Commuters’ Behavior towards Upgraded Bus Services … Paper # 27 February 2015 Ali Chalak, Hani...
38
Working Paper # 27 February 2015 Ali Chalak, Hani Al-Naghi, Alexandra Irani, and Maya Abou-Zeid Commuters’ Behavior towards Upgraded Bus Services in Greater Beirut: Implications for Greenhouse Gas Emissions, Social Welfare and Transport Policy Climate Change and Environment in the Arab World Sustainable Transport Series
Transcript of Commuters’ Behavior towards Upgraded Bus Services … Paper # 27 February 2015 Ali Chalak, Hani...
Wor
king
Pap
er #
27
Febr
uary
201
5
Ali Chalak, Hani Al-Naghi, Alexandra Irani, and Maya Abou-Zeid
Commuters’ Behavior towards Upgraded Bus Services in Greater Beirut: Implications for Greenhouse Gas Emissions, Social Welfare and Transport Policy
Climate Change and Environment in the Arab World
Sustainable Transport Series
Issam Fares Institute for Public Policy and International AffairsAmerican University of Beirut
Commuters’ Behavior towards Upgraded Bus Services in Greater Beirut: Implications for Greenhouse Gas Emissions, Social Welfare and Transport Policy
Working Paper #27 | February 2015
Climate Change and Environment in the Arab World
Ali Chalaka, Hani Al-Naghib, Alexandra Iranic, and Maya Abou-Zeidd a Department of Agricultural Sciences, Faculty of Agricultural and Food Sciences,
American University of Beirut, Lebanon; [email protected] Department of Civil and Environmental Engineering, Faculty of Engineering and
Architecture, American University of Beirut, Lebanon; [email protected] Department of Agricultural Sciences, Faculty of Agricultural and Food Sciences,
American University of Beirut, Lebanon; [email protected] Department of Civil and Environmental Engineering, Faculty of Engineering and
Architecture, American University of Beirut, Lebanon; [email protected]
The Climate Change and Environment in the Arab World Program aims to understand the climate change and environment policy process in the region and define the most appropriate policy recommendations by linking development in applied sciences on issues related to climate change and environment to social sciences.
Nadim Farajalla Faculty Research DirectorRana El Hajj Program CoordinatorPatricia Haydamous Program Research Assistant
Commuters’ Behavior towards Upgraded Bus Services in Greater Beirut: Implications for Greenhouse Gas Emissions, Social Welfare and Transport Policy2
Published by the Issam Fares Institute for Public Policy and International Affairs, American University of Beirut.
This report can be obtained from the Issam Fares Institute for Public Policy and International Affairs office at the American University of Beirut or can be downloaded from the following website: www.aub.edu.lb/ifi
The views expressed in this document are solely those of the author, and do not reflect the views of the Issam Fares Institute for Public Policy and International Affairs or the American University of Beirut.
Beirut, February 2015© All Rights Reserved
Commuters’ Behavior towards Upgraded Bus Services in Greater Beirut: Implications for Greenhouse Gas Emissions, Social Welfare and Transport Policy 3
Contents
Abstract ............................................................................................................................. 4
1. Introduction .................................................................................................................. 5
2. Literature Review .......................................................................................................... 7
Mode Choice ..................................................................................................................................................................................................7
Transportation Behavior Change .......................................................................................................................................................7
3. The Transportation Sector in Lebanon ....................................................................... 9
Overview ...........................................................................................................................................................................................................9
Factors Affecting Current Mobility Patterns ................................................................................................................................9
Environmental Impacts and Regulations ..................................................................................................................................10
Related Studies and Possible Interventions .............................................................................................................................10
4. Data Collection ...........................................................................................................11
Focus Groups ...............................................................................................................................................................................................11
Survey Design .............................................................................................................................................................................................11
Data Collection and Sample Description ..................................................................................................................................12
5. Mode Switching Model and Policy Simulations .......................................................13
The Mixed Logit Mode Switching Model ..................................................................................................................................13
Policy Simulations ....................................................................................................................................................................................14
6. Results and Discussion ...............................................................................................17
Discrete Choice Model Estimates ...................................................................................................................................................17
Policy Simulations ....................................................................................................................................................................................18
7. Conclusions .................................................................................................................20
Acknowledgments ..........................................................................................................22
References .......................................................................................................................23
Commuters’ Behavior towards Upgraded Bus Services in Greater Beirut: Implications for Greenhouse Gas Emissions, Social Welfare and Transport Policy4
AbstractClimate change is one of the most critical environmental challenges facing the world today. The transportation
sector alone contributes to 22% of carbon emissions, of which 80% are contributed by road transportation. In this paper, we investigate the potential greenhouse gas (GHG) emissions reduction and social welfare gains resulting from upgrading the bus service in the Greater Beirut Area. To this end, a stated preference (SP) survey on mode switching from private car to bus was conducted in this area and analyzed by means of a mixed logit model. We then used the model outputs to simulate aggregate switching behavior in the studied area and the attendant welfare and environmental gains and GHG emissions reductions under various alternative scenarios of bus service upgrades. We recommend a bundle of realistic bus service improvements in the short term that will result in a reasonable shift to buses and measurable reduction in vehicular emissions. We argue that such improvements will need to be comprehensive in scope and include both improvements in bus level of service attributes (access/egress time, headway, in-vehicle travel time, and number of transfers) and the provision of amenities, including air-conditioning and Wi-Fi. Moreover, such a service needs to be cheaply priced to achieve reasonably high levels of switching behavior and positive welfare gains. A fare of LBP 1,000 (around $0.67) would trigger 44% of commuters to switch to bus for commuting, resulting in $24 million of welfare gains and a reduction in GHG emissions of 35,000, tCO
2e/year
(32% of car commuting emission). Though the emissions reductions projected by the study may seem modest (2.2% of transport, and 0.43% of overall GHG emissions), they probably under-estimate potential emissions reductions from upgrading public transport systems in that area and in Lebanon in general. With a comprehensively overhauled bus service, one would expect that bus ridership would increase for commuting purposes at first, and once the habit for it is formed, for travel purposes other than commuting, hence dramatically broadening the scope of GHG emissions reduction. This said, this study demonstrates the limits of focused sectorial policies in targeting and reducing GHG emissions, and highlights the need for combining behavioral interventions with other measures, most notably technological innovations, in order for the contribution of this sector to GHG emissions mitigation to be sizable.

Commuters’ Behavior towards Upgraded Bus Services in Greater Beirut: Implications for Greenhouse Gas Emissions, Social Welfare and Transport Policy 5
1. IntroductionClimate change is one of the most critical environmental challenges facing the world today, with significant
threats to ecosystems, food security, water resources, and economic stability overall. Atmospheric carbon dioxide (CO
2) concentrations have increased from approximately 280 parts per million (ppm) in the pre-industrial age to
an estimated level of 430 ppm (IPCC, 2007), and could reach between 540 and 970 ppm over the next century (Nakicenovic & Swart, 2000). Over the past half century, most of the observed warming has been caused by human activities ranging from the production and consumption of fossil fuels to the expansion of the agricultural sector and the changing land use.
The transportation sector alone contributes to 22% of carbon emissions (IEA, 2012). It is one of the few industrial sectors with persistently growing emissions (Chapman, 2007) where reductions in greenhouse gas (GHG) emissions are particularly difficult to achieve (Metz et al., 2007; Stern, 2007). Due to its intensive use of fossil fuels which leads to the emission of greenhouse gases, the transportation sector is considered a main driver of global warming, substantiating the anthropogenic character of climate change. Within the transportation sector, road transportation is responsible for over 80% of carbon emissions (WRI, 2012) and accounts for 81% of total energy used; however, private cars which are the second biggest contributors of GHG emissions (after road freight) are not the only culprit as buses, taxis, inter-city coaches, and road freight all play a significant role. As the popularity of the motor car is no longer confined to the developed world but has attracted millions of new users in developing countries due to its increasing affordability, this could have huge implications on ongoing efforts towards containment of GHG emissions.
A growing awareness in the public policy, industry and popular media spheres over the challenges climate change poses to society inevitably situates the transportation sector at the forefront of researchers’ discourse (Schwanen et al., 2011). Substantial research has been conducted on sustainable transportation over the last several decades and especially in recent years as high oil prices and rising travel demand have bolstered the need for efficiency improvements (IEA, 2013). Studies have focused on the impacts of technological change and the adoption of hybrid or electric cars, the impacts of new car or bike-sharing schemes, improved bus services and amenities, and behavioral measures to reduce driving and use public transportation more through pricing mechanisms, incentives, or travel demand management.
This paper studies the potential emissions reduction and social welfare gains resulting from improved bus services in Greater Beirut, Lebanon, a developing country where the car ownership rate is extremely high, public transportation is perceived to be unreliable and of low quality, and vehicular emissions are a major contributor to air pollution whereby the concentration of pollutants in the air exceeds by far air quality standards (Baalbaki et al., 2013; Borgie et al., 2014; Chaaban et al., 2001; Daher et al., 2013; Waked et al., 2012). A higher degree of public transport adoption in Lebanon would lead to improved air quality alongside other benefits. For example, at average bus occupancy, bus transit in the US generates about 33% less CO
2 per passenger mile compared to single occupancy vehicles, and
the savings increase with higher bus occupancy (Hodges, 2010). Generally, cities with higher modal shares of public transport and non-motorized modes have less CO
2 emissions per capita (UITP, undated), and consequently cities
where investments are made in bus rapid transit and bike or walk infrastructure, may witness reductions in emissions (Kost, 2004; Wright & Fulton, 2005). To explore the potential private and environmental benefits for Greater Beirut commuters and citizens at large, a disaggregate mixed logit model of mode switching from private car to bus is developed based on stated preference data. The model is then used to forecast aggregate switching behavior in the Greater Beirut Area and the resulting welfare and environmental impacts under various alternative scenarios of bus service improvements.
Commuters’ Behavior towards Upgraded Bus Services in Greater Beirut: Implications for Greenhouse Gas Emissions, Social Welfare and Transport Policy6
The current study extends previous mode choice studies in Lebanon by developing more sophisticated models accounting for unobserved heterogeneity in commuters’ preferences (compared to using conditional logit or nested logit models as in previous studies) and by including additional qualitative bus service attributes and amenities like safety and security (presence of CCTV cameras), comfort (presence of air conditioning), and presence of Wi-Fi in the buses. Moreover, previous studies on the environmental impacts of the transportation sector in Lebanon (e.g. MoE et al. (2012)) have mostly surveyed mitigation measures focused on technology innovations (such as the adoption of hybrid or alternative fuel cars or buses) while assuming the nature of the demand function for such technologies. In contrast, this paper aims to develop a richer behavioral representation of the mode switching process for a particular set of measures aimed at improving the bus service. The practical contribution is in recommending a bundle of realistic bus service improvements in the short term that will result in a reasonable shift to buses and measurable reduction in vehicular emissions, given that other more intensive public transport improvements (like the introduction of bus rapid transit or investment in heavy rail which have been proposed in previous studies for Beirut) seem to be unlikely over the next few years.
The remainder of this paper is organized as follows: Section 2 briefly reviews the literature on mode choice and transportation behavior change. Section 3 describes the transportation context in Beirut. Section 4 describes the data collected including focus groups and a stated preference survey. Section 5 presents the formulation of the mode switching model and the methodology used for the policy analysis. Section 6 presents the model estimation results and the outcome of the policy simulation analysis using the developed model, and Section 7 concludes with a summary, practical contributions, and extensions of this research.
Commuters’ Behavior towards Upgraded Bus Services in Greater Beirut: Implications for Greenhouse Gas Emissions, Social Welfare and Transport Policy 7
2. Literature ReviewThis section presents a brief literature review of two topics that are relevant to the present study: mode choice
models, focusing on explanatory variables used and data types, and transportation behavior change from private car to more sustainable modes.
Mode ChoiceMode choice is one of the most studied research topics in transportation. Traditional levels of service attributes
that are included in mode choice models include travel time (which may be decomposed into in-vehicle and out-of-vehicle travel time), cost, and service frequency, and number of transfers for public transport modes. The state of the practice is to develop disaggregate utility-based models of either the conditional logit or nested logit type. More recently, mixed logit mode choice models with distributed parameters (e.g. distributed value of time) have become more prominent (e.g. Hess et al. (2005)).
Mode choice models have been developed using both revealed preference (RP) and stated preference (SP) data. SP data are particularly useful for studying traveler preferences for new transportation modes that do not yet exist in the market (e.g. DMJM+Harris (2003) used SP data to study the demand for bus rapid transit in Lebanon). They can also be used to study preferences for new attributes of existing modes. A number of recent studies have started to evaluate non-traditional attributes of premium transit services, some of which may not yet be in the market. For example, using a model developed from SP data, Outwater et al. (2011) computed the equivalent in-vehicle times of a number of non-traditional attributes (such as reliability, transit real-time information, station amenities, and on-board amenities). For example, they found that for work trips, the presence of transit real-time information is equivalent to a saving of 5.5 minutes in in-vehicle travel time while the presence of Wi-Fi in the transit vehicle is equivalent to a saving of 0.6 minute. Outwater et al. (2011) argue that it is important to include non-traditional attributes in mode choice models as their effect would otherwise be captured in large modal constants. In our study, we use a small subset of such attributes which are likely to be of relevance to the Lebanese population (based on focus group discussions we conducted) and that could reasonably be included in future bus service upgrades in Lebanon.
Transportation Behavior ChangeBehavior change mainly involves the shift from private cars to more sustainable forms of transportation such as
public transportation. It could also involve adopting eco-driving, such as the use of clean-fuel vehicles, carpooling, and more efficient driving that reduces fuel consumption (Barkenbus, 2010). An important behavioral change would be required to promote a modal shift to public transportation and the attendant significant reductions in emissions (Chapman, 2007; Hensher, 2008; Waterson et al., 2003). Research on how changes in the attitudes, lifestyles, and values of people can contribute to behavior change and decarbonisation of the transportation sector has occupied the forefront of the transportation literature and has become a major interest in transportation policy in terms of developing behavior-oriented soft measures aimed at reducing private car use (Möser & Bamberg, 2008). However, policies aimed at reducing the use of private vehicles which do not incorporate users’ comfort and accessibility needs usually fail as customers will not switch toward services with lesser perceived quality (Caruso & Kern, 2004). Accordingly, the attractiveness of alternate modes should be raised by designing public transportation systems that are capable of competing with private vehicles in terms of perceived service quality while at the same time offering improved environmental performances (Poudenx, 2008).
Commuters’ Behavior towards Upgraded Bus Services in Greater Beirut: Implications for Greenhouse Gas Emissions, Social Welfare and Transport Policy8
A number of soft behavioral interventions (such as the provision of free public transportation tickets) have been tested and found to result in some shifts towards sustainable behavior or more favorable attitudes towards public transportation (e.g. Abou-Zeid & Ben-Akiva, 2012; Fujii & Kitamura, 2003; Matthies et al., 2006; Thøgersen, 2009). Several studies have also shown that increasing people’s environmental awareness by providing them with information related to their car emissions and the latter’s impact on their health and the environment might induce them to change their behavior and choice of transportation mode (Gaker et al., 2011; Graham et al., 2011). In fact, when people keep track of their activities and undesired behaviors such as high emission transportation modes and driving methods, those tend to decrease (Jariyasunant et al., forthcoming). However the impacts of such studies have mostly been assessed over the short term.
Although studies suggest that changes in attitudes and lifestyles can have a significant impact on the reduction of GHG emissions (Bin & Dowlatabadi, 2005; Pershing, 2000; Younger et al., 2008), skeptics believe that technological and economic measures will achieve more. In fact, despite the growing importance behavioral change has received in the transportation literature, there still exists substantial research that emphasizes the use of technology, infrastructure, and economic instruments as mitigation measures rather than on the behavioral change of travelers through awareness campaigns and social marketing. Yet, it is not possible to completely separate technological and behavioral change and assume that the former’s contribution to the reduction of GHG emissions in the transportation sector is certain, reliable, and independent from the latter. When exposed to new technologies, people’s behaviors are often reconfigured, and it is quite difficult to predict which direction they will move in (Schwanen et al., 2011). Therefore, to achieve a significant reduction in GHG emissions from transportation, behavioral change induced by targeted policies and public transport improvements is essential as technological innovation alone does not suffice (see also El-Fadel and Bou-Zeid (1999)). If the benefits of new technology are to be fully reaped, both technological solutions and behavioral change are required.
Commuters’ Behavior towards Upgraded Bus Services in Greater Beirut: Implications for Greenhouse Gas Emissions, Social Welfare and Transport Policy 9
3. The Transportation Sector in LebanonThis section provides an overview of the transportation sector in Lebanon, the factors affecting the current mobility
patterns, the environmental impacts of road transportation in Lebanon and related regulations, and an overview of recent studies in this area and potential improvement strategies.
OverviewWith an idle railway and dwindling tracks that were fully operational up until the 1990s, Lebanon’s road
transportation has been reduced to a vehicle fleet comprised of private cars, public buses operated by the Railway and Public Transport Authority which mostly operate within the Greater Beirut Area (GBA) and are subsidized by the government, buses operated by the private Lebanese Community Corporation (LCC), and a privately owned minibus system also mainly operating within the GBA, taxis, and shared-taxis or jitneys1 (Kaysi et al., 2010).
With a fleet of around 1.55 million registered vehicles in 2007, 64% of which were more than 17 years old, passenger cars constituted around 81% of the fleet (MoE, 2011), portraying the country’s relatively elevated car ownership rate of around 1 car for every 3 persons (MoE, 2005; MoE et al., 2012). The lofty reliance on private cars also comes with a low average occupancy rate in Beirut of 1.7 compared to a rate of 1.9 for other modes of transportation (Danaf et al., 2013).
National travel demand is growing at a much faster pace than the country’s transportation system’s ability to adapt, with daily passenger trips in the GBA amounting to around 2.8 million daily automobile passenger trips in 2007, which are expected to increase to 5 million in 2015 (Ministry of Public Works and Transport, 2007). The modal split of motorized trips in the GBA is as follows: 71% by private car, 19% by jitney and taxi, and 10% by public and private buses and minibuses (Nakkash, 1999).
Factors Affecting Current Mobility PatternsThe high car ownership and use rate can be mainly explained by the lack of adequate urban planning, an unreliable
public transportation system and the resulting socio-cultural stigma associated with bus riding, the perception of cars as social status symbols, the availability of affordable old vehicles, and abundant car purchase credit facilities. A poorly maintained and unorganized road network and the high car ownership rate are the main culprits behind the slow traffic flows, congestion, and poor road safety conditions experienced in the GBA. The total public bill of urban congestion in major cities and towns in Lebanon is estimated at around $2 billion annually (MoE, 2005).
As for the public transportation sector, it suffers from major organizational and technical problems such as the lack of government planning, enforced traffic regulation, and an efficient, reliable, well maintained and environmentally friendly public fleet. The latter includes an oversupply of low quality service-taxis (jitneys), compared to a small number of buses, minibuses, and mini-vans. The latter’s numbers have increased threefold from 1994 to 2005 as a result of governmental decisions. They are mostly privately owned and function in the absence of regulated schedules or routes.
1 Jitneys are low quality taxis, usually travel on specific routes and charge low fares per ride.

Commuters’ Behavior towards Upgraded Bus Services in Greater Beirut: Implications for Greenhouse Gas Emissions, Social Welfare and Transport Policy10
Environmental Impacts and RegulationsThe transportation sector is responsible for 19.5% of GHG emissions (MoE et al., 2012) and around 93% of total CO
emissions (Waked et al., 2012) and is the main perpetrator of the current levels of ozone and smog in Beirut which are several times higher than the global norms. Chaaban et al. (2001) report that the concentration of particulates, ozone, and carbon monoxide in the air in Beirut is about 2-4 times the US EPA National Ambient Air Quality Standards. Despite the numerous transportation studies, policies, and legislations, little has been enforced and implemented. To date, a decree enacted in 1995 which sets emission standards for diesel trucks and buses has not been enforced and no legislation related to the management and regulation of passenger vehicle emissions exists. A law enacted in 2001 banned the import of new mini-vans operating on diesel and the use of industrial diesel altogether for cars and minivans, and the use of leaded fuel. Nevertheless, measures such as the use of alternative fuels (e.g. natural gas) and catalytic converters are still non-existing. In fact, catalytic converters are considered luxury goods and thus face additional taxes imposed on their import (MoE, 2011).
Related Studies and Possible InterventionsThe severity of the congestion and pollution problem arising from the transportation sector in Lebanon points to
the urgency of reducing the reliance on the private car and inducing a substantial switch to public transportation for daily commuting. The literature which tackles the topic in Lebanon covers a vast array of sub-topics, from analyzing the current state of the transportation system and its environmental and health impacts, to suggesting policy recommendations and technology and service improvements to revitalize and organize the public transportation system and evaluate developed solutions (Baaj, 2000; Chaaban & Chedid, 2003; Chaaban et al., 2001; DMJM+Harris, 2003; El-Fadel & Bou-Zeid, 1999, 2000; Hashisho & El-Fadel, 2004; IBI Group & TEAM International, 2009). For example, among the recent studies, IBI Group and TEAM International (2009) developed a framework outlining activities at various levels that are necessary for the success of the public transport system in Lebanon, including internal resourcing and organization of the responsible agencies, enforcement of transport laws and regulations, institutional and regulatory actions for the implementation of a national land transport policy, market reorganization of the public transport sector, and operational improvements in the public transport service including wider network coverage. MoE et al. (2012) prioritized technology-based solutions for reducing emissions and fuel consumption based on multi-criteria analysis and found that the most promising ones are bus technologies using diesel and natural gas, followed by hybrid electric vehicles and fuel efficient gasoline vehicles.
One of the short-term measures that the government has been planning to implement is the expansion of the bus fleet by purchasing an additional 250 buses. We considered this scenario to be more realistic in the short term than more ambitious measures such as bus rapid transit or widespread adoption of eco-friendly cars, and thus focused our study on mode switching in the presence of an improved bus system. Although reducing people’s dependence on the motor car is a challenge, one of the most practical alternative modes of sustainable urban transportation is considered to be the bus. Increasing bus use can reduce traffic and congestion, and for bus occupancy that exceeds three people, CO
2 emissions per passenger kilometer become far lower for buses than for cars (Chapman, 2007).
Commuters’ Behavior towards Upgraded Bus Services in Greater Beirut: Implications for Greenhouse Gas Emissions, Social Welfare and Transport Policy 11
4. Data CollectionThis section describes the data used in this study, which includes focus groups and a stated preference (SP) survey.
Descriptive statistics from the SP survey are also shown.
Focus GroupsPrior to the stated preference survey, three focus groups were conducted between September and November
2012 with students and employees of the American University of Beirut to understand the usage patterns, awareness, and attitudes of bus users and non-users towards bus services in Lebanon and the importance of various bus service attributes to them. Non-users cited long and unreliable travel time by bus, the limited network coverage, and lack of professionalism/comfort (e.g. cleanliness, air conditioning, non-smoking), organization, and safety (especially for women) as reasons for not using buses. On the other hand, users indicated that they used the bus for reasons including lower travel cost by bus, parking difficulties and price, and driving stress. Yet, they dislike certain things about the bus such as its ad-hoc stops on the road and the lack of punctuality and professionalism. Participants in the focus groups indicated that the available information about bus routes and schedules was insufficient. While most participants were aware of environmental issues, they would not switch to using buses purely for the sake of the environment. Finally, journey time and comfort level were ranked as the most important among the bus service attributes. The fare and the frequency of service also seemed to be important. The number of transfers, ad-hoc stops, and distance to nearest waiting stop appeared to be of less importance to the participants.
Survey DesignA stated preference survey was designed to elicit commuters’ preferences for an enhanced bus service in Greater
Beirut. The survey consisted of five parts. The first part contained screening questions to determine whether an individual was eligible to answer the survey. Eligibility conditions included being a worker or a student who lives and works in the GBA (extended to Jiyeh in the south and Jounieh in the north), who commutes to work/school by private car, and who has been living and working/studying at the same location for at least three months. Thus, the study focused on current car commuters to estimate their potential switching to buses. The second part of the survey asked about commute satisfaction, perceptions of attributes of the commute by car and by bus, attitudes towards transportation modes and health and the environment, and availability of buses near the place of residence and work. The third part of the survey asked about the attributes of the commute by car such as travel time, distance, parking, dropping off or picking up passengers, weekly frequency of commuting to work, and frequency of using the bus to commute to work. The fourth part consisted of ten hypothetical choice scenarios/experiments, each consisting of a combination of bus attributes, where respondents were asked after each scenario to indicate whether they would switch to the hypothetical bus service for their commute to work/school. The bus attributes presented included service headway during rush hours, access and egress time, additional in-vehicle travel time relative to the car, number of transfers, fare, comfort, and security level at the bus stop and inside the bus, presence of air conditioning inside the bus, and presence of Wi-Fi inside the bus. For one of the scenarios, respondents were also asked about their predicted level of satisfaction if they would choose to use a bus. Respondents were also asked how easy or difficult it was to answer the choice experiments, and were asked to indicate whether they have considered each of the bus attributes in making their choices. An example of a choice experiment is shown in Figure 1, and the attribute definitions and levels are shown in Table 1. The choice experiments were designed based on a Bayesian design, or Db-efficient design (Ferrini & Scarpa, 2007). We obtained prior values for the bus alternative-specific constant, access/egress time, headway, number of transfers, and cost from IBI Group and TEAM International (2009), while we assigned a value of 0 to the remaining attribute parameters, namely comfort and safety, air-conditioning, and Wi-Fi as no priors could be obtained for these attributes in Lebanon. This design resulted in 60 choice experiments, which were divided into blocks of ten choice experiments each. Finally, the last part of the survey consisted of a number of socio-economic and demographic questions.
Commuters’ Behavior towards Upgraded Bus Services in Greater Beirut: Implications for Greenhouse Gas Emissions, Social Welfare and Transport Policy12
Data Collection and Sample DescriptionThe data were collected during one week in June 2013 through personal interviews (in Arabic) administered by
trained interviewers of a local survey firm. The questionnaires were distributed proportionally to the number of registered voters in the areas covered by the study. A multi-stage (by neighborhood, then household, then individual within household) probability sampling approach was used for identifying households and main respondents to attain a random representative sample. A total of 500 respondents answered the survey out of a total of 1,200 that were approached (of whom 161 refused to participate and 539 were ineligible to participate). The six blocks were roughly divided equally among respondents.
Of the 500 respondents, 72.2% were males and 27.8% females, which compares reasonably well with the distribution by gender of the working population in Lebanon (around 75% males, 25% females based on the 2007 CAS household survey). The majority (64.2%) of respondents were below the age of 40, with the average age around 36.6. The majority (55.8%) of respondents belonged to families with children. As to education, 43.6% of respondents had completed high school or less, 7.6% went to technical/vocational school, and 48.6% attended some college or had a university undergraduate or graduate degree. The average household size was 4.1, the average number of licensed drivers in the household was 2.1, and the average number of cars per household was 1.8. The average monthly household income was $2,182 but the majority (59.3%) of respondents had monthly household incomes of less than $2,000. Finally, the average monthly personal income was $1,427 and the majority (69.9%) of respondents had monthly personal incomes of less than $1,500.
Commuters’ Behavior towards Upgraded Bus Services in Greater Beirut: Implications for Greenhouse Gas Emissions, Social Welfare and Transport Policy 13
5. Mode Switching Model and Policy Simulations
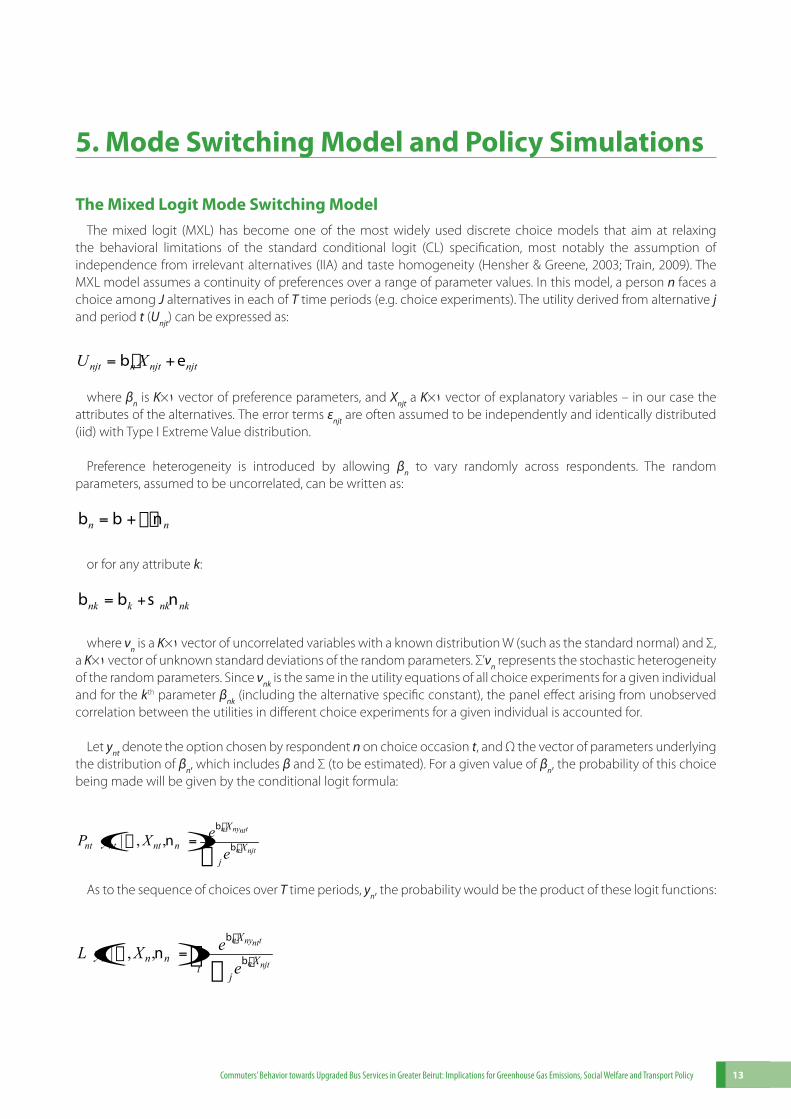
The Mixed Logit Mode Switching ModelThe mixed logit (MXL) has become one of the most widely used discrete choice models that aim at relaxing
the behavioral limitations of the standard conditional logit (CL) specification, most notably the assumption of independence from irrelevant alternatives (IIA) and taste homogeneity (Hensher & Greene, 2003; Train, 2009). The MXL model assumes a continuity of preferences over a range of parameter values. In this model, a person n faces a choice among J alternatives in each of T time periods (e.g. choice experiments). The utility derived from alternative j and period t (Unjt) can be expressed as:
njt n njt njtU Xb e�= +
where βn is K×1 vector of preference parameters, and Xnjt a K×1 vector of explanatory variables – in our case the attributes of the alternatives. The error terms εnjt are often assumed to be independently and identically distributed (iid) with Type I Extreme Value distribution.
Preference heterogeneity is introduced by allowing βn to vary randomly across respondents. The random parameters, assumed to be uncorrelated, can be written as:
n nb b n�= +�
or for any attribute k:
nk k nk nkb b s n+=
where νn is a K×1 vector of uncorrelated variables with a known distribution W (such as the standard normal) and Σ, a K×1 vector of unknown standard deviations of the random parameters. Σ’νn represents the stochastic heterogeneity of the random parameters. Since νnk is the same in the utility equations of all choice experiments for a given individual and for the kth parameter βnk (including the alternative specific constant), the panel effect arising from unobserved correlation between the utilities in different choice experiments for a given individual is accounted for.
Let ynt denote the option chosen by respondent n on choice occasion t, and Ω the vector of parameters underlying the distribution of βn, which includes β and Σ (to be estimated). For a given value of βn, the probability of this choice being made will be given by the conditional logit formula:
( )| , ,n ny tnt
n njt
X
nt nt nt n Xj
eP y Xe
b
bn�
�� =�
As to the sequence of choices over T time periods, yn, the probability would be the product of these logit functions:
( )| , ,n ny tnt
n njt
X
n n n Xt
j
eL y Xe
b
bn�
�� =�
�
Commuters’ Behavior towards Upgraded Bus Services in Greater Beirut: Implications for Greenhouse Gas Emissions, Social Welfare and Transport Policy14
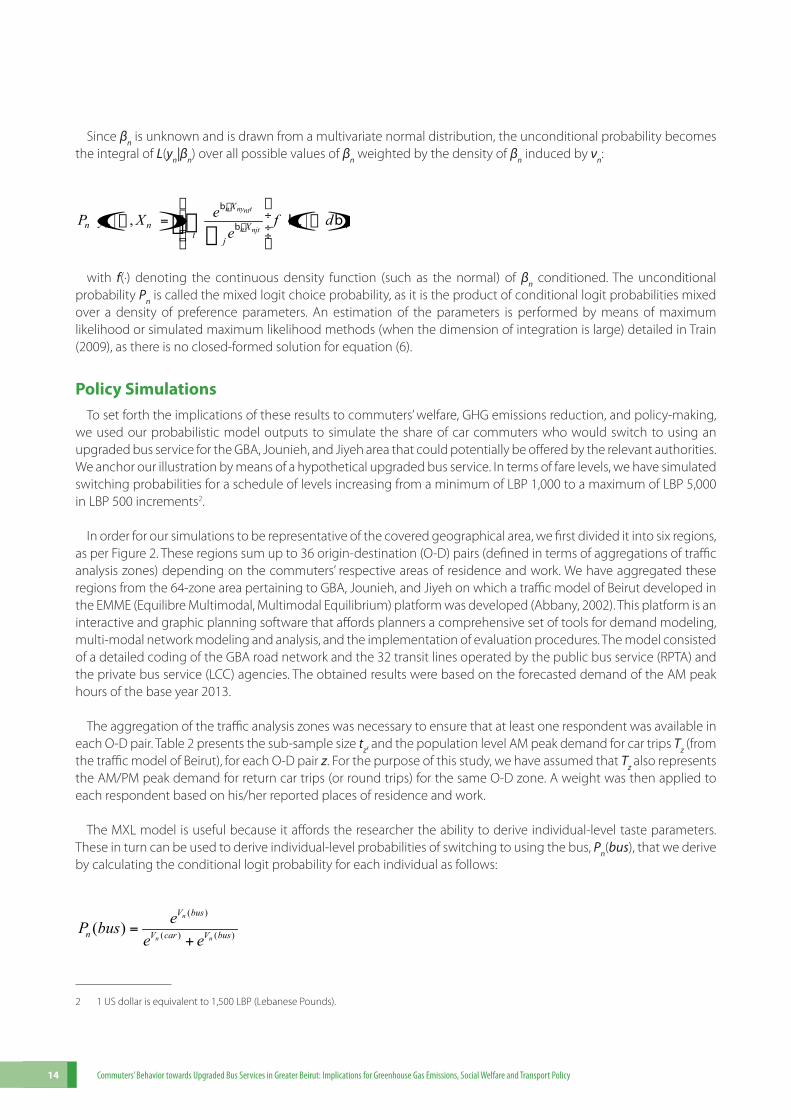
Since βn is unknown and is drawn from a multivariate normal distribution, the unconditional probability becomes the integral of L(yn|βn) over all possible values of βn weighted by the density of βn induced by νn:
( ) ()| , |n ny tnt
n njt
X
n n n n nXt j
eP y X f de
b
b b b�
�
� �� ÷� ÷� ÷� �
� = ��� �
with f(·) denoting the continuous density function (such as the normal) of βn conditioned. The unconditional probability Pn is called the mixed logit choice probability, as it is the product of conditional logit probabilities mixed over a density of preference parameters. An estimation of the parameters is performed by means of maximum likelihood or simulated maximum likelihood methods (when the dimension of integration is large) detailed in Train (2009), as there is no closed-formed solution for equation (6).
Policy SimulationsTo set forth the implications of these results to commuters’ welfare, GHG emissions reduction, and policy-making,
we used our probabilistic model outputs to simulate the share of car commuters who would switch to using an upgraded bus service for the GBA, Jounieh, and Jiyeh area that could potentially be offered by the relevant authorities. We anchor our illustration by means of a hypothetical upgraded bus service. In terms of fare levels, we have simulated switching probabilities for a schedule of levels increasing from a minimum of LBP 1,000 to a maximum of LBP 5,000 in LBP 500 increments2.
In order for our simulations to be representative of the covered geographical area, we first divided it into six regions, as per Figure 2. These regions sum up to 36 origin-destination (O-D) pairs (defined in terms of aggregations of traffic analysis zones) depending on the commuters’ respective areas of residence and work. We have aggregated these regions from the 64-zone area pertaining to GBA, Jounieh, and Jiyeh on which a traffic model of Beirut developed in the EMME (Equilibre Multimodal, Multimodal Equilibrium) platform was developed (Abbany, 2002). This platform is an interactive and graphic planning software that affords planners a comprehensive set of tools for demand modeling, multi-modal network modeling and analysis, and the implementation of evaluation procedures. The model consisted of a detailed coding of the GBA road network and the 32 transit lines operated by the public bus service (RPTA) and the private bus service (LCC) agencies. The obtained results were based on the forecasted demand of the AM peak hours of the base year 2013.
The aggregation of the traffic analysis zones was necessary to ensure that at least one respondent was available in each O-D pair. Table 2 presents the sub-sample size tz, and the population level AM peak demand for car trips Tz (from the traffic model of Beirut), for each O-D pair z. For the purpose of this study, we have assumed that Tz also represents the AM/PM peak demand for return car trips (or round trips) for the same O-D zone. A weight was then applied to each respondent based on his/her reported places of residence and work.
The MXL model is useful because it affords the researcher the ability to derive individual-level taste parameters. These in turn can be used to derive individual-level probabilities of switching to using the bus, Pn(bus), that we derive by calculating the conditional logit probability for each individual as follows:
( )
( ) ( )( )n
n n
V bus
n V car V buseP bus
e e=
+
2 1 US dollar is equivalent to 1,500 LBP (Lebanese Pounds).
Commuters’ Behavior towards Upgraded Bus Services in Greater Beirut: Implications for Greenhouse Gas Emissions, Social Welfare and Transport Policy 15
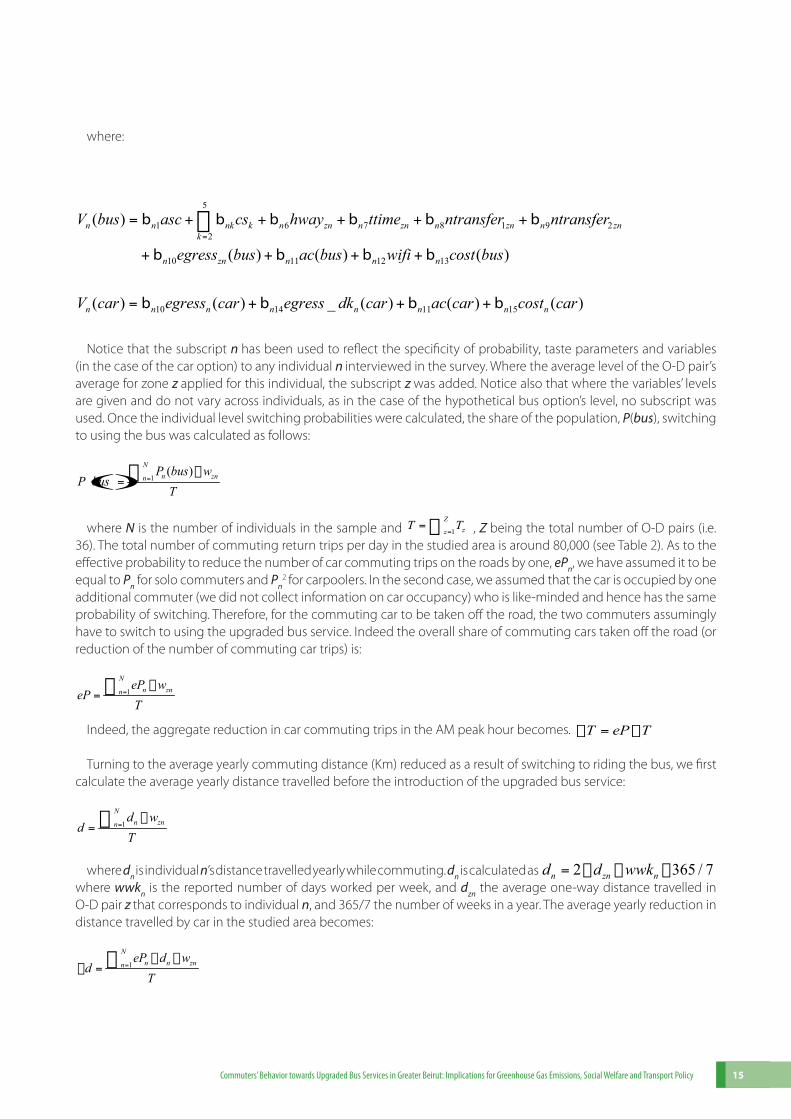
where:
5
1 6 7 8 1 9 22
10 11 12 13
10 14 11
( )
( ) ( ) ( )
( ) ( ) _ ( ) (
b b b b b b
b b b b
b b b
=
= + + + + +
+ + + +
= + +
�n n nk k n zn n zn n zn n znk
n zn n n n
n n n n n n
V bus asc cs hway ttime ntransfer ntransfer
egress bus ac bus wifi cost bus
V car egress car egress dk car ac c 15) ( )b+ n nar cost car
Notice that the subscript n has been used to reflect the specificity of probability, taste parameters and variables (in the case of the car option) to any individual n interviewed in the survey. Where the average level of the O-D pair’s average for zone z applied for this individual, the subscript z was added. Notice also that where the variables’ levels are given and do not vary across individuals, as in the case of the hypothetical bus option’s level, no subscript was used. Once the individual level switching probabilities were calculated, the share of the population, P(bus), switching to using the bus was calculated as follows:
() 1( )
=�
=�
Nn znn
P bus wP bus
T
where N is the number of individuals in the sample and 1== �
Zzz
T T , Z being the total number of O-D pairs (i.e. 36). The total number of commuting return trips per day in the studied area is around 80,000 (see Table 2). As to the effective probability to reduce the number of car commuting trips on the roads by one, ePn, we have assumed it to be equal to Pn for solo commuters and Pn
2 for carpoolers. In the second case, we assumed that the car is occupied by one additional commuter (we did not collect information on car occupancy) who is like-minded and hence has the same probability of switching. Therefore, for the commuting car to be taken off the road, the two commuters assumingly have to switch to using the upgraded bus service. Indeed the overall share of commuting cars taken off the road (or reduction of the number of commuting car trips) is:
1=�
=�
Nn znn
eP weP
T
Indeed, the aggregate reduction in car commuting trips in the AM peak hour becomes. T eP T� = �
Turning to the average yearly commuting distance (Km) reduced as a result of switching to riding the bus, we first calculate the average yearly distance travelled before the introduction of the upgraded bus service:
1
Nn znn
d wd
T=
�=�
where dn is individual n’s distance travelled yearly while commuting. dn is calculated as 2 365 / 7n zn nd d wwk= � � � where wwkn is the reported number of days worked per week, and dzn the average one-way distance travelled in O-D pair z that corresponds to individual n, and 365/7 the number of weeks in a year. The average yearly reduction in distance travelled by car in the studied area becomes:
1
Nn n znn
eP d wd
T=
� �� =
�

Commuters’ Behavior towards Upgraded Bus Services in Greater Beirut: Implications for Greenhouse Gas Emissions, Social Welfare and Transport Policy16
The aggregate commuting distance by car and its reduction over both the AM and PM peak hours, respectively D and ΔD, can be derived simply by multiplying each quantity by T. The reduction proportion in distance travelled is
therefore derived as R d d D D= � = � . That same reduction proportion also applies to pollutants since it is assumed that pollutant generation is proportional to distance traveled. In our study, we have focused on GHG’s which include carbon dioxide (CO
2), methane (CH
4), and nitrous oxide (N
2O), carbon monoxide (CO), nitric oxide/nitrogen dioxide
(NOx), and volatile organic compounds (VOC) emissions. For each pollutant g, the aggregate emissions and emissions reduction (tons/month) in the study area, Eg and ΔEg, are estimated as follows:
610 and g g g gE ef D E R E= � � � = �
where efg is the emission factor for gas g (g/km). The emission factors for CO2, CH
4, and N
2O were derived from US
EPA (2008). As for CO, NOx, and VOC, their emission factors are based on the urban levels reported in the study by
Al-Naghi (2006) conducted in Tripoli, Lebanon. To determine the GHG emissions in tons of CO2 equivalents per year
(tCO2e/year), we apply the following formula:
( )610 and GHG g g GHG GHGgE ef GWP D E R E= � � � � = ��
where GWPg refers to the global warming potential of pollutant gas g as per (El-Fadel & Bou-Zeid, 1999). Emission factors and GWP’s are listed in Table 6.
Finally, we have derived the net benefits ($/year) from switching to the upgraded bus service by adding up the savings in car expenses (NBcar), additional costs of bus ridership (NBbus), and the net benefits from reduced GHG emissions (NBGHG). These net benefits were each calculated as follows:
,1
1
2 365 / 7
2 365 / 7=
=
= � � � � �
= � � � � � �
= � �
��
Ncar n n car n znn
Nbus n bus n znn
GHG GHG
NB eP cost wwk w
NB P cost wwk w
NB E SCC
where SCC is the social cost of carbon valued at $17/tCO2e, as per El-Fadel et al. (2013).
We considered three scenarios for our simulation exercise:
•S1: bus level of service attributes including travel time (ttime), headway (hway), access/egress time (egress), and number of transfers (ntransfer) are reduced by 50% on average across the board, while bus amenities are kept basic, with buses having no additional comfort and security features (cs2-cs5=0), no air-conditioning (ac=0), and no Wi-Fi connection (wifi=0);
•S2: bus level of service attributes (ttime, hway, egress, and ntransfer) remain at their current levels while amenities are enhanced with the bus network being equipped with sheltered stops and CCTV in both buses and stops (cs=5), and buses being air-conditioned (ac=1) and equipped with Wi-Fi connections;
•S3: this bus service scenario is enhanced both in terms of level of service attributes and amenities (S1+S2).
The current average levels of ttime, hway, egress, and ntransfer were derived from the EMME model for each O-D pair. These results are stored in EMME in the form of full matrices, and were averaged weighted by the demand matrix. The travel time of the buses on each route was assumed to be equal to the average travel time of vehicles on the respective links at model equilibrium.
Commuters’ Behavior towards Upgraded Bus Services in Greater Beirut: Implications for Greenhouse Gas Emissions, Social Welfare and Transport Policy 17
6. Results and Discussion
Discrete Choice Model EstimatesThree sequentially nested models were estimated in Stata 11.2 using the command mixlogit written by Hole (2007):1. A restricted conditional logit (CL) that assumes preference homogeneity and hence treats all taste param-
eters as fixed;
2. An unrestricted CL that is similar to the restricted CL in all aspects except for its unrestricted treatment of the marginal utility of cost (i.e. alternative-specific cost coefficients in the bus and car utility equations);
3. An unrestricted MXL which relaxes the preference homogeneity assumption for all attributes and treats them as randomly distributed; log-normally in the case of the cost attribute, and normally for all non-cost attributes. This means that while the cost’s marginal utilities are forced to be negative in keeping with the expectation of economic theory, all other non-cost attributes are allowed to have both negative and positive marginal utilities.
Given that the models are sequentially nested, we were able to conduct likelihood ratio tests in order to select the best model specification. The results of the LR tests are presented in Table 3. In addition, we present the Akaike and Bayesian information criteria (AIC and BIC, respectively) for each model to assist in model selection. The LR test and AIC seem to prefer the unrestricted to the restricted CL, though the BIC rises slightly in the second (unrestricted) model compared to the former (restricted). This supports the decision to treat the marginal utilities of cost for bus and car as unequal, a result further borne out by the fact that the two marginal utility coefficients are significantly different in the unrestricted CL. Finally, the MXL model seems to be by far the best model specification, having substantially lower AIC and BIC values than the remaining two specifications, and showing a highly significant increase in the LR χ2 statistic compared to the unrestricted CL (and indeed the restricted CL).
Model estimates of the preferred unrestricted MXL model are presented in Table 4. The significant asc mean coefficient indicates, on average, a preference for commuting by means of a basic bus service with no air-conditioning or Wi-Fi connection, but with a null bus fare, no transfers, and null additional travel time, headway, and access/egress times, compared to commuting by car. Though this bus service is not realistic, even infeasible, in many respects, it nevertheless suggests a propensity for commuters to switch to using the bus when the service offered is decent, efficient, and competitive. This said, the highly significant and relatively large standard deviation estimate indicates that preference for the basic bus service varies largely across commuters and suggests that a large proportion of them will have a negative preference for it and hence will stick to commuting by car.
The coefficients for the remaining bus service shifters (cs2 to cs5) are all positive, suggesting, as expected, that these further enhanced services are all preferred to the basic bus service on average. However, only the bus services with sheltered stops (cs2), and sheltered stops and CCTV in stops and buses (cs5), are significantly preferred at the 5% confidence level, while the service with sheltered stops and CCTV in stops only (cs4) is preferred at the 10% level only. In terms of the overall average and distribution of preferences for each bus service with respect to commuting by car, post-estimation coefficients of mean and standard deviation are also reported3. Results show that all the non-basic bus services are similarly and significantly preferred to commuting by car, though, again, under the same unrealistic assumptions of no air-conditioning or Wi-Fi connection, no transfers, and a null bus fare, additional travel time, headway, and access/egress times. Also, as with the basic service, the relatively large and significant standard deviation post-estimates for these services suggests the preferences for these services vary considerably in the population with many commuters actually preferring to stick to commuting by car.
3 For the basic bus service (cs1), the mean (βcs1) and standard deviation (σcs1) are the same as those of the asc term. For any of the remaining services
(cs2-cs5), b b b= +cs asc shifter and 2 2s s s= +cs asc shifter . Standard errors are obtained using the Delta method.
Commuters’ Behavior towards Upgraded Bus Services in Greater Beirut: Implications for Greenhouse Gas Emissions, Social Welfare and Transport Policy18
Headway (hway), travel (ttime) and access/egress (egress) times all have negative and significant mean coefficients, as would be expected for these inconveniencing factors and the significant standard deviations estimates indicate a variation in the degree to which these factors would influence switching behavior. Noteworthy is the significantly negative parameter for egress_dk, which suggests that commuters who are not certain about their access or egress times are, on average, reluctant to switch to commuting by car. Number of transfers (ntransfer), another inconveniencing bus service characteristic, also significantly decreases the average propensity of commuters to switch to bus, especially if the number of transfers is two. As for amenities offered by the bus service, on average respondents seem to prefer air conditioning (ac) to a larger extent than Wi-Fi.
The estimates of the mean and standard deviation of log of the car and bus cost coefficients are also estimated. These are normally distributed and as such can be more readily estimated compared to their log-normal transforms, but have no ready interpretation. Therefore, we also present the means and standard deviations of the intended lognormal coefficients in the post-estimates section4. Indeed for both options the cost coefficient turns out to be highly significant. Moreover, the bus’s marginal utility of cost is substantially higher than the car’s, suggesting commuters are less conscious of their cost of commuting by car than they would be commuting by bus.
Finally, values of travel time savings (VTTS) for different travel time components, which are randomly distributed in the population, are computed for every individual in the sample given the individual-level parameters derived post-estimation. The average and standard deviation of the VTTS distribution, for a given travel time component, is then calculated after applying the weights for the sampled individuals. These averages and standard deviations are shown in Table 5 for the following travel time components: in-vehicle time by car, in-vehicle + transfer time by bus, egress time by car, access + egress time by bus, and initial waiting time by bus. The high standard deviations as a proportion of the means reveal that there is considerable variation in the VTTS across the population. Value of bus out-of-vehicle time (walking, waiting) is usually 2-3 times higher than that of in-vehicle travel time, which seems to hold approximately for access + egress time by bus but not for initial waiting time. Compared to VTTS estimates from local studies, our mean VTTS for car in-vehicle time (34,407 LBP/hour) is higher while our mean VTTS for bus in-vehicle time (11,786 LBP/hour) is within the range of other studies in Beirut (e.g. 5,503 LBP/hour in year 2008 LBP in the study by IBI Group and TEAM International (2009); 3,928 LBP/hour for the population of GBA and 10,144 LBP/hour for students of the American University of Beirut in the year 2010 LBP, in the study by Danaf et al. (2013)).
Policy SimulationsThe results of the policy simulations are presented in Tables 7 to 10. Results in Table 7 reveal that across policy
scenarios, the percent mode switching (P) is higher than commuting trips reduction (eP). This result is expected as not all switching decisions will lead to taking commuting cars off the roads; indeed where commuters share a car, all commuters need to decide to switch to the bus service for their joint decision to result in retiring their car from commuting. Similarly, commuting trips reduction is more pronounced than travel distance/emissions reduction (R), reflecting the fact that commuters within urban centers (e.g. zones 1, 2, and 3) who tend to travel for shorter distances are also more likely to switch to using the bus service than commuters in outlying areas who tend to commute for longer distances. All three percentages decrease with an increasing bus fare, as would be predicted by economics theory.
Comparing scenarios S1, S2, and S3, we find that the former two achieve similar percent mode switching, commuting trips reduction, and travel distance/emissions reduction. However, S3, which combines S1 and S2, achieves P, eP, and R levels that are higher than the sum of those achieved by S1 and S2. This suggests that public transport policy-makers are justified in proposing a comprehensive upgrade of the bus service in the GBA, Jounieh, and Jiyeh area in terms of both bus level of service attributes and amenities, as this will ensure substantially higher
4 The mean (β) and standard deviation (σ) of a log-normally distributed coefficient are derived from those of the log of this coefficient, β* and σ*, as
follows: 2* * 2eb sb += and . ()2 2* 2 * *1s b ss += � �e e Standard errors are derived by means of the Delta method.
Commuters’ Behavior towards Upgraded Bus Services in Greater Beirut: Implications for Greenhouse Gas Emissions, Social Welfare and Transport Policy 19
ridership, emissions reductions and lower traffic than a bus service focused solely on level of service attributes or service amenities. With scenario S3 and with a one-way bus fare of LBP 1,000, nearly 44% of car commuters will switch to using the bus, resulting in a 39% reduction in commuting trips and 32% reduction in travel distance and GHG emissions. These percentages decrease dramatically to 26, 22, and 18 percent, respectively, with a LBP 2,500 bus fare. Table 8 sheds further light on the reduction in car commuting trips and travel distance by translating the relative quantities eP and R into the absolute reduction of commuting trips (ΔT; car-trips/day during the AM and PM peak hours), and aggregate (ΔD; km/year) and average (Δd; km/year/car) travel distance, respectively. Therefore, with a fare of LBP 1,000, there will be around 31,000 less commuting car trips per day on the road, with an aggregate 71 million, and a per car average of 900, less kilometers traveled while commuting per year. At LBP 2,500, however, these values decrease to 17,000 car-trips/day, 40 million km/year, and 510 km/year/car, respectively.
In terms of the welfare implications to commuters from introducing an upgraded bus service (Table 9), again the net benefits from introducing the S3 outweighs the sum of the net benefits from S1 and S2, lending further support to the introduction of a comprehensively upgraded bus service. Looking further into this service scenario, we notice that the private net benefits for relinquishing car commuting and using the bus service are, in absolute terms, an order of magnitude larger than the external net benefits from reduced GHG emissions. Moreover, total net benefits decrease from a high of $24 million when the one-way bus fare is LBP 1,000, to a still positive but low value of $1.7 million when the bus fare increases to LBP 2,500 – a level beyond which total net benefits become negative. This is mainly because the pace at which aggregate car savings decrease with less switching is faster than the rate at which aggregate expenses from increased bus commuting are decreasing. Results for the total net benefits (NBtotal) across scenarios can be visualized in Figure 3.
Finally, Table 10 sheds light on the absolute pollutants emissions reduction both as GHG aggregate and individually. Indeed these are the absolute value translations of the percent travel distance/emissions reduction (R) in Table 7, and the same comparative assessment of S1, S2, and S3 applies herein. In order to benchmark our results against the literature, we compared our simulated current GHG emissions from car commuting to what would be obtained by means of a back-of the-envelope exercise based on the overall transport emissions in Lebanon reported in MoE et al. (2012). Based on this report, transport emissions in Lebanon amount to around 4 million tCO
2e/year. If we assume –
somewhat crudely – that the emissions are proportional to population size, and the study area’s population is around 40% of Lebanon’s, then GHG emissions in the study area would be around 1.6 million tCO
2e. Of those, cars contribute
25%, that is 0.4 million tCO2e/year. Finally, commuting trips in the AM and PM peak hours would account for around
20% of GHG emissions, or 80 thousand tons. Therefore, our base emissions estimates are in line with the literature.
The emission reduction range that we obtained (column labeled R in Table 8) is also of a similar order of magnitude as that reported in other studies in Lebanon. For example, El-Fadel and Bou-Zeid (1999) assessed the mitigation potential of two scenarios for year 2020, one involving technological improvement (reduced car fleet age, clean fuel program, catalytic converters) and another involving technological improvement, higher traffic speed, better urban planning, and increased public transport mode share. Compared to the technological improvement only scenario, the latter scenario involving public transport resulted in additional 16.5% reduction in CO
2 and 5% reduction in
CO generated per year relative to the do-nothing scenario. MoE et al. (2012) report a higher percent reduction in CO
2, ranging from 41% to 80% reduction, for a scenario of revitalized public transport system with improved bus
technologies and dedicated lanes. Results for the GHG emissions reduction across scenarios can be visualized in Figure 3.
Commuters’ Behavior towards Upgraded Bus Services in Greater Beirut: Implications for Greenhouse Gas Emissions, Social Welfare and Transport Policy20
7. ConclusionsIn this paper, we investigated the potential GHG emissions reduction and social welfare gains resulting from
upgrading the bus service in the GBA, Jounieh, and Jiyeh area. To this end, a stated preference survey on mode switching from private car to bus was conducted in this area and analyzed by means of a mixed logit model. We then used the model outputs to simulate aggregate switching behavior in the study area and the attendant welfare and environmental gains under various alternative scenarios of bus service upgrade. In addition to accounting for unobserved heterogeneity in commuters’ preferences, this study adds to the mode choice literature in Lebanon by accounting for qualitative bus service attributes and amenities like comfort and security, air-conditioning, and the presence of Wi-Fi in buses.
By means of a richer behavioral representation of the mode switching process for a particular set of measures aimed at improving the bus service, we recommend a bundle of realistic bus service improvements in the short term that will result in a reasonable shift to buses and measurable reduction in vehicular emissions. We argue that such improvements will need to be comprehensive in scope and include both improvements in bus level of service attributes (access/egress time, headway, in-vehicle travel time, and number of transfers) and the provision of amenities, including air-conditioning and Wi-Fi. Moreover, such a service needs to be cheaply priced to achieve reasonably high levels of switching behavior and positive welfare gains. A one-way fare of more than LBP 2,500 will leave commuters and citizens at large in the study area worse off in terms of welfare, while a fare of LBP 1,000 would trigger 44% of commuters to switch to bus for commuting, resulting in $24 million in welfare gains and a reduction in GHG emissions of 35,000, tCO
2e/year (32%t of car commuting emission). This recommended bus service
improvement scenario reinforces the point made by IBI Group and TEAM International (2009) that the purchase of new buses, adding more routes, or increasing service frequency without significant improvements to the level of service will not result in increased bus ridership. Moreover, complementary actions are needed to promote the viability of any public transport solution, including supportive urban planning, enforcement of traffic regulations, parking restrictions and pricing, technology improvements in the vehicle fleet, etc.
Though the emissions reductions projected by the study may seem modest compared to the 1.6 million tCO2e/
year transport GHG emissions in the study area (2.2%), and even more so compared to the 8 million tCO2e/year overall
emissions (0.43%), it is most probably the case that they highly under-estimate the potential for emissions reductions from upgrading public transport systems in that area, and in Lebanon in general. Indeed, public transport systems in Lebanon are highly under-performing and bus ridership levels rates remain very low. With a comprehensively overhauled bus service, one would expect that bus ridership would increase for commuting purposes at first, but once the habit of using the bus is formed, citizens will start depending on buses for travel purposes other than commuting. Here, the scope of GHG emissions reduction is no more confined to commuting emissions alone (which currently are in the region of 0.1 million tCO
2e/year), but goes beyond to encompass the entirety of the 0.4 million
tCO2e/year car GHG emissions.
Yet when all is said and done, this study demonstrates the limits of focused sectorial policies in targeting and reducing GHG emissions. Earlier, we have discussed the ‘technology bias’ and limits of GHG emissions mitigation measures touted in policy-making circles in Lebanon. Our results suggest that behavioral interventions themselves may be limited in their reach and need to be coupled with other measures, most notably technological innovations, in order for the contribution of this sector to GHG emissions mitigation to be sizable. Any single-minded policy focus on one facet at the expense of others will risk having meager returns to costly investments.
Commuters’ Behavior towards Upgraded Bus Services in Greater Beirut: Implications for Greenhouse Gas Emissions, Social Welfare and Transport Policy 21
This policy analysis has a number of limitations which may be addressed in future extensions of this study. The emission factors used do not consider speed (e.g. as in Sbayti et al. (2002)), acceleration, different vehicle types and ages, etc. No feedback mechanism is implemented between demand and network performance in the policy analysis; that is, the demand for bus is predicted given a specific set of level of service variables, but the travel time itself may then change based on this demand. This effect is assumed to be negligible in this paper. Moreover, our study does not account for the potential of multiple discreteness in commuters’ mode choices. Indeed, it is perfectly reasonable to assume that some commuters may choose to use both cars and buses for commuting on different days. Crucially, some respondents who have decided not to switch to a particular bus service in our ‘take-it-or-leave-it’ choice experiment could have stated that they would use it for a day or two per week in an initial trial period. Recently, models to deal with multiple discreteness have been developed, most notably the multiple discrete-continuous extreme value (MDCEV) model developed by Bhat (2008). Exploring the use of such models to produce better forecasts of travel demand and attendant GHG emissions reductions and welfare gains would be a worthwhile avenue of research.
Commuters’ Behavior towards Upgraded Bus Services in Greater Beirut: Implications for Greenhouse Gas Emissions, Social Welfare and Transport Policy22
AcknowledgementsThe authors wish to thank the Issam Fares Institute for Public Policy and International Affairs at the American
University of Beirut, for the research grant given to conduct this research project, Dr. Isam Kaysi for giving the authors access to the EMME traffic model of Beirut, Information International for their appreciated assistance in data collection, several AUB students who conducted the focus groups and helped in the literature review and survey design (Gaelle Samaha, Lamis Houssami, Zeina Wafa, Edrees El-Rachidi, and Weam Aridi), and all individuals who participated in the focus groups and surveys.
Commuters’ Behavior towards Upgraded Bus Services in Greater Beirut: Implications for Greenhouse Gas Emissions, Social Welfare and Transport Policy 23
ReferencesAbbany, A. S. (2002). Contracting out of bus routes: Implications for service design. (M.Eng. Thesis), Department of
Civil and Environmental Engineering, Faculty of Engineering and Architecture, American University of Beirut.
Abou-Zeid, M., & Ben-Akiva, M. (2012). Travel mode switching: Comparison of findings from two public transportation experiments. Transport Policy, 24, 48-59. doi: 10.1016/j.tranpol.2012.07.013
Al-Naghi, H. (2006). Mobility plan for urban community Al-Fayhaa. The SMAP Air Quality Project in Mediterranean Cities, Final Report.
Baaj, M. H. (2000). The public land transport sector in Lebanon. Journal of Public Transportation, 3(3), 87-108.
Baalbaki, R., Al-Assaad, K., Mehanna, C. J., Saliba, N. A., Katurji, M., & Roumié, M. (2013). Road versus roadside particle size distribution in a hot Mediterranean summer-Estimation of fleet emission factors. Journal of the Air and Waste Management Association, 63(3), 327-335. doi: 10.1080/10962247.2012.761660
Barkenbus, J. N. (2010). Eco-driving: An overlooked climate change initiative. Energy Policy, 38(2), 762-769. doi: 10.1016/j.enpol.2009.10.021
Bhat, C. R. (2008). The multiple discrete-continuous extreme value (MDCEV) model: Role of utility function parameters, identification considerations, and model extensions. Transportation Research Part B: Methodological, 42(3), 274-303. doi: http://dx.doi.org/10.1016/j.trb.2007.06.002
Bin, S., & Dowlatabadi, H. (2005). Consumer lifestyle approach to US energy use and the related CO2 emissions.
Energy Policy, 33(2), 197-208. doi: 10.1016/s0301-4215(03)00210-6
Borgie, M., Garat, A., Cazier, F., Delbende, A., Allorge, D., Ledoux, F., . . . Dagher, Z. (2014). Traffic-related air pollution. A pilot exposure assessment in Beirut, Lebanon. Chemosphere, 96, 122-128. doi: 10.1016/j.chemosphere.2013.09.034
Caruso, A., & Kern, F. (2004). ‘Transition Management Developing a More Sustainable Transportation System. Institut for Miljo, Teknologi og Samfund (TekSam), May 24, 2004. http://rudar.ruc.dk/bitstream/1800/406/1/Transition_Management_in.pdf
Chaaban, F. B., & Chedid, R. (2003). Technology needs assessment and technology transfer in developing countries: The case of Lebanon. World Resource Review, 15(2), 206-216.
Chaaban, F. B., Nuwayhid, I., & Djoundourian, S. (2001). A study of social and economic implications of mobile sources on air quality in Lebanon. Transportation Research Part D: Transport and Environment, 6(5), 347-355. doi: 10.1016/s1361-9209(01)00004-9
Chapman, L. (2007). Transport and climate change: A review. Journal of Transport Geography, 15(5), 354-367. doi: 10.1016/j.jtrangeo.2006.11.008
Daher, N., Saliba, N. A., Shihadeh, A. L., Jaafar, M., Baalbaki, R., & Sioutas, C. (2013). Chemical composition of size-resolved particulate matter at near-freeway and urban background sites in the greater Beirut area. Atmospheric Environment, 80, 96-106. doi: 10.1016/j.atmosenv.2013.08.004
Danaf, M., Abou-Zeid, M., & Kaysi, I. (2013). Modeling travel choices of students at a private, urban university: Insights and policy implications. Paper presented at the 13th World Conference on Transport Research, Rio de Janeiro, Brazil, July 15-18, 2013.
DMJM+Harris. (2003). Beirut Suburban Mass Transit Corridor Feasibility Study. Study prepared for the Ministry of Transportation and Public Works, Beirut, Republic of Lebanon
El-Fadel, M., & Bou-Zeid, E. (1999). Transportation GHG emissions in developing countries: The case of Lebanon. Transportation Research Part D: Transport and Environment, 4(4), 251-264. doi: 10.1016/s1361-9209(99)00008-5
El-Fadel, M., & Bou-Zeid, E. (2000). Transportation emissions in Lebanon: extent and mitigation. Paper presented at the International Conference on Urban Transport.

Commuters’ Behavior towards Upgraded Bus Services in Greater Beirut: Implications for Greenhouse Gas Emissions, Social Welfare and Transport Policy24
El-Fadel, M., Rachid, G., El-Samra, R., Bou Boutros, G., & Hashisho, J. (2013). Emissions reduction and economic implications of renewable energy market penetration of power generation for residential consumption in the MENA region. Energy Policy, 52, 618-627. doi: 10.1016/j.enpol.2012.10.015
Ferrini, S., & Scarpa, R. (2007). Designs with a priori information for nonmarket valuation with choice experiments: a Monte Carlo study. Journal of Environmental Economics and Management, 53(3), 342-363.
Fujii, S., & Kitamura, R. (2003). What does a one-month free bus ticket do to habitual drivers? An experimental analysis of habit and attitude change. Transportation, 30(1), 81-95. doi: 10.1023/A:1021234607980
Gaker, D., Vautin, D., Vij, A., & Walker, J. L. (2011). The power and value of green in promoting sustainable transport behavior. Environmental Research Letters, 6(3), 034010. doi: 10.1088/1748-9326/6/3/034010
Graham, J., Koo, M., & Wilson, T. D. (2011). Conserving energy by inducing people to drive less. Journal of Applied Social Psychology, 41(1), 106-118. doi: 10.1111/j.1559-1816.2010.00704.x
Hashisho, Z., & El-Fadel, M. (2004). Impacts of traffic-induced lead emissions on air, soil and blood lead levels in Beirut. Environmental Monitoring and Assessment, 93(1-3), 185-202.
Hensher, D. A. (2008). Climate change, enhanced greenhouse gas emissions and passenger transport–What can we do to make a difference? Transportation Research Part D: Transport and Environment, 13(2), 95-111.
Hensher, D. A., & Greene, W. H. (2003). The mixed logit model: the state of practice. Transportation, 30(2), 133-176. doi: 10.1023/a:1022558715350
Hess, S., Bierlaire, M., & Polak, J. W. (2005). Estimation of value of travel-time savings using mixed logit models. Transportation Research Part A: Policy and Practice, 39(2-3 SPEC. ISS.), 221-236.
Hodges, T. (2010). Public Transportation’s Role in Responding to Climate Change. Federal Transit Administration, US Department of Transportation, January 2010. http://www.fta.dot.gov/documents/PublicTransportationsRoleInRespondingToClimateChange2010.pdf
Hole, A. R. (2007). Fitting mixed logit models by using maximum simulated likelihood. Stata Journal, 7(3), 388-401.
IBI Group, & TEAM International. (2009). Study for the Revitalization of the Public and Freight Transport Industry in Lebanon. Report Submitted to the Ministry of Public Works and Transport, Lebanon.
IEA. (2012). CO2 Emissions from Fuel Combustion (Ed. 2012). Mimas, University of Manchester. http://dx.doi.org/10.5257/iea/co2/2012
IEA. (2013). Redrawing The Energy-Climate Map. World Energy Outlook Special Report. International Energy Agency, Paris, France, 10 June 2013. http://www.iea.org/publications/freepublications/publication/WEO_Special_Report_2013_Redrawing_the_Energy_Climate_Map.pdf
IPCC. (2007). Climate Change 2007: Synthesis Report. Contribution of Working Groups I, II and III to the Fourth Assessment Report of the Intergovernmental Panel on Climate Change [Core Writing Team, Pachauri, R.K and Reisinger, A. (eds.)]. Geneva, Switzerland.
Jariyasunant, J., Abou-Zeid, M., Carrel, A., Ekambaram, V., Gaker, D., Sengupta, R., & Walker, J. L. (forthcoming). Quantified traveler: Travel feedback meets the cloud to change behavior. Journal of Intelligent Transportation Systems: Technology, Planning, and Operations. doi: 10.1080/15472450.2013.856714
Kaysi, I., Harb, M., & Al-Dour, A. (2010). Fleet reduction reform of Lebanese jitneys. Paper presented at the 12th World Conference on Transport Research, Lisbon, Portugal, July 11-15, 2010.
Kost, C. (2004). Reducing Emissions through Transportation Mode Switching: Bus Rapid Transit in Cape Town, South Africa. 2nd edition, 26 May 2004. http://www.chriskost.net/documents/modeswitching.pdf
Matthies, E., Klöckner, C. A., & Preißner, C. L. (2006). Applying a modified moral decision making model to change habitual car use: How can commitment be effective? Applied Psychology, 55(1), 91-106. doi: 10.1111/j.1464-0597.2006.00237.x
Commuters’ Behavior towards Upgraded Bus Services in Greater Beirut: Implications for Greenhouse Gas Emissions, Social Welfare and Transport Policy 25
Metz, B., Davidson, O., Bosch, P., Dave, R., & Meyer, L. (Eds.). (2007). Climate Change 2007: Mitigation of Climate Change: Contribution of Working Group III to the Fourth Assessment Report of the Intergovernmental Panel on Climate Change. Cambridge, United Kingdom and New York, NY, USA: Cambridge University Press.
Ministry of Public Works and Transport. (2007). Public transport sector in Lebanon. Seminar on Safe and Sustainable Mobility in Mediterranean Cities, Barcelona, Spain, 10-14 December 2007.
MoE. (2005). National Environmental Action Plan. Beirut: Ministry of Environment.
MoE. (2011). Lebanon’s Second National Communication to the United Nations Framework Convention on Climate Change: Ministry of Environment, Lebanon.
MoE, URC, GEF, & UNDP. (2012). Lebanon: Technology Needs Assessment. Republic of Lebanon Ministry of Environment (MoE), UNEP Risø Centre on Energy, Climate and Sustainable Development (URC), Global Environment Facility (GEF) and United Nations Development Programme (UNDP), December 2012. http://unfccc.int/ttclear/sunsetcms/storage/contents/stored-file-20130327162628519/TechnologyNeedsAssessment-ClimateChange_Lebanon.pdf
Möser, G., & Bamberg, S. (2008). The effectiveness of soft transport policy measures: A critical assessment and meta-analysis of empirical evidence. Journal of Environmental Psychology, 28(1), 10-26.
Nakicenovic, N., & Swart, R. (Eds.). (2000). Special Report on Emissions Scenarios. Cambridge, UK: Cambridge University Press.
Nakkash, T. (1999). Transport plan for Greater Beirut. In M. H. Baaj (Ed.), Proceedings of the Workshop on Land Transport Policy for Lebanon. Prepared for Lebanon, Ministry of Transport.
Outwater, M. L., Spitz, G., Lobb, J., Campbell, M., Sana, B., Pendyala, R., & Woodford, W. (2011). Characteristics of premium transit services that affect mode choice. Transportation, 38(4), 605-623. doi: 10.1007/s11116-011-9334-0
Pershing, J. (2000). Fossil fuel implications of climate change mitigation responses. Paper presented at the Sectoral economic costs and benefits of GHG mitigation, IPCC Expert Meeting Held in Eisenach, Germany, 14-15 February 2000. http://ipccch.alkwop.ru/pdf/supporting-material/sectoral-economic-costs-2000.pdf#page=91
Poudenx, P. (2008). The effect of transportation policies on energy consumption and greenhouse gas emission from urban passenger transportation. Transportation Research Part A: Policy and Practice, 42(6), 901-909. doi: 10.1016/j.tra.2008.01.013
Sbayti, H., El-Fadel, M., & Kaysi, I. (2002). Effect of roadway network aggregation levels on modeling of traffic-induced emission inventories in Beirut. Transportation Research Part D: Transport and Environment, 7(3), 163-173. doi: 10.1016/S1361-9209(01)00017-7
Schwanen, T., Banister, D., & Anable, J. (2011). Scientific research about climate change mitigation in transport: A critical review. Transportation Research Part A: Policy and Practice, 45(10), 993-1006. doi: 10.1016/j.tra.2011.09.005
Stern, N. (2007). The economics of climate change: the Stern review: Cambridge University Press.
Thøgersen, J. (2009). Promoting public transport as a subscription service: Effects of a free month travel card. Transport Policy, 16(6), 335-343. doi: 10.1016/j.tranpol.2009.10.008
Train, K. E. (2009). Discrete Choice Methods with Simulation (2nd ed.). New York: Cambridge University Press.
UITP. (undated). Public Transport and CO2 Emissions. International Association of Public Transport. http://www.ourfutureplanet.org/newsletters/resources/UITP%20CO2%20emissions%20from%20passenger%20transport%20correlation%20between%20mobility%20patterns%20and%20CO2%20emissions.pdf
US EPA. (2008). Climate Leaders Greenhouse Gas Inventory Protocol Core Module Guidance, Optional Emissions from Employee Commuting, Business Travel and Product Transport. Office of Air and Radiation, United States Environmental Protection Agency, May 2008. http://www.google.com/url?sa=t&rct=j&q=&esrc=s&source=web&cd=1&cad=rja&uact=8&ved=0CCgQFjAA&url=http%3A%2F%2Fwww.epa.gov%2Fstateply%2Fdocuments%2Fresources%2Fcommute_travel_product.pdf&ei=ed4aU66xDMrrswb3s4CADA&usg=AFQjCNGOzmShNUBdfuQBxoj4hcdu3K
Commuters’ Behavior towards Upgraded Bus Services in Greater Beirut: Implications for Greenhouse Gas Emissions, Social Welfare and Transport Policy26
Mg7w&sig2=egmyuqCkW4sc-JsomQ5SUg&bvm=bv.62578216,d.Yms
Waked, A., Afif, C., & Seigneur, C. (2012). An atmospheric emission inventory of anthropogenic and biogenic sources for Lebanon. Atmospheric Environment, 50, 88-96. doi: 10.1016/j.atmosenv.2011.12.058
Waterson, B. J., Rajbhandari, B., & Hounsell, N. B. (2003). Simulating the impacts of strong bus priority measures. Journal of Transportation Engineering, 129(6), 642-647. doi: 10.1061/(asce)0733-947x(2003)129:6(642)
WRI. (2012). Climate Analysis Indicators Tool (Online database). from World Resources Institute http://cait2.wri.org/wri/Country%20GHG%20Emissions?indicator[]=Total%20GHG%20Emissions%20Excluding%20LUCF&indicator[]=Total%20GHG%20Emissions%20Including%20LUCF&year[]=2010&chartType=geo
Wright, L., & Fulton, L. (2005). Climate change mitigation and transport in developing nations. Transport Reviews, 25(6), 691-717.
Younger, M., Morrow-Almeida, H. R., Vindigni, S. M., & Dannenberg, A. L. (2008). The built environment, climate change, and health: opportunities for co-benefits. American Journal of Preventive Medicine, 35(5), 517-526. doi: 10.1016/j.amepre.2008.08.017
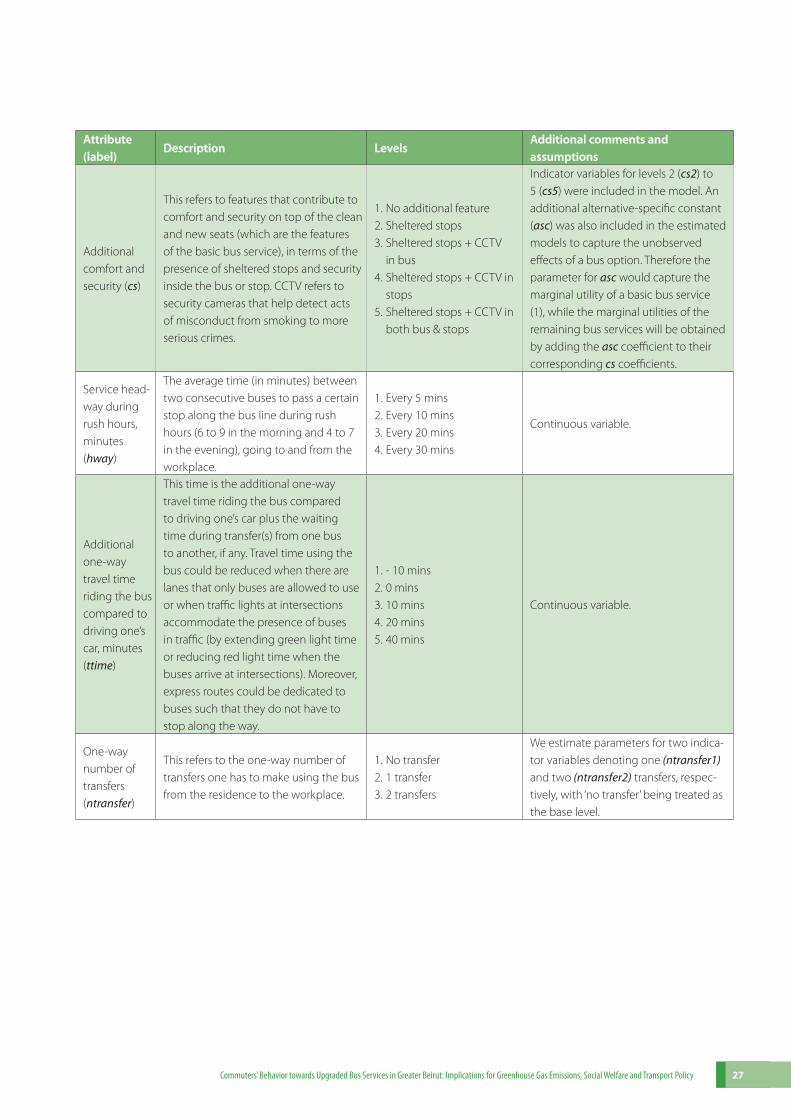
Commuters’ Behavior towards Upgraded Bus Services in Greater Beirut: Implications for Greenhouse Gas Emissions, Social Welfare and Transport Policy 27
Attribute (label)
Description LevelsAdditional comments and assumptions
Additional comfort and security (cs)
This refers to features that contribute to comfort and security on top of the clean and new seats (which are the features of the basic bus service), in terms of the presence of sheltered stops and security inside the bus or stop. CCTV refers to security cameras that help detect acts of misconduct from smoking to more serious crimes.
1. No additional feature2. Sheltered stops3. Sheltered stops + CCTV
in bus4. Sheltered stops + CCTV in
stops5. Sheltered stops + CCTV in
both bus & stops
Indicator variables for levels 2 (cs2) to 5 (cs5) were included in the model. An additional alternative-specific constant (asc) was also included in the estimated models to capture the unobserved effects of a bus option. Therefore the parameter for asc would capture the marginal utility of a basic bus service (1), while the marginal utilities of the remaining bus services will be obtained by adding the asc coefficient to their corresponding cs coefficients.
Service head-way during rush hours, minutes (hway)
The average time (in minutes) between two consecutive buses to pass a certain stop along the bus line during rush hours (6 to 9 in the morning and 4 to 7 in the evening), going to and from the workplace.
1. Every 5 mins2. Every 10 mins3. Every 20 mins4. Every 30 mins
Continuous variable.
Additional one-way travel time riding the bus compared to driving one’s car, minutes (ttime)
This time is the additional one-way travel time riding the bus compared to driving one’s car plus the waiting time during transfer(s) from one bus to another, if any. Travel time using the bus could be reduced when there are lanes that only buses are allowed to use or when traffic lights at intersections accommodate the presence of buses in traffic (by extending green light time or reducing red light time when the buses arrive at intersections). Moreover, express routes could be dedicated to buses such that they do not have to stop along the way.
1. - 10 mins2. 0 mins3. 10 mins4. 20 mins5. 40 mins
Continuous variable.
One-way number of transfers (ntransfer)
This refers to the one-way number of transfers one has to make using the bus from the residence to the workplace.
1. No transfer 2. 1 transfer3. 2 transfers
We estimate parameters for two indica-tor variables denoting one (ntransfer1) and two (ntransfer2) transfers, respec-tively, with ‘no transfer’ being treated as the base level.

Commuters’ Behavior towards Upgraded Bus Services in Greater Beirut: Implications for Greenhouse Gas Emissions, Social Welfare and Transport Policy28
Attribute (label)
Description LevelsAdditional comments and assumptions
Total one-way access + egress time, minutes (egress)
For bus, it is the time (in minutes) required to walk to the first bus stop + the time to walk from where the commuter is dropped off by the last bus to the workplace. For car, it is the time (in minutes) required to walk from the parking lot where the commuter parks his/her car to his/her workplace.
1. 2 mins2. 5 mins3. 15 mins4. 30 mins
Continuous variable. This attribute is common to both the car and bus options. For the car option, the value was elicited for the respondent by means of an open-ended question. For respondents who did not disclose any time value, a value of 0 was assigned to them and their effect was captured by means of an indicator variable, egress_dk, which equaled 1 if access or egress time was not reported and zero otherwise.
Does the bus have a Wi-Fi connection? (wifi)
It reflects the presence of a free Wi-Fi service inside the improved bus.
1. No (0)2. Yes (1)
Indicator variable.
Is the bus air-conditioned? (ac)
It reflects the presence of an air-condi-tioning unit inside the improved bus.
1. No (0)2. Yes (1)
Indicator variable. All cars were assumed to be air-conditioned.
One-way door-to-door travel cost, Lebanese Pounds - LBP (cost)
The cost (in LBP’s) incurred by using the car or the improved bus service for a one-way ride from home to work, or work to home.
1. LBP 1,0002. LBP 1,2503. LBP 1,5004. LBP 2,0005. LBP 3,0006. LBP 4,000
Continuous variable. For car cost, this attribute was calculated as the running cost, assumed to consist of parking and petrol costs. For parking, if a daily figure was reported by the respondent, it was divided by two to make it one-way. If a monthly figure was reported, it was divided by ((reported working days per week) ×4+ 2)/2. To this value was added the petrol running cost. This was equal to (one-way travel distance) × LBP33,000/tank × 127Km/tank, the last two terms being the average price of a 20L fuel tank during the time the study was conducted and the average fuel consumption of cars in Lebanon, respectively. Where distance range was reported, the value was taken to be the range’s mid-point. Where the reported value was >20Km, it was assumed to be 25Km. When not reported, distance was approximated by inputting the reported residence and workplace locations to Google Maps. Finally, since the marginal utility of cost is expected to be negative, and its estimate, which we assume to be lognormal, can only be positive, we multiplied all cost variables by -1.
Table 1: Summary of the attributes and levels and their descriptions
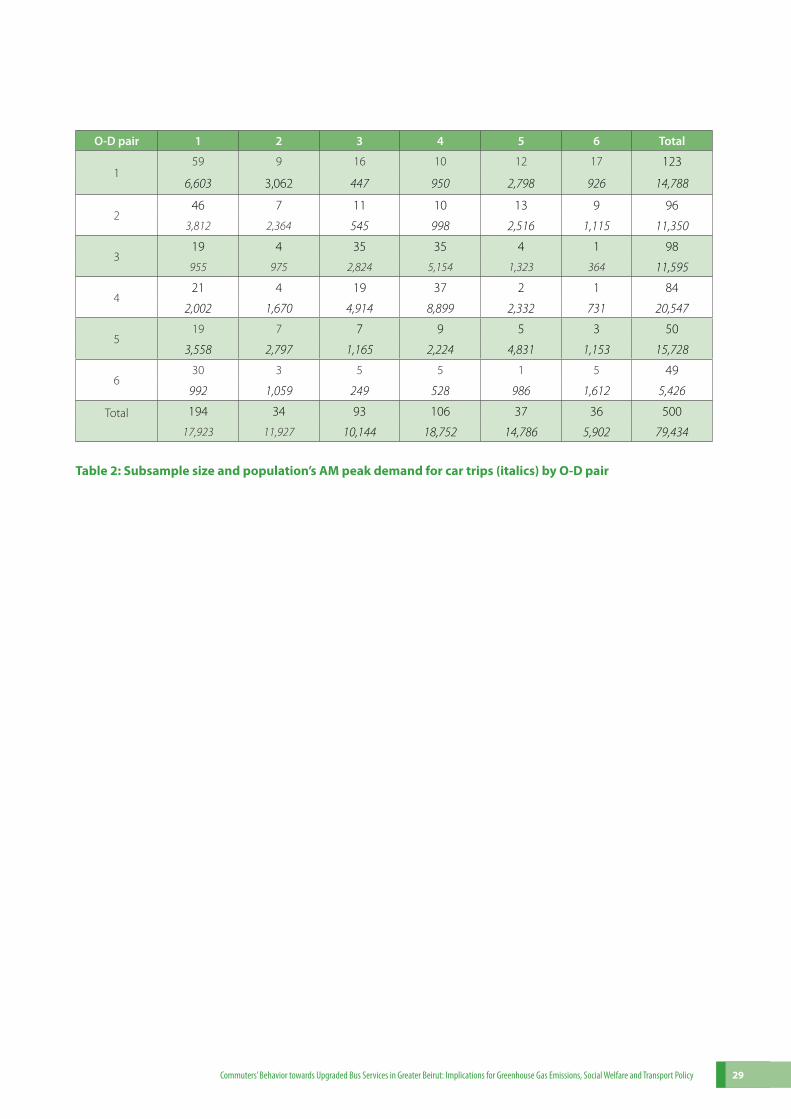
Commuters’ Behavior towards Upgraded Bus Services in Greater Beirut: Implications for Greenhouse Gas Emissions, Social Welfare and Transport Policy 29
O-D pair 1 2 3 4 5 6 Total
159 9 16 10 12 17 123
6,603 3,062 447 950 2,798 926 14,788
246 7 11 10 13 9 96
3,812 2,364 545 998 2,516 1,115 11,350
319 4 35 35 4 1 98
955 975 2,824 5,154 1,323 364 11,595
421 4 19 37 2 1 84
2,002 1,670 4,914 8,899 2,332 731 20,547
519 7 7 9 5 3 50
3,558 2,797 1,165 2,224 4,831 1,153 15,728
630 3 5 5 1 5 49
992 1,059 249 528 986 1,612 5,426
Total
194 34 93 106 37 36 500
17,923 11,927 10,144 18,752 14,786 5,902 79,434
Table 2: Subsample size and population’s AM peak demand for car trips (italics) by O-D pair
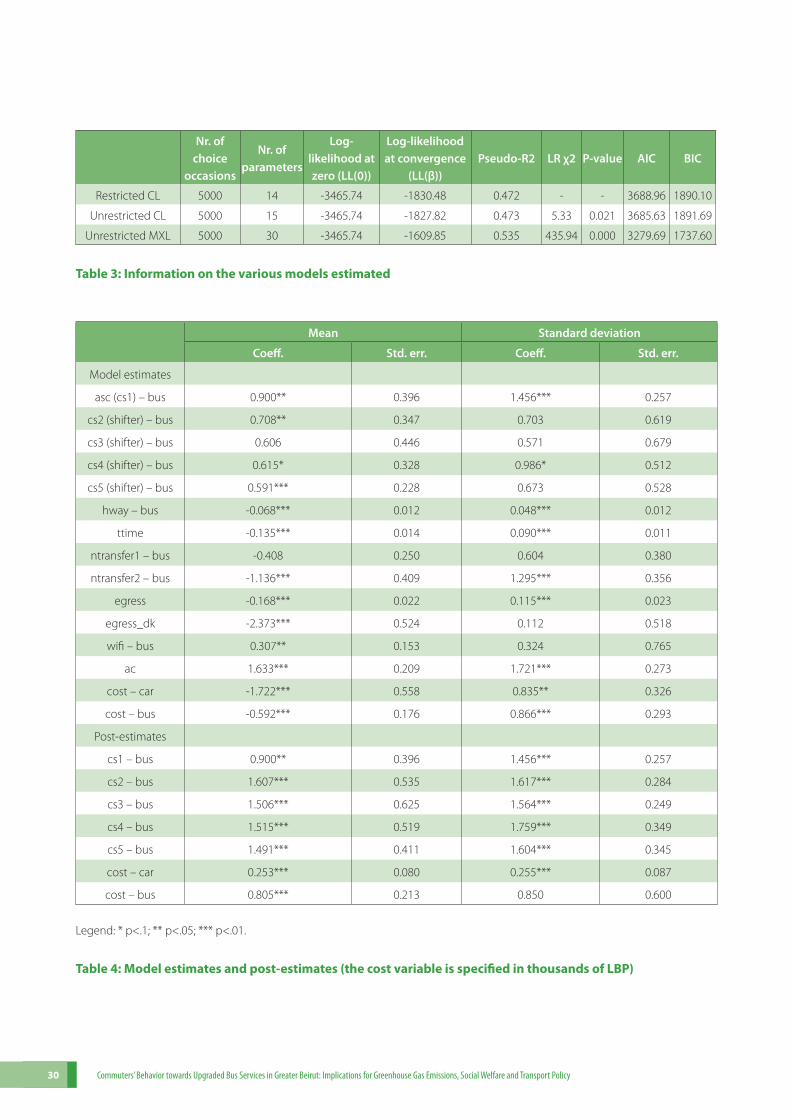
Commuters’ Behavior towards Upgraded Bus Services in Greater Beirut: Implications for Greenhouse Gas Emissions, Social Welfare and Transport Policy30
Nr. of
choice occasions
Nr. of parameters
Log-likelihood at zero (LL(0))
Log-likelihood at convergence
(LL(β))Pseudo-R2 LR χ2 P-value AIC BIC
Restricted CL 5000 14 -3465.74 -1830.48 0.472 - - 3688.96 1890.10
Unrestricted CL 5000 15 -3465.74 -1827.82 0.473 5.33 0.021 3685.63 1891.69
Unrestricted MXL 5000 30 -3465.74 -1609.85 0.535 435.94 0.000 3279.69 1737.60
Table 3: Information on the various models estimated
Mean Standard deviation
Coeff. Std. err. Coeff. Std. err.
Model estimates
asc (cs1) – bus 0.900** 0.396 1.456*** 0.257
cs2 (shifter) – bus 0.708** 0.347 0.703 0.619
cs3 (shifter) – bus 0.606 0.446 0.571 0.679
cs4 (shifter) – bus 0.615* 0.328 0.986* 0.512
cs5 (shifter) – bus 0.591*** 0.228 0.673 0.528
hway – bus -0.068*** 0.012 0.048*** 0.012
ttime -0.135*** 0.014 0.090*** 0.011
ntransfer1 – bus -0.408 0.250 0.604 0.380
ntransfer2 – bus -1.136*** 0.409 1.295*** 0.356
egress -0.168*** 0.022 0.115*** 0.023
egress_dk -2.373*** 0.524 0.112 0.518
wifi – bus 0.307** 0.153 0.324 0.765
ac 1.633*** 0.209 1.721*** 0.273
cost – car -1.722*** 0.558 0.835** 0.326
cost – bus -0.592*** 0.176 0.866*** 0.293
Post-estimates
cs1 – bus 0.900** 0.396 1.456*** 0.257
cs2 – bus 1.607*** 0.535 1.617*** 0.284
cs3 – bus 1.506*** 0.625 1.564*** 0.249
cs4 – bus 1.515*** 0.519 1.759*** 0.349
cs5 – bus 1.491*** 0.411 1.604*** 0.345
cost – car 0.253*** 0.080 0.255*** 0.087
cost – bus 0.805*** 0.213 0.850 0.600
Legend: * p<.1; ** p<.05; *** p<.01.
Table 4: Model estimates and post-estimates (the cost variable is specified in thousands of LBP)
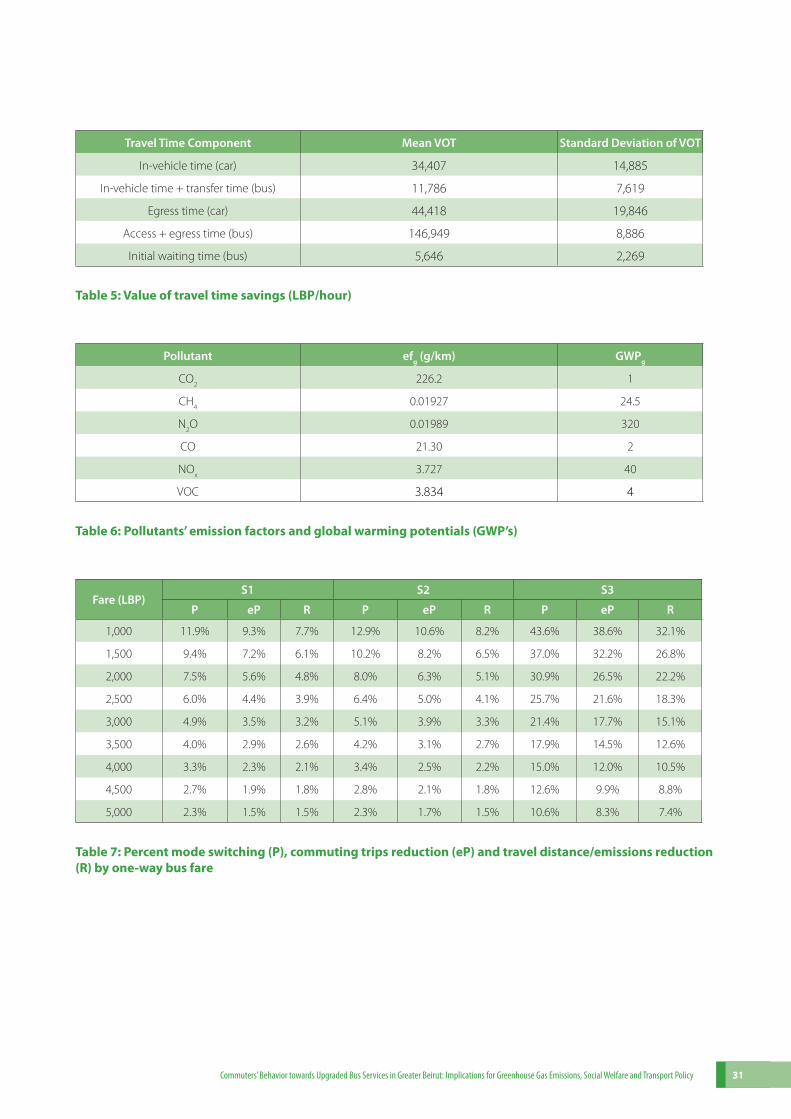
Commuters’ Behavior towards Upgraded Bus Services in Greater Beirut: Implications for Greenhouse Gas Emissions, Social Welfare and Transport Policy 31
Travel Time Component Mean VOT Standard Deviation of VOT
In-vehicle time (car) 34,407 14,885
In-vehicle time + transfer time (bus) 11,786 7,619
Egress time (car) 44,418 19,846
Access + egress time (bus) 146,949 8,886
Initial waiting time (bus) 5,646 2,269
Table 5: Value of travel time savings (LBP/hour)
Pollutant efg (g/km) GWPg
CO2
226.2 1
CH4
0.01927 24.5
N2O 0.01989 320
CO 21.30 2
NOx 3.727 40
VOC 3.834 4
Table 6: Pollutants’ emission factors and global warming potentials (GWP’s)
Fare (LBP)S1 S2 S3
P eP R P eP R P eP R
1,000 11.9% 9.3% 7.7% 12.9% 10.6% 8.2% 43.6% 38.6% 32.1%
1,500 9.4% 7.2% 6.1% 10.2% 8.2% 6.5% 37.0% 32.2% 26.8%
2,000 7.5% 5.6% 4.8% 8.0% 6.3% 5.1% 30.9% 26.5% 22.2%
2,500 6.0% 4.4% 3.9% 6.4% 5.0% 4.1% 25.7% 21.6% 18.3%
3,000 4.9% 3.5% 3.2% 5.1% 3.9% 3.3% 21.4% 17.7% 15.1%
3,500 4.0% 2.9% 2.6% 4.2% 3.1% 2.7% 17.9% 14.5% 12.6%
4,000 3.3% 2.3% 2.1% 3.4% 2.5% 2.2% 15.0% 12.0% 10.5%
4,500 2.7% 1.9% 1.8% 2.8% 2.1% 1.8% 12.6% 9.9% 8.8%
5,000 2.3% 1.5% 1.5% 2.3% 1.7% 1.5% 10.6% 8.3% 7.4%
Table 7: Percent mode switching (P), commuting trips reduction (eP) and travel distance/emissions reduction (R) by one-way bus fare
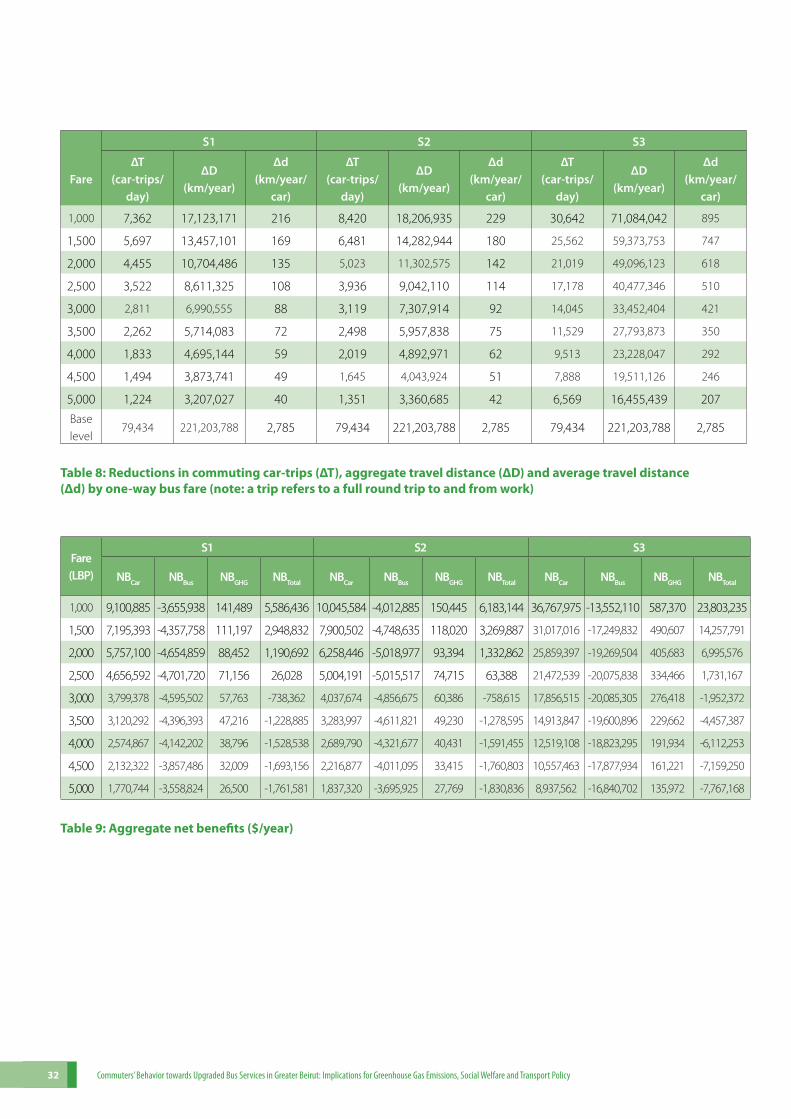
Commuters’ Behavior towards Upgraded Bus Services in Greater Beirut: Implications for Greenhouse Gas Emissions, Social Welfare and Transport Policy32
S1 S2 S3
FareΔT
(car-trips/day)
ΔD (km/year)
Δd (km/year/
car)
ΔT (car-trips/
day)
ΔD (km/year)
Δd (km/year/
car)
ΔT (car-trips/
day)
ΔD (km/year)
Δd (km/year/
car)
1,000 7,362 17,123,171 216 8,420 18,206,935 229 30,642 71,084,042 895
1,500 5,697 13,457,101 169 6,481 14,282,944 180 25,562 59,373,753 747
2,000 4,455 10,704,486 135 5,023 11,302,575 142 21,019 49,096,123 618
2,500 3,522 8,611,325 108 3,936 9,042,110 114 17,178 40,477,346 510
3,000 2,811 6,990,555 88 3,119 7,307,914 92 14,045 33,452,404 421
3,500 2,262 5,714,083 72 2,498 5,957,838 75 11,529 27,793,873 350
4,000 1,833 4,695,144 59 2,019 4,892,971 62 9,513 23,228,047 292
4,500 1,494 3,873,741 49 1,645 4,043,924 51 7,888 19,511,126 246
5,000 1,224 3,207,027 40 1,351 3,360,685 42 6,569 16,455,439 207
Base level
79,434 221,203,788 2,785 79,434 221,203,788 2,785 79,434 221,203,788 2,785
Table 8: Reductions in commuting car-trips (ΔT), aggregate travel distance (ΔD) and average travel distance (Δd) by one-way bus fare (note: a trip refers to a full round trip to and from work)
Fare (LBP)
S1 S2 S3
NBCar NBBus NBGHG NBTotal NBCar NBBus NBGHG NBTotal NBCar NBBus NBGHG NBTotal
1,000 9,100,885 -3,655,938 141,489 5,586,436 10,045,584 -4,012,885 150,445 6,183,144 36,767,975 -13,552,110 587,370 23,803,235
1,500 7,195,393 -4,357,758 111,197 2,948,832 7,900,502 -4,748,635 118,020 3,269,887 31,017,016 -17,249,832 490,607 14,257,791
2,000 5,757,100 -4,654,859 88,452 1,190,692 6,258,446 -5,018,977 93,394 1,332,862 25,859,397 -19,269,504 405,683 6,995,576
2,500 4,656,592 -4,701,720 71,156 26,028 5,004,191 -5,015,517 74,715 63,388 21,472,539 -20,075,838 334,466 1,731,167
3,000 3,799,378 -4,595,502 57,763 -738,362 4,037,674 -4,856,675 60,386 -758,615 17,856,515 -20,085,305 276,418 -1,952,372
3,500 3,120,292 -4,396,393 47,216 -1,228,885 3,283,997 -4,611,821 49,230 -1,278,595 14,913,847 -19,600,896 229,662 -4,457,387
4,000 2,574,867 -4,142,202 38,796 -1,528,538 2,689,790 -4,321,677 40,431 -1,591,455 12,519,108 -18,823,295 191,934 -6,112,253
4,500 2,132,322 -3,857,486 32,009 -1,693,156 2,216,877 -4,011,095 33,415 -1,760,803 10,557,463 -17,877,934 161,221 -7,159,250
5,000 1,770,744 -3,558,824 26,500 -1,761,581 1,837,320 -3,695,925 27,769 -1,830,836 8,937,562 -16,840,702 135,972 -7,767,168
Table 9: Aggregate net benefits ($/year)
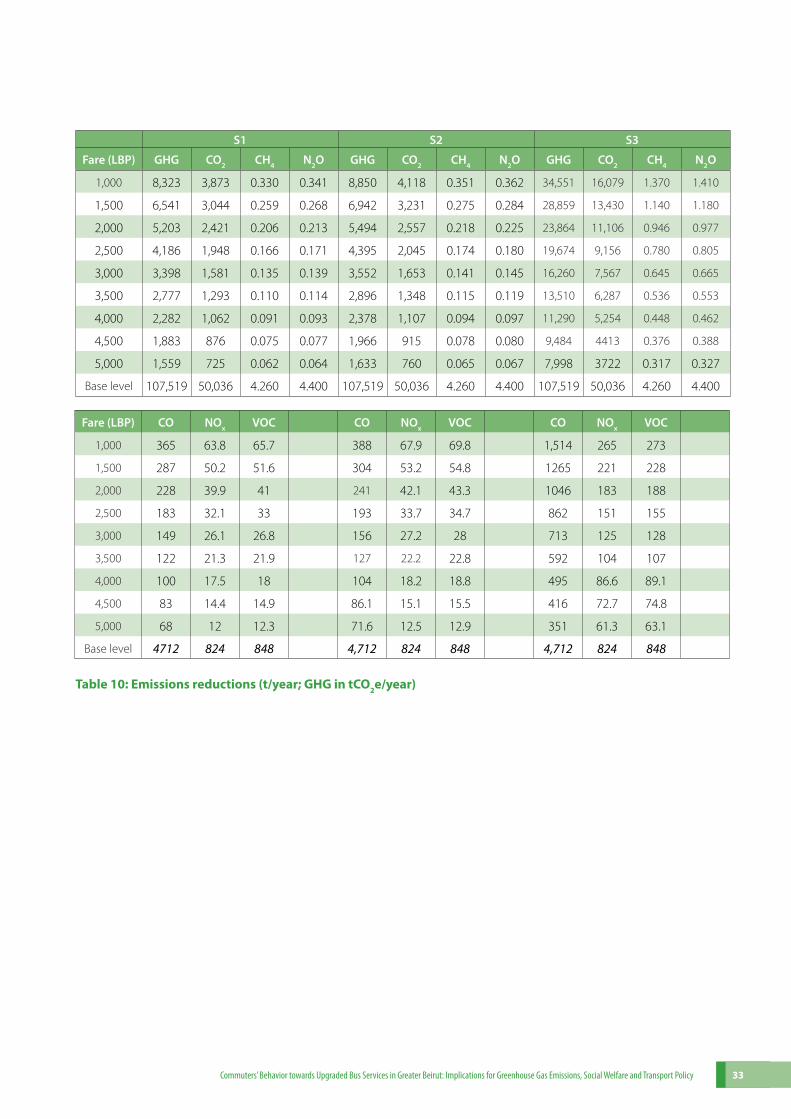
Commuters’ Behavior towards Upgraded Bus Services in Greater Beirut: Implications for Greenhouse Gas Emissions, Social Welfare and Transport Policy 33
S1 S2 S3
Fare (LBP) GHG CO2 CH4 N2O GHG CO2 CH4 N2O GHG CO2 CH4 N2O
1,000 8,323 3,873 0.330 0.341 8,850 4,118 0.351 0.362 34,551 16,079 1.370 1.410
1,500 6,541 3,044 0.259 0.268 6,942 3,231 0.275 0.284 28,859 13,430 1.140 1.180
2,000 5,203 2,421 0.206 0.213 5,494 2,557 0.218 0.225 23,864 11,106 0.946 0.977
2,500 4,186 1,948 0.166 0.171 4,395 2,045 0.174 0.180 19,674 9,156 0.780 0.805
3,000 3,398 1,581 0.135 0.139 3,552 1,653 0.141 0.145 16,260 7,567 0.645 0.665
3,500 2,777 1,293 0.110 0.114 2,896 1,348 0.115 0.119 13,510 6,287 0.536 0.553
4,000 2,282 1,062 0.091 0.093 2,378 1,107 0.094 0.097 11,290 5,254 0.448 0.462
4,500 1,883 876 0.075 0.077 1,966 915 0.078 0.080 9,484 4413 0.376 0.388
5,000 1,559 725 0.062 0.064 1,633 760 0.065 0.067 7,998 3722 0.317 0.327
Base level 107,519 50,036 4.260 4.400 107,519 50,036 4.260 4.400 107,519 50,036 4.260 4.400
Fare (LBP) CO NOx VOC CO NOx VOC CO NOx VOC
1,000 365 63.8 65.7 388 67.9 69.8 1,514 265 273
1,500 287 50.2 51.6 304 53.2 54.8 1265 221 228
2,000 228 39.9 41 241 42.1 43.3 1046 183 188
2,500 183 32.1 33 193 33.7 34.7 862 151 155
3,000 149 26.1 26.8 156 27.2 28 713 125 128
3,500 122 21.3 21.9 127 22.2 22.8 592 104 107
4,000 100 17.5 18 104 18.2 18.8 495 86.6 89.1
4,500 83 14.4 14.9 86.1 15.1 15.5 416 72.7 74.8
5,000 68 12 12.3 71.6 12.5 12.9 351 61.3 63.1
Base level 4712 824 848 4,712 824 848 4,712 824 848
Table 10: Emissions reductions (t/year; GHG in tCO2e/year)
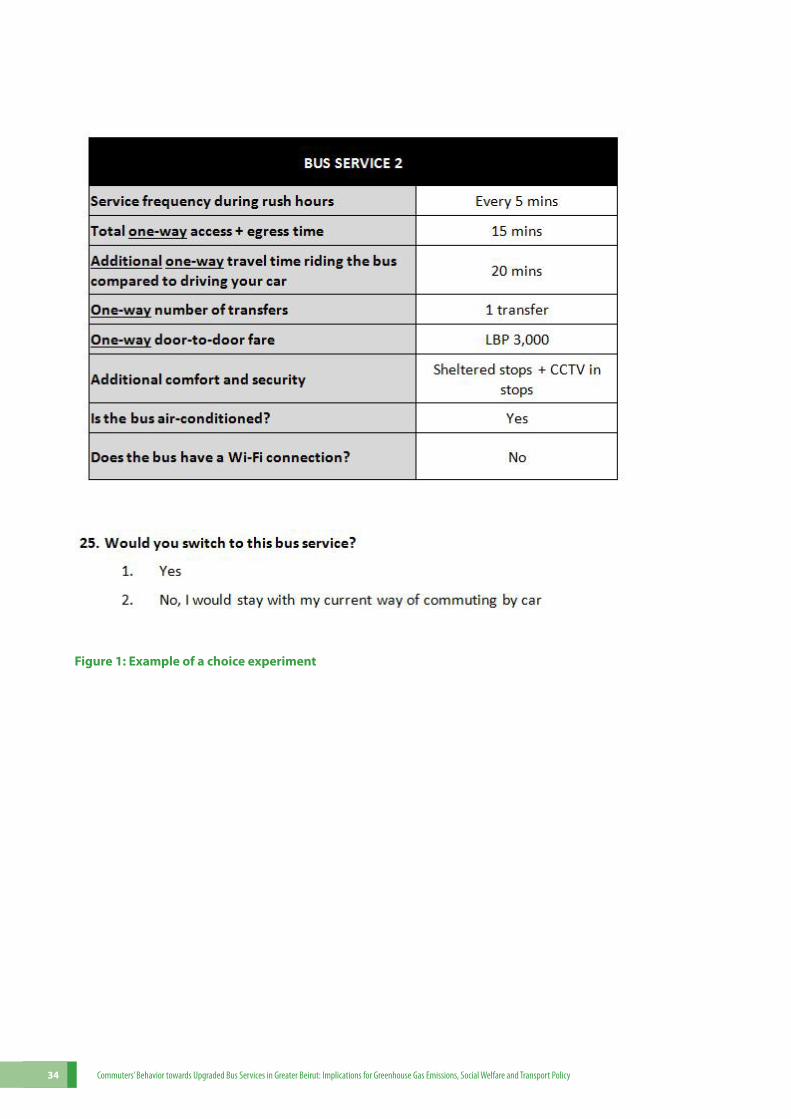
Commuters’ Behavior towards Upgraded Bus Services in Greater Beirut: Implications for Greenhouse Gas Emissions, Social Welfare and Transport Policy34
Figure 1: Example of a choice experiment
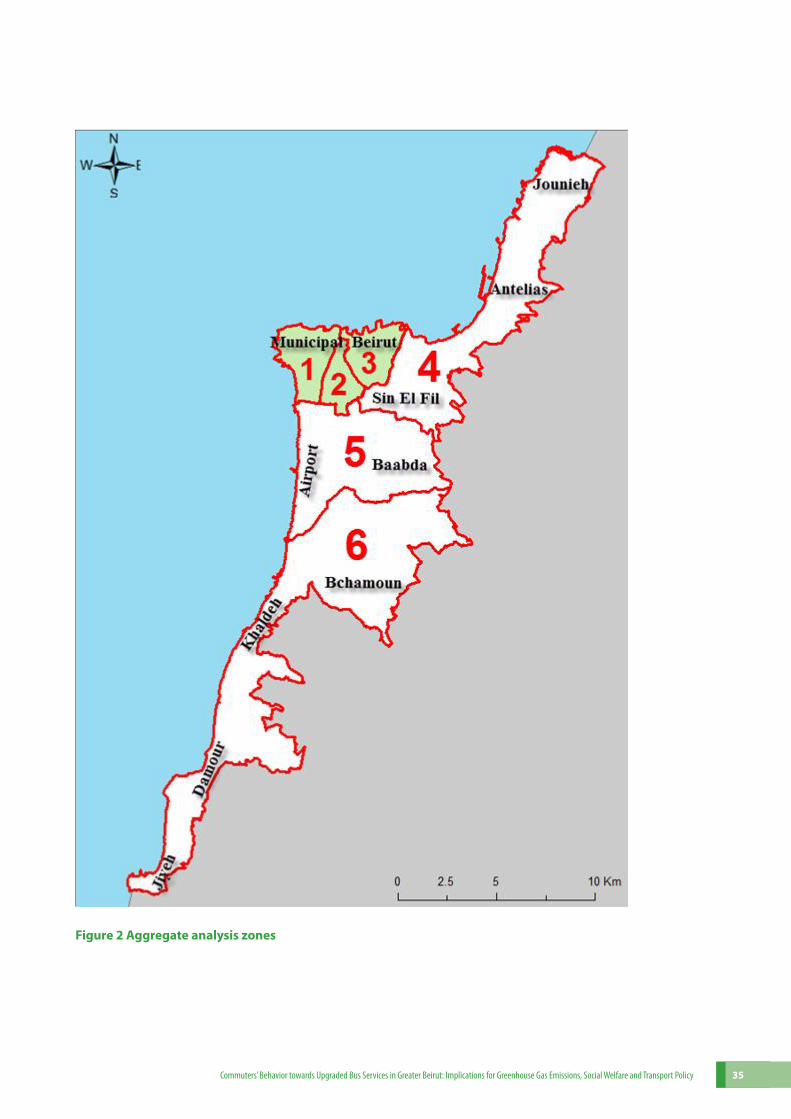
Commuters’ Behavior towards Upgraded Bus Services in Greater Beirut: Implications for Greenhouse Gas Emissions, Social Welfare and Transport Policy 35
Figure 2 Aggregate analysis zones
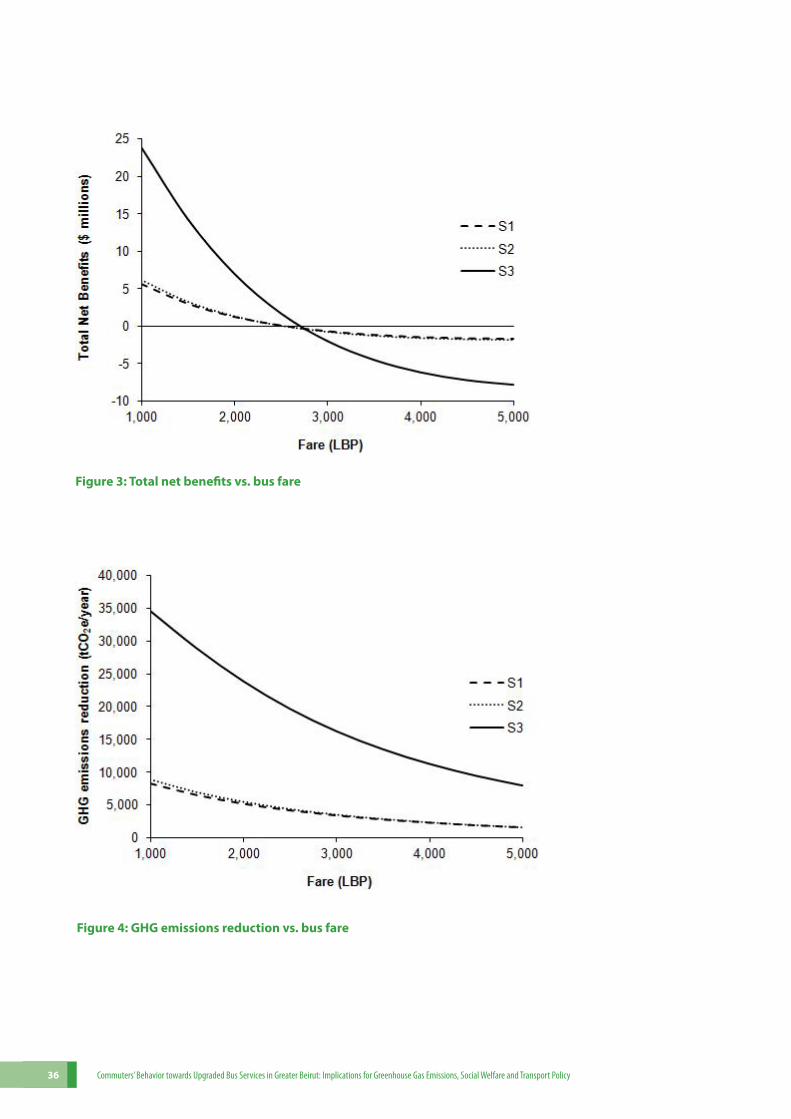
Commuters’ Behavior towards Upgraded Bus Services in Greater Beirut: Implications for Greenhouse Gas Emissions, Social Welfare and Transport Policy36
Figure 3: Total net benefits vs. bus fare
Figure 4: GHG emissions reduction vs. bus fare

Wor
king
Pap
er #
27
Febr
uary
201
5
The Issam Fares Institute for Public Policy and International Affairs (IFI)
American University of Beirut | PO Box 11-0236, Riad El Solh 1107 2020, Beirut, LebanonTel: +961-1-374374, Ext: 4150 | Fax: +961-1-737627 | Email: [email protected] | Website: www.aub.edu.lb/ifi