Community Services Block Grant (CSBG) Annual … Services Block Grant (CSBG) Annual Report . ......
70
Community Services Block Grant (CSBG) Annual Report OMB Control No: 0970-0492 Expiration Date: 01/31/2020
Transcript of Community Services Block Grant (CSBG) Annual … Services Block Grant (CSBG) Annual Report . ......
Community Services Block
Grant (CSBG) Annual Report
OMB Control No: 0970-0492Expiration Date: 01/31/2020
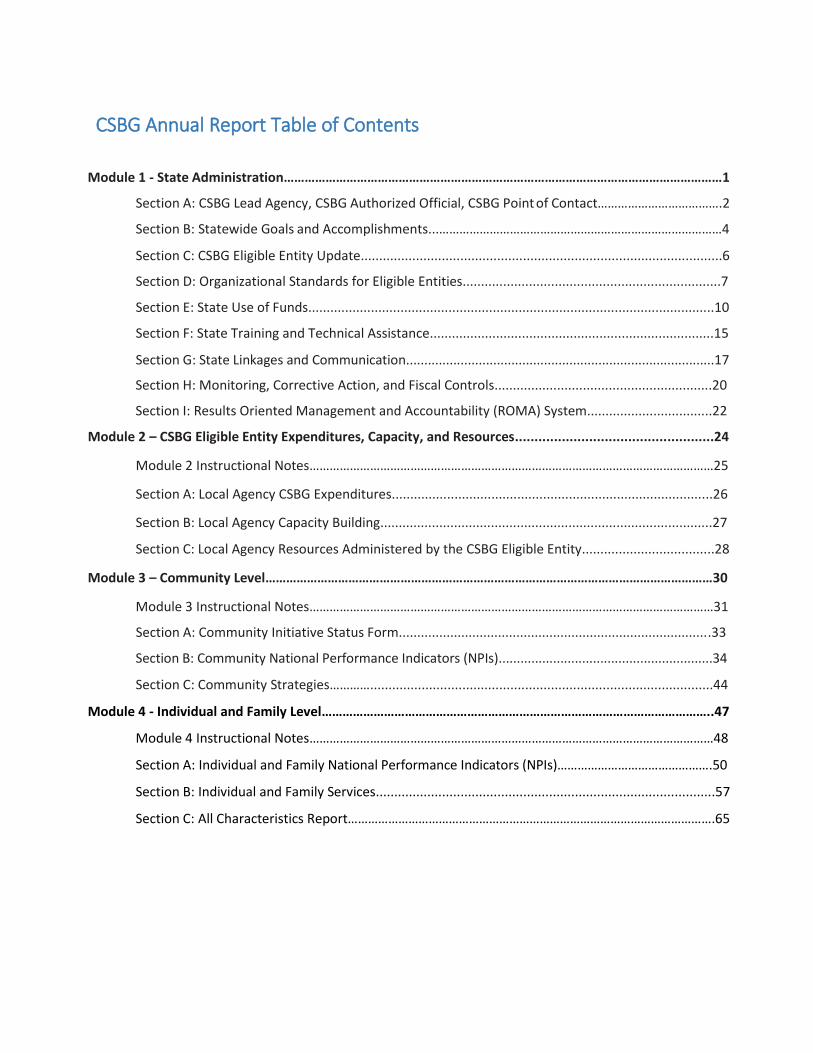
CSBG Annual Report Table of Contents
Module 1 - State Administration………………………………………………………………………………………………………………1
Section A: CSBG Lead Agency, CSBG Authorized Official, CSBG Point of Contact////////////.2
Section B: Statewide Goals and Accomplishments...////////////////////////////4
Section C: CSBG Eligible Entity Update..................................................................................................6
Section D: Organizational Standards for Eligible Entities......................................................................7
Section E: State Use of Funds..............................................................................................................10
Section F: State Training and Technical Assistance.............................................................................15
Section G: State Linkages and Communication.....................................................................................17
Section H: Monitoring, Corrective Action, and Fiscal Controls...........................................................20
Section I: Results Oriented Management and Accountability (ROMA) System..................................22
Module 2 – CSBG Eligible Entity Expenditures, Capacity, and Resources...................................................24
Module 2 Instructional Notes////////////////////////////////////////25
Section A: Local Agency CSBG Expenditures.......................................................................................26
Section B: Local Agency Capacity Building..........................................................................................27
Section C: Local Agency Resources Ad ministered by the CSBG Eligible Entity....................................28
Module 3 – Community Level…………………………………………………………………………………………………………………30
Module 3 Instructional Notes////////////////////////////////////////31
Section A: Community Initiative Status Form.....................................................................................33
Section B: Community National Performance Indicators (NPIs)...........................................................34
Section C: Community Strategies////.............................................................................................44
Module 4 - Individual and Family Level…………………………………………………………………………………………………..47
Module 4 Instructional Notes////////////////////////////////////////48
Section A: Individual and Family National Performance Indicators (NPIs)///////////////.50
Section B: Individual and Family Services............................................................................................57
Section C: All Characteristics Report////////////////////////////////////.65

Module 1
State Administration
Page 1 of 66

Community Services Block Grant (CSBG) Annual Report – State Administration Module
Note: The reporting timeframes for all information in the administrative module is based on the Federal Fiscal Year, which runs from October 1 of a given calendar year until September 30 of the following calendar year. When completing the annual report, respondents will first indicate the Federal Fiscal Year for which the state is submitting data. The Online Data Collection (OLDC) system will then auto‐populate the administrative module with information from the appropriate year (year 1 or year 2) in the accepted CSBG State Plan. States will be able to update information in these sections, as necessary.
SECTION A CSBG Lead Agency, CSBG Authorized Official, CSBG Point of Contact
A.1. Confirm and update the following information in relation to the lead agency designated to
administer the CSBG in the State, as required by Section 676(a) of the CSBG Act.
A.1a. Lead agency
[This section will auto‐populate using information provided in the CSBG State Plan. The State should review all items and may update to note any changes that have taken place during the year. Any updates or changes will be noted in quality assurance reviews and may require brief explanation prior to acceptance of the annual report.]
A.1b. Cabinet or administrative department of this lead agency
[Auto‐populated from the CSBG State Plan with option to update where applicable]
Community Services Department Human Services Department Social Services Department Governor’s Office Community Affairs Department Other, describe:
A.1c. Division, bureau, or office of the CSBG authorized official [Narrative, 2500 Characters] [Auto‐populated from the CSBG State Plan with option to update where applicable]
A.1d. Authorized official of the lead agency [Narrative, 2500 Characters]
[Auto‐populated from the CSBG State Plan with option to update where applicable]
Instructional note: The authorized official could be the director, secretary, commissioner etc. as assigned in the designation letter (attached under item 1.3). The authorized official is the person indicated as authorized representative on the SF‐424M.
A.1e. Street address [Narrative, 2500 Characters]
Module 1 State Administration
Page 2 of 66
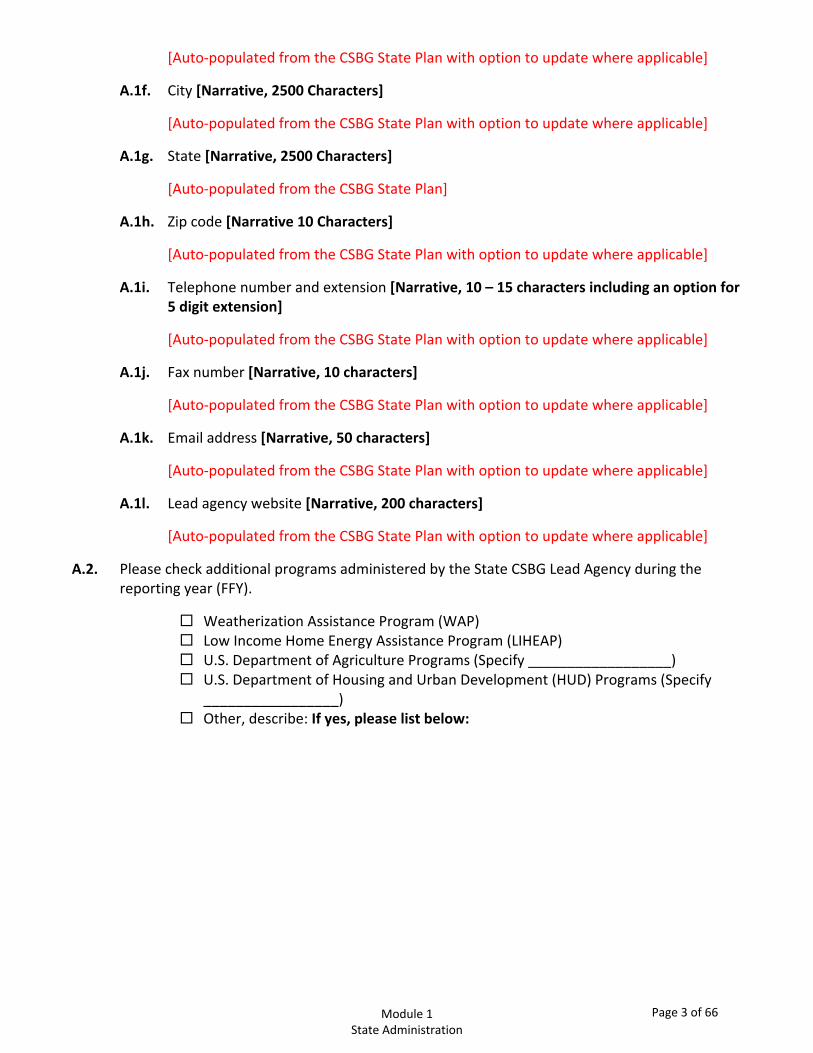
[Auto‐populated from the CSBG State Plan with option to update where applicable]
A.1f. City [Narrative, 2500 Characters]
[Auto‐populated from the CSBG State Plan with option to update where applicable]
A.1g. State [Narrative, 2500 Characters]
[Auto‐populated from the CSBG State Plan]
A.1h. Zip code [Narrative 10 Characters]
[Auto‐populated from the CSBG State Plan with option to update where applicable]
A.1i. Telephone number and extension [Narrative, 10 – 15 characters including an option for 5 digit extension]
[Auto‐populated from the CSBG State Plan with option to update where applicable]
A.1j. Fax number [Narrative, 10 characters]
[Auto‐populated from the CSBG State Plan with option to update where applicable]
A.1k. Email address [Narrative, 50 characters]
[Auto‐populated from the CSBG State Plan with option to update where applicable]
A.1l. Lead agency website [Narrative, 200 characters]
[Auto‐populated from the CSBG State Plan with option to update where applicable]
A.2. Please check additional programs administered by the State CSBG Lead Agency during the reporting year (FFY).
Weatherization Assistance Program (WAP) Low Income Home Energy Assistance Program (LIHEAP) U.S. Department of Agriculture Programs (Specify __________________) U.S. Department of Housing and Urban Development (HUD) Programs (Specify
_________________) Other, describe: If yes, please list below:
Module 1 State Administration
Page 3 of 66
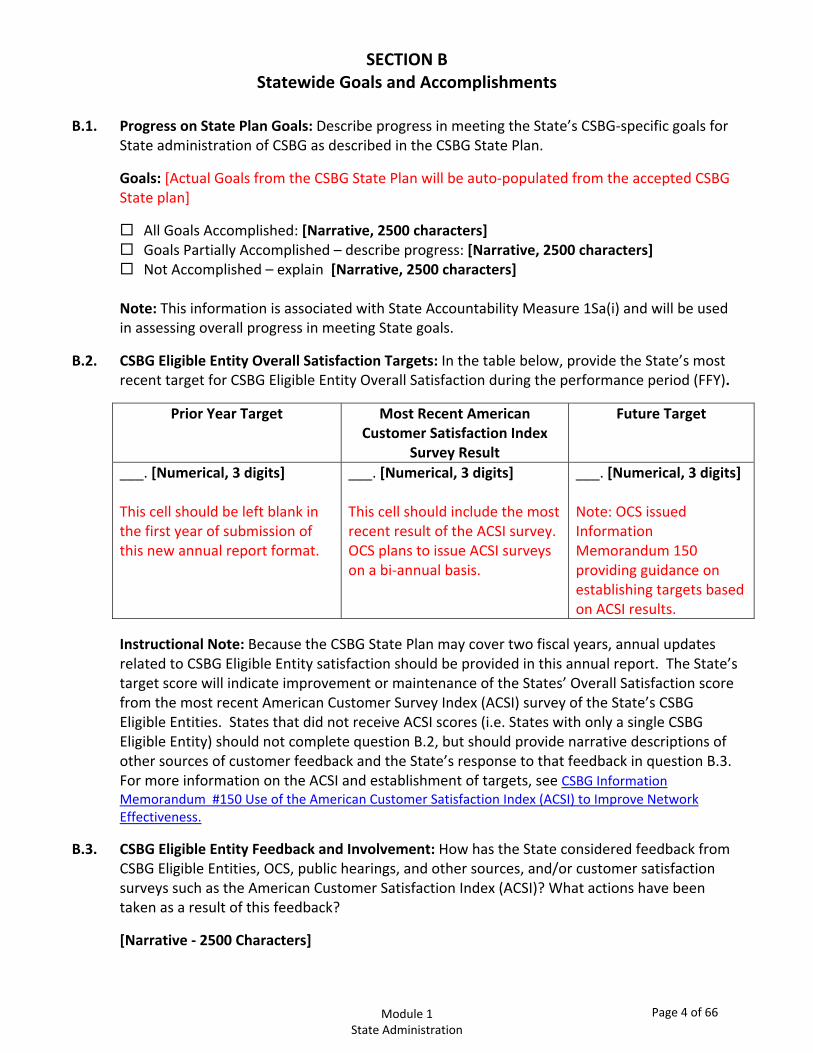
SECTION B Statewide Goals and Accomplishments
B.1. Progress on State Plan Goals: Describe progress in meeting the State’s CSBG‐specific goals for
State administration of CSBG as described in the CSBG State Plan.
Goals: [Actual Goals from the CSBG State Plan will be auto‐populated from the accepted CSBG State plan]
All Goals Accomplished: [Narrative, 2500 characters] Goals Partially Accomplished – describe progress: [Narrative, 2500 characters] Not Accomplished – explain [Narrative, 2500 characters]
Note: This information is associated with State Accountability Measure 1Sa(i) and will be used in assessing overall progress in meeting State goals.
B.2. CSBG Eligible Entity Overall Satisfaction Targets: In the table below, provide the State’s most recent target for CSBG Eligible Entity Overall Satisfaction during the performance period (FFY).
Prior Year Target Most Recent American Customer Satisfaction Index
Survey Result
Future Target
___. [Numerical, 3 digits] This cell should be left blank in the first year of submission of this new annual report format.
___. [Numerical, 3 digits] This cell should include the most recent result of the ACSI survey. OCS plans to issue ACSI surveys on a bi‐annual basis.
___. [Numerical, 3 digits] Note: OCS issued Information Memorandum 150 providing guidance on establishing targets based on ACSI results.
Instructional Note: Because the CSBG State Plan may cover two fiscal years, annual updates related to CSBG Eligible Entity satisfaction should be provided in this annual report. The State’s target score will indicate improvement or maintenance of the States’ Overall Satisfaction score from the most recent American Customer Survey Index (ACSI) survey of the State’s CSBG Eligible Entities. States that did not receive ACSI scores (i.e. States with only a single CSBG Eligible Entity) should not complete question B.2, but should provide narrative descriptions of other sources of customer feedback and the State’s response to that feedback in question B.3. For more information on the ACSI and establishment of targets, see CSBG Information Memorandum #150 Use of the American Customer Satisfaction Index (ACSI) to Improve Network Effectiveness.
B.3. CSBG Eligible Entity Feedback and Involvement: How has the State considered feedback from CSBG Eligible Entities, OCS, public hearings, and other sources, and/or customer satisfaction surveys such as the American Customer Satisfaction Index (ACSI)? What actions have been taken as a result of this feedback?
[Narrative ‐ 2500 Characters]
Module 1 State Administration
Page 4 of 66
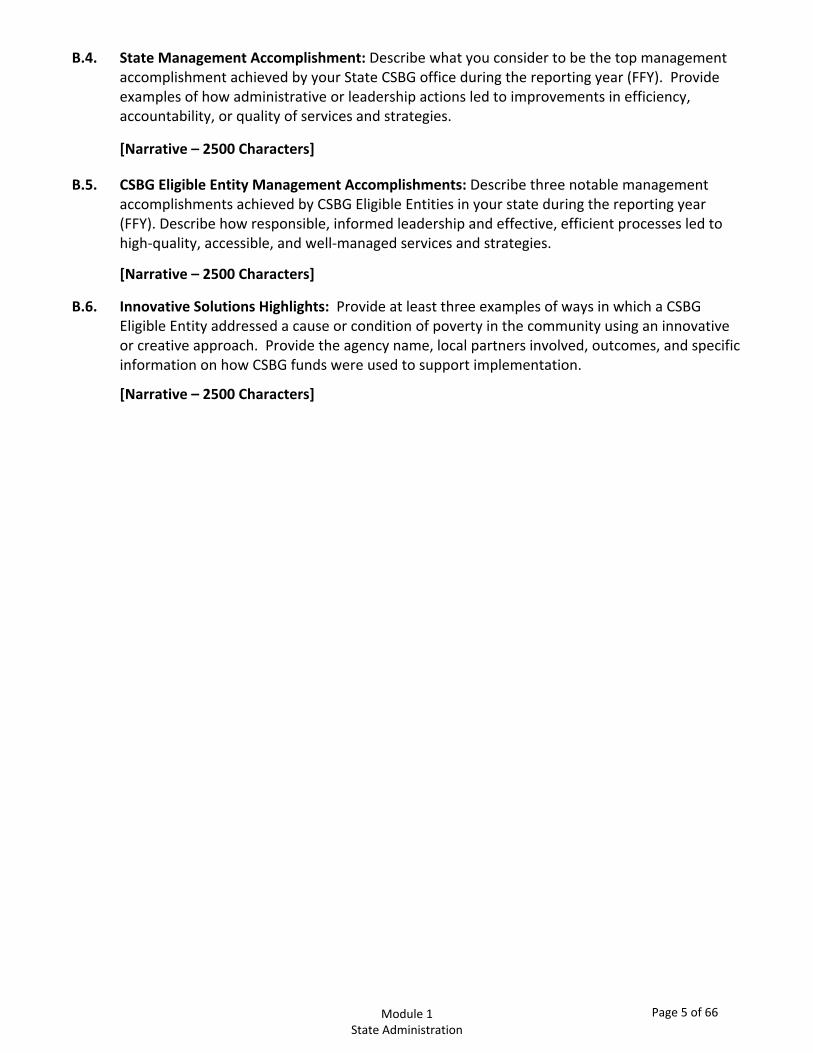
B.4. State Management Accomplishment: Describe what you consider to be the top management accomplishment achieved by your State CSBG office during the reporting year (FFY). Provide examples of how administrative or leadership actions led to improvements in efficiency, accountability, or quality of services and strategies.
[Narrative – 2500 Characters]
B.5. CSBG Eligible Entity Management Accomplishments: Describe three notable management accomplishments achieved by CSBG Eligible Entities in your state during the reporting year (FFY). Describe how responsible, informed leadership and effective, efficient processes led to high‐quality, accessible, and well‐managed services and strategies.
[Narrative – 2500 Characters]
B.6. Innovative Solutions Highlights: Provide at least three examples of ways in which a CSBG Eligible Entity addressed a cause or condition of poverty in the community using an innovative or creative approach. Provide the agency name, local partners involved, outcomes, and specific information on how CSBG funds were used to support implementation.
[Narrative – 2500 Characters]
Module 1 State Administration
Page 5 of 66
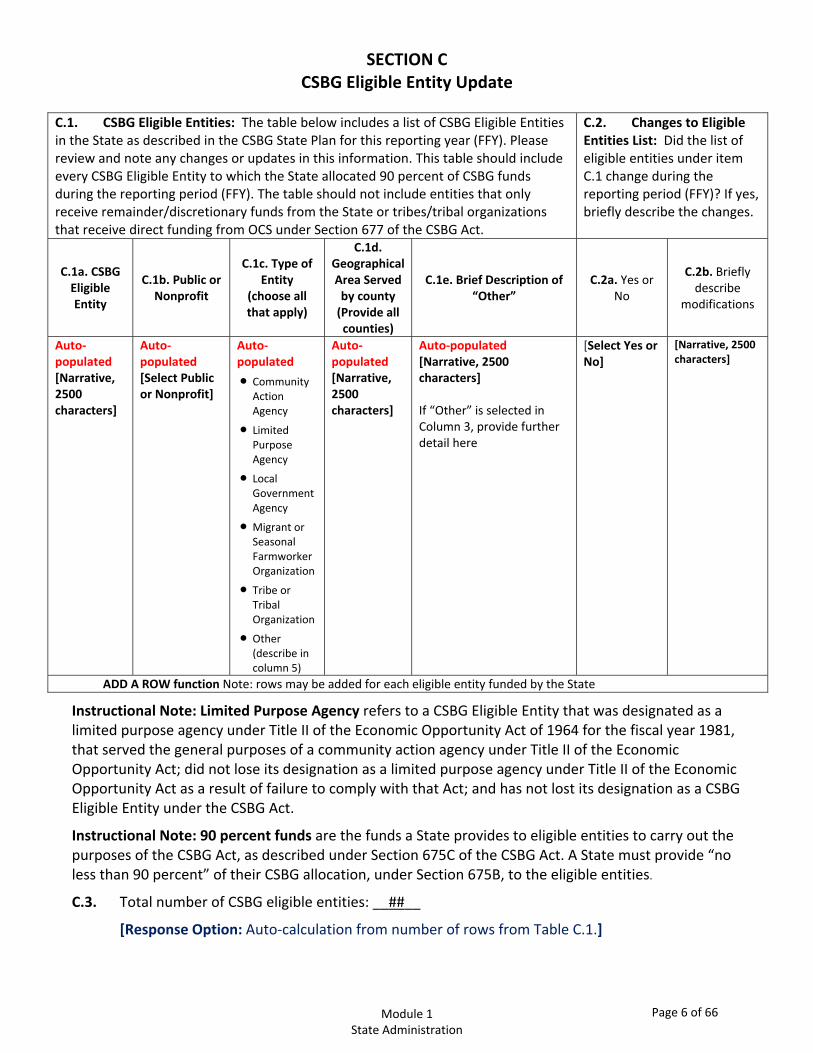
SECTION C CSBG Eligible Entity Update
C.1. CSBG Eligible Entities: The table below includes a list of CSBG Eligible Entities in the State as described in the CSBG State Plan for this reporting year (FFY). Please review and note any changes or updates in this information. This table should include every CSBG Eligible Entity to which the State allocated 90 percent of CSBG funds during the reporting period (FFY). The table should not include entities that only receive remainder/discretionary funds from the State or tribes/tribal organizations that receive direct funding from OCS under Section 677 of the CSBG Act.
C.2. Changes to Eligible Entities List: Did the list of eligible entities under item C.1 change during the reporting period (FFY)? If yes, briefly describe the changes.
C.1a. CSBG Eligible Entity
C.1b. Public or Nonprofit
C.1c. Type of Entity
(choose all that apply)
C.1d. Geographical Area Served by county (Provide all counties)
C.1e. Brief Description of “Other”
C.2a. Yes or No
C.2b. Briefly describe
modifications
Auto‐populated [Narrative, 2500 characters]
Auto‐populated [Select Public or Nonprofit]
Auto‐populated Community
Action Agency
Limited Purpose Agency
Local Government Agency
Migrant or Seasonal Farmworker Organization
Tribe or Tribal Organization
Other (describe in column 5)
Auto‐populated [Narrative, 2500 characters]
Auto‐populated [Narrative, 2500 characters] If “Other” is selected in Column 3, provide further detail here
[Select Yes or No]
[Narrative, 2500 characters]
ADD A ROW function Note: rows may be added for each eligible entity funded by the State
Instructional Note: Limited Purpose Agency refers to a CSBG Eligible Entity that was designated as a limited purpose agency under Title II of the Economic Opportunity Act of 1964 for the fiscal year 1981, that served the general purposes of a community action agency under Title II of the Economic Opportunity Act; did not lose its designation as a limited purpose agency under Title II of the Economic Opportunity Act as a result of failure to comply with that Act; and has not lost its designation as a CSBG Eligible Entity under the CSBG Act.
Instructional Note: 90 percent funds are the funds a State provides to eligible entities to carry out the purposes of the CSBG Act, as described under Section 675C of the CSBG Act. A State must provide “no less than 90 percent” of their CSBG allocation, under Section 675B, to the eligible entities.
C.3. Total number of CSBG eligible entities: __##__
[Response Option: Auto‐calculation from number of rows from Table C.1.]
Module 1 State Administration
Page 6 of 66
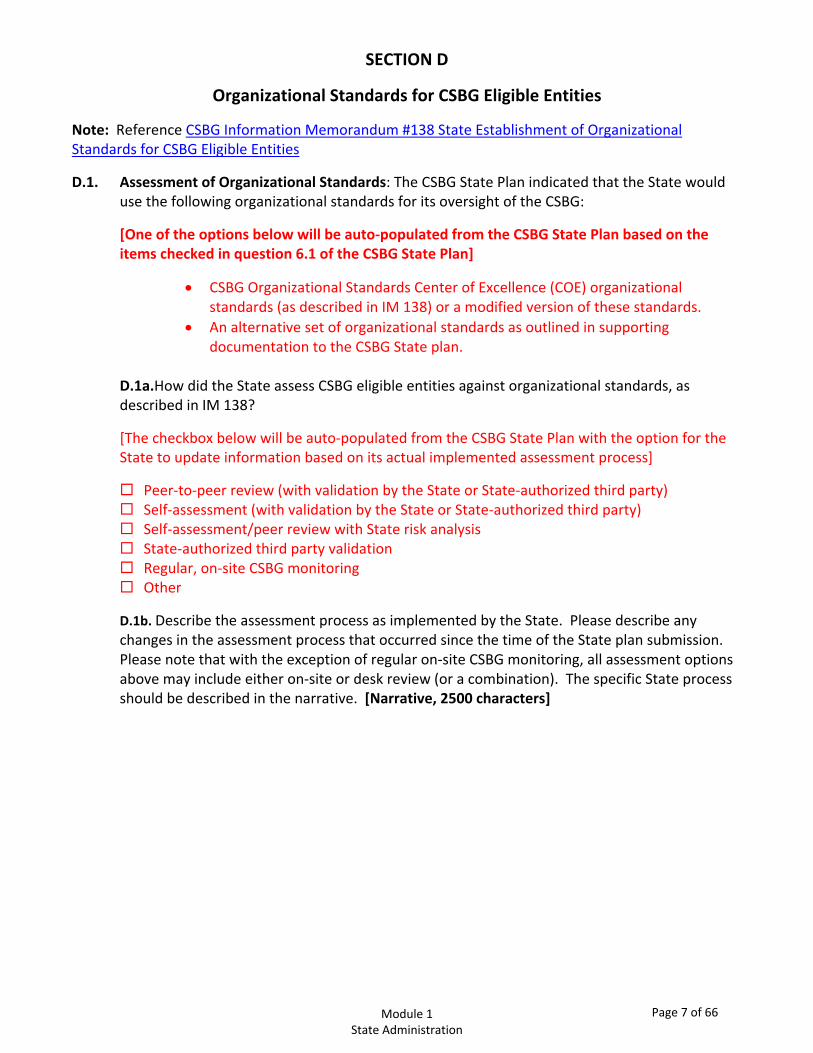
SECTION D
Organizational Standards for CSBG Eligible Entities
Note: Reference CSBG Information Memorandum #138 State Establishment of Organizational Standards for CSBG Eligible Entities
D.1. Assessment of Organizational Standards: The CSBG State Plan indicated that the State would use the following organizational standards for its oversight of the CSBG:
[One of the options below will be auto‐populated from the CSBG State Plan based on the items checked in question 6.1 of the CSBG State Plan]
CSBG Organizational Standards Center of Excellence (COE) organizational standards (as described in IM 138) or a modified version of these standards.
An alternative set of organizational standards as outlined in supporting documentation to the CSBG State plan.
D.1a.How did the State assess CSBG eligible entities against organizational standards, as described in IM 138?
[The checkbox below will be auto‐populated from the CSBG State Plan with the option for the State to update information based on its actual implemented assessment process]
Peer‐to‐peer review (with validation by the State or State‐authorized third party) Self‐assessment (with validation by the State or State‐authorized third party) Self‐assessment/peer review with State risk analysis State‐authorized third party validation Regular, on‐site CSBG monitoring Other
D.1b. Describe the assessment process as implemented by the State. Please describe any changes in the assessment process that occurred since the time of the State plan submission. Please note that with the exception of regular on‐site CSBG monitoring, all assessment options above may include either on‐site or desk review (or a combination). The specific State process should be described in the narrative. [Narrative, 2500 characters]
Module 1 State Administration
Page 7 of 66

D.2. Organizational Standards Performance: In the table below, please provide the percentage of CSBG Eligible Entities that met all State‐adopted organizational standards in the reporting period (FFY). The target set in the CSBG State Plan is provided in the left‐hand column. For more information on the CSBG Organizational Standards, see CSBG Information Memorandum #138.
Target vs. Actual Performance on the Organizational Standards
Fiscal Year State CSBG Plan Target
Number of Entities Assessed
Number that Met All (100%) of
State Standards
Actual Percentage Meeting All (100%) of
State Standards
Auto‐populated [Auto‐populated target from question 6.6. of the State CSBG plan].
[Insert a number between 0 – 99]
[Insert a number between 0 – 99]
[Auto‐calculated]
Progress Indicators Indicate the number of entities that met the following percentages of Organizational Standards.
Note – While the State targets the percent of CSBG Eligible Entities to meet 100% of the Organizational
Standards, targets are not set in the State Plan for 90%, 80%, 70%, and 60%
progress indicators.
Number of Entities Assessed
Number that Met between 90% and
99% of State Standards
Actual Percentage
[Insert a number between 0 – 99]
[Insert a number between 0 – 99]
[Auto‐calculated]
Number of Entities Assessed
Number that met between 80% and
89% of State Standards
Actual Percentage
[Insert a number between 0 – 99]
[Insert a number between 0 – 99]
[Auto‐calculated]
Number of Entities Assessed
Number that met between 70% and
79% of State Standards
Actual Percentage
[Insert a number between 0 – 99]
[Insert a number between 0 – 99]
[Auto‐calculated]
Note: This information is associated with State Accountability Measures 6Sa.
D.2a. In the space below, please identify the challenges and factors contributing to the difference between the target and actual results provided in the top row of Table D.2 (above).
[Narrative, 2500 characters]
Module 1 State Administration
Page 8 of 66
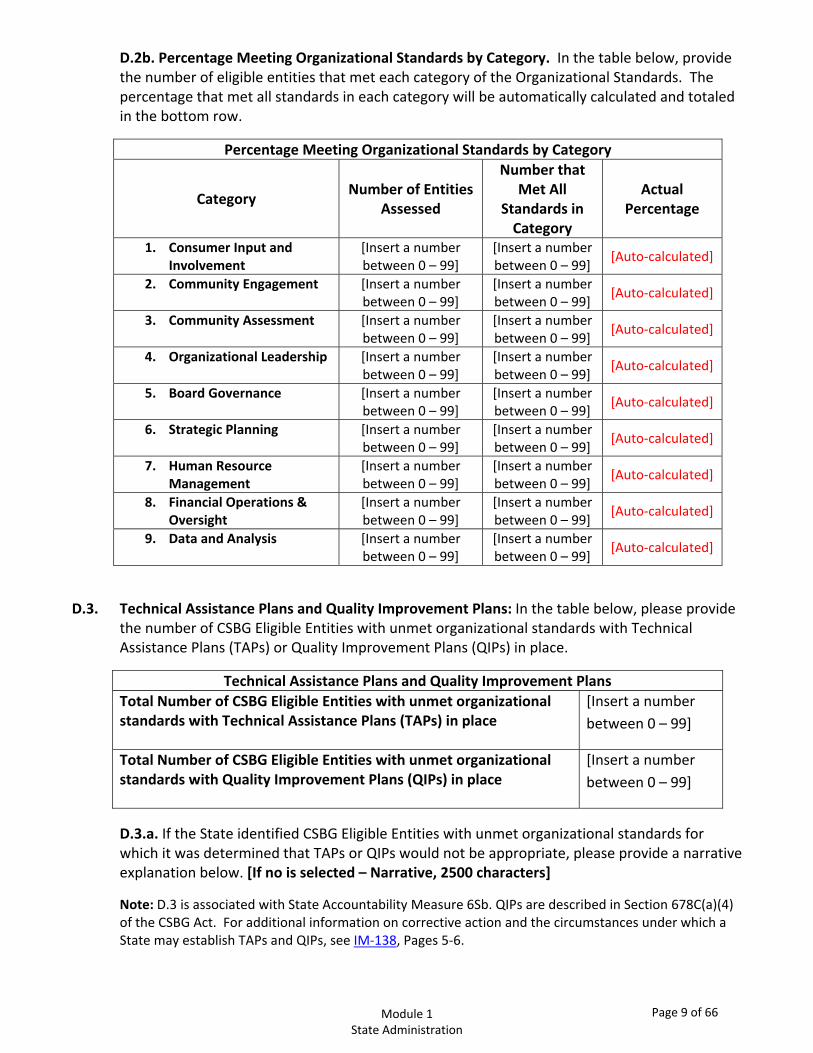
D.2b. Percentage Meeting Organizational Standards by Category. In the table below, provide the number of eligible entities that met each category of the Organizational Standards. The percentage that met all standards in each category will be automatically calculated and totaled in the bottom row.
Percentage Meeting Organizational Standards by Category
Category Number of Entities
Assessed
Number that Met All
Standards in Category
Actual Percentage
1. Consumer Input and Involvement
[Insert a number between 0 – 99]
[Insert a number between 0 – 99] [Auto‐calculated]
2. Community Engagement [Insert a number between 0 – 99]
[Insert a number between 0 – 99] [Auto‐calculated]
3. Community Assessment [Insert a number between 0 – 99]
[Insert a number between 0 – 99] [Auto‐calculated]
4. Organizational Leadership [Insert a number between 0 – 99]
[Insert a number between 0 – 99] [Auto‐calculated]
5. Board Governance [Insert a number between 0 – 99]
[Insert a number between 0 – 99] [Auto‐calculated]
6. Strategic Planning [Insert a number between 0 – 99]
[Insert a number between 0 – 99] [Auto‐calculated]
7. Human Resource Management
[Insert a number between 0 – 99]
[Insert a number between 0 – 99] [Auto‐calculated]
8. Financial Operations & Oversight
[Insert a number between 0 – 99]
[Insert a number between 0 – 99] [Auto‐calculated]
9. Data and Analysis [Insert a number between 0 – 99]
[Insert a number between 0 – 99] [Auto‐calculated]
D.3. Technical Assistance Plans and Quality Improvement Plans: In the table below, please provide the number of CSBG Eligible Entities with unmet organizational standards with Technical Assistance Plans (TAPs) or Quality Improvement Plans (QIPs) in place.
Technical Assistance Plans and Quality Improvement Plans Total Number of CSBG Eligible Entities with unmet organizational standards with Technical Assistance Plans (TAPs) in place
[Insert a number between 0 – 99]
Total Number of CSBG Eligible Entities with unmet organizational standards with Quality Improvement Plans (QIPs) in place
[Insert a number between 0 – 99]
D.3.a. If the State identified CSBG Eligible Entities with unmet organizational standards for which it was determined that TAPs or QIPs would not be appropriate, please provide a narrative explanation below. [If no is selected – Narrative, 2500 characters]
Note: D.3 is associated with State Accountability Measure 6Sb. QIPs are described in Section 678C(a)(4) of the CSBG Act. For additional information on corrective action and the circumstances under which a State may establish TAPs and QIPs, see IM‐138, Pages 5‐6.
Module 1 State Administration
Page 9 of 66
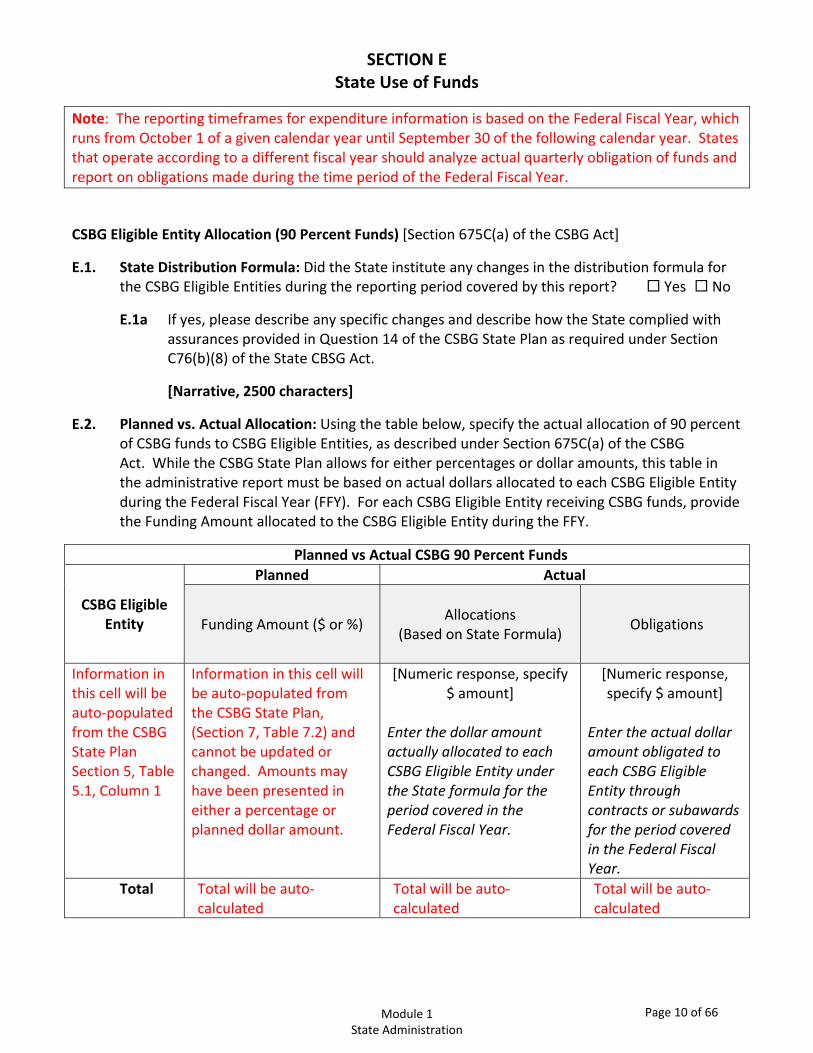
SECTION E State Use of Funds
Note: The reporting timeframes for expenditure information is based on the Federal Fiscal Year, which runs from October 1 of a given calendar year until September 30 of the following calendar year. States that operate according to a different fiscal year should analyze actual quarterly obligation of funds and report on obligations made during the time period of the Federal Fiscal Year.
CSBG Eligible Entity Allocation (90 Percent Funds) [Section 675C(a) of the CSBG Act]
E.1. State Distribution Formula: Did the State institute any changes in the distribution formula for the CSBG Eligible Entities during the reporting period covered by this report? Yes No
E.1a If yes, please describe any specific changes and describe how the State complied with assurances provided in Question 14 of the CSBG State Plan as required under Section C76(b)(8) of the State CBSG Act.
[Narrative, 2500 characters]
E.2. Planned vs. Actual Allocation: Using the table below, specify the actual allocation of 90 percent of CSBG funds to CSBG Eligible Entities, as described under Section 675C(a) of the CSBG Act. While the CSBG State Plan allows for either percentages or dollar amounts, this table in the administrative report must be based on actual dollars allocated to each CSBG Eligible Entity during the Federal Fiscal Year (FFY). For each CSBG Eligible Entity receiving CSBG funds, provide the Funding Amount allocated to the CSBG Eligible Entity during the FFY.
Planned vs Actual CSBG 90 Percent Funds
CSBG Eligible Entity
Planned Actual
Funding Amount ($ or %)
Allocations
(Based on State Formula)
Obligations
Information in this cell will be auto‐populated from the CSBG State Plan Section 5, Table 5.1, Column 1
Information in this cell will be auto‐populated from the CSBG State Plan, (Section 7, Table 7.2) and cannot be updated or changed. Amounts may have been presented in either a percentage or planned dollar amount.
[Numeric response, specify $ amount]
Enter the dollar amount actually allocated to each CSBG Eligible Entity under the State formula for the period covered in the Federal Fiscal Year.
[Numeric response, specify $ amount]
Enter the actual dollar amount obligated to each CSBG Eligible Entity through contracts or subawards for the period covered in the Federal Fiscal Year.
Total Total will be auto‐calculated
Total will be auto‐calculated
Total will be auto‐calculated
Module 1 State Administration
Page 10 of 66
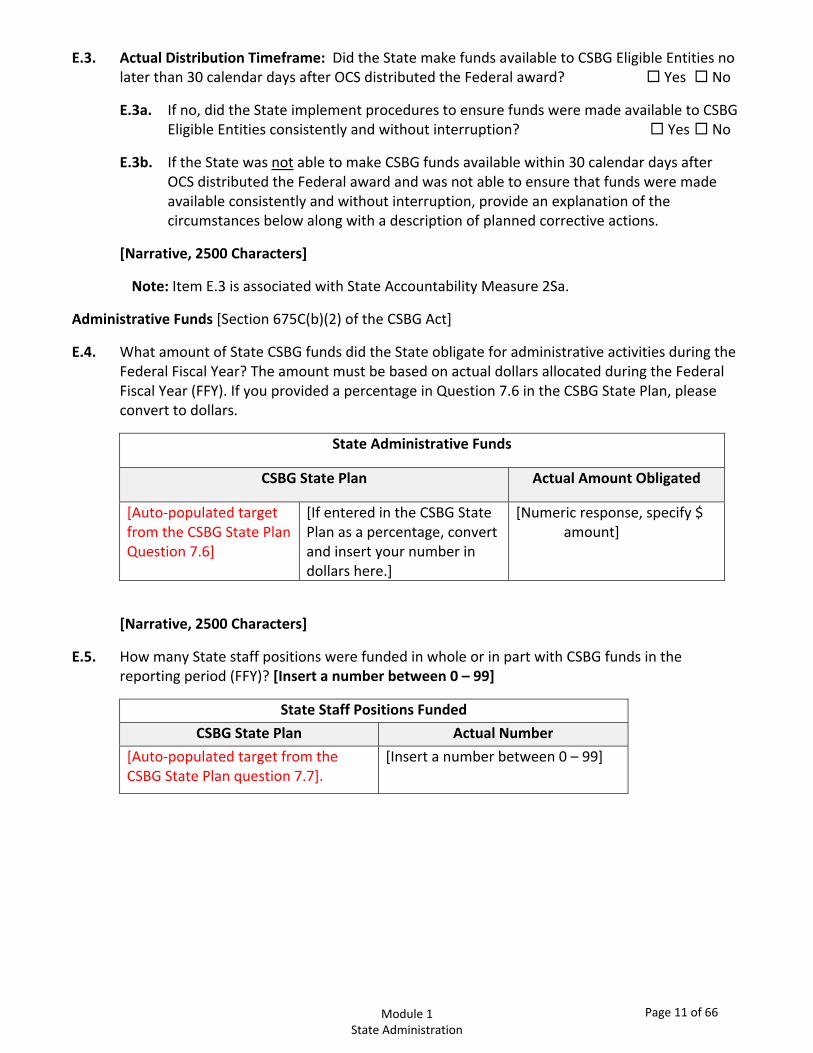
E.3. Actual Distribution Timeframe: Did the State make funds available to CSBG Eligible Entities no later than 30 calendar days after OCS distributed the Federal award? Yes No
E.3a. If no, did the State implement procedures to ensure funds were made available to CSBG Eligible Entities consistently and without interruption? Yes No
E.3b. If the State was not able to make CSBG funds available within 30 calendar days after OCS distributed the Federal award and was not able to ensure that funds were made available consistently and without interruption, provide an explanation of the circumstances below along with a description of planned corrective actions.
[Narrative, 2500 Characters]
Note: Item E.3 is associated with State Accountability Measure 2Sa.
Administrative Funds [Section 675C(b)(2) of the CSBG Act]
E.4. What amount of State CSBG funds did the State obligate for administrative activities during the Federal Fiscal Year? The amount must be based on actual dollars allocated during the Federal Fiscal Year (FFY). If you provided a percentage in Question 7.6 in the CSBG State Plan, please convert to dollars.
State Administrative Funds
CSBG State Plan Actual Amount Obligated
[Auto‐populated target from the CSBG State Plan Question 7.6]
[If entered in the CSBG State Plan as a percentage, convert and insert your number in dollars here.]
[Numeric response, specify $ amount]
[Narrative, 2500 Characters]
E.5. How many State staff positions were funded in whole or in part with CSBG funds in the reporting period (FFY)? [Insert a number between 0 – 99]
State Staff Positions Funded
CSBG State Plan Actual Number
[Auto‐populated target from the CSBG State Plan question 7.7].
[Insert a number between 0 – 99]
Module 1 State Administration
Page 11 of 66
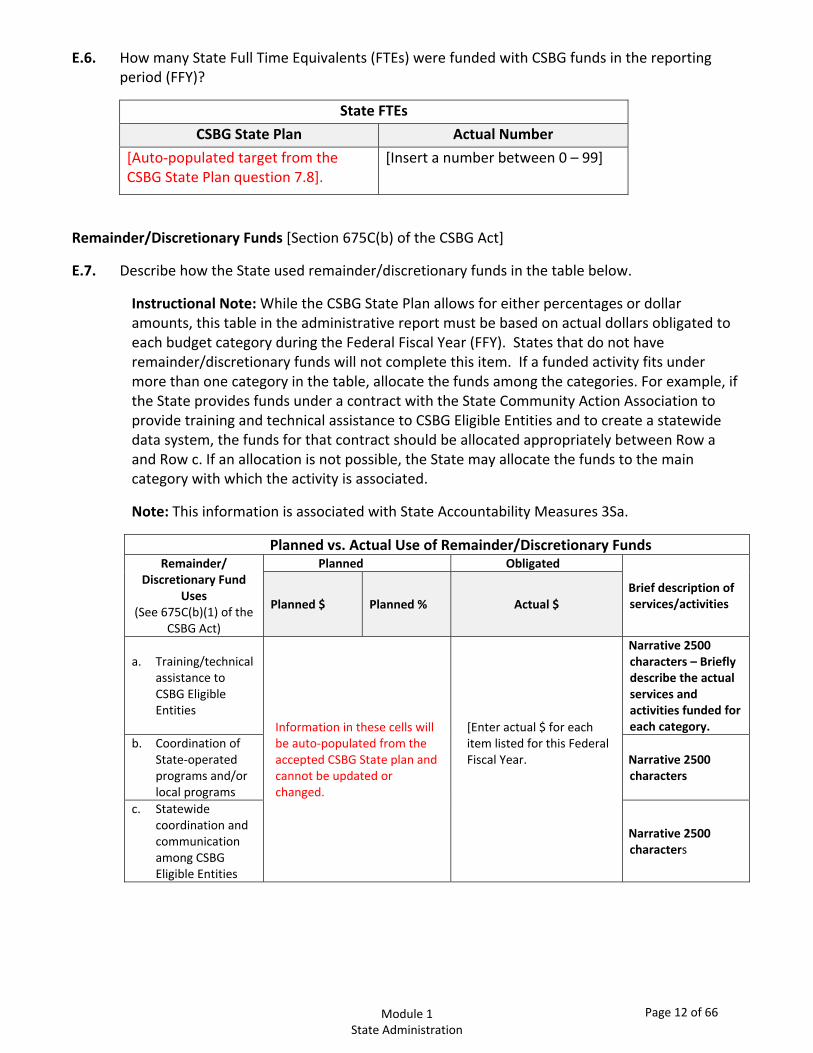
E.6. How many State Full Time Equivalents (FTEs) were funded with CSBG funds in the reporting period (FFY)?
State FTEs
CSBG State Plan Actual Number
[Auto‐populated target from the CSBG State Plan question 7.8].
[Insert a number between 0 – 99]
Remainder/Discretionary Funds [Section 675C(b) of the CSBG Act]
E.7. Describe how the State used remainder/discretionary funds in the table below.
Instructional Note: While the CSBG State Plan allows for either percentages or dollar amounts, this table in the administrative report must be based on actual dollars obligated to each budget category during the Federal Fiscal Year (FFY). States that do not have remainder/discretionary funds will not complete this item. If a funded activity fits under more than one category in the table, allocate the funds among the categories. For example, if the State provides funds under a contract with the State Community Action Association to provide training and technical assistance to CSBG Eligible Entities and to create a statewide data system, the funds for that contract should be allocated appropriately between Row a and Row c. If an allocation is not possible, the State may allocate the funds to the main category with which the activity is associated.
Note: This information is associated with State Accountability Measures 3Sa.
Planned vs. Actual Use of Remainder/Discretionary Funds Remainder/
Discretionary Fund Uses
(See 675C(b)(1) of the CSBG Act)
Planned Obligated
Brief description of services/activities Planned $ Planned % Actual $
a. Training/technical assistance to CSBG Eligible Entities
Information in these cells will be auto‐populated from the accepted CSBG State plan and cannot be updated or changed.
[Enter actual $ for each item listed for this Federal Fiscal Year.
Narrative 2500 characters – Briefly describe the actual services and activities funded for each category.
b. Coordination of State‐operated programs and/or local programs
Narrative 2500 characters
c. Statewide coordination and communication among CSBG Eligible Entities
Narrative 2500 characters
Module 1 State Administration
Page 12 of 66
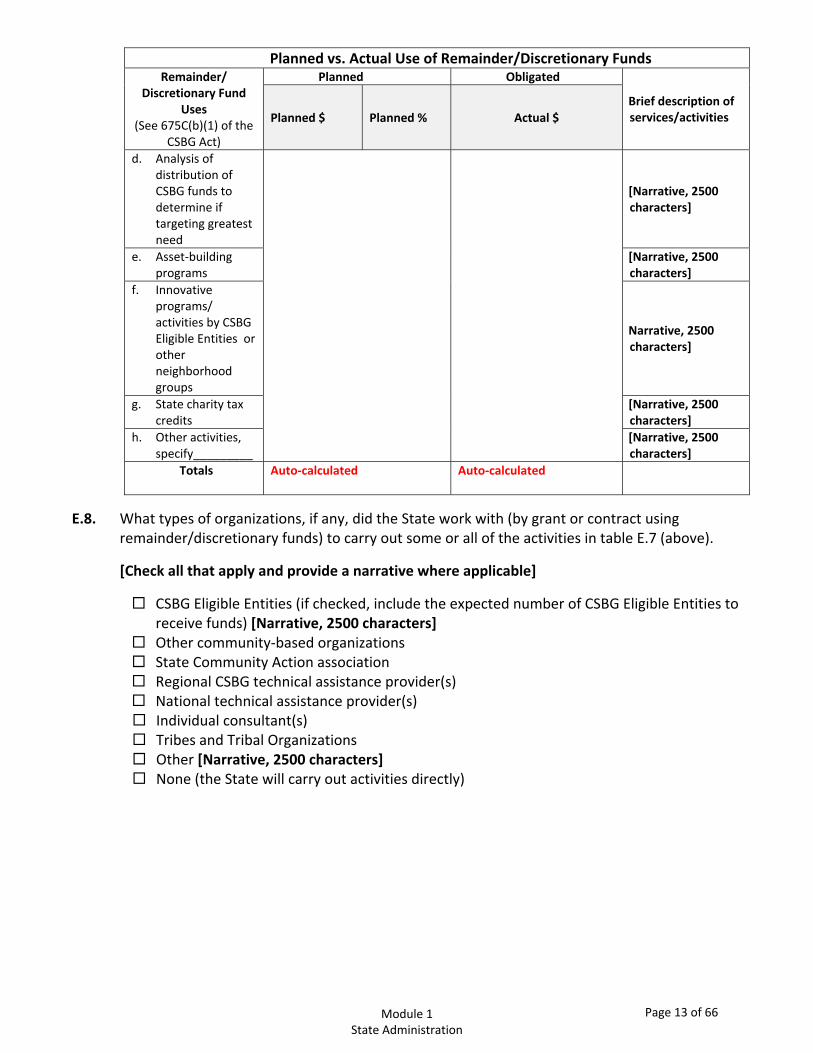
Planned vs. Actual Use of Remainder/Discretionary Funds Remainder/
Discretionary Fund Uses
(See 675C(b)(1) of the CSBG Act)
Planned Obligated
Brief description of services/activities Planned $ Planned % Actual $
d. Analysis of distribution of CSBG funds to determine if targeting greatest need
[Narrative, 2500 characters]
e. Asset‐building programs
[Narrative, 2500 characters]
f. Innovative programs/ activities by CSBG Eligible Entities or other neighborhood groups
Narrative, 2500 characters]
g. State charity tax credits
[Narrative, 2500 characters]
h. Other activities, specify_________
[Narrative, 2500 characters]
Totals Auto‐calculated
Auto‐calculated
E.8. What types of organizations, if any, did the State work with (by grant or contract using remainder/discretionary funds) to carry out some or all of the activities in table E.7 (above).
[Check all that apply and provide a narrative where applicable]
CSBG Eligible Entities (if checked, include the expected number of CSBG Eligible Entities to receive funds) [Narrative, 2500 characters]
Other community‐based organizations State Community Action association Regional CSBG technical assistance provider(s) National technical assistance provider(s) Individual consultant(s) Tribes and Tribal Organizations Other [Narrative, 2500 characters] None (the State will carry out activities directly)
Module 1 State Administration
Page 13 of 66

E.9. Total Obligations: Total CSBG funds obligated for the Federal Fiscal Year (Review and confirm from the chart below). Category Actual Obligations
Obligations to CSBG Eligible Entities (from State CSBG 90% Formula Funds)
Auto‐populated from Table E.2 (total actual obligations in contracts and subawards)
State Administrative Costs Auto‐populated from Table E.4 (total actual obligations of administrative funds)
Remainder/Discretionary Funds Auto‐populated from Table E.7 (total actual obligations of State remainder/discretionary funds).
Total Obligations in FY ___ Total will be auto‐calculated from the three rows above
E.9a. Prior Year Carryover Of the total amount reported in the row above, the amount that represents carryover funding from the prior fiscal year.
[Numeric response, specify $ amount]
E.9b. Carryover for this Fiscal Year Of the total CSBG amount to the State for this fiscal year, the amount that was unobligated and will carry forward to the next fiscal year.
[Numeric response, specify $ amount]
Module 1 State Administration
Page 14 of 66
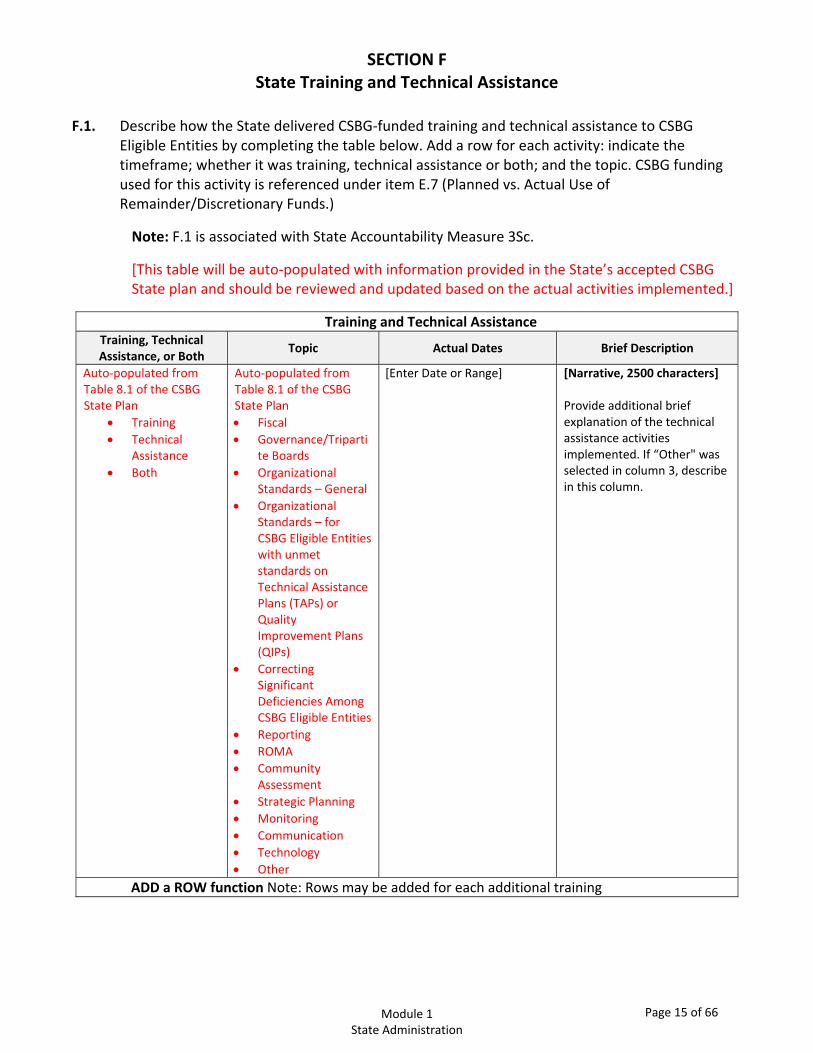
SECTION F State Training and Technical Assistance
F.1. Describe how the State delivered CSBG‐funded training and technical assistance to CSBG
Eligible Entities by completing the table below. Add a row for each activity: indicate the timeframe; whether it was training, technical assistance or both; and the topic. CSBG funding used for this activity is referenced under item E.7 (Planned vs. Actual Use of Remainder/Discretionary Funds.)
Note: F.1 is associated with State Accountability Measure 3Sc.
[This table will be auto‐populated with information provided in the State’s accepted CSBG State plan and should be reviewed and updated based on the actual activities implemented.]
Training and Technical AssistanceTraining, Technical Assistance, or Both
Topic Actual Dates Brief Description
Auto‐populated from Table 8.1 of the CSBG State Plan
Training Technical
Assistance Both
Auto‐populated from Table 8.1 of the CSBG State Plan Fiscal Governance/Triparti
te Boards Organizational
Standards – General Organizational
Standards – for CSBG Eligible Entities with unmet standards on Technical Assistance Plans (TAPs) or Quality Improvement Plans (QIPs)
Correcting Significant Deficiencies Among CSBG Eligible Entities
Reporting ROMA Community
Assessment Strategic Planning Monitoring Communication Technology Other
[Enter Date or Range] [Narrative, 2500 characters]
Provide additional brief explanation of the technical assistance activities implemented. If “Other" was selected in column 3, describe in this column.
ADD a ROW function Note: Rows may be added for each additional training
Module 1 State Administration
Page 15 of 66
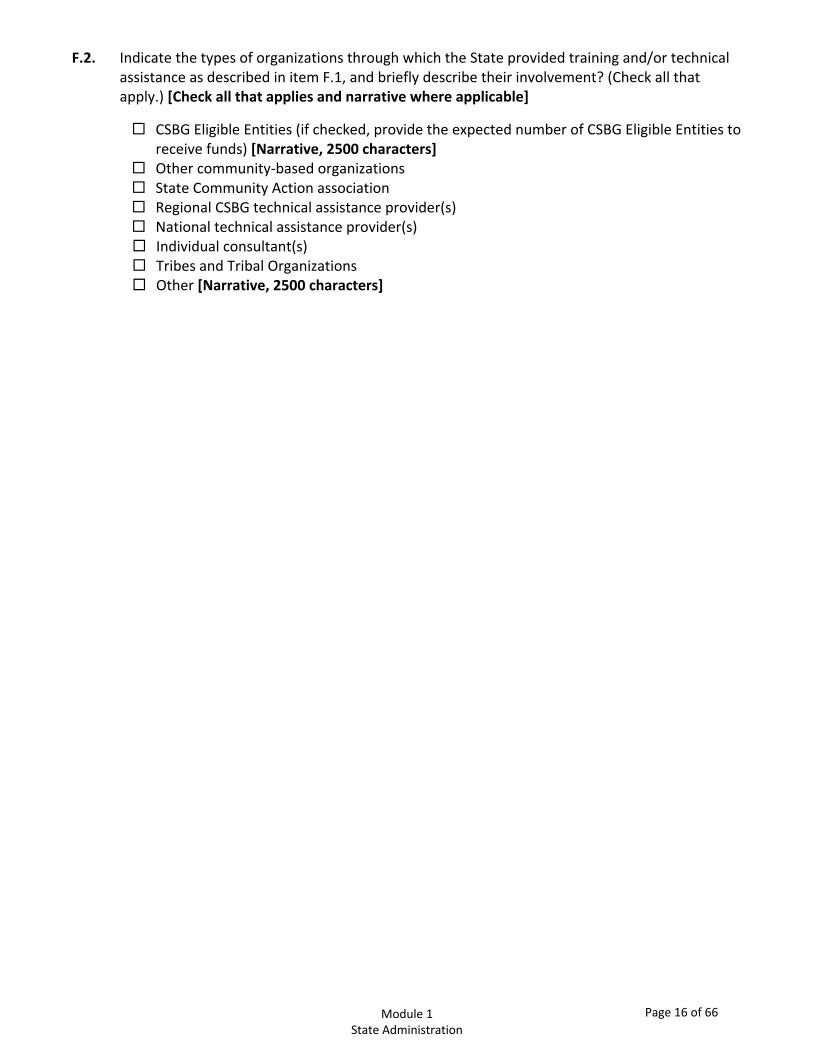
F.2. Indicate the types of organizations through which the State provided training and/or technical assistance as described in item F.1, and briefly describe their involvement? (Check all that apply.) [Check all that applies and narrative where applicable]
CSBG Eligible Entities (if checked, provide the expected number of CSBG Eligible Entities to receive funds) [Narrative, 2500 characters]
Other community‐based organizations State Community Action association Regional CSBG technical assistance provider(s) National technical assistance provider(s) Individual consultant(s) Tribes and Tribal Organizations Other [Narrative, 2500 characters]
Module 1 State Administration
Page 16 of 66
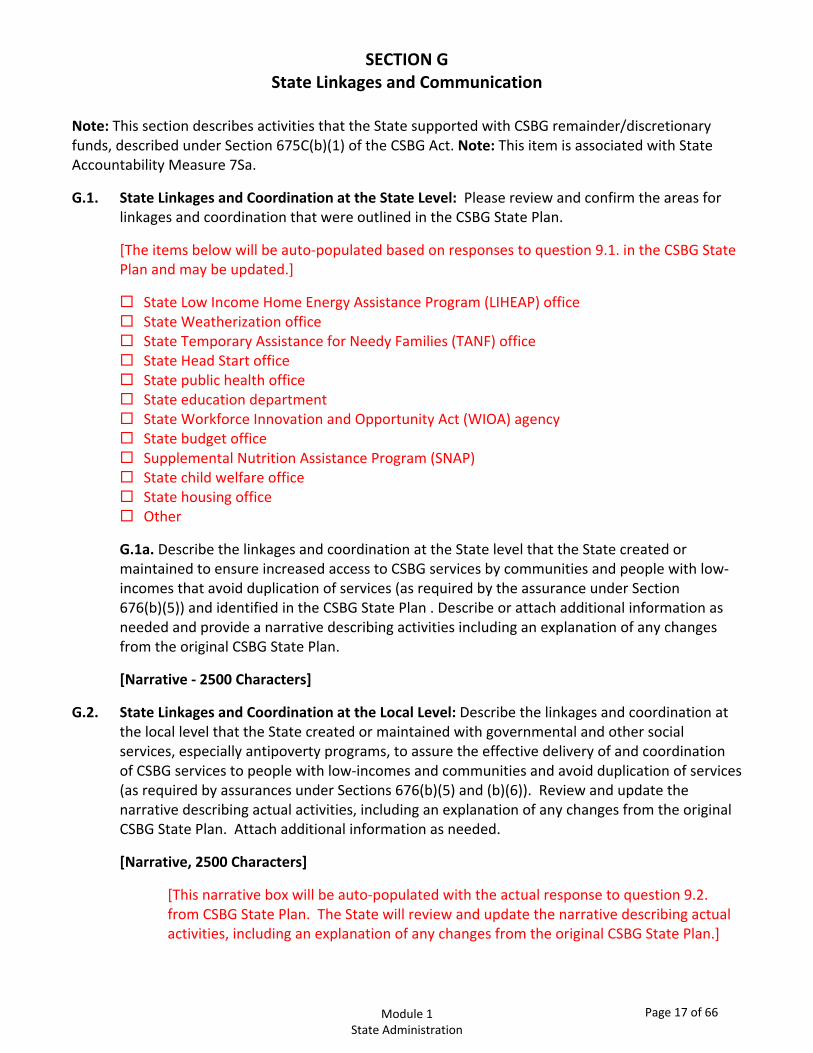
SECTION G State Linkages and Communication
Note: This section describes activities that the State supported with CSBG remainder/discretionary funds, described under Section 675C(b)(1) of the CSBG Act. Note: This item is associated with State Accountability Measure 7Sa.
G.1. State Linkages and Coordination at the State Level: Please review and confirm the areas for linkages and coordination that were outlined in the CSBG State Plan.
[The items below will be auto‐populated based on responses to question 9.1. in the CSBG State Plan and may be updated.]
State Low Income Home Energy Assistance Program (LIHEAP) office State Weatherization office State Temporary Assistance for Needy Families (TANF) office State Head Start office State public health office State education department State Workforce Innovation and Opportunity Act (WIOA) agency State budget office Supplemental Nutrition Assistance Program (SNAP) State child welfare office State housing office Other
G.1a. Describe the linkages and coordination at the State level that the State created or maintained to ensure increased access to CSBG services by communities and people with low‐incomes that avoid duplication of services (as required by the assurance under Section 676(b)(5)) and identified in the CSBG State Plan . Describe or attach additional information as needed and provide a narrative describing activities including an explanation of any changes from the original CSBG State Plan.
[Narrative ‐ 2500 Characters]
G.2. State Linkages and Coordination at the Local Level: Describe the linkages and coordination at the local level that the State created or maintained with governmental and other social services, especially antipoverty programs, to assure the effective delivery of and coordination of CSBG services to people with low‐incomes and communities and avoid duplication of services (as required by assurances under Sections 676(b)(5) and (b)(6)). Review and update the narrative describing actual activities, including an explanation of any changes from the original CSBG State Plan. Attach additional information as needed.
[Narrative, 2500 Characters]
[This narrative box will be auto‐populated with the actual response to question 9.2. from CSBG State Plan. The State will review and update the narrative describing actual activities, including an explanation of any changes from the original CSBG State Plan.]
Module 1 State Administration
Page 17 of 66

G.3. CSBG Eligible Entity Linkages and Coordination
G.3a State Assurance of CSBG Eligible Entity Linkages and Coordination: Describe how the State assured that the CSBG Eligible Entities coordinated and established linkages to assure the effective delivery of and coordination of CSBG services to people with low‐incomes and communities and avoid duplication of services (as required by the assurance under Section 676(b)(5)). Attach additional information as needed.
[Narrative, 2500 Characters]
[This narrative box will be auto‐populated with the actual response to question 9.3. from CSBG State Plan. The State will review and update the narrative describing actual activities, including an explanation of any changes from the CSBG State plan.]
G.3b State Assurance of CSBG Eligible Entity Linkages to Fill Service Gaps: Describe how the CSBG Eligible Entities developed linkages to fill identified gaps in the services, through the provision of information, referrals, case management, and follow‐up consultations, according to the assurance under Section 676(b)(3)(B) of the CSBG Act.
[Narrative, 2500 Characters]
[This narrative box will be auto‐populated with the actual response to question 9.3b. from CSBG State Plan. The State will review and update the narrative describing actual activities, including an explanation of any changes from the original CSBG State Plan.]
G.4. Workforce Innovation and Opportunity Act (WIOA) Employment and Training Combined Plan Activities (if applicable): If the State included CSBG employment and training activities as part of a WIOA Combined State Plan, as allowed under the Workforce Innovation and Opportunity Act, provide a brief narrative describing the status of WIOA coordination activities, including web links, if available, to any publicly accessible combined plans and reports.
[Narrative, 2500 Characters]
[Note: This narrative box will only be completed by States in which CSBG employment and training activities are included as part of a WIOA Combined State Plan. Because the WIOA Combined State Plan is in a separate system not administered by ACF, information cannot be auto‐populated. The purpose of this section will be to provide an administrative update on State‐level WIOA plan coordination for States with combined plans, rather than a report on employment and training outcomes at the CSBG Eligible Entity level. ]
G.5. Coordination among CSBG Eligible Entities and the State Community Action Association: Describe State activities that took place to support coordination among the CSBG Eligible Entities and the State Community Action Association.
[Narrative, 2500 Characters]
[This narrative box will be auto‐populated with the actual response to question 9.8. from CSBG State Plan. The State will review and update the narrative describing actual activities, including an explanation of any changes from the original CSBG State Plan.]
Module 1 State Administration
Page 18 of 66

G.6. Feedback to CSBG Eligible Entities and State Community Action Association: Describe how the State provided feedback to local entities and the State Community Action Association regarding its performance on State Accountability Measures.
[Narrative, 2500 Characters]
[This narrative box will be auto‐populated with the actual response to question 9.10 from CSBG State Plan. The State will review and update the narrative describing actual activities, including an explanation of any changes from the original CSBG State Plan.]
Note: This information is associated with State Accountability Measure 5S(iii). The measure indicates feedback should be provided within 60 calendar days of the State receiving feedback from OCS.
Module 1 State Administration
Page 19 of 66
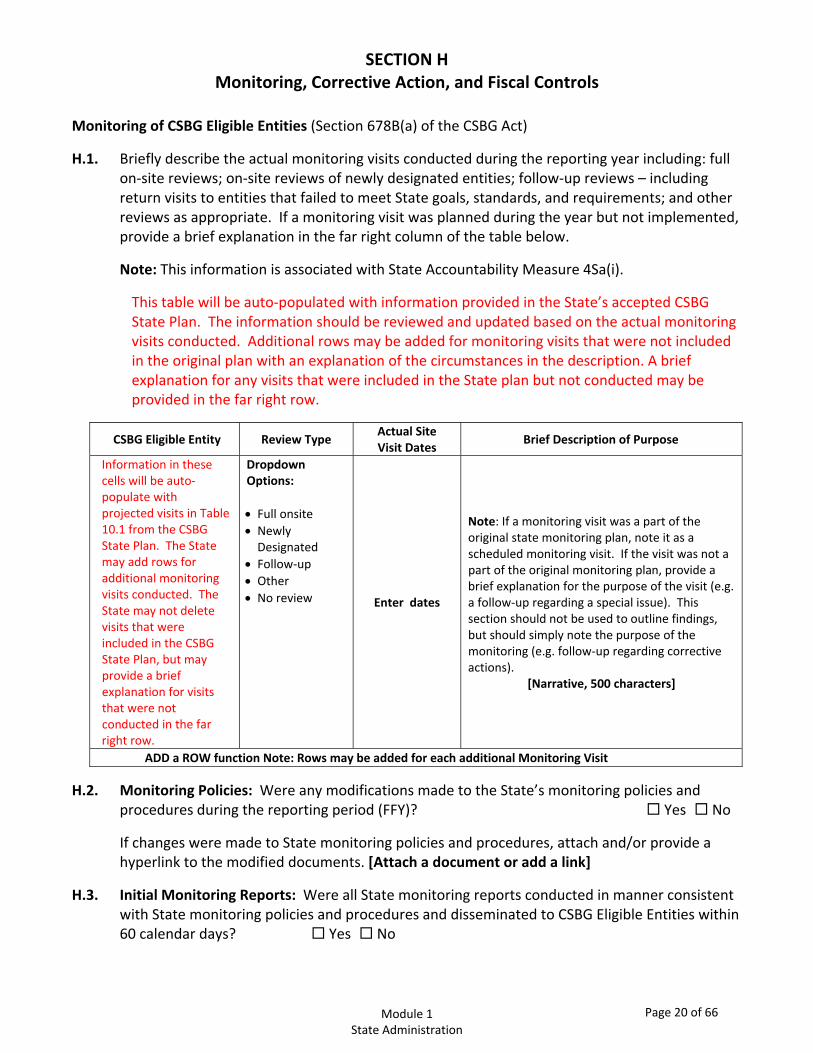
SECTION H Monitoring, Corrective Action, and Fiscal Controls
Monitoring of CSBG Eligible Entities (Section 678B(a) of the CSBG Act)
H.1. Briefly describe the actual monitoring visits conducted during the reporting year including: full on‐site reviews; on‐site reviews of newly designated entities; follow‐up reviews – including return visits to entities that failed to meet State goals, standards, and requirements; and other reviews as appropriate. If a monitoring visit was planned during the year but not implemented, provide a brief explanation in the far right column of the table below.
Note: This information is associated with State Accountability Measure 4Sa(i).
This table will be auto‐populated with information provided in the State’s accepted CSBG State Plan. The information should be reviewed and updated based on the actual monitoring visits conducted. Additional rows may be added for monitoring visits that were not included in the original plan with an explanation of the circumstances in the description. A brief explanation for any visits that were included in the State plan but not conducted may be provided in the far right row.
CSBG Eligible Entity Review Type Actual Site Visit Dates
Brief Description of Purpose
Information in these cells will be auto‐populate with projected visits in Table 10.1 from the CSBG State Plan. The State may add rows for additional monitoring visits conducted. The State may not delete visits that were included in the CSBG State Plan, but may provide a brief explanation for visits that were not conducted in the far right row.
Dropdown Options:
Full onsite Newly
Designated Follow‐up Other No review Enter dates
Note: If a monitoring visit was a part of the original state monitoring plan, note it as a scheduled monitoring visit. If the visit was not a part of the original monitoring plan, provide a brief explanation for the purpose of the visit (e.g. a follow‐up regarding a special issue). This section should not be used to outline findings, but should simply note the purpose of the monitoring (e.g. follow‐up regarding corrective actions).
[Narrative, 500 characters]
ADD a ROW function Note: Rows may be added for each additional Monitoring Visit
H.2. Monitoring Policies: Were any modifications made to the State’s monitoring policies and procedures during the reporting period (FFY)? Yes No
If changes were made to State monitoring policies and procedures, attach and/or provide a hyperlink to the modified documents. [Attach a document or add a link]
H.3. Initial Monitoring Reports: Were all State monitoring reports conducted in manner consistent with State monitoring policies and procedures and disseminated to CSBG Eligible Entities within 60 calendar days? Yes No
Module 1 State Administration
Page 20 of 66
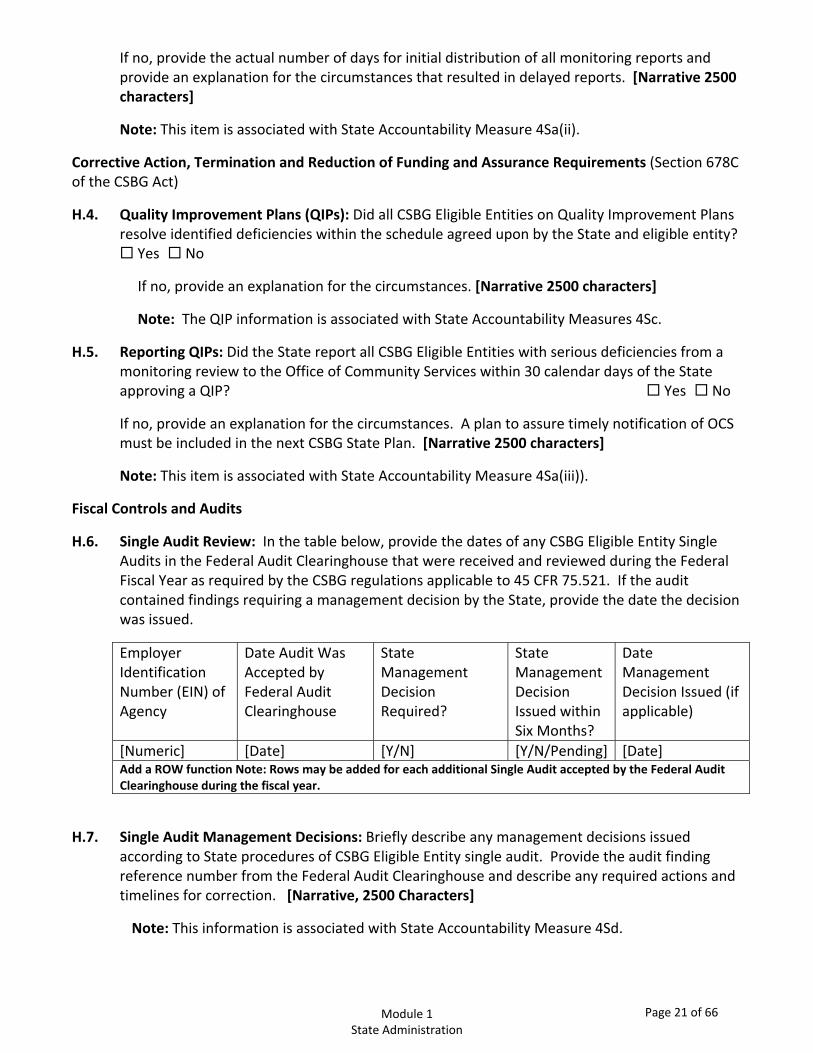
If no, provide the actual number of days for initial distribution of all monitoring reports and provide an explanation for the circumstances that resulted in delayed reports. [Narrative 2500 characters]
Note: This item is associated with State Accountability Measure 4Sa(ii).
Corrective Action, Termination and Reduction of Funding and Assurance Requirements (Section 678C of the CSBG Act)
H.4. Quality Improvement Plans (QIPs): Did all CSBG Eligible Entities on Quality Improvement Plans resolve identified deficiencies within the schedule agreed upon by the State and eligible entity? Yes No
If no, provide an explanation for the circumstances. [Narrative 2500 characters]
Note: The QIP information is associated with State Accountability Measures 4Sc.
H.5. Reporting QIPs: Did the State report all CSBG Eligible Entities with serious deficiencies from a monitoring review to the Office of Community Services within 30 calendar days of the State approving a QIP? Yes No
If no, provide an explanation for the circumstances. A plan to assure timely notification of OCS must be included in the next CSBG State Plan. [Narrative 2500 characters]
Note: This item is associated with State Accountability Measure 4Sa(iii)).
Fiscal Controls and Audits
H.6. Single Audit Review: In the table below, provide the dates of any CSBG Eligible Entity Single Audits in the Federal Audit Clearinghouse that were received and reviewed during the Federal Fiscal Year as required by the CSBG regulations applicable to 45 CFR 75.521. If the audit contained findings requiring a management decision by the State, provide the date the decision was issued.
Employer Identification Number (EIN) of Agency
Date Audit Was Accepted by Federal Audit Clearinghouse
State Management Decision Required?
State Management Decision Issued within Six Months?
Date Management Decision Issued (if applicable)
[Numeric] [Date] [Y/N] [Y/N/Pending] [Date] Add a ROW function Note: Rows may be added for each additional Single Audit accepted by the Federal Audit Clearinghouse during the fiscal year.
H.7. Single Audit Management Decisions: Briefly describe any management decisions issued according to State procedures of CSBG Eligible Entity single audit. Provide the audit finding reference number from the Federal Audit Clearinghouse and describe any required actions and timelines for correction. [Narrative, 2500 Characters]
Note: This information is associated with State Accountability Measure 4Sd.
Module 1 State Administration
Page 21 of 66
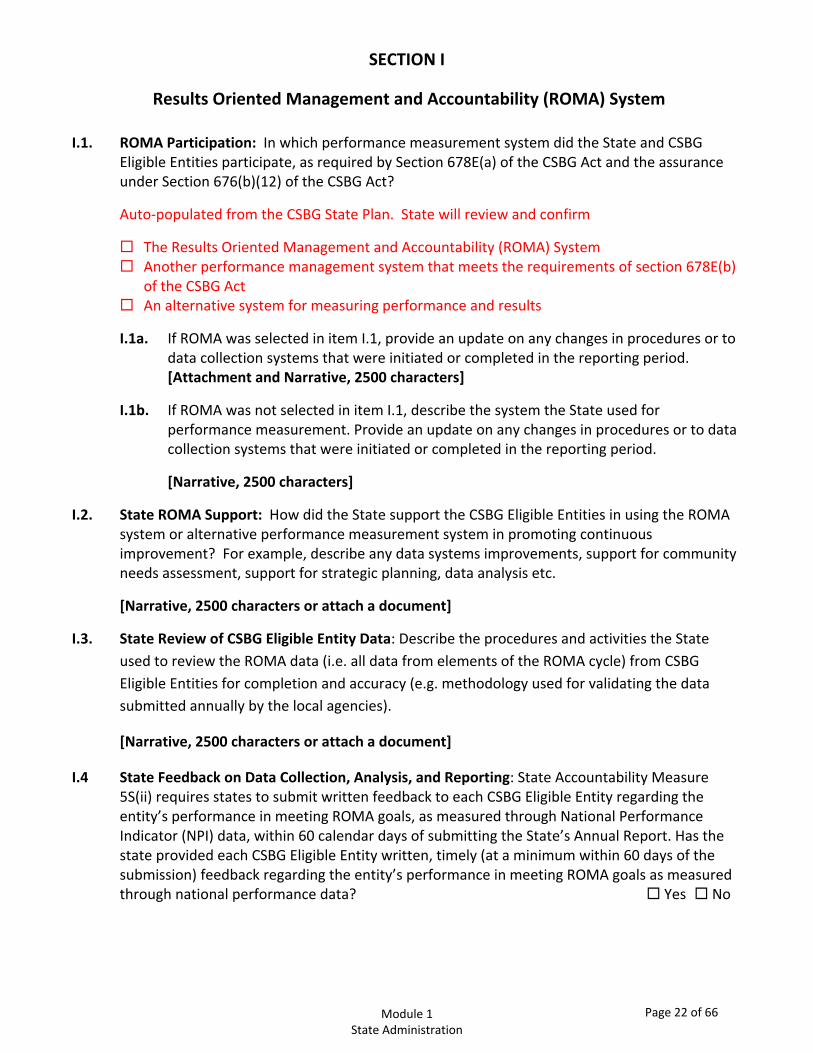
SECTION I
Results Oriented Management and Accountability (ROMA) System
I.1. ROMA Participation: In which performance measurement system did the State and CSBG Eligible Entities participate, as required by Section 678E(a) of the CSBG Act and the assurance under Section 676(b)(12) of the CSBG Act?
Auto‐populated from the CSBG State Plan. State will review and confirm
The Results Oriented Management and Accountability (ROMA) System Another performance management system that meets the requirements of section 678E(b)
of the CSBG Act An alternative system for measuring performance and results
I.1a. If ROMA was selected in item I.1, provide an update on any changes in procedures or to data collection systems that were initiated or completed in the reporting period. [Attachment and Narrative, 2500 characters]
I.1b. If ROMA was not selected in item I.1, describe the system the State used for performance measurement. Provide an update on any changes in procedures or to data collection systems that were initiated or completed in the reporting period.
[Narrative, 2500 characters]
I.2. State ROMA Support: How did the State support the CSBG Eligible Entities in using the ROMA system or alternative performance measurement system in promoting continuous improvement? For example, describe any data systems improvements, support for community needs assessment, support for strategic planning, data analysis etc.
[Narrative, 2500 characters or attach a document]
I.3. State Review of CSBG Eligible Entity Data: Describe the procedures and activities the State used to review the ROMA data (i.e. all data from elements of the ROMA cycle) from CSBG Eligible Entities for completion and accuracy (e.g. methodology used for validating the data submitted annually by the local agencies).
[Narrative, 2500 characters or attach a document]
I.4 State Feedback on Data Collection, Analysis, and Reporting: State Accountability Measure 5S(ii) requires states to submit written feedback to each CSBG Eligible Entity regarding the entity’s performance in meeting ROMA goals, as measured through National Performance Indicator (NPI) data, within 60 calendar days of submitting the State’s Annual Report. Has the state provided each CSBG Eligible Entity written, timely (at a minimum within 60 days of the submission) feedback regarding the entity’s performance in meeting ROMA goals as measured through national performance data? Yes No
Module 1 State Administration
Page 22 of 66
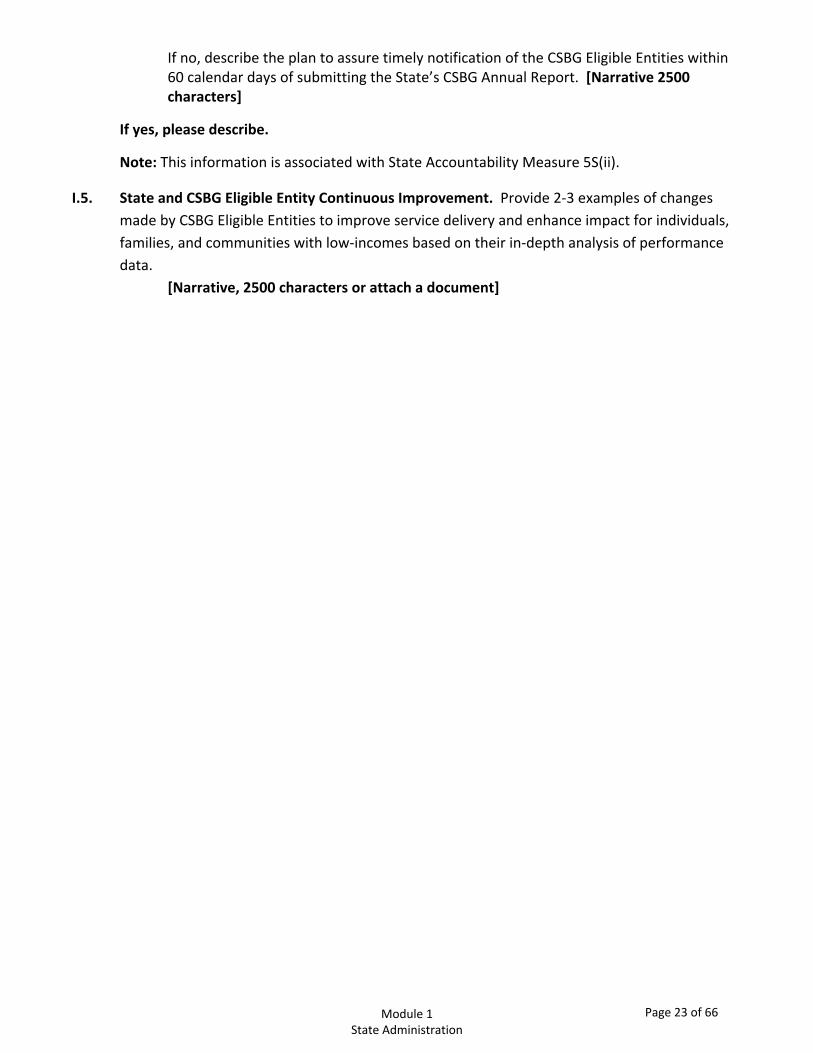
If no, describe the plan to assure timely notification of the CSBG Eligible Entities within 60 calendar days of submitting the State’s CSBG Annual Report. [Narrative 2500 characters]
If yes, please describe.
Note: This information is associated with State Accountability Measure 5S(ii).
I.5. State and CSBG Eligible Entity Continuous Improvement. Provide 2‐3 examples of changes made by CSBG Eligible Entities to improve service delivery and enhance impact for individuals, families, and communities with low‐incomes based on their in‐depth analysis of performance data.
[Narrative, 2500 characters or attach a document]
Module 1 State Administration
Page 23 of 66

Module 2
CSBG Eligible Entity Expenditures, Capacity, and Resources
Page 24 of 66

InstructionalNotes
Module2‐CSBGEligibleEntityExpenditures,Capacity,andResources
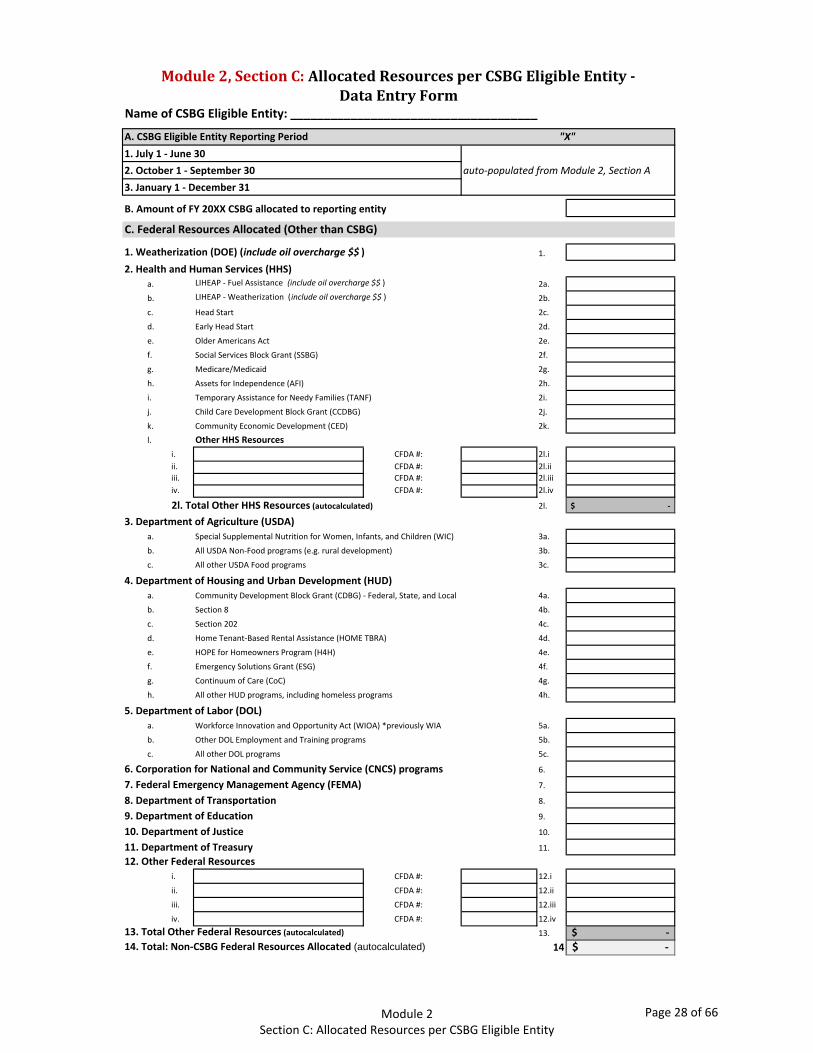
Module2,SectionC:AllocatedResourcesperCSBGEligibleEntity‐DataEntryForm
Section C: Allocated Resources per CSBG Eligible Entity data entry formprovides data on resources allocated to, administered through, and generated by the CSBG Eligible Entity. This report provides valuable information on how CSBG leverages funds from multiple federal, state, local, and private sources as required in the CSBG Act.
Section B: CSBG Eligible Entity Capacity Building Data Entry Form provides detail on agency capacity building funded by CSBG and other funding sources.
Module2,SectionA:CSBGExpendituresbyCSBGEligibleEntity‐DataEntryForm
Module2,SectionB:CSBGEligibleEntityCapacityBuilding‐DataEntryForm
Section A: CSBG Expenditures by CSBG Eligible Entity Data Entry Form meets the Congressional requirement for an explanation of the total amount of CSBG funding expended during the reporting period (identified below) based on categories referenced in the CSBG Act.
CSBG funding expended during the reporting period should be identified in the domain that best reflects the services delivered and strategies implemented, as well as the administrative costs associated with the domains. Further instructions will be provided, but please keep the following in mind, per domain:
Services Supporting Multiple Domains: Expenditures reported under Services Supporting Multiple Domains are those that span or support outcomes achieved across multiple domains for families and individuals, such as case management, transportation, and childcare.
Linkages: Many of the activities that were associated with Linkages are now captured in Domain 9: Agency Capacity Building. This narrows the definition of Linkages, but continues to include community initiatives and information and referral calls.
Agency Capacity Building: Expenditures for Agency Capacity Building are detailed in Table B on this form.
Reporting on Administration: Administrative costs for CSBG reporting are defined by the Office of Community Services as “equivalent to typical indirect costs or overhead." As distinguished from program administration or management expenditures that qualify as direct costs, administrative costs refer to central executive functions that do not directly support a specific project or service.
Module 2 Instructional Notes
Page 25 of 66
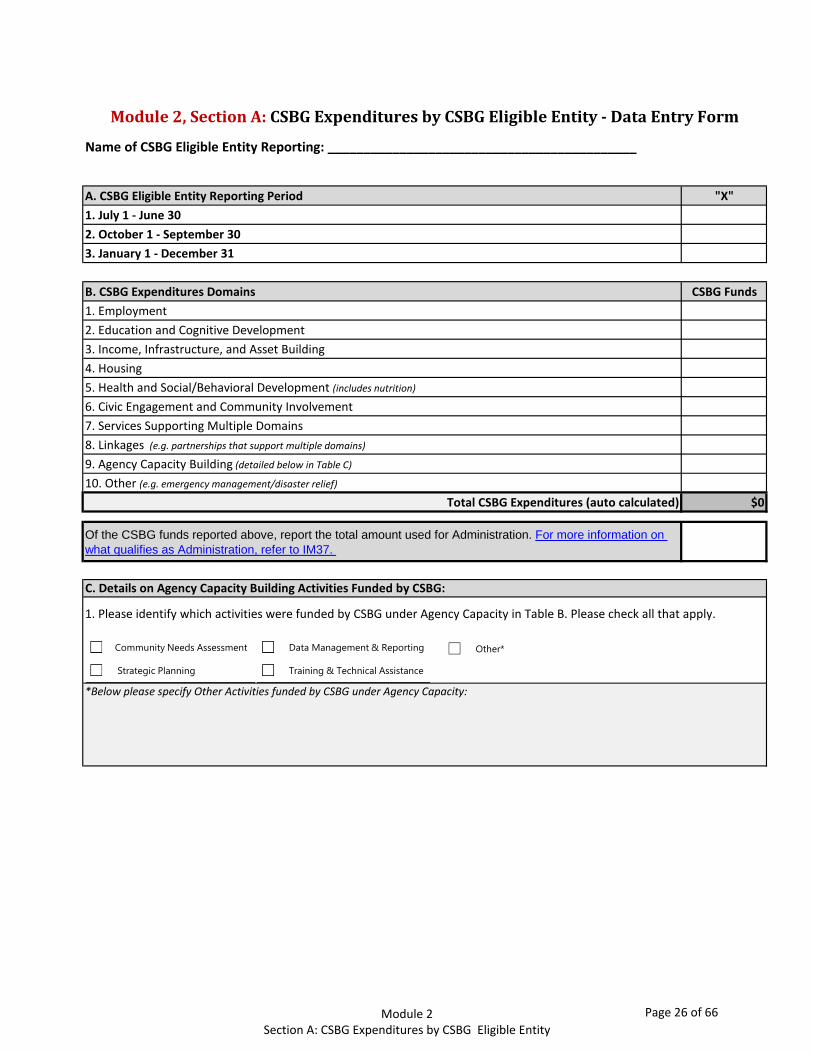
Name of CSBG Eligible Entity Reporting: ___________________________________________
A. CSBG Eligible Entity Reporting Period "X"
1. July 1 ‐ June 30
2. October 1 ‐ September 30
3. January 1 ‐ December 31
B. CSBG Expenditures Domains CSBG Funds
1. Employment2. Education and Cognitive Development3. Income, Infrastructure, and Asset Building4. Housing5. Health and Social/Behavioral Development (includes nutrition)6. Civic Engagement and Community Involvement7. Services Supporting Multiple Domains 8. Linkages (e.g. partnerships that support multiple domains)
9. Agency Capacity Building (detailed below in Table C)10. Other (e.g. emergency management/disaster relief)
Total CSBG Expenditures (auto calculated) $0
Of the CSBG funds reported above, report the total amount used for Administration. For more information on what qualifies as Administration, refer to IM37.
Module2,SectionA:CSBGExpendituresbyCSBGEligibleEntity‐DataEntryForm
*Below please specify Other Activities funded by CSBG under Agency Capacity:
1. Please identify which activities were funded by CSBG under Agency Capacity in Table B. Please check all that apply.
C. Details on Agency Capacity Building Activities Funded by CSBG:
Community Needs Assessment
Strategic Planning
Data Management & Reporting
Training & Technical Assistance
Other*
Module 2 Section A: CSBG Expenditures by CSBG Eligible Entity
Page 26 of 66
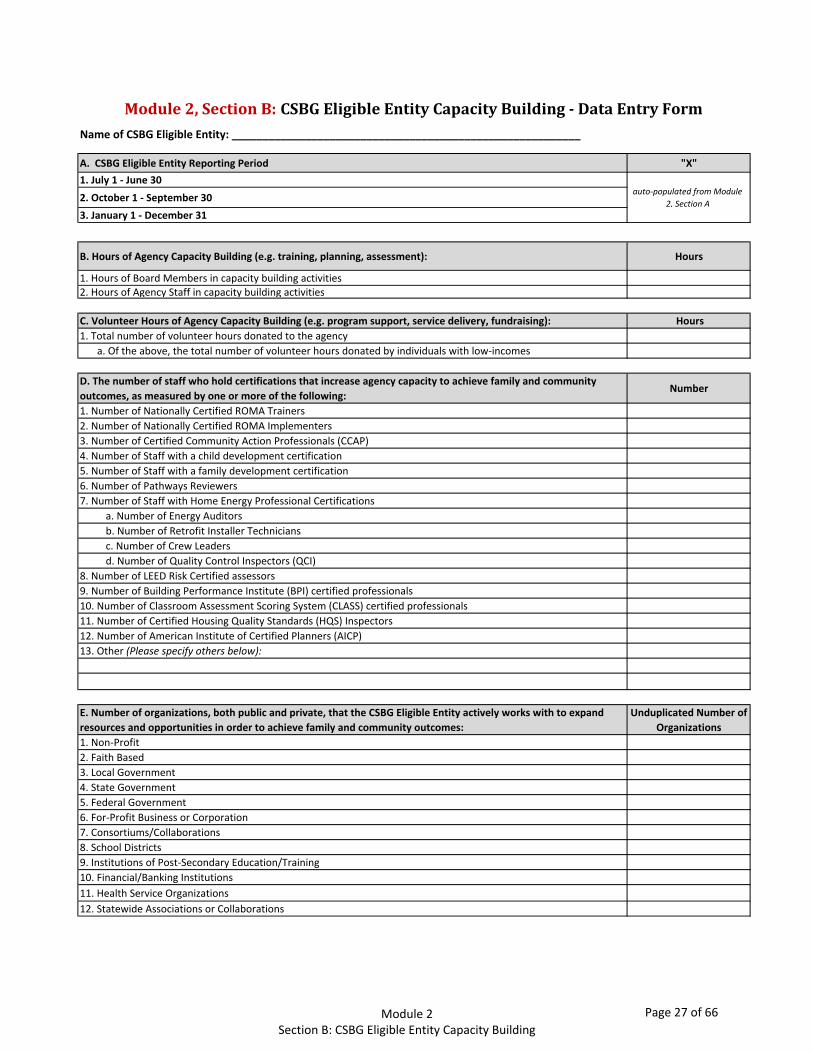
Name of CSBG Eligible Entity: _________________________________________________________
A. CSBG Eligible Entity Reporting Period "X"
1. July 1 ‐ June 30
2. October 1 ‐ September 30auto‐populated from Module
2, Section A
3. January 1 ‐ December 31
B. Hours of Agency Capacity Building (e.g. training, planning, assessment): Hours
1. Hours of Board Members in capacity building activities2. Hours of Agency Staff in capacity building activities
C. Volunteer Hours of Agency Capacity Building (e.g. program support, service delivery, fundraising): Hours
1. Total number of volunteer hours donated to the agencya. Of the above, the total number of volunteer hours donated by individuals with low‐incomes
D. The number of staff who hold certifications that increase agency capacity to achieve family and community
outcomes, as measured by one or more of the following: Number
1. Number of Nationally Certified ROMA Trainers2. Number of Nationally Certified ROMA Implementers3. Number of Certified Community Action Professionals (CCAP)4. Number of Staff with a child development certification5. Number of Staff with a family development certification6. Number of Pathways Reviewers 7. Number of Staff with Home Energy Professional Certifications
a. Number of Energy Auditorsb. Number of Retrofit Installer Techniciansc. Number of Crew Leadersd. Number of Quality Control Inspectors (QCI)
8. Number of LEED Risk Certified assessors9. Number of Building Performance Institute (BPI) certified professionals10. Number of Classroom Assessment Scoring System (CLASS) certified professionals11. Number of Certified Housing Quality Standards (HQS) Inspectors12. Number of American Institute of Certified Planners (AICP) 13. Other (Please specify others below):
E. Number of organizations, both public and private, that the CSBG Eligible Entity actively works with to expand
resources and opportunities in order to achieve family and community outcomes:
Unduplicated Number of
Organizations
1. Non‐Profit2. Faith Based3. Local Government4. State Government5. Federal Government6. For‐Profit Business or Corporation7. Consortiums/Collaborations8. School Districts9. Institutions of Post‐Secondary Education/Training10. Financial/Banking Institutions11. Health Service Organizations12. Statewide Associations or Collaborations
Module2,SectionB:CSBGEligibleEntityCapacityBuilding‐DataEntryForm
Module 2 Section B: CSBG Eligible Entity Capacity Building
Page 27 of 66
1. July 1 ‐ June 30
2. October 1 ‐ September 30 auto‐populated from Module 2, Section A
3. January 1 ‐ December 31
B. Amount of FY 20XX CSBG allocated to reporting entity
1. Weatherization (DOE) (include oil overcharge $$ ) 1.
2. Health and Human Services (HHS)
a. LIHEAP ‐ Fuel Assistance (include oil overcharge $$ ) 2a.
b. LIHEAP ‐ Weatherization (include oil overcharge $$ ) 2b.
c. Head Start 2c.
d. Early Head Start 2d.
e. Older Americans Act 2e.
f. Social Services Block Grant (SSBG) 2f.
g. Medicare/Medicaid 2g.
h. Assets for Independence (AFI) 2h.
i. Temporary Assistance for Needy Families (TANF) 2i.
j. Child Care Development Block Grant (CCDBG) 2j.
k. Community Economic Development (CED) 2k.l. Other HHS Resources
i. CFDA #: 2l.iii. CFDA #: 2l.iiiii. CFDA #: 2l.iiiiv. CFDA #: 2l.iv
2l. Total Other HHS Resources (autocalculated) 2l. ‐$
3. Department of Agriculture (USDA)
a. Special Supplemental Nutrition for Women, Infants, and Children (WIC) 3a.
b. All USDA Non‐Food programs (e.g. rural development) 3b.
c. All other USDA Food programs 3c.
4. Department of Housing and Urban Development (HUD)
a. Community Development Block Grant (CDBG) ‐ Federal, State, and Local 4a.
b. Section 8 4b.
c. Section 202 4c.
d. Home Tenant‐Based Rental Assistance (HOME TBRA) 4d.
e. HOPE for Homeowners Program (H4H) 4e.
f. Emergency Solutions Grant (ESG) 4f.
g. Continuum of Care (CoC) 4g.
h. All other HUD programs, including homeless programs 4h.
5. Department of Labor (DOL)
a. Workforce Innovation and Opportunity Act (WIOA) *previously WIA 5a.
b. Other DOL Employment and Training programs 5b.
c. All other DOL programs 5c.
6. Corporation for National and Community Service (CNCS) programs 6.
7. Federal Emergency Management Agency (FEMA) 7.
8. Department of Transportation 8.
9. Department of Education 9.
10. Department of Justice 10.
11. Department of Treasury 11.
12. Other Federal Resources
i. CFDA #: 12.i
ii. CFDA #: 12.ii
iii. CFDA #: 12.iii
iv. CFDA #: 12.iv13. Total Other Federal Resources (autocalculated) 13. ‐$
14. Total: Non‐CSBG Federal Resources Allocated (autocalculated) 14 ‐$
C. Federal Resources Allocated (Other than CSBG)
Module2,SectionC:AllocatedResourcesperCSBGEligibleEntity‐DataEntryForm
"X"A. CSBG Eligible Entity Reporting Period
Name of CSBG Eligible Entity: _____________________________________
Module 2 Section C: Allocated Resources per CSBG Eligible Entity
Page 28 of 66
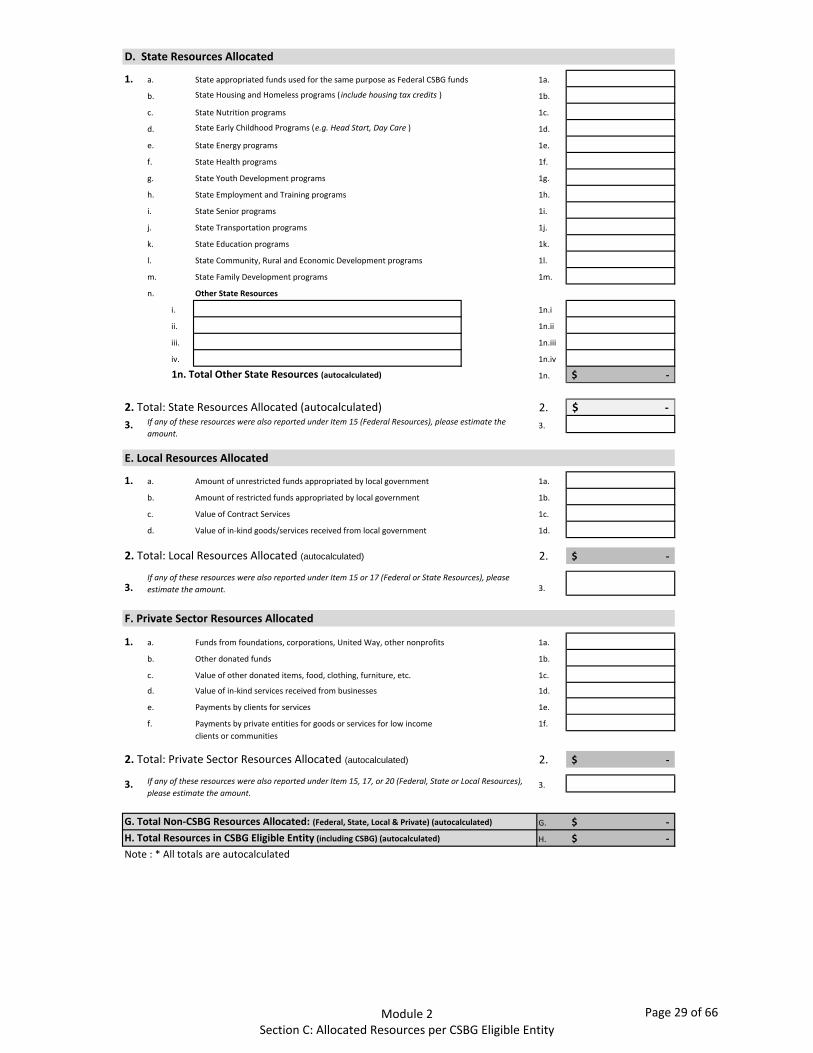
1. a. State appropriated funds used for the same purpose as Federal CSBG funds 1a.
b. State Housing and Homeless programs ( include housing tax credits ) 1b.
c. State Nutrition programs 1c.
d. State Early Childhood Programs (e.g. Head Start, Day Care ) 1d.
e. State Energy programs 1e.
f. State Health programs 1f.
g. State Youth Development programs 1g.
h. State Employment and Training programs 1h.
i. State Senior programs 1i.
j. State Transportation programs 1j.
k. State Education programs 1k.
l. State Community, Rural and Economic Development programs 1l.
m. State Family Development programs 1m.
n. Other State Resources
i. 1n.i
ii. 1n.ii
iii. 1n.iii
iv. 1n.iv
1n. Total Other State Resources (autocalculated) 1n. ‐$
2. Total: State Resources Allocated (autocalculated) 2. ‐$
3. 3.
1. a. Amount of unrestricted funds appropriated by local government 1a.
b. Amount of restricted funds appropriated by local government 1b.
c. Value of Contract Services 1c.
d. Value of in‐kind goods/services received from local government 1d.
2. Total: Local Resources Allocated (autocalculated) 2. ‐$
3. 3.
1. a. Funds from foundations, corporations, United Way, other nonprofits 1a.
b. Other donated funds 1b.
c. Value of other donated items, food, clothing, furniture, etc. 1c.
d. Value of in‐kind services received from businesses 1d.
e. Payments by clients for services 1e.
f. Payments by private entities for goods or services for low income 1f.clients or communities
2. Total: Private Sector Resources Allocated (autocalculated) 2. ‐$
3. 3.
G. Total Non‐CSBG Resources Allocated: (Federal, State, Local & Private) (autocalculated) G. ‐$
H. Total Resources in CSBG Eligible Entity (including CSBG) (autocalculated) H. ‐$
Note : * All totals are autocalculated
D. State Resources Allocated
If any of these resources were also reported under Item 15, 17, or 20 (Federal, State or Local Resources),
please estimate the amount.
F. Private Sector Resources Allocated
If any of these resources were also reported under Item 15 or 17 (Federal or State Resources), please
estimate the amount.
E. Local Resources Allocated
If any of these resources were also reported under Item 15 (Federal Resources), please estimate the
amount.
Module 2 Section C: Allocated Resources per CSBG Eligible Entity
Page 29 of 66
Module 3
Community Level
Page 30 of 66
InstructionalNotes
Module3‐CommunityLevel
Partnership Type: Select the partnership type from the choices provided. For example, a multi‐partner initiative includes the CSBG Eligible Entity and one or more partners.
The first way to report impact is the Counts of Change indicators. These are basic measures that provide the number of units being measured, e.g. jobs, houses, resources, etc. that have been added (created) or subtracted (eliminated), and in some cases maintained, in the community the CSBG Eligible Entity has targeted.
The second way to report impact is the Rates of Change indicators. While requiring a bit more information, these indicators tell the full story of the magnitude of the impact a community initiative (usually involving multiple organizations) has had in a community.
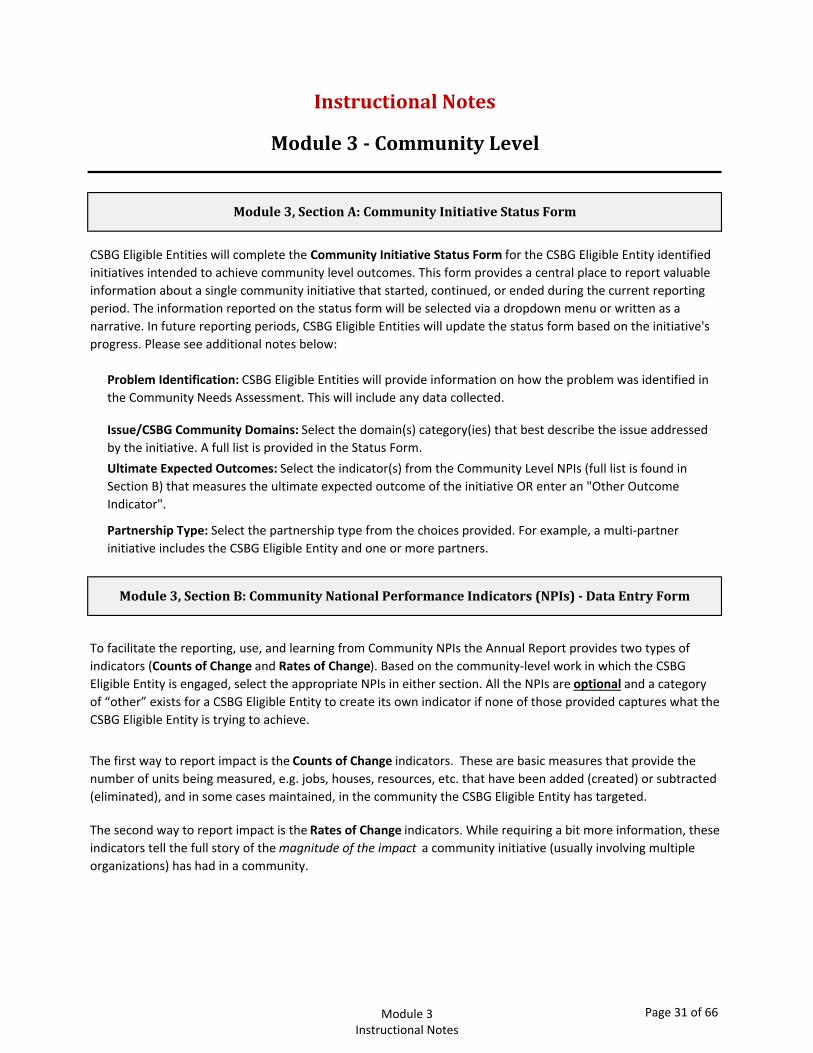
Module3,SectionB:CommunityNationalPerformanceIndicators(NPIs)‐DataEntryForm
To facilitate the reporting, use, and learning from Community NPIs the Annual Report provides two types of indicators (Counts of Change and Rates of Change). Based on the community‐level work in which the CSBG Eligible Entity is engaged, select the appropriate NPIs in either section. All the NPIs are optional and a category of “other” exists for a CSBG Eligible Entity to create its own indicator if none of those provided captures what the CSBG Eligible Entity is trying to achieve.
Module3,SectionA:CommunityInitiativeStatusForm
CSBG Eligible Entities will complete the Community Initiative Status Form for the CSBG Eligible Entity identified initiatives intended to achieve community level outcomes. This form provides a central place to report valuable information about a single community initiative that started, continued, or ended during the current reporting period. The information reported on the status form will be selected via a dropdown menu or written as a narrative. In future reporting periods, CSBG Eligible Entities will update the status form based on the initiative's progress. Please see additional notes below:
Problem Identification: CSBG Eligible Entities will provide information on how the problem was identified in the Community Needs Assessment. This will include any data collected.
Ultimate Expected Outcomes: Select the indicator(s) from the Community Level NPIs (full list is found in Section B) that measures the ultimate expected outcome of the initiative OR enter an "Other Outcome Indicator".
Issue/CSBG Community Domains: Select the domain(s) category(ies) that best describe the issue addressed by the initiative. A full list is provided in the Status Form.
Module 3 Instructional Notes
Page 31 of 66
InstructionalNotes
Module3‐CommunityLevel
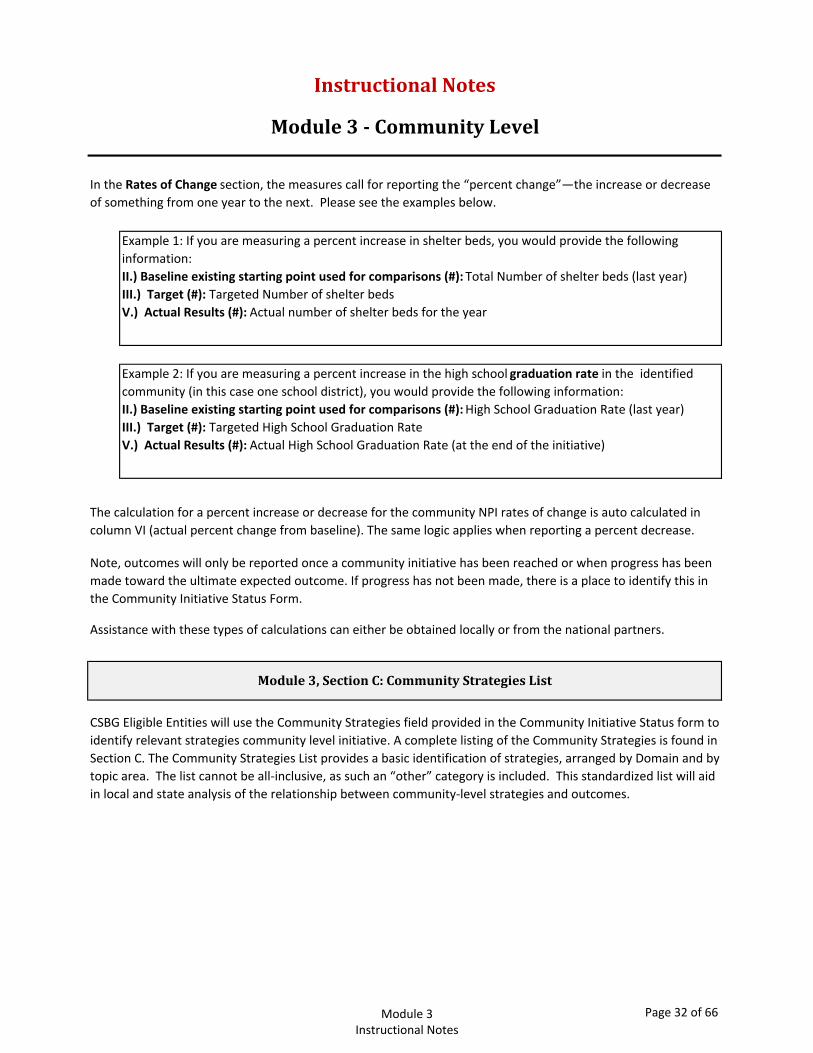
Example 1: If you are measuring a percent increase in shelter beds, you would provide the following information: II.) Baseline existing starting point used for comparisons (#): Total Number of shelter beds (last year)III.) Target (#): Targeted Number of shelter bedsV.) Actual Results (#): Actual number of shelter beds for the year
Assistance with these types of calculations can either be obtained locally or from the national partners.
In the Rates of Change section, the measures call for reporting the “percent change”—the increase or decrease of something from one year to the next. Please see the examples below.
The calculation for a percent increase or decrease for the community NPI rates of change is auto calculated in column VI (actual percent change from baseline). The same logic applies when reporting a percent decrease.
Example 2: If you are measuring a percent increase in the high school graduation rate in the identified community (in this case one school district), you would provide the following information: II.) Baseline existing starting point used for comparisons (#): High School Graduation Rate (last year)III.) Target (#): Targeted High School Graduation RateV.) Actual Results (#): Actual High School Graduation Rate (at the end of the initiative)
Note, outcomes will only be reported once a community initiative has been reached or when progress has been made toward the ultimate expected outcome. If progress has not been made, there is a place to identify this in the Community Initiative Status Form.
Module3,SectionC:CommunityStrategiesList
CSBG Eligible Entities will use the Community Strategies field provided in the Community Initiative Status form to identify relevant strategies community level initiative. A complete listing of the Community Strategies is found in Section C. The Community Strategies List provides a basic identification of strategies, arranged by Domain and by topic area. The list cannot be all‐inclusive, as such an “other” category is included. This standardized list will aid in local and state analysis of the relationship between community‐level strategies and outcomes.
Module 3 Instructional Notes
Page 32 of 66

1. Initiative Name
2. Initiative Year
3. Problem Identification
4. Goal/Agenda
5. Issue/CSBG Community
Domains
6. Ultimate Expected Outcome
7. Identified Community
8. Expected Duration
9. Partnership Type
10. Partners
11. Strategy(ies)
12. Progress on
Outcomes/Indicators
13. Impact of Outcomes
14. Outcomes/Indicators to
Report15. Final Status
16. Lessons Learned
Narrative (Provide additional information on the scope of the impact of these outcomes. e.g. If an initiative created a health clinic, please describe how many individuals
and families are expected to be impacted.)Community Level National Performance Indicators (NPIs)
(Reference the Community NPIs listed in Section B)Initiative Active, Initiative Ended Early, Initiative Ended as Planned, Completed
Still Delivering Value
Narrative
Narrative(Provide the range in years, e.g. 1‐3 years)
Independent CAA Initiative, CAA is the core organizer of multi‐partner Initiative, or CAA is one of multiple active investors and partners
Narrative(Provide a narrative on the key 1‐3 partners)
Select from the Community Level Strategies listed in Section C
No Outcomes to Report, Interim Outcomes, Final Outcomes
Narrative(Provide a narrative on the goal/agenda)
Use the dropdown menu to select the response where appropriate.
Employment; Education and Cognitive Development; Income, Infrastructure, and Asset Building; Housing; Health and Social/Behavioral Development; or
Civic Engagement and Community InvolvementCommunity Level National Performance Indicators (NPIs)
(Reference the Community NPIs listed in Section B)Neighborhood, City, School District, County, Service Area, State, Region, or
Other
Module3,SectionA:CommunityInitiativeStatusForm
Name of CSBG Eligible Entity Reporting:
1‐7+ years
Narrative (Provide a narrative on the scope of the problem)
Module 3 Section A: Community Initiative Status Form
Page 33 of 66
Name of CSBG Eligible Entity Reporting:
I.) Identified
Community
(auto‐populated)
II.) Target
(#)III.) Actual
Results
(#)
IV.) Performance
target accuracy
(% auto calculated)
I.) Identified
Community(auto‐populated)
II.) Target (#)
III.) Actual
Results(#)
IV.) Performance
target accuracy (% auto calculated)
I.) Identified
Community(auto‐populated)
II.) Baseline existing starting point used for comparisons
(#)
III.) Target (#)
IV.) Expected %
change from
baseline (Target % auto
calculated)
V.) Actual Results(#)
VI.) Actual %
change from
baseline (% auto
calculated)
VII.) Performance
target accuracy(% auto calculated)
General comments:
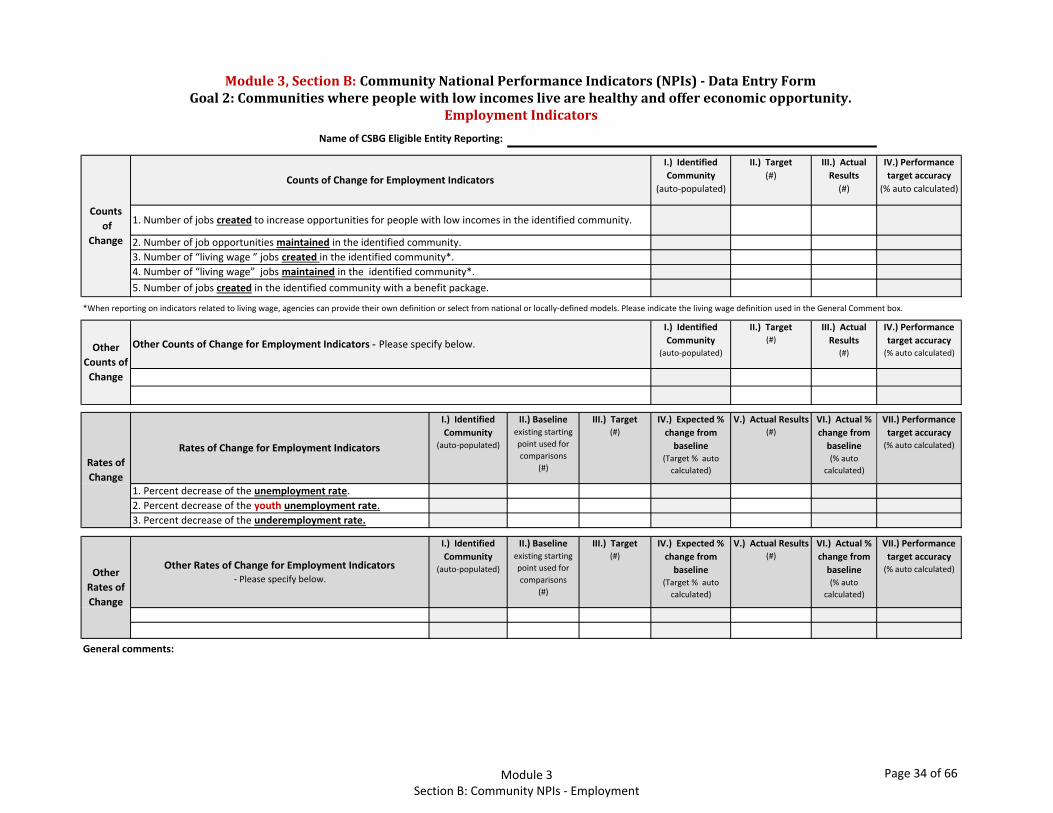
*When reporting on indicators related to living wage, agencies can provide their own definition or select from national or locally‐defined models. Please indicate the living wage definition used in the General Comment box.
Other
Rates of
Change
Rates of Change for Employment Indicators
1. Percent decrease of the unemployment rate.2. Percent decrease of the youth unemployment rate.3. Percent decrease of the underemployment rate.
Other Counts of Change for Employment Indicators ‐ Please specify below.
Other Rates of Change for Employment Indicators ‐ Please specify below.
Other
Counts of
Change
Rates of
Change
Module3,SectionB:CommunityNationalPerformanceIndicators(NPIs)‐DataEntryFormGoal2:Communitieswherepeoplewithlowincomeslivearehealthyandoffereconomicopportunity.
EmploymentIndicators
5. Number of jobs created in the identified community with a benefit package.
Counts of Change for Employment Indicators
Counts
of
Change
1. Number of jobs created to increase opportunities for people with low incomes in the identified community.
2. Number of job opportunities maintained in the identified community. 3. Number of “living wage ” jobs created in the identified community*.4. Number of “living wage” jobs maintained in the identified community*.
Module 3 Section B: Community NPIs - Employment
Page 34 of 66
Name of CSBG Eligible Entity Reporting:
I.) Identified
Community(auto‐populated)
II.) Target (#)
III.) Actual
Results(#)
IV.) Performance
target accuracy (% auto calculated)
I.) Identified
Community(auto‐populated)
II.) Target (#)
III.) Actual
Results(#)
IV.) Performance
target accuracy (% auto calculated)
Other
Counts of
Change
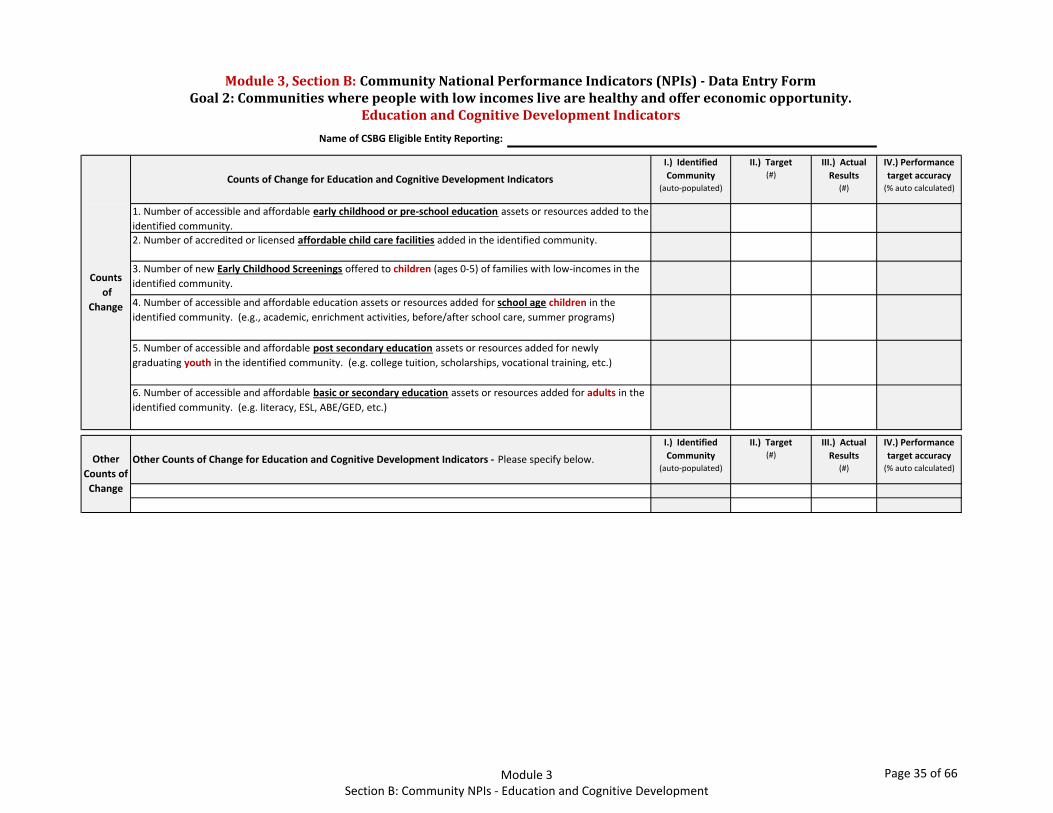
Other Counts of Change for Education and Cognitive Development Indicators ‐ Please specify below.
Module3,SectionB:CommunityNationalPerformanceIndicators(NPIs)‐DataEntryFormGoal2:Communitieswherepeoplewithlowincomeslivearehealthyandoffereconomicopportunity.
EducationandCognitiveDevelopmentIndicators
Counts of Change for Education and Cognitive Development Indicators
1. Number of accessible and affordable early childhood or pre‐school education assets or resources added to the identified community. 2. Number of accredited or licensed affordable child care facilities added in the identified community.
3. Number of new Early Childhood Screenings offered to children (ages 0‐5) of families with low‐incomes in the identified community.
5. Number of accessible and affordable post secondary education assets or resources added for newly graduating youth in the identified community. (e.g. college tuition, scholarships, vocational training, etc.)
4. Number of accessible and affordable education assets or resources added for school age children in the identified community. (e.g., academic, enrichment activities, before/after school care, summer programs)
6. Number of accessible and affordable basic or secondary education assets or resources added for adults in the identified community. (e.g. literacy, ESL, ABE/GED, etc.)
Counts
of
Change
Module 3 Section B: Community NPIs - Education and Cognitive Development
Page 35 of 66
Module3,SectionB:CommunityNationalPerformanceIndicators(NPIs)‐DataEntryFormGoal2:Communitieswherepeoplewithlowincomeslivearehealthyandoffereconomicopportunity.
EducationandCognitiveDevelopmentIndicators
I.) Identified
Community(auto‐populated)
II.) Baseline existing starting point used for comparisons
(#)
III.) Target (#)
IV.) Expected %
change from
baseline (Target % auto
calculated)
V.) Actual Results(#)
VI.) Actual %
change from
baseline (% auto
calculated)
VII.) Performance
target accuracy(% auto calculated)
I.) Identified
Community(auto populated)
II.) Baseline existing starting point used for comparisons
(#)
III.) Target (#)
IV.) Expected %
change from
baseline (Target % auto
calculated)
V.) Actual Results(#)
VI.) Actual %
change from
baseline (% auto
calculated)
VII.) Performance
target accuracy(% auto calculated)
General comments:
Other
Rates of
Change
Other Rates of Change for Education and Cognitive
Development Indicators‐ Please specify below.
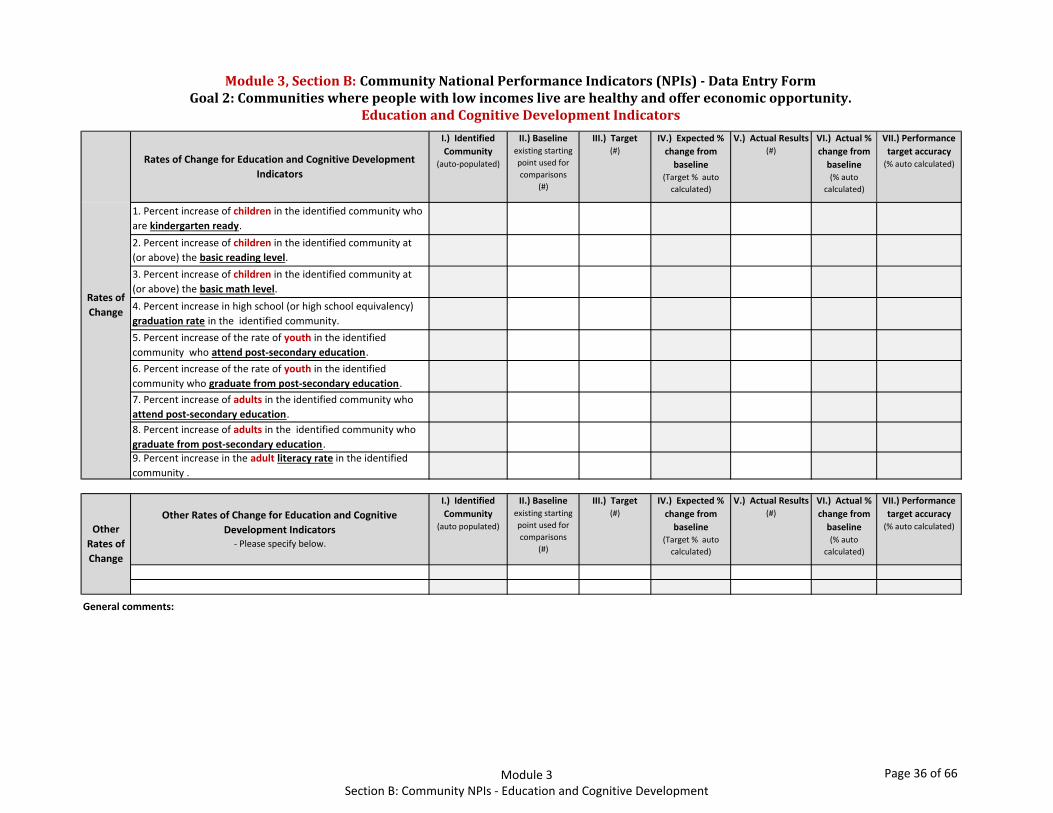
2. Percent increase of children in the identified community at (or above) the basic reading level.3. Percent increase of children in the identified community at (or above) the basic math level.4. Percent increase in high school (or high school equivalency) graduation rate in the identified community.
Rates of
Change
Rates of Change for Education and Cognitive Development
Indicators
1. Percent increase of children in the identified community who are kindergarten ready.
5. Percent increase of the rate of youth in the identified community who attend post‐secondary education.
8. Percent increase of adults in the identified community who graduate from post‐secondary education.9. Percent increase in the adult literacy rate in the identified community .
7. Percent increase of adults in the identified community who attend post‐secondary education.
6. Percent increase of the rate of youth in the identified community who graduate from post‐secondary education.
Module 3 Section B: Community NPIs - Education and Cognitive Development
Page 36 of 66
Name of CSBG Eligible Entity Reporting:
I.) Identified
Community(auto‐populated)
II.) Target (#)
III.) Actual
Results(#)
IV.) Performance
target accuracy (% auto calculated)
a.b.c.
d.e.f.
a.b.c.
d.e.f.
I.) Identified
Community(auto populated)
II.) Target (#)
III.) Actual
Results(#)
IV.) Performance
target accuracy (% auto calculated)
Other
Counts of
Change
Module3,SectionB:CommunityNationalPerformanceIndicators(NPIs)‐DataEntryFormGoal2:Communitieswherepeoplewithlowincomeslivearehealthyandoffereconomicopportunity.
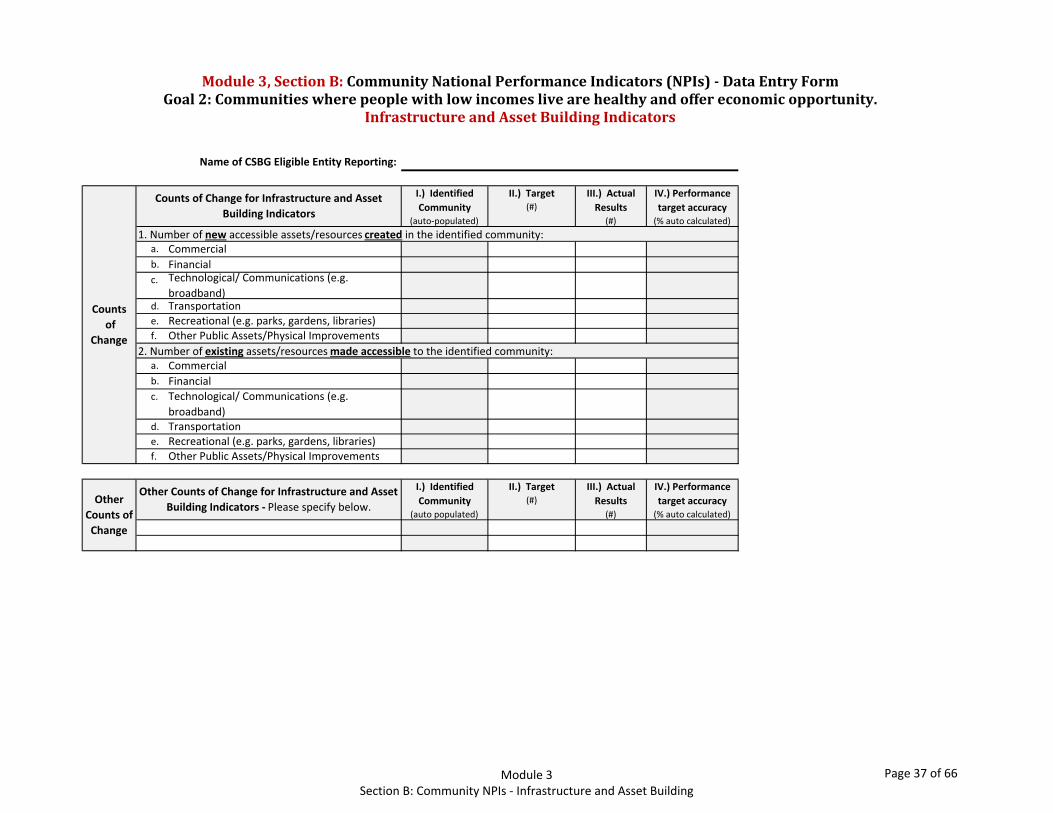
Commercial
Counts of Change for Infrastructure and Asset
Building Indicators
1. Number of new accessible assets/resources created in the identified community:
Counts
of
Change
Financial
InfrastructureandAssetBuildingIndicators
Financial
Other Public Assets/Physical ImprovementsRecreational (e.g. parks, gardens, libraries)
Technological/ Communications (e.g. broadband)TransportationRecreational (e.g. parks, gardens, libraries)Other Public Assets/Physical Improvements
Transportation
Technological/ Communications (e.g. broadband)
2. Number of existing assets/resources made accessible to the identified community:Commercial
Other Counts of Change for Infrastructure and Asset
Building Indicators ‐ Please specify below.
Module 3 Section B: Community NPIs - Infrastructure and Asset Building
Page 37 of 66
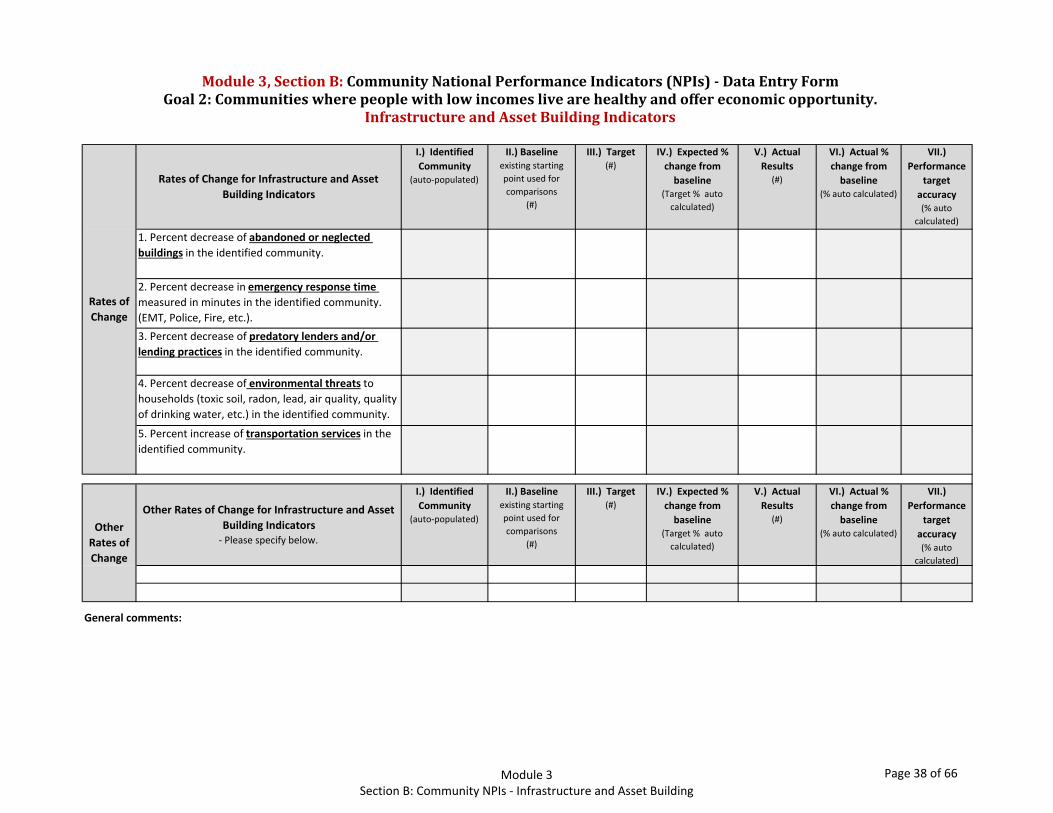
Module3,SectionB:CommunityNationalPerformanceIndicators(NPIs)‐DataEntryFormGoal2:Communitieswherepeoplewithlowincomeslivearehealthyandoffereconomicopportunity.
InfrastructureandAssetBuildingIndicators
I.) Identified
Community(auto‐populated)
II.) Baseline existing starting point used for comparisons
(#)
III.) Target (#)
IV.) Expected %
change from
baseline (Target % auto
calculated)
V.) Actual
Results(#)
VI.) Actual %
change from
baseline (% auto calculated)
VII.)
Performance
target
accuracy(% auto
calculated)
General comments:
Other
Rates of
Change
Rates of
Change
Other Rates of Change for Infrastructure and Asset
Building Indicators‐ Please specify below.
Rates of Change for Infrastructure and Asset
Building Indicators
1. Percent decrease of abandoned or neglected buildings in the identified community.
2. Percent decrease in emergency response time
measured in minutes in the identified community. (EMT, Police, Fire, etc.).3. Percent decrease of predatory lenders and/or lending practices in the identified community.
4. Percent decrease of environmental threats to households (toxic soil, radon, lead, air quality, quality of drinking water, etc.) in the identified community.
5. Percent increase of transportation services in the identified community.
Module 3 Section B: Community NPIs - Infrastructure and Asset Building
Page 38 of 66
Name of CSBG Eligible Entity Reporting:
I.) Identified
Community(auto‐populated)
II.) Target (#)
III.) Actual
Results(#)
IV.) Performance
target accuracy (% auto calculated)
I.) Identified
Community(auto‐populated)
II.) Target (#)
III.) Actual
Results(#)
IV.) Performance
target accuracy (% auto calculated)
I.) Identified
Community(auto‐populated)
II.) Baseline existing starting point used for comparisons
(#)
III.) Target (#)
IV.) Expected %
change from
baseline (Target % auto
calculated)
V.) Actual Results(#)
VI.) Actual %
change from
baseline (% auto
calculated)
VII.) Performance
target accuracy(% auto calculated)
I.) Identified
Community(auto populated)
II.) Baseline existing starting point used for comparisons
(#)
III.) Target (#)
IV.) Expected %
change from
baseline (Target % auto
calculated)
V.) Actual Results(#)
VI.) Actual %
change from
baseline (% auto
calculated)
VII.) Performance
target accuracy(% auto calculated)
General comments:
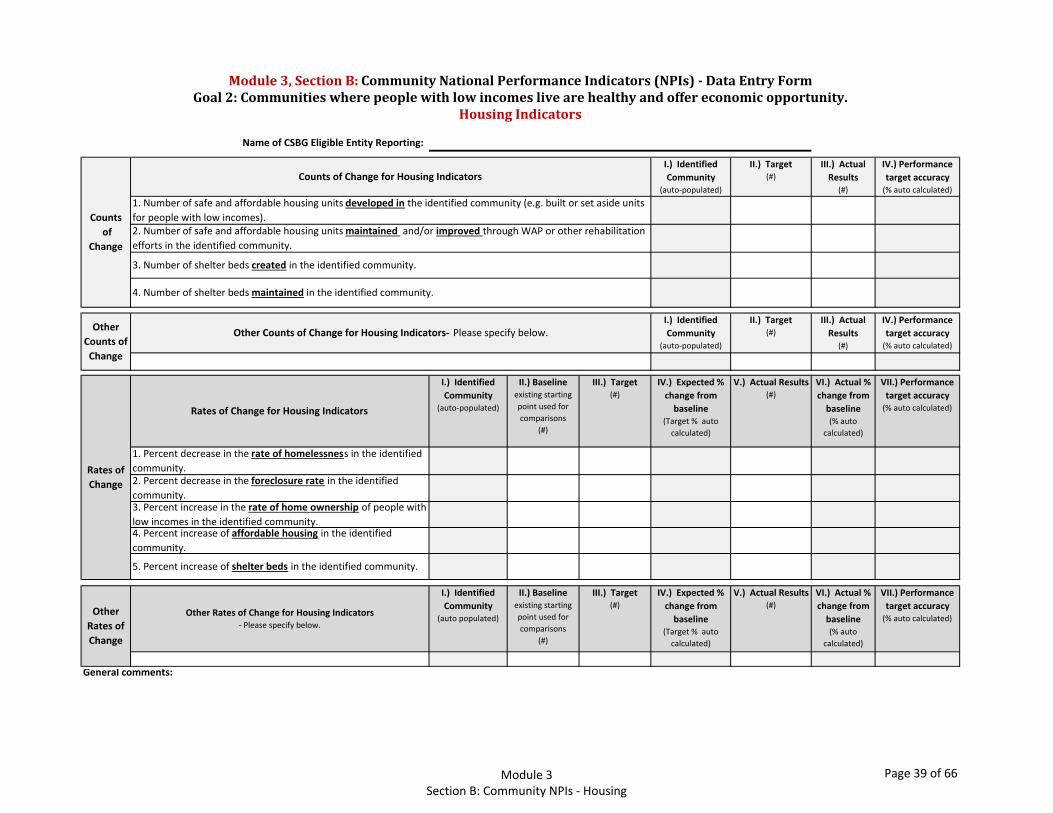
4. Number of shelter beds maintained in the identified community.
Other
Counts of
Change
Other Counts of Change for Housing Indicators‐ Please specify below.
Module3,SectionB:CommunityNationalPerformanceIndicators(NPIs)‐DataEntryFormGoal2:Communitieswherepeoplewithlowincomeslivearehealthyandoffereconomicopportunity.
HousingIndicators
Counts of Change for Housing Indicators
1. Number of safe and affordable housing units developed in the identified community (e.g. built or set aside units for people with low incomes).2. Number of safe and affordable housing units maintained and/or improved through WAP or other rehabilitation efforts in the identified community.
3. Number of shelter beds created in the identified community.
Counts
of
Change
Other
Rates of
Change
Other Rates of Change for Housing Indicators‐ Please specify below.
Rates of
Change
Rates of Change for Housing Indicators
1. Percent decrease in the rate of homelessness in the identified community. 2. Percent decrease in the foreclosure rate in the identified community.3. Percent increase in the rate of home ownership of people with low incomes in the identified community.
5. Percent increase of shelter beds in the identified community.
4. Percent increase of affordable housing in the identified community.
Module 3 Section B: Community NPIs - Housing
Page 39 of 66
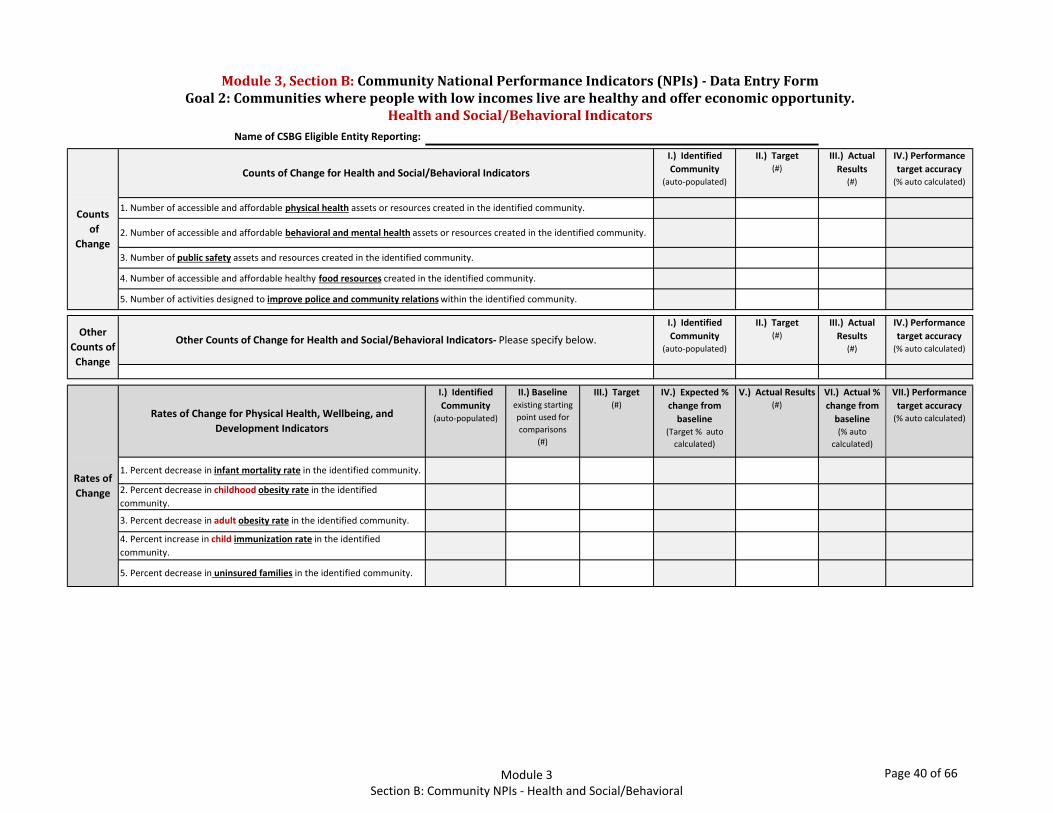
Name of CSBG Eligible Entity Reporting:
I.) Identified
Community(auto‐populated)
II.) Target (#)
III.) Actual
Results(#)
IV.) Performance
target accuracy (% auto calculated)
I.) Identified
Community(auto‐populated)
II.) Target (#)
III.) Actual
Results(#)
IV.) Performance
target accuracy (% auto calculated)
I.) Identified
Community(auto‐populated)
II.) Baseline existing starting point used for comparisons
(#)
III.) Target (#)
IV.) Expected %
change from
baseline (Target % auto
calculated)
V.) Actual Results(#)
VI.) Actual %
change from
baseline (% auto
calculated)
VII.) Performance
target accuracy(% auto calculated)
Module3,SectionB:CommunityNationalPerformanceIndicators(NPIs)‐DataEntryFormGoal2:Communitieswherepeoplewithlowincomeslivearehealthyandoffereconomicopportunity.
HealthandSocial/BehavioralIndicators
Counts of Change for Health and Social/Behavioral Indicators
1. Number of accessible and affordable physical health assets or resources created in the identified community.
2. Number of accessible and affordable behavioral and mental health assets or resources created in the identified community.
3. Number of public safety assets and resources created in the identified community.
4. Number of accessible and affordable healthy food resources created in the identified community.
Other
Counts of
Change
Other Counts of Change for Health and Social/Behavioral Indicators‐ Please specify below.
Rates of
Change
Rates of Change for Physical Health, Wellbeing, and
Development Indicators
1. Percent decrease in infant mortality rate in the identified community.
2. Percent decrease in childhood obesity rate in the identified community.
3. Percent decrease in adult obesity rate in the identified community.
4. Percent increase in child immunization rate in the identified community.
5. Percent decrease in uninsured families in the identified community.
Counts
of
Change
5. Number of activities designed to improve police and community relations within the identified community.
Module 3 Section B: Community NPIs - Health and Social/Behavioral
Page 40 of 66

Module3,SectionB:CommunityNationalPerformanceIndicators(NPIs)‐DataEntryFormGoal2:Communitieswherepeoplewithlowincomeslivearehealthyandoffereconomicopportunity.
HealthandSocial/BehavioralIndicatorsI.) Identified
Community(auto‐populated)
II.) Baseline existing starting point used for comparisons
(#)
III.) Target (#)
IV.) Expected %
change from
baseline (Target % auto
calculated)
V.) Actual Results(#)
VI.) Actual %
change from
baseline (% auto
calculated)
VII.) Performance
target accuracy(% auto calculated)
I.) Identified
Community(auto populated)
II.) Baseline existing starting point used for comparisons
(#)
III.) Target (#)
IV.) Expected %
change from
baseline (Target % auto
calculated)
V.) Actual Results(#)
VI.) Actual %
change from
baseline (% auto
calculated)
VII.) Performance
target accuracy(% auto calculated)
General comments:
Other Rates of Change for Health and Social/Behavioral
Indicators‐ Please specify below.
Other
Rates of
Change
6. Percent decrease in the child neglect rate in the identified community.
5. Percent decrease in the child abuse rate in the identified community.
Rates of
Change
7. Percent decrease in the elder abuse rate in the identified community.
Rates of
Change
Rates of Change for Behavioral and Mental health, Emotional
Wellbeing, and Development Indicators
1. Percent decrease in the teen pregnancy rate in the identified community.2. Percent decrease in unplanned pregnancies in the identified community.3. Percent decrease in substance abuse rate in the identified community.(e.g. cigarettes, prescription drugs, narcotics, alcohol). 4. Percent decrease in domestic violence rate in the identified community.
8. Percent decrease in the elder neglect rate in the identified community.
Rates of Change for Public Safety Indicators
1. Percent decrease in recidivism rate in the identified community.
2. Percent decrease in non‐violent crime rate in the identified community.
3. Percent decrease in violent crime rate in the identified community.
4. Percent decrease in teens involved with the juvenile court system in the identified community.
Module 3 Section B: Community NPIs - Health and Social/Behavioral
Page 41 of 66
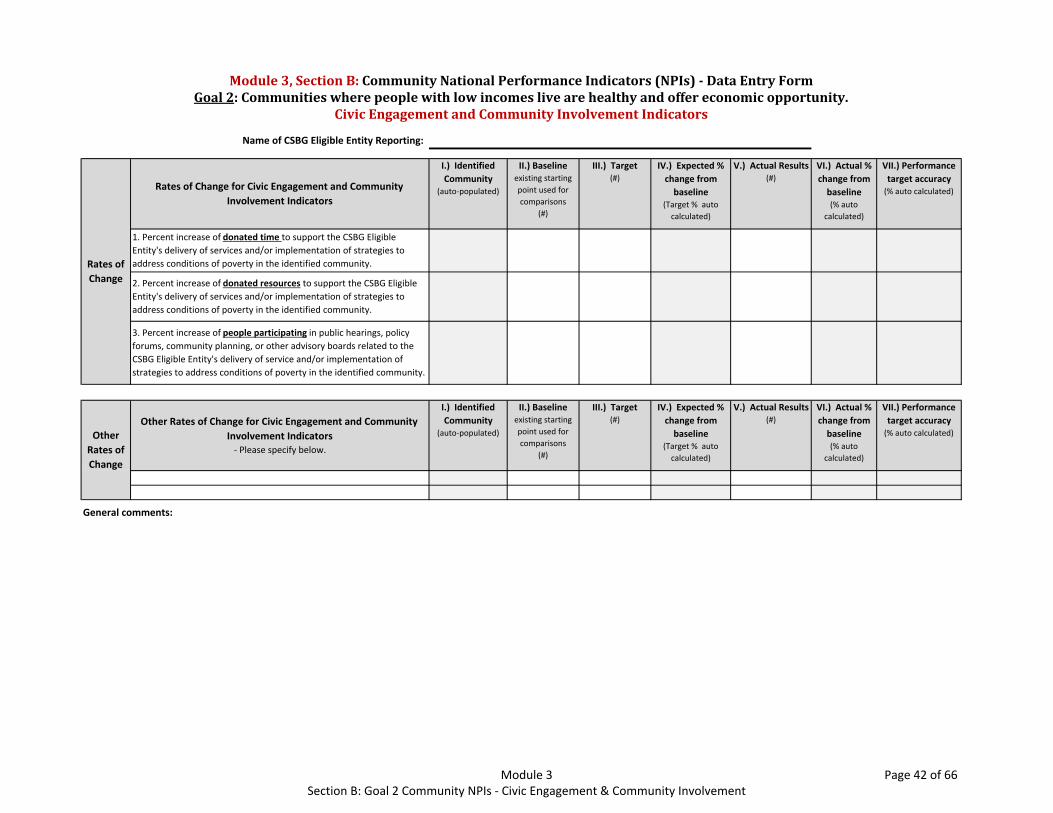
Name of CSBG Eligible Entity Reporting:
I.) Identified
Community(auto‐populated)
II.) Baseline existing starting point used for comparisons
(#)
III.) Target (#)
IV.) Expected %
change from
baseline (Target % auto
calculated)
V.) Actual Results(#)
VI.) Actual %
change from
baseline (% auto
calculated)
VII.) Performance
target accuracy(% auto calculated)
General comments:
Other
Rates of
Change
Other Rates of Change for Civic Engagement and Community
Involvement Indicators‐ Please specify below.
Module3,SectionB:CommunityNationalPerformanceIndicators(NPIs)‐DataEntryFormGoal2:Communitieswherepeoplewithlowincomeslivearehealthyandoffereconomicopportunity.
CivicEngagementandCommunityInvolvementIndicators
Rates of
Change
Rates of Change for Civic Engagement and Community
Involvement Indicators
1. Percent increase of donated time to support the CSBG Eligible Entity's delivery of services and/or implementation of strategies to address conditions of poverty in the identified community.
2. Percent increase of donated resources to support the CSBG Eligible Entity's delivery of services and/or implementation of strategies to address conditions of poverty in the identified community.
3. Percent increase of people participating in public hearings, policy forums, community planning, or other advisory boards related to the CSBG Eligible Entity's delivery of service and/or implementation of strategies to address conditions of poverty in the identified community.
Module 3 Section B: Goal 2 Community NPIs - Civic Engagement & Community Involvement
Page 42 of 66

Name of CSBG Eligible Entity Reporting:
I.) Identified
Community(auto‐populated)
II.) Baseline existing starting point used for comparisons
(#)
III.) Target (#)
IV.) Expected %
change from
baseline (Target % auto calculated)
V.) Actual Results(#)
VI.) Actual %
change from
baseline (% auto
calculated)
VII.) Performance
target accuracy(% auto calculated)
General comments:
Other
Rates of
Change
Other Rates of Change for Civic Engagement and Community
Involvement Indicators‐ Please specify below.
Module3,SectionB:CommunityNationalPerformanceIndicators(NPIs)‐DataEntryFormGoal3:Peoplewithlow‐incomesareengagedandactiveinbuildingopportunitiesincommunities.
CivicEngagementandCommunityInvolvementIndicators
Rates of
Change
Rates of Change for Civic Engagement and Community
Involvement Indicators
1. Percent increase of people with low incomes who support the CSBG Eligible Entity's delivery of service and/or implementation of strategies to address conditions of poverty in the identified community.
2. Percent increase of people with low incomes who acquire and maintain leadership roles with the CSBG Eligible Entity or other organizations within the identified community.
Module 3 Section B: Goal 3 Community NPIs - Civic Engagement & Community Involvement
Page 43 of 66

Module3,SectionC:CommunityStrategiesList
Employment Strategies
Minimum/Living Wage Campaign Job Creation/Employment Generation Job FairsEarned Income Tax Credit (EITC) PromotionCommercial Space DevelopmentEmployer Education Employment Policy ChangesEmployment Legislative ChangesOther Employment Strategy: (please specify)
Education and Cognitive Development Strategies
Preschool for All CampaignCharter School DevelopmentAfter School Enrichment Activities PromotionPre K‐College/Community College Support Children’s Trust Fund CreationScholarship CreationChild Tax Credit (CTC) Promotion Adoption Child Care Quality Rating Adult Education EstablishmentEducation and Cognitive Development Policy ChangesEducation and Cognitive Development Legislative ChangesOther Education and Cognitive Development Strategy: (please specify)
Infrastructure and Asset Building Strategies
Cultural Asset CreationPolice/Community Relations CampaignNeighborhood Safety Watch ProgramsAnti‐Predatory Lending CampaignAsset Building and Savings Promotion Develop/Build/Rehab Spaces Maintain or Host Income Tax Preparation SitesCommunity‐Wide Data Collection Systems DevelopmentLocal 211 or Resource/Referral System DevelopmentWater/Sewer System Development Community Financial Institution CreationInfrastructure Planning CoalitionPark or Recreation Creation and Maintenance Rehabilitation/Weatherization of Housing Stock Community Center/Community Facility EstablishmentAsset Limit Barriers for Benefits Policy ChangesInfrastructure and Asset Building Policy ChangesInfrastructure and Asset Building Legislative ChangesOther Infrastructure and Asset Building Strategy: (please specify)
Module 3 Section C: Community Strategies List
Page 44 of 66
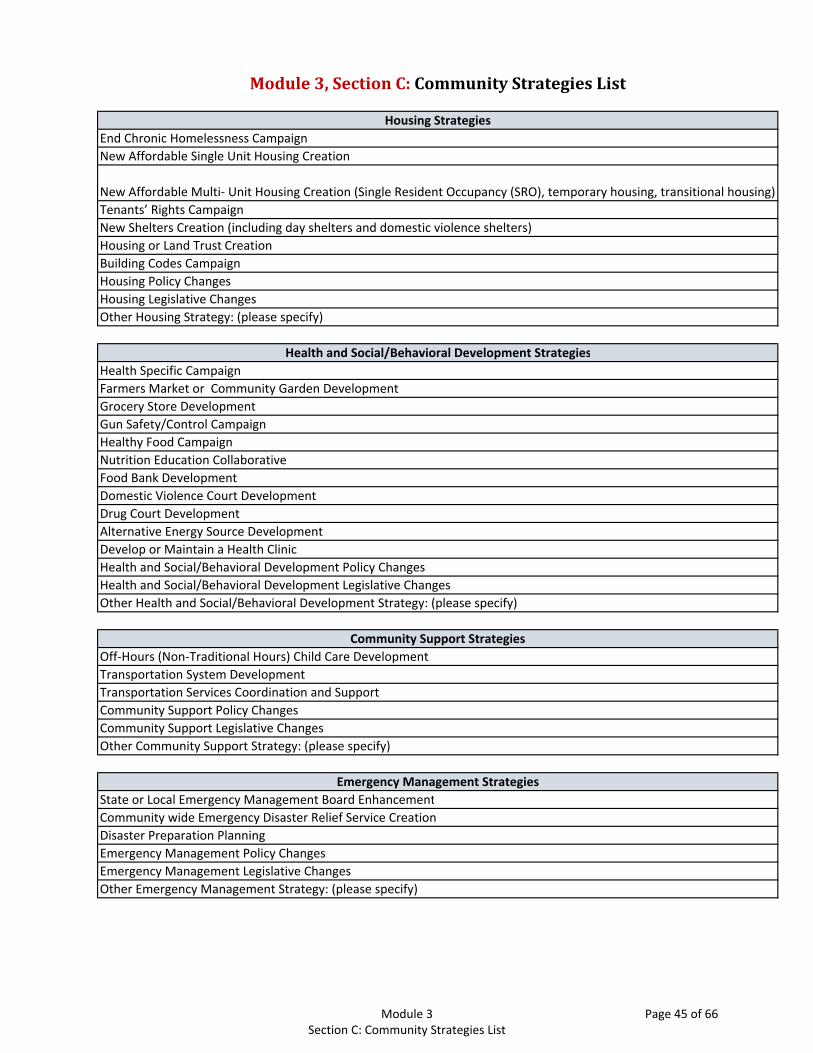
Module3,SectionC:CommunityStrategiesList
Housing Strategies
End Chronic Homelessness CampaignNew Affordable Single Unit Housing Creation
New Affordable Multi‐ Unit Housing Creation (Single Resident Occupancy (SRO), temporary housing, transitional housing)Tenants’ Rights CampaignNew Shelters Creation (including day shelters and domestic violence shelters)Housing or Land Trust CreationBuilding Codes CampaignHousing Policy ChangesHousing Legislative Changes Other Housing Strategy: (please specify)
Health and Social/Behavioral Development Strategies
Health Specific CampaignFarmers Market or Community Garden DevelopmentGrocery Store DevelopmentGun Safety/Control CampaignHealthy Food CampaignNutrition Education CollaborativeFood Bank DevelopmentDomestic Violence Court DevelopmentDrug Court DevelopmentAlternative Energy Source DevelopmentDevelop or Maintain a Health ClinicHealth and Social/Behavioral Development Policy ChangesHealth and Social/Behavioral Development Legislative ChangesOther Health and Social/Behavioral Development Strategy: (please specify)
Community Support Strategies
Off‐Hours (Non‐Traditional Hours) Child Care DevelopmentTransportation System DevelopmentTransportation Services Coordination and SupportCommunity Support Policy ChangesCommunity Support Legislative Changes Other Community Support Strategy: (please specify)
Emergency Management Strategies
State or Local Emergency Management Board EnhancementCommunity wide Emergency Disaster Relief Service CreationDisaster Preparation PlanningEmergency Management Policy ChangesEmergency Management Legislative Changes Other Emergency Management Strategy: (please specify)
Module 3 Section C: Community Strategies List
Page 45 of 66
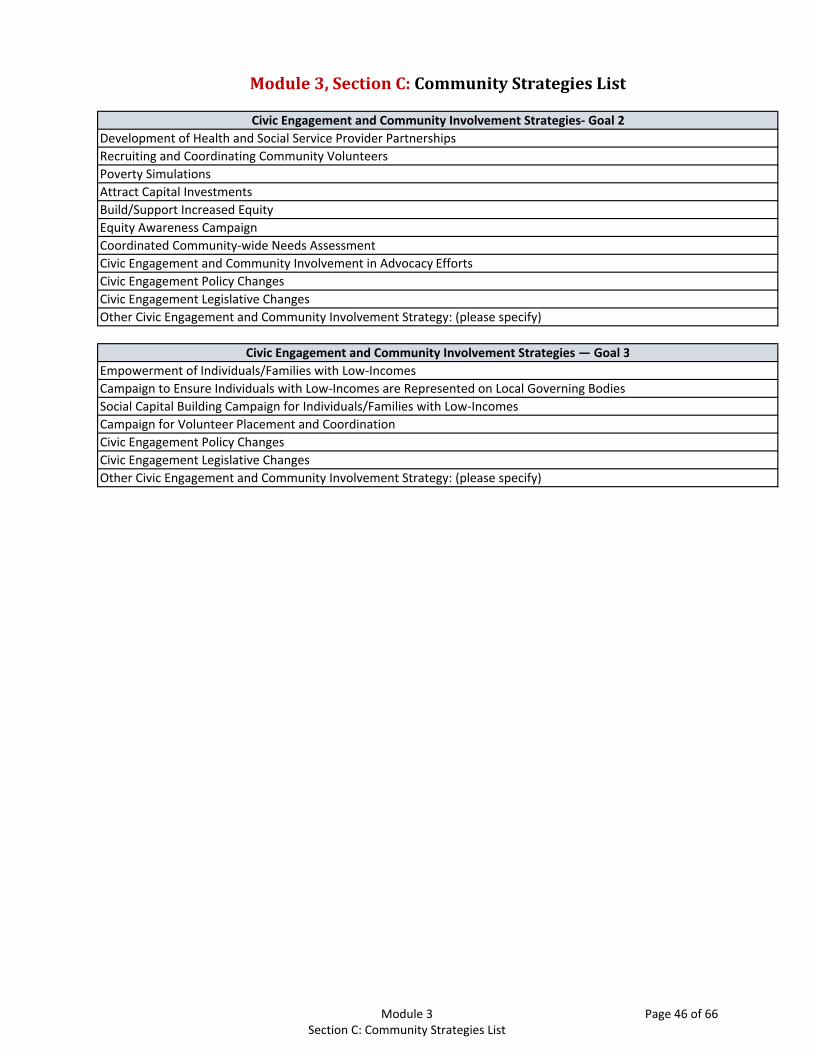
Module3,SectionC:CommunityStrategiesList
Civic Engagement and Community Involvement Strategies‐ Goal 2
Development of Health and Social Service Provider Partnerships Recruiting and Coordinating Community VolunteersPoverty SimulationsAttract Capital InvestmentsBuild/Support Increased Equity Equity Awareness Campaign Coordinated Community‐wide Needs AssessmentCivic Engagement and Community Involvement in Advocacy EffortsCivic Engagement Policy Changes Civic Engagement Legislative Changes Other Civic Engagement and Community Involvement Strategy: (please specify)
Civic Engagement and Community Involvement Strategies — Goal 3
Empowerment of Individuals/Families with Low‐Incomes Campaign to Ensure Individuals with Low‐Incomes are Represented on Local Governing Bodies Social Capital Building Campaign for Individuals/Families with Low‐IncomesCampaign for Volunteer Placement and Coordination Civic Engagement Policy Changes Civic Engagement Legislative Changes Other Civic Engagement and Community Involvement Strategy: (please specify)
Module 3 Section C: Community Strategies List
Page 46 of 66
Module 4
Individual and Family Level
Page 47 of 66

InstructionalNotes
Module4‐IndividualandFamilyLevel
http://www.consumerfinance.gov/reports/financial‐well‐being‐scale/
Income and Asset Building Domain
NPI 1 and 2: CSBG Eligible Entities are only expected to report on basic needs indicators as applicable to the CSBG Eligible Entity's programs. When reporting on indicators related to basics needs, CSBG Eligible Entities can provide their own definition or select from national or locally‐defined models. Please idenitfy the basic needs definition used in the General Comments Section.
For All Individual and Family Domains:
Employment, Income and Asset Building, and Housing Domains
Employment Domain
Domain Specific Instructions:
Column I: Number of Participants Served
Column II: Target (number planned to achieve an outcome in the reporting period)
Column III: Actual Results (actual number of participants who achieved the outcome)
Please note, it is rare that 100% of the people served will achieve the proposed outcome.
NPI 8: This indicator requires agencies to keep an unduplicated count of people who report improved financial well‐being based on responses to the CFPB Financial Well Being Scale (found in the link below)
Module4,SectionA:IndividualandFamilyNationalPerformanceIndicators(NPIs)‐DataEntryForm
Indicators tracking outcomes for 90 or 180 days: CSBG Eligible Entities are only expected to report on indicators with retention time frames for programs that specifically include follow up. If the CSBG Eligible Entity does not conduct follow up activities as a part of their programs, outcomes for indicators with retention time frames will not be reported.
NPI 5‐7: When reporting on indicators related to living wage, CSBG Eligible Entities can provide their own definition or select from national or locally‐defined models. Please idenitfy the living wage definition used in the General Comments Section.
Targeting: Targets are set in the Community Action Plan and are identified through the planning phase of the CAA’s ROMA (Results Oriented Management and Accountability) cycle. The following will be repotred for every indicator:
All Individual and Family NPIs are optional there is a category for "Other Outcome Indicator". CSBG Eligible Entities will only report an "Other Outcome Indicator" if the current NPIs do not capture the outcomes the CSBG Eligible Entity is trying to achieve. Sample language is provided in the “Other Outcome Indicator” data entry section and will be modified by the CSBG Eligible Entity as necessary.
Please see additional notes below:
Module 4 Instructional Notes
Page 48 of 66

InstructionalNotes
Module4‐IndividualandFamilyLevel
CSBG Eligible Entities will report unduplicated counts of individuals receiving any of the services listed on the Individual and Family Services form. This standardized Individual and Family Services list will aid in analysis of the relationship between people, services, and outcomes.
Outcomes Across Multiple Domains:
We recognize that CSBG Eligible Entities have multiple data systems and may not be able to have an unduplicated count across several systems. If you are unable to collect any characteristics on unduplicated individuals or households due to data systems issues, include those individuals in row E and households in row F at the end of this report. Additionally, please indicate the programs in which these individuals and households were enrolled. The system will allow mutliple programs to be added.
Module4,SectionC:AllCharacteristicsReport‐DataEntryForm
Module4,SectionB:IndividualandFamilyServices‐DataEntryForm
The data from this indicator will help tell the story of how many lives were improved because of the CSBG Network. Reporting on this indicator requires CSBG Eligible Entities to keep an unduplicated count of individuals who achieved one or more outcomes reported in the NPIs.
The All Characteristics Report collects data on all individuals and households, whether or not funded directly by CSBG. This demographic information will strengthen the CSBG Annual Report by demonstrating who is being served by CSBG Eligible Entities.
To obtain unduplicated counts, a CSBG Eligible Entity will need to have a system that distinguishes the characteristics for each individual/household. While some individuals and households may be served by several programs within a reporting year and entered into multiple data systems (e.g. LIHEAP, WIC, etc.), they must be reported as unduplicated individuals (in row A) and unduplicated households (in row B) in this report. Please note, a single person is reported as an unduplicated individual and an unduplicated household.
Module 4 Instructional Notes
Page 49 of 66

Name of CSBG Eligible Entity Reporting:
Employment
I.) Number of
Participants
Served in program(s) (#)
II.) Target (#) III.) Actual
Results (#)
IV.) Percentage
Achieving
Outcome [III/ I = IV ] (%
auto calculated)
V.) Performance
Target Accuracy (III/II = V] (% auto
calculated)
1. The number of unemployed youth who obtained employment to gain skills or income.
#DIV/0! #DIV/0!
2. The number of unemployed adults who obtained employment (up to a living wage).
#DIV/0! #DIV/0!
3. The number of unemployed adults who obtained and maintained employment for at least 90 days (up to a living wage).
#DIV/0! #DIV/0!
4. The number of unemployed adults who obtained and maintained employment for at least 180 days (up to a living wage).
#DIV/0! #DIV/0!
5. The number of unemployed adults who obtained employment (with a living wage or higher).
#DIV/0! #DIV/0!
6. The number of unemployed adults who obtained and maintained employment for at least 90 days (with a living wage or higher).
#DIV/0! #DIV/0!
7. The number of unemployed adults who obtained and maintained employment for at least 180 days (with a living wage or higher).
#DIV/0! #DIV/0!
Employment
I.) Number of
Participants
Served in program(s) (#)
II.) Target (#) III.) Actual
Results (#)
IV.) Percentage
Achieving
Outcome [III/ I = IV ] (%
auto calculated)
V.) Performance
Target Accuracy (III/II = V] (% auto
calculated)
8. The number of employed participants in a career‐advancement related program who entered or transitioned into a position that provided increased income and/or benefits.
#DIV/0! #DIV/0!
a. Of the above, the number of employed participants who Increased income from employment through wage or salary amount increase.
#DIV/0! #DIV/0!
b. Of the above, the number of employed participants who increased income from employment through hours worked increase.
#VALUE! #DIV/0!
c. Of the above, the number of employed participants who increased benefits related to employment.
#DIV/0! #DIV/0!
Other Employment Outcome Indicator
I.) Number of
Participants
Served in program(s) (#)
II.) Target (#) III.) Actual
Results (#)
IV.) Percentage
Achieving
Outcome [III/ I = IV ] (%
auto calculated)
V.) Performance
Target Accuracy (III/II = V] (% auto
calculated)
9. The number of individuals or households ______________.
#DIV/0! #DIV/0!
Comments:
Module4,SectionA:IndividualandFamilyNationalPerformanceIndicators(NPIs)‐DataEntryFormGoal1:IndividualsandFamilieswithlowincomesarestableandachieveeconomicsecurity.
EmploymentIndicators
Module 4 Section A: Individual and Family NPIs - Employment
Page 50 of 66
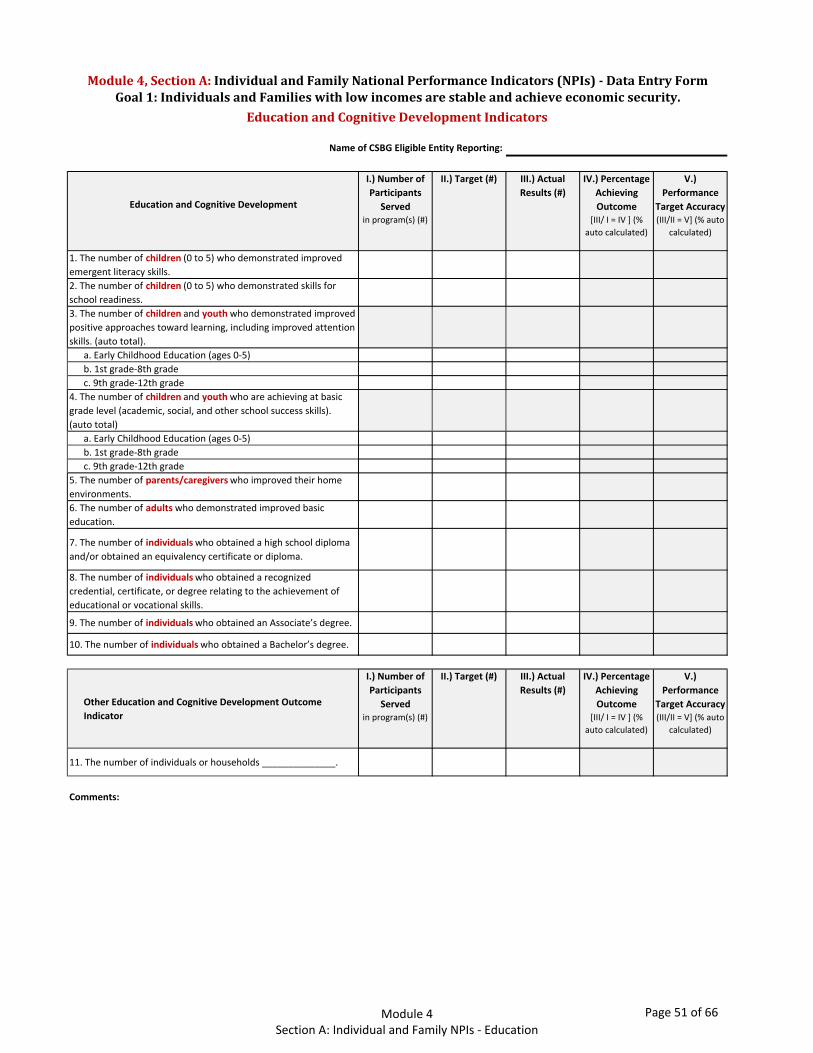
Name of CSBG Eligible Entity Reporting:
Education and Cognitive Development
I.) Number of
Participants
Served in program(s) (#)
II.) Target (#) III.) Actual
Results (#)
IV.) Percentage
Achieving
Outcome [III/ I = IV ] (%
auto calculated)
V.)
Performance
Target Accuracy (III/II = V] (% auto
calculated)
1. The number of children (0 to 5) who demonstrated improved emergent literacy skills.
#DIV/0! #DIV/0!
2. The number of children (0 to 5) who demonstrated skills for school readiness.
#DIV/0! #DIV/0!
3. The number of children and youth who demonstrated improved positive approaches toward learning, including improved attention skills. (auto total).
0 0 0 #DIV/0! #DIV/0!
a. Early Childhood Education (ages 0‐5) #DIV/0! #DIV/0!b. 1st grade‐8th grade #DIV/0! #DIV/0!c. 9th grade‐12th grade #DIV/0! #DIV/0!
4. The number of children and youth who are achieving at basic grade level (academic, social, and other school success skills). (auto total)
0 0 0 #DIV/0! #DIV/0!
a. Early Childhood Education (ages 0‐5) #DIV/0! #DIV/0!b. 1st grade‐8th grade #DIV/0! #DIV/0!c. 9th grade‐12th grade #DIV/0! #DIV/0!
5. The number of parents/caregivers who improved their home environments.
#DIV/0! #DIV/0!
6. The number of adults who demonstrated improved basic education.
#DIV/0! #DIV/0!
7. The number of individuals who obtained a high school diploma and/or obtained an equivalency certificate or diploma.
#DIV/0! #DIV/0!
8. The number of individuals who obtained a recognized credential, certificate, or degree relating to the achievement of educational or vocational skills.
#DIV/0! #DIV/0!
9. The number of individuals who obtained an Associate’s degree. #DIV/0! #DIV/0!
10. The number of individuals who obtained a Bachelor’s degree. #DIV/0! #DIV/0!
Other Education and Cognitive Development Outcome
Indicator
I.) Number of
Participants
Served in program(s) (#)
II.) Target (#) III.) Actual
Results (#)
IV.) Percentage
Achieving
Outcome [III/ I = IV ] (%
auto calculated)
V.)
Performance
Target Accuracy (III/II = V] (% auto
calculated)
11. The number of individuals or households ______________. #DIV/0! #DIV/0!
Comments:
Goal1:IndividualsandFamilieswithlowincomesarestableandachieveeconomicsecurity.
EducationandCognitiveDevelopmentIndicators
Module4,SectionA:IndividualandFamilyNationalPerformanceIndicators(NPIs)‐DataEntryForm
Module 4 Section A: Individual and Family NPIs - Education
Page 51 of 66

Name of CSBG Eligible Entity Reporting:
Income and Asset Building
I.) Number of
Participants
Served in program(s) (#)
II.) Target (#) III.) Actual
Results (#)
IV.) Percentage
Achieving
Outcome [III/ I = IV ] (%
auto calculated)
V.) Performance
Target Accuracy (III/II = V] (% auto
calculated)
1. The number of individuals who achieved and maintained capacity to meet basic needs for 90 days.
#DIV/0! #DIV/0!
2. The number of individuals who achieved and maintained capacity to meet basic needs for 180 days.
#DIV/0! #DIV/0!
3. The number of individuals who opened a savings account or IDA.
#DIV/0! #DIV/0!
4. The number of individuals who increased their savings. #DIV/0! #DIV/0!
5. The number of individuals who used their savings to purchase an asset.
#DIV/0! #DIV/0!
a. Of the above, the number of individuals who purchased a home.
#DIV/0! #DIV/0!
6. The number of individuals who improved their credit
scores. #DIV/0! #DIV/0!
7. The number of individuals who increased their net worth.
#DIV/0! #DIV/0!
8. The number of individuals engaged with the Community Action Agency who report improved financial well‐being.
#DIV/0! #DIV/0!
Other Income and Asset Building Outcome Indicator
I.) Number of
Participants
Served in program(s) (#)
II.) Target (#) III.) Actual
Results (#)
IV.) Percentage
Achieving
Outcome [III/ I = IV ] (%
auto calculated)
V.) Performance
Target Accuracy (III/II = V] (% auto
calculated)
9. The number of individuals or households ______________.
#DIV/0! #DIV/0!
Comments:
Module4,SectionA:IndividualandFamilyNationalPerformanceIndicators(NPIs)‐DataEntryForm
IncomeandAssetBuildingIndicatorsGoal1:IndividualsandFamilieswithlowincomesarestableandachieveeconomicsecurity.
Module 4 Section A: Individual and Family NPIs - Income and Assets
Page 52 of 66
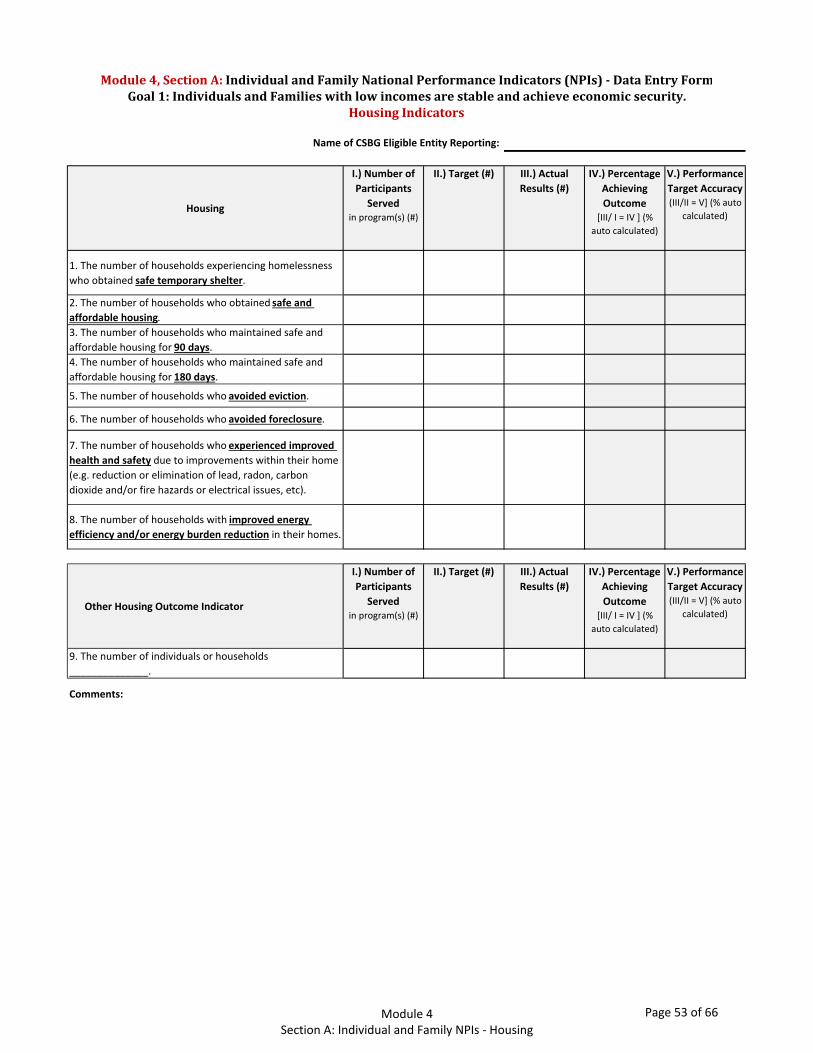
Name of CSBG Eligible Entity Reporting:
Housing
I.) Number of
Participants
Served in program(s) (#)
II.) Target (#) III.) Actual
Results (#)
IV.) Percentage
Achieving
Outcome [III/ I = IV ] (%
auto calculated)
V.) Performance
Target Accuracy (III/II = V] (% auto
calculated)
1. The number of households experiencing homelessness who obtained safe temporary shelter.
#DIV/0! #DIV/0!
2. The number of households who obtained safe and affordable housing.
#DIV/0! #DIV/0!
3. The number of households who maintained safe and affordable housing for 90 days.
#DIV/0! #DIV/0!
4. The number of households who maintained safe and affordable housing for 180 days.
#DIV/0! #DIV/0!
5. The number of households who avoided eviction. #DIV/0! #DIV/0!
6. The number of households who avoided foreclosure. #DIV/0! #DIV/0!
7. The number of households who experienced improved
health and safety due to improvements within their home (e.g. reduction or elimination of lead, radon, carbon dioxide and/or fire hazards or electrical issues, etc).
#DIV/0! #DIV/0!
8. The number of households with improved energy
efficiency and/or energy burden reduction in their homes.#DIV/0! #DIV/0!
Other Housing Outcome Indicator
I.) Number of
Participants
Served in program(s) (#)
II.) Target (#) III.) Actual
Results (#)
IV.) Percentage
Achieving
Outcome [III/ I = IV ] (%
auto calculated)
V.) Performance
Target Accuracy (III/II = V] (% auto
calculated)
9. The number of individuals or households ______________.
#DIV/0! #DIV/0!
Comments:
Module4,SectionA:IndividualandFamilyNationalPerformanceIndicators(NPIs)‐DataEntryFormGoal1:IndividualsandFamilieswithlowincomesarestableandachieveeconomicsecurity.
HousingIndicators
Module 4 Section A: Individual and Family NPIs - Housing
Page 53 of 66

Name of CSBG Eligible Entity Reporting:
Health and Social/Behavioral Development
I.) Number of
Participants
Served in program(s) (#)
II.) Target (#) III.) Actual
Results (#)
IV.) Percentage
Achieving
Outcome [III/ I = IV ] (%
auto calculated)
V.) Performance
Target Accuracy (III/II = V] (% auto
calculated)
1. The number of individuals who demonstrated increased nutrition skills (e.g. cooking, shopping, and growing food).
#DIV/0! #DIV/0!
2. The number of individuals who demonstrated improved
physical health and well‐being.#DIV/0! #DIV/0!
3. The number of individuals who demonstrated improved
mental and behavioral health and well‐being. #DIV/0! #DIV/0!
4. The number of individuals who improved skills related to the adult role of parents/ caregivers.
#DIV/0! #DIV/0!
5. The number of parents/caregivers who demonstrated
increased sensitivity and responsiveness in their interactions with their children.
#DIV/0! #DIV/0!
6. The number of seniors (65+) who maintained an independent living situation.
#DIV/0! #DIV/0!
7. The number of individuals with disabilities who maintained an independent living situation.
#DIV/0! #DIV/0!
8. The number of individuals with chronic illness who maintained an independent living situation.
#DIV/0! #DIV/0!
9. The number of individuals with no recidivating event for six months.
0 0 0 #DIV/0! #DIV/0!
a. Youth (ages 14‐17) #DIV/0! #DIV/0!b. Adults (ages 18+) #DIV/0! #DIV/0!
Other Health and Social/Behavioral Development
Outcome Indicator
I.) Number of
Participants
Served in program(s) (#)
II.) Target (#) III.) Actual
Results (#)
IV.) Percentage
Achieving
Outcome [III/ I = IV ] (%
auto calculated)
V.) Performance
Target Accuracy (III/II = V] (% auto
calculated)
10. The number of individuals or households ______________.
#DIV/0! #DIV/0!
Comments:
Module4,SectionA:IndividualandFamilyNationalPerformanceIndicators(NPIs)‐DataEntryFormGoal1:IndividualsandFamilieswithlowincomesarestableandachieveeconomicsecurity.
HealthandSocial/BehavioralDevelopmentIndicators
Module 4 Section A: Individual and Family NPIs - Health and Social/Behavioral
Page 54 of 66
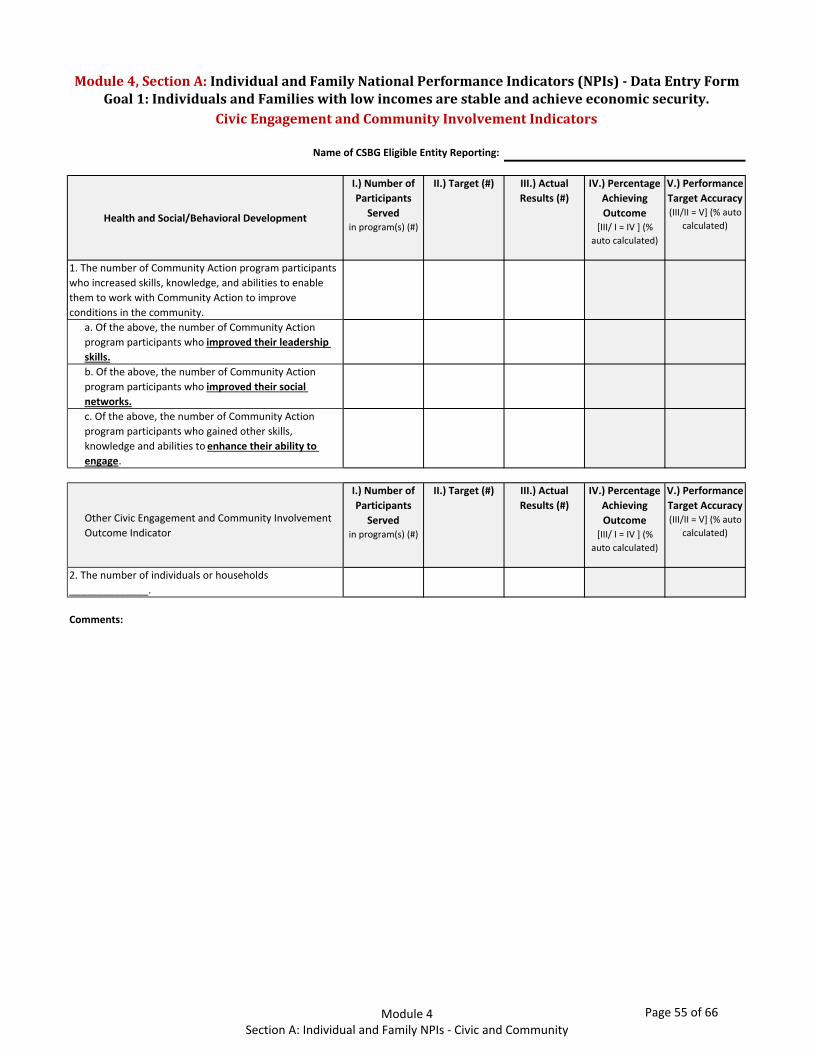
Name of CSBG Eligible Entity Reporting:
Health and Social/Behavioral Development
I.) Number of
Participants
Served in program(s) (#)
II.) Target (#) III.) Actual
Results (#)
IV.) Percentage
Achieving
Outcome [III/ I = IV ] (%
auto calculated)
V.) Performance
Target Accuracy (III/II = V] (% auto
calculated)
1. The number of Community Action program participants who increased skills, knowledge, and abilities to enable them to work with Community Action to improve conditions in the community.
#DIV/0! #DIV/0!
a. Of the above, the number of Community Action program participants who improved their leadership
skills.
#DIV/0! #DIV/0!
b. Of the above, the number of Community Action program participants who improved their social
networks.
#DIV/0! #DIV/0!
c. Of the above, the number of Community Action program participants who gained other skills, knowledge and abilities to enhance their ability to engage.
#DIV/0! #DIV/0!
Other Civic Engagement and Community Involvement Outcome Indicator
I.) Number of
Participants
Served in program(s) (#)
II.) Target (#) III.) Actual
Results (#)
IV.) Percentage
Achieving
Outcome [III/ I = IV ] (%
auto calculated)
V.) Performance
Target Accuracy (III/II = V] (% auto
calculated)
2. The number of individuals or households ______________.
#DIV/0! #DIV/0!
Comments:
Module4,SectionA:IndividualandFamilyNationalPerformanceIndicators(NPIs)‐DataEntryFormGoal1:IndividualsandFamilieswithlowincomesarestableandachieveeconomicsecurity.
CivicEngagementandCommunityInvolvementIndicators
Module 4 Section A: Individual and Family NPIs - Civic and Community
Page 55 of 66
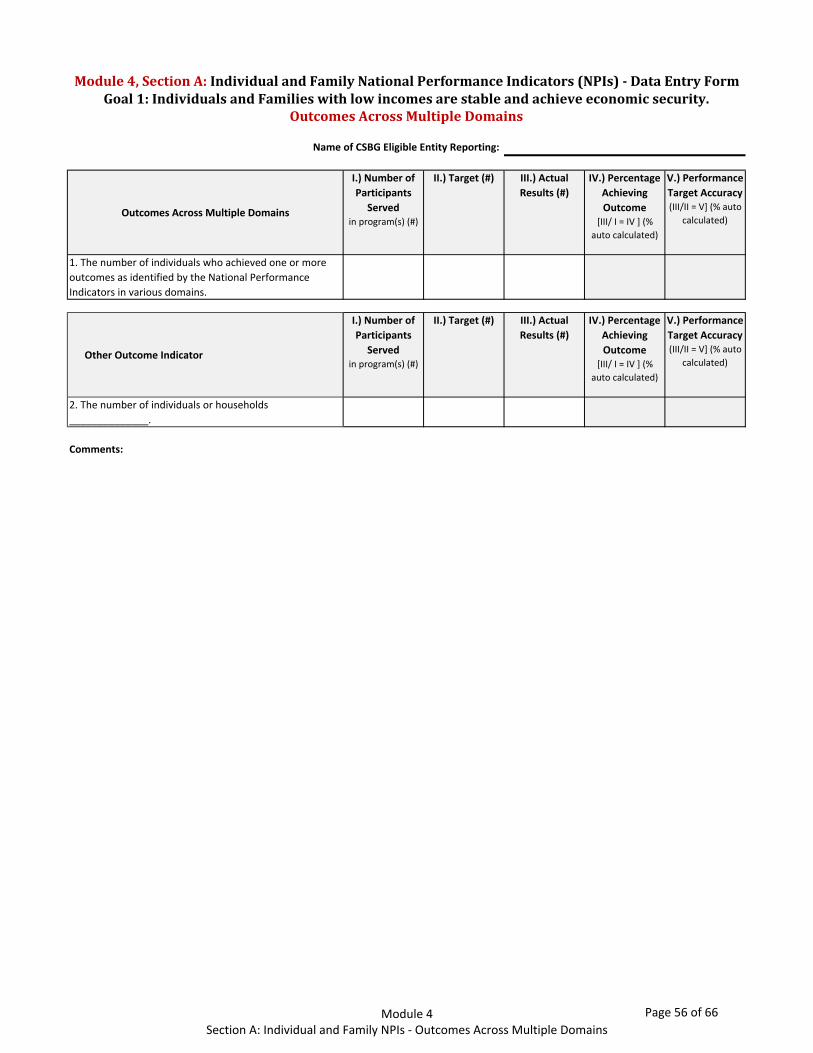
Name of CSBG Eligible Entity Reporting:
Outcomes Across Multiple Domains
I.) Number of
Participants
Served in program(s) (#)
II.) Target (#) III.) Actual
Results (#)
IV.) Percentage
Achieving
Outcome [III/ I = IV ] (%
auto calculated)
V.) Performance
Target Accuracy (III/II = V] (% auto
calculated)
1. The number of individuals who achieved one or more outcomes as identified by the National Performance Indicators in various domains.
#DIV/0! #DIV/0!
Other Outcome Indicator
I.) Number of
Participants
Served in program(s) (#)
II.) Target (#) III.) Actual
Results (#)
IV.) Percentage
Achieving
Outcome [III/ I = IV ] (%
auto calculated)
V.) Performance
Target Accuracy (III/II = V] (% auto
calculated)
2. The number of individuals or households ______________.
#DIV/0! #DIV/0!
Comments:
Module4,SectionA:IndividualandFamilyNationalPerformanceIndicators(NPIs)‐DataEntryFormGoal1:IndividualsandFamilieswithlowincomesarestableandachieveeconomicsecurity.
OutcomesAcrossMultipleDomains
Module 4 Section A: Individual and Family NPIs - Outcomes Across Multiple Domains
Page 56 of 66
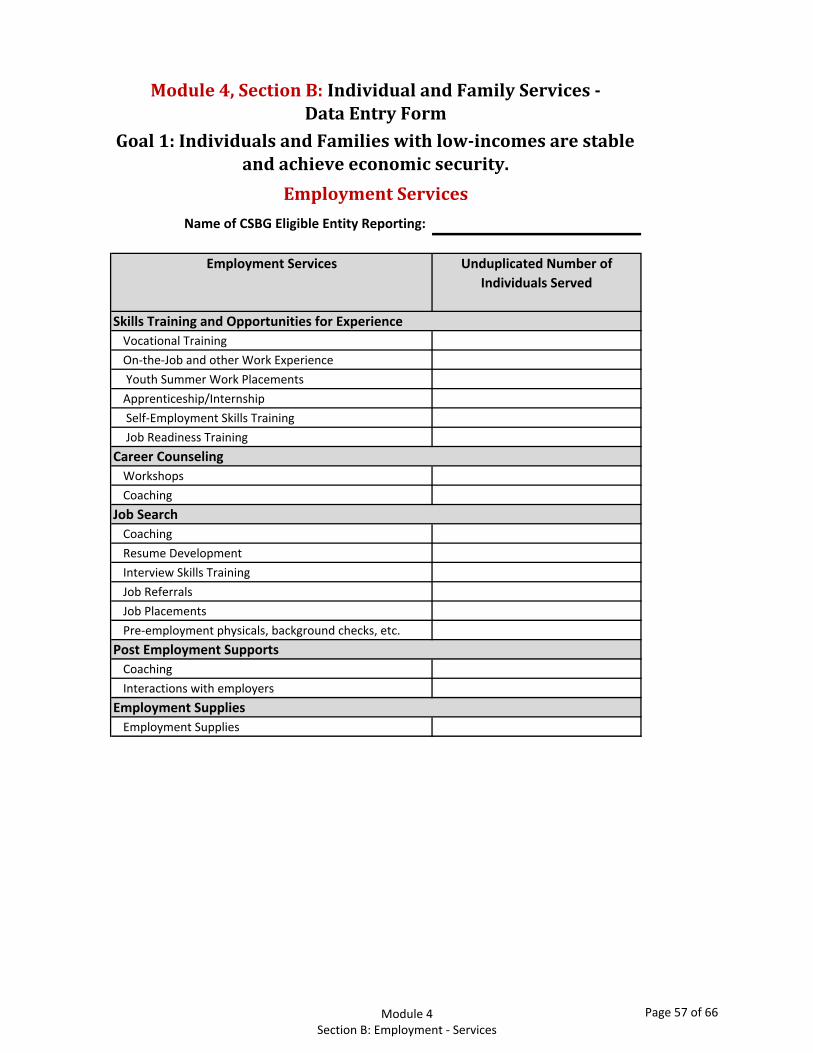
Name of CSBG Eligible Entity Reporting:
Employment Services Unduplicated Number of
Individuals Served
Vocational Training On‐the‐Job and other Work Experience Youth Summer Work PlacementsApprenticeship/Internship Self‐Employment Skills Training Job Readiness Training
WorkshopsCoaching
Coaching Resume Development Interview Skills Training Job ReferralsJob PlacementsPre‐employment physicals, background checks, etc.
Coaching Interactions with employers
Employment Supplies
Module4,SectionB:IndividualandFamilyServices‐DataEntryForm
Career Counseling
Job Search
Post Employment Supports
Employment Supplies
Skills Training and Opportunities for Experience
Goal1:IndividualsandFamilieswithlow‐incomesarestableandachieveeconomicsecurity.
EmploymentServices
Module 4 Section B: Employment - Services
Page 57 of 66
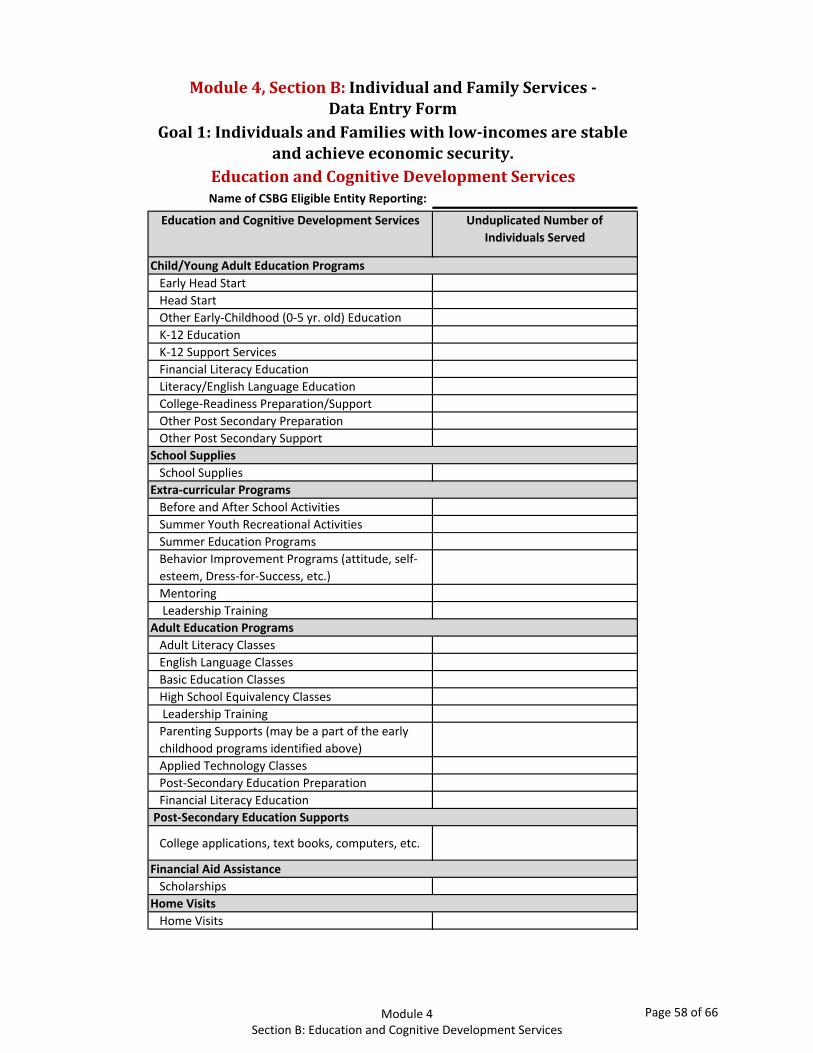
Name of CSBG Eligible Entity Reporting:
Education and Cognitive Development Services Unduplicated Number of
Individuals Served
Early Head Start Head StartOther Early‐Childhood (0‐5 yr. old) Education K‐12 Education K‐12 Support ServicesFinancial Literacy EducationLiteracy/English Language EducationCollege‐Readiness Preparation/Support Other Post Secondary PreparationOther Post Secondary Support
School Supplies
Before and After School ActivitiesSummer Youth Recreational ActivitiesSummer Education ProgramsBehavior Improvement Programs (attitude, self‐esteem, Dress‐for‐Success, etc.)Mentoring Leadership Training
Adult Literacy ClassesEnglish Language ClassesBasic Education Classes High School Equivalency Classes Leadership TrainingParenting Supports (may be a part of the early childhood programs identified above)Applied Technology ClassesPost‐Secondary Education PreparationFinancial Literacy Education
College applications, text books, computers, etc.
Scholarships
Home Visits
Child/Young Adult Education Programs
Module4,SectionB:IndividualandFamilyServices‐DataEntryForm
Goal1:IndividualsandFamilieswithlow‐incomesarestableandachieveeconomicsecurity.
EducationandCognitiveDevelopmentServices
Home Visits
School Supplies
Extra‐curricular Programs
Adult Education Programs
Post‐Secondary Education Supports
Financial Aid Assistance
Module 4 Section B: Education and Cognitive Development Services
Page 58 of 66

Name of CSBG Eligible Entity Reporting:
Income and Asset Building Services Unduplicated Number of
Individuals Served
Financial Capability Skills TrainingFinancial Coaching/Counseling
Financial Management Programs (including budgeting, credit management, credit repair, credit counseling, etc.)
First‐time Homebuyer CounselingForeclosure Prevention CounselingSmall Business Start‐Up and Development Counseling Sessions/Classes
Child Support PaymentsHealth InsuranceSocial Security/SSI PaymentsVeteran's BenefitsTANF BenefitsSNAP Benefits
Saving Accounts/IDAs and other asset building accounts
Other financial products (IRA accounts, MyRA, other retirement accounts, etc.)VITA, EITC, or Other Tax Preparation programs
Micro‐loansBusiness incubator/business development loans
Benefit Coordination and Advocacy
Asset Building
Loans And Grants
Training and Counseling Services
Module4,SectionB:IndividualandFamilyServices‐DataEntryForm
Goal1:IndividualsandFamilieswithlowincomesarestableandachieveeconomicsecurity.
IncomeandAssetBuildingServices
Module 4 Section B: Income and Asset Building Services
Page 59 of 66
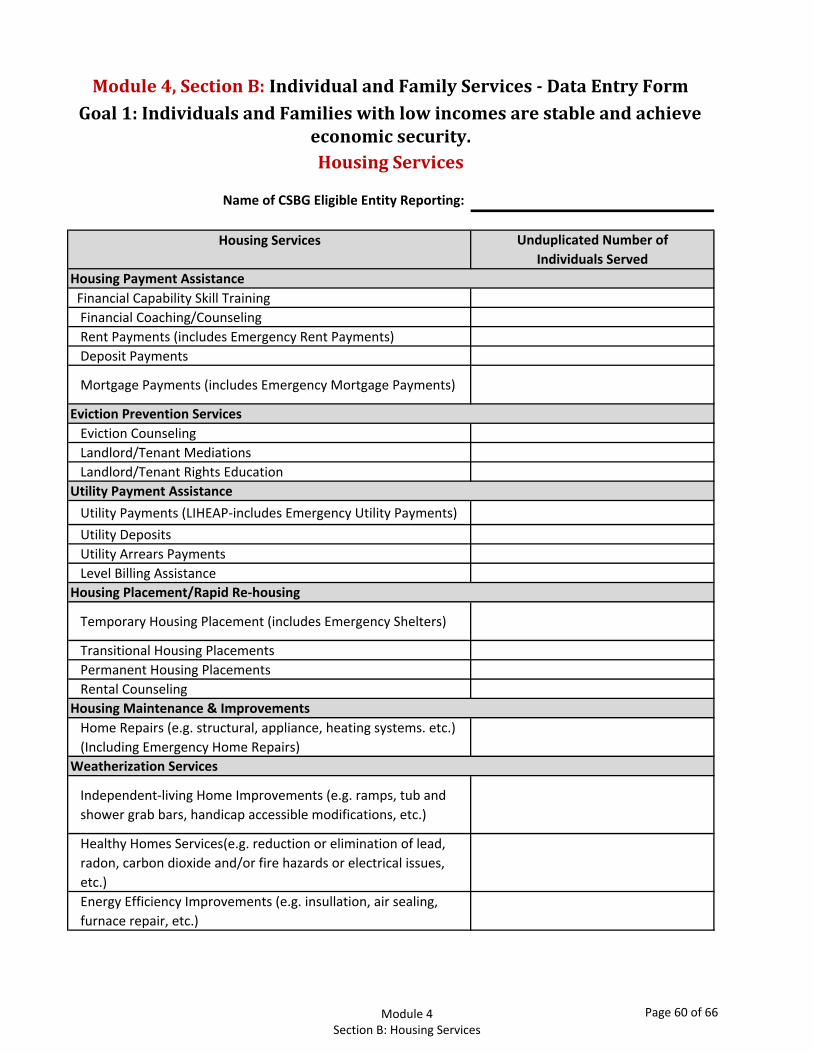
Name of CSBG Eligible Entity Reporting:
Housing Services Unduplicated Number of
Individuals Served
Financial Capability Skill Training Financial Coaching/Counseling Rent Payments (includes Emergency Rent Payments)Deposit Payments
Mortgage Payments (includes Emergency Mortgage Payments)
Eviction Counseling Landlord/Tenant MediationsLandlord/Tenant Rights Education
Utility Payments (LIHEAP‐includes Emergency Utility Payments)Utility DepositsUtility Arrears PaymentsLevel Billing Assistance
Temporary Housing Placement (includes Emergency Shelters)
Transitional Housing PlacementsPermanent Housing Placements Rental Counseling
Home Repairs (e.g. structural, appliance, heating systems. etc.) (Including Emergency Home Repairs)
Independent‐living Home Improvements (e.g. ramps, tub and shower grab bars, handicap accessible modifications, etc.)
Healthy Homes Services(e.g. reduction or elimination of lead, radon, carbon dioxide and/or fire hazards or electrical issues, etc.)Energy Efficiency Improvements (e.g. insullation, air sealing, furnace repair, etc.)
Housing Placement/Rapid Re‐housing
Housing Maintenance & Improvements
Weatherization Services
Housing Payment Assistance
Module4,SectionB:IndividualandFamilyServices‐DataEntryFormGoal1:IndividualsandFamilieswithlowincomesarestableandachieve
economicsecurity.HousingServices
Eviction Prevention Services
Utility Payment Assistance
Module 4 Section B: Housing Services
Page 60 of 66
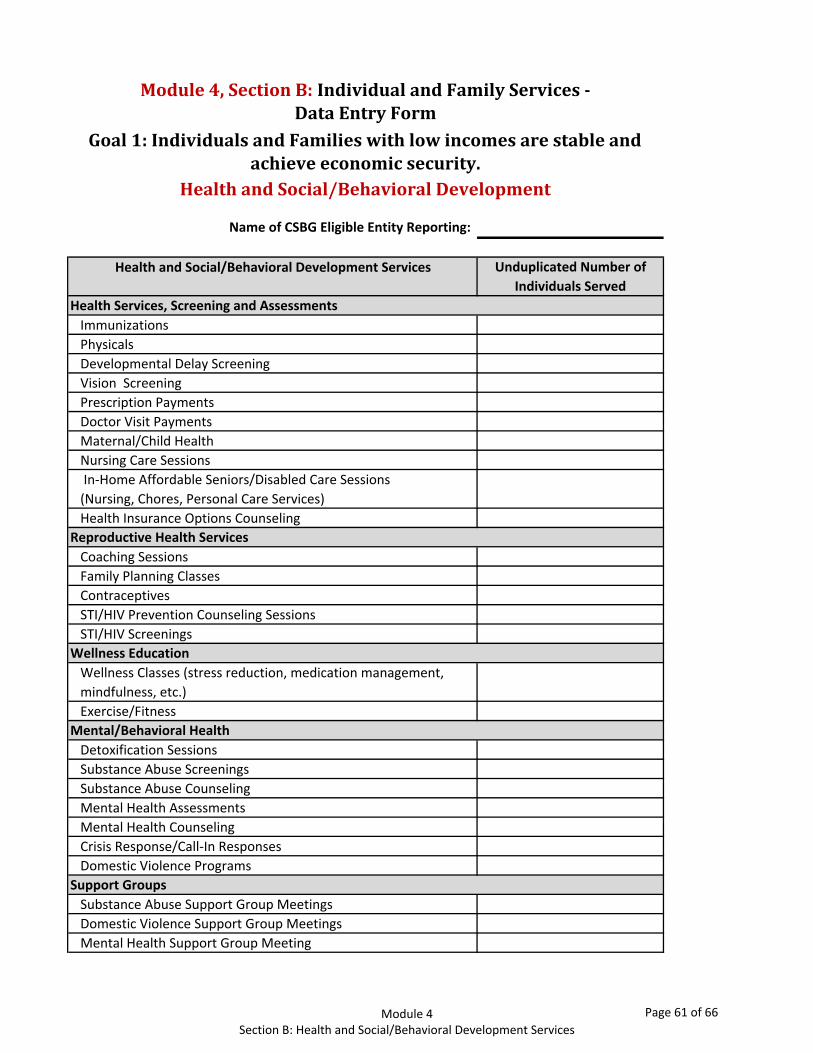
Name of CSBG Eligible Entity Reporting:
Health and Social/Behavioral Development Services Unduplicated Number of
Individuals Served
ImmunizationsPhysicalsDevelopmental Delay ScreeningVision ScreeningPrescription PaymentsDoctor Visit PaymentsMaternal/Child HealthNursing Care Sessions In‐Home Affordable Seniors/Disabled Care Sessions(Nursing, Chores, Personal Care Services) Health Insurance Options Counseling
Coaching SessionsFamily Planning ClassesContraceptivesSTI/HIV Prevention Counseling SessionsSTI/HIV Screenings
Wellness Classes (stress reduction, medication management, mindfulness, etc.)Exercise/Fitness
Detoxification SessionsSubstance Abuse ScreeningsSubstance Abuse Counseling Mental Health AssessmentsMental Health Counseling Crisis Response/Call‐In ResponsesDomestic Violence Programs
Substance Abuse Support Group MeetingsDomestic Violence Support Group MeetingsMental Health Support Group Meeting
Reproductive Health Services
Wellness Education
Mental/Behavioral Health
Support Groups
Health Services, Screening and Assessments
Module4,SectionB:IndividualandFamilyServices‐DataEntryForm
Goal1:IndividualsandFamilieswithlowincomesarestableandachieveeconomicsecurity.
HealthandSocial/BehavioralDevelopment
Module 4 Section B: Health and Social/Behavioral Development Services
Page 61 of 66
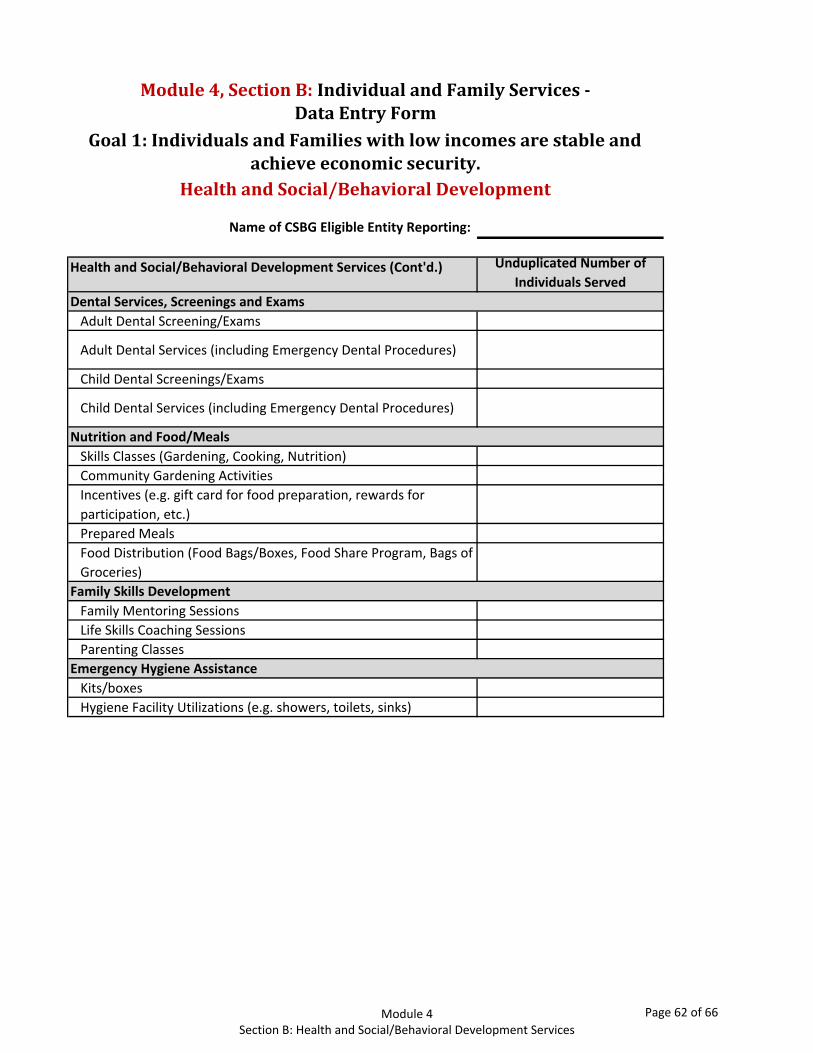
Name of CSBG Eligible Entity Reporting:
Module4,SectionB:IndividualandFamilyServices‐DataEntryForm
Goal1:IndividualsandFamilieswithlowincomesarestableandachieveeconomicsecurity.
HealthandSocial/BehavioralDevelopment
Health and Social/Behavioral Development Services (Cont'd.) Unduplicated Number of
Individuals Served
Adult Dental Screening/Exams
Adult Dental Services (including Emergency Dental Procedures)
Child Dental Screenings/Exams
Child Dental Services (including Emergency Dental Procedures)
Skills Classes (Gardening, Cooking, Nutrition)Community Gardening ActivitiesIncentives (e.g. gift card for food preparation, rewards for participation, etc.)Prepared MealsFood Distribution (Food Bags/Boxes, Food Share Program, Bags of Groceries)
Family Mentoring SessionsLife Skills Coaching SessionsParenting Classes
Kits/boxesHygiene Facility Utilizations (e.g. showers, toilets, sinks)
Nutrition and Food/Meals
Family Skills Development
Emergency Hygiene Assistance
Dental Services, Screenings and Exams
Module 4 Section B: Health and Social/Behavioral Development Services
Page 62 of 66

Name of CSBG Eligible Entity Reporting:
Services Supporting Multiple Domains
Unduplicated Number of
Individuals Served
Case Management
Eligibility Determinations
Referrals
Transportation Services (e.g. bus passes, bus transport, support for auto purchase or repair; including emergency services)
Child Care subsidiesChild Care payments
Day Centers
Birth Certificate Social Security Card Driver's License
Criminal Record Expungements
Immigration Support Services (relocation, food, clothing)
Legal Assistance
Emergency Clothing Assistance
Mediation/Customer Advocacy Interventions
Re‐Entry Services
Immigration Support Services
Legal Assistance (includes emergency legal assistance)
Emergency Clothing Assistance
Mediation/Customer Advocacy Interventions (debt forgiveness, negotiations or issues with
landlords, coordinating with other services or government)
Referrals
Childcare
Eldercare
Identification Documents
Transportation Services
Goal1:IndividualsandFamilieswithlow‐incomesarestableandachieveeconomicsecurity.
ServicesSupportingMultipleDomains
Module4,SectionB:IndividualandFamilyServices‐DataEntryForm
Case Management
Eligibility Determinations
Module 4 Section B: Services Supporting Multiple Domains
Page 63 of 66
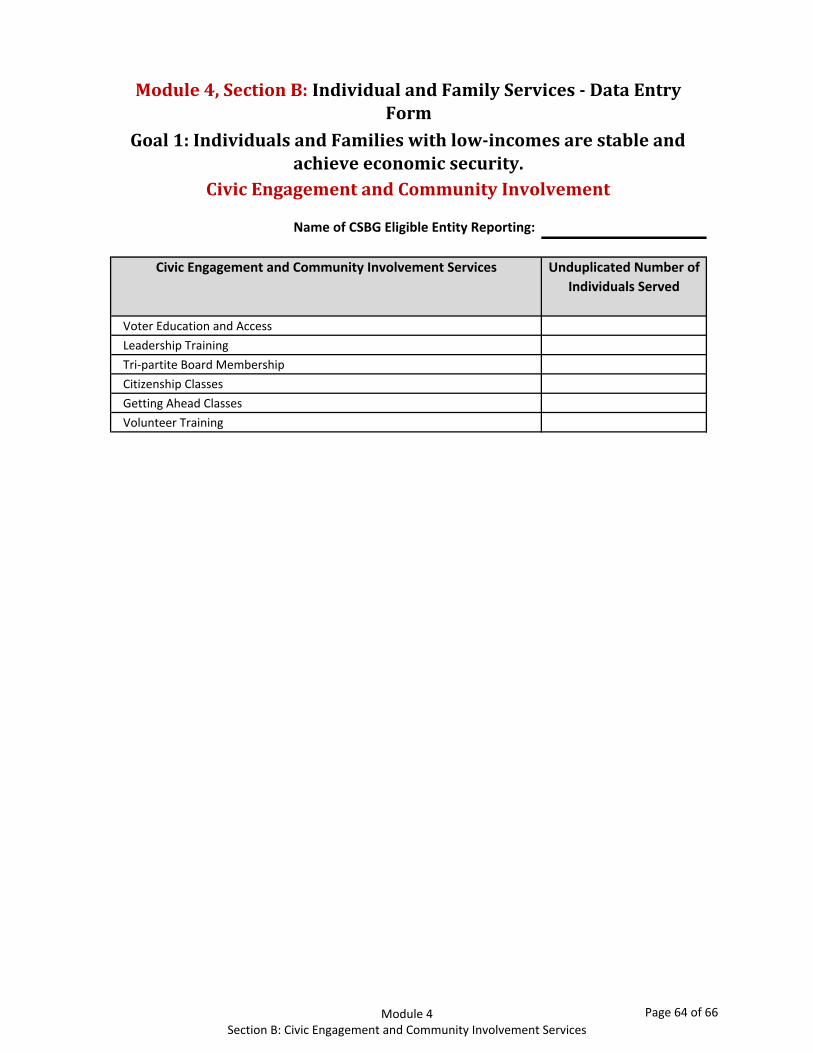
Name of CSBG Eligible Entity Reporting:
Civic Engagement and Community Involvement Services Unduplicated Number of
Individuals Served
Voter Education and AccessLeadership TrainingTri‐partite Board MembershipCitizenship ClassesGetting Ahead ClassesVolunteer Training
Module4,SectionB:IndividualandFamilyServices‐DataEntryForm
Goal1:IndividualsandFamilieswithlow‐incomesarestableandachieveeconomicsecurity.
CivicEngagementandCommunityInvolvement
Module 4 Section B: Civic Engagement and Community Involvement Services
Page 64 of 66

Name of CSBG Eligible Entity Reporting:
A. Total unduplicated number of all INDIVIDUALS about whom one or more characteristics were obtained:
B. Total unduplicated number of all HOUSEHOLDS about whom one or more characteristics were obtained:
C. INDIVIDUAL LEVEL CHARACTERISTICS
1. Gender Number of Individuals 6. Ethnicity/Race Number of Individuals
a. Male I. Ethnicityb. Female a. Hispanic, Latino or Spanish Originsc. Other b. Not Hispanic, Latino or Spanish Originsd. Unknown/not reported c. Unknown/not reported
TOTAL (auto calculated) 0 TOTAL (auto calculated) 0
2. Age Number of Individuals II. Race
a. 0‐5 a. American Indian or Alaska Nativeb. 6‐13 b. Asianc. 14‐17 c. Black or African Americand. 18‐24 d. Native Hawaiian and Other Pacific Islander e. 25‐44 e. Whitef. 45‐54 f. Otherg. 55‐59 g. Multi‐race (two or more of the above)h. 60‐64 h. Unknown/not reportedi. 65‐74 TOTAL (auto calculated) 0
j. 75+k. Unknown/not reported 7. Military Status Number of Individuals
TOTAL (auto calculated) 0 a. Veteranb. Active Military
3. Education Levels Number of Individuals c. Unknown/not reported
[ages 14‐24] [ages 25+] TOTAL (auto calculated) 0
a. Grades 0‐8b. Grades 9‐12/Non‐Graduate 8. Work Status (Individuals 18+) Number of Individuals
c. High School Graduate/ Equivalency Diploma a. Employed Full‐Timed. 12 grade + Some Post‐Secondary b. Employed Part‐Timee. 2 or 4 years College Graduate c. Migrant Seasonal Farm Workerf. Graduate of other post‐secondary school d. Unemployed (Short‐Term, 6 months or less)g. Unknown/not reported e. Unemployed (Long‐Term, more than 6 months)
TOTAL (auto calculated) 0 0 f. Unemployed (Not in Labor Force)g. Retired
4. Disconnected Youth Number of Individuals h. Unknown/not reporteda. Youth ages 14‐24 who are neither working or in school TOTAL (auto calculated) 0
5. Health Number of Individuals
Yes No Unknowna. Disabling Condition
Yes No Unknownb. Health Insurance*
Health Insurance Sources
i. Medicaidii. Medicareiii. State Children’s Health Insurance Programiv. State Health Insurance for Adultsv. Military Health Carevi. Direct‐Purchasevii. Employment Basedviii. Unknown/not reportedTOTAL (auto calculated) 0
Module4,SectionC:AllCharacteristicsReport‐DataEntryFormGoal1:IndividualsandFamilieswithlow‐incomesarestableandachieveeconomicsecurity.
*If an individual reported that they had Health Insurance please identify the source of health insurance below.
Module 4 Section C: All Characteristics Report
Page 65 of 66
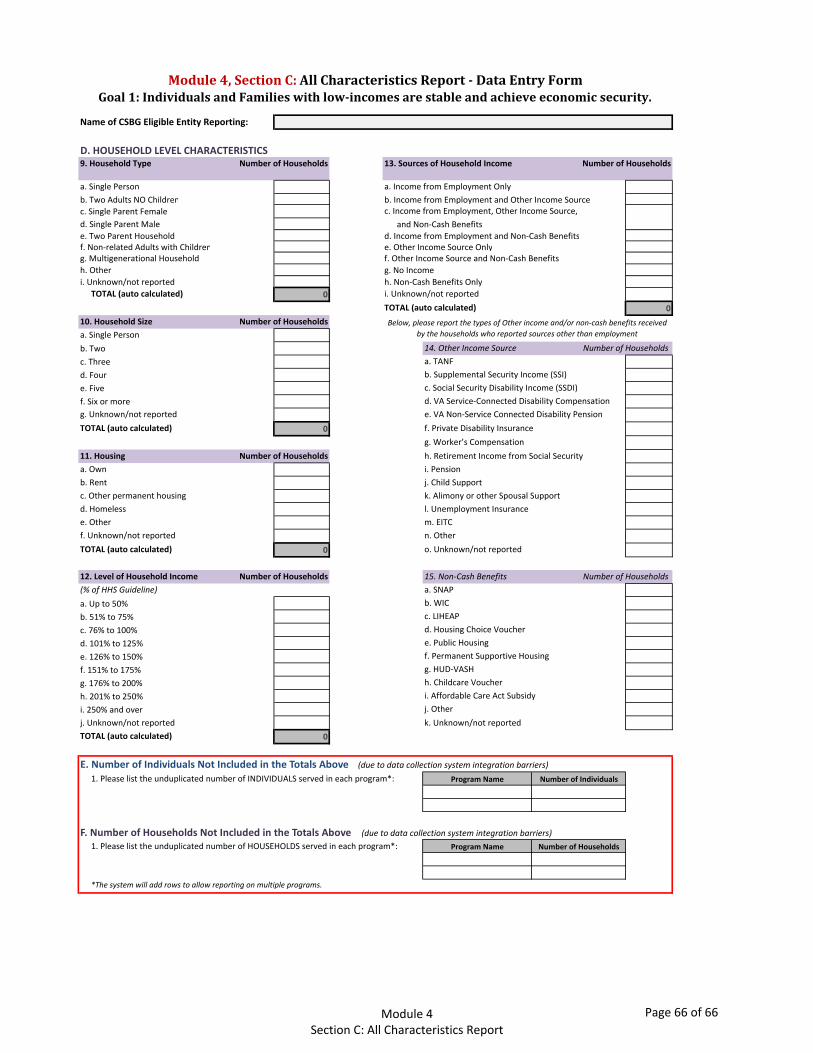
Name of CSBG Eligible Entity Reporting:
Module4,SectionC:AllCharacteristicsReport‐DataEntryFormGoal1:IndividualsandFamilieswithlow‐incomesarestableandachieveeconomicsecurity.
D. HOUSEHOLD LEVEL CHARACTERISTICS9. Household Type Number of Households 13. Sources of Household Income Number of Households
a. Single Person a. Income from Employment Only b. Two Adults NO Children b. Income from Employment and Other Income Source c. Single Parent Female c. Income from Employment, Other Income Source,d. Single Parent Male and Non‐Cash Benefits e. Two Parent Household d. Income from Employment and Non‐Cash Benefitsf. Non‐related Adults with Children e. Other Income Source Onlyg. Multigenerational Household f. Other Income Source and Non‐Cash Benefitsh. Other g. No Incomei. Unknown/not reported h. Non‐Cash Benefits Only
TOTAL (auto calculated) 0 i. Unknown/not reportedTOTAL (auto calculated) 0
10. Household Size Number of Households
a. Single Personb. Two 14. Other Income Source Number of Households
c. Three a. TANFd. Four b. Supplemental Security Income (SSI)e. Five c. Social Security Disability Income (SSDI)f. Six or more d. VA Service‐Connected Disability Compensationg. Unknown/not reported e. VA Non‐Service Connected Disability PensionTOTAL (auto calculated) 0 f. Private Disability Insurance
g. Worker’s Compensation11. Housing Number of Households h. Retirement Income from Social Securitya. Own i. Pensionb. Rent j. Child Supportc. Other permanent housing k. Alimony or other Spousal Supportd. Homeless l. Unemployment Insurancee. Other m. EITCf. Unknown/not reported n. OtherTOTAL (auto calculated) 0 o. Unknown/not reported
12. Level of Household Income Number of Households 15. Non‐Cash Benefits Number of Households
(% of HHS Guideline) a. SNAPa. Up to 50% b. WICb. 51% to 75% c. LIHEAPc. 76% to 100% d. Housing Choice Voucherd. 101% to 125% e. Public Housinge. 126% to 150% f. Permanent Supportive Housingf. 151% to 175% g. HUD‐VASHg. 176% to 200% h. Childcare Voucherh. 201% to 250% i. Affordable Care Act Subsidyi. 250% and over j. Otherj. Unknown/not reported k. Unknown/not reportedTOTAL (auto calculated) 0
E. Number of Individuals Not Included in the Totals Above (due to data collection system integration barriers)
1. Please list the unduplicated number of INDIVIDUALS served in each program*: Number of Individuals
F. Number of Households Not Included in the Totals Above (due to data collection system integration barriers)
1. Please list the unduplicated number of HOUSEHOLDS served in each program*: Number of Households
*The system will add rows to allow reporting on multiple programs.
Below, please report the types of Other income and/or non‐cash benefits received
by the households who reported sources other than employment
Program Name
Program Name
Module 4 Section C: All Characteristics Report
Page 66 of 66


THE PAPERWORK REDUCTION ACT OF 1995 (Pub. L. 104-13)
Public reporting burden for this collection of information is estimated to average 203 hours per response for State CSBG Lead Agencies and 756 hours per response for eligible entities, including the time for reviewing instructions, gathering and maintaining the data needed, and reviewing the collection of information.
An agency may not conduct or sponsor, and a person is not required to respond to, a collection of information unless it displays a currently valid OMB control number. If you have comments concerning the accuracy of the time estimate(s) or suggestions for improving this form, please send to: [email protected]