COMMUNITY REINVESTMENT ACT PERFORMANCE …reportable rates of lending were below the aggregate’s...
35
NEW YORK STATE DEPARTMENT OF FINANCIAL SERVICES FINANCIAL FRAUDS AND CONSUMER PROTECTION DIVISION One State Street New York, NY 10004 PUBLIC SUMMARY COMMUNITY REINVESTMENT ACT PERFORMANCE EVALUATION Date of Evaluation: September 30, 2017 Institution: Amalgamated Bank 275 Seventh Avenue New York, NY 10001 Note: This evaluation is not an assessment of the financial condition of this institution. The rating assigned does not represent an analysis, conclusion or opinion of the New York State Department of Financial Services concerning the safety and soundness of this financial institution.
Transcript of COMMUNITY REINVESTMENT ACT PERFORMANCE …reportable rates of lending were below the aggregate’s...

NEW YORK STATE
DEPARTMENT OF FINANCIAL SERVICES FINANCIAL FRAUDS AND CONSUMER PROTECTION DIVISION
One State Street
New York, NY 10004
PUBLIC SUMMARY
COMMUNITY REINVESTMENT ACT PERFORMANCE EVALUATION
Date of Evaluation: September 30, 2017
Institution: Amalgamated Bank 275 Seventh Avenue New York, NY 10001
Note: This evaluation is not an assessment of the financial condition of this institution. The rating assigned does not represent an analysis, conclusion or opinion of the New York State Department of Financial Services concerning the safety and soundness of this financial institution.

TABLE OF CONTENTS
Section
General Information ......................................................................... 1
Overview of Institution’s Performance .............................................. 2
Performance Context ........................................................................ 3
Institution Profile
Assessment Area
Demographic & Economic Data
Community Information
Performance Tests and Assessment Factors .................................. 4
Lending Test
Investment Test
Service Test
Additional Factors
Glossary ........................................................................................... 5

1 - 1
GENERAL INFORMATION This document is an evaluation of the Community Reinvestment Act (“CRA”) performance of Amalgamated Bank (“Amalgamated”) prepared by the New York State Department of Financial Services (“DFS” or the “Department”). This evaluation represents the Department’s current assessment and rating of the institution’s CRA performance based on an evaluation conducted as of September 30, 2017. Section 28-b of the New York Banking Law, as amended, requires that when evaluating certain applications, the Superintendent of Financial Services shall assess a banking institution’s record of helping to meet the credit needs of its entire community, including low- and moderate-income (“LMI”) areas, consistent with safe and sound operations. Part 76 of the General Regulations of the Superintendent (“GRS”) implements Section 28-b and further requires that the Department assess the CRA performance records of regulated financial institutions. Part 76 establishes the framework and criteria by which the Department will evaluate the performance. Section 76.5 further provides that the Department will prepare a written report summarizing the results of such assessment and will assign to each institution a numerical CRA rating based on a 1 to 4 scoring system. The numerical scores represent an assessment of CRA performance as follows:
(1) Outstanding record of meeting community credit needs;
(2) Satisfactory record of meeting community credit needs;
(3) Needs to improve in meeting community credit needs; and
(4) Substantial noncompliance in meeting community credit needs. Section 76.5 further requires that the CRA rating and the written summary (“Evaluation”) be made available to the public. Evaluations of banking institutions are primarily based on a review of performance tests and standards described in Section 76.7 and detailed in Sections 76.8 through 76.13. The tests and standards incorporate the 12 assessment factors contained in Section 28-b of the New York Banking Law. For an explanation of technical terms used in this report, please consult the GLOSSARY at the back of this document.

2 - 1
OVERVIEW OF INSTITUTION’S PERFORMANCE
The Department evaluated Amalgamated according to the large banking institution performance criteria pursuant to Sections 76.7, 76.8, 76.9, and 76.10 of the GRS. The Department evaluated Amalgamated’s lending activities in calendar years 2014, 2015, and 2016 and its community development activities from October 1, 2014 to September 30, 2017. Amalgamated is rated “Satisfactory” or “2.” This means Amalgamated had a satisfactory record of helping to meet community credit needs. This rating is based on the following factors: LENDING TEST: “Low Satisfactory” Amalgamated’s Consolidation, Extension, and Modification Agreement (“CEMA”), HMDA-reportable, and small business lending activities were adequate in light of the bank’s size, business strategy, and financial condition, as well as aggregate and peer group activity and the demographic characteristics and credit needs of its assessment area. Lending Activity: “Low Satisfactory” Amalgamated’s lending levels were adequate considering its size, business strategy, and financial condition, as well as the activity of its peer group and the demographic characteristics of its assessment area. Amalgamated’s average loan-to-deposit (“LTD”) ratio for the evaluation period was 78.8%. Although this was an improvement from its 75.2% LTD ratio during the prior evaluation period, it was below its peer group’s ratio of 83.6%. Assessment Area Concentration: “Outstanding” Amalgamated originated 93.6% by number and 97.6% by dollar value of its total HMDA-reportable, CEMA, and small business loans within the assessment area. This substantial majority of lending inside of its assessment area reflects an excellent concentration of lending. Geographic Distribution of Loans: “High Satisfactory” Amalgamated’s origination of loans in census tracts of varying income levels demonstrated a more than reasonable distribution of lending. CEMA lending activities demonstrated excellent penetration in low- and moderate-income (“LMI”) census tracts, while HMDA-reportable lending activities in LMI census tracts were more than reasonable. Amalgamated’s small business lending activities were minimal and discontinued in 2016.

2 - 2
Distribution by Borrower Characteristics: “Needs to Improve” Amalgamated‘s HMDA-reportable and CEMA loans demonstrated a less than adequate distribution among individuals of different income levels. Amalgamated’s less than adequate lending performance to LMI borrowers continues from the prior evaluation period. During this evaluation period, Amalgamated’s HMDA-reportable rates of lending were below the aggregate’s and its rates of lending for CEMAs were well below the family demographics of the assessment area. Community Development Lending: “Outstanding” Amalgamated originated $240.2 million in new community development loans during the evaluation period and had $23.5 million outstanding from prior evaluation periods. This demonstrated an excellent level of community development lending. INVESTMENT TEST: “High Satisfactory” Amalgamated’s qualified investments were more than reasonable considering the assessment area’s credit needs. Qualified Investments: “High Satisfactory” Amalgamated made $26.5 million in new community development investments during the evaluation period and had $11.2 million outstanding from prior evaluation periods. In addition, Amalgamated made $1.2 million in community development grants. This demonstrated a more than reasonable level of qualified investments. Innovativeness of Qualified Investments Amalgamated did not make any innovative investments to support community development. Responsiveness of Qualified Investments to Credit and Community Development Needs Amalgamated‘s qualified investments exhibited more than reasonable responsiveness to the assessment area’s credit and community development needs. SERVICE TEST: “High Satisfactory” Retail Banking Services: “High Satisfactory” Amalgamated branch network, delivery systems, branch hours and services, and alternative delivery systems are more than reasonable, particularly as they relate to LMI individuals. Amalgamated operated 12 branches within its assessment area, including four branches (33%) in LMI census tracts. In addition, five of Amalgamated’s 12 branches are Banking Development District (“BDD”) branches.

2 - 3
Community Development Services: “Outstanding” Amalgamated provided an excellent level of community development services. Directors, officers, and employees of Amalgamated participated in over 200 approved community development services during the evaluation period. This evaluation was conducted based on a review of the 12 assessment factors set forth in Section 28-b of the New York Banking Law and GRS Part 76.

3 - 1
PERFORMANCE CONTEXT Institution Profile Established in 1923, Amalgamated is a New York state-chartered commercial bank headquartered in New York, NY. Amalgamated is the largest majority union-owned bank in the United States and a subsidiary of Workers United, a bank holding company. Amalgamated operates 12 branch offices within the five boroughs of New York City and one branch office in the District of Columbia. Amalgamated offers a wide array of banking services and products for individuals, small and large businesses, and non-profit, local community, and progressive organizations. Services include online and mobile banking, remote deposit capture, Apple pay, and merchant processing. Deposit products include checking accounts, savings accounts, money market accounts, and certificates of deposit for consumers and business customers. Credit products include residential and commercial mortgage loans, commercial & industrial loans, and consumer loans. Amalgamated also offers investment products such as mutual funds, stocks, annuities, IRA, college savings plans, and insurance. According to the Consolidated Report of Condition (“Call Report”) as of September 30, 2017 filed with the Federal Deposit Insurance Corporation (“FDIC”), Amalgamated reported total assets of $4.1 billion, of which $2.7 billion were net loans and lease financing receivables. It also reported total deposits of $3.1 billion, resulting in a LTD ratio of 86.7% as of September 30, 2017. According to the latest available comparative deposit data as of June 30, 2017, Amalgamated had a market share of 0.18%, or $2.6 billion in a market of $1.5 trillion, ranking it 37th among 129 deposit-taking institutions. The following is a summary of the bank’s loan portfolio, based on Schedule RC-C of the bank’s December 31, 2014, 2015, 2016 and September 30, 2017, Call Reports.
$000's % $000's % $000's % $000's %1-4 Family Residential Mortgage Loans 469,951 23.4 578,261 25.1 681,817 26.8 762,928 28.0Multifamily Mortgages 568,582 28.3 703,392 30.5 748,251 29.4 859,157 31.5Commercial Mortgage Loans 413,124 20.5 375,017 16.3 385,146 15.1 361,052 13.2Commercial & Industrial Loans 441,027 21.9 573,045 24.9 664,192 26.1 651,808 23.9Consumer Loans 7,245 0.4 4,318 0.2 3,486 0.1 32,453 1.2Obligations of States and Other Political Subdivision 44,111 2.2 15,691 0.7 0 0.0 0 0.0Construction Loans 1,655 0.1 8,350 0.4 8,350 0.3 10,317 0.4Loans to Non Depositary Finanical Institutions 59,598 3.0 35,088 1.5 35,924 1.4 40,728 1.5Other Loans 5,946 0.3 12,375 0.5 19,880 0.8 10,208 0.4Total Gross Loans 2,011,239 100.0 2,305,537 100.0 2,547,046 100.0 2,728,651 100.0
12/31/2016Loan Type
12/31/2014 12/31/2015 9/30/2017
TOTAL GROSS LOANS OUTSTANDING

3 - 2
As illustrated in the above table, multifamily mortgage loans represent the largest segment of Amalgamated’s loan portfolio as of September 30, 2017 (31.5%), closely followed by one-to-four family residential mortgage loans at 28%. Commercial & industrial loans and commercial mortgage loans made up 23.9% and 13.2% of the loan portfolio, respectively. Examiners did not find evidence of financial or legal impediments that had an adverse impact on Amalgamated’s ability to meet the credit needs of its community. Assessment Area Amalgamated’s assessment area is comprised of Bronx, Kings, New York, Queens, Richmond, Nassau, Rockland, and Westchester counties. There were no changes to the bank’s assessment area since the prior evaluation. There are 2,740 census tracts in the assessment area, of which 354 are low-income, 693 are moderate-income, 867 are middle-income, and 748 are upper-income; 78 tracts had no income indicated.
County N/A Low Moderate Middle Upper Total LMI %
Bronx 10 143 97 60 29 339 70.8Kings 13 125 295 213 115 761 55.2Nassau 8 9 26 157 84 284 12.3New York 12 44 61 25 146 288 36.5Queens 26 21 169 314 139 669 28.4Richmond 3 3 11 33 61 111 12.6Rockland 0 4 6 10 45 65 15.4Westchester 6 5 28 55 129 223 14.8Total 78 354 693 867 748 2,740 38.2
Assessment Area Census Tracts by Income Level
The assessment area appears reasonable based upon the location of the bank’s offices and its lending patterns. There is no evidence that Amalgamated has arbitrarily excluded LMI areas. Demographic & Economic Data The assessment area had a population of 10.8 million during the examination period. Approximately 12.5% of the population were over the age of 65 and 19.6% were under the age of 16. Of the 2.5 million families in the assessment area, 27.8% were low-income, 16.4% were moderate-income, 17.1% were middle-income, and 38.7% were upper-income. There were 3.9 million households in the assessment area, of which 15.6% had income below the poverty level and 3.5% were on public assistance.
3 - 3
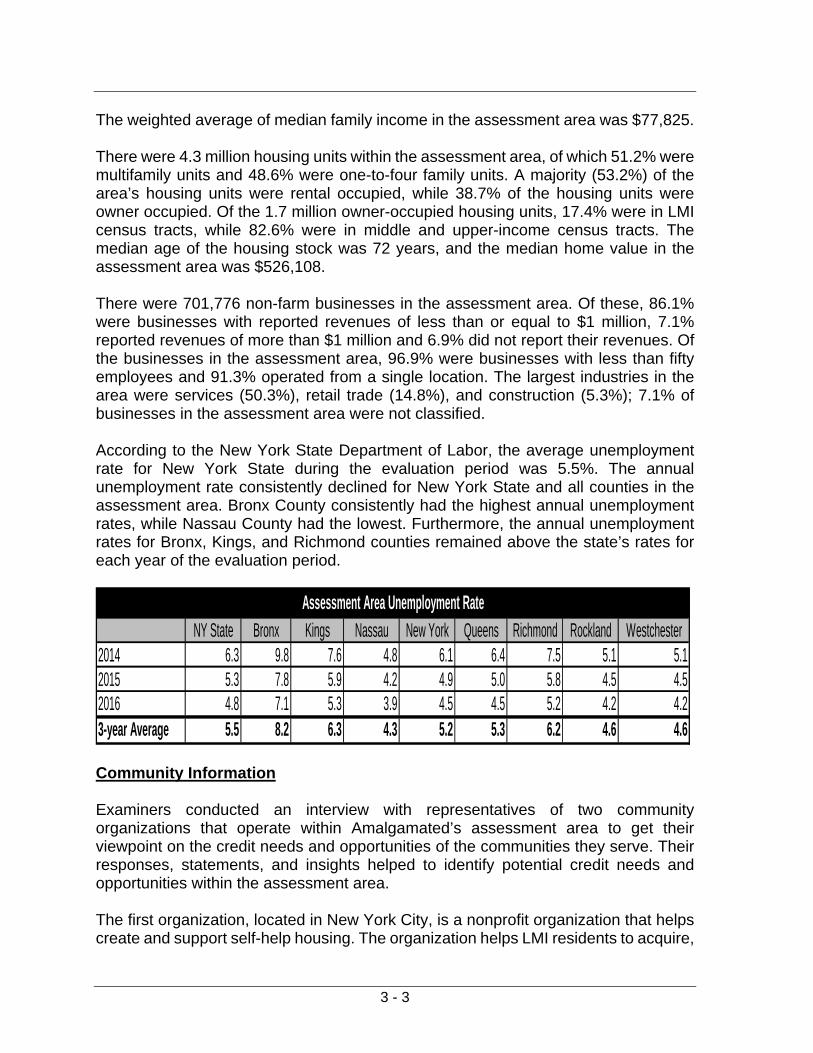
The weighted average of median family income in the assessment area was $77,825. There were 4.3 million housing units within the assessment area, of which 51.2% were multifamily units and 48.6% were one-to-four family units. A majority (53.2%) of the area’s housing units were rental occupied, while 38.7% of the housing units were owner occupied. Of the 1.7 million owner-occupied housing units, 17.4% were in LMI census tracts, while 82.6% were in middle and upper-income census tracts. The median age of the housing stock was 72 years, and the median home value in the assessment area was $526,108. There were 701,776 non-farm businesses in the assessment area. Of these, 86.1% were businesses with reported revenues of less than or equal to $1 million, 7.1% reported revenues of more than $1 million and 6.9% did not report their revenues. Of the businesses in the assessment area, 96.9% were businesses with less than fifty employees and 91.3% operated from a single location. The largest industries in the area were services (50.3%), retail trade (14.8%), and construction (5.3%); 7.1% of businesses in the assessment area were not classified. According to the New York State Department of Labor, the average unemployment rate for New York State during the evaluation period was 5.5%. The annual unemployment rate consistently declined for New York State and all counties in the assessment area. Bronx County consistently had the highest annual unemployment rates, while Nassau County had the lowest. Furthermore, the annual unemployment rates for Bronx, Kings, and Richmond counties remained above the state’s rates for each year of the evaluation period.
NY State Bronx Kings Nassau New York Queens Richmond Rockland Westchester2014 6.3 9.8 7.6 4.8 6.1 6.4 7.5 5.1 5.12015 5.3 7.8 5.9 4.2 4.9 5.0 5.8 4.5 4.52016 4.8 7.1 5.3 3.9 4.5 4.5 5.2 4.2 4.23-year Average 5.5 8.2 6.3 4.3 5.2 5.3 6.2 4.6 4.6
Assessment Area Unemployment Rate
Community Information Examiners conducted an interview with representatives of two community organizations that operate within Amalgamated’s assessment area to get their viewpoint on the credit needs and opportunities of the communities they serve. Their responses, statements, and insights helped to identify potential credit needs and opportunities within the assessment area. The first organization, located in New York City, is a nonprofit organization that helps create and support self-help housing. The organization helps LMI residents to acquire,

3 - 4
rehabilitate, and manage their co-op apartments. Since its inception in 1973, the organization has helped to create and preserve over 30,000 apartments and over 1,600 buildings in New York City. The representative stated that the high rents and high cost of living in New York City make it more and more difficult for LMI individuals and families to find affordable housing. It was noted that local financial institutions could offer more flexible credit programs for LMI borrowers to make housing more affordable in New York City. The other nonprofit organization assists LMI entrepreneurs build businesses in underserved areas in New York City. Many of these businesses are minority- and/or women-owned businesses. The organization provides legal, financial, and marketing services to its clients including bookkeeping, financial management, planning, and strategic marketing. The representative indicated that many of the organization’s clients do not have business accounts, mainly due to their poor personal credit. The representative noted the opportunity for local financial institutions to offer financial education and credit counseling programs that discuss the requirements and documentation required for small business accounts and small business loan products for LMI entrepreneurs. The representative also noted the potential opportunity for financial institutions to offer more flexible small business loan products in many of the unbanked and underserved neighborhoods in New York City.

4 - 1
PERFORMANCE STANDARDS AND ASSESSMENT FACTORS
The Department evaluated Amalgamated under the large banking institution performance standards in accordance with Sections 76.7, 76.8, 76.9, and 76.10 of the GRS, which consist of the lending, investment, and service tests. DFS also considered the following factors in assessing the bank’s record of performance: 1. The extent of participation by the board of directors or board of trustees in formulating
CRA policies and reviewing CRA performance; 2. Any practices intended to discourage credit applications; 3. Evidence of prohibited discriminatory or other illegal credit practices; 4. Record of opening and closing offices and providing services at offices; and 5. Process factors, such as activities to ascertain credit needs and the extent of
marketing and special credit related programs. Finally, the evaluation considered other factors as delineated in Section 28-b of the New York Banking Law that reasonably bear upon the extent to which Amalgamated helps to meet the credit needs of its entire community. DFS derived statistics employed in this evaluation from various sources. Amalgamated submitted bank-specific information both as part of the examination process and on its Call Report submitted to the FDIC. DFS obtained aggregate lending data from the Federal Financial Institutions Examination Council (“FFIEC”) and deposit data from the FDIC. DFS calculated LTD ratios from information shown in the bank’s Uniform Bank Performance Report as submitted to the FDIC. DFS sourced the demographic data referred to in this report from the 2010 U.S. Census and the FFIEC. DFS based business data on Dun & Bradstreet reports, which Dun & Bradstreet updates annually, and obtained unemployment data from the New York State Department of Labor. At Amalgamated’s request, DFS evaluated CEMAs, which made up 70.1% of the dollar value of loans the bank originated within the assessment area during the evaluation period. Although CEMA loans represented the majority of Amalgamated’s dollar value of loans, HMDA-reportable loans represented 75.6% of the number of loans the bank originated within the assessment area during the evaluation period. The Department evaluated Amalgamated’s CEMA, HMDA-reportable, and small business lending from January 1, 2014 to December 31, 2016, and Amalgamated’s community development activities from October 1, 2014 through September 30, 2017. Examiners considered Amalgamated’s CEMA, HMDA-reportable, and small business loans in evaluating factors (2), (3), and (4) of the lending test noted below.
4 - 2
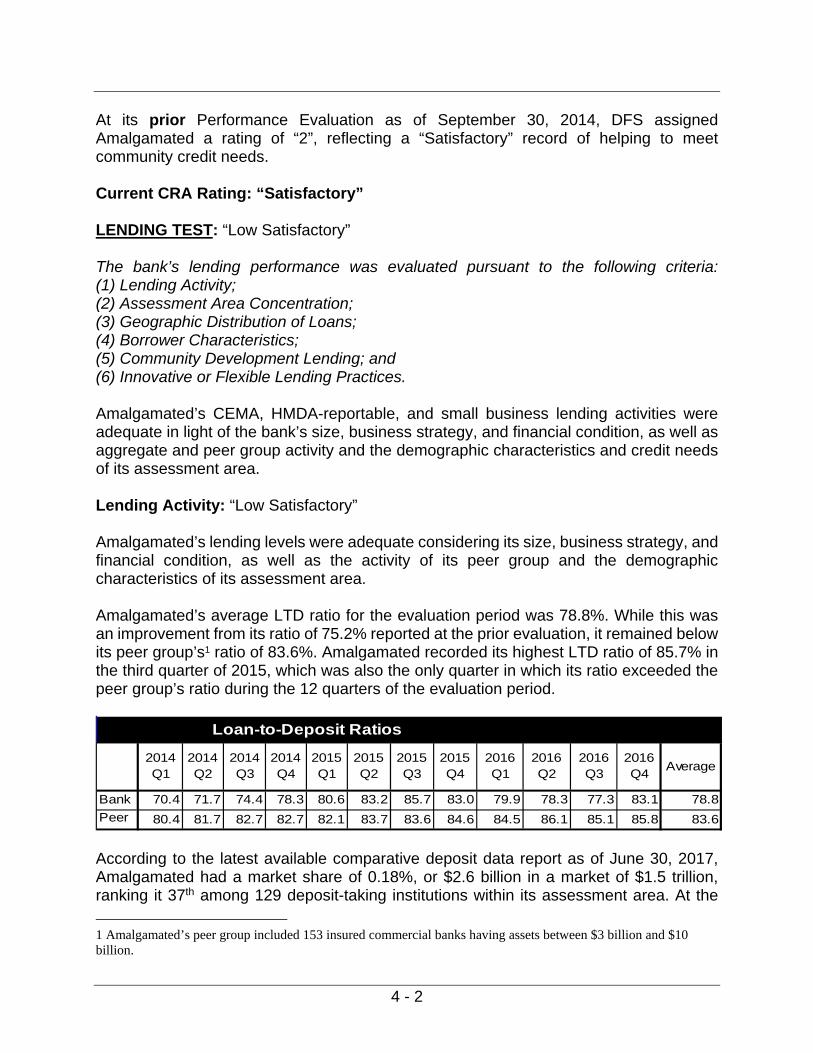
At its prior Performance Evaluation as of September 30, 2014, DFS assigned Amalgamated a rating of “2”, reflecting a “Satisfactory” record of helping to meet community credit needs. Current CRA Rating: “Satisfactory” LENDING TEST: “Low Satisfactory” The bank’s lending performance was evaluated pursuant to the following criteria: (1) Lending Activity; (2) Assessment Area Concentration; (3) Geographic Distribution of Loans; (4) Borrower Characteristics; (5) Community Development Lending; and (6) Innovative or Flexible Lending Practices. Amalgamated’s CEMA, HMDA-reportable, and small business lending activities were adequate in light of the bank’s size, business strategy, and financial condition, as well as aggregate and peer group activity and the demographic characteristics and credit needs of its assessment area. Lending Activity: “Low Satisfactory” Amalgamated’s lending levels were adequate considering its size, business strategy, and financial condition, as well as the activity of its peer group and the demographic characteristics of its assessment area. Amalgamated’s average LTD ratio for the evaluation period was 78.8%. While this was an improvement from its ratio of 75.2% reported at the prior evaluation, it remained below its peer group’s1 ratio of 83.6%. Amalgamated recorded its highest LTD ratio of 85.7% in the third quarter of 2015, which was also the only quarter in which its ratio exceeded the peer group’s ratio during the 12 quarters of the evaluation period.
2014Q1
2014Q2
2014Q3
2014Q4
2015 Q1
2015 Q2
2015 Q3
2015 Q4
2016 Q1
2016 Q2
2016 Q3
2016 Q4
Average
Bank 70.4 71.7 74.4 78.3 80.6 83.2 85.7 83.0 79.9 78.3 77.3 83.1 78.8
Peer 80.4 81.7 82.7 82.7 82.1 83.7 83.6 84.6 84.5 86.1 85.1 85.8 83.6
Loan-to-Deposit Ratios
According to the latest available comparative deposit data report as of June 30, 2017, Amalgamated had a market share of 0.18%, or $2.6 billion in a market of $1.5 trillion, ranking it 37th among 129 deposit-taking institutions within its assessment area. At the
1 Amalgamated’s peer group included 153 insured commercial banks having assets between $3 billion and $10 billion.

4 - 3
prior evaluation, Amalgamated ranked 35th among 134 institutions in the comparative deposit data report as of June 30, 2014, with deposits of $2.3 billion and a similar 0.2% market share in a market of $1.1 trillion. Assessment Area Concentration: “Outstanding” During the evaluation period, Amalgamated originated 93.6% by number and 97.6% by dollar value of its total HMDA-reportable, CEMA, and small business loans within the assessment area. This substantial majority of lending inside of its assessment area reflects an excellent concentration of lending within the assessment area. HMDA-Reportable Loans During the evaluation period, Amalgamated originated 92.3% by number and 92.8% by dollar value of its HMDA-reportable loans within the assessment area. This substantial majority of lending inside of its assessment area reflects an excellent concentration of lending within the assessment area. CEMA Loans Amalgamated originated 98.2% by number and 99.8% by dollar value of its CEMA loans within the assessment area during the evaluation period. This substantial majority of lending inside of its assessment area reflects an excellent concentration of lending within the assessment area. Small Business Loans Amalgamated originated all of its small business loans within its assessment area during the evaluation period, which reflects an excellent concentration of lending within the assessment area. The following table shows the percentages of the Amalgamated’s HMDA-reportable, CEMA, and small business loans originated inside and outside of its assessment area.

4 - 4
Loan Type Total Total
# % # % $ % $ %
HMDA-Reportable2014 139 92.1% 12 7.9% 151 62,252 94.8% 3,449 5.2% 65,701
2015 216 96.0% 9 4.0% 225 78,163 95.7% 3,488 4.3% 81,651
2016 169 88.0% 23 12.0% 192 66,325 87.9% 9,113 12.1% 75,438
Subtotal 524 92.3% 44 7.7% 568 206,740 92.8% 16,050 7.2% 222,790
CEMA
2014 30 100.0% 0 0.0% 30 100,914 100.0% 0 0.0% 100,914
2015 47 97.9% 1 2.1% 48 219,834 99.9% 285 0.1% 220,119
2016 83 97.6% 2 2.4% 85 167,573 99.5% 867 0.5% 168,440
Subtotal 160 98.2% 3 1.8% 163 488,321 99.8% 1,152 0.2% 489,473
Small Business2015 5 100.0% 0 0.0% 5 975 100.0% 0 0.0% 975
2016 4 100.0% 0 0.0% 4 575 100.0% 0 0.0% 575
Subtotal 9 100.0% 0 0.0% 9 1,550 100.0% 0 0.0% 1,550
Grand Total 693 93.6% 47 6.4% 740 696,611 97.6% 17,202 2.4% 713,813
Distribution of Loans Inside and Outside of the Assessment Area
Number of Loans Loans in Dollars (in thousands)
Inside Outside Inside Outside
Geographic Distribution of Loans: “High Satisfactory” Amalgamated’s origination of loans in census tracts of varying income levels demonstrated a more than reasonable distribution of lending. HMDA-reportable lending activities in LMI census tracts were reasonable, while CEMA lending activities demonstrated excellent penetration in LMI census tracts. Amalgamated’s small business lending activities were minimal and discontinued in 2016. HMDA-Reportable Loans The distribution of Amalgamated’s HMDA-reportable loans by the income level of the geography was more than reasonable. Amalgamated’s average rates of lending in LMI census tracts were 21.6% by number and 28% by dollar value of loans. This exceeded the aggregate’s average rates of 17.6% and 20.9%, respectively. In 2016, Amalgamated’s rates of lending in moderate-income census tracts exceeded the aggregate’s, while it trailed the aggregate’s rates in low-income census tracts. In 2015, the aggregate’s rates exceeded Amalgamated’s rates, except in dollar value of loans in low-income census tracts. However, in 2014, Amalgamated’s rates of lending exceeded the aggregate’s rates by number and dollar value of loans in LMI census tracts. The following table provides a summary of the distribution of Amalgamated’s HMDA-reportable loans by the income level of the geography where the property was located.

4 - 5
Geographic OO HUsIncome # % $000's % # % $000's % %
Low 7 5.0% 8,633 13.9% 2,868 3.7% 2,795,106 6.2% 2.9%Moderate 34 24.5% 13,226 21.2% 10,929 14.2% 6,911,984 15.4% 14.5%LMI 41 29.5% 21,859 35.1% 13,797 17.9% 9,707,090 21.6% 17.4%Middle 47 33.8% 22,865 36.7% 25,820 33.5% 10,212,278 22.7% 37.7%Upper 51 36.7% 17,528 28.2% 37,305 48.4% 25,011,348 55.6% 44.9%Unknown 0 0.0% 0 0.0% 81 0.1% 92,233 0.2% 0.0%
Total 139 62,252 77,003 45,022,949
Geographic OO HUsIncome # % $000's % # % $000's % %
Low 7 3.2% 13,811 17.7% 3,286 3.6% 2,964,031 5.4% 2.9%Moderate 29 13.4% 8,652 11.1% 12,659 13.8% 8,159,414 15.0% 14.5%LMI 36 16.7% 22,463 28.7% 15,945 17.4% 11,123,445 20.4% 17.4%Middle 130 60.2% 33,799 43.2% 31,448 34.3% 12,885,047 23.6% 37.7%Upper 50 23.1% 21,901 28.0% 44,174 48.2% 30,481,051 55.9% 44.9%Unknown 0 0.0% 0 0.0% 43 0.0% 41,517 0.1% 0.0%
Total 216 78,163 91,610 54,531,060
Geographic OO HUsIncome # % $000's % # % $000's % %
Low 3 1.8% 1,874 2.8% 3,584 3.7% 3,346,501 5.6% 2.9%Moderate 33 19.5% 11,653 17.6% 13,591 13.8% 9,143,216 15.3% 14.5%LMI 36 21.3% 13,527 20.4% 17,175 17.5% 12,489,717 20.8% 17.4%Middle 58 34.3% 22,838 34.4% 34,231 34.9% 14,623,033 24.4% 37.7%Upper 75 44.4% 29,960 45.2% 46,743 47.6% 32,744,677 54.7% 44.9%Unknown 0 0.0% 0 0.0% 33 0.0% 57,069 0.1% 0.0%
Total 169 66,325 98,182 59,914,496
Geographic OO HUs
Income # % $000's % # % $000's % %
Low 17 3.2% 24,318 11.8% 9,738 3.6% 9,105,638 5.7%Moderate 96 18.3% 33,531 16.2% 37,179 13.9% 24,214,614 15.2%LMI 113 21.6% 57,849 28.0% 46,917 17.6% 33,320,252 20.9%Middle 235 44.8% 79,502 38.5% 91,499 34.3% 37,720,358 23.7%Upper 176 33.6% 69,389 33.6% 128,222 48.1% 88,237,076 55.3%Unknown 0 0.0% 0 0.0% 157 0.1% 190,819 0.1%
Total 524 206,740 266,795 159,468,505
Bank Aggregate
2015
2016
Bank Aggregate
Distribution of HMDA-Reportable Lending by Geographic Income of the Census Tract
Bank Aggregate
2014
Bank Aggregate
GRAND TOTAL
CEMA Loans The distribution of Amalgamated’s CEMA loans by the income level of the geography was excellent. Amalgamated’s rates of lending for CEMA loans exceeded the percentage of owner-occupied housing units (housing demographics) in LMI tracts for every year of the

4 - 6
evaluation period. In 2016, Amalgamated originated 9.6% by number and 10.7% by dollar value of CEMAs in low-income census tracts and 22.9% and 27.1%, respectively, in moderate-income tracts. Despite being Amalgamated’s lowest annual rates of lending in LMI geographies, these rates remained well above the percentage of owner-occupied housing units in low-income census tracts (2.9%) and in moderate-income census tracts (14.5%). The following table provides a summary of the distribution of the bank’s CEMA loans by the income level of the geography where the property was located.
Geographic OO HUsIncome # % $000's % %
Low 3 10.0% 9,600 9.5% 2.9%Moderate 11 36.7% 58,075 57.5% 14.5%LMI 14 46.7% 67,675 67.1% 17.4%Middle 8 26.7% 13,391 13.3% 37.7%Upper 8 26.7% 19,848 19.7% 44.9%Unknown 0 0.0% 0 0.0% 0.0%
Total 30 100,914
Geographic OO HUsIncome # % $000's % %
Low 9 19.1% 42,058 19.1% 2.9%Moderate 20 42.6% 123,033 56.0% 14.5%LMI 29 61.7% 165,091 75.1% 17.4%Middle 10 21.3% 23,115 10.5% 37.7%Upper 8 17.0% 31,628 14.4% 44.9%Unknown 0 0.0% 0 0.0% 0.0%
Total 47 219,834
Geographic OO HUsIncome # % $000's % %
Low 8 9.6% 17,908 10.7% 2.9%Moderate 19 22.9% 45,470 27.1% 14.5%LMI 27 32.5% 63,378 37.8% 17.4%Middle 25 30.1% 48,074 28.7% 37.7%Upper 31 37.3% 56,121 33.5% 44.9%Unknown 0 0.0% 0 0.0% 0.0%
Total 83 167,573
Geographic OO HUs
Income # % $000's % %
Low 20 12.5% 69,566 14.2%Moderate 50 31.3% 226,578 46.4%LMI 70 43.8% 296,144 60.6%Middle 43 26.9% 84,580 17.3%Upper 47 29.4% 107,597 22.0%Unknown 0 0.0% 0 0.0%
Total 160 488,321
Bank
Distribution of CEMA loans by Geographic Income of the Census Tract
Bank
2014
Bank
Bank
2015
2016
GRAND TOTAL

4 - 7
Small Business Loans DFS did not rate Amalgamated’s distribution of small business loans among census tracts of varying income levels because the number of loans was too low for a meaningful analysis. Amalgamated introduced small business lending in 2015 and discontinued it in 2016. Amalgamated originated only nine small business loans during the evaluation period; only one was originated in an LMI geography. Amalgamated originated that loan in a moderate-income census tract in 2016. The following table provides a summary of the distribution of Amalgamated’s small business loans by the income level of the geography where the business was located.
Geographic Bus.Dem.Income # % $000's % # % $ % %
Low 0 0.0% 0 0.0% 26,208 9.1% 556,632 7.3% 8.3%Moderate 0 0.0% 0 0.0% 54,921 19.0% 1,187,433 15.5% 18.6%LMI 0 0.0% 0 0.0% 81,129 28.1% 1,744,065 22.8% 26.9%Middle 1 20.0% 100 10.3% 78,169 27.1% 1,899,149 24.8% 27.2%Upper 4 80.0% 875 89.7% 122,840 42.6% 3,694,440 48.3% 43.8%Unknown 0 0.0% 0 0.0% 6,447 2.2% 310,077 4.1% 2.2%
Total 5 975 288,585 7,647,731
Geographic Bus.Dem.Income # % $000's % # % $ % %
Low 0 0.0% 0 0.0% 26,333 8.7% 676,641 7.8% 8.3%Moderate 1 25.0% 100 17.4% 55,732 18.4% 1,388,933 16.1% 18.6%LMI 1 25.0% 100 17.4% 82,065 27.1% 2,065,574 23.9% 26.9%Middle 0 0.0% 0 0.0% 82,217 27.2% 2,158,343 24.9% 27.0%Upper 3 75.0% 475 82.6% 131,572 43.5% 4,096,011 47.3% 43.9%Unknown 0 0.0% 0 0.0% 6,678 2.2% 330,932 3.8% 2.2%
Total 4 575 302,532 8,650,860
Geographic Bus.Dem.
Income # % $000's % # % $000's % %
Low 0 0.0% 0 0.0% 52,541 8.9% 1,233,273 7.6%Moderate 1 11.1% 100 6.5% 110,653 18.7% 2,576,366 15.8%LMI 1 11.1% 100 6.5% 163,194 27.6% 3,809,639 23.4%Middle 1 11.1% 100 6.5% 160,386 27.1% 4,057,492 24.9%Upper 7 77.8% 1,350 87.1% 254,412 43.0% 7,790,451 47.8%Unknown 0 0.0% 0 0.0% 13,125 2.2% 641,009 3.9%
Total 9 1,550 591,117 16,298,591
2016
Bank Aggregate
Distribution of Small Business Lending by Geographic Income of the Census Tract
Bank Aggregate
2015
Bank Aggregate
GRAND TOTAL

4 - 8
Distribution by Borrower Characteristics: “Needs to Improve” Amalgamated‘s HMDA-reportable and CEMA loans demonstrated a less than adequate distribution of loans among individuals of different income levels. Amalgamated’s lending performance to LMI borrowers was also less than adequate during the prior evaluation period. During this evaluation period, the bank’s HMDA-reportable rates of lending were below the aggregate’s and its rates of lending for CEMAs was well below the family demographics of the assessment area. HMDA-Reportable Loans Amalgamated’s one-to-four family HMDA-reportable lending demonstrated a less than adequate distribution of loans among individuals of different income levels. Amalgamated originated 520 one-to-four family HMDA-reportable loans during the evaluation period, but originated only 27 loans to moderate-income borrowers and only two loans to low-income borrowers. As a result, Amalgamated’s average rates of lending to LMI borrowers were 5.4% by number and 1.8% by dollar value of loans, well below the aggregate’s rates of 11.2% and 5.1%, respectively. Amalgamated’s annual rates of lending to LMI borrowers trailed the aggregate’s rates each year of the evaluation period. Amalgamated’s rates of lending during the evaluation were also well below the LMI family demographics of the assessment area, as 44.2% of the families living in the assessment area were LMI families. The following table provides a summary of the distribution of the bank’s one-to-four family HMDA-reportable loans by borrower income.

4 - 9
Borrower Fam.Dem.Income # % $000's % # % $000's % %
Low 1 0.7% 78 0.1% 2,047 2.8% 427,814 1.3% 27.8%Moderate 8 5.8% 863 1.4% 6,925 9.3% 1,409,258 4.1% 16.4%LMI 9 6.5% 941 1.5% 8,972 12.1% 1,837,072 5.4% 44.2%Middle 32 23.0% 6,459 10.4% 14,735 19.8% 3,920,844 11.5% 17.1%Upper 92 66.2% 33,284 53.5% 47,812 64.3% 25,781,320 75.4% 38.7%Unknown 6 4.3% 21,568 34.6% 2,786 3.7% 2,667,047 7.8% 0.0%
Total 139 62,252 74,305 34,206,283
Borrower Fam.Dem.Income # % $000's % # % $000's % %
Low 0 0.0% 0 0.0% 2,185 2.5% 511,105 1.2% 27.8%Moderate 12 5.6% 1,334 2.1% 7,891 8.9% 1,716,376 4.0% 16.4%LMI 12 5.6% 1,334 2.1% 10,076 11.4% 2,227,481 5.2% 44.2%Middle 49 23.0% 8,897 14.2% 17,296 19.5% 4,916,348 11.5% 17.1%Upper 147 69.0% 49,492 79.0% 55,179 62.3% 31,346,005 73.3% 38.7%Unknown 5 2.3% 2,890 4.6% 6,043 6.8% 4,277,989 10.0% 0.0%
Total 213 62,613 88,594 42,767,823
Borrower Fam.Dem.Income # % $000's % # % $000's % %
Low 0 0.0% 0 0.0% 1,924 2.0% 443,106 0.9% 27.8%Moderate 7 4.2% 1,208 1.8% 8,062 8.4% 1,827,420 3.8% 16.4%LMI 7 4.2% 1,208 1.8% 9,986 10.5% 2,270,526 4.8% 44.2%Middle 25 14.9% 6,614 10.1% 19,108 20.0% 5,713,187 12.0% 17.1%Upper 136 81.0% 57,503 88.0% 60,574 63.4% 35,303,957 74.1% 38.7%Unknown 0 0.0% 0 0.0% 5,838 6.1% 4,388,043 9.2% 0.0%
Total 168 65,325 95,506 47,675,713
Borrower Fam.Dem.
Income # % $000's % # % $000's % %
Low 1 0.2% 78 0.0% 6,156 2.4% 1,382,025 1.1%Moderate 27 5.2% 3,405 1.8% 22,878 8.9% 4,953,054 4.0%LMI 28 5.4% 3,483 1.8% 29,034 11.2% 6,335,079 5.1%Middle 106 20.4% 21,970 11.6% 51,139 19.8% 14,550,379 11.7%Upper 375 72.1% 140,279 73.8% 163,565 63.3% 92,431,282 74.2%Unknown 11 2.1% 24,458 12.9% 14,667 5.7% 11,333,079 9.1%
Total 520 190,190 258,405 124,649,819
Bank Aggregate
GRAND TOTAL
Bank Aggregate
Distribution of 1-4 Family Loans by Borrower Income
Bank Aggregate
2014
Bank Aggregate
2015
2016
CEMA Loans Amalgamated’s CEMA lending demonstrated a less than adequate distribution of loans among individuals of different income levels. During the evaluation period, Amalgamated originated 85 CEMA loans; however, it failed

4 - 10
to originate any loans to low-income borrowers and originated only two loans to moderate-income borrowers. As a result, its rates of CEMA lending to LMI borrowers of 2.4% by number and 0.9% by dollar value were significantly below the LMI family demographics of 44.2% within the assessment area. The following table provides a summary of the distribution of Amalgamated’s one-to-four family CEMA loans by borrower income.
Borrower Fam. Dem.Income # % $000's % %
Low 0 0.0% 0 0.0% 27.8%Moderate 1 12.5% 208 7.2% 16.4%LMI 1 12.5% 208 7.2% 44.2%Middle 0 0.0% 0 0.0% 17.1%Upper 7 87.5% 2,681 92.8% 38.7%Unknown 0 0.0% 0 0.0% 0.0%
Total 8 2,889
Borrower Fam. Dem.Income # % $000's % %
Low 0 0.0% 0 0.0% 27.8%Moderate 1 6.7% 202 2.7% 16.4%LMI 1 6.7% 202 2.7% 44.2%Middle 0 0.0% 0 0.0% 17.1%Upper 14 93.3% 7,270 97.3% 38.7%Unknown 0 0.0% 0 0.0% 0.0%
Total 15 7,472
Borrower Fam. Dem.Income # % $000's % %
Low 0 0.0% 0 0.0% 27.8%Moderate 0 0.0% 0 0.0% 16.4%LMI 0 0.0% 0 0.0% 44.2%Middle 2 3.2% 523 1.5% 17.1%Upper 60 96.8% 35,400 98.5% 38.7%Unknown 0 0.0% 0 0.0% 0.0%
Total 62 35,923
Borrower Fam. Dem.
Income # % $000's % %
Low 0 0.0% 0 0.0%Moderate 2 2.4% 410 0.9%LMI 2 2.4% 410 0.9%Middle 2 2.4% 523 1.1%Upper 81 95.3% 45,351 98.0%Unknown 0 0.0% 0 0.0%
Total 85 46,284
Bank
Grand Total
Distribution of 1-4 Family CEMA Loans by Borrower Income
Bank
2014
Bank
2015
2016
Bank
4 - 11
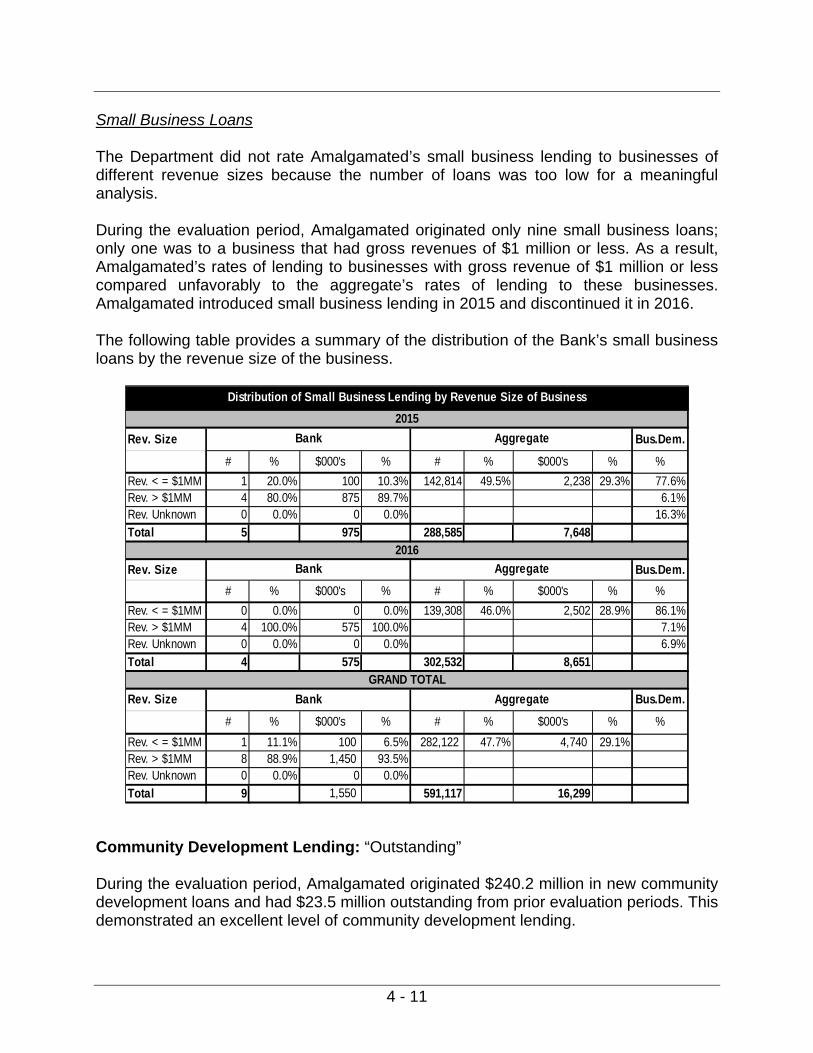
Small Business Loans The Department did not rate Amalgamated’s small business lending to businesses of different revenue sizes because the number of loans was too low for a meaningful analysis. During the evaluation period, Amalgamated originated only nine small business loans; only one was to a business that had gross revenues of $1 million or less. As a result, Amalgamated’s rates of lending to businesses with gross revenue of $1 million or less compared unfavorably to the aggregate’s rates of lending to these businesses. Amalgamated introduced small business lending in 2015 and discontinued it in 2016. The following table provides a summary of the distribution of the Bank’s small business loans by the revenue size of the business.
Rev. Size Bus.Dem.
# % $000's % # % $000's % %
Rev. < = $1MM 1 20.0% 100 10.3% 142,814 49.5% 2,238 29.3% 77.6%Rev. > $1MM 4 80.0% 875 89.7% 6.1%Rev. Unknown 0 0.0% 0 0.0% 16.3%
Total 5 975 288,585 7,648
Rev. Size Bus.Dem.
# % $000's % # % $000's % %
Rev. < = $1MM 0 0.0% 0 0.0% 139,308 46.0% 2,502 28.9% 86.1%Rev. > $1MM 4 100.0% 575 100.0% 7.1%Rev. Unknown 0 0.0% 0 0.0% 6.9%
Total 4 575 302,532 8,651
Rev. Size Bus.Dem.
# % $000's % # % $000's % %
Rev. < = $1MM 1 11.1% 100 6.5% 282,122 47.7% 4,740 29.1%Rev. > $1MM 8 88.9% 1,450 93.5%Rev. Unknown 0 0.0% 0 0.0%
Total 9 1,550 591,117 16,299
Bank Aggregate
GRAND TOTAL
Bank Aggregate
Distribution of Small Business Lending by Revenue Size of Business
Bank Aggregate
2015
2016
Community Development Lending: “Outstanding” During the evaluation period, Amalgamated originated $240.2 million in new community development loans and had $23.5 million outstanding from prior evaluation periods. This demonstrated an excellent level of community development lending.

4 - 12
When annualized over the evaluation period, Amalgamated’s total community development loans of $263.7 million were 2.2% of average total assets, which was an improvement from the 1.7% recorded for the prior evaluation period and is an excellent level of community development lending. The majority (89.7% by dollar value) of Amalgamated’s community development loans were for affordable housing.
Purpose# of
Loans$000 # of
Loans$000
Affordable Housing 36 215,387 5 13,860Economic Development 3 6,000Community Services 9 13,800Revitalize & Stabilize 2 4,981 2 9,657Total 50 240,168 7 23,517
Community Development LoansThis Evaluation Period Outstandings from Prior
Evaluation Periods
Below are highlights of Amalgamated’s community development lending.
Amalgamated originated a $10.5 million commercial mortgage loan secured by three apartment buildings containing 115 residential apartments. All three buildings are located in low-income census tracts in the Bronx. The buildings provide affordable housing—approximately 99% of the apartments have monthly rents below the fair market rents for the New York metropolitan area as estimated by the U.S. Department of Housing and Urban Development (“HUD”).
Amalgamated refinanced two multifamily mortgage loans for $6.3 million and $6.5 million. Both buildings are located in Brooklyn; one is in a moderate-income census tract and the other is in a low-income census tract. One building contains 91 apartments of which 52% qualify as affordable housing and the other contains 119 apartments of which 62% qualify as affordable housing according to the area’s fair market rents as estimated by HUD.
Amalgamated refinanced a $2.6 million commercial mortgage secured by a one-
story retail property located in a moderate-income census tract in the Bronx. The property contains five small businesses (mom and pop retailers) that provide jobs to LMI individuals and services to the community.
Amalgamated originated a $750,000, 5-year term loan to a nonprofit agency in 2014, and the bank extended a $3 million working capital line-of-credit (renewed in 2016) to the agency in 2015. The agency provides workforce preparation, industry-specific training, and direct placement services to union members, new

4 - 13
Americans, and dislocated workers throughout New York City. The services the agency provides are funded by the New York State Department of Education, the New York City Council, and New York State.
Amalgamated extended a $5 million line-of-credit to a New York-based Community Development Financial Institution (“CDFI”). The facility may provide bridge loans and working capital to organizations whose mission is to provide loans, housing, or services that benefit LMI individuals, families, and communities.
Amalgamated originated a $1 million working capital line-of-credit to a nonprofit
organization in New York City. The organization combines mental health and educational services to provide children dealing with poverty-related stress, or that are in schools located in high-poverty communities, with the tools for healthy development and academic achievement.
Amalgamated extended a $2 million line-of-credit to a not-for-profit financial
intermediary business development corporation promoting economic welfare in New York State. The corporation provides small business financing to start-ups, mature businesses, and minority- and women-owned businesses that do not meet the requirements for traditional financing. The corporation also partners with various local community organizations in the bank's assessment area.
Innovative or Flexible Lending Practices Amalgamated did not make use of innovative or flexible lending practices. INVESTMENT TEST: “High Satisfactory” DFS evaluated Amalgamated’s investment performance pursuant to the following criteria: (1) The dollar amount of qualified investments; (2) The innovativeness or complexity of qualified investments; and (3) The responsiveness of qualified investments to the credit and community
development needs of the assessment area. Amalgamated’s community development investments were more than reasonable considering the assessment area’s credit needs. Qualified Investments: “High Satisfactory” During the evaluation period, Amalgamated made $26.5 million in new community development investments and had $11.2 million outstanding from prior evaluation periods. In addition, Amalgamated made $1.2 million in community development grants. This demonstrated a more than reasonable level of qualified investments.

4 - 14
Amalgamated’s qualified investments totaled $39 million, and when annualized over the evaluation period community development investments totaled 0.3% of average total assets. This was an improvement from the 0.1% recorded at the prior evaluation.
CD Investments # of Inv. $000 # of Inv. $000Affordable Housing 4 24,522 3 10,842 Economic Development 2 2,000 Community ServicesRevitalize & Stabilize 1 349 Total 6 26,522 4 11,191
Community Development Investments and GrantsThis Evaluation Period Outstandings from Prior
Evaluation Periods
CD Grants# of
Grants $000Affordable Housing 33 850 Economic Development 16 14
Community Services 80 355 Revitalize & Stabilize 6 19 Total 135 1,238
Not A
pplic
able
Below are highlights of Amalgamated’s community development investments.
In 2015, Amalgamated made an investment in the form of a deposit of $1 million in a U.S. Treasury certified CDFI. When the deposit matured in 2017, the bank renewed the deposit for another two-year term. The CFDI’s mission is to help LMI communities achieve financial independence by providing credit and financial education to residents of low-income urban, rural, and reservation-based communities.
In 2015 and 2017, Amalgamated invested $10 million in Fannie Mae mortgage-backed securities that are secured by a 46-story building containing 1,689 rental units. The building is located in Manhattan and all rental units are federally subsidized under the Section 8 program, providing affordable housing for LMI individuals and families.
Below are highlights of Amalgamated’s community development grants.
Amalgamated contributed $1.2 million in grants to 135 organizations throughout the assessment area. These grants included $687,318, which represented Amalgamated’s share in the Federal Home Loan Bank of New York’s (“FHLBNY”) earnings for 2014 ($215,012), 2015 ($257,108), and 2016 ($215,197). Amalgamated contributed these funds to help FHLBNY fund its Affordable Housing Program including the “First Home Club,” a first-time homebuyer assistance program for LMI individuals and families.

4 - 15
Innovativeness of Qualified Investments Amalgamated did not make any innovative investments to support community development. Responsiveness of Qualified Investments to Credit and Community Development Needs Amalgamated‘s community development investments exhibited more than reasonable responsiveness to the assessment area’s credit and community development needs. SERVICE TEST: “High Satisfactory” DFS evaluated Amalgamated’s retail service performance pursuant to the following criteria: (1) The current distribution of the banking institution’s branches; (2) The institution’s record of opening and closing branches; (3) The availability and effectiveness of alternative systems for delivering retail services;
and (4) The range of services provided. DFS evaluated Amalgamated’s community development service performance pursuant to the following criteria: (1) The extent to which the banking institution provides community development services;
and (2) The innovativeness and responsiveness of community development services. Retail Banking Services: “High Satisfactory” Amalgamated’s branch network, delivery systems, branch hours and services, and alternative delivery systems are more than reasonable, particularly as they relate to LMI individuals. Current distribution of the banking institution’s branches Amalgamated has an adequate distribution of branches within its assessment area. As of the evaluation date, Amalgamated operated 12 branches within its assessment area. Four of the twelve (33%) branches were located in LMI census tracts. This was comparable to the 30% recorded at the prior evaluation and the 38.2% of LMI census tracts (demographic data) within the assessment area.

4 - 16
# # # # # # %
Bronx 1 2 3 33%Kings 1 1 2 100%Nassau 0 0%New York 1 4 5 0%Queens 1 1 2 50%Richmond 0 0%Rockland 0 0%Westchester 0 0% Total 1 3 1 3 4 12 33%
Distribution of Branches within the Assessment Area
County N/A Low Moderate Middle Upper Total LMI
Five of Amalgamated’s branches are Banking Development District (“BDD”) branches. The BDD program is a Department-administered program that “encourages the establishment of bank branches in geographic locations where there is a demonstrated need for banking services,” as provided for by Section 96-d of the New York Banking Law. All five BDD branch designations were successfully renewed in 2017. Record of opening and closing branches Amalgamated’s record of opening and closing branches has generally not adversely affected the accessibility of its delivery systems, particularly to LMI geographies and/or LMI individuals. During the evaluation period, Amalgamated closed eight branches located in Bronx, Kings, New York, and Queens counties. The branch closures were due to a lack of profitability, high operating costs, low deposit volume, increased competition, and low customer foot traffic. Customers of the closed branches have access to Amalgamated’s remaining branches, which are accessible by public transportation. Customers also have access to the Allpoint ATM network for free ATM transactions. Two of the eight branches closed were located in moderate-income census tracts in Queens and Bronx County. A number of branches operated by other banks are within one mile of the locations in which the closed branches operated and easily accessible by public transportation. While the number of branches in moderate-income census tracts declined to one from three at the prior evaluation, the number of branches (3) located in low-income census tracts remained unchanged from the prior evaluation. Availability and effectiveness of alternative systems for delivering retail services Amalgamated’s delivery systems are accessible to significant portions of the bank’s assessment area, particularly LMI geographies and individuals.

4 - 17
Amalgamated offers its customers bank-by-phone, bank-by-mail, online banking, bill pay, e-statements, mobile banking with check deposit, and debit cards, while small business customers have access to online business services, mobile services, remote deposit captures, and business debit cards. Range of services provided Amalgamated’s services meet the convenience and accessibility needs of its assessment area, particularly LMI geographies and individuals. All branches offer hours from 9:00 am to 4:00 pm Monday through Friday, except for the Wall Street branch which has hours from 8:30 am to 4:00 pm and the Long Island City branch which offers hours from 9:00 am to 5:00 pm. All branches offer extended hours until 6:00pm once a week. All branches offer Saturday hours from 9:00 am to 1:00 pm or 2:00 pm, except for the Wall Street and Long Island City branches, which are closed. All branches, except for the Burnside branch (Bronx), are supplemented by ATMs that have deposit-taking capabilities and are accessible 24 hours a day. In addition, Amalgamated customers have surcharge-free access to over 40,000 ATMs nationwide through the Allpoint Network. Amalgamated also offers residents of the New York City Housing Authority the convenience of making monthly rent payments at four of its branches. There is no fee for Amalgamated customers and a $2.00 fee for non-customers. Amalgamated offers several low-cost checking accounts (Affordable Checking, Restart Checking, and Small Business Checking) designed to benefit LMI individuals or small businesses. The features of these accounts include no minimum balance requirements, no maintenance fees, and direct deposit. In late 2016, Amalgamated started to offer the “First Home First Priority Program,” a mortgage loan program for applicants with income of 80% or less of the county median family income. The program also offers a 0.5% interest rate discount and a 5% down-payment that can come from a gift or grant. In addition, the seller can pay up to 3% of closing cost and lender-paid insurance may be available. Customers who would have been declined for a traditional checking account by Amalgamated due to charge-off history may be offered a “Restart Checking” account (formerly the “Second Chance Checking Account”) if their total unpaid charge-offs are less than $500 and/or charge-offs more than $500 have been paid. The account is automatically converted to an “Affordable Checking” account after one year.

4 - 18
Community Development Services: “Outstanding” Amalgamated provided an excellent level of community development services. Directors, officers, and employees of Amalgamated participated in over 200 approved community development services during the evaluation period. Below are some of the highlights of Amalgamated’s community development services:
Several senior bank officers are involved with numerous nonprofit organizations in the area that provided services for LMI individuals. The officers provide financial education including the basics of banking, debt management, understanding credit, and small business guidance.
A community impact business development officer is a board member of an independent not-for-profit corporation that supports economic revitalization of upper Manhattan through job creation, corporate alliances, strategic investments, and small business assistance. The corporation is a U.S. Treasury certified CDFI.
A senior marketing manager is a junior advisory board member for a multi-service community agency serving those who live, work, or go to school in the Chelsea neighborhood of New York City, with a focus on those in need. The agency offers programs in adult services, mental health services, and youth development and education. Its early childhood education program offers low-cost and free care, as well as free nutritious meals.
A branch manager is a board member of a not-for-profit corporation that administers a local business improvement district in Brooklyn. The organization seeks to revitalize the community and enhance the quality of life of residents. Services provided by the organization include direct services, advocacy, and outreach.
A commercial service officer is a treasurer for a nonprofit organization that promotes self-sufficiency to low-income individuals and families who are facing hardship. The organization offers social service programs, youth educational and employment programs, and various food assistance programs.
A community development officer serves on the advisory board of a Queens County high school. The board’s responsibilities are to review career focused academies, including business and law, and to meet and provide guidance to students that are interested in specific careers such as banking and finance. According to the NYS Department of Education, 79% of its students are eligible for either free or reduced priced lunches.
Several branch managers participated in financial literacy education for LMI individuals and first-time home buyer education classes in partnership with local

4 - 19
community organizations.
An underwriter is a board member of a community foundation that connects donors to the causes they care about most in New York City. Grants from the foundation supports many areas including affordable housing, education, and social justice for all residents in the area.
Additional Factors The following factors were also considered in assessing Amalgamated’s record of performance. The extent of participation by the banking institution’s board of directors or board of trustees in formulating the banking institution’s policies and reviewing its performance with respect to the purposes of the CRA. Amalgamated’s board has designated the board’s compliance and operational risk committee with the oversight of the Bank’s CRA performance. The committee annually reviews and approves the Bank’s CRA policy. The CRA officer in 2015 drafted a CRA plan that covered the period 2014-2017. The plan sets specific goals for lending, services, and investments. In 2016, the Bank raised the goals in hopes of achieving an outstanding rating. To achieve these goals the Bank established a CRA task force led by the president and CEO, which meets monthly to evaluate the Bank’s progress. Management is kept abreast of CRA activities via quarterly meetings of the compliance and CRA committees. On an annual basis, the CRA Officer presents a CRA progress report to the board’s compliance and operational risk committee for their review and approval. Discrimination and other illegal practices Any practices intended to discourage applications for types of credit set forth in the
banking institution’s CRA Public File.
DFS did not note practices by Amalgamated intended to discourage applications for the types of credit offered by the Bank.
Evidence of prohibited discriminatory or other illegal credit practices.
DFS did not note evidence of prohibited discriminatory or other illegal practices. Process Factors Activities conducted by the banking institution to ascertain the credit needs of its
community, including the extent of the banking institution’s efforts to communicate

4 - 20
with members of its community regarding the credit services being provided by the banking institution.
Amalgamated’s effort to ascertain the credit needs of its community included meeting with local community organizations who serve LMI individuals and small businesses. Several branch managers met with these organizations on a number of occasions during the evaluation period to discuss community needs. Furthermore, some senior bank officers and branch managers are board members of some of these organizations. Community needs are discussed as a part of these organizations’ regular board meetings.
The extent of the banking institution’s marketing and special credit-related programs
to make members of the community aware of the credit services offered by the banking institution
Amalgamated’s marketing includes brochures, advertising on its website, and paid online advertising. The Bank also uses social media to inform and reach out to its customers, as well as direct mailings and email marketing to customers in LMI areas. Amalgamated also did an ad campaign in the New York City subway to promote the Bank’s mission to ensure all communities have access to banking services. Amalgamated’s special effort to reach LMI individuals and geographies included print ads targeting consumers and realtors in LMI areas. In early 2017, Amalgamated started to promote its LMI “First Home First Priority” mortgage loan program in LMI communities within the assessment area. Amalgamated also conducted first-time homebuyer and financial literacy workshops in branches located in LMI areas and in collaboration with local nonprofit organizations who serve LMI individuals.
Neither Amalgamated nor DFS received any written complaints regarding the bank’s CRA performance during the evaluation period.
Other factors that in the judgment of the Superintendent bear upon the extent to which Amalgamated is helping to meet the credit needs of its entire community DFS noted no other factors.

5 - 1
GLOSSARY Aggregate Penetration Rate The number of loans originated and purchased by all reporting lenders in specified categories as a percentage of the aggregate number of loans originated and purchased by all reporting lenders in the assessment area. Community Development “Community development”: 1. Affordable housing (including multifamily housing) for low- or moderate-income (“LMI”)
individuals; 2. Community services targeted to LMI individuals; 3. Activities that promote economic development by financing business or farms that
meet the size eligibility standards of the United States Small Business Administration (“SBA”) Development Company or Small Business Investment Company programs, or have gross annual incomes of $1 million or less;
4. Activities that revitalize or stabilize LMI geographies; and 5. Activities that seek to prevent defaults and/or foreclosures in loans included in (1) and
(3) above. Community Development Loan A loan that has its primary purpose community development. This includes but is not limited to loans to: Borrowers for affordable housing rehabilitation and construction, including
construction and permanent financing for multifamily rental property serving low or moderate income (“LMI”) persons;
Nonprofit organizations serving primarily LMI or other community development needs; Borrowers to construct or rehabilitate community facilities that are located in LMI areas
or that primarily serve LMI individuals; Financial intermediaries including community development financial institutions,
community development corporations, minority- and women-owned financial institutions, community loan funds or pools, micro-finance institutions, and low-income or community development credit unions that primarily lend or facilitate lending to promote community development;
Local, state and tribal governments for community development activities; and Borrowers to finance environmental clean up or redevelopment of an industrial site as
part of an effort to revitalize the LMI community in which the property is located.
5 - 2
Community Development Service Service that has community development as its primary purpose, is related to the provision of financial services, and has not been considered in the evaluation of the banking institution's retail banking services. This includes but is not limited to:
Providing technical assistance on financial matters to nonprofit, tribal or government
organizations serving LMI housing or economic revitalization and development needs; Providing technical assistance on financial matters to small businesses or community
development organizations; Lending employees to provide financial services for organizations facilitating
affordable housing construction and rehabilitation or development of affordable housing;
Providing credit counseling, home buyers and home maintenance counseling, financial planning or other financial services education to promote community development and affordable housing;
Establishing school savings programs for LMI individuals; Providing seminars for LMI persons on banking and bank account record-keeping; Making ATM “Training Machines” available for extended periods at LMI community
sites or at community facilities that serve LMI individuals; and Technical assistance activities to community development organizations such as: Serving on a loan review committee; Developing loan application and underwriting standards; Developing loan processing systems; Developing secondary market vehicles or programs; Assisting in marketing financial services, including the development of advertising
and promotions, publications, workshops and conferences; Furnishing financial services training for staff and management; Contributing accounting/bookkeeping services; and Assisting in fund raising, including soliciting or arranging investments.
Geography A census tract delineated by the United States Bureau of the Census in the most recent decennial census Home Mortgage Disclosure Act (“HMDA”) The Home Mortgage Disclosure Act, enacted by Congress in 1975, and subsequently amended, requires institutions to annually report data about applications for residential (including multifamily) financing. Income Level

5 - 3
The income level for borrowers is based on household or family income. A geography’s income is categorized by median family income for the geography. In both cases, the income is compared to the MSA or statewide nonmetropolitan median income.
Income level of individual or geography % of the area median income Low-income Less than 50Moderate-income At least 50 and less than 80 Middle-income At least 80 and less than 120 Upper-income 120 or more
Small Business Loan A small business loan is a loan less than or equal to $1 million. Low or Moderate Income (“LMI”) Geographies Those census tracts or block numbering areas where, according to the 2000 U.S. Census, the median family income is less than 80% of the area median family income. In the case of tracted areas that are part of a Metropolitan Statistical Area (“MSA”) or Primary Metropolitan Statistical Area (“PMSA”), this would relate to the median family income for the MSA or PMSA in which the tracts are located. In the case of BNAs and tracted areas that are not part of a MSA or PMSA, the area median family income would be the statewide non-metropolitan median family income. LMI Borrowers Borrowers whose income, as reported on the loan application which the lender relied upon in making the credit decision, is less than 80% of the area median family income. In cases where the residential property is located in a MSA or PMSA, this would relate to the median family income for that MSA or PMSA. Otherwise, the area median family income would be the statewide non-metropolitan median family income. In all instances, the area median family incomes used to measure borrower income levels are updated annually by the U.S. Department of Housing and Urban Development (“HUD”). LMI Individuals/Persons Individuals or persons whose income is less than 80% of the area median family income. In the case where the individual resides in a MSA or PMSA, this would relate to the median family income for that MSA or PMSA. Otherwise, the area median family income would be the statewide non-metropolitan median family income. In all instances, the area median family incomes used to measure individual income levels are updated annually by HUD. LMI Penetration Rate

5 - 4
A number that represents the percentage of a bank’s total loans (for a particular product) that was extended to LMI geographies or borrowers. For example, an LMI penetration rate of 20% would indicate that the bank made 20 out of a total of 100 loans in LMI geographies or to LMI borrowers. Low-Income Housing Tax Credit (LIHTC) A dollar for dollar tax credit for affordable housing, created under the Tax Reform Act of 1986, that provides incentives to invest in projects for the utilization of private equity in the development of affordable housing aimed at low income Americans. It is also more commonly called Section 42 credits in reference to the applicable section of the IRC. The tax credits are more attractive than tax deductions as they provide a dollar for dollar reduction in a taxpayer’s federal income tax. It is more commonly attractive to corporations since the passive loss rules and similar tax changes greatly reduced the value of tax credits and deductions to individual taxpayers. New Markets Tax Credit (NMTC) The New Markets Tax Credits (NMTC) Program was established by Congress in December 2000 to stimulate economic and community development and job creation in low-income communities. It permits individual and corporate taxpayers to receive a credit against federal income taxes for making qualified equity investments in Community Development Entities (CDEs). The credit provided to the investor totals 39% of the cost of the investment and is claimed over a 7-year period. CDEs must use substantially all of the taxpayer’s investments to make qualified investments in low-income communities. The Fund is administered by the US Treasury Department’s Community Development Financial Institutions Fund (CDFI). Qualified Investment A lawful investment, deposit, membership share or grant that has community development as its primary purpose. This includes but is not limited to investments, deposits, membership shares or grants in or to: Financial intermediaries (including community development financial institutions,
community development corporations, minority- and women-owned financial institutions, community loan funds, micro-finance institutions and low-income or community development credit unions) that primarily lend or facilitate lending in LMI areas or to LMI individuals in order to promote community development;
Organizations engaged in affordable housing rehabilitation and construction; Organizations, including, for example, small business investment corporations that
promote economic development by financing small businesses; Facilities that promote community development in LMI areas or LMI individuals, such
as youth programs, homeless centers, soup kitchens, health care facilities, battered women’s centers, and alcohol and drug recovery centers;
Projects eligible for low-income housing tax credits;

5 - 5
State and municipal obligations, such as revenue bonds that specifically support affordable housing or other community development needs;
Organizations serving LMI housing or other community development needs, such as counseling for credit, home ownership, home maintenance, and other financial services education; and
Organizations supporting activities essential to the capacity of LMI individuals or geographies to utilize credit to sustain economic development, such as day care operations and job training programs that facilitate access to permanent jobs.