COMMUNITY PSYCHOGRAPHICS - Retail:360 · COMMUNITY PSYCHOGRAPHICS | LIFEMODE ... will go to...
18
COMMUNITY PSYCHOGRAPHICS Batesville, Mississippi Prepared for Panola Partnership, Inc. January 2014
Transcript of COMMUNITY PSYCHOGRAPHICS - Retail:360 · COMMUNITY PSYCHOGRAPHICS | LIFEMODE ... will go to...

COMMUNITY PSYCHOGRAPHICSBatesville, Mississippi
Prepared forPanola Partnership, Inc.January 2014

2
TAPESTRY SEGMENTATION PROFILE
What Is Tapestry Segmentation?Tapestry Segmentation is a market segmentation system that classifies US neighborhoods based on their socioeconomic and demographic compositions. Tapestry is a system for classifying consumers and constituents using all the variables that can distinguish consumer behavior, from household characteristics such as income and family type to personal traits like age, education, or employment and even housing choices.
Tapestry Segmentation classifies US neighborhoods into 65 distinct market segments. Neighborhoods with the most similar characteristics are grouped together, while neighborhoods with divergent characteristics are separated. Tapestry Segmentation combines the “who” of lifestyle demography with the “where” of local neighborhood geography to create a model of various lifestyle classifications, or segments, of actual neighborhoods with addresses—distinct behavioral market segments.
Who Should Use Tapestry Segmentation?All companies, agencies, and organizations need to understand consumers/constituents in order to supply them with the right products and services and to reach them via their preferred media. These applications require a robust segmentation system that can accurately profile these diverse markets. The versatility and predictive power of Tapestry Segmentation allow users to integrate their own data or national consumer surveys into Tapestry Segmentation to identify their best market segments and reach them through the most effective channels.
Tapestry Segmentation Summary GroupsEsri’s Tapestry Segmentation provides a robust, powerful portrait of the 65 US consumer markets. To provide a broader view of these 65 segments, Esri combined them into 12 LifeMode Summary Groups based on lifestyle and lifestage composition.
L1 High SocietyL2 Upscale AvenuesL3 MetropolisL4 Solo ActsL5 Senior StylesL6 Scholars and Patriots L7 High HopesL8 Global RootsL9 Family PortraitL10 Traditional LivingL11 Factories and FarmsL12 American Quilt

3
TAPESTRY SEGMENTATION PROFILE
Income Range of LifeMode Summary Groups
$16,820 per year $182,041 per year
L1 High Society
L2 Upscale Avenues
L3 Metropolis
L4 Solo Acts
L5 Senior Styles
L6 Scholars and Patriots
L7 High Hopes
L8 Global Roots
L9 Family Portrait
L10 Traditional Living
L11 Factories and Farms
L12 American Quilt

4
Dominant Tapestry Site MapBatesville City, MS Prepared by The Retail Coach, L.L.C.2803620 (Batesville city)Geography: Popular places
January 22, 2014
Made with Esri Business Analyst©2014 Esri www.esri.com/ba 800-447-9778 Try it Now! Page 1 of 2
Source: Esri
COMMUNITY PSYCHOGRAPHICS | LIFEMODE SUMMARY GROUPS MAPBatesville, Mississippi
L1 High SocietyAffluent, well educated, married-couple homeowners
L2 Upscale AvenuesProsperous, married-couple homeowners in different housing
L3 MetropolisCity dwellers in older homes reflecting the diversity of urban culture
L4 Solo ActsUrban young singles on the move
L5 Senior StylesSenior lifestyles by income, age and housing
L6 Scholars and PatriotsCollege, military environments
L7 High HopesYoung households striving for the "American Dream"
L8 Global RootsEthnic and culturally diverse families
L9 Family PortraitYouth, family life and children
L10 Traditional LivingMiddle aged, middle income - Middle America
L11 Factories and FarmsHardworking families in small communities, settled near jobs
L12 American QuiltHouseholds in small towns in rural areas

5
TAPESTRY SEGMENTATION HOUSEHOLDS PERCENT CUMULATIVE PERCENT US HOUSEHOLDS PERCENT CUMULATIVE PERCENT INDEX
1 33. Midlife Junction 25.0% 25.0% 2.6% 2.6% 979
2 51. Metro City Edge 20.3% 45.3% 0.9% 3.4% 2353
3 50. Heartland Communities 18.7% 64.0% 2.0% 5.4% 920
4 25. Salt of the Earth 16.8% 80.8% 2.7% 8.1% 631
5 64. City Commons 13.3% 94.1% 0.7% 8.8% 1946
Subtotal 94.1% 8.9%
6 56. Rural Bypasses 5.6% 99.7% 1.5% 10.3% 377
7 42. Southern Satellites 0.3% 100.0% 2.6% 12.9% 12
Subtotal 5.9% 4.1%
Total 100.0% 13.0% 769
COMMUNITY PSYCHOGRAPHICS | TOP TAPESTRY SEGMENTSBatesville, Mississippi

6
Batesville, Mississippi
SummaryHousehold/Median Age Mixed/41.8
Median Household Income $48,161
Employment Professional, management, services
Education Some college
Housing/Median Home Value Single family, multiunit/$131,464
Race/Ethnicity White
Lifestyle Go fishing; attend tennis matches
DemographicThe median age for residents in these neighborhoods is 41.8 years; nearly 20 per-cent are aged 65 years or older. Households are a mix of family types and singles who live alone or share housing. Nearly half are married-couple families; 31 percent are singles. Most of these residents are white.
SocioeconomicMost are still working; although at 61 percent, the labor force participation rate is slightly below average. A third of the households receive Social Security. The median household income of $48,161 is slightly below the US median; the median net worth is $80,220. Educational attainment levels are comparable to the US levels.
ResidentialAlthough scattered in suburbs across the country, these neighborhoods are found more frequently in the South and Midwest. Sixty-five percent of residents own their homes, close to the US rate. Nearly two-thirds of the housing is single family; the remainder are primarily apartments in multiunit buildings. The median home value of $131,464 is lower than the US median of $157,913.
PreferencesMidlife Junction residents live quiet, settled lives as they move from child-rearing into retirement. To finance their retirement, they own certificates of deposit, sav-ings bonds, and IRAs. They’re careful spenders, always looking for bargains, and not swayed by fads.
On weekends, they eat fast food or go to family restaurants such as Friendly’s or Perkins. They drive standard-sized domestic cars and shop by mail or phone from the L.L. Bean and JCPenney catalogs. They communicate with friends and family by e-mail. They go fishing, take walks, work crossword puzzles, play board games, do woodworking, and read science fiction or romance novels. They watch TV network shows and news programs.
33. MIDLIFE JUNCTION – 25.0%

7
Batesville, Mississippi
SummaryHousehold/Median Age Family mix/29.4
Median Household Income $33,018
Employment Services, skilled, professional, management
Education No HS diploma, HS graduate
Housing/Median Home Value Single family, duplex/$70,892
Race/Ethnicity Black; White; American Indian
Lifestyle Buy baby products; go to the movies frequently
DemographicMarried couples, single parents, and multigenerational families are the household types found in Metro City Edge neighborhoods. Grandparents are caregivers in 4 percent of these households, twice the US rate. The median age of this segment is 29.4 years because of the children, including adult children who still live at home. The average family size of 3.5 is slightly higher than the US average. Seventy-two percent of the residents are black; 17.3 percent are white; and 4 percent are Ameri-can Indian—four times the US level.
SocioeconomicThe median household income for this segment is $33,018; the median net worth is $14,773. Although 78 percent of households derive income from wages and salaries, 9 percent receive public assistance and 9 percent receive Supplemental Security Income. Nearly half of employed residents work in service industries. Un-employment is more than double the US level. One in ten residents aged 25 years or older have a bachelor’s or graduate degree; four in ten have attended college.
ResidentialMetro City Edge residents live in older suburban neighborhoods of large metropoli-tan cities, primarily in the Midwest and South. Sixty-eight percent live in single-fam-ily homes; 14 percent live in buildings with two to four units. The home ownership rate is 53 percent; the median home value is $70,892. Although home prices are relatively inexpensive, many families are young, unsettled, and still renting. Seventy percent of the housing units were built before 1970.
PreferencesMetro City Edge residents must spend their money wisely to ensure the welfare of their children. They tend to shop for groceries at Piggly Wiggly, Kroger, and Aldi but will go to superstores and wholesalers for bulk purchases of household and chil-dren’s items. Some will have their vehicles serviced at auto parts chains. They eat at fast-food or family-style restaurants such as Old Country Buffet or Ryan’s.
They watch sitcoms, movies, news programs, courtroom shows, and sports such as pro wrestling on TV. Accessing the Internet at home isn’t important. They go to the movies and professional football games and play basketball. They read music and baby magazines and listen to urban and contemporary hit radio.
51. METRO CITY EDGE – 20.3%

8
Batesville, Mississippi
SummaryHousehold/Median Age Mixed/42.8
Median Household Income $35,160
Employment Skilled, professional, management, services
Education No HS diploma, HS graduate
Housing/Median Home Value Single family/$78,489
Race/Ethnicity White
Lifestyle Work on lawn, gardening, DIY projects; order products from Avon
DemographicSettled and close-knit, residents of Heartland Communities have a median age of 42.8 years. Approximately half of the residents have already retired, many in the same towns where they have lived and worked their whole lives. Nearly half are aged 55 years or older. Although married-couple families comprise nearly half of the household types and almost one-third are singles who live alone, other family types and shared housing are also represented. Children are found in 30 percent of the households. Diversity is minimal; nearly 9 in 10 residents are white.
SocioeconomicThe median household income is $35,160. Two-thirds of the households earn wage and salary income, and 39 percent receive Social Security benefits. Because of low home value, their median net worth is $46,091. Employed residents work in occupa-tions ranging from management positions to unskilled labor jobs; approximately 40 percent are employed in service industries. The percentage of the population aged 25 years or older that has completed high school is higher than the US level; the percentage that has attended college is far lower than the US figure.
ResidentialHome to six million people, Heartland Communities neighborhoods are found primarily in small towns scattered across the Midwest and South. Low-density neighborhoods dominate, with older homes in urban clusters and rural, nonfarm areas. More than half of the housing units were built before 1960. Home ownership is at 71 percent; the median home value is $78,489, less than half of the US median. More than three-fourths of the housing is single-family dwellings.
PreferencesHeartland Communities residents invest time and money in their cherished homes and communities. They take pride in their gardening skills and in growing their own vegetables. Many homes own a riding lawn mower to keep up their relatively large lots. Residents tackle home improvement projects such as exterior painting and faucet replacement and shop at Ace Hardware or Lowe’s. Many residents order items from catalogs, QVC, and Avon sales representatives. They also shop at Wal-Mart or Kmart and buy groceries at Wal-Mart Supercenters. Favorite restaurants include Golden Corral and Cracker Barrel. The residents in this segment rarely travel by plane.
Heartland Communities residents have a distinctly country lifestyle. They go hunting and fishing. They also read gardening, fishing, and hunting magazines and listen to country music and auto races on the radio. Reading two or more Sunday newspa-pers is important to them. Some join fraternal orders or religious clubs and even get involved with local politics. Many Heartland Communities households subscribe to cable and usually watch news programs and movies on TV.
50. HEARTLAND COMMUNITIES – 18.7%

9
Batesville, Mississippi
SummaryHousehold/Median Age Married-couple families/41.8
Median Household Income Middle/$50,406
Employment Skilled, professional, management
Education HS graduate, some college
Housing/Median Home Value Single family/$124,189
Race/Ethnicity White
Lifestyle Gardening, outdoor projects; go hunting and target shooting
DemographicSixty-five percent of Salt of the Earth households are married couples with and without children. Twenty percent of the households are singles who live alone. The average household size of 2.6 people matches the US figure; the average family size of three is below the US value. The median age is 41.8 years. These neighborhoods are the least diverse of the Tapestry segments.
SocioeconomicAlthough these residents are older, the labor participation rate is higher than that of the United States, and the unemployment rate of 9.6 percent is lower. They work in professional and managerial positions and unskilled labor jobs. Higher than aver-age proportions work in skilled labor occupations. Approximately 20 percent of the workers are employed in the manufacturing sector. The median household income of $50,406, slightly lower than the US figure. At higher than national rates, residents supplement their wages with income from interest, dividends, rental properties, self-employment businesses, retirement plans, and Social Security benefits. The median net worth is $104,721. Forty-one percent of the residents aged 25 years and older have attended college; 15 percent have earned a bachelor’s or graduate degree.
ResidentialAlthough these neighborhoods are found in rural areas across the United States, nearly half are in the Midwest, with concentrations in Pennsylvania, Ohio, Indiana, and Michigan. The other half are in the South and Northeast. Eighty-four percent of the residents own their homes; the median home value is $124,189. Most of the housing is single family; 12 percent are mobile homes. Twenty-two percent of the homes were built before 1940.
PreferencesSalt of the Earth residents are settled, traditional, and hardworking. Independent and self-reliant, they tackle small home improvement and remodeling projects. They spend money and time on their flower and vegetable gardens and own the neces-sary tools to handle these chores successfully. Twenty-eight percent of the house-holds own three or more vehicles including a truck; many own a motorcycle. One of Tapestry Segmentation’s top segments for owning or leasing multiple vehicles, these residents prefer domestic vehicles and do their own maintenance. Most of them carry insurance policies to protect themselves and their families. They invest in annuities, certificates of deposit, and US savings bonds. Many families own two or more pets, either dogs or cats.
They eat out at family restaurants such as Bob Evans Farms or Cracker Barrel. Satis-fying their sweet tooth, they often bake goodies at home. They go fishing, hunting, target shooting, and boating and work out on indoor exercise equipment such as stationary bikes and treadmills. They read fishing and hunting magazines. They listen to country music radio and follow NASCAR racing. Many households own a satellite dish so they can watch CMT and the Speed Channel. Favorite TV programs include auto racing, horse racing, truck and tractor pulls/mud racing, and weekly sitcoms.
25. SALT OF THE EARTH – 16.8%

10
Batesville, Mississippi
SummaryHousehold/Median Age Single-parent families, singles/24.6
Median Household Income $16,830
Employment Services
Education No HS diploma, HS graduate
Housing/Median Home Value Multiunit rental/$67,943
Race/Ethnicity Black
Lifestyle Buy baby/children's products; read a variety of magazines
DemographicSingle-parent families or singles who live alone comprise most of these very young households. With a median age of 24.6 years, City Commons is one of Tapestry Segmentation’s youngest segments. Approximately half of the households have children; some households are multigenerational, with adults still living at home or grandparents who provide child care. The average household size of 2.8 is higher than the national average. Since 2000, population in these areas has declined at 0.4 percent per year. These neighborhoods are not ethnically diverse; 81 percent of the population is black.
SocioeconomicThirty-one percent of the residents who work are employed in service occupa-tions (twice the national level). Nineteen percent of the households are on public assistance; 13 percent receive Supplemental Social Security income. Overall, more than 60 percent of the residents aged 25 years and older have graduated from high school. Six percent hold a bachelor’s or graduate degree; 27 percent have attended college. Because they have limited employment options, more residents work part-time than full-time. Unemployment is at 30 percent, the highest rate among the Tapestry segments, and almost three times that of the national level. The median household income is $16,830, and the median net worth is $9,958.
ResidentialCity Commons neighborhoods are found in large metropolitan areas, mainly in the South and Midwest. More than three-fourths of the households rent. Sixty-three percent rent apartments in multiunit buildings, primarily with fewer than 20 units. One-fourth of the housing is single-family dwellings. The median home value is $67,943. Typical of a young renters’ market, these residents are movers; nearly 50 percent have relocated within the last five years.
PreferencesCity Commons residents buy baby and children’s products, food, and clothing most frequently. They shop primarily at discount stores and occasionally at department stores. Most families enjoy eating at fast-food restaurants several times a month. For exercise, they take their children to nearby city parks and playgrounds. Occa-sionally, they go to basketball games. An annual travel destination is probably to a theme park. They watch daytime courtroom and talk show programs and primetime TV shows. They would rather go to the movies than rent films to watch at home. They buy game systems for their children and listen to urban radio.
64. CITY COMMONS – 13.3%
11
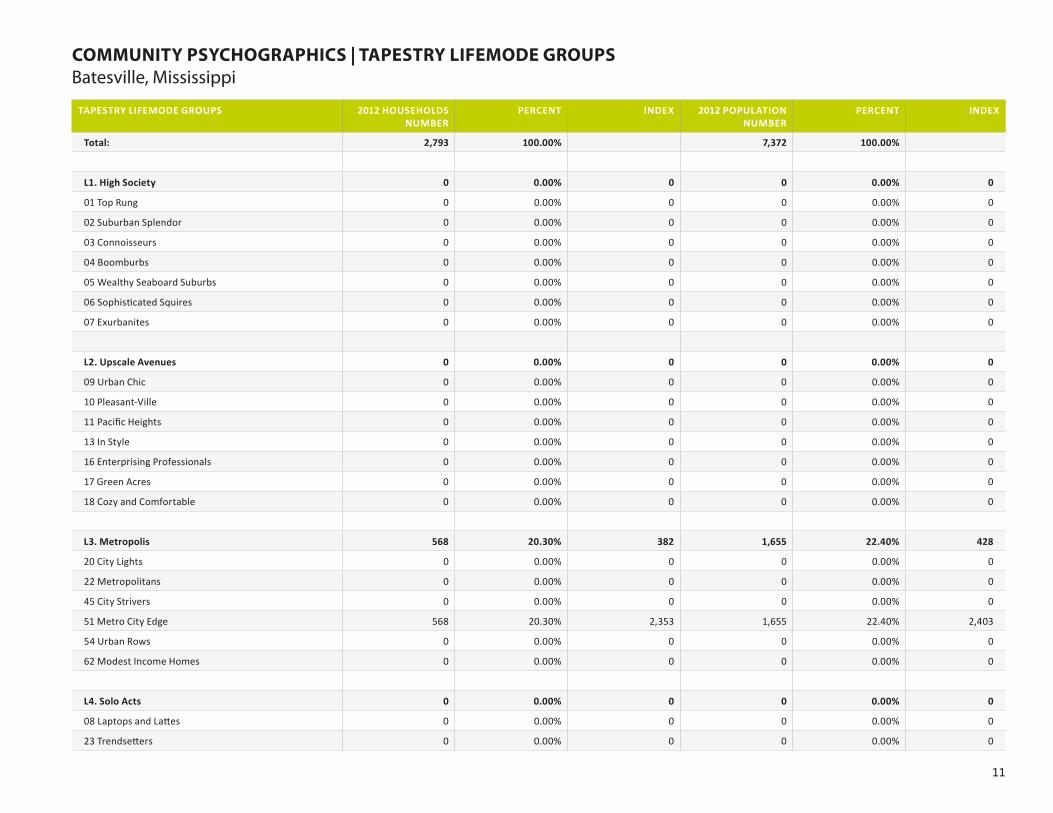
TAPESTRY LIFEMODE GROUPS 2012 HOUSEHOLDS NUMBER
PERCENT INDEX 2012 POPULATION NUMBER
PERCENT INDEX
Total: 2,793 100.00% 7,372 100.00%
L1. High Society 0 0.00% 0 0 0.00% 0
01 Top Rung 0 0.00% 0 0 0.00% 0
02 Suburban Splendor 0 0.00% 0 0 0.00% 0
03 Connoisseurs 0 0.00% 0 0 0.00% 0
04 Boomburbs 0 0.00% 0 0 0.00% 0
05 Wealthy Seaboard Suburbs 0 0.00% 0 0 0.00% 0
06 Sophisticated Squires 0 0.00% 0 0 0.00% 0
07 Exurbanites 0 0.00% 0 0 0.00% 0
L2. Upscale Avenues 0 0.00% 0 0 0.00% 0
09 Urban Chic 0 0.00% 0 0 0.00% 0
10 Pleasant-Ville 0 0.00% 0 0 0.00% 0
11 Pacific Heights 0 0.00% 0 0 0.00% 0
13 In Style 0 0.00% 0 0 0.00% 0
16 Enterprising Professionals 0 0.00% 0 0 0.00% 0
17 Green Acres 0 0.00% 0 0 0.00% 0
18 Cozy and Comfortable 0 0.00% 0 0 0.00% 0
L3. Metropolis 568 20.30% 382 1,655 22.40% 428
20 City Lights 0 0.00% 0 0 0.00% 0
22 Metropolitans 0 0.00% 0 0 0.00% 0
45 City Strivers 0 0.00% 0 0 0.00% 0
51 Metro City Edge 568 20.30% 2,353 1,655 22.40% 2,403
54 Urban Rows 0 0.00% 0 0 0.00% 0
62 Modest Income Homes 0 0.00% 0 0 0.00% 0
L4. Solo Acts 0 0.00% 0 0 0.00% 0
08 Laptops and Lattes 0 0.00% 0 0 0.00% 0
23 Trendsetters 0 0.00% 0 0 0.00% 0
COMMUNITY PSYCHOGRAPHICS | TAPESTRY LIFEMODE GROUPSBatesville, Mississippi

12
TAPESTRY LIFEMODE GROUPS 2012 HOUSEHOLDS NUMBER
PERCENT INDEX 2012 POPULATION NUMBER
PERCENT INDEX
27 Metro Renters 0 0.00% 0 0 0.00% 0
36 Old and Newcomers 0 0.00% 0 0 0.00% 0
39 Young and Restless 0 0.00% 0 0 0.00% 0
L5. Senior Styles 521 18.70% 148 1,336 18.10% 170
14 Prosperous Empty Nesters 0 0.00% 0 0 0.00% 0
15 Silver and Gold 0 0.00% 0 0 0.00% 0
29 Rustbelt Retirees 0 0.00% 0 0 0.00% 0
30 Retirement Communities 0 0.00% 0 0 0.00% 0
43 The Elders 0 0.00% 0 0 0.00% 0
49 Senior Sun Seekers 0 0.00% 0 0 0.00% 0
50 Heartland Communities 521 18.70% 920 1,336 18.10% 974
57 Simple Living 0 0.00% 0 0 0.00% 0
65 Social Security Set 0 0.00% 0 0 0.00% 0
L6. Scholars & Patriots 0 0.00% 0 0 0.00% 0
40 Military Proximity 0 0.00% 0 0 0.00% 0
55 College Towns 0 0.00% 0 0 0.00% 0
63 Dorms to Diplomas 0 0.00% 0 0 0.00% 0
L7. High Hopes 0 0.00% 0 0 0.00% 0
28 Aspiring Young Families 0 0.00% 0 0 0.00% 0
48 Great Expectations 0 0.00% 0 0 0.00% 0
L8. Global Roots 0 0.00% 0 0 0.00% 0
35 International Marketplace 0 0.00% 0 0 0.00% 0
38 Industrious Urban Fringe 0 0.00% 0 0 0.00% 0
44 Urban Melting Pot 0 0.00% 0 0 0.00% 0
47 Las Casas 0 0.00% 0 0 0.00% 0
52 Inner City Tenants 0 0.00% 0 0 0.00% 0
58 NeWest Residents 0 0.00% 0 0 0.00% 0
COMMUNITY PSYCHOGRAPHICS | TAPESTRY LIFEMODE GROUPSBatesville, Mississippi

13
TAPESTRY LIFEMODE GROUPS 2012 HOUSEHOLDS NUMBER
PERCENT INDEX 2012 POPULATION NUMBER
PERCENT INDEX
60 City Dimensions 0 0.00% 0 0 0.00% 0
61 High Rise Renters 0 0.00% 0 0 0.00% 0
L9. Family Portrait 372 13.30% 150 1,010 13.70% 131
12 Up and Coming Families 0 0.00% 0 0 0.00% 0
19 Milk and Cookies 0 0.00% 0 0 0.00% 0
21 Urban Villages 0 0.00% 0 0 0.00% 0
59 Southwestern Families 0 0.00% 0 0 0.00% 0
64 City Commons 372 13.30% 1,946 1,010 13.70% 1,933
L10. Traditional Living 698 25.00% 311 1,589 21.60% 280
24 Main Street, USA 0 0.00% 0 0 0.00% 0
32 Rustbelt Traditions 0 0.00% 0 0 0.00% 0
33 Midlife Junction 698 25.00% 979 1,589 21.60% 947
34 Family Foundations 0 0.00% 0 0 0.00% 0
L11. Factories & Farms 634 22.70% 243 1,782 24.20% 261
25 Salt of the Earth 469 16.80% 631 1,192 16.20% 616
37 Prairie Living 0 0.00% 0 0 0.00% 0
42 Southern Satellites 9 0.30% 12 21 0.30% 11
53 Home Town 0 0.00% 0 0 0.00% 0
56 Rural Bypasses 156 5.60% 377 569 7.70% 519
L12. American Quilt 0 0.00% 0 0 0.00% 0
26 Midland Crowd 0 0.00% 0 0 0.00% 0
31 Rural Resort Dwellers 0 0.00% 0 0 0.00% 0
41 Crossroads 0 0.00% 0 0 0.00% 0
46 Rooted Rural 0 0.00% 0 0 0.00% 0
66 Unclassified 0 0.00% 0 0 0.00% 0
COMMUNITY PSYCHOGRAPHICS | TAPESTRY LIFEMODE GROUPSBatesville, Mississippi
14
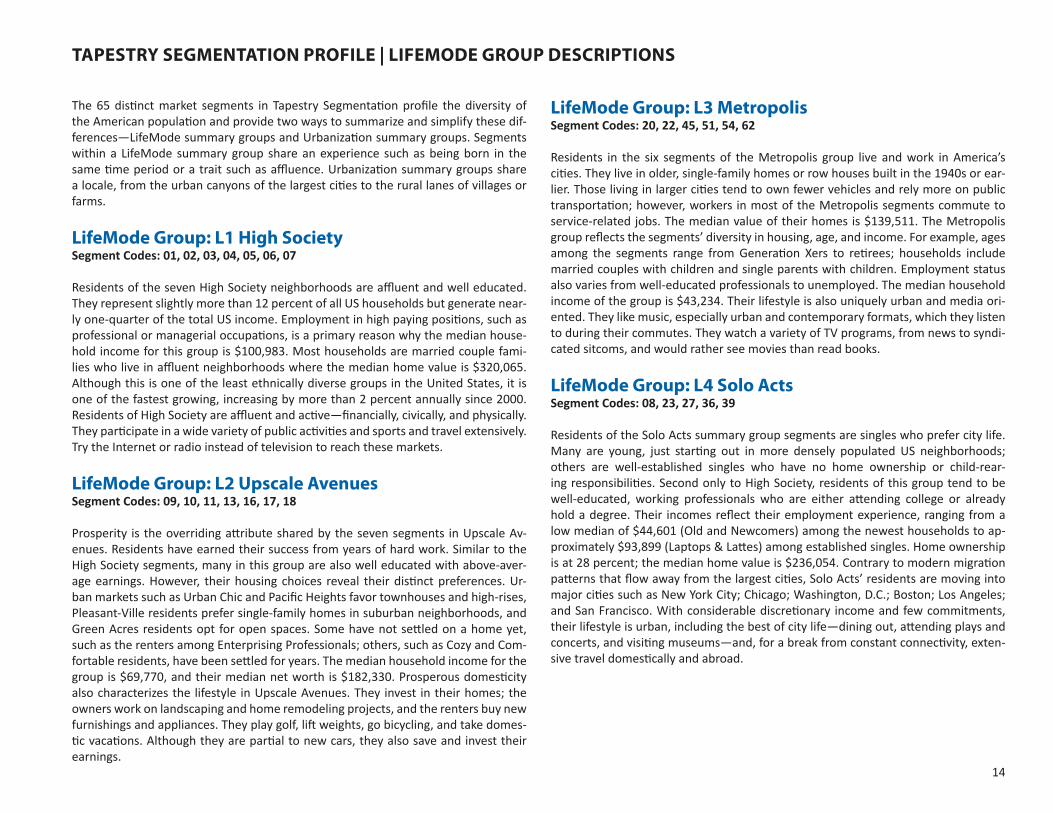
TAPESTRY SEGMENTATION PROFILE | LIFEMODE GROUP DESCRIPTIONS
The 65 distinct market segments in Tapestry Segmentation profile the diversity of the American population and provide two ways to summarize and simplify these dif-ferences—LifeMode summary groups and Urbanization summary groups. Segments within a LifeMode summary group share an experience such as being born in the same time period or a trait such as affluence. Urbanization summary groups share a locale, from the urban canyons of the largest cities to the rural lanes of villages or farms.
LifeMode Group: L1 High SocietySegment Codes: 01, 02, 03, 04, 05, 06, 07
Residents of the seven High Society neighborhoods are affluent and well educated. They represent slightly more than 12 percent of all US households but generate near-ly one-quarter of the total US income. Employment in high paying positions, such as professional or managerial occupations, is a primary reason why the median house-hold income for this group is $100,983. Most households are married couple fami-lies who live in affluent neighborhoods where the median home value is $320,065. Although this is one of the least ethnically diverse groups in the United States, it is one of the fastest growing, increasing by more than 2 percent annually since 2000. Residents of High Society are affluent and active—financially, civically, and physically. They participate in a wide variety of public activities and sports and travel extensively. Try the Internet or radio instead of television to reach these markets.
LifeMode Group: L2 Upscale AvenuesSegment Codes: 09, 10, 11, 13, 16, 17, 18
Prosperity is the overriding attribute shared by the seven segments in Upscale Av-enues. Residents have earned their success from years of hard work. Similar to the High Society segments, many in this group are also well educated with above-aver-age earnings. However, their housing choices reveal their distinct preferences. Ur-ban markets such as Urban Chic and Pacific Heights favor townhouses and high-rises, Pleasant-Ville residents prefer single-family homes in suburban neighborhoods, and Green Acres residents opt for open spaces. Some have not settled on a home yet, such as the renters among Enterprising Professionals; others, such as Cozy and Com-fortable residents, have been settled for years. The median household income for the group is $69,770, and their median net worth is $182,330. Prosperous domesticity also characterizes the lifestyle in Upscale Avenues. They invest in their homes; the owners work on landscaping and home remodeling projects, and the renters buy new furnishings and appliances. They play golf, lift weights, go bicycling, and take domes-tic vacations. Although they are partial to new cars, they also save and invest their earnings.
LifeMode Group: L3 MetropolisSegment Codes: 20, 22, 45, 51, 54, 62
Residents in the six segments of the Metropolis group live and work in America’s cities. They live in older, single-family homes or row houses built in the 1940s or ear-lier. Those living in larger cities tend to own fewer vehicles and rely more on public transportation; however, workers in most of the Metropolis segments commute to service-related jobs. The median value of their homes is $139,511. The Metropolis group reflects the segments’ diversity in housing, age, and income. For example, ages among the segments range from Generation Xers to retirees; households include married couples with children and single parents with children. Employment status also varies from well-educated professionals to unemployed. The median household income of the group is $43,234. Their lifestyle is also uniquely urban and media ori-ented. They like music, especially urban and contemporary formats, which they listen to during their commutes. They watch a variety of TV programs, from news to syndi-cated sitcoms, and would rather see movies than read books.
LifeMode Group: L4 Solo ActsSegment Codes: 08, 23, 27, 36, 39
Residents of the Solo Acts summary group segments are singles who prefer city life. Many are young, just starting out in more densely populated US neighborhoods; others are well-established singles who have no home ownership or child-rear-ing responsibilities. Second only to High Society, residents of this group tend to be well-educated, working professionals who are either attending college or already hold a degree. Their incomes reflect their employment experience, ranging from a low median of $44,601 (Old and Newcomers) among the newest households to ap-proximately $93,899 (Laptops & Lattes) among established singles. Home ownership is at 28 percent; the median home value is $236,054. Contrary to modern migration patterns that flow away from the largest cities, Solo Acts’ residents are moving into major cities such as New York City; Chicago; Washington, D.C.; Boston; Los Angeles; and San Francisco. With considerable discretionary income and few commitments, their lifestyle is urban, including the best of city life—dining out, attending plays and concerts, and visiting museums—and, for a break from constant connectivity, exten-sive travel domestically and abroad.

15
LifeMode Group: L5 Senior StylesSegment Codes: 14, 15, 29, 30, 43, 49, 50, 57, 65
More than 14.4 million households in the nine Senior Styles segments comprise one of the largest LifeMode summary groups. As the US population ages, two of the fast-est-growing American markets are found among The Elders and the Silver and Gold segments. Senior Styles segments illustrate the diversity among today’s senior mar-kets. Although incomes within this group cover a wide range, the median is $45,261, attributable mostly to retirement income or Social Security payments. Younger, more affluent seniors, freed of their child-rearing responsibilities, are traveling and relo-cating to warmer climates. Settled seniors are looking forward to retirement and re-maining in their homes. Residents in some of the older, less privileged segments live alone and collect Social Security and other benefits. Their choice of housing depends on their income. This group may reside in single-family homes, retirement homes, or high-rises. Their lifestyles can be as diverse as their circumstances, but senior markets do have common traits among their preferences. Golf is their favorite sport; they play and watch golf on TV. They read the newspaper daily and prefer to watch news shows on television. Although their use of the Internet is nearly average, they are more likely to shop through QVC than online.
LifeMode Group: L6 Scholars and PatriotsSegment Codes: 40, 55, 63
This summary group is unique in the Tapestry Segmentation system. Their shared traits include youth, with the attendant lower incomes, and atypical environments such as college life or military service. Because of their transient lifestyle and life-stage, their home ownership rate is low. Most live in townhouses or apartments, although one-quarter reside in single-family homes. One segment, Military Proximity, is dominated by military life; the other two, College Towns and Dorms and Diplomas, are predominantly students who are pursuing college degrees. Although most of the residents in the military segment are either on active duty or employed in civilian jobs on military bases, the students tend to work part-time at low-paying jobs to support themselves while attending school. However, low personal income does not inhibit their lifestyles. Scholars and Patriots residents’ eclectic tastes in sports range from yoga to football. Electronically savvy, they have wireless Internet connections, note-book computers, iPods, and digital cameras.
LifeMode Group: L7 High HopesSegment Codes: 28, 48
The High Hopes summary group includes Aspiring Young Families and Great Expecta-tions. These residents are a mix of married couples, single parents, and singles who seek the “American Dream” of home ownership and a rewarding job. Most live in single-family houses or multiunit buildings; approximately half own their homes. The median home value is $119,508. Many would move to a new location for better op-portunities. Many are young, mobile, and college educated; one-third are younger than 35 years. The median household income is $47,263, and the median net worth is $29,218.
LifeMode Group: L8 Global RootsSegment Codes: 35, 38, 44, 47, 52, 58, 60, 61
Ethnic diversity is the common thread among the eight segments in Global Roots; the diversity index stands at 89. Las Casas and NeWest Residents represent a strong Hispanic influence in addition to a broad mix of cultural and racial diversity found in Urban Melting Pot and International Marketplace. Typical of new households, Glob-al Roots’ residents are young, earn modest incomes, and tend to rent in multiunit buildings. Their youth reflects recent immigration trends; half of all households have immigrated to the United States within the past 10 years. Married couples, usually with children; single parents; and people who live alone are typical of the household types in the Global Roots segments. Because households with children dominate, it is not surprising that spending is high for baby products, children’s clothing, and toys. Residents of Global Roots are less likely than other groups to have home PCs but just as likely to use cell phones. They maintain ties with friends and relatives in their coun-tries of origin with foreign travel.
TAPESTRY SEGMENTATION PROFILE | LIFEMODE GROUP DESCRIPTIONS

16
LifeMode Group: L9 Family PortraitSegment Codes: 12, 19, 21, 59, 64
Family Portrait has the fastest-growing population of the LifeMode summary groups, driven primarily by the rapid increase in the Up and Coming Families segment. Youth, family life, and the presence of children are the common characteristics across the five markets in Family Portrait. The group is also ethnically diverse: more than 30 per-cent of the residents are of Hispanic descent. The neighborhoods are predominantly composed of homeowners who live in single-family homes. Most households include married couples with children who contribute to the group’s large household size, av-eraging more than 3.1 persons per household. Their lifestyle reflects their youth and family orientation—buying infant and children’s clothing and toys and visiting theme parks and zoos.LifeMode Group:
L10 Traditional LivingSegment Codes: 24, 32, 33, 34
The four segments in Traditional Living convey the perception of real middle Amer-ica—hardworking, settled families. The group’s higher median age of 38.2 years also conveys their lifestage—a number of older residents who are completing their child-rearing responsibilities and anticipating retirement. Even though they’re older, many still work hard to earn a modest living. They typically own single-family homes in established, slow-growing neighborhoods. They buy standard, four-door American cars, belong to veterans’ clubs and fraternal organizations, take care of their homes and gardens, and rely on traditional media such as newspapers for their news.
LifeMode Group: L11 Factories and FarmsSegment Codes: 25, 37, 42, 53, 56
The segments in the Factories and Farms summary group represent rural life—from small towns and villages to farms. Employment in manufacturing and agricultural in-dustries is typical in these small, settled communities across America’s breadbasket. Population change is nominal, and the profile is classic. Most households are families, either married couples or married couples with children. By age, the residents of Factories and Farms mirror the US distribution, with slightly more retirees. Median household income is a bit lower, almost $40,611, but so is the home value of $91,798. Most own their homes. Their lifestyle reflects their locale, emphasizing home and garden care, fishing and hunting, pets, and membership in local clubs.
LifeMode Group: L12 American QuiltSegment Codes: 26, 31, 41, 46
Location in America’s small towns and rural areas links the four segments in American Quilt. Unlike Factories and Farms, this group represents a more diverse microcosm of small-town life, including the largest segment of Tapestry Segmentation, Midland Crowd. Manufacturing and agriculture remain part of the local economy, but Ameri-can Quilt also includes workers in local government, service, construction, communi-cation, and utilities. In addition to farmers, American Quilt includes the Rural Resort Dwellers segment, an older population that is retiring to seasonal vacation spots, and Crossroads, young families who live in mobile homes. Households in American Quilt are also more affluent, with a median household income of $45,501, and more are homeowners. However, the rural lifestyle is also evident, with a preference for fish-ing, hunting, power boats, pickups, and country music.
TAPESTRY SEGMENTATION PROFILE | LIFEMODE GROUP DESCRIPTIONS

17
About The Retail Coach
The Retail Coach, LLC, is a national retail analytics and locational intelligence firm that specializes in all aspects of retail market analyses and recruitment, from “macro to micro” trade area assessment to actively recruiting retailers on behalf of our clients.
Through its unique Retail:360 process, The Retail Coach offers a dynamic system of products and services that better enable communities to maximize their retail development potential.
Retail:360 Process
Providing more than simple data reports of psychographic and demographic trends, The Retail Coach goes well beyond other retail consulting and market research firms’ offerings by combining current national and statewide demographics and trend data with real-world, “on-the-ground” data gathered through extensive visits within our clients’ communities.
Every community is different, and there is no “one size fits all” retail recruitment solution. Compiling the gathered data into client-tailored information packets that are uniquely designed for, and targeted to, specific retailers and restaurants who meet the community’s needs helps assure our clients that they are receiving the latest and best information for their retail recruitment efforts — all with personal service and coaching guidance that continues beyond the initial project scope and timeline.
Our Retail:360 process assures that communities get timely, accurate and relevant information. Translating that data into the information that retailers need and seek assures our clients even better possibilities for tremendous retail growth and success.
The Retail Coach -It’s not about data. It’s about your success.
The Retail Coach, LLC | P. O. Box 7272 | Tupelo, Mississippi 38802tel 800.851.0962 | fax 662.844.2738 | e-mail [email protected] | web www.theretailcoach.net
C. Kelly Cofer President & CEO
The Retail Coach, LLC

18
Acknowledgements
The observations, conclusions and recommendations contained in this study are solely those of The Retail Coach, LLC and should not be construed to represent the opinions of others, including its clients, or any other entity prior to such entity’s express approval of this study.
Sources used in completing this study include: infoUSA™, Applied Geographic Solutions, Nielsen 2013/2014, ESRI 2012/2013, U.S. Census Bureau, Economy.com, CensusViewer.com, International Council of Shopping Centers, and/or U.S. Bureau of Labor and Statistics.
To better represent current data, where applicable, portions of estimated actual sales may be calculated using an average sales per square foot model.
Mapping data is provided by MapInfo, Nielsen, ESRI and/or Microsoft Corporation.
All information furnished is from sources deemed reliable and is submitted subject to errors, omissions, change of terms and/or conditions.