Community Housing Market Report York Region: Vaughan · First Quarter 2018 Toronto Real Estate...
24
Community Housing Market Report York Region: Vaughan Second Quarter 2018
Transcript of Community Housing Market Report York Region: Vaughan · First Quarter 2018 Toronto Real Estate...

Community Housing Market ReportYork Region: Vaughan
Second Quarter 2018

First Quarter 2018
Toronto Real Estate Board
*The source for all slides is the Toronto Real Estate Board. Some statistics are not reported when the number of transactions is two (2) or less.Statistics are updated on a monthly basis. Quarterly community statistics in this report may not match quarterly sums calculated from past TREB publications. 1
ALL HOME TYPES, SECOND QUARTER 2018VAUGHAN COMMUNITY BREAKDOWN
Sales Dollar Volume Average Price Median Price New Listings Active Listings Avg. SP/LP Avg. DOM
Vaughan 847 $833,376,232 $983,915 $896,000 2,495 1,206 97% 24West Woodbridge Industria l A 0 - - - 0 0 - -Kleinburg 46 $58,024,388 $1,261,400 $1,078,750 187 117 97% 27Sonoma Heights 33 $32,760,000 $992,727 $1,005,000 76 30 99% 22Elder Mills 3 $3,005,000 $1,001,667 $865,000 6 2 98% 49Islington Woods 28 $30,432,061 $1,086,859 $1,200,250 53 26 96% 27West Woodbridge 43 $33,273,050 $773,792 $805,000 111 51 97% 24Vaughan Grove 10 $5,313,000 $531,300 $507,500 21 12 98% 22Vellore Village 144 $144,924,100 $1,006,417 $910,000 406 190 97% 25East Woodbridge 73 $78,048,100 $1,069,152 $1,050,000 163 73 98% 29Pine Valley Business Park 0 - - - 0 0 - -Steeles West Industrial 0 - - - 0 0 - -Vaughan Corporate Centre 0 - - - 13 7 - -Rural Vaughan 14 $15,459,675 $1,104,263 $827,500 49 30 96% 23Maple 109 $93,025,388 $853,444 $838,888 250 107 98% 19Concord 20 $12,850,500 $642,525 $542,500 53 32 98% 42Glen Shields 4 $4,082,500 $1,020,625 $981,750 20 8 98% 8Patterson 152 $181,180,510 $1,191,977 $1,042,500 616 291 98% 24Beverley Glen 36 $28,954,500 $804,292 $556,500 85 38 96% 22Brownridge 33 $26,132,800 $791,903 $736,000 87 45 98% 28Lakeview Estates 16 $10,067,000 $629,188 $615,000 38 12 100% 18Uplands 9 $15,916,000 $1,768,444 $1,200,000 56 34 92% 20Crestwood-Springfarm-Yorkhi 74 $59,927,660 $809,833 $628,500 205 101 98% 24
SUMMARY OF EXISTING HOME TRANSACTIONS
Vaughan Community Breakdown
First Quarter 2018
Toronto Real Estate Board
*The source for all slides is the Toronto Real Estate Board. Some statistics are not reported when the number of transactions is two (2) or less.Statistics are updated on a monthly basis. Quarterly community statistics in this report may not match quarterly sums calculated from past TREB publications. 2
0 0 0 0 0 0
Number of Transactions* Average/Median Selling Price (,000s)* Average Selling PriceMedian Selling Price
0 0 0 0 0 0
Number of New Listings*
0% 0% 0% 0% 0% 0%
Sales-to-New Listings Ratio*
Average Days on Market* Average Sale Price to List Price Ratio*
Vaughan: West Woodbridge Industrial Area

First Quarter 2018
Toronto Real Estate Board
*The source for all slides is the Toronto Real Estate Board. Some statistics are not reported when the number of transactions is two (2) or less.Statistics are updated on a monthly basis. Quarterly community statistics in this report may not match quarterly sums calculated from past TREB publications. 3
37
41 0 2 2
Number of Transactions*
$1,379
$827
$1,170
$838
Average/Median Selling Price (,000s)* Average Selling PriceMedian Selling Price
165
141 0 4 3
Number of New Listings*
22% 29%
100%
0%
50%67%
Sales-to-New Listings Ratio*
28
15
Average Days on Market*
97% 99%
Average Sale Price to List Price Ratio*
Vaughan: Kleinburg

First Quarter 2018
Toronto Real Estate Board
*The source for all slides is the Toronto Real Estate Board. Some statistics are not reported when the number of transactions is two (2) or less.Statistics are updated on a monthly basis. Quarterly community statistics in this report may not match quarterly sums calculated from past TREB publications. 4
26
4 30 0 0
Number of Transactions*
$1,053
$788 $745
$1,031
$788 $727
Average/Median Selling Price (,000s)* Average Selling PriceMedian Selling Price
58
153 0 0 0
Number of New Listings*
45%27%
100%
0% 0% 0%
Sales-to-New Listings Ratio*
22 2226
Average Days on Market*
99% 98% 97%
Average Sale Price to List Price Ratio*
Vaughan: Sonoma Heights

First Quarter 2018
Toronto Real Estate Board
*The source for all slides is the Toronto Real Estate Board. Some statistics are not reported when the number of transactions is two (2) or less.Statistics are updated on a monthly basis. Quarterly community statistics in this report may not match quarterly sums calculated from past TREB publications. 5
2
1
0 0 0 0
Number of Transactions* Average/Median Selling Price (,000s)* Average Selling PriceMedian Selling Price
2
4
0 0 0 0
Number of New Listings*
100%
25%
0% 0% 0% 0%
Sales-to-New Listings Ratio*
Average Days on Market* Average Sale Price to List Price Ratio*
Vaughan: Elder Mills

First Quarter 2018
Toronto Real Estate Board
*The source for all slides is the Toronto Real Estate Board. Some statistics are not reported when the number of transactions is two (2) or less.Statistics are updated on a monthly basis. Quarterly community statistics in this report may not match quarterly sums calculated from past TREB publications. 6
17
1 1 0
9
0
Number of Transactions*
$1,443
$473
$1,431
$435
Average/Median Selling Price (,000s)* Average Selling PriceMedian Selling Price
40
1 2 0
10
0
Number of New Listings*
43%
100%
50%
0%
90%
0%
Sales-to-New Listings Ratio*
28 29
Average Days on Market*
95% 99%
Average Sale Price to List Price Ratio*
Vaughan: Islington Woods

First Quarter 2018
Toronto Real Estate Board
*The source for all slides is the Toronto Real Estate Board. Some statistics are not reported when the number of transactions is two (2) or less.Statistics are updated on a monthly basis. Quarterly community statistics in this report may not match quarterly sums calculated from past TREB publications. 7
19
35
3
13
0
Number of Transactions*$942
$780 $777
$558 $575
$880$770 $748
$565 $546
Average/Median Selling Price (,000s)* Average Selling PriceMedian Selling Price
42
9
30
14 16
0
Number of New Listings*
45%33%
17% 21%
81%
0%
Sales-to-New Listings Ratio*
27
17
33
21 19
Average Days on Market*
97% 98% 99% 97% 97%
Average Sale Price to List Price Ratio*
Vaughan: West Woodbridge

First Quarter 2018
Toronto Real Estate Board
*The source for all slides is the Toronto Real Estate Board. Some statistics are not reported when the number of transactions is two (2) or less.Statistics are updated on a monthly basis. Quarterly community statistics in this report may not match quarterly sums calculated from past TREB publications. 8
10 0
1
8
0
Number of Transactions*$472 $445
Average/Median Selling Price (,000s)* Average Selling PriceMedian Selling Price
4
0 0
5
12
0
Number of New Listings*
25%
0% 0%
20%
67%
0%
Sales-to-New Listings Ratio*
25
Average Days on Market*
99%
Average Sale Price to List Price Ratio*
Vaughan: Vaughan Grove

First Quarter 2018
Toronto Real Estate Board
*The source for all slides is the Toronto Real Estate Board. Some statistics are not reported when the number of transactions is two (2) or less.Statistics are updated on a monthly basis. Quarterly community statistics in this report may not match quarterly sums calculated from past TREB publications. 9
72
24
46
0 1 1
Number of Transactions*
$1,202
$813 $804
$1,204
$812 $802
Average/Median Selling Price (,000s)* Average Selling PriceMedian Selling Price
218
62
121
0 3 2
Number of New Listings*
33%39% 38%
0%
33%
50%
Sales-to-New Listings Ratio*
26
19
26
Average Days on Market*
97% 97% 99%
Average Sale Price to List Price Ratio*
Vaughan: Vellore Village

First Quarter 2018
Toronto Real Estate Board
*The source for all slides is the Toronto Real Estate Board. Some statistics are not reported when the number of transactions is two (2) or less.Statistics are updated on a monthly basis. Quarterly community statistics in this report may not match quarterly sums calculated from past TREB publications. 10
50
7 6 72 1
Number of Transactions*
$1,237
$762 $759$605
$1,134
$748 $751
$547
Average/Median Selling Price (,000s)* Average Selling PriceMedian Selling Price
115
13 15 13 6 1
Number of New Listings*
43%54%
40%54%
33%
100%
Sales-to-New Listings Ratio*
2418
26
48
Average Days on Market*
98% 99% 97% 98%
Average Sale Price to List Price Ratio*
Vaughan: East Woodbridge

First Quarter 2018
Toronto Real Estate Board
*The source for all slides is the Toronto Real Estate Board. Some statistics are not reported when the number of transactions is two (2) or less.Statistics are updated on a monthly basis. Quarterly community statistics in this report may not match quarterly sums calculated from past TREB publications. 11
0 0 0 0 0 0
Number of Transactions* Average/Median Selling Price (,000s)* Average Selling PriceMedian Selling Price
0 0 0 0 0 0
Number of New Listings*
0% 0% 0% 0% 0% 0%
Sales-to-New Listings Ratio*
Average Days on Market* Average Sale Price to List Price Ratio*
Vaughan: Pine Valley Business Park

First Quarter 2018
Toronto Real Estate Board
*The source for all slides is the Toronto Real Estate Board. Some statistics are not reported when the number of transactions is two (2) or less.Statistics are updated on a monthly basis. Quarterly community statistics in this report may not match quarterly sums calculated from past TREB publications. 12
0 0 0 0 0 0
Number of Transactions* Average/Median Selling Price (,000s)* Average Selling PriceMedian Selling Price
0 0 0 0 0 0
Number of New Listings*
0% 0% 0% 0% 0% 0%
Sales-to-New Listings Ratio*
Average Days on Market* Average Sale Price to List Price Ratio*
Vaughan: Steeles West Industrial

First Quarter 2018
Toronto Real Estate Board
*The source for all slides is the Toronto Real Estate Board. Some statistics are not reported when the number of transactions is two (2) or less.Statistics are updated on a monthly basis. Quarterly community statistics in this report may not match quarterly sums calculated from past TREB publications. 13
0 0 0 0 0 0
Number of Transactions* Average/Median Selling Price (,000s)* Average Selling PriceMedian Selling Price
0 0 0 0
13
0
Number of New Listings*
0% 0% 0% 0% 0% 0%
Sales-to-New Listings Ratio*
Average Days on Market* Average Sale Price to List Price Ratio*
Vaughan: Vaughan Corporate Centre

First Quarter 2018
Toronto Real Estate Board
*The source for all slides is the Toronto Real Estate Board. Some statistics are not reported when the number of transactions is two (2) or less.Statistics are updated on a monthly basis. Quarterly community statistics in this report may not match quarterly sums calculated from past TREB publications. 14
9
0
5
0 0 0
Number of Transactions*$1,317
$721$900
$723
Average/Median Selling Price (,000s)* Average Selling PriceMedian Selling Price
41
0
8
0 0 0
Number of New Listings*
22%
0%
63%
0% 0% 0%
Sales-to-New Listings Ratio*
2126
Average Days on Market*
96% 98%
Average Sale Price to List Price Ratio*
Vaughan: Rural Vaughan

First Quarter 2018
Toronto Real Estate Board
*The source for all slides is the Toronto Real Estate Board. Some statistics are not reported when the number of transactions is two (2) or less.Statistics are updated on a monthly basis. Quarterly community statistics in this report may not match quarterly sums calculated from past TREB publications. 15
58
7
20
4
20
0
Number of Transactions*
$1,022
$773 $740$587 $559
$1,046
$765 $717$588 $540
Average/Median Selling Price (,000s)* Average Selling PriceMedian Selling Price
143
11
53
4
39
0
Number of New Listings*
41%
64%
38%
100%
51%
0%
Sales-to-New Listings Ratio*
18 18 17
12
22
Average Days on Market*
97% 99% 100% 100% 97%
Average Sale Price to List Price Ratio*
Vaughan: Maple

First Quarter 2018
Toronto Real Estate Board
*The source for all slides is the Toronto Real Estate Board. Some statistics are not reported when the number of transactions is two (2) or less.Statistics are updated on a monthly basis. Quarterly community statistics in this report may not match quarterly sums calculated from past TREB publications. 16
3
02
0
14
1
Number of Transactions*
$1,202
$516
$1,175
$484
Average/Median Selling Price (,000s)* Average Selling PriceMedian Selling Price
13
04
0
35
1
Number of New Listings*
23%
0%
50%
0%
40%
100%
Sales-to-New Listings Ratio*
4944
Average Days on Market*
100% 97%
Average Sale Price to List Price Ratio*
Vaughan: Concord

First Quarter 2018
Toronto Real Estate Board
*The source for all slides is the Toronto Real Estate Board. Some statistics are not reported when the number of transactions is two (2) or less.Statistics are updated on a monthly basis. Quarterly community statistics in this report may not match quarterly sums calculated from past TREB publications. 17
4
0 0 0 0 0
Number of Transactions*
$1,021 $982
Average/Median Selling Price (,000s)* Average Selling PriceMedian Selling Price
14
0 0 0 0
6
Number of New Listings*29%
0% 0% 0% 0% 0%
Sales-to-New Listings Ratio*
8
Average Days on Market*
98%
Average Sale Price to List Price Ratio*
Vaughan: Glen Shields
First Quarter 2018
Toronto Real Estate Board
*The source for all slides is the Toronto Real Estate Board. Some statistics are not reported when the number of transactions is two (2) or less.Statistics are updated on a monthly basis. Quarterly community statistics in this report may not match quarterly sums calculated from past TREB publications. 18
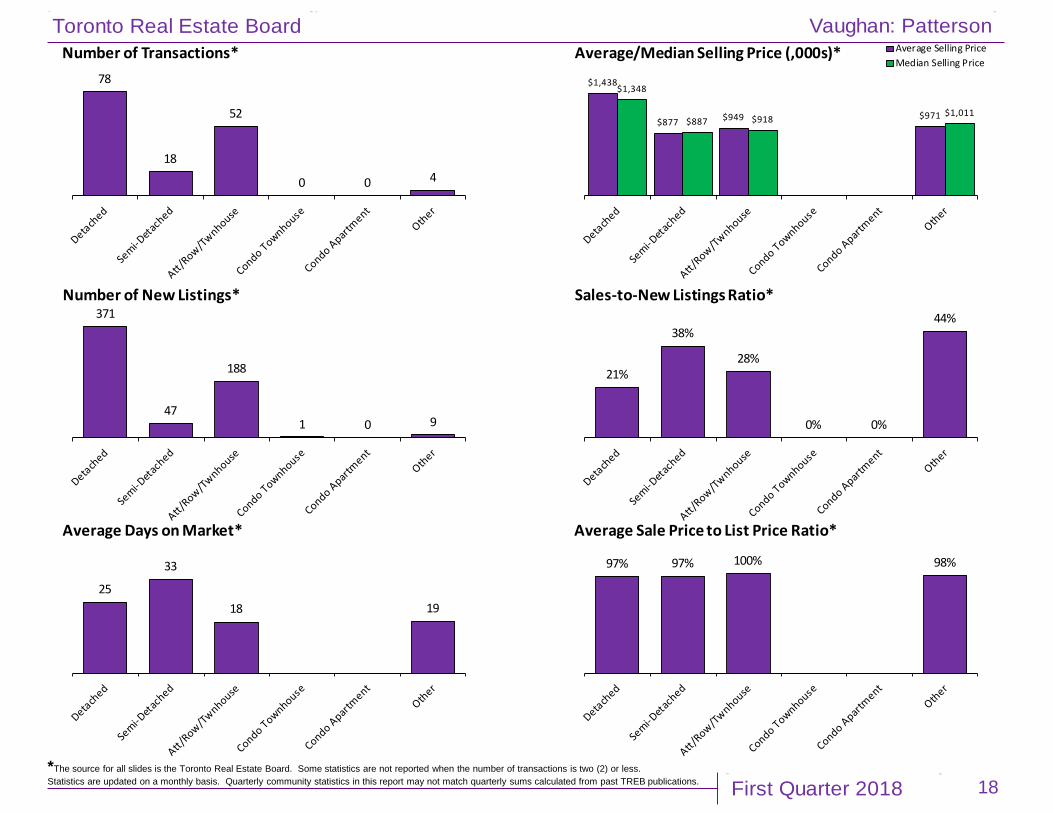
78
18
52
0 0 4
Number of Transactions*
$1,438
$877 $949 $971
$1,348
$887 $918$1,011
Average/Median Selling Price (,000s)* Average Selling PriceMedian Selling Price
371
47
188
1 0 9
Number of New Listings*
21%
38%
28%
0% 0%
44%
Sales-to-New Listings Ratio*
25
33
18 19
Average Days on Market*
97% 97% 100% 98%
Average Sale Price to List Price Ratio*
Vaughan: Patterson

First Quarter 2018
Toronto Real Estate Board
*The source for all slides is the Toronto Real Estate Board. Some statistics are not reported when the number of transactions is two (2) or less.Statistics are updated on a monthly basis. Quarterly community statistics in this report may not match quarterly sums calculated from past TREB publications. 19
10
0 1 0
25
0
Number of Transactions*
$1,529
$507
$1,383
$457
Average/Median Selling Price (,000s)* Average Selling PriceMedian Selling Price
30
05 2
48
0
Number of New Listings*
33%
0%
20%
0%
52%
0%
Sales-to-New Listings Ratio*
22 21
Average Days on Market*
96% 97%
Average Sale Price to List Price Ratio*
Vaughan: Beverley Glen

First Quarter 2018
Toronto Real Estate Board
*The source for all slides is the Toronto Real Estate Board. Some statistics are not reported when the number of transactions is two (2) or less.Statistics are updated on a monthly basis. Quarterly community statistics in this report may not match quarterly sums calculated from past TREB publications. 20
13
0 1 1
17
1
Number of Transactions*
$1,037
$610
$991
$599
Average/Median Selling Price (,000s)* Average Selling PriceMedian Selling Price
36
0 16
43
1
Number of New Listings*
36%
0%
100%
17%
40%
100%
Sales-to-New Listings Ratio*
33
26
Average Days on Market*
98% 99%
Average Sale Price to List Price Ratio*
Vaughan: Brownridge
First Quarter 2018
Toronto Real Estate Board
*The source for all slides is the Toronto Real Estate Board. Some statistics are not reported when the number of transactions is two (2) or less.Statistics are updated on a monthly basis. Quarterly community statistics in this report may not match quarterly sums calculated from past TREB publications. 21
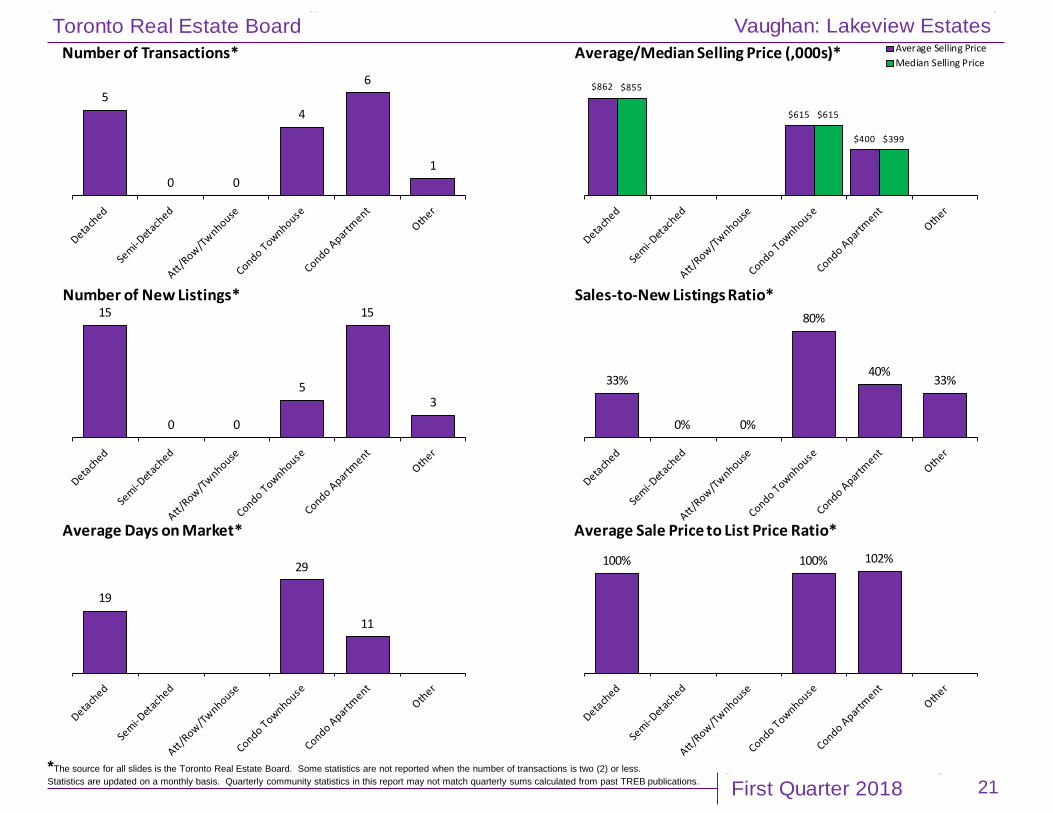
5
0 0
4
6
1
Number of Transactions*
$862
$615
$400
$855
$615
$399
Average/Median Selling Price (,000s)* Average Selling PriceMedian Selling Price
15
0 0
5
15
3
Number of New Listings*
33%
0% 0%
80%
40%33%
Sales-to-New Listings Ratio*
19
29
11
Average Days on Market*
100% 100% 102%
Average Sale Price to List Price Ratio*
Vaughan: Lakeview Estates

First Quarter 2018
Toronto Real Estate Board
*The source for all slides is the Toronto Real Estate Board. Some statistics are not reported when the number of transactions is two (2) or less.Statistics are updated on a monthly basis. Quarterly community statistics in this report may not match quarterly sums calculated from past TREB publications. 22
7
0 0
2
0 0
Number of Transactions*
$2,085
$1,670
Average/Median Selling Price (,000s)* Average Selling PriceMedian Selling Price
53
0 0 3 0 0
Number of New Listings*
13%
0% 0%
67%
0% 0%
Sales-to-New Listings Ratio*
19
Average Days on Market*91%
Average Sale Price to List Price Ratio*
Vaughan: Uplands

First Quarter 2018
Toronto Real Estate Board
*The source for all slides is the Toronto Real Estate Board. Some statistics are not reported when the number of transactions is two (2) or less.Statistics are updated on a monthly basis. Quarterly community statistics in this report may not match quarterly sums calculated from past TREB publications. 23
15
1 2 4
49
3
Number of Transactions*$1,640
$654 $568
$815
$1,150
$595 $520
$825
Average/Median Selling Price (,000s)* Average Selling PriceMedian Selling Price
67
2 316
113
4
Number of New Listings*
22%
50%
67%
25%
43%
75%Sales-to-New Listings Ratio*
29
13
24
31
Average Days on Market*
97% 100% 98% 100%
Average Sale Price to List Price Ratio*
Vaughan: Crestwood-Springfarm-Yorkhill