Community Health Needs Assessment...Community Health Needs Assessment Community Health Needs...
53
Community Health Needs Assessment Methodist Richardsons Medical Center
Transcript of Community Health Needs Assessment...Community Health Needs Assessment Community Health Needs...

Community Health Needs Assessment
Methodist Richardsons Medical Center

Table of Contents
4 metsyS htlaeH tsidohteM ............................................................................................... 4 erachtlaeH etanoissapmoC ................................................................................................... 4 metsyS htlaeH tsidohteM fo seulaV dna ,noisiV ,noissiM ...................................................
5 yrammuS evitucexE ....................................................................................................... 7 tnemeriuqeR tnemssessA sdeeN htlaeH ytinummoC ................................................. 8 hcaorppA dna ygolodohteM ,weivrevO ANHC ............................................................ 8 noitaroballoC & snoitacifilauQ tnatlusnoC .......................................................................... 8 noitinifeD devreS ytinummoC ................................................................................................ 8 sdeeN htlaeH fo tnemssessA ................................................................................................
Quantitative Assessment of Health Needs – Methodology and Data Sources 9 ..................Qualitative Assessment of Health Needs and Community Input – Approach 10 .................
21 deeN ytinummoC gninifeD rof ygolodohteM ...................................................................... 31 spaG noitamrofnI ................................................................................................................... 41 sdeeN htlaeH tnacifingiS ezitiroirP dna yfitnedI ot hcaorppA ........................................... 51 tsidohteM yb desserddA eb ot sdeeN htlaeH eht gnitceleS .............................................. 51 sdeeN htlaeH sserddA ot secruoseR gnitsixE ....................................................................
Methodist Health System Community Health Needs Assessment 16 .......................... 61 yrammuS cimonoceoicoS dna cihpargomeD .....................................................................
62 srotacidnI htlaeH cilbuP ........................................................................................................ 72 ataD ytinummoC htlaeH nostaW .......................................................................................... 23 sweivretnI & spuorG sucoF .................................................................................................. 43 sdeeN htlaeH tnacifingiS dezitiroirP .................................................................................... 53 tsidohteM yb desserddA eb ot sdeeN htlaeH ..................................................................... 63 tsidohteM yb desserddA eb ot sdeeN fo noitpircseD ........................................................ 63 eruliaF traeH cinorhC ......................................................................................................................... 63 recnaC ................................................................................................................................................ 73 ekortS .................................................................................................................................................
73 yrammuS ................................................................................................................................
83 secruoS rotacidnI htlaeH yeK :A xidneppA ................................................................Appendix B: Community Resources Identified to Potentially Address Significant
44 sdeeN htlaeH .................................................................................................................Appendix C: Federally Designated Health Professional Shortage Areas and
64 snoitalupoP dna saerA devresrednU yllacideM ......................................................... 64 )ASPH( saerA egatrohS lanoisseforP htlaeH ......................................................................
Appendix D: Public Health Indicators Showing Greater Need When Compared to 84 kramhcneB etatS ..........................................................................................................
Appendix E: Evaluation of Prior Implementation Strategy Impact 53..........................
Page of 2 60
Methodist Richardson Medical Centerl

Methodist Richardson Medical Centerl
Table of Contents
4 metsyS htlaeH tsidohteM ............................................................................................... 4 erachtlaeH etanoissapmoC ................................................................................................... 4 metsyS htlaeH tsidohteM fo seulaV dna ,noisiV ,noissiM ...................................................
5 yrammuS evitucexE ....................................................................................................... 7 tnemeriuqeR tnemssessA sdeeN htlaeH ytinummoC ................................................. 8 hcaorppA dna ygolodohteM ,weivrevO ANHC ............................................................ 8 noitaroballoC & snoitacifilauQ tnatlusnoC .......................................................................... 8 noitinifeD devreS ytinummoC ................................................................................................ 8 sdeeN htlaeH fo tnemssessA ................................................................................................
Quantitative Assessment of Health Needs – Methodology and Data Sources 9 ..................Qualitative Assessment of Health Needs and Community Input – Approach 10 .................
21 deeN ytinummoC gninifeD rof ygolodohteM ...................................................................... 31 spaG noitamrofnI ................................................................................................................... 41 sdeeN htlaeH tnacifingiS ezitiroirP dna yfitnedI ot hcaorppA ........................................... 51 tsidohteM yb desserddA eb ot sdeeN htlaeH eht gnitceleS .............................................. 51 sdeeN htlaeH sserddA ot secruoseR gnitsixE ....................................................................
Methodist Health System Community Health Needs Assessment 16 .......................... 61 yrammuS cimonoceoicoS dna cihpargomeD .....................................................................
62 srotacidnI htlaeH cilbuP ........................................................................................................ 72 ataD ytinummoC htlaeH nostaW .......................................................................................... 23 sweivretnI & spuorG sucoF .................................................................................................. 43 sdeeN htlaeH tnacifingiS dezitiroirP .................................................................................... 53 tsidohteM yb desserddA eb ot sdeeN htlaeH ..................................................................... 63 tsidohteM yb desserddA eb ot sdeeN fo noitpircseD ........................................................ 63 eruliaF traeH cinorhC ......................................................................................................................... 63 recnaC ................................................................................................................................................ 73 ekortS .................................................................................................................................................
73 yrammuS ................................................................................................................................
83 secruoS rotacidnI htlaeH yeK :A xidneppA ................................................................Appendix B: Community Resources Identified to Potentially Address Significant
44 sdeeN htlaeH .................................................................................................................Appendix C: Federally Designated Health Professional Shortage Areas and
64 snoitalupoP dna saerA devresrednU yllacideM ......................................................... 64 )ASPH( saerA egatrohS lanoisseforP htlaeH ......................................................................
Appendix D: Public Health Indicators Showing Greater Need When Compared to 84 kramhcneB etatS ..........................................................................................................
Appendix E: Evaluation of Prior Implementation Strategy Impact 53..........................
Page of 2 60

Methodist Richardson Medical Center 4
Methodist Health System Community Health Needs Assessment
Methodist Health System
Compassionate Healthcare
The Methodist ministers and civic leaders who opened our doors in 1927 couldn’t have imagined where Methodist Health System would be today. From humble beginnings, our renowned health system has become one of the leading healthcare providers in North Texas.
But all of our growth, advancements, accreditation, awards, and accomplishments have been earned under the guidance of their founding principles: life, learning, and compassion. We’re still growing, learning, and improving — grounded in a proud past and looking ahead to an even brighter future.
Whatever your medical need, we are honored that you would entrust us with your health and safety. We understand that we have a solemn responsibility to you and your family, and you can trust that our team takes that commitment very seriously.
Mission, Vision, and Values of Methodist Health System
Mission
To improve and save lives through compassionate quality healthcare.
Vision for the Future
To be the trusted choice for health and wellness.
Core Values
Methodist Health System core values reflect our historic commitment to Christian concepts of life and learning:
• Servant Heart – compassionately putting others first
• Hospitality – offering a welcoming and caring environment
• Innovation – courageous creativity and commitment to quality
• Noble – unwavering honesty and integrity
• Enthusiasm – celebration of individual and team accomplishment
• Skillful – dedicated to learning and excellence
Page ! of !4 60

Methodist Richardson Medical Center 5
Methodist Health System Community Health Needs Assessment
Executive Summary
Methodist Health System (Methodist) understands the importance of serving the health needs of its communities. To do that successfully, we must first take a comprehensive look at the issues our patients, their families, and neighbors face when making healthy life choices and health care decisions.
Beginning in June 2018, the organization began the process of assessing the current health needs of the communities it serves. IBM Watson Health (Watson Health) was engaged to help collect and analyze the data for this process and to compile a final report made publicly available on September 30, 2019.
Methodist owns and operates multiple individually licensed hospital facilities serving the residents of North Texas. This assessment applies to the following Methodist hospital facility:
• Methodist Richardson Medical Center
For the 2019 assessment, the community includes the geographic area where at least 75% of the hospital facility admitted patients live. Methodist Richardson Medical Center defined their community as the geographical area of Dallas and Collin Counties. This hospital facility provided a Community Health Needs Assessment (CHNA) report in accordance with Treasury Regulations and 501(r) of the Internal Revenue Code.
Watson Health examined over 102 public health indicators and conducted a benchmark analysis of the data comparing the community to overall state of Texas and United States (U.S.) values. For a qualitative analysis, and in order to get input directly from the community, focus groups and key informant interviews were conducted. Interviews included input from state, local, or regional governmental public health departments (or equivalent department or agency) with knowledge, information, or expertise relevant to the health needs of the community as well as individuals or organizations serving and/or representing the interests of medically underserved, low-income, and minority populations in the community.
Needs were first identified when it was determined which indicators for the community did not meet the state benchmarks. A need differential analysis was conducted on all of the indicators not meeting benchmarks to determine relative severity by using the percent difference from benchmark. The outcome of this quantitative analysis was then aligned with the qualitative findings of the community input sessions to create a list of health needs in the community. Each health need received assignment into one of four quadrants in a health needs matrix, this clarified the assignment of severity rankings of the needs. The matrix shows the convergence of needs identified in the qualitative data (interview and focus group feedback) and quantitative data (health indicators) and identifies the top health needs for this community.
On May 2, 2019 a prioritization meeting was held with system and hospital leadership in which the health needs matrix was reviewed to establish and prioritize significant needs. The meeting was moderated by Watson Health and included an overview of the Methodist CHNA process, summary of qualitative and quantitative findings, and a review of the identified community health needs.
Page ! of !5 60

Methodist Richardson Medical Center 6
Methodist Health SystemCommunity Health Needs Assessment
Participants identified the significant health needs through review of the health needs matrix, discussion, and a consensus process. Once the significant health needs were established, participants rated the needs using a set of prioritization criteria. The sum of the criteria scores for each need created an overall score that was the basis of the prioritized order of significant health needs.
The meeting participants subsequently evaluated the prioritized health needs against a set of selection criteria in order to determine which needs would be addressed by the
.troper siht fo ydob eht ni dedulcni si sdeen detceles eht fo noitpircsed A .ytilicaf latipsohEach facility developed an individual implementation strategy with specific initiatives aimed at addressing the selected health needs. The implementation strategy will be completed and adopted by the hospital facility on or before February 15, 2020. The needs to be addressed by Methodist Richardson Medical Center are as follows:
• Chronic Heart Failure • Cancer • Stroke
As part of the assessment process, community resources were identified, including facilities/organizations, that may be available to address the significant needs in the community. These resources are in the appendix of this report.
An evaluation of the impact and effectiveness of interventions and activities outlined in the implementation strategy drafted after the prior assessment is also included in Appendix E of this document.
The CHNA for Methodist Richardson Medical Center has been presented and approved by the Vice President of Strategic Planning, Methodist Health System Senior Executive Management team and Methodist Health System’s Board of Directors. The full assessment is available for download at no cost to the public on Methodist’s website, visit www.methodisthealthsystem.org/about/communityinvolvement. This assessment and corresponding implementation strategy meet the requirements for community benefit planning and reporting as set forth in state and federal laws, including but not limited to: Texas Health and Safety Code Chapter 311 and Internal Revenue Code Section 501(r).
Page of 6 60

Methodist Richardson Medical Center 7
Methodist Health System Community Health Needs Assessment
Community Health Needs Assessment Requirement
As a result of the Patient Protection and Affordable Care Act (PPACA), all tax-exempt organizations operating hospital facilities are required to assess the health needs of their community through a Community Health Needs Assessment (CHNA) once every three years.
The written CHNA Report must include descriptions of the following: • The community served and how the community was determined • The process and methods used to conduct the assessment including sources
and dates of the data and other information as well as the analytical methods applied to identify significant community health needs
• How the organization took into account input from persons representing the broad interests of the community served by the hospital, including a description of when and how the hospital consulted with these persons or the organizations they represent
• The prioritized significant health needs identified through the CHNA as well as a description of the process and criteria used in prioritizing the identified significant needs
• The existing healthcare facilities, organizations, and other resources within the community available to meet the significant community health needs
• An evaluation of the impact of any actions that were taken, since the hospital facility(s) most recent CHNA, to address the significant health needs identified in that last CHNA
PPACA also requires hospitals to adopt an Implementation Strategy to address prioritized community health needs identified through the assessment. An Implementation Strategy is a written plan that addresses each of the significant community health needs identified through the CHNA and is a separate but related document to the CHNA report.
The written Implementation Strategy must include the following: • List of the prioritized needs the hospital plans to address and the rationale for not
addressing other significant health needs identified • Actions the hospital intends to take to address the chosen health needs • The anticipated impact of these actions and the plan to evaluate such impact
(e.g. identify data sources that will be used to track the plan’s impact) • Identify programs and resources the hospital plans to commit to address the
health needs • Describe any planned collaboration between the hospital and other facilities or
organizations in addressing the health needs
Page ! of !7 60

Methodist Health System Community Health Needs Assessment
CHNA Overview, Methodology and Approach
Methodist began the 2019 CHNA process in June of 2018 and partnered with Watson Health to complete a CHNA for Methodist Richardson Medical Center.
Consultant Qualifications & Collaboration
Watson Health delivers analytic tools, benchmarks, and strategic consulting services to the healthcare industry, combining rich data analytics in demographics, including the Community Needs Index, planning, and disease prevalence estimates, with experienced strategic consultants to deliver comprehensive and actionable Community Health Needs Assessments.
Community Served Definition
For the purpose of this assessment, Methodist Richardson Medical Center defined the facility’s community using the county in which at least 75% of patients reside. Using this definition, Methodist Richardson Medical Center has defined their community to be the geographical area of Dallas and Collin Counties for the 2019 CHNA.
Assessment of Health Needs
To identify the health needs of the community, the hospital facility established a comprehensive method of taking into account all available relevant data including
Community Served Map
Source: Watson Health, 2019
!
Page ! of !8 60
Methodist Richardson Medical Center 8

Methodist Richardson Medical Center 9
Methodist Health System Community Health Needs Assessment
CHNA Overview, Methodology and Approach
Methodist began the 2019 CHNA process in June of 2018 and partnered with Watson Health to complete a CHNA for Methodist Richardson Medical Center.
Consultant Qualifications & Collaboration
Watson Health delivers analytic tools, benchmarks, and strategic consulting services to the healthcare industry, combining rich data analytics in demographics, including the Community Needs Index, planning, and disease prevalence estimates, with experienced strategic consultants to deliver comprehensive and actionable Community Health Needs Assessments.
Community Served Definition
For the purpose of this assessment, Methodist Richardson Medical Center defined the facility’s community using the county in which at least 75% of patients reside. Using this definition, Methodist Richardson Medical Center has defined their community to be the geographical area of Dallas and Collin Counties for the 2019 CHNA.
Assessment of Health Needs
To identify the health needs of the community, the hospital facility established a comprehensive method of taking into account all available relevant data including
Community Served Map
Source: Watson Health, 2019
!
Page ! of !8 60
Methodist Health SystemCommunity Health Needs Assessment
community input. The basis of identification of community health needs was the weight of qualitative and quantitative data obtained when assessing the community. Surveyors conducted interviews and focus groups with individuals representing public health, community leaders/groups, public organizations, and other providers. In addition, data collected from several public sources compared to the state benchmark indicated the level of severity.
Quantitative Assessment of Health Needs – Methodology and Data Sources
Quantitative data collection and analysis in the form of public health indicators assessed community health needs, including collection of 102 data elements grouped into 11 categories, and evaluated for the counties where data was available. Since 2016, the identification of several new indicators included: addressing mental health, health care costs, opioids, and social determinants of health. The categories, indicators, and sources are included in Appendix A.
A benchmark analysis, conducted for each indicator collected for the community served, determined which public health indicators demonstrated a community health need from a quantitative perspective. Benchmark health indicators collected included (when available): overall U.S. values; state of Texas values; and goal setting benchmarks such as Healthy People 2020.
According to America’s Health Rankings 2018 Annual Report, Texas ranks 37th out of the 50 states. The health status of Texas compared to other states in the nation identified many opportunities to impact health within local communities, including opportunities for those communities that ranked highly. Therefore, the benchmark for the community served was set to the state value.
Once the community benchmark was set to the state value, it was determined which indicators for the community did not meet the state benchmarks. This created a subset of indicators for further analysis. A need differential analysis was conducted to understand the relative severity of need for these indicators. The need differential established a standardized way to evaluate the degree each indicator differed from its benchmark. Health community indicators with need differentials above the 50th percentile were ordered by severity and the highest ranked indicators were the highest health needs from a quantitative perspective.
The outcomes of the quantitative data analysis were compared to the qualitative data findings.
Page of 9 60

Qualitative Assessment of Health Needs and Community Input – Approach
In addition to analyzing quantitative data, three (3) focus groups with a total of 33 participants, as well as eight (8) key informant interviews, were conducted to take into account the input of persons representing the broad interests of the community served. The focus groups and interviews solicited feedback from leaders and representatives who serve the community and have insight into community needs.
The focus groups familiarized participants with the CHNA process and solicited input to understand health needs from the community’s perspective. Focus groups, formatted for individual as well as small group feedback, helped identify barriers and social determinants influencing the community’s health needs. Barriers and social determinants were new topics added to the 2019 community input sessions.
Watson Health conducted key informant interviews for the community served by the hospital. The interviews aided in gaining understanding and insight into participants‘ concerns about the general health status of the community and the various drivers that contributed to health issues.
Participation in the qualitative assessment was included from at least one state, local, or regional governmental public health department (or equivalent department or agency) with knowledge, information, or expertise relevant to the health needs of the community,
Health Indicator Benchmark Analysis Example
Source: IBM Watson Health, 2019
Page of 10 60
Methodist Richardson Medical Center 10
Qualitative Assessment of Health Needs and Community Input – Approach
In addition to analyzing quantitative data, three (3) focus groups with a total of 33 participants, as well as eight (8) key informant interviews, were conducted to take into account the input of persons representing the broad interests of the community served. The focus groups and interviews solicited feedback from leaders and representatives who serve the community and have insight into community needs.
The focus groups familiarized participants with the CHNA process and solicited input to understand health needs from the community’s perspective. Focus groups, formatted for individual as well as small group feedback, helped identify barriers and social determinants influencing the community’s health needs. Barriers and social determinants were new topics added to the 2019 community input sessions.
Watson Health conducted key informant interviews for the community served by the hospital. The interviews aided in gaining understanding and insight into participants‘ concerns about the general health status of the community and the various drivers that contributed to health issues.
Participation in the qualitative assessment was included from at least one state, local, or regional governmental public health department (or equivalent department or agency) with knowledge, information, or expertise relevant to the health needs of the community,
Health Indicator Benchmark Analysis Example
Source: IBM Watson Health, 2019
Page of 10 60

Methodist Richardson Medical Center 11
Methodist Health System Community Health Needs Assessment
as well as individuals or organizations who served and/or represented the interests of medically underserved, low-income and minority populations in the community.
Participation from community leaders/groups, public health organizations, other healthcare organizations, and other healthcare providers ensured that the input received represented the broad interests of the community served. A list of the organizations providing input is in the table below.
Community Input Participants
Participant Organization Name
Public Health
Medically Under-served
Low-income
Chronic Disease Needs
Minority Populations
Governmental Public --Health Dept.
Public Health Knowledge --Expertise
Agape Clinic X X X X X
Bridge Breast Network X X X X
City of Plano X X X X X
CitySquare X X X X X X
Community Council
Community Lifeline Center X X X X
Cornerstone Baptist Church X X X X X X
D/FW Hindu Temple Society X
Dallas Area Interfaith X X X X
Family Promise of Irving X X
Frisco Family Services X X
Genesis Women's Shelter & Support X X X X
Goodwill Industries of Dallas X X
Hope Clinic X X X X
Hope Clinic of McKinney X X X X
Legal Aid of Northwest Texas X
LifePath Systems X X X X
Los Barrios Unidos Community Clinic X X X X X X
Many Helping Hands Ministry X X X X
Page ! of !11 60
Participant Organization Name
Pub
lic H
ealth
Med
ical
ly U
nder
-ser
ved
Low
-inco
me
Chr
onic
Dise
ase
Nee
ds
Min
ority
Pop
ulat
ions
Gov
ernm
enta
l Pub
lic --
Heal
th
Dept
.
Pub
lic H
ealth
Kno
wle
dge
--Ex
pert
ise
Agape Clinic X X X X X
Bridge Breast Network X X X X
City of Plano X X X X X
CitySquare X X X X X X
Community Council
Community Lifeline Center X X X X
Cornerstone Baptist Church X X X X X X
D/FW Hindu Temple Society X
Dallas Area Interfaith X X X X
Family Promise of Irving X X
Frisco Family Services X X
Genesis Women's Shelter & Support X X X X
Goodwill Industries of Dallas X X
Hope Clinic X X X X
Hope Clinic of McKinney X X X X
Legal Aid of Northwest Texas X
LifePath Systems X X X X
Los Barrios Unidos Community Clinic X X X X X X
Many Helping Hands Ministry X X X X
McKinney City Council X
North Texas Food Bank X X
Office of the County Judge - Dallas County X X X X X X
Plano Fire-Rescue X X X X X X
Project Access-Collin County X

Methodist Health System Community Health Needs Assessment
In addition to soliciting input from public health and various interests of the community, the hospital was also required to consider written input received on their most recently conducted CHNA and subsequent implementation strategies. The assessment is available to receive public comment or feedback on the report findings on the Methodist website (www.methodisthealthsystem.org/about/communityinvolvement) or by
McKinney City Council X
North Texas Food Bank X X
Office of the County Judge - Dallas County X X X X X X
Plano Fire-Rescue X X X X X X
Project Access-Collin County X
Sharing Life Community Outreach Inc X
Society of St. Vincent de Paul of North Texas X X X X
Texas Muslim Women's Foundation X
The Samaritan Inn X
United Way Metropolitan Dallas X X X X X
Urban Inter-Tribal Center of Texas X X X X X
Veterans Center of North Texas X X
YMCA X X X X X X
Cancer Care Services X X X X X X
Dallas County Health and Human Services X X X
Metrocare X X X X X X
PCI ProComp Solutions, LLC X X
University of Texas - Dallas X X
Assistance Center of Collin County X X X X
Methodist Golden Cross Academic Clinic X X X X X
The Visiting Nurse Association of North Texas (VNA) X X X X X X
Participant Organization Name
Public Health
Medically Under-served
Low-income
Chronic Disease Needs
Minority Populations
Governmental Public --Health Dept.
Public Health Knowledge --Expertise
Page ! of !12 60
Methodist Richardson Medical Center 12
Participant Organization Name
Pub
lic H
ealth
Med
ical
ly U
nder
-ser
ved
Low
-inco
me
Chr
onic
Dise
ase
Nee
ds
Min
ority
Pop
ulat
ions
Gov
ernm
enta
l Pub
lic --
Heal
th
Dept
.
Pub
lic H
ealth
Kno
wle
dge
--Ex
pert
ise
Sharing Life Community Outreach Inc X
Society of St. Vincent de Paul of North Texas X X X X
Texas Muslim Women's Foundation X
The Samaritan Inn X
United Way Metropolitan Dallas X X X X X
Urban Inter-Tribal Center of Texas X X X X X
Veterans Center of North Texas X X
YMCA X X X X X X
Cancer Care Services X X X X X X
Dallas County Health and Human Services X X X
Metrocare X X X X X X
PCI ProComp Solutions, LLC X X
University of Texas - Dallas X X
Assistance Center of Collin County X X X X
Methodist Golden Cross Academic Clinic X X X X XThe Visiting Nurse Association of North Texas (VNA) X X X X X X
emailing [email protected]. To date Methodist has not received written input but continues to welcome feedback from the community.
Community input from interviews and focus groups organized the themes around community needs. These themes were compared to the quantitative data findings.
Page of 13 60

Methodist Richardson Medical Center 13
Methodist Health System Community Health Needs Assessment
Methodology for Defining Community Need
Using qualitative feedback from the interviews and focus groups, as well as the health indicator data, the issues currently affecting the community served are assembled in the Health Needs Matrix below to help identify the top health needs for the community. The upper right quadrant of the matrix is where the needs identified in the qualitative data (interview and focus group feedback) and quantitative data (health indicators) converge to identify the significant health needs for this community.
Information Gaps
Most public health indicators were available only at the county level. In evaluating data for entire counties versus more localized data, it was difficult to understand the health needs for specific population pockets within a county. It could also be a challenge to tailor programs to address community health needs, as placement and access to specific programs in one part of the county may or may not actually affect the population who truly need the service. The publicly available health indicator data was supplemented with Watson Health’s ZIP code estimates to assist in identifying specific populations within a community where health needs may be greater.
The Health Needs Matrix
Source: IBM Watson Health, 2019
!
Page ! of !14 60

Methodist Richardson Medical Center 14
Methodist Health System Community Health Needs Assessment
Approach to Identify and Prioritize Significant Health Needs
In a session held with system and hospital leadership representing Methodist Richardson Medical Center on May 2, 2019, significant health needs were identified and prioritized. Moderated by Watson Health, the meeting included: an overview of the CHNA process for Methodist; the methodology for determining the top health needs; the Methodist prioritization approach; and discussion of the top health needs identified for the community.
Prioritization of the health needs took place in two steps. In the first step, participants reviewed the top health needs for their community based on the Health Needs Matrix. The group then reviewed the significant health needs as determined by the upper right quadrant of the matrix and identified other significant needs from other matrix quadrants by leveraging the professional experience and community knowledge of the group via discussion.
In the second step, participants ranked the significant health needs based on the following prioritization criteria:
1. Magnitude: The need impacts a large number of people, actually or potentially. 2. Severity: What degree of disability or premature death occurs because of the
problem? What are the potential burdens to the community, such as economic or social burdens?
3. Vulnerable Populations: There is a high need among vulnerable populations and/or vulnerable populations are adversely impacted.
4. Root Cause: The issue is a root cause of other problems, thereby possibly affecting multiple issues.
Through discussion and consensus, the group rated each of the significant health needs on each of the four identified criteria utilizing a scale of 1 (low) to 10 (high). The criteria scores summed for each need created an overall score. The list of significant health needs was then prioritized based on the overall scores. The outcome of this process, the list of prioritized health needs for this community, is located in the “Prioritized Significant Health Needs” section of the assessment.
The prioritized list of significant health needs was approved by the hospitals’ governing body and the full assessment is available to anyone at no cost. To download a copy, visit www.methodisthealthsystem.org/about/communityinvolvement.
Page ! of !15 60

Methodist Richardson Medical Center 15
Methodist Health System Community Health Needs Assessment
Selecting the Health Needs to be Addressed by Methodist
To choose which of the prioritized health needs Methodist would address through its corresponding implementation plans, the participants representing Methodist Richardson Medical Center collectively as a group rated each of the prioritized significant health needs on the following selection criteria:
1. Expertise & Collaboration: Confirm health issues can build upon existing resources and strengths of the organization. Ability to leverage expertise within the organization and resources in the community for collaboration.
2. Feasibility: Ensure needs are amenable to interventions, acknowledge resources needed, and determine if need is preventable.
3. Quick Success & Impact: Ability to obtain quick success and make an impact in the community.
Through discussion and consensus, the group rated a subset of the prioritized health needs on each of the three identified criteria utilizing a scale of 1 (low) to 10 (high). The criteria scores summed for each need, created an overall score. The list of prioritized health needs was then ranked based on the overall scores. The health needs selected by participants, which will be addressed via implementation strategies, are located in the “Health Needs to be Addressed by Methodist” section of the assessment.
Existing Resources to Address Health Needs
Part of the assessment process included gathering input on community resources potentially available to address the significant health needs identified through the CHNA. Qualitative assessment participants identified community resources that may assist in addressing the health needs identified for this community. A description of these resources is in Appendix B.
Page ! of !16 60

Methodist Richardson Medical Center 16
Methodist Health System Community Health Needs Assessment
Methodist Health System Community Health Needs Assessment
Demographic and Socioeconomic Summary
According to population statistics, the population in this health community is expected to grow 7.5% in five years, above the Texas growth rate of 7.1%. The median age of 35.5 was younger than the Texas and national benchmarks. Median income was above both the state and the country. The community served had a lower proportion of Medicaid beneficiaries than the state of Texas.
Demographic and Socioeconomic Comparison: Community Served and State/U.S. Benchmarks
Source: IBM Watson Health / Claritas, 2018; US Census Bureau 2017 (U.S. Median Income)
!
Page ! of !17 60
Methodist Health System Community Health Needs Assessment
Methodist Health System Community Health Needs Assessment
Demographic and Socioeconomic Summary
According to population statistics, the population in this health community is expected to grow 7.5% in five years, above the Texas growth rate of 7.1%. The median age of 35.5 was younger than the Texas and national benchmarks. Median income was above both the state and the country. The community served had a lower proportion of Medicaid beneficiaries than the state of Texas.
Demographic and Socioeconomic Comparison: Community Served and State/U.S. Benchmarks
Source: IBM Watson Health / Claritas, 2018; US Census Bureau 2017 (U.S. Median Income)
!
Page ! of !17 60

Methodist Richardson Medical Center 17
The population of the community served is expected to grow 7.5% by 2023, an increase of more than 268,000 people. The 7.5% projected population growth is more than the state’s 5-year projected growth rate (7.1%) and higher when compared to the national projected growth rate (3.5%). The ZIP codes expected to experience the most growth in five years are:
• 75070 McKinney – 12,270 people • 75052 Grand Prairie – 9,059 people • 75002 Allen – 7,892 people
2018 - 2023 Total Population Projected Change by ZIP Code
Source: IBM Watson Health / Claritas, 2018
Page of 19 60

Methodist Richardson Medical Center 18
The community’s population skewed younger with 38.2% of the population ages 18-44 and 26.3% under age 18. The largest cohort (18-44) is expected to grow by adding 43,719 people (3.2%) by 2023. The age 65 plus cohort was the smallest (10.9%) but is expected to experience the fastest growth (27.2%) over the next five years, adding 106,485 seniors to the community. Growth in the senior population will likely contribute to increased utilization of services as the population continues to age.
Population Distribution by Age
2018 Population by Age Cohort Change by 2023
Source: IBM Watson Health / Claritas, 2018
Page of 20 60

Methodist Richardson Medical Center 19
Methodist Health System Community Health Needs Assessment
Population statistics are analyzed by race and by Hispanic ethnicity. The largest groups in the community were non-Hispanic White (36.58%), non-Hispanic Black (18.99%), White Hispanic (18.08%), and other Hispanic (13.09%). The expected growth rate of the Hispanic population (all races) is over 124,000 people (10.3%) by 2023, while the non-Hispanic population (all races) is expected to grow by over 144,000 people (6.0%) by 2023.
Population Distribution by Race and Ethnicity
2018 Population by Race 2018 Population by Ethnicity
Source: IBM Watson Health / Claritas, 2018
!
!
Page ! of !21 60

Methodist Richardson Medical Center 20
Methodist Health System Community Health Needs Assessment
2018 - 2023 Hispanic Population Projected Change by ZIP Code
Source: IBM Watson Health / Claritas, 2018
!
!
Page ! of !22 60

Methodist Richardson Medical Center 21
Methodist Health System Community Health Needs Assessment
The 2018 median household income for the United States was $61,372 and $60,397 for the state of Texas. The median household income for the ZIP codes within this community ranged from $21,940 for 75210-Dallas to $169,738 for 75225-Dallas. There were 33 ZIP codes with median household incomes less than $50,200, twice the 2018 Federal Poverty Limit for a family of four: • 75210 Dallas - $21,940 • 75216 Dallas - $26,240 • 75247 Dallas - $28,750 • 75237 Dallas - $29,606 • 75215 Dallas - $31,213 • 75212 Dallas - $34,787 • 75203 Dallas - $35,177 • 75241 Dallas - $36,316 • 75217 Dallas - $36,886 • 75231 Dallas - $37,253 • 75232 Dallas - $38,650 • 75224 Dallas - $39,096 • 75227 Dallas - $39,505 • 75233 Dallas - $40,741 • 75228 Dallas - $41,081 • 75223 Dallas - $41,798 • 75211 Dallas - $42,165
• 75042 Garland - $42,226 • 75243 Dallas - $42,441 • 75180 Balch Springs - $43,055 • 75240 Dallas - $43,473 • 75253 Dallas - $43,956 • 75141 Hutchins - $43,968 • 75246 Dallas - $43,992 • 75041 Garland - $44,881 • 75061 Irving - $44,965 • 75220 Dallas - $45,016 • 75172 Wilmer - $45,833 • 75236 Dallas - $45,849 • 75051 Grand Prairie - $46,798 • 75149 Mesquite - $48,436 • 75150 Mesquite - $49,678 • 75254 Dallas - $49,817
Page ! of !23 60

Methodist Richardson Medical Center 22
Methodist Health System Community Health Needs Assessment
2018 Median Household Income by ZIP Code
Source: IBM Watson Health / Claritas, 2018
!
!
Page ! of !24 60

Methodist Richardson Medical Center 23
A majority of the population (50%) were insured through employer sponsored health coverage, 17% of residents did not have any health insurance. The remainder of the population was fairly equally divided between Medicaid, Medicare, and private market (the purchasers of coverage directly or through the health insurance marketplace).
2018 Estimated Distribution of Covered Lives by Insurance Category
Source: IBM Watson Health / Claritas, 2018
Page of 26 60

Methodist Richardson Medical Center 24
Methodist Health System Community Health Needs Assessment
The community includes 27 Health Professional Shortage Areas and 20 Medically Underserved Areas as designated by the U.S. Department of Health and Human Services Health Resources Services Administration. Appendix C includes the details 1
on each of these designations.
The Watson Health Community Need Index (CNI) is a statistical approach to identifying areas within a community where health disparities may exist. The CNI takes into account vital socio-economic factors (income, cultural, education, insurance and housing) about a community to generate a CNI score for every populated ZIP code in the United States. The CNI strongly links to variations in community healthcare needs and is an indicator of a community’s demand for various healthcare services. The CNI score by ZIP code identifies specific areas within a community where healthcare needs may be greater.
The CNI score for the community served was 3.9 (4.2 for Dallas County and 2.9 for Collin County) which is higher than the CNI national average of 3.0, potentially indicating greater health care needs in this community. In portions of the community (Balch Springs, Dallas, Duncanville, Garland, Grand Prairie, Irving, McKinney, Mesquite, and Wilmer) the CNI score was greater than 4.5, pointing to potentially more significant health needs among the population.
Health Professional Shortage Areas and Medically Underserved Areas and Populations
Source: U.S. Department of Health and Human Services, Health Resources and Services Administration, 2018
!
U.S. Department of Health and Human Services, Health Resources and Services Administration, 20181
Page ! of !27 60
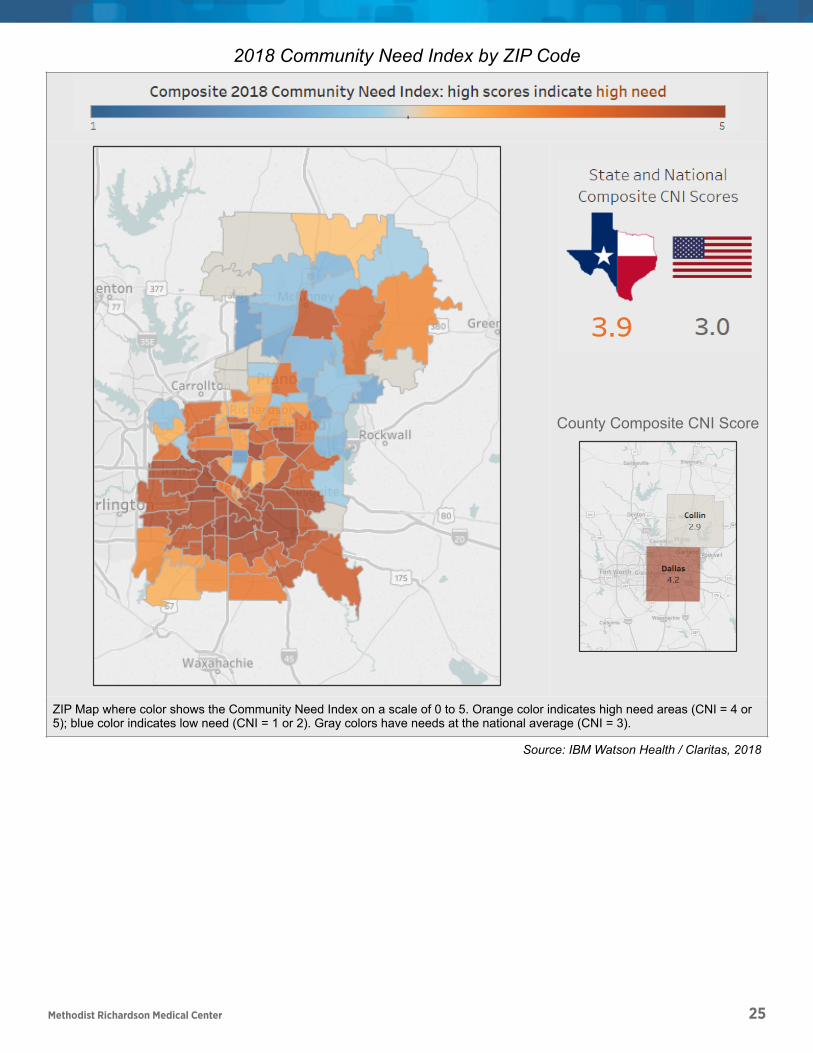
Methodist Richardson Medical Center 25
Methodist Health System Community Health Needs Assessment
2018 Community Need Index by ZIP Code
ZIP Map where color shows the Community Need Index on a scale of 0 to 5. Orange color indicates high need areas (CNI = 4 or 5); blue color indicates low need (CNI = 1 or 2). Gray colors have needs at the national average (CNI = 3).
Source: IBM Watson Health / Claritas, 2018
County Composite CNI Score
!
!
!
!
Page ! of !28 60

Methodist Richardson Medical Center 26
Methodist Health System Community Health Needs Assessment
Public Health Indicators
Public health indicators were collected and analyzed to assess community health needs. Evaluation for the community served used 102 indicators. For each health indicator, a comparison between the most recently available community data and benchmarks for the same/similar indicator was made. The basis of benchmarks was available data for the U.S. and the state of Texas.
Where the community indicators showed greater need when compared to the state of Texas comparative benchmark, the difference between the community values and the state benchmark was calculated (need differential). Those highest ranked indicators with need differentials in the 50th percentile of greater severity pinpointed community health needs from a quantitative perspective. These indicators are located in Appendix D.
Page ! of !29 60

Methodist Richardson Medical Center 27
Methodist Health System Community Health Needs Assessment
Watson Health Community Data
Watson Health supplemented the publicly available data with estimates of localized disease prevalence of heart disease and cancer as well as emergency department visit estimates.
Watson Health Heart Disease Estimates identified hypertension as the most prevalent heart disease diagnosis; there were over 898,000 estimated cases in the community overall. McKinney ZIP code 75070 had the most estimated cases of Arrhythmia, Ischemic Heart Disease and Hypertension, while Grand Prairie ZIP code 75052 had the most estimated cases of Heart Failure. ZIP code 75075 in Plano had the highest estimated prevalence rates for Arrhythmia (705 cases per 10,000 population), Hypertension (3,332 cases per 10,000 population) and Ischemic Heart Disease (654 cases per 10,000 population). ZIP Code 75225 in Dallas was the highest rate for Heart Failure (341 cases per 10,000 population).
2018 Estimated Heart Disease Cases
Bar chart shows total number and prevalence rate of 2018 Estimated Heart Disease cases for each of four types: arrhythmia, heart failure, hypertension, and ischemic heart disease Note: An individual patient may have more than one type of heart disease. Therefore the sum of all four heart disease types is not a unique count of individuals.
Source: IBM Watson Health, 2018
!
Page ! of !30 60

Methodist Richardson Medical Center 28
Methodist Health System Community Health Needs Assessment
For this community, Watson Health’s 2018 Cancer Estimates revealed the cancers projected to have the greatest rate of growth in the next five years were pancreatic, bladder, and kidney based on population changes and disease rates. The cancers estimated to have the greatest number of new cases in 2018 were breast, prostate, lung, and colorectal cancers.
2018 Estimated New Cancer Cases
Bar chart shows estimated new diagnoses per year for each of the 17 types of Cancer and 1 category for all other cancers. Color shows details about sex with light blue for females and dark blue for males.
Source: IBM Watson Health, 2018
!
Page ! of !31 60

Methodist Richardson Medical Center 29
Methodist Health System Community Health Needs Assessment
Estimated Cancer Cases and Projected 5 Year Change by Type
Cancer Type 2018 Estimated New Cases
2023 Estimated New Cases 5 Year Growth (%)
Bladder 648 779 20.3%
Brain 161 180 11.4%
Breast 3,436 3,978 15.8%
Colorectal 1,881 1,998 6.2%
Kidney 763 906 18.8%
Leukemia 511 597 16.7%
Lung 1,666 1,944 16.7%
Melanoma 642 750 16.8%
Non Hodgkins Lymphoma 706 829 17.5%
Oral Cavity 470 553 17.6%
Ovarian 231 262 13.6%
Pancreatic 565 690 22.0%
Prostate 2,781 3,071 10.4%
Stomach 306 359 17.1%
Thyroid 537 632 17.8%
Uterine Cervical 152 161 6.2%
Uterine Corpus 503 595 18.3%
All Other 2,249 2,658 18.2%
Grand Total 18,208 20,942 15.0%
Source: IBM Watson Health, 2018
Page ! of !32 60

Methodist Richardson Medical Center 30
Methodist Health System Community Health Needs Assessment
Based on population characteristics and regional utilization rates, Watson Health projected all emergency department (ED) visits in this community to increase by 7.9% over the next 5 years. The highest estimated ED use rates were in the ZIP codes of Dallas; 534 to 375.3 ED visits per 1,000 residents compared to the Texas state benchmark of 460 visits and the U.S. benchmark of 435 visits per 1,000.
These ED visits consisted of three main types: those resulting in an inpatient admission, emergent outpatient treated and released ED visits, and non-emergent outpatient ED visits that were lower acuity. Non-emergent ED visits present to the ED but can be treated in more appropriate and less intensive outpatient settings.
Non-emergent outpatient ED visits could be an indication of systematic issues within the community regarding access to primary care, managing chronic conditions, or other access to care issues such as ability to pay. Watson Health estimated non-emergent ED visits to increase by an average of 3.8% over the next five years in this community.
Estimated 2018 Emergency Department Visit Rate
ZIP map color shows total Emergency Department visits per 10,00 population. Orange colors are higher than the state benchmark, blue colors are less than the state benchmark, and gray colors are similar.
Note: These are not actual Methodist ED visit rates. These are statistical estimates of ED visits for the population.
County Benchmark
!
!
!
!
Page ! of !33 60

Methodist Richardson Medical Center 31
Methodist Health System Community Health Needs Assessment
Source: IBM Watson Health, 2018
Projected 5 Year Change in Non-Emergent Emergency Department Visits by ZIP Code
This chart show sthe percent change in Emergency Department visits by 2023 at the ZIP level. The average for all ZIPs in the Health Community is labeled. ED visits are defined by the presence of specific CPT® codes in claims. Non-emergency visits to the ED do not necessarily require treatment in a hospital emergency department and can potentially be reated in a fast-track ED, an urgent care treatment center, or a clinical or a physician’s private office.
Note: These are not actual Methodist ED visit rates. These are statistical estimates of ED visits for the population.
Source: IBM Watson Health, 2018
!
!
Page ! of !34 60

Methodist Richardson Medical Center 32
Methodist Health System Community Health Needs Assessment
Focus Groups & Interviews
Methodist worked jointly with Baylor Scott & White Health, Parkland Health & Hospital System, and Texas Health Resources hospital facilities in collecting and sharing qualitative data (community input) on the health needs of this community.
In the focus group sessions and interviews, participants identified and discussed the factors that contribute to the current health status of the community, and then identified the greatest barriers and strengths that contribute to the overall health of the community. For this health community there were three focus group sessions with a total of 33 participants and eight (8) interviews were conducted July 2018 through March 2019.
In this health community, the top health needs identified in the discussions included: • Access to jobs and affordable housing • Safe public transportation • Lack of insurance and access to services • Health care service gaps and navigating services • Language barriers and cultural differences
Dallas was a melting pot of ethnicities and neighborhoods, each with different assets and health care needs. The predominantly urban area was a culturally and economically diverse area with strong community and networks but challenged with high poverty levels and growing homelessness. Companies were moving into the northern areas, such as Frisco and Plano, but the downtown area south of I40 lacked resources and was characterized by concentrated poverty and segregation. Participants described Collin County as a fast-growing, increasingly diverse area with a high cost of living. People moved to this community for its high quality of life, good schools, and job growth, but the increased cost of housing was putting some longtime residents and fixed-income seniors at risk for homelessness.
For those with insurance and means, there was access to high quality health care and specialists in the area, but there was a growing percentage that did not have equal access. Lack of insurance was often discussed as a major barrier to better health in the area. Many residents worked but didn’t have health insurance, part of the “working poor” population. Parts of this health community were agricultural, and public transportation was extremely limited which created food and transportation “deserts”. One of the primary barriers to good health in this community was the lack of living wage jobs to pay for insurance, health services, medications, housing, and healthy food. The lack of public transit interfered with follow up care and was also ineffectual in assisting residents get to their places of employment. It was suggested that centrally located health facilities with evening hours would help increase access.
The focus groups described a local culture of generational habits and limited knowledge about healthy eating habits. The food pantries were working to alleviate hunger and to provide healthier and fresh food options; language and culture were barriers to developing trust and increased access. There were food deserts, and some residents
Page ! of ! 35 60

Methodist Richardson Medical Center 33
used local convenience stores and inexpensive fast food frequently, both poor nutrition options.
Focus groups shared that the diversity in the community also presented barriers to good health. Cultural and historical habits in the immigrant populations and lack of cultural sensitivity in providers contributed to a culture of distrust of outsiders. For example, only a few clinics treated female Muslims and those facilities needed guidance in delivering culturally sensitive care as to not offend the women or their families. Combined with very limited public transportation, food deserts, and lack of insurance, many residents had no access to preventive services or primary care and used the ED for medical services. There was a need for education and resources to understand how to access care. The focus groups noted that minorities living in the area had an overall mistrust of authority (police, fire, hospitals). The group thought that outreach and education for health care providers to address trust issues would help tremendously.
Participants identified gaps in service in all clinical areas; primary care, maternal care, vision, dental, specialty, wellness clinics, geriatric specialists, and behavioral health care were the most acute. The needs for mental health services were frequently mentioned as a high need area; there was limited coordination of available services, the topic was highly stigmatized, very few services were available, and it affected all age groups. Focus group participants called out the need for increased space for residents to receive mental health treatment as well as increased funding.
Page of 36 60

Methodist Richardson Medical Center 34
Prioritized Significant Health Needs
The Health Needs Matrix identified through the community health needs assessment (see Methodology for Defining Community Need section) shows the convergence of needs identified in the qualitative data (interview and focus group feedback) and quantitative data (health indicators). The significant health needs for this community were identified, reviewed, and prioritized by Methodist leadership (see Approach to Identify and Prioritize Significant Health Needs section) and the resulting prioritized health needs for this community were:
Significant Community Health Needs Identified
Page of 37 60
Priority Needs Identified Category of Need Public Health Indicator
1 Adolescent Behavioral Health Health Behaviors Teen Birth Rate per 1,000 Female
Population, Ages 15-19
2 Language Barriers Social Determinants of Health Non-English Speaking Households
2 Hyperlipidemia Chronic Conditions Hyperlipidemia in Medicare Population
3 Schizophrenia and Other Psychotic Disorders
Mental Health Schizophrenia and Other Psychotic Disorders in Medicare Population
3 Mental Health Mental Health Depression in Medicare Population
4 Atrial Fibrillation Chronic Conditions Atrial Fibrillation in Medicare Population
4 Chronic Heart Failure Chronic Conditions Hypertension in Medicare Population
4 Cancer Cancer Cancer Incidence - Female Breast
4 Stroke Chronic Conditions Stroke Mortality Rate
5 Uninsured Population Access to Care Percent of Population under Age 65 without Health Insurance
6 Poverty Social Determinants of Health Individuals Living Below the Poverty Level
7 Poverty Social Determinants of Health Children in Poverty
7 Food Insecurity Environment Food Insecurity (Hunger)
8 Drug Overdose Deaths - Opioids
Health Behaviors - Substance Abuse
Accidental Poisoning Deaths where Opioids were Involved
8 Drug Overdose Deaths Health Behaviors - Substance Abuse Drug Poisoning Death Rate
9 Poverty Social Determinants of Health
Children Eligible for Free Lunch Enrolled in Public Schools
10 Social Isolation Social Determinants of Health Social Membership Associations
11 Child Mortality Injury and Death - Children Child Mortality Rate
11 Motor Vehicle Driving Deaths with Alcohol Involvement
Health Behaviors - Substance Abuse
Motor Vehicle Driving Deaths with Alcohol Involvement
12 Infant Mortality Injury and Death - Children Infant Mortality Rate
12 Housing Environment Severe Housing Problems
12 Primary Care Access to Care Ratio of Population to one Non-Physician Primary Care Provider
13 Transportation Access to Care No Vehicle Available

Methodist Richardson Medical Center 35
Health Needs to be Addressed by Methodist
Using the approach outlined in the methodology section of this report (see Selecting the Health Needs to be Addressed by Methodist section), participants from Methodist Richardson Medical Center collectively rated, ranked, and selected the following significant needs to be addressed by implementation strategies:
1. Chronic Heart Failure
2. Cancer
3. Stroke
Description of Needs to be Addressed by Methodist
The CHNA process identified significant community health needs that can be categorized as chronic conditions, specifically chronic heart failure, cancer, and stroke. Regionalized health needs affect all age levels to some degree; however, it is often the most vulnerable populations that are negatively affected. Community health gaps help to define the resources and access to care within the county or region. Health and social concerns were validated through key informant interviews, focus groups and county data. The health needs selected by Methodist to be addressed are briefly described below with public health indicator and benchmark information.
Chronic Heart Failure
Chronic Heart disease is an umbrella term which covers multiple conditions that affect the heart. Congestive heart failure (CHF) is another term for heart failure and occurs when your heart muscle doesn't pump blood as well as it should. Heart Disease can be chronic, ongoing, or acute where you experience a sudden onset of symptoms. Heart disease can, and does, occur at any age; however, it is most commonly seen as people age and have other co-morbidities that can increase the incidence of heart disease. In Dallas County, the mortality rate from heart disease is 180 per 100,000, or 5.3% higher than the state benchmark. 2
Certain conditions, such as narrowed arteries in your heart (coronary artery disease) or high blood pressure, gradually leave your heart too weak or stiff to fill and pump efficiently. Dallas and Collin counties have a higher prevalence of Hyperlipidemia and Atrial Fibrillation compared to the state. In Collin County, 54% of the Medicare 3
population has a diagnosis of Hyperlipidemia which is 11% higher than the state benchmark. Not all conditions that lead to heart failure can be reversed, but treatments can improve the signs and symptoms of heart failure and help you live longer. Preventing heart failure may be possible by controlling conditions that cause heart failure, such as coronary artery disease, high blood pressure, diabetes or obesity. Lifestyle changes such as exercising, reducing sodium in your diet, managing stress and losing weight can improve quality of life.
2013 Texas Health Data, Center for Health Statistics, Texas Department of State Health Services2
CMS.gov Chronic conditions 2007-20153
Page of 39 60

Cancer
Cancer is a term used for diseases in which abnormal cells divide without control and can invade other tissues, when cancer spreads to other organs through the blood and lymph systems, it is considered malignant. Cancer is not just one disease, but many diseases and there are more than one hundred kinds of cancer. Cancer is a genetic 4
disease, it is caused by changes to genes that control the way our cells function, especially how they grow and divide. Genetics play an important role in whether we are 5
pre-ordained to develop a cancer; however, we have control over personal choices and environmental exposures that may modify risk.
In Texas in 2016, the age-adjusted rate of new cancer cases was 391.8 per 100,000 people and there were 109,083 cancer cases reported. Nationally, there were 6
1,658,716 new cases of cancer reported in 2016 and 598,031 cancer diagnoses. There were 436 new cancer cases reported and 156 died per 100,000. Cancer is the second leading cause of death in the United States, exceeded only by heart disease. One of every four deaths in the U.S. is due to cancer. In Dallas County, the incidence rate of 7
prostate cancer, female breast cancer, and colon cancer are all higher than the Texas state benchmarks, and the cancer mortality rate of 163 per 100,000 people is 4.4% worse than the Texas benchmark. Similarly, the breast cancer incidence rate in Collin 8
County is 10.7% higher than the Texas benchmark (123.7 vs. 111.7 per 100,000). 9
Cancer prevention, treatment and research are addressed on federal, state and local levels. Individuals can improve their odds of not receiving a cancer diagnosis by controlling their exposure to carcinogens, avoiding or quitting smoking, seeking preventative healthcare and living a healthy lifestyle, including nutritious foods and getting regular exercise.
Stroke
On average someone is the United States is having a stroke every 40 seconds. Strokes can and do occur at any age and nearly one fourth of strokes occur in people under the age of 65. Stroke is the third leading cause of death in the U.S. and in Texas. Nearly 10
three-quarters of all strokes occur in people over the age of 65. The risk of having a stroke more than doubles each decade after the age of 55. Stroke morbidity causes serious, long-term disability and each year over 795,000 people suffer a stroke and
https://www.cdc.gov/cancer/dcpc/prevention/index.htm4
https://www.cancer.gov/about-cancer/causes-prevention5
https://gis.cdc.gov/Cancer/USCS/DataViz.html6
https://gis.cdc.gov/Cancer/USCS/DataViz.html7
2011-2015 Age-Adjusted Colon & Rectum Cancer Incidence Rate, National Cancer Institute (CDC); 2011-2015 8
Age-Adjusted Female Breast Cancer Incidence Rate, National Cancer Institute (CDC); 2011-2015 Age-Adjusted Prostate Cancer Incidence Rate, National Cancer Institute (CDC); 2013 Cancer Age Adjusted Death Rate, Texas Health Data, Center for Health Statistics, Texas Department of State Health Services
2011-2015 Age-Adjusted Female Breast Cancer Incidence Rate, National Cancer Institute (CDC)9
https://www.dshs.texas.gov/heart/Texas-Heart-Disease-and-Stroke-Program---Home.aspx10
Page ! of ! 40 60Methodist Richardson Medical Center 36
Cancer
Cancer is a term used for diseases in which abnormal cells divide without control and can invade other tissues, when cancer spreads to other organs through the blood and lymph systems, it is considered malignant. Cancer is not just one disease, but many diseases and there are more than one hundred kinds of cancer. Cancer is a genetic 4
disease, it is caused by changes to genes that control the way our cells function, especially how they grow and divide. Genetics play an important role in whether we are 5
pre-ordained to develop a cancer; however, we have control over personal choices and environmental exposures that may modify risk.
In Texas in 2016, the age-adjusted rate of new cancer cases was 391.8 per 100,000 people and there were 109,083 cancer cases reported. Nationally, there were 6
1,658,716 new cases of cancer reported in 2016 and 598,031 cancer diagnoses. There were 436 new cancer cases reported and 156 died per 100,000. Cancer is the second leading cause of death in the United States, exceeded only by heart disease. One of every four deaths in the U.S. is due to cancer. In Dallas County, the incidence rate of 7
prostate cancer, female breast cancer, and colon cancer are all higher than the Texas state benchmarks, and the cancer mortality rate of 163 per 100,000 people is 4.4% worse than the Texas benchmark. Similarly, the breast cancer incidence rate in Collin 8
County is 10.7% higher than the Texas benchmark (123.7 vs. 111.7 per 100,000). 9
Cancer prevention, treatment and research are addressed on federal, state and local levels. Individuals can improve their odds of not receiving a cancer diagnosis by controlling their exposure to carcinogens, avoiding or quitting smoking, seeking preventative healthcare and living a healthy lifestyle, including nutritious foods and getting regular exercise.
Stroke
On average someone is the United States is having a stroke every 40 seconds. Strokes can and do occur at any age and nearly one fourth of strokes occur in people under the age of 65. Stroke is the third leading cause of death in the U.S. and in Texas. Nearly 10
three-quarters of all strokes occur in people over the age of 65. The risk of having a stroke more than doubles each decade after the age of 55. Stroke morbidity causes serious, long-term disability and each year over 795,000 people suffer a stroke and
https://www.cdc.gov/cancer/dcpc/prevention/index.htm4
https://www.cancer.gov/about-cancer/causes-prevention5
https://gis.cdc.gov/Cancer/USCS/DataViz.html6
https://gis.cdc.gov/Cancer/USCS/DataViz.html7
2011-2015 Age-Adjusted Colon & Rectum Cancer Incidence Rate, National Cancer Institute (CDC); 2011-2015 8
Age-Adjusted Female Breast Cancer Incidence Rate, National Cancer Institute (CDC); 2011-2015 Age-Adjusted Prostate Cancer Incidence Rate, National Cancer Institute (CDC); 2013 Cancer Age Adjusted Death Rate, Texas Health Data, Center for Health Statistics, Texas Department of State Health Services
2011-2015 Age-Adjusted Female Breast Cancer Incidence Rate, National Cancer Institute (CDC)9
https://www.dshs.texas.gov/heart/Texas-Heart-Disease-and-Stroke-Program---Home.aspx10
Page ! of ! 40 60

Methodist Richardson Medical Center 37
Methodist Health System Community Health Needs Assessment
Page 39 of 52
140,000 die from the event. In Dallas County, the stroke mortality rate is 43.9 per 11
100,000, almost 10% higher than the Texas state benchmark. 12
A stroke is a sudden interruption in the blood supply of the brain. 80% of strokes are caused by an abrupt blockage of arteries leading to the brain; hemorrhagic stroke is when a blood vessel bursts leading to bleeding into brain tissue. All strokes are a considered a medical emergency and people experiencing symptoms such as slurred speech, facial drooping, loss of balance or vision should seek medical attention immediately. Time is of the essence with stroke diagnosis and treatment.
Identifying and eliminating risk factors associated with stroke are essential to decrease incidence of events. High blood pressure is the most common risk for stroke. Weight management, diet, exercise and the use of prescribed medications are essential for health. Stroke deaths are higher for African-Americans than whites, even at younger ages. Smokers have double the risk of having an ischemic stroke than non-smokers, even when risk adjusted for other factors. People experiencing atrial fibrillation (AF) have a five-fold increase in stroke risk. Stroke deaths and mortality have been decreasing over the last two decades and is highly correlated to education awareness and medical management improvement. 13
Summary
Methodist conducted its Community Health Needs Assessments beginning June 2018 to identify and begin addressing the health needs of the communities they serve. Using both qualitative community feedback as well as publicly available and proprietary health indicators, Methodist was able to identify and prioritize community health needs for their healthcare system. With the goal of improving the health of the community, implementation plans with specific tactics and time frames will be developed for the health needs Methodist chose to address for the community served.
http://www.strokecenter.org/patients/about-stroke/stroke-statistics/11
2013 Texas Health Data, Center for Health Statistics, Texas Department of State Health Services12
http://www.strokecenter.org/patients/about-stroke/stroke-statistics/13
Page of 41 60

Methodist Richardson Medical Center 38
App
endi
x A
: Key
Hea
lth In
dica
tor S
ourc
es
Pag
e o
f
4260
Cat
egor
yPu
blic
Hea
lth In
dica
tor
Sour
ce
Access to Care
Hos
pita
l Sta
ys fo
r Am
bula
tory
-Car
e S
ensi
tive
Con
ditio
ns-M
edic
are
2018
Cou
nty
Hea
lth R
anki
ngs
& R
oadm
aps;
Dar
tmou
th A
tlas
of H
ealth
Car
e, C
MS
Per
cent
age
of P
opul
atio
n un
der a
ge 6
5 w
ithou
t Hea
lth In
sura
nce
2018
Cou
nty
Hea
lth R
anki
ngs
& R
oadm
aps;
Sm
all A
rea
Hea
lth In
sura
nce
Est
imat
es (S
AH
IE),
Uni
ted
Sta
tes
Cen
sus
Bur
eau
Pric
e-A
djus
ted
Med
icar
e R
eim
burs
emen
ts p
er E
nrol
lee
NEW
201
920
18 C
ount
y H
ealth
Ran
king
s &
Roa
dmap
s; D
artm
outh
Atla
s of
Hea
lth C
are,
CM
S
Rat
io o
f Pop
ulat
ion
to O
ne D
entis
t20
18 C
ount
y H
ealth
Ran
king
s &
Roa
dmap
s; A
rea
Hea
lth R
esou
rce
File
/Nat
iona
l Pro
vide
r Ide
ntifi
catio
n fil
e (C
MS
)R
atio
of P
opul
atio
n to
One
Non
-Phy
sici
an P
rimar
y C
are
Pro
vide
r20
18 C
ount
y H
ealth
Ran
king
s &
Roa
dmap
s; C
MS
, Nat
iona
l Pro
vide
r Ide
ntifi
catio
n R
egis
try (N
PP
ES
)
Rat
io o
f Pop
ulat
ion
to O
ne P
rimar
y C
are
Phy
sici
an20
18 C
ount
y H
ealth
Ran
king
s &
Roa
dmap
s; A
rea
Hea
lth R
esou
rce
File
/Am
eric
an M
edic
al A
ssoc
iatio
n
Uni
nsur
ed C
hild
ren
2018
Cou
nty
Hea
lth R
anki
ngs
& R
oadm
aps;
Sm
all A
rea
Hea
lth In
sura
nce
Est
imat
es (S
AH
IE),
Uni
ted
Sta
tes
Cen
sus
Bur
eau
Conditions/Diseases
Adu
lt O
besi
ty (P
erce
nt)
2018
Cou
nty
Hea
lth R
anki
ngs
& R
oadm
aps;
CD
C D
iabe
tes
Inte
ract
ive
Atla
s, T
he N
atio
nal D
iabe
tes
Sur
veill
ance
Sys
tem
Arth
ritis
in M
edic
are
Pop
ulat
ion
CM
S.g
ov C
hron
ic c
ondi
tions
200
7-20
15
Atri
al F
ibril
latio
n in
Med
icar
e P
opul
atio
nC
MS
.gov
Chr
onic
con
ditio
ns 2
007-
2015
Can
cer I
ncid
ence
-A
ll C
ause
s20
11-2
015
Sta
te C
ance
r Pro
files
, Nat
iona
l Can
cer I
nstit
ute
(CD
C)
Can
cer I
ncid
ence
-C
olon
2011
-201
5 S
tate
Can
cer P
rofil
es, N
atio
nal C
ance
r Ins
titut
e (C
DC
)
Can
cer I
ncid
ence
-Fe
mal
e B
reas
t20
11-2
015
Sta
te C
ance
r Pro
files
, Nat
iona
l Can
cer I
nstit
ute
(CD
C)
Can
cer I
ncid
ence
-Lu
ng20
11-2
015
Sta
te C
ance
r Pro
files
, Nat
iona
l Can
cer I
nstit
ute
(CD
C)
Can
cer I
ncid
ence
-P
rost
ate
2011
-201
5 S
tate
Can
cer P
rofil
es, N
atio
nal C
ance
r Ins
titut
e (C
DC
)
Chr
onic
Kid
ney
Dis
ease
in M
edic
are
Pop
ulat
ion
CM
S.g
ov C
hron
ic c
ondi
tions
200
7-20
15
CO
PD
in M
edic
are
Pop
ulat
ion
CM
S.g
ov C
hron
ic c
ondi
tions
200
7-20
15
Dia
bete
s D
iagn
oses
in A
dults
CM
S.g
ov C
hron
ic c
ondi
tions
200
7-20
15
Dia
bete
s pr
eval
ence
2018
Cou
nty
Hea
lth R
anki
ngs
(CD
C D
iabe
tes
Inte
ract
ive
Atla
s)
Freq
uent
phy
sica
l dis
tress
2016
Beh
avio
ral R
isk
Fact
or S
urve
illan
ce S
yste
m(B
RFS
S)
Hea
rt Fa
ilure
in M
edic
are
Pop
ulat
ion
CM
S.g
ov C
hron
ic c
ondi
tions
200
7-20
15
HIV
Pre
vale
nce
2018
Cou
nty
Hea
lth R
anki
ngs
& R
oadm
aps;
Nat
iona
l Cen
ter f
or H
IV/A
IDS
, Vira
l Hep
atiti
s, S
TD, a
nd
TB P
reve
ntio
n (N
CH
HS
TP)
Hyp
erlip
idem
ia in
Med
icar
e P
opul
atio
nC
MS
.gov
Chr
onic
con
ditio
ns 2
007-
2015
Hyp
erte
nsio
n in
Med
icar
e P
opul
atio
nC
MS
.gov
Chr
onic
con
ditio
ns 2
007-
2015
Isch
emic
Hea
rt D
isea
se in
Med
icar
e P
opul
atio
nC
MS
.gov
Chr
onic
con
ditio
ns 2
007-
2015
Ost
eopo
rosi
s in
Med
icar
e P
opul
atio
nC
MS
.gov
Chr
onic
con
ditio
ns 2
007-
2015
Stro
ke in
Med
icar
e P
opul
atio
nC
MS
.gov
Chr
onic
con
ditio
ns 2
007-
2015
Environment
Air
Pol
lutio
n -P
artic
ulat
e M
atte
r dai
ly d
ensi
ty20
18 C
ount
y H
ealth
Ran
king
s &
Roa
dmap
s; E
nviro
nmen
tal P
ublic
Hea
lth T
rack
ing
Net
wor
k (C
DC
)
Drin
king
Wat
er V
iola
tions
(Per
cent
of P
opul
atio
n E
xpos
ed)
2018
Cou
nty
Hea
lth R
anki
ngs
& R
oadm
aps;
Saf
e D
rinki
ng W
ater
Info
rmat
ion
Sys
tem
(SD
WIS
), U
nite
d S
tate
s E
nviro
nmen
tal P
rote
ctio
n A
genc
y (E
PA
)

Methodist Richardson Medical Center 40
App
endi
x A
: Key
Hea
lth In
dica
tor S
ourc
es
Pag
e o
f
4260
Cat
egor
yPu
blic
Hea
lth In
dica
tor
Sour
ce
Driv
ing
Alo
ne to
Wor
k20
18 C
ount
y H
ealth
Ran
king
s &
Roa
dmap
s; A
mer
ican
Com
mun
ity S
urve
y, 5
-Yea
r Est
imat
es, U
nite
d S
tate
s C
ensu
s B
urea
uE
lder
ly is
olat
ion.
65+
Hou
seho
lder
livi
ng a
lone
NEW
201
9U
.S. C
ensu
s B
urea
u, 2
012-
2016
Am
eric
an C
omm
unity
Sur
vey
5-Y
ear E
stim
ates
Food
Env
ironm
ent I
ndex
2018
Cou
nty
Hea
lth R
anki
ngs
& R
oadm
aps;
US
DA
Foo
d E
nviro
nmen
t Atla
s, M
ap th
e M
eal G
ap fr
om
Feed
ing
Am
eric
a, U
nite
d S
tate
s D
epar
tmen
t of A
gric
ultu
re (U
SD
A)
Food
Inse
cure
2018
Cou
nty
Hea
lth R
anki
ngs
& R
oadm
aps;
Map
the
Mea
l Gap
, Fee
ding
Am
eric
a
Lim
ited
Acc
ess
to H
ealth
yFo
ods
(Per
cent
of L
ow In
com
e)20
18 C
ount
y H
ealth
Ran
king
s &
Roa
dmap
s; U
SD
A F
ood
Env
ironm
ent A
tlas,
Uni
ted
Sta
tes
Dep
artm
ent
of A
gric
ultu
re (U
SD
A)
Long
Com
mut
e A
lone
2018
Cou
nty
Hea
lth R
anki
ngs
& R
oadm
aps;
Am
eric
an C
omm
unity
Sur
vey,
5-Y
ear E
stim
ates
, Uni
ted
Sta
tes
Cen
sus
Bur
eau
No
vehi
cle
avai
labl
e N
EW 2
019
U.S
. Cen
sus
Bur
eau,
201
7 A
mer
ican
Com
mun
ity S
urve
y 1-
Year
Est
imat
es
Pop
ulat
ion
with
Ade
quat
e A
cces
s to
Loc
atio
ns fo
r Phy
sica
l Act
ivity
2018
Cou
nty
Hea
lth R
anki
ngs
&R
oadm
aps;
Bus
ines
s A
naly
st, D
elor
me
map
dat
a, E
SR
I, &
US
Cen
sus
Tige
rline
File
s (A
rcG
IS)
Ren
ter-
occu
pied
hou
sing
NEW
201
9U
.S. C
ensu
s B
urea
u, 2
017
Am
eric
an C
omm
unity
Sur
vey
1-Ye
ar E
stim
ates
Res
iden
tial s
egre
gatio
n -b
lack
/whi
te N
EW 2
019
2018
Cou
nty
Hea
lth R
anki
ngs
(Am
eric
an C
omm
unity
Sur
vey,
5-y
ear e
stim
ates
)
Res
iden
tial s
egre
gatio
n -n
on-w
hite
/whi
te N
EW 2
019
2018
.Cou
nty
Hea
lth R
anki
ngs
(Am
eric
an C
omm
unity
Sur
vey,
5-y
ear e
stim
ates
)
Sev
ere
Hou
sing
Pro
blem
s20
18 C
ount
y H
ealth
Ran
king
s &
Roa
dmap
s; C
ompr
ehen
sive
Hou
sing
Affo
rdab
ility
Stra
tegy
(CH
AS
) da
ta, U
.S. D
epar
tmen
t of H
ousi
ng a
nd U
rban
Dev
elop
men
t (H
UD
)
Health Behaviors
Adu
lt S
mok
ing
2018
Cou
nty
Hea
lth R
anki
ngs
& R
oadm
aps;
The
Beh
avio
ral R
isk
Fact
or S
urve
illan
ce S
yste
m (B
RFS
S)
Adu
lts E
ngag
ing
in B
inge
Drin
king
Dur
ing
the
Pas
t 30
Day
s20
18 C
ount
y H
ealth
Ran
king
s &
Roa
dmap
s; T
he B
ehav
iora
l Ris
k Fa
ctor
Sur
veill
ance
Sys
tem
(BR
FSS
)
Dis
conn
ecte
d yo
uth
NEW
201
920
18 C
ount
y H
ealth
Ran
king
s (M
easu
re o
f Am
eric
a)
Dru
g P
oiso
ning
Dea
ths
Rat
e20
18 C
ount
y H
ealth
Ran
king
s &
Roa
dmap
s, C
DC
WO
ND
ER
Mor
talit
y D
ata
Insu
ffici
ent s
leep
NEW
201
920
16 B
ehav
iora
l Ris
k Fa
ctor
Sur
veill
ance
Sys
tem
(BR
FSS
)
Mot
or V
ehic
le D
rivin
g D
eath
s w
ith A
lcoh
ol In
volv
emen
t20
18 C
ount
y H
ealth
Ran
king
s &
Roa
dmap
s; F
atal
ityA
naly
sis
Rep
ortin
g S
yste
m (F
AR
S)
Phy
sica
l Ina
ctiv
ity20
18 C
ount
y H
ealth
Ran
king
s &
Roa
dmap
s; C
DC
Dia
bete
s In
tera
ctiv
e A
tlas,
The
Nat
iona
l Dia
bete
s S
urve
illan
ce S
yste
m
Sex
ually
Tra
nsm
itted
Infe
ctio
n In
cide
nce
2018
Cou
nty
Hea
lth R
anki
ngs
& R
oadm
aps;
Nat
iona
l Cen
ter f
or H
IV/A
IDS
, Vira
l Hep
atiti
s, S
TD, a
nd
TB P
reve
ntio
n (N
CH
HS
TP)
Teen
Birt
h R
ate
per 1
,000
Fem
ale
Pop
ulat
ion,
Age
s 15
-19
2018
Cou
nty
Hea
lth R
anki
ngs
& R
oadm
aps;
Nat
iona
l Cen
ter f
or H
ealth
Sta
tistic
s -N
atal
ity fi
les,
N
atio
nal V
ital S
tatis
tics
Sys
tem
(NV
SS
)
Hea
lth
Stat
us
Adu
lts R
epor
ting
Fair
or P
oor H
ealth
2018
Cou
nty
Hea
lth R
anki
ngs
& R
oadm
aps;
The
Beh
avio
ral R
isk
Fact
or S
urve
illan
ce S
yste
m (B
RFS
S)
Ave
rage
Num
ber o
f Phy
sica
lly U
nhea
lthy
Day
s R
epor
ted
in P
ast 3
0 da
ys (A
ge-A
djus
ted)
2018
Cou
nty
Hea
lth R
anki
ngs
& R
oadm
aps;
The
Beh
avio
ral R
isk
Fact
or S
urve
illan
ce S
yste
m (B
RFS
S)
Injury & Death
Can
cer M
orta
lity
Rat
e20
13 T
exas
Hea
lth D
ata,
Cen
ter f
or H
ealth
Sta
tistic
s, T
exas
Dep
artm
ent o
f Sta
te H
ealth
Ser
vice
s
Chi
ld M
orta
lity
Rat
e20
18C
ount
y H
ealth
Ran
king
s &
Roa
dmap
s, C
DC
WO
ND
ER
Mor
talit
y D
ata
Chr
onic
Low
er R
espi
rato
ry D
isea
se (C
LRD
) Mor
talit
y R
ate
2013
'Tex
as H
ealth
Dat
a, C
ente
r for
Hea
lth S
tatis
tics,
Tex
as D
epar
tmen
t of S
tate
Hea
lth S
ervi
ces
Dea
th ra
te d
ue to
fire
arm
s N
EW 2
019
2018
Cou
nty
Hea
lth R
anki
ngs
(CD
C W
ON
DE
R E
nviro
nmen
tal D
ata)

Methodist Richardson Medical Center 41
App
endi
x A
: Key
Hea
lth In
dica
tor S
ourc
es
Pag
e o
f
4260
Cat
egor
yPu
blic
Hea
lth In
dica
tor
Sour
ceH
eart
Dis
ease
Mor
talit
y R
ate
2013
Tex
as H
ealth
Dat
a, C
ente
r for
Hea
lth S
tatis
tics,
Tex
as D
epar
tmen
t of S
tate
Hea
lth S
ervi
ces
Infa
nt M
orta
lity
Rat
e20
18 C
ount
y H
ealth
Ran
king
s &
Roa
dmap
s, C
DC
WO
ND
ER
Mor
talit
y D
ata
Mot
or V
ehic
le C
rash
Mor
talit
y R
ate
2018
Cou
nty
Hea
lth R
anki
ngs
& R
oadm
aps,
CD
C W
ON
DE
R M
orta
lity
Dat
a
Num
ber o
f dea
ths
due
to in
jury
NEW
201
920
18 C
ount
y H
ealth
Ran
king
s &
Roa
dmap
s, C
DC
WO
ND
ER
Mor
talit
y D
ata
Pre
mat
ure
Dea
th (P
oten
tial Y
ears
Los
t)20
18 C
ount
y H
ealth
Ran
king
s &
Roa
dmap
s; N
atio
nal C
ente
r for
Hea
lth S
tatis
tics
-Mor
talit
y Fi
les,
N
atio
nal V
ital S
tatis
tics
Sys
tem
(NV
SS
)S
troke
Mor
talit
y R
ate
2013
Tex
as H
ealth
Dat
a, C
ente
r for
Hea
lth S
tatis
tics,
Tex
as D
epar
tmen
t of S
tate
Hea
lth S
ervi
ces
Maternal & Child Health
Firs
t Trim
este
r Ent
ry in
to P
rena
tal C
are
2016
Tex
as H
ealth
and
Hum
an S
ervi
ces
-Vita
l sta
tistic
s an
nual
repo
rt
Low
Birt
h W
eigh
t Per
cent
2018
Cou
nty
Hea
lth R
anki
ngs
&R
oadm
aps;
Nat
iona
l Cen
ter f
or H
ealth
Sta
tistic
s -N
atal
ity fi
les,
N
atio
nal V
ital S
tatis
tics
Sys
tem
(NV
SS
)Lo
w B
irth
Wei
ght R
ate
2016
Tex
as H
ealth
and
Hum
an S
ervi
ces
-Vita
l sta
tistic
s an
nual
repo
rt -P
reve
ntab
le H
ospi
taliz
atio
ns
Pre
term
Birt
hs <
37 W
eeks
Ges
tatio
n20
15 K
ids
Dis
coun
t Dat
a C
ente
r
Ver
y Lo
w B
irth
Wei
ght (
VLB
W)
Cen
ters
for D
isea
se C
ontro
l and
Pre
vent
ion
WO
ND
ER
Mental Health
Acc
iden
tal p
oiso
ning
dea
ths
whe
re o
pioi
ds w
ere
invo
lved
NEW
201
9U
.S. C
ensu
s B
urea
u, P
opul
atio
n D
ivis
ion
and
2015
Texa
s H
ealth
and
Hum
an S
ervi
ces
Cen
ter f
or
Hea
lth S
tatis
tics
Opi
oid
rela
ted
deat
hs in
Tex
asA
lzhe
imer
's D
isea
se/D
emen
tia in
Med
icar
e P
opul
atio
nC
MS
.gov
Chr
onic
con
ditio
ns 2
007-
2015
Ave
rage
Num
ber o
f Men
tally
Unh
ealth
y D
ays
Rep
orte
d in
Pas
t 30
days
(Age
-Adj
uste
d)20
18 C
ount
y H
ealth
Ran
king
s &
Roa
dmap
s; T
he B
ehav
iora
l Ris
k Fa
ctor
Sur
veill
ance
Sys
tem
(BR
FSS
)
Dep
ress
ion
in M
edic
are
Pop
ulat
ion
CM
S.g
ov C
hron
ic c
ondi
tions
200
7-20
15
Freq
uent
men
tal d
istre
ss20
16 B
ehav
iora
l Ris
k Fa
ctor
Sur
veill
ance
Sys
tem
(BR
FSS
)
Inte
ntio
nal S
elf-H
arm
; Sui
cide
NEW
201
920
15 T
exas
Hea
lth D
ata
Cen
ter f
or H
ealth
Sta
tistic
s
Rat
io o
f Pop
ulat
ion
to o
ne M
enta
l Hea
lth P
rovi
der
2018
Cou
nty
Hea
lth R
anki
ngs
& R
oadm
aps;
CM
S, N
atio
nal P
rovi
der I
dent
ifica
tion
Reg
istry
(NP
PE
S)
Sch
izop
hren
ia a
nd O
ther
Psy
chot
ic D
isor
ders
in M
edic
are
Pop
ulat
ion
CM
S.g
ov C
hron
ic c
ondi
tions
200
7-20
15
Population
Chi
ldre
n E
ligib
le fo
r Fre
e Lu
nch
Enr
olle
d in
Pub
lic S
choo
ls20
18 C
ount
y H
ealth
Ran
king
s &
Roa
dmap
s, T
he N
atio
nal C
ente
r for
Edu
catio
nS
tatis
tics
(NC
ES
)
Chi
ldre
n in
Pov
erty
2018
Cou
nty
Hea
lth R
anki
ngs
& R
oadm
aps;
Sm
all A
rea
Hea
lth In
sura
nce
Est
imat
es (S
AH
IE),
Uni
ted
Sta
tes
Cen
sus
Bur
eau
Chi
ldre
n in
Sin
gle-
Par
ent H
ouse
hold
s20
18 C
ount
y H
ealth
Ran
king
s &
Roa
dmap
s; A
mer
ican
Com
mun
ity S
urve
y (A
CS
), 5
Year
Est
imat
es
(Uni
ted
Sta
tes
Cen
sus
Bur
eau)
Civ
ilian
vet
eran
pop
ulat
ion
18+
NEW
201
9U
.S. C
ensu
s B
urea
u, 2
012-
2016
Am
eric
an C
omm
unity
Sur
vey
5-Y
ear E
stim
ates
Dis
able
d po
pula
tion,
civ
ilian
non
-inst
itutio
naliz
edU
.S. C
ensu
s B
urea
u, 2
012-
2016
Am
eric
an C
omm
unity
Sur
vey
5-Y
ear E
stim
ates

Methodist Richardson Medical Center 42
App
endi
x A
: Key
Hea
lth In
dica
tor S
ourc
es
Pag
e o
f
4260
Cat
egor
yPu
blic
Hea
lth In
dica
tor
Sour
ceH
igh
Sch
ool D
ropo
ut20
16 T
exas
Edu
catio
n A
genc
y
Hig
h S
choo
l Gra
duat
ion
2017
Tex
as E
duca
tion
Age
ncy
Hom
icid
es20
18 C
ount
y H
ealth
Ran
king
s &
Roa
dmap
s, C
DC
WO
ND
ER
Mor
talit
y D
ata
Hou
seho
ld in
com
e, m
edia
n N
EW 2
019
2018
Cou
nty
Hea
lth R
anki
ngs
(201
6 S
mal
l Are
a In
com
e an
d P
over
ty E
stim
ates
)
Inco
me
Ineq
ualit
y20
18 C
ount
y H
ealth
Ran
king
s &
Roa
dmap
s; A
mer
ican
Com
mun
ity S
urve
y (A
CS
), 5
Year
Est
imat
es
(Uni
ted
Sta
tes
Cen
sus
Bur
eau)
Indi
vidu
als
Livi
ng B
elow
Pov
erty
Lev
el20
12-2
016
US
Cen
sus
Bur
eau
-Am
eric
an F
actF
inde
r
Indi
vidu
als
Who
Rep
ort B
eing
Dis
able
d20
12-2
016
US
Cen
sus
Bur
eau
-Am
eric
an F
actF
inde
r
Non
-Eng
lish-
spea
king
hou
seho
lds
NEW
201
9U
.S. C
ensu
s B
urea
u, 2
012-
2016
Am
eric
an C
omm
unity
Sur
vey
5-Y
ear E
stim
ates
Soc
ial/M
embe
rshi
p A
ssoc
iatio
ns20
18 C
ount
y H
ealth
Ran
king
s &
Roa
dmap
s; 2
015
Cou
nty
Bus
ines
s P
atte
rns,
Uni
ted
Sta
tes
Cen
sus
Bur
eau
Som
e C
olle
ge20
18 C
ount
y H
ealth
Ran
king
s &
Roa
dmap
s; A
mer
ican
Com
mun
ity S
urve
y (A
CS
), 5
Year
Est
imat
es
(Uni
ted
Sta
tes
Cen
sus
Bur
eau)
Une
mpl
oym
ent
2018
Cou
nty
Hea
lth R
anki
ngs
& R
oadm
aps;
Loc
al A
rea
Une
mpl
oym
ent S
tatis
tics
(LA
US
), B
urea
u of
La
bor S
tatis
tics
Vio
lent
Crim
e O
ffens
es20
18 C
ount
y H
ealth
Ran
king
s &
Roa
dmap
s; U
nifo
rm C
rime
Rep
ortin
g (U
CR
) Pro
gram
, Uni
ted
Sta
tes
Dep
artm
ent o
f Jus
tice,
Fed
eral
Bur
eau
of In
vest
igat
ion
(FB
I)
Preventable Hospitalizations
Ast
hma
Adm
issi
on: P
edia
tric
(Ris
k-A
djus
ted-
Rat
e)20
16 T
exas
Hea
lth a
nd H
uman
Ser
vice
s C
ente
r for
Hea
lth S
tatis
tics
Pre
vent
able
Hos
pita
lizat
ions
Dia
bete
s Lo
wer
-Ext
rem
ity A
mpu
tatio
n A
dmis
sion
: Adu
lt (R
isk-
Adj
uste
d-R
ate)
2016
Tex
as H
ealth
and
Hum
an S
ervi
ces
Cen
ter f
or H
ealth
Sta
tistic
s P
reve
ntab
le H
ospi
taliz
atio
ns
Dia
bete
s S
hort-
term
Com
plic
atio
ns A
dmis
sion
: Ped
iatri
c (R
isk-
Adj
uste
d-R
ate)
2016
Tex
as H
ealth
and
Hum
an S
ervi
ces
Cen
ter f
or H
ealth
Sta
tistic
s P
reve
ntab
le H
ospi
taliz
atio
ns
Gas
troen
terit
is A
dmis
sion
: Ped
iatri
c (R
isk-
Adj
uste
d-R
ate)
2016
Tex
as H
ealth
and
Hum
an S
ervi
ces
Cen
ter f
or H
ealth
Sta
tistic
s P
reve
ntab
le H
ospi
taliz
atio
nsP
erfo
rate
d A
ppen
dix
Adm
issi
on: A
dult
(Ris
k-A
djus
ted-
Rat
e pe
r 100
A
dmis
sion
s fo
r App
endi
citis
)20
16 T
exas
Hea
lth a
nd H
uman
Ser
vice
s C
ente
r for
Hea
lth S
tatis
tics
Pre
vent
able
Hos
pita
lizat
ions
Per
fora
ted
App
endi
x A
dmis
sion
: Ped
iatri
c (R
isk-
Adj
uste
d-R
ate
for
App
endi
citis
)20
16Te
xas
Hea
lth a
nd H
uman
Ser
vice
s C
ente
r for
Hea
lth S
tatis
tics
Pre
vent
able
Hos
pita
lizat
ions
Unc
ontro
lled
Dia
bete
s A
dmis
sion
: Adu
lt (R
isk-
Adj
uste
d-R
ate)
2016
Tex
as H
ealth
and
Hum
an S
ervi
ces
Cen
ter f
or H
ealth
Sta
tistic
s P
reve
ntab
le H
ospi
taliz
atio
ns
Urin
ary
Trac
t Inf
ectio
n A
dmis
sion
: Ped
iatri
c (R
isk-
Adj
uste
d-R
ate)
2016
Tex
as H
ealth
and
Hum
an S
ervi
ces
Cen
ter f
or H
ealth
Sta
tistic
s P
reve
ntab
le H
ospi
taliz
atio
ns
Prev
entio
nD
iabe
tic M
onito
ring
in M
edic
are
Enr
olle
es20
18 C
ount
y H
ealth
Ran
king
s &
Roa
dmap
s; D
artm
outh
Atla
s of
Hea
lth C
are,
CM
S
Mam
mog
raph
y S
cree
ning
in M
edic
are
Enr
olle
es20
18 C
ount
y H
ealth
Ran
king
s &
Roa
dmap
s; D
artm
outh
Atla
s of
Hea
lth C
are,
CM
S

Methodist Richardson Medical Center 43
App
endi
x A
: Key
Hea
lth In
dica
tor S
ourc
es
Pag
e o
f
4260
Cat
egor
yPu
blic
Hea
lth In
dica
tor
Sour
ceH
igh
Sch
ool D
ropo
ut20
16 T
exas
Edu
catio
n A
genc
y
Hig
h S
choo
l Gra
duat
ion
2017
Tex
as E
duca
tion
Age
ncy
Hom
icid
es20
18 C
ount
y H
ealth
Ran
king
s &
Roa
dmap
s, C
DC
WO
ND
ER
Mor
talit
y D
ata
Hou
seho
ld in
com
e, m
edia
n N
EW 2
019
2018
Cou
nty
Hea
lth R
anki
ngs
(201
6 S
mal
l Are
a In
com
e an
d P
over
ty E
stim
ates
)
Inco
me
Ineq
ualit
y20
18 C
ount
y H
ealth
Ran
king
s &
Roa
dmap
s; A
mer
ican
Com
mun
ity S
urve
y (A
CS
), 5
Year
Est
imat
es
(Uni
ted
Sta
tes
Cen
sus
Bur
eau)
Indi
vidu
als
Livi
ng B
elow
Pov
erty
Lev
el20
12-2
016
US
Cen
sus
Bur
eau
-Am
eric
an F
actF
inde
r
Indi
vidu
als
Who
Rep
ort B
eing
Dis
able
d20
12-2
016
US
Cen
sus
Bur
eau
-Am
eric
an F
actF
inde
r
Non
-Eng
lish-
spea
king
hou
seho
lds
NEW
201
9U
.S. C
ensu
s B
urea
u, 2
012-
2016
Am
eric
an C
omm
unity
Sur
vey
5-Y
ear E
stim
ates
Soc
ial/M
embe
rshi
p A
ssoc
iatio
ns20
18 C
ount
y H
ealth
Ran
king
s &
Roa
dmap
s; 2
015
Cou
nty
Bus
ines
s P
atte
rns,
Uni
ted
Sta
tes
Cen
sus
Bur
eau
Som
e C
olle
ge20
18 C
ount
y H
ealth
Ran
king
s &
Roa
dmap
s; A
mer
ican
Com
mun
ity S
urve
y (A
CS
), 5
Year
Est
imat
es
(Uni
ted
Sta
tes
Cen
sus
Bur
eau)
Une
mpl
oym
ent
2018
Cou
nty
Hea
lth R
anki
ngs
& R
oadm
aps;
Loc
al A
rea
Une
mpl
oym
ent S
tatis
tics
(LA
US
), B
urea
u of
La
bor S
tatis
tics
Vio
lent
Crim
e O
ffens
es20
18 C
ount
y H
ealth
Ran
king
s &
Roa
dmap
s; U
nifo
rm C
rime
Rep
ortin
g (U
CR
) Pro
gram
, Uni
ted
Sta
tes
Dep
artm
ent o
f Jus
tice,
Fed
eral
Bur
eau
of In
vest
igat
ion
(FB
I)
Preventable Hospitalizations
Ast
hma
Adm
issi
on: P
edia
tric
(Ris
k-A
djus
ted-
Rat
e)20
16 T
exas
Hea
lth a
nd H
uman
Ser
vice
s C
ente
r for
Hea
lth S
tatis
tics
Pre
vent
able
Hos
pita
lizat
ions
Dia
bete
s Lo
wer
-Ext
rem
ity A
mpu
tatio
n A
dmis
sion
: Adu
lt (R
isk-
Adj
uste
d-R
ate)
2016
Tex
as H
ealth
and
Hum
an S
ervi
ces
Cen
ter f
or H
ealth
Sta
tistic
s P
reve
ntab
le H
ospi
taliz
atio
ns
Dia
bete
s S
hort-
term
Com
plic
atio
ns A
dmis
sion
: Ped
iatri
c (R
isk-
Adj
uste
d-R
ate)
2016
Tex
as H
ealth
and
Hum
an S
ervi
ces
Cen
ter f
or H
ealth
Sta
tistic
s P
reve
ntab
le H
ospi
taliz
atio
ns
Gas
troen
terit
is A
dmis
sion
: Ped
iatri
c (R
isk-
Adj
uste
d-R
ate)
2016
Tex
as H
ealth
and
Hum
an S
ervi
ces
Cen
ter f
or H
ealth
Sta
tistic
s P
reve
ntab
le H
ospi
taliz
atio
nsP
erfo
rate
d A
ppen
dix
Adm
issi
on: A
dult
(Ris
k-A
djus
ted-
Rat
e pe
r 100
A
dmis
sion
s fo
r App
endi
citis
)20
16 T
exas
Hea
lth a
nd H
uman
Ser
vice
s C
ente
r for
Hea
lth S
tatis
tics
Pre
vent
able
Hos
pita
lizat
ions
Per
fora
ted
App
endi
x A
dmis
sion
: Ped
iatri
c (R
isk-
Adj
uste
d-R
ate
for
App
endi
citis
)20
16Te
xas
Hea
lth a
nd H
uman
Ser
vice
s C
ente
r for
Hea
lth S
tatis
tics
Pre
vent
able
Hos
pita
lizat
ions
Unc
ontro
lled
Dia
bete
s A
dmis
sion
: Adu
lt (R
isk-
Adj
uste
d-R
ate)
2016
Tex
as H
ealth
and
Hum
an S
ervi
ces
Cen
ter f
or H
ealth
Sta
tistic
s P
reve
ntab
le H
ospi
taliz
atio
ns
Urin
ary
Trac
t Inf
ectio
n A
dmis
sion
: Ped
iatri
c (R
isk-
Adj
uste
d-R
ate)
2016
Tex
as H
ealth
and
Hum
an S
ervi
ces
Cen
ter f
or H
ealth
Sta
tistic
s P
reve
ntab
le H
ospi
taliz
atio
ns
Prev
entio
nD
iabe
tic M
onito
ring
in M
edic
are
Enr
olle
es20
18 C
ount
y H
ealth
Ran
king
s &
Roa
dmap
s; D
artm
outh
Atla
s of
Hea
lth C
are,
CM
S
Mam
mog
raph
y S
cree
ning
in M
edic
are
Enr
olle
es20
18 C
ount
y H
ealth
Ran
king
s &
Roa
dmap
s; D
artm
outh
Atla
s of
Hea
lth C
are,
CM
S

Methodist Richardson Medical Center 44
Appendix B: Community Resources Identified to Potentially Address Significant Health Needs
Below is a list of resources identified via community input:
Resource County
Assistance Center of Collin County Collin
Collin County Adult Clinic Collin
Collin County Alliance for Children Collin
Collin County Social Services Association Collin
Community Dental Care Collin
Community Lifeline Center Collin
Family Guidance Collin
Family Health Center Collin
Frisco Family Services Collin
Geriatric Wellness Center Collin
Grace to Change Collin
Holy Family Day School Collin
Hope Clinic of McKinney Collin
LifePath Systems Collin
Plano Adult Clinic Collin
Plano Children's Medical Clinic Collin
Plano Indigent Care Clinic Collin
Project Access Collin
Veterans Assistance Center Collin
Wellness Center for Older Adults Collin
Churches Dallas
City of Dallas Dallas
City Square Dallas
Community Health Centers Dallas
Dallas Concilio Dallas
Dallas Housing Authority Dallas
Page ! of ! 49 60

Methodist Richardson Medical Center 45
Dallas Life Foundation Dallas
DART Dallas
DCHHS Dallas
Food Pantries Dallas
FQHCs or charity clinics(Agape, etc.) Dallas
Genesis Women's Shelter Dallas
Habitat for Humanity Dallas
Hospital and Hospital Affiliated Clinics Dallas
Local Health Clinics Dallas
North Texas Food Bank Dallas
Parkland Dallas
Parkland Irving Health Center Dallas
Sharing Life Outreach Dallas
St. Vincent de Paul Dallas
The Bridge Homeless Shelter Dallas
WIC Clinics Dallas
Resource County
Page ! of ! 50 60
Appendix B: Community Resources Identified to Potentially Address Significant Health Needs
Below is a list of resources identified via community input:
Resource County
Assistance Center of Collin County Collin
Collin County Adult Clinic Collin
Collin County Alliance for Children Collin
Collin County Social Services Association Collin
Community Dental Care Collin
Community Lifeline Center Collin
Family Guidance Collin
Family Health Center Collin
Frisco Family Services Collin
Geriatric Wellness Center Collin
Grace to Change Collin
Holy Family Day School Collin
Hope Clinic of McKinney Collin
LifePath Systems Collin
Plano Adult Clinic Collin
Plano Children's Medical Clinic Collin
Plano Indigent Care Clinic Collin
Project Access Collin
Veterans Assistance Center Collin
Wellness Center for Older Adults Collin
Churches Dallas
City of Dallas Dallas
City Square Dallas
Community Health Centers Dallas
Dallas Concilio Dallas
Dallas Housing Authority Dallas
Page ! of ! 49 60

Methodist Richardson Medical Center 46
Appendix C: Federally Designated Health Professional Shortage Areas and Medically Underserved Areas and Populations
Health Professional Shortage Areas (HPSA) 14
U.S. Department of Health and Human Services, Health Resources and Services Administration, 201814
Page of 51 60
Metho
dist Hea
lth System
Co
mmun
ity Hea
lth Nee
ds Assessm
ent
P
age
48 o
f 55
App
endi
x C
: Fed
eral
ly D
esig
nate
d H
ealth
Pro
fess
iona
l Sho
rtag
e A
reas
and
Med
ical
ly U
nder
serv
ed A
reas
and
Po
pula
tions
Hea
lth P
rofe
ssio
nal S
horta
ge A
reas
(HP
SA
)14
Cou
nty
Nam
eH
PS
A ID
HP
SA
Nam
eH
PS
A D
isci
plin
e C
lass
Des
igna
tion
Type
Dal
las
1489
9948
5F
MLK
Jr F
amily
Cen
ter
Prim
ary
Car
e Fe
dera
lly Q
ualif
ied
Hea
lth C
ente
r
Dal
las
1489
9948
D3
Los
Bar
rios
Uni
dos
Com
mun
ity
Hea
lth C
ente
r P
rimar
y C
are
Fede
rally
Qua
lifie
d H
ealth
Cen
ter
Dal
las
6489
9948
89
Los
Bar
rios
Uni
dos
Com
mun
ity
Hea
lth C
ente
r D
enta
l Hea
lth
Fede
rally
Qua
lifie
d H
ealth
Cen
ter
Dal
las
6489
9948
97
MLK
Jr.
Fam
ily C
ente
r D
enta
l Hea
lth
Fede
rally
Qua
lifie
d H
ealth
Cen
ter
Dal
las
7489
9948
1L
Los
Bar
rios
Uni
dos
Com
mun
ity
Hea
lth C
ente
r M
enta
l Hea
lth
Fede
rally
Qua
lifie
d H
ealth
Cen
ter
Dal
las
7489
9948
1V
MLK
Jr.
Fam
ily C
ente
r M
enta
l Hea
lth
Fede
rally
Qua
lifie
d H
ealth
Cen
ter
Dal
las
1489
9948
P6
Dal
las
Cou
nty
Hos
pita
l Dis
trict
H
omel
ess
Pro
gram
s Pr
imar
y C
are
Fede
rally
Qua
lifie
d H
ealth
Cen
ter
Dal
las
6489
9948
C2
Dal
las
Cou
nty
Hos
pita
l Dis
trict
H
omel
ess
Pro
gram
s D
enta
l Hea
lth
Fede
rally
Qua
lifie
d H
ealth
Cen
ter
Dal
las
7489
9948
2V
Dal
las
Cou
nty
Hos
pita
l Dis
trict
H
omel
ess
Pro
gram
s M
enta
l Hea
lth
Fede
rally
Qua
lifie
d H
ealth
Cen
ter
Dal
las
1482
6450
75
Sou
thea
st D
alla
s P
rimar
y C
are
Geo
grap
hic
HP
SA
Dal
las
1489
9948
OZ
Mis
sion
Eas
t Dal
las
(Med
ical
) an
d M
etro
plex
Pro
ject
P
rimar
y C
are
Fede
rally
Qua
lifie
d H
ealth
Cen
ter
Dal
las
6489
9948
MO
M
issi
on E
ast D
alla
s (M
edic
al)
and
Met
ropl
ex P
roje
ct
Den
tal H
ealth
Fe
dera
lly Q
ualif
ied
Hea
lth C
ente
r
Dal
las
7489
9948
MN
M
issi
on E
ast D
alla
s (M
edic
al)
and
Met
ropl
ex P
roje
ct
Men
tal H
ealth
Fe
dera
lly Q
ualif
ied
Hea
lth C
ente
r
14
U.S
. Dep
artm
ent o
f Hea
lth a
nd H
uman
Ser
vice
s, H
ealth
Res
ourc
es a
nd S
ervi
ces
Adm
inis
tratio
n, 2
018

Methodist Richardson Medical Center 47
Metho
dist Hea
lth System
Co
mmun
ity Hea
lth Nee
ds Assessm
ent
P
age
49 o
f 55
Cou
nty
Nam
eH
PS
A ID
HP
SA
Nam
eH
PS
A D
isci
plin
e C
lass
Des
igna
tion
Type
Dal
las
1489
9948
OY
Urb
an In
ter-T
ribal
Cen
ter o
f Te
xas
Prim
ary
Car
e N
ativ
e A
mer
ican
/Trib
al
Faci
lity/
Pop
ulat
ion
Dal
las
6489
9948
MP
Urb
an In
ter-T
ribal
Cen
ter o
f Te
xas
Den
tal H
ealth
N
ativ
e A
mer
ican
/Trib
al
Faci
lity/
Pop
ulat
ion
Dal
las
7489
9948
MP
Urb
an In
ter-T
ribal
Cen
ter o
f Te
xas
Men
tal H
ealth
N
ativ
e A
mer
ican
/Trib
al
Faci
lity/
Pop
ulat
ion
Dal
las
7481
8573
39
Sou
th Ir
ving
Ser
vice
Are
a M
enta
l Hea
lth
Geo
grap
hic
HP
SA
Dal
las
1489
9948
Q0
Hea
ling
Han
ds M
inis
tries
, Inc
. P
rimar
y C
are
Fede
rally
Qua
lifie
d H
ealth
Cen
ter
Dal
las
6489
9948
NX
Hea
ling
Han
ds M
inis
tries
, Inc
. D
enta
l Hea
lth
Fede
rally
Qua
lifie
d H
ealth
Cen
ter
Dal
las
7489
9948
O2
Hea
ling
Han
ds M
inis
tries
, Inc
. M
enta
l Hea
lth
Fede
rally
Qua
lifie
d H
ealth
Cen
ter
Dal
las
1487
7906
22
Ofa
c-P
arkl
and
Cen
ter f
or
Inte
rnal
Med
icin
e (P
cim
) P
rimar
y C
are
Oth
er F
acilit
y
Dal
las
1488
1476
11
Sim
pson
-Stu
art
Prim
ary
Car
e G
eogr
aphi
c H
PS
A
Dal
las
1487
7324
21
Trin
ity A
rea
Prim
ary
Car
e G
eogr
aphi
c H
PS
A
Dal
las
6488
1388
03
Lisb
on S
ervi
ce A
rea
Den
tal H
ealth
G
eogr
aphi
c H
PS
A
Dal
las
6486
3508
27
Wes
t Dal
las/
Clif
f Hal
l D
enta
l Hea
lth
Hig
h N
eeds
Geo
grap
hic
HP
SA
Dal
las
7482
1326
65
Wes
t Dal
las
Men
tal H
ealth
H
igh
Nee
ds G
eogr
aphi
c H
PS
A
Col
lin
7485
1093
04
Low
Inco
me-
Col
lin C
ount
y M
enta
l Hea
lth
Low
Inco
me
Pop
ulat
ion
HP
SA
Metho
dist Hea
lth System
Co
mmun
ity Hea
lth Nee
ds Assessm
ent
P
age
48 o
f 55
App
endi
x C
: Fed
eral
ly D
esig
nate
d H
ealth
Pro
fess
iona
l Sho
rtag
e A
reas
and
Med
ical
ly U
nder
serv
ed A
reas
and
Po
pula
tions
Hea
lth P
rofe
ssio
nal S
horta
ge A
reas
(HP
SA
)14
Cou
nty
Nam
eH
PS
A ID
HP
SA
Nam
eH
PS
A D
isci
plin
e C
lass
Des
igna
tion
Type
Dal
las
1489
9948
5F
MLK
Jr F
amily
Cen
ter
Prim
ary
Car
e Fe
dera
lly Q
ualif
ied
Hea
lth C
ente
r
Dal
las
1489
9948
D3
Los
Bar
rios
Uni
dos
Com
mun
ity
Hea
lth C
ente
r P
rimar
y C
are
Fede
rally
Qua
lifie
d H
ealth
Cen
ter
Dal
las
6489
9948
89
Los
Bar
rios
Uni
dos
Com
mun
ity
Hea
lth C
ente
r D
enta
l Hea
lth
Fede
rally
Qua
lifie
d H
ealth
Cen
ter
Dal
las
6489
9948
97
MLK
Jr.
Fam
ily C
ente
r D
enta
l Hea
lth
Fede
rally
Qua
lifie
d H
ealth
Cen
ter
Dal
las
7489
9948
1L
Los
Bar
rios
Uni
dos
Com
mun
ity
Hea
lth C
ente
r M
enta
l Hea
lth
Fede
rally
Qua
lifie
d H
ealth
Cen
ter
Dal
las
7489
9948
1V
MLK
Jr.
Fam
ily C
ente
r M
enta
l Hea
lth
Fede
rally
Qua
lifie
d H
ealth
Cen
ter
Dal
las
1489
9948
P6
Dal
las
Cou
nty
Hos
pita
l Dis
trict
H
omel
ess
Pro
gram
s Pr
imar
y C
are
Fede
rally
Qua
lifie
d H
ealth
Cen
ter
Dal
las
6489
9948
C2
Dal
las
Cou
nty
Hos
pita
l Dis
trict
H
omel
ess
Pro
gram
s D
enta
l Hea
lth
Fede
rally
Qua
lifie
d H
ealth
Cen
ter
Dal
las
7489
9948
2V
Dal
las
Cou
nty
Hos
pita
l Dis
trict
H
omel
ess
Pro
gram
s M
enta
l Hea
lth
Fede
rally
Qua
lifie
d H
ealth
Cen
ter
Dal
las
1482
6450
75
Sou
thea
st D
alla
s P
rimar
y C
are
Geo
grap
hic
HP
SA
Dal
las
1489
9948
OZ
Mis
sion
Eas
t Dal
las
(Med
ical
) an
d M
etro
plex
Pro
ject
P
rimar
y C
are
Fede
rally
Qua
lifie
d H
ealth
Cen
ter
Dal
las
6489
9948
MO
M
issi
on E
ast D
alla
s (M
edic
al)
and
Met
ropl
ex P
roje
ct
Den
tal H
ealth
Fe
dera
lly Q
ualif
ied
Hea
lth C
ente
r
Dal
las
7489
9948
MN
M
issi
on E
ast D
alla
s (M
edic
al)
and
Met
ropl
ex P
roje
ct
Men
tal H
ealth
Fe
dera
lly Q
ualif
ied
Hea
lth C
ente
r
14
U.S
. Dep
artm
ent o
f Hea
lth a
nd H
uman
Ser
vice
s, H
ealth
Res
ourc
es a
nd S
ervi
ces
Adm
inis
tratio
n, 2
018

Methodist Richardson Medical Center 48
Metho
dist Hea
lth System
Co
mmun
ity Hea
lth Nee
ds Assessm
ent
P
age
50 o
f 55
App
endi
x D
: Pub
lic H
ealth
Indi
cato
rs S
how
ing
Gre
ater
Nee
d W
hen
Com
pare
d to
Sta
te B
ench
mar
k
Pub
lic H
ealth
Indi
cato
r C
ateg
ory
Indi
cato
r Def
initi
on
Pric
e-Ad
just
ed M
edic
are
Rei
mbu
rsem
ents
per
Enr
olle
e A
cces
s to
Car
e 20
15 A
mou
nt o
f Pric
e-A
djus
ted
Med
icar
e R
eim
burs
emen
ts (P
art A
and
B
) per
Enr
olle
e
Uni
nsur
ed C
hild
ren
Acc
ess
to C
are
2015
Per
cent
age
of C
hild
ren
Und
er A
ge 1
9 W
ithou
t Hea
lth In
sura
nce
Per
cent
age
of P
opul
atio
n un
der a
ge 6
5 w
ithou
t Hea
lth In
sura
nce
Acc
ess
to C
are
2015
Per
cent
age
of P
opul
atio
n U
nder
Age
65
With
out H
ealth
Insu
ranc
e
No
vehi
cle
Ava
ilabl
e A
cces
s to
Car
e 20
17 P
erce
ntag
e of
Hou
seho
lds
with
no
Veh
icle
Ava
ilabl
e
Rat
io o
f Pop
ulat
ion
to O
ne N
on-
Phy
sici
an P
rimar
y C
are
Pro
vide
r A
cces
s to
Car
e 20
17 R
atio
of P
opul
atio
n to
Prim
ary
Car
e P
rovi
ders
Oth
er th
an
Phy
sici
ans
Can
cer I
ncid
ence
- A
ll C
ause
s C
ance
r 20
11-2
015
Age-
Adj
uste
d C
ance
r (A
ll) In
cide
nce
Rat
e C
ases
per
100
,000
Can
cer I
ncid
ence
- C
olon
C
ance
r 20
11-2
015
Age-
Adj
uste
d C
olon
& R
ectu
m C
ance
r Inc
iden
ce R
ate
Cas
es
per 1
00,0
00
Can
cer I
ncid
ence
- Fe
mal
e Br
east
C
ance
r 20
11-2
015
Age-
Adj
uste
d Fe
mal
e B
reas
t Can
cer I
ncid
ence
Rat
e C
ases
pe
r 100
,000
Can
cer I
ncid
ence
- Pr
osta
te
Can
cer
2011
-201
5 Ag
e-A
djus
ted
Pro
stat
e C
ance
r Inc
iden
ce R
ate
Cas
es p
er
100,
000
Can
cer M
orta
lity
Rat
e C
ance
r 20
13 A
ll C
ance
r Age
-Adj
uste
d D
eath
Rat
e pe
r 100
,000
(Age
-Adj
uste
d us
ing
the
2000
U.S
. Sta
ndar
d P
opul
atio
n)
Arth
ritis
in M
edic
are
Pop
ulat
ion
Chr
onic
Con
ditio
n -
Arth
ritis
20
07-2
015
Pre
vale
nce
of C
hron
ic C
ondi
tion
Acr
oss
all M
edic
are
Ben
efic
iarie
s
Hea
rt D
isea
se M
orta
lity
Rat
e C
hron
ic C
ondi
tion
- C
ardi
ovas
cula
r 20
13 H
eart
Dis
ease
Age
-Adj
uste
d D
eath
Rat
e pe
r 100
,000
(Age
-adj
uste
d us
ing
the
2000
U.S
. Sta
ndar
d P
opul
atio
n)
Hyp
erlip
idem
ia in
Med
icar
e P
opul
atio
n C
hron
ic C
ondi
tion
- C
ardi
ovas
cula
r 20
07-2
015
Pre
vale
nce
of C
hron
ic C
ondi
tion
Acr
oss
all M
edic
are
Ben
efic
iarie
s
Atri
al F
ibril
latio
n in
Med
icar
e P
opul
atio
n C
hron
ic C
ondi
tion
- C
ardi
ovas
cula
r 20
07-2
015
Pre
vale
nce
of C
hron
ic C
ondi
tion
Acr
oss
all M
edic
are
Ben
efic
iarie
s
Stro
ke M
orta
lity
Rat
e C
hron
ic C
ondi
tion
- C
ereb
rova
scul
ar
2013
Cer
ebro
vasc
ular
Dis
ease
(Stro
ke) A
ge-A
djus
ted
Dea
th R
ate
per
100,
000
(Age
-adj
uste
d us
ing
the
2000
U.S
. Sta
ndar
d P
opul
atio
n)
Stro
ke in
Med
icar
e P
opul
atio
n Ch
ronic Co
ndition
‐ Ce
rebrov
ascular
2007
-201
5 P
reva
lenc
e of
Chr
onic
Con
ditio
n A
cros
s al
l Med
icar
e B
enef
icia
ries

Methodist Richardson Medical Center 49
Metho
dist Hea
lth System
Co
mmun
ity Hea
lth Nee
ds Assessm
ent
P
age
52 o
f 55
Pub
lic H
ealth
Indi
cato
r C
ateg
ory
Indi
cato
r Def
initi
on
Phy
sica
l Ina
ctiv
ity
Hea
lth B
ehav
iors
- Ex
erci
se
2014
Per
cent
age
of A
dults
Age
s 20
and
Ove
r Rep
ortin
g N
o Le
isur
e-Ti
me
Phy
sica
l Act
ivity
in th
e P
ast M
onth
M
otor
Veh
icle
Driv
ing
Dea
ths
with
A
lcoh
ol In
volv
emen
t H
ealth
Beh
avio
rs -
Sub
stan
ce A
buse
20
12-2
016
Perc
enta
ge o
f Mot
or V
ehic
le C
rash
Dea
ths
that
had
Alc
ohol
In
volv
emen
t
Dru
g P
oiso
ning
Dea
ths
Rat
e H
ealth
Beh
avio
rs -
Sub
stan
ce A
buse
20
14-2
016
Num
ber o
f Dru
g P
oiso
ning
Dea
ths
(Dru
g O
verd
ose
Dea
ths)
pe
r 100
,000
Pop
ulat
ion
Adu
lt S
mok
ing
Hea
lth B
ehav
iors
- S
ubst
ance
Abu
se
2016
Per
cent
age
of th
e A
dult
Pop
ulat
ion
in a
Cou
nty
Who
Bot
h R
epor
t th
at T
hey
Cur
rent
ly S
mok
e E
very
Day
or M
ost D
ays
and
Hav
e S
mok
ed a
t Le
ast 1
00 C
igar
ette
s in
The
ir Li
fetim
e
Acc
iden
tal P
oiso
ning
Dea
ths
whe
re
Opi
oids
wer
e In
volv
ed
Hea
lth B
ehav
iors
- S
ubst
ance
Abu
se
2010
-201
7 Ac
cide
ntal
Poi
soni
ng D
eath
s w
here
Opi
oids
wer
e In
volv
ed
(Und
erly
ing
Cau
ses
of D
eath
: X40
-X44
, and
One
of t
he F
ollo
win
g IC
D-1
0 C
odes
Iden
tifyi
ng O
pioi
ds: T
40.0
, T40
.1, T
40.2
, T40
.3, T
40.4
, T40
.6)
Teen
Birt
h R
ate
per 1
,000
Fem
ale
Pop
ulat
ion,
Age
s 15
-19
Hea
lth B
ehav
iors
- Te
en
Pre
gnan
cy
2010
-201
6 N
umbe
r of B
irths
to F
emal
es A
ges
15-1
9 pe
r 1,0
00 F
emal
es
in a
Cou
nty
Long
Com
mut
e A
lone
H
ealth
Sta
tus
2012
-201
6 Am
ong
Wor
kers
Who
Com
mut
e in
The
ir C
ar A
lone
, the
P
erce
ntag
e th
at C
omm
ute
Mor
e th
an 3
0 M
inut
es
Pre
mat
ure
Dea
th (P
oten
tial Y
ears
Los
t) H
ealth
Sta
tus
2014
-201
6 P
rem
atur
e D
eath
; Yea
rs o
f Pot
entia
l Life
Los
t Bef
ore
Age
75
per 1
00,0
00 P
opul
atio
n (A
ge-A
djus
ted)
Adu
lts R
epor
ting
Fair
or P
oor H
ealth
H
ealth
Sta
tus
2016
Per
cent
age
of A
dults
Rep
ortin
g Fa
ir or
Poo
r Hea
lth (A
ge-A
djus
ted)
Freq
uent
Phy
sica
l Dis
tress
H
ealth
Sta
tus
2016
Per
cent
age
of A
dults
who
Rep
orte
d ≥1
4 D
ays
of P
oor P
hysi
cal
Hea
lth in
the
Pas
t 30
Day
s
HIV
Pre
vale
nce
Infe
ctio
us D
isea
se -
HIV
20
15 N
umbe
r of P
erso
ns A
ged
13 Y
ears
and
Old
er L
ivin
g w
ith a
D
iagn
osis
of H
uman
Imm
unod
efic
ienc
y V
irus
(HIV
) Inf
ectio
n pe
r 100
,000
P
opul
atio
n
Sex
ually
Tra
nsm
itted
Infe
ctio
n In
cide
nce
Infe
ctio
us D
isea
se -
Sex
ually
Tra
nsm
itted
20
15 N
umbe
r of N
ewly
Dia
gnos
ed C
hlam
ydia
Cas
es p
er 1
00,0
00
Pop
ulat
ion
Infa
nt M
orta
lity
Rat
e In
jury
& D
eath
- C
hild
ren
2010
-201
6 N
umbe
r of A
ll In
fant
Dea
ths
(With
in 1
yea
r), p
er 1
,000
Liv
e B
irths
Chi
ld M
orta
lity
Rat
e In
jury
& D
eath
- C
hild
ren
2013
-201
6 N
umbe
r of D
eath
s A
mon
g C
hild
ren
unde
r Age
18
per 1
00,0
00
Low
Birt
h W
eigh
t Per
cent
M
ater
nal a
nd C
hild
H
ealth
20
10-2
016
Perc
enta
ge o
f Liv
e B
irths
with
Low
Birt
hwei
ght;
< 25
00 G
ram
s
Ver
y Lo
w B
irth
Wei
ght (
VLB
W)
Mat
erna
l and
Chi
ld
Hea
lth
2016
Liv
e B
irths
Wei
ghin
g Le
ss th
an 1
,500
Gra
ms
(3.4
Pou
nds)
Metho
dist Hea
lth System
Co
mmun
ity Hea
lth Nee
ds Assessm
ent
P
age
50 o
f 55
App
endi
x D
: Pub
lic H
ealth
Indi
cato
rs S
how
ing
Gre
ater
Nee
d W
hen
Com
pare
d to
Sta
te B
ench
mar
k
Pub
lic H
ealth
Indi
cato
r C
ateg
ory
Indi
cato
r Def
initi
on
Pric
e-Ad
just
ed M
edic
are
Rei
mbu
rsem
ents
per
Enr
olle
e A
cces
s to
Car
e 20
15 A
mou
nt o
f Pric
e-A
djus
ted
Med
icar
e R
eim
burs
emen
ts (P
art A
and
B
) per
Enr
olle
e
Uni
nsur
ed C
hild
ren
Acc
ess
to C
are
2015
Per
cent
age
of C
hild
ren
Und
er A
ge 1
9 W
ithou
t Hea
lth In
sura
nce
Per
cent
age
of P
opul
atio
n un
der a
ge 6
5 w
ithou
t Hea
lth In
sura
nce
Acc
ess
to C
are
2015
Per
cent
age
of P
opul
atio
n U
nder
Age
65
With
out H
ealth
Insu
ranc
e
No
vehi
cle
Ava
ilabl
e A
cces
s to
Car
e 20
17 P
erce
ntag
e of
Hou
seho
lds
with
no
Veh
icle
Ava
ilabl
e
Rat
io o
f Pop
ulat
ion
to O
ne N
on-
Phy
sici
an P
rimar
y C
are
Pro
vide
r A
cces
s to
Car
e 20
17 R
atio
of P
opul
atio
n to
Prim
ary
Car
e P
rovi
ders
Oth
er th
an
Phy
sici
ans
Can
cer I
ncid
ence
- A
ll C
ause
s C
ance
r 20
11-2
015
Age-
Adj
uste
d C
ance
r (A
ll) In
cide
nce
Rat
e C
ases
per
100
,000
Can
cer I
ncid
ence
- C
olon
C
ance
r 20
11-2
015
Age-
Adj
uste
d C
olon
& R
ectu
m C
ance
r Inc
iden
ce R
ate
Cas
es
per 1
00,0
00
Can
cer I
ncid
ence
- Fe
mal
e Br
east
C
ance
r 20
11-2
015
Age-
Adj
uste
d Fe
mal
e B
reas
t Can
cer I
ncid
ence
Rat
e C
ases
pe
r 100
,000
Can
cer I
ncid
ence
- Pr
osta
te
Can
cer
2011
-201
5 Ag
e-A
djus
ted
Pro
stat
e C
ance
r Inc
iden
ce R
ate
Cas
es p
er
100,
000
Can
cer M
orta
lity
Rat
e C
ance
r 20
13 A
ll C
ance
r Age
-Adj
uste
d D
eath
Rat
e pe
r 100
,000
(Age
-Adj
uste
d us
ing
the
2000
U.S
. Sta
ndar
d P
opul
atio
n)
Arth
ritis
in M
edic
are
Pop
ulat
ion
Chr
onic
Con
ditio
n -
Arth
ritis
20
07-2
015
Pre
vale
nce
of C
hron
ic C
ondi
tion
Acr
oss
all M
edic
are
Ben
efic
iarie
s
Hea
rt D
isea
se M
orta
lity
Rat
e C
hron
ic C
ondi
tion
- C
ardi
ovas
cula
r 20
13 H
eart
Dis
ease
Age
-Adj
uste
d D
eath
Rat
e pe
r 100
,000
(Age
-adj
uste
d us
ing
the
2000
U.S
. Sta
ndar
d P
opul
atio
n)
Hyp
erlip
idem
ia in
Med
icar
e P
opul
atio
n C
hron
ic C
ondi
tion
- C
ardi
ovas
cula
r 20
07-2
015
Pre
vale
nce
of C
hron
ic C
ondi
tion
Acr
oss
all M
edic
are
Ben
efic
iarie
s
Atri
al F
ibril
latio
n in
Med
icar
e P
opul
atio
n C
hron
ic C
ondi
tion
- C
ardi
ovas
cula
r 20
07-2
015
Pre
vale
nce
of C
hron
ic C
ondi
tion
Acr
oss
all M
edic
are
Ben
efic
iarie
s
Stro
ke M
orta
lity
Rat
e C
hron
ic C
ondi
tion
- C
ereb
rova
scul
ar
2013
Cer
ebro
vasc
ular
Dis
ease
(Stro
ke) A
ge-A
djus
ted
Dea
th R
ate
per
100,
000
(Age
-adj
uste
d us
ing
the
2000
U.S
. Sta
ndar
d P
opul
atio
n)
Stro
ke in
Med
icar
e P
opul
atio
n Ch
ronic Co
ndition
‐ Ce
rebrov
ascular
2007
-201
5 P
reva
lenc
e of
Chr
onic
Con
ditio
n A
cros
s al
l Med
icar
e B
enef
icia
ries

Chronic Kidney Disease in Medicare Population
Chronic Condition - Kidney Disease
2007-2015 Prevalence of Chronic Condition Across all Medicare Beneficiaries
Adult Obesity (Percent) Chronic Condition - Obesity
2014 Percentage of the Adult Population (Age 20 and Older) that Reports a Body Mass Index (BMI) Greater than or Equal to 30 kg/m2
Osteoporosis in Medicare Population
Chronic Condition - Osteoporosis
2007-2015 Prevalence of Chronic Condition Across all Medicare Beneficiaries
Some College Education 2012-2016 Percentage of Adults Ages 25-44 with Some Post-Secondary Education
High School Dropout Education2016 Percentage of Students from the Same Class who Drop out Before Completing their High School Education
High School Graduation Education
2016 Percentage of Students from a Class of Beginning Ninth Graders who Graduate by their Anticipated Graduation Date, or Within Four Years of Beginning Ninth Grade
Air Pollution - Particulate Matter Daily Density Environment 2012 Average Daily Density of Fine Particulate Matter
in Micrograms per Cubic Meter (PM2.5)
Driving Alone to Work Environment 2012-2016 Percentage of the Workforce that Drives Alone to Work
Food Insecure Environment - Food
2015 Percentage of Population Who Lacked Adequate Access to Food During the Past Year
Severe Housing Problems Environment - Housing
2010-2014 Percentage of Households with at Least 1 of 4 Housing Problems: Overcrowding, High Housing Costs, or Lack of Kitchen or Plumbing Facilities
Renter-Occupied Housing Environment - Housing
2017 Percentage of Households that are Renter-Occupied
Homicides Environment - Violence
2010-2016 Number of Deaths Due to Homicide, Defined as ICD-10 Codes X85-Y09, per 100,000 Population
Violent Crime Offenses Environment - Violence
2012-2014 Number of Reported Violent Crime Offenses per 100,000 Population
Death Rate Due to Firearms Environment - Violence
2012-2016 Number of Deaths due to Firearms per 100,000 Population
Physical Inactivity Health Behaviors - Exercise
2014 Percentage of Adults Ages 20 and Over Reporting No Leisure-Time Physical Activity in the Past Month
Motor Vehicle Driving Deaths with Alcohol Involvement
Health Behaviors - Substance Abuse
2012-2016 Percentage of Motor Vehicle Crash Deaths that had Alcohol Involvement
Drug Poisoning Deaths Rate Health Behaviors - Substance Abuse
2014-2016 Number of Drug Poisoning Deaths (Drug Overdose Deaths) per 100,000 Population
Adult Smoking Health Behaviors - Substance Abuse
2016 Percentage of the Adult Population in a County Who Both Report that They Currently Smoke Every Day or Most Days and Have Smoked at Least 100 Cigarettes in Their Lifetime
Public Health Indicator Category Indicator Definition
Page of 57 60
Methodist Richardson Medical Center 50
Appendix D: Public Health Indicators Showing Greater Need When Compared to State Benchmark
Page of 55 60

Methodist Richardson Medical Center 51
Accidental Poisoning Deaths where Opioids were Involved
Health Behaviors - Substance Abuse
2010-2017 Accidental Poisoning Deaths where Opioids were Involved (Underlying Causes of Death: X40-X44, and One of the Following ICD-10 Codes Identifying Opioids: T40.0, T40.1, T40.2, T40.3, T40.4, T40.6)
Teen Birth Rate per 1,000 Female Population, Ages 15-19
Health Behaviors - Teen Pregnancy
2010-2016 Number of Births to Females Ages 15-19 per 1,000 Females in a County
Long Commute Alone Health Status2012-2016 Among Workers Who Commute in Their Car Alone, the Percentage that Commute More than 30 Minutes
Premature Death (Potential Years Lost) Health Status
2014-2016 Premature Death; Years of Potential Life Lost Before Age 75 per 100,000 Population (Age-Adjusted)
Adults Reporting Fair or Poor Health Health Status 2016 Percentage of Adults Reporting Fair or Poor
Health (Age-Adjusted)
Frequent Physical Distress Health Status 2016 Percentage of Adults who Reported 14 Days of Poor Physical Health in the Past 30 Days
HIV Prevalence Infectious Disease - HIV
2015 Number of Persons Aged 13 Years and Older Living with a Diagnosis of Human Immunodeficiency Virus (HIV) Infection per 100,000 Population
Sexually Transmitted Infection Incidence
Infectious Disease - Sexually Transmitted
2015 Number of Newly Diagnosed Chlamydia Cases per 100,000 Population
Infant Mortality Rate Injury & Death - Children
2010-2016 Number of All Infant Deaths (Within 1 year), per 1,000 Live Births
Child Mortality Rate Injury & Death - Children
2013-2016 Number of Deaths Among Children under Age 18 per 100,000
Low Birth Weight Percent Maternal and Child Health
2010-2016 Percentage of Live Births with Low Birthweight; < 2500 Grams
Very Low Birth Weight (VLBW)
Maternal and Child Health
2016 Live Births Weighing Less than 1,500 Grams (3.4 Pounds)
Low Birth Weight Rate Maternal and Child Health
2016 Number Observed / Adult Population Age 18 and Older
First Trimester Entry into Prenatal Care
Maternal and Child Health
2014 Percent of Births with Onset of Prenatal Care within the First Trimester
Intentional Self-Harm; Suicide Mental Health 2015 Intentional Self-Harm (Suicide) (X60-X84, Y87.0)
Average Number of Mentally Unhealthy Days Reported in Past 30 days (Age-Adjusted)
Mental Health 2016 Average Number of Mentally Unhealthy Days Reported in Past 30 Days (Age-Adjusted)
Frequent Mental Distress Mental Health 2016 Percentage of Adults who Reported 14 Days of Poor Mental Health in the Past 30 Days
Ratio of Population to One Mental Health Provider Mental Health 2017 Ratio of Population to Mental Health Providers
Public Health Indicator Category Indicator Definition
Page of 58 60
Appendix D: Public Health Indicators Showing Greater Need When Compared to State Benchmark
Page of 55 60

Methodist Richardson Medical Center 52
Depression in Medicare Population Mental Health 2007-2015 Prevalence of Chronic Condition Across
all Medicare Beneficiaries
Schizophrenia and Other Psychotic Disorders in Medicare Population
Mental Health 2007-2015 Prevalence of Chronic Condition Across all Medicare Beneficiaries
Alzheimer's Disease/Dementia in Medicare Population
Mental Health 2007-2015 Prevalence of Chronic Condition Across all Medicare Beneficiaries
Perforated Appendix Admission: Adult (Risk-Adjusted-Rate per 100 Admissions for Appendicitis)
Preventable Hospitalizations
2016 Number Observed / Adult Population Age 18 and Older
Perforated Appendix Admission: Pediatric (Risk-Adjusted-Rate for Appendicitis)
Preventable Hospitalizations
2016 Number Observed / Adult Population Age 18 and Older
Asthma Admission: Pediatric (Risk-Adjusted-Rate)
Preventable Hospitalizations
2016 Number Observed / Adult Population Age 18 and Older
Children in Single-Parent Households SDH 2012-2016 Percentage of Children that Live in a
Household Headed by Single Parent
Individuals Living Below Poverty Level SDH - Income 2012-2016 American Community Survey 5-Year
Estimates, Individuals below Poverty Level
Children Eligible for Free Lunch Enrolled in Public Schools
SDH - Income2015-2016 Percentage of Children Enrolled in Public Schools that are Eligible for Free or Reduced Price Lunch
Household Income, Median SDH - Income 2016 Income where Half of Households in a County Earn More and Half of Households Earn Less
Children in Poverty SDH - Income 2016 Percentage of Children Under Age 18 in Poverty
Non-English Speaking Households SDH - Language 2012 Percent of Households with Language other
than English
Disconnected youth SDH - Social Isolation
2010-2014 Population Between the Ages of 16 and 24 who are Neither Working nor in School
Social/Membership Associations
SDH - Social Isolation
2015 Number of Membership Associations per 10,000 Population
Public Health Indicator Category Indicator Definition
Page of 59 60
Appendix D: Public Health Indicators Showing Greater Need When Compared to State Benchmark
Page of 55 60

Methodist Richardson Medical Center 53
Appendix E: Evaluation of Prior Implementation Strategy Impact
Page ! of ! 60 60
Identified Need Implementation Strategy Response Status
Access to care
Continue to provide care to uninsured or underinsured patients through existing programs and facilities; recruitment of primary care providers where appropriate; adding access points throughout the service area (such as family health centers, imaging and urgent care locations); providing low-cost screenings through programs such as MHS’ Mobile Mammography program and low-dose screenings for lung cancer; offering streamlined care for patients through various navigator programs and virtual visits; and collaborating with community agencies such as City of Richardson to provide an immunization clinic and Collin County Project Access.
• $156.0M (FY2017) in unreimbursed cost of charity care (10.5% of net patient revenue)
• Approval to build Midlothian Hospital bringing acute care and outpatient services to Midlothian and surrounding communities
• Opened new Convenient Care Campus in Grand Prairie (primary & specialty care, UC, imaging, and lab)
• $85M expansion at MRMC (adds 2 floors, 150 beds, OR & 500-space parking garage)
• Methodist Medical Group launched MethodistNOW (virtual visits with online diagnosis & treatment, accessible 24/7)
• MHS trained 88 residents in the Graduate Medical Education program in 2017-2018 academic year
• City of Richardson immunization clinics reached 1,097 children in 2017 with 2,623 vaccines given and YTD 2018 reached 608 children with 1,481 vaccines given
• Over $500K given to various community agencies and groups to further MHS mission and outreach to communities served through sponsorships and events, marketing support, and outreach
• Cancer screenings – 2 screenings reached 100 community members
• Low-dose cancer screenings – provided at low cost for those without insurance; working to screen City of Richardson employees
• Over 1,000 people helped in the past two years through the Asian Breast Health outreach program
• Nearly 2,400 mammograms provided through MHS’ mobile mammography program in the past 2 years
• 570 educational classes and events provided through Generations program in 2017 with 10,645 attendees
• Over 100 patients with ongoing monitoring in the high risk assessment clinic at Richardson Cancer Center
• Food for Life program 3-day class about changing diet to prevent cancer and other chronic
Diabetes
Provide ongoing educational classes and support groups with a focus on Diabetes; continue existing entity-based chronic disease programs such as the 1115 Waiver Projects; continue to collaborate with community agencies such as the Texas Agri-life Extension office to increase access to services and improve awareness of risk factors and treatment.
Heart Disease
Continue to provide education and treatment through existing and new area Methodist Family Health Centers; provide ongoing community education and support services; and collaborate with community agencies to improve awareness of risk factors and treatment.
Awareness and collaboration of community resources
Continue various navigator programs such as the ED Patient Navigation 1115 Waiver project and MHS Mobile mammography program; collaborate with local municipalities and coalitions (such as Whole Foods Food for Life Program; RISH Health Science Tech rotational program and the Learning Lab for Health Sciences at the Continuing Care Campus to expand outreach and awareness of community resources; provide support with charitable contribution to community agencies to improve awareness of services.
Cancer
Provide low-cost screening mammograms to area residents through MHS’ Mobile Mammography program; provide ongoing community education and support services (such as Senior Access Generations programming; Asian Breast Health Outreach Project and high risk assessment clinic at the Richardson Cancer Center.
• Food for Life program 3-day class about changing diet to prevent cancer and other chronic illnesses
• Monthly ongoing support groups for Breast Cancer, HPB and Diabetes
• Faith Community Nursing outreach includes programs that promote health and wellness (engaged over 20,000 members through programming and gave over 600 flu shots in the past two years)
• 1115 Waiver/DSRIP program leverages ED patient navigators to guide patients seeking routine medical care in the ED to Primary Care Providers at Golden Cross and MCMC Family Medicine Clinic
Status continued
• Over 1,480 patients received one-on-one navigation & chronic disease services FYTD 2018
• MHS Diabetes Council works with the American Diabetes Association to raise awareness of diabetes prevention and treatment; Activities include participation in health fairs, hosting clinical education seminars and fund-raising efforts (Tour de Cure)
• Offer free community “Lunch & Learns” featuring health-related topics such as nutrition, emotional health, and chronic disease prevention
• Collaboration with JPS, The Caring Place (charity clinic), Christ’s Family Clinic, Parkland and other local charity clinics to coordinate care for low income and Medicaid patients

Methodist Richardson Medical Center 54
Cancer
Provide low-cost screening mammograms to area residents through MHS’ Mobile Mammography program; provide ongoing community education and support services (such as Senior Access Generations programming; Asian Breast Health Outreach Project and high risk assessment clinic at the Richardson Cancer Center.
• Food for Life program 3-day class about changing diet to prevent cancer and other chronic illnesses
• Monthly ongoing support groups for Breast Cancer, HPB and Diabetes
• Faith Community Nursing outreach includes programs that promote health and wellness (engaged over 20,000 members through programming and gave over 600 flu shots in the past two years)
• 1115 Waiver/DSRIP program leverages ED patient navigators to guide patients seeking routine medical care in the ED to Primary Care Providers at Golden Cross and MCMC Family Medicine Clinic
Status continued
• Over 1,480 patients received one-on-one navigation & chronic disease services FYTD 2018
• MHS Diabetes Council works with the American Diabetes Association to raise awareness of diabetes prevention and treatment; Activities include participation in health fairs, hosting clinical education seminars and fund-raising efforts (Tour de Cure)
• Offer free community “Lunch & Learns” featuring health-related topics such as nutrition, emotional health, and chronic disease prevention
• Collaboration with JPS, The Caring Place (charity clinic), Christ’s Family Clinic, Parkland and other local charity clinics to coordinate care for low income and Medicaid patients
Appendix E: Evaluation of Prior Implementation Strategy Impact
Page ! of ! 60 60