COMMUNITY EXPECTATIONS AND PERCEPTIONS OF …
157
COMMUNITY EXPECTATIONS AND PERCEPTIONS OF MUNICIPAL SERVICE DELIVERY: A CASE STUDY IN THE EMFULENI LOCAL AREA ANNIE MOJAESI MOLETSANE A dissertation submitted in fulfillment of the requirements for the degree MAGISTER of COMMERCE BUSINESS MANAGEMENT in the SCHOOL OF ECONOMIC SCIENCES at the VAAL TRIANGLE CAMPUS of the North-West University Vanderbijlpark Supervisor: Dr N de Klerk Vanderbijlpark 2012
Transcript of COMMUNITY EXPECTATIONS AND PERCEPTIONS OF …

COMMUNITY EXPECTATIONS AND PERCEPTIONS OF
MUNICIPAL SERVICE DELIVERY: A CASE STUDY IN
THE EMFULENI LOCAL AREA
ANNIE MOJAESI MOLETSANE
A dissertation submitted in fulfillment
of the requirements for the degree
MAGISTER of COMMERCE
BUSINESS MANAGEMENT
in the
SCHOOL OF ECONOMIC SCIENCES
at the
VAAL TRIANGLE CAMPUS
of the
North-West University
Vanderbijlpark
Supervisor: Dr N de Klerk
Vanderbijlpark
2012

ii
ACKNOWLEDGEMENTS
I want to give thanks to the following individuals who made this work
worth my undertaking:
God, Heavenly Father, Lord Jesus, I glorify your holy name. I would not
have managed on my own, having you by side made me who I am. You
gave me the courage and ability to complete this degree: Master of
Commerce.
My loving husband, David, you are a pillar of strength, a shoulder to lean
on. Thank you for the love and support you have given me, especially
during the challenging times of this study.
My son, Thabo, and my daughter, Rearabetsoe, thank you for your
consideration. I hope my achievements will be your inspiration to study.
My late mother and father, I wish you were here to share this, but I know
you are proud of me. My brother Ramolamu Joseph, thank you for your
prayers, encouragement, support and care.
Dr N de Klerk, my supervisor and Prof. A.L. Bevan-Dye, my co-supervisor,
both from North West University (Vaal Campus). This dissertation would
not have been a success without your academic support and professional
advice.
Emfuleni Local Municipality, I salute you for providing me the opportunity
to carry out this study.
All the respondents of the Sedibeng District, particularly Emfuleni and
Lesedi Local Municipalities, who completed the questionnaires. This study
would not have been possible without you.
Ms Amanda Smith, M and PHD office, North West University (Vaal
Campus) you are a pillar of strength. Thank you for your unwavering
support and advice.
Ms Aldine Oosthuyzen from North-West University (Vaal Campus), without
you I would have been adrift. Thank you for your professional assistance
with regard to the analysis of the completed research questionnaires.

iii
Ms Linda Scott, language specialist, thank you for professionally editing
the dissertation and tolerating the pressure you were put under.
My field workers, thank you for the crucial role you played in this study,
particularly Edwin Mabelane, you ensured the success of this study.

iv
OPSOMMING
GEMEENSKAPSVERWAGTINGE EN PERSEPSIES VAN MUNISIPALE
DIENSLEWERING: ’N GEVALLESTUDIE IN DIE EMFULENI PLAASLIKE
GEBIED
SLEUTELWOORDE: Diensgehalte, SERVQUAL, dienstebemarking,
persepsies, verwagtinge, munisipale dienslewering, Suid-Afrika
Die tekort aan dienslewering deur Suid-Afrikaanse munisipaliteite het baie
aandag ontvang in die afgelope paar jaar. In Suid-Afrika word diensgehalte
binne die plaaslike regering oor die algemeen as swak bestempel. Volgens
die Suid-Afrikaanse Grondwet is die mandaat van ʼn munisipaliteit om
dienslewering te verseker deur aan die basiese benodighede van inwoners te
voldoen. Derhalwe is begrip van kliënte se verwagtinge en persepsies
noodsaaklik vir die sukses van enige diensorganisasie. Die navorsing wat
deur hierdie studie onderneem is, is nodig aangesien dit algemeen aanvaar
word dat dienslewering deur Suid-Afrikaanse munisipaliteite in verskillende
gebiede tekort skiet. Die navorsing is teen die agtergrond van die Witskrif op
Plaaslike Regering aangevoer, wat vra vir die voorsiening van dienste aan
gemeenskappe op ʼn volhoubare wyse.
Die primêre doelwit van die studie was om ʼn voorstelling van die gemeenskap
se verwagtinge en persepsies van die gehalte van die dienslewerings van die
Emfuleni Plaaslike Munisipaliteit te bied, ten einde enige potensiële gapings
ten opsigte van dienslewering te identifiseer. Die studie maak gebruik van ʼn
beskrywende navorsingontwerpbenadering.
Die literatuuroorsig bevat gepubliseerde navorsing met betrekking tot
diensgehalte en diensgehaltemodelle. Die literatuuroorsig verskaf inligting oor
diensgehalte vanuit die perspektief van algemene diensbedrywe, asook ʼn
oorsig van die huidige Suid-Afrikaanse regering se plaaslike sfere. Die
uitkomstes van die literatuurstudie dien om die teoretiese raamwerk vir die
empiriese studie te verskaf.

v
ʼn Vraelysopname is gebruik om die nodige data vir die empiriese gedeelte
van die studie in te samel. Inwoners van die Emfuleni Plaaslike Munisipaliteit
het die streekproefraamwerk van die studie gevorm. Die vraelys het die
SERVQUAL-meetinstrument ingesluit. Vraestelle wat selftoegedien is en
gebruik maak van die winkelsentrumonderskeppingmetode, is gebruik as ʼn
data-insamelingsmetode. Ingevolge die afgetekende omvang van die studie,
is die studie beperk tot die Vereenigingse en Vanderbijlparkse betaalpunte
van die Emfuleni Plaaslike Munisipaliteit. Die studie is dwarssnit van aard
(data is gedurende Desember 2010 ingesamel) en gevolglik
verteenwoordigend van die betrokke tydstip.
Die bevindinge dui daarop aan dat die Emfuleni Plaaslike Munisipaliteit se
kliënte negatiewe persepsies het van die gehalte van die dienste wat deur die
munisipaliteit gelewer is. ʼn Beduidende statistiese en praktiese verskil is
bereken tussen die verwagtinge en die persepsies van al die diensgehalte
dimensies wat diensgehalte-lewering deur die Emfuleni Plaaslike
Munisipaliteit behels. Daardeur word gapings ten opsigte van diensgehalte
aangedui wat aandag moet geniet.
Die aanbevelings wat in die studie verskaf word stel moontlike maniere voor
waarop munisipaliteite in Suid-Afrika, oor die algemeen en die Emfuleni
Plaaslike Munisipaliteit spesifiek die gehalte van hul dienslewering kan
verbeter en sodoende die tevredenheid van hul kliënte kan laat toeneem.
Aanbevelings om moontlike gapings te oorbrug sluit onder meer in die
toename van marknavorsing, die opgradering en instandhouding van fisiese
fasiliteite, verbetering van medewerking, koördinering en samewerking tussen
departemente, die hou van opgedateerde rekords, die verbetering van
kommunikasieprogramme, en die uitvoering van bestuurs- en
leierskapopleiding vir die bemarkingspan. Verder word die aanbeveling
gemaak dat munisipaliteite bevoegde personeel werf, wat bereid is om te
help, en dat hulle deelneem aan voortdurende personeelopleiding en
motiveringsinisiatiewe.

vi
ABSTRACT
COMMUNITY EXPECTATIONS AND PERCEPTIONS OF MUNICIPAL
SERVICE DELIVERY: A CASE STUDY IN THE EMFULENI LOCAL AREA
KEY WORDS: Service quality, SERVQUAL, services marketing,
perceptions, expectations, municipal service delivery, South Africa
The lack of service delivery by South African municipalities has received
much attention in recent years. In South Africa, service quality within local
government is perceived as being generally poor. According to the South
African Constitution, the mandate of a municipality is to ensure service
deliveries through satisfying citizens‟ basic needs. Therefore, an
understanding of customers‟ expectations and perceptions is vital for any
service organisation‟s success. The research undertaken in this study was
deemed necessary, given that service delivery by South African municipalities
is widely considered to be lacking in various areas. The research was
conducted against the backdrop of the White Paper on Local Government that
calls for the provision of services to communities in a sustainable manner.
The primary objective of the study was to provide a view on the community‟s
expectations and perceptions of the service quality delivery by the Emfuleni
Local Municipality in order to identify any potential service quality gaps. The
study follows a descriptive research design approach.
The literature review comprised published research relating to service quality
and service quality models. The literature review provides information on
service quality from the perspective of general service industries, as well as
an overview of the current South African local spheres of government. The
outcomes of the literature review served to provide the theoretical framework
for the empirical study.
A questionnaire survey was utilised to gather the required data for the
empirical portion of this study. Residents of the Emfuleni Local Municipality
formed the sampling frame of this study. The questionnaire included the

vii
SERVQUAL measuring scale. Self-administered questionnaires using the
mall-intercept survey method were employed as the data collection method. In
accordance with the delineated scope of the study, this study was confined to
the Vereeniging and Vanderbijlpark pay points of the Emfuleni Local
Municipality. The study is cross-sectional in nature (data were collected in
December 2010) and, as such, the results are representative of that point in
time.
The findings indicate that customers of the Emfuleni Local Municipality have
negative perceptions of the quality of services delivered by the municipality. A
statistical and practical significant difference was computed between
expectations and perceptions on all of the service quality dimensions
concerning service-quality delivery by the Emfuleni Local Municipality, thereby
indicating service quality gaps that need to be addressed.
The recommendations provided in this study focus on suggesting possible
ways in which municipalities in South Africa in general, and in the Emfuleni
Local Municipality in particular, may improve their service-quality delivery in
order to decrease the gaps between expectations and perceptions, and doing
so, increase customer satisfaction. Recommendations for closing these gaps
include increasing marketing research, upgrading and maintaining the
physical facilities, improving collaboration, co-ordination and co-operation
between departments, keeping up-dated records, improving communication
programmes, and implementing management and leadership training for
management team. In addition, it is recommended that municipalities recruit
qualified personnel who are willing to help, and that they engage in ongoing
staff training and motivation initiatives.
viii
TABLE OF CONTENTS
ACKNOWLEDGEMENTS ................................................................................ ii
OPSOMMING .................................................................................................. iv
ABSTRACT ..................................................................................................... vi
TABLE OF CONTENTS ................................................................................ viii
LIST OF TABLES .......................................................................................... xvi
LIST OF FIGURES ....................................................................................... xvii
CHAPTER 1 ..................................................................................................... 1
INTRODUCTION AND PROBLEM STATEMENT ............................................ 1
1.1 INTRODUCTION ................................................................................ 1
1.2 PROBLEM STATEMENT ................................................................... 4
1.3 OBJECTIVES OF THE STUDY .......................................................... 5
1.3.1 Primary objective .......................................................................... 5
1.3.2 Theoretical objectives .................................................................. 6
1.3.3 Empirical objectives ..................................................................... 6
1.4 RESEARCH DESIGN AND METHODOLOGY ................................... 6
1.4.1 Literature review ........................................................................... 6
1.4.2 Empirical study ............................................................................. 7
1.4.2.1 Target population ........................................................................... 7
1.4.2.2 Sampling frame .............................................................................. 7
1.4.2.3 Sample method .............................................................................. 7

ix
1.4.2.4 Sample size .................................................................................... 8
1.4.2.5 Data collection method and measuring instrument ......................... 8
1.4.3 Statistical analysis ........................................................................ 9
1.5 ETHICAL CONSIDERATIONS ........................................................... 9
1.6 DEFINITIONS OF TERMINOLOGY ................................................. 10
1.7 CLASSIFICATION OF CHAPTERS ................................................. 11
1.8 LIMITATIONS OF THE RESEARCH STUDY .................................. 12
1.9 SYNOPSIS ....................................................................................... 12
CHAPTER 2 ................................................................................................... 14
SERVICE QUALITY ....................................................................................... 14
2.1 INTRODUCTION .............................................................................. 14
2.2 INTRODUCTION TO SERVICES ..................................................... 15
2.2.1 Defining services ........................................................................ 15
2.2.2 Characteristics of services ........................................................ 16
2.2.2.1 Intangibility ................................................................................... 17
2.2.2.2 Inseparability ................................................................................ 18
2.2.2.3 Heterogeneity ............................................................................... 18
2.2.2.4 Perishability .................................................................................. 19
2.3 SERVICE QUALITY ......................................................................... 20
2.3.1 Service quality defined ............................................................... 22
2.3.2 Dimensions of service quality ................................................... 23
2.3.2.1 Tangibility ..................................................................................... 23
x
2.3.2.2 Reliability ...................................................................................... 24
2.3.2.3 Responsiveness ........................................................................... 24
2.3.2.4 Assurance .................................................................................... 25
2.3.2.5 Empathy ....................................................................................... 25
2.3.3 Customer satisfaction ................................................................ 26
2.3.3.1 Defining customer satisfaction...................................................... 26
2.3.3.2 Customer satisfaction versus service quality ................................ 27
2.3.4 Customer expectations .............................................................. 28
2.3.4.1 Customer expectations defined .................................................... 29
2.3.4.2 Understanding customer expectations ......................................... 29
2.3.4.3 Determinants of service expectations ........................................... 30
2.3.5 Customer perceptions ................................................................ 32
2.3.5.1 Customer perceptions defined...................................................... 32
2.3.5.2 Understanding customer perceptions ........................................... 33
2.3.6 Measuring service quality .......................................................... 34
2.4 SERVICE QUALITY MODELS ......................................................... 35
2.4.1 SERVQUAL model ...................................................................... 36
2.4.2 Gap Analysis Model .................................................................... 38
2.4.2.1 Gap 1: Customers‟ expectations – Managements‟
perceptions gap ............................................................................ 40
2.4.2.2 Gap 2: Management‟s perceptions – Service quality
specifications gap ......................................................................... 40

xi
2.4.2.3 Gap 3: Service quality specifications – Service delivery gap ........ 41
2.4.2.4 Gap 4: Service delivery – External communications gap ............. 41
2.4.2.5 Gap 5: Customer‟s expectation – Perceived service gap ............. 42
2.5 HISTORICAL OVERVIEW OF THE CURRENT SOUTH
AFRICAN LOCAL SPHERES OF GOVERNMENT ......................... 42
2.5.1 Status of local government ........................................................ 44
2.5.2 Local government and service delivery .................................... 45
2.5.3 White paper on local government ............................................. 46
2.5.4 Functions of municipalities ........................................................ 46
2.5.5 Responsibilities of Local Government ...................................... 47
2.5.6 Municipal service delivery in South Africa ............................... 48
2.5.7 Challenges facing South African municipalities ...................... 49
2.6 SYNOPSIS ...................................................................................... 50
CHAPTER 3 ................................................................................................... 52
RESEARCH METHODOLOGY ...................................................................... 52
3.1 INTRODUCTION .............................................................................. 52
3.2 FORMULATING THE RESEARCH OBJECTIVES AND
RESEARCH DESIGN ....................................................................... 52
3.3 DATA REQUIREMENTS .................................................................. 54
3.4 RESEARCH INSTRUMENT ............................................................. 54
3.4.1 Development of questionnaire items ........................................ 55
3.4.1.1 Dimension 1: Tangibility .............................................................. 56

xii
3.4.1.2 Dimension 2: Reliability ............................................................... 56
3.4.1.3 Dimension 3: Responsiveness .................................................... 56
3.4.1.4 Dimension 4: Assurance .............................................................. 56
3.4.1.5 Dimension 5: Empathy ................................................................ 57
3.4.2 Question format .......................................................................... 57
3.4.3 Questionnaire specifications and design ................................. 58
3.4.4 Determining the measurement scale......................................... 59
3.4.5 Pre-testing of questionnaire ...................................................... 60
3.5 SAMPLING PROCEDURE ............................................................... 62
3.5.1 Defining the target population ................................................... 63
3.5.2 Data collection method selection .............................................. 63
3.5.3 Sampling frame, sampling method and sample size
selection ...................................................................................... 63
3.5.4 Operational procedure for sample element selection ............. 64
3.5.5 Sample plan execution ............................................................... 65
3.6 STATISTICAL ANALYSIS ............................................................... 66
3.6.1 Reliability analysis ...................................................................... 66
3.6.2 Validity analysis .......................................................................... 68
3.6.3 Factor Analysis ........................................................................... 69
3.6.4 Descriptive analysis ................................................................... 70
3.6.4.1 Measures of central tendency ...................................................... 70
3.6.4.2 Measures of dispersion ................................................................ 70

xiii
3.6.4.3 Measures of skewness ................................................................. 71
3.6.5 T-test ............................................................................................ 71
3.7 SYNOPSIS ....................................................................................... 72
CHAPTER 4 ................................................................................................... 73
ANALYSIS AND INTERPRETATION OF EMPIRICAL FINDINGS ................ 73
4.1 INTRODUCTION .............................................................................. 73
4.2 PILOT TESTING OF QUESTIONNAIRE .......................................... 73
4.3 MAIN STUDY: PRELIMINARY DATA ANALYSIS .......................... 77
4.3.1 Coding .......................................................................................... 77
4.3.2 Tabulation: All variables ............................................................ 78
4.3.3 Data gathering process .............................................................. 82
4.4 DEMOGRAPHICAL INFORMATION ............................................... 82
4.5 VALIDITY AND RELIABILITY OF THE SCALE .............................. 87
4.6 FACTOR ANALYSIS ON COMMUNITY EXPECTATIONS AND
PERCEPTIONS ................................................................................ 89
4.7 DESCRIPTIVE ANALYSIS............................................................... 94
4.7.1 Descriptive statistics pertaining to the dimensions ................ 94
4.8 TEST OF SIGNIFICANCE .............................................................. 100
4.9 SYNOPSIS ..................................................................................... 101
CHAPTER 5 ................................................................................................. 103
CONCLUSION AND RECOMMENDATIONS ............................................... 103
5.1 INTRODUCTION ............................................................................ 103

xiv
5.2 OVERVIEW OF STUDY ................................................................. 104
5.2.1 Primary objective ...................................................................... 104
5.2.2 Theoretical objectives .............................................................. 105
5.2.3 Empirical objectives ................................................................. 105
5.3 CONTRIBUTIONS OF THE STUDY .............................................. 106
5.4 RECOMMENDATIONS .................................................................. 107
5.4.1 Customer expectations and perceptions ................................ 108
5.4.1.1 Dimension 1: Tangibility: Appearance of physical facilities,
equipment, personnel and communication materials ................. 108
5.4.1.2 Dimension 2: Reliability: Ability to perform the promised
service dependable and accurately ............................................ 109
5.4.1.3 Dimension 3: Responsiveness: Willingness to help
customers and provide prompt service ....................................... 110
5.4.1.4 Dimension 4: Assurance: Knowledge and courtesy of
employees and their ability to convey trust and confidence ....... 111
5.4.1.5 Dimension 5: Empathy: The caring, individualised attention
the municipality provides to each customer ................................ 112
5.4.2 Recommended implementation approach .............................. 113
5.5 FUTURE RESEARCH OPPORTUNITIES ...................................... 114
5.6 CONCLUDING REMARKS ............................................................ 114
BIBLIOGRAPHY .......................................................................................... 116
ANNEXURE A .............................................................................................. 132
COVER LETTER .......................................................................................... 132
ANNEXURE B .............................................................................................. 134
xv
SURVEY QUESTIONNAIRE – SECTION A ................................................. 134
ANNEXURE C .............................................................................................. 136
SURVEY QUESTIONNAIRE – SECTIONS B & C ....................................... 136

xvi
LIST OF TABLES
Table 4.1: Reliability: Expectations and Perceptions .............................. 75
Table 4.2: Dimensions of customer expectations and perceptions
of service quality and service delivery at the pilot stage ........ 76
Table 4.3: Coding information ................................................................ 77
Table 4.4: Frequency table for customers‟ expectations of service
quality in municipal service delivery ....................................... 79
Table 4.4: Frequency table for customers‟ expectations of service
quality in municipal service delivery (continued...) ................. 80
Table 4.5: Frequency table for customers‟ perceptions of service
quality in municipal service delivery ....................................... 80
Table 4.6: Reliability analysis: Section B ................................................ 88
Table 4.7: Eigenvalues for the five dimensions: Expectations and
perceptions ............................................................................ 90
Table 4.8: Rotated factor loadings on community expectations and
perceptions on municipal service delivery ............................. 92
Table 4.9 Descriptive statistics: Total sample ........................................ 95
Table 4.10: SERVQUAL Gap Score ......................................................... 98
Table 4.11: Priorities for improvement ...................................................... 99
Table 4.12: Difference of means between expectations and
perceptions on the five dimensions ..................................... 101
xvii
LIST OF FIGURES
Figure 2.1 Perceived service qualities (Berry et al., 1985:47) ................. 34
Figure 2.2 Integrated Gap Analysis model of service quality
(Parasuraman et al., 1985:48) ............................................... 39
Figure 3.1 Sampling plan procedure (Iacobucci and Churchill,
2010:449) .............................................................................. 62
Figure 4.1: Gender classification ............................................................. 83
Figure 4.2: Racial groups ......................................................................... 83
Figure 4.3: Age classification ................................................................... 84
Figure 4.4: Residential area ..................................................................... 85
Figure 4.5: Years of occupancy ............................................................... 86
Figure 4.6: Number of occupants living in residence ............................... 87
Figure 4.7: Aggregate mean rating of the five dimensions:
Expectations .......................................................................... 96
Figure 4.8: Aggregate mean rating of the five dimensions:
Perceptions ............................................................................ 97
Figure 4.9: Overall gaps between expectations and perceptions in
five dimensions .................................................................... 100

Chapter 1: Introduction and problem statement 1
CHAPTER 1
INTRODUCTION AND PROBLEM STATEMENT
1
1.1 INTRODUCTION
Following South Africa‟s first democratic local government elections in 1996,
the government realised there was a need to rethink the manner in which
services were being delivered (De Villiers & Kalema, 2005:80). The local
government system of the transitional phase needed to mature into a new
system of local governance. The White Paper on Local Government (RSA,
1998) states that, in order to realise the vision, goals and objectives of the
new democracy, an array of institutional and political interventions by
government is required.
According to the White Paper on Local Government (RSA, 1998), national
government, provincial government and local government were established as
the three elected spheres of government, each with distinctive functional
responsibilities. In terms of Chapter 4 of the Constitution (1996) (hereinafter
referred to as the Constitution) the three spheres of government are required
to function as a single system of cooperative government for the country as a
whole. Although transformation has been the defining characteristic of the
structures and institutions of all three spheres of government, the process
followed different paths for provincial government and local government.
Local government came into being much later than the other two spheres of
government. Although this sphere has generated new opportunities for a more
responsive and efficient government, incorporating local government into the
system of cooperative governance has proved to be complex. The White
Paper on Local Government (RSA, 1998) highlights the absence of a definite
policy on provincial government. This has generated uncertainty about the
role of this sphere in reconstruction and development. Schacter (2000:8)
concurs with this and states that there is intransigence in the relationship
between the different spheres of government. In order to facilitate and

Chapter 1: Introduction and problem statement 2
improve service delivery, there should be a coordinated effort from all spheres
of government.
Municipalities are important role players in service delivery (Boshoff &
Mazibuko, 2008:14). They are required by law to find innovative methods to
involve communities in all their affairs. The mandate of a municipality,
according to the Constitution, is to ensure that the service deliveries for which
it is responsible satisfy citizens‟ basic needs. These include water supply,
sewerage collection and disposal, refuse removal, electricity and gas supply,
health services, roads and storm water drainage, street lighting, and municipal
parks and recreation (Boshoff & Mazibuko, 2008:14). Nealer and Raga
(2007:173) concur with this, stating that the Constitution is a contract between
the South African Government and citizens of the country, established by the
structuring of the three spheres of government legislature and execution of
public policies. Therefore, the government is under moral obligation to identify
and address the needs of the country‟s citizens, and in order to add value to
the respective communities and society as a whole, needs to determine which
services should be addressed through more effective, efficient and
economical public administration and management. Wisniewski and Stewart
(2001:540-555) elaborate, stating that there is a need to improve the quality of
local democracy and the degree of municipal responsiveness and
accountability to the stakeholders. The National Government has set out the
criteria for best value services, requiring the understanding of the needs,
expectations, and priorities of all stakeholders.
According to Curtis (1999:261), the White Paper on Municipal Service
Partnerships offers support to the views of the role of municipalities and the
case for nationally set standards for municipal service delivery, monitored
within a national framework for performance management. From the
customers‟ perspective, expectations of services have shifted upwards, with
greater emphasis placed on the quality of service. From a best value
perspective, the measurement of service quality is that the public sector
should take into account customer expectations and perceptions of services
(Robinson, 1999:21). A regularly used method is the utilisation of gap scores

Chapter 1: Introduction and problem statement 3
that enable service managers to assess current service quality and quantify
gaps that exist. Hence, the service quality dimensions may assist in an
understanding of the broad areas where customers have particularly high or
low expectations, and an assessment of where there may be relatively large
service gaps (Wisniewski & Stewart, 2001:380-388).
Governments strive to determine how much should be spent on public
services, what components of a public service programme are most valuable,
and whether service delivery can be measurable and thereby allow the
development of a performance plan (Rodriguez, Vazquez & Edwards,
2009:1). In order to address service delivery backlogs, especially in previously
disadvantaged communities, it is necessary to improve the leadership and
governance framework to accelerate service delivery at the pace needed in
South Africa (Naidoo, 2009:104).
The emergence of the new South African democracy in 1994 brought with it
expectations of equalisation across racial, gender, socio-economic and
geographic boundaries, fair and just delivery of services, access to basic
services and the hope that all citizens could have freedom and dignity (Van
der Wal, Pampallis, & Bond, 2002:324). Pretorius and Schurink (2007:19)
agree with this, stating that post-apartheid South Africa faces a challenge in
ensuring that municipalities provide optimal and professional services to
citizens of heterogeneous cultures. Municipalities are the vehicle selected by
national government to address the dual water service-delivery challenge and
to reduce the apartheid backlog, whilst concurrently raising the level of
services delivered (Hemson, 2004:10). The leadership and governance
framework should be manifested through a set of techniques and methods
related to effective policy implementation, monitoring and evaluation (Van der
Waldt, 2004:2).
According to Van der Wal et al. (2002:324), the ultimate aim of any modern
government is to create conditions in the country in order for every
stakeholder to enjoy good quality of life, and furthermore, to be able to
achieve the aim, government has to identify priorities in relationship to
formulated objectives, targets, services and strategies. However, according to

Chapter 1: Introduction and problem statement 4
Farnham and Horton (1996:25), recent challenges facing public organisations
globally have led to a new public management which is different from
traditional public administration and which is now focusing more on business
management, as is the case in private sector management.
Service delivery and service quality can provide an organisation with a lasting
competitive advantage (Van der Wal et al., 2002:325). Curry and Sinclair
(2002:198) state that service quality is determined by the disparity between
the expectations of the community and its perceptions of the service actually
delivered. The quality of services provided by organisations can make the
difference between success and failure. Service quality, customer satisfaction
and customer value have become the main concerns in service organisations
and, as a result, many organisations are paying more attention to improving
service delivery and service quality (Wang, Hing-Po & Yang, 2004:325).
1.2 PROBLEM STATEMENT
The notion of service quality has produced considerable debate with regard to
defining it, as well as measuring it – unfortunately, with a lack of emerging
consensus. Parasuraman, Zeithaml & Berry, (1988:12) developed the well-
known SERVQUAL instrument to measure customer expectations and
perceptions of service quality. The instrument has become the most
prominent scale in attempting to operationalise service quality (Van der Wal et
al., 2002:324; Wisniewski & Stewart 2001:380).
Despite services being a large and important segment of the world
economies, the concepts and practice of service quality and service delivery
are less developed compared to those concerning quality in the manufacturing
industry (Ghobadian, Speller & Jones, 1994:43; Douglas & Fredendall,
2004:393). Service organisations are lagging behind their manufacturing
counterparts in terms of the effective use of Total Quality Management (TQM)
practices aimed at achieving organisational objectives (Yasin, Alavi, Kunt &
Zimmerer, 2004:377).

Chapter 1: Introduction and problem statement 5
Once the quality issues are delegated to the subordinate hierarchy, it is no
longer considered vital for top management to participate personally in
managing quality and this leads to negative effects on quality (Kruger,
2001:146). The citizen deliberation is at the core of public service delivery
(Denhardt & Denhardt, 2003:123; Mintrom, 2003:52).
Municipalities have been experimenting with new forms of community
engagement, recognising that a sense of engagement is critical to effective
service delivery and democratic management (Osborne & Plastrik, 1997:28;
Crocker, Potapchuck & Schechter, 1998:17). Furthermore, mixed delivery
(service delivery from both public and private sectors) is part of an innovative
and dynamic decision-making process where city managers recognise the
need to balance the benefits of the need for citizen engagement in service
delivery (Borins, 2001:5).
This study, therefore, focuses on the following three specific research
questions:
What are the customers‟ expectations of service-quality delivery by the
Emfuleni Local municipality?
What are the customers‟ perceptions of service-quality delivery by the
Emfuleni Local municipality?
What service quality gaps exist in the municipal services delivered by
the Emfuleni Local Municipality?
1.3 OBJECTIVES OF THE STUDY
The following objectives have been formulated for this study:
1.3.1 Primary objective
The main aim of this study was to determine the community expectations and
perceptions of the quality of municipal services delivered by the Emfuleni
Local Municipality in order to identify potential service quality gaps.
Chapter 1: Introduction and problem statement 6
1.3.2 Theoretical objectives
In order to achieve the primary objective, the following theoretical objectives
were formulated for this study:
Outline the fundamental principles of service delivery.
Conduct a review of the relevant service quality literature.
Outline the importance of service quality in municipalities.
Conduct a review of the relevant literature pertaining to the different
service quality models
1.3.3 Empirical objectives
In accordance with the primary objective of the study, the following empirical
objectives were formulated for the study:
Measure the community customers‟ expectations of municipal service–
quality delivery in the Emfuleni Local Municipality.
Measure the community customers‟ perceptions of municipal service-
quality delivery in the Emfuleni Local Municipality.
Identify the gaps between community customers‟ expectations and
perceptions of municipal service–quality delivery in the Emfuleni Local
Municipality
Identify priorities for improvement in an attempt to improve service-
quality delivery within the Emfuleni Local Municipality.
1.4 RESEARCH DESIGN AND METHODOLOGY
The research undertaken in this study encompasses both a literature review
and an empirical study. Quantitative research, using the survey method, was
used for the empirical portion of the study.
1.4.1 Literature review
A literature review of secondary data sources was undertaken to achieve the
theoretical objectives of the study. Secondary data sources included
government publications, local and international journal articles, relevant
textbooks and full-text online academic databases. Specific emphasis was

Chapter 1: Introduction and problem statement 7
placed on literature pertaining to the South African local spheres of
government. The Harvard method of source referencing and
acknowledgement was applied in this study.
1.4.2 Empirical study
The empirical portion of this study concentrates on addressing the empirical
objectives and comprises the following methodology dimensions:
1.4.2.1 Target population
The target population is defined as a collection of the elements or objects that
possess the information sought by the researcher and regarding which
inferences are to be made (Malhotra, 2010:372). The target population
relevant for this study is residents of communities who have either the right of
occupancy or other informal status to land within the Emfuleni Local
Municipality. Included are those residents who currently do not have legal
occupancy right but who receive services on the land on which they reside.
The research was conducted in the form of the mall intercept survey carried
out at the Emfuleni Local Municipality pay points.
1.4.2.2 Sampling frame
The sampling frame for this study consists of residents of the Emfuleni Local
Municipality. Given that this was a mall intercept, the sampling frame for this
study comprised residents that were at the Vereeniging and Vanderbijlpark
pay points on the day that the fieldwork for the study was undertaken. The
reason for selecting these pay points is because they are the largest pay
points that currently serve the residents of the Emfuleni Local Municipality.
1.4.2.3 Sample method
From the sampling frame, a non-probability convenience sample of 400
residents was selected, irrespective of sex, race and/or location, ensuring an
equal opportunity for all residents in the area to be included in the study. A
non-probability convenience sample was used for this study as it allows a
large number of respondents to be reached and is suitable for respondents
Chapter 1: Introduction and problem statement 8
who are geographically dispersed (Churchill, 2001:453). A structured format
was applied, whereby the Municipal Manager of the Emfuleni Local
Municipality was contacted with a request to carry out the survey. Permission
to conduct the survey was subsequently obtained. Thereafter, a hand
delivered self-administered questionnaire was distributed to the residents of
the Emfuleni Local Municipality at the Vereeniging and Vanderbijlpark pay
points.
1.4.2.4 Sample size
In establishing an appropriate sample size, an analysis was undertaken of the
sample size used by previous researchers in similar studies such as Ngubane
(2005:78) (sample size of 300) and Mncwango (2004:29) (sample size of
400). Based on these studies, a sample of 400 respondents was deemed
sufficient.
1.4.2.5 Data collection method and measuring instrument
The survey method was applied to collect the data in this research study.
Primary data was collected by means of a structured questionnaire. The self-
administered questionnaire using the mall-intercept survey method was used
as the data collection method.
The SERVQUAL measuring scale developed by three American academics,
Parasuraman, Zeithaml and Berry in the 1980s, was applied in this study. The
model was designed to measure customers‟ expectations and perceptions of
service quality. The model was based on 12 focus groups and the three
researchers developed a questionnaire comprising 22 criteria most commonly
used by focus group participants to assess service quality. The 22 criteria
were then grouped into five service quality dimensions, namely tangibility,
reliability, responsiveness, assurance and empathy, to determine customers‟
expectations and perceptions of any service (Cram, 2001:266).
The perceptions and expectations that residents have of the Emfuleni Local
Municipality were measured on a five-point Likert scale (1 = Strongly agree to
5 = Strongly disagree). The questionnaire comprises three sections, namely
Chapter 1: Introduction and problem statement 9
community expectations of municipal service delivery and service quality,
community perceptions on municipal service delivery and service quality, and
a section designed to collect demographic details. The standardised
SERVQUAL scale, developed and validated by Parasuraman, Zeithaml and
Berry (1985) was utilised in order to elicit information on community
expectations and perceptions of municipal service quality and service delivery.
The questionnaire included a covering letter describing the nature and
purpose of the study, and a request for participation. The questionnaire was
pilot tested on 54 respondents. These respondents did not form part of the
sampling frame of the final study. The results of the pilot test were considered
in the process of adopting the final questionnaire. Trained field workers were
supervised during the data collection process.
1.4.3 Statistical analysis
Descriptive statistics were used to analyse the composition of the sample.
Comparisons between the perceptions and expectations data were made
using simple cross-tabulations and t-test to establish the relationship between
variables in the study. Data are represented graphically using bar and pie
charts. Factor analysis was used to establish municipal service quality
dimensions. The statistical package for the Social Sciences (SPSS), Version
18.0 for Windows, was used to analyse the captured data. Validity and
reliability analyses were also conducted.
1.5 ETHICAL CONSIDERATIONS
This study complied with the ethical standards of academic research. The
following code of ethics was adhered to during the research process:
Permission was obtained from the Emfuleni Local Municipality in order
to conduct the interviews
Each respondent was informed of the purpose of the study
Respondents were assured of anonymity and confidentiality
The questionnaire did not contain any questions detrimental to the self-
interest of respondents

Chapter 1: Introduction and problem statement 10
Respondents were under no obligation to complete the questionnaire
The results of the research were made available to the Executive
Mayor and top management of the Emfuleni Local Municipality.
1.6 DEFINITIONS OF TERMINOLOGY
The following terminology and definitions are used in the study:
Municipality is a corporate body, has specific roles and responsibility areas,
a political structure, political office-bearers and a municipal manager, and has
jurisdiction in a defined geographical area as determined by the Local
Government: Municipal Demarcation Act 1998 (Graythorne, 2006:119).
Local governance requires that institutions around local governments be
engaged in the design and implementation of economic and social policy with
business elites, community leaders, development corporations, training and
enterprise councils, as well as voluntary groups.
Developmental local government is defined as local government committed
to working with citizens and group within the community to find ways to meet
their social, economic and material needs and improve the quality of their lives
(RSA, Department of Local and Provincial Government, 1998:37).
Service is an activity or series of activities of more or less an intangible nature
that normally, but not necessarily, take place in interactions between the
customer and the service employee (Gabbortt & Hogg, 1998:21).
Policy is defined as a purposive course of action based on currently
acceptable social values, followed in dealing with a problem or matter of
concern, predicting the state of affairs, which would prevail when that purpose
has been achieved (Hart, Ryan & Zille, 1995:5).
Delivery is defined by the World Book Dictionary (1996:551) as an act of
carrying and giving out something to be, or a giving up. In this study, delivery
is understood to be the manner in which service can be taken to the people.
Integration refers to inclusiveness of various components.

Chapter 1: Introduction and problem statement 11
Components refer to various elements or options of development such as
social facilities, physical facilities, infrastructure and basic services.
1.7 CLASSIFICATION OF CHAPTERS
Chapter 1 of this study serves as the introduction to the research. It introduces
the concepts that will be discussed and it also lays out the importance and
aims of the research. Primary and secondary sources relevant to the research
are discussed. Limitations of the research study will also be discussed as well
as the clarification of the terminology.
Chapter 2 of this study provides an in-depth review of the service quality
literature and the fundamental principles of service marketing. A literature
review pertaining to the various service quality models was conducted. The
literature pertaining to the South African local spheres of government is briefly
analysed.
Chapter 3 concerns itself with the research methodology used in the study. It
focuses on the research design and methodology, as well as on the
development and distribution of the questionnaires. Different statistical
methods and techniques applied during the scope of the study are identified
and discussed in detailed.
Chapter 4 presents the reported results of the empirical study. This chapter
provides an analysis, interpretation, and evaluation of the research findings.
The instruments used are reported and the statistical tests used to analyse
the data are presented in this chapter. The chapter also aims to prove the
reliability of the data gathered in the study.
Chapter 5 provides a final review of the study and presents the conclusion
and recommendations based on the main objective and findings of the study.
The implications and limitations of the study are discussed, and suggestions
for further research are presented in this chapter.

Chapter 1: Introduction and problem statement 12
1.8 LIMITATIONS OF THE RESEARCH STUDY
In order to keep the scope of the study within a manageable range, it was
necessary to constrain the problem. One limitation imposed on the study is
that the scope of the study was confined to Vereeniging and Vanderbijlpark
pay points. The study was cross-sectional in nature (data was collected in
December 2010 and, as such, the results are representative of that point in
time).
1.9 SYNOPSIS
Municipalities are important role players in service delivery, ensuring that the
service deliveries for which they are responsible satisfy citizens‟ basic needs
through means of determining which services should be addressed through
more effective, efficient and economical public administration and
management. There is a need to improve the quality of local democracy, the
degree of municipal responsiveness and the accountability to the
stakeholders. Customer expectations and perceptions received from the
public sector should be taken into account by means of utilising gap scores,
enabling service managers to assess current service quality and quantify gaps
that exist. Municipalities are the vehicles selected by national government to
address the service delivery challenges. In order to address service delivery
backlogs, it is necessary to improve the leadership and governance
framework, to accelerate service delivery at the pace that is needed in South
Africa.
Service delivery and service quality can provide an organisation with a lasting
competitive advantage. The quality of services provided by organisations can
be the difference between success and failure. Service quality, customer
satisfaction and customer value have become the main concerns in service
organisations and, as a result, many organisations are paying increasing
attention to improving service delivery and service quality.
In this chapter, the study‟s problem statement, objectives, research design,
methodology and chapter classifications were provided. In the next chapter,

Chapter 1: Introduction and problem statement 13
Chapter 2, a discussion pertaining to service quality literatures will be
discussed. Services, service marketing, service quality and service quality
models will be reviewed.

Chapter 2: Service quality 14
CHAPTER 2
SERVICE QUALITY
2
2.1 INTRODUCTION
The provision of basic municipal services to all South African citizens is one of
the primary goals of the South African government. The 1996 Constitution
imposes developmental duties on municipalities with service delivery being
central to the role of municipalities (Asmah-Andoh, 2009:101). South Africa as
a post-apartheid country faces the major challenges of ensuring that
municipalities deliver optimum and proficient services to inhabitants of diverse
cultures (Pretorius & Schurink, 2007:19). Basic municipal services are there to
enhance the health and safety of the citizens, and to contribute to the
economy by increasing the liveability of an area, which, in turn, positively
influences the productivity of the inhabitants. The post-1996 delivery of
municipal services in South Africa has not been as effective and efficient as
had been anticipated. Areas of concern include the appropriateness of the
level of service provided, its affordability, cost recovery, operation and
maintenance, service delivery, human resource capacity and skills, and
service delivery in support of economic development (African Development
Bank, 2000:29).
The service sector in South Africa is large and encompasses a wide variety of
organisations, services and activities, including the South African government,
for instance, who is a major service provider. In South Africa, service
marketing is receiving the attention it rightfully deserves. Service
organisations and the marketing of services are a vital part of the South
African economy, although, as opposed to physical products, pose unique
challenges for the service marketer (Du Plessis, Rousseau & Blem,
1995:255).
In order to shape the focus of this study on service quality, sufficient
knowledge on the service sector is necessary. The first section of this chapter
provides an overview of services with respect to the definition and
Chapter 2: Service quality 15
characteristics. Thereafter, the focus of this study, service quality, is
discussed in detail. The discussion on service quality highlights the definition,
dimensions, customer satisfaction, customer expectations and perceptions, as
well as various service-quality measurement models. Furthermore, the brief
discussion on the historical overview of the local spheres of government and
the status of municipalities and service delivery in the current South Africa will
provide a contextual background to service quality.
2.2 INTRODUCTION TO SERVICES
Services contribute to over 80 percent of gross domestic product (GDP) in
developed countries, and 50 percent in developing countries (Sayeda,
Rajendran & Lokachari, 2010:728), constituting the majority employer and
source of income for developed economies (Piercy & Rich, 2009:54). For the
purpose of this study, it is necessary to define the meaning of services and
investigate the characteristics of services. A discussion on these concepts will
illustrate the importance and relevance of service quality to municipalities.
2.2.1 Defining services
Kotler (1999:97) defines a service as "any act or performance that one party
can offer to another that is essentially intangible and does not result in the
ownership of anything”. Reibstein (1997:617) reiterates this by indicating that
a service is a product offering in the form of a performance, deed or act.
According to Marx and Dekker (1998:52), services are intangible utilities
applied for the satisfaction of needs of customers. Similarly, Esman (1997:44)
defines services as intangible activities that provide want-satisfaction.
According to Svensson (2004:278), the interaction between the service
provider and the customer produces, distributes and consumes services.
Theron, Bothma & du Toit (2003:3) concur stating that services can be
distinguished from products and be defined as deeds, processes and
performances.
Despite the difficulty in finding the proper definition for services, it is evident
that the customer perceives services as either being of a high quality or a low

Chapter 2: Service quality 16
quality (Ukens, 2007:119). Customers react differently to what appears to be
the same service. The perception of service, whether high quality or low
quality, may be affected by factors such as the customer's disposition, culture,
timing, environment, as well as previous experience (Wright, 1995:9).
Four generic key characteristics paraphrase services that differentiate them
from products. These characteristics have implications to the service marketer
concerning the manner in which services are marketed (Palmer, 2011:7).
Brown, Fisk & Bitner (1993:78) add that while services and products are
acknowledged as being different, there is less agreement regarding the way
that services and products differ and the extent to which such differences are
relevant and significant from a marketing perspective. In the next section, the
characteristics of services will be explained.
2.2.2 Characteristics of services
Owing to the nature and characteristics of services, the concept of service
quality is complex. Service quality is difficult to measure and this, in turn, has
an impact on service quality (Woodruffe, 1995:105). Several characteristics
distinguish services from products. These fundamental characteristics provide
a rationale for considering the consumption of services as distinctive from the
consumption of products (Gabbott & Hogg, 1998:26). Various researchers
have identified four characteristics of service, which they believe distinguish a
service from a product in marketing terms, and these include intangibility,
inseparability, heterogeneity and perishability (Du Plessis, et al., 1995:256;
Theron et al., 2003:3; Woodruffe 1995:18).
These characteristics create various challenges for service marketers and
require specific strategies to overcome these challenges (Bateson, 1995:50).
Boshoff and Du Plessis (2009:5) agree with this, stating that from a marketing
perspective these four characteristics call for a unique approach. Therefore, a
discussion of these four characteristics, including the unique challenges they
pose to service marketers, follows.

Chapter 2: Service quality 17
2.2.2.1 Intangibility
Intangibility refers to that which cannot be seen or evaluated before receipt.
The five senses perceive only the results of a service and not the service
itself. Service levels are often uncertain and the benefits frequently unknown
(Theron et al., 2003:3). Gabbott and Hogg (1998:27) describe intangibility
without a physical dimension as one of the most significant characteristics of
services. They warn that services are often described using tangible nouns,
thus obscuring the fundamental nature of the service, which remains
intangible. Du Plessis et al. (1995:256) are of the opinion that services are
conceptual and often challenging to describe and understand, resulting in a
service being demanding to demonstrate, illustrate and promote. The Oxford
Dictionary of Current English (1996:38) defines intangibility as “that which is
difficult to define or describe which cannot be touched or seen, and which
cannot be easily understood mentally”.
Owing to services being performances and experiences rather than objects,
exact manufacturing specifications concerning quality can seldom be
established (Fisk, Brown & Bitner, 1993:68). The intangibility of a service
makes it difficult for customers to understand it mentally. A customer must
experience a service before it can be visualised, making the marketing of the
service more challenging (Ukens, 2007:119).
Challenges created by the intangible characteristic of a service are that
services cannot be sampled prior to purchase, services cannot be stored and
new services cannot be protected by patent rights. Prior to purchase, services
cannot be displayed or demonstrated as entities. In addition, the price of a
service is more complicated to determine than that of a product due to the
difficulty involved in explaining quality to a prospective buyer prior to purchase
(Du Plessis et al., 1995:259).
A possible strategy for overcoming the difficulties posed by intangibility is to
stress tangible cues such as the appearance of service personnel and
cleanliness of waiting areas (George, 2011:25). The use of personal sources
in preference to other sources in advertising, simulating or stimulating word-

Chapter 2: Service quality 18
of-mouth communication, creating a strong image, using cost accounting to
set prices and initiating post-purchase communication are strategies that
services marketers typically use to add tangible evidence to their service
offering (Du Plessis et al., 1995:260).
2.2.2.2 Inseparability
The degree of inseparability depends on the type of service delivered and the
actual supplier. Fisk et al. (1993:68) indicate that a customer receiving a
service is directly involved in the service delivery process and may therefore
influence the process.
Services are produced and consumed at the same time, unlike products that
may be manufactured and then stored for later distribution. Therefore, the
service provider becomes an integral part of the service itself (Woodruffe,
1995:19). Owing to the production of a service being inseparable from the
consumption, it is impossible for customers to pre-order a service experience
(Theron et al., 2003:3). Du Plessis et al. (1995:258) emphasise that
employees providing services frequently are not separated from the services.
Smith (1990:27) agree with this stating that unlike a product, which can be
produced, sold and then consumed, a service is produced and consumed
simultaneously.
Challenges created by the inseparability characteristic of a service include the
customer being involved in the service production and the difficulty of having
to mass produce services at a centralised location (George, 2011:26).
Possible strategies to overcome the difficulties posed by the inseparability
characteristic are to consider the selection and training of those service
providers who are in direct contact with customers carefully, to manage
customers and to use multi-site locations (Du Plessis et al., 1995:259).
2.2.2.3 Heterogeneity
Owing to a service being produced and consumed simultaneously, and
customers constituting part of the service offering, Woodruffe (1995:19)
argues that a service only exists once and is never repeated exactly and is

Chapter 2: Service quality 19
therefore always unique, giving rise to concerns about service quality and
uniformity issues. According to Gabbott and Hogg (1998:28), heterogeneity
refers to a function of human involvement in the delivery and consumption.
Individuals deliver services and, therefore, each service encounter will be
different by virtue of the participants, the time of performance or the
circumstances in which the service is being delivered.
Each service cannot be identically repeated and is therefore a new and
unique event. Customers are inconsistent in their day-to-day lives, implying
that the service received today may be very different from the service received
tomorrow. The level of service provided may vary depending on the
disposition, financial or social situation of the service provider (Theron et al.,
2003:4). Heterogeneity manifests in a number of ways. The quality of service
performance varies from one service provider to another and may vary from
one service employee to another. For example, South African Airways may
use its most experienced pilots on international flights and can thus not
maintain the same level of performance on local flights (Du Plessis et al.,
1995:258).
Heterogeneity poses important marketing implications to the service provider,
of which standardisation and quality control are of the most challenging to
achieve (Palmer, 2011:11). An important part of an organisation‟s service
marketing programme should therefore involve reducing customers‟ perceived
risk by means of the standardisation and customisation of service delivery (Du
Plessis et al., 1995:258).
2.2.2.4 Perishability
Perishability is the fourth service characteristic highlighted in the literature.
Owing to services existing in real time, they cannot be stored (Palmer,
2011:12). Woodruffe (1995:19) indicates that because services are
perishable, an empty seat on a commercial airplane, for example, is a lost
opportunity. According to Theron et al. (2003:4), each service experience is
unique and exists only for the duration of the transaction. Demand issues

Chapter 2: Service quality 20
develop when there are not sufficient service providers or resources to meet
the customer‟s demand for a particular service.
Service perishability means that a dissatisfied customer has limited access to
recourse in the case of receiving a low quality service. For example, a
customer who is dissatisfied with a haircut cannot have his/her short hair
replaced. Unlike products, the customer cannot store services and the lack of
the ability to build and maintain a supply of the service, means that sudden
demand cannot be accommodated in the same way as that for products (Du
Plessis et al., 1995:57). According to Gabbott and Hogg (1998:28), the
customer cannot reserve services against possible future demands.
Owing to the loss of potential revenue that occurs when services are not sold
on a particular day, restaurants are charging for reservations that are not kept
and such charges may be made for a missed appointment at, for example, the
dental clinic. Perishability is more challenging for the service marketer when
demand for a service is inconsistent. During times of unusually high or low
demand, perishability is a major challenge for service organisations
(Woodruffe, 1995:19).
The perishability of services means that it is not possible to institute quality
control between production and consumption and that it is not possible to
record services. A possible strategy to overcome the difficulties of perishability
is to attempt to influence demand levels in order to avoid or, at least, minimise
fluctuations by attempting to match demand and supply (Du Plessis et al.,
1995:259).
This section provided an overview on the topic of services, including the
various challenges that the unique characteristics of services pose for the
service marketer. In accordance with the primary objective of this study, the
following section provides a comprehensive discussion on service quality.
2.3 SERVICE QUALITY
Delivering quality service is essential for the success and survival of service
organisations (Noone & Namasivayam, 2010:273). In a turbulent and

Chapter 2: Service quality 21
extremely competitive global business environment, organisations face
considerable pressure to meet or exceed customer expectations by delivering
services that are of the highest quality (Dorsch, Yasin & Czuchry, 1997:268).
Jaiswal (2008:405) reiterates this by stating that for organisations to survive in
a competitive business environment, delivering superior service and ensuring
high customer satisfaction is critical. The increasingly competitive market for
many services has led customers to become more selective in the services
they choose. Conceptualising service quality is more complex than for
products (Palmer, 2011:285),
The role of service quality is widely recognised as being a critical determinant
for the success of an organisation in a competitive environment, where any
decline in customer satisfaction due to poor service quality should be a matter
of concern. Customers have high service expectations and are aware of rising
standards in service, prompted by competitive trends in the business
environment (Frost & Kumar, 2000:358). Service quality is a major area of
attention for practitioners, managers and researchers due to its strong impact
on business performance, costs, customer satisfaction, customer loyalty and
profitability (Seth & Deshmukh, 2005:913).
Quality, when related to products, is defined as the conformance to
specifications. The service perspective of quality focuses on the customer's
specification of the service. This specification forms the customer's
perceptions of quality service. Service has quality if customer‟ enjoyment of it
exceeds the perceived value of the money that is paid for that service
(Chakrapani, 1998:4). Frost and Kumar (2000:358) emphasise that service
marketers need to understand how to enhance service quality between
internal stakeholders within the marketplace in order to ensure a high level of
service quality. In order to understand service quality, it is important to define
services, understand the dimensions of services and investigate the influence
of customer satisfaction on service quality.

Chapter 2: Service quality 22
2.3.1 Service quality defined
Service quality has been widely researched in multiple disciplines and, as
such, a number of definitions exist to describe the phenomenon. Even though
the definitions differ, the majority share some key concepts, which have
become standard in the academic conceptualisation of service quality. Earlier
research by Parasuraman et al. (1985:41) proposed that service quality is a
function of the difference between expectations and performances along the
quality dimensions. Parasuraman et al. (1988:16) later described service
quality as a form of attitude related, but not equivalent to, satisfaction that
results from the comparison of expectations with performances. Bolton and
Drew (1991:376) concur with this emphasising that quality and satisfaction are
two different concepts and cannot be regarded as synonymous. The
distinction between these terms is consistent with the distinction between
attitude and satisfaction.
Services differ from products because products are tangible objects produced
to meet certain standards and which have great consistency. Services are
dependent on the interaction between the customer and service provider
(White & Abels, 1995:36). Lewis and Booms (1983:100) define service quality
in terms of whether there has been confirmation or disconfirmation of
expectations stating that the description of service quality is the measure of
how well the service level delivered matches customer expectations. Bitner
and Hubbert, (1993:77) define service quality as the customer‟s overall
impression of the relative inferiority/superiority of the organisation and its
service. Newman (2001:128) define service quality as the degree and
direction between customer service expectations and perceptions, whilst
Zeithaml, Parasuraman & Berry (1990:16) adopted the user-centred approach
to defining service: “the only criteria that count in evaluating service quality are
defined by customers and only customers judge quality, all other judgements
are essentially irrelevant”.
One of the first scholars who attempted a definition of service quality is
Chrönroos (2000:15), who indicated that the quality of service is determined
by technical quality, functional quality and the image of the service

Chapter 2: Service quality 23
organisation. The technical quality is the service the customer actually
receives and the functional quality involves the manner of service delivery.
The former being the outcome while the latter is the process of service
delivery. Zeithaml et al. (1990:20) identified several dimensions of service
quality, which are discussed in the following section.
2.3.2 Dimensions of service quality
Zeithaml, Bitner & Gremler (2008:111) state that customers do not perceive
service quality in a uni-dimensional way but rather judge quality based on
multiple factors relevant to the context. The dimensions of service quality have
been identified through the pioneering research of Parasuraman, Zeithaml
and Berry and originally consisted of ten dimensions, namely tangibility,
reliability, responsiveness, competence, courtesy, credibility, security, access,
communication and understanding the customer (Seth & Deshmukh,
2005:918). As the work on determining the dimensions of service quality
advanced, the ten original dimensions of service quality were reduced to five
unique dimensions (Boshoff & du Plessis, 2009:38). Cram (2001:266)
reiterates this by identifying five specific dimensions of service quality, namely
tangibility, reliability, responsiveness, assurance and empathy. According to
Zeithaml et al. (2008:113), the dimensions of service quality represent how
customers organise information about service quality in their minds. The five
dimensions of service quality referred to by Parasuraman et al. (1985:41) are
discussed in the following sections.
2.3.2.1 Tangibility
The definition of tangibility is the appearance of physical facilities, equipment,
personnel and communication materials (Santos, 2002:292). Tangibility
provides physical representations or images of the service that customers,
particularly new customers, will use to evaluate quality. Service organisations
often use tangibles to enhance their image, provide continuity and signal
quality to customers. In contrast, organisations that do not pay attention to
tangibility dimensions of the service strategy can confuse and even destroy a
good strategy (Wilson et al., 2008: 86).

Chapter 2: Service quality 24
Owing to the intangible nature of services, it is often difficult for customers to
understand and evaluate services and, therefore, customers often rely on the
tangible evidence that surrounds the service in forming evaluations (Jamal &
Anastasiadou, 2009:402). The tangibility dimension of SERVQUAL compares
customer expectations to customer perceptions regarding the organisation‟s
ability to manage its tangibles. Comparing the perception scores to the
expectation scores provides a numerical variable that indicates the tangibles
gap (Bateson & Hoffman, 2011:334).
2.3.2.2 Reliability
The reliability dimension of service quality refers to the ability of service
organisations to perform the promised service dependably and accurately,
and thus reflects the consistency and dependability of an organisation‟s
performance (Rodriques, Bonar & Sacchi, 2011:633). Wilson et al. (2008:84)
state that reliability means that the organisation delivers on its promises about
service delivery, service provision and problem resolution. Even though
unreliable service providers are extremely frustrating for customers, a
disturbing number of organisations still fail to keep their promises regarding
service delivery. In many instances, the customer is ready to spend money if
only the service provider will show up and conduct the transaction as
promised (Bateson & Hoffman, 2011:335). Reliability is consistently the most
important determinant of perceptions of service quality (Wilson, Zeithaml,
Bitner & Gremler, 2008:84).
2.3.2.3 Responsiveness
Responsiveness is the willingness to help customers and to provide prompt
service (Jamal & Anastasiadou, 2009:400). This dimension emphasises
attentiveness and promptness in dealing with customer requests, questions,
complaints and problems. Responsiveness also captures the notion of
flexibility and the ability to customise the service to customer needs. The
organisation must view the process of service delivery and the handling of
requests from the customer‟s point of view rather than from the organisation‟s
point of view (Wilson et al., 2008:85).

Chapter 2: Service quality 25
Responsiveness reflects a service organisation‟s commitment to provide
services in a timely manner. As such, the responsiveness dimension concerns
the willingness and readiness to provide a service. Occasionally, customers
may encounter a situation in which employees are engaged in their own
conversations with one another while ignoring the needs of the customer
(Bateson & Hoffman, 2011:336).
2.3.2.4 Assurance
The assurance dimension of service quality addresses the competence of the
organisation, the courtesy it extends to its customers and the security of its
operations (Bateson & Hoffman, 2011:336). Jamal and Anastasiadou
(2009:400) define assurance as employees‟ knowledge and courtesy, and the
ability of the organisation and its employees to inspire trust and confidence.
Bateson and Hoffman (2011:336) add that competence pertains to the
organisation‟s knowledge and skills in performing the promised service and
refers to how the organisation‟s employees interact with the customer and the
customer‟s possessions. Wilson et al. (2008:85) warn that this dimension is
likely to be particularly important for services that customers perceive as high
risk or for services that customers feel uncertain about their ability to evaluate
the outcomes.
2.3.2.5 Empathy
Jamal and Anastasiadou (2009:400) define empathy as the caring and
individualised attention that the organisation provides its customers. Bateson
and Hoffman (2011:337) explain that empathy is the ability to experience
another‟s feelings as one‟s own. According to Wilson et al. (2008:86), the
essence of empathy is conveying, through personalised or customised
service, that the customers are unique and special and that their needs are
understood.
Empathetic firms have not lost touch with what it is like to be a customer of
their own organisation. As such, the organisation understands customers‟
needs and makes their services accessible to their customers. In contrast,
organisations that do not provide the requested individualised attention to

Chapter 2: Service quality 26
their customers and offer, for example, operating hours convenient for the
organisation and not its customers, fail to demonstrate empathetic behaviour
(Bateson & Hoffman, 2011:337).
From the discussion above, the inference is that customers want to receive
the service as promised in order to receive quality service. According to Brink
and Berndt (2004:60), service quality is an antecedent of customer
satisfaction and customer satisfaction exerts a stronger influence than service
quality on buying behaviour. Zeithaml et al. (2008:111) are of the opinion that
customer satisfaction is closely linked to service quality.
2.3.3 Customer satisfaction
Studies in services marketing have shown that service quality and customer
satisfaction are closely related. Services marketers are involved in substantial
campaigns to improve the quality of their organisations‟ services and
profitability by ensuring customer satisfaction (Woodruffe, 1995:293).
According to Zeithaml et al. (2008:103), customer satisfaction is a broad
concept, whereas service quality focuses specifically on the dimensions of
services and, therefore, perceived service quality is a component of customer
satisfaction. According to Noone and Namasivayam (2010:273) and Palmer
(2011:288), there is a strong relationship between customer satisfaction and
service quality. Customer satisfaction affects assessments of service quality
and assessments of service quality affect customer satisfaction.
2.3.3.1 Defining customer satisfaction
Kotler (2000:36) defines customer satisfaction as a customer‟s feelings of
desire or disappointment resulting from comparing the perceived performance
of a service to their expectations of that service. Customer satisfaction may
also be defined as the customers‟ feelings, whether content or discontent, that
ensue from comparing a service‟s perceived performance to their
expectations (Ooi, Lin, Tan & Chong, 2011:411). Lewis and Mitchell (1990:11)
define customer satisfaction as the extent to which a service meets
customers‟ needs or expectations. Barnes (2001:52) states that customer
satisfaction is the customer‟s fulfilment response. It is a judgment that the

Chapter 2: Service quality 27
service provided is providing a satisfactory level of consumption-related
fulfilment, including levels of under- or over-fulfilment. According to Zeithaml
et al. (2008:104), customer satisfaction is a dynamic moving target that
evolves over time and that is influenced by a variety of factors. Therefore,
when the service experience takes place over time, customer satisfaction may
be highly variable, depending on the focus point in the usage or experience
cycle.
What will satisfy one customer will not necessarily satisfy another, and what
will satisfy a customer in one situation may not satisfy that same customer in a
different situation. There is a difference between customer expectations and
customer perceptions, as related to customer satisfaction. Customer
satisfaction may develop quickly or may be cultivated over time. Satisfaction
may be a customer‟s afterthought whereby the customer may think back on
the experience and realise how satisfying or dissatisfying it was
(Sureshchandar, Rajendran & Anantharaman, 2002:363). Wu (2009:311)
concurs and states that customer satisfaction is an emotional state resulting
from a customer‟s interactions with a service organisation over time. When the
actual performance of the service provider exceeds customer expectations,
positive disconfirmation occurs and leads to satisfaction, while actual
performance below expectations results in negative disconfirmation and
dissatisfaction.
2.3.3.2 Customer satisfaction versus service quality
Perceived service quality is one of the most highly debated and researched
topics in marketing theories (Sureshchandar et al., 2002:363). Crick and
Spencer (2011:467) emphasise that service quality is a moving target rather
than a fixed goal. While customer satisfaction is often the goal of service
organisations, it often translates into merely meaning that customers are at
ease but not necessarily excited about the organisation. Therefore,
organisations should focus on service quality. Seth and Deshmukh (2005:914)
state that the focus of service organisations changed from profit maximisation
to maximising profits through customer satisfaction; therefore, owing to the
importance of delivering a more superior service to that of competitors,

Chapter 2: Service quality 28
service quality needs to be a priority. Shemwell, Yavas & Bilgin (1998:155)
are in agreement with this and state that the key to a sustainable competitive
advantage lies in delivering high quality service that will in turn result in
satisfied customers.
Cook (2002:86) believes that monitoring customer satisfaction is a pointless
exercise unless management are committed to the process and are likely to
act on the results. Managers must decide which areas of customer
satisfaction to measure, since different customers have different expectations
and, therefore, different satisfaction levels with the service provided by an
organisation.
Bolton and Drew (1991:375) warn that service marketers should understand
that service quality and customer satisfaction are two different concepts and
cannot be regarded as synonymous. The distinction between these terms is
consistent with the distinction between attitude and satisfaction.
Customer expectations of service performance do not remain constant.
Organisations need to be aware of how expectations are changing and adapt
their service offering accordingly (Zeithaml et al., 2008:55).
2.3.4 Customer expectations
Service quality perceptions result from the customers‟ comparison of
expectations of a service with actual service performance. This implies that,
for an organisation to deliver quality service, it has to meet or exceed the
customer's expectations of the service. It is possible to evaluate service
quality on both the process of service delivery as well as the actual outcome
of the service (Theron et al., 2003:5). Among the aspects of expectations that
need exploration and understanding for successful services marketing are the
definition of customer expectations, an understanding of customer
expectations and the expectation of different types of service.

Chapter 2: Service quality 29
2.3.4.1 Customer expectations defined
Performance is evaluated against customer expectations, which are beliefs
about service delivery that serve as standards or reference points. As
customers compare perceptions of performance with these reference points
when evaluating service quality, a thorough knowledge of customer
expectations is critical to service marketers (Zeithaml et al., 2008:75). Harris
(2007:16) states that expectations are personal visions of the results that will
come from experiences that may be either positive or negative. Brink and
Berndt (2004:52) define expectations as customers‟ desires or wants.
According to Zeithaml and Bitner (2000:256), expectations are pre-trial beliefs
or desires about service delivery that serve as points of reference against
which performance and quality are judged.
Quality implies a possible of a range of comparison standards that customers
use to compare different experiences of quality attributes. However, customer
expectations do theoretically form an important factor influencing perceived
service quality, both on the service encounter level and on the customer
relationship level. Service marketers have to understand how expectations
develop throughout the relationship in order to understand how the perception
of quality in an ongoing relationship evolves. This is important for various
reasons, including because marketers have to know the inherent mechanisms
of the dynamics of expectations to be able to manage expectations and
because it is critical to understand that customers may not expect the same
aspects of quality at a later stage in the relationship as they do in the
beginning (Grönroos, 2000:89).
2.3.4.2 Understanding customer expectations
According to Zeithaml et al. (2008:75), understanding what the customer
expects is the most critical step in delivering quality service. Service
organisations that do not have a clear understanding of customer
expectations are likely to lose customers to competitors, while wasting capital,
time and other resources on aspects that are not important to their target
market. According to Boulding, Kalra, Staeling & Zeithaml (1993:7),

Chapter 2: Service quality 30
expectations represent customer desires about the level of service they wish
to receive. Intrinsically, expectations are relatively stable and endure over
time. Zeithaml et al. (1993:70) maintain that customer expectations of services
are a customer‟s normative beliefs about the level of service that will be
delivered in a given service encounter. Normatively, expectations represent
the level of service that customers believe an excellent service provider
should deliver. Jayawardhena and Farrell (2011:207) indicate that positive
perceptions of the service encounter lead to normative expectations of the
overall quality of the service.
Customer expectations result from the perception of various parts of
information that are relevant to a service industry or service organisation,
which start from individual specific courses. It is possible to manage the
service quality expectations of customers by socialising customers and
making customers competent using employees who are able to assist and
lead customers. Enhancing the competitive success of an organisation can be
done by capitalising on the competencies of customers (Nicolaides &
Govender, 2003:7).
2.3.4.3 Determinants of service expectations
According to McKnight (2009:79), different customers have different service
needs and expectations. Zeithaml et al. (2008:77) state that because
customer expectations are critical to their evaluation of services, services
marketers require a thorough understanding about the nature and
determinants of expectations. Service marketers must recognise that
customers have different levels of expectations about services. Wilson et al.
(2008:57) warn that the level of expectation can vary widely depending on the
reference point the customer holds. Various researchers (Parasuraman,
2004:47; Harris, 2007:17; Wilson et al., 2008:57) state that customers have a
range of expectations, rather than a single ideal level of expectations, which
include a desired service, adequate service and a zone of tolerance.
Desired service refers to expectations based on customers‟ previous
experiences that are enhancements to adequate service. Customers‟

Chapter 2: Service quality 31
expectations change constantly and each customer has a unique set of
expectations resulting in a challenging reality for service marketers, and
providing a unique opportunity for enhancing customer satisfaction (Lucas,
2005:67). According to Zeithaml et al. (2008:77), desired service is defined as
the level of service that the customer wishes for and hopes to receive.
Although customers hope to receive a desired service, they recognise that this
is not always possible. As such, customers hold another lower level of
expectations for the threshold of acceptable service referred to as „adequate
service‟. The adequate service expectation level may vary for different
organisations within a category or subcategory.
Adequate service is the customers‟ most basic requirements of a service
interaction (Lucas, 2005:67). It is the minimum tolerable expectation of
performance acceptable to the customer (Boshoff & Du Plessis, 2009:38).
Adequate service is partly influenced by the customers‟ „predicted service‟
level, referring to the customers‟ perception of what the service is likely to be
(Zeithaml & Bitner, 2000:257).
The zone of tolerance is the range in which customers do not particularly
observe service performance. Boshoff and Du Plessis (2009:38) refer to the
zone of tolerance as the difference between the adequate service level and
desired service level. Zeithaml et al. (2008:80) state that the zone of tolerance
is due to services being heterogeneous, in that service performance may alter
across service providers, across service employees from the same service
provider and even across service encounters with the same service
employee. The extent to which customers recognise and are willing to accept
this variation creates the zone of tolerance. Service performance inside or
outside the customer‟s acceptable range, whether very low or very high, may
acquire the attention of the customers in either a positive or a negative
manner (Parasuruman, 2004:47). If, for example, a customer has to wait in a
line for 15 minutes, the customer may begin to get frustrated. The longer the
waiting time below the zone of tolerance, the more frustrated the customer
becomes (Wilson et al., 2008:58).

Chapter 2: Service quality 32
Customer expectations, types of expectations and the zone of tolerance have
been discussed and the understanding of customer expectation was brought
into the perspective of the service provider. According to Zeithaml et al.
(2008:102), service quality and customer satisfaction are based on customers‟
perceptions of the service. Wu (2011:313) reiterates this by stating that
customer perceptions are a major factor in narrowing the zone of tolerance.
2.3.5 Customer perceptions
According to Ukens (2007:51), customers‟ perceptions influence expected
outcomes and customers expect reliability and trustworthiness from service
providers. Aspects of customer perceptions that require an understanding for
successful services marketing include the definition of customer perceptions,
factors forming perceptions and the importance of perceptions.
2.3.5.1 Customer perceptions defined
Perception is the way in which customers see something based on their
experience (Theron et al., 2003:9). According to Boshoff and Du Plessis
(2009:75), perception is the process of receiving, organising and assigning
meaning to information or stimuli detected by a customer‟s five senses. Brink
and Berndt (2004:59) concur with this, stating that perception is the result of a
number of observations by the customer. According to Schiffman and Kanuk
(2007:152), perception is an active, constructive process involving
classification, interpretation and inference.
Theron et al. (2003:9) state that perceptions are frequently developed over
time and that they reflect the ways in which customers have been treated,
their values, priorities, as well as their sensitivity towards other customers.
Different customers can share the same experience and then describe it
differently. Customers may not remember every details of an experience but
will retain an overall feeling about it. That „feeling‟, in combination with others
experiences, will create the perceptions of the organisation.

Chapter 2: Service quality 33
2.3.5.2 Understanding customer perceptions
Customers base the evaluation of the service received on their perceptions
and not on reality. Customer perceptions are often influenced by disposition,
something over which the service organisation has no influence. The
customers‟ experiences or cultural background may influence their
perceptions of the simplest of service experiences. When production and
consumption occur simultaneously, several customers often share a common
service experience and, as a result, demand often outpaces supply (Bateson
& Hoffman, 2011:277).
Perception can change from day to day and from experience to experience.
The service provider must always be aware of the power of perception.
Perceptions are less rigid than attitudes and may be influenced and changed.
The basis of customer perception is experience, knowledge, expectations,
influences and interpretation, and not pure rational logic (Theron et al.,
2003:9). This is re-iterated by Harris (2007:16) who remarks that perceptions
are not necessarily based on rational ideas but may be influenced by
momentary frustration and anger.
Various variables in the customer‟s mind influence the perceived value of
service and its quality, including perceived certainty of service delivery,
expectations about characteristics of service and perceptions of need or
desire for service (Groth & Dye, 1999:338). Parasuraman et al. (1988:13)
define customer perceptions of service quality as a global judgment or attitude
relating to the superiority of a service. According to Theron et al. (2003:54),
customers‟ perceptions of service quality is determined by their experiences
with the service, as well as the expectations they bring to the service situation
and their perception of the quality of the service received. Sureshchandar et
al. (2002:363) describe perceived service quality as one of the most highly
debated and researched topics in marketing theories. There are two
dimensions to the construct of perceived service quality; these are the
perceived expectations of quality before purchase and the perception of
quality delivered. The two dimensions are positively related to the extent that

Chapter 2: Service quality 34
would determine the customers‟ perceived service quality (Theron at al.,
2003:55). This relationship is depicted graphically in Figure 2.1.
Poor Quality
Pre-purchase expectations
Expectations not met
Unacceptable quality
Versus
Expectations met
Satisfactory
quality
Perceptions of service received
Expectations exceeded
Ideal quality
Excellent quality
Figure 2.1 Perceived service qualities (Berry et al., 1985:47)
Generally, service quality is used to measure customers‟ perceptions of
services rendered. Customers are ideal for appraising how well employees
have provided quality service given that they are able to observe employee
performance (Brooks, Lings & Botschem, 1999:53). Measuring service quality
is, although complex, critical to the service marketer. Measures of service
quality can be derived by assessing the difference between customers‟
expectations and perceptions (Zeithaml et al., 2008:293).
2.3.6 Measuring service quality
According to Dhurup (2003:66), receiving a high level of service is important
to customers but understanding how to measure and evaluate the service

Chapter 2: Service quality 35
quality received is challenging. A reliable measure of service quality is critical
for identifying the aspects of service needing performance improvement,
measuring the degree of improvement needed on each aspect and evaluating
the impact of improvement efforts (Zeithaml et al., 2008:151). Seth and
Deschmukh (2005:913) believe that for an organisation to gain a competitive
advantage, marketers must collect information on market demand to enhance
service quality. Zeithaml et al. (2008:151) warn that unlike products quality,
which can be measured objectively by indicators such as durability and
number of defects, service quality is abstract and is best captured by surveys
that measure customer evaluations of service.
This section provided an overview of service quality. In order to gain a
comprehensive understanding of service quality, the following section
describes the various service quality models that are prominent in the
literature.
2.4 SERVICE QUALITY MODELS
Given the complex nature of service quality, it is not surprising that there have
been divergent views about the most suitable way to conceptualise and
measure it (Palmer, 2011:293). Much of the research still uses some variant
of the disconfirmation paradigm to measure customer satisfaction.
Disconfirmation holds that satisfaction is related to the size and direction of
the disconfirmation experience, where disconfirmation is related to the
person‟s initial expectations. A customer‟s expectations are positively
confirmed when a service performs as expected and negatively disconfirmed
when the product or a service performs better than expected (Churchill &
Suprenant, 1982:493).
While the literature on service quality identifies various service quality models
by different researchers, there is little consensus and much disagreement
about how to measure service quality (Robinson, 1999:21). According to Seth
and Deshmukh (2005:934), the SERVQUAL model and the Gap Analysis
model draw much support from researchers. Ooi et al. (2011:411) promote the
use of these two models and state that they have been important in

Chapter 2: Service quality 36
attempting to conceptualise service quality. Therefore, a discussion on the
SERVQUAL model and the Gap Analysis model follows.
2.4.1 SERVQUAL model
The SERVQUAL model, developed by Parasuraman et al. (1985), is a
measurement model for service quality that has been extensively applied in
many studies focusing on service quality assessment (Zeithaml et al.,
2008:154). Zeithaml et al. (2008:151) add that the SERVQUAL model is one
of the first measures to be developed specifically to measure service quality.
The SERVQUAL instrument is known to been the predominant method used
to measure customers‟ perceptions of service quality (Lewis & Booms,
1983:100). Boshoff and Du Plessis (2009:43) believe that this model is
arguably, the best-known instrument to measure customers‟ perceptions of
service quality. According to Jabnoun and Khalifa (2005:375), the popularity of
the SERVQUAL is because of the various advantages the model offers,
namely that it:
is accepted as a standard for assessing different dimensions of service
quality
is shown to be valid across various service industries
has demonstrated reliability in that different respondents interpret the
questions similarly
is parsimonious in that it has a limited number of items and therefore it can
be completed quickly
has a standardised analysis procedure to aid in the interpretation of
results.
The SERVQUAL model views service quality as the gap that exists between
customer expectations and perceived performance. The model suggests that
the greater the distance between the two variables where performance
supersedes expectations, the greater the service quality (Crick & Spencer,

Chapter 2: Service quality 37
2011:467). Wilson et al. (2008:132) have identified the following purposes of
the SERVQUAL model:
Through identifying differences between customers‟ perceptions and
expectations, service organisations may identify average gaps for each
service attribute.
The five SERVQUAL dimensions may be used to assess the service
organisation‟s service quality.
Service organisations may monitor customers‟ perceptions and
expectations using individual service attributes or the SERVQUAL
dimensions.
Service organisations may compare the service quality ratings against
those provided by competing organisations.
The service organisation‟s service performance measurements may be
used to identify and examine differences in customer segments.
The SERVQUAL model may be used to measure the internal service
quality offered by the service organisation‟s departments or divisions.
The SERVQUAL instrument involves a scale consisting of two sections, each
of which contains 22 service attributes, grouped into the five service quality
dimensions (refer to Section 2.3.2), namely tangibility, reliability,
responsiveness, assurance and empathy (Cram, 2001:266). The model was
designed to measure customers‟ expectations and perceptions of service
quality. The first section of the instrument consists of perception items
followed by expectation items (Boshoff & du Plessis, 2009:45). Comparing the
customers‟ expectations before a service encounter and their perceptions of
the actual service delivered has been the most often used approach for
measuring service quality (Lewis & Booms, 1983:100).
The conceptualisation, dimensionality, operationalisation, measurement and
applications of the SERVQUAL model have been subjected to some
criticisms, which include the dimensions (reliability, assurance, tangibility,

Chapter 2: Service quality 38
empathy, responsiveness) not being universal and that the model fails to draw
on established economic, statistical and psychological theory (Buttle, 1996:8).
In spite of these criticisms of the effectiveness of SERVQUAL across different
service settings, there is a universal agreement that the 22 items are
reasonably good predictors of service quality in totality (Sureshchandar et al.,
2002:364). The model remains the most complete attempt to conceptualise
and measure service quality. Nyeck et al. (2002:101) state that although the
model has critics, it does not render the measuring tool moot, rather the
criticism received may have more to do with how researchers use the tool.
Parasuraman et al. (1991:420) argue that, with minor modification,
SERVQUAL can be adapted to any service organisation. They add that
information on service quality gaps can help marketers diagnose where
performance improvement can best be targeted.
Based on the five SERVQUAL dimensions, the gap between customers‟
expectations for excellence and the perceptions of actual service delivered will
be measured with the SERVQUAL instrument. The instrument helps service
providers understand both customer expectations and perceptions of specific
services as well as quality improvements over time (Parasuraman et al.,
1988:26). Hu et al. (2010:501) believe that the SERVQUAL model provides
reasons why the service quality of the service industry cannot meet the
customer demands, and consider that, in order to meet the customer
demands, it is necessary to break through the five service quality gaps in the
model. This has led to the development of the Gap Analysis model.
2.4.2 Gap Analysis Model
Parasuraman et al. (2004:45) developed the Gap Analysis model.
Parasuraman et al. (1985:48) proposed that service quality is a function of the
differences between expectation and performance along the quality
dimensions and, therefore, developed a service quality model (Figure 2.2)
based on gap analysis. The Gap Analysis model is, according to Skalen and
Fougere (2007:110), the most important development in the field of customer
perceived service quality and conceptualises service quality as a comparison
between customer‟s expectations and perceptions.
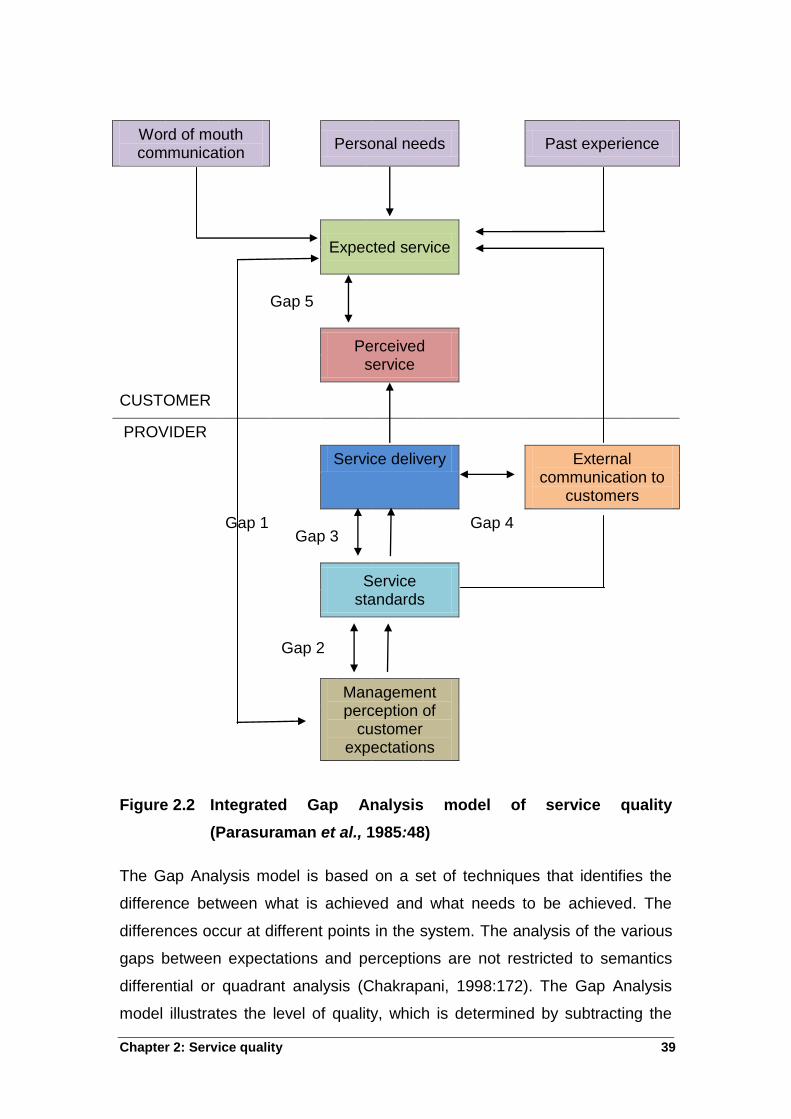
Chapter 2: Service quality 39
Word of mouth communication
Personal needs Past experience
Expected service
Gap 5
Perceived service
CUSTOMER
PROVIDER
Service delivery External communication to
customers
Gap 1 Gap 3
Gap 4
Service standards
Gap 2
Management perception of
customer expectations
Figure 2.2 Integrated Gap Analysis model of service quality
(Parasuraman et al., 1985:48)
The Gap Analysis model is based on a set of techniques that identifies the
difference between what is achieved and what needs to be achieved. The
differences occur at different points in the system. The analysis of the various
gaps between expectations and perceptions are not restricted to semantics
differential or quadrant analysis (Chakrapani, 1998:172). The Gap Analysis
model illustrates the level of quality, which is determined by subtracting the
Chapter 2: Service quality 40
perceived service score from the customer‟s expectation score for each of the
items (Kurtz & Clow, 1998:105). The following are some common gaps used
when measuring service quality:
2.4.2.1 Gap 1: Customers’ expectations – Managements’ perceptions
gap
Gap 1 is the most immediate and obvious gap and is usually between what
customers want and what management think customers want (Bateson &
Hoffman, 2011:328). Wilson et al. (2008:106) state that Gap 1 is the
difference between a customer‟s expectations of a service and the
organisation‟s interpretation of the customer‟s expectations.
According to Wilson et al. (2008:107), in order to close Gap 1, formal and
informal methods to capture information about customer expectations must be
developed through marketing research techniques involving a variety of
traditional research approaches, customer interviews, survey research,
complaint systems and customer panels. Bateson and Hoffman (2011:329)
concur, stating that closing Gap 1 requires minutely detailed knowledge of
what customers desire and then building that response into the service
operating system.
2.4.2.2 Gap 2: Management’s perceptions – Service quality
specifications gap
According to Kurtz and Clow (1998:112), Gap 2 is the difference between
management‟s perception of customers‟ expectations and the translation of
those perceptions into service quality specifications. Gap 2 is the difference
between management‟s perception of what the customer expects and the
translation of this perception into service standards (Chakrapani, 1998:172).
Closing this gap requires setting service quality objectives. The objectives
must to set with the customer, the service contact provider and the
management. Customer contact employees must understand management‟s
perspective and the need to generate a profit. In exchange, management
must understand what is and what is not possible in terms of operations. In
Chapter 2: Service quality 41
order to be effective, the objectives must be customer-oriented. Task
standardisation will also help reduce the size of Gap 2 and this can be done
through technology (Kurtz & Clow, 1998: 115).
2.4.2.3 Gap 3: Service quality specifications – Service delivery gap
Gap 3 is the discrepancy between development of customer-driven service
standards and actual service performance by company employees. Even
when guidelines exist for performing services well and treating customers
correctly, high-quality service performance is not a certainty (Wilson et al.,
2008:110). Primary causes of this gap are the variable and inseparable nature
of services. Most services are performed by people, and therefore the quality
of service is highly dependent upon how well the service provider performs his
or her job (Kurtz & Clow, 1998:115).
A common characteristic of successful service companies is teamwork. A
feeling of teamwork is created when employees see other employees and
management as key members of the team. There must be a fit between
employee skills and job requirements if employees are to provide the services
according to the job specifications. Computerised diagnostic equipment is
essential to diagnose problems (Kurtz & Clow, 1998: 117).
2.4.2.4 Gap 4: Service delivery – External communications gap
Gap 4 is the difference between the service the organisation promises it will
deliver through its external communications and the service it actually delivers
to its customers. If advertising or sales promotions promise one kind of
service and the customer receives a different kind of service, the
communications gap becomes wider and wider (Bateson & Hoffman,
2011:333). According to Chakrapani (1998:172), Gap 4 is the gap between
what is delivered and what is communicated to customers as being delivered.
In order to reduce the size of Gap 4, service providers must address two
issues: horizontal communications and the propensity to over promise.
Service contact employees should have input into the organisation‟s
advertising and promotional plans, ensuring that messages conveyed to the
Chapter 2: Service quality 42
prospective customers can be operationally performed (Kurtz & Clow,
1998:119).
2.4.2.5 Gap 5: Customer’s expectation – Perceived service gap
Gap 5 is the difference between what customers expect from the service
provider and what they perceive they are getting. For example, when a
customer goes to a retail location he/she may expect service within 15
minutes but may perceive the average service time to be close to 30 minutes
(Chakrapani, 1998:172). The key to closing the customer gap is to close Gaps
1 through to 4, and to keep them closed (Wilson et al., 2008:113). Each gap
responds in the same manner - before the organisation can close Gap 5, it
must close, or attempt to narrow Gaps 1 to 4 (Bateson & Hoffman, 2011:328).
Gap 5, which is the difference between what customers received and what
customers expected, is the sum of Gaps 1 to 4 and both the direction and the
magnitude of the first four gaps affect Gap 5 (Kurtz & Clow, 1998:110).
Closing the gap between what customers expect and what customers
perceived is critical to delivering quality service. Any organisation interested in
delivering quality service must begin with a clear understanding of its
customers‟ expectations (Wilson et al., 2008:105).
This section provided an overview of the SERVQUAL model and the Gap
Analysis model. A decision was made to employ the SERVQUAL model as
the measuring instrument for this study in order to obtain the information
required. In order to gain a comprehensive understanding of service quality in
municipal service delivery, as the title of this study suggests, a background on
the South African local spheres of government is vital, and this is addressed in
the following section.
2.5 HISTORICAL OVERVIEW OF THE CURRENT SOUTH AFRICAN
LOCAL SPHERES OF GOVERNMENT
National government, provincial government and local government were
established as the three elected spheres of government, each with distinctive
functional responsibilities. The Constitution requires the three spheres of

Chapter 2: Service quality 43
government to function as a single system of cooperative government for the
country as a whole. While provincial administrations were amalgamated to
become a single public service with national departments, local government
went through a long process of transition (RSA, Department of Local and
Provincial Government, 1998). This transition eventually saw the
establishment of 283 municipalities and the first democratic elections in 2000
(Nealer & Raga, 2007:171).
Before conducting an examination of the history of local authorities in South
Africa, a distinction should be made between a local authority and a local
government. According to Wissink (1999:78), a local authority can be defined
as a clearly demarcated territory with boundaries, a permanent population and
at least one political government, which can act with a degree of sovereignty.
Furthermore, local authorities can be classified as town councils, city councils
or metropolitan councils.
Local government refers to the third, and separate, sphere of government. It
exercises its legislative and executive authority by providing essential
municipal amenities. Local government is subordinate to the higher spheres of
government; however, it is allocated a 1imited degree of autonomy. Local
government was created to bring democratic government to the grass roots
population, giving them a sense of involvement in the political process that
controls the citizens‟ daily lives (Reddy, 1996:51).
Schacter (2000:8) argues that there is intransigence in the relationships
between the different spheres of government. In order to facilitate and
improve service delivery, there should be a co-ordinated effort from all
spheres of government. The South African public service ought to include
clearly defined roles for all three spheres of government, thereby avoiding
duplicating issues among the three spheres (Friedman, 2002:78). Naidoo
(2005:104) agrees and indicates that policy implementations lack co-
ordination among different departments at national, provincial and local
spheres of the South African government. Mavhivha (2003:7) reiterates this,
stating that there is inadequate co-ordination of policies between the three
spheres of government in South Africa.

Chapter 2: Service quality 44
Naidoo (2005:103) argues that the South African public service requires faster
response time to meet the needs and demands of South African society,
better utilisation of available resources, improved policy implementation,
monitoring of performance and a work culture conducive to maximising efforts
by the departments.
In contextualising the present local government system in South Africa, it is
imperative to examine the legislative foundations upon which the local
government is founded. This includes The Constitution of the Republic of
South Africa Act, 1996 (Act 108 of 1996), the Local government: Municipal
Structures Act, 1998 (Act 117 of 1998) and the Local Government: Municipal
Systems Act, 2000 (Act 32 of 2000). The specific role of the local government
is looked at in terms of its functions and powers, some of which devolve from
both the national and provincial governments.
The aim of this study is to add to the growing literature on expectations and
perceptions of service delivery by service providers in the Emfuleni Local
Municipality by measuring the service quality they offer to their customers. A
review the status and service delivery of local government, the White paper on
local government, and the functions, responsibilities and challenges of
municipalities in South Africa will be conducted in the following section.
2.5.1 Status of local government
The Constitution of the Republic of South Africa, Act (108 of 1996) defines the
status underlying developmental local government as:
The Constitution grants local government original powers. Local
government is no longer a function of provincial government, or a third
level of government. It has become a sphere of government in its own
right. It is part of a system of co-operative government and governance,
which includes provincial and national spheres.
Local government is no longer a site for the delivery of services only, but a
crucial site for social and economic development. This requires local
government to have a strong developmental focus.

Chapter 2: Service quality 45
Local government, within its constraints, has to contribute to both
economic growth and social redistribution.
Local government is a key arena for the democratic participation of
ordinary citizens.
Municipalities constituting the new local government system have to be
financially viable and sustainable.
Over time and through appropriate negotiations, more powers and
functions can be devolved to local government.
According to Section 151 of the Constitution (1996):
The local sphere of government consists of municipalities, which must be
established for the whole of the territory of the republic.
The executive and legislative authority of a municipality is vested in its
Municipal Council.
A municipality has the right to govern, on its own initiatives, the local
government affairs of its community, subject to national and provincial
legislation, as provided for in the Constitution.
The national or a provincial government may not compromise or impede a
municipality‟s ability or right to exercise its powers or perform its functions.
The local government and service delivery are discussed next.
2.5.2 Local government and service delivery
Many organisations are investing in employee development to improve the
quality of the services in line with that which customers expect (Jenkins
1992:13). Municipalities in South Africa have become focus points for service
delivery. Local authorities are at the first line of service delivery institutions.
The governance framework should be manifested through a set of techniques
and methods related to effective policy implementation, monitoring,

Chapter 2: Service quality 46
performance evaluation and measurement by a set of values such as equity,
productivity and quality (Van der Waldt, 2004:2).
Nuzvidziwa (2001:3) suggests that these attributes underpin institutional
success stories. Naidoo (2005:103), who indicates that these features ensure
a dynamic and effective organisation, reiterates this. The idea is to ensure that
improved service delivery is a dynamic social activity out of which socio-
economic, cultural and political imperatives integrate within the governance
framework in the South African public service. It is important for the South
African public service to take cognisance of the socio-economic, cultural and
political perspectives of employees in the public service in order to create an
environment that is conducive to the improvement of public service delivery
(Van der Niekerk et al., 2002:115).
2.5.3 White paper on local government
Section B of the White Paper on local government (RSA 1998:33) states that
municipalities require the active participation of the community at four levels.
At the first level, the community should participate as voters in order to ensure
maximum democratic accountability of the elected political leadership for the
policies they are empowered to promote. Participation at the second level
should be as a community who can express, through different stakeholder
associations, their views before and after the policies have been implemented,
in order to ensure that such policies benefit the community. Participation at
the third level should be as customers and end-users who expect value for
money, affordable services and, courteous and responsive service. At the
fourth level, the community should participate as partners, who are involved in
the mobilisation of resources for development. It may be deduced from this
argument that the concept of community participation needs to be clarified;
surely, the municipal councillors are not expected to submit all their decisions
to the community for approval.
2.5.4 Functions of municipalities
The Constitution of Republic of South Africa (1996) refers to the powers and
functions of local municipalities as follows:

Chapter 2: Service quality 47
A municipality has executive authority in respect of, and has the right to
administer the local government matters and other matters assigned to it
by national or provincial legislation.
A municipality may make and administer by-laws for the effective
administration of the matters which it has the right to administer
Subject to Section 151 (4), a by-law that conflicts with national or provincial
legislation is invalid. If there is a conflict between a by-law and national or
provincial legislation that is inoperative because of a conflict referred to in
Section 149, the by-law must be regarded as valid as long as that
legislation is inoperative.
The national government and provincial governments must assign to a
municipality, by agreement and subject to any conditions, the
administration of a matter, which necessarily relates to local government, if
that matter would most effectively be administered locally; and the
municipality has the capacity to administer it.
A municipality has the right to exercise any power concerning matter
reasonably necessary for, or incidental to, the erective performance of its
functions.
A municipal council therefore has very specific functions and powers as an
autonomous level of government.
2.5.5 Responsibilities of Local Government
The responsibilities of local government can be generally categorised as
follows:
Infrastructure and basic services, which includes water and sanitation,
electricity and gas, reticulation, refuse removal, storm water management,
municipal roads, municipal public transport, and street lighting, among
others.

Chapter 2: Service quality 48
Social and welfare services, which while primarily an area of provincial
responsibility, municipal functions that fall in this category may include
childcare facilities, municipal health services, establishment and
maintenance of public parks and other recreational facilities. Other
community-based social services are often, in practice, provided by
municipalities (especially the larger municipalities).
Administration and public order, which includes fire-fighting services,
building regulations, control of nuisances, air and noise pollution, traffic
and parking; larger municipalities often have established 'metro police' to
assist with enforcement in these areas.
Municipal planning, which involves the development plans of a municipality
that are the basis for directing and managing land use and infrastructure
provision, and that should help plan for public investment whether the
particular service is provided directly by the municipality or by province.
For example, the housing subsidy programme has been implemented by
the province, but effective implementation relies on municipal planning.
2.5.6 Municipal service delivery in South Africa
In 2003, a review of the municipal service delivery was conducted by the
South African government. This review reflected that, although South African
public services have been successful in meeting immediate service delivery
objectives, the current interventions, strategies and approaches are not
effective in rapidly improving and redressing service delivery to the extent and
at the pace that is currently needed in South Africa (Towards a Ten Year
Review, 2003).
According to Naidoo (2009:105), there are also a number of interrelated
variable hampering the effectiveness of the public service delivery. The most
important of these variables were identified as human resource and financial
constraints, the lack of technical skills, the lack of co-ordination, ineffective
intergovernmental relations (IGR) among the three spheres of government,
ineffective policy implementation, and the lack of effective monitoring and
evaluation systems.

Chapter 2: Service quality 49
2.5.7 Challenges facing South African municipalities
Municipalities, the world over, face the challenge of managing viable and
environmentally sustainable urban and rural systems (RSA 1998:10). The
backlog in service provision and the transformation needs in South Africa
have led to the adoption of a developmental approach to local government.
The need to provide basic services to South Africa‟s population while still
ensuring adequate service provision for economic development is vital for the
development of the country and is the major challenge facing local
government structures (African Development Bank, 2000:29).
The lack of integration of unique diversities and differences can lead to a lack
of trust and a lack of confidence in government. Such values in South Africa
should include the principle of Ubuntu (Humanness). Values can provide the
basis for responsibility and accountability, and can ensure that the public
service will exercise its authority in such a way as to serve the interests and
welfare of society. Since there is an urgent need to improve service delivery
by the South African public service, leaders should, therefore, motivate public
servants to do more than they had originally expected and even more than
they thought possible (Naidoo, 2005:103).
According to Pretorius and Schurink (2007:22), the post-1994 delivery of
services has not always been as effective and efficient as had been
anticipated. Areas of concern include the appropriateness of the level of
service provided, its affordability, cost recovery, operation and maintenance.
Other problem areas include expectations regarding service delivery, human
resource capacity and skills, and service delivery in support of economic
development. Capacity limitations, other than a direct shortage of funds, have
proved to cause bottlenecks in many instances. Developmental local
government will need to overcome the human resource capacity constraints
that have hampered the transitional municipalities. These constraints have
resulted in:
under spent capital budgets
poorly prepared applications for capital funds

Chapter 2: Service quality 50
an absence of application for national capital funds
weak co-ordination between capital budgets
an inability to procure and manage consultants
a lack of attention to the maintenance of existing plants and infrastructures
the loss of senior technical staff.
According to the public press, most local governments lack the financial,
technical and managerial capacity to take optimum advantage of municipal
service partnerships, and this capacity will need to be developed. In many
circumstances, there has been no substantive debate about alternative
approaches to service delivery - only reaction and counter-reaction. Public
sector leaders around the world face a common set of challenges if their
services are to meet the increased expectations of their customers, both
citizens and organisations. Challenges may be consistent but the ways in
which they are being confronted and the results that are being achieved vary
considerably.
Pretorius and Schurink (2007:23) further elaborates that one common
challenge faced by every organisation is how to improve customer service.
The public sector is no exception. Traditionally, it has been seen as a passive
vehicle for executing social policy mandated by legislation. Increasingly,
however, accustomed to enhanced service delivery from the private sector,
citizens and organisations view the public sector as another provider of
services. To address this, the public sector must find ways of improving the
efficiency and effectiveness of its service delivery. This means providing value
for money by improving quality of service for all and reducing the costs
involved in providing those services.
2.6 SYNOPSIS
This discussion stressed that although public service transformation has been
taking place in South Africa and fundamental changes have been achieved, it
is imperative that the constant questioning and striving continue, in order to
Chapter 2: Service quality 51
discover better ways of delivering improved services. Various alternatives to
deliver improved services may be pursued, including not underestimating the
importance of effective representation, ensuring ongoing meaningful
relationships between councillors and not just during local elections, and
involving the relevant communities in shaping the viability of their
municipalities.
The measurement of service quality is complex and difficult; the complexity of
which is a product of the unique characteristics of services. Many factors play
a crucial role in assessing service quality, with the customer being the most
salient factor of all.
This chapter dealt with the definition and concept of service quality. An outline
and discussion on the five dimensions of service quality, as well as the five
critical aspects of service quality were presented. The advantages and
disadvantages of the service quality model, including the SERVQUAL model
were debated and the proposed service quality model used for this study was
deliberated upon in this chapter. The following chapter describes the research
methodology followed in the empirical study.

Chapter 3: Research Methodology 52
CHAPTER 3
RESEARCH METHODOLOGY
3
3.1 INTRODUCTION
The purpose of this chapter is to outline the methodology employed in the design of
the empirical study. The preceding chapters have laid the foundation for the research
instrument, based on previous studies of a similar nature.
Section 3.2 pinpoints the research objectives and research design, as stated in
Chapter 1. Section 3.3 provides an overview of the data requirements for the study.
Section 3.4 describes the development of the research instrument, including the
development of the questionnaire items, question wording, questionnaire
specifications and design, the determinants of a suitable measuring scale and the
pre-testing of the questionnaire. Section 3.5 discusses the development of the
sampling plan, which involved defining the population of this study, determining the
sample size, deciding on the operational procedure for sampling and determining the
execution of the sample plan. The statistical methods applied to the empirical data
set are identified and discussed in Section 3.6. The statistical procedures used in the
analysis of the data are also discussed.
3.2 FORMULATING THE RESEARCH OBJECTIVES AND RESEARCH
DESIGN
The research objectives applicable to the empirical portion of this study were
formulated in
Chapter 1 and are as follows:
Measure the community customers‟ expectations of municipal service–quality
delivery in the Emfuleni Local Municipality.
Measure the community customers‟ perceptions of municipal service-quality
delivery in the Emfuleni Local Municipality.

Chapter 3: Research Methodology 53
Identify the gaps between community customers‟ expectations and perceptions of
municipal service–quality delivery in the Emfuleni Local Municipality
Identify priorities for improvement in an attempt to improve service-quality
delivery within the Emfuleni Local Municipality.
The research instrument applied in this study was adapted from Parasuraman et al.
(1985:41). The SERVQUAL model (refer to Chapter 2, Section 2.4.1) was
specifically developed to measure service quality and is known to be the
predominant method used to measure customers‟ service expectations and
perceptions. Therefore, the measuring instrument employed in this study supports
the attainment of the first three objectives stated above.
After the research instrument was adapted (refer to Section 3.4), two experienced
researchers initially assessed it to check for any possible misunderstanding. The
initial questionnaire was pre-tested on a small group of three respondents to clarify
the questions. Refinements and the necessary adjustments were then made to the
questionnaire. The questionnaire was piloted on 54 respondents to confirm the
reliability of the instrument. Thereafter, the refined questionnaire was prepared for
the main survey part of the study.
One group of respondents was selected for the study – customers of the Emfuleni
Local Municipality. Two municipal pay points, namely Vereeniging and
Vanderbijlpark, located in the Vaal region of the Gauteng Province were selected by
means of a judgement sample. The reason for selecting these pay points is due to
them being the largest to serve the residents of the Emfuleni Local Municipality. In
line with previous studies conducted of a similar nature, such as Ngubane (2005:78)
(sample size of 300), and Mncwango (2004:29) (sample size of 400), it was decided
to draw a non-probability convenience sample of 400 respondents.
Permission, to carry out the survey was obtained from the Municipal Manager of the
Emfuleni Local Municipality. Thereafter, a hand-delivered self-administered
questionnaire was distributed to the residents of the Emfuleni Local Municipality at
the Vereeniging and Vanderbijlpark pay points.

Chapter 3: Research Methodology 54
3.3 DATA REQUIREMENTS
The types of data required for the study were as follows:
service quality dimensions data
dimension data pertaining to service quality models
demographical data
3.4 RESEARCH INSTRUMENT
The survey approach was selected as the means to gather the relevant data for this
study. A survey is one of the tools used in the collection of research data (Tuckman,
1994:2; Gall et al., 1996:289). According to Malhotra (2010:335), the questionnaire
is an instrument used for gathering data about variables of interest in a study, and
consists of a number of questions or items that a respondent reads and answers.
Tuckman (1994:230) asserts that questionnaires are used to convert the data
provided by respondents directly into information. According to Malhotra (2010:335),
a questionnaire is a formalised set of questions used for obtaining information from
the respondents. Van Rensburg (1994:504) maintains that the questionnaire is a set
of questions dealing with a specific topic or related group of topics given to a
selected group of individuals for the purpose of gathering information on a problem
under consideration. Therefore, in this study, the survey approach using a structured
questionnaire was employed to collect information pertaining to customers‟
expectations and perceptions of municipal services-quality delivery.
The research instrument applied in this study was an adapted version of the
instrument developed by Parasuraman et al. (1985:41). This is in accordance with
the general objective of this study as formulated in Chapter 1. As advised by Wolf
(1997:422), the utilisation of questionnaires in this research was based on the
following assumptions:
Respondents read and understand the questions after the questionnaire is
explained to the respondents.

Chapter 3: Research Methodology 55
Respondents are presumably willing to answer the questions after being assured
that the research is meant for improving the service delivered.
Respondents are in the position to supply the information needed to answer the
questions.
The aim of the research, the size of the research sample, the method of collecting
data and the analysis of data were taken into consideration when preparing the
questionnaire. Given that a questionnaire was selected as the research instrument
for this study, a distinction between questionnaire content, question format, question
order, type of questions, formulation of questions, and validity and reliability of the
scale is required.
3.4.1 Development of questionnaire items
According to Tuckman (1994:225), questionnaire items must be developed carefully
and in such a way that they measure a specific aspect of the study‟s objectives.
Information pertaining to socio-economic and demographic descriptors is referred to
as classification information and in studies involving human participants, relevant
background information is essential in understanding the results of the final study
(Pallant, 2010:53). Therefore, in order to obtain classification information particularly
related to the main aims of the study, socio-economic and demographic information
were collected.
In order to measure customers‟ expectations and perceptions of municipal service-
quality delivery, the SERVQUAL scale was included in the questionnaire. This scale
comprises 22 items divided into the five dimensions of tangibility (four items),
reliability (five items), responsiveness (four items), assurance (four items) and
empathy (five items). Each of the 22 items was measured in two ways, namely the
expectations of customers concerning service quality and the perceived levels of
service actually provided.
The SERVQUAL variables relating to the five service quality dimensions (refer to
Section 2.3.2) are outlined as follows:

Chapter 3: Research Methodology 56
3.4.1.1 Dimension 1: Tangibility
This dimension refers to the appearance of physical facilities, equipment, personnel
and communication materials and includes the following variables:
Modern looking equipment
Attractiveness of the physical facility
Neatness of personnel‟s appearance
Visually appealing promotional materials
3.4.1.2 Dimension 2: Reliability
This dimension refers to the service provider ability to perform the promised service
dependably and accurately, and includes the following variables:
Provide services as promised
Sincere interest in solving problems
Services performed right the first time
Services delivered timeously
Error-free records
3.4.1.3 Dimension 3: Responsiveness
This dimension refers to the service providers‟ willingness to help customers and
provide prompt service and includes the following variables:
Inform customers when services will be performed
Prompt service
Willingness to help customers
Never too busy to respond to requests
3.4.1.4 Dimension 4: Assurance
This dimension refers to the knowledge and courtesy of personnel and their ability to
convey trust and confidence and includes the following variables:
Chapter 3: Research Methodology 57
Personnel‟s behaviour instil confident
Feeling secure with transactions
Personnel are consistently polite
Personnel are knowledgeable
3.4.1.5 Dimension 5: Empathy
This dimension refers to the caring, individualised attention the organisation provides
to each customer and includes the following variables:
Give individual attention
Convenient operating hours
Give personal attention
Have the customers‟ best interests at heart
Personnel understand customers‟ specific needs
3.4.2 Question format
The integrated layout of sets of questions or scale measurements into a systematic
instrument refers to the format of the measuring instrument (Hair, Bush & Ortinau,
2003:450). The format of questions can have a significant effect on the results and is
particularly important for a self-administered questionnaire (Malhotra, 2010:353),
such as the one used in this study. In addition, the wording of a question and the
form of measuring responses should be carefully chosen. This will depend to some
degree on the question‟s content and the method of data collection (Block & Block,
2005:160). According to Brace, (2008:489) self-administered questionnaires are data
collection techniques in which respondents read and answer the same set of
questions in a predetermined order without an interviewer being present.
One of the important aims in the construction of the questionnaire is to present the
questions in as simple and straightforward manner as possible. The questionnaire
should be designed in such a way that it eliminates ambiguity, biasness, technical
language and prejudice (Block & Block, 2005:157). Structured questions are easy to
apply due to them being pre-coded, and more economical and less time consuming

Chapter 3: Research Methodology 58
to implement (Wiid & Diggines, 2009:176). Structured questions specify the set of
response alternatives and the response format, and are in the form of multiple-
choice questions, dichotomous questions or a scale (Malhotra, 2010:349). Therefore,
for the purpose of this study, the 22 variables examined in the section above were
placed in the self-administered questionnaire in an undisguised, structured manner,
as the research instrument contains specific mutually exclusive response categories
from which the respondent chooses a category that best suits the response.
3.4.3 Questionnaire specifications and design
Three critical elements are discussed in this section, namely the layout, phrasing and
length of the questionnaire.
In designing a questionnaire, due consideration should be given to the aesthetics
and length of the questionnaire. The questionnaire should be attractive and not
appear too long. This is intended to encourage the respondent to fill in and return the
questionnaire (Saunders, Lewis & Thornhill, 2009:304). As advised by Brace
(2008:43) and Malhotra (2010:350), an effort was made to arrange the questions in
such a way that the questionnaire would appear logical from the respondent‟s
perspective. The layout of the questionnaire used in this study comprises three
sections, namely Section A (refer to Annexure B), Section B and Section C (refer to
Annexure C). The first section (Section A) was designed to gather demographic data
and includes questions on gender, group, age, area, years of residence and number
of occupants in the household. The second section (Section B) consists of items
relating to customers‟ expectations of the quality of service delivery by the
municipality under study. The third section (Section C) consists of items relating to
customers‟ perceptions of the quality of service delivery by the municipality under
study.
Wiid and Diggines (2009:178) advise that questions be phrased using „simple‟
vocabulary that can be easily understood by the respondents. In order to avoid
potential problems of ambiguity, words with ambiguous meanings should be avoided
(Brace, 2008:118). The questionnaire employed in this study was assessed to
ensure that the language used was simple and without ambiguous meaning. Due
care was taken to ensure that each question was formulated in a clear manner that

Chapter 3: Research Methodology 59
only asked about one variable. In order to prevent double-barrelled questions, the
word „and‟ was avoided in the body of all questions.
The length of the questionnaire relates to the average time it takes a single
participant to complete the questionnaire. Iacobucci and Churchill (2010:223) advise
that respondents may be discouraged from completing an extensive questionnaire
as it takes too much time to complete and, as such, is being less appealing. As
advised by Bevan-Dye (2005:218), the questionnaire was tested to ensure it could
be completed in less than 20 minutes. The questionnaire used in this study is
presented in Annexure C.
3.4.4 Determining the measurement scale
Once the type of research design has been determined and the information to be
obtained specified, a decision must be taken on the measurement and scaling
procedures. According to Cooper and Schindler (2003:250), a measurement scale is
defined as a procedure for assigning numbers or symbols to a property of objects in
order to impart some of the characteristics of the numbers to the properties in
question. Malhotra (2010:354) indicates that scaling is an extension of measurement
and involves creating a continuum upon which measured objects are located.
A number of forms of rating scales have been developed specifically to address
responses to a series of attitudinal dimensions. The three most frequently applied
itemised rating scales include the semantic differential scale, Staple scale and Likert
scale. According to Block and Block (2005:83), technically, most scales are probably
at best interval-level measurements due to the continuum being somewhat arbitrary
and not necessarily standardised across individuals. In the itemised rating scale, the
respondent is given a short description of each of the categories. The semantic
differential scales, the Staple scale and the Likert scale are examples of itemised
rating scales (Wiid & Diggines, 2009:166).
A semantic differential scale is a bipolar rating scale. It differs from the Likert scale in
that opposite statements of the dimension are placed at the two ends of the scale
and respondents are asked to indicate which they most agree with by placing a mark
along the scale (Brace, 2008:76).
Chapter 3: Research Methodology 60
A Staple scale is an attitude measure that places a single objective in the centre of
an even-number range of numerical values. The scale was originally developed in
the 1950s to measure the direction and intensity of an attitude (Zikmund, 2000:296).
The Likert scale, also referred to as a summated scale (Malhotra 2010:276), is a
technique used by researchers for the measurement of attitudes. According to Brace
(2008:86), the Likert scale (frequently known as an agree/disagree scale) was first
published by the psychologist Rensis Likert in 1932. The technique presents
respondents with a series of attitude dimensions on which they are asked to indicate
whether, and how strongly, they agree or disagree with a given statement. Likert
scales consist of statements that express either a favourable or an unfavourable
attitude towards the object of interest (Cooper & Schindler, 2003:252). Numerical
numbers, usually ranging from one to five, are attached to each set of statements
applied in the scale. Respondents are asked to rate their relative agreement or
disagreement in accordance to the statement (McDaniel & Gates, 2006:328). The
application of a Likert scale is very popular because it is simple to develop and
monitor (Saunders et al., 2009:296). Brace (2008:82) concurs and adds that the
Likert scale is popular because it allows for sufficient discrimination between
possible responses and because it is easily understood by respondents.
For the purpose of this study, the second section (Section B) and third section
(Section C) of the questionnaire makes use of a Likert scale. A five-point Likert scale
was applied to measure the respondents‟ agreement or disagreement towards the
specific object being tested. The statements were related to numerical numbers,
ranging from 1=strongly agree, 2=agree, 3=neither agree nor disagree, 4=disagree
and 5=strongly disagree. The following section reports on the methods employed for
the pre-testing of the questionnaire.
3.4.5 Pre-testing of questionnaire
Once a questionnaire is completed, it is important that the draft be tested and refined
(Wiid & Diggines 2009:181). Martins, Loubser & van Wyk (1996:232) indicate that
pre-testing is essential in order to ensure that the questionnaire will perform its
various functions in the actual survey situation. According to Brace (2008:163), as an
essential precaution, it is advisable to pre-test the questionnaire before committing to

Chapter 3: Research Methodology 61
a large-scale study. Wiid and Diggines (2009:181) state that during this step, the
questionnaire should be tested on a small sample of respondents representing the
group under investigation. Therefore, the respondents chosen for the pre-testing
should be similar to the respondents employed to administer the final questionnaire.
As advised by Wiid and Diggines (2009:181), initial pre-testing was undertaken in
two stages in order to ensure the face validity and content validity of the research
instrument.
First, two experienced researchers were requested to evaluate the questionnaire to
check for any obvious mistakes or potential problems. Secondly, as advised by
Bryman and Bell (2003:273), the debriefing approach to pre-testing was applied to
ensure the understanding of the questionnaire. Three individuals who did not form
part of the pilot test or main study were chosen to participate in the debriefing pre-
testing of the questionnaire. Of these three respondents, only one had English as
their first language, whereas the other two respondents had English as their second
language. The questionnaire was presented to the respondents in exactly the same
way, as it would be when presenting the final questionnaire. After the three
respondents completed the questionnaire, they were asked about their thought
processes while they were completing the questionnaire, as well as if they
experienced any problems. The main aim for applying this approach to the study was
to ascertain that the questionnaire could be understood by English and non-English
speaking respondents, as this is in accordance with the multilingual context of the
South African environment. The feedback obtained from these three interviews was
used to refine the questionnaire and included simplifying the language used in the
questionnaire.
Following the initial pre-testing and consequent adjustments and refinements, the
questionnaire was then pilot-tested. Cooper and Schindler (2003:86) indicate that
following a pre-test, the questionnaire should be pilot tested to detect weaknesses in
design and instrumentation, and to determine the reliability of the instrument. It
should draw subjects from the target population and simulate the procedures and
protocols designated for data collection. For the pilot test, a non-probability
judgement sample of respondents was drawn in order to test the reliability of the
questionnaire. The sample employed within the pilot study included 54 residents of
the Lesedi Local Municipality, who did not form part of the sampling frame. This pilot

Chapter 3: Research Methodology 62
study also provided the opportunity to do a trial analysis on coding and tabulating of
the data. The results of this pilot study are reported on in Chapter 4. The same
questionnaire as used in the pilot test, combined with a cover letter (refer to
Annexure A), was then used in the main survey of this study.
3.5 SAMPLING PROCEDURE
In order to give effect to the primary purpose of the study, the procedure followed in
the empirical design is outlined in this section. Figure 3.1 illustrates the steps
followed in the sampling process.
DEFINE THE TARGET POPULATION
DATA COLLECTION METHOD SELECTION
IDENTIFY THE SAMPLING FRAME
SELECT THE SAMPLING METHOD
DETERMINE THE SAMPLE SIZE
SELECT THE SAMPLE ELEMENTS
SAMPLE PLAN EXECUTION
Figure 3.1 Sampling plan procedure (Iacobucci and Churchill, 2010:449)

Chapter 3: Research Methodology 63
3.5.1 Defining the target population
Wiid and Diggines (2009:195) define the target population as the total group of
respondents from whom information is needed. Malhotra (2010:372) reiterates that
the target population is the collection of elements or objects that possess the
information sought and about which inferences are to be made. The target
population selected in this study was the residents of the Emfuleni Local
Municipality.
3.5.2 Data collection method selection
In this research study, the survey method was applied to collect the primary data by
means of a structured questionnaire. The self-administered questionnaire, using the
mall-intercept survey method, was selected as the data collection method. The mall-
intercept survey method involves randomly approaching customers in a central
location. Mall intercepts are especially appropriate when the respondents need to
see, handle, consume or experience the product or service before providing
meaningful information (Malhotra, 2010:793). The Emfuleni Local Municipality was
contacted telephonically and permission to conduct the survey was obtained in
writing from the municipal manager. Thereafter, a hand-delivered self-administering
questionnaire was distributed to the residents of the Emfuleni Local Municipality at
the Vereeniging and Vanderbijlpark pay points. The structured-undisguised design of
the questionnaire conveniently enabled the researcher and two trained fieldworkers
to distribute the questionnaire.
3.5.3 Sampling frame, sampling method and sample size selection
Following defining the target population and deciding on the data collection method,
the next step is to assemble the sample frame. According to Bryman and Bell
(2003:182), a sampling frame is the listing of all units in the population from which
the sample will be selected. Malhotra (2010:373) indicates that the sampling frame
should be a true representation of the target population. The sampling frame applied
in this study comprised the residents of the Emfuleni Local Municipality. From this
sampling frame, a judgement sample of two municipal pay points, namely the
Vereeniging and Vanderbijlpark pay points, was selected. The reasons for choosing
a judgement sample of these two pay points is due to them being the largest to serve

Chapter 3: Research Methodology 64
the residents of the Emfuleni Local Municipality. Thereafter, a convenience sample
of residents of the Emfuleni Local Municipality was selected. Given that this was a
mall intercept, the sampling frame for this study comprised residence that were at
the Vereeniging and Vanderbijlpark pay points on the day that the field work for the
study was undertaken.
Possible sampling methods that may be utilised are divided into two major
categories - probability and non-probability sampling (Wiid & Diggines, 2009:198).
For the purpose of this study, non-probability convenience sampling was used as the
sampling method. A non-probability convenience sampling method was chosen
because it allows a large number of respondents to be reached and because it is
appropriate for a mail-intercept survey (Churchill, 2001:453; Malhotra, 2010:377).
A sample, as defined by Bryman and Bell (2003:182), is a segment of the population
selected for investigation. According to Malhotra (2010:374), the definition of the
sample size is the number of elements to be included in a study. The sample method
employed for this study is a non-probability convenience sample of 400 residents.
3.5.4 Operational procedure for sample element selection
Wiid and Diggines (2009:214) highlight the need to develop a clear guideline and
procedure for the selection of sampling elements. The operational procedures
followed in this study were complete and precise. Wiid and Diggines (2009:214) add
that a number of things can go wrong at the data-gathering stage and, as such,
putting measures in place to minimise or eliminate potential problems is essential.
First, the Municipal Manager of the Emfuleni Local Municipality was contacted in
order to obtain permission to conduct the study. After permission had been obtained,
a non-probability convenience sample of 400 residents of the Emfuleni Local
Municipality was applied.
With the assistance of two trained fieldworkers, the distribution of questionnaires to
the residents at the two pay points, through the course of one week, was
undertaken. The planned operational procedure followed included the fieldworkers,
together with the researcher, distributing questionnaires to potential respondents at
the municipal pay points, and then waiting for the completed questionnaires. In order
to establish cooperation with the municipal personnel, the purpose of the study and

Chapter 3: Research Methodology 65
the estimated duration of data collection process were explained. To encourage
participation by potential respondents, an explanation of the purpose of the study,
the questionnaire instructions and the estimated time for completing the
questionnaire was given. In order to maintain the ongoing goodwill of respondents
for future researchers, the respondents were thanked upon collection of a completed
questionnaire.
Hair et al. (2003:179) warn that there is no best method for selecting potential
respondents, although each respondent must be screened to ensure that they meet
some set of specified criteria for being a suitable respondent. Therefore, in order to
select the sample elements for the survey for this study, a screening question was
asked to determine if the potential respondent was a resident of the Emfuleni Local
Municipal area.
3.5.5 Sample plan execution
Execution of the sampling process requires a detailed specification of how the
sampling design decisions with respect to the population, sampling frame, sampling
unit, sampling techniques and sample size are to be implemented (Malhotra,
2010:375). The sample plan was executed according to the operational procedure
established above.
The target population relevant to the study were residents of communities having
permission to occupy rights to land or other informal status to land within the
Emfuleni Local Municipality, as well as residents currently not having legal status but
paying for services on the land on which they reside. Permission to carry out the
survey at two of the Emfuleni Local Municipality‟s pay points was obtained
telephonically and in writing from the municipal manager. With the assistance of two
trained fieldworkers, using the mall-intercept approach, self-administered
questionnaires were distributed throughout the course of one week to respondents
waiting in line at the Vereeniging and Vanderbijlpark municipal pay points.
Customers waiting in line were asked a screening question to determine if the
potential respondent was a resident of the Emfuleni Local Municipal area.
Thereafter, the purpose of the study, the questionnaire instructions and the
estimated time for completing the questionnaire were explained to each qualifying

Chapter 3: Research Methodology 66
respondent. The respondents were requested to complete the questionnaire while
waiting in line, after which these were collected and respondents were thanked for
their participation. From the sample of 400, 367 completed questionnaires were
received back. This translates into a 92 percent response rate.
The final data obtained from the study was then tabulated and analysed, in order to
draw conclusions and make recommendations. The analysis of the data and
consequent findings are discussed in Chapter 4. The next section will describe the
statistical analysis techniques applied, in order to present the data obtained from the
main survey questionnaire.
3.6 STATISTICAL ANALYSIS
The captured data was analysed using the Statistical Package for Social Sciences
(SPSS), Version 19.0 for Windows, software package. The empirical data sets use
the following statistical methods:
Reliability analysis
Validity analysis
Factor analysis
Descriptive analysis
T-test
The following sections provide a description of these statistical methods.
3.6.1 Reliability analysis
Reliability refers to the extent to which a measurement is consistent and dependable
(Block & Block, 2005:86). According to Malhotra (2010:318), reliability refers to the
extent to which a scale produces consistent results if several measurements are
made. Martin (2005:86) indicate that reliability is an important reflection of the extent
to which the measurements are consistent and dependable, usually over time, and it
is not directly related to validity.
Three major methods assess reliability, namely test-retest, internal consistency and
alternative form.
Chapter 3: Research Methodology 67
Test-retest reliability: Test-retest reliability involves administering a test twice,
on identical or comparable respondents, and comparing the results. The degree
of similarity between the two measurements is determined by computing a
correlation coefficient (Block & Block, 2005:87). There are several problems
associated with the test-retest approach to determining reliability. First, it is
sensitive to the time interval between testing. For example, the longer the time
interval, the lower the reliability. Secondly, the initial measurements may alter the
characteristic being measured. For example, measuring respondents‟ attitude
towards an object may cause them to change their attitude towards that object.
Thirdly, it may be impossible to make repeated measurements. For example, the
research topic may be the respondent‟s initial reaction to a new product
(Malhotra, 2010:319).
Alternative-forms reliability: In alternative-forms reliability testing, two
equivalent forms of the scale are constructed. The same respondents are
measured at two different times, usually two to four weeks apart, with a different
scale form being administered each time. This approach has two problems. First,
it is time consuming and expensive to construct an equivalent form of the scale.
Secondly, it is difficult to construct two equivalent forms of a scale since the two
forms should be equivalent with respect to the content (Malhotra, 2010:319).
Internal consistency reliability: is the ability of an instrument to produce similar
results when used on different samples during the same time-period to measure
a phenomenon, (McDaniel & Gates, 2006:307). The internal consistency method
uses only one administration of an instrument or test to assess the internal
consistency or homogeneity among the items. The instrument is administered
and the results are separated by item into even and odd numbers or into
randomly selected halves (Cooper & Schindler, 2003:239).
For the purpose of this study, the internal consistency reliability was selected; that is,
the Cronbach alpha coefficient. The Cronbach alpha coefficient is the average of all
possible split-half coefficients resulting from different ways of splitting the scale
items. This coefficient has the most utility for multi-item scales at the interval level of
measurement. For the purpose of this study, the application of the internal
consistency method, using the Cronbach coefficient alpha, was deployed. A pilot

Chapter 3: Research Methodology 68
study was conducted before the final study to ascertain its general consistency and
to ensure that all the variables that were employed within the scale were generally
reliable.
3.6.2 Validity analysis
Wiid and Diggines (2009:228) explain that data is valid if the survey measures that
what it is supposed to measure. Martin (2005:85) add that validity represents the
degree to which a measurement reflects the true meaning or true score of the
variable or concept under consideration. Validity is compromised when there is some
source of error or systematic bias in the way the study was conducted or the way a
question was asked. Creswell and Miller (2000:191) indicate that validity is based on
determining whether the findings are accurate from the standpoint of the research.
As with reliability, there are several methods available to assess the validity of a
measuring instrument. For the purpose of this study, face validity, content validity
and construct validity were the estimates of validity selected.
Face validity: Face validity involves the subjective evaluation of the research
instrument by an experienced researcher. Face validity is a simple form of validity
in which a researcher determines if the research instrument seems to measure
what it is intended to measure. Noticeably, face validity only means that the
research instrument appears to be sufficient, it does not mean that the research
instrument has been proven to work. However, in scientific studies, researchers
generally prefer strong evidence because of the elusive nature of measuring
attitudes and other cognitive phenomena, (Zikmund, 2000:282). For the purpose
of this study, in order to ascertain face validity, the questionnaire was perused by
an experienced researcher.
Content validity: Content validity is a non-statistical type of validity that involves
the systematic examination of the test content to determine whether it covers a
representative sample of the behaviour domain to be measured (Pallant, 2010:7).
The determination of content validity alone is not a sufficient measure of the
validity of a scale, yet it aids in a common sense interpretation of the scale
scores. If the measuring instrument contains a representative sample of the
Chapter 3: Research Methodology 69
population of interest, then content validity can be applied (Cooper & Schindler,
2003:233). The questionnaires content validity was determined by requesting two
experienced subject experts to inspect the questionnaire.
Construct validity: Construct validity is a manner of evaluating the specific
measuring instrument in accordance to the theoretical foundations underlying the
theory (Pallant, 2010:7). According to Cooper and Schindler (2006:351),
construct validity consists of convergent and discriminant validity. Construct
validity can be considered only after discriminant and convergent validity have
been established. Convergent validity is measured by determining the extent to
which items within a construct are positively correlated and, therefore, measure
the same thing. Discriminant validity measures the extent to which items within
one construct differ from items in the other constructs from which they are meant
to differ (Malhotra, 2010: 255).
3.6.3 Factor Analysis
Factor analysis and principal component analysis are multivariate statistical methods
designed to explore the correlations between the original variables and create a
smaller set of new artificial variables that can be expressed as a combination of the
original variables (Mazzocchi, 2008:219). Factor analysis is similar to multiple
regression analysis in that each variable is expressed as a linear combination of
underlying factors. The amount of variance the variables share with all the other
variables included in the analysis is referred to as communality and co variation
among the variables, and is described in terms of a small number of a common
factors plus a unique factor for each variable (Malhotra, 2010:638).
In this study, factor analysis was employed to ascertain whether the 22 variables
concluded on the five proposed dimensions. The key statistics associated with factor
analysis used in the study are as follows:
Correlation matrix
Eigenvalue
Factor loadings
Factor matrix

Chapter 3: Research Methodology 70
Percentage of variance
3.6.4 Descriptive analysis
Descriptive analysis enables a researcher to describe and compare variables
numerically. Martin (2005:90) state that most research findings are in the form of
quantitative information, which requires the use of statistics. In this study, descriptive
analysis was used, as the research is quantitative in nature. The first stage of any
analysis is to summarise the responses for each question. The descriptive analysis
or statistics identifies the profile of sample data. These profiles are produced by
condensing large volumes of gathered data on a random variable into a few
summary profile measures, which describe the characteristics of the random variable
(Wegner, 2000:8). Descriptive statistics are used to determine whether the data was
normally distributed and includes measures such as the median, mean, standard
deviation, skewness and kurtosis values.
3.6.4.1 Measures of central tendency
Willemse (1999:44) states that measures of central tendency indicate typical or
middle data points or typical representative figures. For the purpose of this study,
two measures of central tendency, namely the arithmetic mean and the median were
applied.
Arithmetic mean: The mean is used to determine the average value. It is
calculated by taking the accumulated value of a specific variable applied within
an observation and dividing the value by the number of observations employed
within the study (Field, 2011:22).
Median: The median, as a measure of location or central tendency, is the value
that occupies the middle position of a group of numbers in a numerical order.
Therefore, the median is the number of the items that lie above the point and is
equal to the number that lies below it (Wegner, 2000:194).
3.6.4.2 Measures of dispersion
A measure of location or central tendency needs a measurement of dispersion to
add value to the completion of the overall set of data and to emphasise the extent to
Chapter 3: Research Methodology 71
which the data is spread. The measures of dispersion refer to the scatter of the data
points within a set of data (Bryman & Bell, 2003:359). In this study, the standard
deviation was utilised.
Standard deviation: A standard deviation is the square root of a variance. It is a
statistical measure, which expresses the average squared deviations about the
mean in the original units of the random variable in un-squared units of measure
(Wegner, 2000:262).
3.6.4.3 Measures of skewness
According to Pallant (2010:57), descriptive analysis provides information concerning
the distribution of scores on continuous variables, namely skewness and kurtosis.
Pallant (2010:57) states that the skewness value provides an indication of the
symmetry of the distribution. Cooper and Schindler (2003:476) add that skewness is
a measure of a distribution‟s deviation from symmetry. Kurtosis is a final descriptive
statistical measure to describe the behaviour of a random variable, relating to the
„peakedness‟ or „flatness‟ of distribution (Wegner, 2000:273). The degree of
concentration of data around the mode is referred to as the peakedness or kurtosis
of a distribution. According to Willemse (1999:66), the flatter the curve is, the greater
the spread of the data and the larger the standard deviation relative to the mean.
Measures of kurtosis were used in this study to determine whether the normality
assumptions are validated. Descriptive statistics were applied in this study to
determine whether the data were normally distributed and to identify some form of
characteristics on the large sets of data.
3.6.5 T-test
Parametric tests provide inferences for making statements about the means of
parent population. T-tests are used to test the differences between groups or
differences between variables (Malhotra, 2010:504). Once the data has been
summarised, it is vital to interpret it and make inferences about the findings using
significance tests.
This study sought to determine whether customers‟ expectations of municipal service
delivery differed from their perceptions of municipal service delivery. In order to
Chapter 3: Research Methodology 72
determine whether the identified differences were significant, a paired sample t-test
was conducted to determine whether the difference was statistically significant,
whereupon Cohen‟s D-statistic was computed to determine whether the difference
was practically significant. Cohen (1988:79) suggests that if D is 1.0, there is a large
effect between the variables.
3.7 SYNOPSIS
This chapter discussed the methodology used within the empirical portion of this
research study. The formulating of the research objectives and design, data
requirements, the research instrument, developing a sample plan and statistical
analysis procedures were discussed. Chapter 4 that follows, reports on the empirical
research findings of the study in accordance with the research methodology laid out
in this chapter (Chapter 3), thereby providing the foundation from which conclusions
will be drawn and recommendations will be made, in the final chapter (Chapter 5).
The results obtained from the pilot study are discussed in Chapter 4 - these lead the
way for conducting a preliminary data analysis by means of tabulation and coding.
Chapter 4: Analysis and interpretation of empirical findings 73
CHAPTER 4
ANALYSIS AND INTERPRETATION OF EMPIRICAL FINDINGS
4
4.1 INTRODUCTION
The purpose of this chapter is to report on and interpret the empirical findings
of the study. This includes an overview of the results of the pilot study as a
foundation for the results of the main survey, which are reported on in Section
4.2. Different statistical methods were used to analyse the data in the main
survey. Data processing involved the coding and examination of the
descriptive statistics obtained from the analysis. In order to determine whether
the data were normally distributed, the preliminary data was examined. The
preliminary data analysis is found in Section 4.3 of this chapter.
In order to summarise the sample data distribution, descriptive statistics were
calculated. In addition, the data were tested for validity and reliability, and this
is reported on in Section 4.5. The data pertaining to the demographical
information of the respondents are reported on in Section 4.4 of this chapter.
In order to examine the dimensionality of the scales, factor analysis was
conducted and this is reported on in Section 4.6. In Section 4.7, the
descriptive analysis of the data sets is reported on.
Comparisons were made between the customer expectations and perceptions
to determine whether any significant differences existed between the two. The
last section of this chapter, Section 4.8, reports on the results of the
comparative analysis employed to determine if there were any statistical or
practical significant differences between customers‟ expectations and
perceptions of municipal service-quality delivery. Specifically, t-tests were
used.
4.2 PILOT TESTING OF QUESTIONNAIRE
The research instrument applied in this study was adopted from Parasuraman
et al. (1985:41). The SERVQUAL model (refer to Chapter 2 Section 2.4.1)

Chapter 4: Analysis and interpretation of empirical findings 74
was specifically developed to measure service quality and is known to be the
predominant method used for measuring service quality in the service sector.
Malhotra (2010:301) warns that a questionnaire should not be used in the field
survey without adequate pre-testing. As discussed in Chapter 3, the pilot test
was used to test the reliability of the instrument and to check whether the
instructions on the questionnaire were clear and understandable.
For the purpose of this study, the initial questionnaire was subject to pre-
testing, utilising three experienced researchers, and three individuals
receiving municipal services. Following the initial pre-testing and consequent
adjustments and refinements, the questionnaire was then pilot tested on a
non-probability judgement sample of 54 residents of the Lesedi Local
Municipality. Lesedi Local Municipality did not form part of the main survey.
The initial questionnaire consisted of Section A, biographical questions,
Section B, 22 items dealing with customer expectations and Section C, 22
items dealing with customer perceptions. Sections B and C where measured
on a five-point Likert-scale. As a result, of the pilot study, two questions were
rephrased.
The reliability of the research instrument (Sections B and C) was determined
through calculating the Cronbach alpha coefficient for the customers‟
expectations and perceptions. Reliability coefficients of less than 0.50 are
deemed unacceptable (Nunnally, 1978:247), those above 0.70 satisfactory
(Nunnally, 1978:247; Pallant, 2010:97), and coefficients greater than 0.80
good and preferable (Pallant, 2010:97). The results obtained in the pilot study
provided a satisfactory indication of reliability. The five-point scale returned a
Cronbach alpha of 0.860 for customer expectations (Section B) and 0.941 for
customer perceptions (Section C), which exceeded the recommended level of
0.70. The reliability of the scales in the pilot test is presented in Table 4.1.
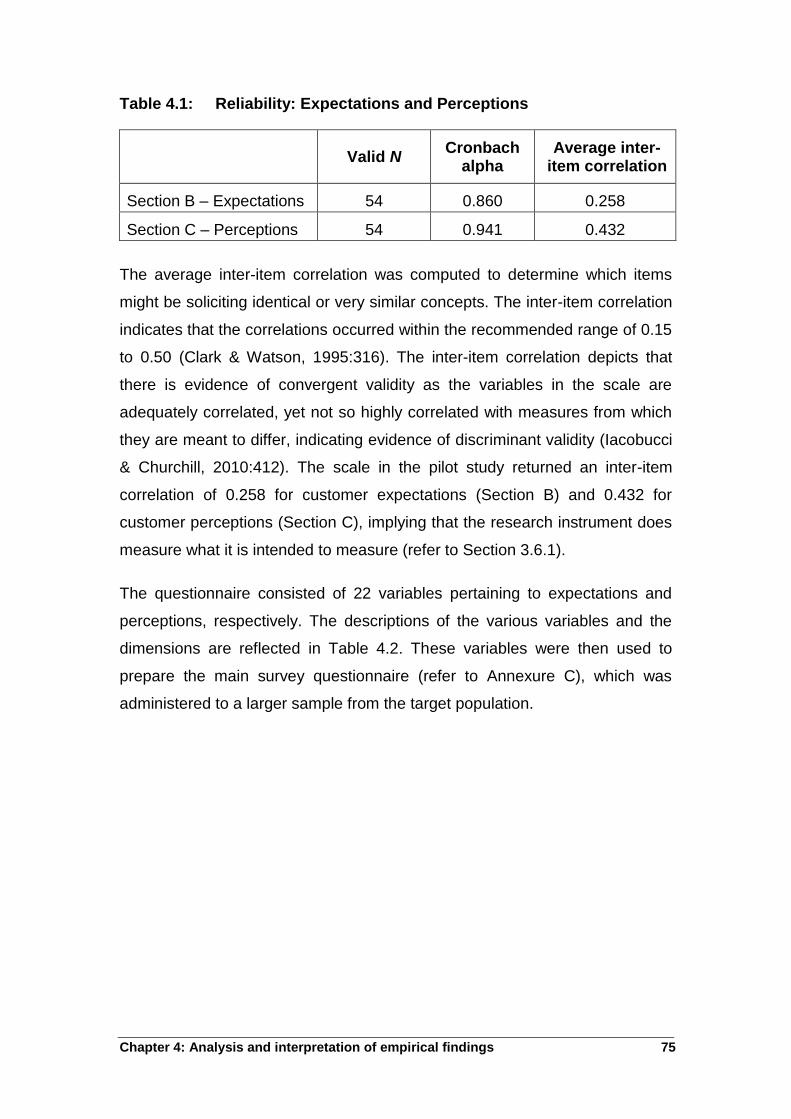
Chapter 4: Analysis and interpretation of empirical findings 75
Table 4.1: Reliability: Expectations and Perceptions
Valid N
Cronbach alpha
Average inter-item correlation
Section B – Expectations 54 0.860 0.258
Section C – Perceptions 54 0.941 0.432
The average inter-item correlation was computed to determine which items
might be soliciting identical or very similar concepts. The inter-item correlation
indicates that the correlations occurred within the recommended range of 0.15
to 0.50 (Clark & Watson, 1995:316). The inter-item correlation depicts that
there is evidence of convergent validity as the variables in the scale are
adequately correlated, yet not so highly correlated with measures from which
they are meant to differ, indicating evidence of discriminant validity (Iacobucci
& Churchill, 2010:412). The scale in the pilot study returned an inter-item
correlation of 0.258 for customer expectations (Section B) and 0.432 for
customer perceptions (Section C), implying that the research instrument does
measure what it is intended to measure (refer to Section 3.6.1).
The questionnaire consisted of 22 variables pertaining to expectations and
perceptions, respectively. The descriptions of the various variables and the
dimensions are reflected in Table 4.2. These variables were then used to
prepare the main survey questionnaire (refer to Annexure C), which was
administered to a larger sample from the target population.
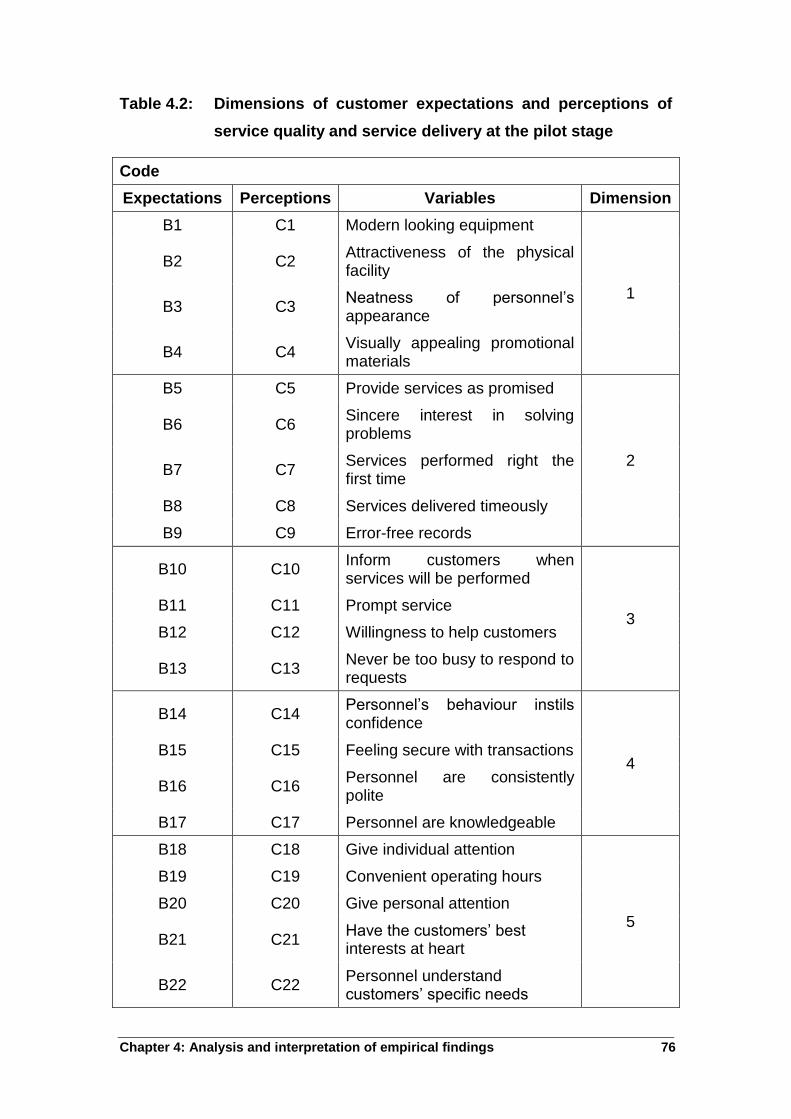
Chapter 4: Analysis and interpretation of empirical findings 76
Table 4.2: Dimensions of customer expectations and perceptions of
service quality and service delivery at the pilot stage
Code
Expectations Perceptions Variables Dimension
B1 C1 Modern looking equipment
1
B2 C2 Attractiveness of the physical facility
B3 C3 Neatness of personnel‟s appearance
B4 C4 Visually appealing promotional materials
B5 C5 Provide services as promised
2
B6 C6 Sincere interest in solving problems
B7 C7 Services performed right the first time
B8 C8 Services delivered timeously
B9 C9 Error-free records
B10 C10 Inform customers when services will be performed
3 B11 C11 Prompt service
B12 C12 Willingness to help customers
B13 C13 Never be too busy to respond to requests
B14 C14 Personnel‟s behaviour instils confidence
4 B15 C15 Feeling secure with transactions
B16 C16 Personnel are consistently polite
B17 C17 Personnel are knowledgeable
B18 C18 Give individual attention
5
B19 C19 Convenient operating hours
B20 C20 Give personal attention
B21 C21 Have the customers‟ best interests at heart
B22 C22 Personnel understand customers‟ specific needs

Chapter 4: Analysis and interpretation of empirical findings 77
4.3 MAIN STUDY: PRELIMINARY DATA ANALYSIS
Prior to analysing a data set, conducting a preliminary data analysis in the
form of coding and tabulation is advisable. The first step in data analysis is to
edit the raw data. According to Malhotra (2010:453), editing is the review of
the questionnaires with the objective of increasing accuracy and precision,
involving screening questionnaires to identify illegible, incomplete,
inconsistent or ambiguous responses. Cooper and Schindler (2003:455) state
that editing detects and corrects, when possible, errors and omissions,
instilling minimum data quality standards.
4.3.1 Coding
According to Cooper and Schindler (2003:456), coding refers to the process of
assigning values to various responses on the research instrument. The
assigned code includes an indication of the column position and data record it
will occupy (Malhotra, 2010:454). In the questionnaire, questions were
classified into three sections: Section A, demographical data, Section B,
customer expectations data and Section C, customer perceptions data. Table
4.3 summarises the variable codes and assigned values of all the sections in
the survey instrument.
Table 4.3: Coding information
Section A: Demographical data
Question Dimension measured Code
Question 1 Gender A1
Question 2 Group A2
Question 3 Age A3
Question 4 Area A4
Question 5 Years of occupancy A5
Question 6 Number of occupants A6
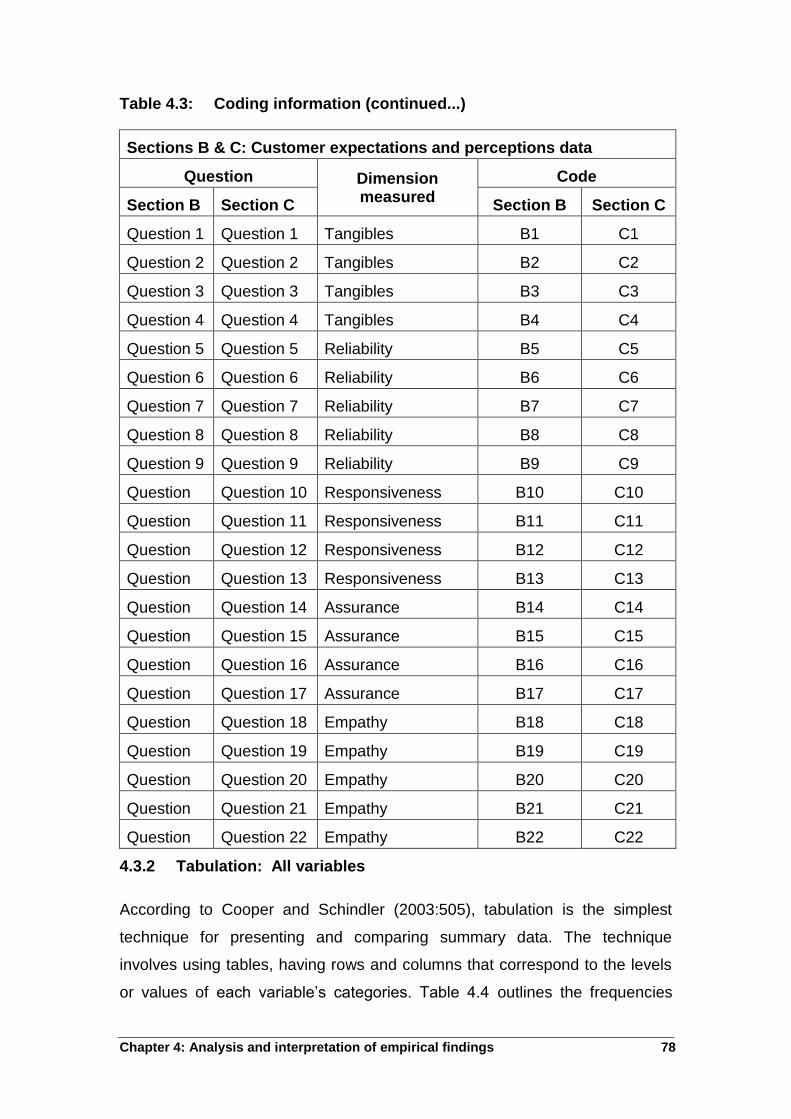
Chapter 4: Analysis and interpretation of empirical findings 78
Table 4.3: Coding information (continued...)
Sections B & C: Customer expectations and perceptions data
Question Dimension measured
Code
Section B Section C Section B Section C
Question 1 Question 1 Tangibles B1 C1
Question 2 Question 2 Tangibles B2 C2
Question 3 Question 3 Tangibles B3 C3
Question 4 Question 4 Tangibles B4 C4
Question 5 Question 5 Reliability B5 C5
Question 6 Question 6 Reliability B6 C6
Question 7 Question 7 Reliability B7 C7
Question 8 Question 8 Reliability B8 C8
Question 9 Question 9 Reliability B9 C9
Question 10
Question 10 Responsiveness B10 C10
Question 11
Question 11 Responsiveness B11 C11
Question 12
Question 12 Responsiveness B12 C12
Question 13
Question 13 Responsiveness B13 C13
Question 14
Question 14 Assurance B14 C14
Question 15
Question 15 Assurance B15 C15
Question 16
Question 16 Assurance B16 C16
Question 17
Question 17 Assurance B17 C17
Question 18
Question 18 Empathy B18 C18
Question 19
Question 19 Empathy B19 C19
Question 20
Question 20 Empathy B20 C20
Question 21
Question 21 Empathy B21 C21
Question 22
Question 22 Empathy B22 C22
4.3.2 Tabulation: All variables
According to Cooper and Schindler (2003:505), tabulation is the simplest
technique for presenting and comparing summary data. The technique
involves using tables, having rows and columns that correspond to the levels
or values of each variable‟s categories. Table 4.4 outlines the frequencies

Chapter 4: Analysis and interpretation of empirical findings 79
pertaining to Section B (B1 to B22) of the questionnaire, which aimed to
measure consumers‟ expectations of the municipal service-quality delivery. A
low score indicates high customer expectations and a high score indicates low
customer expectations of the quality of municipal services delivered.
Table 4.4: Frequency table for customers’ expectations of service
quality in municipal service delivery
Code 1 Strongly
agree
2 Agree
3 Neither
agree nor disagree
4 Disagree
5 Strongly disagree
Dimension 1: Tangibility
B1 215 110 36 5 1
B2 80 241 40 5 1
B3 104 228 27 6 2
B4 109 228 26 4 2
Dimension 2: Reliability
B5 145 190 25 5 2
B6 147 185 30 1 4
B7 152 181 29 1 4
B8 151 178 33 0 5
B9 186 138 36 3 4
Dimension 3: Responsiveness
B10 220 111 29 1 6
B11 80 245 36 2 4
B12 118 210 33 4 2
B13 118 208 34 3 4
Dimension 4: Assurance
B14 145 190 26 3 3
B15 142 187 32 2 4
B16 150 186 27 3 1
B17 151 183 28 1 4

Chapter 4: Analysis and interpretation of empirical findings 80
Table 4.4: Frequency table for customers’ expectations of service
quality in municipal service delivery (continued...)
Code 1 Strongly
agree
2 Agree
3 Neither
agree nor disagree
4 Disagree
5 Strongly disagree
Dimension 5: Empathy
B18 149 191 22 2 3
B19 162 165 35 1 4
B20 154 181 26 4 2
B21 161 178 22 1 5
B22 181 157 23 4 2
Table 4.5 outlines the frequencies pertaining to Section C (C1 to C22) of the
questionnaires, which aimed to measure customers‟ perceptions of the
municipal service-quality delivery in the Emfuleni Municipality. A low score
indicates high customer perceptions and a high score indicates low customer
perceptions of the quality of municipal services delivered by the Emfuleni
Municipality.
Table 4.5: Frequency table for customers’ perceptions of service
quality in municipal service delivery
Code 1 Strongly
agree
2 Agree
3 Neither
agree nor disagree
4 Disagree
5 Strongly disagree
Dimension 1: Tangibility
C1 12 5 72 197 81
C2 5 9 35 156 162
C3 6 8 16 177 160
C4 8 6 18 159 176
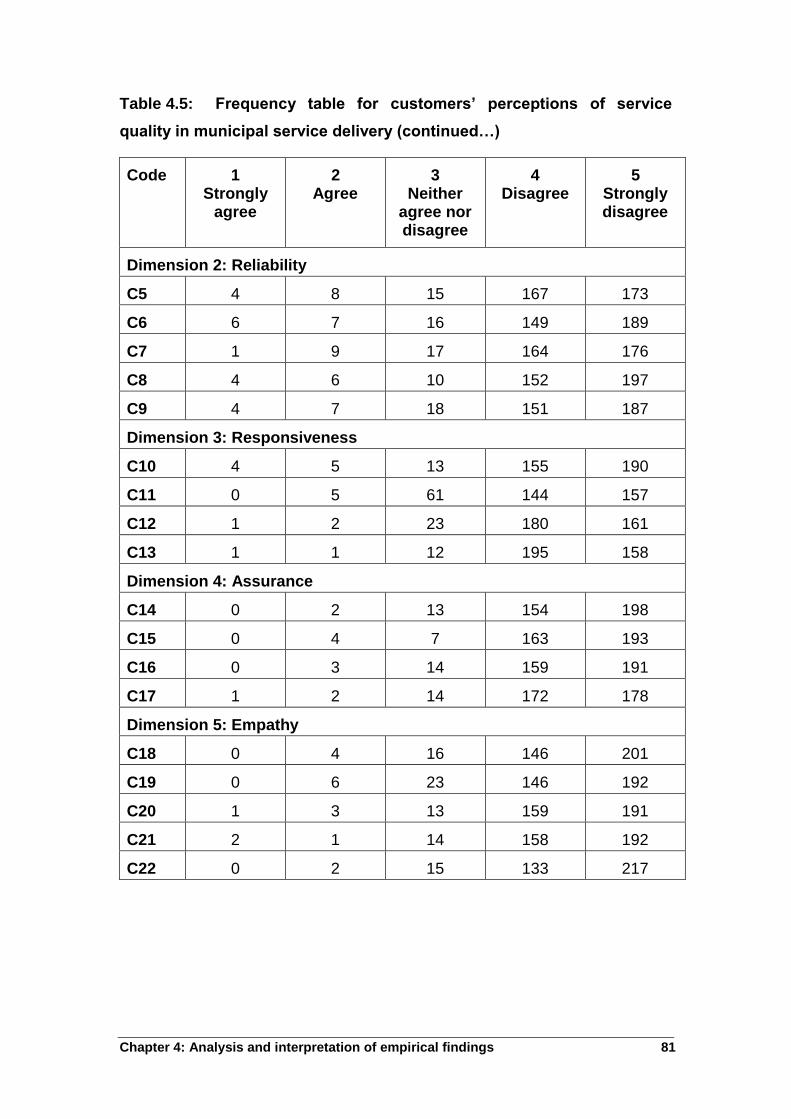
Chapter 4: Analysis and interpretation of empirical findings 81
Table 4.5: Frequency table for customers’ perceptions of service
quality in municipal service delivery (continued…)
Code 1 Strongly
agree
2 Agree
3 Neither
agree nor disagree
4 Disagree
5 Strongly disagree
Dimension 2: Reliability
C5 4 8 15 167 173
C6 6 7 16 149 189
C7 1 9 17 164 176
C8 4 6 10 152 197
C9 4 7 18 151 187
Dimension 3: Responsiveness
C10 4 5 13 155 190
C11 0 5 61 144 157
C12 1 2 23 180 161
C13 1 1 12 195 158
Dimension 4: Assurance
C14 0 2 13 154 198
C15 0 4 7 163 193
C16 0 3 14 159 191
C17 1 2 14 172 178
Dimension 5: Empathy
C18 0 4 16 146 201
C19 0 6 23 146 192
C20 1 3 13 159 191
C21 2 1 14 158 192
C22 0 2 15 133 217

Chapter 4: Analysis and interpretation of empirical findings 82
4.3.3 Data gathering process
Permission to carry out the survey was obtained from the Municipal Manager
of the Emfuleni Local Municipality. Thereafter, in order to obtain the required
sample size of 400 residents, using the mall-intercept approach, a hand-
delivered self-administered questionnaire was distributed with the assistance
of two trained fieldworkers to the residents of the Emfuleni Local Municipality
at the Vereeniging and Vanderbijlpark pay points through the course of one
week. From the sample of 400, 367 completed questionnaires were received
back. This translates into a 92 percent response rate. Classification data
pertaining to the sample group follows.
4.4 DEMOGRAPHICAL INFORMATION
Demographical information, also known as classification information, consists
of demographic and socio-economic characteristics used to classify the
respondents and understand the results (Malhotra, 2010:350). The
biographical statistics of the sample, represented by pie charts, are set out
below.
Section A of the research instrument related to the demographic information
of residents of Emfuleni Local Municipality, including the following:
gender
racial groups
age
residential area
years of living in residence
number of occupants in residence

Chapter 4: Analysis and interpretation of empirical findings 83
Figure 4.1: Gender classification
Figure 4.1 depicts the percentages in terms of the respondents‟ gender. Male
respondents represented the majority of this group with a value of 55 percent.
The female respondents held the minority with 45 percent. The difference of
10 percent indicates a relative even gender distribution.
Figure 4.2: Racial groups

Chapter 4: Analysis and interpretation of empirical findings 84
The results obtained from the respondents concerning their racial groups are
presented in Figure 4.2. The majority of respondents were African (76%),
followed by White (15%). Of the respondents, seven percent were coloured
and one percent Asian. Where respondents marked the category „other‟, it
referred to those not listed in the survey categories, which made up one
percent of the total sample.
Figure 4.3: Age classification
The majority of the respondents in the sample (39%) were between 40 and 49
years old, followed by 29 percent indicating their ages as between 30 and 39
years old. Of the respondents, one percent were 60 years and older, 16
percent were between 50 and 59 years old and 15 percent were younger than
20 years old. Only one respondent failed to indicate his or her age, hence
indicating a 0.30 percent of missing data. These results are illustrated in
Figure 4.3.
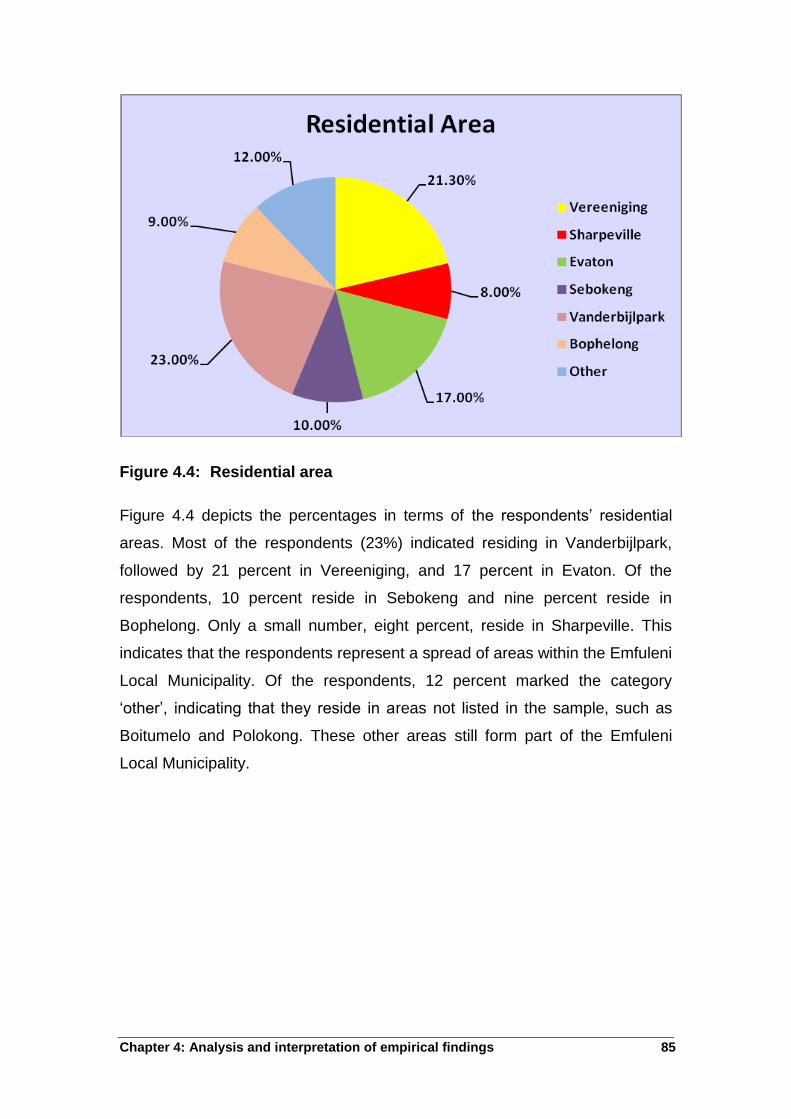
Chapter 4: Analysis and interpretation of empirical findings 85
Figure 4.4: Residential area
Figure 4.4 depicts the percentages in terms of the respondents‟ residential
areas. Most of the respondents (23%) indicated residing in Vanderbijlpark,
followed by 21 percent in Vereeniging, and 17 percent in Evaton. Of the
respondents, 10 percent reside in Sebokeng and nine percent reside in
Bophelong. Only a small number, eight percent, reside in Sharpeville. This
indicates that the respondents represent a spread of areas within the Emfuleni
Local Municipality. Of the respondents, 12 percent marked the category
„other‟, indicating that they reside in areas not listed in the sample, such as
Boitumelo and Polokong. These other areas still form part of the Emfuleni
Local Municipality.

Chapter 4: Analysis and interpretation of empirical findings 86
9.00%
39.00%
37.00%
15.00%
Years of Occupancy
0 - 5 years
6 – 10 years
11 – 20 years
20 years +
Figure 4.5: Years of occupancy
Regarding the years living in current residence, the majority of the
respondents, 39 percent, indicated that they had been staying in their
residence for the last 6 to 10 years. The percentage of respondents staying in
their residence for the last 11 to 20 years amounted to 37 percent, which is
indicative of their experience with dealing with the Emfuleni Municipality.
Furthermore, 15 percent of the respondents indicated occupying their
residence for more than 20 years. The minority of the group, namely nine
percent, have been occupying their residence for five years and less. The
distribution of the number of years of occupying the residence is outlined in
Figure 4.5.

Chapter 4: Analysis and interpretation of empirical findings 87
Figure 4.6: Number of occupants living in residence
Figure 4.6 illustrates the total number of occupants living in the residence. Of
the respondents, 58 percent indicated that 4 to 6 residents share one
residence. Furthermore, the residences with 1 to 3 residents and 7 to 9
residents occupying one residence amounted to 28 percent and 13 percent,
respectively. Only one percent of the respondents indicated occupancy of
more than 10 people in one residence.
The previous section described the biographical information regarding the
sample group of the study. The following section reports on the results of the
reliability and validity measures found within the main survey questionnaire
conducted in this study.
4.5 VALIDITY AND RELIABILITY OF THE SCALE
Reliability and validity analysis were conducted for Section B pertaining to
customer expectations, and Section C pertaining to customer perceptions and
the results are presented in Table 4.6.

Chapter 4: Analysis and interpretation of empirical findings 88
Table 4.6: Reliability analysis: Section B
Expectations Perceptions
Dimensions Number of items
Cronbach alpha
Inter-item correlation
Cronbach alpha
Inter-item correlation
Tangibility 4 0.787 0.485 0.863 0.612
Reliability 5 0.769 0.402 0.820 0.478
Responsivenessss
4 0.818 0.535 0.594 0.273
Assurance 4 0.728 0.402 0.542 0.228
Empathy 5 0.774 0.407 0.657 0.276
Overall Score 22 0.912 0.320 0.884 0.245
The reliability and validity measures for each section and for each of the five
dimensions of service quality within Section B (customers‟ expectations) and
Section C (customers‟ perceptions) of the survey questionnaire are provided
in Table 4.6. The coefficient alpha was first computed to assess the reliability
of the scale. The coefficient varies from zero to one, and values less than 0.50
generally indicates unsatisfactory reliability, while those above 0.70 are
deemed satisfactory (Malhotra, 2010:319).
A Cronbach alpha value of 0.912 was computed for Section B and a
Cronbach alpha value of 0.884 was computed for Section C, which are well
over the recommended value of 0.70. In addition, Cronbach alphas of above
0.50 were computed for each of the individual dimensions in Section B and
Section C, which are deemed satisfactory (Pallant, 2010:98).
In order to test the construct validity, the average inter-item correlation was
computed, which, according to Aaker, Kumar & Day (2004:565), needs to be
between 0.15 and 0.50. An inter-item correlation value of 0.320 was computed
for Section B and 0.245 for Section C. These values indicate that the items in
the scale are both sufficiently correlated to suggest convergent validity, yet not
so highly correlated from measures from which they are intended to differ,
which indicates the presence of discriminant validity (McDaniel & Gates,
2007:262). This implies that the research instrument in the study does
measure what it is supposed to measure (Malhotra, 2010:319), namely the

Chapter 4: Analysis and interpretation of empirical findings 89
customers‟ expectations and perceptions of municipal service-quality delivery
by the Emfuleni Local Municipality.
The average inter-item correlation was then computed for each of the five
dimensions in Section B and Section C. For Dimension 1 (tangibility) it was
computed as 0.485 for Section B and 0.612 for Section C. For Dimension 2
(reliability) it was computed as 0.402 for Section B and 0.478 for Section C.
For Dimension 3 (responsiveness) it was computed as 0.535 for Section B
and for 0.273 for Section C. For Dimension 4 (assurance) it was computed as
0.402 for Section B and 0.228 for Section C. For Dimension 5 (empathy) it
was computed as 0.407 for Section B and 0.276 for Section C. Although inter-
item correlation for Dimension 3 (responsiveness) in Section B, and
Dimension 1 (tangibility) in Section C exceeded the recommended 0.50, it was
only by a marginal amount.
In order to determine the dimensionality of the scale, the data was then
prepared for a confirmatory factor analysis.
4.6 FACTOR ANALYSIS ON COMMUNITY EXPECTATIONS AND
PERCEPTIONS
The appropriate multivariate technique was used in this study to examine the
dimensionality of the scale is factor analysis, as referred to in Chapter 3.
Factor analysis was employed to ascertain whether the 22 variables
concluded on the five proposed dimensions. Confirmatory factor analysis,
using un-rotated principal axis factor analysis, was performed on 22 service
quality variables in order to assess the inter-correlation amongst the scale
component. The factor analysis matrix was rotated using Varimax rotation with
Kaiser Normalisation. This resulted in an easy-to-interpret matrix. The
extraction method of principal component analysis was also used. The aim
was to establish a factor structure which had a sufficient number of variables
in each factor and which gave factors that were usable and definable.
As advised by Iacobucci and Churchill (2010:809), for sample sizes of more
than 100, loadings of greater than 0.30 are appropriate. Therefore, variable

Chapter 4: Analysis and interpretation of empirical findings 90
loadings of 0.40 and above were retained. The key statistics associated with
factor analysis used in the study included a correlation matrix, eigenvalues,
factor loadings, a factor matrix and percentage of variance.
Five factors were extracted, which coincided with the number of
conceptualised dimensions of the SERVQUAL scale. A combination of
techniques was used to determine the number of factors to extract. Initially,
the eigenvalues was used in factor extraction. The eigenvalues hold that the
amount of variation explained by each factor must be greater than one (Aaker
et al., 2004:568). The same procedure was followed in Section B and in
Section C. Eigenvalues was computed for customer expectations and
customer perceptions. The dimension of the scale was examined. Five factors
to be extracted were established. The results of the Eigenvalues are reflected
in Table 4.7, followed by the factor-loading matrix.
Table 4.7: Eigenvalues for the five dimensions: Expectations and
perceptions
Dimension
Initial Eigenvalues
Eigenvalue Percentage of Variance (%)
Cumulative Percentage (%)
1 (Expectations) 7.779 35.357 35.357
2 (Expectations) 1.970 8.953 44.310
3 (Expectations) 1.298 5.902 50.212
4 (Expectations) 1.194 5.425 55.637
5 (Expectations) 1.012 4.599 60.236
1 (Perceptions) 6.545 29.749 29.749
2 (Perceptions) 2.538 11.538 41.287
3 (Perceptions) 1.313 5.970 47.257
4 (Perceptions) 1.165 5.296 52.554
5 (Perceptions) 1.071 4.866 57.420

Chapter 4: Analysis and interpretation of empirical findings 91
Table 4.7 contains information regarding the five possible factors and their
relative explanatory power expressed by their eigenvalues, which clearly
supporting the use of five factors. The eigenvalues hold that the amount of
variation explained by each factor must be greater than one (Iacobucci &
Churchill, 2010:576). In respect of the five dimensions, the eigenvalues
ranged from 7.93 to 1.00. These five factors accounted for 60 percent of the
variance within the variables, which is satisfactory (Malhotra, 2010:604).
Eigenvalues represent the amount of variance in the original variables that is
associated with a factor. When divided by the number of variables, an
eigenvalue yields an estimate of the amount of total variance explained by the
factor (Aaker et al., 2004:568). From the factor analysis, community
expectations and perceptions on municipal service delivery can be
categorised in the following five factors:
Factor 1: Tangibility (items 1 – 4)
Factor 2: Reliability (items 5 – 9)
Factor 3: Responsiveness (items 10 – 13)
Factor 4: Assurance (items 14 – 17)
Factor 5: Empathy (items 18 – 22)
Table 4.8 illustrates the results of the rotated factor analysis on customer
expectations and perceptions on municipal service delivery quality.

Chapter 4: Analysis and interpretation of empirical findings 92
Table 4.8: Rotated factor loadings on community expectations and
perceptions on municipal service delivery
Variable Factor loadings
Factor 1 Factor 2 Factor 3 Factor 4 Factor 5
B1 .575
B2 .796
B3 .800
B4 .567
B5 .554
B6 .410
B7 .611
B8 .694
B9 .734
B10 .550 .579
B11 .705
B12 .778
B13 .735
B14 .559 .450
B15 .596 .465
B16 .768
B17 .601
B18 .608
B19 .480
B20 .615
B21 .706
B22 .652

Chapter 4: Analysis and interpretation of empirical findings 93
Table 4.8: Rotated factor loadings on community expectations and
perceptions on municipal service delivery (continued…)
Variable
Factor loadings
Factor 1 Factor 2 Factor 3 Factor 4 Factor 5
C1 .697
C2 .676
C3 .729
C4 .775
C5 .738
C6 .736
C7 .708
C8 .727
C9 .681
C10 .696
C11 .692
C12 .693
C13 .604
C19 .460
C21 .543
C16 .554
C18 .754
C20 .625
C15 .754
C17 .668
C14 .723
C22 .590
Although five factors emerged from the data as expected, not all the items
loaded on the same factor as in the SERVQUAL scale. The loadings on the
correct factor are indicated by red in the table. The data does not contradict

Chapter 4: Analysis and interpretation of empirical findings 94
the dimensions/factors of the SERVQUAL and therefore the standardised
dimensions/factors from the SERVQUAL will be used for further discussion.
With regard to customer perceptions on service delivery quality, most of items
loaded on one factor (Factor 1). Items for Factor 3 loaded on Factor 2 and
most of the Factor 4 items loaded on Factor 3. Only one of the items that
loaded on Factor 5 is placed correctly. The other item in Factor 5 is a Factor 3
item. Therefore, the standardised dimensions from the SEVQUAL will be used
for further discussion. The following section presents the descriptive statistics
of the data.
4.7 DESCRIPTIVE ANALYSIS
Descriptive statistics provide a broad overview of the profile of responses and
provide insight by giving a set of numeric summary statistical measures
(Wegner, 2000:191). In order to provide such a measure, some numerical
description of the characteristic of a data set is needed. Summary statistics
that are either typical of the data set or best describe it make faster and
improved decisions possible because they eliminate the need to consult
original observations (Wilemse, 1999:43). The following section reports on the
descriptive statistics of this study. In addition, the validity and reliability
measures of the scale are also reported on.
4.7.1 Descriptive statistics pertaining to the dimensions
The descriptive statistics measured in the main survey questionnaire of this
study are presented in Table 4.9. The measures of central tendency and the
measures of dispersion are calculated on the five pre-determined dimensions
of service quality, namely tangibility, reliability, responsiveness, assurance
and empathy, as well as for the gaps between expectations and actual
perceptions for each of the dimensions. The number of the completed
questionnaire is shown as the Valid N in Table 4.9.

Chapter 4: Analysis and interpretation of empirical findings 95
Table 4.9 Descriptive statistics: Total sample
Dimension N Mean Std. Dev
Skewness Kurtosis Inter-item
Cronbach Alpha
Expectations dimensions
Tangibility 367 1.78 .529 1.676 5.048 0.485 0.787
Reliability 367 1.70 .527 2.515 11.435 0.402 0.769
Responsiveness 367 1.77 .574 2.242 8.486 0.535 0.818
Assurance 367 1.71 .522 2.255 9.895 0.402 0.728
Empathy 367 1.67 .515 2.465 10.433 0.407 0.774
Perceptions dimensions
Tangibility 367 4.20 .699 -2.323 7.022 0.612 0.863
Reliability 367 4.39 .5739 -3.085 11.784 0.478 0.820
Responsiveness 367 4.35 .46454
-1.334 2.620 0.273 0.594
Assurance 367 4.47 .39355
-2.369 11.575 0.228 0.542
Empathy 367 4.47 .4153 -2.626 11.728 0.276 0.657
For customer expectations, a low score indicates high customer expectations
and a high score indicates low customer expectations of the quality of
municipal services delivered. For customer perceptions, a low score indicates
high customer perceptions and a high score indicates low customer
perceptions of the quality of municipal services delivered by the Emfuleni
Local Municipality. Although the data set appeared slightly skewed, it was still
within the acceptable parameters of normal distribution.
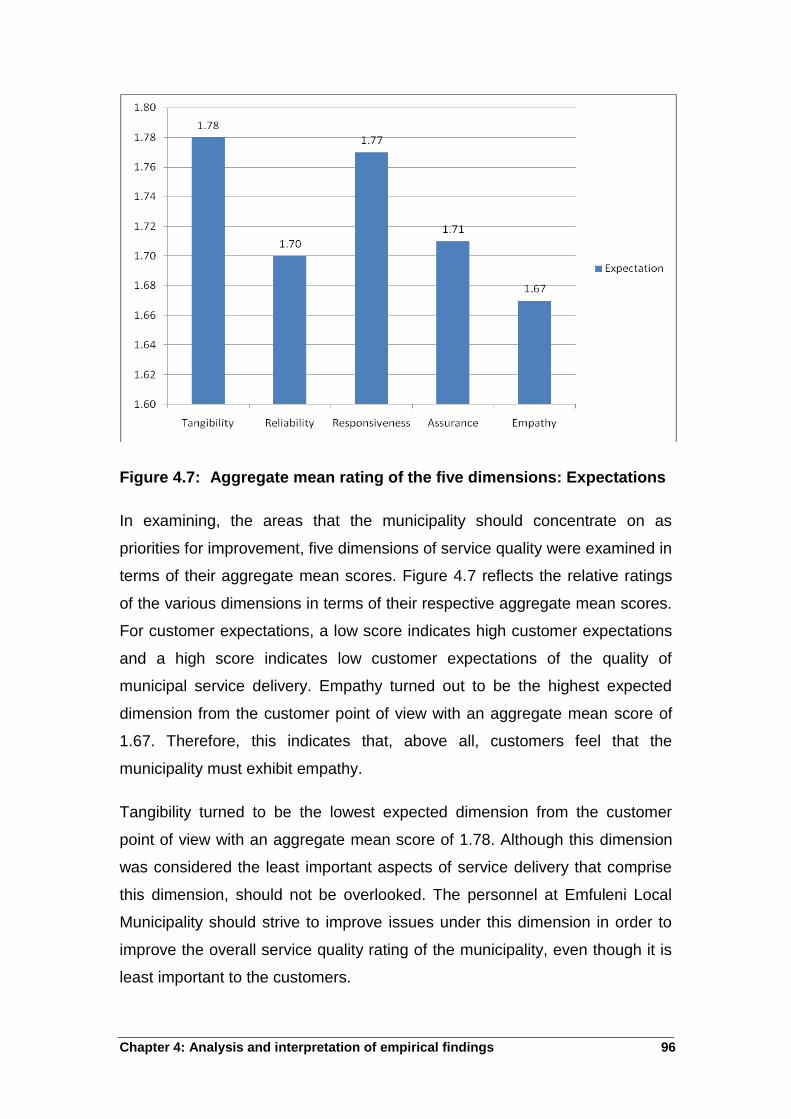
Chapter 4: Analysis and interpretation of empirical findings 96
Figure 4.7: Aggregate mean rating of the five dimensions: Expectations
In examining, the areas that the municipality should concentrate on as
priorities for improvement, five dimensions of service quality were examined in
terms of their aggregate mean scores. Figure 4.7 reflects the relative ratings
of the various dimensions in terms of their respective aggregate mean scores.
For customer expectations, a low score indicates high customer expectations
and a high score indicates low customer expectations of the quality of
municipal service delivery. Empathy turned out to be the highest expected
dimension from the customer point of view with an aggregate mean score of
1.67. Therefore, this indicates that, above all, customers feel that the
municipality must exhibit empathy.
Tangibility turned to be the lowest expected dimension from the customer
point of view with an aggregate mean score of 1.78. Although this dimension
was considered the least important aspects of service delivery that comprise
this dimension, should not be overlooked. The personnel at Emfuleni Local
Municipality should strive to improve issues under this dimension in order to
improve the overall service quality rating of the municipality, even though it is
least important to the customers.

Chapter 4: Analysis and interpretation of empirical findings 97
Figure 4.8: Aggregate mean rating of the five dimensions: Perceptions
Means above 4 were reported on all five dimensions indicating that the
customers of the Emfuleni Local Municipality perceive service delivery quality
as inadequate on all five dimensions. In examining the areas that the
municipality should concentrate on as priorities for improvement, the five
dimensions of service quality were examined in terms of their aggregate mean
scores. Figure 4.8 reflects the relative ratings of the various dimensions in
terms of their respective aggregate mean scores. For customer perceptions, a
low score indicates high customer perceptions and a high score indicates low
customer perceptions of the municipal service delivered by the Emfuleni Local
Municipality.
In terms of perceptions, tangibility turned out to be the highest perceived
dimension from the customer point of view, with an aggregate mean score of
4.20, which is in accordance with customers‟ expectations of tangibility.
Assurance and empathy turned to be the lowest perceived dimensions from
the customer point of view, with an aggregate mean score of 4.47 for both
dimensions. This is in accordance with customers‟ expectations that empathy
is what they rate as the highest expectation in a municipality. Aspects of
service delivery, that comprise these two dimensions, should not be
overlooked.

Chapter 4: Analysis and interpretation of empirical findings 98
Table 4.10: SERVQUAL Gap Score
Dimensions Items Expectations Perceptions Gaps
Mean Std. Dev
Mean Std. Dev
Tangibility 1 1.55 0.75 3.90 0.88 2.35
2 1.93 0.63 4.26 0.83 2.33
3 1.84 0.67 4.30 0.79 2.46
4 1.81 0.65 4.33 0.83 2.52
Reliability 5 1.72 0.69 4.35 0.76 2.63
6 1.72 0.72 4.38 0.80 2.66
7 1.70 0.72 4.38 0.71 2.68
8 1.72 0.74 4.38 0.71 2.66
9 1.64 0.78 4.44 0.73 2.80
Responsiveness 10 1.53 0.79 4.39 0.76 2.86
11 1.92 0.66 4.42 0.74 2.50
12 1.81 0.68 4.23 0.77 2.42
13 1.82 0.72 4.36 0.65 2.54
Assurance 14 1.72 0.70 4.38 0.59 2.66
15 1.74 0.73 4.49 0.59 2.75
16 1.69 0.67 4.49 0.59 2.80
17 1.70 0.71 4.47 0.61 2.77
Empathy 18 1.69 0.68 4.43 0.62 2.74
19 1.69 0.74 4.48 0.63 2.79
20 1.69 0.70 4.43 0.68 2.74
21 1.67 0.72 4.46 0.63 2.79
22 1.61 0.70 4.46 0.64 2.85
In order to determine the service quality of the Emfuleni municipal service
delivery, the SERVQUAL gaps were determined by subtracting customer
perception from customer expectation scores (Q = P-E). The SERVQUAL
score is equal to the perception‟s score minus the expectation‟s score. As
such, a lower score indicates lower customer perception of actual service
delivery. The dimension scores for each respondent were computed by
averaging the gap score over the relevant number of statements (either 4 or 5
statements). Based on the item-by-item analysis (Table 4.10), all of the items

Chapter 4: Analysis and interpretation of empirical findings 99
of perceptions were perceived as negative, as compared to customers‟
expectations. The mean gaps indicate a negative score, representing an
unenthusiastic assessment of municipal service delivery quality. All 22 items
yielded negative gap scores.
Table 4.11 illustrates aspects of service quality that are worth noting as
priorities for improvement by Emfuleni Local Municipality.
Table 4.11: Priorities for improvement
Dimension Item Question/Statement
Reliability 9 Error-free records
Responsiveness 10 Time of performing service
Assurance 15 Customers should feel safe in their dealings with municipality
16 Personnel should be consistently polite to customers
17 Have knowledge to answer customers‟ questions
Empathy 18 Customer individual attention
19 Operating hours convenient to all municipal customers
20 Give customers personal attention
21 Have customers‟ best interests at heart
22 Understand specific needs of their customers
The overall gaps between customers‟ expectations and perceptions are
graphically illustrated in Figure 4.9.

Chapter 4: Analysis and interpretation of empirical findings 100
Figure 4.9: Overall gaps between expectations and perceptions in five
dimensions
In examining the different gaps between expectations and perceptions of the
customer concerning service quality provided by Emfuleni Local Municipality,
the five dimensions of service quality were examined and illustrated in Figure
4.9 in terms of the differences between the dimensions‟ gaps.
After subtracting the overall mean score of customer expectations from the
overall mean score of customer perceptions, there was a large gap between
expectation and perception on the empathy dimension with the gap score of
2.80, followed by the assurance dimension, with the gap score of 2.76. With
regard to the reliability dimension, the gap score was 2.69. For the
responsiveness dimension, a gap score of 2.58was computed, and the lowest
gap score was computed on the tangibility dimension, with the gap score of
2.42.
4.8 TEST OF SIGNIFICANCE
The statistical significance testing of difference of means between customers‟
expectations and perceptions of the five dimensions is outlined in Table 4.12.

Chapter 4: Analysis and interpretation of empirical findings 101
Table 4.12: Difference of means between expectations and perceptions
on the five dimensions
Dimension
N=367
Expectations Perceptions t Sig Cohen’s D
Effect size
Mean Std. Dev.
Mean Std. Dev.
Tangibles 1.78 .529 4.20 .699 -49.850 .000* 3.46 Large
Reliability 1.70 .527 4.39 .574 -66.399 .000* 4.68 Large
Responsiveness 1.77 .574 4.35 .465 -63.669 .000* 4.491 Large
Assurance 1.71 .522 4.47 .394 -78.379 .000* 5.28 Large
Empathy 1.67 .515 4.47 .415 -74.376 .000* 5.44 Large
A paired sample t-test was used to determine whether there is a statistically
significant difference between the sample‟s expectations and perceptions of
the Emfuleni Local Municipality‟s service quality delivery. The significance
level was set at the conventional 5 percent level; that is a=0.05. As is evident
from Table 4.12, statistically significant differences at p<0.05 were recorded
for all five dimensions. Cohen‟s D statistic was then used to assess the
practically significant difference in the means between expectations and
perceptions of the five dimensions. Practically significant differences with a
large effect size were computed between expectations and perceptions on the
five dimensions. Therefore, these differences are real and have practical
implications. It is concluded that the perception‟s gap are much more to the
right-hand side of the scale than the expectation‟s gap. Based on the
dimension-by-dimension analysis, all of the dimensions of perceptions were
perceived as negative as compared to customers‟ expectations. The greatest
difference is for the dimension empathy, followed by the dimension
assurance.
4.9 SYNOPSIS
This chapter reported on the empirical findings of the study. The pilot study
was discussed, including reliability. The coding information was also
discussed. The results of the main survey were then tabulated. The chapter
also provided a statistical overview of the data obtained from the research

Chapter 4: Analysis and interpretation of empirical findings 102
process. The information was analysed and summarised using descriptive
statistics and multivariate measures. Graphic illustrations and tables were
used to explain the results.
The data were tested for reliability, and descriptive statistics were used in the
study, this includes the mean, standard deviation, and frequency distributions.
These were calculated to summarise the sample data distribution. Finally, the
difference between the variables was tested. Cronbach alpha were computed
and factor analysis were loaded in the data. The weighted gap score were
also computed.
The study now progresses to Chapter 5, which will provide a general overview
of the study against the literature review and objective from the previous
chapters. In addition, research questions will be re-examined to determine
whether they have been answered. Furthermore, the final recommendations
and conclusions pertaining to the study will be discussed.

Chapter 5: Conclusion and recommendations 103
CHAPTER 5
CONCLUSION AND RECOMMENDATIONS
5
5.1 INTRODUCTION
Municipalities in South Africa exist primarily for improving the welfare of the
local communities they serve. Local government in South Africa is undividable
from the events that have shaped the South African socio-economic and
political landscape. The South African 1996 Constitution stipulates that all
spheres of government are responsible for ensuring the delivery of basic
services to all South Africans. Local authorities particularly face a massive
task, as there is a huge backlog in access to basic services in South Africa.
Municipalities in South Africa are important role players in service delivery and
are required by law to find innovative methods to involve communities in all
their affairs. Although municipalities face many challenges concerning service
delivery, one of the major concerns among South Africans is slow service
delivery by municipalities. Many municipalities find it challenging to find ways
to accomplish their requirement to deliver quality services to their
communities.
The service sector in South Africa is large, and encompasses a wide variety of
organisations, services and activities. This includes the South African
government, for instance, who is a major service provider. Service
organisations and the marketing of services are a vital part of the South
African economy but this, as opposed to the marketing of physical products,
poses unique challenges for the service marketer because of the unique
characteristics of services, namely intangibility, inseparability, heterogeneity
and perishability. Delivering quality service is essential for the success and
survival of service organisations and, therefore, municipalities need to take
steps to improve the service quality they provide to their customers. In a
turbulent, extremely competitive global business environment, organisations
face considerable pressure to meet or exceed customer expectations by
delivering services that are of the highest quality. The five dimensions of

Chapter 5: Conclusion and recommendations 104
service quality, namely tangibility, reliability, responsiveness, assurance and
empathy are the key drivers of service quality offered to customers (Chapter
2).
In this study, comparisons were made with regard to customer expectations
and perceptions of the service quality offered by Emfuleni Local Municipality
and the results are presented in Section 5.4. In addition, this section includes
a discussion on findings of the research study on different dimensions of
service quality. Section 5.5 outlines the future research opportunities, and this
is set against the overview of the study in Section 5.2 and the contribution
made by the study in Section 5.3.
5.2 OVERVIEW OF STUDY
Based on the input of all previous chapters in this study, a comparison was
made between customer expectations and perceptions on the quality of
municipal services delivered to customers, as presented in Section 2.4. For
additional clarity on the comparison, this section contains an overview of
these inputs.
The purpose of this study was to determine the customer expectations and
perceptions of the quality of municipal service delivered by the Emfuleni Local
Municipality in order to identify potential gaps that may exist. This study
utilised customer-based data to provide actual expectations and perceptions
of quality service, thereby resulting in the dimensions of service quality.
The objectives of the study were stated as follows (refer to Section 1.3):
5.2.1 Primary objective
The primary objective of this study was to measure the community
expectations and perceptions of the quality of municipal services delivered by
the Emfuleni Local Municipality in order to identify potential service quality
gaps.

Chapter 5: Conclusion and recommendations 105
5.2.2 Theoretical objectives
In order to achieve the primary objective, the following theoretical objectives
were formulated for the study:
Outline the fundamental principles of service delivery
Conduct a review of the relevant service quality literature
Outline the importance of service quality in municipalities
Conduct a review of the relevant literature pertaining to the different
service quality models
5.2.3 Empirical objectives
The following empirical objectives were formulated to support the primary and
theoretical objectives:
Measure the community customers‟ expectations of municipal service–
quality delivery in the Emfuleni Local Municipality.
Measure the community customers‟ perceptions of municipal service-
quality delivery in the Emfuleni Local Municipality.
Identify the gaps between community customers‟ expectations and
perceptions of municipal service–quality delivery in the Emfuleni Local
Municipality
Identify priorities for improvement in an attempt to improve service-quality
delivery within the Emfuleni Local Municipality.
The empirical objectives were addressed by investigating and answering the
following research questions:
What are the customers‟ expectations of service-quality delivery by the
Emfuleni Local municipality?
What are the customers‟ perceptions of service-quality delivery by the
Emfuleni Local municipality?

Chapter 5: Conclusion and recommendations 106
What service quality gaps exist in the municipal services delivered by the
Emfuleni Local Municipality?
In accordance with the specified objectives of the study, Chapter 2 addressed
theoretical objectives one and two, which provided a theoretical foundation
describing the service quality literature and the fundamental principles of
service marketing. A literature review pertaining to the various service quality
models and the South African local spheres of government was conducted.
Chapter 3 outlined the methodology of the study and provided an overview of
the data gathering and analysis processes (Section 3.2), together with an
outline of the study‟s data requirements (Section 3.3). The design of the
research instrument was discussed (Section 3.4) and the sampling procedure
was also explained (Section 3.5). This chapter also outlined the statistical
methods used in the empirical study (Section 3.6). Chapter 4 reported on the
empirical findings of the study. The findings indicated a statistical and practical
significant difference between the customers‟ expectations and perceptions of
the quality of services delivered by the Emfuleni Local Municipality.
Chapter 5, as a concluding chapter, provides an overview of the research
conducted in Chapters 1 to 4, with recommendations on how municipalities
can improve service delivery and service quality to their customers.
5.3 CONTRIBUTIONS OF THE STUDY
As a legislative requirement, local government in South Africa is required to
become more entrepreneurial, to be performance orientated, to provide
excellent service to their customers and to be customer-focussed. One
common challenge faced by every municipality is how to service its customers
better. Customers perceive service quality as essential for enhancing their
satisfaction and loyalty. Municipalities need to update and keep abreast of
methods to deliver quality service to their customers continuously. Current
and continuing resource pressures and firm policy directions from central
government give added urgency for local government decision makers to
understand and manage the needs and expectations of their customers, and
to be aware of customers‟ perceptions as they apply to current service quality.

Chapter 5: Conclusion and recommendations 107
The findings of this study are important to the understanding of the service
delivery quality in the municipal context and service organisations in general.
Identifying the differences in customers‟ expectations and perceptions
concerning service-quality delivery by the Emfuleni Local Municipality
contributes to determining the success or failure of customer experiences,
which have significant effects on customer satisfaction. This study provides an
understanding of customers‟ expectations as well as their perceptions,
thereby allowing managerial judgement to be exercised from a position of
knowledge rather than guesswork in the important task of managing public
expectations and resources. Not only will such knowledge facilitate more
informed prioritisation, improved strategic resource allocation and improved
value for money, it will also serve as a platform for providing better services
for citizens, in the sense that the services more closely match customers‟
expectations. This study make a significant contribution by indicating which of
the different service quality dimensions influence customer satisfaction and
providing possible strategies on how municipalities can effectively and
efficiently design their service delivery process, thereby ultimately providing
better customer service. By better understanding customers‟ expectations and
perceptions, municipalities will be better placed to improve service quality. In
highlighting the service quality gaps, this study makes a significant
contribution to aiding in the bridging of the gaps identified.
5.4 RECOMMENDATIONS
The following recommendations are based on the literature review of service
quality together with a statistical analysis of the feedback received from the
customers of the Emfuleni Local Municipality. These recommendations
represent the customers‟ expectations and perceptions of the quality of
services delivered, as well as the service quality gaps identified between
customers‟ expectations and perceptions.
Five dimensions of service quality, namely tangibility, reliability,
responsiveness, assurance and empathy were identified in the literature
portion of the study, which utilised previous empirical studies on the subject.
Section 4.4.1.1 represents these five dimensions.
Chapter 5: Conclusion and recommendations 108
5.4.1 Customer expectations and perceptions
This study indicates that customers of the Emfuleni Local Municipality have
negative perceptions of the quality of services delivered by the municipality,
as customers‟ expectations were not met in the performance of services
delivered. In all of the service quality dimensions, customer expectations differ
from customer perceptions with regard to service quality delivered by the
Emfuleni Local Municipality. Therefore, customers were dissatisfied with the
quality of services delivered on all of the five service quality dimensions. One
of the most important causes for feeling this dissatisfaction could be explained
by the gap theory suggesting that the difference between customers‟
expectations of the expected service, and their assessment of the actual
service received, drive the perception of service quality (Parasuraman et al.,
1985:41). In light of these five dimensions in the overall sample, the following
service quality dimensions require attention in order to increase customer
satisfaction.
5.4.1.1 Dimension 1: Tangibility: Appearance of physical facilities,
equipment, personnel and communication materials
The smallest service quality shortfall was in the tangibility dimension. From
the customers‟ expectations, tangibility ranked the lowest expected dimension
compared to the other dimensions, indicating the least importance of all the
dimensions. From the customers‟ perceptions, tangibility ranked the lowest
perception scores resulting in it being perceived as negative. Coverage of the
content of this dimension includes the following topics (refer to Section
3.4.1.1):
Modern looking equipment
Attractiveness of the physical facility
Neatness of personnel‟s appearance
Visually appealing promotional materials
The smallest discrepancy between customers‟ expectations and perceptions
of the quality of municipal service delivery was in terms of the tangibility

Chapter 5: Conclusion and recommendations 109
dimension. Although this was the smallest gap of all of the five dimensions,
the gap was still large. In terms of tangibility dimension, it is recommended
that the municipality should upgrade the existing infrastructure, provide
sufficient physical facilities, and improve the maintenance of the physical
facilities in order to allow efficient service delivery. In contributing to closing
this gap, personnel should be encouraged to behave more responsively by
using customer names more often, offering greetings, saying „please‟ and
„thank you‟, and providing customers with undivided attention.
5.4.1.2 Dimension 2: Reliability: Ability to perform the promised
service dependable and accurately
After empathy and assurance, the third largest quality shortfall was on the
reliability dimension. From the customers‟ expectations, reliability ranked the
second highest expected dimension compared to the other dimensions,
indicating high expectations. From the customers‟ perceptions, reliability
ranked the third highest perception score, resulting in it being perceived as
negative. The item that recorded the highest gap score for this dimensions
and for all of the items overall, was error-free records, indicating that
customers find this very important. The error-free records item coverage of the
content of this dimension includes the following topics in 3.4.1.2:
Excellent municipalities provide service as promised
Excellent municipalities shows a sincere interest in solving customer
problems
Excellent municipalities get things right the first time
Excellent municipalities provide services at the time they promised to do
so
Excellent municipalities have error-free records
The third largest discrepancy between customers‟ expectations and
perceptions of the quality of municipal service delivery was in terms of the
reliability dimension, which reflects a negative gap in the needs of customers.
Therefore, in order to enhance customer satisfaction, the municipality should

Chapter 5: Conclusion and recommendations 110
focus on closing this gap through implementing various strategies such as
improving collaboration, co-ordination and co-operation between departments,
integrating planning processes between departments, keeping updated
records, up-to-date and modern electronic technology and improving
communication programmes. Ensuring that there are adequate, well-trained
personnel to deliver services timely through providing information accurately
by means of up-to-date information technology is critical to closing this gap.
5.4.1.3 Dimension 3: Responsiveness: Willingness to help
customers and provide prompt service
The fourth largest service quality shortfall was on the responsiveness
dimension. From the customers‟ expectations, responsiveness ranked the
fourth highest expected dimension compared to the other dimensions. From
the customers‟ perceptions, responsiveness ranked the fourth highest scores,
resulting in it being perceived as the fourth most important dimension
pertaining to service quality of municipal service delivery. The item that
recorded the highest gap score for this dimension and the second highest for
all the items overall, was the time of performing the service, indicating that it is
important for customers to know exactly when services will be performed.
Coverage of the content of this dimension includes the following topics in
3.4.1.3:
Personnel at excellent municipalities tell customer exactly when services
will be performed
Personnel at excellent municipalities should give customers prompt
service
Personnel at excellent municipalities should always be willing to help
customers
Personnel at excellent municipalities should never be too busy to respond
to customers‟ request
The fourth largest discrepancy between customers‟ expectations and
perceptions of the quality of municipal service delivery was in terms of the

Chapter 5: Conclusion and recommendations 111
responsiveness dimension reflecting a negative gap in the needs of
customers, which indicates that their customers mistrust the municipality.
Customers indicated that they do not receive services on time and doubted
that they will receive the right service the first time. Although this gap was the
second smallest of all of the five dimensions, the gap itself was still large. In
order to enhance customer satisfaction, the municipality should focus on
closing this gap through implementing various strategies. These should
include continuous management and leadership training for management
team, on-going staff training and motivation, improved collaboration, co-
ordination and co-operation between departments, improved up-ward
communication, up-to-date and modern electronic technology, and employing
qualified personnel who are willing to help.
5.4.1.4 Dimension 4: Assurance: Knowledge and courtesy of
employees and their ability to convey trust and confidence
The second largest service quality shortfall was in the assurance dimension.
From the customers‟ expectations, assurance ranked the third highest
expected dimension compared to the other dimensions, indicating high
expectations. From the customers‟ perceptions, assurance ranked the second
highest, perception scores resulting in this dimension perceived as the second
most important dimension pertaining to service quality of municipal service
delivery. Three items that recorded the highest gap scores for this dimension
were customers should feel safe in their dealings with the municipality,
personnel should be consistently polite to customers and personnel should
have knowledge to answer customers‟ questions. Coverage of the content of
this dimension includes the following topics in 3.4.1.4:
Behaviour of personnel at excellent municipalities should make customer
feel confident
Customers should feel safe in their dealings with excellent municipalities
Personnel at excellent municipalities should be consistently polite to
customers

Chapter 5: Conclusion and recommendations 112
Personnel at excellent municipalities should have the knowledge to answer
customers‟ questions
The second largest discrepancy between customers‟ expectations and
perceptions of the quality of municipal service delivery was in terms of the
assurance dimension, which reflects a negative gap in the needs of
customers. Therefore, in order to enhance customer satisfaction, the
municipality should focus on closing this gap through implementing various
strategies, such as employing the right people in the right positions,
developing and continuously providing staff training and motivation, providing
personalised and courteous service, improving service recovery, product
knowledge and sensitivity expressed towards the needs of customers. In
contributing to closing this gap, personnel dealing directly with customers
should be empowered to provide service recovery as stipulated and
previously agreed upon by management.
5.4.1.5 Dimension 5: Empathy: The caring, individualised attention
the municipality provides to each customer
The largest service quality shortfall was in the empathy dimension. From the
customers‟ expectations, empathy ranked the highest expected dimension
compared to the other dimensions, indicating high expectations. From the
customers‟ perceptions, empathy ranked the highest perception scores,
resulting in it being perceived as the most negative of all the dimensions.
Coverage of the content of this dimension includes the following topics in
3.4.1.5:
Excellent municipalities should give customers individual attention
Excellent municipalities should have operating hours convenient to all their
customers
Excellent municipalities should have personnel who give customers
personal attention
Excellent municipalities should have the customers‟ best interests at heart

Chapter 5: Conclusion and recommendations 113
The personnel at excellent municipalities should understand the specific
needs of their customers
The largest discrepancy between customers‟ expectations and perceptions of
the quality of municipal service delivery was in terms of the empathy
dimension, which reflects a negative gap in the needs of customers.
Therefore, in order to enhance customer satisfaction, the municipality should
focus on closing this gap through implementing various strategies such as
providing individual customer attention, providing personalised and courteous
service, being sensitive towards customer‟s needs, employing qualified
personnel who are empathetic, providing continuous staff training and
motivation, and having convenient operating hours.
5.4.2 Recommended implementation approach
Municipalities in South Africa should be aware of their customers‟
expectations and perception of service quality, as evaluated in this study. The
findings of the study indicate that from the customers‟ perspective
expectations and perceptions should be taken into account when
municipalities deliver services. Driven by these differences in expectations
and perceptions of service delivery and service quality, Emfuleni Local
Municipality is increasingly required to redefine its role, strengthen its
customer focus as the core value of the organisation, and build integrated
service delivery models based on meeting customer needs more efficiently
and more effectively.
The municipality must also ensure the encouragement of active participation
by the community on the municipal decision-making processes, from strategy
formulation and design, through to execution. Based on the five SERVQUAL
dimensions, the survey instrument was used to measure the gap between
customers‟ expectations for excellence and their perceptions of actual service
delivered. Recommendations for closing these gaps in order to allow efficient
service delivery include increasing marketing research, upgrading and
maintaining the physical facilities, improving collaboration, co-ordination and
co-operation between departments, keeping up-dated records, improving

Chapter 5: Conclusion and recommendations 114
communication programmes, having management and leadership training for
management team, training and motivating staff, and recruiting qualified
personnel who are willing to help.
5.5 FUTURE RESEARCH OPPORTUNITIES
The study has evaluated customer expectations and perceptions on municipal
service delivery and service quality and identified the gaps that exist in service
quality. Future research may be undertaken to complement the findings of this
study by developing the service delivery model that municipalities can employ
to deliver the required services. The study was confined to the Emfuleni Local
Municipality. Future research should be expanded to all local municipalities
throughout South Africa.
Future research should be undertaken on customer satisfaction and service
quality improvement. This study found that there is a significant different
between the five service quality dimensions regarding customer‟ expectations
and perceptions of service quality. Therefore, further research involving an in-
depth analysis of the reasons why customer expectations and perceptions
differ, especially regarding the dimension on empathy should be conducted.
5.6 CONCLUDING REMARKS
The significant problem worldwide is the failure of the municipalities to deliver
quality of services expected. Typically, municipalities focus on projects and
administration rather than their customers. Greater emphasis should be
placed on providing customers with required service at the time they need it.
To keep customers satisfied, municipalities have to find unique ways of
providing a service that will boost customers‟ morale.
Municipalities are under increasing pressure to demonstrate that their services
are customer-focused. Given the financial and resource constraints under
which municipalities are managed, it is important that customer expectations
are properly understood and measured, and that from the customers‟
perspective, any gaps in service quality are identified. This will help
Chapter 5: Conclusion and recommendations 115
municipalities to prioritising which gaps to focus on, and identify ways of
closing service quality gaps.

Bibliography 116
BIBLIOGRAPHY
AAKER, D.A., KUMAR, V. & DAY, G.S. 2004. Marketing research. 8th ed.
New York: Wiley. 565 p.
ACTS see SOUTH AFRICA.
AFRICAN DEVELOPMENT BANK. 2000. African Development Report. New
York: Oxford University Press. 29 p.
AFRICAN DEVELOPMENT BANK. 2000. African Development Report. New
York: Oxford University Press. 29 p.
ASMAH-ANDOH, K. 2009. Implementation of developmental local
government for alleviating poverty and inequality. Journal of Public
Administration, 44(1):100-110. [Sabinet Online, SA ePublications, Full
Display : http://www.sabinet.co.za] [Date of access: 6 June 2011].
BARNES, J.G. 2001. Secrets of customer relationship management. New
York: McGraw-Hill. 52 p.
BATESON, J.E.G. 1995. Managing service marketing: text and readings.
5th ed. Fort Worth: Dryden Press. 50 p.
BATESON, J.E.G. & HOFFMAN, K.D. 2011. Services marketing:
international edition. 4th ed. Canada: South Western Cengage Learning. 277
p.
BERRY, L.L., ZEITHAML, V.A. & PARASURAMAN, A. 1985. Quality counts
in services too. Business Horizons, 28(3):44-52. [In Science Direct, Full
Display : http://www.sciencedirect.com] [Date of access: 30 June 2010].
BEVAN-DYE, A.L. 2005. Identifying Internet marketing principles relevant to
generic marketers. Vanderbijlpark: PU vir CHO. (Thesis – PhD) 218 p.
BITNER, M.J. & HUBBERT, A.R. 1993. Encounter satisfaction versus overall
satisfaction versus quality: the customer‟s voice. (In Rust, R.T. & Oliver, R.L.,

Bibliography 117
ed. 1993. Service quality: new directions in theory and practice. London:
Sage. p. 77-94).
BLOCK, M.P. & BLOCK, T.S. 2005. Business-to-business: marketing
research. 2nd ed. Mason: Thomson South Western. 83 p.
BOLTON, R.N. & DREW, J.H. 1991. A multistage customers‟ assessments
of service quality and value. Journal of Consumer Research, 17(4):375-384.
BORINS, S. 2001. Public management innovation: toward a global
perspective. American Review of Public Administration, 31(1): 5-21. [In Sage
Journal, Full Display : http://online.sagepub.com] [Date of access: 27 January
2011].
BOSHOFF, C. & DU PLESSIS, F. 2009. Services Marketing: a
contemporary approach. Juta: Pretoria. 5 p.
BOSHOFF, C. & MAZIBUKO, E.N. 2008. Measuring customer satisfaction
with a municipality‟s waste management service: a preliminary instrument.
Management dynamics, 17(2): 14-26. [Sabinet Online, SA ePublications, Full
Display : http://www.sabinet.co.za] [Date of access: 6 January 2011].
BOULDING, W., KALRA, A., STAELING, R. & ZEITHAML, V.A. 1993. A
dynamic process model of service quality: from expectations to behavioural
intentions. Journal of Marketing Research, 30(1):7-27. [In EBSCOHost :
Business Source Premier, Full Display : http://www.sa.ebsco.com] [Date of
access: 23 June 2010].
BRACE, I. 2008. Questionnaire design: how to plan, structure and write
survey material for effective marketing research. 2nd ed. London: Kogan
Page. 76 p.
BRINK, A. & BERNDT, A. 2004. Customer relationship management and
customer service. Pretoria: Juta. 60 p.
BROOKS, R.F., LINGS, I.N. & BOTSCHEM, M.A. 1999. Internal marketing
and customer driven waterfronts: The Service Industry Journal, 19(4): 49-67.

Bibliography 118
BROWN, S.W., FISK, R.P. & BITNER, M.J. 1993. Tracking the evolution of
the service marketing literature. Journal of Retailing, 69(1):78-103. [In
Science Direct, Full Display : http://www.sciencedirect.com] [Date of access:
30 January 2010].
BRYMAN, A. & BELL, E. 2003. Business research methods. 2nd ed. New
York: Oxford University Press. 273 p.
BUTTLE, F. 1996. SERVQUAL: review, critique, research agenda.
European Journal of Marketing, 30(1):8-32. [In MCB – Emerald Online, Full
Display : http://www.emerald-library.com] [Date of access: 25 March 2011].
CHAKRAPANI, C. 1998. How to measure service quality and customer
satisfaction: the informal field guide for tools and techniques. Chicago: South
Western Educational Publications. 172 p.
CHURCHILL, G. A. 2001. Basic marketing research. 4th ed. Ohio:
Thompson Learning. 453 p.
CHURCHILL, G.A. & IACOBUCCI, D. 2002. Marketing research:
Methodological foundations. 8th ed. USA: South-Western. Thomson Learning.
449 p.
CHURCHILL, G.A. & SUPRENANT, C. 1982. An investigation into the
determinants of customer satisfaction. Journal of Marketing Research,
19(4):491-504.
CLARK, L.A. & WATSON, D. 1995. Construct validity: basic issues in
objective scale development. Psychological assessment, 7(3):309-316.
COHEN, J.W. 1988. Statistical power analysis for the behavioral sciences.
2nd ed. Hillsdale: Lawrence Erlbaum Associates Publishers. 79 p.
CONSTITUTION see SOUTH AFRICA.
COOK, S. 2002. Customer care excellence: how to create an effective
customer focus. 4th ed. London: Kogan Page. 86 p.

Bibliography 119
COOPER, D.R. & SCHINDLER P.S. 2006. Marketing research. McGraw-
Hill. Irwin: New York. 351 p
COOPER, D.R. & SCHINDLER, P.S. 2003. Business research methods. 8th
ed. New York: McGraw-Hill. 252 p.
CRAM, T. 2001. Customers that count. London: Pearson Education Limited.
266 p.
CRESWELL, J.W. & MILLER, D.L. 2000. Determining validity in qualitative
inquiry. Theory into practice. 39 (3): p 124-191.
CRICK, A.P. & SPENCER, A. 2011. Hospitality quality: new directions and
new challenges. International Journal of Contemporary Hospitality
Management, 23(4):463-478. [In MCB – Emerald Online, Full Display :
http://www.emerald-library.com] [Date of access: 2 December 2011].
CROCKER, J., POTAPCHUCK, W. & SCHECHTER, W. 1998. Systems
reform and local government: improving outcomes for children, families and
neighborhoods (working paper / program for community problem solving).
Washington: Program Community Problem Solving. 17 p.
CURRY, A. & SINCLAIR, E. 2002. Assessing the quality of physiotherapy
services using Servqual. International Journal of Health Care Quality
Assurance, 15(5):197-205. [In MCB – Emerald Online, Full Display :
http://www.emerald-library.com] [Date of access: 12 January 2011].
CURTIS, D. 1999. Performance management for participatory democracy:
thoughts on the transformation process in South African local government.
International Journal of Public Sector Management, 12(3):260-273. [In MCB –
Emerald Online, Full Display : http://www.emerald-library.com] [Date of
access: 22 November 2010].
DE VILLIERS, A. & KALEMA, R. 2005. Challenges and opportunities for
local government development with reference to the Polokwane Municipality
in the Limpopo Province of South Africa. Journal of Public Administration,

Bibliography 120
40(1):78-90. [Sabinet Online, SA ePublications, Full Display :
http://www.sabinet.co.za] [Date of access: 12 July 2011].
DENHARDT, J. V. & DENHARDT, R.B. 2003. The new public service:
serving, not steering. New York: M.E. Sharpe. 123 p.
DEPARTMENT OF LOCAL AND PROVINCIAL GOVERNMENT see SOUTH
AFRICA.
DEPARTMENT OF PUBLIC SERVICE AND ADMINISTRATION see SOUTH
AFRICA
DHURUP, M. 2003. Consumer perceptions of supermarket service quality:
scale development, measurement and validation. Vanderbijlpark: PU vir
CHO. (Thesis – PhD) 66 p.
DORSCH, J.J., YASIN, M.M. & CZUCHRY, A. 1997. Application of root
cause analysis in a service delivery operational environment: a framework for
implementation. International Journal of Service Industry Management, 8(4):
268-289. [In MCB – Emerald Online, Full Display : http://www.emerald-
library.com] [Date of access: 13 January 2011].
DOUGLAS, T. J., FREDENDALL, L.D. 2004. Evaluating the Deming
management model of total quality in services. Decision Science, 35(3):393-
423. [In MCB – Emerald Online, Full Display : http://www.emerald-
library.com] [Date of access: 21 January 2011].
DU PLESSIS, P.J., ROUSSEAU, G.G. & BLEM H. 1995. Buyer behaviour:
strategic marketing applications. Halfway House: Southern Book Publishers.
p. 255.
ESMAN, M.J. 1997. “Good governance and devolution of power” in Africa
Notes. May. 1-3.
FARNHAM, D. & HORTON, S. 1996. Managing the new public services.
London: Macmillan Press. 25 p.

Bibliography 121
FIELD, A. 2011. Discovering statistics using SPSS. 3rd ed. London: Sage.
22 p.
FISK, R.P., BROWN, S.W. & BITNER, M.J. 1993. Tracking the evolution of
the services marketing literature. Journal of Retailing, 69(1): 61-103. [In
Science Direct, Full Display : http://www.sciencedirect.com] [Date of access:
30 March 2011].
FRIEDMAN, L.G. 2002. Go-to market strategy: advanced techniques and
tools for selling more products, to more customers, more profitably. Boston:
Butterworth-Heinemann. 78 p.
FROST, F.A. & KUMAR, M. 2000. INTSERVQUAL-an internal adaptation of
the GAP model in a large service organisation. Journal of Service Marketing,
14(5): 358-386. [In MCB – Emerald Online, Full Display : http://www.emerald-
library.com] [Date of access: 21 January 2011].
GABBOTT, T. & HOGG, G. 1998. Consumer and service. England: Wiley.
26 p.
GALL, M.D., BIRG, W.R. & GAKK, J.P. 1996. Educational research: An
introduction. 6th ed. White plain, NY: Longman. p 289.
GEORGE, R. 2011. Marketing tourism in South Africa. 4th ed. Cape Town:
Oxford University Press. 25 p.
GHOBADIAN, A., SPELLER, S., & JONES, M. 1994. Service quality
concepts and models. International Journal of Quality & Reliability
Management, 11(9):43-66.
GRAYTHORNE, D.L. 2006. Municipal administration: the handbook.
Kenwyn: Juta. 119 p.
GRŐNROOS, C. 2000. Service management and marketing: a customer
relationship approach. 2nd ed. New York: John Wiley and Son. P. 89.

Bibliography 122
GROTH, J.C. & DYE, R.T. 1999. Service quality: guidelines for marketers.
Managing Service Quality, 9(5): 337-351. [In MCB – Emerald Online, Full
Display : http://www.emerald-library.com] [Date of access: 10 January 2011].
HAIR, J.F., BUSH, R.P. & ORTINAU, D.J. 2003. Research marketing. New
York: McGraw-Hill. 450 p.
HARRIS, E. 2007. Customer service: a practical approach. Upper Saddle
River: Prentice Hall. 16 p.
HART, T., RYAN, C. & ZILLE, H. 1995. Building policy skills in South Africa:
A resource document on policy analysis. Johannesburg: Centre for
Development Enterprise. 5 p.
HEMSON, D. 2004. South African‟s poverty by numbers. Mail and Guardian:
10-11, 25 June.
HU, H.Y., CHIU, S.I., CHENG, C.C. & HSIEH, Y.F. 2010. A study on
investigating patient satisfaction of medical centers using Taiwan customer
satisfaction index in Taiwan. Africa. Journal of Business Management, 4(14):
3207-3216.
IACOBUCCI, D. & CHURCHILL, G.A. 2010. Marketing research :
methodological foundations. 10th ed. Mason: South Western Cengage
Learning. 223 p.
JABNOUN, N. & KHALIFA, A. 2005. A customized measure of service
quality in the UAE. Managing Service Quality, 15(4):374-88. [In MCB –
Emerald Online, Full Display : http://www.emerald-library.com] [Date of
access: 14 February 2011].
JAISWAL, A.K. 2008. Customer satisfaction and service quality measurement
in Indian call centres. Managing service quality, 18(4): 405-416. [In MCB –
Emerald Online, Full Display : http://www.emerald-library.com] [Date of access:
10 January 2011].
Bibliography 123
JAMAL, A. & ANASTASIADOU, K. 2009. Investigating the effects of service
quality dimensions and expertise on loyalty. European Journal of Marketing,
43(3/4):398-420. [In MCB – Emerald Online, Full Display : http://www.emerald-
library.com] [Date of access: 14 February 2011].
JAYAWARDHENA, C. & FARRELL, A.M. 2011. Effects of retail employees‟
behaviours on customers‟ service evaluation. International Journal of Retail &
Distribution Management, 39(3): 203-217. [In MCB – Emerald Online, Full
Display : http://www.emerald-library.com] [Date of access: 18 December 2011].
JENKINS, K.J. 1992. Service quality in the skies. Business Quarterly. 57(2):
13-18. [In Sage Journal, Full Display : http://online.sagepub.com] [Date of
access: 14 February 2011].
KOTLER, P. 2000. Marketing management: the millennium edition. 6th ed.
Upper Saddle River: Prentice Hall. 36 p.
KOTLER, P. 1999. Marketing management: analysis, planning,
implementation and control. New Jersey: Prentice Hall. 97 p.
KRUGER, V. 2001. Main schools of TQM: the big five. 13(3):146-155.
KURTZ, D.L. & CLOW, K.E. 1998. Services marketing. New York: Wiley.
105 p.
LEWIS, B.R. & MITCHELL, V.W. 1990. Defining and measuring the quality of
customer service. Marketing Intelligence and Planning, 8(6):11-17. [In MCB –
Emerald Online, Full Display : http://www.emerald-library.com] [Date of access:
2 February 2011].
LEWIS, R.C. & BOOMS, B.H. 1983. The marketing aspects of service
quality. (In Berry, L., Shostack, G. & Upah, G. eds. 1983. Emerging
perspectives on services marketing. Chicago: American Marketing p. 99-
107).
LUCAS, R.W. 2005. Customer service: building successful skills for the
twenty-first century. 3rd ed. New York: McGraw-Hill. 67 p.

Bibliography 124
MALHOTRA, N.K. 2010. Marketing research: an applied orientation, 6th ed.
Upper Saddle River: Pearson. 255 p.
MARTIN, S.J. 2005. Public service improvement: current developments and
future research agendas. Local Government Studies. 31 (5): p 531-540.
MARTINS, J.H., LOUBSER, M.G. & VAN WYK, H. DE J. 1996. Marketing
Research: a South African approach. Pretoria: Unisa Press. 232 p.
MAVHIVHA, E. 2003. Leadership and governance perspectives in local
government administration in South Africa: Limpopo province. Pretoria:
University of Pretoria. (Thesis – PhD) 195 p.
MAZZOCCHI, M. 2008. Statistics for marketing and consumer research.
London: SAGE. 219 p.
MCDANIEL, C. & GATES, R. 2007. Marketing research essentials. 6th ed.
New York: Wiley. 262 p.
MCDANIEL,C. & GATES, R. 2006. Marketing research: the impact of the
Internet. 7th ed. New York: Wiley. 328 p.
McDANIEL,C.J.R. & GATES, R. 2002. Marketing research: The impact of the
internet, 5th ed. South Western. Thomson. 328 p.
MCKNIGHT, S. 2009. Bridging the gap between service provision and
customer expectations. Performance Measurement and Metrics, 10(2):79-93.
[In MCB – Emerald Online, Full Display : http://www.emerald-library.com]
[Date of access: 10 January 2011].
MINTROM, M. 2003. Market organizations and deliberative democracy:
choice and voice in public service delivery. Administration & Society, 35
(1):52-81. [In Sage Journal, Full Display : http://online.sagepub.com] [Date of
access: 27 January 2011].
MNCWANGO, Z.R. 2004. A sustainable delivery approach for peri-urban and
rural areas. Durban: University of Kwazulu-Natal. (Dissertation – M.Sc) 151 p.

Bibliography 125
NAIDOO, G. 2009. Corporate governance: essential guide for the South
African companies. 2nd ed. Pretoria: Juta. 104 p.
NAIDOO, G. 2005. A transformative African leadership and governance
framework to improve public service delivery in South Africa. Journal of
Public Administration: Conference proceedings: 102-117. [Sabinet Online, SA
ePublications, Full Display : http://www.sabinet.co.za] [Date of access: 12
March 2011].
NEALER, E. & RAGA, K. 2007. Nature and extetd of local governance in
South Africa. Journal of Public Administration: Conference proceedings,
42(5):171-182. [Sabinet Online, SA ePublications, Full Display :
http://www.sabinet.co.za] [Date of access: 12 July 2011].
NEWMAN, K. 2001. Interrogating SERVQUAL: a critical assessment of
service quality measurement in a high street retail bank. International Journal
of Bank Marketing, 19(3):126-39. [In MCB – Emerald Online, Full Display :
http://www.emerald-library.com] [Date of access: 10 January 2011].
NGUBANE, M.B. 2005. An evaluation of service delivery at Endondakusuka
Local Municipality. Durban: University of Zululand. (Thesis – PhD). 78 p.
NICOLAIDES, A. & GOVENDER, K., ed. 2003. Service quality excellence:
an operational guide to customer care. Johannesburg: Helderkruin. 7 p.
NOONE, B.M. & NAMASIVAYAM, K. 2010. Examining the application of six
sigma in the service exchange. Managing Service Quality, 20(3):273-293. [In
MCB – Emerald Online, Full Display : http://www.emerald-library.com] [Date of
access: 14 February 2011].
NUNNALLY, J.C. 1978. Psychometric Theory. 2nd ed. New York: McGraw-
Hill. 247 p.
NUZVIDZIWA, V.N. 2001. Making a difference: African traditions, cultural
values and leadership. Social Anthropology and Sociology Department,
National University of Lesotho. Paper presented to the leadership project
IEMS, Maseru.

Bibliography 126
NYECK, S., MORALES, M., LADHARI, R. & PONS, F. 2002. 10 years of
service quality measurement: reviewing the use of the SERVQUAL
instrument. Cuadernos de Diffusion, 7(13):101-107.
OOI, K.B., LIN, B., TAN, B.I. & CHONG, A.Y.L. 2011. “Are TQM practices
supporting customer satisfaction and service quality?”. Journal of Services
Marketing, 25 (6): 410-490.
OSBORNE, D.E., & PLASTRICK, P. 1997. Banishing Bureaucracy: the five
strategies for reinventing government. Reading: Addison Wesley. 28 p.
OXFORD DICTIONARY OF CURRENT ENGLISH. 1996. New York: Oxford
University Press. 551 p.
PALLANT, J. 2010. SPSS survival manual. 4th ed. New York: McGraw-Hill.
53 p.
PALMER, A. 2011. Principal of services marketing. 6th ed. Berkshire:
McGraw-Hill. 7 p.
PARASURAMAN, A. BERRY, L.L. & ZEITHAML, V.A. 1991. Refinement and
reassessment of the SERVQUAL scale. Journal of Retailing, 67(4):420-450.
PARASURAMAN, A., GREWAL, D. & KRISHNAN, R. 2004. Marketing
research. Boston: Houghton Mifflin Company. 47 p.
PARASURAMAN, A., ZEITHAML, V.A. & BERRY, L.L. 1988. SERVQUAL: a
multiple-item scale for measuring perceptions of service quality. Journal of
Retailing, 64(1):12-40.
PARASURAMAN, A., ZEITHAML, V.A. & BERRY, L.L. 1985. Conceptual
model of service quality and its implications for future research. Journal of
marketing, 49:41-50.
PIERCY, N. & RICH, N. 2009. Lean transformation in the pure service
environment: the case of the call service centre. International Journal of
Operations & Production Management, 29(1):54-76.

Bibliography 127
PRETORIUS, D. & SCHURINK, W. 2007. Enhancing service delivery in local
government: the case of a District Municipality. SA Journal of Human
Resource Management, 5(3):19-29. [In SAJHRM, Full Display :
http://www.sajhrm.co.za] [Date of access: 23 June 2011].
REDDY, P.S. 1996. Readings in local government management and
development: a Southern African perspective. Kenwyn: Juta. 51 p.
ROBINSON, S. 1999. Measuring service quality: current thinking and future
requirements. Journal of Marketing Intelligence & Planning, 17(1):21-32. [In
MCB – Emerald Online, Full Display : http://www.emerald-library.com] [Date of
access: 14 February 2011].
ROBINSON, S. 1999. Measuring service quality: current thinking and future
requirements. Journal of Marketing Intelligence & Planning, 17(1):21-32. [In
MCB – Emerald Online, Full Display : http://www.emerald-library.com] [Date of
access: 14 February 2011].
RODRIGUEZ, I., BONAR, D. & SACCHI, M. 2011. Microseismic record de-
nosing using a sparse time-frequency transform: 81 International Conference,
SEG, Expanded Absracts. 633 p.
RODRIGUEZ, P. G., VAZQUEZ BURGUETE, J.L., VAUGHAN, R. &
EDWARDS, J. 2009. Quality dimensions in the public sector: municipal
services and citizen‟s perception. International Review on Public and Non-
profit Marketing, 6(1):75-90. [In IRPNM, Full Display :
http://www.springerlink.com] [Date of access: 2 January 2011].
SANTOS, J. 2002. From intangibility to tangibility on service quality
perceptions: a comparison study between consumers and service providers in
four service industries. Managing Service Quality, 12(5):292-302. [In MCB –
Emerald Online, Full Display : http://www.emerald-library.com] [Date of
access: 6 2011].
SAUNDERS, M., LEWIS, P. & THORNHILL, A. 2009. Research methods for
business students. 5th ed. Upper Saddle River: Prentice Hall. 296 p.
Bibliography 128
SAYEDA, B., RAJENDRAN, C. & LOKACHARI, P.S. 2010. An empirical
study of total quality management in engineering educational institution of
India: perspective of management. Benchmarking: An International Journal,
17(5):728-767. [In MCB – Emerald Online, Full Display : http://www.emerald-
library.com] [Date of access: 26 February 2011].
SCHACTER, M. 2000. Evaluation Capacity Development. Sub-Saharan
Africa: Lessons from experience in supporting sound governance. ECD
Working Paper Series, No. 7 February. World Bank Operations Evaluations
Department. 8 p.
SCHIFFMAN, L.G. & KANUK, L.L. 2007. Consumer behavior. 9th ed.
Upper Saddle River: Prentice Hall. 152 p.
SETH, N. & DESHMUKH, S.G. 2005. Service quality models: a review.
International Journal of Quality & Reliability Management, 22(9):913-949.
SHEMWELL, D.J., YAVAS, U. & BILGIN, Z. 1998. Customer service provider
relationships: an empirical test of a model of service quality, satisfaction and
relationship oriented outcome. International Journal of Service Industry
Management, 9(2):155-168. [In MCB – Emerald Online, Full Display :
http://www.emerald-library.com] [Date of access: 26 February 2011].
SKALEN, P. & FOUGERE, M. 2007. Be(com)ing normal – not excellent:
service management, the gap-model and disciplinary power. Journal of
Organisational Change Management, 20(1):109-125. [In MCB – Emerald
Online, Full Display : http://www.emerald-library.com] [Date of access: 2
December 2010].
SMITH, A.M. 1990. Quality aspects of services marketing. Journal of
Marketing Intelligence & Planning, 8(6):25-32. [In MCB – Emerald Online, Full
Display : http://www.emerald-library.com] [Date of access: 9 November 2010].
SOUTH AFRICA (Republic). 2003. Towards a ten year review. Pretoria:
Government Printer.
Bibliography 129
SOUTH AFRICA (Republic). 2000. Local Government: Municipal Systems
Act, 2000 (Act No. 32 of 2000). Pretoria: Government Printer.
SOUTH AFRICA (Republic). 1998. Local Government: Municipal Structures
Act, 1998 (Act No. 117 of 1998). Pretoria: Government Printer.
SOUTH AFRICA (Republic). 1998. White Paper on Local Government, 1998.
Pretoria: Government Printer. 37 p.
SOUTH AFRICA (Republic). 1996. Constitution of the Republic of South
Africa Act, 1996 (Act No. 108 of 1996). Pretoria: Government Printer.
SURESHCHANDAR, G.S., RAJENDRAN, C. & ANANTHARAMAN, R.N.
2002. The relationship between service quality and customer satisfaction: a
factor specific approach. Journal of Services Marketing, 16(4):363-379. [In
MCB – Emerald Online, Full Display : http://www.emerald-library.com] [Date of
access: 9 November 2010].
SVENSSON, G. 2004. Interactive Service quality in service encounters:
Empirical illustration and models. Managing service quality. 14(4) 278-287.
THERON, D.P., BOTHMA, C.H. & DU TOIT M.N. 2003. Focusing on
customer service in Southern Africa. Helderkruin: Red Pepper Books. 3 p.
TUCKMAN, B.W. 1994. Conducting educational research. 4th ed. Fort Worth:
Harcourt Brace College Publishers. p. 548.
UKENS, L.L. 2007. 101 Ways to improve customer service: training tools,
tips, and techniques. San Francisco: Wiley. 51 p.
VAN DER WAL, R.W.E., PAMPALLIS, A. & BOND, C. 2002. Service quality
in a cellular telecommunications company: a South African experience.
Managing Service Quality, 12(5):323-335. . [In MCB – Emerald Online, Full
Display : http://www.emerald-library.com] [Date of access: 12 March 2011].
VAN DER WALDT, G. 2004. Managing performance in the public sector:
concepts, considerations and challenges. Paarl: Juta. 2 p.

Bibliography 130
VAN RENSBURG, L.J.J. 1994. Basic concepts in education. Doornfontein:
Orion. 504 p.
WANG, Y., HING-PO, L. & YANG, Y. 2004. An integrated framework for
service quality. Customer value and satisfaction: evidence from China‟s
telecommunication industry. Information Systems Frontiers, 6(4):325-40. [In
MCB – Emerald Online, Full Display : http://www.emerald-library.com] [Date of
access: 2 December 2010].
WEGNER, T. 2000. Quantitative methods for marketing decisions. Pretoria:
JUTA. 8 p.
WHITE, M.D. & ABELS, E.G. 1995. Measuring service quality in special
libraries: lessons from service marketing. Special Libraries, 86(1):36-45.
WIID, J.W. & DIGGINES, C. 2009. Marketing research. Pretoria: Juta. 176
p.
WILLEMSE, I. 1999. Statistical methods & financial calculations. 2nd ed.
Pretoria: Juta. 44 p.
WILSON, A., ZEITHAML, V.A., BITNER, M.J. & GREMLER, D.D. 2008.
Services marketing. London: McGraw-Hill. 86 p.
WISNIEWSKI, M. & STEWART, D. 2001. Using the statutory audit to support
continuous improvement in Scottish local authorities: International Journal of
Public Sector Management, 7(3):540-55
WISSINK, H.F. 1999. Understanding municipal government and
administration. Pretoria: Vista University. p. 78. (Study manual MNA5001).
WOLF, J. 1997. Client needs and quality of life: Journal of Psychiatric
rehabilitation. 20(4):416-425.
WOODRUFFE, H. 1995. Services marketing: financial times. Salford: Pitman
Publishing. 105 p.

Bibliography 131
WRIGHT, R.E. 1995. Logistic regression. (In Grimm, L.G. & Yarnold, P.R.
eds. Reading and understanding multivariate statistics. Washington:
American Psychological Association. p. 9.).
WU, W.Y., BAI, C. & GUPTA, O.K. 2009. An appraisal system for monitoring
performance of convenience stores in Taiwan. Journal of Industrial
Enginnering, 20 (2): 163-177. November.
YASIN, M.M., ALAVI, J., KUNT, M., ZIMMERER, T.W. 2004. Total quality
management (TQM) practices in service organizations: an exploratory study
into the implementation, outcome and effectiveness. Managing Service
Quality, 14(5):377-89. [In MCB – Emerald Online, Full Display :
http://www.emerald-library.com] [Date of access: 18 February 2011].
ZEITHAML, V. BERRY, L.L. & PARASURAMAN, A. 1993. The nature and
determinants of customer expectations of service. Journal of the Academy of
Marketing Science, 21(1):1-12. [In Sage Journal, Full Display :
http://online.sagepub.com] [Date of access: 27 January 2011].
ZEITHAML, V.A., BITNER, M.I. & GREMLER, D.D. 2008. Services
marketing: integrating customer focus across the firm. 5th ed. London:
McGraw-Hill. 111 p.
ZEITHAML, V.A., PARASURAMAN, A. & BERRY, L.L. 1990. Delivering
quality service: balancing customer perceptions and expectations. New York:
Free Press. 16 p.
ZEITHML, V.A. & BITNER, M.J. 2000. Service Marketing 2nd ed. New York:
McGraw-Hill. p. 256.
ZIKMUND, W.G. 2000. Business research methods. 6th ed. Forth Worth:
Dryden Press. 282 p.

Annexure A 132
ANNEXURE A
COVER LETTER

Annexure A 133
North West University Vaal Triangle Campus Private Bag X 1174 VANDERBIJLPARK 1900 30 November 2010
Dear Respondents I am conducting a research project as part of the requirements for completing my MCom: Business Management. The purpose of this research project is to evaluate the community expectations and perceptions of the municipal service delivery: A case study in the Emfuleni Local Area. It would be greatly appreciated if you could assist me by completing the attached questionnaire. The questionnaire is user-friendly and should take approximately 10 minutes to complete. Completion of the questionnaire should be done anonymously to ensure the objectiveness of the results. After completion of the questionnaire, please give it back to the fieldworker. I guarantee that the responses will remain confidential and will only be used for the purpose of this study. Your assistance and contribution will be highly appreciated. Yours faithfully ANNIE M. MOLETSANE

Annexure B 134
ANNEXURE B
SURVEY QUESTIONNAIRE – SECTION A

Annexure B 135
Community Expectations and Perceptions of Municipal Service Delivery:
A Case Study in the Emfuleni Local Area
Section A: Demographical information
Please mark each question with a cross (X).
1. Gender: Male Female
1 2
2. Designated group: White 1 African 2
Coloured 3 Asian 4
Other
(specify): 5
3. Age: Younger than 20
20 – 29 30 – 39 40 – 49 50 – 59 60 +
1 2 3 4 5 6
4. Residential Area: Vereeniging 1 Sharpeville 2
Evaton 3 Sebokeng 4
Vanderbijlpark 5 Bophelong 6
Other
(specify): 7
5. Years of living in residence: 0 – 5 years
6 – 10 years
11 – 20 years
More than 20 years
1 2 3 4
6. Number of occupants in residence:
1 – 3 4 – 6 7 – 9 More than 10
occupants
1 2 3 4

Annexure C 136
ANNEXURE C
SURVEY QUESTIONNAIRE – SECTIONS B & C

Annexure C 137
Section B: Expectations of an excellent municipality
Please mark each question with a cross (X).
Based on your experiences as a customer of a municipality, please indicate
your expectations of service quality and service delivery by indicating whether
you agree or disagree with each of the following statements. There are no
right or wrong answers, just your opinion as to what would make an excellent
municipality.
Str
ong
ly
Ag
ree
Ag
ree
Ne
ith
er
Ag
ree
nor
Dis
agre
e
Dis
agre
e
Str
ong
ly
Dis
agre
e
1 Excellent municipalities should have modern looking equipment
1 2 3 2 5
2 The physical facilities at excellent municipalities should be attractive
1 2 3 2 5
3 Personnel at excellent municipalities should be neat in appearance
1 2 3 2 5
4 Materials associated with the service (such as pamphlets or statements) should be clear and attractive at excellent municipalities
1 2 3 2 5
5 When excellent municipalities promise to do something by a certain time they should keep to that promise
1 2 3 2 5
6 When a customer has a problem, excellent municipalities should show a sincere interest in solving it
1 2 3 2 5
7 Excellent municipalities should get things right the first time
1 2 3 2 5
8 Excellent municipalities should provide their services at the time they promise to do so
1 2 3 2 5
9 Excellent municipalities will have error-free records
1 2 3 4 5
10 Personnel at excellent municipalities should tell customer exactly when services will be performed
1 2 3 4 5

Annexure C 138
Str
ong
ly
Ag
ree
Ag
ree
Ne
ith
er
Ag
ree
nor
Dis
agre
e
Dis
agre
e
Str
ong
ly
Dis
agre
e
11 Personnel at excellent municipalities should give customers prompt service
1 2 3 4 5
12 Personnel at excellent municipalities should always willing to help customers
1 2 3 4 5
13 Personnel at excellent municipalities should never be too busy to respond to customers‟ requests
1 2 3 4 5
14 The behaviour of personnel at excellent municipalities should make customers feel confident
1 2 3 4 5
15 Customers of excellent municipality should feel safe in their dealings with the municipality
1 2 3 4 5
16 Personnel at excellent municipalities should be consistently polite to customers
1 2 3 4 5
17 Personnel at excellent municipalities should have the knowledge to answer customers‟ questions
1 2 3 4 5
18 Excellent municipalities should give customers individual attention
1 2 3 4 5
19 Excellent municipalities should have operating hours convenient to all their customers
1 2 3 4 5
20 Excellent municipalities should have personnel who give customers personal attention
1 2 3 4 5
21 Excellent municipalities should have the customers‟ best interests at heart
1 2 3 4 5
22 The personnel of excellent municipalities should understand the specific needs of their customers
1 2 3 4 5

Annexure C 139
Section C: Perceptions of the Emfuleni municipality
Please mark each question with a cross (X).
The following set of statements relate to your perceptions about the Emfuleni
Local municipality. Crossing a 5 means that you strongly disagree that the
municipality has this feature and crossing a 1 means that you strongly agree.
You may cross any of the numbers in the middle that show how strong you
feelings or perceptions are.
Str
ong
ly
Ag
ree
Ag
ree
Ne
ith
er
Ag
ree
nor
Dis
agre
e
Dis
agre
e
Str
ong
ly
Dis
agre
e
1 The Emfuleni municipality has modern looking equipment
1 2 3 4 5
2 The physical facilities at the Emfuleni municipality are attractive
1 2 3 4 5
3 Personnel at the Emfuleni municipality are neat in appearance
1 2 3 4 5
4 Materials associated with the service (such as pamphlets or statements) are clear and attractive from the Emfuleni municipality.
1 2 3 4 5
5 When the Emfuleni municipality promises to do something by a certain time they keep that promise
1 2 3 4 5
6 When a customer has a problem, the Emfuleni municipality shows a sincere interest in solving it
1 2 3 4 5
7 The Emfuleni municipality gets things right the first time
1 2 3 4 5
8 The Emfuleni municipality provides their services at the time they promised to do so
1 2 3 4 5
9 The Emfuleni municipality have error-free records
1 2 3 4 5
10 Personnel at the Emfuleni municipality tell customers exactly when services are performed
1 2 3 4 5

Annexure C 140
Str
ong
ly
Ag
ree
Ag
ree
Ne
ith
er
Ag
ree
nor
Dis
agre
e
Dis
agre
e
Str
ong
ly
Dis
agre
e
11 Personnel at the Emfuleni municipality give customers prompt service
1 2 3 4 5
12 Personnel at the Emfuleni municipality are always willing to help customers
1 2 3 4 5
13 Personnel at the Emfuleni municipality are never too busy to respond to customers‟ requests
1 2 3 4 5
14 The behaviour of personnel at the Emfuleni municipality makes customers feel confident
1 2 3 4 5
15 Customers of the Emfuleni municipality feel safe in their dealings with the municipality
1 2 3 4 5
16 Personnel at the Emfuleni municipality are consistently polite to customers
1 2 3 4 5
17 Personnel at the Emfuleni municipality have the knowledgeable to answer customers‟ questions
1 2 3 4 5
18 The Emfuleni municipality gives customers individual attention.
1 2 3 4 5
19 The Emfuleni municipality have operating hours convenient to all their customers
1 2 3 4 5
20 The Emfuleni municipality have staff members who give customers personal attention
1 2 3 4 5
21 The Emfuleni municipality have the customers‟ best interests at heart.
1 2 3 4 5
22 Personnel at the Emfuleni municipality understand the specific needs of their customers
1 2 3 4 5
THANK YOU!