Community Driven Reconstruction in Lofa County …mh2245/FHW/FHW_final.pdfCommunity‐Driven...
47
Community‐Driven Reconstruction in Lofa County IMPACT ASSESSMENT December 2008 James Fearon Macartan Humphreys Jeremy Weinstein Stanford University Columbia University Stanford University
Transcript of Community Driven Reconstruction in Lofa County …mh2245/FHW/FHW_final.pdfCommunity‐Driven...

Community‐Driven Reconstruction in Lofa County
IMPACT ASSESSMENT
December 2008
James Fearon Macartan Humphreys Jeremy Weinstein
Stanford University Columbia University Stanford University

i
Executive Summary
We describe the results of an evaluation of a DFID‐funded community‐driven reconstruction (CDR) program implemented by the International Rescue Committee (IRC) in post‐conflict northern Liberia. The CDR project had a multiplicity of goals: to improve material well‐being, reinforce democratic political attitudes, and increase social cohesion. Our evaluation finds powerful evidence that the program was successful in increasing social cohesion, some evidence that it reinforced democratic political attitudes and increased confidence in local decision making procedures, but only weak evidence that material well‐being was positively affected. There is essentially no evidence of adverse effects. Attempts to find out whether programs of this type actually improve community cohesion and reinforce democratic practices face two major challenges. First, there is a selection problem: if programs are implemented in communities that have greater (or weaker) cohesion or are already more or less democratic than comparison groups, a comparison of outcomes will lead to inaccurate estimates of program effects. Second, there is a measurement problem: democratic political attitudes and patterns of social cooperation are very difficult to measure, in contrast to outcomes like educational attainment and health status. Moreover, there is a concern that communities exposed to CDR may be more likely to provide survey responses that indicate support for democracy, less community tension, and greater collective efficacy even if there has been no underlying change in attitudes and behavior. The evaluation described here responds to both of these challenges. The selection problem is resolved through a randomization process in which villages were selected to receive CDR through public lotteries. This approach ensures that program (“treatment”) villages and comparison (“control”) villages are alike in all respects except for the CDR intervention itself. It provides a solid basis for making causal claims regarding the efficacy of the project. The measurement problem is resolved by combining standard survey methodologies with tools developed in behavioral economics to examine actual patterns of cooperation in partially controlled interactions. Results from the panel survey of households – conducted before and after the CDR project – provide evidence largely consistent with the CDR project having had a positive impact on beneficiary communities. Survey data suggest that the program reduced social tension, increased the inclusion of marginalized groups, and enhanced individuals’ trust in community leadership. The survey evidence is much weaker that the program positively reinforced support for democracy, had an impact material well‐being or resulted in an increased ability of the community to act collectively and provides no evidence that the attitudes of traditional leaders towards decision making was affected in any way.
ii
The behavioral measures reinforce the survey results in a powerful way. Measures of cohesion are generated by examining the actual behavior of almost 2000 community members in collective action problems facing their communities in both program and comparison areas. The results provide strong evidence that the CDR program did alter patterns of social cooperation and reinforced support for democratic practices, even after the program’s conclusion. Villages exposed to the IRC’s CDR program were found to exhibit higher subsequent levels of social cooperation than those in the control group and to employ more democratic practices for community decision‐making, as measured through a community‐wide public goods game. We believe that this is first time a CDR project of this form has been evaluated with a randomized control trial. We are sure that this is first time a CDR evaluation has attempted to assess change in actual behavior – as opposed to changes in survey responses – concerning community governance and ability to cooperate to provide public goods. The evidence of positive program impact, and absence of evidence of negative impact in measured areas, is thus considerably stronger than previous evaluation work done on CDR programming.

iii
CONTENTS
1 INTRODUCTION: PURPOSE OF RESEARCH AND METHODOLOGY ................................................................. 1
1.1 COMMUNITY‐DRIVEN RECONSTRUCTION .................................................................................................................. 1 1.2 COMMUNITY‐DRIVEN RECONSTRUCTION IN LIBERIA .................................................................................................... 2 1.3 HYPOTHESES ....................................................................................................................................................... 4 1.4 METHODOLOGY ................................................................................................................................................... 5 1.5 MEASUREMENT STRATEGY ..................................................................................................................................... 6
1.5.1 Waves I and II: Panel Survey .................................................................................................................. 6 1.5.2 Wave III: Behavioral Outcomes .............................................................................................................. 7
2 FINDINGS FROM THE PANEL SURVEY ......................................................................................................... 9
2.1 MATERIAL WELFARE ........................................................................................................................................... 10 2.1.1 Access to Amenities ............................................................................................................................. 10 2.1.2 Livelihoods ........................................................................................................................................... 12
2.2 GOVERNANCE .................................................................................................................................................... 15 2.2.1 Attitudes about Governance ................................................................................................................ 15 2.2.2 Attitudes of Leaders ............................................................................................................................. 16 2.2.3 Individual Efficacy ................................................................................................................................ 17 2.2.4 Trust in Community Decision Making Procedures ............................................................................... 18
2.3 SOCIAL COHESION .............................................................................................................................................. 20 2.3.1 Social Acceptance ................................................................................................................................ 20 2.3.2 Social Tensions ..................................................................................................................................... 21 2.3.3 Collective Efficacy ................................................................................................................................ 23
3 FINDINGS ON BEHAVIORAL OUTCOMES ................................................................................................... 25
3.1 SOCIAL COHESION .............................................................................................................................................. 26 3.2 CONTRIBUTIONS BY SOCIALLY MARGINALIZED GROUPS .............................................................................................. 27 3.3 SOCIAL INCLUSION .............................................................................................................................................. 28 3.4 DEMOCRATIC PRACTICES ..................................................................................................................................... 29
4 DISCUSSION ............................................................................................................................................. 31
4.1 CONFOUNDING FACTORS? ................................................................................................................................... 31 4.2 ARE COMMUNITIES JUST TELLING US WHAT WE WANT TO HEAR? ............................................................................. 32 4.3 EXTERNAL VALIDITY: IS THIS A TYPICAL IRC CDR PROGRAM? ..................................................................................... 32 4.4 LESSONS ON EVALUATION .................................................................................................................................... 34
4.4.1 Program Assumptions .......................................................................................................................... 34 4.4.2 Ethics of Randomization ...................................................................................................................... 34 4.4.3 Measures ............................................................................................................................................. 35
5 CONCLUSIONS AND IMPLICATIONS........................................................................................................... 36
6 REFERENCES ............................................................................................................................................. 40

iv
TABLES TABLE 1: COMMUNITY PUBLIC GOODS ................................................................................................................................. 10 TABLE 2: DISTANCE TO SERVICES ......................................................................................................................................... 11 TABLE 3: HEALTH AND EDUCATION ...................................................................................................................................... 12 TABLE 4: EMPLOYMENT ..................................................................................................................................................... 13 TABLE 5: ASSET OWNERSHIP, PLANTING, AND MEALS ............................................................................................................. 14 TABLE 6: SUPPORT FOR DEMOCRACY.................................................................................................................................... 15 TABLE 7: VILLAGE CHIEF ATTITUDES TO DECISION‐MAKING ....................................................................................................... 16 TABLE 8: INDIVIDUAL EFFICACY ........................................................................................................................................... 17 TABLE 9: TRUST IN LEADERSHIP ........................................................................................................................................... 18 TABLE 10: SOCIAL INCLUSION ............................................................................................................................................. 20 TABLE 11: SOCIAL TENSIONS .............................................................................................................................................. 22 TABLE 12: COLLECTIVE EFFICACY ......................................................................................................................................... 23 TABLE 13: BEHAVIORAL MEASURES OF SOCIAL COHESION ........................................................................................................ 26 TABLE 14: AVERAGE CONTRIBUTION BY SUBGROUP ................................................................................................................ 27 TABLE 15: BEHAVIORAL MEASURES OF INCLUSION AND DEMOCRATIC GOVERNANCE ..................................................................... 29 TABLE 16: BEHAVIORAL MEASURES OF DEMOCRATIC PRACTICES ............................................................................................... 29 TABLE 17: COMPARATIVE DATA ON CDR PROGRAMS ............................................................................................................. 33 TABLE 18: SUMMARY OF SUBSTANTIVE RESULTS .................................................................................................................... 38

v
ACKNOWLEDGEMENTS The research effort was led by James Fearon and Jeremy Weinstein of Stanford University and Macartan Humphreys of Columbia University. James D. Fearon is Theodore and Frances Geballe Professor of Humanities and Sciences and Professor of Political Science at Stanford University. Dr. Fearon was elected as a fellow of the American Academy of the Arts and Sciences in 2002. Macartan Humphreys is Associate Professor of Political Science at Columbia University and a research scholar at the Center for Globalization and Sustainable Development at the Earth Institute. Jeremy Weinstein is Assistant Professor of Political Science at Stanford University, an affiliated faculty member at the Center for Democracy, Development, and the Rule of Law (CDDRL) and the Center for International Security and Cooperation (CISAC), and a non‐resident fellow at the Center for Global Development (CGD). Field enumeration of the first household survey was led by Johnson Kei of the Liberia Institute of Statistics and Geo‐Information Services (LISGIS) and Gwen Taylor of NYU. The enumerators were Urias F.O. Binda, Kamara Boakai V., Kukor Davies, D‐Sleh Gurley Sr., Matthew Hindawah, Tamay N. Jaiblai, H. Raymond Jarbo, Jimmie Fallah Jimmy, Maborlon M. Kamara, Momo Kamara Sr., Musa S. Kamara, Soko G. Kamara, George Kardar, Tamba Mayson, Fallah T. Mbakillah, Josephine L. Meatee, Andrew M. Sar, Sarah Saah, Robert Sowoi, Thomas G. Tellewoyan, Wologo Tellewoyan, Rudolph Vanwen, Arthur N. Yeanay, Jr., and Robert K. Zayzay. Field enumeration of the second household survey was led by K. Johnson Borh, Morlee Gugu Zawoo Sr., Zeleh Zealous Kolubah and Johannson Q Dahn of National Ex‐Combatant Peacebuilding Initiatives (NEPI) and Gwen Taylor of NYU. The enumerators were Yassah Wuleh, Praise Johnson, Forkpa Zwannah, Geneve K. Reed, Abubakar Sheriff, Abubakar Daboi, Maborton Kamara, Romeo G Mecauly, Makema Sesay, Ypee Gayflor, Mabel C Zawoo, Matin Nyepan, Steve Wolubah, Caroline A. Lloyd, Melvin Kokula, Mama Kanneh, Winston Gargar, Mam Keita, and David Balah, supported by Tamue L.Y.Borh, Musa Kamara in the advance team and drivers J. Prince Peters, John Jallah, Moses Brida, Musa Kelleh. Data entry was led by Isaac Dahn, Abdulah O Swaray, Steven Nimley, and Joe K Kollie. Field enumeration of the behavioral games was led by K. Johnson Borh, Morlee Gugu Zawoo Sr., Zealous Kolubah, Musa Kamara and Yassah Wulleh of National Ex‐Combatant Peacebuilding Initiatives (NEPI) and Nicholai Lidow of Stanford University, who was supported by Andrea Abel, Jessica Gottlieb, and Amanda Robinson. The enumerators were Rome G. McCally, Emmanuel A.C. Keloh , Samuel Layledoe, Sekou Kamara, Elijah B. Garsayne, Gordon S.Karpeh, Makemah Sesay, Anthony Jasper, Nicholas Vah, Joe Kollie, Haja V. Kamara, David K. Ballah, Abubakar Sheriff, Steven Wolobah, Veleega K. Teekeh, and Augustine Kpalleh. These were supported by Loseni B. Fofana, Joseph Nyuma, J.Prince Peters, Jr., John Jallah and Gayduobah M. Kolubah. Isaac Dahn oversaw data input, supported by Steven Nimley. All of these teams did extraordinary work in very difficult conditions. We owe them our thanks and admiration.

vi
Data entry for the first survey was done by a dedicated group of students from Stanford University: Our thanks to Simran Bindra, Marissa Cramer, Nancy Cruz, Fausto Inestroza, Denise Sohn, Stephanie Majerowicz, and John Maas, Daniel Slate, and Deborah Sohn. Data entry for the second survey; the results from the summer games was completed by NEPI in the field. Brian Coyne and Daniel Cassman assisted with the cleaning and organization of this data at Stanford. Throughout this project, the team received support from IRC experts both in Liberia and in the US. Jodi Nelson and Liz McBride played a key role in designing the instruments while IRC field staff, both in Monrovia and Lofa County, provided key support on the ground. We are also grateful for the support of a number of funders that made this impact evaluation possible. DFID provided the bulk of funding for the panel survey as part of its initial grant to IRC. The Center for Global Development provided some additional funding for the second wave survey. AUSAID, through a grant to the Center for Global Development, provided the resources to implement the behavioral protocol for the measurement of social cohesion. And the Center for Democracy, Development, and the Rule of Law provided funding for field work expenses.

1
1 Introduction: Purpose of Research and Methodology This report describes the findings from an impact evaluation of a community‐driven reconstruction program, funded by the Department for International Development (DFID) and implemented by the International Rescue Committee (IRC), in Lofa County, Liberia. The CDR program, implemented in 42 communities between September 2006 and February 2007, aimed to improve welfare, local governance, and community cohesion. This evaluation examines whether the program was successful in achieving these objectives. The evaluation was implemented by researchers from Columbia University and Stanford University, with assistance from the Liberia Institute for Statistics and Geo‐Information Services (LISGIS) and the National Ex‐Combatant Peacebuilding Initiative (NEPI) in the field.
1.1 CommunityDriven Reconstruction Community‐driven reconstruction (CDR), or community‐driven development (CDD) as it is referred to more broadly, is rapidly gaining popularity as a mechanism for delivering development assistance. Such programs emphasize the engagement of beneficiaries in the design and management of development projects, often by giving communities direct control over key project decisions. By conservative estimates, the World Bank’s lending alone for CDD projects exceeded $2 billion in 2003 (Mansuri and Rao 2004). Bilateral donors have also embraced the methodology, applying it to support local public goods provision in areas as diverse as infrastructure, agriculture, health care, and education. Community‐driven development is viewed widely as a mechanism for making development more inclusive, empowering the poor, strengthening governance, and enhancing project effectiveness and sustainability. As Mansuri and Rao suggest (2004), there is significant potential for community‐driven processes to transform social relations. CDR and CDD programs have, as an explicit purpose, the goal of challenging existing structures of authority by putting power and resources in the hands of community members, especially previously disadvantaged or marginalized groups. They typically contain two major components: first the democratic selection of community committees and second the allocation of block grants to be spent on development within communities with project selection and oversight led by the community committees (Cliffe et al 2003). In this way they involve both the creation of new institutions and an opportunity for populations to observe them in action. Skeptics have countered that such approaches are easily captured by local elites; risk undermining existing (and sometimes democratically‐elected) institutions; or inevitably sacrifice the time‐consuming work of community mobilization and empowerment to the task of implementing big budget development projects on short timelines.
2
In light of the rapid scale‐up of these programs, there is surprisingly little evidence of their impact. A now somewhat dated review of existing evaluations commissioned by the World Bank (2003) found only mixed evidence that CDD programs strengthen the targeting of beneficiaries, enhance service delivery, and improve sustainability; moreover, the review unearthed little evidence on whether projects better reflect community preferences and whether exposure to CDD increases the capacity for subsequent collective action. More recent work (Arcand and Bassole 2007; Labonne and Chase 2008) has started to find more positive results. Our evaluation builds on this work by examining CDD in a post‐conflict setting (CDR), by examining direct measures of effects on social behavior, and by employing a first‐best identification strategy, randomized evaluation.
1.2 CommunityDriven Reconstruction in Liberia In 2006, IRC launched a community‐driven reconstruction program in Lofa County, Liberia. Northern Liberia figures centrally in the violence that engulfed Liberia over the past fifteen years. It was a hotspot during Charles Taylor’s rebellion between 1990 and 1996 and reemerged as the epicenter of a second war against Taylor’s government after 2000. Our baseline data testify to the extent of damage done to the region by the conflict. The data record information on almost 6,000 household members living in the region in 1989. Of these, over 4% are reported to have died directly from war related violence and a further 6% suffered injury or maiming. 5% took active part in the fighting, with three fifths of these having been abducted. A similar share (4.9%) of approximately 1500 subjects we interviewed in our follow up survey self‐reported as ex‐combatants. The most widespread effect, however, was one that could have a direct bearing on communities’ ability to cooperate (Richards et al 2005): 85% of these individuals were displaced during the conflict and many were displaced multiple times. Of 1500 individuals we interviewed in the final survey, 25% still considered themselves internally displaced. The CDR program had the following core components. First, villages were grouped into approximately equally‐sized “communities” – based on geographic proximity and preexisting ties, each with a population of between 2000 and 3000 individuals. Then, IRC undertook initial activities to sensitize local communities to the new development project, including targeted meetings with local chiefs and elders to solicit their cooperation. In each community, IRC oversaw the election of community development councils (CDCs), with representatives chosen from among all voting‐age adults in the villages. CDCs were then empowered to oversee a community‐wide process to select and implement a quick impact project (approx $2000‐$4000 in value), followed by a larger development project (approx $17,000 in value). The members of the CDCs were selected in direct elections from among all voting age adults in the villages. CDCs managed the implementation process and continue to have responsibility for project maintenance over time. This model was adopted, in part, as a strategy for using local leadership to quickly generate material improvements in people’s lives. Given the state of the government after fifteen years

3
of civil war communities could plausibly also move more quickly than government to deliver a tangible peace dividend. Such participatory approaches are also argued for on the grounds that (a) people had lost faith in their government, both at the national and local level; (b) the conflict generated significant tensions and distrust within and across communities; and (c) that Liberian communities were struggling to incorporate marginalized and disenfranchised groups including internally displaced persons, women, young people, and ex‐combatants (Richards et al 2005). The premises of IRC’s program are described in Box 1 below.
Box 1 : The Premises of the IRC Liberia CDR Process
The IRC CDR Project Description Document gives the following premises as a motivation for a CDR approach in Liberia:
1 That the cause of conflict often finds its roots in poverty and a lack of democratic
governance, which cannot be addressed merely at central policy levels. The base or grass roots levels are the foundation that will sustain it. Communities must be empowered from the outset to drive their own reintegration and recovery process, creating not only a sense of ownership of problems and solutions, but restoring the dignity and self‐reliance that is so often lost in wartime recovery efforts. To effect this however requires accountable, functioning structures and processes based on principles of good governance and inclusiveness, concurrent with citizen understanding of rights and responsibilities.
2 That the effect of conflict is one where communities are divided and often distrust each other and the notion of government. The tremendous social and physical barriers to peace and development require inter‐and intra community wide efforts to initiate dispute resolution at local levels (given the absence of legal systems and structure to date), and to foster reconciliation not only for disenfranchised groups, but for all members of the community. Mechanisms must be developed to reunite communities with political/civic leadership, allowing them to work together to resolve differences, both former and newly anticipated.
3 That special groups such as women, youth and excombatants are particularly impacted by war and must be given due consideration in post war efforts as equal participants in the process of becoming active citizens and by restoring or providing opportunities for improved livelihoods.
4 That realization of all these goals has most effect when underpinned with concrete action that restores productive capacities.
Source: IRC Project Document:”Community‐Driven Reintegration and Reconstruction in Rural Liberia”
The CDR program had an overall budget of just over $2 million (US). Approximately 18 staff worked full‐time on the implementation of the program over eighteen months. The projects

4
most commonly implemented involved the construction or renovation of village meeting halls, government guest houses, and pit latrines.
1.3 Hypotheses In this report we examine nine hypotheses that are implicit in the design of Liberia’s CDR program. These hypotheses, detailed in Box 2, fall within three major families: welfare, local governance, and community cohesion.
Box 2: Hypotheses
1 Welfare:
1.1 The program will result in improved access to health, education, water sources and other basic amenities.
1.2 The program will result in greater opportunities for income generation and wealth creation.
2. Local Governance:
2.1 The program will change how individuals think about decision making at local levels, in favor of transparency, accountability, and inclusiveness.
2.2 The program will change how leaders think about decision making at local levels, in favor of transparency, accountability, and inclusiveness.
2.3 The program will change the citizens’ sense of personal efficacy and confidence that they can affect community decision making.
2.4 The program will provide citizens with greater confidence in institutions for decision‐making in their communities.
3. Community Cohesion:
3.1 The program will result in greater acceptance of individuals, specifically conflict victims, displaced persons and ex‐combatants.
3.2 The program will result in reduced tensions between groups and a greater ability to resolve tensions non‐violently.
3.3 The program will enhance the community’s ability to act collectively. The hypotheses described in Box 3 emphasize the direct effects of CDR on community outcomes. It is also possible that CDR programs have broader impacts. For example, by improving public goods provision or enhancing cohesion, CDR may reduce the risk of renewed conflict by lessening local grievances or facilitating economic development, which may in turn reduce the incentives to participate in violence (World Bank 2003). These potential, indirect impacts were not a focus of the evaluation.

5
1.4 Methodology In order to test these core hypotheses, we employed an approach known as randomized evaluation. To employ this approach, the IRC randomly assigned 42 communities to receive the CDR program. These communities were selected from among 83 equally‐deserving and accessible “communities,” constructed from over 400 villages that were clustered together (by IRC) on the basis of preexisting ties and geography in order to facilitate program implementation. This randomization process is key for ensuring that differences in outcome measures for the project and comparison villages truly reflect the causal effects of the CDR program and not other features that determine selection into treatment in the first place (see Box 3). The lottery was conducted in a public place, with chiefs representing each community in attendance.
Box 3: Randomized Intervention
Our evaluation strategy employs randomized intervention in order to identify the causal effects of the CDR program. The basic idea of randomized evaluation is simple. Say that a given program is to be implemented in 50 sites that meet some eligibility criteria. The usual approach is for implementing agencies to identify 50 sites and projects are undertaken in these sites. When undertaking evaluations, researchers may then seek 50 “comparable” sites so that they can compare outcomes in the project sites and the comparison sites. The difficulty, however, is that it is normally very hard to know whether a comparison site is really comparable. For example, if comparison sites start off richer or poorer, more or less conflict affected, or more or less cohesive, then estimates of the impact of programs could mistakenly be simply capturing these preexisting features. The best way to ensure that there are no confounds of this form is to use a process in which 100 eligible sites are identified at the outset and the 50 project areas are selected by lottery from these 100 sites. This approach ensures that (in expectation) the only systematic difference between project and comparison areas is the program itself and allows researchers to attribute differences between project and comparison areas to the causal effect of the program with confidence. In addition to allowing for the identification of clear causal effects, this approach can sometimes be more equitable than other approaches since all sites in the pool of project and comparison areas have an equal chance of being selected for the project. In the Liberia case, the lotteries were also conducted in public which provided an unusually high degree of transparency regarding how project sites were selected. In consequence, all results in this report draw on a randomized, controlled trial in which a random subset of communities (and individuals residing in those communities) were exposed to CDR (the “treatment” communities). Those communities not exposed to CDR (the “control” communities) are, at least in expectation, no different than those who received the treatment,

6
except for the fact of receiving treatment. This key feature allows us to estimate the causal effect of the program on outcomes. In practice the randomization process was effective in the sense that baseline data shows that treatment and control areas are similar with respect to a large set of measures: exposure to conflict, community size, and so on. There are however some differences that arose by chance: specifically, treatment areas were somewhat more likely than control areas to be rural; likely related to this is the fact that treatment areas were on average located farther from health clinics than control areas, a feature we return to below. Finally, it is important to emphasize that this impact evaluation does not isolate the impact of community‐driven processes per se. Instead the evaluation identifies the overall impact of receiving funds for public goods provision coupled with a community‐driven processes. In short, the design allows us to assess the effect of getting the IRC CDR program versus not getting the IRC CDR program. To assess the relative merits of a community‐driven approach versus a more centralized strategy for implementation (e.g., perhaps by working through existing government institutions), a different research design would be required, in which different sorts of aid programming are assigned at random to different communities.
1.5 Measurement Strategy To assess the impact of the CDR program, the research team gathered data in three waves, drawing both on classic survey methods and a new approach to measuring behavioral change directly.
1.5.1 Waves I and II: Panel Survey During the first wave of data collection (March/April 2006), the team conducted a baseline survey of 1702 households. This was a representative sample of households in Voinjama and Zorzor districts, based on a sample frame produced by the United Nations Humanitarian Information Center. Because the survey was carried out before the IRC clustered villages into communities and selected treatment and control groups, a number of surveys were completed in areas that did not ultimately enter the sample used for the lottery. We were however able to link 1606 of the completed surveys in the baseline to their appropriate community in the IRC treatment and control group. The second wave of data collection took place after the conclusion of the CDR program in March/April 2008. The research team sought to find all households interviewed in the first wave, ultimately revisiting 1382 of the 1606 households surveyed two years earlier. In addition, interviews were conducted with 166 new respondents, in an effort to ensure a minimum of 10 respondents in each of the IRC treatment and control communities. A parallel survey of 135 town and village chiefs was completed, targeting the chief in the major village associated with

7
each IRC community and one additional randomly selected chief from among the other associated villages. The surveys asked a battery of questions designed to measure outcomes including household and community welfare; progress toward the reintegration of ex‐combatants, internally displaced persons, and new migrants; individual efficacy; social cohesion and collective action; the extent of trust in community leadership; and political attitudes and beliefs. In addition, the follow‐up survey probed attitudes about the CDR program among respondents who lived in treatment communities.
1.5.2 Wave III: Behavioral Outcomes The final wave of data collection took place between July and September 2008, nearly six months after the CDR program came to an end. To complement the data gleaned from household surveys, we implemented a behavioral public goods “game” carried out in the largest village in each of the 83 treatment and control communities.1 The behavioral game worked as follows. Initially, an advance team visited each village to announce/explain the project and to gain the consent of the village leadership. One week later, we facilitated a community meeting at which villagers were told the community could receive up to $400 to spend on a development project. They were also told that receipt of the funds would depend (a) on whether the community competed a form indicating how the money would be spent and which three people would handle the funds and (b) on how much money a random sample of 24 people contributed to the project in a community‐wide public goods game (or n‐person prisoner’s dilemma in the language of experimental economics). One week later, a team returned to the village, collected the form, sampled 24 households, played the public goods game, publicly counted the contributions, and delivered the money to the three community representatives. The public goods game itself was straightforward: 24 randomly selected individuals (from randomly selected households) were given an opportunity to decide how much of 300LD (approx $5 US or a week’s wages) they wished to contribute to the community and how much they wanted to keep for themselves. Half of the players had their contributions to the community multiplied by two, and half were multiplied by five. Each community had the opportunity to earn up to 25,200 LD. In addition, we ran a cross‐cutting experimental treatment (balanced across CDR treatment status) in which all 24 players were women in half of the communities, while 12 were men and 12 were women in the other half. There are considerable advantages to the behavioral public goods game as a strategy for measuring the outcomes of CDR. Most importantly, it permits us to observe the means by which communities select representatives and decide on community projects and to measure the actual level of cooperation achieved, based on individual decisions taken by a random 1 The use of the term “game” here follows from the fact that the approach employed draws on researchers studying “game theory”, a branch of economics that examines the behavior of individuals in strategic settings.
8
sample of households. It also imposes real costs on behavior that reflects a social desirability bias (e.g., “I’ll say that I support democracy because I know I should or I know that is what they want to hear”) rather than an individual or the community’s true underlying beliefs and preferences. Finally, the implementation of the game was entirely disconnected from the CDR program; it was carried out by an established Liberian NGO and the implementers did not know which communities received the CDR program and which did not. The behavioral game was completed successfully in 82 communities. Thus we have data from 1968 individual contribution decisions, along with accompanying survey results on each household that participated. We also gathered detailed information from the chief and the three selected community representatives in each of the 82 communities to permit an analysis of community processes.

9
2 Findings from the Panel Survey The survey instrument contained nearly 200 questions designed to assess the impact of the CDR program on a wide range of individual and community‐level outcomes. In putting together the survey instrument, we drew on a battery of social capital questions developed by the World Bank, standard questions on political attitudes developed by the Afrobarometer, and added new questions that we field‐tested in Lofa County before the administration of the survey began. The data generated through the household surveys are rich. There are a number of different proxies for each outcome of interest. There are a number of ways of assessing the impact of the program – from a comparison of simple differences in treatment and control outcomes in 2008 to a more complex analysis that looks at the difference in how particular variables have changed over time since 2006. Moreover, the sample size is sufficiently large that responses can be analyzed for particular sub‐groups, not just communities as a whole. This report focuses on “first order” results for key proxies that allow us to address the hypotheses described in Section 1.3 above. We focus on results from the post‐survey for ease of interpretation. Where possible, we also indicate whether the effects are strengthened or weakened when one takes into account the results from the baseline survey as part of a “difference‐in‐differences” analysis in which we look for an impact of CDR on the change we observe in particular variables over time. The tables report the average response to a given question for households in treatment and control communities. They also report the average effect of the IRC program, which is the difference between the average response in treatment and control communities. Finally, they report the standard error of that estimate, which is a measure of our uncertainty about whether the estimated effect is due to the CDR program or to random sampling variability.2 The smaller the standard error the more confident we are in the results. Typically, we consider an effect to be “statistically significant” if that standard error is no more than half the effect size. We indicate statistical significance in the tables with stars placed beside the estimated effects. In the analysis presented here we generally do not “control” for features such as the age, gender, or other attributes of respondents or of communities. This is justified by the fact that the randomization procedure guarantees that there are no biases resulting from such features in expectation. As noted above however there are some differences between treatment and control areas, to account for these a number of the results have been subjected to robustness tests (not reported here) in which controls have been introduced. In general we find that these controls have only a modest effect on the results reported here.
2 For analysis reported here standard errors are clustered at the level of villages or communities to take account of the fact that observations are not independent within communities. Note in addition that the reported results estimate the sample average treatment effect and not the population average treatment effect.

10
There are very many questions and responses studied in this report, and thus many different results. In the concluding section of the report we provide a discussion of how we make an overall assessment of program impact based on all of these different questions.
2.1 Material Welfare
2.1.1 Access to Amenities We begin our analysis by considering Hypotheses 1.1: access to basic amenities. We do so first by examining physical proximity to amenities such as clinics, schools, water sources and then examine welfare effects in the form of health and education outcomes. In some sense, proximity to services can be thought of as outputs of the CDR program, rather than impacts per se. We know from monitoring by the IRC that local public goods were in fact constructed in treatment communities. By including them here, however, our goal is to assess whether treatment communities ended up better off in terms of these outputs than control communities as a consequence of the program.
Table 1: Community Public Goods
Individuals in control communities
Individuals in treatment communities
Difference(se)
Outcome No. of wells 2.96 2.31 ‐.65 (.45)No. of classrooms 1.28 1.38 .11 (.23)No. of latrines 2.86 3.28 .42 (.77)No. of health clinics .59 .32 ‐.27*** (.09)No. of comm. facilities .62 .76 .14* (.08)*** Significant at 99%; ** Significant at 95%; * Significant at 90%. The table reports results from a t‐test comparing mean outcomes across individuals in control and treatment communities. Standard errors are clustered by community. There are approximately 1500 respondents for each outcome, about evenly divided between treatment and control communities. Table 1 reports the average number of key local public goods in treatment and control communities. Unsurprisingly, given the emphasis that CDR communities put on the construction of community facilities (including palaver huts and government guesthouses), individuals in treatment communities report higher numbers of local community facilities. There is also strong evidence that treatment communities have less health clinics – a fact that we believe is related to the observation that treatment villages tend to be more rural and less accessible to the main road (as we reported in our analysis of baseline survey data). Consistent with this not being a causal effect of the program, the difference between treatment and control communities in terms of clinic presence disappears when the 2006 baseline is taken

11
into account. By contrast, the program impact on community facilities is even stronger in that specification. We can also assess whether access to key services has improved as a function of the CDR program. Table 2 reports the average walking distance (in minutes) to a set of services that contribute to household welfare.
Table 2: Distance to Services
Individuals in control communities
Individuals in treatment communities
Difference(se)
Outcome Min. walk to water 14.55 12.17 ‐2.38 (1.81)Min. walk to market 97.39 104.81 7.42 (17.63)Min. walk to transport 79.00 86.82 7.84 (18.14)Min. walk to pr. school 32.99 30.11 ‐2.88 (6.49)Min. walk to sec. school 52.33 52.55 .22 (9.81)Min. walk to clinic 70.40 98.70 28.30* (16.07)Min. walk to latrine 7.72 6.78 ‐.94 (.91) Notes: *** Significant at 99%; ** Significant at 95%; * Significant at 90%. The table reports results from a t‐test comparing mean outcomes across individuals in control and treatment communities. Standard errors are clustered by community. There are approximately 1500 respondents for each outcome, about evenly divided between treatment and control communities. There is no evidence that the CDR program decreased the time needed to walk to key services for households living in treatment communities. The results suggest that households in CDR areas have to walk longer distances to clinics and also to transport and market (although the latter two are not significant effects). Again, this is likely due to the greater isolation of treatment communities as evidenced by the fact that these results disappear in a difference in differences specification. In the difference in differences specification, there is some evidence that the time needed to walk to water, markets, secondary schools, and clinics in treatment communities has decreased at a faster rate than in control communities, although only the estimate for secondary schools is significant at conventional levels. Finally, whereas Table 1 and Table 2 examine the existence of services, in Table 3 we explore measures that better capture access. Access to services reflects both the availability of functioning services and household level decisions to access these services when they are available. As measures of access we examine ultimate outcomes in the form of educational attainment and health status.
12
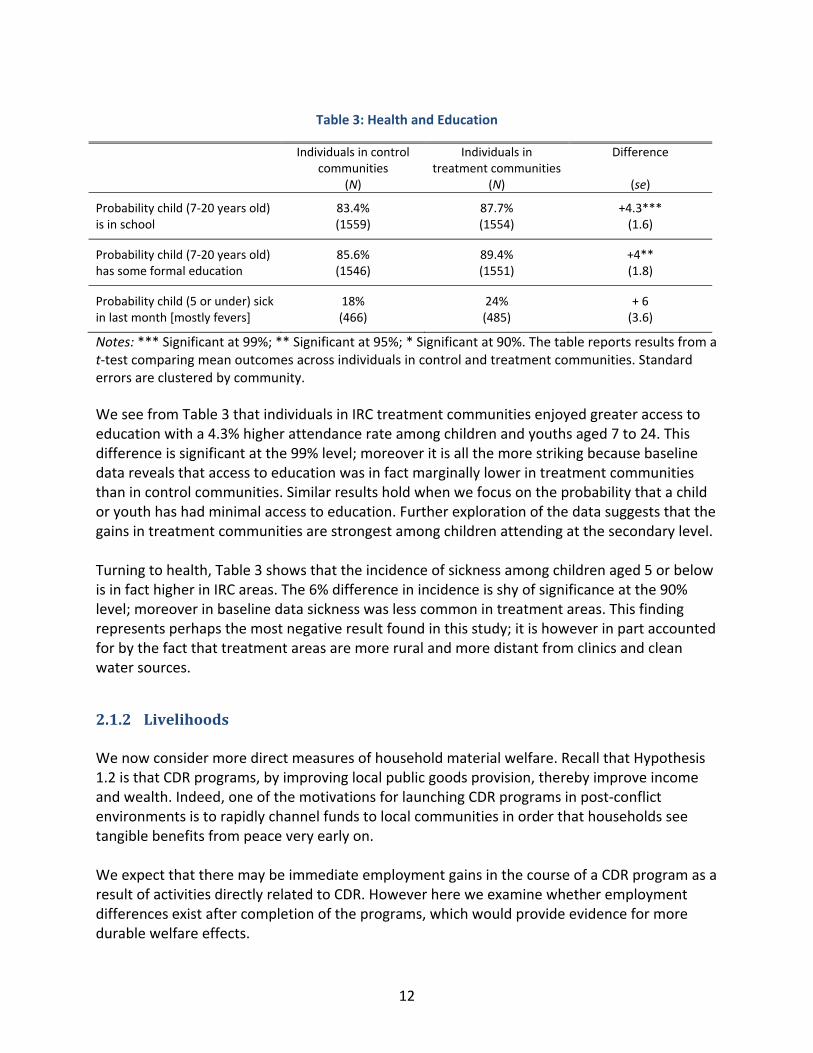
Table 3: Health and Education
Individuals in control communities
Individuals in treatment communities
Difference
(N) (N) (se)
Probability child (7‐20 years old) is in school
83.4% (1559)
87.7% (1554)
+4.3*** (1.6)
Probability child (7‐20 years old) has some formal education
85.6% (1546)
89.4% (1551)
+4** (1.8)
Probability child (5 or under) sick in last month [mostly fevers]
18% (466)
24% (485)
+ 6 (3.6)
Notes: *** Significant at 99%; ** Significant at 95%; * Significant at 90%. The table reports results from a t‐test comparing mean outcomes across individuals in control and treatment communities. Standard errors are clustered by community. We see from Table 3 that individuals in IRC treatment communities enjoyed greater access to education with a 4.3% higher attendance rate among children and youths aged 7 to 24. This difference is significant at the 99% level; moreover it is all the more striking because baseline data reveals that access to education was in fact marginally lower in treatment communities than in control communities. Similar results hold when we focus on the probability that a child or youth has had minimal access to education. Further exploration of the data suggests that the gains in treatment communities are strongest among children attending at the secondary level. Turning to health, Table 3 shows that the incidence of sickness among children aged 5 or below is in fact higher in IRC areas. The 6% difference in incidence is shy of significance at the 90% level; moreover in baseline data sickness was less common in treatment areas. This finding represents perhaps the most negative result found in this study; it is however in part accounted for by the fact that treatment areas are more rural and more distant from clinics and clean water sources.
2.1.2 Livelihoods We now consider more direct measures of household material welfare. Recall that Hypothesis 1.2 is that CDR programs, by improving local public goods provision, thereby improve income and wealth. Indeed, one of the motivations for launching CDR programs in post‐conflict environments is to rapidly channel funds to local communities in order that households see tangible benefits from peace very early on. We expect that there may be immediate employment gains in the course of a CDR program as a result of activities directly related to CDR. However here we examine whether employment differences exist after completion of the programs, which would provide evidence for more durable welfare effects.

13
Table 4 shows differences in employment rates (defined as being in full time or being in “consistent part time / contract work” arrangements) among non‐student and non‐retired individuals aged 15‐35, broken down by gender. The table shows that subsequent to the IRC intervention employment rates are no different for male youths; but are 4.9 points higher for female youths. This provides some evidence of positive effects on employment. Moreover this effect is largely unchanged once we control for rurality. Further inspection of the data reveal that the main gains in female employment come from fewer females reported as unemployed and not looking for work and more reported as working within households. This difference could in part reflect different evaluations of domestic labor rather than material gains in income generation; although the latter is not excluded.
Table 4: Employment
Individuals in control communities
Individuals in treatment communities
Difference
(N) (N) (se) Probability (non‐student) male youth (15‐35 years old) employed
73.3% (435)
74%% (377)
0.7 (4.7)
Probability (non‐student) female youth (15‐35 years old) employed
85.1% (632)
90% (582)
4.9** (1.4)
Notes: *** Significant at 99%; ** Significant at 95%; * Significant at 90%. The table reports results from a t‐test comparing mean outcomes across individuals in control and treatment communities. Standard errors are clustered by community. Finally we examine asset ownership. The survey instrument queried respondents on their ownership of key assets including livestock, chickens and guinea fowl, and household wares. The survey also asked about patterns of rice planting – the dominant form of agriculture in the region – and the regularity with which households are cooking meals. Table 5 reports estimates of the average effect of the IRC program on total asset ownership, on rice planting, and on meals. In addition we show the effect of the IRC program on per‐adult ownership of asset and planting. There is some evidence of a positive impact of the program, especially on the ownership of chickens, with households in treatment communities owning on average nearly 2 additional chickens. The impacts on rice planting and the number of meals cooked the previous day are also close to conventional levels of significance. In the case of rice planted the gain corresponds to a 12% gain in production. Most other effects are neither sizeable nor significant. If we examine per capita holdings we find similar results, with effect sizes typically gaining in significance somewhat and suggesting gains in rice planting and fowl ownership as well as chicken ownership. The estimated effect on chicken holdings, and in particular chickens per household member, can also be observed in an independent sample of almost 2000 subjects participating in the behavioral games. Moreover while for both datasets the effect is weakened when we control for quarter, the effect size of chickens per adult remains significant at the 95% level.

14
Table 5: Asset Ownership, Planting, and Meals
Households in control communities
Households in treatment communities
Difference in household assets
Outcome (se) No. of rooms 3.25 3.42 .16 (.12) No. of sheep or goats .22 .19 ‐.03 (.06) No. of chickens 5.36 7.04 1.68*** (.69) No. of guinea fowl .09 .16 .07 (.05) No. of bamboo beds 2.31 2.46 .15 (.15) No. of wooden beds .34 .29 ‐.05 (.07) No. of foam mattresses .49 .52 .03 (.09) No. of straw mattresses 2.23 2.23 ‐.00 (.13) No. of buckets 1.89 1.85 ‐.04 (.10) No. of fitted doors 2.44 2.43 ‐.00 (.22) No. of radios .40 .45 .05 (.04) Tins of rice planted 3.41 3.81 .40 (.24) No. of meals yesterday 1.26 1.31 .05 (.03) *** Significant at 99%; ** Significant at 95%; * Significant at 90%. The table reports results from a t‐test comparing mean outcomes across individuals in control and treatment communities. Standard errors are clustered by community. There are approximately 1500 respondents for each outcome, about evenly divided between treatment and control communities. These findings suggest that there may be some modest benefits to communities in terms of small asset holdings. However we note that the intertemporal analysis does not strengthen confidence in these findings. We have two ways of looking at change over time in these measures of asset ownership. First, we can assess change using our 2008 respondents’ recollections of asset ownership in 2006 as the baseline. Second we can compute change with responses from 2006 as a baseline (although responses in 2006 were gathered from the household head, while in 2008 a randomly selected household member provided the response). Using the first approach we find generally weaker evidence for a positive effect of the program; under the second approach we find more positive evidence but for a different set of assets. The instability of our estimates using this historical data suggests that asset ownership was likely measured with significant error and that the results on small asset should be treated with caution.

15
2.2 Governance
2.2.1 Attitudes about Governance An explicit goal of CDR is to expose individuals to the practice of democratic, transparent, and accountable governance. Hypothesis 2.1 suggests that this exposure will lead to greater support for more democratic forms of government.
Table 6: Support for Democracy
Individuals in control
communities Individuals in treatment
communities Difference
Outcome (se)
Share agreeing that people should be more active in questioning leaders
.72
.75
.03 (.03)
Share agreeing that leaders should not favor their own ethnic group
.90
.92
.02 (.02)
Share agreeing that all should be permitted to take part in decisions
.60
.58
‐.02 (.03)
Share agreeing that women should have equal rights
.79
.80
.01 (.02)
Share agreeing that leaders should be chosen through elections
.82
.86
.04 (.03)
Share agreeing that community members have the responsibility for improving things in the town
.63
.67
.05* (.03)
*** Significant at 99%; ** Significant at 95%; * Significant at 90%. The table reports results from a t‐test comparing mean outcomes across individuals in control and treatment communities. Standard errors are clustered by community. There are approximately 1500 respondents for each outcome, about evenly divided between treatment and control communities. To examine the hypotheses we asked respondents to give their opinion on a range of potentially divisive issues related to decision making in their communities. The results are reported in Table 6. We find only weak support for the idea that exposure to CDR increases support for democratic practices. On most issues, respondents in treatment communities are more likely to support the more democratic propositions than those in control communities, although the effects are very small and often not significant. Individuals in treatment communities are more likely to agree that people should question their leaders; that leaders should pursue the public interest, rather than the interests of their family or ethnic group; that leaders should be chosen through elections; and that community members (not the government) bear the primary responsibility for improving things in the town. Only this last result is statistically significant and then only at the 90% level. This result, however, does not hold up in a difference‐in‐differences specification which takes account of how respondents answered these same questions two years earlier.

16
2.2.2 Attitudes of Leaders To address Hypotheses 2.2, in addition to examining changes in attitudes of citizens in the project areas, we also examined whether the program has an impact on the attitudes of leaders. By engaging in the participatory and democratic forms of decision‐making employed in the CDR process, do leaders alter their positions to be more welcoming of broad based approaches and more appreciative of the contributions of non‐elites to decision making? To answer the question we interviewed village chiefs in all of the hub towns of the treatment and control CDC areas as well as a random sample of chiefs in other town. We asked them to describe their attitudes on a range of questions associated with who should take part in decisions and to whom leaders should be accountable. The results are shown for six questions in Table 7. The table reports the degree to which chiefs in treatment (black circles) and control areas (white circles) agree with more or less inclusive or democratic positions with respect to decision making.
Table 7: Village Chief Attitudes to Decision‐making
Less democratic position Agree
Strongly With A
Agree Weakly With A
Agree Weakly With B
Agree Strongly With B
More democratic position
Decisions regarding the village are most effective when village leaders make decisions alone on behalf of the village.
Decisions regarding the village are most effective when village leaders widely consult others in the village before making a decision.
Once in a position of authority, leaders are obliged to help their own family or ethnic group. Since leaders represent everyone, they should not
favor their own family or ethnic group.
Only those who understand the issues very well should be allowed to take part in important decisions.
All people should be permitted to take part in important decisions, even if they don’t understand the issues or are new to the community.
There should be no limit on how long leaders stay in office; because it is important that the best and most experienced person should be able to lead.
Leaders of a community should only be allowed to stay in office for a fixed period of time so that they do not become too dominant and so that new people can have a chance to lead communities.
The leaders of a community should always be people whose family has lived in the area for a long time and who know the traditions of the area well.
Anybody should be able to become leader of a community if the majority of the people who are living there agree.
The leaders of a community should always be male. Women should be allowed and encouraged to
become leaders of communities.
Notes: Black circles mark the average response of chiefs in treatment communities; white circles mark average responses in control communities. In no case are these differences statistically significant. Table 7 provides no evidence of an effect of the IRC program on the self‐reported attitudes of leaders. Across all measures the average response given by chiefs in treatment communities is
17
indistinguishable from that given in control communities. Analysis of other data we collected on chiefs continues to find no evidence of a program’s affect on leader attitudes. This is a negative finding for the program. But there is another finding that can be seen from Table 7 that is just as important: across all but one measure, the positions of leaders are strongly supportive of inclusive approaches in both treatment and control areas. An implication is that the problem may not so much lie in the effectiveness of the program but in its background assumption that decision making was non‐inclusive at the outset.
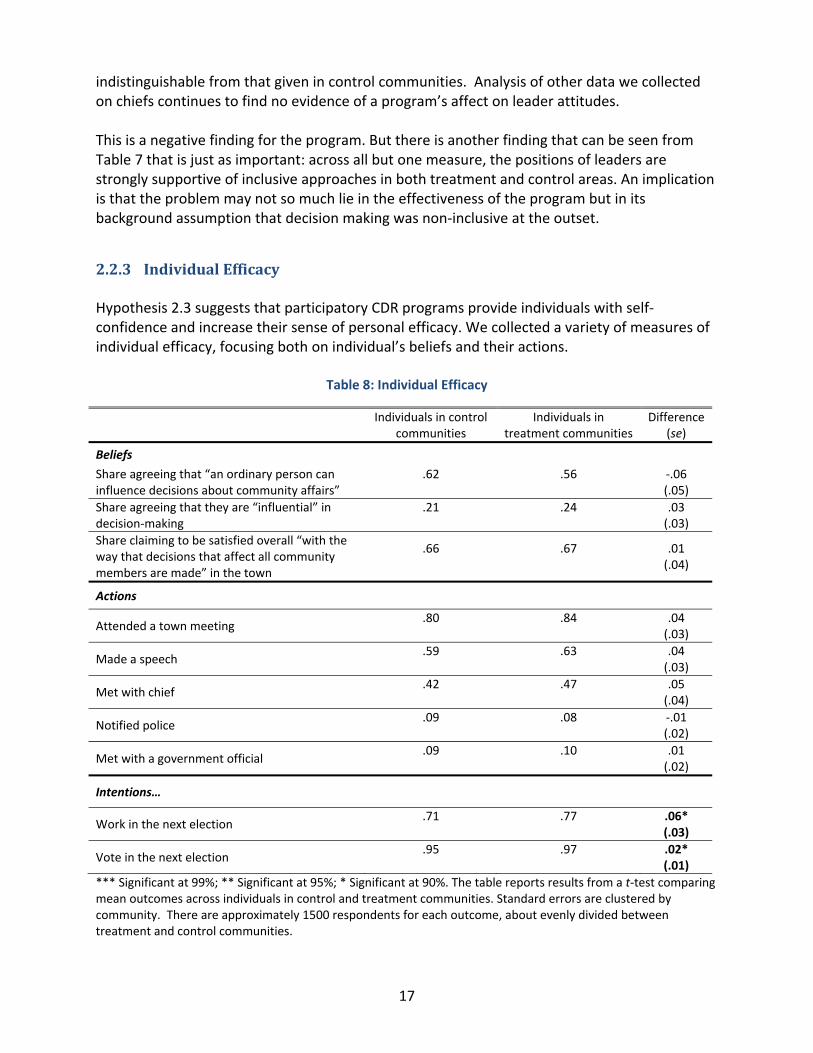
2.2.3 Individual Efficacy Hypothesis 2.3 suggests that participatory CDR programs provide individuals with self‐confidence and increase their sense of personal efficacy. We collected a variety of measures of individual efficacy, focusing both on individual’s beliefs and their actions.
Table 8: Individual Efficacy
Individuals in control
communities Individuals in
treatment communities Difference
(se)
Beliefs
Share agreeing that “an ordinary person can influence decisions about community affairs”
.62
.56
‐.06(.05)
Share agreeing that they are “influential” in decision‐making
.21
.24
.03(.03)
Share claiming to be satisfied overall “with the way that decisions that affect all community members are made” in the town
.66
.67
.01 (.04)
Actions
Attended a town meeting .80
.84
.04(.03)
Made a speech .59
.63
.04(.03)
Met with chief .42
.47
.05(.04)
Notified police .09
.08
‐.01(.02)
Met with a government official .09
.10
.01(.02)
Intentions…
Work in the next election .71
.77
.06*(.03)
Vote in the next election .95
.97
.02*(.01)
*** Significant at 99%; ** Significant at 95%; * Significant at 90%. The table reports results from a t‐test comparing mean outcomes across individuals in control and treatment communities. Standard errors are clustered by community. There are approximately 1500 respondents for each outcome, about evenly divided between treatment and control communities.

18
Table 8 presents estimates of the impact of the CDR program on individual efficacy. There is not much evidence that CDR has changed how individual think about the degree to which they can influence community affairs. There is slightly more evidence that CDR has increased the level of activism of individuals in communities that received the program, although these effects are always small, and only significant in the case of people’s plans to work on and vote in the next election. When we examine responses in 2008, in light of how individuals answered the same questions in 2006, there is still no consistent evidence of a CDR program impact in this area.
2.2.4 Trust in Community Decision Making Procedures Hypothesis 2.4 suggests that CDR programs enhance people’s trust in their community decision making procedures, perhaps by setting in place new expectations about how community processes should be run or by creating formal structures that empower community members which persist after the program’s conclusion.
Table 9: Trust in Leadership
Individuals in control
communities Individuals in
treatment communities Difference
Outcome (se)
Actions
Village meetings held in past year? .82
.87
.05(.03)
Number of meetings in past six months 6.34
6.36
.02(.71)
Beliefs
Share saying that appealing to a village/town chief can help with local problems
.90
.95
.05*** (.02)
Share saying that town leaders are more or much more trustworthy than in neighboring towns
.47
.59
.12*** (.04)
Share saying that town leaders are more or much more trustworthy than in other parts of Lofa County
.39
.47
.09*** (.04)
Share saying that community leaders would not keep any funds for private use
.44
.51
.07*** (.03)
If the town received $10,000, what share should be given directly to community members instead of community leaders?
34%
35%
‐1% (85)
Notes:*** Significant at 99%; ** Significant at 95%; * Significant at 90%. The table reports results from a t‐test comparing mean outcomes across individuals in control and treatment communities. Standard errors are clustered by community. There are approximately 1500 respondents for each outcome, about evenly divided between treatment and control communities.

19
Table 9 presents estimates of how the CDR program affected reported levels of trust in community leadership. Consistently, respondents report higher levels of faith in the trustworthiness of leaders in communities that experienced CDR as opposed to control communities. Respondents in places that were exposed to CDR express more faith in the ability of town chiefs to resolve local problems; believe town leaders are more trustworthy than those in neighboring towns and areas; and believe strongly that their own leaders, if given funds to spend on the community, would not keep any money for their private use. The results are strongly significant and the magnitude is substantial, with CDR increasing the share of community members reporting faith in their leaders by between 5% and 12% depending on the measure.

20
2.3 Social Cohesion One major motivation for the participatory processes embedded in the CDR program is the possibility that successful community mobilization can help to ease tensions between groups and lead to more successful collective action in the future. This is especially relevant in post‐conflict contexts where the conflict may have generated tensions within a village.
2.3.1 Social Acceptance To examine Hypothesis 3.1 we generated a standard version of a social distance scale, asking about a respondent’s comfort level with particular groups as members of the community, as landowners in the village, as leaders of the community, as close friends, and as kin by marriage. We focus our attention on how households think about three marginalized groups in particular: returnees from conflict displacement, new migrants to the area (often as a result of conflict), and ex‐combatants.
Table 10: Social Inclusion
Individuals in control communities
Individuals in treatment communities
Difference
Social distance scale (0‐5, with 5 being most accepting) Returnees 4.95
4.97
.02 (.01)
New Migrants 4.62
4.71
.09 (.06)
Ex‐Combatants 4.21
4.35
.14 (.12)
If you suddenly needed a small amount of money, can you think of a person from the following group who would lend you the money? Share saying yes… Returnees .43
.46
.02 (.04)
New Migrants .27
.33
.06 (.04)
Ex‐Combatants .23
.28
.05 (.04)
Some people benefit more than other people from decisions made in community meetings… Share saying that the poor benefit much less
.35
.27
‐.08*(.04)
Share saying that older people benefit much less
.19
.15
‐.04(.03)
Share saying that ex‐combatants benefit much less
.15
.09
‐.06**(.02)
*** Significant at 99%; ** Significant at 95%; * Significant at 90%. The table reports results from a t‐test comparing mean outcomes across individuals in control and treatment communities. Standard errors are clustered by community. There are approximately 1500 respondents for each outcome, about evenly divided between treatment and control communities.

21
As one can see in the first three rows of Table 10, expressed levels of comfort with these three groups are high in both treatment and control communities. 5 is the maximum score than can be achieved, indicating a respondent’s willingness to accept a member of the specified group in any of the roles mentioned above. Even with acceptance very high overall, respondents in CDR communities exhibit higher levels of acceptance of new migrants and ex‐combatants, although these results fall just below conventional levels of statistical significance. Other measures that asked about people being refused access to services also suggested that there are high levels of acceptance of different types of individuals in all communities. We also posed hypothetical questions about the types of situations individuals might encounter in their daily life. For example, if someone needed a small amount of money as a loan to meet household expenses, would they be able to find someone from a particular group who could assist them? We use this question – and one focused on whether people could identify someone to take care of their children – to gauge the extent to which returnees, new migrants, and ex‐combatants have been reinserted into the social fabric of the community. The results in Table 10 suggest that households in communities exposed to CDR are somewhat more likely to be able to think of returnees, new migrants, and ex‐combatants who would be willing to lend them money, than households in control communities. These results again are just below conventional levels of significance. The findings are almost identical (and in fact a bit stronger) for the question related to taking care of one’s children. A final strategy we pursue is to ask about the way in which different groups are treated in the context of community decision‐making processes. Recognizing that some groups benefit more than others from community meetings, we ask respondents to tell us the extent to which the interests of the poor, older generations, and ex‐combatants are reflected in the outcomes of community meetings. Consistently, individuals report that these three groups benefit much less than others from community processes; but it is clear from the final three rows of Table 10 , that these three groups are not perceived to do as poorly in CDR communities as in those in the control group, with two of the three findings significant at conventional levels.3
2.3.2 Social Tensions To examine Hypothesis 3.2 we examine the extent to which social conflict persists in villages in Northern Liberia. Table 11 reports measures of how respondents described the level of social tension that exists in their village. It is striking that on every measure, respondents in communities exposed to the CDR program report lower levels of tension than individuals from communities in the control group. While in most cases the difference in incidence in tensions is marginal, these tensions are reported to be less likely to escalate in treatment areas. A number of these findings also pass the conventional bar for statistical significance, with respondents reporting less tension between men and women, and lower levels of violent conflict among genders, between new migrants and 3 Although we do not address it here the survey data can be used to measure the extent to which these views are consistent with those held by the marginalized views themselves.

22
community members, and among tribes. Of course, it bears mention that reported levels of tension are very low overall; nonetheless, the CDR program seems to have further mitigated tension in those communities that benefitted from the program.
Table 11: Social Tensions
Individuals in control communities
Individuals in treatment communities
Difference
(se)
To what extent do the following differences tend to divide people in your town (1‐3, with 3 being very much)
Between rich and poor 1.28
1.22
‐.06(.04)
Between men and women 1.40
1.32
‐.08*(.05)
Between younger and older generations
1.28
1.23
‐.04(.03)
Between new migrants and community members
1.24
1.21
‐.04(.04)
Among religions 1.29
1.25
‐.04(.05)
Among tribes 1.28
1.22
‐.06(.05)
Among people of different education
1.19
1.17
‐.02(.03)
In the past six months, have these differences escalated into violence (1‐3, with 3 being often)
Between rich and poor 1.11
1.08
‐.02(.02)
Between men and women 1.27
1.20
‐.07*(.04)
Between younger and older generations
1.12
1.10
‐.03(.02)
Between new migrants and community members
1.13
1.08
‐.05**(.02)
Among religions 1.17
1.15
‐.03(.05)
Among tribes 1.18
1.10
‐.08*(.04)
Among people of different education
1.07
1.04
‐.03(.02)
Notes: *** Significant at 99%; ** Significant at 95%; * Significant at 90%. The table reports results from a t‐test comparing mean outcomes across individuals in control and treatment communities. Standard errors are clustered by community. There are approximately 1300‐1500 respondents for each outcome, about evenly divided between treatment and control communities. These findings are reinforced by results in our survey of town and village chiefs; on these identical questions, chiefs report lower levels of tension in communities exposed to the CDR program. But when initial answers to these questions from 2006 are taken into account in a difference‐in‐differences set‐up, there are no longer significant effects, although treatment communities generally experience a greater reduction in tension than control communities.

23
2.3.3 Collective Efficacy In seeking to ease tensions among groups, the hope is that CDR can improve the ability of communities to act collectively. We now turn to measures designed to capture collective efficacy, from the perspective of residents but also as reflected in their actions.
Table 12: Collective Efficacy
Individuals in control communities
Individuals in treatment communities
Difference(se)
Beliefs
Share agreeing strongly that “people in this town are willing to cooperate to improve things for the community”
.66
.62
‐.04 (.03)
Share disagreeing that the “town needs strong leadership from government because people here are not able to organize to do things”
.60
.70
.09*** (.03)
Actions Share reporting that in the past six month there, has there been a community initiative to…
Rebuild a school or clinic .26
.22
‐.03 (.03)
Organize roadbrushing .52
.55
.03 (.05)
Regrade a local road .20
.24
.04 (.03)
Dig or repair a well .20
.17
‐.03 (.03)
Organize security .12
.11
‐.01 (.02)
Improve agriculture .32
.28
‐.04 (.04)
Rebuild a church/mosque .23
.23
‐.01 (.03)
Notes: *** Significant at 99%; ** Significant at 95%; * Significant at 90%. The table reports results from a t‐test comparing mean outcomes across individuals in control and treatment communities. Standard errors are clustered by community. There are approximately 1500 respondents for each outcome, about evenly divided between treatment and control communities.
Table 12 presents estimates of the impact of CDR on a variety of measures of collective efficacy. We examine first how respondents describe the collective action potential of their communities. While individuals that experienced CDR are no more likely to report that their neighbors are willing to work together to improve things in the town, they are significantly more likely to believe that the town can achieve things on its own without strong leadership from government.

24
The remainder of the table emphasizes measures of reported instances of successful collective action. Although the evidence that CDR eased social tensions is reasonably strong, there is relatively little evidence of greater levels of community action. While village meetings were slightly more likely to be held in CDR communities (perhaps as a direct output of the CDR program), there is no consistent evidence that CDR communities were more likely to launch community efforts to improve local public goods. The results are very similar in a difference‐in‐differences analysis. Moreover, in results not reported here, levels of associational life are almost identical in CDR treatment and control communities, suggesting that the program itself does not lead to the sprouting of new organized associations.

25
3 Findings on Behavioral Outcomes To complement our survey‐based measures of social cohesion and approaches to decision making we sought direct measures of behavioral effects of the CDR program as revealed by behavior in “public goods games.” The public goods games were conducted in the largest village associated with each treatment and control community. The behavioral measures generated using this approach were not collected in coordination with IRC and did not employ IRC or DFID funding at any stage; nevertheless the randomization approach employed by IRC remained essential for allowing us to draw inferences from behavior in these exercises. In total 82 communities successfully completed the behavioral game, meaning that they selected three community representatives, identified a set of projects on which the money would be spent, and played a community‐wide public goods game. In one community, the game was halted during play as a result of a rule violation. To review the set up of the public goods games: In the hub town of each of the 83 IRC communities, individuals were selected at random from 24 randomly selected households, given 300 Liberian dollars in 100LD notes, and asked to decide (in private) how much to put into an envelope to be given to the community, and how much to keep for themselves or their family. After the decision, we gave each game player a short survey asking about his or her knowledge of community meetings held to discuss how the money would be spent, who the community representatives were, beliefs about how others would play the game, and so on. A community meeting was called after all the surveys were finished, at which the envelopes were opened and the money counted out. In addition to the main comparison between communities that received and did not receive an IRC CDR program, we also implemented two other experimental treatments in the play of the game. First, in the interest rate treatment, twelve individuals in each community knew that any money they contributed would be doubled by us when given to the community; the other twelve knew that any money they gave would be increased by us by a factor of five. These correspond to interest rates of 100% and 400% respectively. Second, for the gender treatment, in about half of the 83 communities, we told the community in advance that only women would be chosen to play the game, while in the other half we told the community that the game would be played by both men and women (and in those “mixed” communities we chose exactly 12 men and 12 women to play). The main advantage of the public goods game is that it captures behavioral outcomes. It puts us in a position to observe how communities conduct themselves when they confront major decisions and to what extent they are able to mobilize participation from community members. Moreover, because the public goods game was conducted nearly six months after the CDR program came to an end, it offers some evidence of the extent to which the effects we observe as short‐term, largely attitudinal changes (in the panel survey) persist and actually shape subsequent behavior.

26
3.1 Social Cohesion First, we examine data regarding the contribution levels we observed in communities during the public goods game. These measure individuals’ willingness to contribute community public goods, and thus can be viewed as a behavioral measure of social cohesion. The average payout to villages was 20,022LD and the median received was slightly higher at 20,850LD (out of total possible earnings of 25,200LD). Among individuals, nearly two thirds contributed the maximum amount (300LD). Only 10% kept the endowment in its entirety. It is worth noting that these contribution rates are impressively high, especially in light of the assumption – that Northern Liberia had significant intra‐community tensions – which guided the design of the program.
Table 13: Behavioral Measures of Social Cohesion
Control communities Treatment communities DifferenceOutcome (N) (N) (se) Share of available 75.9% 82.5% +6.5**funds earned (41) (41) (2.6)Average share of 75.1% 80.8% +5.7**300LD contributed (41) (41) (2.6)Share contributing 62.3% 71.3% +9.1**full amount (41) (41) (3.7)Notes: *** Significant at 99%; ** Significant at 95%; * Significant at 90%. The table reports the average treatment effect on the treated, with matching according to assignment to the gender composition treatment; standard errors allow for heteroskedasticity across strata. Results are reported for village level outcomes. Table 13 presents estimates of the impact of the CDR program on contributions in the public goods game. The first row shows the share of the total available funding earned, the second the average share of 300LD contributed by community members, and the third the share of individuals contributing the full amount. The final column reports average treatment effects estimated by taking a weighted average of the differences in outcomes between treated and untreated units in the women only and in the mixed gender sites. (Recall that in about half of the communities, the contribution game was played by 12 men and 12 women, while in the other half all 24 were women.) 4 We see that exposure to the CDR program led to an average 6.5 percentage point (or 7.5%) gain in the share of available funds earned by the community; the average share of the 300LD contributed by households increased by an estimated 5.7 percentage points (7.6%); and the share of households contributing the full amount increased by 9 percentage points (15%). These effects are each significant at the 95% level.
4 We report the average treatment effect on the treated here, matching on gender treatment because of a slight lack of balance in its assignment. Results from the simple average treatment effect, or a t test on the difference of means without matching, yield very similar results.

27
We can get some sense of the magnitude of the effect by examining how players responded to different interest rates. Quantitatively, the 5.7 point effect of the CDR treatment on individual contributions is about the same as the effect of a change in the social rate of return of an individual’s investment from 100% to 400%. This change in interest rates yields an estimated 5.8 percentage point change in individual contributions, an effect significant at the 99% level.5 In short, the impact of the CDR program on contribution rates is equivalent (in magnitude) to a substantial increase in the rate of return on people’s investments in community‐wide public goods.
3.2 Contributions by Socially Marginalized Groups While we observe higher levels of social cooperation in communities exposed to the CDR program, a specific goal of the program was to ensure the inclusion of traditionally underrepresented or alienated groups in community processes. As such, it makes sense to ask whether the CDR program increases the contribution rates of marginalized groups or simply strengthens the cooperative capacity of individuals already engaged in community life.
Table 14: Average Contribution by Subgroup
Control communities
(N) Treatment communities
(N) Difference
(se)
Individuals who were not born in the village
214(265)
239(272)
28*** (12)
Individuals who identify as internally displaced persons
218(317)
259(308)
44*** (15)
Individuals who are among the poorest in the village
222(418)
231(386)
12 (12)
Ex‐combatants 194(64)
225(72)
34 (26)
Women 235(735)
242(713)
9 (9)
Youth 219(465)
231(384)
15 (11)
Notes: *** Significant at 1%; ** Significant at 5%; * Significant at 10%. The table reports results from a weighted least squares regression with matching to account for different treatment assignment probabilities in women only and mixed gender sites and for women. Standard errors allow for heteroskedasticity across strata. Figures are in Liberian dollars (60LD is approximately 1 US dollar). We look specifically at six categories of people considered marginalized or disadvantaged in the Liberian context: individuals not born in the village, people who are currently internally
5 These estimates are calculated by examining differences between contributions by individuals facing a high and a low interest rate within villages under the assumption that behavior is not strongly sensitive to the composition of interest rates facing other players. For this analysis standard errors are clustered at the community level.

28
displaced in the country, the poor, ex‐combatants, women, and youth. Our measures of membership in these categories are based generally on self‐reported answers to our survey question; in addition, we categorize someone as among the poorest in the village if he or she has no chickens (about 40% of respondents) and as a youth if he or she is under 30 years old (also nearly 40% of respondents). In general, these groups are evenly distributed across treatment and control communities with the exception of youth, who represent a larger share of the population in control communities. Table 14 reports average contributions by members of a subset of marginalized groups targeted by the CDR program. The final column reports average treatment effects estimated by taking a weighted average of the differences in outcomes between treated and untreated units in the women only and the mixed gender sites and after matching on gender. In all cases, the average contribution of individuals from marginalized groups is higher in treatment communities than in control communities. These effects are large and statistically significant for individuals born outside of the village and for people who continue to be internally displaced as a result of the war. The effect for internally displaced people is substantively very large and accounts for a very large share of the overall treatment effect: IRC program communities do better in large part because IDPs living within them are more ready to contribute to social benefits than elsewhere.
3.3 Social Inclusion We can also explore the impact of the CDR program – and specifically, the extent to which the program created more inclusive community processes – by examining survey data collected from the 24 randomly sampled respondents who made contributions decisions about how the community organized itself to select representatives, choose the project, and mobilize people to participate in the game. In our analysis, we focus on a variety of measures of inclusiveness, emphasizing knowledge/awareness of the representatives and project, participation in the meetings, and attitudes about the quality of the representatives and projects selected. Table 15 reports average community‐level responses (i.e., the average share of community members giving a specific response across treatment or control communities) to a variety of survey questions. The final column reports average treatment effects estimated by taking a weighted average of the differences in outcomes between treated and untreated units in the women only and the mixed gender sites. Across measures, communities exposed to the CDR program appear to exhibit more inclusive processes. The strongest statistical results relate to the average share of respondents who attended the first meeting (which is nine percentage points higher in CDR communities) and the share who reported confidence in the community representatives (with CDR communities reporting that funds would “certainly” be put to good use at a rate seven percentage points higher). The other effects point in the direction of a positive impact of the CDR program, but are not statistically significant.

29
Table 15: Behavioral Measures of Inclusion and Democratic Governance
Control communities
(N)
Treatment communities
(N)
Difference (se)
Avg. share who attended the first meeting
.50(41)
.59(41)
.09* (.05)
Avg. share who reported other meetings being held on the project
.44(41)
.49(41)
.05 (.05)
Avg. share who reported knowing comm. reps
.30(41)
.37(41)
.07 (.05)
Avg. share who reported funds would “certainly” be put to good use
.80(41)
.87(41)
.07**(.03)
Avg. share who reported selected projects were among “most important” for village
.94(41)
.95(41)
.01 (.02)
Notes: *** Significant at 1%; ** Significant at 5%; * Significant at 10%. The table reports the average treatment effect on the treated, with matching according to assignment to the gender composition treatment; standard errors allow for heteroskedasticity across strata. Results are reported for village level outcomes.
3.4 Democratic Practices The behavioral exercise also permits us to observe the extent to which the CDR program has altered how the community is governed. Recall that a key hypothesis implicit in the CDR model is that exposure to community‐driven processes changes how people want to be governed, creating or strengthening a preference for democratic, transparent, and accountable governance. In the context of the community‐wide public goods game, we can ask whether CDR communities employed more democratic practices in the selection of community representatives and projects.
Table 16: Behavioral Measures of Democratic Practices
Control communities
(N)
Treatment communities
(N)
Difference (se)
Share of reps reporting that they were selected in a community meeting
.70(38)
.94(34)
.24***(.08)
Share of reps reporting that projects were selected at a community meeting
.82(37)
.94(36)
.12*(.07)
Notes: *** Significant at 1%; ** Significant at 5%; * Significant at 10%. The table reports the average treatment effect on the treated, with matching according to assignment to the gender composition treatment; standard errors allow for heteroskedasticity across strata. Results are reported for village level outcomes. Table 16 draws on survey evidence collected from the three community representatives who were presented to our teams as the people responsible for receiving the money and overseeing

30
the implementation of the project. While this measures potentially suffers from reporting bias, it has the advantage over more abstract survey questions in that it refers to specific and verifiable actions taken over the previous week. The table reports the share of community representatives who reported to us that they were selected in a community meeting, as opposed to in private (i.e., by the chief or the elders). It also reports the share that said projects were selected in a public meeting. Recall that our protocol provided no instructions about how these representatives or the community project were to be selected, so these observed practices reflect existing norms and power relations in each community. Representatives in treatment communities report being selected in a community meeting at a rate 24 percentage points higher than in control communities. The CDR program also appears to have increased the likelihood that project selection is broadly participatory, although the effect is smaller in magnitude and the rate at which communities report undertaking participatory consultation begins from a high baseline.

31
4 Discussion We close our exposition of findings with a discussion of methodological issues, noting possible methodological concerns and lessons learned.
4.1 Confounding Factors? A common concern raised in any evaluation is how does one know with confidence that ultimate differences between project and comparison communities are due to the program itself and not due to other “confounding” factors. There are many factors that could in principle affect a program like this: the project areas could have different populations, geographies, conflict experiences or other attributes when compared to the comparison communities. Perhaps they were selected because they were areas that were particularly receptive to outside intervention, or particularly willing to try out the project’s participatory approach. Such considerations typically render program evaluation extremely difficult. In the presence of such concerns readers often want to know if researchers have “controlled” for other factors. In the analysis provided here however we have typically not controlled for any other factors. The reason is that the approach used here, randomized intervention, provides exceptional confidence that such third factors are not in operation. We know with confidence that programs were not in operation in particular sites because of attributes of those sites and that individuals were not exposed to the program because of attributes of those individuals. While it is possible (and to some extent inevitable) that there are differences between program and control areas, there is, in this case, no reason to expect there to be any systematic biases one way or another. For this reason we can present the outcomes in there simplest form, as raw comparisons between treatment and control areas. Nevertheless there could be two possible sources of confounding. One is that, by chance, program areas could happen to be different than control areas on some important criterion. In our analysis we find evidence that this is true to some extent of rurality—programs were more likely to take place in rural areas. In response we have undertaken robustness tests for the main results reported here and indicate the few cases in which this feature is of consequence. The second type of concern is that selection into the program could induce other changes which affect outcomes but which are not directly attributable to the program (that is they are attributable to selection into the program but not to the program itself). Notably it is possible that once selected to a program a community becomes more likely to receive more (or less) aid from different sources. To examine this possibility we collected data on other programs taking place in the area but find no evidence that selection into the CDR program resulted in differences in exposure to other development programs.

32
4.2 Are Communities Just Telling Us What We Want to Hear? It is natural to ask whether the treatment effects we observe reflect real changes in attitudes and behavior, or rather the fact that CDR treatment communities learned what to say and how to act in order to please outsiders. This concern is most relevant to the survey results. The surveys reveal extraordinarily high levels of support for democratic practices, very low levels of social tension, a rich associational life, and a strong willingness of individuals to be engaged in community problems. These levels – high across both treatment and control communities – may in part reflect the fact that our respondents are aware of the “right” answers to many of the survey questions. Liberians are bombarded with messages urging them to support democracy, to embrace women’s rights, and not to treat people differently because of their tribe from donors and the national government. Indeed, this may be a part of the reason that the impact of the CDR program is harder to pick up in the survey results. But for those treatment effects we do pick up in the survey – especially those that relate to levels of community tension and a willingness to embrace marginalized groups – it is a real possibility that CDR cued individuals to these issues without substantively changing their attitudes or behavior. The fact that the survey was carried out so soon after the program ended, and with the support of the IRC, reinforces this worry. While this possibility cannot be completely ruled out, we think it is unlikely that this explanation accounts for the results in the behavioral games. First, it is highly unlikely that CDR communities contributed more because they thought this would help them get more funding from the IRC. The IRC was never mentioned in the behavioral games, and the games were implemented by an organization not linked to the IRC in any way, by teams that did not even know which communities had received the CDR treatment. Second, unlike with survey responses there is a real private cost in the games to taking an action motivated purely by a desire to please outsiders; moreover, the actions are taken in private and the benefits diffused over the community. Thus, the counterargument would have to be that exposure to the IRC CDR program greatly increased individuals’ expectations that contributing would bring about more funding from NGOs. Given that many of the control communities have also received NGO projects, and that it could also be the case that communities underserved by NGO projects would have an even greater motivation to please outsiders, it seems unlikely that differential “desire to please” explains the strong differences in individual behavior across treatment and control communities. So, altogether we think the evidence is strong that the CDR program actually changed attitudes and patterns of behavior.
4.3 External Validity: Is This a Typical IRC CDR Program? A final concern relates to the possibility that the results here are not general with respect to CDR programs elsewhere. For this reason it is useful to assess whether this CDR program is typical of IRC efforts in other contexts. Are we observing these effects because the project was
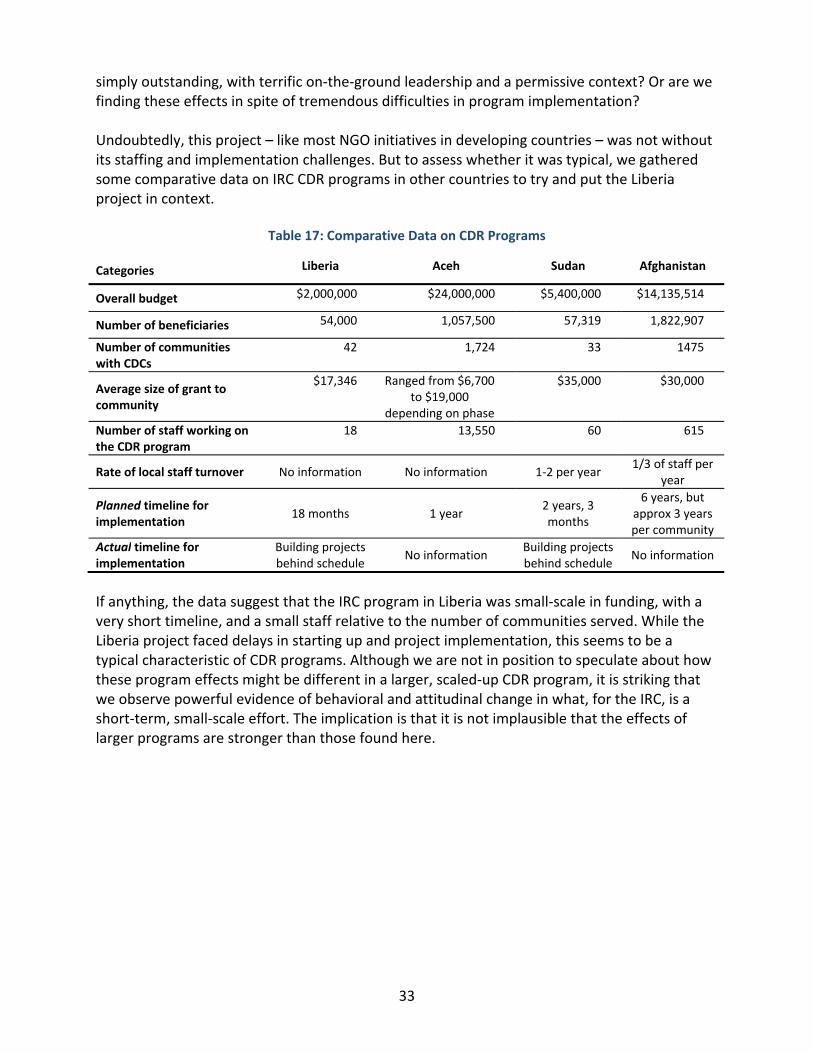
33
simply outstanding, with terrific on‐the‐ground leadership and a permissive context? Or are we finding these effects in spite of tremendous difficulties in program implementation? Undoubtedly, this project – like most NGO initiatives in developing countries – was not without its staffing and implementation challenges. But to assess whether it was typical, we gathered some comparative data on IRC CDR programs in other countries to try and put the Liberia project in context.
Table 17: Comparative Data on CDR Programs
Categories Liberia Aceh Sudan Afghanistan
Overall budget $2,000,000 $24,000,000 $5,400,000 $14,135,514
Number of beneficiaries 54,000 1,057,500 57,319 1,822,907
Number of communities with CDCs
42 1,724 33 1475
Average size of grant to community
$17,346 Ranged from $6,700to $19,000
depending on phase
$35,000 $30,000
Number of staff working on the CDR program
18 13,550 60 615
Rate of local staff turnover No information No information 1‐2 per year 1/3 of staff per
year
Planned timeline for implementation
18 months 1 year 2 years, 3 months
6 years, but approx 3 years per community
Actual timeline for implementation
Building projects behind schedule
No information Building projects behind schedule
No information
If anything, the data suggest that the IRC program in Liberia was small‐scale in funding, with a very short timeline, and a small staff relative to the number of communities served. While the Liberia project faced delays in starting up and project implementation, this seems to be a typical characteristic of CDR programs. Although we are not in position to speculate about how these program effects might be different in a larger, scaled‐up CDR program, it is striking that we observe powerful evidence of behavioral and attitudinal change in what, for the IRC, is a short‐term, small‐scale effort. The implication is that it is not implausible that the effects of larger programs are stronger than those found here.

34
4.4 Lessons on Evaluation We close with some comments on lessons on evaluation that we learned in the course of this evaluation.
4.4.1 Program Assumptions We have focused our discussion on differences between treatment and control communities and not on the levels of outcomes in each. In fact however it is clear that for many outcomes the levels of outcomes such as cohesion, democratic attitudes, or social acceptance, were very high both in treatment and control communities. These findings are inconsistent with some of the assumptions underscoring the CDR approach as described in Box 1 above. Communities did not seem especially divided at the outset, there were few problems of acceptance, there was little evidence of a crisis in leadership or a sense of political exclusion. Having such information before the evaluation started could have led to the collection of a more appropriate set of measures but could also have helped shape program design. In standard practice, baseline measures are often taken only after a program design has been completed; our results suggest however that this may be too late.
4.4.2 Ethics of Randomization An obvious concern with the use of randomization for the delivery of aid in a post conflict setting is that it could give rise to jealousies between communities who do and do not receive benefits and could conceivably lead to conflict. On the other hand there are clear benefits; not only is the procedure equitable in the sense of giving all equally needy communities an equal opportunity to benefit, it is also transparent. Communities can see how they were or were not selected and do not have to resort to theories of systematic exclusion or favoritism. Because of these concerns we monitored the lottery process for early indications of conflict risks. Reports from the field strongly indicated that not only were there no conflicts resulting from the randomization but that communities did indeed view the process favorably and appreciated the equity of the procedure. From our own fieldwork on this project, it seems clear that the views of Liberians resonate with the government’s and NGO’s emphasis on the importance of “transparency,” and that they saw the public lottery to decide project allocation as a transparent and fair procedure. While randomization should continue to be monitored closely this experience suggests that the potential for a randomized approach is greater than many have suggested.

35
4.4.3 Measures Many of the outcomes of interest for this study – attitudes, cohesion, acceptance—are intangible. A standard approach to measuring such outcomes is to use surveys of random samples of respondents. While there are great benefits to this approach, as described in Section 4.2 above, there are also real concerns of reporting bias. In response we turned to the use of behavioral games. We did so with some apprehension however, viewing the behavioral tests as exceptionally difficult tests of program impact. In fact this approach yielded some of our strongest results. We believe this experience can serve as an encouragement for others hoping to move beyond surveys to gather compelling measures for abstract outcomes.

36
5 Conclusions and Implications This report covers a great deal of ground, with measures drawn from the panel survey as well as behavioral games to test hypotheses linking CDR to a wide variety of outcomes. How do we make an overall assessment of program impact based on all of these different measures? On some measures these effects are significant; on many, there are not. Moreover, ideally for each measure we would have a quantitative target (other than zero) against which we could examine our estimated effect sizes. In the absence of good information about the potential effects of programs of this form however, identifying such targets is very difficult; it is simply not known for example how “large” an effect a CDR program can have on community cohesion, moreover for many of the outcomes considered here there is no widely recognized metric on which such goals could be based. As the number of studies of this form increase, goal setting of this form may become easier. In the meantime, the approach we have used is to examine outcomes against a “null hypothesis” of no effect. We ask for each separate outcome what we would expect to see if the IRC CDR program in fact had no effect on people’s material circumstances, attitudes, or behaviors as reported in the survey and examine how different what we observe is from this null outcome. This is the standard statistical approach for analyzing survey data. However, in this case (and often in others), looking for “statistically significant” differences between treatment and control groups outcome by outcome may not be the best way to provide an overall assessment of the results. For an overall assessment, we should ask not just about outcome‐by‐outcome results, but whether there are larger patterns across outcomes and how likely they would be to appear by chance if the CDR program in fact had no impact. Call an effect estimate “supportive” if it is consistent with the hypothesized effect of the CDR program. If the program had no impact or no consistent impact, then we would expect to find a roughly equal number of supportive and unsupportive effect estimates, and about 5% would appear to be supportive and “statistically significant.” What we actually find is quite different. The direction of the effect estimates is far more often supportive than unsupportive. And when the estimated treatment effects are statistically significant, they are almost always in the supportive direction. For over 20% of our 90 outcome measures reported here, we find statistically significant effects in a direction supportive of a positive CDR program effect. Moreover, for 73% of the outcome measures in the survey data, we estimate a positive effect of the CDR program. In only 2% of cases is there a priori evidence of a significant adverse effect and in these cases the adverse effects can be accounted for by baseline variation. These patterns are summarized in Figure 1 below. They are consistent with, and strongly reinforced by, the positive assessment of program impact emerging from our behavioral measures.

37
Figure 1: Summary of statistical results
The overall assessment then is positive. However, there is much variation across objectives. Table 18 provides a summary of which hypotheses found strong or weak support in this evaluation. Some hypotheses receive strong support, some receive no support at all. Taken together, the data are generally supportive of the following conclusions:
• The CDR program had a measurable, positive impact on the level of community cohesion. Communities exposed to the CDR program appear better able to act collectively after the program’s completion to improve their own welfare. The evidence for this in the surveys is relatively weak, but our behavioral measures provide strong evidence that CDR communities can significantly outperform control communities in raising funds to implement a community project.
• Exposure to CDR also appears to have increased social inclusion in beneficiary
communities, especially for marginalized groups. The behavioral evidence on this is powerful, with greater knowledge and awareness of the community project and faith in the representatives and projects chosen. Moreover, traditionally marginalized groups made significantly higher contributions to the community project in CDR communities. Survey evidence is also supportive of this conclusion, with individuals in CDR communities reporting less social tension and exhibiting greater acceptance of traditionally marginalized groups.
• The CDR program also reinforced democratic values and practices. The evidence in the
surveys provides some evidence for greater support for elections and participatory processes in treatment communities. The behavioral games demonstrate these values in practice, with a higher likelihood of democratic selection processes for community representatives and projects in communities that experienced CDR. Baseline support for these values and practices were however high and there is no evidence that the program altered these values among our sample of town chiefs.

38
Table 18: Summary of Substantive Results
# HYPOTHESIS OUTCOME 1 Welfare 1.1
The program will result in improved access to health, education, water sources and other basic amenities
Improved access to education
MODERATE SUPPORT
1.2 The program will result in greater opportunities for income generation and wealth creation
Weak evidence for gains in small asset holdings and employment
WEAK
SUPPORT
2. Local Governance
2.1 The program will change how individuals think about decision making at local levels, in favor of transparency, accountability, and inclusiveness.
Most respondents already hold these attitudes. More transparent approaches used in behavioral games.
WEAK
SUPPORT
2.2 The program will change how leaders think about decision making at local levels, in favor of transparency, accountability, and inclusiveness.
Most chiefs already hold these attitudes. No gains in treatment areas.
NO
SUPPORT
2.3 The program will change the citizens’ sense of personal efficacy and confidence that they can affect community decision making
Weak gains on multiple measures and significant rise in interest in elections.
WEAK
SUPPORT
2.4 The program will provide citizens with greater confidence in institutions for decision‐making in their communities.
Increased trust in community leaders on multiple measures.
HYPOTHESISSUPPORTED
3. Community Cohesion
3.1 The program will result in greater acceptance of individuals, specifically conflict victims, displaced persons and ex‐combatants
High baseline levels of acceptance. Some evidence of greater inclusion of poor and ex‐combatants.
WEAK
SUPPORT
3.2 The program will result in reduced tensions between groups and a greater ability to resolve tensions non‐violently
Weak effect on existence of tensions but evidence that tensions less likely to become violent
MODERATE SUPPORT
3.3 The program will enhance the community’s ability to act collectively
Strong evidence from behavioral measures that communities can work together more effectively.
HYPOTHESISSUPPORTED

39
• There is little evidence of positive improvements in material well‐being related to the CDR program. While the data do suggest an improvement in local public goods – consistent with the focus of communities on the construction of community facilities – this does not appear to have translated into household‐level welfare improvement. The main finding on welfare is that access to education improves significantly. Evidence for gains in livelihoods and asset holdings are however weak.
As studies of this form accumulate it will be useful to put them in the context of evaluations of CDR projects by IRC and other implementing agencies. In anticipation of such a comparison, we contrast the findings with our initial expectations going into the project. In fact, we did not expect to find nearly as strong and positive results as those reported above. We expected that we might find some evidence of attitudinal change in the survey data, which we thought would most likely reflect an “indoctrination effect” more than any deep change in beliefs and practice. Thus, we expected that we would probably not find evidence of improved ability to cooperate to provide public goods in the behavioral games. We thought it possible that we might find some evidence of behavioral effects in how CDR‐treated communities organized to choose community representatives and projects in the behavioral games. But we were doubtful that actual contributions would differ systematically across treatment and control groups. These pessimistic expectations were based on our own experiences with aid projects in developing countries, and on a large academic literature that casts doubt on the ability of foreign aid to have much real impact on deeply rooted patterns of social cooperation, conflict, and local governance structures. Such studies point to the scope for adverse effects on political dynamics (Gugerty and Kremer 2008) and to the risks of misuse of project assets (Ensminger, 2007). Even if we ignore concerns about the possible capture of projects by local elites or about the robustness of local political cultures, another reason to expect to find little apparent impact is that the outcomes in question – attitudes and practices concerning governance and social cohesion – are so hard to measure (Murphy 1990). Development practitioners are at the beginning of the road in terms of understanding how to conceptualize and operationalize these project aims. Finally, an 18‐month project of this sort would seem inherently limited in how much it can achieve, given the scale of the problems compared to the time, staff, and other resources available. Under such circumstances we find the evidence of positive program impact – which for a number of the hypothesized outcomes is clear and fairly unambiguous because this was a randomized controlled study – to be remarkable. We find it particularly interesting that the evidence for a causal impact of the CDR program seems if anything stronger in the behavioral measures than in the attitudinal survey data. Attitudinal surveys are the standard tool for relatively rigorous evaluations of post‐conflict governance aid programming. The results presented above may suggest that even so they are very noisy measures that may fail to pick up behavioral change (that one might have thought would be hard to accomplish). Future work on evaluation might try to develop an array of behavioral measures ranging from a community‐wide public goods game like that used here, to simpler and more targeted behavioral measures that could be more easily implemented.

40
6 References Arcand, J. and Bassole, L. 2007. “Does community driven development work? Evidence from
Senegal” Working Paper CERDI . Cliffe, Sarah, Scott Guggenheim and Markus Kostner. 2003. "Community‐Driven Reconstruction
as an Instrument in War‐to‐Peace Transitions "CPR Working Papers, No. Ensminger, Jean. 2007. “Getting to the Bottom of Corruption: A Case Study in Community
Driven Development,” Unpublished manuscript, Caltech. Gugerty, Mary Kay and Michael Kremer, “Outside Funding and the Dynamics of Participation in
Community Associations”, Volume 52, Number 3, July 2008 , pp. 585‐602(18) Labonne, Julien and Robert S. Chase. 2008. Do Community‐Driven Development Projects
Enhance Social Capital? Evidence from the Philippines, World Bank Policy Research Working Paper No. 4678
Masuri, Ghazala and Vijayendra Rao. 2004. “Community‐Based and –Driven Development: A Critical Review,” World Bank Research Observer, 19(1): 1‐39.
Murphy, William P. 1990. “Creating the Appearance of Consensus in Mende Political Discourse,” American Anthropologist 92:1.
Richards, Paul et al. 2005. “Community Cohesion in Liberia,” Social Development Paper 21, The World Bank.
The World Bank. 2003. Breaking the Conflict Trap: Civil War and Development Policy. Washington, DC: The World Bank.