Community (Dis)Organization and Racially Motivated Crime1
49
AJS Volume 113 Number 3 (November 2007): 815–63 815 2007 by The University of Chicago. All rights reserved. 0002-9602/2007/11303-0006$10.00 Community (Dis)Organization and Racially Motivated Crime 1 Christopher J. Lyons University of New Mexico This article examines the relationship between community structural conditions and racially motivated crimes against blacks and whites. Drawing on six years of police reports, census data, and survey data of Chicago communities, the study evaluates alternative hypotheses about the social organization of racial hate crime derived from social disorganization, resource competition, and defended communities perspectives. Multivariate analyses controlling for spatial autocor- relation reveal that antiblack hate crimes, in contrast to general forms of crime, are more likely in relatively organized communities with high levels of informal social control. Conversely, antiwhite incidents appear more numerous in traditionally disorganized com- munities, especially those characterized by residential instability. Acts of violence and discrimination motivated by racial animus are “in- terwoven with the fabric of our culture” (Newton and Newton 1991, p. ix). In the United States alone, history abounds with examples of racial and ethnic violence, from the well-known extremes of slavery and lynch- ing of African-Americans, to the genocide of Native Americans, to more mundane yet pervasive forms of discrimination and harassment. Given the indelible marks of interracial violence on our history, and on our current conceptions of racial and ethnic identity, social scientists have sought for centuries to understand the nature of intergroup conflict. Interest in the study of intergroup criminal victimization has grown 1 A dissertation fellowship from the Harry Frank Guggenheim Foundation supported this research. I thank Ross L. Matsueda, Becky Pettit, Stew Tolnay, Bob Crutchfield, and the AJS reviewers for helpful suggestions. I also thank the Chicago Police De- partment, the Chicago Commission on Human Relations, and the Project on Human Development in Chicago Neighborhoods for sharing data. An earlier version of this article was presented at the 2005 American Sociological Association meetings in Phil- adelphia. Direct correspondence to Christopher J. Lyons, Department of Sociology, MSC 05 3080, 1 University of New Mexico, Albuquerque, New Mexico 87131-0001. E-mail: [email protected]
Transcript of Community (Dis)Organization and Racially Motivated Crime1
AJS Volume 113 Number 3 (November 2007): 815–63 815
� 2007 by The University of Chicago. All rights reserved.0002-9602/2007/11303-0006$10.00
Community (Dis)Organization and RaciallyMotivated Crime1
Christopher J. LyonsUniversity of New Mexico
This article examines the relationship between community structuralconditions and racially motivated crimes against blacks and whites.Drawing on six years of police reports, census data, and survey dataof Chicago communities, the study evaluates alternative hypothesesabout the social organization of racial hate crime derived from socialdisorganization, resource competition, and defended communitiesperspectives. Multivariate analyses controlling for spatial autocor-relation reveal that antiblack hate crimes, in contrast to generalforms of crime, are more likely in relatively organized communitieswith high levels of informal social control. Conversely, antiwhiteincidents appear more numerous in traditionally disorganized com-munities, especially those characterized by residential instability.
Acts of violence and discrimination motivated by racial animus are “in-terwoven with the fabric of our culture” (Newton and Newton 1991, p.ix). In the United States alone, history abounds with examples of racialand ethnic violence, from the well-known extremes of slavery and lynch-ing of African-Americans, to the genocide of Native Americans, to moremundane yet pervasive forms of discrimination and harassment. Giventhe indelible marks of interracial violence on our history, and on ourcurrent conceptions of racial and ethnic identity, social scientists havesought for centuries to understand the nature of intergroup conflict.
Interest in the study of intergroup criminal victimization has grown
1 A dissertation fellowship from the Harry Frank Guggenheim Foundation supportedthis research. I thank Ross L. Matsueda, Becky Pettit, Stew Tolnay, Bob Crutchfield,and the AJS reviewers for helpful suggestions. I also thank the Chicago Police De-partment, the Chicago Commission on Human Relations, and the Project on HumanDevelopment in Chicago Neighborhoods for sharing data. An earlier version of thisarticle was presented at the 2005 American Sociological Association meetings in Phil-adelphia. Direct correspondence to Christopher J. Lyons, Department of Sociology,MSC 05 3080, 1 University of New Mexico, Albuquerque, New Mexico 87131-0001.E-mail: [email protected]
American Journal of Sociology
816
with the emergence of hate crime as a new criminal category (Green,McFalls, and Smith 2001). Modern hate crime policy represents an attemptto engage the legal system in combating criminal acts motivated by prej-udice (Grattet, Jenness, and Curry 1998; Levin 2002). Since the appear-ance of hate crime legislation in the early 1980s (Grattet et al. 1998), hatecrimes are now widely understood as criminal offenses motivated at leastpartially by offender prejudice against the victim’s putative group mem-bership (FBI 1999a). As a legal concept, then, hate crime distinguishesbetween crime motivated by bias and otherwise similar crime.
We know little about the spatial distribution of racially motivated crime,especially compared to other forms of crime. For instance, what are thecharacteristics of communities that facilitate racial hate crime? Beginningwith the seminal work of Coleman (1988), sociologists have argued thatsocial capital facilitates various forms of instrumental action—includingcommunity social organization against crime (Sampson, Morenoff, andEarls 1999). Yet social capital may also have a “darker side” insofar asit can be appropriated for other, perhaps illegal actions, such as subversivebehavior or the exclusion of racial outsiders (Coleman 1988; Portes 1998;Putnam 2000; Sampson 1999). Although criminologists have long invokedthe concept of social disorganization to explain why communities low ineconomic and social capital have higher crime rates, it is unclear howcommunity organization explains the special case of crime motivated byracial animus. Are racial hate crimes the product of socially disorganizedcommunities low in economic and social capital? Or are racially motivatedcrimes more likely in communities with substantial resources to excludeoutsiders?
Given the impact of hate crimes on communities, questions related tocommunity-level variation are particularly pertinent. Proponents of hatecrime legislation argue that hate crimes are symbolic crimes that targetwhole communities as well as individual victims. Often the particularvictim matters less to the offender than the victim’s social categorization(Berk, Boyd, and Hamner 1992; Levin and McDevitt 1993). Thus, anattack against one individual may have a “ripple effect” that reverberatesto the wider community. Even relatively minor acts, in terms of penallaw, can raise levels of fear and mistrust between groups and communities,exacerbating already tense relations between racial groups and elevatingthe potential for retaliation (Craig 1999; Martin 1995; Wisconsin v. Mitch-ell 1993). Indeed, some city departments have focused on the communitycontext in the hopes of alleviating conflicts before they escalate into largerproblems. To intervene successfully at the community level, we need tounderstand the community factors that lead to variation in hate crimes.
The paucity of research on the spatial distribution of hate crime par-tially reflects concerns about the reliability of hate crime data. As Black
Racially Motivated Crime
817
(1983, p. 40) suggested over two decades ago, moralistic crimes of “col-lective liability” such as racially motivated hate crime may “receive adegree of immunity from the law.” As with all official crime data, hatecrime data represent only those incidents that come to the attention ofthe police department. Many argue that hate crime victims may be re-luctant to report incidents to the police out of fear of secondary victim-ization, humiliation, or the ambivalence of the police or the larger com-munity (McDevitt et al. 2000; Herek and Berrill 1992; Comstock 1991;Perry 2001). Recent victimization research, however, suggests the opposite:victims may be more likely to report hate crimes than nonbias crimes,possibly because hate crimes are perceived as more serious (StatisticsCanada 1999). Even if potential incidents are more likely to come to theattention of the police, an unknown quantity of “true” hate crimes maynot be classified as such by authorities, as some incidents do not providenecessary detail to meet classification criteria. Additional concerns aboutthe reliability of official data stem from different reporting and classifi-cation standards across jurisdictions (Nolan, Akiyama, and Berhanu 2002;McDevitt et al. 2000). This latter issue in particular renders problematicanalyses of the spatial distribution of hate crimes across agencies, counties,states, and countries.
Perhaps for these reasons, research has tended to focus on importantconcerns other than etiology, including the political emergence of hatecrime as a social problem (e.g., Jacobs and Potter 1998; Jenness and Broad1997; Jenness and Grattet 2001), the diffusion and institutionalization ofhate crime laws (e.g., Grattet et al. 1998; Phillips and Grattet 2000; Sav-elsberg and King 2005), the social production of hate crime statistics(Martin 1995; Boyd, Berk, and Hamner 1996), and hate crime reportingas an indicator of social movement success (McVeigh, Welch, and Bjar-nason 2003). With the exception of Green, Strolovitch, and Wong’s 1998study of hate crimes in New York City, questions related to the antecedentsof hate-motivated behavior remain relatively unexplored.
This article attempts to address this gap by exploring the characteristicsof communities that explain variation in hate crime. In doing so, it joinsa long tradition of “Chicago-style” research (Sampson 2002b) by focusingon the role of community social organization in shaping crime—in thiscase, racially motivated crime in Chicago. By focusing on hate crimevariation within a single jurisdiction (Chicago), the study circumventssome of the concerns of reporting bias, particularly those related to mea-surement inconsistencies across agencies. As others have argued (Greenet al. 1998), reporting biases should be relatively similar across commu-nities because data are collected by a single department with an estab-lished tradition of hate crime reporting. Although focusing on community-level variation may not eliminate fundamental concerns about decisions

American Journal of Sociology
818
to report or classify hate crimes (Boyd, Berk, and Hamner 1996), it maypresent our most reliable insight into the spatial patterning of raciallymotivated crime.
This study explores the extent to which ecological theories of crime andinterracial conflict explain the distribution of hate crime against blacksand whites. Despite evidence that antiwhite hate crimes are the mostfrequently reported category of hate crime after antiblack incidents (FBI1999a; Strom 2001), researchers have rarely examined antiminority andantimajority victimization together. Three general perspectives on crimeand interracial conflict offer divergent expectations about the relationshipbetween racial hate crime and the economic and social capital of com-munities. Assuming that hate crime is similar to crime generally, socialdisorganization theory predicts more hate crimes in disadvantaged areaswith low levels of social capital. Traditional resource competition theoriesspecify that hate crimes are most likely when competition between racialgroups increases, especially during economic downturns when resourcesare scarce. In contrast, a defended community perspective implies thatinterracial antagonism is most likely in economically and socially orga-nized communities able to use these resources to exclude racial outsiders.I explore each of these perspectives further below. Then, drawing on sixyears of Chicago police records, census data, and survey data on socialcohesion and informal social control in Chicago communities, I evaluatetheir implications for the community-level correlates of antiblack andantiwhite hate crime.
THE ECOLOGY OF INTERRACIAL CONFLICT
Social Disorganization
The most prominent explanation for community-level variation in generalcrime focuses on the deterioration of community social controls broughtabout by certain structural conditions. In their pioneering study of urbancommunities, Shaw and McKay (1942) argued that ecological features,such as economic status, residential mobility, and racial heterogeneity,influenced delinquency rates largely indirectly by upsetting communitysocial organization. Later revised by Kornhauser (1974) and others (e.g.,Bursik 1988; Sampson and Groves 1989), Shaw and McKay’s concept ofsocial disorganization has come to refer to a condition of weak controlsin which communities are unable to achieve collective goals, such as lowcrime rates. According to Kornhauser (1978, pp. 64–65), the most impor-tant determinant of social organization is economic status, since poorercommunities have fewer resources to combat crime. To a lesser extent,population mobility and racial heterogeneity also impede a community’s
Racially Motivated Crime
819
ability to mobilize effectively against crime. A rich research traditiongenerally affirms the ecological correlation between these structural fea-tures and a variety of criminal outcomes, including juvenile delinquency,homicide, and violent crime.
Applying a disorganization perspective to explain racial hate crimeassumes that the antecedents of hate crime are therefore similar to thoseof other types of crime. That is, as with crime in general, economic dep-rivation, along with racial heterogeneity and residential instability, shouldinfluence both antiblack and antiwhite hate crime indirectly through com-munity controls. Communities facing economic downturns and other so-cial changes may be unable to exercise control over the dislocated, whomay act on their impulses and racial prejudices. In addition, formal re-sources may also be important for combating racially motivated crime.Impoverished communities may experience more racial hate crime partlybecause they are less able to invest in social programs for police designedto promote tolerance or directly prevent hate crimes (van Dyke, Soule,and Widom 2001, p. 40).
Whether hate crimes are the result of informal social control, however,cannot easily be resolved by ecological analyses based on census dataalone. Investigation into the potential mechanisms that intervene betweenstructural conditions and hate crime requires attention to informal insti-tutional processes at the community level, such as social cohesion andtrust and norms of informal social control. Informed by a “systemic” ornetwork model of community organization, recent elaborations of socialdisorganization theory have begun to assess more directly the informalsocial control mechanisms implied by social disorganization theory. Thesystemic model elaborated by Kasarda and Janowitz (1974) conceives ofthe community as a complex network of social relationships, ranging fromclose friendship and kinship ties to more diffuse associations with othersand with institutions. A network conception of community directs atten-tion to the constraining and enabling potential of “social relations amongpersons and the structural connections among positions” within a givenecological unit (Sampson 1999, p. 255). In other words, the systemic modelfocuses on social capital, or the structures of relationships among peoplethat facilitate action (Coleman 1988; Sampson et al 1999).
Sampson and colleagues (Morenoff, Sampson, and Raudenbush 2001;Sampson, Raudenbush, and Earls 1997) conceptualize “collective efficacy”as a key component of community social capital that mediates betweenecological conditions and crime. Generated from surveys of residents’perceptions of their communities, collective efficacy consists of two un-derlying constructs: (1) social cohesion and trust and (2) norms of informalsocial control in relation to widely held goals of public safety and crimeprevention. Thus defined, efficacious neighborhoods are cohesive neigh-
American Journal of Sociology
820
borhoods characterized by expectations for informal surveillance, espe-cially of youths, and intervention in problems leading to the control ofpotential criminal elements. In numerous studies, Sampson and colleaguesdemonstrate that collective efficacy works to prevent delinquency, vio-lence, and property crime. In addition, collective efficacy largely mediatesthe effect of macrostructural features, as social disorganization theorywould predict.
Collective efficacy is oriented toward crime and safety in general (Samp-son 2002a, p. 101) and is not necessarily meant to explain interracialconflict. The question remains, however, whether the pursuit of socialgoods such as public safety facilitates the control of interracial conflict aswell. If hate crimes are etiologically similar to other forms of crime, areashigh in social cohesion/trust and informal social control should be ableto prevent hate crime just as they are able to prevent other types of crime.Because youths are more likely than those of most other age groups tobe victims and offenders of hate crime (Strom 2001), close supervision ofyouths may discourage potential hate crime incidents. In much the samemanner that German families with sufficient social capital are able toprevent children from engaging in antiforeigner violence (Hagan, Mer-kens, and Boehnke 1995), communities with substantial cohesion andinformal social control may be able to regulate youths’ behavior, dis-suading them from similarly racist hate crimes.
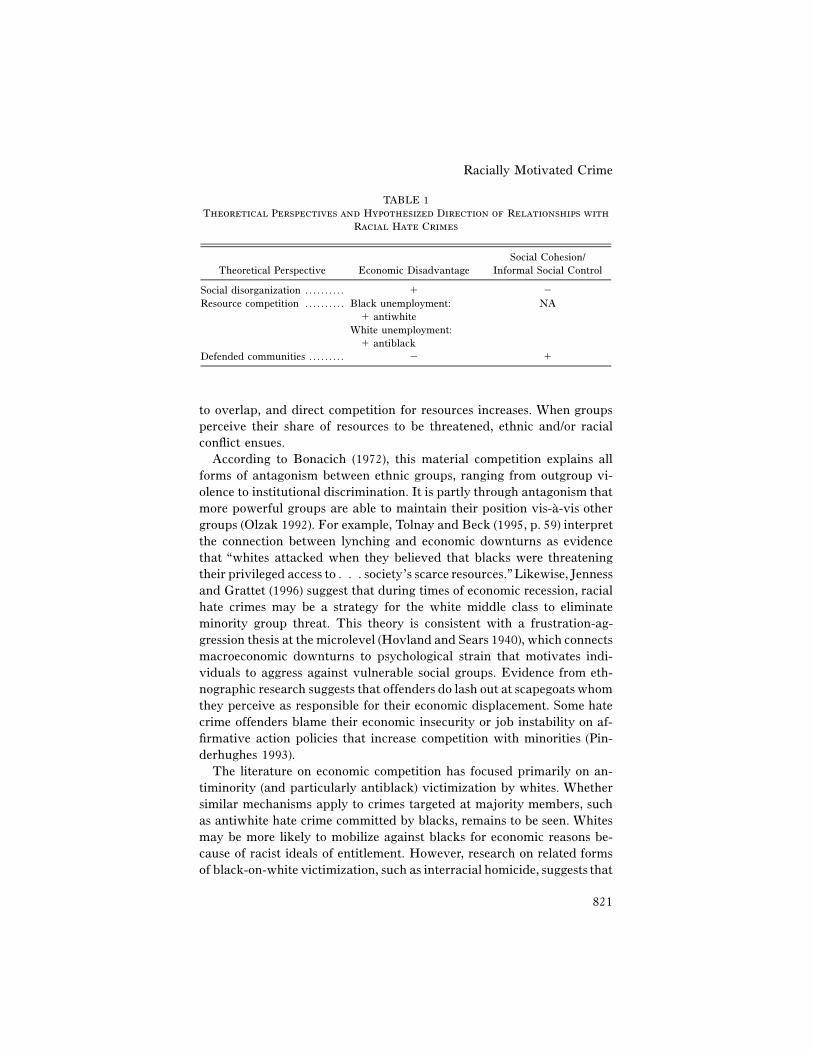
In sum, social disorganization theory predicts more hate crime in ec-onomically disadvantaged and residentially unstable communities. Fur-thermore, communities with high levels of social cohesion and norms ofinformal social control with respect to crime in general should exhibitlower amounts of racially motivated crime (see table 1).
Resource Competition
Rather than focusing on the deterioration of social controls, competitiontheories predict that racial conflicts covary with the degree of intergroupcompetition for limited resources in a shared environment (Olzak 1990;Soule and van Dyke 1999; van Dyke et al. 2001). Because groups occupydifferent positions or “niches” in the environment, competition for scarceresources renders group identities and boundaries salient, increasing thelikelihood that individuals will align their actions with the interests oftheir ethnic group (Olzak 1992). In modern economies, labor markets areoften segmented by race and ethnicity. Therefore, niches often do notoverlap, and groups may not directly compete for the same occupations.During stable niche conditions such as these, interracial competition andresultant intergroup conflict are minimized. But when conditions of equi-librium are disrupted during times of economic contraction, niches begin
Racially Motivated Crime
821
TABLE 1Theoretical Perspectives and Hypothesized Direction of Relationships with
Racial Hate Crimes
Theoretical Perspective Economic DisadvantageSocial Cohesion/
Informal Social Control
Social disorganization . . . . . . . . . . � �Resource competition . . . . . . . . . . Black unemployment:
� antiwhiteWhite unemployment:
� antiblack
NA
Defended communities . . . . . . . . . � �
to overlap, and direct competition for resources increases. When groupsperceive their share of resources to be threatened, ethnic and/or racialconflict ensues.
According to Bonacich (1972), this material competition explains allforms of antagonism between ethnic groups, ranging from outgroup vi-olence to institutional discrimination. It is partly through antagonism thatmore powerful groups are able to maintain their position vis-a-vis othergroups (Olzak 1992). For example, Tolnay and Beck (1995, p. 59) interpretthe connection between lynching and economic downturns as evidencethat “whites attacked when they believed that blacks were threateningtheir privileged access to . . . society’s scarce resources.” Likewise, Jennessand Grattet (1996) suggest that during times of economic recession, racialhate crimes may be a strategy for the white middle class to eliminateminority group threat. This theory is consistent with a frustration-ag-gression thesis at the microlevel (Hovland and Sears 1940), which connectsmacroeconomic downturns to psychological strain that motivates indi-viduals to aggress against vulnerable social groups. Evidence from eth-nographic research suggests that offenders do lash out at scapegoats whomthey perceive as responsible for their economic displacement. Some hatecrime offenders blame their economic insecurity or job instability on af-firmative action policies that increase competition with minorities (Pin-derhughes 1993).
The literature on economic competition has focused primarily on an-timinority (and particularly antiblack) victimization by whites. Whethersimilar mechanisms apply to crimes targeted at majority members, suchas antiwhite hate crime committed by blacks, remains to be seen. Whitesmay be more likely to mobilize against blacks for economic reasons be-cause of racist ideals of entitlement. However, research on related formsof black-on-white victimization, such as interracial homicide, suggests that
American Journal of Sociology
822
economic stressors may also motivate blacks to attack whites (Blackwell1990; Jacobs and Wood 1999).
Thus, like social disorganization theory, traditional resource competi-tion theory predicts negative associations between racial hate crime andcommunity economic status, though for different reasons. However, com-petition theories imply that race-specific economic status captures thestrain felt by a particular group more directly than overall (race-neutral)economic status. Therefore, the theory predicts that antiblack incidentsshould be most prominent in areas of lower white economic status,whereas antiwhite crimes should be more likely where blacks face poorereconomic prospects (see table 1).
Although much research reveals a direct relationship between economicrecession and various forms of interracial conflict such as lynching (Olzak1992; Soule 1992; Tolnay and Beck 1995) and black church arson (Souleand van Dyke 1999), some recent studies suggest that the relationshipbetween economic conditions and hate crime may be more complex. Ina monthly time series analysis of hate crime in New York City, Green,Glaser, and Rich (1998) find no association between hate crime and eco-nomic recession. In another study, Green, Strolovitch, and Wong (1998)report no relationship between antiblack crimes and race-specific em-ployment conditions once controlling for racial composition. Green andcolleagues, however, caution that economic conditions may still be im-portant indirect determinants of hate crime. They suggest, for instance,that “the relationship between economic discontent and intergroup ag-gression may hinge . . . on the ways in which political leaders and or-ganizations frame and mobilize such grievances” (Green, Glaser, and Rich1998, p. 89).2
Defended Communities
A variant of traditional competition theories, the defended communitiesperspective focuses less on competition for jobs than on the defense ofvalued community identities. The defended community perspective is in-formed by the ethnographic work of Suttles (1972) and others (e.g., DeSena 1990; Rieder 1985) on the social construction of urban communities.
2 Based on their analysis of antiminority hate crime patterns in New York City anda reanalysis of lynching data, Green, Glaser, and Rich (1998) conclude that the con-nection between economic conditions and racially motivated crime is “elusive.” Cautionis warranted, however, when comparing the patterns of contemporary hate crime withpost Civil War–era lynching of African-Americans. The historical contexts and mean-ings of these crimes differ in important ways, and they also refer to different criminalactions. In contrast to lynching, contemporary hate crimes include a variety of be-haviors ranging from criminal harassment to more serious physical assault.
Racially Motivated Crime
823
According to Suttles (1972), the defended neighborhood occurs when someresidents take action against a perceived threat to community identity.Although defensive posturing may take many forms, racially motivatedcrime is one means, albeit extreme, for “defending” a valued communityimage and way of life from the threat posed by racial outsiders. Suttles(1972, p. 58) suggests that defensive identity maintenance is often (al-though not only) triggered by fears of racial invasion from adjacent com-munities. In one of the few quantitative community-level analyses of hatecrime to date, Green, Strolovitch, and Wong (1998) find support for thishypothesis. Specifically, they report that hate crimes against racial mi-norities in New York City are most common in traditionally white com-munities experiencing recent in-migration of racial outsiders. Such com-munities may be motivated to victimize racial minorities to defendidentities based on racial (white) homogeneity from the threat posed byracial invasion.
Beyond racial composition and change, the defended communities per-spective implicates other factors that may affect interracial tensions. Inthis article, I focus specifically on the model’s implications for the rela-tionship between racial hate crime and the economic and social capitalof communities, net of racial demographics. Whereas social disorgani-zation and resource competition perspectives predict the same ecologicalcorrelation between economic status and racial hate crime, a defendedcommunity perspective implies the opposite: racial hate crimes will bemore numerous in economically prosperous and collectively efficaciousareas. First, under the assumption that racial outsiders pose more of athreat to affluent communities whose identities are based on ideals ofhomogeneity and economic stability, communities with greater economiccapital may be more likely to resort to racial exclusion to preserve com-munity boundaries. Economic resources constitute an important part ofthe symbolic identity of the community that is perceived worthy of pro-tection. In addition, economic capital may provide resources for com-munities to exclude others and maintain boundaries.3
Second, the defended community model suggests that hate crimes aremore likely in internally organized communities with high levels of social
3 McVeigh et al. (2003) offer a competing explanation in their analysis of hate crimereports in counties across the United States. They find that per capita income ispositively related to reported hate crimes and ague that “relatively prosperous countieshave more resources that could be directed toward the enforcement of hate crime laws”(McVeigh et al. 2003, p. 855). I discuss this alternative “reporting” hypothesis in theconclusion. McVeigh and colleagues, however, focus on a measure that aggregatesdifferent kinds of hate crime (not only racial hate crime). Furthermore, for the purposesof the current study, it is unclear whether resources for hate crime reporting varyappreciably at the community level within a single jurisdiction.
American Journal of Sociology
824
cohesion and norms of informal social control. In some cases defensivehate crimes may be initiated with the perceived support of the largercommunity (Pinderhughes 1993; Suttles 1972, p. 201). If so, racial hatecrimes would “not represent internal social disorganization but organizedresponses to perceived external threats” (Heitgard and Bursik 1987, p.786). To the extent that hate crimes are the outcome of collective action,they may be more likely in communities with substantial social cohesion/trust and norms of informal social control. Social closure and trust, forinstance, provide the capacity to defend against perceived threats posedby outgroups (Portes 1998; Waldinger 1995). Indeed, as Suttles (1972, p.35) notes, defended communities “generally call for some level of concertedaction and thus a certain degree of cohesion.”
Furthermore, communities organized in favor of goals of public safetyand order, as indicated by prevailing norms of informal social control ofcrime, may create a climate conducive to interracial hate crime. Goals ofpublic safety and order are often informed by widespread racial stereo-types, and the association of minority status with disorder may lead tothe scrutiny of racial outsiders—even among those who are not explicitlyracist. In a recent study, Sampson and Raudenbush (2004) find that racialcomposition influences the level of perceived disorder in Chicago neigh-borhoods, above and beyond the effect of actual or “objective” disorder.Specifically, residents of all races perceive more disorder in communitieswith higher proportions of minority populations, even after controllingfor observable conditions. Sampson and Raudenbush (2004) suggest thatracial stereotypes linking minorities to crime and poverty are powerfuldeterminants of perceived disorder (see also Quillian and Pager 2001).Given widespread racial stereotypes, communities with strong norms ofinformal social control of crime may be particularly likely to equate safetyand order with whiteness, and fear and declining order with minoritystatus. Taken to their logical, albeit extreme end, racialized notions oforder and safety suggest that the exclusion of racial outgroups may beperceived by some to be in concert with the control of crime in general.Thus, while norms of informal social control may hinder conventionalcrime, they may mix with racial stereotypes to increase the likelihood ofhate crime against minorities.
Social cohesion and informal social control may facilitate hate crimeespecially in communities whose identities are rooted in racial homoge-neity. In racially homogeneous contexts, social cohesion and informal so-cial control may take the form of “bonding” (as opposed to “bridging”)social capital (Putnam 2000), which encourages exclusive rather than in-terdependent identities. Although bonding social capital can be positivefor communities by encouraging solidarity (as in the case of ethnic enclaves[Portes 1998]), it “may also create strong out-group antagonism” and po-
Racially Motivated Crime
825
tentially produce negative externalities (Putnam 2000, p. 23). Of course,not all ethnically homogenous communities may employ social capital tokeep outgroups at bay. Following the defended communities model, wewould expect most hate crime to occur where (1) the incentive to protectidentities rooted in racial homogeneity from the threat of racial invasion(Green, Strolovitch, and Wong 1998) coexists with (2) the social resourcesneeded to exclude outsiders. Social cohesion and informal social controlmay be leveraged for hate crime particularly (or perhaps exclusively) inracially homogenous communities that are threatened by racial invasion,perhaps in the form of recent in-migration of racial outgroups.
The defended communities perspective conceives racial hate crimes asboth phenomenologically and etiologically distinct from other types ofcrime. Therefore, the perspective is consistent with the idea that differ-ential social organization—that is, the degree to which a community isorganized for or against crime—depends on the nature or type of crime(Sutherland 1947; Matsueda 1988). For example, as implied above, it maybe possible for a community to have low rates of conventional crime whileexperiencing relatively high rates of racial hate crime. In fact, it may bethat the same structural conditions that facilitate the control of crime ingeneral work in the opposite direction for racially motivated crime. Inparticular, relatively affluent, organized communities with high levels ofsocial cohesion and informal social control may be simultaneously orga-nized against general crime and in favor of racial hate crime.
At one extreme, this could mean that some communities actively bandtogether to exclude unwanted newcomers. In this case, social cohesionand norms of informal social control enable a community to organize forhate crime. However, examples of large segments of a community bandingtogether against outgroups, although certainly not unheard of, are prob-ably rare. Most hate crimes more likely result from individuals actingwithout the expressed consent of the community at large. These individ-uals nonetheless may perceive outgroups in certain communities to be outof place and may attack with the perception of support or ambivalence.A positive relationship between hate crime and norms of informal socialcontrol in particular would suggest that emphasis on the surveillance ofcriminal elements may, ironically, lead to intolerance of diversity and theattenuation of controls against racist victimization. Organization againstgeneral crime may not necessarily imply concomitant respect for diversityand individual rights (Sampson 1999, 2002a).
This perspective therefore emphasizes the potential “dangers” of variousforms of social capital (Coleman 1988; Portes 1998; Putnam 2000; Samp-son 1999). As a resource for collective action, social capital may be em-ployed for “positive” as well as “negative” ends. From the point of viewof the actor, social capital is always positive insofar as it is goal oriented.
American Journal of Sociology
826
That is, social capital facilitates desired action. From the standpoint ofothers, however, the actions facilitated by social capital may engenderundesired consequences.
In sum, the defended communities perspective predicts fewer hatecrimes in economically disadvantaged communities and more racial hatecrimes in communities with high levels of social cohesion and informalsocial control, in contrast to social disorganization and resource compe-tition theories. Table 1 summarizes the hypothesized relationships betweencommunity characteristics and racial hate crime for each of the threeperspectives.
DATA
Dependent Variables: Hate Crimes in Chicago
I assess these perspectives using antiblack and antiwhite hate crime in-cidents reported to the Chicago Police Department (CPD) from 1997 to2002.4 The CPD began collecting hate crime reports in 1986.5 Since then,procedures for reporting and classifying hate crimes have been formalizedwithin the police department. As mentioned earlier, police reports at thecommunity level likely provide the most reliable data to explore the spatialpatterning of hate crime. Nevertheless, given the limitations inherent inthe reporting and classification of hate crime data (e.g., Boyd et al. 1996),it is possible that some of the patterns presented below reflect differentreporting mechanisms rather than the racially motivated behavior. I ad-dress these issues further in the conclusion.
The Municipal Code of Chicago defines hate crimes as criminal actsthat are committed because of “a specific demographic characteristic ofthe victim” (CPD 2005, p. 4). Once a potential incident is reported to ordetected by an officer, CPD guidelines require a preliminary investigationwhich entails “obtaining witness statements and writing a thorough reportincluding evidence of bias such as racial slurs, written statements, orgestures made by the offender prior to the incident” (CPD 2005, p. 30).In addition to these factors, preliminary assessments of bias motive gen-erally hinge on the perceptions of the victim(s), the context in which thecrime takes place (e.g., an ongoing pattern of harassment), and the absence
4 Incident-level data prior to 1997 were not made available by the CPD. Furthermore,data prior to 1997 cannot be reliably aggregated to community areas because mapsare unavailable (see below).5 Although other advocacy groups in Chicago collect hate crime reports on particularconstituencies (e.g., Horizons Community Services collects reports on antigay andlesbian violence), the police department remains the only organization that system-atically collects data on racially motivated crime.
Racially Motivated Crime
827
of other motives (e.g., material gain) (CPD 2005; Green, Strolovitch, andWong 1998, p. 380; Martin 1995). Following guidelines established by theFBI, for an incident to be reported as a hate crime, there must be “suf-ficient objective facts . . . to lead a reasonable and prudent person toconclude that the offender’s actions were motivated, in whole or in part,by bias” (FBI 1999b, pp. 4–6; quoted in Iganski 2002, p. 5). Incidents thatmeet initial screening criteria are classified as motivated by antiwhite orantiblack bias by Civil Rights Unit investigators.
Once a preliminary hate motive is ascertained, each reported incidentis investigated further to determine whether sufficient evidence exists tocharge the offender with the additional felony charge of hate crime. Aspart of their follow-up investigations, the Civil Rights Unit eventuallyclassifies the bias component of each incident as “bonafide,” “undeter-mined,” or “unfounded.” Of all racial hate crimes reported between 1997and 2002, about 25% did not meet standards for hate crime classification(unfounded), 25% did not provide information necessary to determine theveracity of a bias component (undetermined), and the remaining 50%were found to be bonafide hate crimes. The results presented below in-clude only those bonafide incidents verified by the CPD, although sen-sitivity analyses reported in appendix B reveal very similar patterns forall reported incidents regardless of follow-up classification.
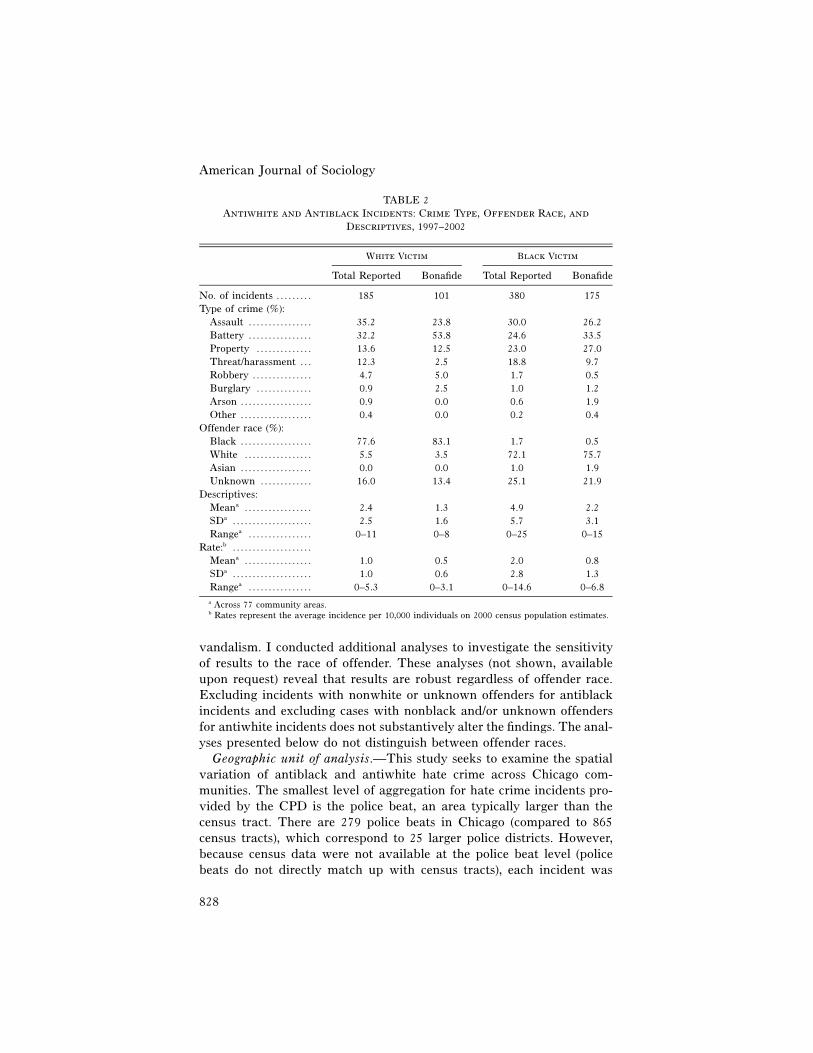
The final data set pools six years of reported racially motivated hatecrimes, resulting in a total of 380 antiblack incidents, 175 of which aredeemed bonafide, and 185 antiwhite incidents, 101 of which are classifiedas bonafide. Incidents motivated by animus toward other racial groups(e.g., Latinos, Asians) are too few to analyze reliably. As table 2 reveals,the criminal content of reported hate crimes varies from less serious prop-erty damage to more serious aggravated assault, though well over half ofall reports are for violent (antiperson) crimes. Compared to total reportedincidents, bonafide incidents tend to involve a greater percentage of an-tiperson crimes and fewer criminal harassment crimes. For both antiblackand antiwhite hate crimes, results do not change substantively from thosereported below if data are restricted to violent incidents (see app. B). Itshould be noted that the CPD does not include murder under the potentiallist of hate crimes.
Table 2 also lists the known race of hate crime offenders as reportedby the victim. In the vast majority of cases, antiblack and antiwhite hatecrimes in Chicago are interracial incidents: whites are by far the mostlikely perpetrators of antiblack crime, and blacks are the typical perpe-trators of antiwhite incidents. In about 13% of antiwhite incidents and22% of antiblack incidents, however, the race of the offender is unknown.Offender race is more likely to be unknown in offenses where offender-victim contact does not occur directly, as in telephone harassment or
American Journal of Sociology
828
TABLE 2Antiwhite and Antiblack Incidents: Crime Type, Offender Race, and
Descriptives, 1997–2002
White Victim Black Victim
Total Reported Bonafide Total Reported Bonafide
No. of incidents . . . . . . . . . 185 101 380 175Type of crime (%):
Assault . . . . . . . . . . . . . . . . 35.2 23.8 30.0 26.2Battery . . . . . . . . . . . . . . . . 32.2 53.8 24.6 33.5Property . . . . . . . . . . . . . . 13.6 12.5 23.0 27.0Threat/harassment . . . 12.3 2.5 18.8 9.7Robbery . . . . . . . . . . . . . . . 4.7 5.0 1.7 0.5Burglary . . . . . . . . . . . . . . 0.9 2.5 1.0 1.2Arson . . . . . . . . . . . . . . . . . . 0.9 0.0 0.6 1.9Other . . . . . . . . . . . . . . . . . . 0.4 0.0 0.2 0.4
Offender race (%):Black . . . . . . . . . . . . . . . . . . 77.6 83.1 1.7 0.5White . . . . . . . . . . . . . . . . . 5.5 3.5 72.1 75.7Asian . . . . . . . . . . . . . . . . . . 0.0 0.0 1.0 1.9Unknown . . . . . . . . . . . . . 16.0 13.4 25.1 21.9
Descriptives:Meana . . . . . . . . . . . . . . . . . 2.4 1.3 4.9 2.2SDa . . . . . . . . . . . . . . . . . . . . 2.5 1.6 5.7 3.1Rangea . . . . . . . . . . . . . . . . 0–11 0–8 0–25 0–15
Rate:b . . . . . . . . . . . . . . . . . . . .Meana . . . . . . . . . . . . . . . . . 1.0 0.5 2.0 0.8SDa . . . . . . . . . . . . . . . . . . . . 1.0 0.6 2.8 1.3Rangea . . . . . . . . . . . . . . . . 0–5.3 0–3.1 0–14.6 0–6.8a Across 77 community areas.b Rates represent the average incidence per 10,000 individuals on 2000 census population estimates.
vandalism. I conducted additional analyses to investigate the sensitivityof results to the race of offender. These analyses (not shown, availableupon request) reveal that results are robust regardless of offender race.Excluding incidents with nonwhite or unknown offenders for antiblackincidents and excluding cases with nonblack and/or unknown offendersfor antiwhite incidents does not substantively alter the findings. The anal-yses presented below do not distinguish between offender races.
Geographic unit of analysis.—This study seeks to examine the spatialvariation of antiblack and antiwhite hate crime across Chicago com-munities. The smallest level of aggregation for hate crime incidents pro-vided by the CPD is the police beat, an area typically larger than thecensus tract. There are 279 police beats in Chicago (compared to 865census tracts), which correspond to 25 larger police districts. However,because census data were not available at the police beat level (policebeats do not directly match up with census tracts), each incident was
Racially Motivated Crime
829
mapped instead to one of Chicago’s 77 traditional community areas. Com-munity areas in Chicago correspond to census tracts, and aggregatingcensus tract data to community area level is fairly straightforward. Thecommunity areas were first outlined in the late 1920s by researchers atthe University of Chicago to delineate areas of reasonable ecological in-tegrity. The areas are generally recognized as discernable communities bylocal residents as well as by “administrative agencies and local institutionsconcerned with service delivery” (Sampson 1999, p. 248). Although Chi-cago community areas (average population near 40,000) are admittedlylarger and more heterogeneous than local neighborhoods, they are sub-stantially smaller units than those used in previous community-level re-search on hate crime (i.e., Green, Strolovitch, and Wong 1998).
Mapping incidents to community areas poses some hurdles. Incidentdata had to be reorganized using alternative mapping techniques. Mapsof community area and police beat boundaries revealed that over 60%of police beats are contained completely within the boundaries of com-munity areas. The rest of the police beats fall into more than one com-munity area. For those incidents in police beats that cross communityarea boundaries, maps published by the police department showing thegeneral location of incidents within each beat were overlaid with com-munity area maps to determine the community area location of eachincident. About 97% of incidents were easily assigned community areasbased on these maps. Decisions for the remaining 3% of cases were basedon “closer calls” (e.g., the incident fell near the borders of two communityareas).6
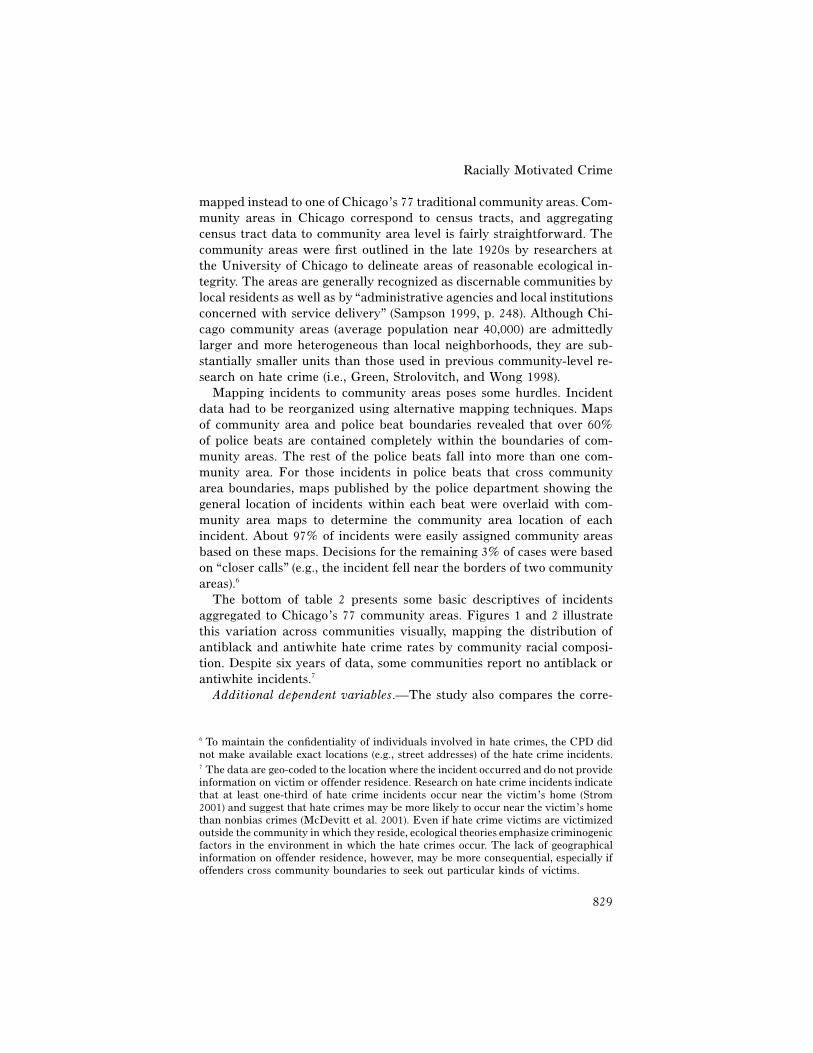
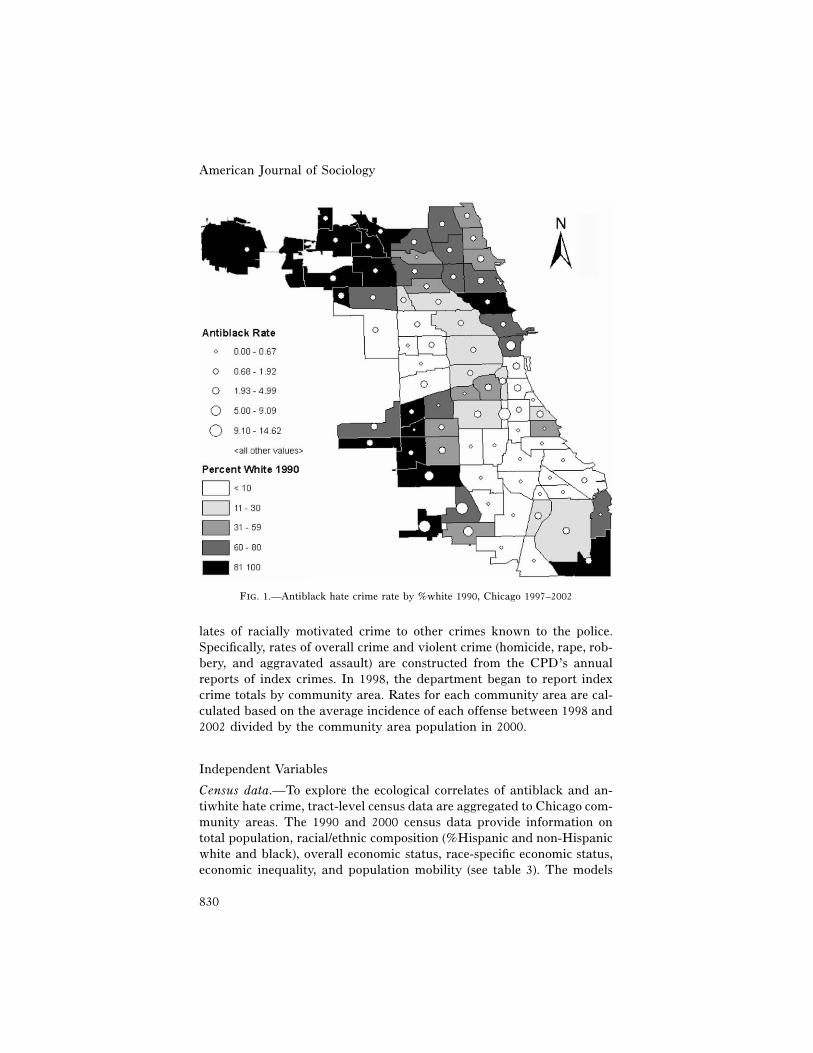
The bottom of table 2 presents some basic descriptives of incidentsaggregated to Chicago’s 77 community areas. Figures 1 and 2 illustratethis variation across communities visually, mapping the distribution ofantiblack and antiwhite hate crime rates by community racial composi-tion. Despite six years of data, some communities report no antiblack orantiwhite incidents.7
Additional dependent variables.—The study also compares the corre-
6 To maintain the confidentiality of individuals involved in hate crimes, the CPD didnot make available exact locations (e.g., street addresses) of the hate crime incidents.7 The data are geo-coded to the location where the incident occurred and do not provideinformation on victim or offender residence. Research on hate crime incidents indicatethat at least one-third of hate crime incidents occur near the victim’s home (Strom2001) and suggest that hate crimes may be more likely to occur near the victim’s homethan nonbias crimes (McDevitt et al. 2001). Even if hate crime victims are victimizedoutside the community in which they reside, ecological theories emphasize criminogenicfactors in the environment in which the hate crimes occur. The lack of geographicalinformation on offender residence, however, may be more consequential, especially ifoffenders cross community boundaries to seek out particular kinds of victims.
American Journal of Sociology
830
Fig. 1.—Antiblack hate crime rate by %white 1990, Chicago 1997–2002
lates of racially motivated crime to other crimes known to the police.Specifically, rates of overall crime and violent crime (homicide, rape, rob-bery, and aggravated assault) are constructed from the CPD’s annualreports of index crimes. In 1998, the department began to report indexcrime totals by community area. Rates for each community area are cal-culated based on the average incidence of each offense between 1998 and2002 divided by the community area population in 2000.
Independent Variables
Census data.—To explore the ecological correlates of antiblack and an-tiwhite hate crime, tract-level census data are aggregated to Chicago com-munity areas. The 1990 and 2000 census data provide information ontotal population, racial/ethnic composition (%Hispanic and non-Hispanicwhite and black), overall economic status, race-specific economic status,economic inequality, and population mobility (see table 3). The models
Racially Motivated Crime
831
Fig. 2.—Antiwhite hate crime rate by %black 1990, Chicago 1997–2002
for hate crime presented below use 1990 census data because these mea-sures are causally prior to hate crime reports. Results do not changesubstantively if 2000 census measures are used instead. An index con-centration at extremes or “ICE” (Massey 2001) measures economic in-equality, or the concentration of family poverty versus affluence, and mayrange from �1 (extreme poverty) to �1 (extreme affluence) (Morenoff etal. 2001, p. 529).
Social cohesion and informal social control.—Data on social cohesionand the informal dynamics of social control are taken from the CommunitySurvey of the Project on Human Development in Chicago Neighborhoods(PHDCN). Conducted in 1995, the survey asked 8,782 Chicago residentsquestions about their neighborhoods. Following Sampson et al. (1997), asocial cohesion and trust scale consists of five items asking how stronglyrespondents agreed that (1) “People around here are willing to help theirneighbors”; (2) “This is a close-knit neighborhood”; (3) “People in thisneighborhood can be trusted”; (4) “People in this neighborhood generally
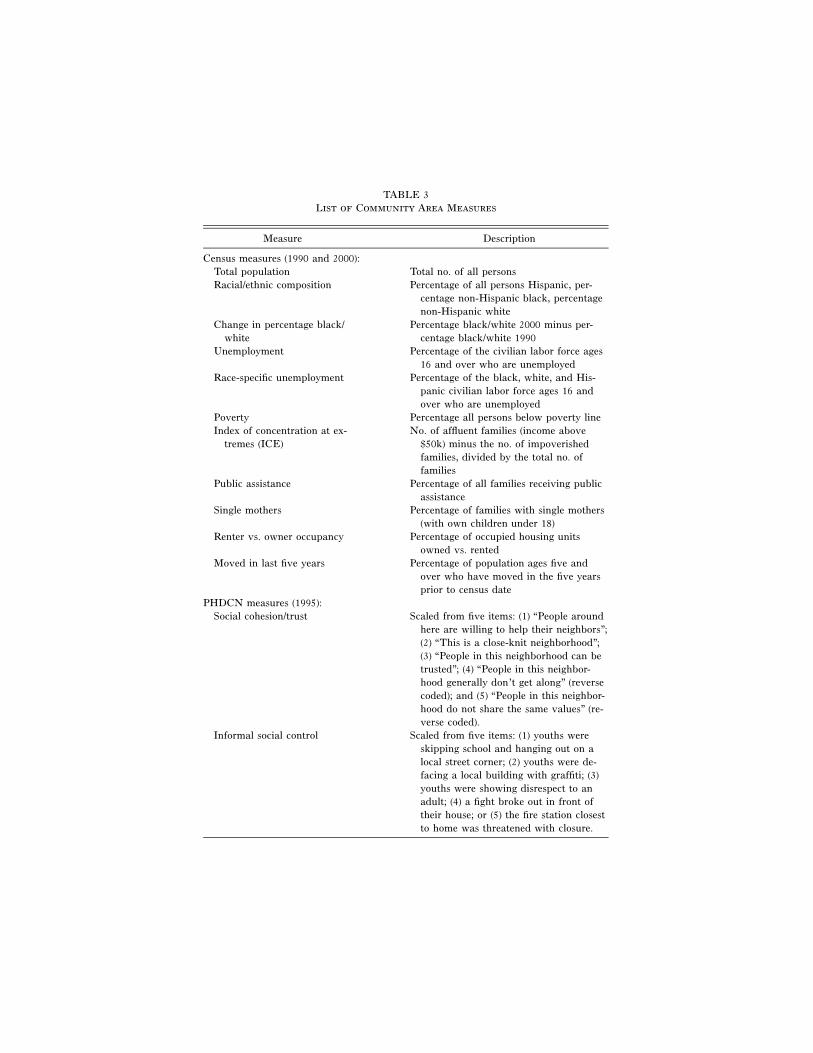
TABLE 3List of Community Area Measures
Measure Description
Census measures (1990 and 2000):Total population Total no. of all personsRacial/ethnic composition Percentage of all persons Hispanic, per-
centage non-Hispanic black, percentagenon-Hispanic white
Change in percentage black/white
Percentage black/white 2000 minus per-centage black/white 1990
Unemployment Percentage of the civilian labor force ages16 and over who are unemployed
Race-specific unemployment Percentage of the black, white, and His-panic civilian labor force ages 16 andover who are unemployed
Poverty Percentage all persons below poverty lineIndex of concentration at ex-
tremes (ICE)No. of affluent families (income above
$50k) minus the no. of impoverishedfamilies, divided by the total no. offamilies
Public assistance Percentage of all families receiving publicassistance
Single mothers Percentage of families with single mothers(with own children under 18)
Renter vs. owner occupancy Percentage of occupied housing unitsowned vs. rented
Moved in last five years Percentage of population ages five andover who have moved in the five yearsprior to census date
PHDCN measures (1995):Social cohesion/trust Scaled from five items: (1) “People around
here are willing to help their neighbors”;(2) “This is a close-knit neighborhood”;(3) “People in this neighborhood can betrusted”; (4) “People in this neighbor-hood generally don’t get along” (reversecoded); and (5) “People in this neighbor-hood do not share the same values” (re-verse coded).
Informal social control Scaled from five items: (1) youths wereskipping school and hanging out on alocal street corner; (2) youths were de-facing a local building with graffiti; (3)youths were showing disrespect to anadult; (4) a fight broke out in front oftheir house; or (5) the fire station closestto home was threatened with closure.
Racially Motivated Crime
833
don’t get along” (reverse coded); and (5) “People in this neighborhood donot share the same values” (reverse coded). A scale for informal socialcontrol is constructed by combining five items that tap the likelihood thatneighbors could be counted on to intervene if: (1) youths were skippingschool and hanging out on a local street corner; (2) youths were defacinga local building with graffiti; (3) youths were showing disrespect to anadult; (4) a fight broke out in front of their house; or (5) the fire stationclosest to home was threatened with closure. Together, the informal controland social cohesion scales capture “the linkage of mutual trust and thewillingness to intervene for the common good” (Sampson 2002a, p. 103),or what Sampson et al. (1997) call collective efficacy.8
The community survey data were originally aggregated to 343 “neigh-borhood clusters” (NCs), which are contiguous groupings of Chicago’s865 census tracts. NCs are designed to be “relatively homogenous . . .with respect to distributions of racial-ethnic mix, SES, housing density,and family structure” (Morenoff et al. 2001, p. 526). Although the majorityof the NCs fit completely within a single community, 16 of 343 NCs crossinto more than one community area.
I employ the following strategy for reorganizing the survey data to thecommunity level. First, to address potential biases in the community-levelsurvey, I employ a two-level random intercept model to estimate scoresfor informal social control and social cohesion for each neighborhoodcluster. This two-level model adjusts for relevant respondent character-istics: race-ethnicity, gender, SES, age, marital status, home ownership,number of years living in the neighborhood, and number of residentialmoves in the last five years (Sampson et al. 1997).9 Next, I determine theproportion of a community area’s population represented by each NC.For the 16 NCs that straddle communities, I estimate the proportion ofthe community area population represented by the cluster tracts that fallwithin the community area boundary. I then weight each cluster’s con-tribution to a community area’s social cohesion and social control scoresby multiplying each cluster’s hierarchical linear model–adjusted score by
8 In additional analyses, I also explored a measure of the density of local social ties.The measure of ties is based on the combined average of two questions concerningthe number of relatives reported to live in the respondent’s neighborhood (coded 1,1–2, 3–5, 6–9, 10 or more) (Morenoff et al. 2001). Considered with informal socialcontrol and social cohesion, however, social ties are not significantly related to hatecrime; therefore, this variable is not included in models discussed below.9 As the items in the social cohesion and informal social control scales are subject tomissing values, scales are constructed based on the average value of completed itemsper individual. When aggregated to the NC level, the minimum number of completedresponses to an item is 8 (maximum is 62), with an average number of completedresponses to an item ranging from 21 to 24.
American Journal of Sociology
834
the proportion of the community area population represented by thecluster.
Formally, this aggregation procedure can be expressed as:
CE p CE # P ,�ca nc nc
where CEnc represents the HLM-adjusted score for NCi, which falls atleast partially within the community area boundary, and P is the pro-portion of the community area (CA) population represented by the NCtracts that fall within the community area boundaries, for each NC withinthe community area.
NEGATIVE BINOMIAL MODELS AND SPATIAL DEPENDENCE
The principal outcomes of the study, antiblack and antiwhite hate crimes,are nonnegative count variables. Event count data typically approximatea Poisson distribution: large counts toward zero and a tail that skews inthe positive direction. However, Poisson regression presupposes the sta-tistical independence of events, an assumption that might be violated ifhate crimes in one community lead to retaliatory crimes in another (Green,Strolovitch, and Wong 1998, p. 384). The Poisson model also assumesequidispersion, or that the mean equals the variance. As table 2 suggests,the unconditional means and variances for antiblack and antiwhite in-cidents are in fact overdispersed. A negative binomial variant of the Pois-son model that allows for overdispersion is more appropriate given theseconditions. For the multivariate analyses presented below examining ra-cial hate crimes, I estimate negative binomial models using communityarea incident counts pooled over seven years. The number of observationsin these analyses is equal to the number of community areas (Np77). Allmodels of general crime rates are estimated in ordinary least squares.10
I also control for the possibility of spatial clustering or dependence inthe hate crime data. Even after controlling for the structural features ofcommunity areas, spatial dependence may be particularly likely for anumber of reasons. First, the difficulty in identifying “communities” spa-tially means that we may introduce error when defining communities asaggregates of census tracts (Morenoff et al. 2001). Second, hate crimesmay be spatially linked in important ways. For example, hate crimes inone community may lead to retaliatory hate crimes in neighboring com-
10 For comparative purposes, I estimated models for hate crime rates using a Tobitspecification to correct for left censoring. Overall, the Tobit models reveal patternssimilar to the negative binomial count models presented below (results available uponrequest).
Racially Motivated Crime
835
munities. Failing at least to control for spatial autocorrelation could biasestimates for key independent variables (Anselin 1988; Baller et al. 2001).
Using GeoDa software (Bruch and Mare 2006), I include in the hatecrime models spatial lag variables (Baller et al. 2001) that essentiallyrepresent the average antiblack and antiwhite count in contiguous com-munities. I use a first order contiguity spatial weight matrix that identifiescontiguous communities that share common boundaries (often referred toas queen contiguity). Formally, the spatial lag can be expressed as:
w s , (1)� ij jj
where wij is an element of spatial weights matrix (row standardized), andsj is the count of antiblack or antiwhite incidents of each community’sneighbor as defined by the weights matrix (Anselin 1988, 1995; Baller andRichardson 2002). In the multivariate models that follow, I incorporatea spatial lag term to assess the independent effects of spatial proximityon community levels of racially motivated crime.11
RESULTS
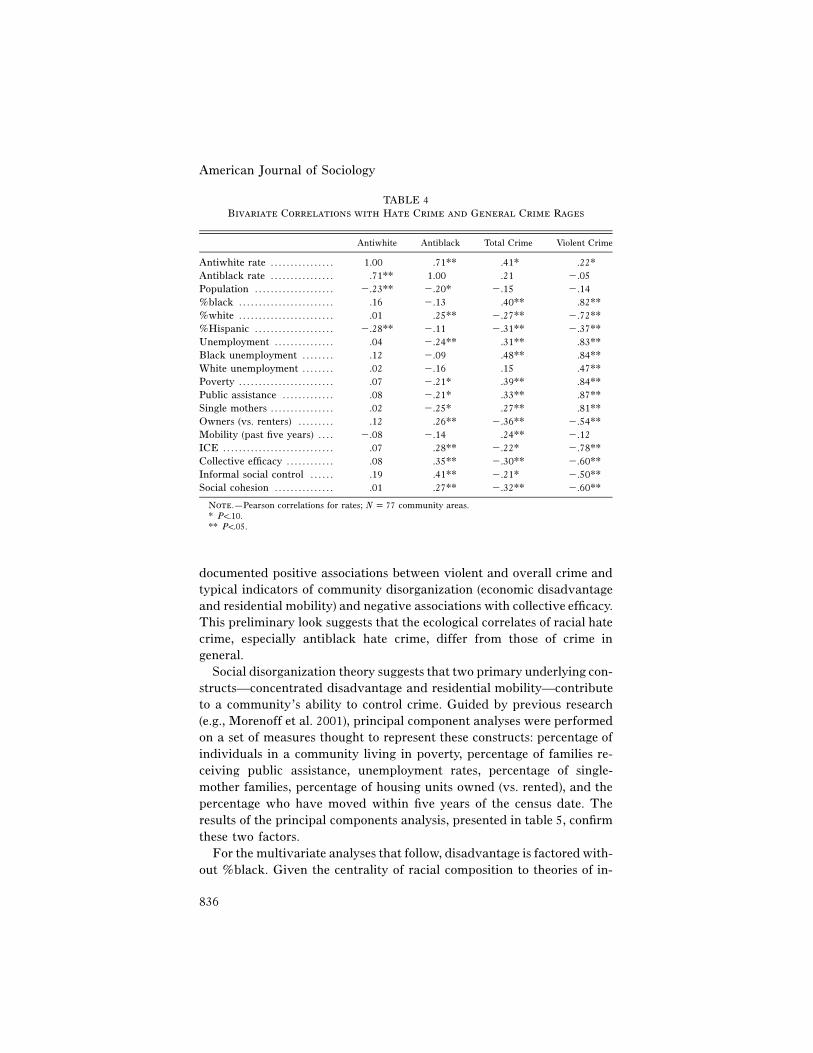
Before moving to multivariate models, table 4 presents bivariate corre-lations between measures of key community characteristics and rates ofracial hate crime and general crime. The associations between economiccharacteristics and antiblack incidents run counter to expectations basedon economic competition or social disorganization. In fact, in sharp con-trast to conventional crimes, antiblack incidents are correlated positivelywith %white (see also fig. 1) and community affluence (note the positivesign for ICE) and associated negatively with traditional indicators ofdisadvantage. Furthermore, antiblack hate crimes are associated posi-tively with community social cohesion and informal social control. Con-versely, correlations with antiwhite incidents seldom reach statistical sig-nificance. An important exception is that antiwhite incidents correlatepositively with both total and violent crime rates.
In contrast to correlations with hate crime, table 4 confirms the well-
11 Spatial dependence can be accounted for using either a spatial lag or a spatial errormodel (Baller et al. 2001). There are a number of reasons for preferring the spatiallag to the spatial error specification. The error model is actually nested within thespatial lag model (Baller et al. 2001, p. 566). Furthermore, if the “real” specificationof the dependence is a spatial lag, then not including the lag term would bias coeffi-cients. In contrast, if the spatial dependence is due to the clustering of unmeasuredvariables (spatial error), then failing to control for the error dependence would resultin larger standard errors but unbiased coefficients (less efficiency). Therefore, I opt forthe more conservative choice and specify a spatial lag model.
American Journal of Sociology
836
TABLE 4Bivariate Correlations with Hate Crime and General Crime Rages
Antiwhite Antiblack Total Crime Violent Crime
Antiwhite rate . . . . . . . . . . . . . . . . 1.00 .71** .41* .22*Antiblack rate . . . . . . . . . . . . . . . . .71** 1.00 .21 �.05Population . . . . . . . . . . . . . . . . . . . . �.23** �.20* �.15 �.14%black . . . . . . . . . . . . . . . . . . . . . . . . .16 �.13 .40** .82**%white . . . . . . . . . . . . . . . . . . . . . . . . .01 .25** �.27** �.72**%Hispanic . . . . . . . . . . . . . . . . . . . . �.28** �.11 �.31** �.37**Unemployment . . . . . . . . . . . . . . . .04 �.24** .31** .83**Black unemployment . . . . . . . . .12 �.09 .48** .84**White unemployment . . . . . . . . .02 �.16 .15 .47**Poverty . . . . . . . . . . . . . . . . . . . . . . . . .07 �.21* .39** .84**Public assistance . . . . . . . . . . . . . .08 �.21* .33** .87**Single mothers . . . . . . . . . . . . . . . . .02 �.25* .27** .81**Owners (vs. renters) . . . . . . . . . .12 .26** �.36** �.54**Mobility (past five years) . . . . �.08 �.14 .24** �.12ICE . . . . . . . . . . . . . . . . . . . . . . . . . . . . .07 .28** �.22* �.78**Collective efficacy . . . . . . . . . . . . .08 .35** �.30** �.60**Informal social control . . . . . . .19 .41** �.21* �.50**Social cohesion . . . . . . . . . . . . . . . .01 .27** �.32** �.60**
Note.—Pearson correlations for rates; community areas.N p 77* P!.10.** P!.05.
documented positive associations between violent and overall crime andtypical indicators of community disorganization (economic disadvantageand residential mobility) and negative associations with collective efficacy.This preliminary look suggests that the ecological correlates of racial hatecrime, especially antiblack hate crime, differ from those of crime ingeneral.
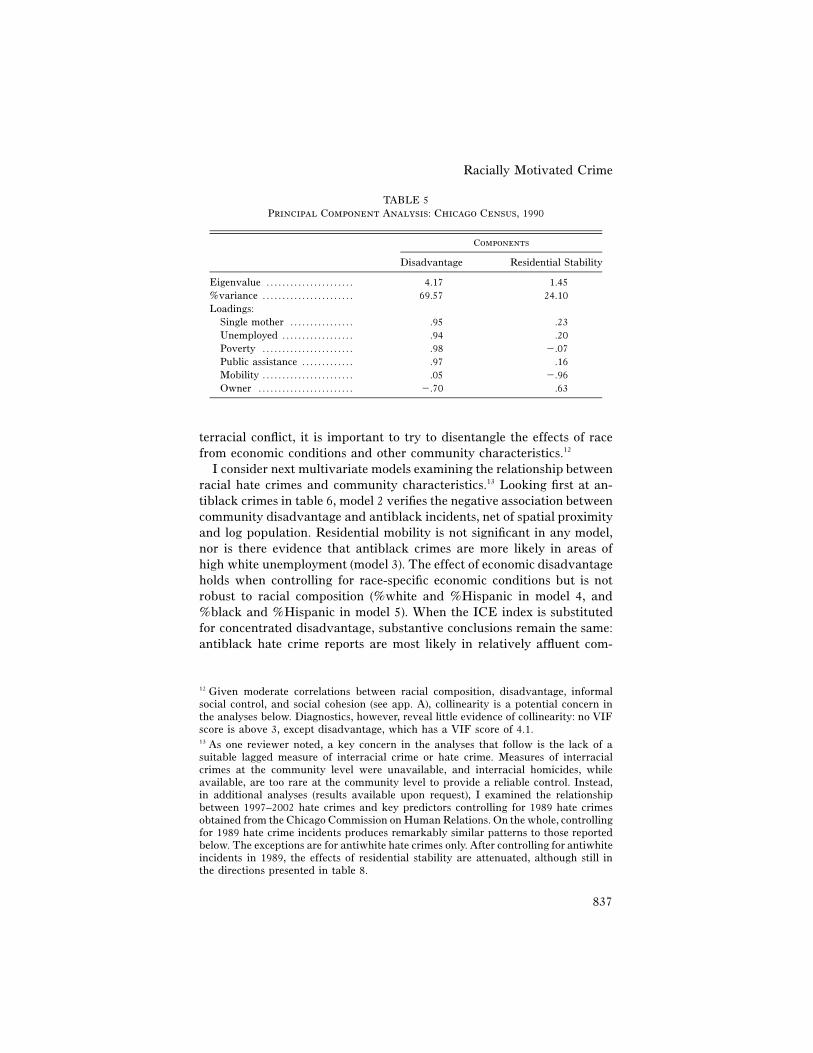
Social disorganization theory suggests that two primary underlying con-structs—concentrated disadvantage and residential mobility—contributeto a community’s ability to control crime. Guided by previous research(e.g., Morenoff et al. 2001), principal component analyses were performedon a set of measures thought to represent these constructs: percentage ofindividuals in a community living in poverty, percentage of families re-ceiving public assistance, unemployment rates, percentage of single-mother families, percentage of housing units owned (vs. rented), and thepercentage who have moved within five years of the census date. Theresults of the principal components analysis, presented in table 5, confirmthese two factors.
For the multivariate analyses that follow, disadvantage is factored with-out %black. Given the centrality of racial composition to theories of in-
Racially Motivated Crime
837
TABLE 5Principal Component Analysis: Chicago Census, 1990
Components
Disadvantage Residential Stability
Eigenvalue . . . . . . . . . . . . . . . . . . . . . . 4.17 1.45%variance . . . . . . . . . . . . . . . . . . . . . . . 69.57 24.10Loadings:
Single mother . . . . . . . . . . . . . . . . .95 .23Unemployed . . . . . . . . . . . . . . . . . . .94 .20Poverty . . . . . . . . . . . . . . . . . . . . . . . .98 �.07Public assistance . . . . . . . . . . . . . .97 .16Mobility . . . . . . . . . . . . . . . . . . . . . . . .05 �.96Owner . . . . . . . . . . . . . . . . . . . . . . . . �.70 .63
terracial conflict, it is important to try to disentangle the effects of racefrom economic conditions and other community characteristics.12
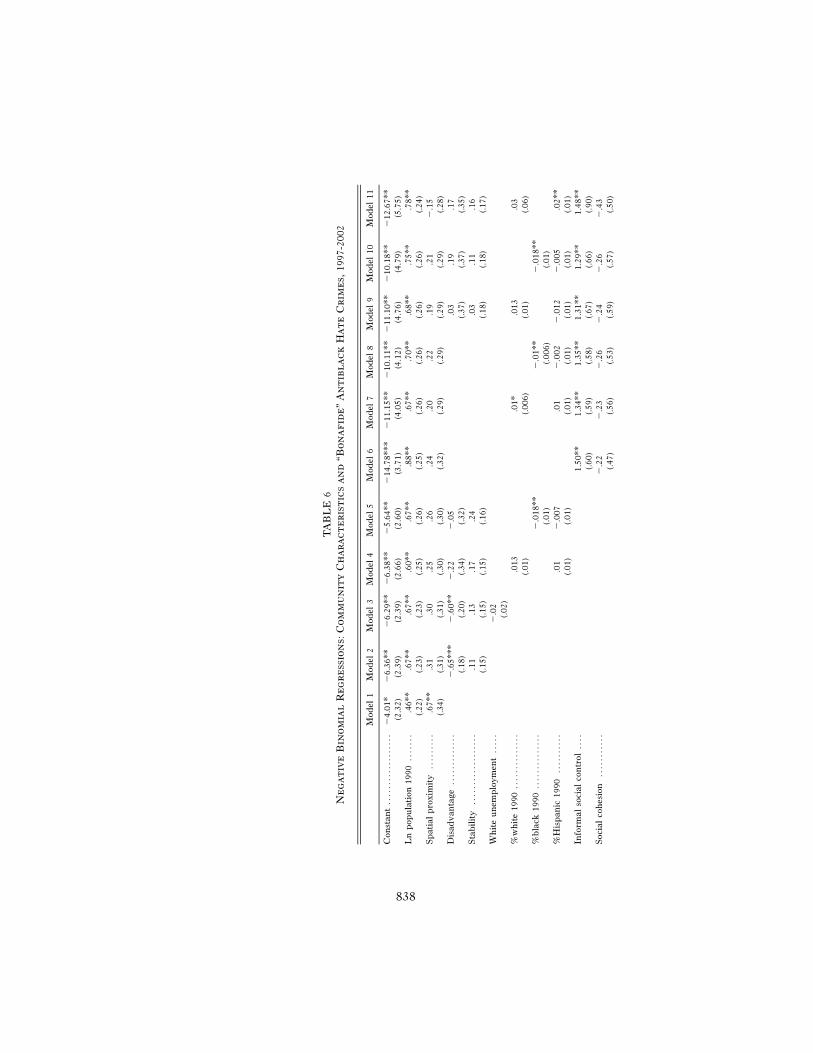
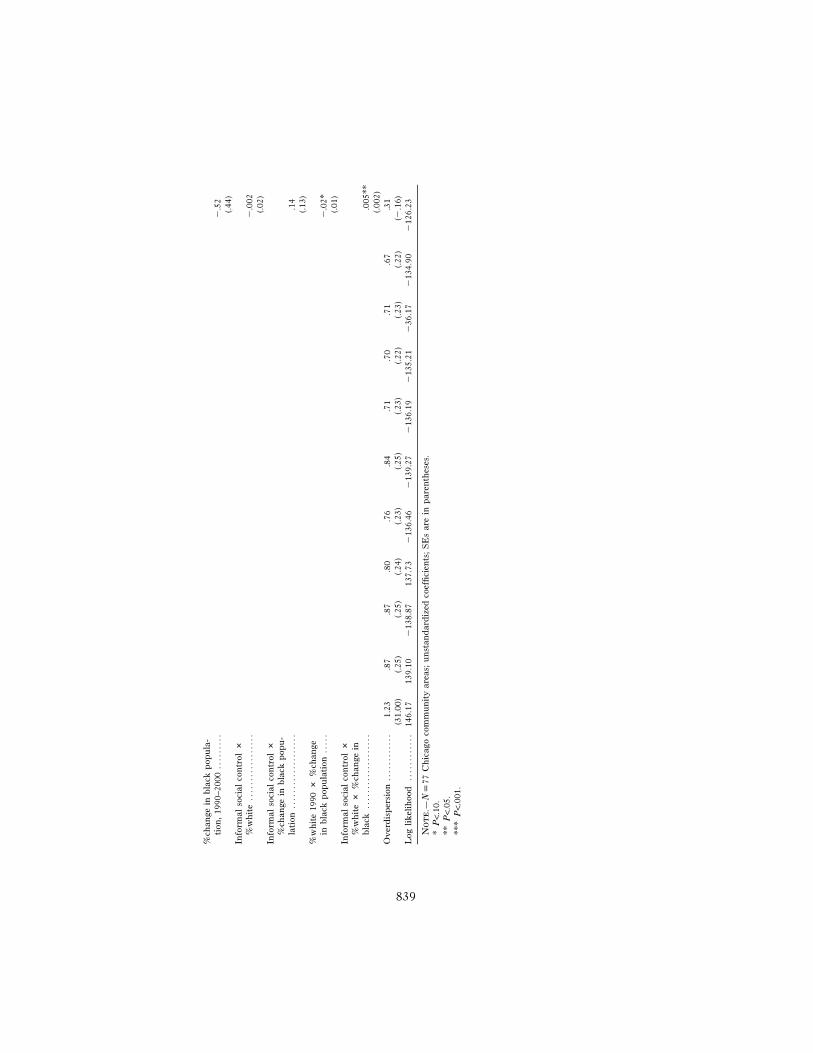
I consider next multivariate models examining the relationship betweenracial hate crimes and community characteristics.13 Looking first at an-tiblack crimes in table 6, model 2 verifies the negative association betweencommunity disadvantage and antiblack incidents, net of spatial proximityand log population. Residential mobility is not significant in any model,nor is there evidence that antiblack crimes are more likely in areas ofhigh white unemployment (model 3). The effect of economic disadvantageholds when controlling for race-specific economic conditions but is notrobust to racial composition (%white and %Hispanic in model 4, and%black and %Hispanic in model 5). When the ICE index is substitutedfor concentrated disadvantage, substantive conclusions remain the same:antiblack hate crime reports are most likely in relatively affluent com-
12 Given moderate correlations between racial composition, disadvantage, informalsocial control, and social cohesion (see app. A), collinearity is a potential concern inthe analyses below. Diagnostics, however, reveal little evidence of collinearity: no VIFscore is above 3, except disadvantage, which has a VIF score of 4.1.13 As one reviewer noted, a key concern in the analyses that follow is the lack of asuitable lagged measure of interracial crime or hate crime. Measures of interracialcrimes at the community level were unavailable, and interracial homicides, whileavailable, are too rare at the community level to provide a reliable control. Instead,in additional analyses (results available upon request), I examined the relationshipbetween 1997–2002 hate crimes and key predictors controlling for 1989 hate crimesobtained from the Chicago Commission on Human Relations. On the whole, controllingfor 1989 hate crime incidents produces remarkably similar patterns to those reportedbelow. The exceptions are for antiwhite hate crimes only. After controlling for antiwhiteincidents in 1989, the effects of residential stability are attenuated, although still inthe directions presented in table 8.
838
TA
BL
E6
Ne
ga
tiv
eB
ino
mia
lR
eg
re
ssio
ns:
Co
mm
un
ity
Ch
ar
ac
te
ris
tic
sa
nd
“Bo
na
fid
e”
An
tib
la
ck
Ha
te
Cr
ime
s,19
97-2
002
Mod
el1
Mod
el2
Mod
el3
Mod
el4
Mod
el5
Mod
el6
Mod
el7
Mod
el8
Mod
el9
Mod
el10
Mod
el11
Con
stan
t..
....
....
....
....
�4.
01*
�6.
36**
�6.
29**
�6.
38**
�5.
64**
�14
.78*
**�
11.1
5**
�10
.11*
*�
11.1
0**
�10
.18*
*�
12.6
7**
(2.3
2)(2
.39)
(2.3
9)(2
.66)
(2.6
0)(3
.71)
(4.0
5)(4
.12)
(4.7
6)(4
.79)
(5.7
5)L
np
opu
lati
on19
90..
....
..4
6**
.67*
*.6
7**
.60*
*.6
7**
.88*
*.6
7**
.70*
*.6
8**
.75*
*.7
8**
(.22)
(.23)
(.23)
(.25)
(.26)
(.25)
(.26)
(.26)
(.26)
(.26)
(.24)
Sp
atia
lp
roxi
mit
y..
....
...
.67*
*.3
1.3
0.2
5.2
6.2
4.2
0.2
2.1
9.2
1�
.15
(.34)
(.31)
(.31)
(.30)
(.30)
(.32)
(.29)
(.29)
(.29)
(.29)
(.28)
Dis
adv
anta
ge..
....
....
...
�.6
5***
�.6
0**
�.2
2�
.05
.03
.19
.17
(.18)
(.20)
(.34)
(.32)
(.37)
(.37)
(.35)
Sta
bil
ity
....
....
....
....
...1
1.1
3.1
7.2
4.0
3.1
1.1
6(.1
5)(.1
5)(.1
5)(.1
6)(.1
8)(.1
8)(.1
7)W
hit
eu
nem
plo
ymen
t..
...
�.0
2(.0
2)%
wh
ite
1990
....
....
....
...0
13.0
1*.0
13.0
3(.0
1)(.0
06)
(.01)
(.06)
%b
lack
1990
....
....
....
..�
.018
**�
.01*
*�
.018
**(.0
1)(.0
06)
(.01)
%H
isp
anic
1990
....
....
...0
1�
.007
.01
�.0
02�
.012
�.0
05.0
2**
(.01)
(.01)
(.01)
(.01)
(.01)
(.01)
(.01)
Info
rmal
soci
alco
ntr
ol..
..1.
50**
1.34
**1.
35**
1.31
**1.
29**
1.48
**(.6
0)(.5
9)(.5
8)(.6
7)(.6
6)(.9
0)S
ocia
lco
hes
ion
....
....
...
�.2
2�
.23
�.2
6�
.24
�.2
6�
.43
(.47)
(.56)
(.53)
(.59)
(.57)
(.50)
839
%ch
ange
inb
lack
pop
ula
-ti
on,
1990
–200
0..
....
...
�.5
2(.4
4)In
form
also
cial
con
trol
#%
wh
ite
....
....
....
....
.�
.002
(.02)
Info
rmal
soci
alco
ntr
ol#
%ch
ange
inb
lack
pop
u-
lati
on..
....
....
....
....
..1
4(.1
3)%
wh
ite
1990
#%
chan
gein
bla
ckp
opu
lati
on..
...
�.0
2*(.0
1)In
form
also
cial
con
trol
#%
wh
ite
#%
chan
gein
bla
ck..
....
....
....
....
..0
05**
(.002
)O
ver
dis
per
sion
....
....
....
1.23
.87
.87
.80
.76
.84
.71
.70
.71
.67
.31
(31.
00)
(.25)
(.25)
(.24)
(.23)
(.25)
(.23)
(.22)
(.23)
(.22)
(�.1
6)L
ogli
kel
ihoo
d..
....
....
..14
6.17
139.
10�
138.
8713
7.73
�13
6.46
�13
9.27
�13
6.19
�13
5.21
�36
.17
�13
4.90
�12
6.23
No
te
.—N
p77
Ch
icag
oco
mm
un
ity
area
s;u
nst
and
ard
ized
coef
fici
ents
;S
Es
are
inp
aren
thes
es.
*P
!.1
0.**
P!
.05.
***
P!
.001
.
American Journal of Sociology
840
munities, yet the effects of economic conditions are attenuated net of racialcomposition (results not shown).
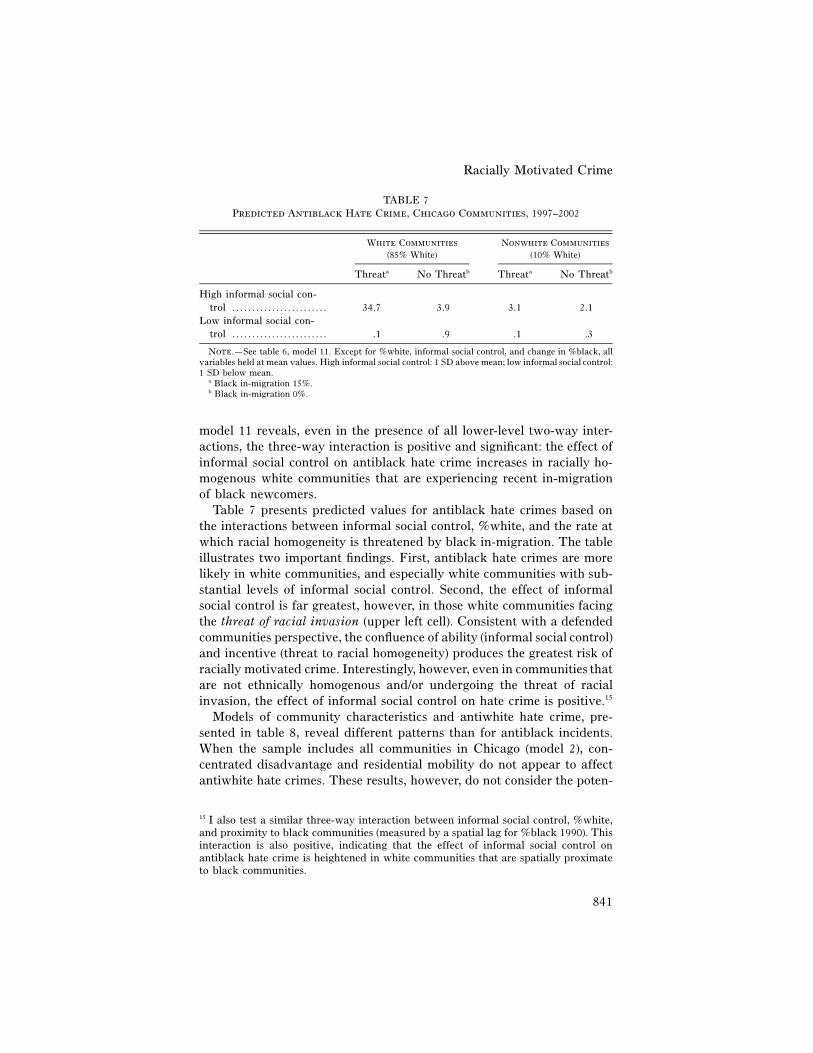
Models 6–11 consider the relationship between antiblack hate crimeand social cohesion and norms of informal social control. Controlling forlog population and spatial proximity, model 6 shows a large and positiveeffect of informal social control on antiblack incidents and a negative andnonsignificant effect of social cohesion. The positive association betweeninformal controls and antiblack hate crimes is robust to controls for racialcomposition (models 7 and 8) as well as economic disadvantage and res-idential stability (models 9 and 10). Interestingly, the coefficient for com-munity social cohesion is opposite that for informal social control, butnever reaches traditional levels of significance.14 Thus, norms of informalsocial control, rather than social cohesion, economic conditions, or racialcomposition, facilitate hate crimes against blacks. These results generallyprovide support for a defended community thesis. Net of other charac-teristics, communities with heightened norms of informal surveillancehave more antiblack hate crime.
I also explore whether the effects of social cohesion and informal socialcontrol vary across various community characteristics, such as racial com-position and change. In racially integrated communities, social capitalmay be more likely to bridge racial divides. Under these conditions, in-formal social control and social cohesion may promote tolerance and dis-courage racially motivated conflict. Alternatively, in relatively homoge-nous white communities or those that are proximate to black communities,social cohesion and informal social control may facilitate exclusive iden-tities that encourage antagonism toward racial minorities (Putnam 2000).White homogeneity may interact with social cohesion and/or informalsocial control, especially in communities facing the threat of racial in-vasion. The positive effect of informal social control in models 9 and 10may therefore hold only for specific communities with particular identitiesbased on racial homogeneity.
Although no interactions are detected for social cohesion, model 11presents evidence of a three-way interaction between informal social con-trol, %white 1990, and change in proportion black between 1990 and 2000.This interaction is meant to capture communities whose identities maybe rooted especially in racial homogeneity: traditionally white commu-nities experiencing the threat of racial invasion (Green et al 1998). As
14 A single collective efficacy scale that combines informal control and social cohesionis positive and significant in early models but is not robust to racial composition oreconomic conditions. It appears that combining the components of collective efficacyinto one scale masks countervailing effects of informal social control and social cohesionon antiblack hate crime at the community level.
Racially Motivated Crime
841
TABLE 7Predicted Antiblack Hate Crime, Chicago Communities, 1997–2002
White Communities(85% White)
Nonwhite Communities(10% White)
Threata No Threatb Threata No Threatb
High informal social con-trol . . . . . . . . . . . . . . . . . . . . . . . . 34.7 3.9 3.1 2.1
Low informal social con-trol . . . . . . . . . . . . . . . . . . . . . . . . .1 .9 .1 .3
Note.—See table 6, model 11. Except for %white, informal social control, and change in %black, allvariables held at mean values. High informal social control: 1 SD above mean; low informal social control:1 SD below mean.
a Black in-migration 15%.b Black in-migration 0%.
model 11 reveals, even in the presence of all lower-level two-way inter-actions, the three-way interaction is positive and significant: the effect ofinformal social control on antiblack hate crime increases in racially ho-mogenous white communities that are experiencing recent in-migrationof black newcomers.
Table 7 presents predicted values for antiblack hate crimes based onthe interactions between informal social control, %white, and the rate atwhich racial homogeneity is threatened by black in-migration. The tableillustrates two important findings. First, antiblack hate crimes are morelikely in white communities, and especially white communities with sub-stantial levels of informal social control. Second, the effect of informalsocial control is far greatest, however, in those white communities facingthe threat of racial invasion (upper left cell). Consistent with a defendedcommunities perspective, the confluence of ability (informal social control)and incentive (threat to racial homogeneity) produces the greatest risk ofracially motivated crime. Interestingly, however, even in communities thatare not ethnically homogenous and/or undergoing the threat of racialinvasion, the effect of informal social control on hate crime is positive.15
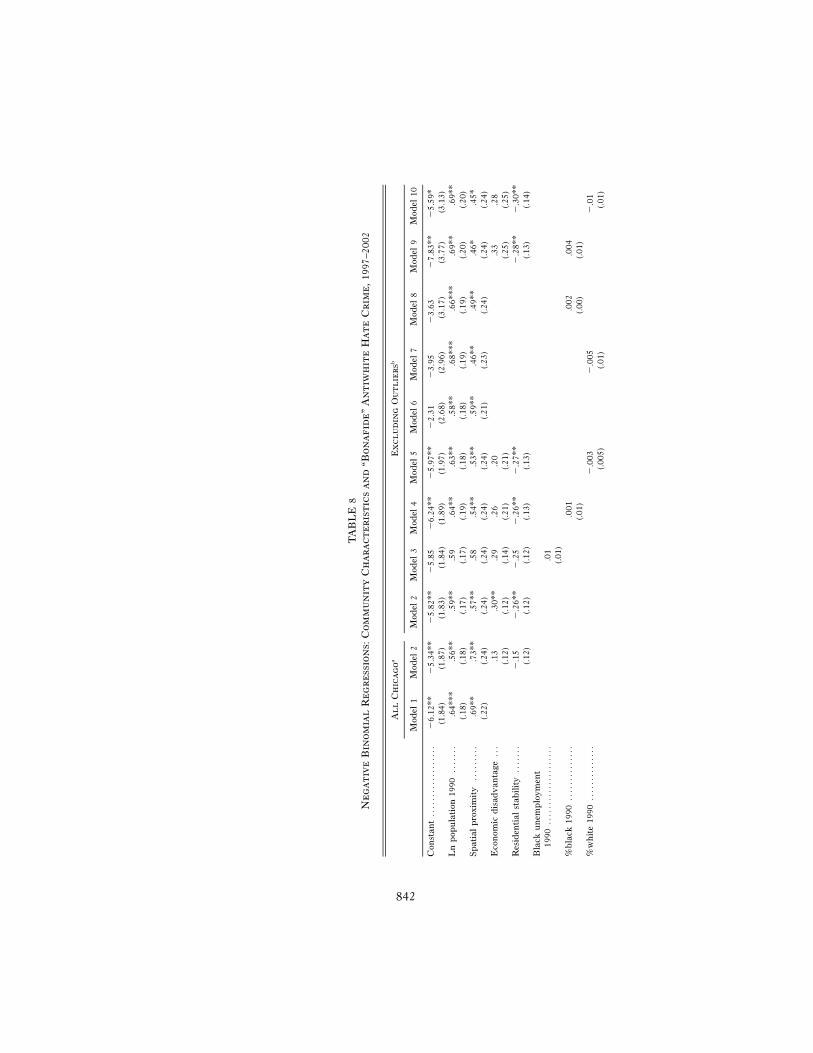
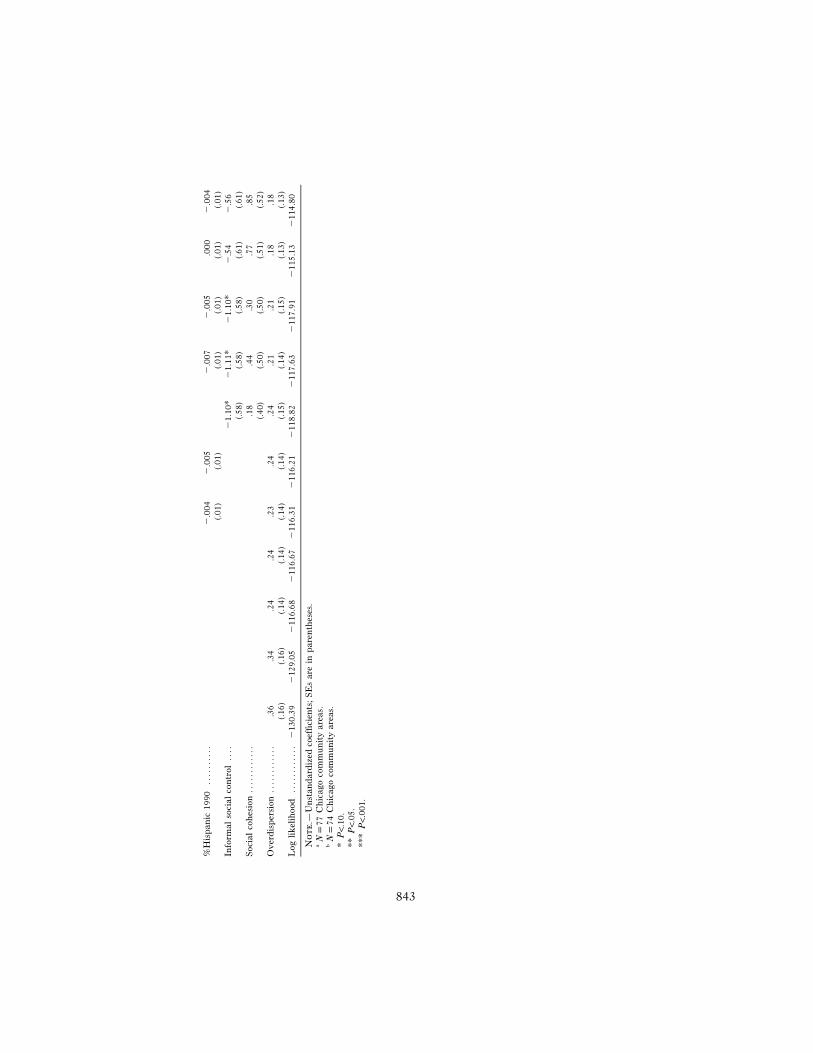
Models of community characteristics and antiwhite hate crime, pre-sented in table 8, reveal different patterns than for antiblack incidents.When the sample includes all communities in Chicago (model 2), con-centrated disadvantage and residential mobility do not appear to affectantiwhite hate crimes. These results, however, do not consider the poten-
15 I also test a similar three-way interaction between informal social control, %white,and proximity to black communities (measured by a spatial lag for %black 1990). Thisinteraction is also positive, indicating that the effect of informal social control onantiblack hate crime is heightened in white communities that are spatially proximateto black communities.
842
TA
BL
E8
Ne
ga
tiv
eB
ino
mia
lR
eg
re
ssio
ns:
Co
mm
un
ity
Ch
ar
ac
te
ris
tic
sa
nd
“Bo
na
fid
e”
An
tiw
hit
eH
at
eC
rim
e,
1997
–200
2
Al
lC
hic
ag
oaE
xc
lu
din
gO
ut
lie
rsb
Mod
el1
Mod
el2
Mod
el2
Mod
el3
Mod
el4
Mod
el5
Mod
el6
Mod
el7
Mod
el8
Mod
el9
Mod
el10
Con
stan
t..
....
....
....
....
�6.
12**
�5.
34**
�5.
82**
�5.
85�
6.24
**�
5.97
**�
2.31
�3.
95�
3.63
�7.
83**
�5.
59*
(1.8
4)(1
.87)
(1.8
3)(1
.84)
(1.8
9)(1
.97)
(2.6
8)(2
.96)
(3.1
7)(3
.77)
(3.1
3)L
np
opu
lati
on19
90..
....
..6
4***
.56*
*.5
9**
.59
.64*
*.6
3**
.58*
*.6
8***
.66*
**.6
9**
.69*
*(.1
8)(.1
8)(.1
7)(.1
7)(.1
9)(.1
8)(.1
8)(.1
9)(.1
9)(.2
0)(.2
0)S
pat
ial
pro
xim
ity
....
....
..6
9**
.73*
*.5
7**
.58
.54*
*.5
3**
.59*
*.4
6**
.49*
*.4
6*.4
5*(.2
2)(.2
4)(.2
4)(.2
4)(.2
4)(.2
4)(.2
1)(.2
3)(.2
4)(.2
4)(.2
4)E
con
omic
dis
adv
anta
ge..
..1
3.3
0**
.29
.26
.20
.33
.28
(.12)
(.12)
(.14)
(.21)
(.21)
(.25)
(.25)
Res
iden
tial
stab
ilit
y..
....
.�
.15
�.2
6**
�.2
5�
.26*
*�
.27*
*�
.28*
*�
.30*
*(.1
2)(.1
2)(.1
2)(.1
3)(.1
3)(.1
3)(.1
4)B
lack
un
emp
loym
ent
1990
....
....
....
....
....
.01
(.01)
%b
lack
1990
....
....
....
...0
01.0
02.0
04(.0
1)(.0
0)(.0
1)%
wh
ite
1990
....
....
....
..�
.003
�.0
05�
.01
(.005
)(.0
1)(.0
1)
843
%H
isp
anic
1990
....
....
..�
.004
�.0
05�
.007
�.0
05.0
00�
.004
(.01)
(.01)
(.01)
(.01)
(.01)
(.01)
Info
rmal
soci
alco
ntr
ol..
..�
1.10
*�
1.11
*�
1.10
*�
.54
�.5
6(.5
8)(.5
8)(.5
8)(.6
1)(.6
1)S
ocia
lco
hes
ion
....
....
....
.18
.44
.30
.77
.85
(.40)
(.50)
(.50)
(.51)
(.52)
Ov
erd
isp
ersi
on..
....
....
...3
6.3
4.2
4.2
4.2
3.2
4.2
4.2
1.2
1.1
8.1
8(.1
6)(.1
6)(.1
4)(.1
4)(.1
4)(.1
4)(.1
5)(.1
4)(.1
5)(.1
3)(.1
3)L
ogli
kel
ihoo
d..
....
....
..�
130.
39�
129.
05�
116.
68�
116.
67�
116.
31�
116.
21�
118.
82�
117.
63�
117.
91�
115.
13�
114.
80
No
te
.—U
nst
and
ard
ized
coef
fici
ents
;S
Es
are
inp
aren
thes
es.
aN
p77
Ch
icag
oco
mm
un
ity
area
s.b
Np
74C
hic
ago
com
mu
nit
yar
eas.
*P
!.1
0.**
P!
.05.
***
P!
.001
.
American Journal of Sociology
844
tial influences of statistical outliers. Although no outliers were detectedfor antiblack hate crimes, interior analyses reveal three communities inthe southwest corner of Chicago that unduly influence the patterns forantiwhite incidents. These three communities have unusually high levelsof antiwhite hate crime given their relative affluence and racial (white)homogeneity.16 Once these outliers are omitted, both concentrated dis-advantage (positive) and residential stability (negative) are significantlyrelated to antiwhite hate crimes. It appears that antiwhite incidents inthe vast majority of Chicago are more likely in traditionally economicallydisadvantaged communities with high rates of population turnover. Onlyin the relatively affluent southwest corner of the city do antiwhite incidentsfollow a different pattern. Although thorough explanation for these dif-ferent patterns in the southwest warrants qualitative exploration beyondthe scope of the present study, I address potential reasons in the conclusion.
In models excluding the southwest corner, the effects of disadvantagehold after considering black unemployment, which is not significant(model 3), but is not robust to controls for racial composition (models 4and 5). However, consistent with a systemic model of social organization,residential stability remains a significant and negative predictor of anti-white incidents net of racial composition or race-specific economicconditions.
Models 6–10 explore the effects of cohesion and informal social controlon antiwhite hate crime. In contrast to antiblack incidents, the coefficientfor informal social control is negative and marginally significant in model6. According to social disorganization theory, this would suggest thatinformal social control works to prevent antiwhite incidents just as itprevents general forms of crime, at least in sections of Chicago other thanthe southwest corner. The effect is robust to controls for racial composition(models 7 and 8), but not economic disadvantage or residential stability(models 9 and 10). In models 9 and 10, the only significant predictor ofantiwhite incidents, other than log population and spatial proximity, isresidential stability. Like conventional crime in general, antiwhite inci-dents are more likely in relatively unstable communities with frequentpopulation turnover.
I also explored whether the effects of social cohesion and informal socialcontrol vary by racial composition and/or the degree of threat posed toracial homogeneity in the form of changes in the white population. Unlikethe models for antiblack hate crimes, there is no evidence that racialcomposition or the rate of increase in the white population proportion
16 Outlier analyses include examination of residuals, leverage, dfits, and Cook’s dis-tance. The three communities in the southwest corner of Chicago have dfits and Cook’sdistance scores two to three times above recommended cut-off values.
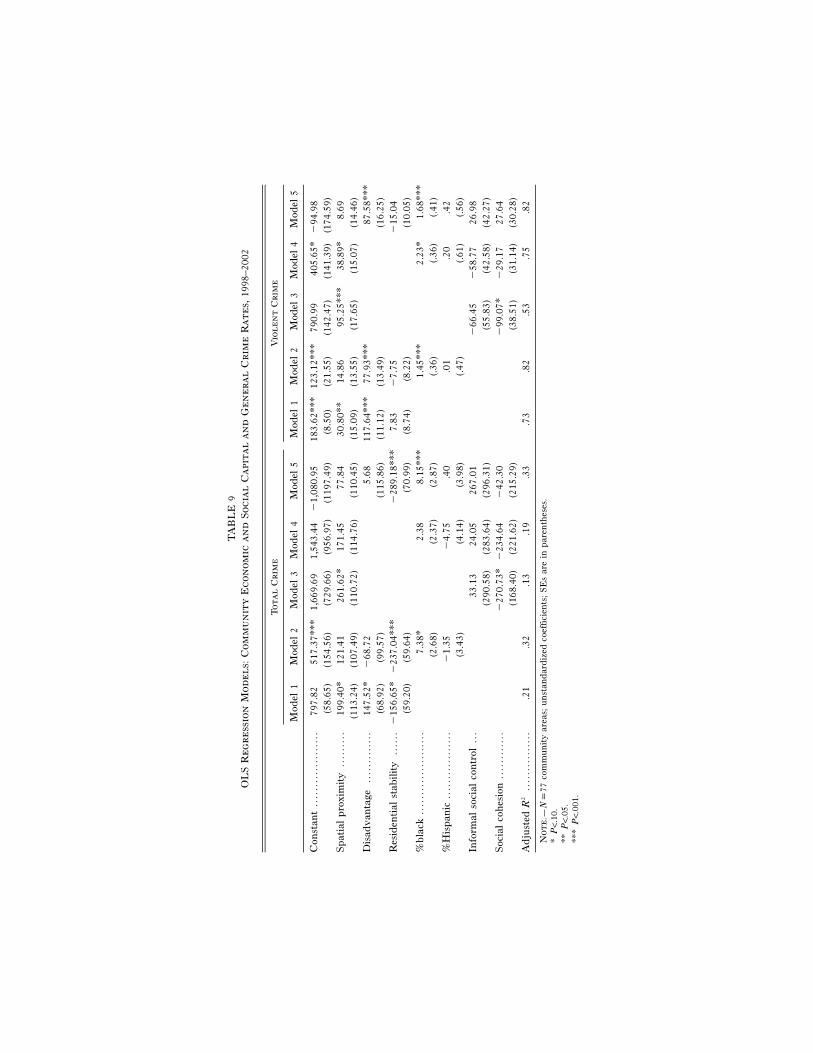
TA
BL
E9
OL
SR
eg
re
ssio
nM
od
el
s:C
om
mu
nit
yE
co
no
mic
an
dS
oc
ial
Ca
pit
al
an
dG
en
er
al
Cr
ime
Ra
te
s,19
98–2
002
To
ta
lC
rim
eV
iol
en
tC
rim
e
Mod
el1
Mod
el2
Mod
el3
Mod
el4
Mod
el5
Mod
el1
Mod
el2
Mod
el3
Mod
el4
Mod
el5
Con
stan
t..
....
....
....
....
.79
7.82
517.
37**
*1,
669.
691,
543.
44�
1,08
0.95
183.
62**
*12
3.12
***
790.
9940
5.65
*�
94.9
8(5
8.65
)(1
54.5
6)(7
29.6
6)(9
56.9
7)(1
197.
49)
(8.5
0)(2
1.55
)(1
42.4
7)(1
41.3
9)(1
74.5
9)S
pat
ial
pro
xim
ity
....
....
.19
9.40
*12
1.41
261.
62*
171.
4577
.84
30.8
0**
14.8
695
.25*
**38
.89*
8.69
(113
.24)
(107
.49)
(110
.72)
(114
.76)
(110
.45)
(15.
09)
(13.
55)
(17.
65)
(15.
07)
(14.
46)
Dis
adv
anta
ge..
....
....
...
147.
52*
�68
.72
5.68
117.
64**
*77
.93*
**87
.58*
**(6
8.92
)(9
9.57
)(1
15.8
6)(1
1.12
)(1
3.49
)(1
6.25
)R
esid
enti
alst
abil
ity
....
..�
156.
65*
�23
7.04
***
�28
9.18
***
7.83
�7.
75�
15.0
4(5
9.20
)(5
9.64
)(7
0.99
)(8
.74)
(8.2
2)(1
0.05
)%
bla
ck..
....
....
....
....
...
7.38
*2.
388.
15**
*1.
45**
*2.
23*
1.68
***
(2.6
8)(2
.37)
(2.8
7)(.3
6)(.3
6)(.4
1)%
His
pan
ic..
....
....
....
...
�1.
35�
4.75
.40
.01
.20
.42
(3.4
3)(4
.14)
(3.9
8)(.4
7)(.6
1)(.5
6)In
form
also
cial
con
trol
...
33.1
324
.05
267.
01�
66.4
5�
58.7
726
.98
(290
.58)
(283
.64)
(296
.31)
(55.
83)
(42.
58)
(42.
27)
Soc
ial
coh
esio
n..
....
....
..�
270.
73*
�23
4.64
�42
.30
�99
.07*
�29
.17
27.6
4(1
68.4
0)(2
21.6
2)(2
15.2
9)(3
8.51
)(3
1.14
)(3
0.28
)A
dju
sted
R2
....
....
....
...
.21
.32
.13
.19
.33
.73
.82
.53
.75
.82
No
te
.—N
p77
com
mu
nit
yar
eas;
un
stan
dar
diz
edco
effi
cien
ts;
SE
sar
ein
par
enth
eses
.*
P!
.10.
**P
!.0
5.**
*P
!.0
01.
American Journal of Sociology
846
between 1990 and 2000 condition the influence of informal social controlor social cohesion on antiwhite hate crime (results not shown).
Tables 6 and 8 also test for spatial clustering in antiblack and antiwhitehate crimes. There is little evidence of spatial lag effects for antiblackincidents net of key structural variables. As revealed in table 6, any spatialclustering in antiblack hate crimes appears to be explained by the clus-tering of economic conditions, social capital, or racial composition acrosscommunities. In contrast, the structural conditions considered in table 8do not completely explain the clustering of antiwhite incidents. Althoughthe spatial lag effect is attenuated after controlling for economic conditionsand residential stability, the coefficient remains significant and positive.The lag effect also persists after controlling for social cohesion and in-formal social control. These results suggest diffusion or contagion pro-cesses for antiwhite hate crimes: hate crimes against whites in one com-munity may lead to similar crimes in neighboring communities.
How do these ecological patterns for racial hate crime compare withthose for crime in general? The patterns for total and violent crime rates,presented in table 9, validate what previous social disorganization re-search has demonstrated: disadvantage, residential instability, and %blackare strongly associated with conventional crime rates, with disadvantageand %black stronger predictors of violent crime and residential instabilitya stronger predictor of total crime. Social cohesion, but not informal socialcontrol, is negatively related to crime rates, yet this effect is not robustto other structural variables at this level of aggregation. The patterns forconventional crime (especially total crime) are somewhat similar to thosefor antiwhite incidents in the majority of Chicago (excluding the southwestcorner). Both total crime and antiwhite hate crime occur in relativelyecologically disorganized communities characterized by residential insta-bility. In contrast, antiblack incidents appear etiologically distinct and aremost numerous in more traditionally “organized” communities character-ized by norms of informal social control. Although the OLS models forcrime rates consider different years (1998–2002) than the negative bino-mial regressions for hate crimes (1997–2002), restricting hate crime modelsto 1998–2002 incidents produces very similar results.
CONCLUSIONS
Drawing on police records, census data, and Chicago community surveydata, this article provides new insight into the etiology of racially moti-vated crime at the community level. Multivariate analyses of antiblackand antiwhite hate crimes reveal a number of important findings. First,antiblack hate crimes are most numerous in relatively organized com-
Racially Motivated Crime
847
munities with higher levels of informal social control, and especially ininternally organized white communities undergoing the threat of racialinvasion. Antiblack incidents are also more common in economically af-fluent communities, although the effect of economic conditions is notrobust to racial composition and norms of informal social control. Asmuch research has shown, communities rich in economic resources anddynamics of informal social control are able to manage forms of unwantedconventional crime and secure public goods such as safety. However, suchcommunities appear simultaneously organized in favor of antiblackcrimes. The correlates of antiblack hate crimes are distinguishable fromthose of crime in general. That is, crimes motivated by animus againstblacks appear to be distinct phenomena, and theories traditionally em-ployed to explain the spatial organization of general crime must be revisedto explain the special case of antiblack hate crime.
Although researchers have tended to focus on the positive consequencesof social capital for communities, some have conceded that social resourcescan be used for purposes that may be considered “antisocial” by some(Portes 1998; Putnam 2000; Sampson 1999, 2002a; see also Thomson 2005).This study provides empirical support for such concerns. The positiveeffect of a particular form of social capital, informal social control, onantiblack hate crimes warns of the potentially negative consequences ofcollectively pursuing safety and public order without concomitant toler-ance for racial diversity and individual rights. Racial stereotypes linkingminorities—and especially blacks—to social ills such as disorder, violence,and poverty are widespread. Even members of white communities whoare not “explicitly” racist may view the presence of blacks as a sign ofdecline and impending disorder (Sampson and Raudenbush 2004). Com-munities with heightened norms of informal social control that are mo-tivated to maintain safe and orderly ways of life may also be disposed tomonitor the racial composition within their borders. In the name of or-ganizing against crime and disorder, these communities may run the riskof alienating certain groups and encouraging defensive (and dangerous)sentiments.
The defended communities thesis assumes that communities are mo-tivated to protect valued identities from threats posed by outside elements.Insofar as blacks represent symbolic threats to the identities of certaincommunities, racially motivated crime may be a means for maintaininglines of class and color. Indeed, informal social control of general crimeis more strongly related to antiblack hate crime in relatively homogenouscommunities that are undergoing changes in racial composition. That is,in communities that may be particularly motivated to maintain bound-aries in the face of external threats, informal social control appears tofacilitate defensive posturing. However, the results indicate that informal
American Journal of Sociology
848
social control operates across a wider range of communities. The positiveeffect of informal social control on antiblack hate crime persists evenamong those communities not facing prospects of in-migration of racialoutgoups.
The results indicate that the antecedents of antiwhite and antiblackcrimes differ in important ways. In contrast to antiblack hate crime, an-tiwhite hate crimes are somewhat more likely in disadvantaged com-munities, especially those with higher levels of residential instability. Ac-cording to a systemic model of social organization, residential mobilitydisrupts the social relations that enable organization against crime. Thus,like other forms of crime, antiwhite hate crimes appear to be a productof social disorganization brought about by population turnover. The dif-ferent patterns for antiblack and antiwhite hate crime underscore theimportance of disaggregating hate crimes by bias motivation. Althoughscholars often disregard bias motivation and consider hate crimes as anaggregate category, this study suggests that antiwhite and antiblack crimesmay be etiologically distinct and should be analyzed separately.
The different patterns for antiblack and antiwhite hate crime warrantadditional research. One set of potential explanations for these differencesfocuses on the degree to which general criminal propensity versus animusdirectly motivates antiblack versus antiwhite offenders. Offenders of de-fensive antiblack crimes may be more likely to display motives consistentwith a specialization model (Messner, McHugh, and Felson 2004) wherebyoffenders “specialize” in hate crime and do not engage in other types ofcrime. Such offenders are distinguished more by racial prejudice thangeneral criminal propensity. Defensive hate crimes may involve special-ized offenders because these incidents serve particular, future-orientedfunctions: restricting the spatial movement of racial outsiders or protectingagainst threats to a valued community (and collective) identity. This im-plies that racial territoriality and animus induced by social change are adirect cause of antiblack hate crimes. In contrast, the patterns for anti-white hate crimes are more similar to the patterns for conventional typesof crime. This may suggest that offenders of antiwhite hate crime maybe more criminally versatile than antiblack offenders. That is, they maybe motivated by a variety of criminal goals, especially those for financialgain. In many urban environments, blacks disproportionately live in struc-turally disadvantaged communities where motivations for crime are en-demic (Sampson and Wilson 1995), and Chicago is no exception. Thisreasoning does not necessarily mean that antiwhite offenders are lessprejudiced than antiblack offenders, or vice versa. However, in the caseof antiwhite hate crimes, other criminal motives brought about by struc-tural conditions or stable criminal propensities may complicate the re-lationship between racial prejudice and behavior. Of course, such con-
Racially Motivated Crime
849
clusions about the differences between antiblack and antiwhite hate crimeremain speculative and await additional research on the ecology of raciallymotivated crime.
The models for antiwhite hate crimes are complicated by the presenceof communities in Chicago that appear to follow divergent patterns. Whatexplains these deviant cases in the southwest corner of Chicago? Althougha full explanation is beyond the scope of the present study, a number ofpossibilities merit further investigation. First, antiwhite incidents in thesecommunities could be retaliatory—that is, made in response to antiblackincidents. The anomalous communities have higher-than-average rates ofantiblack hate crime, although they are well predicted by the defendedcommunity model. In fact, these areas appear prime examples of relativelyorganized communities defending against a perceived threat posed byblacks. If blacks victimize whites in retaliation to antiblack incidents,then the relationship between antiwhite incidents and community eco-nomic and social capital may be indirect. These factors increase the like-lihood of antiblack incidents, which may increase the likelihood thatblacks will retaliate.
Second, Perry (2002, p. 73) has suggested that whites may be morewilling than minorities to report racially motivated crimes or more readilydefine acts as an affront to their privileged racial status. Although thisargument has not been subject to empirical test, it is consistent withresearch showing whites’ greater trust and confidence in the police com-pared to minorities (e.g., Weitzer and Tuch 2005). It is also possible thatthe reporting of antiwhite crime in some communities is a strategy foridentity maintenance—another resource for defending the color line fromperceived threats to valued identities.
In addition to these possibilities, the collective memory of blacks andwhites might influence hate crime rates in Chicago’s southwest. Bothwhites and blacks may be more sensitive to potentially racially motivatedconflict given the history of tension in Chicago’s southwest dating backto Civil Rights protests and KKK gatherings (Berlet 2001). This historicalframework may also help explain why this relatively stable and affluentsection of the city reports unusually high numbers of antiwhite hate crime.These speculative explanations require more extensive investigation.
This study explored the extent to which theoretical perspectives on theetiology of interracial crime explain the spatial distribution of officiallyreported hate crimes. Although the patterns for antiblack hate crimes aresupportive of the defended communities perspective, definitive tests mustbe able to rule out alternative explanations for the positive associationbetween antiblack incidents and community economic and social capital.One competing explanation concerns the issue of reporting versus theactual commission of hate crimes. Specifically, relatively affluent and col-
American Journal of Sociology
850
lectively efficacious communities may be more disposed than less “orga-nized” communities to report antiblack crimes when they do occur. In ananalysis of hate crime reporting across U.S. counties, McVeigh et al. (2003)argue that counties with higher per capita income have higher numbersof reported hate crimes because they have more resources to encourageenforcement of hate crime laws. Although McVeigh et al. (2003) focus ona larger unit of analysis (counties vs. communities) and aggregate all hatecrimes into one outcome, this line of reasoning counters a defended com-munities perspective. Likewise, it could be argued that the componentsof collective efficacy work to encourage the reporting of hate crimes byfostering trust and other informal mechanisms that support victims.Browning (2002), for instance, finds that women feel more comfortabledisclosing domestic disturbances to neighbors and authorities if they residein collectively efficacious neighborhoods (although overall, collective ef-ficacy is negatively related to neighborhood levels of domestic violence).Social cohesion and trust and norms of informal social control may alsoencourage reporting of crimes by improving relationships between citizensand formal agents of control. Attempts at increasing neighborhood efficacythrough community policing emphasize that “citizen calls to the police. . . are one form of social control from the bottom up” (Sampson 2002a,p. 103).
The reporting argument implies that efficacious or relatively affluentcommunities are more sensitive to antiblack hate crimes and encouragevictims or witnesses to report incidents to authorities. In communitieswith fewer economic resources and norms of informal social control andless cohesion, the facility of reporting incidents may be impeded. However,reporting bias is typically inversely related to incident seriousness (Myers1980; Skogan 1984). That is, serious crimes involving threat of or actualbodily harm are more likely reported than “less serious” crimes. If so, wemight expect the reporting benefits of economic and social capital to begreatest for incidents that might, in other contexts, go unreported, suchas incidents not involving bodily harm.
The data provide some opportunity to assess this hypothesis by ex-ploring whether the effects of community characteristics vary by incidentseriousness. Dividing antiblack hate crime counts into violent (antiperson)crimes and nonviolent (primarily property) crimes, supplementary anal-yses reveal little support for the reporting hypothesis. For antiblack in-cidents, informal social control is positively related to both violent inci-dents and nonviolent incidents, and tests for differences in the magnitudeof effects across models (Clogg, Petkova, and Haritou 1995) reveal noevidence that informal social control is more strongly related to less seriousantiblack incidents. The same results hold for economic disadvantage,
Racially Motivated Crime
851
which is negatively related to both categories of antiblack hate crime(results available upon request).
These additional analyses do not provide definitive tests of whethercommunity characteristics facilitate the commission versus the reportingof antiblack hate crime, nor do they address the discretion involved indefining incidents as racially motivated (see Boyd et al. 1996). Nonetheless,they do lend further credibility to the defended communities model. Fur-thermore, if social and economic resources facilitate the reporting of an-tiblack hate crime, one might expect them also to affect the reporting ofantiwhite hate crime in similar ways. Yet, for antiwhite hate crime, in-formal social controls produce fewer reports. In the absence of reliablevictimization data that allows more rigorous analysis of reporting behav-ior, the defended community perspective remains a theoretically compel-ling explanation for the social organization of antiminority hate crime.
Finally, the current study examined hate crimes across relatively largeand heterogeneous community areas, and the mechanisms of collectiveorganization may operate more appropriately at the neighborhood level.Although original tests of the defended community thesis (Green, Stro-lovitch, and Wong 1998) focused on substantially larger units (averagepopulation near 130,000), future work should endeavor to explore thepatterns for antiblack and antiwhite hate crimes at smaller levels of geo-graphical analysis.
This article represents an initial step forward in our understanding ofthe newly redefined but long-standing social problem of racially motivatedcrime. The topic of social organization and crime has long occupied so-ciologists interested in explaining the spatial variation of crime, thoughit has been unclear how these theories can be applied to the specific caseof crimes motivated by racial animus. This study indicates that disor-ganization may well explain reported hate crimes against whites, butantiblack hate crimes are not the product of traditionally crime-riddencommunities. In contrast, in the process of collectively organizing forvalued community ideals such as safety and order, communities maysimultaneously encourage, either explicitly or implicitly, antiblackincidents.
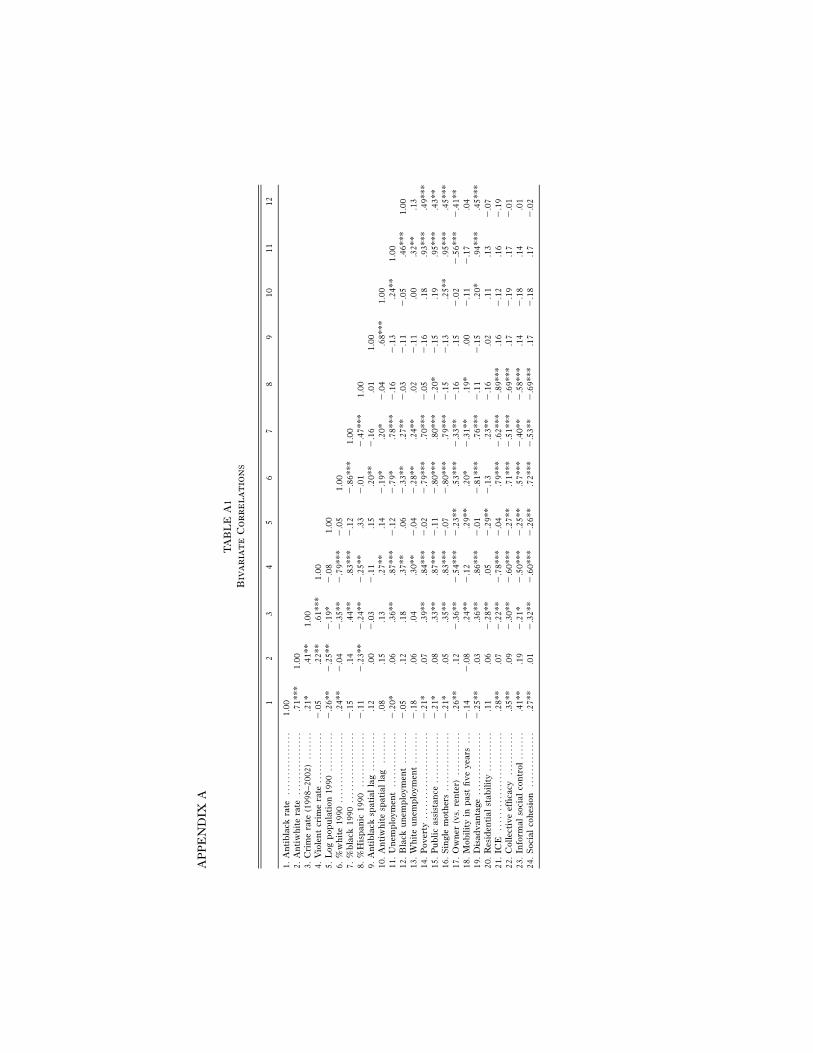
AP
PE
ND
IXA
TA
BL
EA
1B
iva
ria
te
Co
rr
el
at
ion
s
12
34
56
78
910
1112
1.A
nti
bla
ckra
te..
....
....
....
..1.
002.
An
tiw
hit
era
te..
....
....
....
...7
1***
1.00
3.C
rim
era
te(1
998–
2002
)..
....
..2
1*.4
1**
1.00
4.V
iole
nt
crim
era
te..
....
....
...
�.0
5.2
2**
.61*
**1.
005.
Log
pop
ula
tion
1990
....
....
..�
.26*
*�
.25*
*�
.19*
�.0
81.
006.
%w
hit
e19
90..
....
....
....
....
.24*
*�
.04
�.3
5**
�.7
9***
�.0
51.
007.
%b
lack
1990
....
....
....
....
..�
.15
.14
.44*
*.8
3***
�.1
2�
.86*
**1.
008.
%H
isp
anic
1990
....
....
....
..�
.11
�.2
3**
�.2
4**
�.2
5**
.33
�.0
1�
.47*
**1.
009.
An
tib
lack
spat
ial
lag
....
....
...1
2.0
0�
.03
�.1
1.1
5.2
0**
�.1
6.0
11.
0010
.A
nti
wh
ite
spat
ial
lag
....
....
.08
.15
.13
.27*
*.1
4�
.19*
.20*
�.0
4.6
8***
1.00
11.
Un
emp
loym
ent
....
....
....
..�
.20*
.06
.36*
*.8
7***
�.1
2�
.79*
.78*
**�
.16
�.1
3.2
4**
1.00
12.
Bla
cku
nem
plo
ymen
t..
....
..�
.05
.12
.18
.37*
*.0
6�
.33*
*.2
7**
�.0
3�
.11
�.0
5.4
6***
1.00
13.
Wh
ite
un
emp
loym
ent
....
....
�.1
8.0
6.0
4.3
0**
�.0
4�
.28*
*.2
4**
.02
�.1
1.0
0.3
2**
.13
14.
Pov
erty
....
....
....
....
....
..�
.21*
.07
.39*
*.8
4***
�.0
2�
.79*
**.7
0***
�.0
5�
.16
.18
.93*
**.4
9***
15.
Pu
bli
cas
sist
ance
....
....
....
.�
.21*
.08
.33*
*.8
7***
�.1
1�
.80*
**.8
0***
�.2
0*�
.15
.19
.95*
**.4
3**
16.
Sin
gle
mot
her
s..
....
....
....
.�
.21*
.05
.35*
*.8
3***
�.0
7�
.80*
**.7
9***
�.1
5�
.13
.25*
*.9
5***
.45*
**17
.O
wn
er(v
s.re
nte
r)..
....
....
..2
6**
.12
�.3
6**
�.5
4***
�.2
3**
.53*
**�
.33*
*�
.16
.15
�.0
2�
.56*
**�
.41*
*18
.M
obil
ity
inp
ast
fiv
eye
ars
...
�.1
4�
.08
.24*
*�
.12
.29*
*.2
0*�
.31*
*.1
9*.0
0�
.11
�.1
7.0
419
.D
isad
van
tage
....
....
....
....
�.2
5**
.03
.36*
*.8
6***
�.0
1�
.81*
**.7
6***
�.1
1�
.15
.20*
.94*
**.4
5***
20.
Res
iden
tial
stab
ilit
y..
....
....
.11
.06
�.2
8**
.05
�.2
9**
�.1
3.2
3**
�.1
6.0
2.1
1.1
3�
.07
21.
ICE
....
....
....
....
....
....
..2
8**
.07
�.2
2**
�.7
8***
�.0
4.7
9***
�.6
2***
�.8
9***
.16
�.1
2.1
6�
.19
22.
Col
lect
ive
effi
cacy
....
....
...
.35*
*.0
9�
.30*
*�
.60*
**�
.27*
*.7
1***
�.5
1***
�.6
9***
.17
�.1
9.1
7�
.01
23.
Info
rmal
soci
alco
ntr
ol..
....
..4
1**
.19
�.2
1*�
.50*
**�
.25*
*.5
7***
�.4
0**
�.5
8***
.14
�.1
8.1
4.0
124
.S
ocia
lco
hes
ion
....
....
....
...2
7**
.01
�.3
2**
�.6
0***
�.2
6**
.72*
**�
.53*
*�
.69*
**.1
7�
.18
.17
�.0
2
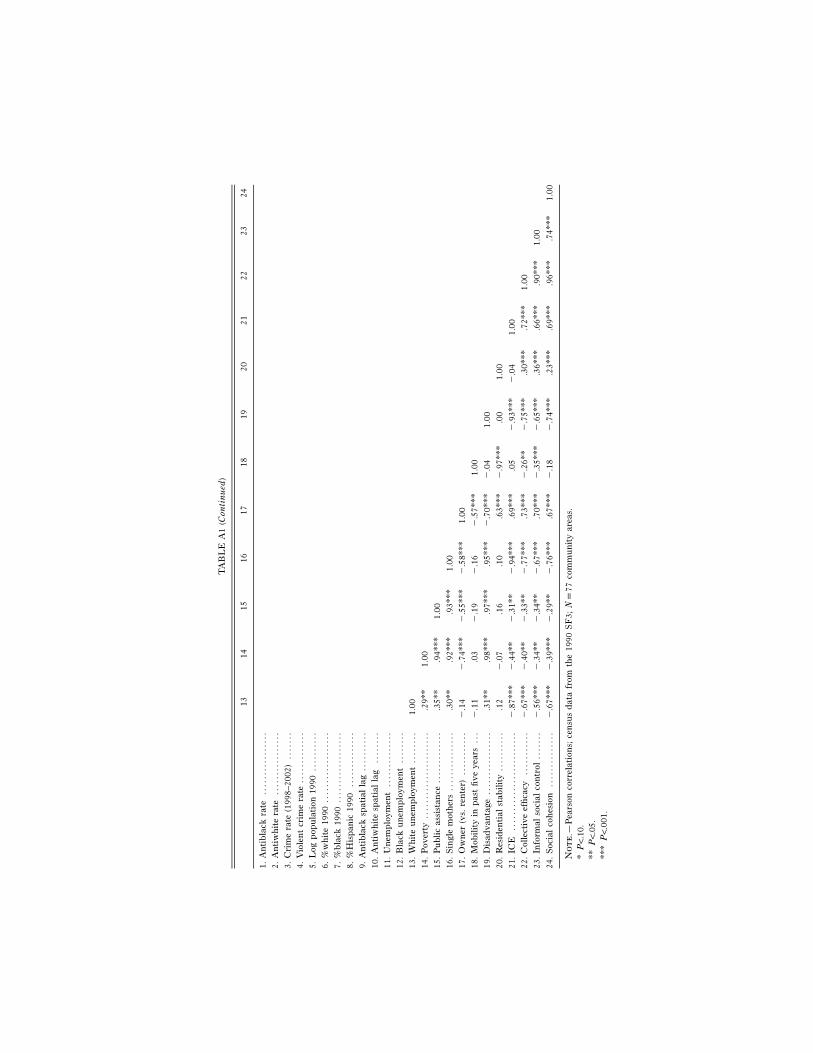
TA
BL
EA
1(C
onti
nu
ed)
1314
1516
1718
1920
2122
2324
1.A
nti
bla
ckra
te..
....
....
....
..2.
An
tiw
hit
era
te..
....
....
....
..3.
Cri
me
rate
(199
8–20
02)
....
...
4.V
iole
nt
crim
era
te..
....
....
...
5.L
ogp
opu
lati
on19
90..
....
....
6.%
wh
ite
1990
....
....
....
....
..7.
%b
lack
1990
....
....
....
....
..8.
%H
isp
anic
1990
....
....
....
..9.
An
tib
lack
spat
ial
lag
....
....
..10
.A
nti
wh
ite
spat
ial
lag
....
....
11.
Un
emp
loym
ent
....
....
....
..12
.B
lack
un
emp
loym
ent
....
....
13.
Wh
ite
un
emp
loym
ent
....
....
1.00
14.
Pov
erty
....
....
....
....
....
...2
9**
1.00
15.
Pu
bli
cas
sist
ance
....
....
....
..3
5**
.94*
**1.
0016
.S
ingl
em
oth
ers
....
....
....
...
.30*
*.9
2***
.93*
**1.
0017
.O
wn
er(v
s.re
nte
r)..
....
....
.�
.14
�.7
4***
�.5
5***
�.5
8***
1.00
18.
Mob
ilit
yin
pas
tfi
ve
year
s..
.�
.11
.03
�.1
9�
.16
�.5
7***
1.00
19.
Dis
adv
anta
ge..
....
....
....
...3
1**
.98*
**.9
7***
.95*
**�
.70*
**�
.04
1.00
20.
Res
iden
tial
stab
ilit
y..
....
....
.12
�.0
7.1
6.1
0.6
3***
�.9
7***
.00
1.00
21.
ICE
....
....
....
....
....
....
.�
.87*
**�
.44*
*�
.31*
*�
.94*
**.6
9***
.05
�.9
3***
�.0
41.
0022
.C
olle
ctiv
eef
fica
cy..
....
....
.�
.67*
**�
.40*
*�
.33*
*�
.77*
**.7
3***
�.2
6**
�.7
5***
.30*
**.7
2***
1.00
23.
Info
rmal
soci
alco
ntr
ol..
....
.�
.56*
**�
.34*
*�
.34*
*�
.67*
**.7
0***
�.3
5***
�.6
5***
.36*
**.6
6***
.90*
**1.
0024
.S
ocia
lco
hes
ion
....
....
....
..�
.67*
**�
.39*
**�
.29*
*�
.76*
**.6
7***
�.1
8�
.74*
**.2
3***
.69*
**.9
6***
.74*
**1.
00
No
te
.—P
ears
onco
rrel
atio
ns;
cen
sus
dat
afr
omth
e19
90S
F3;
Np
77co
mm
un
ity
area
s.*
P!
.10.
**P
!.0
5.**
*P
!.0
01.
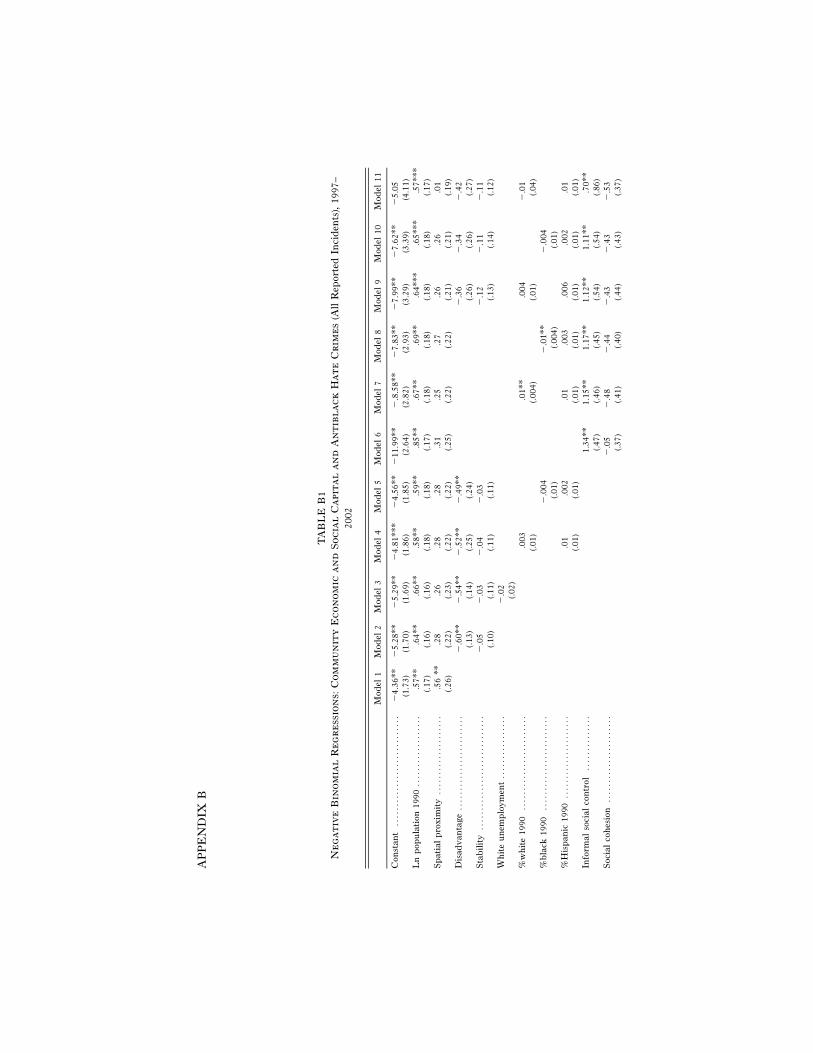
AP
PE
ND
IXB
TA
BL
EB
1N
eg
at
ive
Bin
om
ial
Re
gr
ess
ion
s:C
om
mu
nit
yE
co
no
mic
an
dS
oc
ial
Ca
pit
al
an
dA
nt
ibl
ac
kH
at
eC
rim
es
(All
Rep
orte
dIn
cid
ents
),19
97–
2002
Mod
el1
Mod
el2
Mod
el3
Mod
el4
Mod
el5
Mod
el6
Mod
el7
Mod
el8
Mod
el9
Mod
el10
Mod
el11
Con
stan
t..
....
....
....
....
....
....
..�
4.36
**�
5.28
**�
5.29
**�
4.81
***
�4.
56**
�11
.99*
*�
.8.5
8**
�7.
83**
�7.
99**
�7.
62**
�5.
05(1
.73)
(1.7
0)(1
.69)
(1.8
6)(1
.85)
(2.6
4)(2
.82)
(2.9
3)(3
.29)
(3.3
9)(4
.11)
Ln
pop
ula
tion
1990
....
....
....
....
...5
7**
.64*
*.6
6**
.58*
*.5
9**
.85*
*.6
7**
.69*
*.6
4***
.65*
**.5
7***
(.17)
(.16)
(.16)
(.18)
(.18)
(.17)
(.18)
(.18)
(.18)
(.18)
(.17)
Sp
atia
lp
roxi
mit
y..
....
....
....
....
...5
6**
.28
.26
.28
.28
.31
.25
.27
.26
.26
.01
(.26)
(.22)
(.23)
(.22)
(.22)
(.25)
(.22)
(.22)
(.21)
(.21)
(.19)
Dis
adv
anta
ge..
....
....
....
....
....
..�
.60*
*�
.54*
*�
.52*
*�
.49*
*�
.36
�.3
4�
.42
(.13)
(.14)
(.25)
(.24)
(.26)
(.26)
(.27)
Sta
bil
ity
....
....
....
....
....
....
....
.�
.05
�.0
3�
.04
�.0
3�
.12
�.1
1�
.11
(.10)
(.11)
(.11)
(.11)
(.13)
(.14)
(.12)
Wh
ite
un
emp
loym
ent
....
....
....
....
�.0
2(.0
2)%
wh
ite
1990
....
....
....
....
....
....
.003
.01*
*.0
04�
.01
(.01)
(.004
)(.0
1)(.0
4)%
bla
ck19
90..
....
....
....
....
....
..�
.004
�.0
1**
�.0
04(.0
1)(.0
04)
(.01)
%H
isp
anic
1990
....
....
....
....
....
..0
1.0
02.0
1.0
03.0
06.0
02.0
1(.0
1)(.0
1)(.0
1)(.0
1)(.0
1)(.0
1)(.0
1)In
form
also
cial
con
trol
....
....
....
..1.
34**
1.15
**1.
17**
1.12
**1.
11**
.70*
*(.4
7)(.4
6)(.4
5)(.5
4)(.5
4)(.8
6)S
ocia
lco
hes
ion
....
....
....
....
....
..�
.05
�.4
8�
.44
�.4
3�
.43
�.5
3(.3
7)(.4
1)(.4
0)(.4
4)(.4
3)(.3
7)

TA
BL
EB
1(C
onti
nu
ed)
Mod
el1
Mod
el2
Mod
el3
Mod
el4
Mod
el5
Mod
el6
Mod
el7
Mod
el8
Mod
el9
Mod
el10
Mod
el11
%ch
ange
inb
lack
pop
ula
tion
,19
90–2
000
....
....
....
....
....
....
�.5
7*(.3
2)In
form
also
cial
con
trol
#%
wh
ite
...
.005
(.01)
Info
rmal
soci
alco
ntr
ol#
%ch
ange
inb
lack
pop
ula
tion
....
....
....
...
.18*
(.10)
%w
hit
e19
90#
%ch
ange
inb
lack
pop
ula
tion
....
....
....
....
....
....
�.0
12*
(.007
)In
form
also
cial
con
trol
#%
wh
ite
#%
chan
gein
bla
ck..
....
....
....
...
.003
**(.0
016)
Ov
erd
isp
ersi
on..
....
....
....
....
....
.78
.55
.54
.53
.54
.60
.50
.50
.48
.48
.26
(.17)
(.13)
(.13)
(.13)
(.13)
(.14)
(.13)
(.13)
(.12)
(.12)
(.09)
Log
lik
elih
ood
....
....
....
....
....
...
�19
8.67
188.
78�
187.
85�
188.
36�
188.
27�
191.
86�
187.
57�
186.
28�
186.
14�
186.
06�
176.
40
No
te
.—N
p77
Ch
icag
oco
mm
un
ity
area
s;u
nst
and
ard
ized
coef
fici
ents
;S
Es
inp
aren
thes
es.
*P
!.1
0.**
P!
.05.
***
P!
.001
.
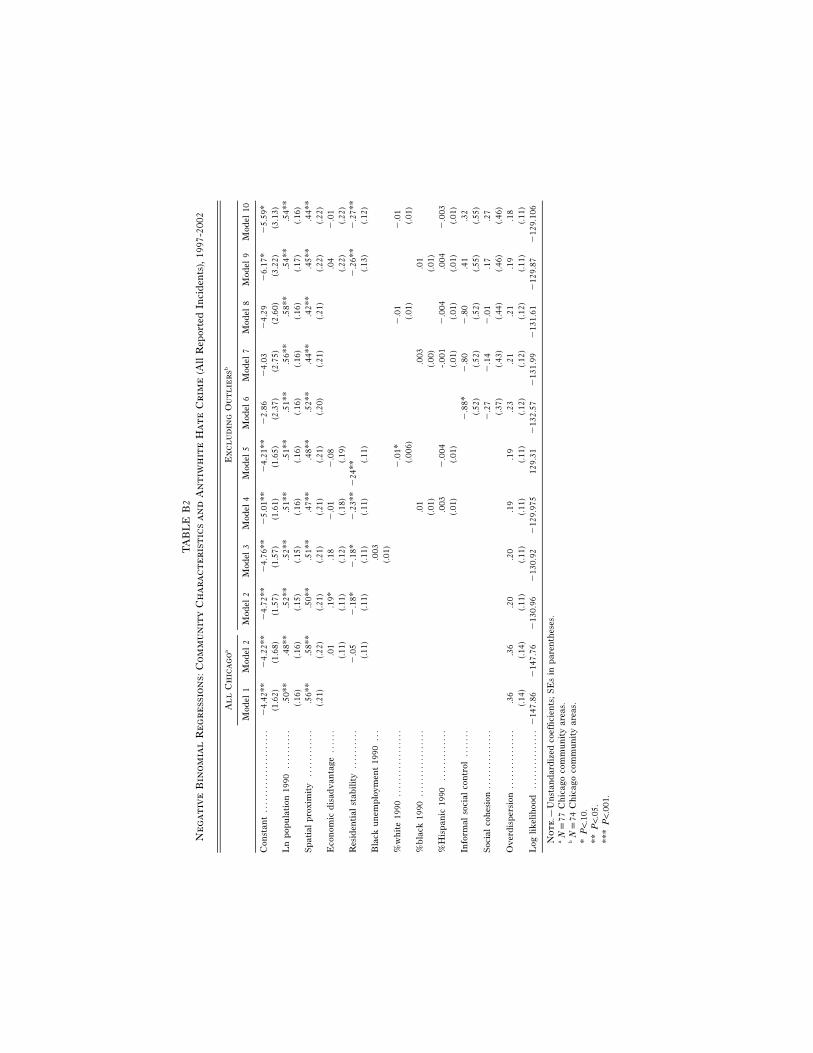
TA
BL
EB
2N
eg
at
ive
Bin
om
ial
Re
gr
ess
ion
s:C
om
mu
nit
yC
ha
ra
ct
er
ist
ics
an
dA
nt
iwh
ite
Ha
te
Cr
ime
(All
Rep
orte
dIn
cid
ents
),19
97-2
002
Al
lC
hic
ag
oaE
xc
lu
din
gO
ut
lie
rsb
Mod
el1
Mod
el2
Mod
el2
Mod
el3
Mod
el4
Mod
el5
Mod
el6
Mod
el7
Mod
el8
Mod
el9
Mod
el10
Con
stan
t..
....
....
....
....
...
�4.
42**
�4.
22**
�4.
72**
�4.
76**
�5.
01**
�4.
21**
�2.
86�
4.03
�4.
29�
6.17
*�
5.59
*(1
.62)
(1.6
8)(1
.57)
(1.5
7)(1
.61)
(1.6
5)(2
.37)
(2.7
5)(2
.60)
(3.2
2)(3
.13)
Ln
pop
ula
tion
1990
....
....
...5
0**
.48*
*.5
2**
.52*
*.5
1**
.51*
*.5
1**
.56*
*.5
8**
.54*
*.5
4**
(.16)
(.16)
(.15)
(.15)
(.16)
(.16)
(.16)
(.16)
(.16)
(.17)
(.16)
Sp
atia
lp
roxi
mit
y..
....
....
...5
6**
.58*
*.5
0**
.51*
*.4
7**
.48*
*.5
2**
.44*
*.4
2**
.45*
*.4
4**
(.21)
(.22)
(.21)
(.21)
(.21)
(.21)
(.20)
(.21)
(.21)
(.22)
(.22)
Eco
nom
icd
isad
van
tage
....
...0
1.1
9*.1
8�
.01
�.0
8.0
4�
.01
(.11)
(.11)
(.12)
(.18)
(.19)
(.22)
(.22)
Res
iden
tial
stab
ilit
y..
....
....
�.0
5�
.18*
�.1
8*�
.23*
*�
24**
�.2
6**
�.2
7**
(.11)
(.11)
(.11)
(.11)
(.11)
(.13)
(.12)
Bla
cku
nem
plo
ymen
t19
90..
..0
03(.0
1)%
wh
ite
1990
....
....
....
....
.�
.01*
�.0
1�
.01
(.006
)(.0
1)(.0
1)%
bla
ck19
90..
....
....
....
...
.01
.003
.01
(.01)
(.00)
(.01)
%H
isp
anic
1990
....
....
....
..0
03�
.004
-.00
1�
.004
.004
�.0
03(.0
1)(.0
1)(.0
1)(.0
1)(.0
1)(.0
1)In
form
also
cial
con
trol
....
...
�.8
8*�
.80
�.8
0.4
1.3
2(.5
2)(.5
2)(.5
2)(.5
5)(.5
5)S
ocia
lco
hes
ion
....
....
....
...
�.2
7�
.14
�.0
1.1
7.2
7(.3
7)(.4
3)(.4
4)(.4
6)(.4
6)O
ver
dis
per
sion
....
....
....
...
.36
.36
.20
.20
.19
.19
.23
.21
.21
.19
.18
(.14)
(.14)
(.11)
(.11)
(.11)
(.11)
(.12)
(.12)
(.12)
(.11)
(.11)
Log
lik
elih
ood
....
....
....
...
�14
7.86
�14
7.76
�13
0.96
�13
0.92
�12
9.97
512
9.31
�13
2.57
�13
1.99
�13
1.61
�12
9.87
�12
9.10
6
No
te
.—U
nst
and
ard
ized
coef
fici
ents
;S
Es
inp
aren
thes
es.
aN
p77
Ch
icag
oco
mm
un
ity
area
s.b
Np
74C
hic
ago
com
mu
nit
yar
eas.
*P
!.1
0.**
P!
.05.
***
P!
.001
.
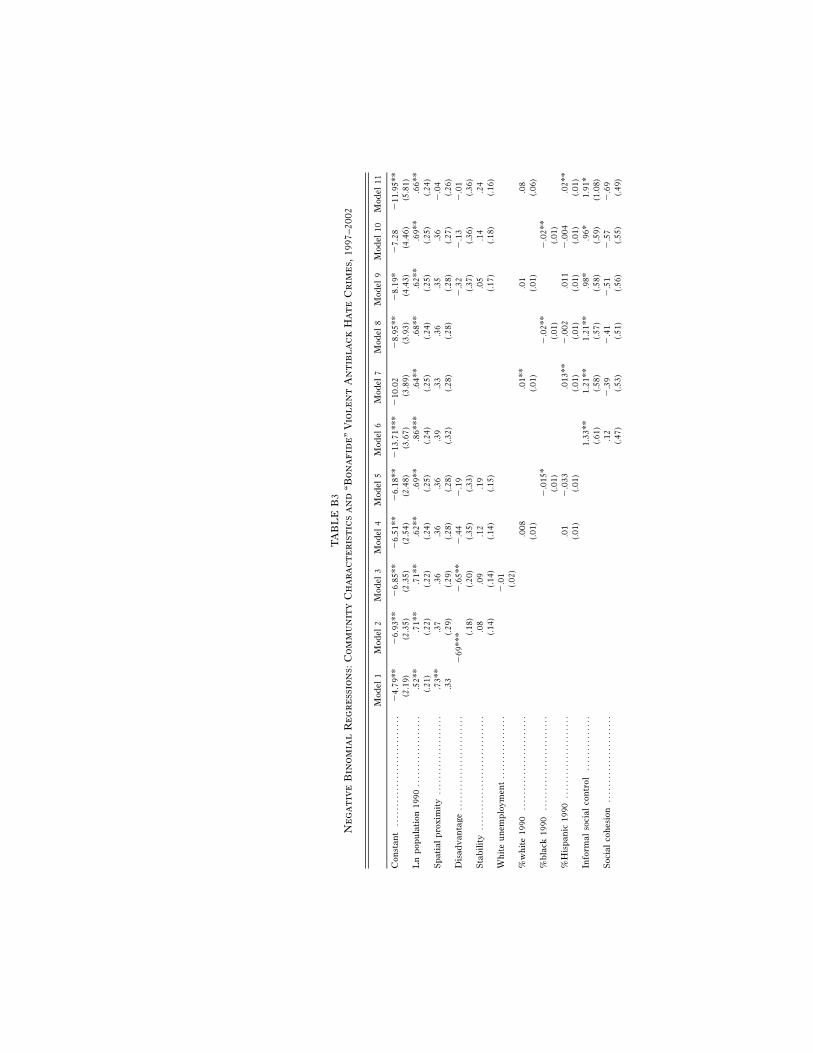
TA
BL
EB
3N
eg
at
ive
Bin
om
ial
Re
gr
ess
ion
s:C
om
mu
nit
yC
ha
ra
ct
er
ist
ics
an
d“B
on
afi
de
”V
iol
en
tA
nt
ibl
ac
kH
at
eC
rim
es,
1997
–200
2
Mod
el1
Mod
el2
Mod
el3
Mod
el4
Mod
el5
Mod
el6
Mod
el7
Mod
el8
Mod
el9
Mod
el10
Mod
el11
Con
stan
t..
....
....
....
....
....
....
..�
4.79
**�
6.93
**�
6.85
**�
6.51
**�
6.18
**�
13.7
1***
�10
.02
�8.
95**
�8.
19*
�7.
28�
11.9
5**
(2.1
9)(2
.35)
(2.3
5)(2
.54)
(2.4
8)(3
.67)
(3.8
9)(3
.93)
(4.4
3)(4
.46)
(5.8
1)L
np
opu
lati
on19
90..
....
....
....
....
.52*
*.7
1**
.71*
*.6
2**
.69*
*.8
6***
.64*
*.6
8**
.62*
*.6
9**
.66*
*(.2
1)(.2
2)(.2
2)(.2
4)(.2
5)(.2
4)(.2
5)(.2
4)(.2
5)(.2
5)(.2
4)S
pat
ial
pro
xim
ity
....
....
....
....
....
.73*
*.3
7.3
6.3
6.3
6.3
9.3
3.3
6.3
5.3
6�
.04
.33
(.29)
(.29)
(.28)
(.28)
(.32)
(.28)
(.28)
(.28)
(.27)
(.26)
Dis
adv
anta
ge..
....
....
....
....
....
..�
69**
*�
.65*
*�
.44
�.1
9�
.32
�.1
3�
.01
(.18)
(.20)
(.35)
(.33)
(.37)
(.36)
(.36)
Sta
bil
ity
....
....
....
....
....
....
....
..0
8.0
9.1
2.1
9.0
5.1
4.2
4(.1
4)(.1
4)(.1
4)(.1
5)(.1
7)(.1
8)(.1
6)W
hit
eu
nem
plo
ymen
t..
....
....
....
..�
.01
(.02)
%w
hit
e19
90..
....
....
....
....
....
...0
08.0
1**
.01
.08
(.01)
(.01)
(.01)
(.06)
%b
lack
1990
....
....
....
....
....
....
�.0
15*
�.0
2**
�.0
2**
(.01)
(.01)
(.01)
%H
isp
anic
1990
....
....
....
....
....
..0
1�
.033
.013
**�
.002
.011
�.0
04.0
2**
(.01)
(.01)
(.01)
(.01)
(.01)
(.01)
(.01)
Info
rmal
soci
alco
ntr
ol..
....
....
....
1.33
**1.
21**
1.21
**.9
8*.9
6*1.
91*
(.61)
(.58)
(.57)
(.58)
(.59)
(1.0
8)S
ocia
lco
hes
ion
....
....
....
....
....
...1
2�
.39
�.4
1�
.51
�.5
7�
.69
(.47)
(.53)
(.51)
(.56)
(.55)
(.49)
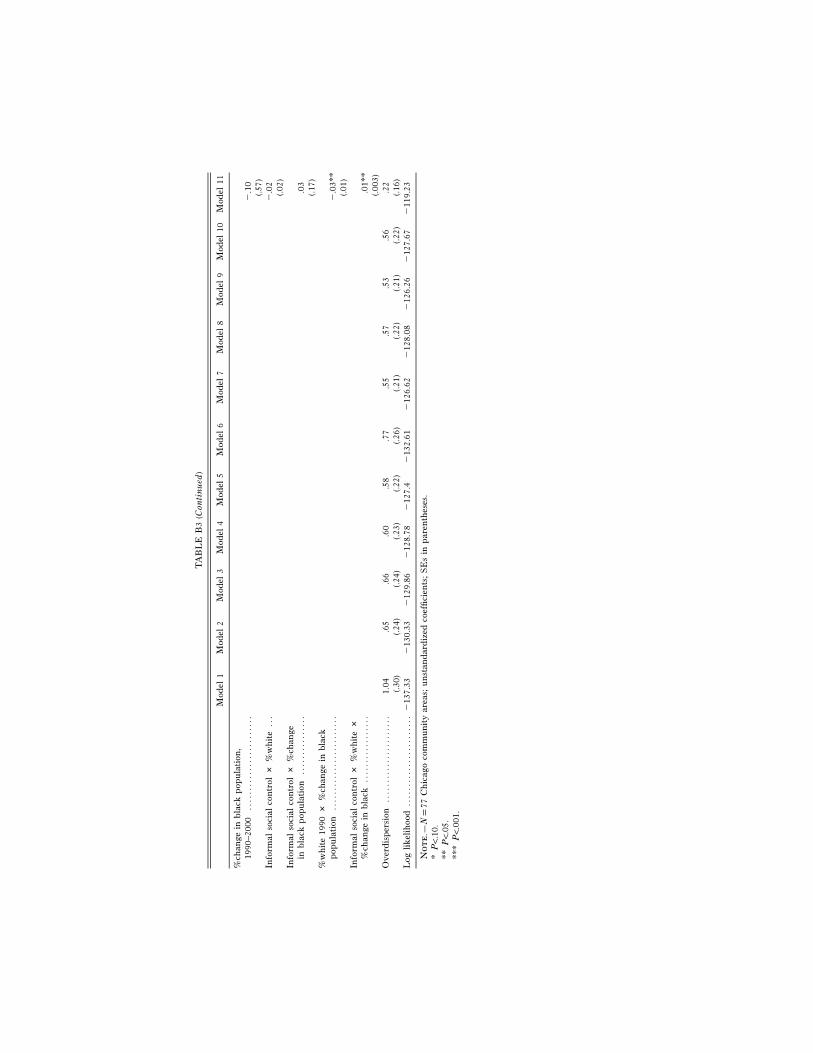
TA
BL
EB
3(C
onti
nu
ed)
Mod
el1
Mod
el2
Mod
el3
Mod
el4
Mod
el5
Mod
el6
Mod
el7
Mod
el8
Mod
el9
Mod
el10
Mod
el11
%ch
ange
inb
lack
pop
ula
tion
,19
90–2
000
....
....
....
....
....
....
�.1
0(.5
7)In
form
also
cial
con
trol
#%
wh
ite
...
�.0
2(.0
2)In
form
also
cial
con
trol
#%
chan
gein
bla
ckp
opu
lati
on..
....
....
....
..0
3(.1
7)%
wh
ite
1990
#%
chan
gein
bla
ckp
opu
lati
on..
....
....
....
....
....
..�
.03*
*(.0
1)In
form
also
cial
con
trol
#%
wh
ite
#%
chan
gein
bla
ck..
....
....
....
...
.01*
*(.0
03)
Ov
erd
isp
ersi
on..
....
....
....
....
....
1.04
.65
.66
.60
.58
.77
.55
.57
.53
.56
.22
(.30)
(.24)
(.24)
(.23)
(.22)
(.26)
(.21)
(.22)
(.21)
(.22)
(.16)
Log
lik
elih
ood
....
....
....
....
....
...
�13
7.33
�13
0.33
�12
9.86
�12
8.78
�12
7.4
�13
2.61
�12
6.62
�12
8.08
�12
6.26
�12
7.67
�11
9.23
No
te
.—N
p77
Ch
icag
oco
mm
un
ity
area
s;u
nst
and
ard
ized
coef
fici
ents
;S
Es
inp
aren
thes
es.
*P
!.1
0.**
P!
.05.
***
P!
.001
.
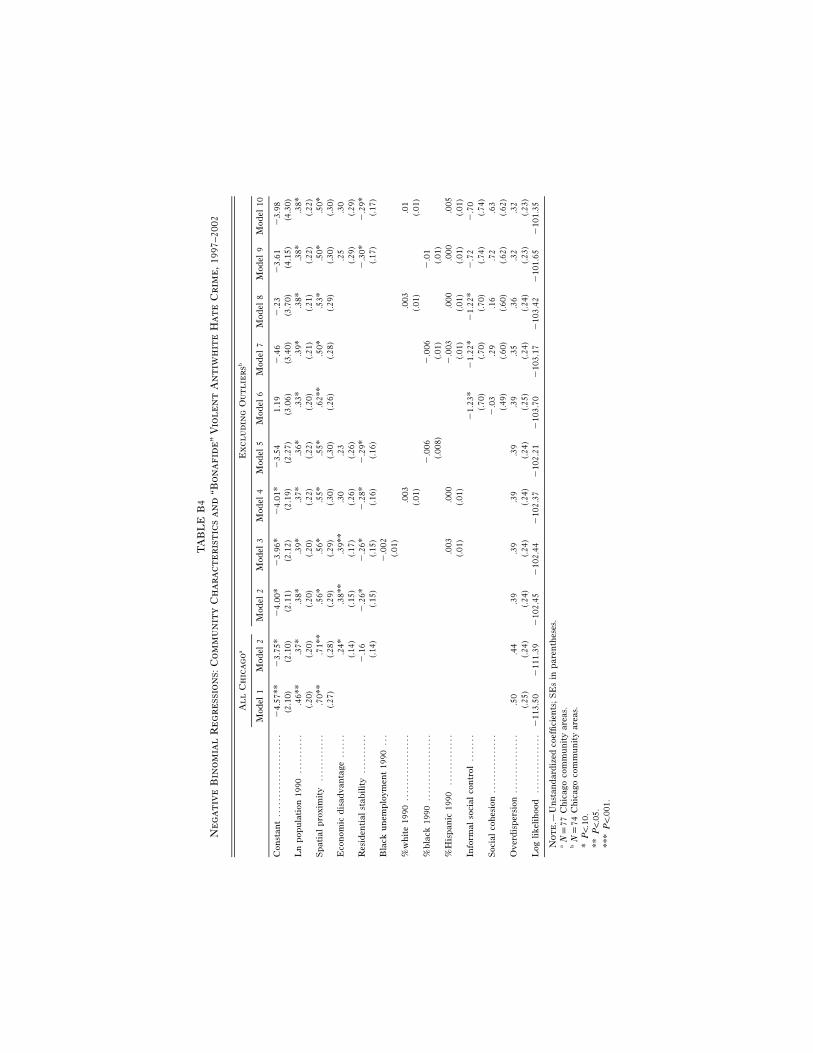
TA
BL
EB
4N
eg
at
ive
Bin
om
ial
Re
gr
ess
ion
s:C
om
mu
nit
yC
ha
ra
ct
er
ist
ics
an
d“B
on
afi
de
”V
iol
en
tA
nt
iwh
ite
Ha
te
Cr
ime
,19
97–2
002
Al
lC
hic
ag
oaE
xc
lu
din
gO
ut
lie
rsb
Mod
el1
Mod
el2
Mod
el2
Mod
el3
Mod
el4
Mod
el5
Mod
el6
Mod
el7
Mod
el8
Mod
el9
Mod
el10
Con
stan
t..
....
....
....
....
...
�4.
57**
�3.
75*
�4.
00*
�3.
96*
�4.
01*
�3.
541.
19�
.46
�.2
3�
3.61
�3.
98(2
.10)
(2.1
0)(2
.11)
(2.1
2)(2
.19)
(2.2
7)(3
.06)
(3.4
0)(3
.70)
(4.1
5)(4
.30)
Ln
pop
ula
tion
1990
....
....
...4
6**
.37*
.38*
.39*
.37*
.36*
.33*
.39*
.38*
.38*
.38*
(.20)
(.20)
(.20)
(.20)
(.22)
(.22)
(.20)
(.21)
(.21)
(.22)
(.22)
Sp
atia
lp
roxi
mit
y..
....
....
...7
0**
.71*
*.5
6*.5
6*.5
5*.5
5*.6
2**
.50*
.53*
.50*
.50*
(.27)
(.28)
(.29)
(.29)
(.30)
(.30)
(.26)
(.28)
(.29)
(.30)
(.30)
Eco
nom
icd
isad
van
tage
....
...2
4*.3
8**
.39*
*.3
0.2
3.2
5.3
0(.1
4)(.1
5)(.1
7)(.2
6)(.2
6)(.2
9)(.2
9)R
esid
enti
alst
abil
ity
....
....
..�
.16
�.2
6*�
.26*
�.2
8*�
.29*
�.3
0*�
.29*
(.14)
(.15)
(.15)
(.16)
(.16)
(.17)
(.17)
Bla
cku
nem
plo
ymen
t19
90..
.�
.002
(.01)
%w
hit
e19
90..
....
....
....
...
.003
.003
.01
(.01)
(.01)
(.01)
%b
lack
1990
....
....
....
....
.�
.006
�.0
06�
.01
(.008
)(.0
1)(.0
1)%
His
pan
ic19
90..
....
....
...
.003
.000
�.0
03.0
00.0
00.0
05(.0
1)(.0
1)(.0
1)(.0
1)(.0
1)(.0
1)In
form
also
cial
con
trol
....
...
�1.
23*
�1.
22*
�1.
22*
�.7
2�
.70
(.70)
(.70)
(.70)
(.74)
(.74)
Soc
ial
coh
esio
n..
....
....
....
.�
.03
.29
.16
.72
.63
(.49)
(.60)
(.60)
(.62)
(.62)
Ov
erd
isp
ersi
on..
....
....
....
..5
0.4
4.3
9.3
9.3
9.3
9.3
9.3
5.3
6.3
2.3
2(.2
5)(.2
4)(.2
4)(.2
4)(.2
4)(.2
4)(.2
5)(.2
4)(.2
4)(.2
3)(.2
3)L
ogli
kel
ihoo
d..
....
....
....
.�
113.
50�
111.
39�
102.
45�
102.
44�
102.
37�
102.
21�
103.
70�
103.
17�
103.
42�
101.
65�
101.
35
No
te
.—U
nst
and
ard
ized
coef
fici
ents
;S
Es
inp
aren
thes
es.
aN
p77
Ch
icag
oco
mm
un
ity
area
s.b
Np
74C
hic
ago
com
mu
nit
yar
eas.
*P
!.1
0.**
P!
.05.
***
P!
.001
.
American Journal of Sociology
860
REFERENCES
Anselin, Luc. 1988. Spatial Econometrics: Methods and Models. Dordrecht: KluwerAcademic Publishers.
———. 1995. “Local Indicators of Spatial Association—LISA.” Geographical Analysis27:93–115.
Baller, Robert D., Luc Anselin, Steven Messner, Glenn Deane, and Darnell Hawkins.2001. “Structural Covariates of U.S. County Homicide Rates: Incorporating SpatialEffects.” Criminology 39:561–90.
Baller, Robert D., and Kelly K. Richardson. 2002. “Social Integration, Imitation, andthe Geographic Patterning of Suicide.” American Sociological Review 67:873–88.
Berk, Richard A., Elizabeth A. Boyd, and Karl M. Hamner. 1992. “Thinking MoreClearly about Hate-Motivated Crimes.” Pp. 123–43 in Hate Crimes: ConfrontingViolence against Lesbians and Gay Men, edited by Gregory M. Herek and KevinBerill. Newbury Park, Calif.: Sage.
Berlet, Chip. 2001. “Hate Groups, Racial Tension and Ethnoviolence in an IntegratingNeighborhood, 1976–1988.” Research in Political Sociology 9:117–63.
Black, Donald D. 1983. “Crime as Social Control.” American Sociological Review 48:34–45.
Blackwell, James W. 1990. “Ethnic Inequality and the Rate of Homicide.” Social Forces69:53–70.
Bonacich, Edna. 1972. “A Theory of Ethnic Antagonism: The Split Labor Market.”American Sociological Review 37 (5): 547–59.
Boyd, Elizabeth A., Richard A. Berk, and Karl M. Hamner. 1996. “‘Motivated byHatred or Prejudice’: Categorization of Hate-Motivated Crimes in Two PoliceDivisions.” Law and Society Review 30:819–50.
Browning, Christopher R. 2002. “The Span of Collective Efficacy: Extending SocialDisorganization Theory to Partner Violence.” Journal of Marriage and Family 64:833–50.
Bruch, Elizabeth E., and Robert D. Mare. 2006. “Neighborhood Choice andNeighborhood Change.” American Journal of Sociology 112 (3): 667–709.
Bursik, Robert J., Jr. 1988. “Social Disorganization Theories of Crime and Delinquency:Problems and Prospects.” Criminology 26:519–52.
Clogg, Clifford, Eva Petkova, and Adamantios Haritou. 1995. “Statistical Methods forComparing Regression Coefficients between Models.” American Journal of Sociology100:1261–93.
Coleman, James S. 1988. “Social Capital in the Creation of Human Capital.” AmericanJournal of Sociology 94:S95–S120.
Comstock, Gary D. 1991. Violence against Lesbians and Gay Men. New York:Columbia University Press.
CPD (Chicago Police Department). 2005. “Hate Crimes in Chicago.” Chicago: ChicagoPolice Department.
Craig, Kellina M. 1999. “Retaliation, Fear, or Rage: An Investigation of AfricanAmerican and White Reactions to Racist Hate Crime.” Journal of InterpersonalViolence 14:138–51.
De Sena, Judith. 1990. Protecting One’s Turf: Social Strategies for Maintaining UrbanNeighborhoods. Lanham, Md.: University Press of America.
FBI (Federal Bureau of Investigation). 1999a. Hate Crime Statistics, 1998. Washington,D.C: Government Printing Office.
———. 1999b. Hate Crime Data Collection Guidelines. Washington D.C.: U.S.Department of Justice, Federal Bureau of Investigation.
Grattet, Ryken, Valerie Jenness, and Timothy Curry. 1998. “The Homogenization andDifferentiation of Hate Crime Law in the United States, 1978 to 1995: Innovation
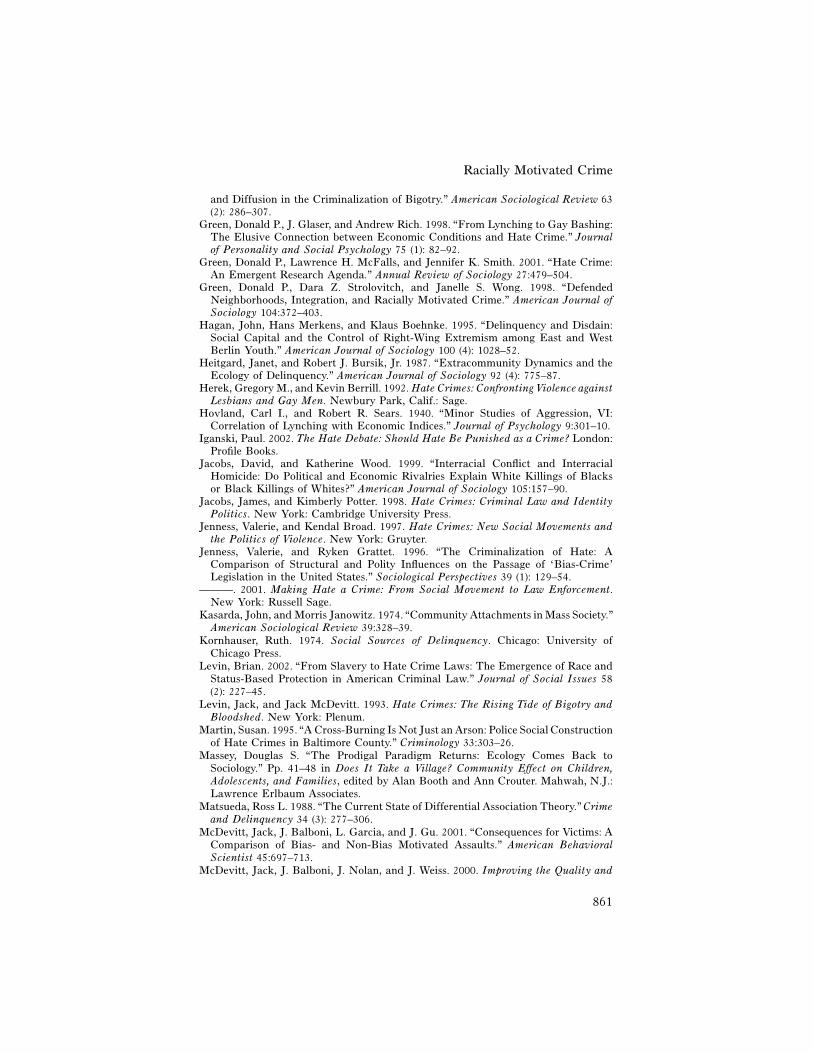
Racially Motivated Crime
861
and Diffusion in the Criminalization of Bigotry.” American Sociological Review 63(2): 286–307.
Green, Donald P., J. Glaser, and Andrew Rich. 1998. “From Lynching to Gay Bashing:The Elusive Connection between Economic Conditions and Hate Crime.” Journalof Personality and Social Psychology 75 (1): 82–92.
Green, Donald P., Lawrence H. McFalls, and Jennifer K. Smith. 2001. “Hate Crime:An Emergent Research Agenda.” Annual Review of Sociology 27:479–504.
Green, Donald P., Dara Z. Strolovitch, and Janelle S. Wong. 1998. “DefendedNeighborhoods, Integration, and Racially Motivated Crime.” American Journal ofSociology 104:372–403.
Hagan, John, Hans Merkens, and Klaus Boehnke. 1995. “Delinquency and Disdain:Social Capital and the Control of Right-Wing Extremism among East and WestBerlin Youth.” American Journal of Sociology 100 (4): 1028–52.
Heitgard, Janet, and Robert J. Bursik, Jr. 1987. “Extracommunity Dynamics and theEcology of Delinquency.” American Journal of Sociology 92 (4): 775–87.
Herek, Gregory M., and Kevin Berrill. 1992. Hate Crimes: Confronting Violence againstLesbians and Gay Men. Newbury Park, Calif.: Sage.
Hovland, Carl I., and Robert R. Sears. 1940. “Minor Studies of Aggression, VI:Correlation of Lynching with Economic Indices.” Journal of Psychology 9:301–10.
Iganski, Paul. 2002. The Hate Debate: Should Hate Be Punished as a Crime? London:Profile Books.
Jacobs, David, and Katherine Wood. 1999. “Interracial Conflict and InterracialHomicide: Do Political and Economic Rivalries Explain White Killings of Blacksor Black Killings of Whites?” American Journal of Sociology 105:157–90.
Jacobs, James, and Kimberly Potter. 1998. Hate Crimes: Criminal Law and IdentityPolitics. New York: Cambridge University Press.
Jenness, Valerie, and Kendal Broad. 1997. Hate Crimes: New Social Movements andthe Politics of Violence. New York: Gruyter.
Jenness, Valerie, and Ryken Grattet. 1996. “The Criminalization of Hate: AComparison of Structural and Polity Influences on the Passage of ‘Bias-Crime’Legislation in the United States.” Sociological Perspectives 39 (1): 129–54.
———. 2001. Making Hate a Crime: From Social Movement to Law Enforcement.New York: Russell Sage.
Kasarda, John, and Morris Janowitz. 1974. “Community Attachments in Mass Society.”American Sociological Review 39:328–39.
Kornhauser, Ruth. 1974. Social Sources of Delinquency. Chicago: University ofChicago Press.
Levin, Brian. 2002. “From Slavery to Hate Crime Laws: The Emergence of Race andStatus-Based Protection in American Criminal Law.” Journal of Social Issues 58(2): 227–45.
Levin, Jack, and Jack McDevitt. 1993. Hate Crimes: The Rising Tide of Bigotry andBloodshed. New York: Plenum.
Martin, Susan. 1995. “A Cross-Burning Is Not Just an Arson: Police Social Constructionof Hate Crimes in Baltimore County.” Criminology 33:303–26.
Massey, Douglas S. “The Prodigal Paradigm Returns: Ecology Comes Back toSociology.” Pp. 41–48 in Does It Take a Village? Community Effect on Children,Adolescents, and Families, edited by Alan Booth and Ann Crouter. Mahwah, N.J.:Lawrence Erlbaum Associates.
Matsueda, Ross L. 1988. “The Current State of Differential Association Theory.” Crimeand Delinquency 34 (3): 277–306.
McDevitt, Jack, J. Balboni, L. Garcia, and J. Gu. 2001. “Consequences for Victims: AComparison of Bias- and Non-Bias Motivated Assaults.” American BehavioralScientist 45:697–713.
McDevitt, Jack, J. Balboni, J. Nolan, and J. Weiss. 2000. Improving the Quality and
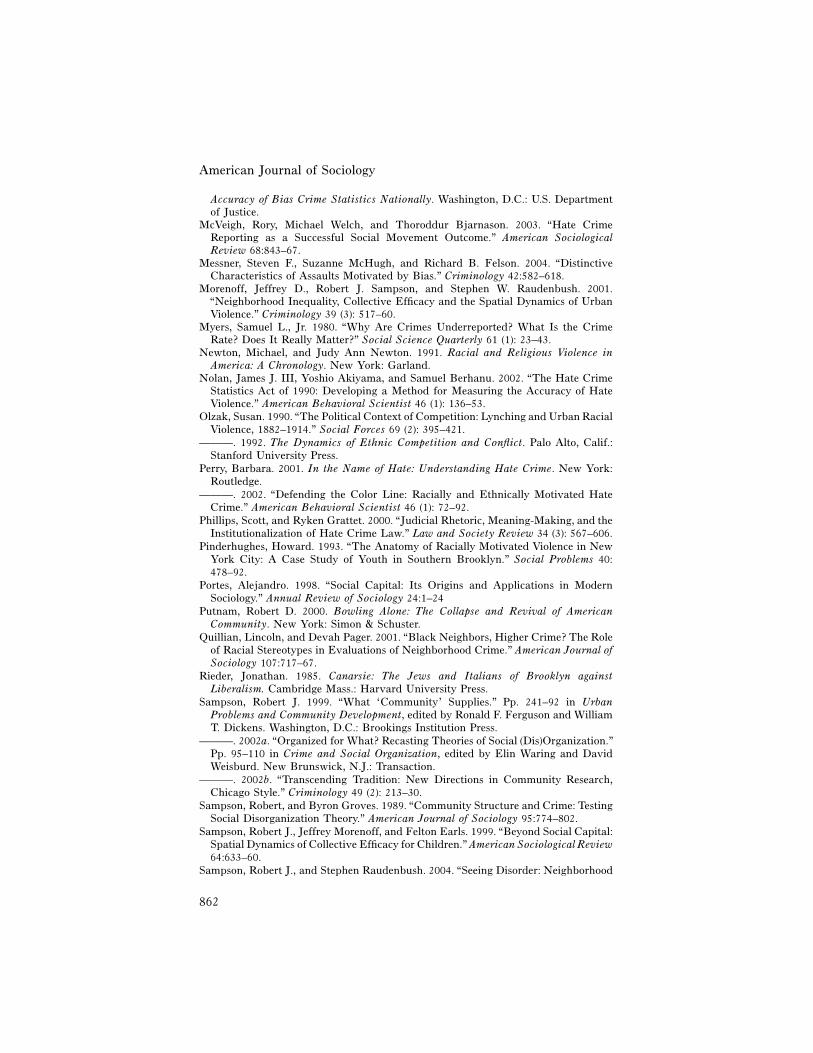
American Journal of Sociology
862
Accuracy of Bias Crime Statistics Nationally. Washington, D.C.: U.S. Departmentof Justice.
McVeigh, Rory, Michael Welch, and Thoroddur Bjarnason. 2003. “Hate CrimeReporting as a Successful Social Movement Outcome.” American SociologicalReview 68:843–67.
Messner, Steven F., Suzanne McHugh, and Richard B. Felson. 2004. “DistinctiveCharacteristics of Assaults Motivated by Bias.” Criminology 42:582–618.
Morenoff, Jeffrey D., Robert J. Sampson, and Stephen W. Raudenbush. 2001.“Neighborhood Inequality, Collective Efficacy and the Spatial Dynamics of UrbanViolence.” Criminology 39 (3): 517–60.
Myers, Samuel L., Jr. 1980. “Why Are Crimes Underreported? What Is the CrimeRate? Does It Really Matter?” Social Science Quarterly 61 (1): 23–43.
Newton, Michael, and Judy Ann Newton. 1991. Racial and Religious Violence inAmerica: A Chronology. New York: Garland.
Nolan, James J. III, Yoshio Akiyama, and Samuel Berhanu. 2002. “The Hate CrimeStatistics Act of 1990: Developing a Method for Measuring the Accuracy of HateViolence.” American Behavioral Scientist 46 (1): 136–53.
Olzak, Susan. 1990. “The Political Context of Competition: Lynching and Urban RacialViolence, 1882–1914.” Social Forces 69 (2): 395–421.
———. 1992. The Dynamics of Ethnic Competition and Conflict. Palo Alto, Calif.:Stanford University Press.
Perry, Barbara. 2001. In the Name of Hate: Understanding Hate Crime. New York:Routledge.
———. 2002. “Defending the Color Line: Racially and Ethnically Motivated HateCrime.” American Behavioral Scientist 46 (1): 72–92.
Phillips, Scott, and Ryken Grattet. 2000. “Judicial Rhetoric, Meaning-Making, and theInstitutionalization of Hate Crime Law.” Law and Society Review 34 (3): 567–606.
Pinderhughes, Howard. 1993. “The Anatomy of Racially Motivated Violence in NewYork City: A Case Study of Youth in Southern Brooklyn.” Social Problems 40:478–92.
Portes, Alejandro. 1998. “Social Capital: Its Origins and Applications in ModernSociology.” Annual Review of Sociology 24:1–24
Putnam, Robert D. 2000. Bowling Alone: The Collapse and Revival of AmericanCommunity. New York: Simon & Schuster.
Quillian, Lincoln, and Devah Pager. 2001. “Black Neighbors, Higher Crime? The Roleof Racial Stereotypes in Evaluations of Neighborhood Crime.” American Journal ofSociology 107:717–67.
Rieder, Jonathan. 1985. Canarsie: The Jews and Italians of Brooklyn againstLiberalism. Cambridge Mass.: Harvard University Press.
Sampson, Robert J. 1999. “What ‘Community’ Supplies.” Pp. 241–92 in UrbanProblems and Community Development, edited by Ronald F. Ferguson and WilliamT. Dickens. Washington, D.C.: Brookings Institution Press.
———. 2002a. “Organized for What? Recasting Theories of Social (Dis)Organization.”Pp. 95–110 in Crime and Social Organization, edited by Elin Waring and DavidWeisburd. New Brunswick, N.J.: Transaction.
———. 2002b. “Transcending Tradition: New Directions in Community Research,Chicago Style.” Criminology 49 (2): 213–30.
Sampson, Robert, and Byron Groves. 1989. “Community Structure and Crime: TestingSocial Disorganization Theory.” American Journal of Sociology 95:774–802.
Sampson, Robert J., Jeffrey Morenoff, and Felton Earls. 1999. “Beyond Social Capital:Spatial Dynamics of Collective Efficacy for Children.” American Sociological Review64:633–60.
Sampson, Robert J., and Stephen Raudenbush. 2004. “Seeing Disorder: Neighborhood
Racially Motivated Crime
863
Stigma and the Social Construction of ‘Broken Windows.’” Social PsychologyQuarterly 67:319–42.
Sampson, Robert, Stephen Raudenbush, and Felton Earls. 1997. “Neighborhoods andViolent Crime: A Multilevel Study of Collective Efficacy.” Science 277:918–24.
Sampson, Robert J., and William J. Wilson. 1995. “Toward a Theory of Race, Crime,and Inequality.” In Crime and Inequality, edited by John Hagan and Ruth Peterson.Stanford, Calif.: Stanford University Press.
Savelsberg, Joachim J., and Ryan D. King. 2005. “Institutionalizing CollectiveMemories of Hate: Law and Law Enforcement in Germany and the United States.”American Journal of Sociology 111:579–616.
Shaw, Clifford R., and Henry D. McKay. 1942. Juvenile Delinquency in Urban Areas.Chicago: University of Chicago Press.
Skogan, Wesley G. 1984. “Reporting Crimes to the Police: The Status of WorldResearch.” Journal of Research in Crime and Delinquency 21:113–37.
Soule, Sarah A. 1992. “Populism and Black Lynching in Georgia, 1890–1900.” SocialForces 71 (2): 431–49.
Soule, Sarah A., and Nella van Dyke. 1999. “Black Church Arson in the United States,1989–1996.” Ethnic and Racial Studies 22 (4): 724–42.
Statistics Canada. 1999. Hate Crime in Canada: An Overview of Issues and DataSources. Canadian Centre for Justice Statistics, catalogue 85-551-XIE.
Strom, Kevin J. 2001. Hate Crimes Reported in NIBRS, 1997–1999. Bureau of JusticeStatistics Special Report, U.S. Department of Justice, NCJ 186765.
Sutherland, Edwin H. 1947. Principles in Criminology, 4th ed. Philadelphia:Lippincott.
Suttles, Gerald D. 1972. The Social Construction of Communities. Chicago: Universityof Chicago Press.
Thomson, Irene Taviss. 2005. “The Theory that Won’t Die: From Mass Society to theDecline of Social Capital.” Sociological Forum 20:421–48.
Tolnay, Stewart E., and E. M. Beck. 1995. A Festival of Violence: An Analysis ofSouthern Lynchings, 1882–1930. Urbana: University of Illinois Press.
van Dyke, Nella, Sarah A. Soule, and Rebecca Widom. 2001. “The Politics of Hate:Explaining Variation in the Incidence of Anti-gay Hate Crime.” Research in PoliticalSociology 9:35–58.
Waldinger, Roger. 1995. “The ‘Other Side’ of Embeddedness: A Case-Study of theInterplay of Economy and Ethnicity.” Ethnic and Racial Studies 18 (3): 555–80.
Weitzer, Ronald, and Steven A. Tuch. 2005. “Racially Biased Policing: Determinantsof Citizen Perceptions.” Social Forces 83 (3): 1009–30.
Wisconsin v. Mitchell. 1993. 508 U.S. 476.