Community barcoding reveals little effect of ocean ... · focused on the assessment of the...
20
RESEARCH ARTICLE Community barcoding reveals little effect of ocean acidification on the composition of coastal plankton communities: Evidence from a long-term mesocosm study in the Gullmar Fjord, Skagerrak Julia A. F. Langer 1 *, Rahul Sharma 2,3 , Susanne I. Schmidt 4 , Sebastian Bahrdt 4 , Henriette G. Horn 1 , Marı ´a Alguero ´ -Muñiz 1 , Bora Nam 2,3 , Eric P. Achterberg 5 , Ulf Riebesell 5 , Maarten Boersma 1,6 , Marco Thines 2,3 , Klaus Schwenk 4 1 Alfred-Wegener-Institut Helmholtz-Zentrum fu ¨ r Polar- und Meeresforschung, Biologische Anstalt Helgoland, Germany, 2 Biodiversity and Climate Research Centre (BiK-F), Senckenberg Gesellschaft fu ¨r Naturkunde, Frankfurt am Main, Germany, 3 Institute of Ecology, Evolution and Diversity, Faculty of Biological Sciences, Frankfurt am Main, Germany, 4 University Koblenz-Landau, Institute of Environmental Science, Landau in der Pfalz, Germany, 5 GEOMAR Helmholtz Centre for Ocean Research Kiel, Kiel, Germany, 6 University of Bremen, Bremen, Germany * [email protected] Abstract The acidification of the oceans could potentially alter marine plankton communities with con- sequences for ecosystem functioning. While several studies have investigated effects of ocean acidification on communities using traditional methods, few have used genetic analy- ses. Here, we use community barcoding to assess the impact of ocean acidification on the composition of a coastal plankton community in a large scale, in situ, long-term mesocosm experiment. High-throughput sequencing resulted in the identification of a wide range of planktonic taxa (Alveolata, Cryptophyta, Haptophyceae, Fungi, Metazoa, Hydrozoa, Rhi- zaria, Straminipila, Chlorophyta). Analyses based on predicted operational taxonomical units as well as taxonomical compositions revealed no differences between communities in high CO 2 mesocosms (~ 760 μatm) and those exposed to present-day CO 2 conditions. Observed shifts in the planktonic community composition were mainly related to seasonal changes in temperature and nutrients. Furthermore, based on our investigations, the ele- vated CO 2 did not affect the intraspecific diversity of the most common mesozooplankter, the calanoid copepod Pseudocalanus acuspes. Nevertheless, accompanying studies found temporary effects attributed to a raise in CO 2 . Differences in taxa composition between the CO 2 treatments could, however, only be observed in a specific period of the experiment. Based on our genetic investigations, no compositional long-term shifts of the plankton com- munities exposed to elevated CO 2 conditions were observed. Thus, we conclude that the compositions of planktonic communities, especially those in coastal areas, remain rather unaffected by increased CO 2 . PLOS ONE | https://doi.org/10.1371/journal.pone.0175808 April 26, 2017 1 / 20 a1111111111 a1111111111 a1111111111 a1111111111 a1111111111 OPEN ACCESS Citation: Langer JAF, Sharma R, Schmidt SI, Bahrdt S, Horn HG, Alguero ´-Muñiz M, et al. (2017) Community barcoding reveals little effect of ocean acidification on the composition of coastal plankton communities: Evidence from a long-term mesocosm study in the Gullmar Fjord, Skagerrak. PLoS ONE 12(4): e0175808. https://doi.org/ 10.1371/journal.pone.0175808 Editor: Arga Chandrashekar Anil, CSIR-National Institute of Oceanography, INDIA Received: September 13, 2016 Accepted: April 1, 2017 Published: April 26, 2017 Copyright: © 2017 Langer et al. This is an open access article distributed under the terms of the Creative Commons Attribution License, which permits unrestricted use, distribution, and reproduction in any medium, provided the original author and source are credited. Data Availability Statement: All sequence reads are available in the European Nucleotide Archive (ENA; PRJEB15126). Generated OTUs and the corresponding sequences as well as the reference sequences of P. acuspes are deposited in PANGAEA (doi:10.1594/PANGAEA.864598). Additional data are available in S1, S2 and S3 Tables.
Transcript of Community barcoding reveals little effect of ocean ... · focused on the assessment of the...

RESEARCH ARTICLE
Community barcoding reveals little effect of
ocean acidification on the composition of
coastal plankton communities: Evidence from
a long-term mesocosm study in the Gullmar
Fjord, Skagerrak
Julia A. F. Langer1*, Rahul Sharma2,3, Susanne I. Schmidt4, Sebastian Bahrdt4,
Henriette G. Horn1, Marıa Alguero-Muñiz1, Bora Nam2,3, Eric P. Achterberg5, Ulf Riebesell5,
Maarten Boersma1,6, Marco Thines2,3, Klaus Schwenk4
1 Alfred-Wegener-Institut Helmholtz-Zentrum fur Polar- und Meeresforschung, Biologische Anstalt
Helgoland, Germany, 2 Biodiversity and Climate Research Centre (BiK-F), Senckenberg Gesellschaft fur
Naturkunde, Frankfurt am Main, Germany, 3 Institute of Ecology, Evolution and Diversity, Faculty of
Biological Sciences, Frankfurt am Main, Germany, 4 University Koblenz-Landau, Institute of Environmental
Science, Landau in der Pfalz, Germany, 5 GEOMAR Helmholtz Centre for Ocean Research Kiel, Kiel,
Germany, 6 University of Bremen, Bremen, Germany
Abstract
The acidification of the oceans could potentially alter marine plankton communities with con-
sequences for ecosystem functioning. While several studies have investigated effects of
ocean acidification on communities using traditional methods, few have used genetic analy-
ses. Here, we use community barcoding to assess the impact of ocean acidification on the
composition of a coastal plankton community in a large scale, in situ, long-term mesocosm
experiment. High-throughput sequencing resulted in the identification of a wide range of
planktonic taxa (Alveolata, Cryptophyta, Haptophyceae, Fungi, Metazoa, Hydrozoa, Rhi-
zaria, Straminipila, Chlorophyta). Analyses based on predicted operational taxonomical
units as well as taxonomical compositions revealed no differences between communities in
high CO2 mesocosms (~ 760 μatm) and those exposed to present-day CO2 conditions.
Observed shifts in the planktonic community composition were mainly related to seasonal
changes in temperature and nutrients. Furthermore, based on our investigations, the ele-
vated CO2 did not affect the intraspecific diversity of the most common mesozooplankter,
the calanoid copepod Pseudocalanus acuspes. Nevertheless, accompanying studies found
temporary effects attributed to a raise in CO2. Differences in taxa composition between the
CO2 treatments could, however, only be observed in a specific period of the experiment.
Based on our genetic investigations, no compositional long-term shifts of the plankton com-
munities exposed to elevated CO2 conditions were observed. Thus, we conclude that the
compositions of planktonic communities, especially those in coastal areas, remain rather
unaffected by increased CO2.
PLOS ONE | https://doi.org/10.1371/journal.pone.0175808 April 26, 2017 1 / 20
a1111111111
a1111111111
a1111111111
a1111111111
a1111111111
OPENACCESS
Citation: Langer JAF, Sharma R, Schmidt SI,
Bahrdt S, Horn HG, Alguero-Muñiz M, et al. (2017)
Community barcoding reveals little effect of ocean
acidification on the composition of coastal plankton
communities: Evidence from a long-term
mesocosm study in the Gullmar Fjord, Skagerrak.
PLoS ONE 12(4): e0175808. https://doi.org/
10.1371/journal.pone.0175808
Editor: Arga Chandrashekar Anil, CSIR-National
Institute of Oceanography, INDIA
Received: September 13, 2016
Accepted: April 1, 2017
Published: April 26, 2017
Copyright: © 2017 Langer et al. This is an open
access article distributed under the terms of the
Creative Commons Attribution License, which
permits unrestricted use, distribution, and
reproduction in any medium, provided the original
author and source are credited.
Data Availability Statement: All sequence reads
are available in the European Nucleotide Archive
(ENA; PRJEB15126). Generated OTUs and the
corresponding sequences as well as the reference
sequences of P. acuspes are deposited in
PANGAEA (doi:10.1594/PANGAEA.864598).
Additional data are available in S1, S2 and S3
Tables.

Introduction
Enhanced atmospheric CO2 concentrations result in an increase in surface ocean pCO2 with a
subsequent decrease in pH. Several studies have investigated the effects of ocean acidification
(OA) on marine biota under laboratory and field conditions. Generally, OA has been shown to
negatively affect survival, calcification, growth and reproduction of a range of organisms [1].
However, there is significant variation among marine species in their sensitivity to elevated
CO2. Direct and indirect effects of OA on single species, which retard development [2], reduce
reproduction [3, 4] and survival [5], may also alter community structures [6] and thereby
impact the food web [7, 8]. Nevertheless, investigations during large-scale mesocosm field
studies in Espegrend (Bergen, Norway) and Kongsfjorden (Ny-Ålesund, Svalbard) showed an
overall resilience of plankton communities (bacteria, phytoplankton, micro- and mesozoo-
plankton) towards enhanced CO2 concentrations, whereby observed biological responses were
largely depending on temperature and nutrient availability [9–13].
Up to now possible changes in the community composition of planktonic organisms were
mainly based on optical (microscopic and flow cytometry) investigations, where the actual
diversity of species may be underestimated, especially in organism groups with small morpho-
logical differences. Marine planktonic taxa (phyto-, bacterio- and zooplankton) are highly
diverse and the differentiation at genus and species level is time consuming and requires highly
specialized taxonomic expertise. Additionally, there is a potentially high diversity of cryptic
species as well as larval stages, which are not captured by morphological investigations. New
molecular techniques show rapid advancements, with promising tools for species identifica-
tion. Especially the combination of DNA barcoding and next generation sequencing (commu-
nity barcoding) can provide accurate and high-resolution taxonomic data [14–17].
In the long-term mesocosm experiment in Kristineberg (west coast of Sweden), which was
part of the BIOACID II project, the response of different trophic levels to elevated CO2 con-
centrations during a winter-to-summer plankton succession over 113 days was investigated
(also see other publications within this collection). Within that framework our present study
focused on the assessment of the diversity of a broad spectrum of the biocoenosis including all
trophic levels (producers, consumers, decomposers).
DNA barcoding in combination with high-throughput sequencing (HTS) was utilized to
investigate potential CO2 induced shifts in the plankton community compositions. We
hypothesized that OA may induce taxonomic shifts in the planktonic community composi-
tion, which are potentially undetectable using morphological techniques, but might be
revealed using genetic methods.
Methods
Experimental design
In Gullmar Fjord, Sweden (58˚ 15’ 9 N, 11˚ 28’ 7 E) ten pelagic mesocosms reaching to 19 m
water depth were deployed. All of them enclosed roughly 50 m3 of seawater and contained all
organisms present in the fjord which were < 1 mm at the time the mesocosms were closed
(note, however, that some larger species were included in the study later on). The field location
was not privately owned or protected, and neither endangered nor protected species were
involved. No specific permission was required for activities related to field sampling. Organ-
isms grew under in situ temperature conditions and close to in situ light levels. Five of the
mesocosms were manipulated with CO2 enriched water (~ 760 μatm), the others remained
unchanged to serve as controls (~ 380 μatm). Due to net outgassing, the CO2 concentration
decreased in the high CO2 mesocosms and needed to be re-adjusted repeatedly. However, the
Coastal plankton communities under elevated CO2: Community barcoding results
PLOS ONE | https://doi.org/10.1371/journal.pone.0175808 April 26, 2017 2 / 20
Funding: This study is part of the German Federal
Ministry of Education and Science (BMBF) funded
“Verbundprojekt” BIOACID Phase II (Biological
Impacts of Ocean ACIDification), consortium 1, WP
1.14 (FKZ 03F0655B) and received funding from
the Swedish Academy of Science. The funders had
no role in study design, data collection and
analysis, decision to publish, or preparation of the
manuscript.
Competing interests: The authors have declared
that no competing interests exist.

ambient and high CO2 treatment remained different throughout the experiment (Fig 1). As
some taxa appearing later in the seasonal succession might not have been present in the water
column when the mesocosms were closed, we added 22 L of water from the fjord every fourth
day to each mesocosm. Additional to smaller plankton, we also added herring eggs (Clupeaharengus) and green sea-urchin gastrula stages (Strongylocentrotus droebrachiensis) to the
mesocosms. Those species were not present in the fjord when the mesocosms were closed.
Adult herring, caught in the Oslo fjord were obtained from a local fisherman. In the laboratory
eggs from the dead herrings were stripped off and fertilized. Afterwards, eggs were stuck on
plastic plates and placed in the middle of each mesocosm at 3 m depth from day 48 until peak
hatching on day 63. Around day 71 after they reached the yolk-sac stage herring larvae pre-
sumably fed on copepod nauplii and ciliates. With growing size, they switched to larger prey.
This side experiment was performed under the ethical permission number 332–2012 (issued
by the Swedish Board of Agriculture "Jordbruksverket"). The species used is not endangered
and animal welfare was assured by minimization of stress from handling and treatment. The
CO2 concentrations in the mesocosms was far below the lethal level and sacrificed specimens
were anaesthetized in advance with MS-222, to reduce stress to a minimum. Green sea-urchin
larvae were cultured in the laboratory following Dorey et al. [18]. When they reached the
swimming gastrula stage they were gently added to each mesocosm on day 56 (for further
details see Dupont et al., this collection).
CTD (Conductivity-Temperature-Depth) casts were taken every second day between 11 am
and 3 pm to monitor inter alia the development of salinity, temperature and pH in the meso-
cosms and fjord. Depth-integrated water samples were taken every second day using an Inte-
grating Water Sampler (IWS, Hydro-Bios, Kiel, Germany) which sampled a total volume of 5
L evenly distributed over the depth range from 0–18 m. From this water among other proper-
ties, concentrations of nitrate (NO3-), nitrite (NO2
-), dissolved silicate (SiO43-), ammonium
(NH4+), and phosphate (PO4
3-) were measured using standard auto-analyser (Seal Analytical
QuAAtro) techniques according to Murphy and Riley (1962) [19], Hansen and Grasshoff
(1983) [20] and Holmes et al. (1999) [21], in addition to nanomolar nutrient techniques [22]
for periods with depleted nutrient levels. In addition, pigment analyses [23] and
Fig 1. pCO2 and chlorophyll a concentration in mesocosms over the experimental period. High and
ambient CO2 mesocosms are represented by red and blue lines, respectively. The fjord is indicated by a black
dashed line. The mean chlorophyll a concentration in the selected high and ambient CO2 mesocosms is
represented by a dark and light green line, respectively. X axis: experimental days. Left y axis: pCO2
concentrations. Right y axis: mean chlorophyll a concentrations. Data pooled from the three ambient and
three high CO2 mesocosms, that were also used for the community barcoding. Error bars = SD.
https://doi.org/10.1371/journal.pone.0175808.g001
Coastal plankton communities under elevated CO2: Community barcoding results
PLOS ONE | https://doi.org/10.1371/journal.pone.0175808 April 26, 2017 3 / 20

microzooplankton microscopy [24] were performed. Mesozooplankton samples were taken
with an Apstein net (55 μm mesh size, 1 m long, Hydro-Bios) from 17 m depth to the top of
each mesocosm (Alguero-Muñiz et al. 2017, this collection). The chlorophyll a concentrations
measured via pigment analysis indicated two bloom events which occurred simultaneously in
the ten mesocosms (Fig 1). Further details on mesocosm setup and performance as well as
CO2 manipulation can be found in the overview paper of the PLoS collection [23].
Plankton samples were taken every 8th day from each mesocosm plus the surrounding
fjord. For the mesoplankton (> 200 μm) samples the content of the mesozooplankton net
hauls was pre-screened with a 200 μm sieve and fixed with 90% pure ethanol in 100 mL bottles.
To sample small-sized plankton including pico-, nano- and microplankton (> 0.45 μm
and< 200 μm), 500 mL of water sampled with the IWS was sieved with a 200 μm mesh to
remove large phyto- and zooplankton. The sieved water was subsequently filtered onto a nylon
filter (0.45 μm pore size, 25 mm diameter, Whatman1) and fixed with 99.9% pure ethanol in 2
mL tubes. For the community barcoding, filter and net samples from three randomly selected
ambient (M1, M5, M9) and high (M2, M4, M6) CO2 mesocosms, and the fjord, from four time
points (t17, t41, t65, t97), were used (in total 28 samples). In this study, we focused on long-
term effects of OA on the composition of plankton communities, as the number of samples for
the HTS was financially limited. Therefore, we selected the time points to be equally distrib-
uted over the experimental period, before and after the bloom events.
DNA isolation
For DNA isolation we used a modified version of a phenol/chloroform method [25]. To extract
the DNA of the mesoplankton the sample bottles were gently homogenized, 2 mL sample were
transferred into a 2 mL tube and ethanol was removed with a pipette. This procedure was
repeated until 0.25 mL (maximum number of organisms per isolation tube) of the tube was
filled with organisms. In total, 10% (10 mL) of each mesoplankton net sample was used for
DNA isolation. Samples were dried at 40˚C to completely remove the ethanol. Nylon filter car-
rying pico-, nano- and microplankton were placed in a petri dish, cut in small pieces and dried
at 40˚C. The filter pieces were put in 2 mL tubes with three metal beads (3 mm) and frozen
overnight at -80˚C. The frozen filter pieces were tissue-lysed once for 50 s at a frequency of 20
Hz (TissueLyser II, Qiagen) to crush phytoplankton cells. For cell lysis 800 μL lyse buffer (50
mM Tris-HCl pH 8, 200 mM NaCl, 0.2 mM EDTA, 0.5% SDS, 0.1 mg mL-1 proteinase K, 0.25
mg mL-1 glycogen) was added. Subsequently samples were vortexed, centrifuged and incu-
bated at 37˚C overnight with gentle mixing. Then 4 μL RNase (100 mg mL-1) was added fol-
lowed by another incubation at 37˚C for 15 min. The buffer and RNase volume was doubled
for the mesoplankton samples. Afterwards the lysate was transferred into new 2 mL tubes
whereby the mesoplankton solution was divided into two tubes. Filter and organism leftovers
were not transferred. Then 804 μL phenol/chloroform/isoamyl alcohol (25:24:1) were added.
These samples were vortexed and centrifuged at 13000 g for two min. Subsequently the liquid
supernatant was pipetted into a new 2 mL tube followed by another addition of 4 μL RNase
and an incubation at 37˚C for 15 min with gentle mixing. Then the phenol/chloroform addi-
tion was repeated and the liquid supernatant was again transferred into new 2 mL tubes (maxi-
mum 400 μL). Afterwards, 36 μL sodium acetate solution (3 M) and 900 μL pure ethanol
(98%) were added, the samples were vortexed and centrifuged at 8000 g for 10 min. The liquid
above the DNA pellets was removed and pellets from the same sample were pooled and
washed twice with 500 μL pure ethanol (70%). Then the pellets were dried at 40˚C and resus-
pended in 100 μL 1x TE buffer (10 mM Tris, 1 mM EDTA). Until further use the isolated
DNA was stored at -20˚C.
Coastal plankton communities under elevated CO2: Community barcoding results
PLOS ONE | https://doi.org/10.1371/journal.pone.0175808 April 26, 2017 4 / 20

Polymerase Chain Reaction (PCR)
We analysed a part (V4 and V5) of the small subunit rDNA (18S) to cover a potentially wide
range of marine planktonic taxa in the community barcoding [26]. Furthermore, we
sequenced the more variable gene region cytochrome-c-oxidase subunit I (cox1) to achieve a
sufficient resolution for species identification. The gene regions 18S and cox1 were amplified
using the primer pairs 554f (5`-AAGTCTGGTGCCAGCAGCCGC-3`) / 1282r (5`-TCACTCCACCAACTAAGAAGGGC-3`)and LCO1490_t1 (5`- TGTAAAACGACGGCCAGTGGTCAACAAATCATAAAGA-3`) / HCO2198_t1 (5`- CAGGAAACAGCTATGACTAAACTTCAGGGTGACCAAA-3`), respectively [27–29]. Amplification was carried out in a total volume of 20 μL
(cox1) and 25 μL (18S) using ~ 10 ng DNA. The reaction mix contained 2.5 (cox1), 1.25 (18S),
mM MgCl2, 1 x PCR-buffer, 0.2 (cox1), 0.25 (18S) mM dNTPs, 0.2 (cox1), 0.3 (18S), μM each
primer and 0.5 (cox1), 0.1 (18S) units TAQ polymerase. Additionally, 0.1 μg μL-1 BSA were
added for the 18S PCRs. PCR conditions for cox1 were 2 min at 95˚C, followed by 35 cycles of
1 min at 95˚C, 1 min at 45˚C, and 1 min 30 s at 72˚C, and a final elongation for 7 min at 72˚C.
For 18S, the PCR conditions were 2 min at 95˚C, followed by 34 cycles of 30 s at 95˚C, 1 min at
56˚C, and 1 min 30 s at 72˚C, and a final elongation for 10 min at 72˚C. PCR-products were
purified using the ISOLATEII PCR and Gel Kit from Bioline. Clean PCR-products were used
as templates for a barcode PCR in which the DNA fragments of each sample were tagged with
a specific barcode to enable the identification after the multiplexed sequencing. Therefore,
primers were labeled with tags of 6–7 bps. Amplifications were carried out in a total volume of
25 μL using ca. 10 ng PCR product as template. The reaction mix contained 1 x Phusion1
High Fidelity buffer, 0.2 mM dNTP’s, 1 μM each primer, and 0.02 units Phusion1 High Fidel-
ity polymerase. PCR conditions for cox1 were 2 min at 98˚C, followed by 27 cycles of 20 s at
98˚C, 30 s at 45˚C, and 1 min at 72˚C, and a final elongation for 6 min at 72˚C. For 18S the
PCR conditions did not change—only the number of cycles was reduced to 27. Amplification
success was 99% and was controlled with gel electrophoresis. PCR of the isolated DNA from
the net sample of mesocosm six (t97) yielded no amplicon for the cox1 gene region.
After purification, 68.57 and 76.80 ng DNA sample-1 from the 18S and cox1 PCR products
were pooled, respectively. The amplicon pool was sequenced on an Illumina MiSeq platform
using the paired end (2 x 300 bp) option at Eurofins Genomics (Ebersberg, Germany).
Sequence reads are deposited in the European Nucleotide Archive (http://www.ebi.ac.uk/ena/
data/view/PRJEB15126).
For a distinct species identification of Pseudocalanus spp., which was the most abundant
mesozooplankton organism in the mesocosms, it was necessary to generate additional 18S and
cox1 reference sequences by standard Sanger sequencing of single individuals. PCR conditions
and primer were equal to those described above. The sequences are deposited in the PAN-
GAEA data repository (doi:10.1594/PANGAEA.864598).
Illumina data processing
The Illumina adapter and primer sequences of the raw sequence pairs were trimmed by using
the Trimmomatic [30] software. Quality filtration was performed using a window size of 5 bp
with an average phred quality score of 25 and a read length cutoff of 220 bp. Furthermore,
sequences including ambiguous bases (Ns) were deleted and sequences were again filtered by
keeping a minimum quality phred score of 3 per base using the FastQFS tool [31]. Afterwards,
based on the barcode sequence, each read was renamed after the corresponding sample ID and
related forward and reverse reads were concatenated. Then the barcode and primer sequences
were trimmed and all reads were oriented in 5‘- 3‘direction. The prediction of operational tax-
onomical units (OTUs) was carried out with the USEARCH v7 software [32]. Thereby both a
Coastal plankton communities under elevated CO2: Community barcoding results
PLOS ONE | https://doi.org/10.1371/journal.pone.0175808 April 26, 2017 5 / 20

de-novo and a reference-based (reference sequences for each primer i.e., 18S and cox1 were
downloaded from the NCBI database) chimera filters were applied. The minimum cluster size
was three reads with an identity cutoff of 99%. To further de-multiplex sequence data, the 18S
and cox1 reads were re-assembled with a minimum identity of 99% using the program Gen-
eious1 version 7.0.4 [33]. Consensus sequences of clustered OTU sequences were generated
on the strength of base majority. Afterwards, sequences of new and not further assembled
OTUs were aligned and trimmed to the same length. Sequences related to amplification arti-
facts were manually detected based on their lack of homology to the target regions and deleted
from the set. The resulting set of high-confidence OTUs were mapped by the processed reads,
only those OTUs were kept which had a mapping support of at least three reads. This filtered
set of OTUs was then used for the community analysis and abundance tables were generated
keeping only those OTUs which occurred in a minimum of 2 samples (S1 (18S) and S2 (cox1)
Tables). OTU distribution among net and filter samples were calculated in Microsoft Excel
2016. For species identification OTU representative sequences were aligned with the NCBI
nucleotide database (nt) using the BLASTn [34] algorithm. For this, OTUs were separated
according to their sample ID. Those from the same time point and CO2 treatment were pro-
cessed together. Further taxonomical classification of the OTUs was carried out by using the
MEGAN program [35]. Thereby, we kept only those taxa for which the pairwise identity
between the forward and/or reverse part of the assigned OTU sequences and the NCBI refer-
ence sequence was 100%. If an OTU assigned to different taxa with equal pairwise identities,
we used the next higher taxonomical level. Resulting taxa and their number of assigned OTUs
were put together in a table for further community composition analyses (Generated OTUs
and the corresponding sequences are deposited in the PANGAEA data repository (doi:10.
1594/PANGAEA.864598)).
Statistics
Data analyses were performed using the vegan package [36] in R software (Version 0.99.879,
RStudio, Inc.). For the statistical analyses we used two Hellinger transformed [37] OTU data-
sets of the 18S gene region. The first data set consisted of the raw OTU abundance data, i.e. the
number of sequence reads from the HTS. The second data set were the presence-absence-
transformed OTU abundance data (as suggested by Borcard, Gillet [38]). In contrast to the
presence-absence-transformed data which only reflects the OTU composition, the number of
HTS reads per OTU provide additional information on the relative abundance of species,
since the amount of sequence reads is positively correlated with the available amount of
genetic material. Although the amount of sequence reads per OTU does not reflect real bio-
masses or abundances of the planktonic taxa on-site, these values can serve as a proxy for rela-
tive abundances or biomasses of taxa and can be compared between mesocosms and/or time
points. The data set consisting of raw sequence reads per OTU is referred to as “sequence
read” data subsequently. Statistical analyses were performed with environmental data which
were log10(x + 1) transformed, to approximate normality, and standardized to bring all of the
variables into proportion with one another (decostand with the option “standardize”). For all
statistical analyses, a probability value of p< 0.05 was considered significant. To test for signif-
icant differences in the OTU composition and/or in the amount of assigned HTS reads per
OTU between the size fractions (filter and net samples), permutational multivariate analyses of
variance (adonis) were performed, based on the Bray-Curtis distance matrix of the 18S pres-
ence-absence-transformed and sequence read data. To investigate whether there were signifi-
cant differences in the OTU composition of the plankton samples between the ambient and
high CO2 treatment over the experimental period we performed an adonis, based on Bray-
Coastal plankton communities under elevated CO2: Community barcoding results
PLOS ONE | https://doi.org/10.1371/journal.pone.0175808 April 26, 2017 6 / 20

Curtis dissimilarity matrices of the 18S presence-absence-transformed and sequence read data.
OTU composition changes within and between mesocosms and fjord system, were visualized
in nonmetric multidimensional scaling (nMDS) ordinations.
The development of the environmental conditions over the experimental period was inves-
tigated with a principal component analysis (PCA). For the PCA we considered temperature,
salinity and chlorophyll a as measured via pigment analysis using HPLC, as well as the concen-
trations of different nutrients (NO3- / NO2
-, PO43-, SiO4
3-, NH4+) and the abundances of
micro- and mesozooplankton. Here, these data were only included as covariates, detailed
interpretations and discussions are presented elsewhere [23]. In this study, counts of the most
abundant microzooplankton group (ciliates) and the most abundant mesozooplankton species
(all stages of Pseudocalanus spp. (later identified as P. acuspes)) were considered in the corre-
sponding taxa abundance variables. Chlorophyll ameasurement in the fjord for day 41 was
missing, therefore this data point was extrapolated by averaging the measurements from days
33, 35, 37, 39, 43, and 45. Due to a deviating sampling schedule, ciliate counts from day 103
instead of day 97 were used. Furthermore, biomass calculations of the microzooplankton,
which included also different dinoflagellate species, were included in the PCA analysis.
Since absence represents a statistical information in presence-absence-transformed data
sets, redundancy analyses (RDA) is preferred over canonical correspondence analysis (CCA)
[39]. Additionally, for short gradients as found in the present study, where species abundance
or frequency is a linear function, CCA is an inappropriate model [40]. Therefore, OTU com-
positions of the plankton (pico-, nano-, micro- and mesoplankton) in the mesocosms in
dependence of environmental variables were investigated via RDA [41] on the Hellinger-trans-
formed sequence read and presence-absence-transformed data. The stepwise model builder
based on permutation tests (ordistep) was used to determine the set of significant explanatory
environmental variables for the final RDA.
As already mentioned for the sequence read data, the number of assigned OTUs to certain
taxa, identified by the BLAST searches and MEGAN analyses, do also not necessarily reflect
species abundances and/or biomasses on-site. However, they can be used to test whether the
composition of the planktonic taxa was different between the CO2 treatments and/or over the
time. Therefore, we performed an adonis based on the number of assigned OTUs to certain
taxa. To investigate potential differences in the diversity of the detected taxa between the high
and ambient CO2 treatment and/or over the experimental period, we calculated taxonomic
diversity indices ðH�¼ �XR
i¼lðpi ln piÞ � ð� 1ÞÞ [42], where pi is the proportion of OTUs
belonging to the ith taxa in the subset. Furthermore, OTU evenness J�¼ H�
lnðSÞ
� �[43] (S = total
number of detected taxa in the dataset), was calculated to detect imbalances in the number of
assigned OTUs among taxa.
We additionally investigated whether elevated CO2 affected the intraspecific genetic diver-
sity of Pseudocalanus spp. (later identified as P. acuspes), which was the most abundant cope-
pod throughout the experiment. Therefore, we performed an adonis based on presence-
absence-transformed and sequence read data, which exclusively included OTUs from this
species.
Results
Illumina data processing
The Illumina MiSeq sequencing resulted in about five million paired-end sequence reads. The
raw reads were processed for Illumina adapter and primer sequences, and filtered in terms of
their sequencing quality and sequenced read length. In total, 32.6% of the reads passed the
Coastal plankton communities under elevated CO2: Community barcoding results
PLOS ONE | https://doi.org/10.1371/journal.pone.0175808 April 26, 2017 7 / 20

data processing and filtering steps. This filtered set of reads was then further processed to
assign sample information (18S and cox1) based on their unique oligomer and primer
sequence combinations. After categorizing the filtered reads into samples, the oligomer and
primer sequences were clipped off, and all sequences were oriented in 5’ to 3’ direction. Using
this sample assignment step 653,789 and 3,417 sequences were assigned as 18S and cox1
sequences, respectively. Assigned sequences were then clustered into OTUs, which resulted in
7,734 and 96 OTUs for 18S and cox1 samples, respectively. After the re-assembly, alignment
clean up and mapping, the final 18S and cox1 abundance tables contained a high confident set
of 740 (S1 Table) and 31 (S2 Table) OTUs, respectively. Steps of the bioinformatics pipeline,
including the programs used, and the numbers of obtained sequence reads and OTUs, can be
found in the supplementary data (S3 Table). M13 tailed cox1 primers were already successfully
used for barcoding approaches of e.g. marine crustaceans [44], fish [45] and various freshwater
invertebrates [46]. However, in the present study, the use of M13 tailed cox1 primers for HTS
resulted in an insufficient number of sequence reads. Thus, further analyses were based on the
18S OTU abundance table only. 18S OTUs originated mainly (40.8 ± 3.3%) from filter samples
representing the small size fraction including pico-, nano- and microplankton. Only
11.2 ± 1.2% corresponded to the mesoplankton size fraction of the net samples. Furthermore,
there was a substantial overlap (47.9 ± 2.1%) between both fractions.
Community composition and succession (OTUs)
The overall OTU composition was significantly different between the size fractions for the
18S OTU presence-absence-transformed and sequence read matrices, respectively, although
~ 50% of the OTUs were present in both filter and net samples (adonis: R20/1 = 0.30, p0/1 <
0.05; R2reads = 0.21, preads = 0.01). Thus, filter and net samples were analysed separately in the
following. Analyses based on the 18S OTU abundance tables revealed no significant differ-
ences in the OTU compositions between the ambient and high CO2 treatments neither for
the presence-absence-transformed (R2filter_0/1 = 0.01, pfilter_0/1 = 0.96; R2
net_0/1 = 0.04,
pnet_0/1 = 0.27) nor for the sequence read data (R2filter_reads = 0.012, pfilter_reads = 0.924;
R2net_reads = 0.054; pnet_reads = 0.091), but a significant change occurred over time
(R2filter_0/1 = 0.29, R2
net_0/1 = 0.28; R2filter_reads = 0.309, R2
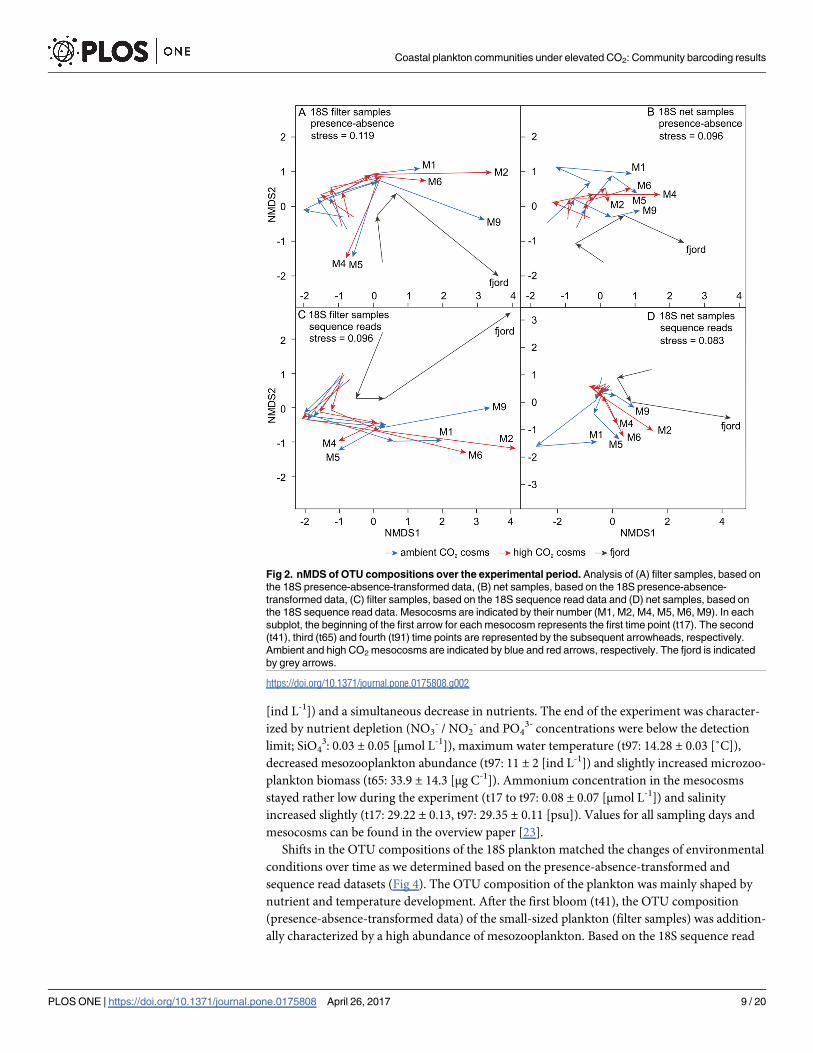
net_reads = 0.272; p< 0.001). Espe-
cially at the first and second time point the mesocosms exhibited similar OTU compositions
which can be seen also in the nMDS ordinations where they are situated close to each other
(Fig 2). With progressing time, distances among mesocosms within the ordination increased,
revealing differences in the OTU compositions between the enclosures at the end of the
experiment. In the nMDS ordination mesocosms were however not separated by their CO2
treatment. The amount of sequence reads per OTU and the OTU composition of the 18S
mesoplankton size fraction was significantly different between the mesocosm and fjord sam-
ples over the experimental period (R2net_0/1 = 0.11; R2
net_reads; p< 0.05). However, no such
differences were observed for the smaller plankton groups from the filter samples
(R2filter_0/1 = 0.08, p = 0.06; R2
filter_reads = 0.079, pfilter_reads = 0.09).
Environmental conditions differed only slightly between the investigated mesocosms (M1,
M2, M4, M5, M6, M9) but showed a significant temporal development (Fig 3). The first sam-
pling point was characterized by high nutrient (NO3- / NO2
-: 6.69 ± 0.12, PO43-: 0.69 ± 0.00,
SiO43: 7.47 ± 0.04 [μmol L-1]) concentrations. Then two phytoplankton blooms followed, rep-
resented by increased chlorophyll a values (t41: 1363.7 ± 409.4, t65: 1858.4 ± 379.6 [ng L-1]),
which were probably triggered by increasing water temperatures (t17: 2.19 ± 0.03, t41:
4.66 ± 0.01, t65: 8.11 ± 0.04 [˚C]), resulting in the associated increase in micro- and mesozoo-
plankton abundances (t65 microzooplankton: 6113 ± 2113, t65 mesozooplankton: 102 ± 18
Coastal plankton communities under elevated CO2: Community barcoding results
PLOS ONE | https://doi.org/10.1371/journal.pone.0175808 April 26, 2017 8 / 20
[ind L-1]) and a simultaneous decrease in nutrients. The end of the experiment was character-
ized by nutrient depletion (NO3- / NO2
- and PO43- concentrations were below the detection
limit; SiO43: 0.03 ± 0.05 [μmol L-1]), maximum water temperature (t97: 14.28 ± 0.03 [˚C]),
decreased mesozooplankton abundance (t97: 11 ± 2 [ind L-1]) and slightly increased microzoo-
plankton biomass (t65: 33.9 ± 14.3 [μg C-1]). Ammonium concentration in the mesocosms
stayed rather low during the experiment (t17 to t97: 0.08 ± 0.07 [μmol L-1]) and salinity
increased slightly (t17: 29.22 ± 0.13, t97: 29.35 ± 0.11 [psu]). Values for all sampling days and
mesocosms can be found in the overview paper [23].
Shifts in the OTU compositions of the 18S plankton matched the changes of environmental
conditions over time as we determined based on the presence-absence-transformed and
sequence read datasets (Fig 4). The OTU composition of the plankton was mainly shaped by
nutrient and temperature development. After the first bloom (t41), the OTU composition
(presence-absence-transformed data) of the small-sized plankton (filter samples) was addition-
ally characterized by a high abundance of mesozooplankton. Based on the 18S sequence read
Fig 2. nMDS of OTU compositions over the experimental period. Analysis of (A) filter samples, based on
the 18S presence-absence-transformed data, (B) net samples, based on the 18S presence-absence-
transformed data, (C) filter samples, based on the 18S sequence read data and (D) net samples, based on
the 18S sequence read data. Mesocosms are indicated by their number (M1, M2, M4, M5, M6, M9). In each
subplot, the beginning of the first arrow for each mesocosm represents the first time point (t17). The second
(t41), third (t65) and fourth (t91) time points are represented by the subsequent arrowheads, respectively.
Ambient and high CO2 mesocosms are indicated by blue and red arrows, respectively. The fjord is indicated
by grey arrows.
https://doi.org/10.1371/journal.pone.0175808.g002
Coastal plankton communities under elevated CO2: Community barcoding results
PLOS ONE | https://doi.org/10.1371/journal.pone.0175808 April 26, 2017 9 / 20

data, variation among the plankton samples after the first bloom (t41) were characterized by
the increased chlorophyll a concentration. The mesocosms were not separated by their CO2
treatment in the RDA ordination (ambient: M1, M5, M9; high: M2, M4, M6) indicating no
CO2 induced significant differences in the OTU composition or number of assigned HTS
reads per OTU.
From OTU to identification: Plankton community composition and
succession in terms of Taxa
Comparing the taxonomic composition recorded with the 18S marker, in the high (M2, M4,
M6) and ambient (M1, M5, M9) CO2 mesocosms, there were no significant differences (R2 =
0.02; adonis; p> 0.05). However, the plankton community composition changed significantly
over time (R2 = 0.61; adonis; p< 0.01). The BLAST searches and MEGAN analyses of the 18S
and cox1 OTUs resulted in the identification of 30 (± 5) and 10 (± 3) taxa per treatment and
time point from different hierarchal levels, respectively. 18S OTUs assigned to various plank-
tonic taxa within the groups Ciliophora, Dinophyceae, Amoebozoa, Fungi, Haptophyceae,
Cryptophyta, Deuterostomia, Copepoda, Hydrozoa, Rhizaria, Straminipila and Chlorophyta
Fig 3. PCA of measured environmental variables and CO2 concentrations in the mesocosms.
Mesocosms are indicated by their number. High CO2 (2, 4, 6) and ambient CO2 (1, 5, 9). The time points are
indicated by color: t17 = red, t41 = purple, t65 = green and t97 = blue. Environmental variables are
represented by circles, with NO3- / NO2
- = nitrate and nitrite [μmol L-1], NH4+ = ammonium [μmol L-1], PO4
3- =
phosphate [μmol L-1], SiO43- = silicate [μmol L-1], sal. = salinity [psu], temp. = temperature [˚C], chl a =
chlorophyll a [ng L-1], mesozoopl. = mesozooplankton [ind L-1], microzoopl. = microzooplankton [ind L-1],
biomass microzoopl. = biomass microzooplankton [μg C L-1].
https://doi.org/10.1371/journal.pone.0175808.g003
Coastal plankton communities under elevated CO2: Community barcoding results
PLOS ONE | https://doi.org/10.1371/journal.pone.0175808 April 26, 2017 10 / 20

covering all trophic levels (Fig 5). OTU evenness for the investigated 18S community was 0.57
(± 0.04), indicating the presence of dominating species in terms of biomass. Almost half of the
18S OTUs (45.1% ± 3.1) were assigned to Pseudocalanus spp., (later identified as P. acuspes,which was also the most abundant copepod throughout the experiment) representing its intra-
specific genetic variation. Apart from copepods (54.9% ± 2.2), OTUs assigned mainly to green
algae (9.3% ± 1.6), diatoms (9.2% ± 1.2) and other Straminipila (12.2% ± 3.3) at day 17 and 41.
With time ciliate (t97: 13.0% ± 0.1) and dinoflagellate (t97: 6.0% ± 0.4) diversity increased.
During most of the experimental period (t17, t41, t65) the recorded taxonomic diversity based
on the 18S marker was quite similar among the mesocosms (Taxonomic diversity index:
2.2 ± 0.07). At the last time point (t97) taxonomic diversity increased (Taxonomic diversity
index: 2.5 ± 0.03) and we detected two additional copepod species (Calanus helgolandicus,Temora longicornis), two Ciliophora (Askenasia sp., Acineta flava) and four Dinophyceae
(Scippsiella sp., Protoperidinum bipes, Protoperidinium pellucidum, Lophodiniales) taxa as well
Fig 4. RDA of OTU compositions in dependence of ecological variables. Analysis of (A) filter samples,
based on the 18S presence-absence-transformed data, (B) net samples, based on the 18S presence-
absence-transformed data, (C) filter samples, based on the 18S sequence read data and (D) net samples,
based on the 18S sequence read data. Mesocosms are indicated by their number. High CO2 (2, 4, 6) and
ambient CO2 (1, 5, 9). OTUs are represented by grey plus signs. Time points are indicated by color: t17 = red,
t41 = purple, t65 = green and t97 = blue. Explanatory variables are displayed as vectors, with NO3- / NO2
- =
nitrate and nitrite [μmol L-1], PO43- = phosphate [μmol L-1], temp. = temperature [˚C], chl a = chlorophyll a [ng
L-1], mesozoopl. = mesozooplankton [ind L-1]. Only significant ecological variables were retained for the
respective RDA plot. Thus, variables shown vary for the four RDA plots.
https://doi.org/10.1371/journal.pone.0175808.g004
Coastal plankton communities under elevated CO2: Community barcoding results
PLOS ONE | https://doi.org/10.1371/journal.pone.0175808 April 26, 2017 11 / 20

as three other taxa (Oikopleura dioica, Gnathostomata, Amoebozoa) belonging to various
groups.
All taxonomical groups detected in the surrounding fjord were also found in the meso-
cosms, although in slightly deviating diversities. Especially Bivalvia and Cirripedia were less
prominent in the mesocosms.
Only 31 OTUs were obtained from the cox1 gene region, and MEGAN analyses resulted
only in few identifiable taxa. With decreasing proportion OTUs mainly assigned to Proteobac-
teria (t17 to t65: 69.6% ± 10.2, t97: 37.5% ± 12.5). Note that due to the pore size of the nylon fil-
ter bacteria species smaller than 0.45 μm are not included. Beside that the cox1 BLAST search
and MEGAN analysis delivered hits for Pseudocalanus acuspes, Bathycoccus prasinos andHybo-codon prolifer which supports species identification based on the 18S gene region.
Species identification based on the community barcoding was consistent with the flow
cytometry investigations of the phytoplankton [23] as well as with the morphological investiga-
tions of the microzooplankton [24] and mesozooplankton (Alguero-Muñiz et al. 2017, this
collection).
Pseudocalanus acuspes–Species identification & intraspecific diversity
BLAST searches of the 18S sequences from the community barcoding and our reference
sequences, obtained by Sanger sequencing, delivered P. elongates as the best hit (100% pairwise
Fig 5. Taxonomic composition in the mesocosms. Results based on BLAST searches and MEGAN
analyses of the 18S sequences. Left side ambient CO2 mesocosms (M1, M5, M9), right side high CO2
mesocosms (M2, M4, M6). Time points (t17, t41, t65, t97). The left y axis shows the percentage of assigned
OTUs per taxon. The right y axis shows the taxonomic diversity index (black line) and OTU evenness (red
line). Data pooled from N = 3 replicates.
https://doi.org/10.1371/journal.pone.0175808.g005
Coastal plankton communities under elevated CO2: Community barcoding results
PLOS ONE | https://doi.org/10.1371/journal.pone.0175808 April 26, 2017 12 / 20

identity over 187 bp and 685 bp, respectively). In contrast to that, BLAST searches of our cox1
reference sequences (81 individuals) exclusively revealed hits for P. acuspes. Therefore, we
aligned (Geneious1 version 7.0.4) the available NCBI 18S reference sequence of P. acuspes(GenBank: KF991205.1, 419 bp) with our own 18S reference sequences (~ 675 bp), which were
proven to belong to P. acuspes by Sanger sequencing of the cox1 gene region of the same indi-
viduals. The alignment (89% pairwise identity over 214 bp) suggested that the sequence frag-
ments represent different parts of the 18S gene region, which prevented an appropriate species
identification using BLAST. Another investigation in the Gullmar Fjord based on species-spe-
cific PCR of 100 individuals, also resulted in the identification of P. acuspes exclusively [47].
Thus, based on these findings, we consider P. acuspes as the only present Pseudocalanus species
throughout the experiment.
Investigations of the intraspecific genetic diversity revealed no differences between the CO2
treatments or sampling days, except for mesocosm two (M2). There were no CO2 induced dif-
ferences in the OTU composition (presence-absence-transformed data, adonis: R2 = 0.008,
p = 0.924) nor in the OTU frequencies (sequence read data, adonis: R2 = 0.010, p = 0.991) of
the investigated P. acuspes populations. However, in M2 the OTU frequency and composition
and therefore the haplotype compilation changed significantly during the experimental period
(presence-absence-transformed, adonis: R2 = 0.297, p< 0.05; sequence read data, R2 = 0.308,
p< 0.05).
Discussion
The combination of DNA barcoding and high throughput sequencing (HTS) applied here
revealed no CO2 induced compositional shifts in the investigated coastal plankton communi-
ties. Changes in relative taxa abundances and taxa compilations were mainly observed along
the seasonal succession, which was driven by temperature and nutrient availability.
Experimental setup
Ambient and high CO2 treatments remained different with respect to pCO2 throughout the
whole experiment, although CO2 concentrations fluctuate in the mesocosms, due to outgas-
sing and CO2 uptake by algae followed by additions of CO2 enriched water to compensate for
CO2 losses. Starting with similar biogeochemical conditions and plankton communities, varia-
tion among mesocosm replicates increased over time (Fig 2). Initial subtle differences between
the enclosures intensified over the succession. Therefore, the detection of possible CO2 effects
became more difficult with time, because they potentially occurred at different days in the rep-
licates. Although increasing variation among replicates is a common complication of long-
term studies in natural systems, it will be a major task to resolve this problem for future studies
to avoid an underestimation of the implications of increasing CO2.
The mesocosms included the majority of the natural plankton community; all taxa found in
the surrounding fjord were also detected in the enclosures. However, the OTU composition of
the mesoplankton was significantly different between the mesocosms and the fjord at the
investigated time points (Fig 2). This indicates either a displacement in species succession or
differences in species abundances. Some species were underrepresented in the mesocosms
compared to the fjord e.g. Bivalvia and Cirripedia, which is to be expected as these meroplank-
tonic species typically produce their larvae later in the year, at a time when the mesocosms
were long closed. Although blooms in the fjord and the mesocosms developed in parallel, they
were more intense in the enclosures [23]. This suggests a similar succession, but differences in
species composition and abundance among the mesocosms and the fjord.
Coastal plankton communities under elevated CO2: Community barcoding results
PLOS ONE | https://doi.org/10.1371/journal.pone.0175808 April 26, 2017 13 / 20
Community barcoding
The analyses of the community barcoding data resulted in a total number of 771 OTUs with
an identity cutoff of 99%. This indicated a high sequencing depth and thereby a high coverage
of the species (and intraspecific genetic variation) diversity present in the mesocosms and in
the surrounding fjord. The plankton communities in the three ambient (M1, M5, M9) and
high CO2 (M2, M4, M6) mesocosms were represented by 375 ± 66 OTUs per time point. Dur-
ing the MEGAN analyses, only around one half of the OTUs (198 ± 33) could be assigned to
reference sequences. The other half could not be assigned, probably because corresponding
18S reference sequences are missing in the database yet. Furthermore, multiple OTUs were
assigned to the same taxa, since some OTUs represent haplotypes of the same species. Overall,
based on the 18S and cox1 sequences we could identify 19 species, 9 genera, 16 higher taxo-
nomical groups i.e. 44 different taxa. The success of studies such as the present depends very
much on the quality of the available molecular databases. For a steady improvement of those
databases good cooperation between taxonomists and molecular biologists is therefore crucial.
Despite the high taxonomic resolution based on OTUs, metabarcoding data cannot be used
to make predictions about species abundances and/or biomasses on-site, due to preferential
annealing of universal primers in some species over others during PCRs and HTS [48]. There-
fore, relative abundances and diversity indices, based on HTS reads and the number of OTUs
assigned to certain taxa, respectively, are not directly comparable to those determined using
count abundance data. However, comparisons among the enclosures and time points are feasi-
ble because amplification and sequence success between should be constant.
Based on the number of assigned OTUs to a certain taxon, predictions about the intraspe-
cific diversity is only possible to a limited extent. For investigations of the intraspecific diver-
sity a sufficient sample size is crucial, because up to a certain point the observed intraspecific
variation is positively correlated with the number of investigated individuals. Therefore, the
percentages of assigned OTUs shown in Fig 5 do not reflect the actual level of intraspecific var-
iation, since it is unlikely that a representative sample size could be reached for all taxa detected
with the community barcoding. P. acuspes, however, was the most abundant copepod (based
on mesozooplankton counts, Alguero-Muñiz et al. 2017, this collection) throughout the exper-
iment and with 1,351 (± 561) assigned sequence reads per sample also the best covered taxa in
the HTS of the 18S gene region. We observed no effect of elevated CO2 on the genetic intraspe-
cific diversity of the investigated P. acuspes populations. Furthermore, in all investigated meso-
cosms (M1, M4, M5, M6, M9) except M2 the OTU, and thus the haplotype compilations of the
P. acuspes populations, were similar at the sampling days 17, 41, 65, and 97. The temporal
change in the OTU composition of the P. acuspes population of M2 was probably due to a
decline in the number of detected OTUs (~ 40 less) on the filter sample on day 97. Since the
intraspecific diversity decrease was only detected in one of the three replicates and we further
cannot exclude a potential methodological flaw this finding should not be overinterpreted.
Unexpectedly, a relatively high number of 18S OTUs (115) assigned to P. acuspes, which
might indicate that several cryptic lineages co-occur in this species complex. However, such a
high level of intraspecific variation is unusual for the rather conserved 18S gene region. Since
other processes such as sequencing errors might explain an increased number of assigned
OTUs, one should interpret this finding with caution. Additionally, we did not observe such a
high intraspecific variation using cox1 reference sequences (81 individuals, 7 haplotypes). Nev-
ertheless, the actual genetic variation might have been underestimated due to the relatively low
number of investigated individuals compared to the community barcoding data set. The HTS
of the cox1 gene region delivered only one OTU assigned to P. acuspes (containing 14 DNA
sequences), i.e. not a representative sample of the population. Further investigations are
Coastal plankton communities under elevated CO2: Community barcoding results
PLOS ONE | https://doi.org/10.1371/journal.pone.0175808 April 26, 2017 14 / 20

necessary to generate a sound statement about the actual intraspecific genetic diversity of the
P. acuspes species complex.
The OTU distribution among the filter and net samples was quite different. A higher pro-
portion of the OTUs originated from filter samples. However, this is not surprising since spe-
cies diversity is in general higher in small organisms (here microplankton) compared to large
ones (here mesoplankton) and taxa larger than 1 mm were excluded (which were very rare).
Around 50% of the OTUs corresponded to both size fractions (filter and net samples), because
eggs, larvae and nauplii of mesozooplankton as well as smaller cells of large diatoms (e.g. Cos-
cinodiscaceae) are also captured on the filter samples. Furthermore, pico-, nano- and micro-
plankton were ingested by larger planktonic taxa or just attached to them and will be detected
along with the grazer/predator.
CO2 effects on the plankton community composition and food web
interactions
The composition of plankton communities investigated in this mesocosm study was not
affected by increased CO2 levels. At the analysed time points (t17, t41, t65, t97) no significant
differences between the CO2 treatments could be observed. Yet, there were significant com-
positional changes over time (Fig 2), which were primarily induced by changing temperature
and decreasing nutrient availability over the course of the succession (Fig 4). Additionally, at
day 41, the 18S OTU composition (presence-absence-transformed data) of the small-sized
plankton communities (pico-, nano- and microplankton) also seemed to be driven by meso-
zooplankton abundances, i.e. rather by top-down effects from predators than by bottom-up
effects from food sources (Fig 4A and 4B). Loder et al. (2011) found copepods to be less
important phytoplankton grazers, but important top-down regulators of microzooplankton,
especially with decreasing quality of phytoplankton food due to nutrient limitation during
blooms [49]. Furthermore, many copepods are size-selective feeders, preferring a size class
between 10–102 μm [50]. During the bloom events the phytoplankton community was
mainly made up by picoeukaryotes (< 2 μm) and Coscinodiscus sp. (> 200 μm), a giant dia-
tom. Therefore, the vast majority of the phytoplankton present did not represent a suitable
food source for copepods, due to the unfavorable cell size. Thus, copepods probably inten-
sively grazed on microzooplankton organisms [24], most likely ciliates and dinoflagellates.
This is corroborated by the 18S mesoplankton OTU composition (presence-absence-trans-
formed data) obviously not being related to phytoplankton densities (chlorophyll a) in the
RDA analysis (Fig 4A and 4B). On day 97 towards the end of the experiment more OTUs
assigned to ciliate and dinoflagellate species (Fig 5), after the top-down control by meso-
plankton subsided due to decreasing copepod abundances. Considering the amount of
assigned HTS reads per OTU in the RDA the predator-prey food web interaction was proba-
bly masked, because the high numbers of sequence reads, which correspond to OTUs repre-
senting the main contributing taxa of the blooms, (Chlorophyta, Rhizaria and Straminipila)
carried more weight in the analysis then the actual composition of the OTUs. Therefore, in
the RDA, variation between plankton samples at day 41 were rather explained by the chloro-
phyll a concentration than by the abundance of mesozooplankton. The introduced herring
larvae potentially controlled both micro- and mesozooplankton abundances. In their early
life stages from day ~ 64 to 74 they were probably feeding first on small-sized microzoo-
plankton e.g. ciliates and subsequently on larger microzooplankton organisms and nauplii
stages of mesozooplankton taxa. Towards the end of the experiment they most likely started
to feed on adult mesozooplankton organisms. As P. acuspes was the dominant copepod spe-
cies it was probably mostly consumed by the herring larvae. Decreasing densities of P.
Coastal plankton communities under elevated CO2: Community barcoding results
PLOS ONE | https://doi.org/10.1371/journal.pone.0175808 April 26, 2017 15 / 20

acuspes towards the end of the experiment, thereby potentially facilitated the development of
other copepod species (Fig 5) due to reduced competition.
As part of this mesocosm experiment other studies found temporal effects of high CO2 on
planktonic taxa. Dinoflagellates were more abundant in the high CO2 mesocosms towards the
end of the experimental period [24], and the phytoplankton community structure was signifi-
cantly different between the CO2 treatments during the second bloom period, with a higher
abundance of picophytoplankton [23]. Lischka et al. (2015) also observed temporal effects of
elevated CO2 on a microzooplankton community in Tvarminne / Storfjarden, whereby interalia a shift towards smaller taxa with increasing CO2 was detected [51]. The second bloom was
fueled by recycled nutrients, thus resources for plankton growth needed to by delivered by the
food web, thereby the limitation of inorganic nutrients seemed to indirectly enhance CO2
effects on planktonic organisms. The higher Proteobacteria diversity (number of assigned
OTUs based on the cox1 gene region) in the period after the blooms (t41, t65) may also suggest
a rather bottom-up driven food web. A similar pattern was found by Fierer et al. (2007) who
showed a positive correlation between the abundance of β-Proteobacteria and C mineraliza-
tion rates [52]. After decomposition and remineralization of the particulate organic matter,
Proteobacteria diversity decreased towards day 97. Dependencies between nutrient availability
and impacts of elevated CO2 on marine organisms were also demonstrated in previous studies
[53–56]. Therefore, future studies investigating the impacts of OA on marine biota should
focus on nutrient limited systems.
Study hypothesis
Based on the results of this study our hypothesis that DNA barcoding in combination with
HTS can unravel previously hidden (based on morphological analyses) CO2 sensitivities of
plankton communities cannot be confirmed. We focused on the investigation of potential
long-term effects of CO2 on planktonic taxa compilations, because the number of samples for
the HTS was limited (financial constrains). Thereby, samples from the distinct bloom events
were not considered for the community barcoding. Thus, we did not assess whether the CO2
induced increase in the abundance of picoeukaryotic phytoplankton [23], which was observed
during the second bloom, could have been detected with community barcoding. Although our
genetic approach allowed a detailed investigation of the majority of the planktonic communi-
ties (down to haplotype level), the technique is not appropriate to detect slight changes in spe-
cies abundances and stage specific effects, as it has been observed for some dinoflagellate [24]
and copepod taxa (Alguero-Muñiz et al. 2017, this collection), respectively. However, commu-
nity barcoding data delivers additional information about the genetic diversity of a community
and the presence of potentially cryptic or even unknown species. Thus, for future studies we
suggest to use community barcoding as applied here, not as a standalone technique but as a
tool to complement classical morphological investigations.
Conclusions
Based on the community barcoding data elevated CO2 had no significant effect on the relative
abundance or compilation of coastal planktonic taxa during a winter-to-summer succession in
the mesocosms investigated in this field experiment. The resilience of coastal plankton com-
munities (bacteria, phytoplankton, micro- and mesozooplankton) towards future OA condi-
tions was also demonstrated in earlier large scale mesocosm field and indoor studies [9–13, 57,
58]. In agreement with those results, we assume that low sensitivities for high CO2 conditions
are common for coastal plankton communities which are exposed to pronounced natural fluc-
tuations in seawater pH.
Coastal plankton communities under elevated CO2: Community barcoding results
PLOS ONE | https://doi.org/10.1371/journal.pone.0175808 April 26, 2017 16 / 20

Supporting information
S1 Table. Final OTU table based on the 18S gene region containing the HTS reads. Col-
umns A—E contain information about the sampling day, sampling method, sampled meso-
cosms and CO2 treatment. Columns F—P contain information about environmental variables.
Columns Q—ACB contain OTU information. This data was used for adonis, PCA (Fig 3),
nMDS (Fig 2) and RDA (Fig 4) analysis.
(TXT)
S2 Table. Final OTU table based on the cox1 gene region containing the HTS reads. Col-
umns A—E contain information about the sampling day, sampling method, sampled meso-
cosms and CO2 treatment. Columns F—AN contain OTU information. This data was used for
adonis analysis.
(TXT)
S3 Table. Steps of the bioinformatics pipeline. Including the programs used, decreasing
sequence reads, and OTU numbers.
(PDF)
Acknowledgments
We thank the Sven Loven Centre for Marine Sciences (University of Gothenburg) for provid-
ing research facilities and accommodation. Furthermore, we acknowledge the whole team of
the R/V Alkor for their work with the transport and setup of the mesocosms during their
cruses AL406 and AL420. We also gratefully thank the KOSMOS 2013 team for their extensive
maintenance work throughout the experiment. Furthermore, we acknowledge Andrea Ludwig
(GEOMAR, Kiel) for her outstanding organization and coordination performance before and
during the experiment. We thank Dr. Lennart Bach (GEOMAR, Kiel) for providing his chloro-
phyll data and for his valuable comments on an earlier version of this manuscript. For their
laboratory assistance, we would like to thank the technical assistants M. Sinn and B. Losch
(University Koblenz-Landau). Additionally, we thank Dr. Sven Neulinger (omics2view, Kiel)
and Prof. Stephan Frickenhaus (Alfred-Wegener-Institute, Bremerhaven) for providing their
expertise in statistical analyses of NGS data.
Author Contributions
Conceptualization: MB KS MT.
Data curation: JAFL RS HGH MAM EPA.
Formal analysis: JAFL SIS RS MT.
Funding acquisition: MB KS UR.
Investigation: JAFL HGH MAM SB BN.
Methodology: JAFL SB RS MT.
Project administration: UR.
Resources: UR.
Software: RS SIS.
Supervision: MB KS MT UR.
Coastal plankton communities under elevated CO2: Community barcoding results
PLOS ONE | https://doi.org/10.1371/journal.pone.0175808 April 26, 2017 17 / 20

Visualization: JAFL SIS.
Writing – original draft: JAFL.
Writing – review & editing: JAFL MB KS MT RS SIS HGH MAM BN SB EPA UR.
References1. Kroeker KJ, Kordas RL, Crim RN, Singh GG. Meta-analysis reveals negative yet variable effects of
ocean acidification on marine organisms. Ecol Lett. 2010; 13(11):1419–34. https://doi.org/10.1111/j.
1461-0248.2010.01518.x PMID: 20958904
2. Schoo KL, Malzahn AM, Krause E, Boersma M. Increased carbon dioxide availability alters phytoplank-
ton stoichiometry and affects carbon cycling and growth of a marine planktonic herbivore. Mar Biol.
2013; 160(8):2145–55.
3. Kurihara H, Shimode S, Shirayama Y. Effects of raised CO2 concentration on the egg production rate
and early development of two marine copepods (Acartia steueri and Acartia erythraea). Marine Poll
Bull. 2004; 49(9–10):721–7. Epub 2004/11/09.
4. Rossoll D, Bermudez R, Hauss H, Schulz KG, Riebesell U, Sommer U, et al. Ocean acidification-
induced food quality deterioration constrains trophic transfer. PloS one. 2012; 7(4):e34737. https://doi.
org/10.1371/journal.pone.0034737 PMID: 22509351
5. Cripps G, Lindeque P, Flynn KJ. Have we been underestimating the effects of ocean acidification in
zooplankton? Glob Chang Biol. 2014; 20(11):3377–85. https://doi.org/10.1111/gcb.12582 PMID:
24782283
6. Doney SC, Ruckelshaus M, Duffy JE, Barry JP, Chan F, English CA, et al. Climate change impacts on
marine ecosystems. Ann Rev Mar Sci. 2012; 4:11–37. https://doi.org/10.1146/annurev-marine-041911-
111611 PMID: 22457967
7. Peck LS, Clark MS, Power D, Reis J, Batista FM, Harper EM. Acidification effects on biofouling commu-
nities: winners and losers. Glob Chang Biol. 2015; 21(5):1907–13. https://doi.org/10.1111/gcb.12841
PMID: 25626420
8. Fabry VJ, Seibel BA, Feely RA, Orr JC. Impacts of ocean acidification on marine fauna and ecosystem
processes. Ices J Mar Sci. 2008; 65(3):414–32.
9. Riebesell U, Bellerby RGJ, Grossart HP, Thingstad F. Mesocosm CO2 perturbation studies: from organ-
ism to community level. Biogeosciences. 2008; 5(4):1157–64.
10. Niehoff B, Schmithusen T, Knuppel N, Daase M, Czerny J, Boxhammer T. Mesozooplankton commu-
nity development at elevated CO2 concentrations: results from a mesocosm experiment in an Arctic
fjord. Biogeosciences. 2013; 10(3):1391–406.
11. Aberle N, Schulz KG, Stuhr A, Malzahn AM, Ludwig A, Riebesell U. High tolerance of microzooplankton
to ocean acidification in an Arctic coastal plankton community. Biogeosciences. 2013; 10(3):1471–81.
12. Silyakova A, Bellerby RGJ, Schulz KG, Czerny J, Tanaka T, Nondal G, et al. Pelagic community pro-
duction and carbon-nutrient stoichiometry under variable ocean acidification in an Arctic fjord. Biogeos-
ciences. 2013; 10(7):4847–59.
13. Sperling M, Piontek J, Gerdts G, Wichels A, Schunck H, Roy AS, et al. Effect of elevated CO2 on the
dynamics of particle-attached and free-living bacterioplankton communities in an Arctic fjord. Biogeos-
ciences. 2013; 10(1):181–91.
14. Pochon X, Bott NJ, Smith KF, Wood SA. Evaluating detection limits of next-generation sequencing for
the surveillance and monitoring of international marine pests. PloS one. 2013; 8(9):e73935. https://doi.
org/10.1371/journal.pone.0073935 PMID: 24023913
15. Wood SA, Smith KF, Banks JC, Tremblay LA, Rhodes L, Mountfort D, et al. Molecular genetic tools for
environmental monitoring of New Zealand’s aquatic habitats, past, present and the future. New Zeal J
Mar Fresh. 2013; 47(1):90–119.
16. Zaiko A, Samuiloviene A, Ardura A, Garcia-Vazquez E. Metabarcoding approach for nonindigenous
species surveillance in marine coastal waters. Marine Poll Bull. 2015; 100(1):53–9.
17. Lejzerowicz F, Esling P, Pillet L, Wilding TA, Black KD, Pawlowski J. High-throughput sequencing and
morphology perform equally well for benthic monitoring of marine ecosystems. Sci Rep-Uk. 2015; 5.
18. Dorey N, Lancon P, Thorndyke M, Dupont S. Assessing physiological tipping point of sea urchin larvae
exposed to a broad range of pH. Glob Chang Biol. 2013; 19(11):3355–67. https://doi.org/10.1111/gcb.
12276 PMID: 23744556
19. Murphy J, Riley JP. A modified single solution method for the determination of phosphate in natural
waters. Analytica Chimica Acta. 1962; 27:31–6.
Coastal plankton communities under elevated CO2: Community barcoding results
PLOS ONE | https://doi.org/10.1371/journal.pone.0175808 April 26, 2017 18 / 20

20. Hansen HP. In situ determination of pH and oxygen. Methods of Seawater Analysis: Wiley-VCH Verlag
GmbH; 2007. p. 399–405.
21. Holmes RM, Aminot A, Kerouel R, Hooker BA, Peterson BJ. A simple and precise method for measur-
ing ammonium in marine and freshwater ecosystems. Can J Fish Aquat Sci. 1999; 56(10):1801–8.
22. Patey MD, Rijkenberg MJA, Statham PJ, Stinchcombe MC, Achterberg EP, Mowlem M. Determination
of nitrate and phosphate in seawater at nanomolar concentrations. TrAC. 2008; 27(2):169–82.
23. Bach LT, Taucher J, Boxhammer T, Ludwig A, Achterberg EP, Alguero-Muniz M, et al. Influence of
Ocean Acidification on a Natural Winter-to-Summer Plankton Succession: First Insights from a Long-
Term Mesocosm Study Draw Attention to Periods of Low Nutrient Concentrations. PloS one. 2016; 11
(8):e0159068. https://doi.org/10.1371/journal.pone.0159068 PMID: 27525979
24. Horn HG, Sander N, Stuhr A, Alguero-Muñiz M, Bach LT, Loder MGJ, et al. Low CO2 Sensitivity of
Microzooplankton Communities in the Gullmar Fjord, Skagerrak: Evidence from a Long-Term Meso-
cosm Study PloS one. 2016; 11(11):e0165800. https://doi.org/10.1371/journal.pone.0165800 PMID:
27893740
25. Sambrook J, Fritsch EF, Maniatis T. Molecular cloning: a laboratory manual. Cold Spring Harbor, N.Y.:
Cold Spring Harbor Laboratory; 1989.
26. Hadziavdic K, Lekang K, Lanzen A, Jonassen I, Thompson EM, Troedsson C. Characterization of the
18S rRNA Gene for Designing Universal Eukaryote Specific Primers. PloS one. 2014; 9(2):e87624.
https://doi.org/10.1371/journal.pone.0087624 PMID: 24516555
27. Huys R, Llewellyn-Hughes J, Olson PD, Nagasawa K. Small subunit rDNA and Bayesian inference
reveal Pectenophilus ornatus (Copepoda incertae sedis) as highly transformed Mytilicolidae, and sup-
port assignment of Chondracanthidae and Xarifiidae to Lichomolgoidea (Cyclopoida). Biol J Linn Soc.
2006; 87(3):403–25.
28. Messing J. New M13 vectors for cloning. Methods Enzymol. 1983; 101:20–78. PMID: 6310323
29. Folmer O, Black M, Hoeh W, Lutz R, Vrijenhoek R. DNA primers for amplification of mitochondrial cyto-
chrome c oxidase subunit I from diverse metazoan invertebrates. Mol Mar Biol Biotechnol. 1994; 3
(5):294–9. PMID: 7881515
30. Bolger AM, Lohse M, Usadel B. Trimmomatic: a flexible trimmer for Illumina sequence data. Bioinfor-
matics. 2014; 30(15):2114–20. https://doi.org/10.1093/bioinformatics/btu170 PMID: 24695404
31. Sharma R, Thines M. FastQFS—A tool for evaluating and filtering paired-end sequencing data gener-
ated from high throughput sequencing. Mycol Prog. 2015; 14(8):1–7.
32. Edgar RC. Search and clustering orders of magnitude faster than BLAST. Bioinformatics. 2010; 26
(19):2460–1. https://doi.org/10.1093/bioinformatics/btq461 PMID: 20709691
33. Kearse M, Moir R, Wilson A, Stones-Havas S, Cheung M, Sturrock S, et al. Geneious Basic: an inte-
grated and extendable desktop software platform for the organization and analysis of sequence data.
Bioinformatics. 2012; 28(12):1647–9. https://doi.org/10.1093/bioinformatics/bts199 PMID: 22543367
34. Altschul SF, Gish W, Miller W, Myers EW, Lipman DJ. Basic local alignment search tool. J Mol Biol.
1990; 215(3):403–10. Epub 1990/10/05. https://doi.org/10.1016/S0022-2836(05)80360-2 PMID:
2231712
35. Huson DH, Auch AF, Qi J, Schuster SC. MEGAN analysis of metagenomic data. Genome Res. 2007;
17(3):377–86. https://doi.org/10.1101/gr.5969107 PMID: 17255551
36. Oksanen J, Blanchet FG, Kindt R, Legendre P, Minchin PR, O’Hara RB, et al. vegan: Community Ecol-
ogy Package. R package version 2.3–4. https://CRANR-projectorg/package=vegan. 2016.
37. Rao CR. A review of canonical coordinates and an alternative to correspondence analysis using Hellin-
ger distance. Questiio. 1995; 19:23–63.
38. Borcard D, Gillet F, Legendre P. Introduction. Numerical Ecology with R. New York: Springer; 2011. p.
1–7.
39. Dray S, Chessel D, Thioulouse J. Co-inertia analysis and the linking of ecological data tables. Ecology.
2003; 84(11):3078–89.
40. Palmer MW. Putting Things in Even Better Order: The Advantages of Canonical Correspondence Anal-
ysis. Ecology. 1993; 74(8):2215–30.
41. Legendre P, Legendre LF. Numerical ecology: Elsevier; 2012.
42. Shannon CE. A Mathematical Theory of Communication. Bell System Technical Journal. 1948; 27
(3):379–423.
43. Pielou EC. The measurement of diversity in different types of biological collections. Journal of Theoreti-
cal Biology. 1966; 13:131–44.
Coastal plankton communities under elevated CO2: Community barcoding results
PLOS ONE | https://doi.org/10.1371/journal.pone.0175808 April 26, 2017 19 / 20

44. Raupach MJ, Barco A, Steinke D, Beermann J, Laakmann S, Mohrbeck I, et al. The Application of DNA
Barcodes for the Identification of Marine Crustaceans from the North Sea and Adjacent Regions. PloS
one. 2015; 10(9):e0139421. https://doi.org/10.1371/journal.pone.0139421 PMID: 26417993
45. Ivanova NV, Zemlak TS, Hanner RH, Hebert PDN. Universal primer cocktails for fish DNA barcoding.
Molecular Ecology Notes. 2007; 7(4):544–8.
46. Stein ED, White BP, Mazor RD, Miller PE, Pilgrim EM. Evaluating Ethanol-based Sample Preservation
to Facilitate Use of DNA Barcoding in Routine Freshwater Biomonitoring Programs Using Benthic
Macroinvertebrates. PloS one. 2013; 8(1):e51273. https://doi.org/10.1371/journal.pone.0051273
PMID: 23308097
47. Thor P, Oliva EO. Ocean acidification elicits different energetic responses in an Arctic and a boreal pop-
ulation of the copepod Pseudocalanus acuspes. Mar Biol. 2015; 162(4):799–807.
48. Elbrecht V, Leese F. Can DNA-Based Ecosystem Assessments Quantify Species Abundance? Testing
Primer Bias and Biomass-Sequence Relationships with an Innovative Metabarcoding Protocol. PloS
one. 2015; 10(7).
49. Loder MGJ, Meunier C, Wiltshire KH, Boersma M, Aberle N. The role of ciliates, heterotrophic dinofla-
gellates and copepods in structuring spring plankton communities at Helgoland Roads, North Sea. Mar
Biol. 2011; 158(7):1551–80.
50. Frost BW. Effects of size and concentration of food particles on the feeding behavior of the marine
planktonic copepod calanus pacificus. Limnol Oceanogr. 1972; 17(6):805–15.
51. Lischka S, Bach LT, Schulz KG, Riebesell U. Micro- and mesozooplankton community response to
increasing CO2 levels in the Baltic Sea: insights from a large-scale mesocosm experiment. Biogeos-
ciences Discuss. 2015; 2015:20025–70.
52. Fierer N, Bradford MA, Jackson RB. Toward an ecological classification of soil bacteria. Ecology. 2007;
88(6):1354–64. PMID: 17601128
53. Li W, Gao K, Beardall J. Interactive effects of ocean acidification and nitrogen-limitation on the diatom
Phaeodactylum tricornutum. PloS one. 2012; 7(12):e51590. https://doi.org/10.1371/journal.pone.
0051590 PMID: 23236517
54. Rouco M, Branson O, Lebrato M, Iglesias-Rodriguez MD. The effect of nitrate and phosphate availabil-
ity on Emiliania huxleyi (NZEH) physiology under different CO2 scenarios. Front Microbiol. 2013; 4:155.
https://doi.org/10.3389/fmicb.2013.00155 PMID: 23785363
55. Sala MM, Aparicio FL, Balague V, Boras JA, Borrull E, Cardelus C, et al. Contrasting effects of ocean
acidification on the microbial food web under different trophic conditions. Ices J Mar Sci. 2015.
56. Hofmann LC, Bischof K, Baggini C, Johnson A, Koop-Jakobsen K, Teichberg M. CO2 and inorganic
nutrient enrichment affect the performance of a calcifying green alga and its noncalcifying epiphyte.
Oecologia. 2015; 177(4):1157–69. https://doi.org/10.1007/s00442-015-3242-5 PMID: 25648647
57. Horn HG, Boersma M, Garzke J, Loder MGJ, Sommer U, Aberle N. Effects of high CO2 and warming on
a Baltic Sea microzooplankton community. Ices J Mar Sci. 2015.
58. Kim J-M, Lee K, Shin K, Kang J-H, Lee H-W, Kim M, et al. The effect of seawater CO2 concentration on
growth of a natural phytoplankton assemblage in a controlled mesocosm experiment. Limnol Oceanogr.
2006; 51(4):1629–36.
Coastal plankton communities under elevated CO2: Community barcoding results
PLOS ONE | https://doi.org/10.1371/journal.pone.0175808 April 26, 2017 20 / 20