
Community Attitudes to Aged Care Reform – Qualitative Web viewContents. 1. Executive summary...
206
Ipsos Project: 13-098134-01 Motorcycle Monitor 2014 Prepared for the Transport and Accident Commission REPORT OF FINDINGS
Transcript of Community Attitudes to Aged Care Reform – Qualitative Web viewContents. 1. Executive summary...

Ipsos Project: 13-098134-01
Motorcycle Monitor 2014Prepared for the Transport and Accident CommissionREPORT OF FINDINGS
October 2014

Project Contact: Julie Young
Sumedha Gaindhar
Contact address: Building 1, Level 2
658 Church St, RichmondVIC 3121
Office phone: (03) 9946 0888
Email: [email protected]

Contents1. Executive summary and research implications.........................................................................................................5
Learning to ride..............................................................................................................................................5
Riding activity.................................................................................................................................................5
Attitudes towards speeding and speeding behaviour....................................................................................6
Random breath and drug testing...................................................................................................................6
Motorcycle/scooter ownership.......................................................................................................................6
Protective motorcycle clothing.......................................................................................................................7
Motorcycle crash history................................................................................................................................7
Implications of the research...........................................................................................................................7
2. Research Context......................................................................................................................................................... 9
2.1 Background to project....................................................................................................................................9
Transport Accident Commission objectives...................................................................................................9
TAC Road Safety Motorcycle Research Program.........................................................................................9
Research objectives......................................................................................................................................9
3. Survey Design............................................................................................................................................................. 10
Data collection method................................................................................................................................10
Sampling......................................................................................................................................................10
Response rates............................................................................................................................................11
Weighting.....................................................................................................................................................11
Reading this report......................................................................................................................................13
4. Learning to ride........................................................................................................................................................... 16
4.1 Age respondents started riding a motorcycle..............................................................................................16
4.2 Motorcycle licence status.............................................................................................................................18
4.3 Age motorcyclists applied for their licence...................................................................................................19
Full licence holders......................................................................................................................................19
Learner licence holders...............................................................................................................................21
4.4 Learning to ride............................................................................................................................................22
5. Riding activity............................................................................................................................................................. 36
5.1 Riding history...............................................................................................................................................36
5.2 Riding activity segments..............................................................................................................................43
5.3 Riding vs. driving.........................................................................................................................................45
5.4 Riding for commuting and recreational purposes........................................................................................49
Share of time spent riding for commuting or recreational purposes among active riders............................52
Recreational riding locations........................................................................................................................55
Riding with others........................................................................................................................................56
Transport Accident CommissionMotorcycle Monitor 2014 | Page 3

5.5 Distances ridden in last 12 months..............................................................................................................57
Average distance ridden for commuting, on-road and off-road recreational purposes among active riders..................................................................................................................................................................... 59
Hours spent riding off-road..........................................................................................................................60
5.6 Rider fatigue................................................................................................................................................61
6. Attitudes towards speeding and speeding behaviour............................................................................................63
Speeding behaviour.....................................................................................................................................63
Whether pulled over by police in last 12 months.........................................................................................65
Speed limit in a 60km zone..........................................................................................................................67
Speed limit in a 100km zone........................................................................................................................71
7. Random Breath and Drug Testing.............................................................................................................................76
Riding when over the limit............................................................................................................................77
8. Motorcycle/scooter ownership..................................................................................................................................78
8.1 Number of motorcycles in household..........................................................................................................78
8.2 Details of motorcycle ridden most often.......................................................................................................81
Type of motorcycle mainly ridden................................................................................................................81
Make/brand of main motorcycle...................................................................................................................83
Year of manufacture of main motorcycle.....................................................................................................83
Odometer reading........................................................................................................................................85
Engine size of main motorcycle...................................................................................................................87
Registration status.......................................................................................................................................87
Details of other motorcycles ridden in household........................................................................................88
8.3 Motorcycle purchase intentions...................................................................................................................89
Type of bike.................................................................................................................................................91
8.4 Motorcycle safety features...........................................................................................................................93
9. Protective motorcycle clothing.................................................................................................................................95
9.1 Protective gear ownership...........................................................................................................................96
Protective gear use.................................................................................................................................................. 101
Protective gear purchase intentions..........................................................................................................106
Body armour..............................................................................................................................................107
9.2 Attitude statements about motorcycle safety clothing................................................................................109
10. Motorcycle crash history.........................................................................................................................................110
10.1 Crash history..............................................................................................................................................111
10.2 Crashes requiring medical treatment.........................................................................................................112
10.3 Circumstances of most recent crash.........................................................................................................114
Compensation............................................................................................................................................119
11. Respondent suggestions to improve rider safety.................................................................................................120
Demographics.......................................................................................................................................................... 123
Transport Accident CommissionMotorcycle Monitor 2014 | Page 4

Questionnaire........................................................................................................................................................... 125
Transport Accident CommissionMotorcycle Monitor 2014 | Page 5

1. Executive summary and research implications
The Motorcycle Monitor was conducted for the third time in 2014 by the Ipsos Social Research Institute on behalf of the Transport and Accident Commission (TAC) in Victoria.
The study was undertaken to gather detailed information about motorcycle riders, their attitudes toward road safety, and behaviour while riding. The intention was to gain a fully representative sample of the motorcycle rider population. The survey was conducted online, telephone or by hardcopy. A total of 784 motorcycle licence or registration holders completed the survey in June-July 2014 from a sample of 2,350.
Overall there were few differences between the results in 2013 and 2014. One of the differences included an increase in active riders in 2014 compared to 2013. The proportion of active riders (55%) was in line with the population in 2012. There were also fewer off-road riders compared to 2013 (43% compared to 54% in 2013), although the incidence of off-road riding is in line with that reported in 2012 (41%).
In terms of attitudinal differences between respondents in 2013 and 2014, there was an increase in those who disagreed that those returning to riding should have to go through a rider training course (41% disagreed vs. 54% in 2013), although there were more riders in 2014 who had reported they had recently returned to riding.
One attitudinal measure worth monitoring over the next few years is attitudes to speeding in higher speed zones with fewer respondents in 2014 nominating a speed of 100km per hour as the speed people should be able allowed to ride before they are booked (46% vs. 58% in 2013 and 55% in 2012).
Key findings from the research are summarised below.
Learning to rideThe majority of respondents held a full motorcycle licence (91%). A combined 7% had either a learner’s or probationary licence. The average age that respondents got their motorcycle licence (excluding any time on their Ls) was 25.0 years old.
The average age respondents said they had learnt to ride was 18.8 years old. Males tended to start riding at an earlier age than females (18.1 compared to 24.8 years old). Recreational off-road riders were also more likely to start riding at an earlier age (35% started riding under the age of 11).
Respondents were most likely to say they were self-taught riders (46%). A further 20% reported they were taught by their parents. In comparison, 30% said they had been taught to ride by an accredited riding instructor. However, when asked specifically what, if any, rider courses they had attended, 56% said they had taken part in a motorcycle rider training course of some sort, suggesting that while a substantial proportion did attend these type of classes, it was not where they initially learnt to ride.
More than half of respondents reported they had first learnt to ride on an off-road bike (57%). This compares to only 25% of respondents who said they currently mainly ride an off-road bike.
The only notable change in 2014 related to the whether people returning to riding should have to take training courses lower agreement compared to 2013 (41% vs. 54%). However, when looking at riding history, it should be noted that there has been an increase in those who had been on a break but had returned to riding compared to in 2013 (17% compared to 9%).
Riding activityAs with the previous surveys, the majority of respondents had ridden a motorcycle in the last 12 months (62% in 2014 compared to 57% in 2013 and 71% in 2012). Those aged 18-25 were more likely to have done so than those who were older (90% had ridden in the last year). No longer owning a motorcycle and family commitments and/or changes in lifestyle were the most common reasons for not riding in the last 12 months. Those who had stopped riding, on average, did so at the age of 36 years old.
Transport Accident CommissionMotorcycle Monitor 2014 | Page 6
In comparing riding activity of respondents between in 2013 and 2014, there was a significant increase in respondents who were actively riding – on par with proportions in 2012 (55% in 2014, vs. 42% in 2013 vs. 55% in 2012) with the overall mix of riding activity similar to that in 2012. With the increase in those actively riding in 2014, there was a corresponding decrease in those classified as former riders (5% vs. 10% in 2013) or lapsed riders (40% vs. 48% in 2013) (i.e. those who had stopped riding and did not intend to ride in the future or they had stopped riding but may decide to ride again in the future respectively). Lapsed riders tended to report a high likelihood of getting on the bike again (with 56% providing a 7-10 out of 10 on a 0-10 likelihood scale).
Recreational on-road riding remained the most common riding purpose, with a lower number of respondents saying they rode recreationally off-road compared to 2014 (43% vs. 54% in 2013).
In 2014, around half of respondents said they had ridden up to an average of 500km in a month (56%). The average distance travelled per month was 416.4km per month or approximately 4996.4km in the last year.
Attitudes towards speeding and speeding behaviourClose to one in five active riders said they had been pulled over by police in the last 12 months (16%).
When asked about their own speeding behaviour, six in ten (62%) reported that they would not ‘ride over the speed limit if I’m sure I’ll get away with it’. This has remained steady over the last 3 years of the Motorcycle Monitor.
When asked about speeding in a 60km zone, similar proportions of riders reported people should only ride up to 60kph in these areas as in previous years. Six in ten respondents nominated a speed limit of 60km or lower as the speed that people should be able to travel without being booked (58%). Regardless of the speed they thought you should be able to travel before being booked, more than half of respondents said they would never ride above that speed in a 60km zone (59%).
However, in the case of 100km zones, fewer active riders said that you should only be able to go 100km or less compared to in 2013 (46% vs. 58% in 2013). One in two respondents said they would never ride above the speed limit they nominated as the appropriate speed you should be able to travel before being booked for speeding.
Respondents were also less likely to report that they would never ride at or above the speed they nominated as acceptable compared to 60km zones (although this pattern is consistent with previous years).
Random breath and drug testingOne in five active riders said they had been randomly breath tested (19%). Only 2% of this group said they believed they had been through a random drug test.
Random breath testing was more common among those who rode more than 20% of the time compared to driving, those who commuted, and rode bikes with bigger engines (700cc+).
Almost all respondents said they had not ridden their motorcycle when they knew or thought they may have been over the limit (92%) with an additional 6% who said they did not drink at all. Among those who said they may be been over the limit when they had been riding some of the reasons included perhaps being over the limit due drinking the night before, only riding a short distance, or they had no other alternative transport (or did not want to leave their bike behind).
Motorcycle/scooter ownershipMore than half of all respondents (56%) did not have a motorcycle at home. Approximately one in three reported having only one bike at home (30%) with one in five reporting they had 2-4 bikes at home (22%). A minority of respondents had five or more motorcycles at their home address (4%).
The most common type of bike active riders said they mainly rode was a road bike (64% of active riders mainly rode a road bike (65% vs. 60% in 2013). Fewer reported they mainly road an off-road/trail bike compared to 2013 (25% vs. 33% in 2013) with similar levels as reported in 2012 (23%). Eight percent (8%) of respondents rode a scooter (vs. 3% in 2013).
The most common brands were Yamaha, Honda, followed by Harley Davidson motorcycles with one in three active riders riding motorcycles manufactured between 2010-2014 (36%).
Transport Accident CommissionMotorcycle Monitor 2014 | Page 7
Forty percent (40%) reported they were considering purchasing a motorcycle in the future, with half intending to do so within the next 12 months. One in three were considering buying new bike (30%), 44% considering a used motorcycle with the remainder undecided (33%). The majority of those thinking of buying another bike were planning on buying a road bike (76%). Half of these respondents intended to look for Antilock Braking System (ABS) for their new bike (53%).
Protective motorcycle clothingMost respondents said they owned at least one helmet, pair of riding gloves or boots, motorcycle jackets, pair of pants or a one piece riding suit (all owned by more than three quarters of active riders). The most common items of protective gear owned were helmets (99% owned at least one); and gloves (owned by 95%). Respondents were least likely to say they owned a pair of riding pants (22%) or a one piece suit (93%).
In total, 71% of active riders reported they had a complete set of protective gear. This has remained constant between 2012 and 2014. However, as in in previous years, ownership of an item of protective gear did not necessarily mean that it was worn every time they rode. Of note, motorcycle specific pants were only worn all the time by just over half of the active riders who owned them (56%).
Almost all respondents (95%) said they wore a motorcycle helmet all the time. Eight in ten respondents (80%) reported they wore gloves all the time. Riding jackets were worn all the time by 62% of respondents. Boots of any type were worn all the time by 66% of respondents. Riding pants were worn all the time less frequently – 46% reported they were worn all the time.
Two in three respondents (68%) said they wore either riding boots or other types of boots that cover the ankles all the time.
Looking at the number of items worn by active riders, two thirds (64%) of respondents said they wore three or more items all the time. This decreased to 37% for four or more items of protective wear. When looking at the number of items worn most or all the time, 86% of respondents reported they wore three or more items all or most of the time.
Motorcycle crash historyIn comparing the results from 2012 to 2014, similar proportions of riders reported they had experienced a crash during their riding career (47% in 2014 vs. 46% in 2013). The location, and to whom the fault was attributed were also broadly similar, as was the proportion of respondents who received compensation as a result of this crash.
Half of those who had experienced a crash reported they required medical treatment as a result (50%). Only a minority (8%) reported that their most recent crash was in the last 12 months. Half of all those who had experienced a crash said it had happened more than 11 years ago (52%). With riders being skewed towards the older age groups, this suggests that crashes requiring medical treatment were more likely to happen in the earlier years of their riding careers.
Off road bikes made up one in three of the crashes that required medical attention (32%) – slightly but not significantly higher than the proportion who said they mainly rode an off-road bike (25%). Just over half of the crashes had occurred on an on-road bike (56%) with a higher representation of sports tourer bikes among those who had a crash requiring medical attention compared to 2013 (16% vs. 5%).
One in four of those who had crashed in an on-road environment reported that they had been at fault (25%) with one in three saying that another party was at fault (35%) and an additional 16% who said that fault could be attributed to the two parties. One in ten (11%) reported that no other vehicles were involved in the crash.
A third (30%) of respondents who had ever experienced a crash received compensation or income support as a result of injuries they had received due to a motorcycle crash – most (75%) of whom received this from the TAC.
Respondents’ suggestions to the TACThe most common theme related to improving the awareness of road users or providing education by providing training on motorcycle safety and road sharing (27%). Related to this were suggestions around developing awareness campaigns or continuing existing advertising campaigns relating to motorcycle safety (12%). Maintaining the roads, fixing defects, removing potholes and cleaning up after road works was mentioned by one in ten respondents.
Transport Accident CommissionMotorcycle Monitor 2014 | Page 8

Implications of the research● While there were some differences in the broader motorcycle population including a higher proportion of active riders
and a smaller cohort of off-road riders in 2014 compared to 2013, in 2014 the overall composition of riders was much more consistent with that in 2012. This suggests that the change in methodology was not a major factor in the population differences observed in 2013 as hypothesised as both 2013 and 2014 used identical data collection methods. Results among active riders were generally consistent over the three years of the survey.
● There was a relatively higher proportion of respondents who had returned to riding in 2014 compared to 2013. Therefore it is not surprising there lower agreement that returning riders should do a refresher course. While these types of courses may be supported in principle, the TAC should note there may be resistance from the target audience if such courses were to be mandated.
● Learning to ride on an off-road bike or in an off-road environment as a child was a common experience among respondents. There is an opportunity to perhaps work with parents who teach them or working with the off-road riding community to encourage good habits when riders are young such as promoting importance the use of protective gear in all riding environments, communicating messages such as the social unacceptability of not protecting yourself in an already risky pastime or basic motorcycle safety tips or skills that could be passed onto young riders.
● Wearing motorcycle pants remains an issue among active riders. Motorcycle pants were the least likely to be owned by respondents and even among those who owned them, just over half said they wore them every time they rode. In terms of behaviour change, the relatively lower ownership figures compared to other types of gear shows there are some capability and opportunity barriers (lack of ownership means riders are not wearing this type of protective clothing). However, the bigger challenges for agencies such as the TAC are the motivational and habitual barriers. Riders seemed to be more inclined to wear a complete set of gear for longer rides but found it inconvenient or uncomfortable to wear gear on shorter rides. While currently riders do have the freedom of choice as to whether or not to wear protective gear while riding, the TAC could consider communicating to riders that a little bit of effort is worth it in the end, particularly when it comes to wearing motorcycle pants. It is possible that riders underestimate the rate or extent of leg injuries among motorcycle crashes. Other opportunities include promoting alternative designs that perhaps are easy to put on and off or may appear or feel more like regular outerwear.
● Related to protective gear, the survey provides the TAC with a benchmark for the propensity for wearing boots of any kind in the early stages of making it mandatory to wear this type of footwear when riding. It is worthwhile monitoring any changes over time including whether there is a change in those who choose to wear boots of any sort over other types of footwear.
● Based on respondent feedback, the TAC should continue to spread the message about sharing roads and the promoting awareness of other road users among both drivers and motorcyclists. Advocating improvement of roads to the relevant authorities on behalf of motorcyclists would also be worthwhile and well received by the motorcycle riding community.
Transport Accident CommissionMotorcycle Monitor 2014 | Page 9

2. Research Context2.1 Background to project
Transport Accident Commission objectivesThe TAC’s objectives under the Act include:
● reducing the cost to the Victorian community of compensation for transport accidents;● reducing the incidence of transport accidents;● providing suitable and just compensation in respect of persons injured or who die as a result of transport accidents in
the most socially and economically appropriate manner;● determining claims for compensation speedily and efficiently;● providing suitable systems for the effective rehabilitation of persons injured as a result of transport accidents;● managing the Transport Accident Scheme (Scheme) as effectively, efficiently and economically as possible; and● ensuring the Scheme emphasises accident prevention and effective rehabilitation.
TAC Road Safety Motorcycle Research ProgramMotorcycle rider attitudes and behaviours have been surveyed on an ad-hoc basis in recent years, generally as part of other surveys. In 2009, the TAC commissioned a survey to specifically track motorcycle rider attitudes and behaviours in relation to road safety issues, and to measure the prompted recall of motorcycle advertising campaigns when on air.
In since 2012, the Motorcycle Monitor Survey has been undertaken annually to gather detailed information about motorcycle riders, their attitudes toward road safety and their behaviour while riding their motorcycles with the intention to gain a fully representative sample of the motorcycle rider population.
Research objectivesThe core aims of the study were to explore the characteristics of the Victorian motorcycle rider population in terms of their:
● general demographic characteristics;● riding attitudes and behaviours; and● attitudes toward motorcycle related road safety issues.
Specifically, the key issues included:
● how often motorcyclists ride;● their riding activity and purpose;● the types/number of bikes owned;● awareness of motorcycle safety features; and● attitudes and behaviour regarding risk taking and, protective gear.
Additional questions were also included in the 2014 survey to further explore how often people go off-road riding; questions into the types of boots worn by motorcyclists; circumstances of crashes; and perceptions of the road toll (specifically, the perception of the number of motorcyclists who died on Victorian roads in 2013).
Transport Accident CommissionMotorcycle Monitor 2014 | Page 10

3. Survey DesignData collection methodThe 2014 survey was administered using the same methodology used in 2013 with online, hardcopy and telephone options
All respondents were sent an invitation letter in the mail with details on how to complete the survey online or over the phone. A reminder letter including a hardcopy version of the survey was sent to those who had not completed the survey within 10 days of receiving the initial invitation.
Approximately 10 days after the reminder letters and hardcopy surveys were received; reminder calls were made to people who had not completed the survey. At this stage, potential participants were also offered the opportunity to complete the survey over the phone if they preferred to do so.
Overall, 2,301 of the motorcycle licence or registration holders in the sample received at least a letter by mail or a telephone call to invite them take part in the study. The remainder had either opted out of the survey, or were ‘return to senders’ where there was no valid phone number in which to contact them with a reminder call.
The Motorcycle Monitor 2012 was administered with a slightly different methodology, with an online survey with the option for participants to complete the survey via telephone if they preferred. No hardcopy option was included in 2012.
Fieldwork in 2014 was conducted from 10 June 2014 through to 31 July 2014.
SamplingA random selection of 2,350 Victorians who had a motorcycle licence and/or a motorcycle registered in their name were invited to take part in the survey.
The sample included a booster of 350 Victorians who had either a Learners’ or Probationary motorcycle licence.
The sample structure took into account anticipated participation rates for different rider groups but also allowed for enough sample to conduct analyses within key groups such as young male riders, and female riders. This was the same approach that was used to draw the sample in 2013.
Table 1: Key fieldwork figures
n= % of total mail-out
Mail-out 1 – Survey invitation 2,350 100%
Mail-out 2 – Survey reminder 2,120 90%
Reminder calls attempted 1,475 63%
Reminder calls completed 680 29%
TOTAL Survey completions online 432 18%
TOTAL Survey completions hardcopy 304 13%
TOTAL Survey completions by phone 51 2%
TOTAL completions 787 33%
Opt-outs 2 0%
Return to senders/unusable questionnaires 65 3%
Subtotal Out of scope (return to sender with no valid phone number) 47 2%
Hardcopy surveys received after closing date 2 0%
Transport Accident CommissionMotorcycle Monitor 2014 | Page 11

An analysis of the characteristics of hardcopy respondents vs. online respondents showed that those who completed the survey online tended to be younger (79% vs 61%. aged over 40); and more likely to live in metropolitan Melbourne (69% vs. 54% for hardcopy completions).
Other demographic differences between the people who completed the survey online vs. hardcopy or telephone tended to reflect age or location differences in the respective groups. For example 24% of those who completed the survey online were employed part time or casual vs. 13% of those who completed it via hardcopy or telephone.
Response ratesThe overall response rate for the study was 33% compared to 30% in 2013.
There were 784 survey completions in total. More than half of respondents completed the survey online (55% or n=432). This compares to 63% who completed the survey online in 2013. We received 301 usable hardcopy returns (39%). Six percent of respondents (n=51) chose to complete the survey over the telephone. This compares to only 2% telephone completes in 2013.
Response rates tended to be higher among:
● those who were aged 40+ (41% vs. 27% of those aged 18-25);● females (39% vs. 32% for males);● those with full licences (38% vs. 25% for those with Ls or Ps);● those with a registration and licence (40% vs. 30% of those with registration or licence only).
There is a slight difference between the profile of respondents in 2014 compared to 2013 and 2012 that should be noted by readers when considering the findings of this report relating to the riding history of respondents. In 2014, a higher proportion of respondents were classified as ‘active riders’ (defined as either currently riding occasionally or regularly without a break or returning to riding since being on a break) compared to 2013. Proportions of ‘active riders’ in 2014 are on par with those in 2012 (55% of respondents) suggesting that those who are more engaged in riding were more likely to take part in 2012 and 2014 compared to 2013.
WeightingA weighting scheme was developed to realign the number of responses received so that the data would reflect the characteristics of the Victorian motorcyclist population and responses from oversampled sub-groups or groups with higher response rates were not overstated in the results.
The weighting scheme that was developed was based on motorcycle licence and registration population statistics from the VicRoads database extracted in June 2014 and took into account the following attributes:
● age; ● gender;● location; ● licence type and; whether they had a registered motorcycle linked to their home address.
The following table compares the characteristics of the actual riding population in June 2014 compared to the number of surveys mailed out. The data was weighted to realign the number received to the proportion of these groups observed in the population for example, 33% of the mailing sample was sent to those with a learners or probationary licence. One in four returns received were from this cohort (24%), however this group only constitutes 7% of the motorcycling population, therefore the number of returns were ‘weighted’ down so that the proportion was in line with the proportion in the motorcycling population and their views were not over-represented in the results
Transport Accident CommissionMotorcycle Monitor 2014 | Page 12

Table 2: Sample attributes and population comparisons
Sample attributes and population figures % of mail-out
% of completions (unweighted)
Population figures
(%)
Registration and licence status
Both registration and licence** 35% 42% 34%
Registration or licence only*** 65% 58% 66%
Licence type
Full motorcycle licence** 65% 75% 91%
Learner or probationary licence*** 33% 24% 7%
No licence** 3% 1% 2%
Gender
Female*** 18% 21% 13%
Male** 82% 79% 87%
Age
18-25** 38% 30% 7%
26-39** 28% 28% 26%
40+*** 35% 42% 68%
Location
Metropolitan Melbourne*** 56% 54%
Balance of Victoria** 44% 46%
** “weighted down” to be in line with the proportions in the population as mail-out higher than proportion in population (over-sampled)
*** “weighted up” to be in line with the proportions in the population as mail-out lower than proportion in population (under-sampled)
Note: Table based on attributes from sample file as of June 2013
Based on VicRoads data Victorian motorcyclists were predominately male (87%). They also tended to be skewed towards the older age brackets with 68% of motorcycle licence or registration holders aged 40 years plus. Over one in four respondents was aged between 26 and 39 years (26%) and a minority of licence and registration holders were aged under 25 (7%). These weighted figures for 2014 are shown in Figure 1 below.
Transport Accident CommissionMotorcycle Monitor 2014 | Page 13
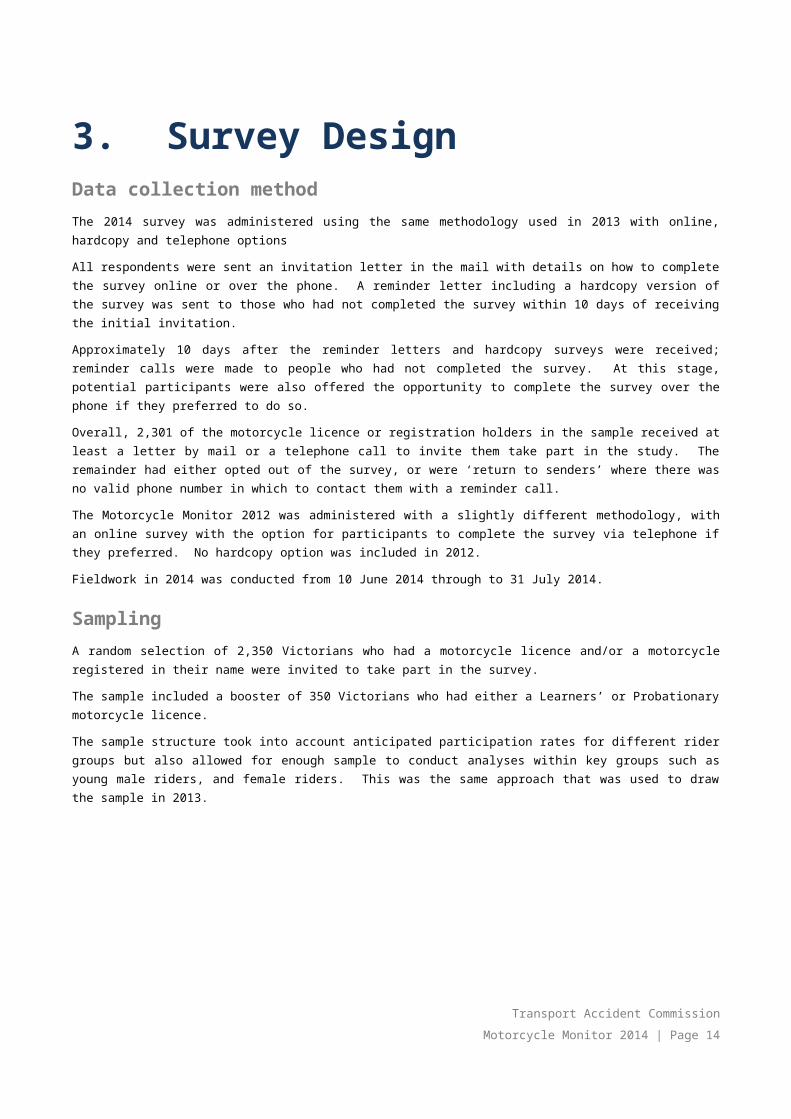
Figure 1: Age and gender (weighted sample) – 2014
6
29
64
Female(n=150)
18-25years
26-39years
40+ years
6
25
69
Male(n=629)
18-25years
26-39years
40+ years
6
26
68
Total (n=780)
18-25years
26-39years
40+ years
Q1 AgeQ2 GenderWeighted sample; Base n = 780Note: Figure based on reported age at time of survey and excludes those who did not provide an age
With the exception of the demographics in the appendix, the research results presented in this report are weighted to be representative of the whole motorcycle riding population rather than just those who completed the survey.
Limited analysis was also conducted to explore whether there were differences according to the sample data from the VicRoads database including variables such as the Socio Economic Index for Areas (SEIFA) quintiles based on the postcode of residence from the VicRoads data base.
This report also includes updated figures for the 2013 survey results due to revisions to the weighting scheme based on updated VicRoads database figures for the motorcycling population.
Reading this reportThe 2013 data has been included in this report for illustrative purposes however, results are only statistically different where stated. Note that most questions in the hardcopy questionnaire were addressed to those who had ridden in the last 12 months. Where questions were asked of different rider groups between completion methods in 2014, the results in this report cover respondents common across all completion methods.
Tests of significance were conducted between key rider characteristics such as age, gender, riding purpose and ownership characteristics. These were conducted at the 95% level of confidence and are reported where appropriate.
A sample of n=784 enables us to be 95% confident that, at the overall level, a feature of the Victorian motorcycle rider population we are testing is within a range of ±3.5% of what the survey tells us. For example, this means that if we find that 50% of respondents said they had ridden a motorcycle in the last 12 months, we can be 95% confident that between 46.5% and 53.5% of the population represented by the sample actually did this.
A ‘significant difference’ means we can be 95% confident the difference observed between the two samples reflects a true difference in the population of interest, and is not a result of chance. Such descriptions are not value judgements on the importance of the difference. The reader is encouraged to make a judgement as to whether the differences are ‘meaningful’ or not.
Where significance testing has occurred between pairs such as male vs. female riders this has been undertaken as an independent samples tests. However, where significance testing has occurred between more than two categories within a group e.g. main motorcycle type ridden (road bike, off-road bike; and scooter), the significance testing used tests one
Transport Accident CommissionMotorcycle Monitor 2014 | Page 14

category against the average of the others that are not in that category combined. Such a test is ideal for multiple comparisons as it reduces the likelihood of displaying a significant difference where one does not exist.
Statistically significant differences within tables are displayed by green (9) and red figures/arrows (2). Green figures indicate the figure reported is statistically higher; red indicate the figure is statistically lower.
Note that figures may not add up to 100% due to rounding or questions where multiple responses were allowed.
Transport Accident CommissionMotorcycle Monitor 2014 | Page 15

Research findings
Transport Accident CommissionMotorcycle Monitor 2014 | Page 16

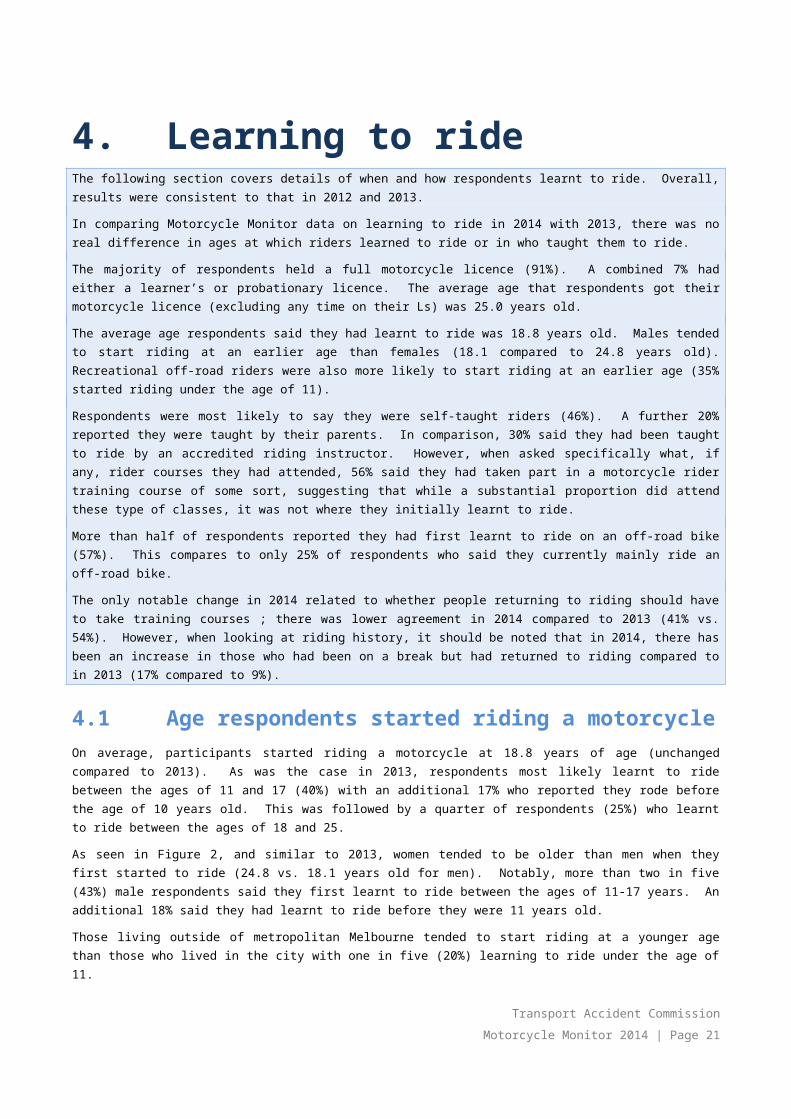
4. Learning to rideThe following section covers details of when and how respondents learnt to ride. Overall, results were consistent to that in 2012 and 2013.
In comparing Motorcycle Monitor data on learning to ride in 2014 with 2013, there was no real difference in ages at which riders learned to ride or in who taught them to ride.
The majority of respondents held a full motorcycle licence (91%). A combined 7% had either a learner’s or probationary licence. The average age that respondents got their motorcycle licence (excluding any time on their Ls) was 25.0 years old.
The average age respondents said they had learnt to ride was 18.8 years old. Males tended to start riding at an earlier age than females (18.1 compared to 24.8 years old). Recreational off-road riders were also more likely to start riding at an earlier age (35% started riding under the age of 11).
Respondents were most likely to say they were self-taught riders (46%). A further 20% reported they were taught by their parents. In comparison, 30% said they had been taught to ride by an accredited riding instructor. However, when asked specifically what, if any, rider courses they had attended, 56% said they had taken part in a motorcycle rider training course of some sort, suggesting that while a substantial proportion did attend these type of classes, it was not where they initially learnt to ride.
More than half of respondents reported they had first learnt to ride on an off-road bike (57%). This compares to only 25% of respondents who said they currently mainly ride an off-road bike.
The only notable change in 2014 related to whether people returning to riding should have to take training courses ; there was lower agreement in 2014 compared to 2013 (41% vs. 54%). However, when looking at riding history, it should be noted that in 2014, there has been an increase in those who had been on a break but had returned to riding compared to in 2013 (17% compared to 9%).
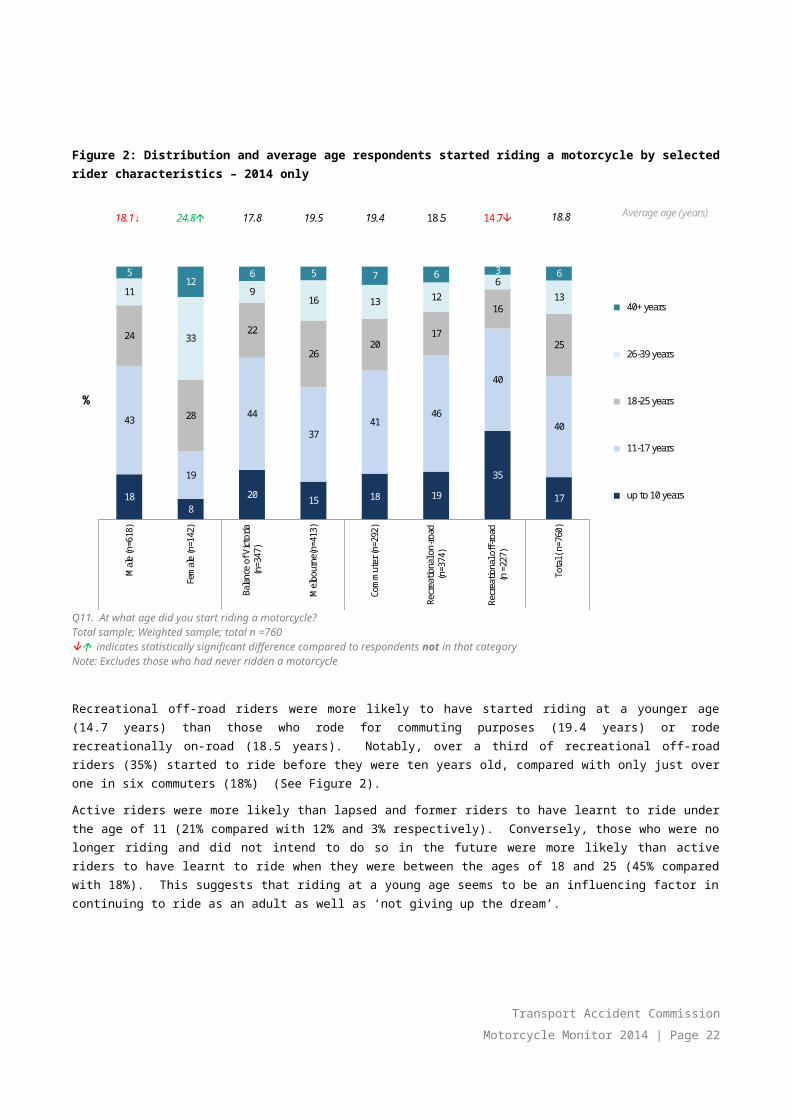
4.1 Age respondents started riding a motorcycleOn average, participants started riding a motorcycle at 18.8 years of age (unchanged compared to 2013). As was the case in 2013, respondents most likely learnt to ride between the ages of 11 and 17 (40%) with an additional 17% who reported they rode before the age of 10 years old. This was followed by a quarter of respondents (25%) who learnt to ride between the ages of 18 and 25.
As seen in Figure 2, and similar to 2013, women tended to be older than men when they first started to ride (24.8 vs. 18.1 years old for men). Notably, more than two in five (43%) male respondents said they first learnt to ride between the ages of 11-17 years. An additional 18% said they had learnt to ride before they were 11 years old.
Those living outside of metropolitan Melbourne tended to start riding at a younger age than those who lived in the city with one in five (20%) learning to ride under the age of 11.
Transport Accident CommissionMotorcycle Monitor 2014 | Page 17

Figure 2: Distribution and average age respondents started riding a motorcycle by selected rider characteristics – 2014 only
188
20 15 18 19
35
17
43
19
44
3741
46
40
40
24
28
22
2620
17
16
25
11
33
916 13 12
613
512
6 5 7 6 3 6
18.1↓ 24.8 17.8 19.5 19.4 18.5 14.7 18.8
Mal
e (n
=618
)
Fem
ale
(n=1
42)
Bala
nce
of V
icto
ria(n
=347
)
Mel
bour
ne(n
=413
)
Com
mut
er (n
=292
)
Recr
eatio
nal o
n-ro
ad(n
=374
)
Recr
eatio
nal o
ff-ro
ad(n
=22
7)
Tota
l ( n
=760
)Gender Location Riding purpose
%
Average age (years)
40+ years
26-39 years
18-25 years
11-17 years
up to 10 years
Q11. At what age did you start riding a motorcycle?Total sample; Weighted sample; total n =760indicates statistically significant difference compared to respondents not in that categoryNote: Excludes those who had never ridden a motorcycle
Recreational off-road riders were more likely to have started riding at a younger age (14.7 years) than those who rode for commuting purposes (19.4 years) or rode recreationally on-road (18.5 years). Notably, over a third of recreational off-road riders (35%) started to ride before they were ten years old, compared with only just over one in six commuters (18%) (See Figure 2).
Active riders were more likely than lapsed and former riders to have learnt to ride under the age of 11 (21% compared with 12% and 3% respectively). Conversely, those who were no longer riding and did not intend to do so in the future were more likely than active riders to have learnt to ride when they were between the ages of 18 and 25 (45% compared with 18%). This suggests that riding at a young age seems to be an influencing factor in continuing to ride as an adult as well as ‘not giving up the dream’.
Transport Accident CommissionMotorcycle Monitor 2014 | Page 18

4.2 Motorcycle licence statusBased on VicRoads database of motorcycle licence holders extracted in April 2014, approximately 385,414 Victorians held a motorcycle licence. The vast majority of respondents in 2014 (91%) held a full motorcycle licence. Similar to 2013, approximately 7% (or approximately 13,775 Victorians) had either a learner’s (4% unchanged) or probationary licence (3%). A minority of all respondents reported they did not have a motorcycle or scooter licence (i.e. they held a registration only) (2%).
Figure 3: Motorcycle licence status - 2012-2014
96
112
2012
Yes - Full
Yes - Probationary
Yes - Learner
None
89
44 3
2013
Yes - Full
Yes - Probationary
Yes - Learner
None
91
3 4 2
2014
Yes - Full
Yes - Probationary
Yes - Learner
None
None
Q4. Do you have a motorcycle licence?Total sample; Weighted sample; 2012 base n = 548, 2013 base n=703; 2014 base n = 781
Transport Accident CommissionMotorcycle Monitor 2014 | Page 19

As expected, riders under the age of 26 were more likely to hold either a learner’s permit or a probationary licence compared to other age groups (21% held a learners permit and 31% held a probationary licence) (See Figure 4).
Figure 4: Motorcycle licence status by age – 2014
21
31
43
5
18-25 years (n=211)
Yes - Learner
Yes - Probationary
Yes - Full
None
56
88
2
26-39 years (n=225)
Yes - Learner
Yes - Probationary
Yes - Full
None
20
96
2
40+ years (n=343)
None
20
96
2
40+ years (n=343)
None
Q4. Do you have a motorcycle licence?Total sample; Weighted sample; base n=781
4.3 Age motorcyclists applied for their licence
Full licence holdersOn average, full licence and probationary licence holders first got their Ps or full motorcycle licence at 25.0 years. There were no significant differences between 2013 and 2014, with the majority of respondents saying that they were aged between 18 and 25 when they had first acquired their motorcycle licence (57% vs. 61% in 2013).
Figure 5: Age full/probationary licence holders got their licence (2012-2014)
9
58
24
87
61
22
88
57
23
9
0
10
20
30
40
50
60
70
17 or under 18-25 years old 26-39 years 40 + years
2012
2013
2014
Q5. How old were you when you got your motorcycle licence? Filter: Full and probationary licence only; Weighted sample; 2012 base n = 501, 2013 base n=555, 2014 base n = 692
Transport Accident CommissionMotorcycle Monitor 2014 | Page 20
Just over one in ten respondents had applied for their motorcycle licence in the last four years (12%). Over a quarter (27%) had applied between 2000 and 2009. Approximately one in five had applied in each of the three decades prior to this (See Figure 6)
Figure 6: Year applied for licence (Full and probationary licence holders) 2014
22 21 19
27
12
0
20
40
60
80
100
1979 or earlier 1980-1989 1990-1999 2000-2009 2010-2014
%
Q5. How old were you when you got your motorcycle licence? Q1. AgeFilter: Full and probationary licence only; Weighted sample; 2014 base n=660 (excluding don’t know and respondent error)
In terms of the gap between first learning to ride and eventually applying for a full/probationary licence, almost one in four reported that there was no gap – that they had learnt to ride in the same year as they applied for their licence (24%). Thirty-seven percent (37%) of full and probationary licence holders, learnt to ride one to five years before gaining their licence; and for one in three (37%) there was a gap of six years or more between first learning and applying for their licence.
Transport Accident CommissionMotorcycle Monitor 2014 | Page 21
Learner licence holdersAmong the learner licence holders, the average age respondents applied for their licence was 32.1 years old. Just over four in ten of this cohort were between the ages of 18 and 25 (41%), followed by over one-third (35%) who were between the ages of 26 and 39. One quarter of respondents (24%) applied for their Ls when they were 40 years or older. The vast majority (91%) of current learner riders reported they had applied for their permit between 2012 and 2014.
Figure 7: Age first got learners motorcycle licence (Learners only) - 2012 - 2014
72
28
0
46
2528
41
35
24
0
10
20
30
40
50
60
70
80
under 25 years 26-39 years 40 years +
2012
2013
2014
Q6. How old were you when you got your learners licence?Filter: Full and probationary licence only; Weighted sample; 2012 base n = 22, 2013 base n=117, 2014 base n = 79
Among L platers, the majority (54%) reported there was no gap between first learning to ride and getting their Ls. However, for some it was likely they had some riding experience prior to getting their Ls with 33% getting their Ls six years or more after they had first learnt to ride. For a further 10%, there had been a gap of one to five years between learning to ride and applying for their licence.
Transport Accident CommissionMotorcycle Monitor 2014 | Page 22
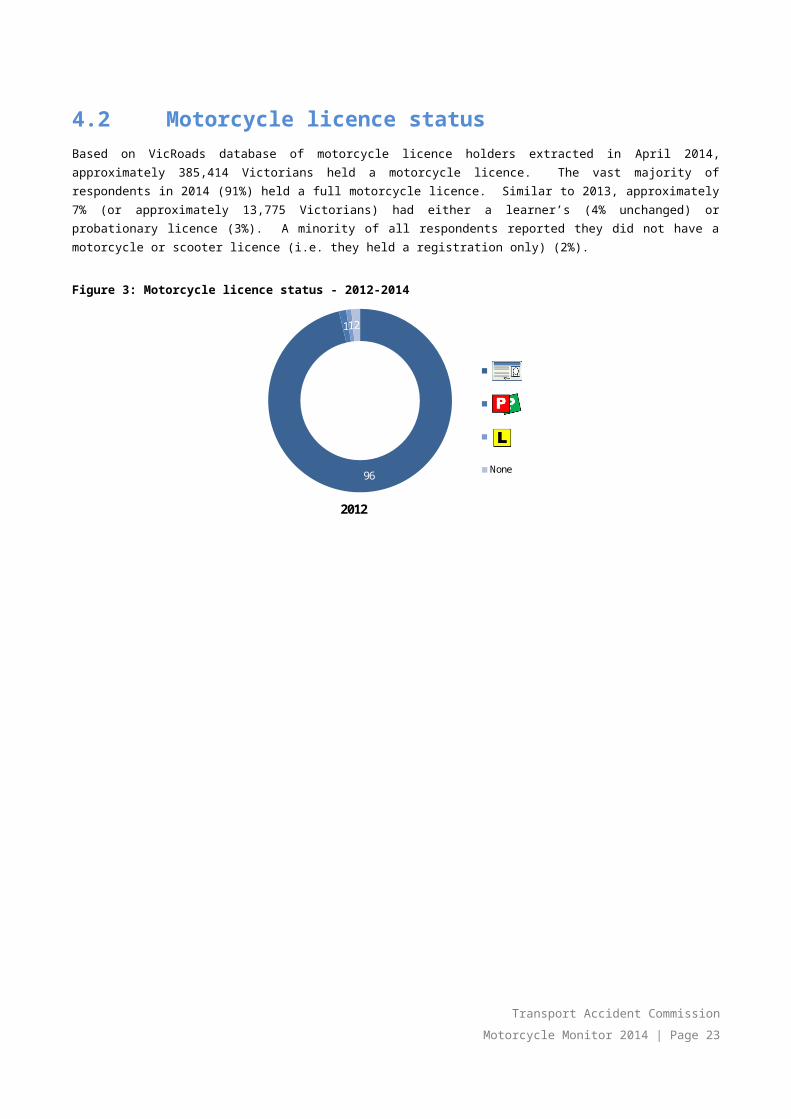
Figure 8: Gap between learning to ride and gaining learners licence (Learners only) - 2014
3
54
10
33
0
20
40
60
80
100
Learnt to ride after getting Ls Learnt to ride when getting Ls(no gap)
Got Ls 1-5 years after learning Got Ls 6 or more years after
%
Q6. How old were you when you got your learners licence?Q1 AgeFilter: Learners only; Weighted sample; base n=79
While the sample sizes for some sub-groups were small, learners aged 40+ were less likely to report a gap of one year or more between first learning to ride and actually getting their learner’s licence (14% compared to 38% of those aged 39 and under and 48% of those aged 18-25). Learners who mainly rode an off-road bike were more likely to report a gap of at least a year (64%) compared to road bike and scooter riders (33% and 0% respectively).
4.4 Learning to ride
Who taught motorcyclists to rideSimilar to findings in the 2013 survey, most respondents in 2014 learnt to ride away from a riding or training school environment. Nearly half (46%) said they had taught themselves how to ride. Just under a third (30%) of riders were taught by an accredited riding instructor and one in five (20%) were taught by their parents. Further details of the types of rider training courses respondents had attended are covered in the subsequent section.
Transport Accident CommissionMotorcycle Monitor 2014 | Page 23

Figure 9: Who taught motorcyclists to ride - 2014
46
30
20
17
15
1
0
0 10 20 30 40 50
Self-taught
Taught by an accredited riding instructor
Taught by parents
Taught by friends
Taught by other family members
Other
Never learned to ride
%
Q11b. Who taught you to ride a motorcycle?Weighted; base n= 779;
At the overall level, respondents aged 40 or over were more likely to say they were self-taught than younger riders (52% vs. 35% for those aged 26-39 years and 37% for those aged 18-25 years).
Those in younger age groups were more likely to have been taught by an accredited riding instructor (40% of those aged 26-39 and 35% of those aged 18-25 years) or by their parents (30% of those aged 26-39 years and 41% of those aged 18-25 years).
Being taught by an accredited riding instructor tended to be more common among those who lived in Metropolitan Melbourne (36% compared to 18% of those who lived outside the city). Off-road recreational riders were more likely to be taught by their parents (32% vs. 19% of commuters and 21% of on-road recreational riders) (See Table 3).
Being taught by an accredited riding instructor was also less common among active riders (25% vs. 35% of lapsed and 38% of former riders).
Transport Accident CommissionMotorcycle Monitor 2014 | Page 24
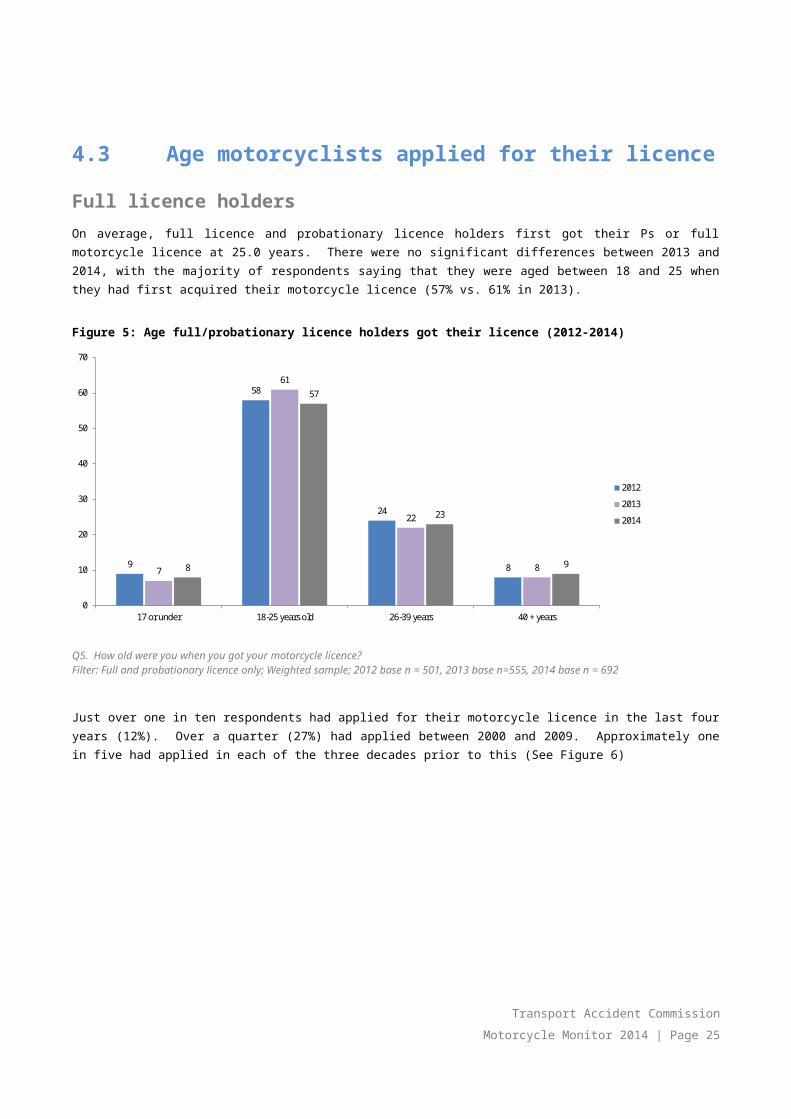
Table 3: Who taught motorcyclists to ride by demographic characteristics - 2014
Column % Gender Age Location Total(n=779)Male
(n=628)Female(n=149)
18-25(n=210)
26-39(n=224)
40+(n=341)
Balance of Victoria(n=355)
Melbourne(n=424)
Self-taught 50 17 37 35 52 50 44 46
Taught by an accredited riding instructor
25 62 35 40 25 18 36 30
Taught by parents 20 17 41 30 15 24 17 20
Taught by friends 16 22 12 16 18 17 17 17
Taught by other family members
13 24 16 13 15 16 13 15
Other 1 3 0 1 2 1 2 1
Never learnt to ride
0 0 0 0 0 0 0 0
Q11B. Who taught you to ride a motorcycle? Total sample; Weighted sample; Base n = 779indicates statistically significant difference compared to respondents not in that category
Respondents who learnt at a younger age were more likely to say they had been taught by their parents (63% of those who learnt at 10 years or younger). Other family members were also more likely to have taught those who learnt when they were very young (24%) compared to those who learnt when they were older.
In contrast, those who had learnt when they were 18 or older were significantly more likely to have taught to ride by an accredited riding instructor (54% vs. 11% of those who learnt at 17 years or under) (See Table 4).
Table 4: Who taught motorcyclists to ride by age learnt to ride - 2014
%Up to 10
years(n=159)
11-17 years
(n=250)
18-25 years
(n=231)
26-39 years(n=90)
40+ years
(n=30)
Total
(n=760)
Self-taught 34 54 55 34 27 47
Taught by an accredited riding instructor
9 11 39 73 78 30
Taught by parents 63 20 3 6 0 20
Taught by friends 14 24 12 15 1 17
Taught by other family members 24 17 8 10 13 15
Other 0 2 0 3 9 2
Q11B. Who taught you to ride a motorcycle? Total sample; Weighted sample; Base n = 760indicates statistically significant difference compared to respondents not in that category
The above findings lead to suggest that a family connection and exposure to riding at a young age continue to be factors in riders choosing to ride as they become adults
Transport Accident CommissionMotorcycle Monitor 2014 | Page 25

Locations motorcyclists learnt to rideIn 2014, the majority of respondents (58%) learnt to ride off-road on private property, followed by just under a third (31%) who learnt at a learner’s course (e.g. Stay Upright). Just over one in five (21%) said they had learnt on quiet back streets. These results remain unchanged from 2013.
Figure 10: Where leant to ride - 2014
58
31
21
13
3
1
0
3
0 10 20 30 40 50 60
Off-road on private property
Did a learners' course (e.g. Stay Upright)
On quiet back streets
Off-road in national/state parks
Trial day (e.g. At a race track)
Overseas/on holidays
Never learned to ride
Other
%
Q11C. Where did you learn to ride? Total sample; Weighted sample; Base n = 779
As shown in Table 5, males were more likely to learn off-road on private property and less likely to do a learner’s course than females (61% for males vs. 41% for females and 27% vs. 61% for females respectively).
Similarly respondents from regional Victoria were more likely to learn off-road on private property and less likely to do a learner’s course than those in Melbourne (71% vs. 51% learnt off-road on private property). Those who lived in Metropolitan Melbourne were more likely to say they had completed learner’s course (18% vs. 39% of regional Victorian residents).
Not surprisingly, active riders (who were more likely to have learnt at a younger age) were more likely than lapsed riders to have learnt to ride off-road on private property (64% vs. 55%).
Transport Accident CommissionMotorcycle Monitor 2014 | Page 26

Table 5: Locations learnt to ride - by selected demographic variables - 2014
Column % Gender Age Location
Male(n=628)
Female(n=149)
18-25(n=210)
26-39(n=224)
40+(n=341)
Balance of Victoria(n=355)
Melbourne(n=424)
Off-road on private property 61 41 58 48 63 71 51
Did a learners' course (e.g. Stay Upright) 27 61 40 48 24 18 39
On quiet back streets 19 37 17 15 23 20 21
Off-road in national/state parks 14 6 15 13 13 11 14
Trial day (e.g. At a race track) 3 3 8 2 3 2 4
Overseas/on holidays 1 0 0 1 1 0 2
Other 3 1 2 3 3 2 4
Q11C.Where did you learn to ride? Multiple responses acceptedTotal sample; Weighted sample; Base n =779indicates statistically significant difference compared to respondents not in that category
Those who were more likely to report they had learnt off-road on private property included those who had been taught by their parents (89%), friends (77%) or other family members (71%). Close to two in three (63%) of those who taught themselves to ride also learnt off-road on private property. Almost one in three (29%) who were self-taught said they had learnt to ride on quiet back streets and 15% of self-taught riders said they had learnt off-road in national/state parks.
Table 6: Where did you learn to ride by who taught by
Column % Self-taught (n=324)
Taught by an accredited riding instructor (n=247)
Taught by parents (n=202)
Taught by friends (n=128)
Taught by other family
members (n=117)
Off-road on private property 63 30 89 77 71
Did a learners' course (e.g. Stay Upright) 21 87 17 23 24
On quiet back streets 29 18 12 27 21
Off-road in national/state parks 15 6 10 19 18
Trial day (e.g. At a race track) 4 6 6 11 6
Overseas/on holidays 2 2 0 0 0
Other 4 3 2 0 1
Q11C.Where did you learn to ride? Total sample; Weighted sample; Base n =779Multiple responses acceptedindicates statistically significant difference compared to respondents not in that category
Transport Accident CommissionMotorcycle Monitor 2014 | Page 27

Looking at the age when people learnt to ride (Table 6) almost all those who had learnt as children (under 11 years old) learnt off-road on private property (87%). Three in four (74%) of those who learnt between 11-17 years old also reported they had learnt off-road on private property. Those who learnt to ride when they were 18 or older were more likely to say they learnt at a dedicated learners’ course (57% compared to 10% who said they learnt when they were younger than this). Those who learnt when they were aged 18-25 were most likely to say they had learnt in quiet back streets (30%).
Table 7: Where did you learn to ride by age learnt to ride
Column % Up to 10 years (n=167)
11-17 years (n=252)
18-25 years (n=234)
26-39 years (n=94)
40+ years (n=32)
Total (n=779)
Did a learners' course (e.g. Stay Upright) 8 11 40 79 79 31
Trial day (e.g. At a race track) 5 3 1 7 1 3
Off-road in national/state parks 18 16 10 4 10 13
Off-road on private property 87 74 34 26 46 58
On quiet back streets 10 21 30 19 13 21
Overseas/on holidays 0 0 4 1 0 1
Other 2 2 6 1 0 3
Q11C.Where did you learn to ride? Total sample; Weighted sample; Base n =779Multiple responses acceptedindicates statistically significant difference compared to respondents not in that category
Riding experience prior to gaining learner licenceWhen asked how they would describe their riding experience prior to gaining their motorcycle learners’ permit, respondents’ levels of experience varied. Respondents were most likely (41%) to indicate they were experienced (i.e. a capable rider when they attained their learners’ permit), followed by just under a third (30%) who indicated their experience was minimal i.e. had never ridden a motorcycle or only ridden a few times before getting their learners’ permit. Just over one in four (28%) described their skills as moderate (having ridden a motorcycle several times prior to gaining their learners).
Transport Accident CommissionMotorcycle Monitor 2014 | Page 28
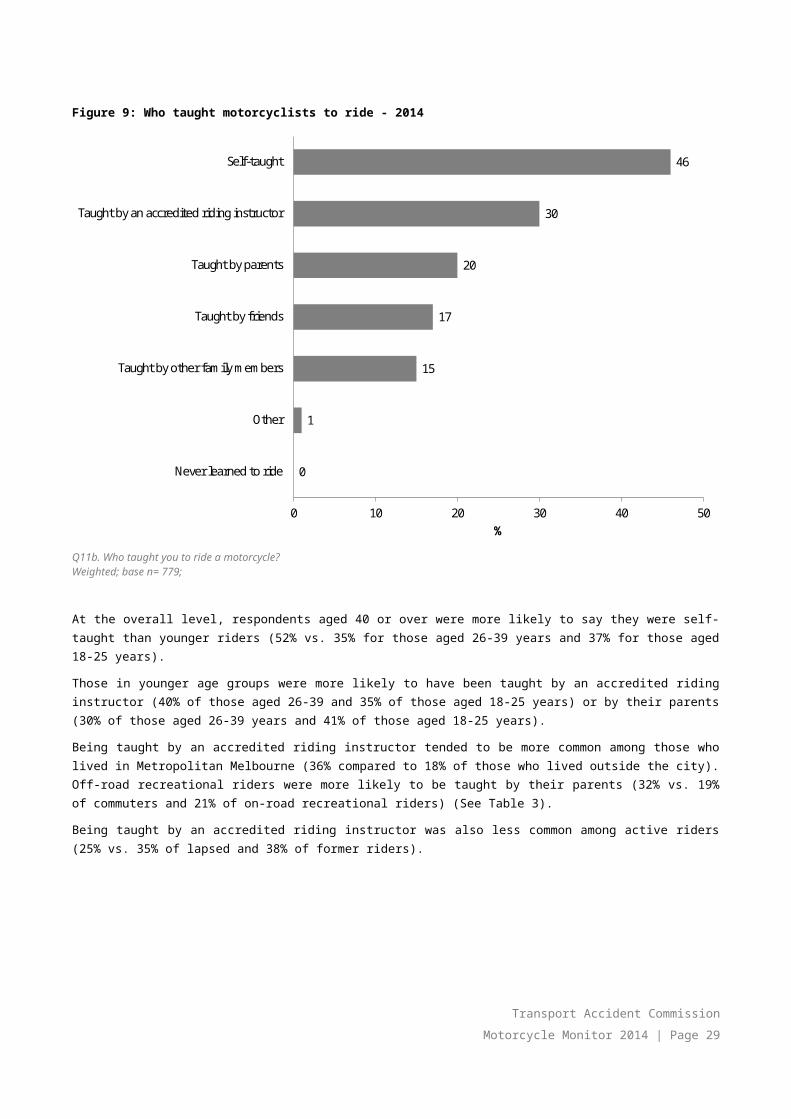
Figure 11: Riding experience prior to gaining a learner's permit - 2014
30%
28%
42%
Minimal (never ridden a motorcycle oronly ridden a few times before gettingmy learners permit)
Moderate (ridden a motorcycleseveral times prior to gaining alearners permit)
Experienced (capable rider whenlearners permit attained)
Q11D How would you describe your riding experience prior to gaining your motorcycle learner’s permit? Total sample; Weighted sample; Base n =770Excludes those who never learnt to ride
As seen in Table 8 and Table 9, those more likely to say they had minimal experience were:
● female riders (62% vs. 26% of males);● those from Melbourne (36% vs. 22% of those from regional Victoria), and● commuters (31% vs. 14% of recreational off-road riders).
Table 8: Riding experience prior to gaining a learner's permit gender and location
Column % Gender Location
Male (n=621)
Female (n=147)
Balance of Victoria (n=350)
Melbourne (n=420)
Minimal experience (never ridden a motorcycle or only ridden a few times before getting learners permit)
26 62 22 36
Moderate experience (ridden a motorcycle several times prior to gaining learners permit)
29 27 26 30
Experienced (capable rider when learners permit attained) 45 11 52 35
Q11D How would you describe your riding experience prior to gaining your motorcycle learner’s permit? Total sample; Weighted sample; Base n =770Excludes those who never learnt to rideindicates statistically significant difference compared to respondents not in that category
Transport Accident CommissionMotorcycle Monitor 2014 | Page 29
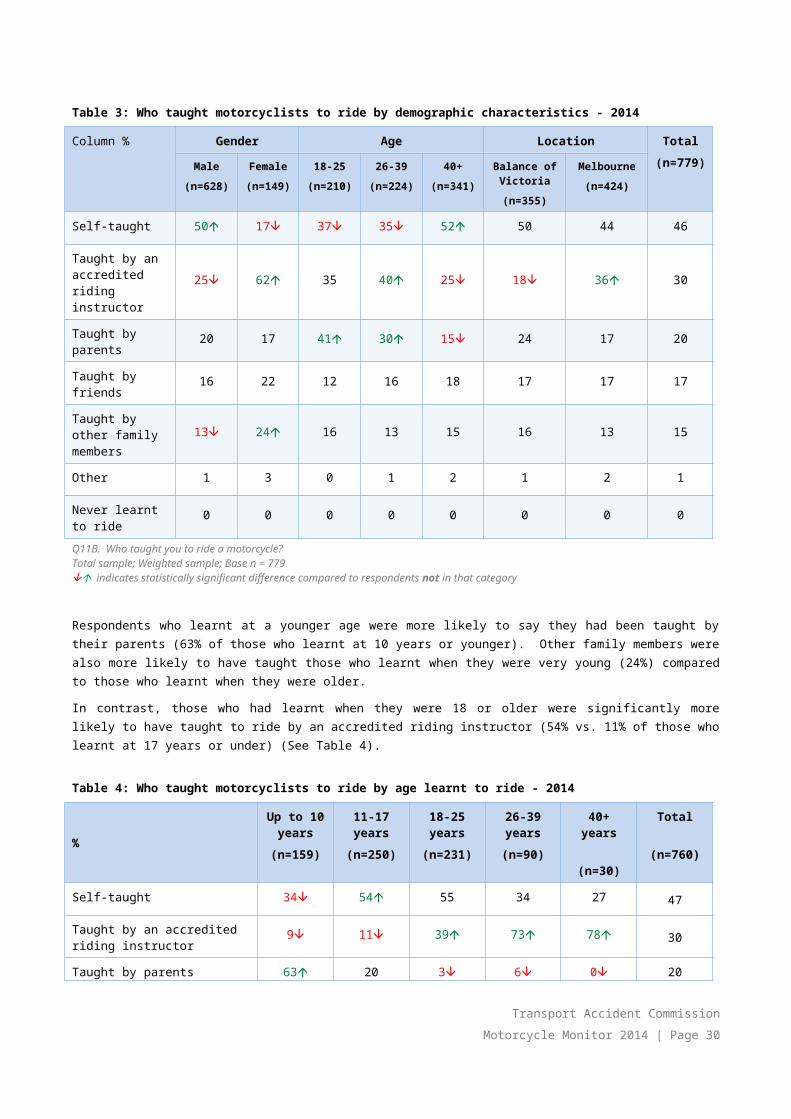
Table 9: Riding experience prior to gaining a learner's permit by rider type
Column % Riding activity segments Riding purpose (Active riders)
Active riders
(n=508)
Lapsed riders
(n=226)
Former riders (n=31)
Commuter (n=293)
Rec. on-road rider
(n=375)
Rec. off-road rider
(n=231)
Minimal experience (never ridden a motorcycle or only ridden a few times before getting learners permit)
25 32 66 31 27 14
Moderate experience (ridden a motorcycle several times prior to gaining learners permit)
25 35 19 30 24 22
Experienced (capable rider when learners permit attained) 50 33 16 39 48 64
Q11D How would you describe your riding experience prior to gaining your motorcycle learner’s permit? Total sample; Weighted sample; Base n =784Excludes those who never learnt to rideindicates statistically significant difference compared to respondents not in that category
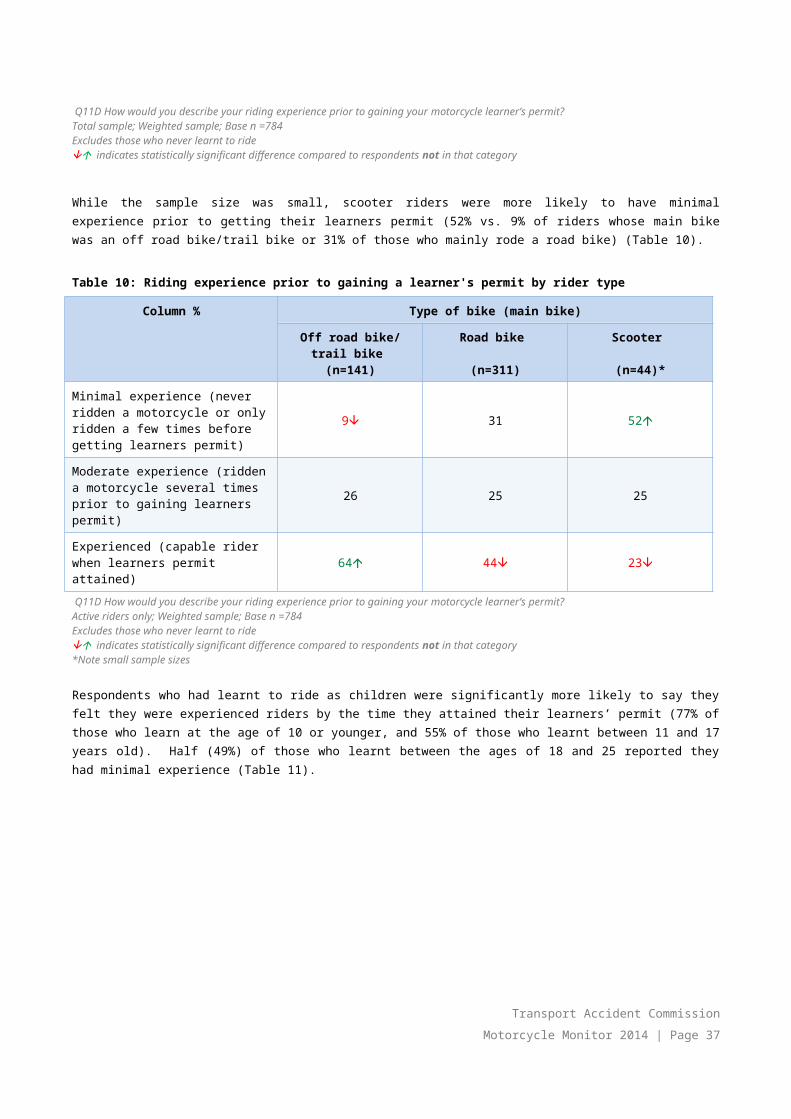
While the sample size was small, scooter riders were more likely to have minimal experience prior to getting their learners permit (52% vs. 9% of riders whose main bike was an off road bike/trail bike or 31% of those who mainly rode a road bike) (Table 10).
Table 10: Riding experience prior to gaining a learner's permit by rider type
Column % Type of bike (main bike)
Off road bike/trail bike (n=141)
Road bike
(n=311)
Scooter
(n=44)*
Minimal experience (never ridden a motorcycle or only ridden a few times before getting learners permit)
9 31 52
Moderate experience (ridden a motorcycle several times prior to gaining learners permit)
26 25 25
Experienced (capable rider when learners permit attained) 64 44 23
Q11D How would you describe your riding experience prior to gaining your motorcycle learner’s permit? Active riders only; Weighted sample; Base n =784Excludes those who never learnt to rideindicates statistically significant difference compared to respondents not in that category*Note small sample sizes
Respondents who had learnt to ride as children were significantly more likely to say they felt they were experienced riders by the time they attained their learners’ permit (77% of those who learn at the age of 10 or younger, and 55% of those who learnt between 11 and 17 years old). Half (49%) of those who learnt between the ages of 18 and 25 reported they had minimal experience (Table 11).
Transport Accident CommissionMotorcycle Monitor 2014 | Page 30

Table 11: Riding experience prior to gaining a learner's permit by age learnt to ride
Column % Up to 10 years old (n=163)
11-17 years old (n=249)
18-25 years old (n=232)
26-39 years (n=94)
40+ years (n=32)
Minimal (never ridden a motorcycle or only ridden a few times before getting my learners permit)
2 14 49 68 55
Moderate (ridden a motorcycle several times prior to gaining a learners permit)
21 31 27 24 45
Experienced (capable rider when learners permit attained) 77 55 23 8 0
Q11D How would you describe your riding experience prior to gaining your motorcycle learner’s permit? Q11. At what age did you start riding a motorcycle?Total sample; Weighted sample; Base n =770Excludes those who never learnt to rideindicates statistically significant difference compared to respondents not in that category
Transport Accident CommissionMotorcycle Monitor 2014 | Page 31

Type of bikes motorcyclists learnt to ride onOver half of respondents (57%) first learnt to ride on an off-road bike, followed by 34% who had learnt on a road bike. A minority reported having first learnt to ride on a scooter (6%).
Figure 12: Type of motorcycle learnt to ride on - 2014 only
34%
6%
57%
3%
Road bike
Scooter
Off-road bike
Other
Q11E What kind of motorcycle did you first learn to ride on? Total sample; Weighted sample; Base n = 772
Females were more likely to have learnt to ride on a road bike than males (58% vs. 31%) and less likely to have learnt on an off-road bike (32% vs. 61% of males).
A particularly high proportion of active riders and those who were aged 18-25 reported first learning to ride on an off-road bike (64% and 67% respectively).
Consistent with findings about where respondents learnt to ride, those who learnt at a younger age were significantly more likely to have learnt on an off-road bike (87% of those who learnt at 10 years or younger and 65% of those who learnt between the ages of 11-17 years old). Road bikes were more common amongst those who had learnt when they were 18 or older (52%) (Table 12).
Table 12: Type of motorcycle learnt to ride on by age learnt to ride
Column % Up to 10 years (n=162)
11-17 years (n=251)
18-25 years (n=233)
26-39 years (n=94)
40+ years (n=32)
Total (n=772)
Road bike 3 28 54 52 43 34
Scooter 6 5 3 13 11 6
Off-road bike 87 65 42 30 46 57
Other 5 3 1 5 0 3
Transport Accident CommissionMotorcycle Monitor 2014 | Page 32

Q11E What kind of motorcycle did you first learn to ride on? Total sample; Weighted sample; Base n =772indicates statistically significant difference compared to respondents not in that category
Rider training courses As in 2013, the proportion of respondents in 2014 who indicated they were taught to ride by an accredited riding instructor/by doing a learners’ course was lower compared with the aggregate proportions nominated by respondents from a specific list of courses (listed in Table 14 below). In 2014, while 30% said they were taught to ride by an accredited instructor, a total of 56% reported having undertaken some sort of formal training when asked which specific rider training courses they had attended. This suggests that while they had attended a course, this was not where they had learnt to ride.
Overall, in 2014, one in three mentioned that they specifically went to a learners’ course e.g. Stay Upright (33% vs. 37% in 2013). A HART course was mentioned by 17% of respondents in 2014. Five percent (5%) specifically mentioned attending a DECA course and 8% had reported attending an advanced rider training course.
Table 13: Rider training courses attended - 2013 vs. 2014
% 2013 % 2014
Learners’ course (e.g. Stay Upright) 37 33
HART course 14 17
Track day riding courses 8 5
Advanced rider training 8 8
DECA course 7 5
Other 3 3
Australian Superbike School 3 1
None of the above 41 44
Subtotal - Attended rider training course 59 56
Q13. Have you ever done any of the following motorcycle rider training courses? Total sample; Weighted sample; 2013 - Base n = 692, 2014 - Base n=779Multiple responses acceptedindicates statistically significant difference compared to respondents not in that category
As Table 14 shows, female riders were more likely than males to have attended a formal training course (75%). A high proportion of 26-39 year olds were also likely to have undertaken a riding course compared with those aged 40 or older (78% vs. 46%).
Transport Accident CommissionMotorcycle Monitor 2014 | Page 33

Table 14: Rider training courses attended by selected demographic variables - 2014
Column % Gender Age Location Total(n=783)Male
(n=630)Female(n=151)
18-25(n=211)
26-39(n=226)
40+(n=342)
Balance of Victoria(n=357)
Melbourne(n=426)
Subtotal - Attended rider training course 53 75 68 78 46 43 63 56
Learners’ course (e.g. Stay Upright) 31 47 50 49 25 25 37 33
HART course 15 29 11 25 15 6 23 17
DECA course 5 8 11 7 4 11 2 5
Track day riding courses 5 3 4 6 4 2 6 5
Advanced rider training 7 9 6 8 8 4 10 8
Australian Superbike School 1 0 2 1 1 0 2 1
Other 3 4 2 1 4 2 4 3
None of the above 46 24 29 22 53 57 36 44
Q13. Have you ever done any of the following motorcycle rider training courses? Total sample; Weighted sample; Base n = 783indicates statistically significant difference compared to respondents not in that category
Half (50%) of those who had experienced a crash in the past had undertaken a rider training course of some sort. Those aged between 26-39 years and had experienced a crash were significantly more likely to have attended a rider training course than those aged 40+ who had also experienced a crash, as seen below in Table 15. This is likely to be a reflection of younger riders being more likely to have attended a course of some sort, and courses, particularly for learners, becoming more common in recent years (See Figure 13).
Table 15: Crash involvement among those who had or had not undertaken rider training
Column % Involved in crash by age TOTAL(n=310)18-25
(n=72)26-39 (n=85)
40+(n=152)
Attended rider training course 63 75 41 50
Did not attend riding training course 36 25 59 50
Q13. Have you ever done any of the following motorcycle rider training courses? Q56 Have you ever had a crash while riding a motorcycle?Filter: Experienced a crash; Weighted sample; Base n = 310 indicates statistically significant difference between those who attended a riding training course or not
Transport Accident CommissionMotorcycle Monitor 2014 | Page 34

Eight in ten (80%) respondents who obtained their licence from 2010 to 2014 reported they had attended a training course of some sort (See Figure 13).
Figure 13: Rider training courses attended by year full licence attained
80
58
21
10
1210
20
40
60
80
100
1979 or earlier(n=183)
1980-1989 (n=120) 1990-1999 (n=140) 2000-2009 (n=181) 2010-2014(n=152)
%
Year learnt to ride
Subtotal - Attended a trainingcourse
Learners’ course (e.g. Stay Upright)
HART course
DECA course
Track day riding courses
Advanced rider training
Australian Superbike School
Other
Q13. Have you ever done any of the following motorcycle rider training courses? By year first learnt to rideTotal sample; Weighted sample; Base n = 778
Transport Accident CommissionMotorcycle Monitor 2014 | Page 35

Attitudes towards riding training courses after a breakRespondents were asked their views on training courses for those who had had a break from riding. While respondents tended to agree that people returning to riding after a break should have to undertake a motorcycle training course, there was a decrease in 2014 with two-fifths (41%) of respondents agreeing strongly or somewhat (compared to 54% in 2013). However, when looking at riding history, it should be noted that there has been an increase in those who had been on a break but had returned to riding in 2014 compared to 2013 (17% compared to 9%) (See Section 5.1).
Recreational off-road riders were significantly more likely to strongly disagree (26%) returning riders should undertake a training course compared to recreational on-road riders (17%) or commuters (16%). Similarly, looking at the type of bike itself, those who mainly rode an off-road bike/trail bike were significantly more likely to be opposed to this with 27% strongly disagreeing compared to 15% and 16% of road bike and scooter owners respectively.
There were no differences in opinion in terms of age, gender or place of residence.
Figure 14: Agree/disagree: People returning to riding after a break should have to undertake a motorcycle training course – 2013 vs. 2014
29
13
25
28
13
12
17
26
16
20 1
0 20 40 60 80 100%
Strongly agree Somewhat agree Neither Somewhat disagree Strongly disagree Don’t know
2013
2014
Q55h. Agree/disagree: People returning to riding after a break should have to undertake a motorcycle training course Base: Those who have ridden in the last 12 months; Weighted sample; 2014 Base n =572; 2013 Base n=491
Transport Accident CommissionMotorcycle Monitor 2014 | Page 36
5. Riding activityThis section covers riding activity including recent riding behaviour, riding history and reasons for riding.
As with the previous surveys, the majority of respondents had ridden a motorcycle in the last 12 months (62% in 2014 compared to similar proportions in 2013 at 57%). Those aged 18-25 were more likely to have done so than those who were older (90% of 18-25 year olds had ridden in the last year). No longer owning a motorcycle, family commitments and/or changes in lifestyle were the most common reasons for not riding in the last 12 months. Those who had stopped riding, on average, did so at the age of 36 years old.
In comparing riding activity of respondents between in 2013 and 2014, there was a significant increase in respondents who were actively riding – on par with proportions in 2012 (55% in 2014, vs. 42% in 2013 vs. 55% in 2012) with the overall mix of riding activity similar to that in 2012. With the increase in those actively riding in 2014, there was a corresponding decrease in those classified as former riders (5% vs. 10% in 2013) or lapsed riders (40% vs. 48% in 2013) (i.e. those who had stopped riding and did not intend to ride in the future or they had stopped riding but may decide to ride again in the future respectively). Lapsed riders tended to report a high likelihood of getting on the bike again (with 56% providing a 7-10 out of 10 on a 0-10 likelihood scale).
Recreational on-road riding remained the most common riding purpose, with a lower number of respondents saying they rode recreationally off-road compared to 2014 (43% vs. 54% in 2013).
In 2014, around half of respondents said they had ridden up to an average of 500km in a month (56%). The average distance travelled per month was 416.4km per month or approximately 4996.4km in the last year.
5.1 Riding history
Riding activity in last 12 monthsA similar proportion of respondents said they had ridden in the last 12 months in 2014 compared with 2013 (62% vs. 57%).
Figure 15: Whether ridden in last 12 months – 2012-2014
71
29
2012
Yes
No
57
43
2013
Yes
No
62
38
2014
Yes
No
Q7 Have you ridden a motorcycle in the last 12 months (either on or off-road)?Filter: excludes never ridden a motorcycle; Weighted sample; 2012 Base n =545; 2013 Base n = 694; 2014 base n = 777
Transport Accident CommissionMotorcycle Monitor 2014 | Page 37

Respondents aged 18-25 were most likely to have ridden in the last 12 months (95%). Two-thirds of respondents aged 26-39 also had ridden in the last 12 months (65%). A large proportion (95%) of those on their L or P plates also reported having ridden in the last 12 months.
Figure 16: Whether ridden in last 12 months by selected rider groups – 2014 only
5
35
41
5
39
38
95
65
59
95
61
62
Age:
18-25 years (n =210)
26-39 years (n =226)
40+ years (n =337)
Licence Status:
Learner/ Probationary (n =167)
Full licence (n =590)
Total (n =774)
No Yes
Q7 Have you ridden a motorcycle in the last 12 months (either on or off-road)?Filter: excludes never ridden a motorcycle; Weighted sample; Base n = 777
Transport Accident CommissionMotorcycle Monitor 2014 | Page 38

Riding historyIn 2014, over half of respondents (58%) were either occasional or regular riders; or had returned to riding after a break compared to 43% in 2013 and 57% in 2012. Specifically, 20% reported they had never had a break from riding since learning to ride and ride regularly in 2014. Just over one in five (21%) had never had a break from riding since learning to ride but said they only ride occasionally.
As seen in Figure 17, respondents in 2014 were less likely to report they had stopped riding but may decide to ride in future (37% vs. 46% in 2013).
There was also a decrease in those who said they had stopped riding altogether and did not see themselves riding again in the future compared to 2013 (5% vs. 10% in 2013).
Figure 17: Riding history - 2012-2014
16
24
16
35
7
1
16
18
9
46
10
1
20
21
17
37
5
0
I have never had a break from riding sincelearning to ride and ride regularly
I have never had a break from riding sincelearning to ride but only ride occasionally
I had a break from riding and have started ridingagain
I have stopped riding and may decide to ride infuture
I have stopped riding and do not intend to rideagain
I have never ridden a motorcycle
2012
2013
2014
Q10. Which of the following best describes your motorbike riding history?Total sample; Weighted; Base 2012 n = 545; 2013 n=692; 2014 base n = 776
Length of break from ridingAmong those who had stopped riding, the average age respondents stopped riding at was 36.1 years old.
Those who had taken a break from riding and had started riding again were asked how long their most recent break had been. In 2014, just under one in five (18%) said their break was under a year in duration. Just over one in ten (12%) reported that the duration of their most recent break was between one and two years, followed by 30% who had had a longer break of between three and five years. Two-fifths (40%) reported a break of six years or longer.
Transport Accident CommissionMotorcycle Monitor 2014 | Page 39

Figure 18: Duration of most recent break from riding - 2014 only
18
12
30
40
0
20
40
60
80
100
Up to 11 months 1-2 years 3-5 years 6 years or more
%
Q7B. You have said you had a break from riding and had started riding again. Approximately, how long was your most recent break?Total sample; Weighted sample; Base n = 114;
While samples sizes for some of the sub-groups were small, females, those aged 18-25 and those aged 26-39 who were on a break were most likely to have had a break of less than an year (46% and 54% and 36% respectively). Males (43%) and those who were aged 40 or older (52%) were more likely to report that their most recent break was 6 years or longer (See Table 16.
Table 16: Most recent break from riding – by demographic groups
Column % Gender Age Location
Male (n=91)
Female (n=23)*
18-25 (n=22)*
26-39 (n=30)*
40+ (n=62)
Balance of Victoria (n=49)
Melbourne (n=65)
Up to 11 months 15 46 54 36 11 23 16
1-2 years 12 8 18 14 11 17 9
3-5 years 30 33 28 48 26 16 37
6 years or more 43 13 0 2 52 43 38
Q7B. You have said you had a break from riding and had started riding again. Approximately, how long was your most recent break?Total sample; Weighted sample; Base n = 114; indicates statistically significant difference compared to respondents not in that category* Note: Small sample sizes
Respondents who had not ridden in the last twelve months or had stopped riding but reported they may resume in the future were asked how likely it was that they would ride again. The overall sentiment was that respondents who had quit riding thought there was a good chance they would ride again in the future. More than half (56%) reported a high likelihood of between seven and ten (on a 0-10 scale). Just over one in five (23%) reported extremely low likelihoods (0-3
Transport Accident CommissionMotorcycle Monitor 2014 | Page 40

out of 10) of getting on a motorcycle again. An almost equal proportion (19%) of respondents elected a moderate likelihood (4-6 out of 10). This distribution is unchanged from results from 2013.
Figure 19: Likelihood of lapsed riders to ride again in the future - 2014
23 19 56 3
0 20 40 60 80 100
2014
%
0-3 out of 10 4-6 out of 10 7-10 out of 10 Dont know
Q7A. What is the likelihood that you will ride again in the future?Base: Stopped riding but may ride again in the future or not ridden in the last 12 months Weighted sample; Base n = 187
A lower proportion of those aged 40 or over indicated a high likelihood of returning to their bike (50% reported a likelihood of 7-10 out of 10 compared to 68% of 18-25 year olds and 67% of 26-39 year olds). Notably, although the sample size was small, the average likelihood ‘score’ for those aged 18-25 was 8.5 out of 10.
Table 17: Likelihood of lapsed riders to ride again in the future by demographic groups
Column % Gender Age Location
Male (n=151)
Female (n=40)
18-25 (n=19)
26-39 (n=74)
40+ (n=98)
Melbourne (n=105)
Balance of Victoria (n=86)
Total (n=191)
0-3 out of 10 22 29 0 17 26 22 24 23
4-6 out of 10 20 11 26 13 21 18 23 19
7-10 out of 10 55 59 68 67 50 57 52 56
Don’t know 3 1 6 2 3 3 1 3Average out of 10 6.5 6.0 8.5 7.2 6.0 6.5 6.1 6.4
Q7A. What is the likelihood that you will ride again in the future?Base: Stopped riding but may ride again in the future or not ridden in the last 12 months Weighted sample; Base n = 191indicates statistically significant difference compared to respondents not in that category
Transport Accident CommissionMotorcycle Monitor 2014 | Page 41

Reasons for no longer riding a motorcycleAmong those who had not ridden in the last 12 months but had not ruled out riding again, the most common reasons in both 2013 and 2014 were no longer owning a motorcycle (65% vs. 69% in 2013); and family commitments or a change in lifestyle (47% vs. 42% in 2013) (See Figure 20).
Figure 20: Main reasons why lapsed riders have not ridden a motorcycle in the last 12 months
6
0
0
2
2
4
4
4
7
16
22
47
65
7
3
1
6
7
4
4
2
6
17
21
42
69
9
5
0
2
5
2
9
2
6
22
20
54
61
0 10 20 30 40 50 60 70
Other
Too old/no longer skilled enough/safety issues
Licence suspended
Went overseas/holiday
Motorcycle related injury
Motorcycle broken down
Moved locations, so became too far to ride
Non-motorcycle related injury
Too expensive to maintain a motorcycle
Prefer to travel using other modes (drive, cycle,public transport etc.)
Too busy/never have time to ride
Family commitments/change in lifestyle
No longer own a motorcycle
2012
2013
2014
Q9. What are the main reasons why you haven’t ridden a motorcycle in the last 12 months? Multiple responses Filter: Not ridden in last 12 months but may ride again; Weighted; 2012 base n = 89; 2013 base n=164; 2014 base n = 163
Females were more likely than males to nominate family commitments/change in lifestyle as a reason for not riding in the last 12 months (66% compared to 43% of males).
Transport Accident CommissionMotorcycle Monitor 2014 | Page 42

While sample sizes were small, a motorcycle related injury was more likely to be a reason amongst younger riders (15% for those aged 18-25 compared to 3% for those aged 26-39 and 2% for those aged 40+.
Table 18: Main reasons why lapsed riders have not ridden a motorcycle in the last 12 months
Column % Gender Age Location
Male (n=126)
Female (n=37)
18-25 (n=8)*
26-39 (n=55)
40+ (n=98)
Melbourne (n=76)
Balance of Victoria (n=87)
No longer own a motorcycle 64 69 36 62 68 62 74
Family commitments/change in lifestyle 43 66 0 46 49 50 39
Too busy/never have time to ride 24 14 0 19 22 23 21
Prefer to travel using other modes (drive, cycle, public transport etc.) 14 25 0 12 18 16 15
Too expensive to maintain a motorcycle 6 11 12 7 7 6 9
Went overseas/holiday 2 0 9 5 1 2 1
Motorcycle related injury 3 1 15 3 2 2 3
Motorcycle broken down 4 2 20 2 5 4 3
Too old/no longer skilled enough/safety issues 0 0 0 0 0 0 0
Moved locations, so became too far to ride 3 5 0 9 2 4 2
Non-motorcycle related injury 4 0 0 3 4 5 0
Licence suspended 0 0 0 0 0 0 0
Other 5 8 25 10 4 7 3
Q9. What are the main reasons why you haven’t ridden a motorcycle in the last 12 months? Multiple responses Filter: Not ridden in last 12 months but may ride again; 2014 base n=161 to 163*Note: Small sample size
Among the small number of those who had stopped riding but were not planning to take it up again in the future (n=31) the most common reasons were similar. More than one third in three mentioned safety concerns (34%) family commitments/change in lifestyle (26%), and a preference for different modes of transport (26%). Twenty two percent (22%) mentioned no longer interested in riding/motorcycles.
Transport Accident CommissionMotorcycle Monitor 2014 | Page 43

5.2 Riding activity segmentsUsing the data on recent riding behaviour and riding history, respondents can be classified into three riding activity groups:
● “active riders”● “lapsed riders” or ● “former riders”.
Compared to 2013, there seems to have been a shift from respondents being classified as lapsed riders and an increase in active riders in the mix. Overall, the riding population in 2014 has a similar make-up to that in 2012.
In 2014, more than half of respondents would be classified as “active riders” - that is they had ridden in the last 12 months either regularly or occasionally or had started riding again after a break (55% - significantly higher than the 42% in 2013).
“Lapsed riders” made up 40% of all respondents in 2014 (significantly lower than the 48% in 2013 but similar to the 37% reported in 2012). Lapsed riders were respondents who said they had stopped riding but may decide to ride again in the future or had not ridden in the last 12 months but still considered themselves ‘regular’ riders. This finding suggests that although someone with a motorcycle licence may not ride regularly; there is a substantial proportion who has not ruled out riding again in the future.
Only 5% of respondents could be considered as “former riders” - those who had stopped riding and did not intend to ride again in the future (10% in 2013 and 7% in 2012).
Figure 21: Riding activity segments - 2012-2014
7
3755
10
48
42
Former riders only
Lapsed riders only
Active riders only
5
4055
Former riders only
Lapsed riders only
Active riders only
40
50
10
Active riders
Lapsed riders
Former riders
2012 2013 2014
Q10 Which of the following best describes your motorbike riding history?Q7 Have you ridden a motorcycle in the last 12 months (either on or off-road)?All respondents; Weighted; 2012 base n = 545; 2013 base n=690; 2014 base n = 774
Transport Accident CommissionMotorcycle Monitor 2014 | Page 44

Figure 22 below, highlights some of the differences observed between the riding activity segments in 2014. This includes higher proportions of active riders among:
● those aged 18-25 (86% vs. 53% of those aged 26-39 and 54% of those aged 40 or older);● learner/probationary licence holders (84% compared to 54% of full licence holders); and
Lapsed riders were more prevalent among full licence holders (41%) and those who lived in Melbourne (44%).
Figure 22: Riding activity segments by selected rider characteristics - 2014
0
86
53
54
60
52
84
54
0
14
45
39
32
44
15
41
0
1
2
7
8
4
0
5
Age:
18-25 years (n =210)
26-39 years (n =225)
40+ years (n =335)
Location:
Balance of Victoria (n =353)
Melbourne (n =421)
Licence:
Full (n =166)
Learner/Probationary (n =589)
%
Active riders only Lapsed riders only
58
39
74
58
53
55
89
83
91
33
87
32
35
54
24
38
38
38
10
16
8
55
12
56
7
8
2
4
9
8
1
1
1
12
1
12
Gender:
Male (n=460)
Female (n=85)
Age:
18-25 years (n=168)
26-39 years (n=178)
40+ years (n=199)
Licence:
Full (n=478)
Learner/Probationary (n=56)
Registration/licence status (VicRoads - June 2011):
Registration only (n=50)
Registration and licence (n=231)
Licence only (n=264)
Motorcycle linked to home address (VicRoads - June 2011):
Yes (n=313)
No (n=232)
%
Active riders Lapsed riders Former riders
Q10 Which of the following best describes your motorbike riding history?Q7 Have you ridden a motorcycle in the last 12 months (either on or off-road)?Filter: Excluding never ridden a motorcycle; Weighted; Base n = 545
Many of the questions in the survey were directed to active riders, However, where relevant, results from the survey have also been analysed according to these riding activity segments.
Transport Accident CommissionMotorcycle Monitor 2014 | Page 45
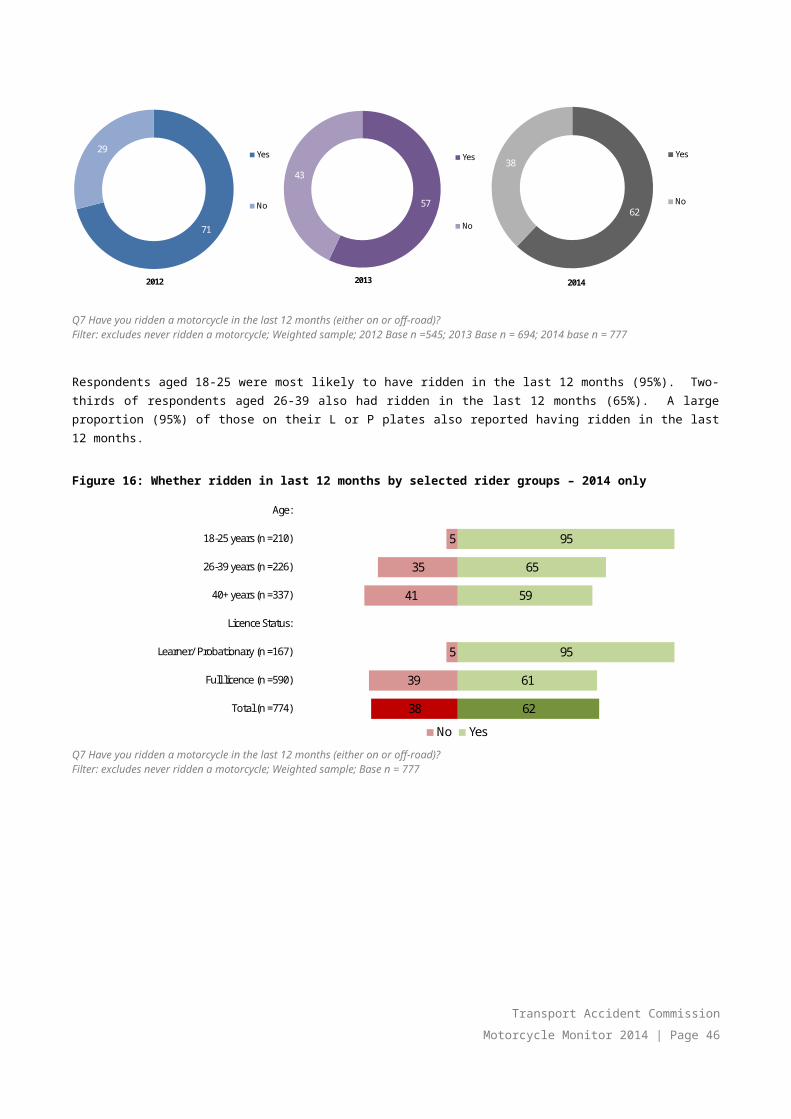
5.3 Riding vs. drivingIn 2014, respondents were asked the extent to which they agreed/disagreed with the statement: ‘Drivers don’t understand what it is like to be a motorcyclist’. The vast majority (86%) of respondents who had ridden in the last 12 months agreed (56% strongly agreed and 30% somewhat agreed). However, there has been a decrease in those who feel this way compared to 2013 where 92% agreed with this statement.
Those who lived in Melbourne were more likely to strongly agree than those living in regional areas (62% vs. 47%).
Figure 23: Agree/disagree: Drivers don’t understand what it’s like to be a motorcyclist – 2013 vs. 2014
61
56
31
30
3
6
3
2
2
4
0
1
0 20 40 60 80 100%
Strongly agree Somewhat agree Neither Somewhat disagree Strongly disagree Don’t know
2013
2014
2013
2014
2013
2014
61
56
31
30
3
6
3
2
2
4
0
1
0 20 40 60 80 100%
Strongly agree Somewhat agree Neither Somewhat disagree Strongly disagree Don’t know
2013
2014
2013
2014
2013
2014
61
56
31
30
3
6
3
2
2
4
0
1
0 20 40 60 80 100%
Strongly agree Somewhat agree Neither Somewhat disagree Strongly disagree Don’t know
2013
2014
2013
2014
2013
2014
Q55i. To what extent do you agree or disagree with the following statements – Drivers don’t understand what it is like to be a motorcyclist?Weighted; 2013 base n = 491, 2014 base n = 574
When asked whether they drivers were aware of motorcyclists when they were driving, views were mixed with half (50%) of respondents disagreeing with the statement and 43% of respondents agreeing with the statement.
Figure 24: Agree/disagree: Most drivers are aware of motorcyclists when they are driving – 2014
17 26 6 30 20 1
%
Strongly agree Somewhat agree Neither Somewhat disagree Strongly disagree Don’t know
Q55k. To what extent do you agree or disagree with the following statements – Most drivers are aware of motorcyclists when they are drivingWeighted; base n = 574
Transport Accident CommissionMotorcycle Monitor 2014 | Page 46

Data was also collected on the proportion of time respondents rode their motorcycle compared to driving a car (See Figure25). Only a small proportion of respondents relied solely on their motorcycles for transport – only 5% in 2014 said they rode their motorcycle more than 90% of the time. In fact, only one in four respondents in 2014 (27%) rode their motorcycle more than 20% of the time.
Figure 25: Proportion of time spent riding a motorcycle vs. driving a car - 2012-2014
65
108
4 3
10
64
12
7 62
8
60
13
84 3
12
0
10
20
30
40
50
60
70
Up to 10% 11-20% 21-30% 31-40% 41-50% 51% or more
2012
2013
2014
Q8. Thinking about your time spent riding and driving over the last 12 months, approximately what percentage of the time would you say you rode a motorcycle (on or off-road) compared to driving a car?Filter: Ridden in the last 12 months; Weighted; 2012 base n = 440, 2013 base n=493, 2014 base n = 582
Transport Accident CommissionMotorcycle Monitor 2014 | Page 47
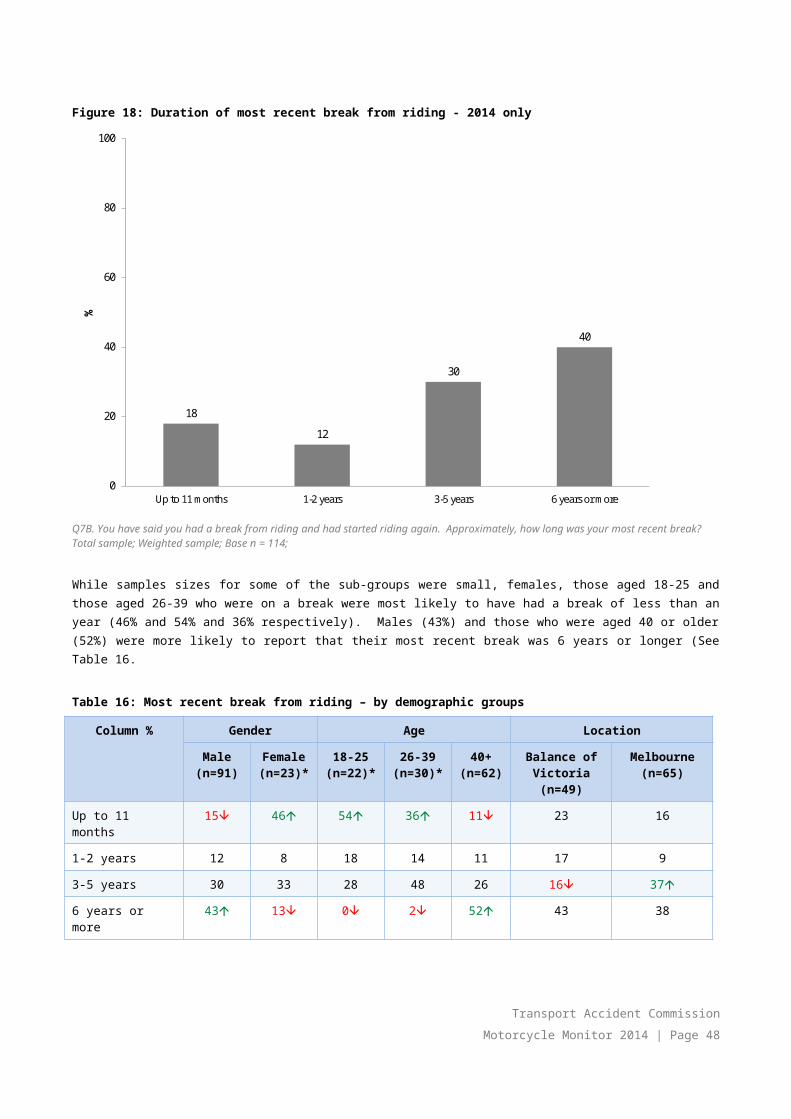
Figure 26 shows that the respondents who were significantly more likely to report they rode more than a fifth of the time in 2014 were aged between 18 and 25 (44%). Similarly, L/P licence holders were also more likely to say they rode more than 20% of the time compared to driving (38% vs. 26% of full licence holders).
Figure 26: Proportion of time spent riding a motorcycle vs. driving a car – differences between demographic groups – 2014
56
71
77
77
70
73
44
29
23
23
30
27
Age:
18-25 years (n =201)
26-39 years (n =168)
40+ years (n =212)
Location:
Balance of Victoria (n =254)
Melbourne (n =328)
Total (n =582)
20% or less More than 20%
56
71
77
77
70
73
44
29
23
23
30
27
Age:
18-25 years (n =201)
26-39 years (n =168)
40+ years (n =212)
Location:
Balance of Victoria (n =254)
Melbourne (n =328)
Total (n =582)
20% or less More than 20%
Q8. Thinking about your time spent riding and driving over the last 12 months, approximately what percentage of the time would you say you rode a motorcycle (on or off-road) compared to driving a car? Filter: Ridden in the last 12 months; Weighted; 2014 Base n =582*Note: Small sample size
Transport Accident CommissionMotorcycle Monitor 2014 | Page 48

Those who rode more than 20% of the time also included those who commuted (46%) or rode recreationally on-road (33%) or owned a scooter (67%) (See Figure 27). Those who owned a newer bike were also more likely to ride more often (43% of those who owned a bike made in 2010 or later).
Figure 27: Proportion of time spent riding a motorcycle vs. driving a car – differences between rider groups - 2014
100
94
71
100
0
83
68
33
73
0
6
29
0
100
17
32
67
27
Riding segment:
Former riders (n =3)
Lapsed riders (n =69)
Active riders (n =510)
Riding vs. Driving:
Ride 20% or less (n =387)
Ride more than 20% of the time (n =195)
Type of bike ridden most often:
Off road bike/trail bike (n =135)
Subtotal - Road bike (n =297)
Scooter (n =40)
Total (n =582)
20% or less More than 20%
100
94
71
100
0
83
68
33
73
0
6
29
0
100
17
32
67
27
Riding segment:
Former riders (n =3)
Lapsed riders (n =69)
Active riders (n =510)
Riding vs. Driving:
Ride 20% or less (n =387)
Ride more than 20% of the time (n =195)
Type of bike ridden most often:
Off road bike/trail bike (n =135)
Subtotal - Road bike (n =297)
Scooter (n =40)
Total (n =582)
20% or less More than 20%
Q8. Thinking about your time spent riding and driving over the last 12 months, approximately what percentage of the time would you say you rode a motorcycle (on or off-road) compared to driving a car? Filter: Ridden in the last 12 months; Weighted; 2013 Base n =440*Note: Small sample size
As would be expected, those who commuted on their motorcycle were most likely to say they rode more than 20% of the time compared to the time they spent driving. Recreational off-road riders were most likely to say rode 20% or less compared to the time they spent driving a car.
Table 19: Proportion of time spent riding a motorcycle vs. driving a car – differences between riding purpose
Commuter Recreational on-road rider
Recreational off-road rider
20% or less 54 67 81
More than 20% 46 33 19
Q8. Thinking about your time spent riding and driving over the last 12 months, approximately what percentage of the time would you say you rode a motorcycle (on or off-road) compared to driving a car? Filter: Ridden in the last 12 months; Weighted; 2013 Base n =440indicates statistically significant difference compared to respondents not in that category
Transport Accident CommissionMotorcycle Monitor 2014 | Page 49

5.4 Riding for commuting and recreational purposesActive riders were asked what type of riding they did in the last 12 months as a proportion of all the time they spent riding a motorcycle. Specifically, respondents were asked to provide the approximate proportions they spent riding for:
● commuting purposes (i.e. going to work, study, shops);● recreational purposes on-road (i.e. riding for leisure on public roads, highways, freeways); and● recreational purposes off-road (i.e. riding on tracks in national parks or on private property).
Respondents were grouped into three categories based on whether they had undertaken any riding for commuting, recreational on-road or recreational off-road riding in the previous year. The following section covers the prevalence of riding for commuting or recreational purposes (either on or off-road).
The majority of active riders in both 2013 and 2014 reported they rode recreationally on-road (79% in both years, a slight decline from 2012 (82%)). Compared to 2013, there has been a decrease in the proportion of respondents who said they rode recreationally off-road (43% vs. 54% in 2013), but the proportion of riders who ride recreationally off road is similar to 2012 (41%).
Figure 28: Proportion of respondents who commuted and/or rode recreationally in last 12 months - 2012-2014
44
82
41
55
79
5454
79
43
0
10
20
30
40
50
60
70
80
90
Commuter Recreational on-road Recreational off-road
Series1
Series2
Series3
2012
2014
2013
Q18 Approximately what percentage of the time did you ride in the following categories excluding any riding you might do for work purposes? Filter: Active riders excluding commuter/recreational riding response error; Weighted; 2012 base n = 354; 2013 base n=399; 2014 base n = 495Note: Does not add to 100% as respondents could ride with more than one purpose
Transport Accident CommissionMotorcycle Monitor 2014 | Page 50

Figure 29 shows the prevalence of the different combinations of riding purposes. The most common combination was commuting in conjunction with riding recreationally on-road (34%), followed by recreational off-road riding exclusively (19%).
Figure 29: Proportion of respondents who commuted and/or rode recreationally in last 12 months – riding purpose combinations
Recreational on-road riding79%
Commuting 54%
Recreational off-road riding
43%
34%
19%
12%
13%
2%
15%
4%
Q18 Approximately what percentage of the time did you ride in the following categories excluding any riding you might do for work purposes? Filter: Active riders excluding commuter/recreational riding response error; Weighted; Base n = 495
In 2014, there were some differences in the type of riding undertaken by different rider groups. These included (See Table 20):
● A higher incidence of on-road riding for recreational purposes among those aged over 40 years (56%) and those who rode less than 20% of the time (52%).
● A higher incidence of commuting by those:
o who lived in metropolitan Melbourne compared with those in regional Victoria (60% vs. 44%);
o who rode more than 20% of the time (51%).
● A higher incidence of recreational off-road riding among those who:
o were aged between 18-39 years (54%); and
o rode less than 20% of the time (49%).
Transport Accident CommissionMotorcycle Monitor 2014 | Page 51
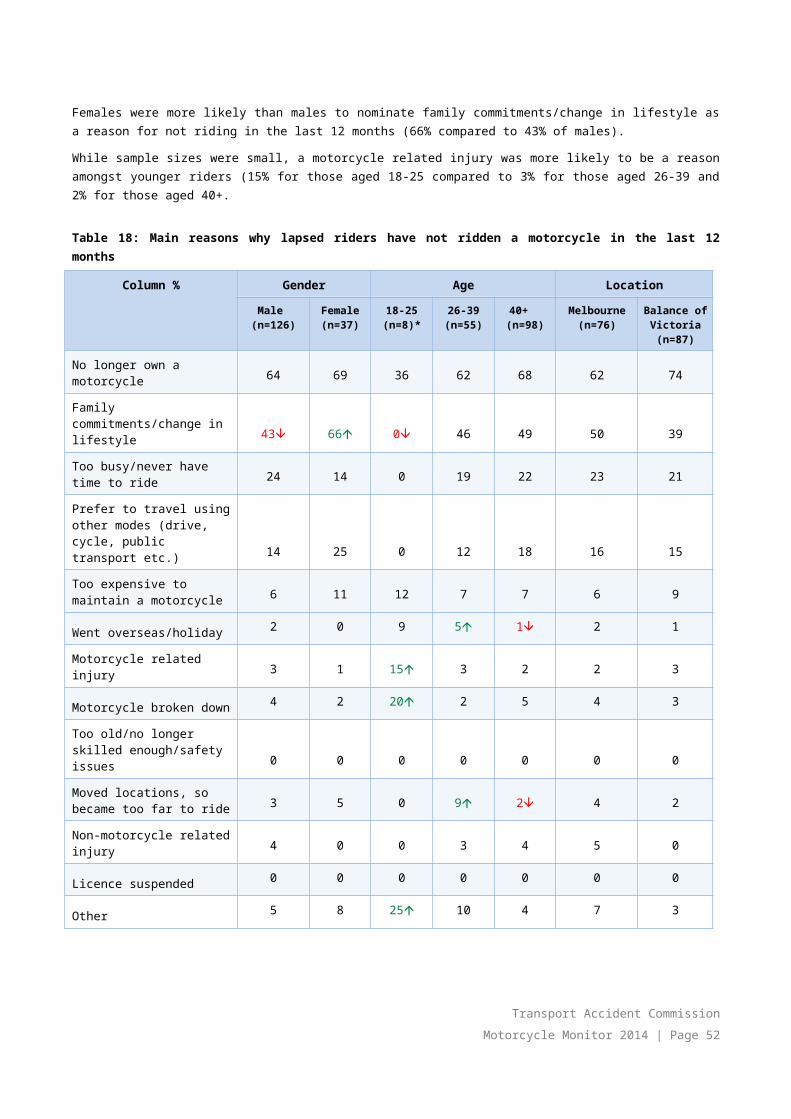
Table 20: Proportion of respondents who commuted and/or rode recreationally in last 12 months – by selected demographic variables - 2014
Row % Commuter Recreational on-road rider
Recreational off-road rider
Gender
Male (n=399) 54 80 44
Female (n=95) 49 65 33
Age
18-25 (n=184) 67 75 56
26-39 (n=135) 49 72 53
40+ (n=175) 53 82 37
Location
Melbourne (n=207) 60 81 42
Balance of Victoria (n=288) 44 75 44
Q18 Approximately what percentage of the time did you ride in the following categories excluding any riding you might do for work purposes? Filter: Active riders excluding commuter/recreational riding response error; Weighted; Base n =494 to 495indicates statistically significant difference compared to respondents not in that category i.e. between Melbourne and the balance of Victoria
Transport Accident CommissionMotorcycle Monitor 2014 | Page 52

Share of time spent riding for commuting or recreational purposes among active ridersFigure 29 showed the proportion of respondents who did each of the three types of riding, Figure 30 below shows the proportion of time spent doing each. On average, 29% of the time riding was spent riding recreationally off-road (vs. 34% in 2013). The average amount of time spent riding for commuting purposes was just under a quarter of the time (24%). There were no significant differences between the time spent riding in 2013 and 2014.
Figure 30: Average proportion of time spent commuting vs. riding recreationally in last 12 months - 2012 vs.2013 vs. 2014
24
52
24
2012
Commuting purposes
Recreation on-road
Recreation off-road
26
40
34
2013
Commuting purposes
Recreation on-road
Recreation off-road
24
47
29
2014
Commuting purposes
Recreation on-road
Recreation off-road
Q18 Approximately what percentage of the time did you ride in the following categories excluding any riding you might do for work purposes? Filter: Active riders excluding commuter/recreational riding response error; Weighted; 2012 base n = 354; 2013 base n=399; 2014 base n = 495
In 2014, those aged 40 years or older spent a significantly higher proportion of riding time riding on-road for recreation than younger riders (56% vs. 32% of 18-39 year-olds) (See Table 21).
Transport Accident CommissionMotorcycle Monitor 2014 | Page 53

Other differences in the average time spent riding for different purposes included a higher incidence of:
● commuting among those who lived in Melbourne compared with those who lived in other areas of Victoria (29% vs. 17%); and
● off-road recreational riding among: those aged 26-39 years compared with those aged 40 and over and those aged 18-25 combined (39% vs. 25%).
Table 21: Average proportion of time spent commuting vs. riding recreationally in last 12 months by demographic characteristics - 2014
Average % (row) Commuter Recreational on-road rider
Recreational off-road rider
Age
18-25 (n=184) 34 33 34
26-39 (n=135) 29 32 39
40+ (n=175) 20 56 24
Location
Balance of Victoria (n=207) 17 52 31
Melbourne (n=288) 29 44 28
Q18 Approximately what percentage of the time did you ride in the following categories excluding any riding you might do for work purposes? Filter: Active riders excluding commuter/recreational riding response error; Weighted; Base n = 494 to 495indicates statistically significant difference compared to respondents not in that category i.e. between male and femaleNote: Table adds across. Where totals do not add to 100%, this is due to rounding.
In terms of riding experience, full licence holders were more likely to spend more time riding recreationally on-road than learner/probationary licence holders (49% of the time riding vs. 37%). Those who had started riding at a young age were more likely to say they spent more time riding off-road than commuting or riding on road (50% of the time compared to 16% and 34% commuting or riding on road). Those who started riding at 26 or older tended to spend the least amount of time riding off-road (16% of the time).
Table 22: Average proportion of time spent commuting vs. riding recreationally in last 12 months by rider experience characteristics
Average % (row) Commuter Recreational on-road rider
Recreational off-road rider
Motorcycle licence
Learner/Probationary (n=141) 34 37 29
Full licence (n=347) 23 49 28
Age when started riding
up to 10 years 16 34 50
11-17 years 21 53 26
18-25 years 29 46 25
26 or older 34 50 16
Transport Accident CommissionMotorcycle Monitor 2014 | Page 54

Q18 Approximately what percentage of the time did you ride in the following categories excluding any riding you might do for work purposes? Filter: Active riders AND Excluding commuter/recreational riding response error; Weighted; Base n = 493indicates statistically significant difference compared to respondents not in that category i.e. between learner and probationary and full licence holders
There were also some differences in the amount of time spent riding for recreational or utilitarian purposes by the number of bikes kept at home, main type of bike ridden, engine capacity of the bike and registration type. Those who were more likely to spend their time commuting included those who own a scooter (60% of the time).
Those who were more likely to spend their time riding recreationally on-road included:
● those who own a road bike (63% of the time);● those who have a bike with an engine capacity of 701+ cc (73%); and● those whose main bike was road registered (58%).
Those who spent more of their time riding recreationally off-road included those who:
● own an off-road/trail bike (88%); and● have a recreational/farm bike registration (83%); or● have not registered their bike (77% although the sample size was small (n=19)).
Table 23: Average proportion of time spent commuting vs. riding recreationally in last 12 months by motorcycle ownership characteristics
Average % (row) Commuting Recreational on-road riding
Recreational off-road riding
Number of bikes kept at home
None (n=43) 11 39 51
One only (n=229) 32 49 19
2 or more (n=223) 18 47 35
Type of bike (main bike ridden)
Off road/ trail bike (n=125) 8 10 82
Road bike (n=227) 28 63 8
Scooter (n=37) 54 45 0
Engine capacity (main bike ridden)
Up to 250cc (n=171) 32 27 41
251-700cc (n=150) 26 31 43
701+ (n=123) 20 73 7
Registration
Road (n=334) 29 58 12
Recreational/farm bike (n=67) 10 7 83
None (n=19)* 10 13 77
Q18 Approximately what percentage of the time did you ride in the following categories excluding any riding you might do for work purposes? Filter: Active riders AND Excluding commuter/recreational riding response error; Weighted; Base n = 398 to 495 indicates statistically significant difference compared to respondents not in that category*Note: Small sample size
Transport Accident CommissionMotorcycle Monitor 2014 | Page 55
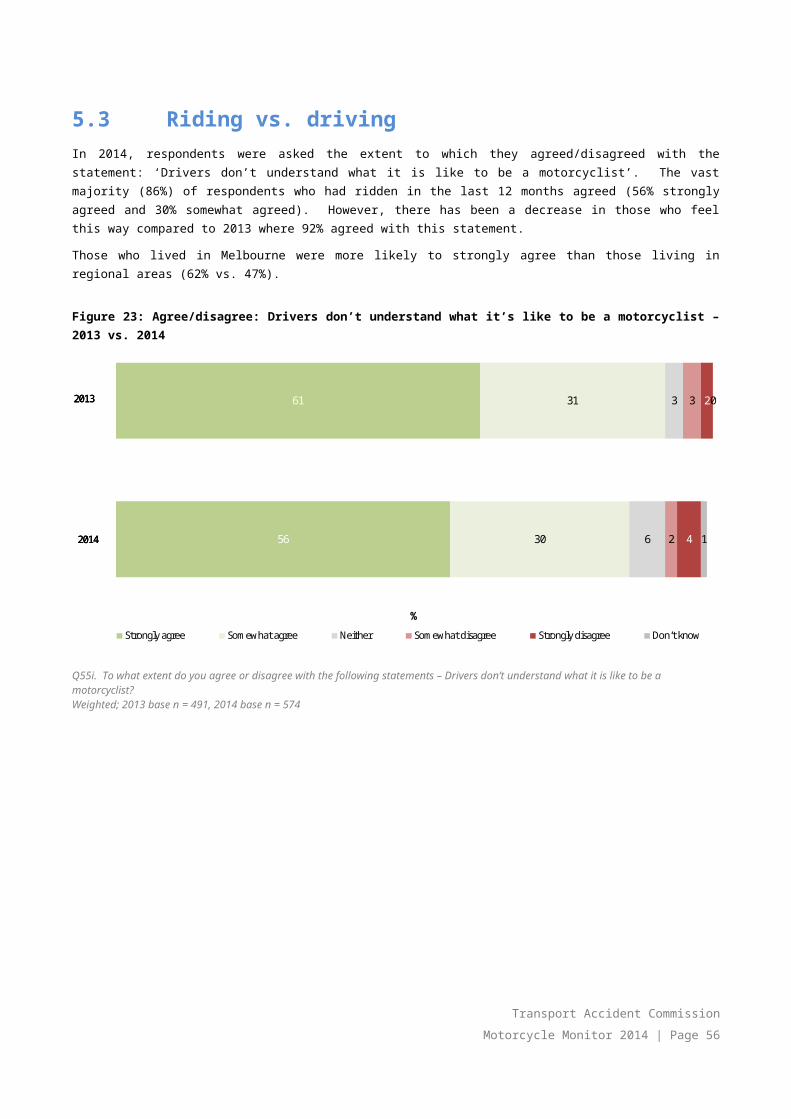
Recreational riding locations The most common areas to ride recreationally were on public roads in rural/non-built up areas (56%). Public roads in metropolitan areas were also popular (30%). Riding on private land was less common in 2014 compared to 2013 (22% vs. 32%).
Those in metropolitan Melbourne were more likely to say they rode in state/national parks (36% vs. 22% in regional Victoria). As expected, respondents in regional Victorian locations were less likely to report doing most of their recreational riding on public roads in metropolitan areas (24% and 40% respectively).
Table 24: Recreational riding locations - 2013 vs. 2014
% 2013 % 2014
Public roads in rural/non-built up areas 52 56
Public roads in metro areas 29 34
State/national parks 29 30
Private land 32 22
Other - 5
Q25. Where do you do most of your recreational riding (on-road or off-road)? Filter: Recreational riding on or off-road; Weighted; 2013 base n = 369, 2014 base n=480.indicates statistically significant difference compared to respondents not in that category
Preferences of off-road riding locations differed depending on the type of riding respondents had undertaken in the last year with private land and state/national parks more often frequented by those who had ridden off-road for recreational purposes (See Table 25).
Table 25: Recreational riding locations by riding purpose
Column % Commuter (n=270)
Recreational on-road rider
(n=376)
Recreational off-road rider
(n=233)
State/national parks 21 22 66
Private land 13 14 49
Public roads in metro areas 43 41 11
Public roads in rural/non-built up areas 61 67 33
Other 5 3 7
Q25. Where do you do most of your recreational riding (on-road or off-road)? Filter: Active riders; Recreational riding on or off-road; Weighted; Base n = 472 to 480indicates statistically significant difference compared to respondents not in that categoryNote: Commuters, on-road recreational and off-road recreational riders defined as riding for this purpose at least 1% of the time in the last 12 months
Transport Accident CommissionMotorcycle Monitor 2014 | Page 56

Riding with othersIn addition to exploring where riders did most of their recreational riding (on or off-road); respondents were asked about whether they mainly rode on their own or with other people. Over a third (38%) mainly rode on their own, followed by three in ten (29%) who rode with two to three other people and just over one in five who rode with one other person (23%). These were similar to proportions in 2013.
Those who mainly rode an off-road bike were more likely to say they rode in a group compared to scooter or road bike riders (See Table 26).
Table 26: Whether ride with others when riding recreationally (on or off-road) with others - 2014
Type of bike
Column % Off road bike/trail bike
(n=123)
Road bike(n=264)
Scooter(n=29)
On your own 14 41 79
With 1 other person 22 23 17
With 2-3 other people 44 26 2
4 -6 other people 15 6 2
7 or more other people 4 2 0
Q25a. When riding recreationally (on-road or off-road), do you mainly ride? Filter: Recreational riding on or off-road; Weighted; Base n = 470indicates statistically significant difference compared to respondents not in that categoryNote: Commuters, on-road recreational and off-road recreational riders defined as riding for this purpose at least 1% of the time in the last 12 months
Transport Accident CommissionMotorcycle Monitor 2014 | Page 57
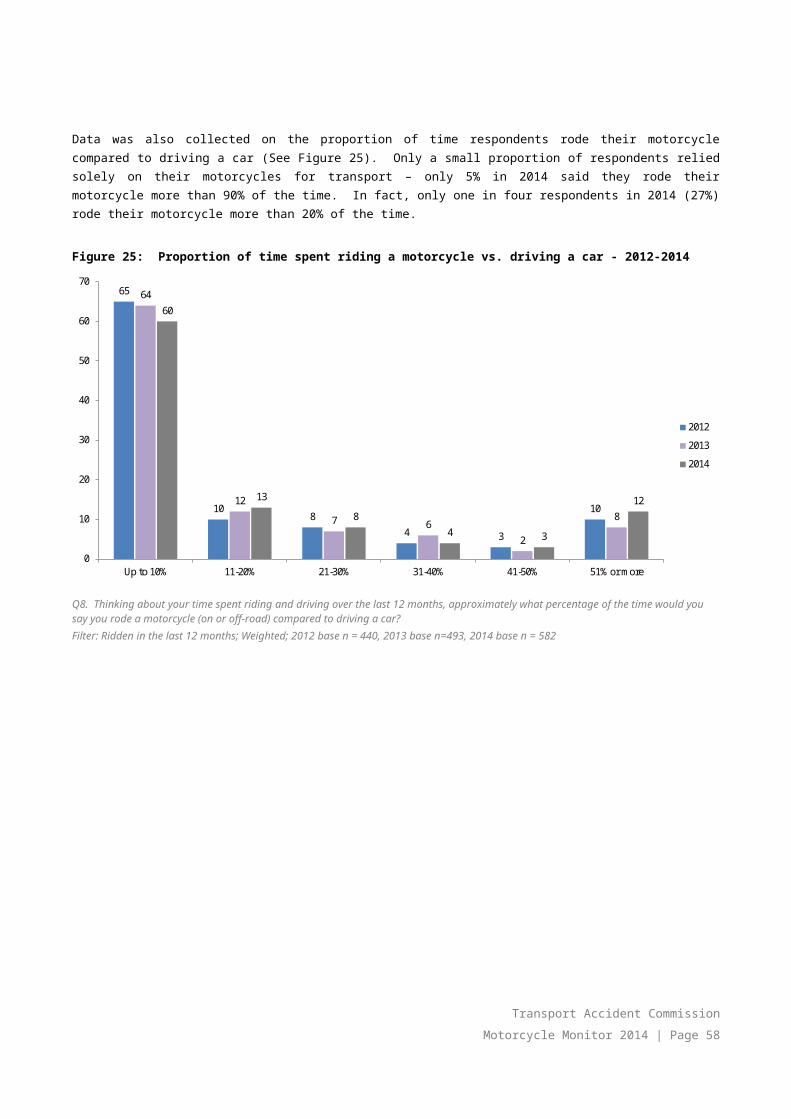
5.5 Distances ridden in last 12 monthsRespondents were asked to estimate the distances they had ridden on any motorcycle for any reason in the last 12 months. The distribution of approximate kilometres per month is shown in Figure 31. In 2014, most respondents rode up to 100km per month (28%) or 101-500km per month (28%). In 2013, 45% rode up to 100km per month in 2013.
Commuters and recreational on-road riders (38% and 37% respectively compared to 23% of recreational off-road riders) were more likely to travel distances between 101-500km per month. Close to one in five (18%) of those who commuted reported riding between 500-1000km per month.
Active riders were more likely to travel between 101 and 500km per month (30% vs. 12% of lapsed riders).
The average distance per year ridden by respondents was calculated to be an equivalent of 4996.4 km in a year or 416.4km per month. This was similar to that reported in 2013 (average of 4010.5 per year or 334.2 per month).
The median distance per month was calculated to be approximately 183km per month (meaning that half of respondents rode more than 183km per month and half of respondents rode less than this amount).
Figure 31: Distance ridden in last 12 months for any purpose – approximate km per month - 2012-2014
33
29
11
3
4
1
21
45
23
9
3
3
1
17
28
28
11
3
3
0
27
Up to 100km per month
101-500km per month
501-1,000km per month
1001-1,500km per month
1,501+
Out of range
Don`t know
2012
2013
2014
Q29. In the last 12 months, how many kilometres did you ride ON ANY motorcycle on the road for any reason? (Per week; per month or per year).Filter: Ridden in the last 12 months; Weighted; 2012 base n = 440, 2013 base n=496; 2014 base n = 583
On average, males tended to ride more kilometres than females (417.9 vs. 401km per month).
There was some correlation between types of riders and the approximate kilometres ridden per month which was reflected in the approximate distances travelled by riders of different types of bikes. For example, road bikes (approximately 534.8km per month) travelled significantly greater distances than off-road/trail bike riders (163.4km per month) and scooter riders (approximately 277.5km per month)
Commuters rode greater distances on average than recreational riders (538.4 km per month compared to 463.6km and 375.6km for recreational on-road and off road riders respectively) (See Figure 32).
Transport Accident CommissionMotorcycle Monitor 2014 | Page 58

Figure 32: Distance ridden in last 12 months – approximate km per month - 2014
163.4 (42)
534.8 (250)
277.5 (217)
215 (42)
437.4 (250)
458.5(233)
448.5 (233)
347.1 (208)
214.5 (83)
535.9 (250)
326 (173)
480.5 (250)
482.1 (250)
200.5 (208)
87.9 (42)
153.3(42)
29.9 (8)
173.3 (17)
439.1 (217)
216 (100)
863.5 (542)
538.4 (333)
463.6 (233)
375.6 (167)
416.4
Type of bike ridden most often:
Off road bike/trail bike( n =68)
Subtotal - Road bike( n =256)
Scooter( n =37)
Total number of bikes:
0( n =51)
One motorcycle( n =185)
Subtotal: 2 motorcycles or more( n =190)
Subtotal: At least 1 motorcycle( n =375)
Ownership:
Mine( n =107)
Owned by another person living in my household( n =46)
Engine capacity:
0-250cc ( n =139)
251-700cc ( n =114)
701+( n =114)
Registration:
Road registered( n =311)
Recreational registered( n =9)
Farm bike registered( n =23)
Not registered( n =11)
Riding segment:
Former riders( n =2)
Lapsed riders( n =39)
Active riders( n =385)
Riding vs. Driving
Ride 20% or less( n =262)
Ride more than 20% of the time( n =164)
Riding purpose
Commuter( n =259)
Recreational on-road rider( n =327)
Recreational off-road rider( n =151)
Average( n =426)
(Median km per month in brackets)
Q29. In the last 12 months, how many kilometres did you ride ON ANY motorcycle on the road for any reason? Filter: Ridden in the last 12 months; Weighted; Base n=426
Transport Accident CommissionMotorcycle Monitor 2014 | Page 59

Average distance ridden for commuting, on-road and off-road recreational purposes among active ridersRespondents were asked the distances travelled in the last 12 months for any purpose. Comparisons of total distance travelled among those who had done some commuting, or recreational riding in the last year is shown in Figure 33. Distance travelled per month tended to be higher where respondents reported they commuted at least some of the time.
Figure 33: Distance ridden in last 12 months – approximate km per month (mean and median)
599.5 (417)
168.8 (83)
382.7 (125)
295.1 (42)
573.5 (333)
268 (250)
131.1 (42)
538.4 (333)
463.6 (233)
375.6 (167)
439.1
0 100 200 300 400 500 600 700
Combination of all( n =83)
Commute only( n =21)
Recreational on-road riding only( n =57)
Recreational off-road riding only( n =20)
Commute & Recreational on-road riding( n =147)
Commute and Recreational off-road riding( n =8)
Recreational on-road & off-road riding( n =40)
Subtotal - Commuter( n =259)
Subtotal - Recreational on-road( n =327)
Subtotal - Recreational off-road( n =151)
Average( n =385)
Q29. In the last 12 months, how many kilometres did you ride ON ANY motorcycle on the road for any reason? (Per week; per month or per year).Filter: Active riders AND excluding commuter/recreational riding response error; Weighted; Total n = 376
Transport Accident CommissionMotorcycle Monitor 2014 | Page 60

Hours spent riding off-roadIn 2014, respondents who had ridden in the last year were asked how many hours they rode off-road for any reason. Over a third of these respondents (37%) said they had not ridden off road at all in the previous 12 months. More than one in four respondents (27%) stated they rode up to 8 hours off-road in a month. Another 12% reported riding 8-20 hours per month.
Figure 34: Hours spent riding off road – approximate hours per month (mean)
37
27
12
3
3
3
15
0 5 10 15 20 25 30 35 40
None
Up to 8 hours per month
8-20 hours per month
21-30 hours per month
31-49 hours per month
50 hours or more
Don't know/Can't say
Q29B. In the last 12 months, how many hours did you ride on any motorcycle off-road for any reason? An approximate number is OK.Filter: If ridden in the last 12 months AND excluding commuter/recreational riding response error; Weighted; Total n = 577
Those who started riding at age 26 or older were more likely to say they had not ridden off road at all in the last 12 months (53%). Among off road riders specifically, close to half (45%) reported they had ridden between 8-20 hours per month off-road. One in five (20%) of those who mainly rode an on-road bike also said they rode off-road around 8-20 hours per month.
Transport Accident CommissionMotorcycle Monitor 2014 | Page 61

5.6 Rider fatigueWhen asked about the extent that they agreed or disagreed that ‘the only remedy for fatigue while riding is to stop riding and rest’, a significant majority of respondents (80%) strongly agreed with this statement. Those aged 18-25 were less likely to ‘strongly agree’ (65% vs. 80% of those aged 26-39 and 83% of those aged 40+).
The majority also strongly agreed that riding while tired can be as dangerous as drink driving (66%).
Figure 35: Agree/disagree statements about fatigue - 2014
66
80
25
13
1
1
3
2
4
2
1
1
0 20 40 60 80 100%
Strongly agree Somewhat agree Neither Somewhat disagree Strongly disagree Don’t know
Riding while tired can be as dangerous as drink-
riding
The only remedy for fatigue while riding is to
stop riding and rest
\
66
80
25
13
1
1
3
2
4
2
1
1
0 20 40 60 80 100%
Strongly agree Somewhat agree Neither Somewhat disagree Strongly disagree Don’t know
Riding while tired can be as dangerous as drink-
riding
The only remedy for fatigue while riding is to
stop riding and rest
Q55f-g. Agreement/disagreement with statements about fatigue Weighted; Base n = 569 to 574
Respondents were asked what they would normally do if they were feeling drowsy when they were riding. The most common answer was to have a break or have a rest (66%) followed by pull over somewhere (51%). The vast majority (94%) of those who had ridden in the last 12 months mentioned stopping (including having something to eat or doing some exercise).
Table 27: Actions taken when feeling drowsy when riding a motorcycle - 2014
Column % %
Have a break/have a rest 66
Pull over somewhere 51
Take regular stops 42
Have something to eat or drink 41
Do some exercise 34
Stop riding 33
Subtotal: Mentions of stopping 94
Keep riding but more slowly 3
Keep riding to get to destination quicker then rest 2
Other 1
Q55ii. If you are feeling drowsy when riding a motorcycle, which of the following would you normally do?Base: Ridden in last 12 months - Weighted; Base n = 583
Transport Accident CommissionMotorcycle Monitor 2014 | Page 62

Females were more likely than males to say they would stop riding (50% compared to 31% of males).
Of note, those aged 18-25 were the least likely to say they would have a break or a rest (56% compared to 67% of those aged 26+) or say they take regular stops (27% compared to 44% of those aged 26+). This group was also more likely to say they would keep riding but more slowly (8%) or keep riding to get to destination quicker then rest (4%).
Respondents who had learnt to ride at an early age were also less likely to say they would stop riding (27% vs. 42% of those who had learnt to ride when they were 18 or older).
Table 28: Actions taken when feeling drowsy when riding a motorcycle by demographics
Column % Gender Age Location
Male (n=472)
Female (n=110)
18-25 (n=201)
26-39 (n=168)
40+ (n=213)
Melbourne (n=328)
Balance of
Victoria (n=583)
Have a break / have a rest 65 69 56 74 63 66 65
Pull over somewhere 51 53 48 53 51 49 53
Take regular stops 42 46 27 41 44 39 44
Have something to eat or drink
39 52 45 45 39 35 45
Do some exercise 33 42 26 30 37 35 33
Stop riding 31 50 30 42 29 28 36
Subtotal: Mentions of stopping
93 97 92 97 93 93 94
Keep riding but more slowly 3 3 8 4 2 1 5
Keep riding to get to destination quicker then rest
2 1 5 2 2 2 2
Other 1 3 4 1 1 1 1
Q55ii. If you are feeling drowsy when riding a motorcycle, which of the following would you normally do?Base: Ridden in last 12 months - Weighted; Base n = 583indicates statistically significant difference compared to respondents not in that category
Transport Accident CommissionMotorcycle Monitor 2014 | Page 63

6. Attitudes towards speeding and speeding behaviour
Respondents were asked a series of questions relating to their attitudes and behaviour in relation to speeding including questions about travel speed and being pulled over by police.
Close to one in five active riders said they had been pulled over by police in the last 12 months (16%).
When asked about their own speeding behaviour, six in ten (62%) reported that they would not ‘ride over the speed limit if I’m sure I’ll get away with it’. This has remained steady over the last 3 years of the Motorcycle Monitor.
When asked about speeding in a 60km zone, similar proportions of riders reported people should only ride up to 60kph in these areas as in 2013. Six in ten (58%) respondents nominated a speed limit of 60km or lower as the speed that people should be able to travel without being booked. Regardless of the speed they thought you should be able to travel before being booked, more than half (59%) of respondents said they would never ride above that speed in a 60km zone.
However, in 100km zones, fewer active riders nominated a speed of 100km or less in comparison to 2013 (46% vs. 58% in 2013). One in two respondents said they would never ride above their nominated speed.
Respondents were also less likely to report that they would never ride at or above their nominated speed in 100km zones compared to 60km zones (50% vs. 59%, although this pattern is consistent with previous years).
Speeding behaviourThose who had ridden in the last 12 months were asked the extent to which they agreed or disagreed with the statement: ‘I ride over the speed limit if I’m sure I’ll get away with it’.
Overall, respondents were most likely to say they disagreed with the statement – in other words they would not ride over the speed limit even if they could get away with it. Two in three (62%) of respondents in 2014 disagreed with the statement (this is on par with the 65% who disagreed in 2013) (See Figure 36).
Figure 36: Agree/disagree: I ride over the speed limit if I’m sure I’ll get away with it 2012-2014
45
47
41
20
18
21
15
17
16
16
15
15
3
3
6
1
1
1
0 20 40 60 80 100
2012
2013
2014
%
Strongly disagree Somewhat disagree Neither Somewhat agree Strongly agree Don’t know
45
47
41
20
18
21
15
17
16
16
15
15
3
3
6
1
1
1
0 20 40 60 80 100
2012
2013
2014
%
Strongly disagree Somewhat disagree Neither Somewhat agree Strongly agree Don’t know
45
47
41
20
18
21
15
17
16
16
15
15
3
3
6
1
1
1
0 20 40 60 80 100
2012
2013
2014
%
Strongly disagree Somewhat disagree Neither Somewhat agree Strongly agree Don’t know
Q55 To what extent do you agree or disagree with the following statements? I ride over the speed limit if I’m sure I’ll get away with it.Those who have ridden in the last 12 months; Weighted; 2012 Base n = 440; 2013 Base n= 489, 2014 Base n = 569
Transport Accident CommissionMotorcycle Monitor 2014 | Page 64
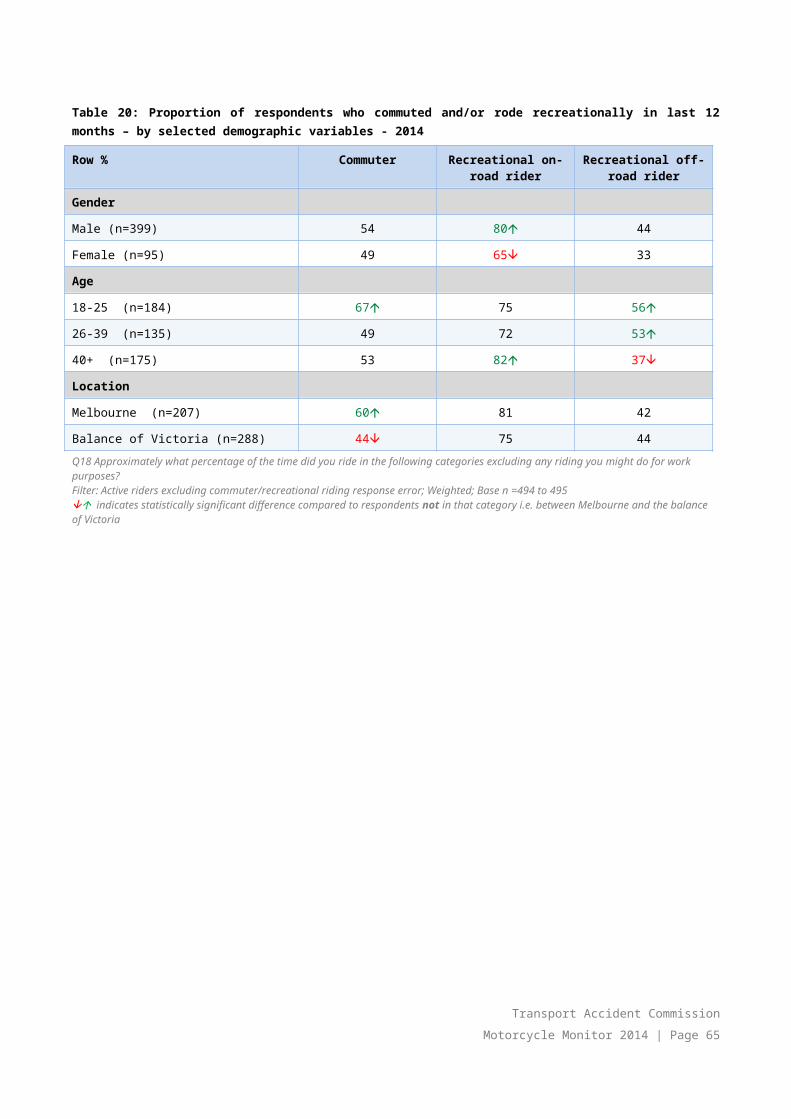
Female riders were significantly more likely to disagree with the statement (i.e. they would not ride over the speed limit even if they were sure they would get away with it) with 85% disagreeing compared to 60% of males. Notably, those aged 18-25 were also less likely to disagree (therefore they were less likely to say they would not ride over the speed limit if they were sure they could get away with it) (See Table 29).
Table 29: Agree/disagree: I ride over the speed limit if I’m sure I’ll get away with it by key demographic groups
Column % Gender Age
Male (n=458)
Female (n=110)
18-25 (n=199)
26-39 (n=167)
40+ (n=202)
Strongly/Somewhat disagree 60 85 51 68 62
Neither 18 6 17 01 19
Somewhat/Strongly agree 22 7 27 21 19
Don’t know 0 1 6 0 0
Q55 To what extent do you agree or disagree with the following statements? I ride over the speed limit if I’m sure I’ll get away with it.Weighted; Base n = 568 to 574
As to the type of bikes owned (Table 30), respondents who tended to say they would ride over the speed limit if they were sure they would get away with it included:
● Those with road bikes compared to scooter and off road bike/trail bike owners (27% agreed vs. 10% and 15% for scooters and off road bikes respectively); and
● Those who owned a motorcycle with an engine capacity of 701+cc (29% vs. 11% of those with 0-250cc bikes agreed and 23% of 251-700cc).
No significant differences were found by crash history at the aggregate level (Table 31); although those who had experienced a crash were less likely to strongly disagree with the statement (35% vs. 46%) i.e. they would not go over the limit if they could get away with it.
Table 30: Agree/disagree: I ride over the speed limit if I’m sure I’ll get away with it by type of bike
Column % Type of bike (main bike) Engine capacity
Off road bike/trail bike
(n=134)
Road bike (n=292)
Scooter (n=40)
0-250cc (n=194)
251-700cc (n=156)
701+cc (n=123)
Strongly/Somewhat disagree
65 56 79 73 60 51
Neither 20 16 11 16 16 20
Somewhat/Strongly agree 15 27 10 11 23 29
Don’t know 1 0 0 1 1 0
Q55 To what extent do you agree or disagree with the following statements? I ride over the speed limit if I’m sure I’ll get away with it.Those who rode in the last 12 months; Base n = 419 to 574
Transport Accident CommissionMotorcycle Monitor 2014 | Page 65
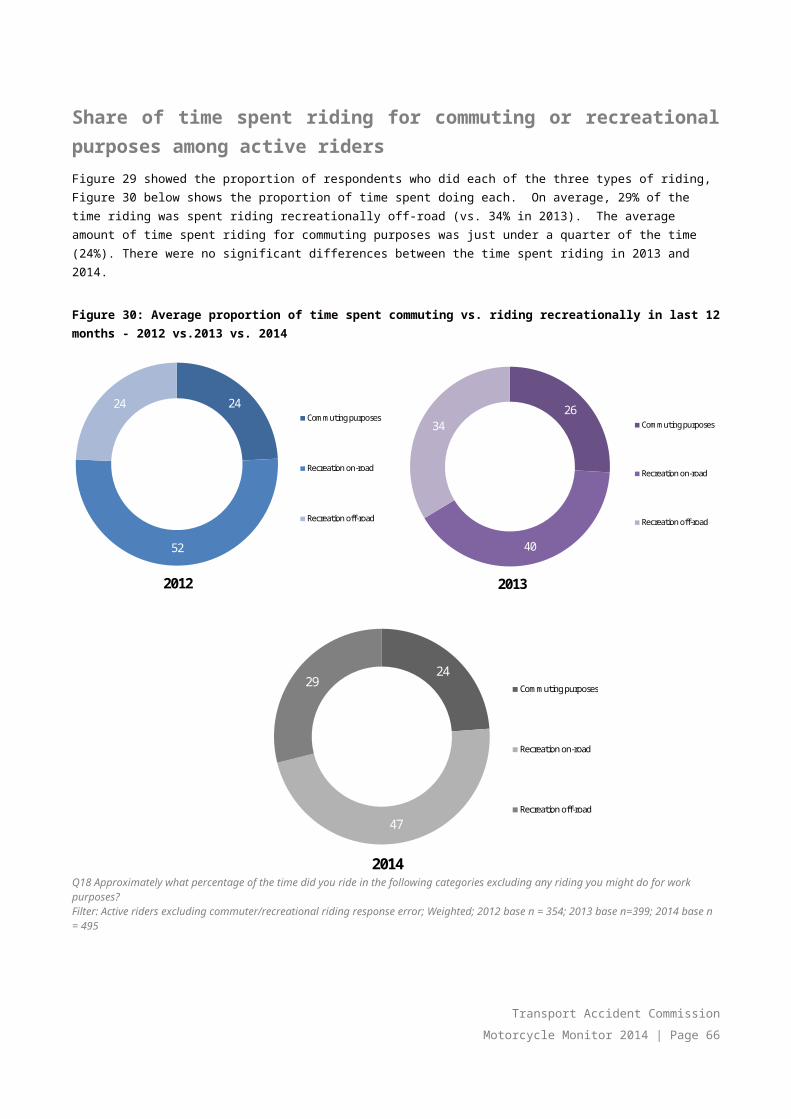
Table 31: Agree/disagree: I ride over the speed limit if I’m sure I’ll get away with it by crash history
Column % Crash while riding motorcycle
Yes (n=228)
No (n=337)
Strongly/Somewhat disagree 58 66
Neither 18 15
Somewhat/Strongly agree 23 18
Don’t know 1 0
Q55 To what extent do you agree or disagree with the following statements? I ride over the speed limit if I’m sure I’ll get away with it.Base n = 566 to 572
Whether pulled over by police in last 12 monthsSimilar proportions of respondents to both the 2013 and 2014 Motorcycle Monitor reported that they had been pulled over by police in the last 12 months. In 2014, 16% of active riders reported they had been pulled over by police in the last 12 months compared to one in five in the previous year (16% vs. 20% in 2013).
Table 32: Whether pulled over by police in last 12 months - 2013 vs. 2014
Column % 2013 2014
Yes 20 16
No 80 82
Prefer not to say/Can’t recall 0 1
Q47 Have you been pulled over by police for any reason while riding your motorcycle in the last 12 months?Filter: Active riders; Weighted; 2014 base n=506, 2013 base n= 404indicates statistically significant difference compared to respondents not in that category
Transport Accident CommissionMotorcycle Monitor 2014 | Page 66

Among those who had been pulled over in the last 12 months, the most common reason in 2014 was breath testing (62%), followed by a routine licence check (41%) and speeding (13%).
Figure 37: Reasons for being pulled over by police in last 12 months
38
69
8
2
1
8
1
53
71
10
16
4
7
62
42
14
6
3
11
0 10 20 30 40 50 60 70
Breath tested
Routine licence check
Speeding
Drug tested
Loud pipes/exhaust
Other
Can`t recall
Prefer not to say
2012
2013
2014
Q48 Why were you pulled over? Filter: Active riders pulled over by police for any reason in the last 12 months; Weighted; 2012 base n = 88, 2013 base n= 65, 2014 base n = 94Note: Does not add to 100% due to multiple responses
In addition, those who had ridden in the last 12 months were asked if they had been caught speeding while riding their motorcycle. In 2014, only 4% of respondents indicated that they had. Of the few who had been caught speeding (n=25), a large majority had only been caught once (93%).
Transport Accident CommissionMotorcycle Monitor 2014 | Page 67
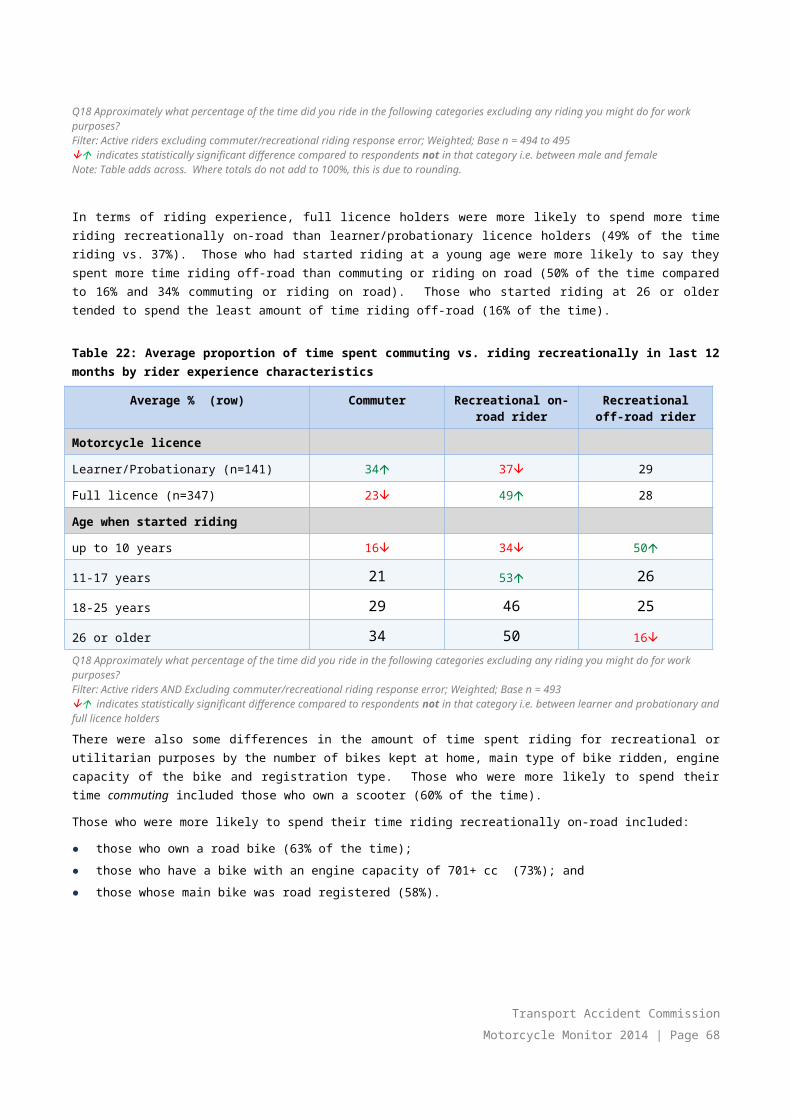
Speed limit in a 60km zoneRespondents were asked how fast people should be allowed to ride a motorcycle in a 60km per hour zone without being booked for speeding. Nearly three-fifths (58%) of the respondents nominated exactly 60km per hour or less (see Figure38). Over a third of respondents in 2014 nominated a speed higher than this (36%).
Figure 38: Speed people should be allowed to ride a motorcycle in a 60kph zone without being booked for speeding
63
8
21
0
4
34
3
66
7
18
1
5
30
4
58
9
18
1
8
36
6
0 10 20 30 40 50 60 70
Up to 60km per hour
61-63km per hour
64-66km per hour
67-69km per hour
70km per hour or above
Subtotal 61km or over
Don`t know
2012
2013
2014
Q51 How fast should people be allowed to ride a motorcycle in a 60kph zone without being booked for speeding? Filtered: Active riders; Weighted; 2012 base n =; 359 2013 base n =405; 2014 base n = 549;
Respondents were asked how often they rode at or above the speed they had nominated. The frequency at which respondents in 2014 would ride their motorcycle above their nominated speed is shown in Figure 39. Seven in ten (71%) of those who said people should only be able ride at 60km or lower in a 60km zone said they would never go above this speed. Approximately, one in five (22%) said they would go over this speed some of the time.
Among the 36% of respondents who nominated speeds greater than 60km per hour, 40% said they would never rider faster than the speed they nominated if they had the opportunity. More than four in ten (44%) reported going over this speed at least some of the time. This suggests that those who thought there should be more leeway in speed zones tended to say they would act upon it if the opportunity presented itself (at least some of the time).
Transport Accident CommissionMotorcycle Monitor 2014 | Page 68

Figure 39: Speed people should be allowed to ride a motorcycle in a 60kph zone without being booked for speeding and frequency they would ride above this speed - 2014
71
43
40
75
34
59
40
22
40
47
21
45
31
44
2
11
5
0
5
3
6
1
1
4
0
7
2
4
3
1
0
0
1
2
0
1
4
4
4
9
3
5
0 20 40 60 80 100
Up to 60km per hour
61-63km per hour
64-66km per hour
67-69km per hour
70km per hour or above
Overall average
Subtotal 61km or over
%
None of the time Some of the time (i.e. Less than half but not never)About half the time (50%) Most of the time (i.e. More than half but not all)All of the time Don’t know
Q51 How fast should people be allowed to ride a motorcycle in a 60 km per hour zone without being booked for speeding? Q52a When you have the opportunity, how often do you ride above 60km per hour in a 60kph zone?Filter: Active riders; Weighted; 2014 Base n = 549
Transport Accident CommissionMotorcycle Monitor 2014 | Page 69

Regardless of the speed nominated, the majority of respondents who had ridden in the last 12 months reported they would never ride above the speed limit they felt people should be able to ride at without being booked (59%). One in three (31%) reported they rode above the speed at least some of the time. These results are similar to those found in 2013.
Figure 40: Frequency respondents would ride above nominated speed in a 60km zone – 2012-2014
55
64
59
33
28
31
3
3
3
1
2
2
2
1
2
6
2
3
0 20 40 60 80 100
2012
2013
2014
%
None of the time Some of the time (i.e. Less than half but not never)About half the time (50%) Most of the time (i.e. More than half but not all)All of the time Don’t know
Q52 & Q52a When you have the opportunity, how often do you ride above X km per hour in a 60kph zone?Filter: Active riders; Weighted; 2012 Base n = 359; 2013 Base n=381; 2014 Base n=563
Transport Accident CommissionMotorcycle Monitor 2014 | Page 70

A higher proportion of those who had done any off-road riding for recreational purposes in the last year said they never rode above their nominated limit (60% compared to 55% of those who did some recreational on-road riding and 52% of those who did some commuting) (See Figure 41).
Figure 41: Frequency respondents would ride above nominated speed in a 60km zone by riding purpose - 2014
52
55
60
38
34
25
4
5
5
1
2
3
2
1
2
2
3
4
0 20 40 60 80 100
Commuter
Recreational on-road rider
Recreational off-road rider
%
None of the time Some of the time (i.e. Less than half but not never)About half the time (50%) Most of the time (i.e. More than half but not all)All of the time Don’t know
Q52 & Q52a When you have the opportunity, how often do you ride above X km per hour in a 60kph zone?Filter: Active riders; Weighted; 2014 Base n = 563
Transport Accident CommissionMotorcycle Monitor 2014 | Page 71

Speed limit in a 100km zoneWhen asked how fast people should be able to ride in a 100km zone without being booked, just under half (46%) said that you should only be able to ride 100 km per hour or less. A fifth (20%) nominated a speed of 106-110km per hour. Compared to the previous year, there was a significant decrease in those who nominated the sign posted speed limit or less compared to 2013 (58%).
Figure 42: Speed people should be allowed to ride a motorcycle in a 100kph zone without being booked for speeding - 2012-2014
7
1
7
1
20
18
46
4
1
3
1
20
13
58
2
3
5
0
19
16
55
Don`t know
130km per hour or above
120-129km per hour
111-119km per hour
106-110km per hour
101-105km per hour
Up to 100km per hour
2012
2013
2014
Q53 How fast should people be allowed to ride a motorcycle in a 100kph zone without being booked for speeding? Filter: Those ridden in the last 12 months; Weighted; 2012 base n = 348, 2013 base n=468; 2014 Base n = 550
Transport Accident CommissionMotorcycle Monitor 2014 | Page 72

Similar to responses to the same question in relation to 60km zones, males were less likely to nominate a speed of 100km or less (43% vs. 68% of females) (See Table 33). Notably, one in four of those aged 18-25 reported that a speed of between 101-105km should be acceptable before being booked for speeding in a 100km zone.
Table 33: Speed people should be allowed to ride a motorcycle in a 100kph zone without being booked for speeding by selected demographic characteristics - 2014
Column % Gender Age
Male (n=472)
Female (n=110)
18-25 (n=201)
26-39 (n=168)
40+ (n=213)
Up to 100km per hour 43 68 42 46 46
101-105km per hour 18 23 27 19 17
106-110km per hour 22 5 21 22 19
111-119km per hour 1 0 1 0 1
120-129km per hour 7 1 3 7 7
130km per hour or above 1 0 1 3 0
Don`t know 7 3 4 2 9
Subtotal - 101km per hour or above 50 29 53 52 44
Q53 How fast should people be allowed to ride a motorcycle in a 100kph zone without being booked for speeding? Weighted; Base n = 582-583indicates statistically significant difference compared to respondents not in that category
Overall, the average speed respondents said you should be able to ride without being booked was 104.8 km per hour in 2014 (similar to that reported in 2013 at 104km).
Those who had been involved in an accident while riding a motorcycle were more likely to nominate a higher average speed of 105.8km per hour (vs 104km per hour for those who have not experienced a crash). However, it should be noted that those who had experienced a crash rode more frequently on average than those who had not been involved in a crash so this would most likely reflect their riding experience. In 2014, no significant differences were observed among riders according to the bike they mainly rode.
The frequency at which respondents rode their motorcycle above the speed they nominated as permissible in a 100 km per hour zone is shown in Figure 43. Two-thirds of those who said people should only be able to ride up to 100km per hour in a 100 zone would never ride above this speed (66%). In comparison, those who nominated a speed higher than 100km, were less likely to say they would never go above this speed (35%).
Transport Accident CommissionMotorcycle Monitor 2014 | Page 73

Figure 43: Speed people should be allowed to ride a motorcycle in a 100kph zone without being booked for speeding and frequency they would ride above this speed - 2014
66
44
26
71
34
37
50
35
27
42
55
23
62
18
38
49
3
8
11
0
4
8
5
8
1
3
5
6
0
37
2
4
2
1
0
0
0
0
1
0
2
3
3
0
0
3
3
0 20 40 60 80 100
Up to 100km per hour
101-105km per hour
106-110km per hour
111-119km per hour
120-129km per hour
130km per hour or above
Overall average
NET above 100km per hour
%None of the time Some of the time (i.e. Less than half but not never)About half the time (50%) Most of the time (i.e. More than half but not all)All of the time Don’t know
Q54 & Q54a When you have the opportunity, how often do you ride above X kph in a 100kph zone?Filter: Active riders; Weighted; 2014 Base n =563
Transport Accident CommissionMotorcycle Monitor 2014 | Page 74

Regardless of the speed nominated, half of respondents who had ridden in the last 12 months reported they would never ride above the limit they felt people should be able to ride at without being booked (50%). More than one in three (38%) reported they rode above the speed they nominated at least some of the time. The results for 2014 are similar to those found in 2013.
Figure 44: Frequency respondents would ride above nominated speed in a 100km zone – 2012-2014
41
56
50
44
32
38
5
6
5
3
4
2
2
1
1
5
3
3
0 20 40 60 80 100
2012
2013
2014
%
None of the time Some of the time (i.e. Less than half but not never)About half the time (50%) Most of the time (i.e. More than half but not all)All of the time Don’t know
Q54 & Q54a When you have the opportunity, how often do you ride above X kph in a 100kph zone?Filter: Ridden in the last 12 months; Weighted; 2012 Base n=359; 2013 Base n = 382; 2014 Base n = 563
When comparing attitudes towards speeding in the two zones (regardless of the speed they nominated as the point where people should be booked), more riders tended to report they would never ride above the speed limit in a 60km zone (59% vs. 50% in a 100km zone) and were more likely to ride above the speed they nominated at least ‘some of the time’ when referring to a 100km zone (38% in a 100km zone vs. 31% in a 60km zone) (See Figure 45).
While this should be of concern, it should be also noted that these results are consistent with attitudes towards speed among car drivers where reported speeding was more prevalent in the higher speed zones.
Transport Accident CommissionMotorcycle Monitor 2014 | Page 75

Figure 45: Frequency respondents would ride above nominated speed in a 60km zone compared to a 100km zone – 2014
59
50
31
38
3
5
2
2
2
1
3
3
0 20 40 60 80 100
60 kph
100 kph
%
None of the time Some of the time (i.e. Less than half but not never)About half the time (50%) Most of the time (i.e. More than half but not all)All of the time Don’t know
Q52 & Q52a When you have the opportunity, how often do you ride above X km per hour in a 60kph zone?Q54 & Q54a When you have the opportunity, how often do you ride above X kph in a 100kph zone?Filter: Active riders; Weighted; Base n = 563
Transport Accident CommissionMotorcycle Monitor 2014 | Page 76

7. Random Breath and Drug Testing
Close to one in five active riders said they had been randomly breath tested (19%). Only 2% of this group said they believed they had been through a random drug test.
Random breath testing was more common among those who rode more than 20% of the time compared to driving, those who commuted, and rode bikes with bigger engines (700cc+).
Almost all respondents said they had not ridden their motorcycle when they knew or thought they may have been over the limit (92%) with an additional 6% who said they did not drink at all. Among those who said they may be been over the limit when they had been riding some of the reasons included perhaps being over the limit due drinking the night before, only riding a short distance, or they had no other alternative transport (or did not want to leave their bike behind).
Respondents were asked about their experiences in relation to random breath testing and random drug testing (RBT and RDT) and their motorcycle riding behaviour when they knew or thought they might be over the legal blood alcohol limit.
The vast majority of active riders (81%) had not been breath tested in the last 12 months. Nineteen percent (19%) reported having been breath tested, half of whom had been breath tested just the once (see Figure 46).
Those who did more riding (i.e. they rode more than 20% of the time compared to driving) (37%), those who commuted (28%), rode recreationally on-road (23%), rode a bike of 701cc+ (30%) were more likely to report being breath tested in that time period.
Figure 46: Proportion of active riders breath tested - 2014 only
81
10
5
4
0
0
0 10 20 30 40 50 60 70 80 90
Zero
1
2
3+ times
Prefer not to say
Can’t recall
%
Q48a In the last 12 months, how many times, if any have you been breath-tested when riding your motorcycle? Filter: Active riders; Weighted; Base n = 511indicates statistically significant difference compared to respondents not in that category
Transport Accident CommissionMotorcycle Monitor 2014 | Page 77

Few respondents had been drug tested while riding a motorcycle in the last 12 months (2% of active riders). Of the n=6 who had taken a drug test during this time period, there was some confusion with four respondents saying it had been a breath test and only two saying it had been a saliva test.
Riding when over the limitMore than nine in ten (92%) respondents said they had not ridden their motorcycle when they knew or thought they might possibly have been over the legal blood alcohol limit and a further 6% reported they did not drink at all.
Of the n=14 people who thought they may have/had done so, respondents had a number of reasons for doing so including they had drunk the night before riding their motorcycle and may consequently have been over the limit, that they were riding a short distance, they did not want to leave their bike, or had no other options, were not thinking straight, or that they were riding on private property.
Transport Accident CommissionMotorcycle Monitor 2014 | Page 78
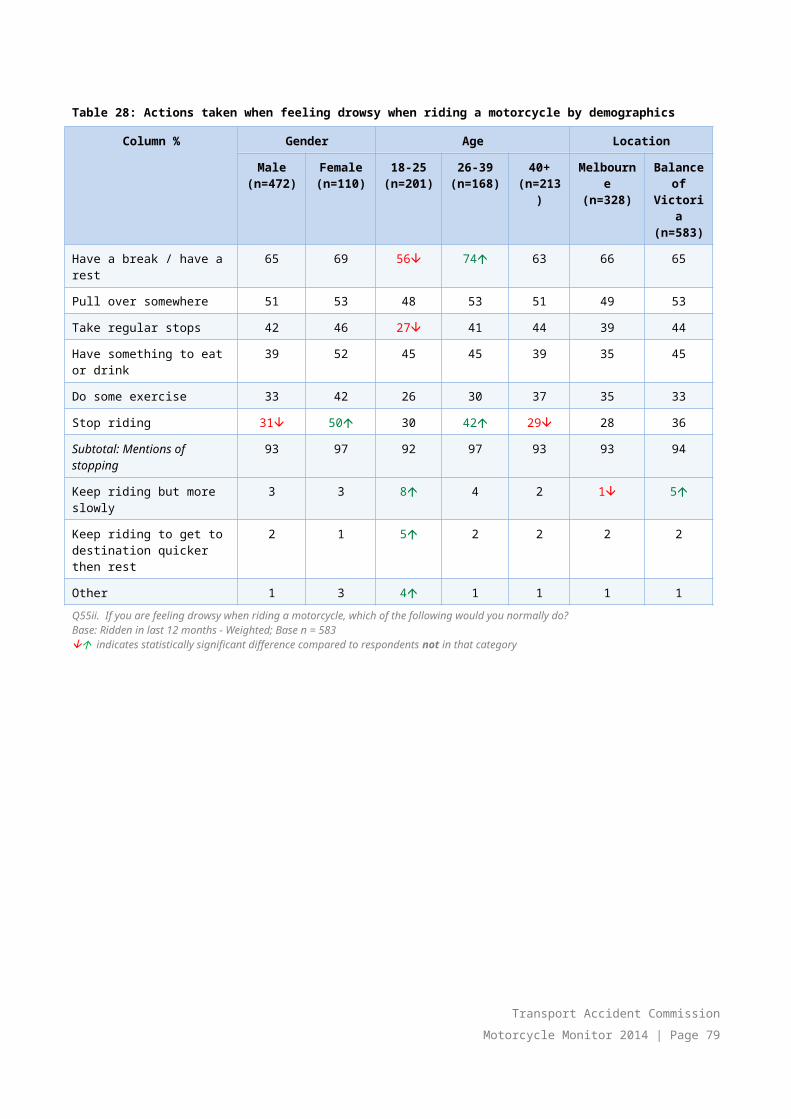
8. Motorcycle/scooter ownershipRespondents were asked about the details of up to four bikes that they rode most often; including the type of bike, make/brand, year of manufacture, engine size and ownership status. Respondents were asked to exclude bikes they had not ridden in the last 12 months or were not planning to ride in the next year.
More than half of all respondents (56%) did not have a motorcycle at home. Approximately one in three reported having only one bike at home (30%) with one in five reporting they had 2-4 bikes at home (22%). A minority of respondents had five or more motorcycles at their home address (4%).
The most common type of bike active riders said they mainly rode was a road bike (65% of active riders mainly rode a road bike vs. 60% in 2013). Fewer reported they mainly road an off-road/trail bike compared to 2013 (25% vs. 33% in 2013) with similar levels as reported in 2012 (23%). Eight percent (8%) of respondents rode a scooter (vs. 3% in 2013).
The most common brands were Yamaha, Honda, followed by Harley Davidson motorcycles with one in three active riders riding motorcycles manufactured between 2010-2014 (36%).
Forty percent (40%) reported they were considering purchasing a motorcycle in the future with half intending to do so within the next 12 months. One in three respondents were considering buying a new bike (30%), 44% were considering a used motorcycle, with the remainder undecided (33%). The majority of those thinking of buying another bike were planning on buying a road bike (76%). Half of these respondents intended to look for Antilock braking system (ABS) for their new bike (53%).
8.1 Number of motorcycles in householdIn 2014, under half (44%) of respondents indicated they did not have a motorcycle at their home address.
Under one in three (30%) reported having only one motorcycle in their household. A further 22% reported having between 2-4 motorcycles, and a very small percentage (4%) had five or more bikes at their home address.
Transport Accident CommissionMotorcycle Monitor 2014 | Page 79

Figure 47: Number of motorcycles kept at home - 2014 only
44%
30%
22%
4%
None
One
2-4 motorcycles
5 or more
Q15. How many motorcycles are kept at your home address regardless of who owns them or registration status? Filter: all respondents; Weighted; 2014 base n=784
Active riders were more likely to have at least one bike in their household (90%), with the vast majority of lapsed and former riders not having access to a bike (82% and 98% respectively) (See Table 33).
Table 34: Number of motorcycles kept at home by rider activity segment - 2014
Column % Rider activity segment
Active riders(n=511)
Lapsed riders (n=232)
Former riders (n=31)
None 10 82 98
One motorcycle 45 13 0
2-4 motorcycles 38 4 2
5 or more motorcycles 7 1 0
Q15 How many motorcycles are kept at your home address? All respondents; Weighted; 2013 Base n = 774indicates statistically significant difference compared to respondents not in that category
Transport Accident CommissionMotorcycle Monitor 2014 | Page 80

Looking at socio-economic variables, those who lived in the least disadvantaged areas of Victoria (SEIFA quintiles 4 and 5) were significantly less likely to own two or more motorcycles than average (22% compared to 33% for those in quintile 3 and 32% in quintile 1 and 2) (See Table 35).
Table 35: Number of motorcycles kept at home by SEIFA quintiles
Column % Quintile 1 and 2 (n=228)
Quintile 3 (n=149)
Quintile 4 and 5 (n=399)
None 36 47 46
One motorcycle only 32 20 31
Two or more motorcycles 32 33 22
Q15 How many motorcycles are kept at your home address?Filter: All respondents; Weighted; Base n = 776indicates statistically significant difference compared to respondents not in that category
Transport Accident CommissionMotorcycle Monitor 2014 | Page 81
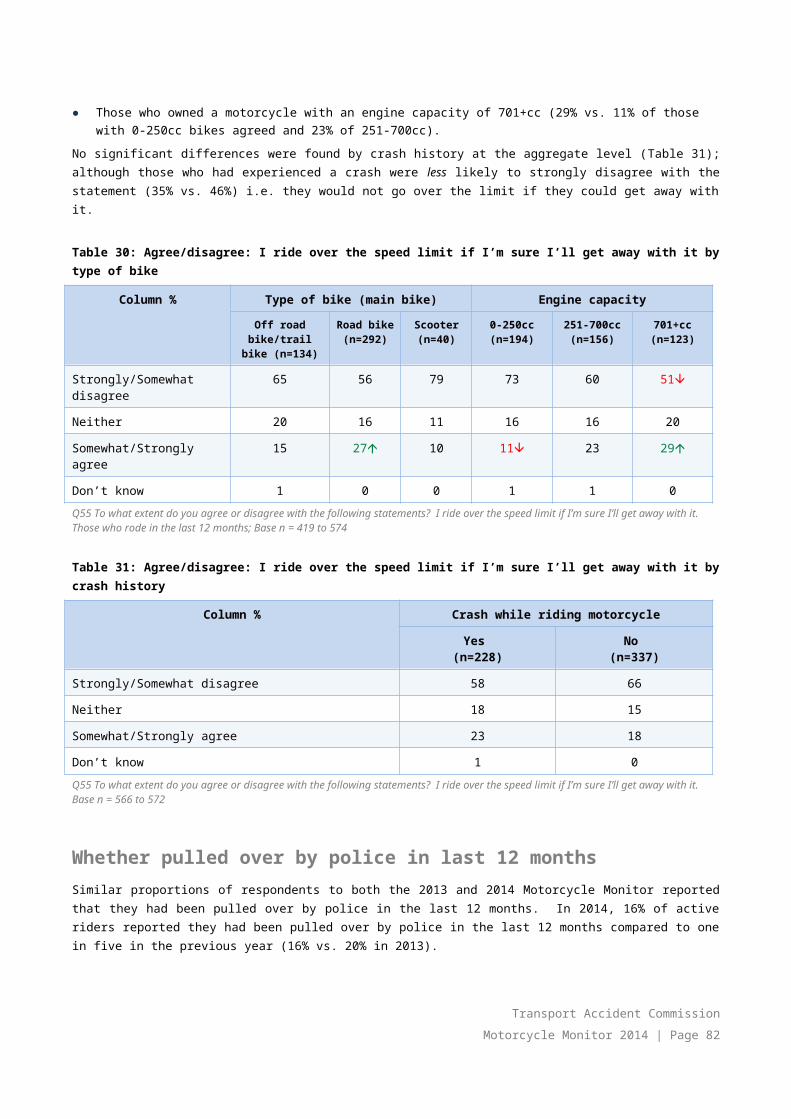
8.2 Details of motorcycle ridden most often
Type of motorcycle mainly riddenIn comparing the main type of motorcycle ridden by active riders in 2013 and 2014, the types of bikes ridden were broadly similar with few significant differences.
The majority (65%) rode an on-road bike, while just over a quarter said they rode an off road/trail bike (25%). In 2014, significantly more respondents said they rode a scooter compared to in 2013 (8% vs. 3%), but at similar levels to 2012 (9%).
In 2014, of the types of road bikes ridden, 25% reported mainly riding a tourer/cruiser, followed by just over two in ten active riders specifically saying they mainly rode a sports bike (22%),
Figure 48: Type of bike (Main motorcycle) - 2012-2014
23
67
25
10
4
25
3
9
1
33
60
28
6
2
16
7
3
4
25
65
22
11
5
25
2
8
3
Off road bike/trail bike
Subtotal - Road bike
Road bike - Sports bike
Road bike - Sports tourer
Road bike - Dual sport
Road bike - Tourer/cruiser
Road bike - Other
Scooter
Other type of bike
2012
2013
2014
Q16 Please provide details of the motorcycle you ride most of the time – Type of bikeFilter: Active riders and keep at least one bike at home; Weighted; 2012 base n = 329; 2013 base n=350; 2014 Base n = 450
Transport Accident CommissionMotorcycle Monitor 2014 | Page 82

There were some differences in the types of motorcycles mainly ridden among the active rider segment (See Table 36). These included:
● Male riders, those aged 18-25 and learner/probationary licence holders were more likely to own a sports bike (23%, 42% and 41% respectively).
● Off-road bikes/trail bikes were more popular among those aged 26-39 (35%) and those living in regional Victorian locations (32%).
● Scooters were also more prevalent among females than males (19% vs. 6%).
Table 36: Type of bike (Main motorcycle) by selected characteristics - 2014
Column % Gender Age Location Licence type
Mal
e (n
=408
)
Fem
ale
(n=1
04)
18-2
5 (n
=178
)
26-3
9 (n
=140
)
40+
(n=1
94)
Mel
bour
ne
(n=2
94)
Bal
ance
of V
ic.
(n=2
19)
Lear
ner/
prob
atio
nary
(n
=142
)
Full
licen
ce
(n=3
59)
Off road bike/trail bike 24 30 32 35 20 20 32 29 24
Subtotal - Road bikes 67 45 61 53 70 67 61 58 66
- Sports bike 23 7 42 28 17 24 19 41 20
- Sports tourer 12 1 6 6 14 9 14 4 12
-Tourer/cruiser 5 1 2 2 6 7 2 1 5
- Dual sport 25 31 10 14 32 25 25 8 27
- Other 1 6 2 3 2 3 1 4 2
Scooter 6 19 5 11 7 11 3 12 7
Other type of bike 2 6 1 2 3 2 4 1 3
Don’t know 0 0 0 0 0 0 1 0 0
Q16 Please provide details of the motorcycle you ride most of the time – Type of bikeFilter: Active riders and keep at least one bike at home; Weighted; Base n = 450indicates statistically significant difference compared to respondents not in that category
Transport Accident CommissionMotorcycle Monitor 2014 | Page 83

Make/brand of main motorcycleIn 2014 the three most common brands of motorcycle among active riders were Yamaha, Honda, and Harley Davidson. Those who rode a Harley Davidson increase from 7% to 15% in 2014. Suzuki and Kawasaki motorcycles rounded out the top five brands.
Figure 49: Brand of bike (Main motorcycle) - 2012-2014
17
22
12
16
7
3
2
4
1
3
0
13
19
23
7
14
10
6
5
1
2
4
1
8
19
16
15
12
0
5
5
3
3
3
2
7
Yamaha
Honda
Harley Davidson
Suzuki
Kawasaki
KTM
Triumph
BMW
Vespa
Ducati
Husqvarna
Others
2012
2013
2014
Q16 Please provide details of the motorcycle you ride most of the time – Make/brandFilter: Active riders; Weighted; 2012 base n = 329; 2013 base n = 422; 2014 base n = 513
Year of manufacture of main motorcycle Newly manufactured motorcycles made in 2010-2014 were ridden by 36% of active riders. Active riders were most likely to ride motorcycles manufactured between 2000 and 2009 (45%).
Younger respondents tended to ride newer bikes (made in 2010-2014 - 48%) (See Table 37).
Transport Accident CommissionMotorcycle Monitor 2014 | Page 84
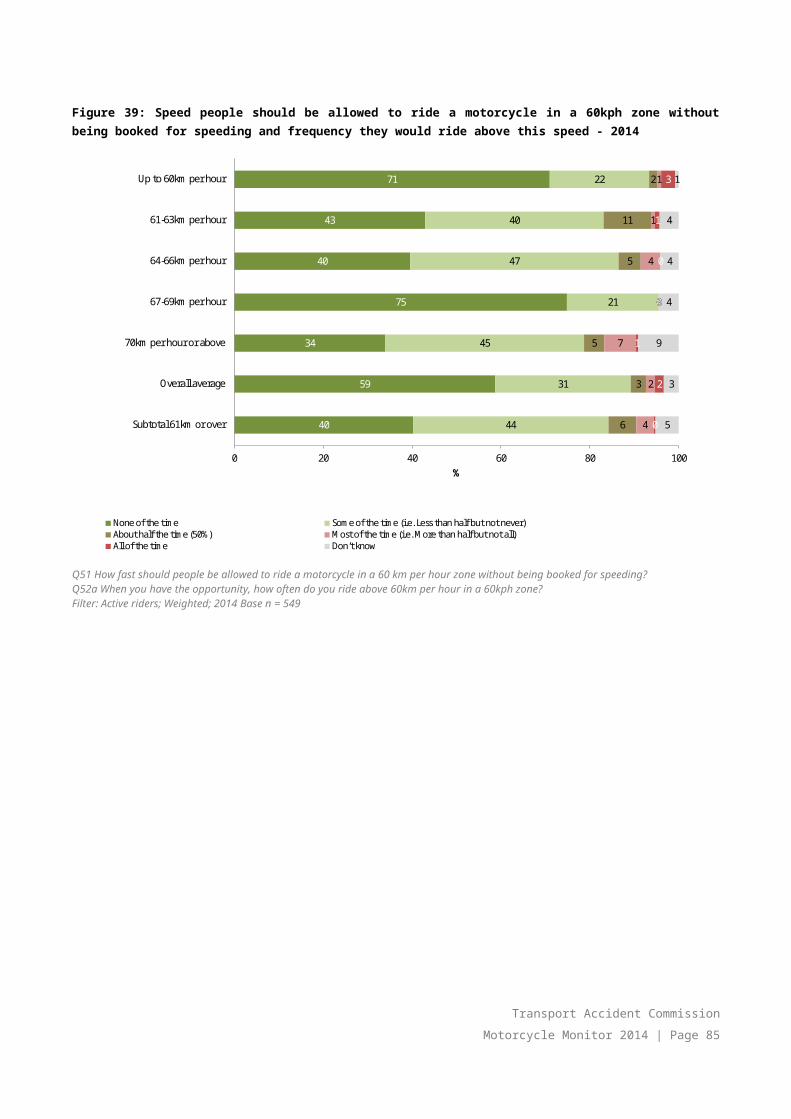
Table 37: Year of manufacture of main motorcycle by selected rider characteristics - 2014
Column % Age Whether had a crash
18-25 (n=148) 26-39 (n=111) 40+ (n=143) Yes (n=167) No (n=234)
1999 or earlier 15 16 21 19 18
2000-2009 37 45 46 39 51
2010-2014 48 38 34 42 31
Q16 Bike ridden most often - Year of manufactureFilter: Active riders who kept at least one bike at home; Weighted; Base n = 447 to 448indicates statistically significant difference compared to respondents not in that categoryNote: Telephone and online surveys only
Learner and probationary licence holders were also significantly more likely to say they rode a motorcycle made in 2010-2014 (52% compared to 34% of full licence holders). The same was found for those who rode 20% or more of the time (48% compared to 30% of those who rode less than 20% of the time).
Table 38: Year of manufacture of main motorcycle by selected rider characteristics - 2014
Column % Licence Time spent riding vs. driving
Learner/ Probationary
(n=119)
Full licence (n=279)
Ride less than 20% (n=261)
Ride 20% or more (n=160)
1999 or earlier 12 20 22 13
2000-2009 35 46 47 39
2010- 2014 52 34 30 48
Q16 Bike ridden most often - Year of manufactureFilter: Riders who owned at least one bike; Weighted; Base n = 394-446indicates statistically significant difference compared to respondents not in that categoryNote: Telephone and online surveys only
Transport Accident CommissionMotorcycle Monitor 2014 | Page 85
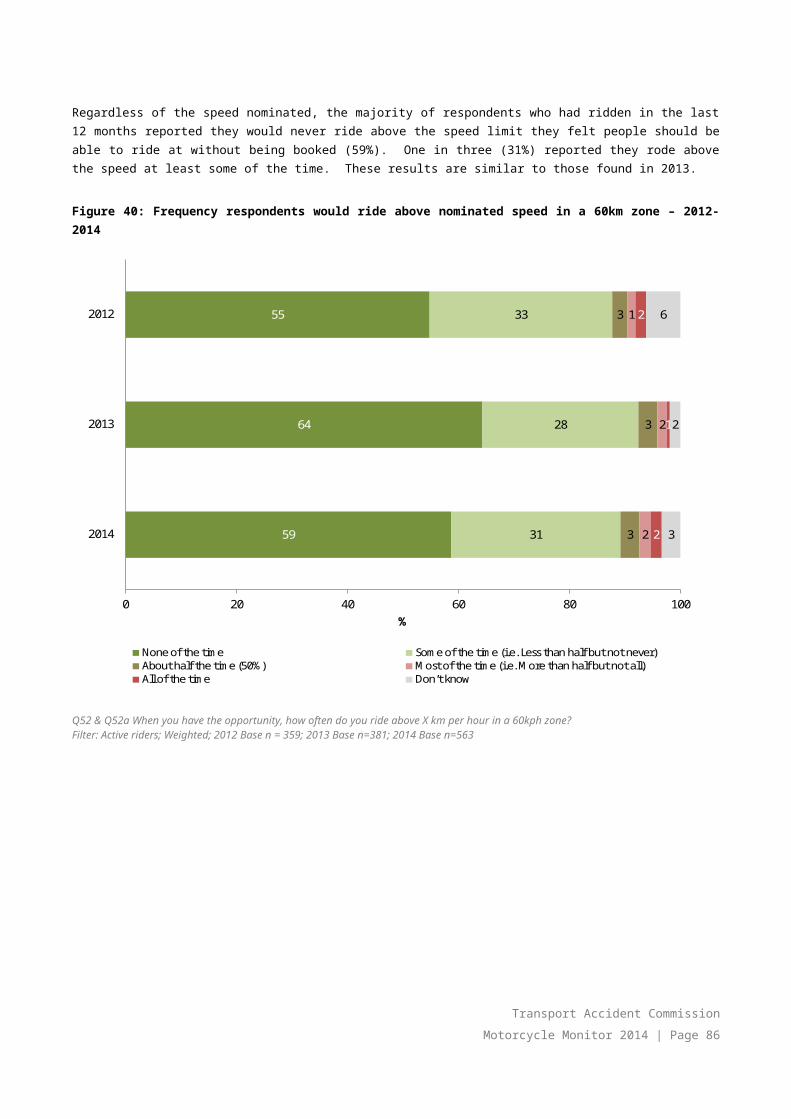
In 2014, respondents were asked what year the bike they ride most often was purchased. More than half (59%) of the respondents purchased their bike between 2010 and 2014. A quarter (28%) purchased their bike between 2005 and 2009 and 13% in 2000 or earlier.
Table 39 shows the vintage of the bike that people bought. Six in ten of those who had purchased their bike in 2010-2014, had brought a relatively new bike (57% of the bikes were also made in 2010-2014).
Table 39: Year of purchase and year of manufacture (2014)
Year of purchase
Year of manufacture 1999 or earlier 2000-2004 2005-2009 2010-2014 NET
1999 or earlier 100 21 21 8 192000-2009 0 79 79 34 442010-2014 0 0 0 57 37NET 100 100 100 100 100Column n 20 12 63 288 383Q16 Bike ridden most often - Year of manufactureQ16 Bike ridden most often - Year purchasedFilter: Riders who owned at least one bike; Weighted; Base n = 394-446indicates statistically significant difference compared to respondents not in that categoryNote: Telephone and online surveys only
Odometer readingRespondents were also asked the odometer reading on the bike they mainly ride. Among those who were able to answer this, responses were fairly evenly spread out, with the highest share of respondents (22%) stating the odometer read between 10,001 to 20,000km (see Table 40). The average odometer reading was 24251.8km.
Table 40: Odometer reading on bike mainly ridden - 2014
Column % % 2014
Up to 500 3
501-1,000 3
1,001-2000 7
2,001-5000 14
5,001-10000 17
10,001-20000 22
20,001-30000 9
30,001-50000 12
50,001+ 12
Q16viii. What is the odometer reading on the bike you mainly ride? Active riders who own at least one motorcycle; Weighted; 2014 Base n = 391indicates statistically significant difference compared to respondents not in that category
As expected, newer motorcycles tended to have lower odometer readings in general with an average of 8934km on the ‘clock’ for bikes made between 2010-2014. Motorcycles made prior to 1999 had an average of over 50,000km on the odometer.
Transport Accident CommissionMotorcycle Monitor 2014 | Page 86
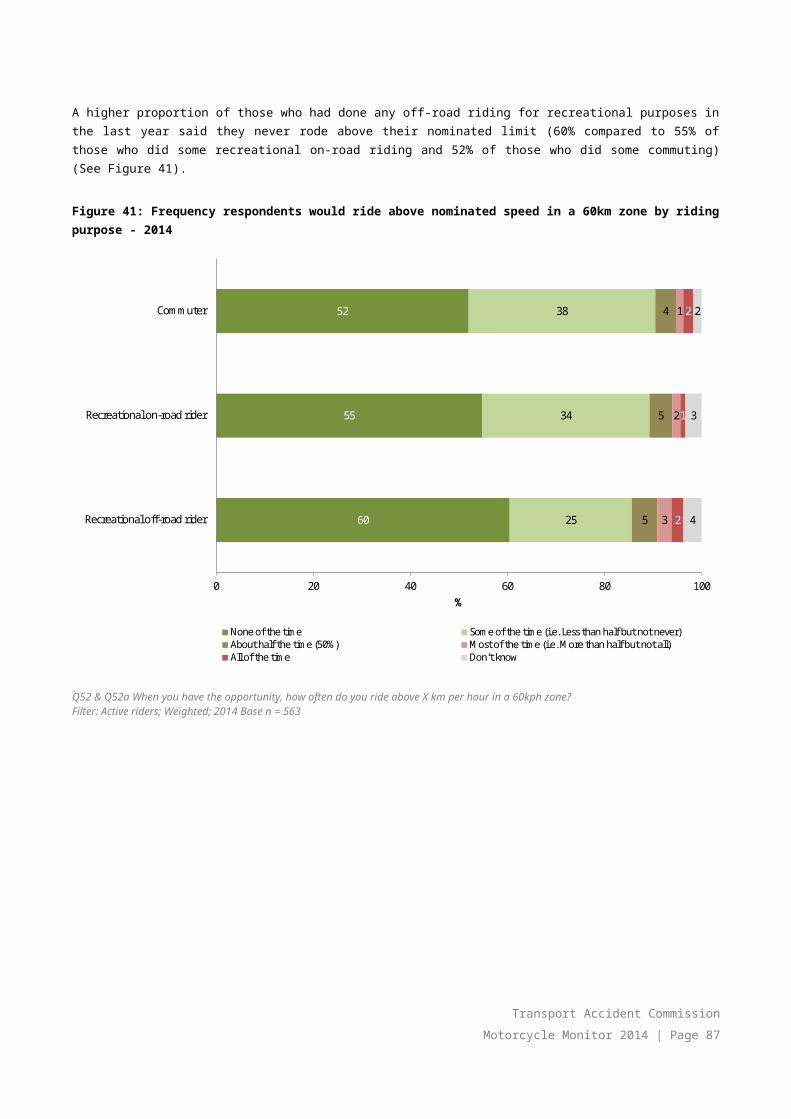
Table 41: Odometer reading on bike mainly ridden by year of manufacture- 2014
Column % 1999 or earlier (n=64)
2000-2009(n=152)
2010-2014(n=143)
Up to 500 0 1 4
501-1,000 1 0 7
1,001-2000 0 7 13
2,001-5000 0 15 22
5,001-10000 6 13 29
10,001-20000 21 26 1620,001-30000 8 15 3
30,001-50000 31 13 5
50,001+ 32 10 0
Average 56,565.5 22,644.3 8,934.9Q16viii. What is the odometer reading on the bike you mainly ride? Those who own at least one motorcycle; Weighted; 2014 Base n = 359 (excludes don’t know or refused)indicates statistically significant difference compared to respondents not in that category
Among those who knew the year of manufacture and the odometer reading for the motorcycle they rode most often, clocked an average of 2484.8 km per year on the odometer. Fourteen percent (14%) reported an average of up to 500km per year. Four in ten (43%) clocked an average of 501-2000km per year. One in ten (11%) reported an average of 5000km or more per year. As expected, off-road bikes had the lowest odometer reading per year with an average of 846.3km. In comparison, road bikes averaged 3022.5km per year and scooters 2121.5 per year since the motorcycle had been manufactured.
Table 42: Odometer reading on bike mainly ridden by per year (based on year of manufacture)
Column %2014
(n=359)
Up to 100 1
101-500 13
501-1000 18
1001-1500 13
1501-2000 13
2001-2500 11
2501-3000 7
3001-5000 14
5001-10000 9
10001+ 2
Average 2,484.8
Q16viii. What is the odometer reading on the bike you mainly ride? Those who own at least one motorcycle; provided year of manufacture and odometer reading Weighted; 2014 Base n = 359 (excludes don’t know or refused)indicates statistically significant difference compared to respondents not in that category
Transport Accident CommissionMotorcycle Monitor 2014 | Page 87

Engine size of main motorcycleMotorcycle engine sizes varied among active riders with bikes that had an engine capacity of 701+cc the most common in 2014 (42%, compared to 31% in 2013 – likely due to the increase of Harley Davidson riders in 2014). Nearly one third (30%) of respondents rode bikes with engine capacity of 251-700cc.
Older respondents were significantly more likely to have a motorbike with a larger engine size with 49% having an engine capacity of 701cc or higher compared to 12% of 18-25 year-olds and 20% of 26-39 year olds. This was also the case for recreational on-road riders with 52% having an engine capacity of 701 or higher compared of 22% of recreational off-road riders.
Registration statusMotorcycle owners were also asked the registration status of the bikes kept at their home address. Almost all road bikes or scooters were registered to ride on the road (97% and 100% respectively). Those who rode an off road or trail bike were most likely to have it farm bike registered (31%), followed by 28% who had it road registered (see Table 43).
Table 43: Registration status of main bike (Active riders) - 2014
Type of bike (main bike)
Column % Off road bike/trail bike
(n=119)
Road bike(n=276)
Scooter(n=38)
Total (n=397)
Road registered 28 97 100 80
Recreational registered 18 0 0 4
Farm bike registered 31 0 0 8
Not registered 11 0 0 2
Unknown 12 3 0 5
Q16 Bike ridden most often - Is the bike registered?Filter: Active riders only; Weighted: base n = 399 to 447indicates statistically significant difference compared to respondents not in that category
The age of the active rider’s main bike by year of manufacture can be seen in Table 44 below. There were no significant differences between manufacture years.
Table 44: Registration status of main bike by year of manufacture (Active riders) – 2014
Column % 1999 or earlier (n=75)
2000-2009 (n=168)
2010-2013 (n=156)
Total (n=399)
Road registered 81 79 83 81
Recreational registered 2 7 4 5
Farm bike registered 7 7 8 8
Not registered 5 3 2 3
Unknown 5 4 3 4
Q16 Bike ridden most often - Is the bike registered?Filter: Active riders only; Weighted: base n = 399indicates statistically significant difference compared to respondents not in that category
Transport Accident CommissionMotorcycle Monitor 2014 | Page 88
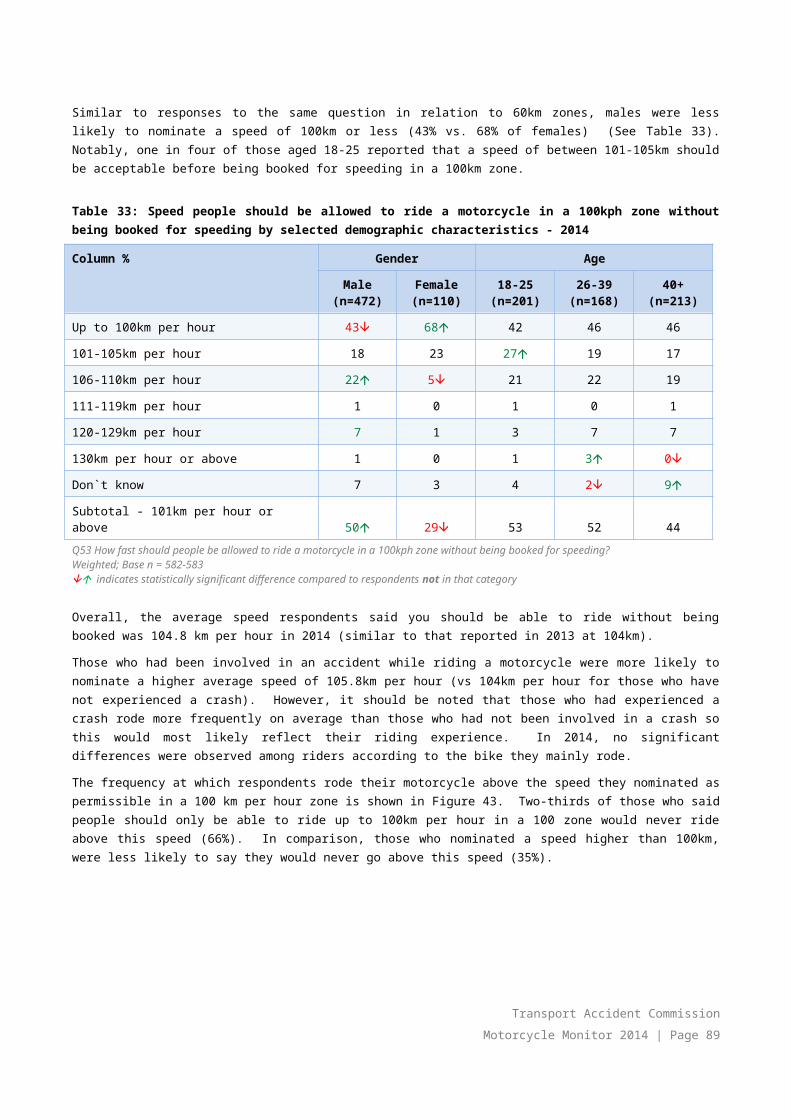
Details of other motorcycles ridden in household Participants who owned more than one motorcycle were asked to list the details of up to three other motorcycles that were kept at their home address, excluding any motorcycles that had not been ridden in the last year or were unlikely to be ridden in the next year. Only 4% of all respondents had more than four motorcycles at home.
As in previous years, the types of motorcycles (other than their main bike) kept by respondents at their home address were similar to their main bikes: 63% of all other bikes were off-road bike/trail bikes and the total proportion of road bikes owned by respondents was 44%.
Table 45 shows that among active riders, the other types of bikes kept at home were usually other models of the main bike they rode. For example, 94% of those who mainly rode an off-road bike owned other off road bikes, although one in five (21%) also owned a road bike.
In comparison, road bike owners who owned more than one bike were most likely to own other road bikes (51%) with 55% also having off-road bikes at home.
Table 45: Other types of bikes owned
Type of bike (Main bike)
Column %
Off
road
bik
e/tr
ail
bike
(n=1
35)
Subt
otal
- R
oad
bike
s (n
=102
)
- Sp
orts
bik
e
(n
=45)
- Sp
orts
tour
er
(n
=16)
*
- D
ual s
port
(n=8
)*
- To
urer
/cru
iser
(n=4
2)*
Scoo
ter (
n=9)
*
Type of other bikes:
Off road bike/trail bike 94 55 83 24 100 33 13
Subtotal - Road bike 21 51 31 55 93 51 88
- Sports bike 12 15 18 27 21 8 60
- Sports tourer 6 11 5 24 25 9 0
- Dual sport 1 7 2 0 47 4 0
- Tourer/cruiser 6 19 12 19 0 27 72
- Other 0 7 0 7 0 10 0
Scooter 0 13 3 19 0 22 8
Other type of bike 4 5 0 3 0 10 7
Q17 Other Bike - Type of bike Filter: Active riders AND Own more than one motorcycle; Weighted; Base n = 450indicates statistically significant difference compared to respondents not in that category*Note: Small sample sizes
Transport Accident CommissionMotorcycle Monitor 2014 | Page 89

8.3 Motorcycle purchase intentionsActive riders were asked whether they intended to purchase a motorcycle in the future. In 2014, four in ten respondents (40%) intended to purchase a motorcycle either in the next 12 months or after 12 months (See Figure 50).
Over a quarter (27%) of respondents were not planning on purchasing a motorcycle in the future, with the remainder (33%) undecided. Similar proportions were reported in 2013.
Figure 50: Purchase intentions - 2014
20%
20%
27%
33%
Yes, in the next 12months
Yes, after 12 months
No, I am not planning topurchase a motorcyclein the future
I have not decided yet
Q30. Are you planning to purchase a motorcycle in the future (either as your first bike, a replacement for or in addition to the one(s) you already have)?Filter: Active riders only; Weighted; 2014 base n=503
In 2014, 18-39 year olds were significantly more likely to say they planned to buy a bike in the future (57% compared to 31% of those aged 40+).
Likewise, those who lived in regional Victoria tended to say they were not planning to purchase a motorcycle in the future (36% vs. 22% in Melbourne) (See Table 46). One in four (24%) respondents from Melbourne said they were likely to purchase a motorcycle in the next 12 months.
Table 46: Purchase intentions by selected demographics
Column % Age Location
18-25 (n=184)
26-39 (n=135)
40+ (n=183)
Melbourne(n=290)
Balance of Victoria (n=213)
Total - Yes 62 56 31 43 35
Yes, in the next 12 months 26 29 16 24 14
Yes, after 12 months 36 27 15 20 21
No, I am not planning to purchase a motorcycle in the future 15 16 33 22 36
I have not decided yet 23 28 26 35 29
Transport Accident CommissionMotorcycle Monitor 2014 | Page 90

Q30. Are you planning to purchase a motorcycle in the future (either as your first bike, a replacement for or in addition to the one(s) you already have)? Filter: Active riders; Weighted; Base n =502 to 503indicates statistically significant difference compared to respondents not in that category
Respondents who stated that they intended to buy a motorcycle sometime in the future were asked whether they planned to buy a new or used motorcycle. In 2014, there was a higher number of respondents who express the intention to purchase a used motorcycle (44% vs. 32% in 2013), and were less likely to report they hadn’t decided yet (26% vs. 31% in 2013) (See Figure 51).
Figure 51: Purchase intention: new or used motorcycle - 2012-2014
34
50
15
2012
New motorcycle
Used motorcycle
Haven’t decided yet
37
32
31
2013
New motorcycle
Used motorcycle
Haven’t decided yet
30
44
26
2014
New motorcycle
Used motorcycle
Haven’t decided yet
Q31 Do you intend to buy a new or a used motorcycle?Filter: Active riders, Intend to purchase a motorcycle in the future; Weighted; 2012 base n = 197, 2013 base n=233; 2014 base n = 244
Type of bikeThree quarters of those who were intending to buy a bike in the future said they were likely to buy a road bike of some sort (76%). The most common type of road bike was a tourer/cruiser (28%) followed by a sports bike (19%). Twenty two percent (22%) intended to buy an off-road bike and 2% a scooter.
Respondents who intended to buy a bike were most likely to purchase the same type of motorcycle they currently rode. For example, 55% of those who mainly rode an off-road bike and intended to by another bike in the future said they would buy another off-road bike, 93% of those who mainly rode a road bike intended to buy another of the same.
Transport Accident CommissionMotorcycle Monitor 2014 | Page 91

As with ownership, scooters were more popular among females (10% compared to 1% of males). Those aged 40 or older were significantly more likely to favour a tourer/cruiser (43%) while this type of bike was only favoured by 9% of 26-39 year olds.
Figure 52: Type of bike intending to buy - 2012-2014
16
77
26
27
20
2
6
2
1
0
26
67
23
25
10
8
6
2
1
0
22
76
28
19
15
7
2
7
0
1
Off road bike/trail bike
Subtotal Road b ike
Tourer/cruiser
Sports bike
Sports tourer
Dual sport
Scooter
Other road bike
Can’t recall
Other type of bike
2012
2013
2014
Q32. What type of motorcycle do you intend to buy? Filter: Active riders; Intend to purchase a motorcycle in the future; Weighted; 2012 base n = 197; 2013 base n=233; 2014 base n = 244
Of the 52 respondents who said they intended to buy an off-road or trail bike, more than half (56%) reported they would register the bike with recreational registration and 26% intended to get a full road registration. A significantly higher proportion said they would register their bike as a farm bike (7% compared to 0% in 2013)
The small percentage (11%, n=2) who did not intend to register their off-road motorcycle stated they did not do so because they did not have to.
Transport Accident CommissionMotorcycle Monitor 2014 | Page 92

8.4 Motorcycle safety featuresActive riders were asked if they were aware of a series of safety features currently available on some motorcycles and/or clothing, with results shown in Figure 53. The most common feature that respondents had heard of was ABS (Antilock Braking Systems) (79%). Half of riders had heard of traction control (53%). There were a number of features recalled by around one in three respondents, including: low tyre pressure indicators (37%), electronic stability control (34%), emergency brake assist (32%), airbags (in clothing) (30%) and speed limiter function (29%).
Only 11% of respondents indicated they had not heard of any of the features listed in the survey. There were no significant differences in awareness compared to 2013.
Figure 53: Awareness of motorcycle safety features - 2012-2014
77
58
35
32
30
39
32
34
20
8
13
2
75
53
32
30
30
36
30
29
17
14
16
1
79
53
37
34
32
30
29
26
15
12
11
2
ABS (Antilock braking system)
Traction control
Low tyre pressure indicators
Electronic Stability Control
Emergency brake assist (EBA)
Airbags (in clothing)
Speed limiter function
Electronic brake force distribution (EDA)
Airbags (on bike)
Blind spot warning sensor
I have heard of none of the above
Other
2012
2013
2014
Q36 Have you heard of any of the following motorcycle safety features?Filter: active riders; Weighted; 2012 base n =359; 2013 base n=405; 2014 base n = 511
Males tended to report higher awareness for a number of the safety features than their female counterparts including ABS (Antilock braking system) (81% vs. 53%), traction control (56% vs. 35%), low tyre pressure indicators (39% vs. 22%), Electronic Stability Control (36% vs. 17%).
Those who had a crash were significantly more likely than those who had not to report they had heard of airbags (in clothing) (37% vs. 22%), airbags (on bike) (21% vs. 9%), and blind spot warning sensor (17% vs. 8%).
Transport Accident CommissionMotorcycle Monitor 2014 | Page 93
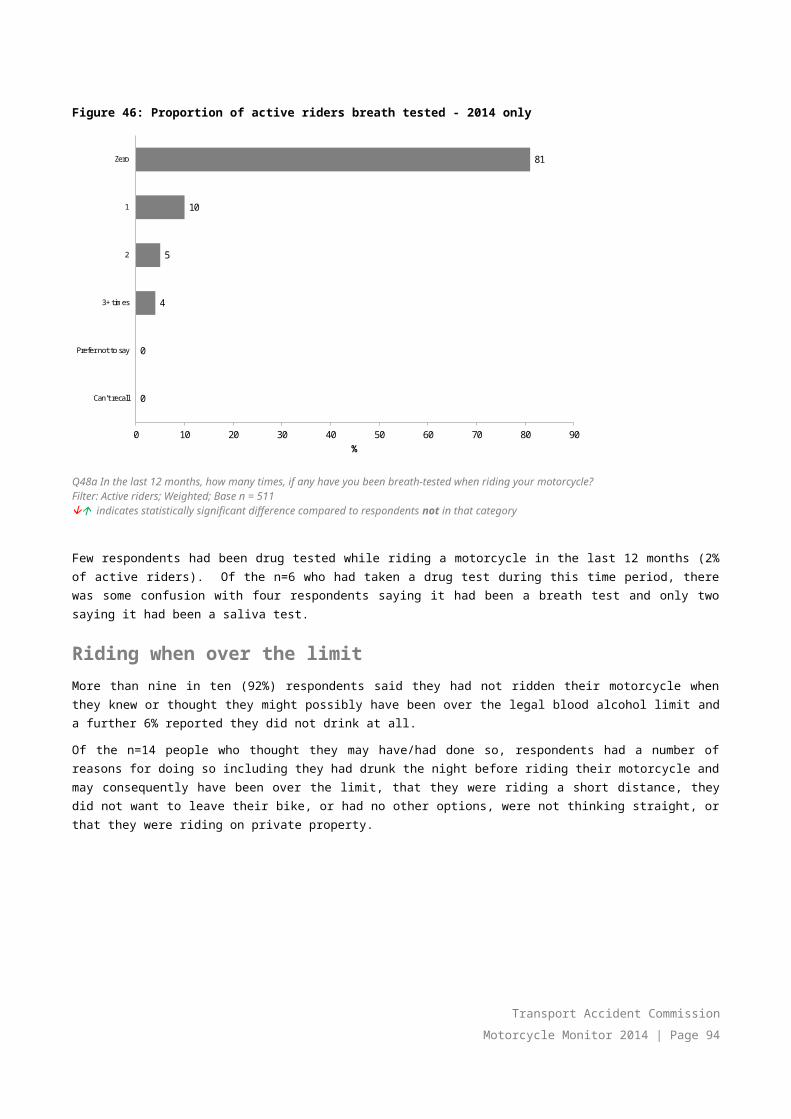
Learner/probationary licence holders were also more likely to report having heard of speed limiter function compared to full licence holders (43% vs. 27%).
Only 17% of those with a road bike reported having ABS on their bike, with 76% stating that their bike did not have this feature. This is similar to 2013 (14% reported having ABS on their bike and 79% did not). A minority of respondents were not sure in both 2013 and 2014 (8% and 6% respectively). Female riders were more likely to be unsure (32% vs. 4%).
Among those who intended to buy a road bike in the next 12 months, 53% reported they would look for ABS for their new bike while 19% would not (similar to 2013 at 20%). A further 22% had not decided yet. A minority (7%) were not aware that ABS was available on motorcycles.
Transport Accident CommissionMotorcycle Monitor 2014 | Page 94

9. Protective motorcycle clothingActive riders were asked about the protective motorcycle clothing they owned, how often they wore protective gear and their future purchase intentions. Additional questions were also included about footwear worn while riding.
Most respondents said they owned at least one helmet, pair of riding gloves or boots, motorcycle jackets, pair of pants or a one piece riding suit (all owned by more than three quarters of active riders). The most common items of protective gear owned were helmets (99% owned at least one); and gloves (owned by 95%).
In total, 71% of active riders reported they had a complete set of protective gear. This has remained constant between 2012 and 2014. However, as in in previous years, ownership of an item of protective gear did not necessarily mean that it was worn every time they rode. Of note, motorcycle specific pants were only worn all the time by just over half of the active riders who owned them (56%).
Almost all respondents (95%) said they wore a motorcycle helmet all the time. Eight in ten respondents (80%) reported they wore gloves all the time. Riding jackets were worn all the time by 62% of respondents. Boots of any type were worn all the time by 66% of respondents. Riding pants were least likely to be worn all the time– 46% reported they were worn all the time.
Two in three respondents (68%) said they wore either riding boots or other types of boots that cover the ankles all the time. Overall, boots specifically made for riding were worn an average of 64% of the time; other boots were worn on average 27% of the time.
Looking at the number of items worn by active riders (including helmets of any kind), two thirds (64%) of respondents said they wore three or more items all the time. This decreased to 37% for four or more items of protective wear. When looking at the number of items worn most or all the time, 86% of respondents reported they wore three or more items all or most of the time.
Transport Accident CommissionMotorcycle Monitor 2014 | Page 95

9.1 Protective gear ownershipAs in previous years, close to 100% of respondents in 2014 said they owned at least one helmet (99%) and pair of riding gloves (95%).
Close to half (47%) owned an open face helmet and 87% owned a full face helmet. Among those who owned an open faced helmet, three out of four (77%) also owned a full face helmet. Those who only owned an open faced helmet were most likely to be aged between 26-39 years old (46% although the sample size was small (n=34).
In 2014, 90% of respondents owned a motorcycle jacket and 83% owned motorcycle boots. Riding pants were owned by just under four-fifths of respondents (78%) (See Figure 54).
Figure 54: At least one protective motorcycle clothing item owned –- 2012-2014
99
83
98
91
75
11
99
42
88
83
95
91
77
11
98
47
87
83
95
90
78
7
Motorcycle helmet - any
Motorcycle helmet - open face*
Motorcycle helmet - full face*
Pair(s) of motorcycle riding boots
Pair(s) of motorcycle riding gloves
Motorcycle riding jacket(s)
Pair(s) of motorcycle riding pants
One piece riding suit(s)
2012 2013 2014
Q39 How many of the following do you own? Filter: Active riders; Weighted; 2012 base n = 429; 2013 base n=405; 2014 base n = 511* Note: the 2012 survey did not distinguish between types of helmet
In total, 71% of active riders owned a complete set of gear i.e. at least one helmet, pair of riding gloves and boots, jacket and pants (or one piece riding suit). Those living in Melbourne were significantly more likely to own a complete set of gear (75% vs. 64% of those living in regional Victoria) (See Table 47).
Table 47: Complete set of protective motorcycle – 2012-2014
Column % 2012(n=359)
2013 (n=405)
2014(n=511)
Own complete set of gear 68 69 71
Do not own complete set of gear 32 31 29
Q39a-f How many of the following do you own? Filter: Active riders; Weighted; 2012 Base n = 359; 2013 Base n = 405; 2014 base n = 511indicates statistically significant difference compared to respondents not in that category
Transport Accident CommissionMotorcycle Monitor 2014 | Page 96

Respondents were most likely to own at least one pair of motorcycle gloves (95%) or a motorcycle jacket (90%). (See Figure 55).
Figure 55: Number of protective motorcycle clothing items owned - 2014
53
13
17
5
10
22
93
28
42
53
31
31
28
6
18
44
29
57
56
48
1
1
1
0
2
2
0
0 20 40 60 80 100
Motorcycle helmet - open face
Motorcycle helmet - full face
Pair(s) of motorcycle riding boots
Pair(s) of motorcycle riding gloves
Motorcycle riding jacket(s)
Pair(s) of motorcycle riding pants
One piece riding suit(s)
%
0 1 2-4 5 or more
Q39a-f How many of the following do you own? Filter: Active riders; Weighted; Base n = 511
On average, those who owned gloves reported having 2.2 pairs. The average number of full face helmets was 1.5 and the average number of open face helmets was 0.7. Respondents owned on average 1.8 motorcycle jackets and 1.6 pairs of riding pants.
Riders on learner or probationary licences tended to own fewer pieces of each item of protective gear. Also, riders who had crashed whilst riding tended to own more items than those who had not – noting that those who had ridden for longer were more likely to have had a crash in the past (see Table 48).
Transport Accident CommissionMotorcycle Monitor 2014 | Page 97

Table 48: Average number of items by rider experience - 2014
Average Motorcycle licence Crash while riding motorcycle
Learner/ Probationary
(n=144)
Full licence(n=359)
Yes(n=206)
No(n=301)
Motorcycle helmet - open face 0.4 0.8 0.7 0.8
Motorcycle helmet - full face 1.2 1.5 1.6 1.4
Pair(s) of motorcycle riding boots 0.9 1.3 1.5 1.1
Motorcycle riding jacket(s) 1.2 1.9 2.1 1.6
Pair(s) of motorcycle riding pants 1.3 1.6 1.8 1.3
Pair(s) of motorcycle riding gloves 1.7 2.3 2.6 1.8
One piece riding suit(s) 0.1 0.1 0.1 0.0
Q39a-f How many of the following do you own? Filter: Active riders; Weighted; Base n = 505indicates statistically significant difference compared to respondents not in that category
There was also a correlation between protective gear and the number and types of bikes kept at home. Those who owned more than one motorcycle and those who owned motorcycles with larger engines tended to own more items of motorcycle clothing (See Table 49 below).
Table 49: Average number of items by ownership characteristics - 2014
Average Type of bike (main bike) Number of bikes at home Capacity of main bike
Off road bike/ trail
bike (n=125)
Road bike
(n=281)Scooter (n=38)*
None (n=49)
1 only (n=234)
2 or more
(n=228)0-250cc (n=174)
251-700cc
(n=152)701+cc (n=126)
Motorcycle helmet - open face 0.5 0.8 0.8 0.6 0.5 1.0 0.6 0.5 1.0
Motorcycle helmet - full face 1.7 1.6 1.1 1.1 1.4 1.7 1.3 1.6 1.7
Pair(s) of motorcycle riding boots 1.3 1.3 0.6 0.9 1.1 1.5 0.9 1.4 1.4
Motorcycle riding jacket(s) 1.5 2.1 1.6 1.3 1.7 2.0 1.4 1.7 2.3
Pair(s) of motorcycle riding pants 1.6 1.7 0.8 1.1 1.5 1.7 1.3 1.6 1.8
Pair(s) of motorcycle riding gloves 2.4 2.3 1.5 1.6 1.9 2.7 1.7 2.4 2.5
One piece riding suit(s) 0.0 0.1 0.2 0.0 0.0 0.2 0.0 0.1 0.1
Q39a-f How many of the following do you own? Filter: Active riders; Weighted; Base n = 404indicates statistically significant difference compared to respondents not in that category*Note: small sample size
Reasons for owning multiple items of protective clothing were similar to 2013. The most common reason in 2014 was for different weather conditions or day vs. night (50%). This was followed by just under one in four mentioning that they had different items for different types of riding such as off-road gear vs. on-road gear (23%). (See Table 50).
Transport Accident CommissionMotorcycle Monitor 2014 | Page 98

Table 50: Reasons for owning multiple items of protective gear - 2013 vs. 2014
Column % 2013 2014
For different weather conditions/seasons/day vs. night 45 50
For different riding purposes/conditions i.e. off-road vs. on-road, recreation vs. commuting
27 23
Replacement/upgrade/kept outgrown/old/damaged/out-dated/better safety gear 19 15
For other riders/passengers to use 18 13
To have a choice/have a spare/just wanted multiples 10 11
Safety reasons - 5
Ride frequently and often need a change of riding gear/if gear is wet 5 6
Aesthetics/different style 4 9
For different bikes 3 1
Different materials - 0
Comfort 2 1
Work gear 1 0
Other reasons 3 5
Q40 You have mentioned that you own multiple pieces of protective clothing. What are the main reasons you have more than one of the above?Filter: Active riders with multiple items of gear; Weighted; 2013 Base n =269 2014 Base n=345indicates statistically significant difference compared to respondents not in that category
Older riders aged 40 and over were significantly more likely to mention they had different gear for different weather conditions (57% vs. 24% for those aged 18-25 years and 39% of those aged 26-39 years).
Those who rode less often (less than 20% of the time) were more likely to have items for different riding purposes and conditions (27% vs. 13% of those who rode more often). This was also the case for recreational on-road, with 55% of them having different gear for different riding purposes and conditions (Table 51).
Transport Accident CommissionMotorcycle Monitor 2014 | Page 99

Table 51: Reasons for owning multiple items of protective gear by riding activity -2014
Column % Riding vs. driving Riding purpose (Active riders)
Ride less than 20% (n=209)
Ride more than 20% (n=136)
Commute (n=211)
Recreational on-road (n=272)
Recreational off-road (n=164)
For different weather conditions/seasons/day vs. night 49 53 56 55 37
For different riding purposes/conditions i.e. off-road vs. on-road, recreation vs. commuting
27 13 22 23 40
Replacement/upgrade/kept outgrown/old/damaged/out-dated/better safety gear
12 22 19 16 13
For other riders/passengers to use 12 15 11 15 8
To have a choice/have a spare/just wanted multiples 11 12 11 10 12
Safety reasons 7 0 3 5 5
Ride frequently and often need a change of riding gear/if gear is wet 4 11 2 2 11
Aesthetics/different style 8 10 9 9 4
For different bikes 1 1 2 1 2
Other reasons 6 4 5 6 4
Different materials 0 0 0 0 0
Comfort 2 1 0 2 0
Work gear 0 0 0 0 0
Q40 You have mentioned that you own multiple pieces of protective clothing. What are the main reasons you have more than one of the above?Filter: Active riders with multiple items of gear; Weighted; 2014 base n = 345indicates statistically significant difference compared to respondents not in that category
Those who did not own a complete set of gear - i.e. at least one helmet, pair of riding gloves and boots, jacket and pants (or one piece riding suit) - were asked the reasons why they did not own more gear. The most common reasons in 2014 were that they hadn’t gotten around to buying it (20%). Other reasons included:
● 19% who did not think they needed it;● 18% said it was too expensive;● 18% mentioned it was because they only rode in the country or off-road; and● 13% said they did not own more gear because they only rode for short trips.
Transport Accident CommissionMotorcycle Monitor 2014 | Page 100

Protective gear useRespondents were asked the frequency with which they wore protective gear with results shown in Figure 56.
Almost all respondents (95%) said they wore a motorcycle helmet all the time. Eight in ten respondents (80%) reported they wore gloves all the time. Riding jackets were worn all the time by 62% of respondents and boots worn all the time by 66% of respondents.
Riding pants were worn less frequently with just under half (46%) respondents stating they wore them all the time. Nearly one in five (18%) never wore motorcycle riding pants.
A one piece riding suit was the least likely item to be worn all the time (3%) – although this is not surprising given the low level of ownership among active riders.
No changes between 2013 and 2014 were evident.
Figure 56: Usage of protective motorcycle clothing regardless of ownership - 2014
95
80
62
46
3
66
1
8
21
18
1
20
0
3
5
7
0
4
2
6
6
11
5
3
1
2
7
18
89
7
0
0
0
1
2
0
0 20 40 60 80 100
Motorcycle helmet( n =506)
Motorcycle riding gloves( n =503)
Motorcycle riding jacket( n =501)
Motorcycle riding pants( n =496)
One piece riding suit(s)( n =464)
Any type of boots( n =499)
%
All the time Most of the time About half the time Some of the time Never Don’t Know
Q42a-f When riding a motorcycle, how often do you wear the following items of protective motorcycle clothing? Filter: Active riders; Weighted; Base n = 464-506
Transport Accident CommissionMotorcycle Monitor 2014 | Page 101
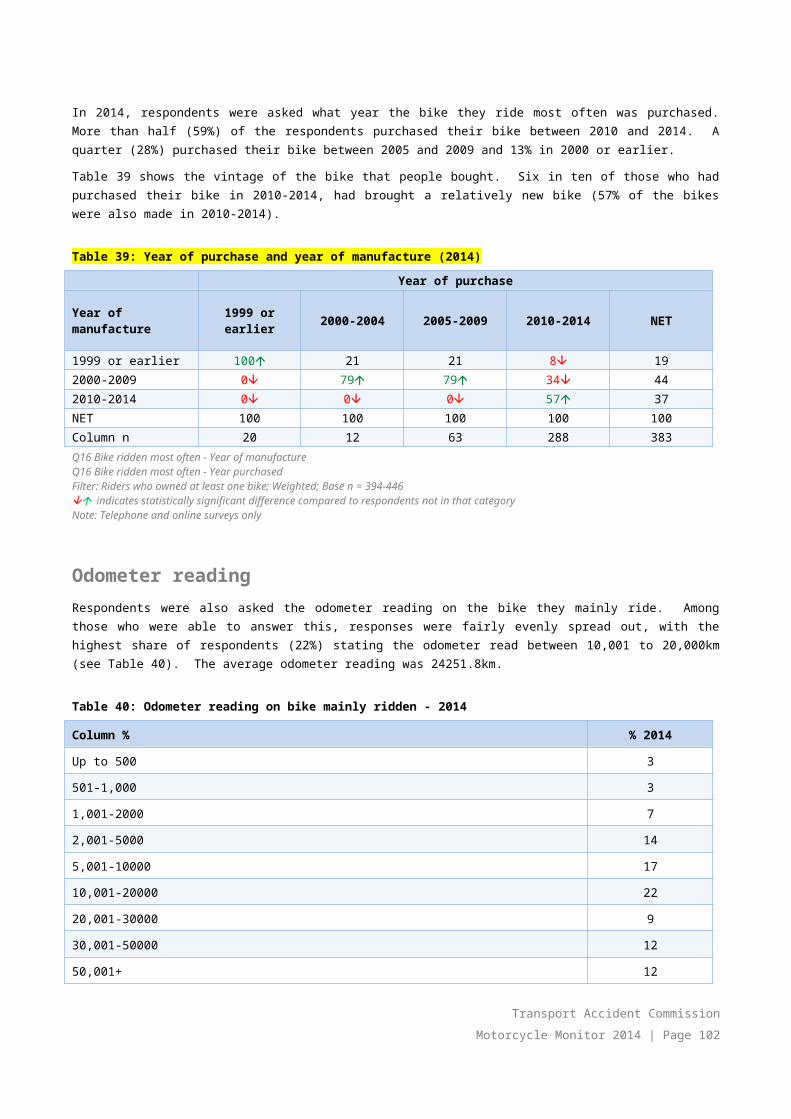
Figure 57 shows the frequency of usage among those who reported they owned the respective items.
While the proportion of those who always wore respective items of gear was slightly higher if ownership was taken into account, only 66% of those who owned a jacket wore them all the time, 72% of respondents who any boots wore then all the time and around half (56%) who owned motorcycle pants wore them all the time.
Figure 57: Usage of protective motorcycle clothing where owned by respondent – 2014
96
81
66
72
56
9
1
9
23
20
22
8
0
3
5
4
8
3
2
6
4
2
13
58
1
1
2
3
2
21
0
0
0
0
0
1
0 20 40 60 80 100
Motorcycle helmet
Motorcycle riding gloves
Motorcycle riding jacket
Any type of boots
Motorcycle riding pants
One piece riding suit(s)
%
All the time Most of the time About half the time Some of the time Never Don’t Know
Q42a-f When riding a motorcycle, how often do you wear the following items of protective motorcycle clothing? Filtered: Active riders; Weighted; Base n = from 454
Transport Accident CommissionMotorcycle Monitor 2014 | Page 102
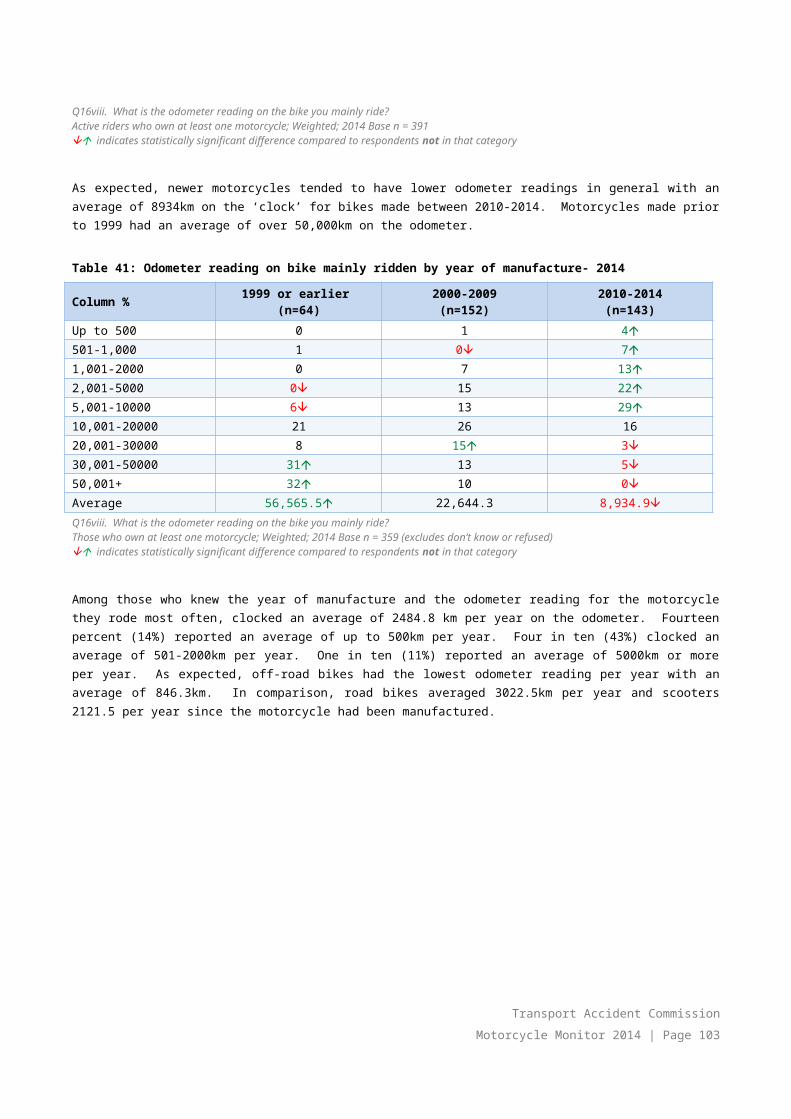
Figure 58 shows the usage of protective gear among those who owned a complete set of gear (i.e. helmet, gloves, boots, jacket and pants (or a one piece suit). However, riding pants were still only worn on every ride by almost six in ten (57%) respondents who had a complete set of protective gear.
Figure 58: Usage of protective motorcycle clothing where owned by respondent (among those who owned a complete set of gear) - 2014
97
87
68
57
1
70
1
7
24
22
1
21
0
2
3
7
0
5
0
2
3
12
6
2
1
1
2
2
89
3
0
0
0
0
2
0
0 20 40 60 80 100
Motorcycle helmet
Motorcycle riding gloves
Motorcycle riding jacket
Motorcycle riding pants
One piece riding suit(s)
Any type of boots
%
All the time Most of the time About half the time Some of the time Never Don’t Know
Q42a-f When riding a motorcycle, how often do you wear the following items of protective motorcycle clothing? Filter: Own complete set of gear; Weighted; Base n = 317 to 346Note: Excludes those who own none of the items
Transport Accident CommissionMotorcycle Monitor 2014 | Page 103

Looking at the number of items worn by active riders (including helmets), two thirds (64%) of respondents said they wore three or more items all the time. Eight six percent (86%) of respondents reported they wore three or more items (including a helmet) most or all the time.
Table 52: Number of items worn when riding - 2014
Number of items of protective clothing % worn all the time
0 1
1 11
2 24
3 27
4 36
5 1
Number of items of protective clothing % worn all or most of the time
0 0
1 3
2 11
3 21
4 50
5 14
Q42a-f When riding a motorcycle, how often do you wear the following items of protective motorcycle clothing? Filter: Own complete set of gear; Weighted; Base n = 462
In 2014, respondents were asked specifically about the type of footwear they wore when riding a motorcycle. In total, two in three respondents said they wore either riding boots or other boots all the time (68%). Thirty seven percent (37%) reported they wore specific motorcycle riding boots all the time. Fourteen percent (14%) reported they wore other boots every time they rode.
When asked whether they agreed or disagreed with the statement “wearing boots that cover my ankles will protect my feet better than other shoes would”, the vast majority of respondents (94%) agreed with the statement (with 80% strongly agreeing and 13% agreeing somewhat). Females were significantly more likely to agree with this statement (99% vs. 93% of males).
In 2014, 25% of active riders reported that they always wore a complete set of gear - i.e. that they always wore either both jacket and pants (or a one piece suit) with a helmet, gloves, and boots when they rode.
Those who did not wear the full kit of gear all the time were asked why this was the case. Overall, it depended on the riding style and type of trip (mentioned by 47%), followed by weather conditions (25%). For other commonly mentioned reasons, see Table 57 below.
Transport Accident CommissionMotorcycle Monitor 2014 | Page 104

Table 53: Main reasons for not wearing protective gear every time - 2014
2014 %
Depends on the destination / riding style / length of trip / speed 47
Depends on the weather /only wear for cold / rainy weather / humidity and summer temperatures 25
I do wear (item of protective clothing) a jacket, boots, gloves, etc. 17
I do always wear the gear that I own / I don't own all the protective clothing listed 14
Inconvenient to change clothes / need to wear other clothing for work / need a changing area / hassle to carry extra clothing
11
Clothing is cumbersome / restrictive / impractical / unwieldy / get in the way / other clothing is more comfortable
11
Too dear / expensive / difficult to find in my size 5
Convenience / easier / too much of a hassle / I`m lazy 4
Other mentions 7
None / Nothing 1
Don’t know 1
Q43 You have said you don’t wear all your protective motorcycle clothing every time you ride… What are the main reasons for this? Filtered: Active riders; those who did not wear full kit all the time; Weighted; Base 2014 n = 300
Reasons among female and male riders were similar in their main reasons for not wearing protective gear every time (See Table 54).
Table 54: Main reasons for not wearing protective gear every time – by gender – 2014
Male (n = 245)
Female (n = 54)
Depends on the destination / riding style / length of trip / speed 48 38
Depends on the weather /only wear for cold / rainy weather / humidity and summer temperatures
24 40
I do wear (item of protective clothing) a jacket, boots, gloves, etc. 17 16
I do always wear the gear that I own / I don't own all the protective clothing listed 15 9
Inconvenient to change clothes / need to wear other clothing for work / need a changing area / hassle to carry extra clothing
11 15
Clothing is cumbersome / restrictive / impractical / unwieldy / get in the way / other clothing is more comfortable
9 23
Too dear / expensive / difficult to find in my size 5 10
Convenience / easier / too much of a hassle / I`m lazy 5 1
None / Nothing 1 0
Don’t know 1 1
Other mentions 7 9
Q43 You have said you don’t wear all your protective motorcycle clothing every time you ride… What are the main reasons for this? Filtered: those who did not wear full kit all the time; Weighted; Base 2014 n = 299indicates statistically significant difference between genders
Transport Accident CommissionMotorcycle Monitor 2014 | Page 105

Protective gear purchase intentions Respondents were asked what, if any, motorcycle clothing they intended to buy in the next six months. Just under two-thirds intended to purchase something in the near future (63%). The items most likely to be bought in the near future were pants (19%), boots and helmet (both 15%). Results were unchanged compared to 2013.
Table 55: Motorcycle clothing purchase intentions for next 6 months – 2013 vs. 2014
2013 % 2014 %
Don’t intend to buy any 45 37
Helmet 18 15
Gloves 18 12
Boots 14 15
Jacket 15 11
Pants 17 19
Body Armour 6 5
LEATT Neck Brace 5 3
Other 1 1
None of the above 17 19
Q45 What, if any, motorcycle clothing do you intend to buy in the next 6 months? Filter: Active riders; Weighted; 2013 Base n = 405; 2014 Base n = 511
In 2014, intentions to purchase gear were highest among riders aged 18-25 years (57%) and lowest among those aged 40+ (41%). This year, young riders (18-25 years) were significantly more likely to intend to buy jackets than older riders (24% compared to 12% of those aged 26-39 year olds and 9% of those aged 40 years and over).
Table 56: Motorcycle clothing purchase intentions for next 6 months by age - 2014
Column % Age
18-25 (n=185) 26-39 (n=137) 40+ (n=188)
Don’t intend to buy any 27 30 41
Subtotal – Intend to buy at least 1 item 57 51 41
- Helmet 20 20 13
- Gloves 18 15 9
- Pants 23 20 18
- Jacket 24 12 9
- Boots 16 18 14
- Body Armour 6 10 3
- LEATT Neck Brace 6 5 2
- Other 4 2 0
None of the above 16 19 19
Q45 What, if any, motorcycle clothing do you intend to buy in the next 6 months? Filter: Active riders; Weighted; Base n = 510indicates statistically significant difference compared to those not in that category
Transport Accident CommissionMotorcycle Monitor 2014 | Page 106

Respondents who already owned a complete set of gear were statistically no more or less likely to report they intended to purchase some gear in the future than those who did not (40% compared to 29%), however, those who did not own a complete set of gear were more likely to not tick any of the items above (27%).
Table 57: Motorcycle clothing purchase intentions for next 6 months by whether riders currently own a complete set of protective gear - 2014
Column % Own complete set of gear (n=347)
Do not own complete set of gear (n=164)
Don’t intend to buy any 40 29
Subtotal - At least one item 45 44
Helmet 15 15
Gloves 12 12
Boots 14 17
Jacket 9 15
Pants 16 26
Body Armour 5 4
LEATT Neck Brace 4 1
Other verbatim 0 0
None of the above 15 27
Q45 What, if any, motorcycle clothing do you intend to buy in the next 6 months? Filter: Active riders; Weighted; Base n = 511indicates statistically significant difference compared to those not in that category
When looking to purchase motorcycle clothing, around 40% reported they looked for the CE (European Union) standard or the Snell logo, significantly down from 2013 (47%). However, a substantial proportion of active riders were not aware of the CE standard or Snell (34% - 2013, similar to 31% last year). A lack of awareness of the European Union standard was much more prevalent among female riders (49% did not know what it was) compared to males (32%).
Body armourAs shown in Table 58, two thirds of active riders reported they owned at least one piece of body armour (64%, similar to 2013 – 66%). The most common pieces of armour owned were inserts for riding jackets (45%); followed by inserts for riding pants (31%) and back protectors (separate piece) (26%), all consistent with 2013. In 2014, riders were significantly less likely to say they owned a chest protector (separate piece) (11%) and a LEATT Neck brace (4%) compared to 2013.
Transport Accident CommissionMotorcycle Monitor 2014 | Page 107

Table 58: Body armour owned by year - 2013 vs. 2014
2013 % 2014 %
Subtotal – at least one item 66 64
Back protector (separate piece) 32 26
Chest protector (separate piece) 21 11
Inserts for riding jackets 43 45
Inserts for riding pants 36 31
Body armour kit 15 23
LEATT Neck brace 10 4
Other body armour 21 7
None of the above 35 36
Q44. Do you own any of the following pieces of body armour? Filter: Active riders; Weighted; 2014; base n = 511indicates statistically significant difference compared to those not in that category
The items of body armour that were more likely to be owned by off-road bike riders included chest protectors (21%), body armour kits (52%) and LEATT neck braces (13%). Those who mainly rode scooters were most likely to own inserts for riding jackets (71%) and a back protector (47%) (See Table 59).
Table 59: Body armour owned by main bike ridden
Column % Type of bike (main bike)
Off road bike/trail bike (n=125)
Road bike (n=281) Scooter (n=38)*
Inserts for riding jackets 31 52 71
Inserts for riding pants 33 36 16
Back protector (separate piece) 28 26 47
Chest protector (separate piece) 21 9 0
Body armour kit 52 14 0
LEATT Neck brace 13 2 0
Other body armour 72 63 73
None of the above 28 37 27
Q44. Do you own any of the following pieces of body armour? Filter: Active riders who have at least one bike at home; Weighted; 2014 Base n = 444indicates statistically significant difference compared to those not in that category*Note: Small sample size
Transport Accident CommissionMotorcycle Monitor 2014 | Page 108
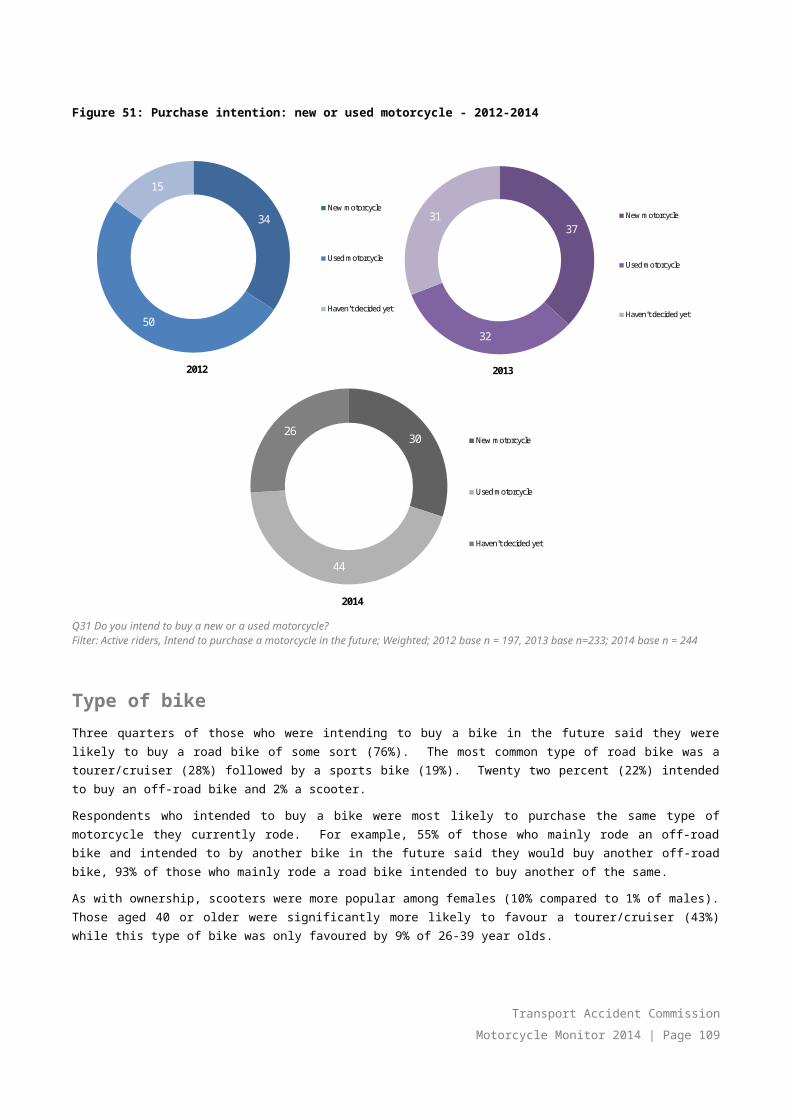
9.2 Attitude statements about motorcycle safety clothingA series of statements regarding motorcycle clothing was put to all respondents. The level of agreement/disagreement with these statements is shown in Figure 59.
There was a strong belief that motorcycle clothing did provide protection in the event of a crash, with nearly two-thirds (62%) of all respondents strongly agreeing with this statement.
Just under three quarters (71%) of all respondents strongly agreed that ‘motorcyclists should always wear motorcycle clothing (jacket, pants, boots and gloves) while riding’.
Figure 59: Agreement/disagreement with statements regarding motorcycle safety clothing
62
71
80
22
21
13
7
1
1
5
3
2
4
3
3
0
1
1
0 20 40 60 80 100%
Strongly agree Somewhat agree Neither Somewhat disagree Strongly disagree Don’t know
Motorcycle clothing protects me in the
event of a crash
There should be a government scheme to help me purchase motorcycle clothing
I think motorcyclistsshould always wear motorcycle clothing (jacket, pants, boots
and gloves) while riding
Q55 To what extent do you agree or disagree with the following statements...Filter: Excluding never ridden motorcycle; Total sample; Weighted; Base n = 569 to 574
There was a significant difference in agreement between those who wore their protective gear (jacket, pants, gloves, boots and helmet) all the time and those who did not in relation to the statement I think motorcyclists should always wear motorcycle clothing (jacket, pants, boots and gloves) while riding. Nine in ten respondents (90%) of active riders wore a full set of protective gear all the time strongly agreed with the statement compared to 50% who strongly agreed among those who did not wear their full kit all the time.
Transport Accident CommissionMotorcycle Monitor 2014 | Page 109

10. Motorcycle crash historyAll respondents were asked whether they had ever experienced a crash. In comparing the results from 2012 to 2014, the proportions of riders who had experienced a crash were similar (47% in 2014 vs. 46% in 2013 vs. 54% in 2012). The location, and to whom the fault was attributed were also broadly similar, as was the proportion of respondents who received compensation as a result of this crash.
Half of those who had experienced a crash reported they required medical treatment as a result (50%). Only a minority (8%) reported that their most recent crash was in the last 12 months. Half of all those who had experienced a crash said it had happened more than 11 years ago (52%). With riders being skewed towards the older age groups, this suggests that crashes requiring medical treatment were more likely to happen in the earlier years of their riding careers.
Off road bikes made up one in three of the crashes that required medical attention (32%) – slightly but not significantly higher than the proportion who said they mainly rode an off-road bike (25%). Just over half of the crashes had occurred on an on-road bike (56%) with a higher representation of sports tourer bikes among those who had a crash requiring medical attention compared to 2013 (16% vs. 5%).
One in four of those who had crashed in an on-road environment reported that they had been at fault (25%) with one in three saying that another party was at fault (35%) and an additional 16% who said that fault could be attributed to the two parties. One in ten (11%) reported that no other vehicles were involved in the crash.
A third (30%) of respondents who had ever experienced a crash received compensation or income support as a result of injuries they had received due to a motorcycle crash – most (75%) of whom received this from the TAC.
Transport Accident CommissionMotorcycle Monitor 2014 | Page 110

10.1 Crash history All respondents were asked whether they had ever experienced a crash while riding a motorcycle (excluding dropping their bike while stationary or crashing while taking part in motorcycle sport). Just under half (47%) of respondents in 2014 had done so - similar to 2013 (46%) (See Figure 60). In 2014, respondents were asked how many times they had crashed in the last 12 months. Of those that had crashed, over half (58%) had crashed only once. Just over one in four (28%) had crashed 2-4 times and 14% had crashed 5 or more times.
Figure 60: Motorcycle crash history - 2012-2014
54
46
2012
Yes
No
46
54
2013
Yes
No
4753
2014
Yes
No
Q56 Have you ever had a crash while riding a motorcycle?Total sample; Weighted; 2012 base n = 545; 2013 base n = 694; 2014 base n = 778Note: excludes prefer not to say and never ridden
Younger riders were significantly less likely compared to those aged 26 or older to have experienced a crash (37% vs. 43% of 26-39 year-olds and 59% of those aged 40+). There were no significant differences between gender and location in 2014.
Transport Accident CommissionMotorcycle Monitor 2014 | Page 111

Table 60: Motorcycle crash history by rider characteristics - 2014
% Yes
Gender
Male 48
Female 38
Age
18-25 37
26-39 43
40+ 59
Location
Melbourne 59
Balance of Victoria 43
Q56 Have you ever had a crash while riding a motorcycle?Total sample; Weighted; Base n= 774 to 778indicates statistically significant difference compared to respondents not in that category Note: excludes prefer not to say and never ridden
10.2 Crashes requiring medical treatmentHalf of those who had experienced a crash said they had needed medical attention as a result of the incident (50% vs. 49% in 2013).
As in 2013, with riders in the population skewed towards older age groups, it is not surprising that the majority of those who had needed medical treatment for their most recent crash reported this had been 11 years ago or more (52% vs. 56% in 2013).
In 2014, very few riders who had needed medical treatment for their most recent crash reported this had occurred in the last 12 months (8%). Just over one-in-five riders who had needed medical treatment for their most recent crash said this had been between 1-5 years ago (19%) (See Table 61).
Table 61: Details of most recent crash requiring medical treatment – time of crash 2012 vs. 2013
% 2013 % 2014
Required medical treatment as a result of crash 49 50
Time of crash % 2013 % 2014
Within the last 12 months 6 8
1 to 5 years ago 20 19
6 to 10 years ago 17 19
11 or more years ago 56 52
Can’t say 1 3
Q57 Have you required medical treatment as a result of any motorcycle accident? Filter: Ever experienced crash; Weighted 2013 base: n=116; 2014 base n=139Q58 When did the crash occur?Filter: Excluding never ridden a motorcycle; Weighted; 2012 base n=108; 2013 base n=115indicates statistically significant difference compared to respondents not in that category Filter: Required medical treatment
Transport Accident CommissionMotorcycle Monitor 2014 | Page 112

Although sample sizes were small, more than half (61%) of 18-25 year olds reported having a crash requiring medical treatment in the last 1-5 years. Six in ten of riders aged 40+ had crashed more than 11 years ago (61%) suggesting that crashes tended to occur in the early stages of a rider’s motorcycling experience.
Table 62: Details of most recent crash requiring medical treatment – time of crash by age
Column % Age
18-25(n=23)*
26-39(n=39)*
40+(n=76)
Within the last 12 months 39 14 4
1 to 5 years ago 61 31 13
6 to 10 years ago 0 24 19
11 or more years ago 0 31 61
Can’t say 0 0 4
Q58 When did the crash occur?Filter: Excluding never ridden a motorcycle; Weighted; base n = 139indicates statistically significant difference compared to respondents not in that category Filter: Required medical treatment
As shown in Table 63, respondents were most likely to say they went to the Emergency Department for medical treatment (58%). Over a third said they had been admitted to hospital in their most recent incident (39%), while just under a quarter reported they had gone to their local doctor for treatment (23%). There was an increase in those who reported being treated by an ambulance at the scene (32% vs. 12% in 2013).
Table 63: Details of most recent crash requiring medical treatment - 2013 vs. 2014
Experienced crash: % 2013 % 2014
Required medical treatment as a result of crash 49 50
Type of treatment % 2013 % 2014
Went to Emergency 47 58
Admitted to hospital (in a ward) 32 39
Went to my doctor 20 23
Saw a physiotherapist/chiropractor or similar 14 17
Treated by ambulance at the scene 12 32
Admitted to a rehabilitation facility 2 8
Radiologist/x-ray - -
Other verbatim 10 1
Can’t say / don’t recall 1 1
Q56 Have you ever had a crash while riding a motorcycle? Filter: Excluding never ridden a motorcycle; Weighted; Q57 Have you required medical treatment as a result of any motorcycle accident? Q62 What sort of treatment did you require? 2012 base n=112; 2013 base n=136indicates statistically significant difference compared to respondents not in that category Filter: Required medical treatment;
Transport Accident CommissionMotorcycle Monitor 2014 | Page 113
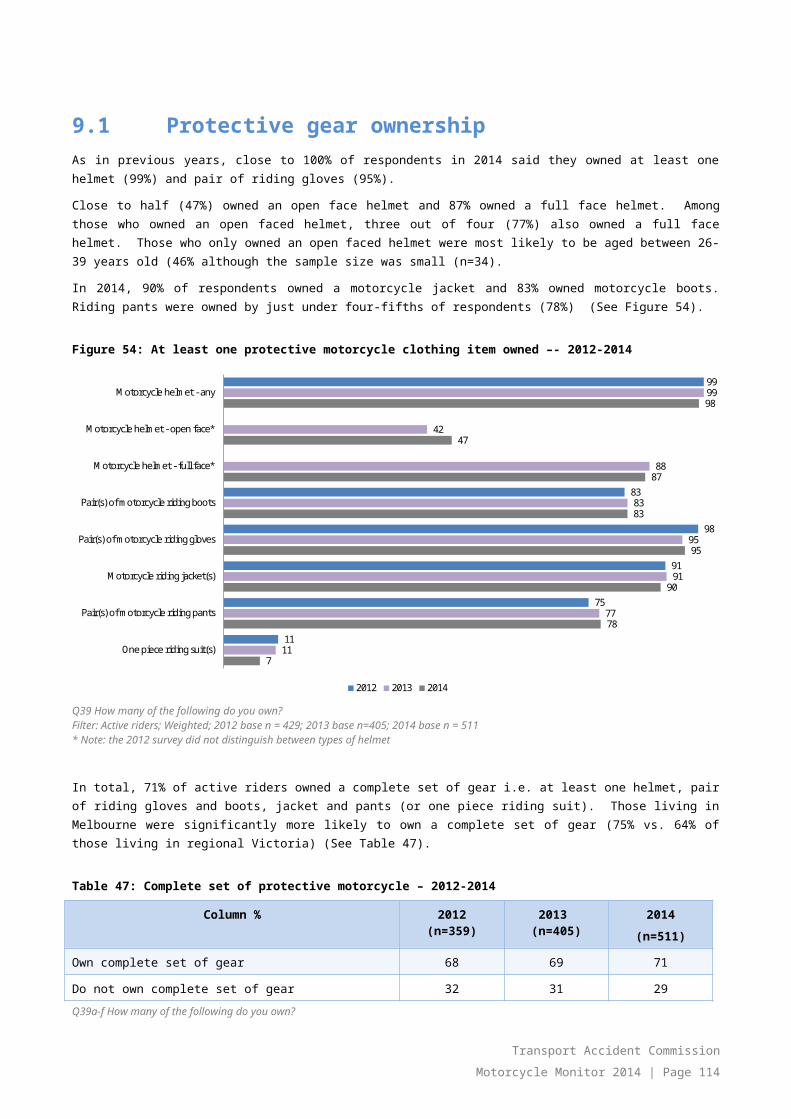
10.3 Circumstances of most recent crashIn 2014, 32% of those who crashed and required medical treatment had been riding an off-road bike. More than half (56%) had been riding a road bike. Compared to 2013, there was a significant increase in those who were riding a sports tourer bike (16% vs. 5% in 2013).
Scooters were ridden by only 6% those who had experienced a crash requiring medical attention.
Table 64: Details of most recent crash requiring medical treatment 2013 vs. 2014
Type of bike ridden during crash % 2013 % 2014
Off-road bike/trail bike 39 32
Subtotal – Road bike (excluding scooters and other types of bikes) 50 56
- Sports bike 22 26
- Sports tourer 5 16
- Dual sport 0 2
- Tourer/cruiser 20 11
- Other road bike 2 1
Scooter 4 6
Other type of bike 7 5
Can’t recall 1 0
Q60 What type of bike were you riding? Filter: Required medical treatment; Weighted; 2013 base n =; 2014 base n=141indicates statistically significant difference compared to respondents not in that category
Respondents whose most recent crash happened on a road bike were less likely to have said it occurred 1 to 5 years ago (10%). Those who crashed on a scooter were less likely to have said that it occurred 11 or more years ago (20%) (Table65).
Table 65: Details of most recent crash requiring medical treatment – Time since crash by type of bike - 2014
Column % Off road bike/trail bike
(n=52)
Road bike (n=71)
Scooter (n=11)*
Total (n=138)
Within the last 12 months 7 8 19 8
1 to 5 years ago 30 10 61 19
6 to 10 years ago 21 23 0 19
11 or more years ago 41 56 20 51
Can’t say 2 4 0 3
Q58 When did the crash occur?Q60 What type of bike were you riding?Filter: Required medical treatment and crash occurred on-road/sealed road surface; Weighted; 2014 base n=138“Other type of bike” not shown in table aboveindicates statistically significant difference compared to respondents not in that category * Small sample size
Sealed roads in built-up areas were the most common location in both years (45% in 2014 and 51% in 2013). Almost one in four (23%) of incidents requiring medical treatment occurred on sealed roads in rural areas. Figures for both 2013 and 2014 are similar. (See Table 64).
Transport Accident CommissionMotorcycle Monitor 2014 | Page 114

Table 66: Details of most recent crash requiring medical treatment – Location of crash - 2013 vs. 2014
Location of crash 2013 2014
Sealed road, built-up area 51 45
Sealed-road, rural area 12 23
Unsealed road 8 6
Track in state park /forest/plantation 15 13
Private property 6 6
Public land in residential areas (e.g. park, reserve, bicycle track) 1 1
On a race track (on a track day or as part of a riding course) 5 4
Other 3 1
Q61. Where did the crash occur? Filter: Required medical treatment; Weighted; 2013 base n = 116; 2014 base n=142indicates statistically significant difference compared to respondents not in that category
In 2014, for those whose most recent crash requiring medical treatment occurred while on an off-road bike, the most common location was on a track in state park/forest/plantation (40%) followed by private property (18%). Two thirds (67%) of those who were on a road bike during their most recent crash had done so on a sealed road in a built up area (See Table 67).
Table 67: Details of most recent crash requiring medical treatment – Location of crash by type of bike - 2014
Column %
Off road bike/trai
l bike (n=102)
Road bike
(n=127)
Scooter (n=17)*
Total (n=256)
Sealed road, built-up area 12 67 78 48
Sealed-road, rural area 5 27 16 18
Unsealed road 17 2 6 7
Track in state park /forest/plantation 40 0 0 14
Private property 18 0 0 9
Public land in residential areas (e.g. park, reserve, bicycle track) 0 2 0 1
On a race track (on a track day or as part of a riding course) 8 1 0 4
Other 1 2 0 1
Q61 Where did the crash occur? Q60 What type of bike were you riding?Filter: Required medical treatment; Weighted; 2014 base n=256“Other type of bike” not shown in table aboveindicates statistically significant difference compared to respondents not in that category * Small sample size
Table 68 shows the details of who else was involved in the crash. In 2014, 35% believed another party was at fault in their most recent crash requiring medical treatment. One in four (25%) respondents reported they themselves were at fault. Fewer respondents reported that no one was at fault (2% in 2014 compared to 10% in 2013).
Transport Accident CommissionMotorcycle Monitor 2014 | Page 115

Table 68: Details of most recent crash on-road requiring medical treatment – perceived fault – 2013 vs. 2014
Perceived fault % 2013 % 2014
I was at fault 17 25
Another party was at fault 48 35
Both myself and another party were at fault 6 16
No-one was at fault 10 2
No other vehicles involved 7 11
Other 11 10
Can’t say 1 0
Q59 Who do you believe was at fault?Filter: Required medical treatment and crashed on-road/sealed surface; Weighted; 2013 base n = 74, 2014 base n=101.indicates statistically significant difference compared to respondents not in that category
In 2014, those who were on off-road/trail bikes were most likely to say that no other vehicles were involved (36%) and those on a scooter were most likely to say that another party was at fault (71%) although the sample sizes were small in both 2013 and 2014.
Table 69: Details of most recent crash requiring medical treatment – Fault by type of bike - 2014
Column %Off road bike/trail
bike (n=16)*
Road bike (n=71)
Scooter (n=10)*
Total (n=100)
I was at fault 37 26 11 26
Another party was at fault 27 34 71 35
Both myself and another party were at fault 0 16 10 16
No-one was at fault 0 3 0 2
No other vehicles involved 36 8 0 12
Other 0 13 9 10
Can’t say 0 0 0 0
Q59 Who do you believe was at fault?Q60 What type of bike were you riding?Filter: Required medical treatment and crash occurred on-road/un-sealed road surface; Weighted; 2014 base n=100“Other type of bike” not shown in table aboveindicates statistically significant difference compared to respondents not in that category * Small sample size
Transport Accident CommissionMotorcycle Monitor 2014 | Page 116
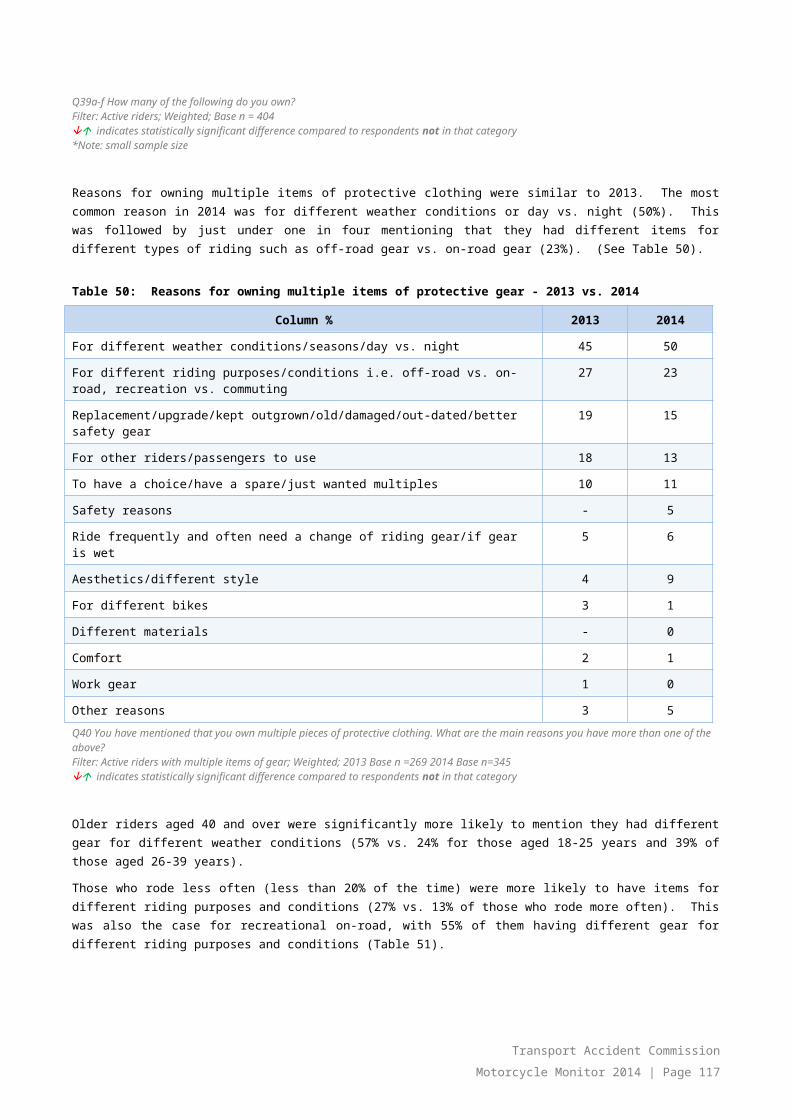
In 2014, those who experienced a crash on a sealed road in a built-up area were most likely to say another party was at fault (52%). While sample sizes were small and results should be treated as indicative, those who incurred a crash requiring medical attention on unsealed road were most likely to say they were at fault (64%).
Table 70: Details of most recent crash on-road requiring medical treatment – Perceived fault by crash location (on-road only) - 2014
Column % Sealed road, built-up area
(n=59)
Sealed-road, rural area
(n=31)*
Unsealed road (n=11)*
Total (n=101)
Another party was at fault 52 13 0 35
I was at fault 20 25 64 25
No-one was at fault 1 3 8 2
No other vehicles involved 9 12 28 11
Both myself and another party were at fault 12 25 0 16
Other 6 22 0 10
Can’t say 0 0 0 0
Q59 Who do you believe was at fault?Q61 Where did the crash occur?Filter: Required medical treatment and crashed on-road/sealed surface; Weighted; base n=101.indicates statistically significant difference compared to respondents not in that category *Note: small sample sizes
In 2014, those whose crash occurred off-road were asked what they believed caused the crash. Among the 31 respondents, the most common response was rider error (42%), followed by road/trail conditions (38%) and terrain (24%).
Table 71: Details of most recent crash off-road requiring medical treatment – Perceived cause (off -road only) - 2014
Column % 2013 2014
Rider error 30 42
Lapse in concentration 18 9
Road/trail conditions 17 38
Trees (e.g. fallen logs, overhanging branches) 13 9
Doing tricks 8 2
Terrain 8 24
Mechanical failure of the motorcycle 7 3
Weather conditions 4 8
Other 3 8
Q59a What caused your crash? Q61 Where did the crash occur?Filter: Required medical treatment and crashed off-road; Weighted; 2014 base n=44; Weighted 2013 base n=42indicates statistically significant difference compared to respondents not in that category
Transport Accident CommissionMotorcycle Monitor 2014 | Page 117

Respondents who had crashed and had required medical attention were asked their opinion on a range of statements about their views on the circumstances their crash.
There was strong agreement with the statement “Wearing protective clothing helped reduce my injuries”, with 70% of respondents strongly agreeing with the statement.
There was an overall disagreement with statements related to their unfamiliarity with the motorcycle, tiredness, returning to riding after a break and being new to riding (see Table 61).
Around a third (36%) agreed strongly that another vehicle contributed to the crash.
Figure 61: Agreement/disagreement with statements regarding their most recent crash
6
7
7
8
15
26
33
36
47
70
2
8
4
4
21
25
19
4
17
11
3
2
7
6
10
9
9
5
9
11
7
13
14
5
22
17
7
2
10
5
82
71
68
76
31
23
32
53
17
3
0
0
1
1
1
0
0
0
1
I was returning to ridingafter a break of at least 6
months
I was new to riding at thetime
I was tired at the time ofthe crash
I was unfamiliar with themotorcycle I was riding at
the time of the crash
If I was riding more slowly, Icould have done something
to avoid the crash
There was nothing I couldhave done to prevent the
crash
Road/terrain conditionscontributed to the crash
Another vehicle contributedto the crash
I knew the crash area well
Wearing protective clothinghelped reduce my injuries
Strongly Agree Somewhat Agree Neither Somewhat Disagree Strongly Disagree Don't know
Q59B. Thinking about your most recent crash that required medical treatment, to what extent do you agree or disagree with the following statements?Filter: Crashed and needed medical treatment; Weighted; Base n = 128 to 131
Transport Accident CommissionMotorcycle Monitor 2014 | Page 118
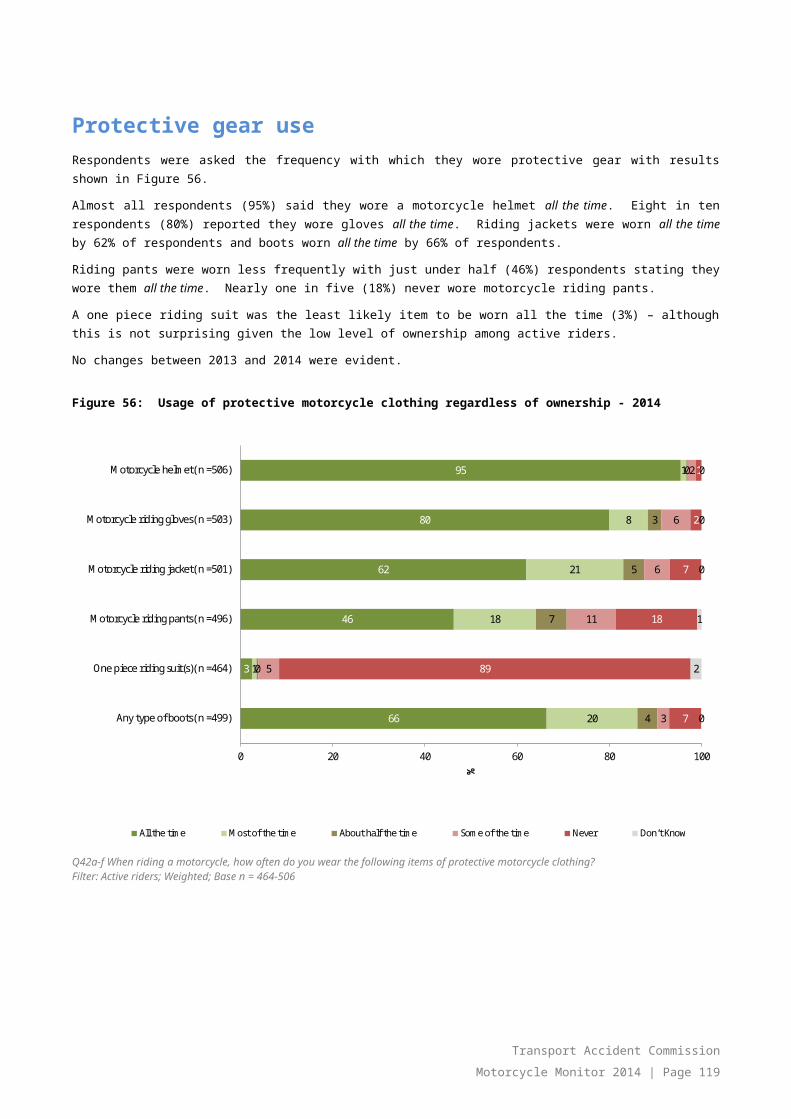
Some demographic differences included:
● Females more likely to report they agreed that there was nothing they could do to avoid the crash (78% vs. 49%); and ● Those living in regional Victoria were more likely to agree that if they were riding more slowly, they could have done
something to avoid the crash (50% vs. 28% of those who lived in Melbourne).
CompensationThree in ten riders (30%) said they received compensation for injuries from a motorcycle crash. Among the 35 respondents who had received compensation or income support, the vast majority said they had received this from the TAC (75%). The remainder reported sources such as personal insurance organisations (24%), property/vehicle insurance organisations (8%) or through Centrelink (e.g. Disability Support Pension or Sickness Allowance) (2%) (See Table 72).
Table 72: Details of compensation received
Source of compensation % 2013 % 2014
TAC 76 75
Property/vehicle insurance organisation 14 8
Centrelink (e.g. Disability Support Pension or Sickness Allowance) 17 2
WorkSafe/WorkCover/Comcare 4 2
Personal insurance organisation (e.g. health, income protection) 0 24
Other 11 19
Prefer not to say 0 0
Q64 From whom did you receive this compensation?Filter: Ever crashed AND ever received compensation as a result of injuries from a motorcycle crash; Weighted; 2013 base n =30; 2014 base n=35indicates statistically significant difference compared to respondents not in that category
Transport Accident CommissionMotorcycle Monitor 2014 | Page 119

11. Respondent suggestions to improve rider safety
Respondents were asked their opinion about the statement “motorcyclists can only be safe on the road if both riders and drivers share responsibility for their safety”. A large majority of respondents (93%) agreed with this statement, with 81% strongly agreeing and 12% somewhat agreeing. A small proportion, 4%, disagreed with the statement.
This overwhelming opinion is reflected in the types of answers provided when respondents were asked unprompted if they had any suggestions about what the TAC could do to improve rider safety. These have been listed in Table 73.
The most common theme related to improving the awareness of road users or providing education by providing training on motorcycle safety and road sharing (27%). Related to this were suggestions around developing awareness campaigns or continuing existing advertising campaigns relating to motorcycle safety (12%). Maintaining the roads, fixing defects, removing potholes and cleaning up after road works was mentioned by one in ten respondents.
Table 73: Suggestions to the TAC about what they can do to improve rider safety - 2014
%
Improve road user awareness /education (include training in motorcycle and push bike safety/sharing the road etc.) 27
Awareness campaigns / continue the advertising 12
Maintain the roads / fix defects / remove pot holes / clean up after road works 10
Comprehensive learner rider courses / more supervised training 7
Increase rider awareness/responsibilities on roads e.g. abide by road rules/consideration of other road users etc. 7
Make the wearing of protective clothing mandatory 7
Legalise traffic splitting and filtering 6
Make licence harder to obtain - after 12 months / after obtaining full car licence… 5
More dedicated rider training/awareness e.g. refresher courses/advanced driving/safety issues etc. 5
Education / provide driver and rider training in schools 4
Make the wearing of high visibility vests and jackets mandatory 4
Restricted range of bikes / limit usage of powerful bikes by less experienced riders 3
Remove wire rope crash barriers / wire barriers can kill 3
Increase penalties for car drivers who cause smashes / speed / text / don’t indicate… 3
Refresher courses / compulsory re-sitting of tests for foreign licence holders 3
Other mentions 11
None / it’s up to the individual / riders are responsible for their own actions 10
Q72 Would you like to make any suggestions to the TAC about what they can do to improve rider safetyTotal sample; Weighted; Base n = 784
Transport Accident CommissionMotorcycle Monitor 2014 | Page 120

Respondents were also asked how many motorcyclists they thought had died on the roads in the previous year. Forty-one riders and pillions died on Victorian roads in 2013.1 Thirty nine percent (39%) thought between 26-50 motorcyclists died on the roads last year (see Table 74) with one in five greatly underestimating motorcycle fatalities thinking that there were between 0-25 deaths per year.
Table 74: Perception of motorcycle deaths - 2014
%
0 12
1-25 8
26-40 20
41-50 19
51-100 23
101-150 7
151-200 5
200+ 7
Q64B. How many motorcyclists do you think died on Victoria’s roads last year?Total sample; Weighted; Base n =583
When asked what they thought were the main causes of motorcycle deaths on the road, the most common response was drivers not paying attention to riders, or driver errors (48%), followed by speed (drivers and riders) (43%) and poor riding skills or inexperience (27%). Other mentions are highlighted in Table 75 below).
1 http://www.tac.vic.gov.au/road-safety/statistics/summaries/motorcycle-crash-data
Transport Accident CommissionMotorcycle Monitor 2014 | Page 121

Table 75: Main causes of motorcycle deaths on the road - 2014
%
Drivers lack of awareness/ cars not seeing motorcycles /Driver errors/careless driving/ not looking out for others
48
Speed/speeding 43
Bad riders/poor riding skills/inexperienced riders 27
Hooning/recklessness/risk taking/danger etc. 16
Cars/other drivers/car drivers/motorists/road users (no further information) 15
Road conditions/bad roads/poor road surface 10
Riders not paying attention/lack of concentration/tired/careless 7
Alcohol/drugs (drivers and/or riders) 9
Driver behaviour/bad drivers/inexperienced drivers/uneducated drivers 6
Fatigue/tiredness/drowsiness 5
Lack of protection for a rider/not wearing the right protective gear 5
Weather conditions/environmental factors 4
Collisions with cars/accidents with vehicles 4
Not riding to the conditions/traffic conditions 3
Drivers speeding/dangerous driving/hoons/drivers not following the road rules 3
Rider error/motorcyclists fault 3
Crashing/accidents/collisions with objects 2
Lane splitting 2
Riding overpowered bikes 2
Stupidity/idiots/lack of intelligence etc. 2
Blind spots 1
Other mentions 6
Don’t know 2
Q72 Would you like to make any suggestions to the TAC about what they can do to improve rider safetyTotal sample; Weighted; Base n = 568
Transport Accident CommissionMotorcycle Monitor 2014 | Page 122

Appendices Demographics
Table 76: Gender
Unweighted % Weighted %
Male 81% 88%
Female 19% 12%
Total 100% 100%
Q2 GenderFilter: 2014 ONLY; base n = 782
Table 77: Age
Unweighted % Weighted %
18-25 years 27% 6%
26-39 years 29% 26%
40+ years 44% 68%
Total 100% 100%
Q1 Age (Categories)Filter: 2014 ONLY; base n = 780
Table 78: Location (based on sample information)
Unweighted % Weighted %
Balance of Victoria 46% 38%
Melbourne 54% 62%
Total 100% 100%
Sample variable - locationFilter: 2014 ONLY; base n = 784
Table 79: Socio-Economic Index for Area Quintiles (based on sample information)
Unweighted % Weighted %
Transport Accident CommissionMotorcycle Monitor 2014 | Page 123
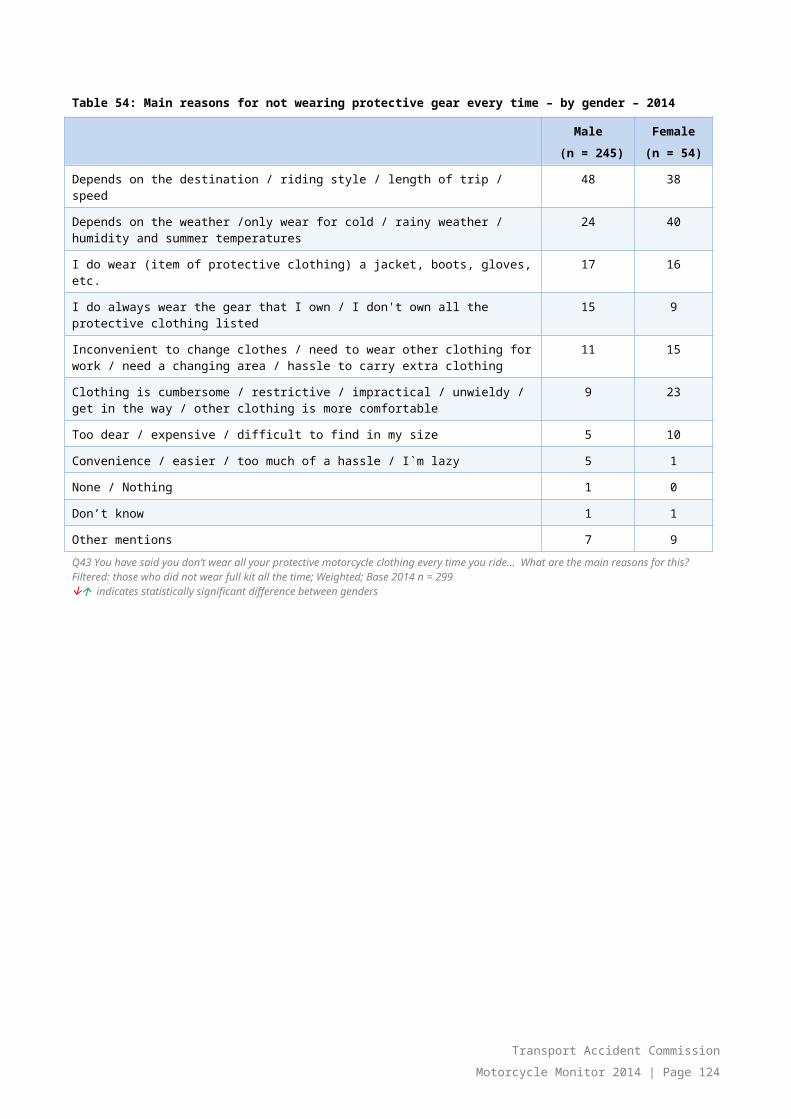
Quintile 1 (Most disadvantaged) 14% 13%
Quintile 2 16% 14%
Quintile 3 19% 16%
Quintile 4 28% 31%
Quintile 5 (Least disadvantaged) 23% 26%
Not classified 0% 0%
Total 100% 100%
Sample variable – SEIFA QuintileFilter: 2014 ONLY; base n = 776
Table 80: Motorcycle licence
Unweighted % Weighted %
Yes - Learner 10% 4%
Yes - Probationary 11% 3%
Yes - Full 76% 91%
No - no motorcycle/motor-scooter licence 0% 0%
No - Never held a motorcycle/motor-scooter licence 1% 1%
No – No longer hold a motorcycle/motor-scooter licence 2% 2%
Subtotal - No licence 3% 2%
Total 100% 100%
Q4 Do you have a motorcycle licence?Filter: 2014 ONLY; base n = 781
Table 81: Main paid occupation
Unweighted % Weighted %
Managers and administrators 13 14
Professionals and associate professionals 22 25
Technicians and trade workers 27 25
Clerical and administrative workers 4 5
Community and personal service workers 6 6
Sales workers 6 5
Machinery operators and drivers 8 9
Labourers and related workers 7 6
Other 5 6
Total 100% 100%
Q65 How would you describe your main paid occupation?Filter: 2014 ONLY; Employed; base n = 684
Table 82: Interest in taking part in future TAC research
Unweighted % Weighted %
Transport Accident CommissionMotorcycle Monitor 2014 | Page 124
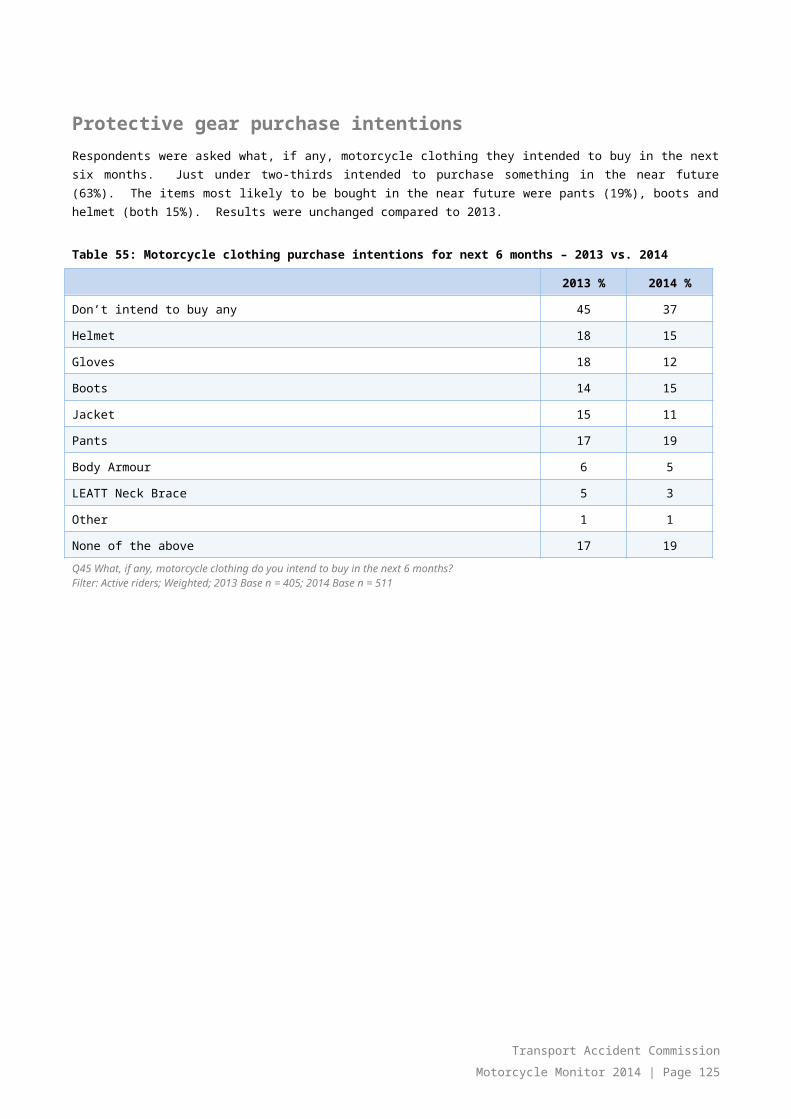
No, I would not be interested 48% 49%
Yes, I would be interested 52% 51%
Total 100% 100%
Q78. Would you be interested in participating in other TAC research into motorcycle safety or other road safety related research?Filter: 2014 ONLY; base n = 781
Transport Accident CommissionMotorcycle Monitor 2014 | Page 125

QuestionnaireThe online questionnaire has been included as an appendix of the report.
The hardcopy and/or the telephone survey differ slightly in the wording of instructions and have been included as appendices to a separate technical report.
Transport Accident CommissionMotorcycle Monitor 2014 | Page 126
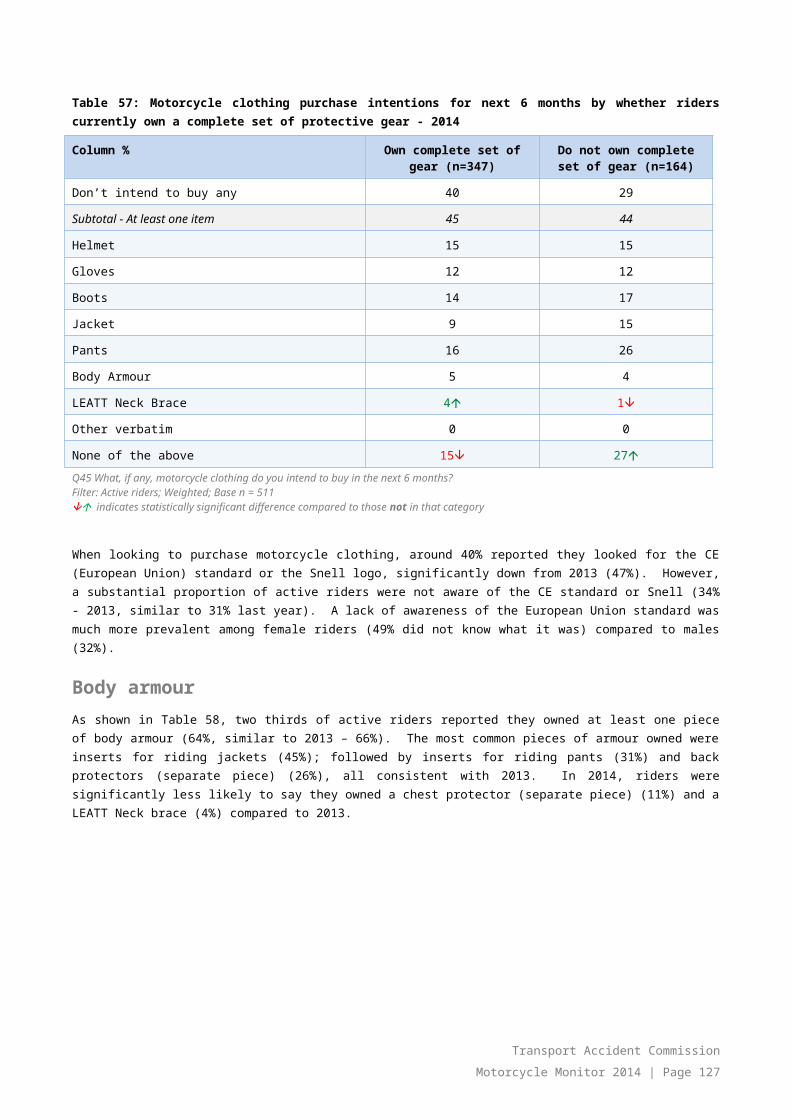
Job #: 13-098134-01
TAC
Motorcycle Monitor 2014Online Questionnaire
VERSION 4: 15/05/2014
(Based on 2013 Version: 7 11/06/2013 - Online version)
BACKGROUND TO PROJECT
The TAC is a statutory authority established under the Transport Accident Act 1986 (Vic) (Act) responsible for managing a compensation scheme which pays compensation to people who are injured as a result of transport accidents (TAC Clients).
Compensation payable by the TAC to TAC Clients includes medical services, rehabilitation services and disability services.
The TAC’s responsibilities under the Act include:
promoting the prevention of transport accidents and safety in the use of transport; and
designing and promoting, so far as possible, programs designed to secure the early and effective medical and vocational rehabilitation of persons injured as a result of a transport accident
This survey will be conducted to gather detailed information about motorcycle riders and their attitudes toward road safety; and their behaviour while riding their motorcycles.
SAMPLING & QUOTAS
A random selection of 2350 Victorian motorcycle licence holders and/or those with a registered motorcycle in their name stratified by age, gender, region and motorcycle status will have received an invitation to complete an online survey via mail, which also contains the option to compete the survey via telephone should they prefer. A hardcopy version of the questionnaire will be posted as part of the letter reminder. All those who have not completed the survey will also receive a follow-up telephone call reminder.
There are no quotas for this survey. Anyone who wishes to complete the survey will have the opportunity to do so.
NOTE: Basis for the 2014 questionnaire is the 2013 motorcycle survey
BLUE = Computer programming instructions
GREY = Changes and additions
Transport Accident CommissionMotorcycle Monitor 2014 | Page 127
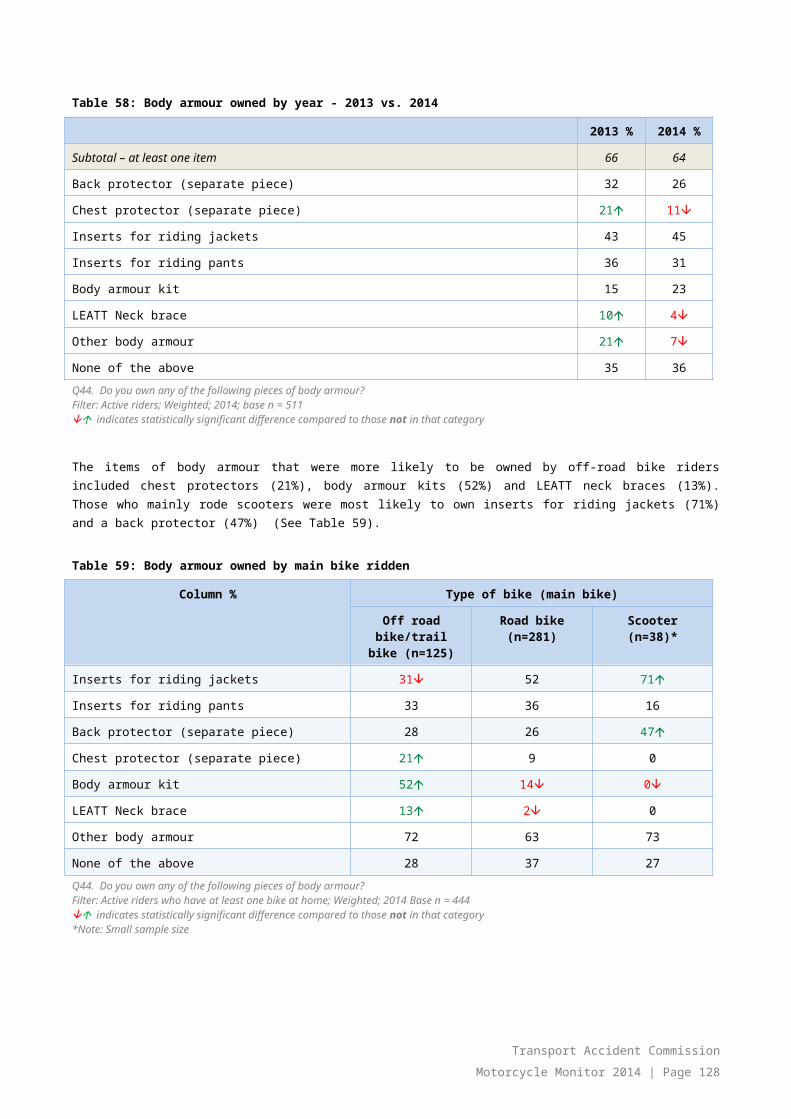
QUESTION SECTIONS
INTRODUCTION
SECTION A: DEMOGRAPHICS
SECTION B: HISTORY OF MOTORCYCLE USE
SECTION C: LEARNING TO RIDE
SECTION D: RIDING HISTORY
SECTION E: MOTORCYCLES IN YOUR HOUSEHOLD
SECTION F: YOUR RECENT MOTORCYCLING ACTIVITY
SECTION G: PROTECTIVE MOTORCYCLE CLOTHING
SECTION H: ATTITUDES AND BEHAVIOURS
SECTION G: CRASH HISTORY
SECTION A: DEMOGRAPHICS (PART 2)
Transport Accident CommissionMotorcycle Monitor 2014 | Page 128

----------------------------------------- [NEW SCREEN] ----------------------------------------
INTRODUCTION
Welcome to the TAC Motorcycle Survey 2014
Thank you for agreeing to participate in this important survey.
The Transport Accident Commission (the TAC) has commissioned the Ipsos Social Research Institute as an independent research organisation to conduct this survey on their behalf. This survey will provide you the opportunity to have a say about road safety issues that are important to motorcyclists whether you ride regularly, occasionally or used to ride.
This survey will take approximately 15 minutes to complete.
At the end of the survey, you will have an opportunity to enter a draw for one of five cash prizes of $250.
Surveys completed online by 24 June 2014 will also be entered into an additional extra draw for a $250 prize.
Please log-in using the username and password provided on the letter you received
Username and passwords are not case sensitive
Username:
Password:
If you have any questions about this study, with accessing the survey online or would prefer to complete the survey over the phone please call the Ipsos Survey Hotline on 1800 796 666 (freecall).
Results of this survey will be made available on www.spokes.com.au and www.tacsafety.com.au in December 2014
Privacy statement:
The results of this study will be reported in aggregate and your responses will remain anonymous. You should be aware that your name and contact details will be removed from your responses to this survey once all surveying is complete. When this has been done we will no longer be able to identify you with the responses you provided.
If you choose to enter the prize draw, your name and contact details will not be linked to your responses. However, for the period until the prize draw, your name and contact details will remain on file separate to your survey responses.
You will also be asked if you would be interested in taking part in other research for the Transport Accident Commission (the TAC). Your name and contact details will be collected separately to the prize draw and will only be forwarded to the TAC if you agree. Your personal details will remain separate to your responses.
You are able to contact us to request that we delete all of your personal information. If you wish to do this, please email [email protected] or feel free to contact the survey Completion Line on 1800 796 666.
Your name was randomly selected to take part in this research from a list of all Victorian motorcycle licence holders and those with registered motorcycles in their name from the VicRoads database. To view VicRoad’s privacy statement online please click here
Note: The Australian Market and Social Research Society’s Surveyline on 1300 364 830 is available for you to call if you would like to check if Ipsos is recognised by the society as a bona fide research company
Transport Accident CommissionMotorcycle Monitor 2014 | Page 129

----------------------------------------- [NEW SCREEN] ----------------------------------------
Please note your responses will be anonymous. The results of this survey will be reported as a summary of the overall findings and will not contain details of who took part.
INSTRUCTIONS:
Please DO NOT USE the 'Back' and 'Forward' buttons in the browser. Doing so means you may have to start the survey again. Please use the buttons at the bottom of each screen.
If you are unable to finish the survey in one sitting, you can re-visit the survey by going to the link in your invitation letter and re-entering your username and password. The survey should open where you left off.
----------------------------------------- [NEW SCREEN] ----------------------------------------
Please note for the purposes of this survey, a motorcycle includes: all registered and unregistered motorcycles that you own including all types of road bikes, off-road/trail bikes, scooters, or mopeds.
[INSERT IMAGE OF MOTORCYLES INCLUDED]
This survey EXCLUDES motorised bicycles, quad bikes and toy motorcycles such as monkey bikes when referring to motorcycles.
[INSERT IMAGE OF MOTORCYLES NOT INCLUDED]
[PROGRAMMING NOTE: PLEASE DO NOT INCLUDE SECTION HEADINGS ON SCREEN]----------------------------------------- [NEW SCREEN] ----------------------------------------
Transport Accident CommissionMotorcycle Monitor 2014 | Page 130

SECTION A: DEMOGRAPHICS
[ASK ALL]
Q1. How old are you? (type in number of years) [OPEN RESPONSE]
Years
[LOGIC CHECK MUST BE AT LEAST 18 years but less than 99 years]
Q2. Are you…?Male 01Female 02
Q3. What is your current employment status? Select all that apply [MULTIPLE RESPONSE]Employed full-time 01Employed part-time or casual 02 Self-employed 03 Student 04Unemployed 05Home duties 06Retired07Other [SPECIFY] 97
----------------------------------------- [NEW SCREEN] ----------------------------------------
SECTION B: HISTORY OF MOTORCYCLE USE
[ASK ALL]
Q4. Do you have a motorcycle licence? Select one only Yes - Learner 01 Yes - Probationary 02 Yes - Full 03 No - no motorcycle/motor-scooter licence 04No - Never held a motorcycle/motor-scooter licence 05No – No longer hold a motorcycle/motor-scooter licence 06
----------------------------------------- [NEW SCREEN] ----------------------------------------
[DISPLAY FOLLOWING TEXT]
Please note: For the purposes of this survey, a motorcycle includes all types of road bikes, off-road/trail bikes, scooters, or mopeds. The following are NOT considered to be motorcycles: quad bikes, motorised bicycles; and toy motorcycles such as monkey bikes.
----------------------------------------- [NEW SCREEN] ----------------------------------------
SECTION C: LEARNING TO RIDE
Transport Accident CommissionMotorcycle Monitor 2014 | Page 131

[Q11 MOVED HERE]
[NOTE CHANGE IN FILTER in 2013]
[ASK IF Q4 NOT = 05]
Q11. At what age did you start riding a motorcycle? Please type in number of years
Years
[LOGIC CHECK FOR AGE – MUST BE Q1 (Age) AT THE MOST; MUST BE <=5 – Error message – “You must enter 5 or older”]
----------------------------------------- [NEW SCREEN] ----------------------------------------
[NEW in 2013]Q11B. Who taught you to ride a motorcycle? Select all that apply [MULITPLE RESPONSE]
Self-taught 01Taught by parents 02Taught by other family members 03Taught by friends 04Taught by an accredited riding instructor 05Never learned to ride 06 Other [SPECIFY] 97
[NEW in 2013]Q11C. Where did you learn to ride? Select all that apply [MULTIPLE RESPONSE]
Did a learners’ course (e.g. Stay Upright) 01Trial day (e.g. at a race track) 02Off-road in national/state parks 03Off-road on private property 04On quiet back streets 05Never learned to ride 06Other [SPECIFY] 97
[IF Q11C = 06 – GO TO Q10]
----------------------------------------- [NEW SCREEN] ----------------------------------------
[NEW in 2013]Q11D. How would you describe your riding experience prior to gaining your motorcycle learners
permit? Select one onlyMinimal (never ridden a motorcycle or only ridden a few times before getting my learners permit) 01Moderate (ridden a motorcycle several times prior to gaining a learners permit) 02Experienced (capable rider when learners permit attained) 03
[NEW in 2013]Q11E What kind of motorcycle did you first learn to ride on? Select one only
Road bike 01Scooter 02Off-road bike 03Other [SPECIFY] 97
Transport Accident CommissionMotorcycle Monitor 2014 | Page 132
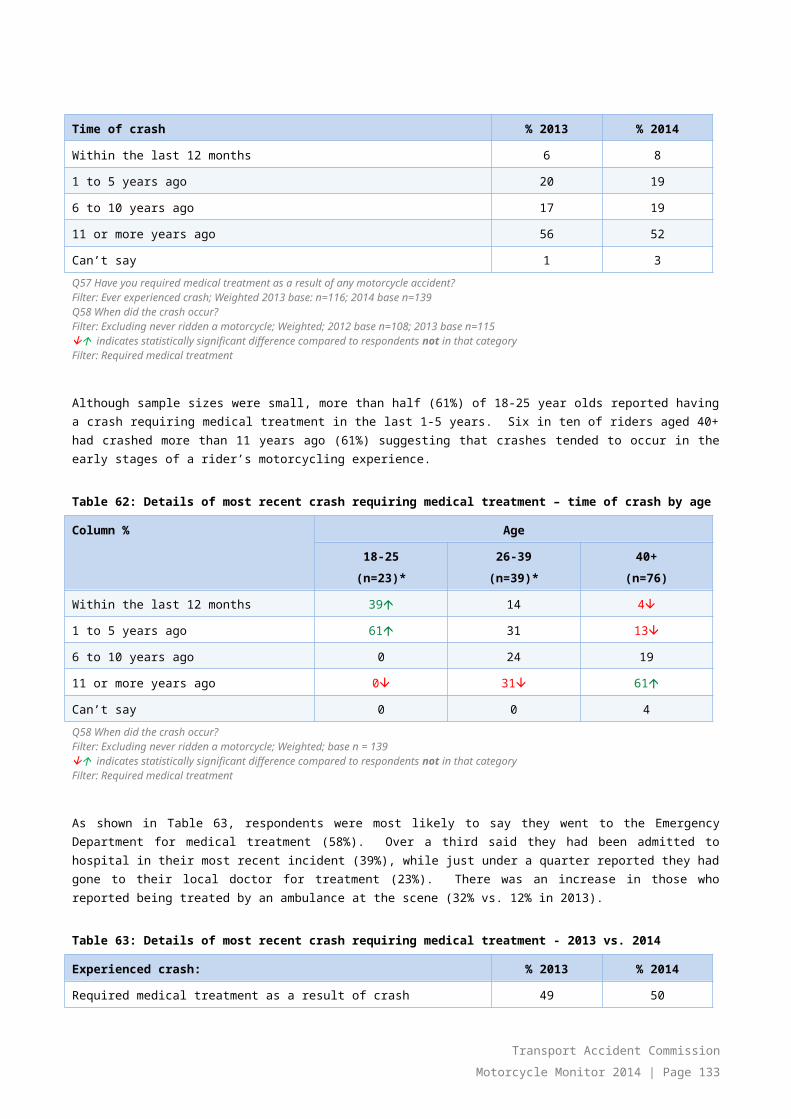
----------------------------------------- [NEW SCREEN] ----------------------------------------
SECTION D: RIDING HISTORY
[IF Q4=2 OR 3 OR 6 (Full or Probationary licence holder), ASK]
Q5. How old were you when you got your motorcycle licence? Please exclude any time on L plates
Years
[LOGIC CHECK FOR AGE – MUST =< Q1 AGE]
----------------------------------------- [NEW SCREEN] ----------------------------------------
[IF Q4=1 (Learner licence holder), ASK]
Q5. How old were you when you got your motorcycle learner’s permit? Please type in number of years
Years
[LOGIC CHECK FOR AGE – MUST =< Q1 AGE]
----------------------------------------- [NEW SCREEN] ----------------------------------------
[ASK ALL]
Q10. Which of the following best describes your motorcycle riding history since you got your permit or licence? Select one only
I have never had a break from riding since learning to ride and ride regularly 01I have never had a break from riding since learning to ride but only ride occasionally 02I had a break from riding and have started riding again 03I have stopped riding and may decide to ride in future 04I have stopped riding and do not intend to ride again 05I have never ridden a motorcycle--------------------------------------------- 06
[NOTE SHOW CODES 1-6 IF Q4=5; SHOW CODES 1-5 if Q4 =1-3 OR 6]
[IF Q10 = 06 GO TO Q52]
----------------------------------------- [NEW SCREEN] ----------------------------------------
Q7. Have you ridden a motorcycle in the last 12 months (either on or off-road)?Yes 01 No 02
Transport Accident CommissionMotorcycle Monitor 2014 | Page 133
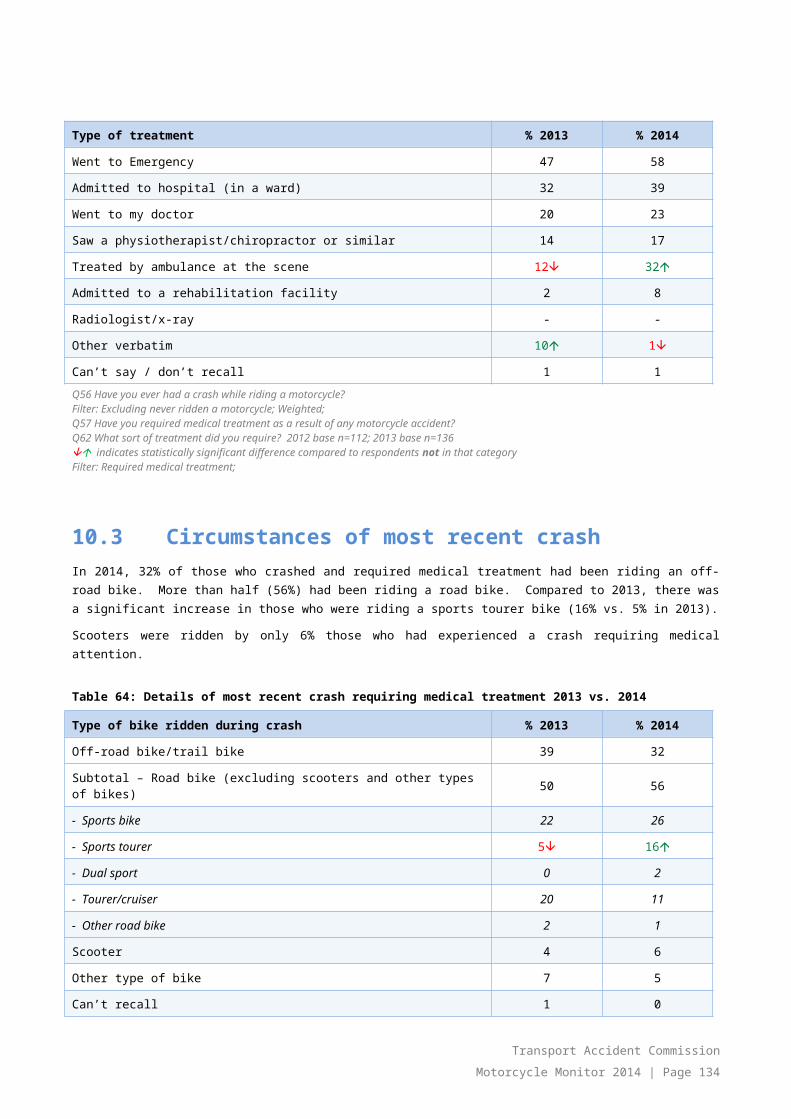
----------------------------------------- [NEW SCREEN] ----------------------------------------
[NEW IN 2013][ASK IF Q10 = 04 OR IF Q7 = 2 (If stopped riding but may ride in the future OR not ridden in last 12 months)]
Q7A. What is the likelihood that you will ride again in the future? Please use a 0-10 scale where 0 is extremely unlikely and 10 is extremely likely.
Extremely unlikely
Extremely likely
Don’t know
0 1 2 3 4 5 6 7 8 9 10 99
----------------------------------------- [NEW SCREEN] ----------------------------------------
[NEW IN 2013] [ASK IF Q10 = 03 (If had a break from riding and started again)]
Q7B. You have said you have had a break from riding and have started riding again. Approximately, how long was the most recent break?Up to 11 months 011-2 years 023-5 years 026-10 years 0411-15 years 0516-20 years 0621 years or more 07
----------------------------------------- [NEW SCREEN] ----------------------------------------
[IF Q7 = 1 (Ridden in last 12 months), ASK]
Q6. Thinking about your time spent riding and driving over the last 12 months, approximately what percentage of the time would you say you rode a motorcycle (on or off-road) compared to driving a car? Please enter percentages
a) Drive a car %b) Ride a motorcycle %
TOTAL 100%
[USE TALLY TO SHOW WHEN TOTAL EQUALS 100%; NOTE: Ride a motorcycle must be more than 0%]
[PROGRAMMING INSTRUCTION – DRIVING CAN BE 0%)
----------------------------------------- [NEW SCREEN] ----------------------------------------
Q12. [DELETED IN 2013 – REPLACED WITH Q11E]
----------------------------------------- [NEW SCREEN] ----------------------------------------
Q13. Have you ever done any motorcycle rider training courses? Select all that apply [MULTIPLE RESPONSE, RANDOMISE]Learners’ course (e.g. Stay Upright) 01
Transport Accident CommissionMotorcycle Monitor 2014 | Page 134

Advanced rider training 02Track day riding courses 03HART course 04DECA course 05Australian /California Superbike School 06Other [SPECIFY] 97
None of the above [EXCLUSIVE] 99
----------------------------------------- [NEW SCREEN] ----------------------------------------
[(Q10 = 4 AND Q7=2) OR (Q10 =5 AND Q7=2) (If stopped riding) ASK]
Q7. How old were you when you stopped riding?
Years
[LOGIC CHECK FOR AGE –MUST BE >= Q5 OR >= Q5 AND <= Q1 (Age)]
----------------------------------------- [NEW SCREEN] ----------------------------------------
[IF Q7 = 2 (NOT Ridden in last 12 months) AND Q10 =1,2,3 OR 4 ASK]
Q9. What are the main reasons why you haven’t ridden a motorcycle in the last 12 months? Select all that apply [MULTIPLE RESPONSE; RANDOMISE]
Motorcycle related injury 01Non-motorcycle related injury 02Went overseas/holiday 03No longer own a motorcycle 04Too expensive to maintain a motorcycle 05Family commitments/change in lifestyle 06Motorcycle broken down 07Moved locations, so became too far to ride 08Too busy/never have time to ride 09Prefer to travel using other modes (drive, cycle, public transport etc. 10Licence suspended 11Other [SPECIFY] 97
----------------------------------------- [NEW SCREEN] ----------------------------------------
[IF Q10 = 5 (Stopped riding and won’t ride again), ASK]
Q9a. What are the main reasons you stopped riding? Select all that apply [MULTIPLE RESPONSE; RANDOMISE]
Motorcycle related injury 01Non-motorcycle related injury 02Too expensive to maintain a motorcycle 03Family commitments/change in lifestyle 04Moved locations, so became too far to ride 05Too busy/never have time to ride 06
Transport Accident CommissionMotorcycle Monitor 2014 | Page 135

Prefer to travel using other modes (drive, cycle, public transport etc. 07Licence suspended 08Safety concerns09No longer interested in riding/motorcycles 10Other [SPECIFY] 97
----------------------------------------- [NEW SCREEN] ----------------------------------------
SECTION E: MOTORCYCLES IN YOUR HOUSEHOLD
[NOTE CHANGE IN FILTER IN 2013]
[ASK ALL]
Q15. How many motorcycles are kept at your home address regardless of who owns them or registration status? Please exclude any motorcycles that have not been ridden in at least 12 months and that are not likely to be ridden in the next 12 months.
[ADD IMAGES OF MOTORCYCLES TO INCLUDE AND MOTORCYCLES TO EXCLUDE HERE][SPLIT UP ROAD AND OFF ROAD]
Q15_1 Road Motorcycles
Q15_2 Off-road motorcycles
I have no motorcycles kept at my home address---------------------------------------------------99 [EXCLUSIVE]
Transport Accident CommissionMotorcycle Monitor 2014 | Page 136
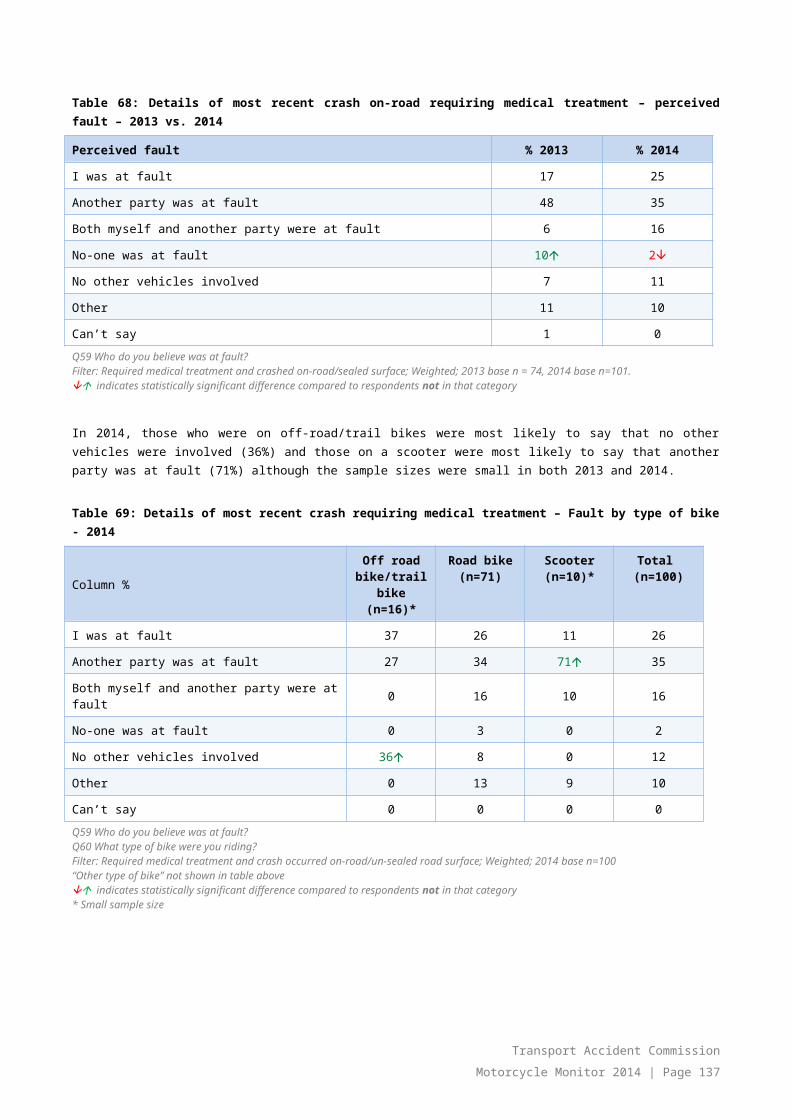
----------------------------------------- [NEW SCREEN] ----------------------------------------
[ASK IF ( Q15a) + Q15b) ) >=1 AND NOT 99 (At least 1 bike kept at home address)]
Q8. Please provide details of the motorcycle you ride most of the time:
Q8
i)-TYPE OF BIKE
Please select
Q8
ii) MAKE/BRAND
Please select
Q8
iii)- YEAR OF MANUFACTURE
Please type year i.e. 1980
(Optional)
[LOGIC CHECK 1900-2014 - OPTIONAL]
Q8
iv)- CAPACITY
Please select
Q8
v)--[DELETED 2014]
Q8
vi)- Registered?
Q8 vii) [NEW IN 2014] YEAR PURCHASED
Please type year i.e. 1980 (Optional) [LOGIC CHECK 1900-2014 AND MUST BE GREATER OR EQUAL TO Q8iii– OPTIONAL]
a. DROP DOWN
DROP DOWN PLEASE TYPE
DROP DOWN
DROP DOWN PLEASE TYPE
[‘Drop down menus’ BELOW:]
Type of bikePLEASE SELECT
MAKE/BRAND CAPACITY Registered?
Off road bike/trail bike 01Road bike- Sports bike 02Road bike- Sports tourer 03Road bike - Dual sport 04Road bike - Tourer/cruiser 05Road bike - Other please specify
06Scooter 08Other specify 97Don’t know 99
Aprilia 01Bolwell 02BMW 03Bug 04Buell 05Ducati 06Harley Davidson 07Honda 08Husqvarna 09Hyosung 10Kawasaki 11KTM 12Moto Guzzi 13MV Agusta 14Piaggio 15Suzuki 16TGB 17Triumph 18Vespa 19
0-125cc 01126-250cc 02251-400cc 03401-550cc 04551-700cc 05701-850cc 06851-1000cc 071001-1200cc 081201-1400cc 091401cc+ 10Don’t know 99
Road registered 01Recreational registered 03Farm bike registered 04Not registered 05Unknown 99
Transport Accident CommissionMotorcycle Monitor 2014 | Page 137

Victory 20VMoto 21Yamaha 22Other: Specify 97 Don’t know 99
----------------------------------------- [NEW SCREEN] ----------------------------------------
[ASK IF Q8 i = 6]Q16i(6)Specify:You selected “other road bike”, please provide details of the type of road bike you ride most of the time. [OPEN
ENDED]
[ASK IF Q8 i = 97]Q16i (97)Specify:You selected “other type of bike”, please provide details of the type of bike you ride most of the time. [OPEN ENDED]
[ASK IF Q8ii) = 97]Q16ii(97)Specify:You selected “other make/brand”, please provide details of the make/brand of bike you ride most of the time. [OPEN
ENDED]
[ASK IF ( Q15a) + Q15b) ) >=1 AND NOT 99 (At least 1 bike kept at home address)]
Q8viii) [NEW IN 2014]
What is the odometer reading on the bike you mainly ride? An approximate number of kms is okay. (Optional)
km
Transport Accident CommissionMotorcycle Monitor 2014 | Page 138

----------------------------------------- [NEW SCREEN] ----------------------------------------
[CHANGE IN FILTER IN 2013]
[ASK IF ( Q15_1 + Q15_2 ) >=2 AND Q15_99 NOT = 1 (At least 2 bikes kept at home address)]
Q9. Please provide details of any other motorcycles (excluding the one you ride most often) that are kept at your home address:
[Programming: CREATE TABLE WITH ( Q15_1 + Q15_2 ) MINUS 1 ROWS TO MAX OF 3 ROWS]
[Programming: INSERT TEXT IF MORE THAN 4 MOTORCYCLES IN TOTAL: You have listed that there are [INSERT NUMBER MINUS 1] other motorcycles held at your home address, please provide details of the 3 that are ridden most often.]
Q9
i)-- - TYPE OF BIKE
Please select
Q9
ii) MAKE/BRAND
Please select
Q9
iii)--YEAR OF MANUFACTURE
Please type year i.e. 1980 (Optional)
[LOGIC CHECK 1900-2014 - OPTIONAL]
Q9
iv)--CAPACITY
Please select
Q9
[DELETED 2014] Q9 [NEW IN
2013]
v)- -Registered?
Q9 vii) YEAR PURCHASED
Please type year i.e. 1980 (Optional)
[LOGIC CHECK 1900-2014 - OPTIONAL]
b. DROP DOWN
DROP DOWNPLEASE TYPE
DROP DOWN DROP DOWN
PLEASE TYPE
c. DROP DOWN
DROP DOWNPLEASE TYPE
DROP DOWN DROP DOWN
PLEASE TYPE
d. DROP DOWN
DROP DOWNPLEASE TYPE
DROP DOWN DROP DOWN
PLEASE TYPE
Transport Accident CommissionMotorcycle Monitor 2014 | Page 139

[‘Drop down menus’ BELOW:]
Type of bikePLEASE SELECT
MAKE/BRAND CAPACITY Registered?
Off road bike/trail bike 01Road bike- Sports bike 02Road bike- Sports tourer 03Road bike- Dual sport 04Road bike- Tourer/cruiser 05Road bike- Other please specify
06Scooter 08Other specify 97Don’t know 99
Aprilia 01Bolwell 02BMW 03Bug 04Buell 05Ducati 06Harley Davidson 07Honda 08Husqvarna 09Hyosung 10Kawasaki 11KTM 12Moto Guzzi 13MV Agusta 14Piaggio 15Suzuki 16TGB 17Triumph 18Vespa 19Victory 20VMoto 21Yamaha 22Other: Specify 97 Don’t know 99
0-125cc 01126-250cc 02251-400cc 03401-550cc 04551-700cc 05701-850cc 06851-1000cc 071001-1200cc 081201-1400cc 091401cc+ 10Don’t know 99
Road registered 01Recreational registered 03Farm bike registered 04Not registered 05Unknown 99
[PROGRAMMING NOTE: HOVER OVER TEXT OVER FIRST “MOTORCYCLES”
Please note: For the purposes of this survey, a motorcycle includes all registered and unregistered motorcycles that you own including all types of road bikes, off-road/trail bikes, scooters, or mopeds.
For the purposes of this survey, the following are NOT considered to be motorcycles: motorised bicycles; toy motorbikes such as monkey bikes; and quad bikes.]
Transport Accident CommissionMotorcycle Monitor 2014 | Page 140

----------------------------------------- [NEW SCREEN] ----------------------------------------
[ASK IF Q9b-d i)= 6]Q9i)b (6)Specify:You selected “other road bike” for the second bike you ride, please provide details of what type of road bike it is. [OPEN
ENDED]
Q9i)c (6)Specify:You selected “other road bike” for the third bike you ride, please provide details of what type of road bike it is [OPEN
ENDED]
Q9i)d (6)Specify:You selected “other road bike” for the fourth bike you ride, provide details of what type of road bike it is [OPEN ENDED]
[ASK IF Q9b-d i) = 97]Q9i)(97)Specify:You selected “other type of bike”, for the second bike you ride, please provide details of what type of bike it is. [OPEN
ENDED]
Q9i)c (97)Specify:You selected “other type of bike”, for the third bike you ride, please provide details of what type of bike it is. [OPEN
ENDED]
Q9i)d (97)Specify:You selected “other type of bike”, for the fourth bike you ride, please provide details of what type of bike it is. [OPEN
ENDED]
[ASK IF Q9ii)= 97]Q9ii)b (97)Specify:You selected “other make/brand”, for the second bike you ride, please provide details of what make/brand it is. [OPEN
ENDED]
Q9ii)c (97)Specify:You selected “other make/brand”, for the third bike you ride, please provide details of what type of bike this is. [OPEN
ENDED]
Q9ii)d (97)Specify:You selected “other make/brand”, for the fourth bike you ride, please provide details of what type of bike this is. [OPEN
ENDED]
Transport Accident CommissionMotorcycle Monitor 2014 | Page 141

----------------------------------------- [NEW SCREEN] ----------------------------------------
SECTION F: YOUR RECENT MOTORCYCLING ACTIVITY
[ASK IF Q7 = 1 (If ridden in last 12 months) AND Q10 = 1, 2, OR 3]
Q10. Thinking about your riding over the last 12 months, approximately what percentage of the time did you ride in the following categories excluding any riding you might do for work purposes? Please enter percentages.
a) Commuting purposes (going to work, study, shops) %b) Recreation on-road (public roads, highways, freeways) %c) Recreation off-road (tracks in national parks or on private property) %
TOTAL 100%
[USE TALLY TO SHOW WHEN TOTAL EQUALS 100%]
----------------------------------------- [NEW SCREEN] ----------------------------------------
Q11. [DELETED 2013]
Q12. [DELETED 2013]
Q13. [DELETED 2013]
Q14. [DELETED 2013]
Q15. [DELETED 2013]
Q16. [DELETED 2013]
----------------------------------------- [NEW SCREEN] ----------------------------------------
[IF Q10 b)> 0% OR Q10 c)> 0% (If ride recreationally on or off road), ASK]
Q17. Where do you do most of your recreational riding (on-road or off-road)? Select all that apply [MULTIPLE RESPONSE]State/national parks 01Private land 02Public roads in metro areas 03Public roads in rural/non-built up areas 04Other [SPECIFY] 97
Transport Accident CommissionMotorcycle Monitor 2014 | Page 142
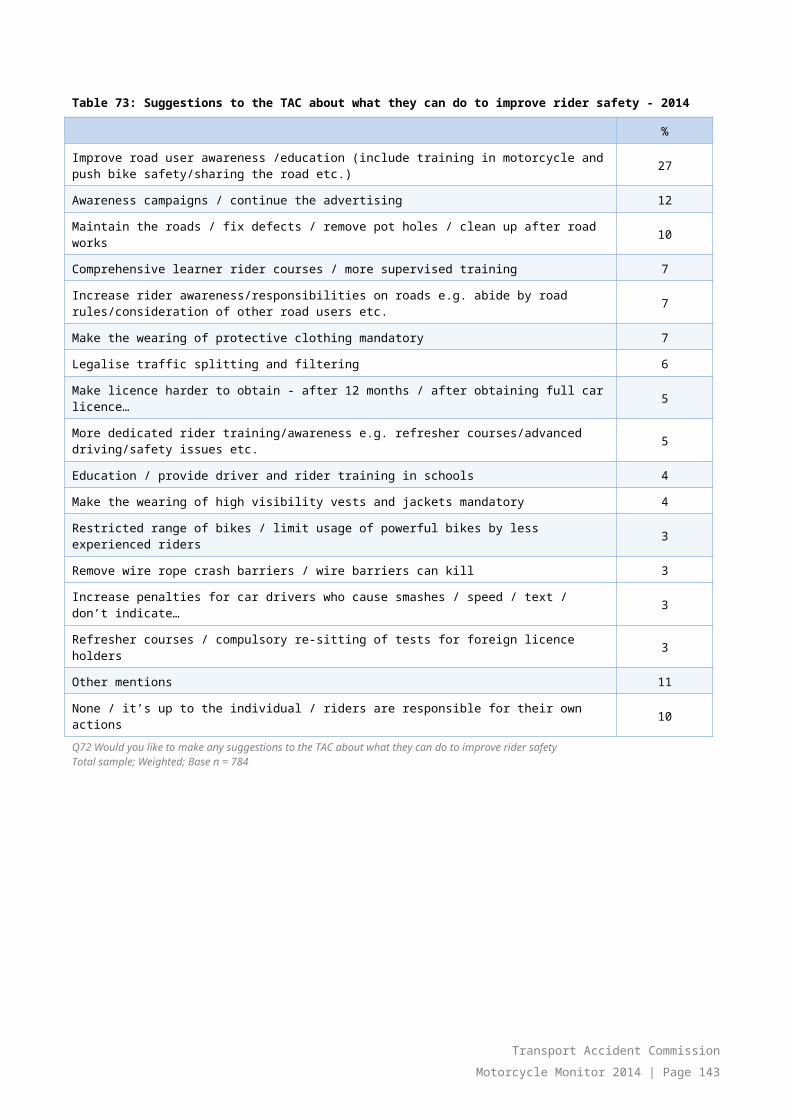
[NEW IN 2013]
[IF Q10 b)> 0% OR Q10 c)> 0% (If ride recreationally on or off road), ASK]
Q17A. When riding recreationally (on-road or off-road), do you mainly ride...?
On your own 01With 1 other person 02With 2-3 other people 034 -6 other people 047 or more other people 05
----------------------------------------- [NEW SCREEN] ----------------------------------------
Q18. [DELETED 2013]
Q18A. [DELETED 2014]
Q18B. [DELETED 2014]
Q19. [DELETED 2013]
Q20. [DELETED 2013]
Transport Accident CommissionMotorcycle Monitor 2014 | Page 143
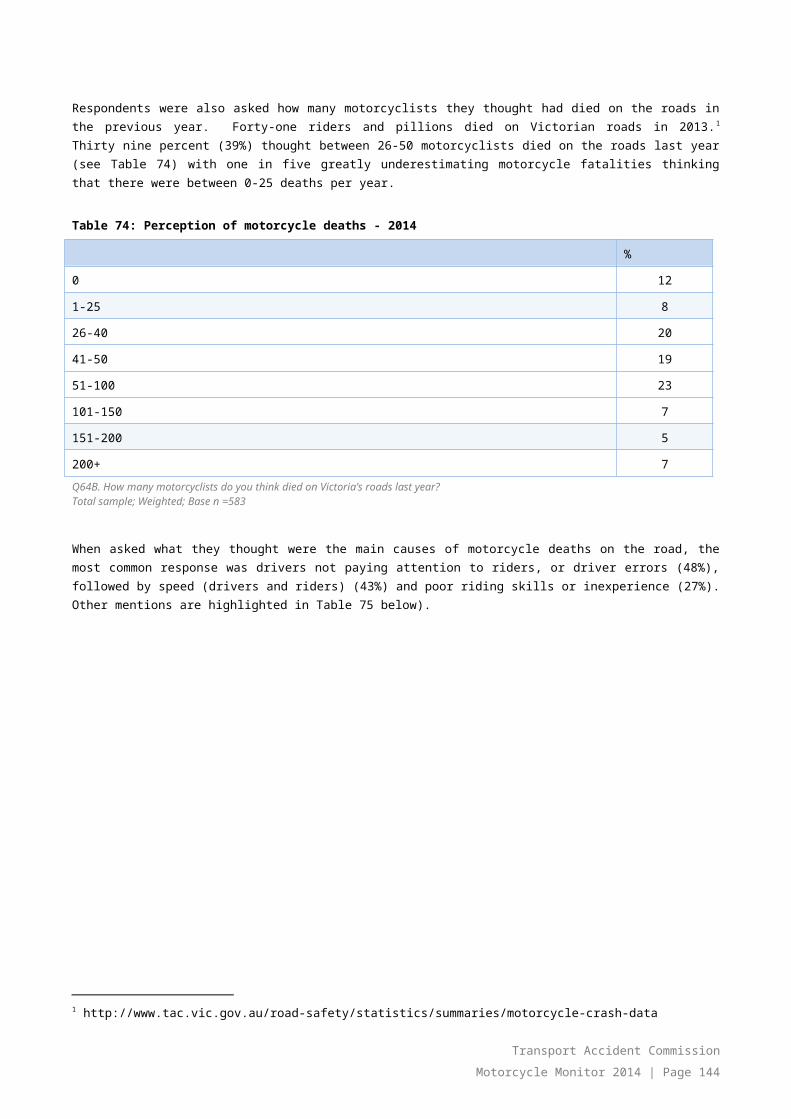
----------------------------------------- [NEW SCREEN] ----------------------------------------
[IF Q7= 1, ASK]
Q21. In the last 12 months, how many kilometres did you ride ON ANY motorcycle on the road for any reason? An approximate number is OK. If you have not ridden on the road just enter ‘0’Please answer one of the below only.
Km In an average WEEK
[FOR WEEK LOGIC CHECK FOR MUST BE LESS THAN 9999 Error message: “Response must be lower than 9999 in an average week” ]
OR
Km In an average MONTH
[LOGIC CHECK FOR MONTH MUST BE LESS THAN 25,000 – Error message: “Must be lower than 25000 for an average month” ]
OR
Km In the last YEAR
[LOGIC CHECK FOR YEAR MUST BE LESS THAN 250,000 – Error message: “Response must be less than 250000 in a year”]
Don’t know/can’t say--------------------------------------------------------------------------------------------------------------99
Transport Accident CommissionMotorcycle Monitor 2014 | Page 144
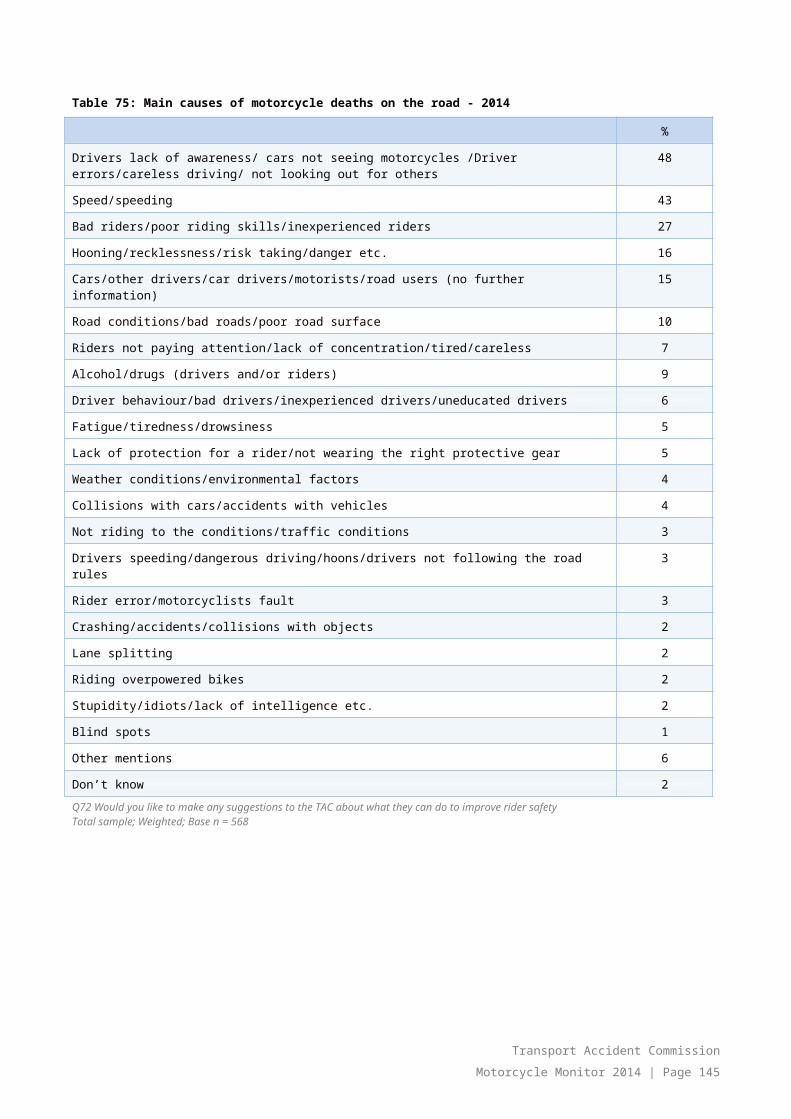
----------------------------------------- [NEW SCREEN] ----------------------------------------
NEW IN 2014[IF Q7= 1, ASK]
Q21B In the last 12 months, how many hours did you ride ON ANY motorcycle off road for any reason? An approximate number is OK. If you have not ridden off-road just enter ‘0’ Please answer one of the below only.
hours In an average WEEK
[FOR WEEK LOGIC CHECK FOR MUST BE LESS THAN 168 Error message: “Response must be lower than 168 in an average week” ]
OR
hours In an average MONTH
[LOGIC CHECK FOR MONTH MUST BE LESS THAN 744 – Error message: “Must be lower than 744 for an average month” ]
OR
hours In the last YEAR
[LOGIC CHECK FOR YEAR MUST BE LESS THAN 8,760 – Error message: “Response must be less than 8,760 in a year”]
Don’t know/can’t say--------------------------------------------------------------------------------------------------------------99
----------------------------------------- [NEW SCREEN] ----------------------------------------
[IF Q10 = 1, 2 OR 3 ASK]
Q22. Are you planning to purchase a motorcycle in the future (either as your first bike, a replacement for or in addition to the one(s) you already have)? Select one only.
This can be either new or used. Yes, in the next 12 months 01Yes, after 12 months 02No, I am not planning to purchase a motorcycle in the future 03
I have not decided yet 04
Transport Accident CommissionMotorcycle Monitor 2014 | Page 145

----------------------------------------- [NEW SCREEN] ----------------------------------------
[ASK IF Q22= 01 OR 02 (If planning to purchase a motorcycle in the future)
Q23. Do you intend to buy a new or a used motorcycle? [SINGLE RESPONSE]
New motorcycle 01Used motorcycle 02Haven’t decided yet 03
Q24. What type of motorcycle do you intend to buy? Select one only [SINGLE RESPONSE]
Off-road bike [HEADING ONLY] Off road bike/trail bike 01 Road bike [HEADING ONLY] Sports bike 02Sports tourer 03Dual sport 04Tourer/cruiser 05Scooter 07Other road bike [PLEASE SPECIFY] 08
Other specify 97Can’t recall 99
Q25. What brand/make of motorcycle are you most likely to buy? [OPEN ENDED]
----------------------------------------- [NEW SCREEN] ----------------------------------------
[ASK IF Q24= 01 (planning to purchase an off-road motorcycle
Q26. You have said you are planning to purchase an off road or trail bike. Do you intend to register this off road/trail bike?
Yes - with full road registration 01Yes - with recreational registration 02Yes – with farm bike registration 04No, I do not intend to register this motorcycle 03
Transport Accident CommissionMotorcycle Monitor 2014 | Page 146
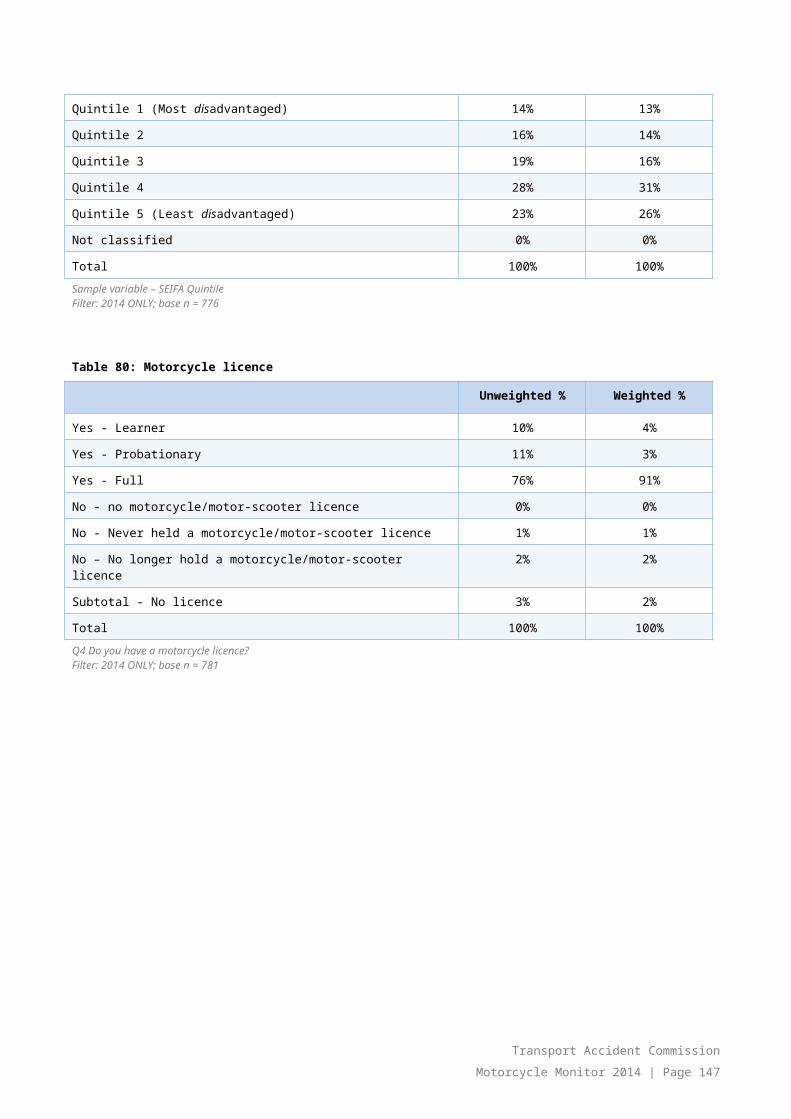
----------------------------------------- [NEW SCREEN] ----------------------------------------
[IF = 03 (No don’t intend to register off-road motorcycle)
Q27. Why don't you plan to register this off road trail bike? Select all that apply [RANDOMISE]
Cost of registration 01Inconvenience 02I won't ride it much 03I don't have to register it 04Didn’t know I could register it 97Other [PLEASE SPECIFY] 05Don’t know/can’t say 99
----------------------------------------- [NEW SCREEN] ----------------------------------------
[IF Q10 = 1, 2 OR 3 ASK ]
Q28. Have you heard of any of the following motorcycle safety features? Select all that apply. [MULTIPLE RESPONSE, RANDOMISE]
ABS (Anti-lock braking system) 01Low tyre pressure indicators 02Speed limiter function 03Blind spot warning sensor 04Traction control 05Emergency brake assist (EBA) 06Electronic brake force distribution (EDA) 07Automatic brake drying 08Airbags (on bike) 10Airbags (in clothing) 11Electronic Stability Control 12Other [SPECIFY] 97
I have heard of none of the above 99
----------------------------------------- [NEW SCREEN] ----------------------------------------
[[ASK IF Q15 >=1 AND NOT 99 (At least 1 bike kept at home address)]
AND IF Q8ai NOT 01 (i.e. MAIN MOTORCYLE IS NOT OFF ROAD)]
Q29. Does your current road motorcycle (the one you mostly ride) have ABS (Anti-lock braking system)?Yes 01No 02Don’t know 99
Transport Accident CommissionMotorcycle Monitor 2014 | Page 147

----------------------------------------- [NEW SCREEN] ----------------------------------------
[ASK IF Q22= 01 (Intend to buy a motorcycle in next 12 months) OR 02 and Q24 IS NOT 01 (Not an off-road motorcycle)] Would you look for ABS (Anti-lock braking system) on your next motorcycle?
Yes 01No 02Haven’t decided yet 99Didn’t know it was available 97
----------------------------------------- [NEW SCREEN] ----------------------------------------
SECTION G: PROTECTIVE MOTORCYCLE CLOTHING
[ASK ALL OF SECTION E IF Q7 = 1 (Ridden in last 12 months) AND Q10 = 1, 2 OR 3 (Currently riding)]
Q30. How many of the following do you own? If you do not own any, please insert ‘O’ [MULTIPLE RESPONSE]
Please hover mouse over the items for an image of relevant item if you are not sure
[INSERT IMAGES TO APPEAR WHEN MOUSE HOVERS OVER PROTECTIVE GEAR]
Item Insert number
aa) Motorcycle helmet – open face [NEW IN 2013]
ab) Motorcycle helmet – full face [NEW IN 2013]
a) Motorcycle helmet
b) Pair(s) of motorcycle riding boots
c) Pair(s) of motorcycle riding gloves
d) Motorcycle riding jacket(s)
e) Pair(s) of motorcycle riding pants
f) One piece riding suit(s) (Note: this refers to a suit where parts cannot be detached to be worn as separate pieces)
Transport Accident CommissionMotorcycle Monitor 2014 | Page 148

---------------------------------------- [NEW SCREEN] ----------------------------------------
[IF ANY Q30 a-f >1 ASK:] Q31. You have mentioned that you own multiple:
[INSERT PROTECTIVE ITEMS FROM Q30 IF GREATER THAN 1IF Q30 aa) + ab) >1 INSERT Motorcycle helmetsIF Q30 b) >1 INSERT Pairs of motorcycle riding bootsIF Q30 c) >1 INSERT Pairs of motorcycle riding glovesIF Q30 d) >1 INSERT Motorcycle riding jacketsIF Q30 e) >1 INSERT Pairs of motorcycle riding pants IF Q30 f) >1 INSERT One piece riding suits]
What are the main reasons you have more than one of the above? [OPEN ENDED]
----------------------------------------- [NEW SCREEN] ----------------------------------------
[IF Q30 NOT (AB, C D AND E = ALL AT LEAST 1) OR (AB, C AND F = ALL AT LEAST 1), ASK]
[IF Q30 NOT (AA, C D AND E = ALL AT LEAST 1) OR (AA, C AND F = ALL AT LEAST 1), ASK]
[Note: Programming filter changed in 2014]
Q32. What are the main reasons you don’t own more protective motorcycle clothing? Select all that apply [MULTIPLE RESPONSE, RANDOMISE]
Too expensive 01Don’t think I need it 02Haven’t gotten around to buying it 03Inconvenient to put on/wear 04Only do country/off-road riding 05Uncomfortable to wear / restrictive to wear 06I rarely ride my bike 07I only ride for short trips 08Other [SPECIFY] 97
Transport Accident CommissionMotorcycle Monitor 2014 | Page 149

----------------------------------------- [NEW SCREEN] ----------------------------------------
[ASK IF Q7 = 1 (Ridden in last 12 months) AND Q10 = 1, 2 OR 3 (Currently riding)]
Q33. When riding a motorcycle, how often do you wear the following items of protective motorcycle clothing?
All
the
time
Mos
t
of
the
time
Abo
ut h
alf
the
time
Som
e o
f th
e tim
e
Nev
er
Don
’t K
now
a) Motorcycle helmet 05 04 03 02 01 99
b) [DELETED 2014] 05 04 03 02 01 99
c) Motorcycle riding gloves 05 04 03 02 01 99
d) Motorcycle riding jacket 05 04 03 02 01 99
e) Motorcycle riding pants 05 04 03 02 01 99
f) One piece riding suit (Note: this refers to a suit where parts cannot be detached to be worn as separate pieces)
05 04 03 02 01 99
g) [DELETED 2014] 05 04 03 02 01 99
h) [NEW IN 2014] Any type of boots (i.e. motorcycle specific riding boots or any other shoes that cover your ankles)
05 04 03 02 01 99
----------------------------------------- [NEW SCREEN] ----------------------------------------
[ASK IF Q7 = 1 (Ridden in last 12 months) AND Q10 = 1, 2 OR 3 (Currently riding)]
[NEW IN 2014]
Q33A. What percentage of the time do you wear the following when riding a motorcycle? Please enter percentages.
a) Boots made specifically for motorcycle riding %b) Other boots (i.e. boots that cover your ankles) %c) Other footwear (i.e. sneakers or other shoes) %d) No footwear/thongs/bare feet %
TOTAL 100%
[USE TALLY TO SHOW WHEN TOTAL EQUALS 100%]
Transport Accident CommissionMotorcycle Monitor 2014 | Page 150

----------------------------------------- [NEW SCREEN] ----------------------------------------
[NOTE NEW FILTER IN 2014]
[SKIP Q34 IF Q33 A, C, D AND E ALL = 5 AND Q33A. a) + b) EQUAL TO 100% (Full gear with any boots all the time) OR Q33 A, C, AND F ALL = 5 AND Q33A. a) + b) EQUAL TO 100% (One piece suit with riding boots)]
Q34. You have said you do not wear a jacket with pants (or one piece suit) with boots, gloves and helmet every time you ride. What are the main reasons you do not wear a complete set of gear every time you ride?[OPEN RESPONSE]
----------------------------------------- [NEW SCREEN] ----------------------------------------
Q35. Do you own any of the following pieces of body armour? Select all that apply This includes body armour that forms part of other gear i.e. inside a jacket etc. [MULTIPLE RESPONSE]
Back protector (separate piece) 01Chest protector (separate piece) 02Inserts for riding jackets 03Inserts for riding pants 04Pressure suit 05Body armour kit 08LEATT Neck brace 06Other body armour [PLEASE SPECIFY] 07
None of the above 99
----------------------------------------- [NEW SCREEN] ----------------------------------------
Q36. What, if any, motorcycle clothing do you intend to buy in the next 6 months? Select all that apply [MULTIPLE RESPONSE – EXCLUSIVE 01]
Don’t intend to buy any 01Helmet02Gloves 03Boots 04Jacket 05Pants 06Body Armour 07LEATT Neck Brace 08Other [SPECIFY] 97Don’t know 99
----------------------------------------- [NEW SCREEN] ----------------------------------------
Q37. When purchasing motorcycle clothing, do you look for the CE (European Union), the Snell logo or other motorcycle protective clothing standard marks on garments? [INSERT NEW image of CE logo and SNELL LOGO BSI logo]
Yes 01No 02Don’t know what the CE (European Union) standard and/or Snell is 99
Transport Accident CommissionMotorcycle Monitor 2014 | Page 151

----------------------------------------- [NEW SCREEN] ----------------------------------------
SECTION H: ATTITUDES AND BEHAVIOURS
[ASK SECTION F Q38 -Q48E IF Q7=1 (If ridden in last 12 months) AND Q10 = 1-3 (Haven’t had a break from riding or had a break and are riding again)]
For the following questions, we are asking about what you do when you’re riding your motorcycle on the road, not when you are driving a car.
Q38. Have you been pulled over by police for any reason while riding your motorcycle in the last 12 months?
Yes 01No 02Prefer not to say 98Can’t recall 99
----------------------------------------- [NEW SCREEN] ----------------------------------------
[ASK IF Q38=1]
Q39. Why were you pulled over? If you have been pulled over more than once, or for multiple reasons, please select all that apply. [MULTIPLE RESPONSE, RANDOMISE]
Breath tested 01Drug tested 02Loud pipes/exhaust 03Routine licence check 04Speeding 05Other [PLEASE SPECIFY] 06Prefer not to say 98Can’t recall 99
----------------------------------------- [NEW SCREEN] ----------------------------------------
[NEW IN 2013]
[IF Q7=1 (If ridden in last 12 months) AND Q10 = 1-3 (Haven’t had a break from riding or had a break and are riding again)]
Q39A. In the last 12 months, how many times, if any, have you been breath-tested when riding your motorcycle?
Please select from below or type in number of timesZero 00
times
Prefer not to say 98Can’t recall 99
Transport Accident CommissionMotorcycle Monitor 2014 | Page 152

----------------------------------------- [NEW SCREEN] ----------------------------------------
[NEW IN 2013]
[IF Q7=1 (If ridden in last 12 months) AND Q10 = 1-3 (Haven’t had a break from riding or had a break and are riding again)]
Q39B. In the last 12 months, how many times, if any, have you been drug-tested when riding your motorcycle? Please select from below or type in number of times
Zero 00
times
Prefer not to say 98Can’t recall 99
----------------------------------------- [NEW SCREEN] ----------------------------------------
[NEW IN 2013]
[ASK IF Q39B NOT 0, 98 or 99]
Q39C Thinking of the most recent time, what type of drug test was it? Select one only
Saliva test 01Breath test 02Other test [PLEASE SPECIFY] 03
----------------------------------------- [NEW SCREEN] ----------------------------------------
[NEW IN 2013]
[IF Q7=1 (If ridden in last 12 months) AND Q10 = 1-3 (Haven’t had a break from riding or had a break and are riding again)]
Q39D In the last 12 months, have you ridden your motorcycle when you knew, or thought you were possibly over the legal blood alcohol limit?
Yes 01No 02Not applicable (I don’t drink alcohol) 03I’d prefer not to say 99
----------------------------------------- [NEW SCREEN] ----------------------------------------
[NEW IN 2013]
[ASK IF Q39D = 01 (Drove over limit) ]
Q39E. What was the main reason for riding your motorcycle when you knew or thought you were over the legal blood alcohol limit? [OPEN ENDED]
[NOTE NEW FILTER IN 2013]
[ASK ALL]
Transport Accident CommissionMotorcycle Monitor 2014 | Page 153
Q40. Have you been caught speeding while riding your motorcycle (not in your car or other vehicle) in the last 12 months (either by police or a fixed/mobile camera)?
Yes 01No 02I’d prefer not to say 99
----------------------------------------- [NEW SCREEN] ----------------------------------------
[IF Q40 = 01 (if caught speeding), ASK Q41. How many times have you been caught speeding on your motorcycle in the last 12 months?
times
I’d prefer not to say 99
----------------------------------------- [NEW SCREEN] ----------------------------------------
[ASK ALL IN 2013]
Q42. How fast should people be allowed to ride a motorcycle in a 60km/h zone without being booked for speeding?
km per hour
Don’t know 99
----------------------------------------- [NEW SCREEN] ----------------------------------------
[IF >60 NOT 99, ASK]
Q43. When you have the opportunity, how often do you ride above [INSERT ] km per hour in a 60km/h zone? Select one only
None of the time 01Some of the time (Less than half but not never) 02About half the time (50%) 03Most of the time (More than half but not all) 04All of the time 05Don’t know 99
----------------------------------------- [NEW SCREEN] ----------------------------------------
IF <=60 OR = 99, ASK]
Q52a When you have the opportunity, how often do you ride above 60km per hour in a 60km/h zone? Select one only
None of the time 01Some of the time (Less than half but not never) 02About half the time (50%) 03Most of the time (More than half but not all) 04All of the time 05Don’t know 99
Transport Accident CommissionMotorcycle Monitor 2014 | Page 154

----------------------------------------- [NEW SCREEN] ----------------------------------------
[ASK ALL IN 2013]
Q44. How fast should people be allowed to ride a motorcycle in a 100km/h zone without being booked for speeding?
km per hour
Don’t know 99
----------------------------------------- [NEW SCREEN] ----------------------------------------
[IF Q44>100 ASK:]
Q45. When you have the opportunity, how often do you ride above [INSERT Q44] kph in a 100km/h zone? Select one only
None of the time 01Some of the time (Less than half but not never) 02About half the time (50%) 03Most of the time (More than half but not all) 04All of the time 05Don’t know 99
----------------------------------------- [NEW SCREEN] ----------------------------------------
[IF Q44<=100 OR Q44=99 ASK:]
Q54a When you have the opportunity, how often do you ride above 100kph in a 100km/h zone? Select one only
None of the time 01Some of the time (Less than half but not never) 02About half the time (50%) 03Most of the time (More than half but not all) 04All of the time 05Don’t know 99
Transport Accident CommissionMotorcycle Monitor 2014 | Page 155

----------------------------------------- [NEW SCREEN] ----------------------------------------
[ASK ALL]
Q46. To what extent do you agree or disagree with the following statements? [RANDOMISE STATEMENTS]
Stro
ngly
di
sagr
ee
Som
ewha
t di
sagr
ee
Nei
ther
Som
ewha
t ag
ree
Stro
ngly
ag
ree
Don
’t kn
ow
a) I ride over the speed limit if I’m sure I’ll get away with it 01 02 03 04 05 99
b)I think motorcyclists should always wear motorcycle clothing (jacket, pants, boots and gloves) while riding 01 02 03 04 05 99
c) [REMOVED IN 2013]
d) [REMOVED IN 2014] 01 02 03 04 05 99
e) Motorcycle clothing protects me in the event of a crash 01 02 03 04 05 99
f)[NEW in 2013]
Riding while tired can be as dangerous as drink-riding 01 02 03 04 05 99
g)
[NEW in 2013- CHANGE IN WORDING 2014]
The only remedy for fatigue feeling drowsy while riding is to stop riding and rest
01 02 03 04 05 99
h)[NEW IN 2013]People returning to motorcycling after a break should have to undertake a motorcycle training course
01 02 03 04 05 99
i)[NEW IN 2013]Drivers don’t understand what it is like to be a motorcyclist
01 02 03 04 05 99
j)[NEW IN 2014]Wearing boots that cover my ankles will protect my feet better than other shoes would
01 02 03 04 05 99
k)[NEW IN 2014]Most drivers are aware of motorcyclists when they are driving
01 02 03 04 05 99
l)[NEW IN 2014]Motorcyclists can only be safe on the road if both riders and drivers share responsibility for their safety
01 02 03 04 05 99
----------------------------------------- [NEW SCREEN] ----------------------------------------
[NEW IN 2013]
[ASK ALL]
Q46I. [DELETED IN 2014 – REPLACED Q46ii. - MULTIPLE RESPONSE]
If you are feeling tired when riding a motorcycle, what do you normally do? [OPEN ENDED]
Transport Accident CommissionMotorcycle Monitor 2014 | Page 156

----------------------------------------- [NEW SCREEN] ----------------------------------------
[NEW IN 2014][ASK ALL]
Q46ii. If you are feeling drowsy when riding a motorcycle, which of the following would you normally do? Select all that apply
[RANDOMISE]
Have a break/have a rest01Stop riding 02Pull over somewhere e.g. a safe spot or rest area 03Have something to eat or drink 04Do some exercise e.g. Stretches/walk a bit etc. 05Take regular stops e.g. every 2 hours or every 200km etc. 06Keep riding but more slowly 07Keep riding to get to destination quicker then rest 08Other [PLEASE SPECIFY] 98
----------------------------------------- [NEW SCREEN] ----------------------------------------
SECTION G: CRASH HISTORY
[ASK ALL]
Q47. Have you ever had a crash while riding a motorcycle? Please do not include dropping your bike while stationary or a crash that occurred while participating in motorcycle sport.
Yes 01No 02 Prefer not to say 99
----------------------------------------- [NEW SCREEN] ----------------------------------------
NEW IN 2014
[IF Q47 = 1 (experienced a crash) AND Q7=1 (ridden in the last year), ASK]
Q47B. How many times have you had a crash in the last 12 months? (Type in number of times in box)
----------------------------------------- [NEW SCREEN] ----------------------------------------
[IF Q47 = 1 (experienced a crash), ASK]
Q48. Have you required medical treatment as a result of any motorcycle accident? Yes 01No 02
Transport Accident CommissionMotorcycle Monitor 2014 | Page 157

----------------------------------------- [NEW SCREEN] ----------------------------------------
[IF Q48= 1 (experienced a crash that required medical treatment) ASK]
Thinking about the most recent crash where you required medical treatment…
Q49. When did the crash occur? Select one onlyWithin the last 12 months011 to 5 years ago026 to 10 years ago 0311 or more years ago 04Can’t say 99
----------------------------------------- [NEW SCREEN] ----------------------------------------
Q60. What type of bike were you riding? Select one only
Off-road bike [HEADING ONLY] Off road bike/trail bike 01 Road bike [HEADING ONLY] Sports bike 02Tourer/cruiser 05Scooter 07Sports tourer 03Dual sport 04Other road bike [PLEASE SPECIFY] 08
Other specify 97Can’t recall 99
----------------------------------------- [NEW SCREEN] ----------------------------------------
IF Q48= 1, ASK]
Q61. Where did the crash occur? Select one onlySealed road, built-up area 01Sealed-road, rural area 02Unsealed road 03Track in state park /forest/plantation 04Private property 05Public land in residential areas (e.g. park, reserve, bicycle track) 06On a race track (on a track day or as part of a riding course) 07Other [SPECIFY] 97
[IF Q61 = 07 GO TO Q51B]
Transport Accident CommissionMotorcycle Monitor 2014 | Page 158

----------------------------------------- [NEW SCREEN] ----------------------------------------
[NOTE NEW FILTER IN 2013]
[IF Q48= 1 (experienced a crash that required medical treatment) AND Q61 =01 OR 02 OR 3 (On sealed or unsealed road) ASK]
Q59. Who do you believe was at fault? Select one onlyI was at fault 01Another party was at fault 02Both myself and another party were at fault 03No-one was at fault 04No other vehicles involved 05Other [SPECIFY] 06Can’t say 99
----------------------------------------- [NEW SCREEN] ----------------------------------------
[NEW IN 2013]
[IF Q48= 1 (experienced a crash that required medical treatment) AND Q61 =03 OR 04 OR 05 OR 06 off road surface ASK]
Q59A What caused your crash? Select as many as applyRoad/trail conditions 01Terrain 02Trees (e.g. fallen logs, overhanging branches) 03Weather conditions 04Rider error 05Lapse in concentration 06Mechanical failure of the motorcycle 07Doing tricks 08Other [SPECIFY] 97Can’t say 99
Transport Accident CommissionMotorcycle Monitor 2014 | Page 159

----------------------------------------- [NEW SCREEN] ----------------------------------------
[NEW IN 2014]
[IF Q48= 1 (experienced a crash that required medical treatment)]
Q59B Thinking of your most recent crash that required medical treatment, to what extent do you agree or disagree with the following statements? [RANDOMISE STATEMENTS]
Stro
ngly
di
sagr
ee
Som
ewha
t di
sagr
ee
Nei
ther
Som
ewha
t ag
ree
Stro
ngly
ag
ree
Don
’t kn
ow
a) I knew the crash area well 01 02 03 04 05 99
b)I was unfamiliar with the motorcycle I was riding at the time of the crash (i.e. a new bike or borrowed bike) 01 02 03 04 05 99
c)If I was riding more slowly, I could have done something to avoid the crash 01 02 03 04 05 99
d) Road/terrain conditions contributed to the crash 01 02 03 04 05 99
e) I was new to riding at the time 01 02 03 04 05 99
f) I was returning to riding after a break of a least six months 01 02 03 04 05 99
g) Another vehicle contributed to the crash 01 02 03 04 05 99
h) I was tired at the time of the crash01 02 03 04 05 99
i) There was nothing I could have done to prevent the crash01 02 03 04 05 99
j) Wearing protective clothing helped reduce my injuries01 02 03 04 05 99
----------------------------------------- [NEW SCREEN] ----------------------------------------
[IF Q48= 1, AND NOT Q61 = 07 ASK]
Q62. What sort of treatment did you require? Select all that apply [MULTI RESPONSE]
Admitted to hospital (in a ward) 01Went to Emergency 02Treated by ambulance at the scene 03Went to my doctor 04Saw a physiotherapist/chiropractor or similar 05Admitted to a rehabilitation facility 06Other [SPECIFY] 97Can’t say/don’t recall 99
----------------------------------------- [NEW SCREEN] ----------------------------------------
[IF Q48= 1, ASK]
Q50. Have you ever received any compensation or income support as a result of injuries received from a motorcycle crash? Select one only
Yes 01
Transport Accident CommissionMotorcycle Monitor 2014 | Page 160

No 02 Prefer not to say 98
----------------------------------------- [NEW SCREEN] ----------------------------------------
[IF = 01, ASK]
Q51. From whom did you receive this compensation? Select all that apply
TAC 01WorkSafe/WorkCover /Comcare 02Comcare 03Personal insurance organisation (e.g. health, or income protection) 04Property/vehicle insurance organisation 05Centrelink (e.g. Disability Support Pension or Sickness Allowance) 06Other [SPECIFY] 97Prefer not to say 98
----------------------------------------- [NEW SCREEN] ----------------------------------------
[NEW IN 2014]
[ASK ALL]
Q51B In 2013, 242 people were killed on Victorian roads.
How many motorcyclists do you think died on Victoria’s roads last year?
[LOGIC CHECK MUST BE <= 242]
----------------------------------------- [NEW SCREEN] ----------------------------------------
[NEW IN 2014]
[ASK ALL]
Q51C What do you think are the main causes of motorcycle deaths on the roads?
[OPEN ENDED – TO BE CODED]
Transport Accident CommissionMotorcycle Monitor 2014 | Page 161
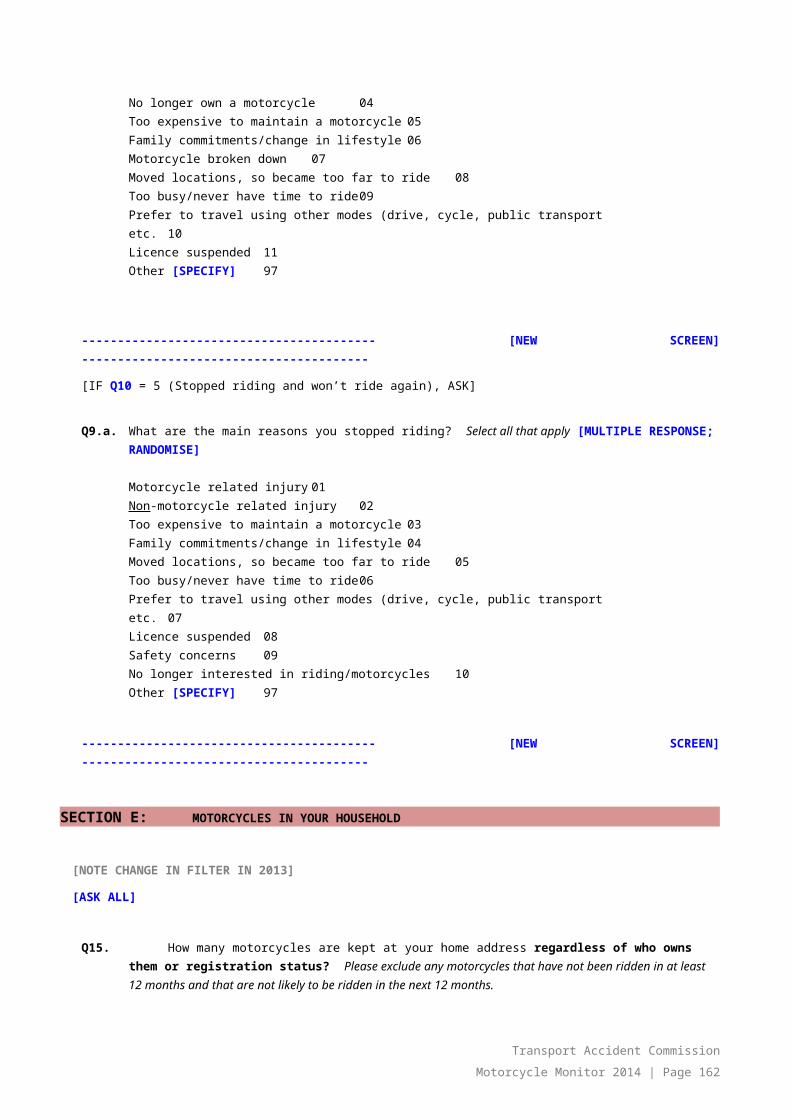
----------------------------------------- [NEW SCREEN] ----------------------------------------
SECTION A: DEMOGRAPHICS (PART 2)
We now have a few questions to help us with the analysis:
[IF Q3 = 1, 2 OR 3 (If employed or self employed) ASK]
Q52. How would you describe your main paid occupation? Select one category only
Managers and administrators ----------------------------------------------------------------------------------------------01For example: Hospitality, retail and service managers, Specialist managers, Farmers and farm managers, Chief executives, General managers and legislators
Professionals & Associate professionals-------------------------------------------------------------------------------02For example: Legal, social and welfare professionals, ICT professionals, Health professionals, Education professionals, Design, engineering, science and transport professionals, Business, human resource and marketing professionals, Arts and media professionals
Technicians and trade workers---------------------------------------------------------------------------------------------03For example: Other technicians and trades workers, Skilled animal and horticultural workers, Food trades workers, Electro-technology and telecommunications trades workers, Construction trades workers, Automotive and engineering trades workers, Engineering, ICT and science technicians
Clerical and administrative workers---------------------------------------------------------------------------------------04For example: Other clerical and administrative workers, Clerical and office support workers, Numerical clerks, Inquiry clerks and receptionists, General clerical workers, Personal assistants and secretaries, Office managers and program administrators
Community and personal service workers------------------------------------------------------------------------------05For example: Sports and personal service workers, Protective service workers, Hospitality workers, Carers and aides, Health and welfare support workers
Sales workers---------------------------------------------------------------------------------------------------------------------06For example: Sales support workers, Sales assistants and salespersons, Sales representatives and agents
Machinery operators and drivers-------------------------------------------------------------------------------------------07For example: Store person, Road and rail drivers, Mobile plant operators, Machine and stationary plant operators
Labourers and related workers---------------------------------------------------------------------------------------------08For example: Food preparation assistants, Farm, forestry and garden workers, Factory process workers, Construction and mining labourers, Cleaners and laundry workers
Other [SPECIFY] -----------------------------------------------------------------------------------------------------------------97
----------------------------------------- [NEW SCREEN] ----------------------------------------
[IF Q3 = 1, 2 OR 3 (If employed or self employed) ASK]
Q53. How many hours do you work in an average week?
Hours per week
Transport Accident CommissionMotorcycle Monitor 2014 | Page 162

[LOGIC CHECK – MAX OF 168 HOURS]
----------------------------------------- [NEW SCREEN] ----------------------------------------
[ASK IF Q10 = 1-3 AND Q3 = 1-3]
Q54. Do you ride a motorcycle as part of your employment (excluding any riding to and from work)? Select one onlyYes 01No 02
----------------------------------------- [NEW SCREEN] ----------------------------------------
Q55. [DELETED 2013]
[NEW IN 2013]
Q55A What is your residential postcode?
----------------------------------------- [NEW SCREEN] ----------------------------------------
[NEW IN 2013]
Q55B [DELETED 2014]
Q55C [DELETED 2014]
----------------------------------------- [NEW SCREEN] ----------------------------------------
SECTION K: TELEPHONE SERVICES [DELETED]
[DELETED Q69-71]
Transport Accident CommissionMotorcycle Monitor 2014 | Page 163

----------------------------------------- [NEW SCREEN] ----------------------------------------
SECTION L: CLOSING
Q72. Lastly, would you like to make any suggestions to the TAC about what they can do to improve rider safety? [OPEN ENDED; OPTIONAL]
----------------------------------------- [NEW SCREEN] ----------------------------------------
Q56. Would you be interested in participating in other TAC research into motorcycle safety or other road safety related research?
If you are interested in taking part in other research, your name and contact details will be forwarded to the TAC. Please be assured that your personal details will be treated in strict confidence and will remain separate to your responses to this survey.
No, I would not be interested 01
Yes, I would be interested (please provide your details below) 02
Name:Contact phone:
OR
Email address:
Transport Accident CommissionMotorcycle Monitor 2014 | Page 164

----------------------------------------- [NEW SCREEN] ----------------------------------------
Q57. Thank you. You have reached the end of this survey. The results of this survey will be published on www.spokes.com.au and www.tacsafety.com.au in December 2014.
If you would like to enter the prize draw, please enter your details below
[IF DATE IS 24 June 2014 OR EARLIER – Surveys completed prior to 24 June 2014 will also be entered into an additional prize draw]
Note: Your personal details will be treated in strict confidence and will only be used for the purpose of the prize draw. All of your personal details will be deleted once prize draws have been completed. (Please note: this will be kept separate to the details provided in the previous question about future research).
No, I would not be interested in the prize draw 01
Yes, I would like to enter the prize draw 03
[IF NOT PROVIDED DETAILS IN Q56 INSERT BOX]:
Please complete your details for the prize draw belowName:Contact phone:
OR
Email address:
[CONTACT NUMBER OR EMAIL ADDRESS REQUIRED ONLY]
[BIG BUTTON TO SUBMIT SURVEY RESPONSES]
[REDIRECT TO www.spokes.com.au]
Transport Accident CommissionMotorcycle Monitor 2014 | Page 165


