Communication Monitor 2010 Results
122
-
Upload
dianova-international -
Category
Business
-
view
2.244 -
download
1
Transcript of Communication Monitor 2010 Results


2
2
Content
_ Overview 03
_ Research design and socio-demographic analysis 09
_ Job satisfaction 19
_ Contribution to organisational objectives and roles 27
_ Excellence, influence and enhancing professionalism 37
_ Leadership style 49
_ Effects of the global downturn 55
_ Development of disciplines and communication channels 63
_ Online communication and social media 75
_ Communication strategy and planning 89
_ Evaluation and communication performance 97
_ Salaries 105
_ Annex (references, authors and advisory board, imprint) 115
3
3
Overview

4
4
European Communication Monitor 2010
_ Most comprehensive analysis of communication management and public relations worldwide; 1,955 participating professionals from 46 countries
_ Annual research project conducted since 2007 by a group of professors from 11 renowned universities across Europe, led by Prof. Dr. Ansgar Zerfass, University of Leipzig
_ Organised by the European Public Relations Education and Research Association (EUPRERA), the European Association of Communication Directors (EACD) andCommunication Director Magazine
_ Sponsors: Infopaq, Grayling
The research highlights:
_ Challenges for communication professionals in the future
_ Strategic issues, development of disciplines and communication instruments
_ Indicators of excellence and power, planning procedures, leadership style
_ Contribution to organisational objectives
_ Perspectives and limitations of social media
_ Salaries and job satisfaction
Key facts

5
5
Academic task force
Research team
_ Ansgar Zerfass, Prof. Dr., University of Leipzig (GE) – Lead Researcher_ Ralph Tench, Prof. Dr., Leeds Metropolitan University (UK) _ Piet Verhoeven, Ass. Prof. Dr., University of Amsterdam (NL)_ Dejan Verčič, Prof. Ph.D., University of Ljubljana (SI)_ Angeles Moreno, Prof. Ph.D., University Rey Juan Carlos, Madrid (ES)
Advisory board
_ Emanuele Invernizzi, Prof. Dr., IULM University, Milano (IT)_ Valerie Carayol, Prof. Dr., University of Bordeaux (FR)_ Francesco Lurati, Ass. Prof. Dr., University of Lugano (CH)_ Sven Hamrefors, Prof. Dr., Mälardalen University (SE)_ Øyvind Ihlen, Prof. Dr., BI Norwegian School of Management, Oslo (NO)_ Ryszard Lawniczak, Prof. Dr., Poznan University of Economics (PL)
Statistical analysis and organisational support _ Ronny Fechner, M.A., & Katharina Simon, B.Sc., University of Leipzig (GE)

6
6
Partners
European Public Relations Education and Research Association (EUPRERA)
_ The European Public Relations Education and Research Association is an autonomous organisation with members from more than 30 countries that aims at stimulating and promoting the knowledge and practice of communication management in Europe. Academic scholars and experienced practitioners work together to advance fundamental and applied research. www.euprera.org
European Association of Communication Directors (EACD)
_ The European Association of Communication Directors is the leading network for communication professionals across Europe with more than 1,200 members.The non-partisan association lobbies for the profession, establishes common quality standards and promotes the advancement of professional qualification by organising events and providing services and material. www.eacd-online.eu
Communication Director
_ Communication Director is a quarterly magazine for Corporate Communications and Public Relations in Europe. It documents opinions on strategic questions in communication, highlights transnational developments and discusses them froma European perspective. The magazine is published by Helios Media, a specialist publishing house based in Berlin and Brussels. www.communication-director.eu

7
7
Infopaq
_ Infopaq is a global, European-based company, with expertise in media, publicity and analysis. By providing media monitoring, surveys, tracking, news evaluation, analysis and consulting services, they help their clients improve future communications efforts and thereby attain their business goals. The company has approximately 6,500 clients and over 500 employees in Germany, Denmark, Estonia, Finland, Norway and Sweden. www.infopaq.com
Grayling
_ Grayling is the world’s second largest independent Public Relations, Public Affairs, Investor Relations and Events consultancy with specialist services including CSR, environment and sustainability and digital. The consultancy has 900 staff in 70 offices in 40 countries across the US, Western and Eastern Europe, Africa and Asia Pacific. www.grayling.com
Sponsors

8
8
Quotation
_ The material presented in this document represents empirical insights and interpretation by the research team. It is intellectual property subject to international copyright. Publication date: July 2010.
_ You are welcome to quote from the content of this survey and reproduce any graphics, subject to the condition that the source including the internet address is clearly quoted and depicted on every chart. See the imprint for more information.
_ The full report (text and figures) is available as a book published by Helios Media, 124 pp., ISBN 978-3-942263-05-4.
Suggested citation for this document (APA style)
_ Zerfass, A., Tench, R., Verhoeven, P., Verčič, D., & Moreno, A. (2010):European Communication Monitor 2010. Status Quo and Challenges for Public Relations in Europe. Results of an Empirical Survey in 46 Countries (Chart Version).Brussels: EACD, EUPRERA (available at: www.communicationmonitor.eu)
Short quotation to be used in legends (charts/graphics)
_ Source: European Communication Monitor 2010
Copyright and reproduction of results

9
9
Research design andsocio-demographic analysis
10
10
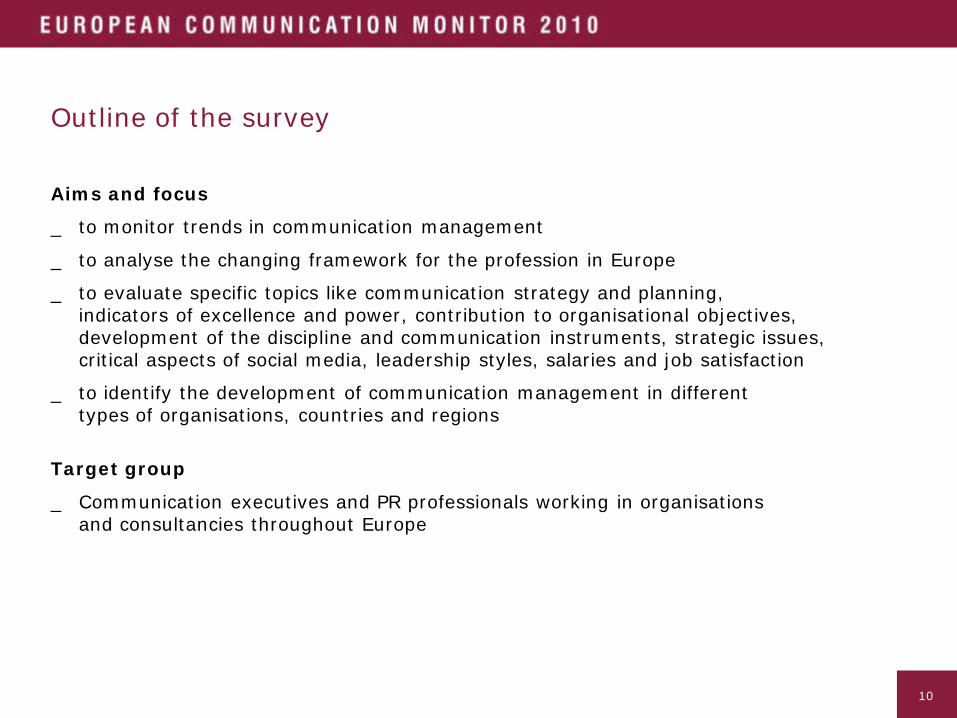
Outline of the survey
Aims and focus
_ to monitor trends in communication management
_ to analyse the changing framework for the profession in Europe
_ to evaluate specific topics like communication strategy and planning,indicators of excellence and power, contribution to organisational objectives, development of the discipline and communication instruments, strategic issues,critical aspects of social media, leadership styles, salaries and job satisfaction
_ to identify the development of communication management in differenttypes of organisations, countries and regions
Target group
_ Communication executives and PR professionals working in organisations and consultancies throughout Europe

11
11
Methodology
Survey method and sampling
_ online survey in March 2010 (4 weeks), English language
_ questionnaire with 19 sections, based on hypotheses and instruments derived from previous research and literature
_ pre-test with 53 practitioners in 12 European countries
_ personal invitation to 30,000+ professionals throughout Europe via e-mailbased on a database provided by EACD; additional invitations to participate via national branch associations and networks (partly self-recruiting); 4,602 respondents and 2,043 fully completed replies
_ evaluation is based on 1,955 fully completed replies by participants clearly identified as part of the population (communication professionals in Europe)
Statistical analysis
_ methods of empirical research, descriptive and analytical analysis (using SPSS)
_ results have been statistically agreed by Pearson's chi-square tests (x²) orSpearman's rank correlation tests (rho) and are classified as significant(p <= 0.05) where appropriate
_ in this report, data highlighted in green or red depicts significant correlations

12
12
Communication excellence, Q3Professionalrole, Q8
Research framework and questions
ProfessionalperceptionEducationJob
statusDemo-
graphics
Person (Communication Manager)
CountryCultureStructure
Organisation
Present
Situation
Future
PerceptionC
E
Age, Q19Gender, Q19Association Member, Q19
Experience, Q19Hierarchy, Q19
Academic, Q19Communicative, Q19
Type oforganisation, Q19
Characteristics of organisational culture, Q17Leadership style, Q18
European homebase, Q19
Communication objectives, Q9Communication strategy andplanning, Q2Evaluation practice, Q10Resources and budgets, Q1Responsibility for digitaland social media, Q12Current concepts forsocial media, Q14
Disciplines and fields of practice, Q5Communication channels, Q6Strategic issues, Q7Features of excellence, Q3 Effects of digital/social media, Q11Importance of social media, Q13Planned concepts for social media, Q14Ways to enhance professionalism, Q15
Position
Advisory/executive influence, Q4Job satisfaction, Q16Personal income, Q19
A
D
E
B

13
13www.communicationmonitor.eu / Zerfass et al. 2010 / n = 1,955 PR professionals from 46 European countries; Q 19.
Demographic background of participants(1,955 communication professionals from 46 European countries)
Position Organisation
Head of communication, Agency CEO
47.9% Communication department- joint stock company 28.5%- private company 21.5%- government-owned, public
sector, political organisation 16.9%- non-profit organisation,
association 11.6%
78.4%
Responsible for single communication discipline, Unit Leader
31.3%
Team member,Consultant
16.5% Communication consultancy,PR Agency, Freelance Consultant
21.6%
Other 4.4%
Job experience Gender / Age
Up to 5 years 19.2% Female 55.8%
6 to 10 years 28,6% Male 44.2%
More than 10 years 52.1% Age (on average) 40.6 yrs
14
14
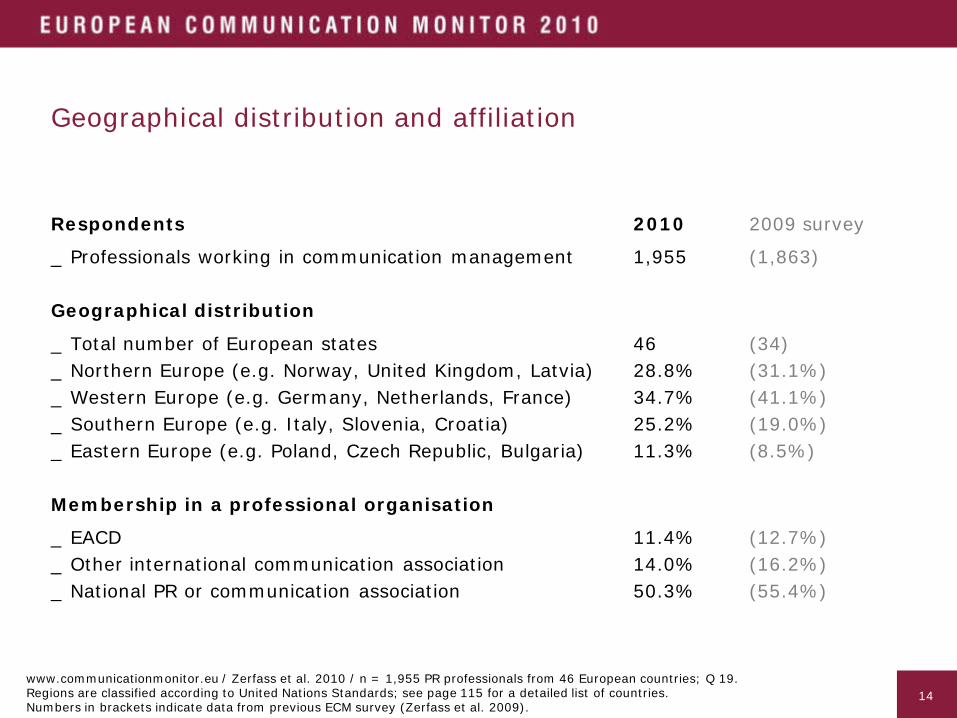
Geographical distribution and affiliation
Respondents 2010 2009 survey
_ Professionals working in communication management 1,955 (1,863)
Geographical distribution
_ Total number of European states 46 (34)_ Northern Europe (e.g. Norway, United Kingdom, Latvia) 28.8% (31.1%)_ Western Europe (e.g. Germany, Netherlands, France) 34.7% (41.1%)_ Southern Europe (e.g. Italy, Slovenia, Croatia) 25.2% (19.0%)_ Eastern Europe (e.g. Poland, Czech Republic, Bulgaria) 11.3% (8.5%)
Membership in a professional organisation
_ EACD 11.4% (12.7%)_ Other international communication association 14.0% (16.2%)_ National PR or communication association 50.3% (55.4%)
www.communicationmonitor.eu / Zerfass et al. 2010 / n = 1,955 PR professionals from 46 European countries; Q 19.Regions are classified according to United Nations Standards; see page 115 for a detailed list of countries. Numbers in brackets indicate data from previous ECM survey (Zerfass et al. 2009).
15
15
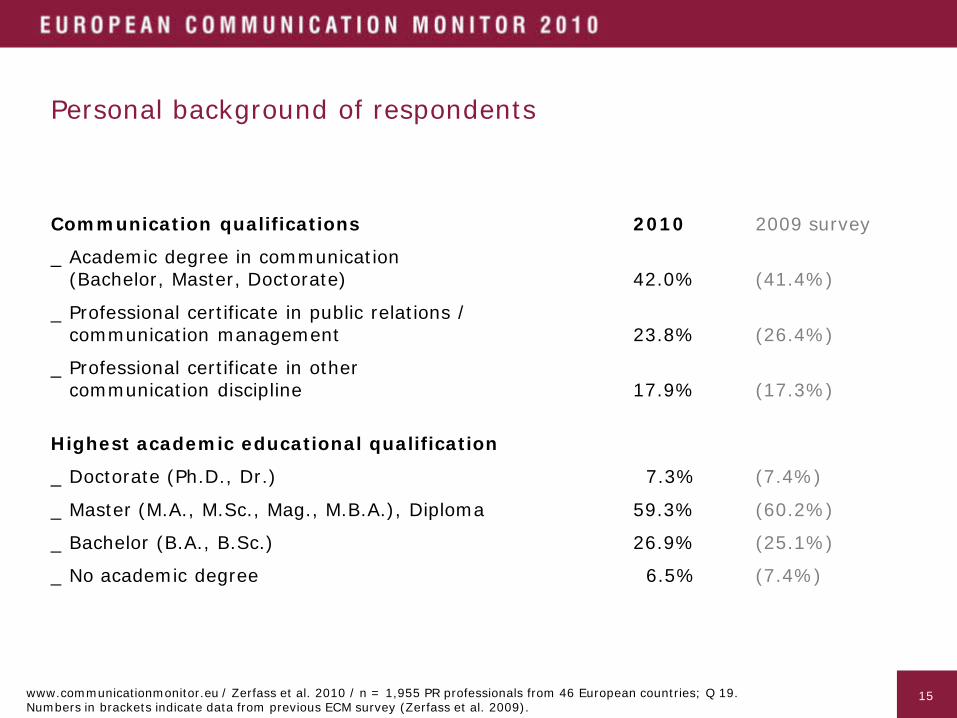
Personal background of respondents
Communication qualifications 2010 2009 survey
_ Academic degree in communication(Bachelor, Master, Doctorate) 42.0% (41.4%)
_ Professional certificate in public relations /communication management 23.8% (26.4%)
_ Professional certificate in othercommunication discipline 17.9% (17.3%)
Highest academic educational qualification
_ Doctorate (Ph.D., Dr.) 7.3% (7.4%)
_ Master (M.A., M.Sc., Mag., M.B.A.), Diploma 59.3% (60.2%)
_ Bachelor (B.A., B.Sc.) 26.9% (25.1%)
_ No academic degree 6.5% (7.4%)
www.communicationmonitor.eu / Zerfass et al. 2010 / n = 1,955 PR professionals from 46 European countries; Q 19.Numbers in brackets indicate data from previous ECM survey (Zerfass et al. 2009).
16
16
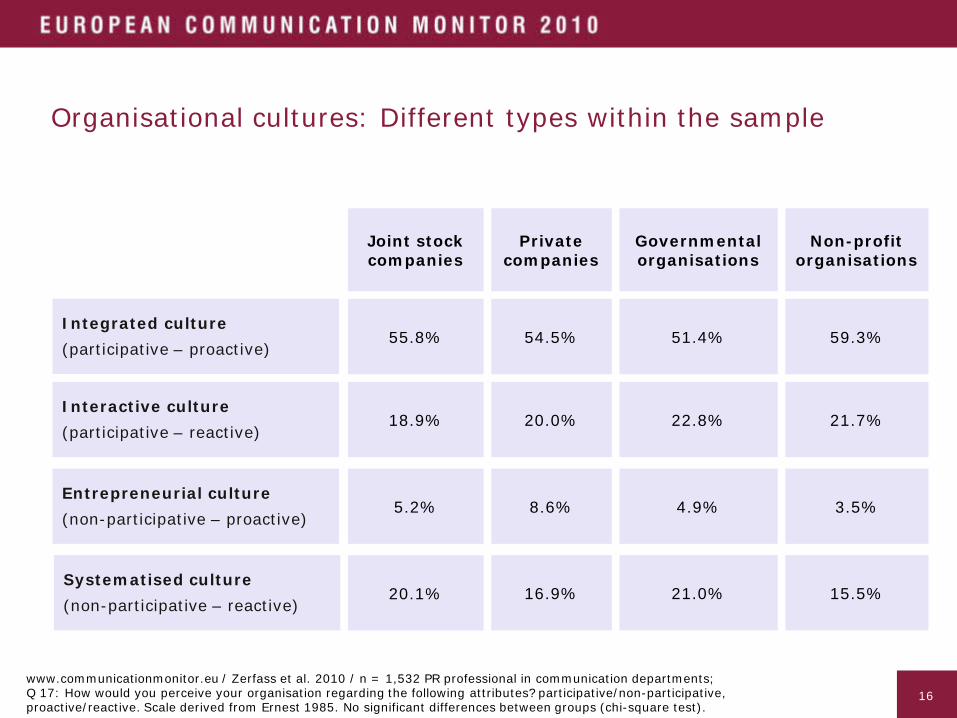
Organisational cultures: Different types within the sample
Joint stock companies
Private companies
Governmental organisations
55.8% 54.5% 51.4%
Non-profit organisations
59.3%
18.9% 20.0% 22.8% 21.7%
5.2% 8.6% 4.9% 3.5%
20.1% 16.9% 21.0% 15.5%
Interactive culture(participative – reactive)
Entrepreneurial culture(non-participative – proactive)
Systematised culture(non-participative – reactive)
Integrated culture(participative – proactive)
www.communicationmonitor.eu / Zerfass et al. 2010 / n = 1,532 PR professional in communication departments;Q 17: How would you perceive your organisation regarding the following attributes? participative/non-participative,proactive/reactive. Scale derived from Ernest 1985. No significant differences between groups (chi-square test).
17
17
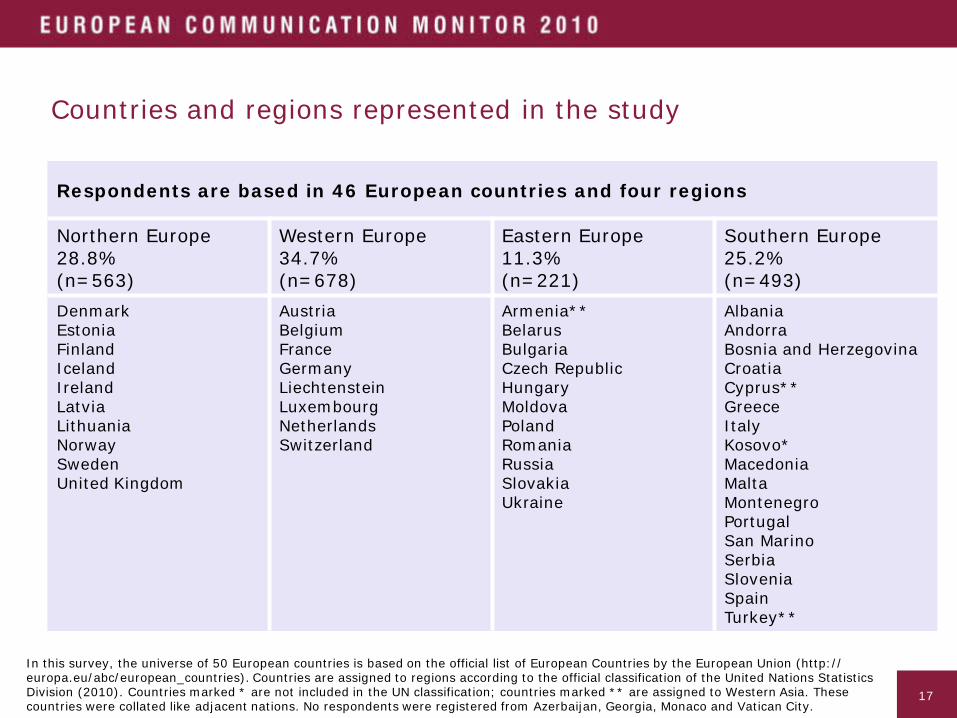
Countries and regions represented in the study
Respondents are based in 46 European countries and four regions
Northern Europe 28.8%(n=563)
Western Europe 34.7%(n=678)
Eastern Europe 11.3%(n=221)
Southern Europe 25.2%(n=493)
DenmarkEstoniaFinlandIcelandIrelandLatviaLithuaniaNorwaySwedenUnited Kingdom
AustriaBelgiumFranceGermanyLiechtensteinLuxembourgNetherlandsSwitzerland
Armenia**BelarusBulgariaCzech RepublicHungaryMoldovaPolandRomaniaRussiaSlovakiaUkraine
AlbaniaAndorraBosnia and HerzegovinaCroatiaCyprus**GreeceItalyKosovo*MacedoniaMaltaMontenegroPortugalSan MarinoSerbiaSloveniaSpainTurkey**
In this survey, the universe of 50 European countries is based on the official list of European Countries by the European Union (http://europa.eu/abc/european_countries). Countries are assigned to regions according to the official classification of the United Nations Statistics Division (2010). Countries marked * are not included in the UN classification; countries marked ** are assigned to Western Asia. These countries were collated like adjacent nations. No respondents were registered from Azerbaijan, Georgia, Monaco and Vatican City.

18
18
Insights into the structures and evolution of communications in Europe
_ Based on a sample of 1,955 professionals from 46 European countries, this research is probably the most comprehensive transnational study ever conducted in the fieldof public relations and communication management.
_ Respondents are characterised by a high level of experience: almost 80% are head of communications, unit leaders or agency CEOs, 50% have more than 10 years of professional experience, the average age is 41 years. The survey lays a solid ground for identifying basic structures and developments in strategic communication.
_ It is necessary to note that economies, communication landscapes and PR professions are in rather different stages of development throughout Europe. Moreover, there is no knowledge about the population of communication departments and agencies in Europe. The survey has been conducted in the English language. Consequently, the findings presented here can not claim representativeness. They are especially useful to identify relevant patterns and trends in the field, which may stimulate qualitative discussions.
_ The analysis is based on thorough empirical research and analysis. Replies from participants not currently working in communication management (academics, students) and from non-European countries have been removed. Only fully completed questionnaires have been taken into account. Data have been analysed using the appropriate statistical procedures like chi-square tests and rank correlation tests.
Interpretation

19
19
Job satisfaction
20
20
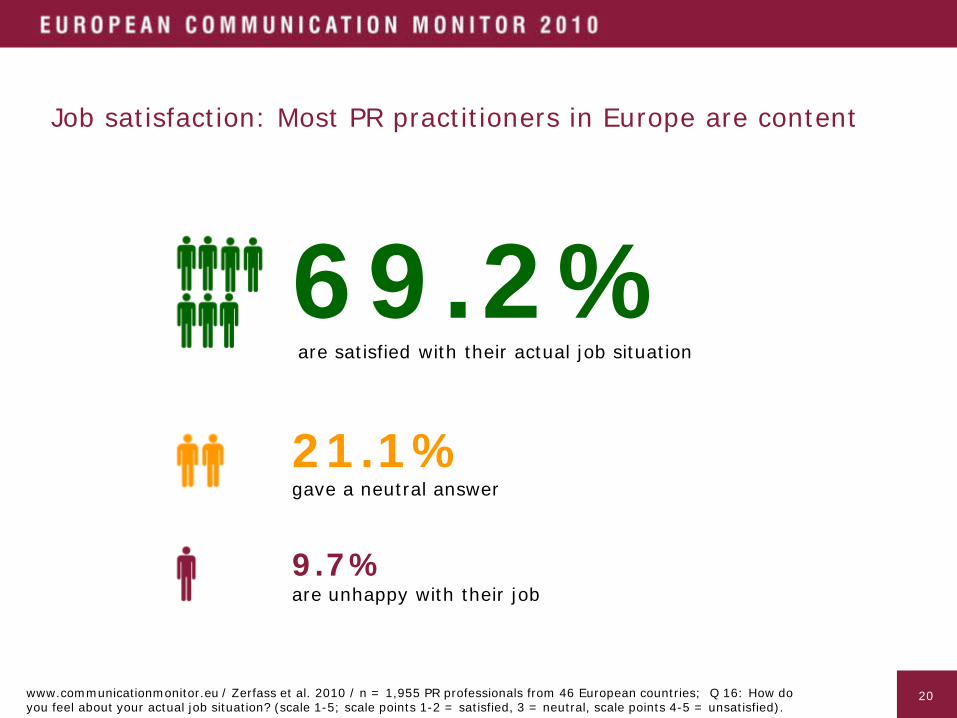
69.2%are satisfied with their actual job situation
21.1%gave a neutral answer
9.7%are unhappy with their job
Job satisfaction: Most PR practitioners in Europe are content
www.communicationmonitor.eu / Zerfass et al. 2010 / n = 1,955 PR professionals from 46 European countries; Q 16: How doyou feel about your actual job situation? (scale 1-5; scale points 1-2 = satisfied, 3 = neutral, scale points 4-5 = unsatisfied).

21
21
Communication professionals enjoy interesting work,but job security and career opportunities are limited
82,3%
71,7%
61,3%
48,6%
43,5%
41,8%
40,1%
69,2%
0% 10% 20% 30% 40% 50% 60% 70% 80% 90%
My tasks are interesting andmanifold.
Superiors and (internal) clientsvalue my work.
The job has a high status.
My job is secure and stable.
The salary is adequate.
My work-life balance is all right.
I have great careeropportunities.
Overall, I am satisfied with myjob.
www.communicationmonitor.eu / Zerfass et al. 2010 / n = 1,955 PR professionals from 46 European countries; Q 16: How do you feel about your actual job situation? (1 = Strongly disagree; 5 = Totally agree; considered scale points: 4-5).

22
22
Practitioners in Eastern Europe are the most satisfied with their jobs
www.communicationmonitor.eu / Zerfass et al. 2010 / n = 1,955 PR professionals from 46 European countries; Q 16 (scale 1-5; scale points 1-2 = satisfied, 3 = neutral, 4-5 = unsatisfied).
73,4% 75,1% 72,7%
57,0%69,2%
19,4% 16,3% 18,7%
28,6%
21,1%
7,3% 8,6% 8,6%14,4% 9,7%
0%
10%
20%
30%
40%
50%
60%
70%
80%
90%
100%
Northern Europe Eastern Europe Western Europe Southern Europe Overall
Satisfied with their jobs Neutral answer Unsatisfied with their jobs

23
23
Respondents in Southern Europe are less content,especially with regards to job security and income
0
1
2
3
4
5
6
7
100% 200% 300% 400% 500%
Western Europe Northern Europe Southern Europe Eastern Europe
My job is secure and stable.
Stronglydisagree
Totally agree
My tasks are interesting and
manifold.Superiors and
(internal) clients value my work.
The job has a high status.
The salary is adequate.
My work-life balance is all right.
I have great career opportunities.
www.communicationmonitor.eu / Zerfass et al. 2010 / n = 1,955 PR professionals from 46 European countries; Q 16 (scale 1-5).

24
24
PR professionals are significantly more likely to be satisfiedif they are female and working in higher positions
3.87 3.77Overall satisfaction 3.76 3.78
Joint stock companies
Private companies
Governmental organisations
Non-profit organisations
4.01 3.63Overall satisfaction 3.52
Head of communication,Agency CEO Unit Leader Team member,
Consultant
www.communicationmonitor.eu / Zerfass et al. 2010 / n = 1,955 PR professionals from 46 European countries; Q 16 (scale 1-5),Q 19; average results. Position, gender: significant differences between the groups (chi-square test, p≤0.05).
3.80
AgenciesType oforganisation
Position
3.89 3.73Overall satisfaction 3.80
Female Male TotalGender
3.91 3.79Overall satisfaction 3.80
EACD Otherprofessionals TotalAssociation
membership
25
25
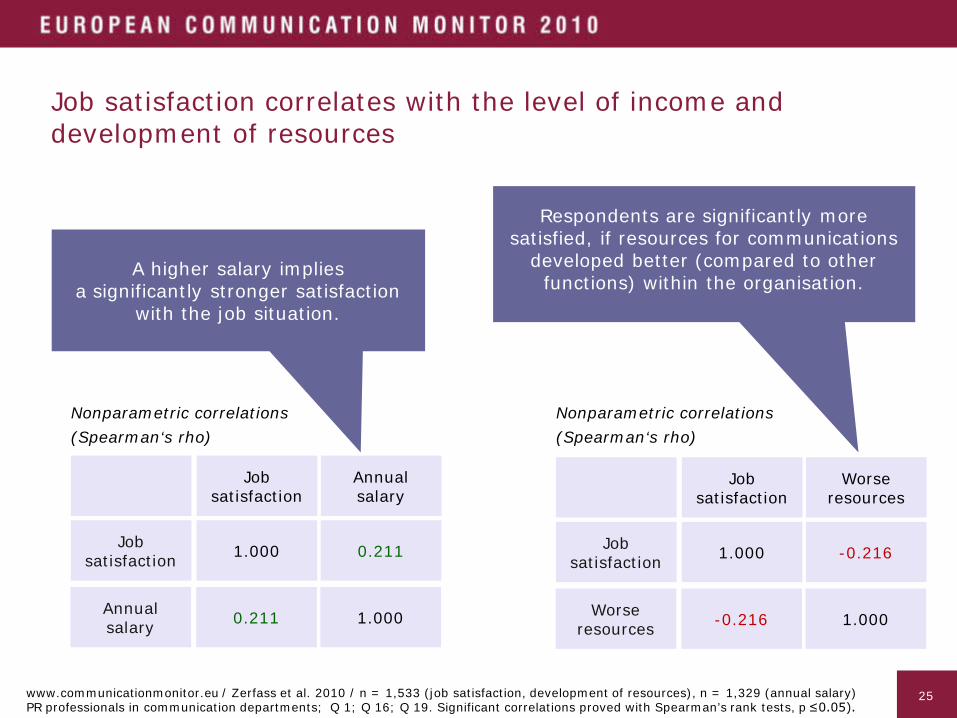
Job satisfaction correlates with the level of income and development of resources
1.000 0.211Jobsatisfaction
Jobsatisfaction
Annualsalary
0.211 1.000Annualsalary
1.000 -0.216Jobsatisfaction
Jobsatisfaction
Worseresources
-0.216 1.000Worseresources
Nonparametric correlations(Spearman‘s rho)
Nonparametric correlations(Spearman‘s rho)
A higher salary impliesa significantly stronger satisfaction
with the job situation.
Respondents are significantly more satisfied, if resources for communications
developed better (compared to other functions) within the organisation.
www.communicationmonitor.eu / Zerfass et al. 2010 / n = 1,533 (job satisfaction, development of resources), n = 1,329 (annual salary)PR professionals in communication departments; Q 1; Q 16; Q 19. Significant correlations proved with Spearman’s rank tests, p≤0.05).
26
26
Job satisfaction
_ In general, communication professionals in Europe are satisfied with their job, although there are differences across the regions.
_ Practitioners in Eastern Europe are most satisfied with their working conditions, Southern Europeans the least. Respondents in the latter region are lagging behind in all dimensions; they complain about inadequate salaries and less job security. Cultural and socio-economic differences and a diverging maturity of the profession across Europe may explain these differences.
_ Interesting tasks, acknowledgement of the work by superiors and clients and the status of the job are the main contributors to satisfaction.
_ Only four out of ten respondents are satisfied with their career opportunities, work-life balance and salary.
_ PR professionals are more likely to be satisfied if they are female and working in higher positions. These results point to factors like gender and managerial responsibility as important for the job satisfaction of professionals.
_ Moreover, job satisfaction is positively influenced by higher salaries and a better development of resources during the recession. While self-actualisation by performing manifold tasks and respect by others are prevalent in the profession, material incentives are significant drivers of satisfaction.
Interpretation

27
27
Contribution to organisational objectives and roles
28
28
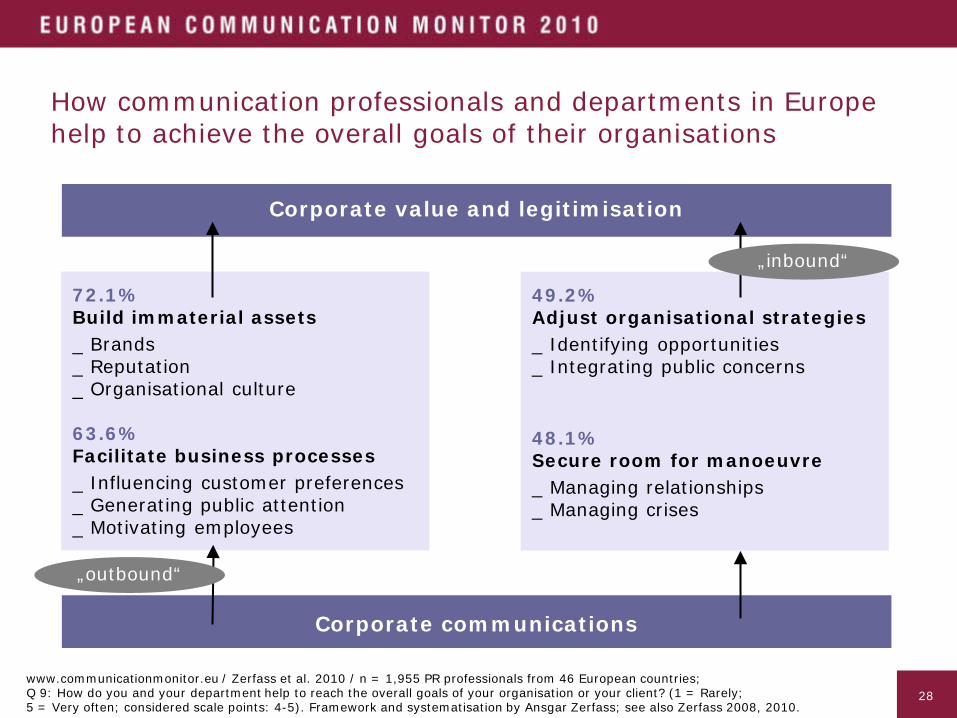
72.1%Build immaterial assets_ Brands_ Reputation_ Organisational culture
63.6%Facilitate business processes_ Influencing customer preferences_ Generating public attention_ Motivating employees
49.2%Adjust organisational strategies_ Identifying opportunities_ Integrating public concerns
48.1%Secure room for manoeuvre_ Managing relationships_ Managing crises
Corporate communications
Corporate value and legitimisation
„inbound“
„outbound“
www.communicationmonitor.eu / Zerfass et al. 2010 / n = 1,955 PR professionals from 46 European countries;Q 9: How do you and your department help to reach the overall goals of your organisation or your client? (1 = Rarely;5 = Very often; considered scale points: 4-5). Framework and systematisation by Ansgar Zerfass; see also Zerfass 2008, 2010.
How communication professionals and departments in Europehelp to achieve the overall goals of their organisations
29
29
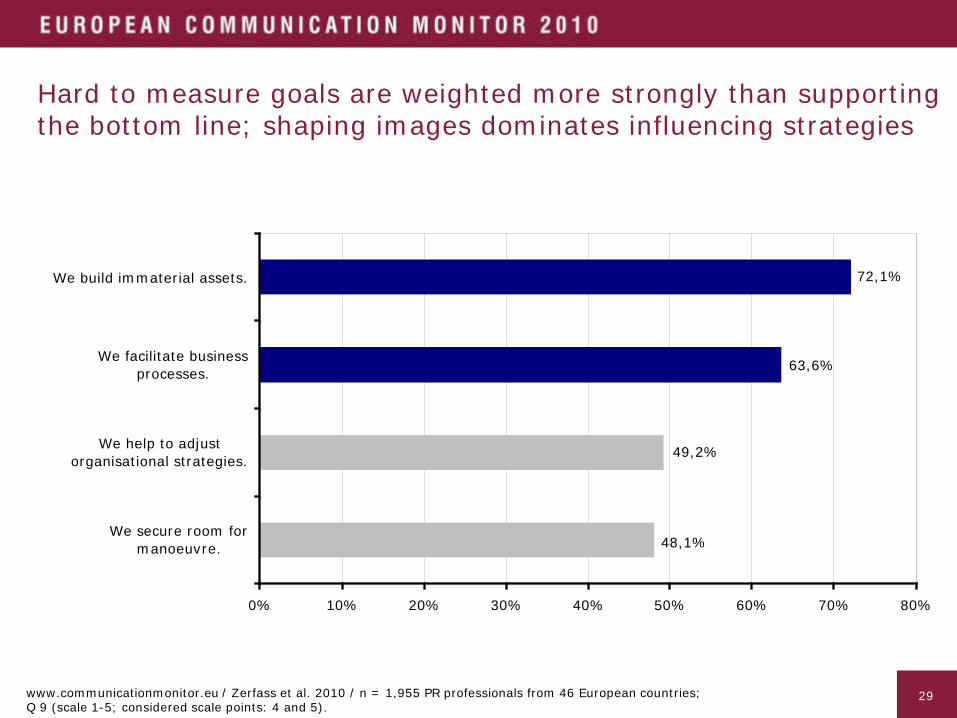
Hard to measure goals are weighted more strongly than supporting the bottom line; shaping images dominates influencing strategies
www.communicationmonitor.eu / Zerfass et al. 2010 / n = 1,955 PR professionals from 46 European countries; Q 9 (scale 1-5; considered scale points: 4 and 5).
48,1%
49,2%
72,1%
63,6%
0% 10% 20% 30% 40% 50% 60% 70% 80%
We build immaterial assets.
We facilitate businessprocesses.
We help to adjustorganisational strategies.
We secure room formanoeuvre.

30
30
Contribution to organisational objectives in European regions
3.75 3.62Facilitate business processes
Build immaterial assets 3.94 3.86
3.53 3.20Secure room for manoeuvre
Help to adjust organisational strategies 3.42 3.30
3.66
3.91
3.30
3.44
3.85
4.07
3.48
3.39
Northern Europe
Western Europe
Southern Europe
Eastern Europe
www.communicationmonitor.eu / Zerfass et al. 2010 / n = 1,955 PR professionals from 46 European countries; Q 9 (scale 1-5),Q 19; average results. Facilitate processes, secure room: significant differences between groups (chi-square test, p≤0.05).
31
31
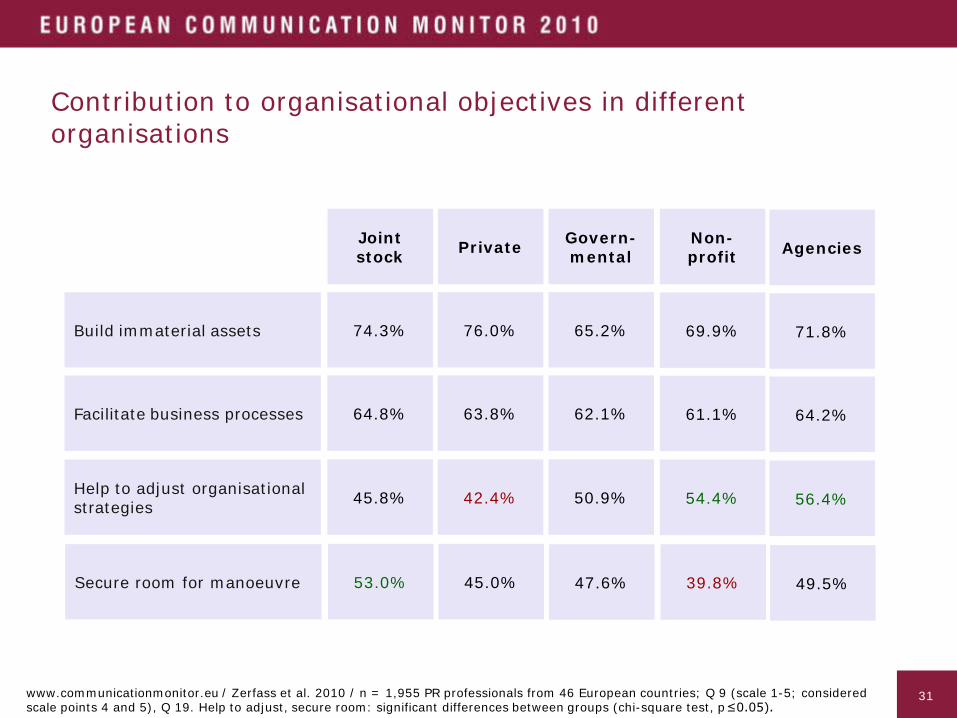
Contribution to organisational objectives in different organisations
64.8% 63.8%Facilitate business processes
Build immaterial assets 74.3% 76.0%
53.0% 45.0%Secure room for manoeuvre
Help to adjust organisational strategies 45.8% 42.4%
62.1%
65.2%
47.6%
50.9%
61.1%
69.9%
39.8%
54.4%
Jointstock Private Govern-
mentalNon-profit
www.communicationmonitor.eu / Zerfass et al. 2010 / n = 1,955 PR professionals from 46 European countries; Q 9 (scale 1-5; considered scale points 4 and 5), Q 19. Help to adjust, secure room: significant differences between groups (chi-square test, p≤0.05).
64.2%
71.8%
49.5%
56.4%
Agencies
32
32
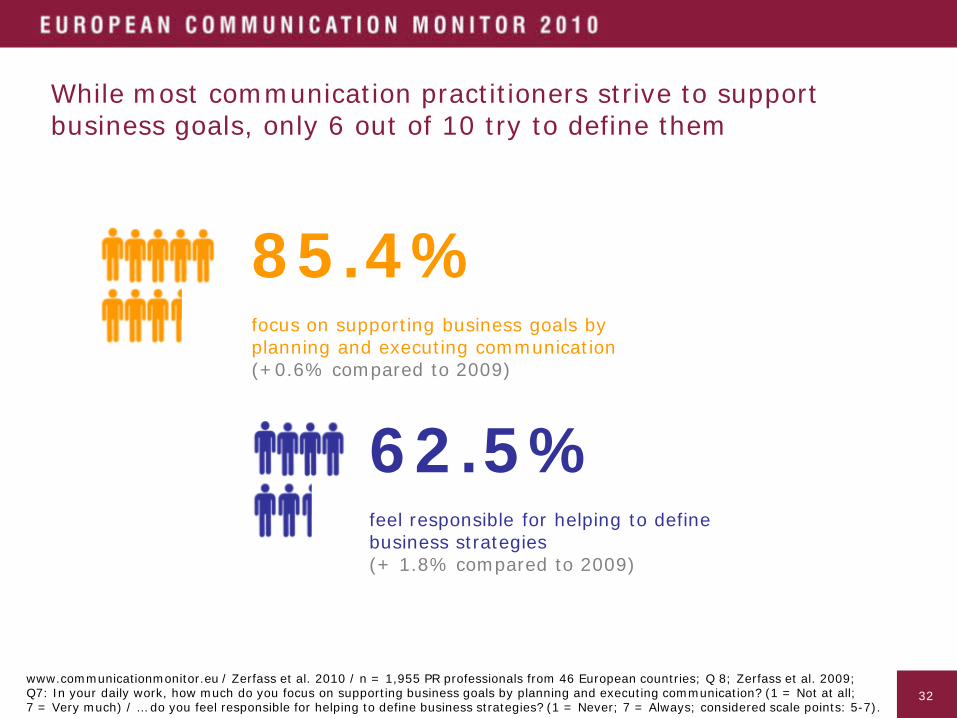
While most communication practitioners strive to supportbusiness goals, only 6 out of 10 try to define them
62.5%feel responsible for helping to define business strategies(+ 1.8% compared to 2009)
85.4%focus on supporting business goals by planning and executing communication(+0.6% compared to 2009)
www.communicationmonitor.eu / Zerfass et al. 2010 / n = 1,955 PR professionals from 46 European countries; Q 8; Zerfass et al. 2009;Q7: In your daily work, how much do you focus on supporting business goals by planning and executing communication? (1 = Not at all;7 = Very much) / … do you feel responsible for helping to define business strategies? (1 = Never; 7 = Always; considered scale points: 5-7).

33
33
Professional roles: Almost 60% contribute to overall goals by acting as strategic facilitators, while others have limited visions
Scale: 1-4 Scale: 5-7
Sca
le:
5-7
Sca
le:
1-4 Operational
Supporters27.0%
NOT AT ALLSUPPORTING BUSINESS GOALS BY MANAGING COMMUNICATION
VERY MUCHSUPPORTING BUSINESS GOALS BY MANAGING COMMUNICATION
ALWAYSHELPING TO DEFINE BUSINESS STRATEGIES
NEVERHELPING TO DEFINE BUSINESS STRATEGIES
StrategicFacilitators
58.4%
BusinessAdvisers
4.1%
IsolatedExperts10.5%
www.communicationmonitor.eu / Zerfass et al. 2010 / n = 1,955 PR professionals from 46 European countries; Q 8: In yourdaily work, how much do you focus on supporting business goals by planning and executing communication? (1 = Not at all;7 = Very much) / … how much do you feel responsible for helping to define business strategies? (1 = Never; 7 = Always).

34
34
Distribution of professional roles in European regions
Northern Europe
Strategic Facilitators
Operational Supporters
62.0% 57.4%
22.3%
Western Europe
Southern Europe
Eastern Europe
27.2%
55.5%
31.1% 24.4%
60.2%
www.communicationmonitor.eu / Zerfass et al. 2010 / n = 1,955 PR professionals from 46 European countries;Q 8, Q 19. All roles: significant differences between groups (chi-square test, p≤0.05).
Business Advisers 7.7%2.0% 3.2% 4.1%
Isolated Experts 12.6%8.9% 10.2% 11.3%
35
35
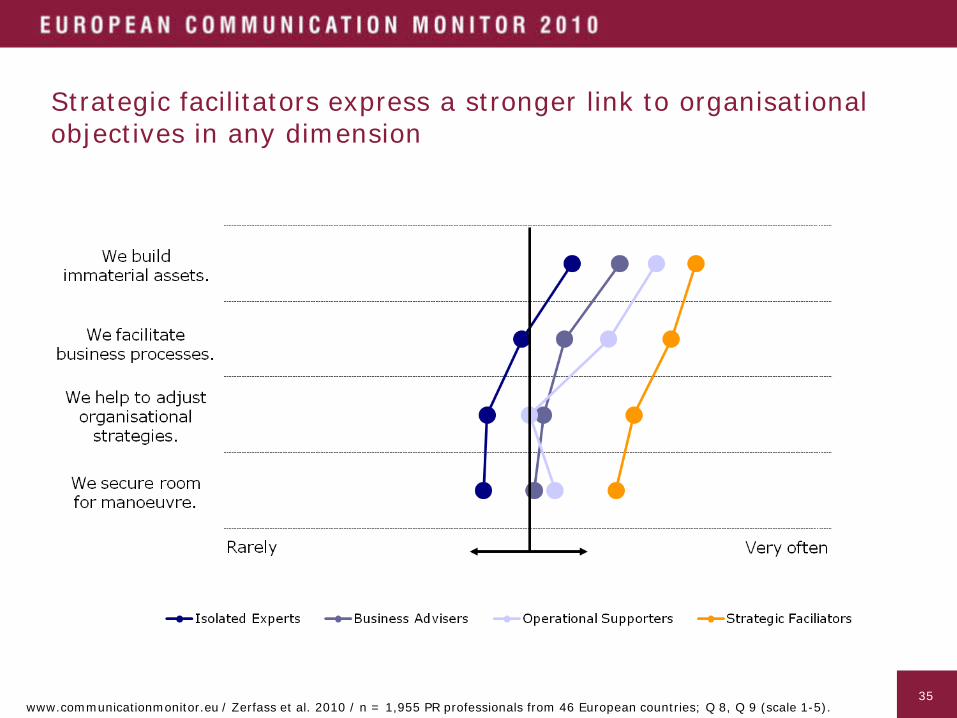
Strategic facilitators express a stronger link to organisational objectives in any dimension
www.communicationmonitor.eu / Zerfass et al. 2010 / n = 1,955 PR professionals from 46 European countries; Q 8, Q 9 (scale 1-5).
36
36
Interpretation
Missing link between communication activities and organisational goals
_ Many professionals neglect one or more basic courses of action by which communication management may contribute to overall organisational goals. While 72% claim building immaterial assets like reputation, culture and brands, only 64% commit themselves to facilitating business processes ‒ the only direct way for communications to support the bottom line.
_ Overall, those “outbound” courses aimed at dissemination of messages are predominant. Less than half of the respondents implement “inbound” activities aiming at adjusting organisational strategies or securing room for manoeuvre.
_ This corresponds with the professional perception. 85% of the respondents focus on supporting problems deriving from business strategies using communication activities.Less than 63% feel responsible for helping to define organisational objectives by adding the communicative dimension to strategy formulation. Practice thus does not reflect theories (Van Ruler & Verčič 2005; Lurati & Eppler 2006; Zerfass 2008) which definePR professionals as boundary-spanners combining speaking out and listening.
_ The “strategic facilitator” role already identified in the ECM 2009 survey (Zerfass et al., 2009) shows a stronger link to organisational objectives than any other professional role. This role is significantly more common in Northern Europe (62% compared to 55% in Western Europe), while nearly 13% of professionals working in Southern Europe identify themselves as “isolated experts”.

37
37
Excellence, influence andenhancing professionalism

38
38
85,8%
82,1%
81,8%
75,8%
69,7%
65,9%
63,7%
54,1%
41,4%
0% 20% 40% 60% 80% 100%
Good relationships with key stakeholders
Capability to mobilise people
Formal involvement in the strategic management process
Knowledge of communication rules
Processes for planning and evaluating communication
Informal networks within the organisation
Capability to use content production tools
Hierarchical position of the senior communication professional
Independence from organisational decision-making
www.communicationmonitor.eu / Zerfass et al. 2010 / n = 1, 955 PR professionals in 46 European countries; Q 3: In your experience,which features define the excellence of a communication department? (1 = Not at all; 5 = Significantly; considered scale points 4-5).Items derived from various concepts and theories like Plowman 2005 and Giddens 1984.
Communication departments which are perceived as excellent are able to involve stakeholders, mobilise people and influence management processes
39
39
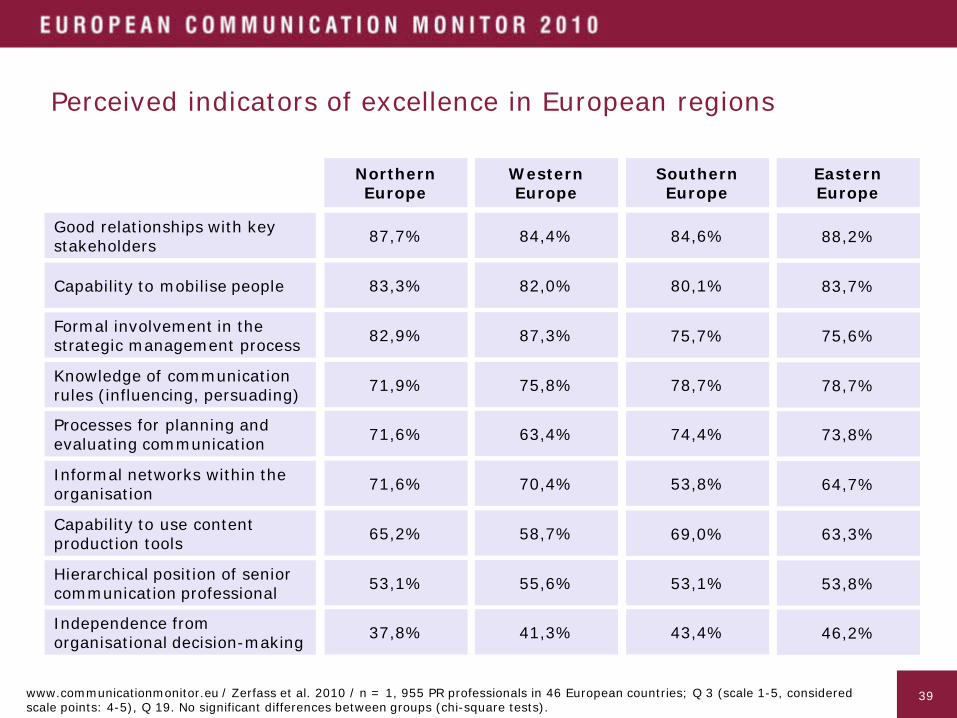
Perceived indicators of excellence in European regions
Good relationships with key stakeholders
Capability to mobilise people
Formal involvement in the strategic management process
Knowledge of communication rules (influencing, persuading)
Southern Europe
84,6%
80,1%
75,7%
78,7%
Eastern Europe
88,2%
83,7%
75,6%
78,7%
Processes for planning and evaluating communication
Informal networks within the organisation
Capability to use content production tools
Hierarchical position of senior communication professional
74,4%
53,8%
69,0%
53,1%
73,8%
64,7%
63,3%
53,8%
Independence from organisational decision-making 43,4% 46,2%
www.communicationmonitor.eu / Zerfass et al. 2010 / n = 1, 955 PR professionals in 46 European countries; Q 3 (scale 1-5, considered scale points: 4-5), Q 19. No significant differences between groups (chi-square tests).
Northern Europe
87,7%
83,3%
82,9%
71,9%
71,6%
71,6%
65,2%
53,1%
37,8%
Western Europe
84,4%
82,0%
87,3%
75,8%
63,4%
70,4%
58,7%
55,6%
41,3%
40
40
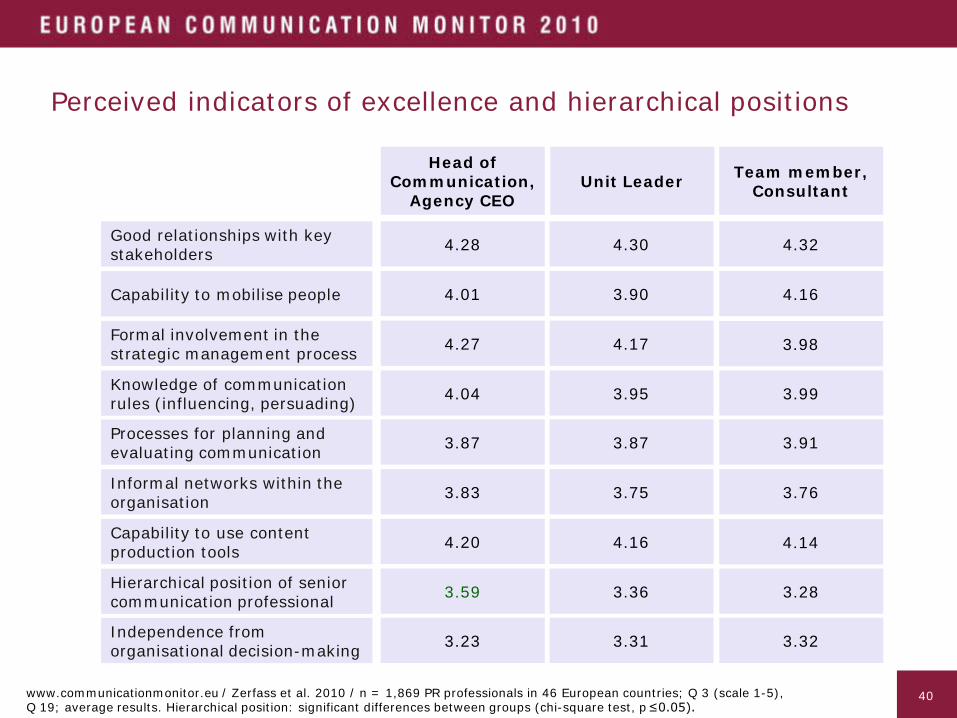
Perceived indicators of excellence and hierarchical positions
Head of Communication,
Agency CEOUnit Leader
4.28 4.30Good relationships with key stakeholders
Capability to mobilise people 4.01 3.90
4.27 4.17Formal involvement in the strategic management process
Knowledge of communication rules (influencing, persuading) 4.04 3.95
Team member,Consultant
4.32
4.16
3.98
3.99
3.87 3.87Processes for planning and evaluating communication
Informal networks within the organisation 3.83 3.75
4.20 4.16Capability to use content production tools
Hierarchical position of senior communication professional 3.59 3.36
3.91
3.76
4.14
3.28
Independence from organisational decision-making 3.23 3.31 3.32
www.communicationmonitor.eu / Zerfass et al. 2010 / n = 1,869 PR professionals in 46 European countries; Q 3 (scale 1-5),Q 19; average results. Hierarchical position: significant differences between groups (chi-square test, p≤0.05).

41
41
Perceived indicators of excellence and professional experience
Less than5 years
6 to 10 years
4.25 4.29Good relationships with key stakeholders
Capability to mobilise people 4.16 4.16
3.97 4.18Formal involvement in the strategic management process
Knowledge of communication rules (influencing, persuading) 3.90 3.99
More than10 years
4.30
4.19
4.27
4.04
3.91 3.86Processes for planning and evaluating communication
Informal networks within the organisation 3.72 3.80
3.91 3.74Capability to use content production tools
Hierarchical position of senior communication professional 3.15 3.33
3.89
3.82
3.69
3.62
Independence from organisational decision-making 3.30 3.28 3.26
www.communicationmonitor.eu / Zerfass et al. 2010 / n = 1, 955 PR professionals in 46 European countries; Q 3 (scale 1-5),Q 19; average results. Hierarchical position: significant differences between groups (chi-square test, p≤0.05).
42
42
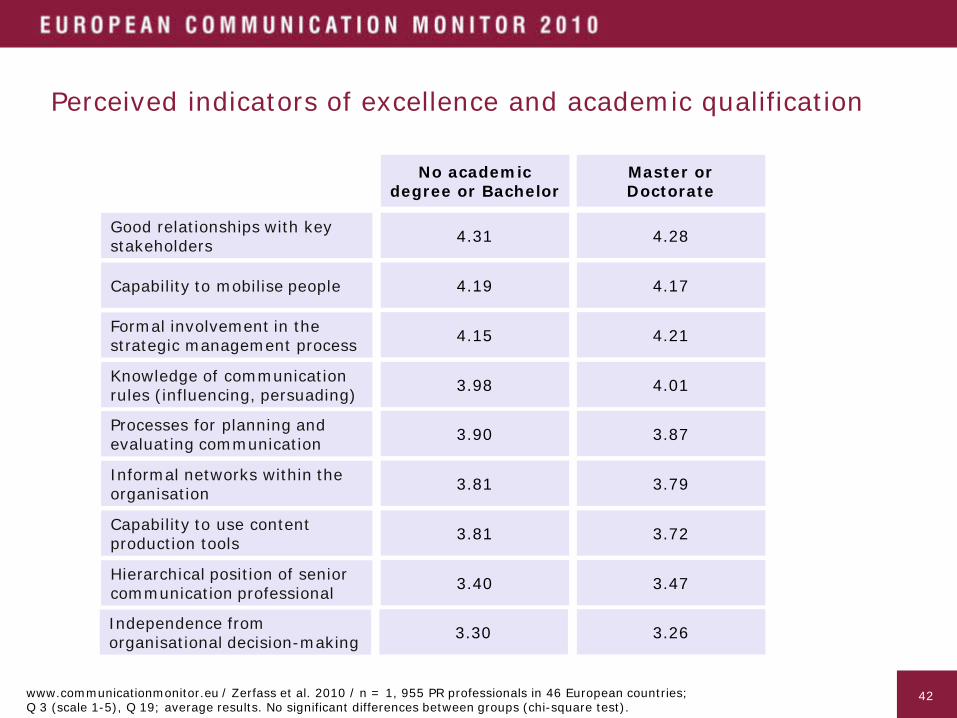
Perceived indicators of excellence and academic qualification
No academic degree or Bachelor
Master or Doctorate
4.31 4.28Good relationships with key stakeholders
Capability to mobilise people 4.19 4.17
4.15 4.21Formal involvement in the strategic management process
Knowledge of communication rules (influencing, persuading) 3.98 4.01
3.90 3.87Processes for planning and evaluating communication
Informal networks within the organisation 3.81 3.79
3.81 3.72Capability to use content production tools
Hierarchical position of senior communication professional 3.40 3.47
Independence from organisational decision-making 3.30 3.26
www.communicationmonitor.eu / Zerfass et al. 2010 / n = 1, 955 PR professionals in 46 European countries;Q 3 (scale 1-5), Q 19; average results. No significant differences between groups (chi-square test).
43
43
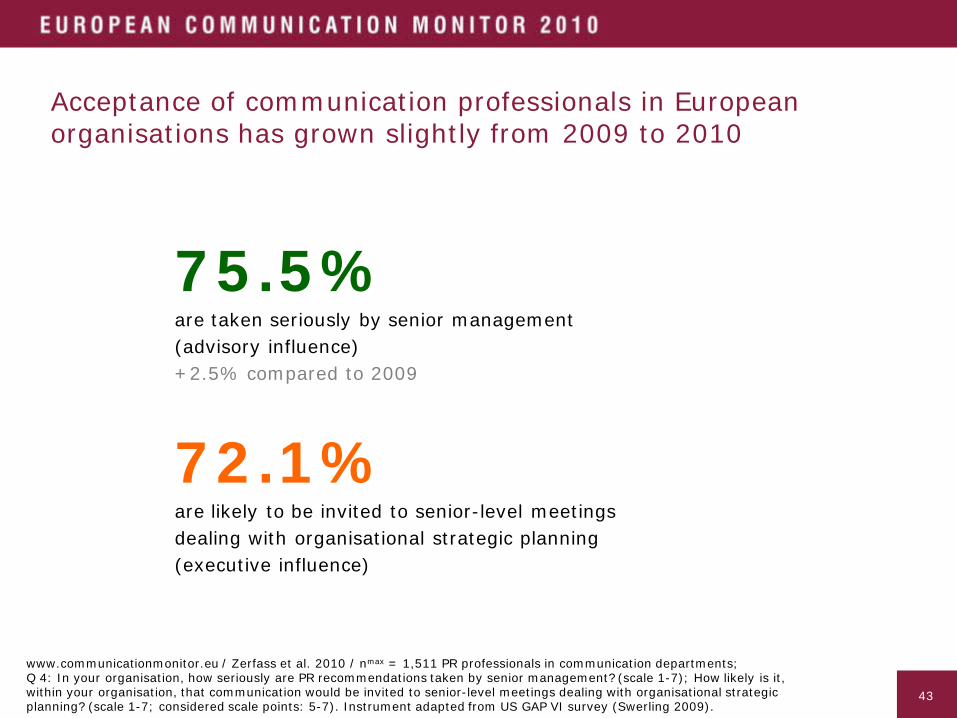
75.5%are taken seriously by senior management(advisory influence)+2.5% compared to 2009
72.1%are likely to be invited to senior-level meetingsdealing with organisational strategic planning(executive influence)
www.communicationmonitor.eu / Zerfass et al. 2010 / nmax = 1,511 PR professionals in communication departments;Q 4: In your organisation, how seriously are PR recommendations taken by senior management? (scale 1-7); How likely is it,within your organisation, that communication would be invited to senior-level meetings dealing with organisational strategicplanning? (scale 1-7; considered scale points: 5-7). Instrument adapted from US GAP VI survey (Swerling 2009).
Acceptance of communication professionals in European organisations has grown slightly from 2009 to 2010

44
44
Perceptions of influence correlate with the hierarchical position
www.communicationmonitor.eu / Zerfass et al. 2010 / nmax = 1,511 PR professionals in communication departments;Q 4 (scale 1-7; considered scale points: 5-7).
81,3%
74,2%
60,3%
76,2%
70,8%
63,0%
0% 10% 20% 30% 40% 50% 60% 70% 80% 90%
Head of communication
Unit Leader
Team member
Advisory Influence Executive Influence
45
45
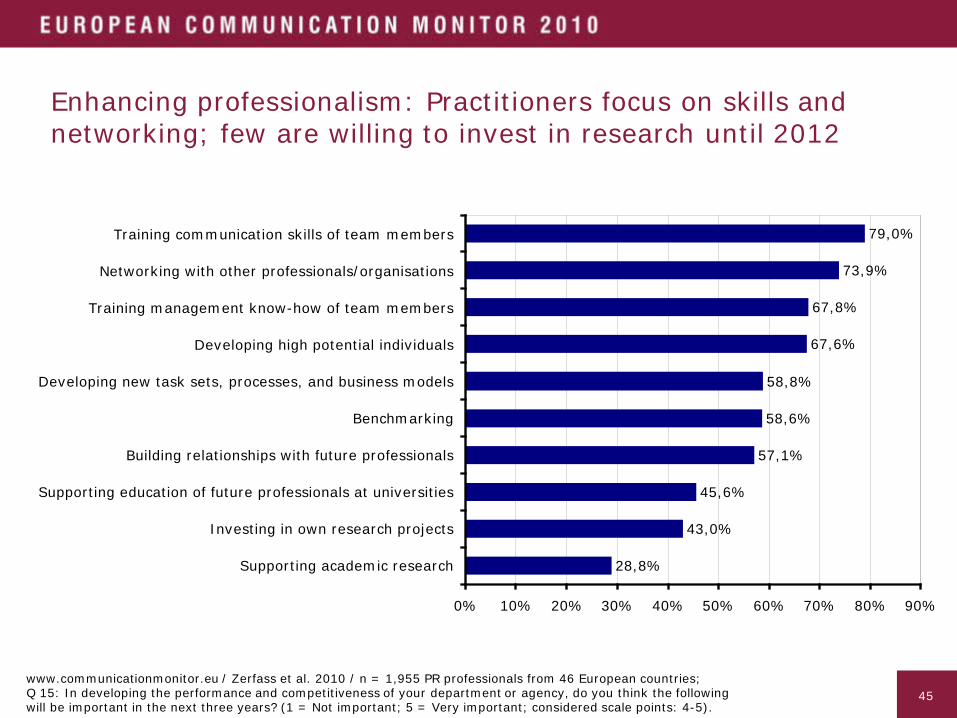
Enhancing professionalism: Practitioners focus on skills andnetworking; few are willing to invest in research until 2012
79,0%
73,9%
67,8%
67,6%
58,8%
58,6%
57,1%
45,6%
43,0%
28,8%
0% 10% 20% 30% 40% 50% 60% 70% 80% 90%
Training communication skills of team members
Networking with other professionals/organisations
Training management know-how of team members
Developing high potential individuals
Developing new task sets, processes, and business models
Benchmarking
Building relationships with future professionals
Supporting education of future professionals at universities
Investing in own research projects
Supporting academic research
www.communicationmonitor.eu / Zerfass et al. 2010 / n = 1,955 PR professionals from 46 European countries;Q 15: In developing the performance and competitiveness of your department or agency, do you think the followingwill be important in the next three years? (1 = Not important; 5 = Very important; considered scale points: 4-5).
46
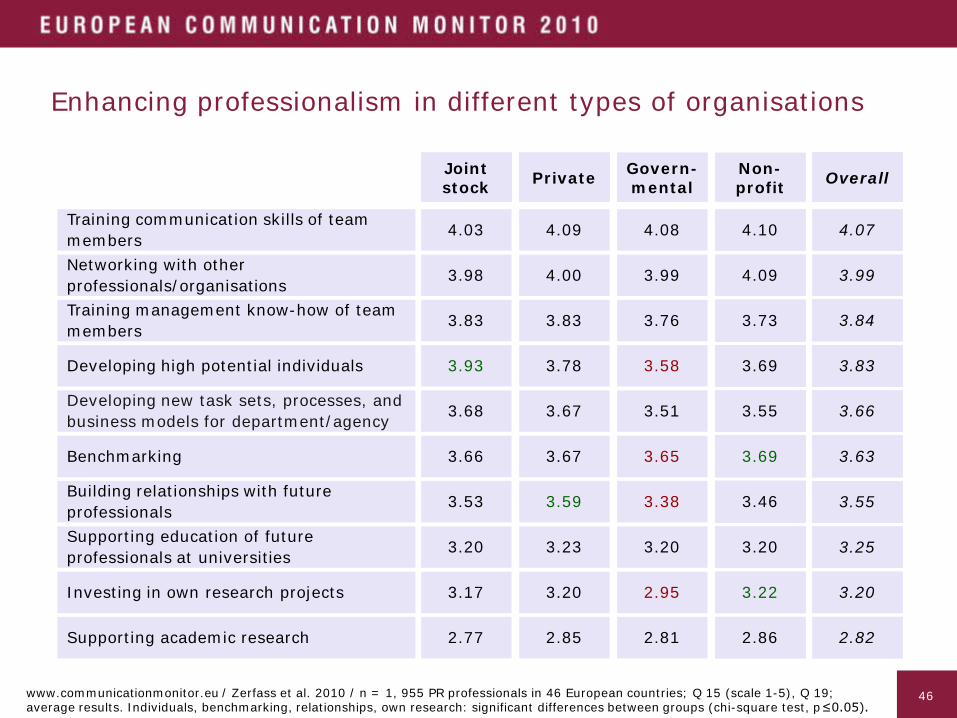
46
Enhancing professionalism in different types of organisations
Jointstock
Benchmarking
Developing high potential individuals
Training management know-how of teammembers
Developing new task sets, processes, and business models for department/agency
Building relationships with future professionals
3.66 %
%
%
%
Supporting education of future professionals at universities
%
Investing in own research projects
Supporting academic research
Private Govern-mental Non profit
3.83
3.93
3.68
3.53
3.20
3.17
2.77
3.67 3.65
3.78
3.20
3.83
2.85
3.67
3.59
3.23
3.76
3.58
3.51
%
%
%
3.38
3.20
2.95
2.81
%
%
%
%
%
%
%
%
%
%
%
%
%
%
%
%
%
%
%
%
%
%
%
%
%
%
%
%
2.86
3.22
3.20
3.46
3.55
3.69
3.73
3.69
Jointstock PrivateJointstock Private Govern-
mentalJointstock Private Non-
profitGovern-mental
Jointstock Private Overall
26.8%
29.8%
83.0%
62.0%
44.9%
32.4%
28.5%
35.1%
Overall
26.8%
29.8%
Overall
26.8%
83.0%
29.8%
Overall
26.8%
62.0%
83.0%
29.8%
Overall
26.8%
44.9%
62.0%
83.0%
29.8%
Overall
26.8%
32.4%
44.9%
62.0%
83.0%
29.8%
Overall
26.8%
28.5%
32.4%
44.9%
62.0%
83.0%
29.8%
Overall
26.8%
2.82
3.20
3.25
3.55
3.66
3.83
3.84
Overall
3.63
Training communication skills of team members 4.03 4.09 %4.08 4.10 35.1%4.07
Networking with other professionals/organisations 3.98 4.00 %3.99 4.09 35.1%3.99
www.communicationmonitor.eu / Zerfass et al. 2010 / n = 1, 955 PR professionals in 46 European countries; Q 15 (scale 1-5), Q 19; average results. Individuals, benchmarking, relationships, own research: significant differences between groups (chi-square test, p≤0.05).

47
47
Enhancing professionalism in European regions
Jointstock
Benchmarking
Developing high potential individuals
Training management know-how of teammembers
Developing new task sets, processes, and business models for department/agency
Building relationships with future professionals
3.59 %
%
%
%
Supporting education of future professionals at universities
%
Investing in own research projects
Supporting academic research
Private Govern-mental Non profit
3.74
3.78
3.60
3.37
2.93
2.95
2.61
3.46 3.85
3.68
3.06
3.72
2.69
3.57
3.44
3.13
4.03
3.99
3.80
%
%
%
3.83
3.68
3.58
3.19
%
%
%
%
%
%
%
%
%
%
%
%
%
%
%
%
%
%
%
%
%
%
%
%
%
%
%
%
2.90
3.42
3.51
3.69
3.80
4.07
4.01
3.75
Jointstock PrivateJointstock Private Govern-
mentalJointstock Private Eastern
EuropeSouthernEurope
NorthernEurope
WesternEurope Overall
26.8%
29.8%
83.0%
62.0%
44.9%
32.4%
28.5%
35.1%
Overall
26.8%
29.8%
Overall
26.8%
83.0%
29.8%
Overall
26.8%
62.0%
83.0%
29.8%
Overall
26.8%
44.9%
62.0%
83.0%
29.8%
Overall
26.8%
32.4%
44.9%
62.0%
83.0%
29.8%
Overall
26.8%
28.5%
32.4%
44.9%
62.0%
83.0%
29.8%
Overall
26.8%
2.82
3.20
3.25
3.55
3.66
3.83
3.84
Overall
3.63
Training communication skills of team members 4.09 3.96 %4.15 4.18 35.1%4.07
Networking with other professionals/organisations 4.02 3.91 %4.05 4.03 35.1%3.99
www.communicationmonitor.eu / Zerfass et al. 2010 / n = 1, 955 PR professionals in 46 European countries; Q 15 (scale 1-5), Q 19. Individuals, benchmarking, relationships, education, own research, academic research: significant differences (chi-square test, p≤0.05).

48
48
Interpretation
Perceptions of excellence and influence depend on experience and position
_ From the point of view of European PR professionals, the top criteria for excellence in communication departments are the ability to develop and maintain good relationships with stakeholders; the capacity to mobilise people and to be formally involved in management decisions.
_ When defining excellence, the more senior the practitioners are and the more experience they have (in years) significantly influences the importance placed on the hierarchical position of the head of communications. Less experienced practitioners seem to underestimate the relevance of formal structures and power.
_ All over Europe, PR professionals are trusted advisers, with 75.5% reporting that their recommendations are taken seriously by senior management. This is a small 2.5% increase within the last 12 months. 72.1% claim executive influence for their function. They report it is likely for communication to be invited to senior-level meetings dealing with organisational strategic planning.
_ Regarding the development of the communication function in the next three years the focus is on training communication and business skills as well as networking and supporting high-profile individuals within the team.
_ When looking at enhancing professionalism the respondents are not willing to invest significantly. They view communication mainly as a personal skill and not so much asorganisational competence. Across the sectors and the regions very few are willing to support new knowledge development through academic research.
49
49
Leadership style

50
50
Leadership style: Communication managers utilise different approaches to achieve goals
www.communicationmonitor.eu / Zerfass et al. 2010 / n = 1,531 PR professionals in communication departments; Q 18: How would you describe the dominant strategy used by leaders in your communication department (or in your consultancy) to achieve common goals? Leadership styles derived from Werder & Holzhausen 2009. Significant differences among the four groups (p ≤0.05, chi-square test).
Joint stock companies
Private companies
Governmental organisations
20.3% 19.8% 29.5%
Non-profit organisations
25.2%
34.4% 38.1% 28.6% 27.9%
45.3% 42.1% 41.9% 46.9%
TransformationalLeaders define a vision and appeal to followers’ ideals and values
InclusiveLeaders name challenges and involve followers in shared decision making
TransactionalLeaders draw on their authority and remind followers of common standards
51
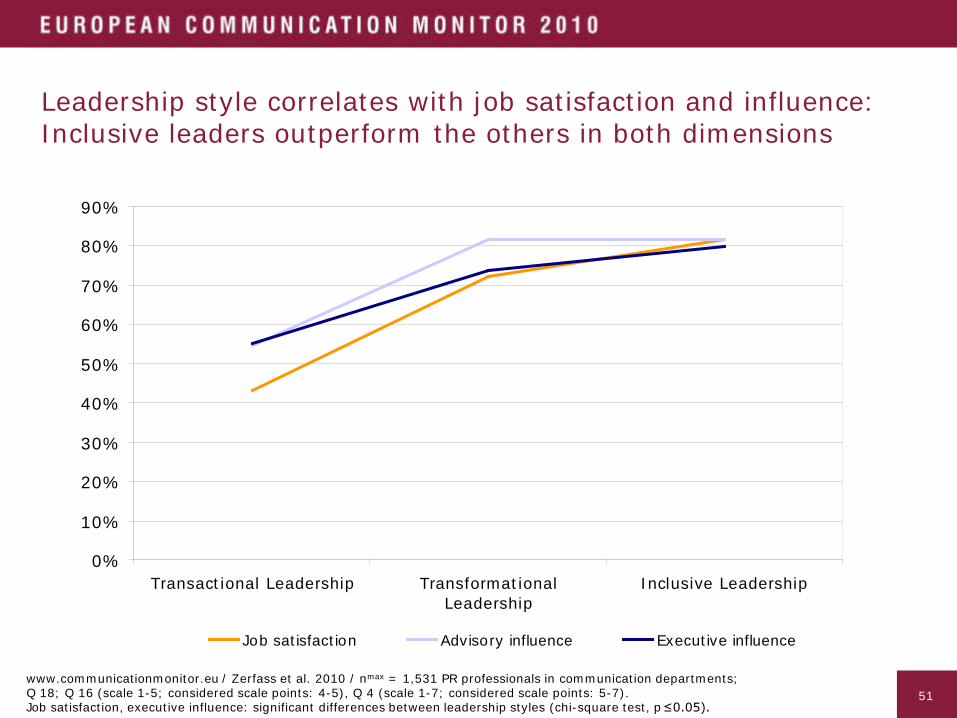
51
Leadership style correlates with job satisfaction and influence: Inclusive leaders outperform the others in both dimensions
0%
10%
20%
30%
40%
50%
60%
70%
80%
90%
Transactional Leadership TransformationalLeadership
Inclusive Leadership
Job satisfaction Advisory influence Executive influence
www.communicationmonitor.eu / Zerfass et al. 2010 / nmax = 1,531 PR professionals in communication departments;Q 18; Q 16 (scale 1-5; considered scale points: 4-5), Q 4 (scale 1-7; considered scale points: 5-7).Job satisfaction, executive influence: significant differences between leadership styles (chi-square test, p≤0.05).
52
52
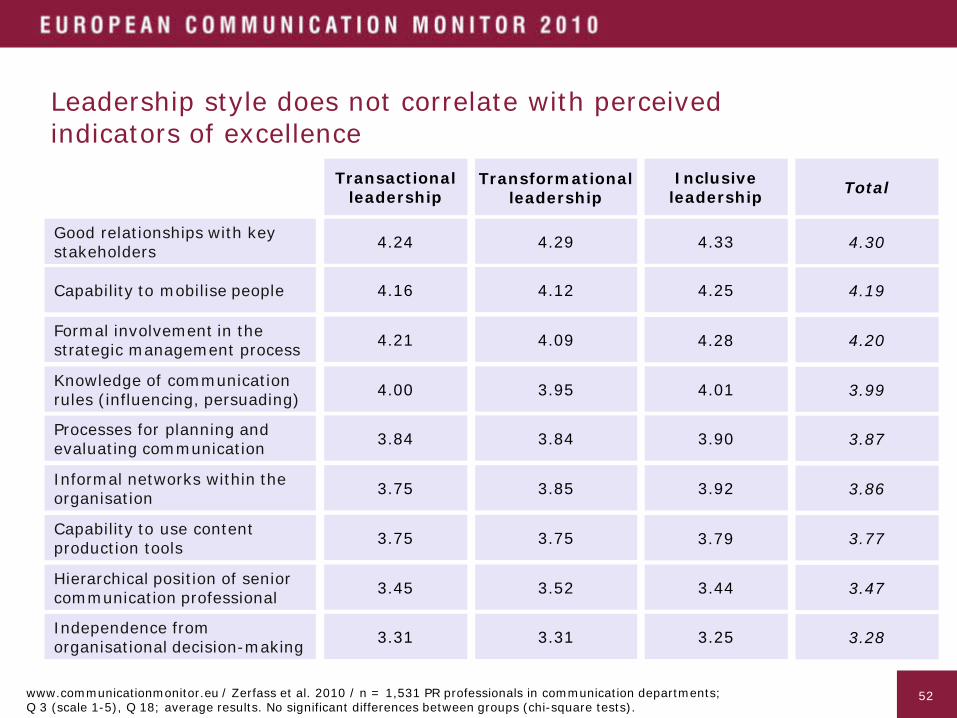
Leadership style does not correlate with perceivedindicators of excellence
Transactional leadership
4.24 4.29Good relationships with key stakeholders
Capability to mobilise people 4.16 4.12
4.21 4.09Formal involvement in the strategic management process
Knowledge of communication rules (influencing, persuading) 4.00 3.95
Inclusive leadership
4.33
4.25
4.28
4.01
Total
4.30
4.19
4.20
3.99
3.84 3.84Processes for planning and evaluating communication
Informal networks within the organisation 3.75 3.85
3.75 3.75Capability to use content production tools
Hierarchical position of senior communication professional 3.45 3.52
3.90
3.92
3.79
3.44
3.87
3.86
3.77
3.47
Independence from organisational decision-making 3.31 3.31 3.25 3.28
www.communicationmonitor.eu / Zerfass et al. 2010 / n = 1,531 PR professionals in communication departments;Q 3 (scale 1-5), Q 18; average results. No significant differences between groups (chi-square tests).
Transformationalleadership

53
53
Organisational culture and leadership style in communication departments are interdependent
www.communicationmonitor.eu / Zerfass et al. 2010 / n = 1,531 PR professionals in communication departments; Q 17; Q 18.All types of culture: significant differences between leadership styles (chi-square test, p≤0.05).
Transactional leadership
Transformational leadership
Inclusive leadership
Interactive culture(participative – reactive)
Entrepreneurial culture(non-participative – proactive)
Systematised culture(non-participative – reactive)
Integrated culture(participative – proactive)
31,7% 58,7% 64,3%
20,9% 19,9% 20,7%
7,7% 5,7% 4,9%
39,7% 15,7% 10,1%

54
54
Interpretation
Leadership style in communication management
_ The survey supports previous research (Werder & Holtzhausen 2009) that communication professionals enact different leadership styles. They may draw on their authority (transactional), appeal to ideals and visions (transformational) or name challenges and stimulate shared decision making (inclusive style).
_ Both organisational structures and cultures have a significant impact on the dominant leadership style. Inclusive leadership proliferates in an integrated culture. Governmental and political organisations present the least adequate framework to enable this leadership style.
_ Quite surprisingly, leadership style does not influence the way professionals define the excellence of communication departments. Those who rely on hierarchical structures to guide followers do not value the hierarchical position of the senior communication officer as significantly more important than their fellows.
_ Inclusive leadership is positively correlated with job satisfaction. Professionals who involve their followers in shared decision are more contented. Reciprocally, this satisfaction provides the framework for inclusive practices.
_ Inclusive leadership also correlates with executive power. This approach to leadership in public relations may be considered a guide to the profession.

55
55
Effects of the global downturn
56
56
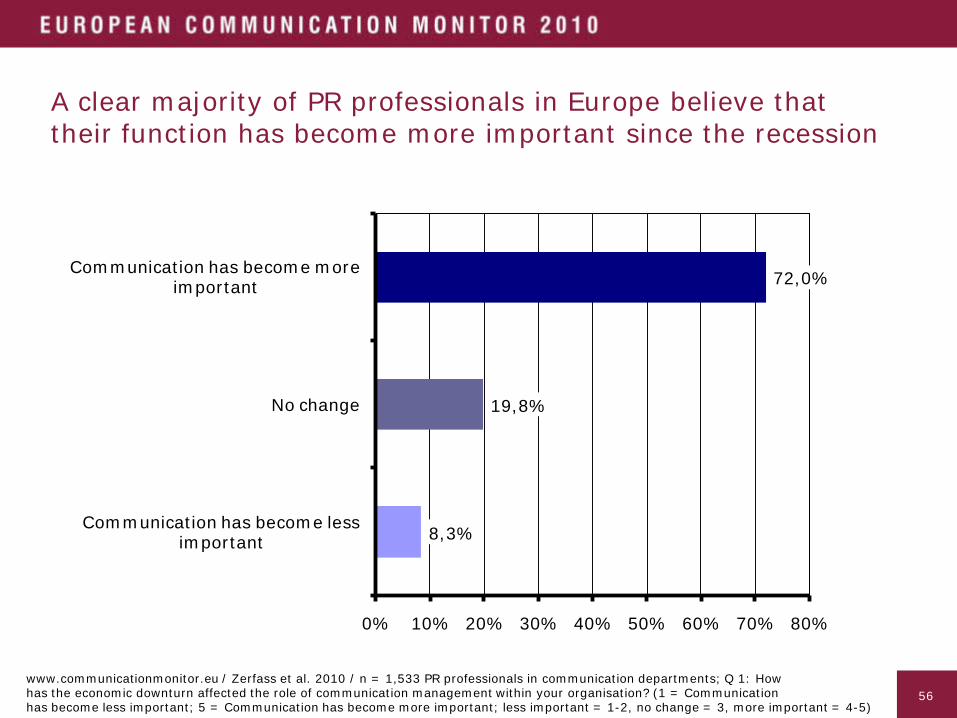
A clear majority of PR professionals in Europe believe that their function has become more important since the recession
www.communicationmonitor.eu / Zerfass et al. 2010 / n = 1,533 PR professionals in communication departments; Q 1: Howhas the economic downturn affected the role of communication management within your organisation? (1 = Communicationhas become less important; 5 = Communication has become more important; less important = 1-2, no change = 3, more important = 4-5)
8,3%
19,8%
72,0%
0% 10% 20% 30% 40% 50% 60% 70% 80%
Communication has become less important
No change
Communication has become more important

57
57
However, only 22% have been able to strengthen their resources, while 37% have lost resources compared to other functions
www.communicationmonitor.eu / Zerfass et al. 2010 / n = 1,533 PR professionals in communication departments;Q 1: How did communication budgets and resources develop, compared to the average change within the organisation?(1 = Better [lost less or gained more]; 5 = Worse [lost more or gained less]; better = 1-2, equal = 3, worse = 4-5).
22,0%
40,8%
37,2%
0% 10% 20% 30% 40% 50%
Better
Equal
Worse

58
58
Development of the communication function and budgetsin Europe
www.communicationmonitor.eu / Zerfass et al. 2010 / n = 1,533 PR professionals in communication departments;Q 1: How has the economic downturn affected the role of communication management within your organisation? (scale 1-5);How did communication budgets and resources develop, compared to the average change within the organisation? (scale 1-5).
0%
5%
10%
15%
20%
25%
30%
35%
1,1%1,8%
5,3%
2,9%8,7%
8,1%
18,0%
30,2%
23,7%
Communication has become more important
No change
Communication has become less important
59
59
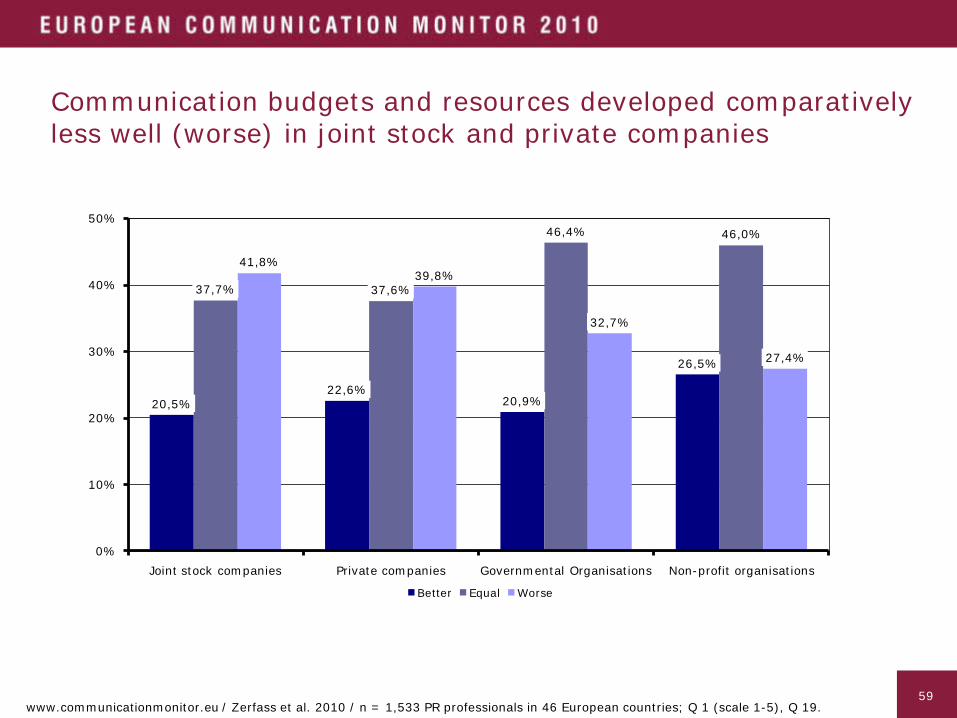
Communication budgets and resources developed comparatively less well (worse) in joint stock and private companies
20,5%22,6%
20,9%
26,5%
37,7% 37,6%
46,4% 46,0%
41,8%39,8%
32,7%
27,4%
0%
10%
20%
30%
40%
50%
Joint stock companies Private companies Governmental Organisations Non-profit organisations
Better Equal Worse
www.communicationmonitor.eu / Zerfass et al. 2010 / n = 1,533 PR professionals in 46 European countries; Q 1 (scale 1-5), Q 19.

60
60
Eastern European professionals report the strongestdecline in resources
22,1%24,1%
17,6% 16,7%
39,2%41,9%
36,3%32,1%
38,6%
34,0%
46,0%
51,1%
0%
10%
20%
30%
40%
50%
60%
Western Europe Northern Europe Southern Europe Eastern Europe
Better Equal Worse
www.communicationmonitor.eu / Zerfass et al. 2010 / n = 1,955 PR professionals in 46 European countries; Q 1 (scale 1-5), Q 19.

61
61
A clear focus on facilitating business processes correlates with a comparatively better development of communication budgets/resources
www.communicationmonitor.eu / Zerfass et al. 2010 / n = 1,533 PR professionals in communication departments; Q 1: How did communication budgets and resources develop, compared to the average change within your organisation? (scale 1-5; better = 1-2, equal = 3, worse = 4-5); Q 9: How do you and your department help to reach the overall goals of your organisation? A: We facilitate business processes (scale: rarely 1 - 5 very often; weak focus = 1-2, average = 3, strong = 4-5). Significant correlations proved with Spearman’s rank tests (ρ=-0,071, p≤0.05).
16,8% 16,2%
25,3%
41,1%43,9%
39,5%42,1%
39,9%
35,2%
0%
5%
10%
15%
20%
25%
30%
35%
40%
45%
50%
Weak focus on facilitating business processes when
helping to reach organisational goals
Average focus on facilitating business processes when
helping to reach organisational goals
Strong focus on facilitating business processes when
helping to reach organisational goals
Development of communication betterbudgets/resources compared to equalthe average within the organisation worse
62
62
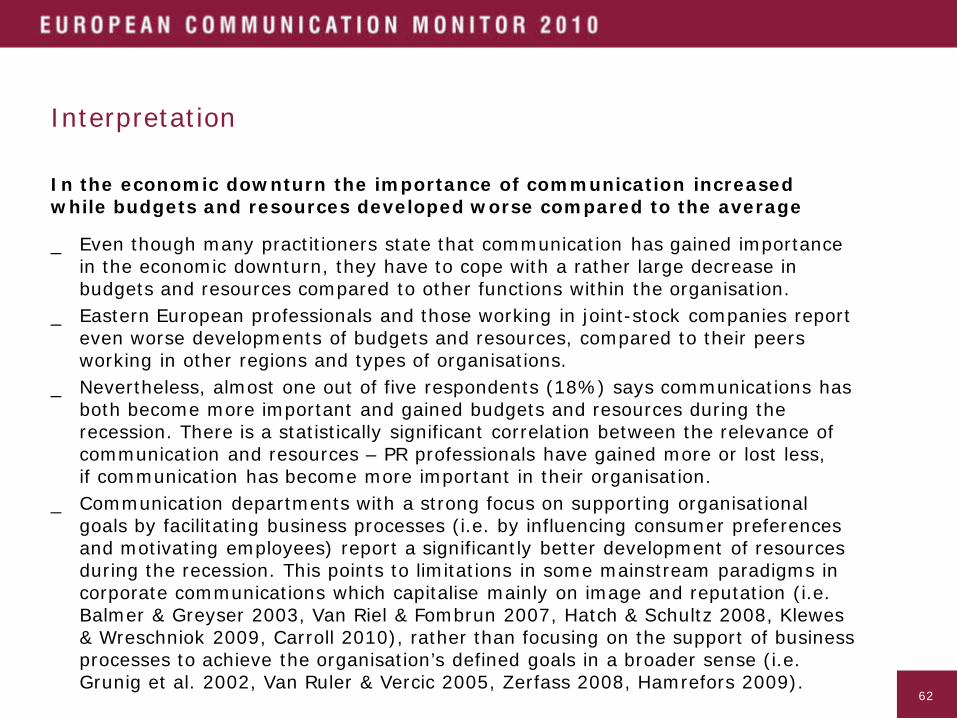
Interpretation
In the economic downturn the importance of communication increased while budgets and resources developed worse compared to the average
_ Even though many practitioners state that communication has gained importance in the economic downturn, they have to cope with a rather large decrease in budgets and resources compared to other functions within the organisation.
_ Eastern European professionals and those working in joint-stock companies report even worse developments of budgets and resources, compared to their peers working in other regions and types of organisations.
_ Nevertheless, almost one out of five respondents (18%) says communications has both become more important and gained budgets and resources during the recession. There is a statistically significant correlation between the relevance of communication and resources – PR professionals have gained more or lost less, if communication has become more important in their organisation.
_ Communication departments with a strong focus on supporting organisational goals by facilitating business processes (i.e. by influencing consumer preferences and motivating employees) report a significantly better development of resources during the recession. This points to limitations in some mainstream paradigms in corporate communications which capitalise mainly on image and reputation (i.e. Balmer & Greyser 2003, Van Riel & Fombrun 2007, Hatch & Schultz 2008, Klewes & Wreschniok 2009, Carroll 2010), rather than focusing on the support of business processes to achieve the organisation’s defined goals in a broader sense (i.e. Grunig et al. 2002, Van Ruler & Vercic 2005, Zerfass 2008, Hamrefors 2009).

63
63
Development of disciplines and communication channels

64
64
Most important disciplines in communication management
www.communicationmonitor.eu / Zerfass et al. 2010 / nmax = 1,926 PR professionals from 46 European countries;Q 5: How important are the following fields of practice in your organisation or consultancy? Will they gain more or lessimportance within the next three years? (1 = Not important; 5 = Very important; important discipline = scale points 4-5).Arrow symbols indicate changes within the ranking of most important disciplines; in general, all disciplines are expected to ascend.
Today In 2013
1 Corporate Communication
2Marketing/Brand and Consumer Communication
3 Crisis Communication
4 Internal Communication and Change Management
5 Public Affairs/Lobbying
1 Corporate Communication
2 Marketing/Brand and Consumer Communication
3 Internal Communication and Change Management
4 CSR and Sustainability
5InternationalCommunication

65
65
Expected development of disciplines and fields of practice
Important discipline 2013: compared to average increase
www.communicationmonitor.eu / Zerfass et al. 2010 / nmax = 1,926 PR professionals from 46 European countries;Q 5 (scale 1-5; important discipline = scale points 4-5). All disciplines are considered more important in 2013.Comparison shows difference to the average increase (22.9%).
-4.1
-5.6
-3.3
+7.3
-2.1
-3.5
+3.7
-9.8
+9.9
+9.6
0% 10% 20% 30% 40% 50% 60% 70% 80% 90%
Corporate Communication
Marketing/Brand andConsumer Communication
Crisis Communication
Internal Communicationand Change Management
Public Affairs, Lobbying
Issues Management
International Communication
Investor Relations,Financial Communication
Corporate Social Responsibilityand Sustainability
Personal Coaching, Training Communication Skills
in 2013 today

66
66
Corporate Communication and Internal Communication are steadily growing, while Marketing has lost ground
www.communicationmonitor.eu / Zerfass et al. 2010 / nmax = 1,926 PR professionals from 46 European countries; Q 5;Zerfass et al. 2009 / nmax = 1,863 PR professionals from 34 countries; Q 4; Zerfass et al. 2008 / n = 1,524 PR professionals from 37 countries; Q 2; Zerfass et al. 2007 / n = 1,087 from 22 countries; Q 3.
Importance of fields of practice in communication management
0%
10%
20%
30%
40%
50%
60%
70%
80%
90%
100%
2007 2008 2009 2010 2011 (prediction) 2012 (prediction) 2013 (prediction)
Corporate Communication Marketing/Brand and Consumer CommunicationCrisis Communication Corporate Social Responsibility and SustainabilityInternal Communication and Change Management
67
67
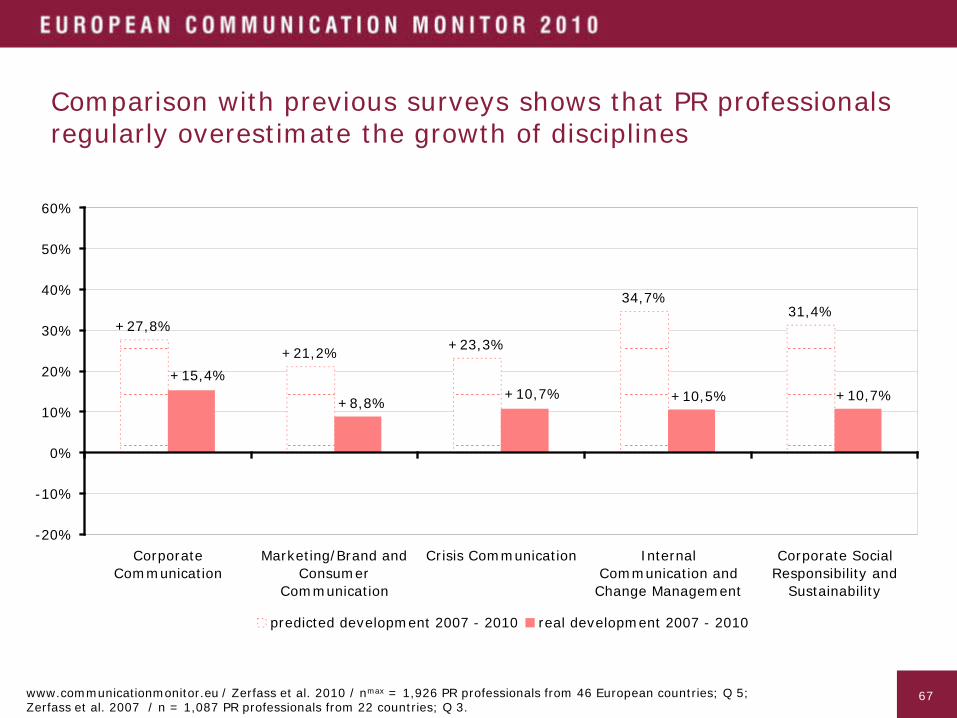
Comparison with previous surveys shows that PR professionals regularly overestimate the growth of disciplines
www.communicationmonitor.eu / Zerfass et al. 2010 / nmax = 1,926 PR professionals from 46 European countries; Q 5;Zerfass et al. 2007 / n = 1,087 PR professionals from 22 countries; Q 3.
34,7%31,4%
+27,8%
+21,2% +23,3%
+10,7%+15,4%
+8,8% +10,7% +10,5%
-20%
-10%
0%
10%
20%
30%
40%
50%
60%
CorporateCommunication
Marketing/Brand andConsumer
Communication
Crisis Communication InternalCommunication andChange Management
Corporate SocialResponsibility and
Sustainability
predicted development 2007 - 2010 real development 2007 - 2010

68
68
Important channels and instruments
Today In 2013
1 Press and media relations: print media
2 Online communication
3 Face-to-face communication
4 Press and media relations: online media
5 Press and media relations: TV/radio
1 Online communication
2 Press and media relations:online media
3 Social media
4 Face-to-face communication
5 Press and media relations:print media
↘
www.communicationmonitor.eu / Zerfass et al. 2010 / nmax = 1,914 PR professionals from 46 European countries; Q 6: How important are the following methods in addressing stakeholders, gatekeepers and audiences? Will this change within the next three years?(1 = Not important; 5 = Very important; important channel = 4-5). Arrow symbols indicate changes within the ranking of instruments.

69
69
Expected development of communication channels
www.communicationmonitor.eu / Zerfass et al. 2010 / nmax = 1,914 PR professionals from 46 European countries; Q 6: How important are the following methods in addressing stakeholders, gatekeepers and audiences? Will this change within the next three years? (1 = not important; 5 = very important; important instrument = scale points 4-5.) Comparison shows difference to the average increase (13.6%).
Important instrument2013: compared
to average increase
-27.1
-1.4
-8.4
-8.9
+37.0
-4.6
+13.3
+0.7
+19.1
-7.8
-11.9
0% 10% 20% 30% 40% 50% 60% 70% 80% 90% 100%
Press and media relations: print media
Online communication
Face-to-face communication
Press and media relations: online media
Press and media relations: TV/radio
Events
Corporate publishing/media
Social media
Non-verbal communication
Paid information
Sponsoring
in 2013 today

70
70
Respondents value instruments more than they did in last year‘s survey
www.communicationmonitor.eu / Zerfass et al. 2010 / nmax = 1,914 PR professionals from 46 European countries; Q 6;Zerfass et al. 2009 / nmax = 1,863 from 34 countries; Q 5 (scale 1-5; important instrument = scale points 4-5).

71
71
Media relations with print journalists were expected to decrease – in fact, they increased between 2007 and 2010
-9,5%
+10,3%
+34,6%
+41,4%
+5,2%
+14,2% +13,4% +15,2%
-20%
-10%
0%
10%
20%
30%
40%
50%
60%
Press and media relations: print media
Events Online communication Social media
predicted development 2007 - 2010
www.communicationmonitor.eu / Zerfass et al. 2010 / nmax = 1,914 PR professionals from 46 European countries; Q 6;Zerfass et al. 2007 / n = 1,087 from 23 countries; Q 3 (scale 1-5).
72
72
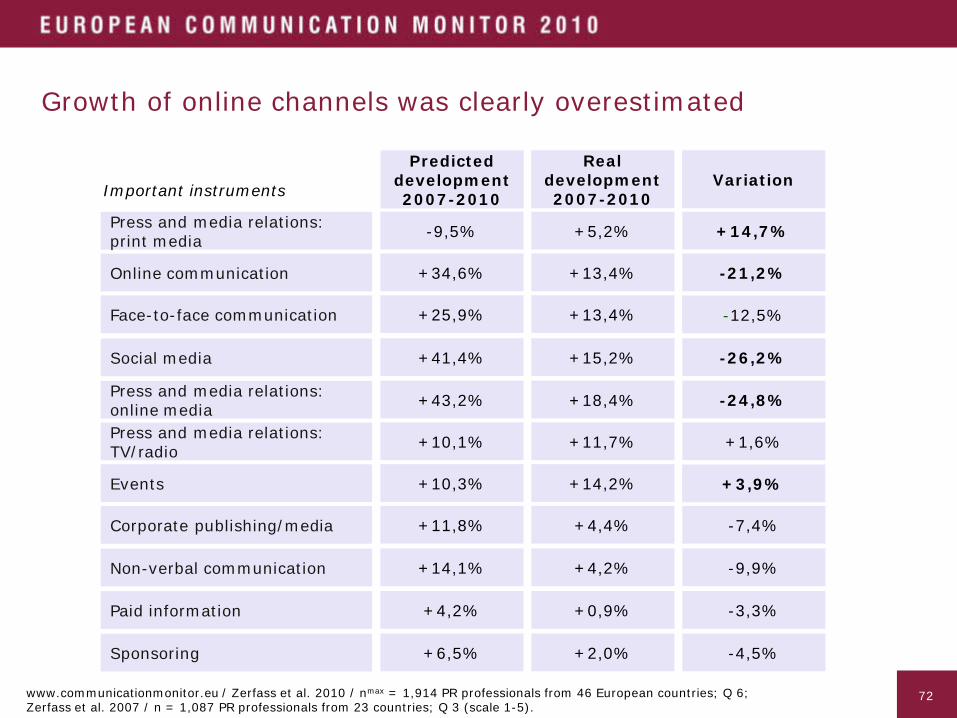
Growth of online channels was clearly overestimated
www.communicationmonitor.eu / Zerfass et al. 2010 / nmax = 1,914 PR professionals from 46 European countries; Q 6;Zerfass et al. 2007 / n = 1,087 PR professionals from 23 countries; Q 3 (scale 1-5).
Predicted development 2007-2010
Real development 2007-2010
-9,5% +5,2%Press and media relations: print media
Online communication +34,6% +13,4%
+25,9% +13,4%Face-to-face communication
Social media +41,4% +15,2%
Variation
+14,7%
-21,2%
-12,5%
-26,2%
+43,2% +18,4%Press and media relations: online mediaPress and media relations: TV/radio +10,1% +11,7%
+10,3% +14,2%Events
Corporate publishing/media +11,8% +4,4%
-24,8%
+1,6%
+3,9%
-7,4%
Non-verbal communication +14,1% +4,2% -9,9%
Paid information +4,2% +0,9% -3,3%
Sponsoring +6,5% +2,0% -4,5%
Important instruments
73
73
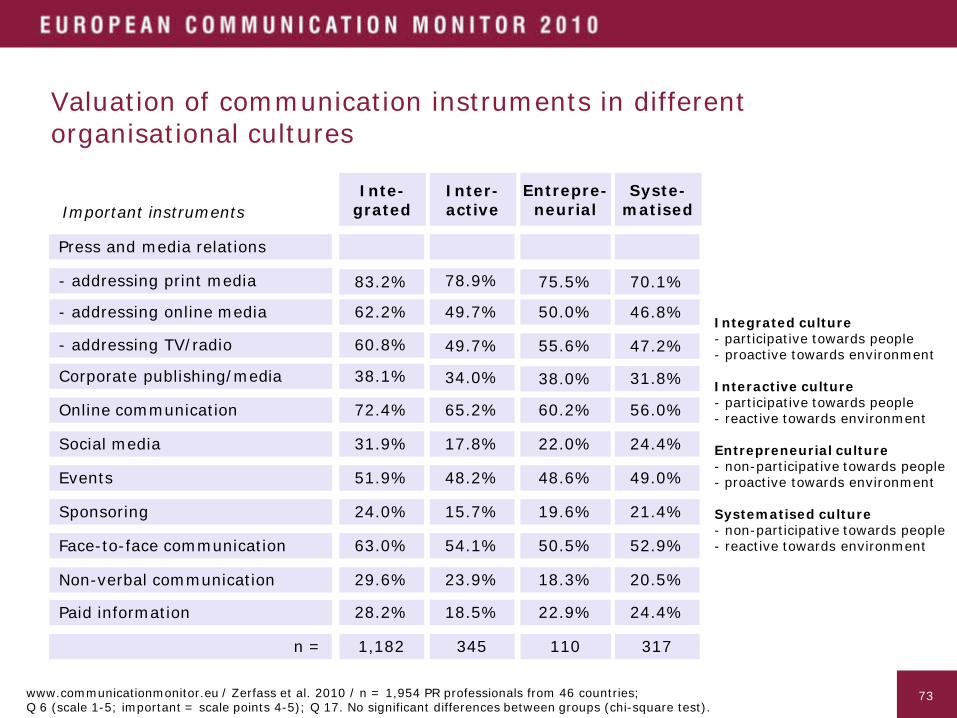
Valuation of communication instruments in different organisational cultures
31.9% 22.0%
48.6%
19.6%
50.5%
51.9%
24.0%
63.0%
29.6%
17.8%
15.7%
23.9%
48.2%
54.1%
18.3%
52.9%
21.4%
49.0%
24.4%
20.5%
Inte-grated
Social media
Sponsoring
Events
Face-to-face communication
Non-verbal communication
- addressing print media
- addressing TV/radio
- addressing online media
Corporate publishing/media
Online communication
Paid information 22.9%28.2% 18.5% 24.4%
75.5%
50.0%
55.6%
83.2%
62.2%
60.8%
38.1%
49.7%
34.0%
78.9%
49.7%
38.0%
47.2%
46.8%
70.1%
31.8%
60.2%72.4% 65.2% 56.0%
Integrated culture- participative towards people- proactive towards environment
Interactive culture- participative towards people- reactive towards environment
Entrepreneurial culture- non-participative towards people- proactive towards environment
Systematised culture- non-participative towards people- reactive towards environment
Press and media relations
Inter-active
Entrepre-neurial
Syste-matised
1101,182 345 317n =
www.communicationmonitor.eu / Zerfass et al. 2010 / n = 1,954 PR professionals from 46 countries;Q 6 (scale 1-5; important = scale points 4-5); Q 17. No significant differences between groups (chi-square test).
Important instruments
74
74
Interpretation
Internal communication and CSR are growing, more disciplines are following
_ The survey predicts a changing relevance of the various disciplines within thebroad range of strategic communication. Corporate communication is mostimportant, followed by long-time forerunner marketing/brand communication. While internal communication and corporate social responsibility communicationare continuing their upswing, predictions for personal coaching and international communication are above the average for the first time since 2007.
_ Regarding communication instruments, online communications, mediarelations on the web and social media have risen since 2009 and areexpected to grow further.
_ For the first time, it was possible to compare predictions for the future fromprevious surveys (Zerfass et al. 2007) with actual insights from the same focalyear 2010. Obviously, PR professionals regularly overestimate the growth ofdisciplines and communication channels. For example, CSR did only grow by 11% in three years instead of 31% as predicted in 2007. Press relations targeting printmedia was expected to decline by 9.5% from 2007-2010; in fact it increased by5.2%. Also, social media was thought to rise by 41.4%, but it was only 15.2%.

75
75
Online communication and social media

76
76
Online communication and social media made a great leap forward during the last 12 months
11,5%
38,4%
54,4%
12,4%
44,0%
58,1%
19,5%
43,8%
26,7%
56,8%
67,8%58,6%
0% 10% 20% 30% 40% 50% 60% 70% 80%
Social media (blogs,podcasts, communities)
Press and mediarelations: online media
Online communication(websites, e-mail,
intranet)
www.communicationmonitor.eu / Zerfass et al. 2010 / nmax = 1,914 PR professionals from 46 European countries; Q 6; Zerfass et al. 2009 / nmax = 1,863; Q 5; Zerfass et al. 2008 / n = 1,524; Q 3; Zerfass et al. 2007/n = 1,087; Q 4: How important are the following methods in addressing stakeholders, gatekeepers and audiences? (1 = Not important; 5 = Very important; important = scale points 4-5).
Important instruments for addressing stakeholders, gatekeepers and audiences
2010
2009
2008
2007

77
77
Social media channels: Online communities are now clearly ahead;also web videos and Twitter have prospered between 2009 and 2010
7.7%
12.2%
14.0%
14.0%
20.0%
24.8%
28.9%
32.8%
9,5%
17,2%
26,3%
16,8%
24,2%
30,9%
38,4%
44,6%
0% 10% 20% 30% 40% 50%
Virtual worlds
Wikis
Microblogs (Twitter)
Podcasts (Audio)
RSS feeds
Weblogs
Online videos
Online Communities (Social Networks)
www.communicationmonitor.eu / Zerfass et al. 2010 / n = 1,955 PR professionals from 46 European countries; Q 13;Zerfass et al. 2009 / nmax = 1,863; Q 10: Can you indicate the level of importance for public relations today and in thenext year of the following communication tools (1= Not important; 5 = Very important; important = scale points 4-5).
Interactive channels important for public relations
2010
2009

78
78
PR professionals expect a heavy growth in importance of social media until 2011, with online videos leading the field
www.communicationmonitor.eu / Zerfass et al. 2010 / n = 1,955 PR professionals from 46 European countries; Q 13 (scale 1-5;important = scale points 4-5). All are considered more important in 2011; comparison shows difference to average increase (26.18%).
+7.3
+10.8
-10.9
-3.2
-2.0
-2.0
+1.0
Interactive channels relevant for public relations Increase compared to average
-0.9
78,1%
75,3%
58,1%
51,6%
48,4%
40,2%
41,0%
24,8%
44,6%
38,4%
30,9%
26,3%
17,2%
16,8%
9,5%
24,2%
0% 10% 20% 30% 40% 50% 60% 70% 80% 90%
Online Communities(social networks)
Online videos
Weblogs
Microblogs (Twitter)
RSS feeds
Wikis
Podcasts (audio)
Virtual worlds
in 2011 today

79
79
However, most PR departments and agencies have still not implemented the basic prerequisites for social media usage
www.communicationmonitor.eu / Zerfass et al. 2010 / n = 1,955 PR professionals from 46 European countries; Q 14: Has yourorganisation or agency already implemented one of the following? (1 = Already implemented; 2 = Planned for 2010; 3 = Not planned yet).
31,3%
26,3%
29,5%
27,5%
27,2%
39,4%
45,7%
43,7%
52,0%
54,8%18,0%
26,8%
20,5%
27,9%
29,3%
0% 10% 20% 30% 40% 50% 60% 70% 80% 90% 100%
Social media guidelines for communicating in blogs, twitter etc.
Tools for monitoring stakeholder communication on the social web
Description of social media services offered by the department/agency
Training programmes for social media
Key performance indicators for measuring social web activities
Already implemented Planned for 2010 Not planned yet

80
80
Joint stock companies are at the cutting-edge when it comes to implementing specific concepts for social media
32.1% 25.7%Social media guidelines for communicating in blogs, twitter etc.
Tools for monitoring stakeholder communication on the social web
28.7% 23.3%
26.2% 17.4%Key performance indicators for measuring social web activities
Training programmes for social media 16.0% 15.0%
15.5%
18.5%
15.8%
11.8%
24.3%
21.2%
23.9%
18.6%
Joint stock Private Governmental Non-profit
Description of social media services offered by the department or agency
16.0% 16.7% 11.2% 15.9%
www.communicationmonitor.eu / Zerfass et al. 2010 / n = 1,955 PR professionals from 46 European countries; Q 14, Q 19.All concepts: significant differences between the groups (chi-square test, p≤0.05).
Already implemented:

81
81
Patterns of the evolving social media framework in PRin different European regions
27.3% 32.1%Social media guidelines for communicating in blogs, twitter etc.
Tools for monitoring stakeholder communication on the social web
25.5% 32.9%
24.9% 28.1%Key performance indicators for measuring social web activities
Training programmes for social media 19.9% 20.4%
29.8%
26.4%
30.4%
22.7%
27.1%
26.2%
21.3%
17.6%
Northern Europe
Western Europe
Southern Europe
Eastern Europe
Description of social media services offered by the department or agency
13.7% 20.1% 22.7% 15.4%
Already implemented:
www.communicationmonitor.eu / Zerfass et al. 2010 / n = 1,955 PR professionals from 46 European countries; Q 14, Q 19.Guidelines, monitoring, key performance indicators, services: significant differences between the groups (chi-square test, p≤0.05).

82
82
Consultants and agencies have a stronger belief insocial networks and Twitter than communication departments
www.communicationmonitor.eu / Zerfass et al. 2010 / n = 1,955 PR professionals from 46 European countries;Q 13 (scale 1-5; important channels= scale points 4-5); Q 19.
40,9% 42,6%
35,5%
47,8%
56,9%
24,6% 24,8%21,5%
24,8%
34,6%
0%
10%
20%
30%
40%
50%
60%
Joint stock companies Private companies Governmentalorganisations
Non-profit organisations PR agencies /consultants
Online Communities (social networks) Microblogs (Twitter)
Interactive channels relevant for public relations
83
83
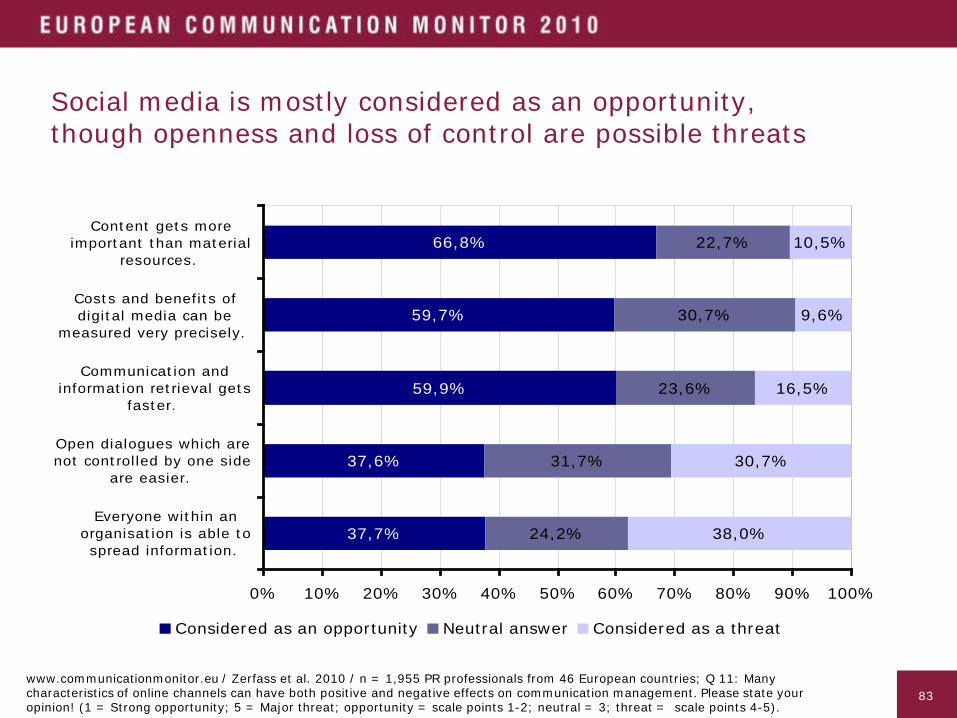
Social media is mostly considered as an opportunity,though openness and loss of control are possible threats
www.communicationmonitor.eu / Zerfass et al. 2010 / n = 1,955 PR professionals from 46 European countries; Q 11: Manycharacteristics of online channels can have both positive and negative effects on communication management. Please state youropinion! (1 = Strong opportunity; 5 = Major threat; opportunity = scale points 1-2; neutral = 3; threat = scale points 4-5).
66,8%
59,7%
59,9%
37,6%
37,7%
22,7%
30,7%
23,6%
31,7%
24,2%
10,5%
9,6%
16,5%
30,7%
38,0%
0% 10% 20% 30% 40% 50% 60% 70% 80% 90% 100%
Content gets moreimportant than material
resources.
Costs and benefits ofdigital media can be
measured very precisely.
Communication andinformation retrieval gets
faster.
Open dialogues which arenot controlled by one side
are easier.
Everyone within anorganisation is able tospread information.
Considered as an opportunity Neutral answer Considered as a threat
84
84
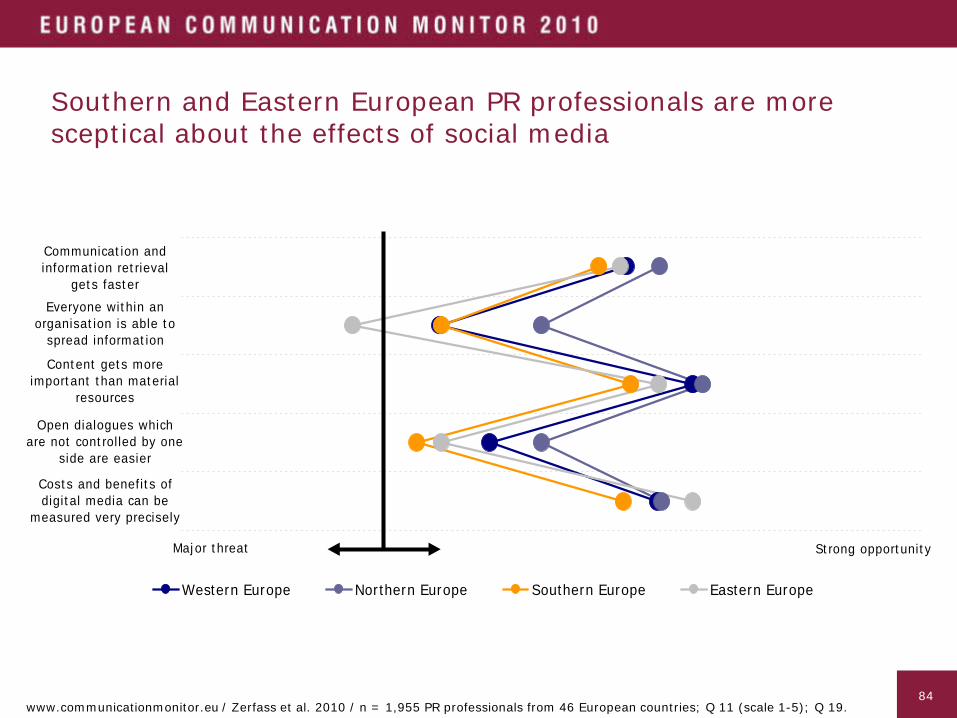
Southern and Eastern European PR professionals are more sceptical about the effects of social media
0
1
2
3
4
5
1,253,25
Western Europe Northern Europe Southern Europe Eastern Europe
Open dialogues which are not controlled by one
side are easier
Major threat
Communication and information retrieval
gets fasterEveryone within an
organisation is able to spread information
Content gets more important than material
resources
Costs and benefits of digital media can be
measured very precisely
Strong opportunity
www.communicationmonitor.eu / Zerfass et al. 2010 / n = 1,955 PR professionals from 46 European countries; Q 11 (scale 1-5); Q 19.
85
85
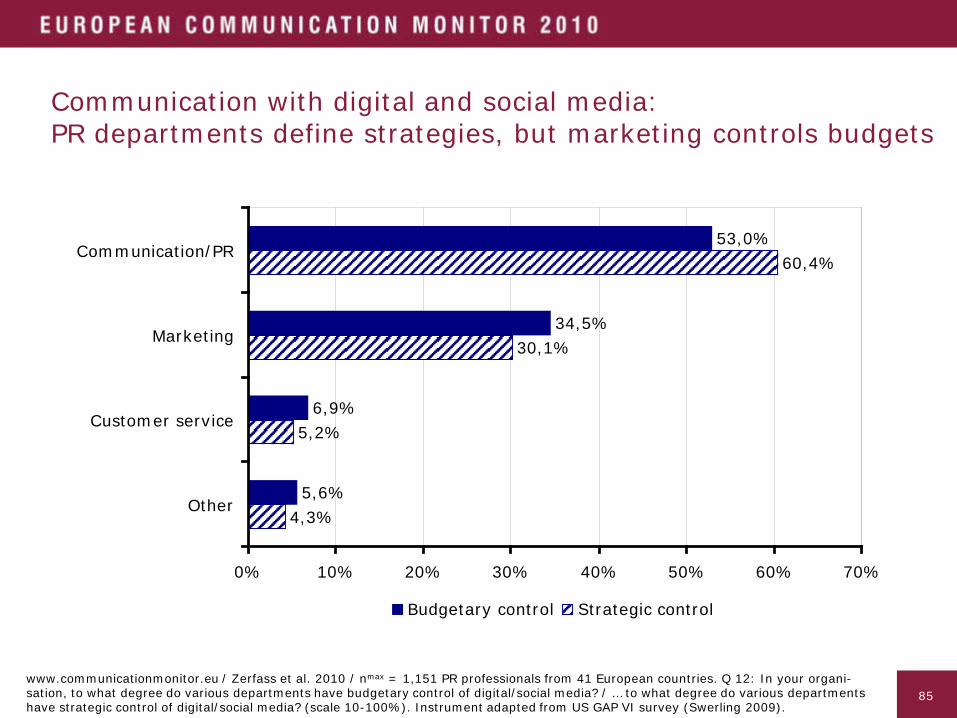
Communication with digital and social media:PR departments define strategies, but marketing controls budgets
www.communicationmonitor.eu / Zerfass et al. 2010 / nmax = 1,151 PR professionals from 41 European countries. Q 12: In your organi-sation, to what degree do various departments have budgetary control of digital/social media? / … to what degree do various departments have strategic control of digital/social media? (scale 10-100%). Instrument adapted from US GAP VI survey (Swerling 2009).
53,0%
34,5%
6,9%
5,6%
60,4%
30,1%
5,2%
4,3%
0% 10% 20% 30% 40% 50% 60% 70%
Communication/PR
Marketing
Customer service
Other
Budgetary control Strategic control

86
86
Responsibility for digital and social media in different typesof organisations
www.communicationmonitor.eu / Zerfass et al. 2010 / nmax = 1,151 PR professionals from 41 European countries;Q 12 (scale 10-100%); Q 19.
48,7%
48,8%
67,7%
63,5%
40,4%
40,7%
16,9%
21,3%
57,2%
58,0%
73,3%
70,8%
35,1%
34,4%
14,8%
18,1%
0% 10% 20% 30% 40% 50% 60% 70% 80%
Joint stockcompanies
Private companies
GovernmentalOrganisations
Non-profitorganisations
Communication / PR controls social media budgetMarketing controls social media budgetCommunication / PR defines social media strategiesMarketing defines social media strategies

87
87
Responsibility for digital and social media in European regions
55,6%
55,8%
45,9%
47,4%
31,2%
31,8%
42,2%
41,3%
61,3%
63,1%
55,0%
57,5%
28,1%
27,9%
36,2%
34,3%
0% 10% 20% 30% 40% 50% 60% 70%
Western Europe
Northern Europe
Southern Europe
Eastern Europe
Communication / PR controls social media budgetMarketing controls social media budgetCommunication / PR defines social media strategiesMarketing defines social media strategies
www.communicationmonitor.eu / Zerfass et al. 2010 / nmax = 1,151 PR professionals from 41 European countries; Q 12 (scale 10-100%), Q 19.

88
88
Interpretation
Breakthrough of online channels, but many questions linked to social media
_ The continuing growth of online communications and social media has been accelerated during the last months. Today, 68% of respondents believe websites,e-mail and intranets are important instruments for addressing stakeholders, gatekeepers and audiences; compared to 59% in 2009. Support for online media relations and social media has grown even stronger. One out of four professionals thinks social media are important for the profession today.
_ Online communities (social networks) are the most important social media platform; Twitter is considered important by 26% of the respondents.
_ In spite of the enthusiasm, less then one third of organisations have already implemented necessary prerequisites for social media communication like social media guidelines, monitoring routines or even key performance indicators to define and evaluate measures of success.
_ While most features of social media are considered as an opportunity, many PR professionals (especially Eastern Europeans) rate open dialogue without control and the ease of spreading information as threats.
_ A majority of communication professionals claim they have strategic control of digital and social media. But resources are often assigned to the marketing function; less than half of the respondents working in joint-stock or private companies has budgetary control.

89
89
Communication strategy and planning

90
90
Challenges for communication management in Europe
www.communicationmonitor.eu / Zerfass et al. 2010 / n = 1,955 PR professionals from 46 European countries;Q 7: Here are some issues that might become relevant for public relations and communication management withinthe next three years. Please pick those three which are most important from your point of view.
Most important issues within the next three years
1 Coping with the digital evolution and the social web
2 Linking business strategy and communication
3 Dealing with sustainable development and social responsibility
4 Dealing with the demand of new transparency andactive audiences
5 Building and maintaining trust
53.7%
43.6%
36.7%
33.1%
32.8%

91
91
53,7%
43,6%
36,7%
33,1%
32,8%
21,4%
17,2%
16,8%
15,4%
12,0%
11,3%
6,1%
0% 10% 20% 30% 40% 50% 60%
Coping with the digital evolution and the social web
Linking business strategy and communication
Dealing with sustainable development and social responsibility
Dealing with the demand for more transparency and active audiences
Building and maintaining trust
Supporting organisational change
Establishing new methods to evaluate communication
Advancing public affairs and political communication
Globalisation of communication strategies
Advancing issues management and corporate foresight
Developing CEO positioning and communication
Supporting intercultural integration
www.communicationmonitor.eu / Zerfass et al. 2010 / n = 1,955 PR professionals from 46 European countries; Q 7.
The most important issues until 2013 in detail
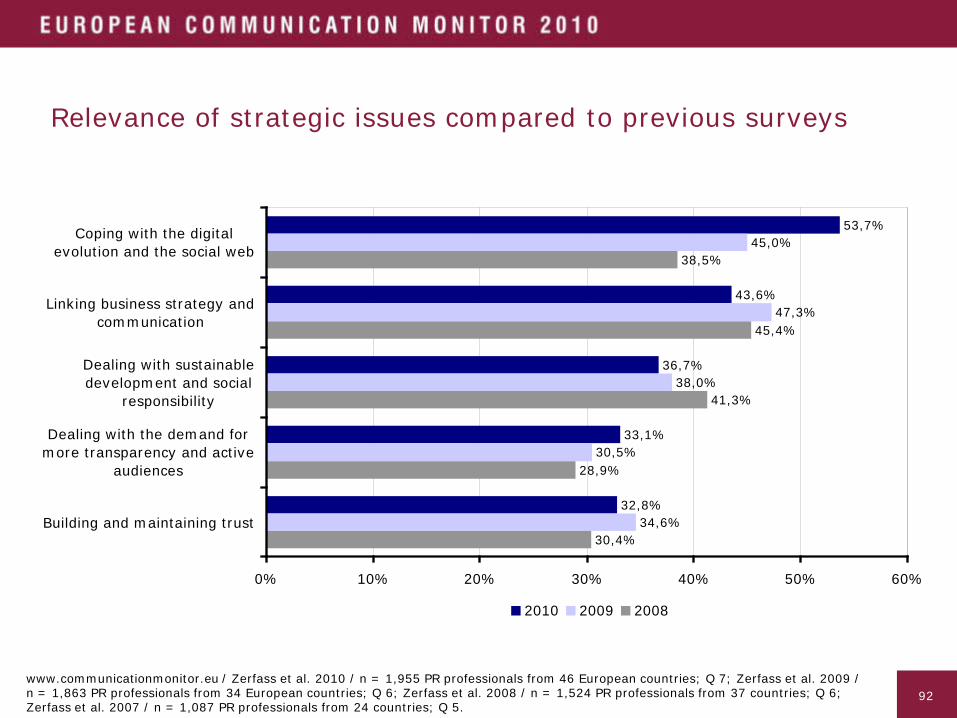
92
92
Relevance of strategic issues compared to previous surveys
www.communicationmonitor.eu / Zerfass et al. 2010 / n = 1,955 PR professionals from 46 European countries; Q 7; Zerfass et al. 2009 /n = 1,863 PR professionals from 34 European countries; Q 6; Zerfass et al. 2008 / n = 1,524 PR professionals from 37 countries; Q 6; Zerfass et al. 2007 / n = 1,087 PR professionals from 24 countries; Q 5.
53,7%
43,6%
36,7%
33,1%
32,8%
45,0%
47,3%
38,0%
30,5%
34,6%
38,5%
45,4%
41,3%
28,9%
30,4%
0% 10% 20% 30% 40% 50% 60%
Coping with the digitalevolution and the social web
Linking business strategy andcommunication
Dealing with sustainabledevelopment and social
responsibility
Dealing with the demand formore transparency and active
audiences
Building and maintaining trust
2010 2009 2008

93
93
Planning procedures: Many PR professionals plan on the instrumental level, neglecting advanced methods and monitoring
72,6%
63,2%
62,4%
57,7%
35,7%
0% 10% 20% 30% 40% 50% 60% 70% 80%
Strategies and plans for singleinstruments
Overall communicationstrategy
Strategies for majordisciplines/stakeholders
Strategies and plans for specificchallenges
Monitoring strategies
www.communicationmonitor.eu / Zerfass et al. 2010 / n = 1,955 PR professionals from 46 European countries; Q 2: Are the following planning procedures used in your organisation? (1 = Not at all; 5 = Significantly; considered scale points: 4-5).
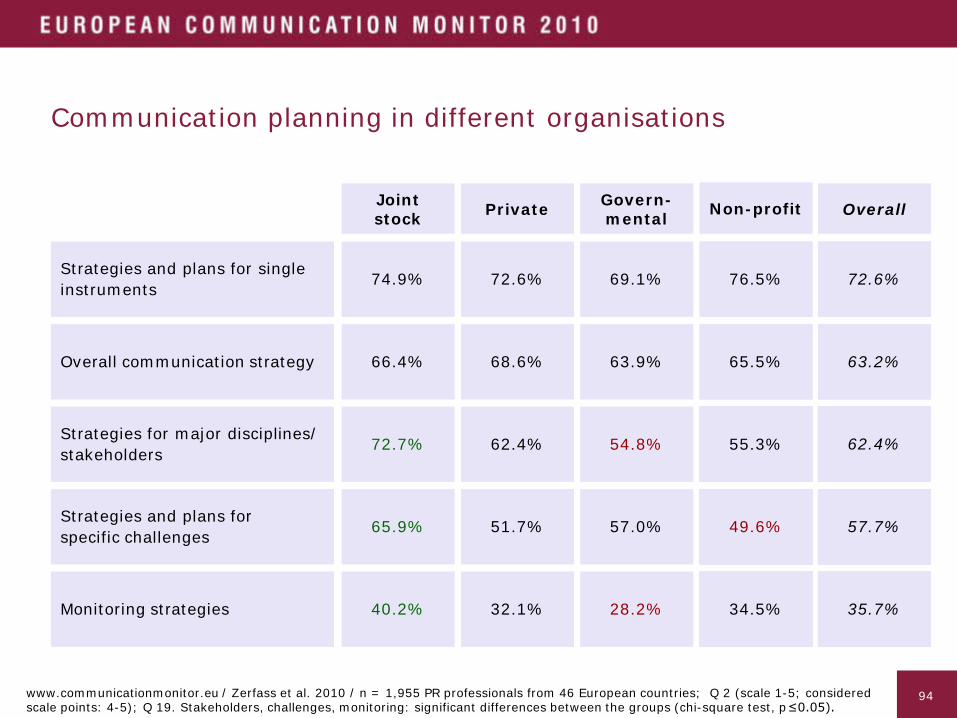
94
94
Communication planning in different organisations
Jointstock
Strategies and plans forspecific challenges
Strategies for major disciplines/stakeholders
Monitoring strategies
%
%
%
Private Govern-mental Non-profit
72.7%
65.9%
40.2%
51.7%
62.4%
32.1%
54.8%
57.0%
28.2%
%
%
%
%
%
%
%
%
%
%
%
%
%
%
%
34.5%
49.6%
55.3%
Overall
29.8%
83.0%
62.0%
29.8%
83.0%
29.8%
62.0%
83.0%
29.8%
62.0%
83.0%
29.8%
62.0%
83.0%
29.8%
62.0%
83.0%
29.8%
35.7%
57.7%
62.4%
Strategies and plans for single instruments 74.9% 72.6% %69.1% 76.5% 35.1%72.6%
Overall communication strategy 66.4% 68.6% %63.9% 65.5% 35.1%63.2%
www.communicationmonitor.eu / Zerfass et al. 2010 / n = 1,955 PR professionals from 46 European countries; Q 2 (scale 1-5; considered scale points: 4-5); Q 19. Stakeholders, challenges, monitoring: significant differences between the groups (chi-square test, p≤0.05).
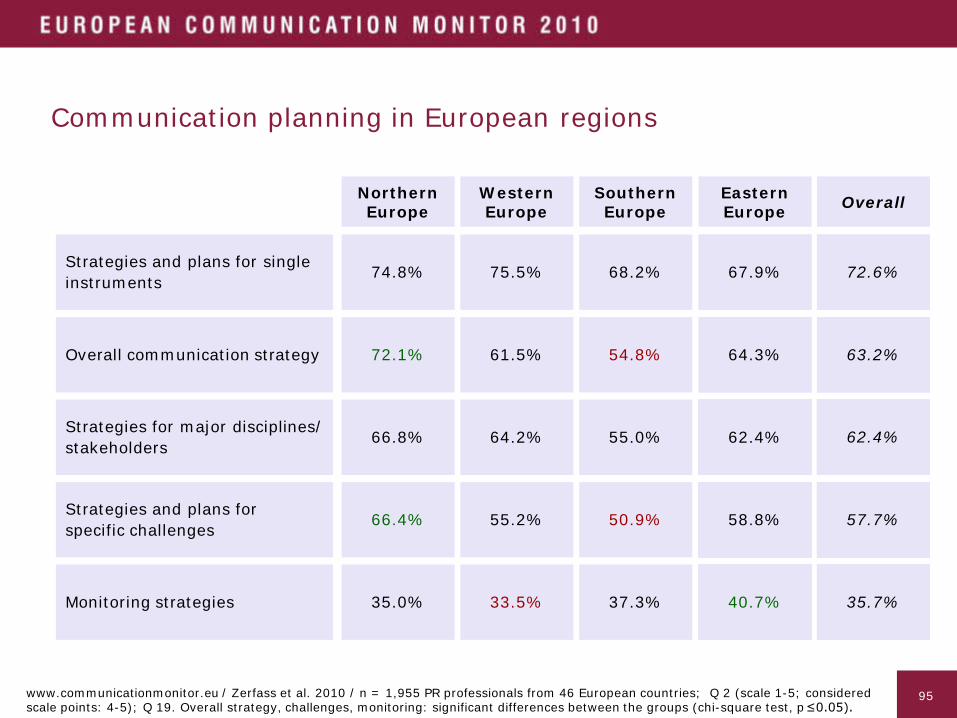
95
95
Communication planning in European regions
WesternEurope
Strategies and plans forspecific challenges
Strategies for major disciplines/stakeholders
Monitoring strategies
%
%
%
NorthernEurope
SouthernEurope
EasternEurope
64.2%
55.2%
33.5%
66.4%
66.8%
35.0%
55.0%
50.9%
37.3%
%
%
%
%
%
%
%
%
%
%
%
%
%
%
%
40.7%
58.8%
62.4%
Overall
29.8%
83.0%
62.0%
29.8%
83.0%
29.8%
62.0%
83.0%
29.8%
62.0%
83.0%
29.8%
62.0%
83.0%
29.8%
62.0%
83.0%
29.8%
35.7%
57.7%
62.4%
Strategies and plans for single instruments 75.5%74.8% %68.2% 67.9% 35.1%72.6%
Overall communication strategy 61.5%72.1% %54.8% 64.3% 35.1%63.2%
www.communicationmonitor.eu / Zerfass et al. 2010 / n = 1,955 PR professionals from 46 European countries; Q 2 (scale 1-5; considered scale points: 4-5); Q 19. Overall strategy, challenges, monitoring: significant differences between the groups (chi-square test, p≤0.05).
96
96
Interpretation
Priorities for communication management in Europe
_ The survey identifies two main issues of major importance for communicationprofessionals throughout Europe. Half of the respondents state either that copingwith the digital evolution and the social web and/or linking business strategy andcommunication are most relevant for themselves within the near future. The digital topic has overtaken the business link issue which had been the numberone issue for the past three years.
_ Social responsibility and sustainable development as well as building andmaintaining trust are still important, but both have slightly lost significance, whereas dealing with the demand of new transparency and active audienceshas gained since 2009.
_ Many PR professionals plan on the instrumental level, mostly for single instruments, overall communication strategies and for major disciplines and stakeholders. Monitoring is not done continuously. In line with the mainstream focus of communication management on speaking instead of listening, only one third of respondents has developed monitoring strategies.

97
97
Evaluation and communication performance

98
98
How PR professionals in Europe measure their activities
www.communicationmonitor.eu / Zerfass et al. 2010 / n = 1,955 PR professionals from 46 European countries;Q 10: Which items do you monitor or measure to assess the effectiveness of public relations / communication management? (1 = Do not use at all; 5 = Use continuously; methods used = scale points 4-5).
82,3%
69,7%
57,2%54,3%
47,7%41,8%
28,0% 26,3% 25,7% 24,3%
0%
10%
20%
30%
40%
50%
60%
70%
80%
90%
Clippings and media response
Internet/Intranet usage
Satisfaction of (internal) clients
Understanding of key messages
Financial costs for projects
Stakeholder attitudes and behaviour change
Personnel costs for projects
Process quality (internal workflow)
Impact on financial/strategic targets
Impact on intangible/tangible resources
Input Output Outcome Outflow
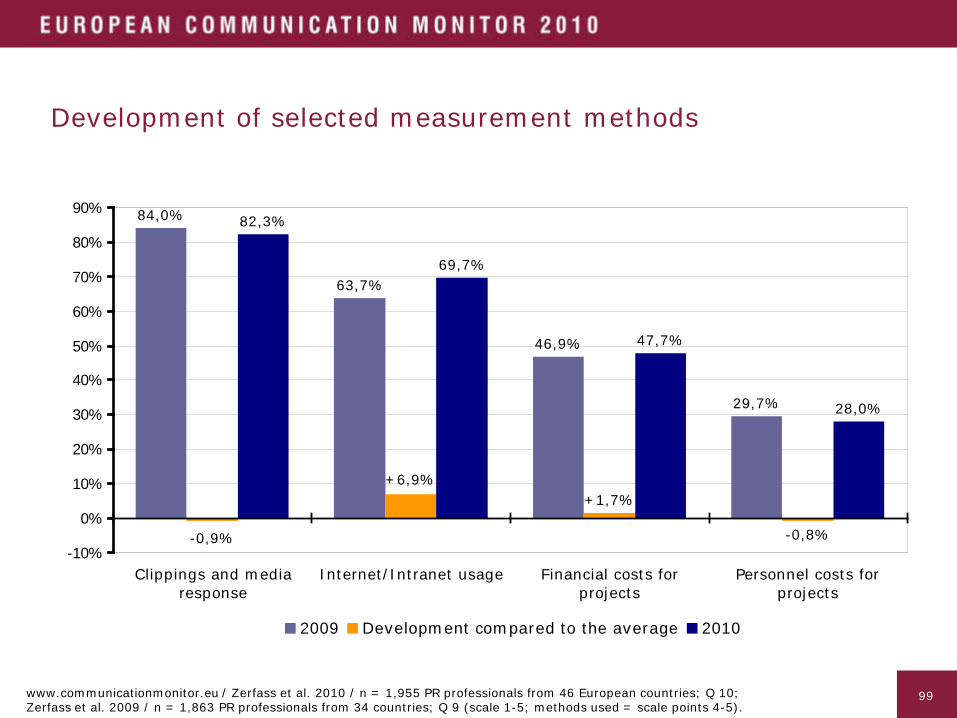
99
99
Development of selected measurement methods
84,0%
63,7%
46,9%
29,7%
-0,8%
82,3%
69,7%
47,7%
28,0%
-0,9%
+1,7%+6,9%
-10%
0%
10%
20%
30%
40%
50%
60%
70%
80%
90%
Clippings and mediaresponse
Internet/Intranet usage Financial costs forprojects
Personnel costs forprojects
2009 Development compared to the average 2010
www.communicationmonitor.eu / Zerfass et al. 2010 / n = 1,955 PR professionals from 46 European countries; Q 10;Zerfass et al. 2009 / n = 1,863 PR professionals from 34 countries; Q 9 (scale 1-5; methods used = scale points 4-5).

100
100
Results ofCommunication Processes
Output
Outcome
Internal Output
Process EfficiencyQuality
External Output
CoverageContent
Direct Outcome
PerceptionUtilizationKnowledge
Indirect Outcome
OpinionAttitudesEmotion
Behavioral DispositionBehavior
Resources
Personnel CostsOutsourcing Costs
Input
Value Creation
Impact onStrategic and/or Financial Targets
(Value Chain)
Impact onTangible and/or
Intangible Ressources
(Capital Accumulation)
Outflow
ORGANISATION
Communication ProcessesInitiation of Communication Processes
MEDIA/CHANNELS STAKEHOLDERS ORGANISATION
37.9% 41.8% 76.0% 54.3% 41.8% 25.0%
58.9%
48.1%
When measuring their activities, communication professionalsfocus only on a small part of the overall process
www.communicationmonitor.eu / Zerfass et al. 2010 / n = 1,955 PR professionals from 46 European countries; Q 10 (scale 1-5;methods used = scale points 4-5). Figures depicted within the DPRG/ICV framework for communication measurement (Zerfass 2010).

101
101
Joint stock and private companies are forerunners in monitoring financial inputs and business impacts
0%
20%
40%
60%
80%
100%
Financia
l costs
(input)
Personnel co
sts (in
put)
Process
quality (o
utput)
Clippings and media r
esponse (outp
ut)
Internet/in
tranet
usage (
output)
Satisfica
tion of clie
nts (output)
Understan
ding of ke
y messages (o
utcome)
Stakehold
er attit
udes, behavio
ur change (
outcome)
Reputation index,
brand va
lue (outflo
w)
Business
goals (o
utflow)
Joint stock companies Private companies Governmental Organisations Non-profit organisations
www.communicationmonitor.eu / Zerfass et al. 2010 / n = 1,533 PR professionals in communication departments;Q 10 (scale 1-5; methods used = scale points 4-5).

102
102
Communication measurement in different organisations
www.communicationmonitor.eu / Zerfass et al. 2010 / n = 1,533 PR professionals in communication departments;Q 10 (scale 1-5; methods used = scale points 4-5); Q 19.
0%
20%
40%
60%
80%
100%
Joint stock companies Private companies GovernmentalOrganisations
Non-profit organisations
Input Output Outcome Outflow
Joint stockcompanies
Non-profitorganisations
Governmentalorganisations
Privatecompanies
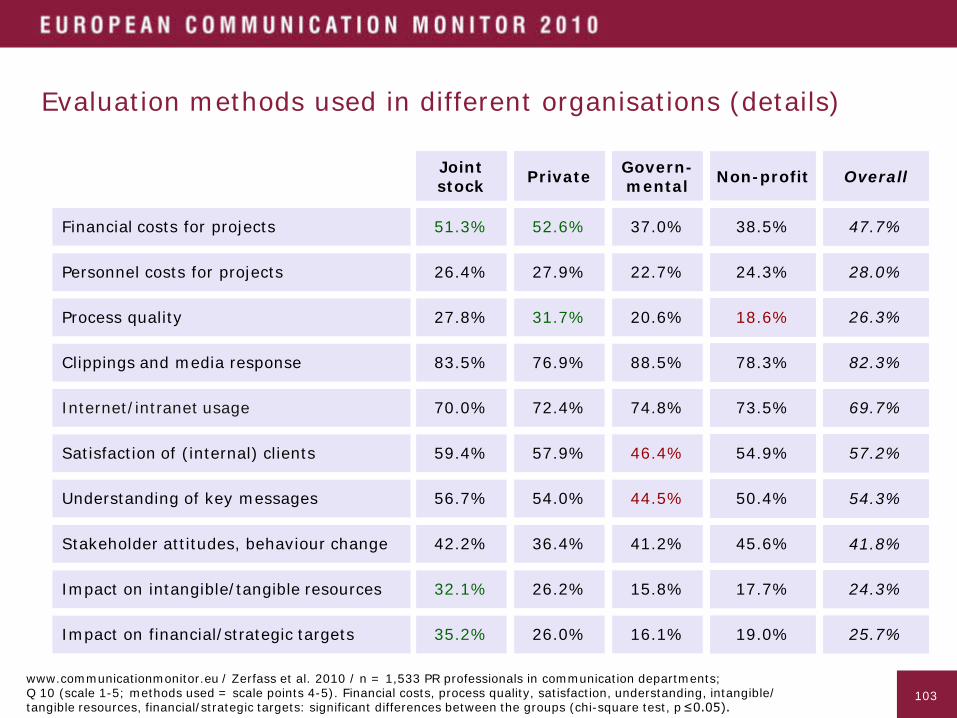
103
103
Evaluation methods used in different organisations (details)
Jointstock
Satisfaction of (internal) clients
Clippings and media response
Process quality
Internet/intranet usage
Understanding of key messages
59.4% %
%
%
%
Stakeholder attitudes, behaviour change
%
Impact on intangible/tangible resources
Impact on financial/strategic targets
Private Govern-mental Non profit
27.8%
83.5%
70.0%
56.7%
42.2%
32.1%
35.2%
57.9% 46.4%
76.9%
26.2%
31.7%
26.0%
72.4%
54.0%
36.4%
20.6%
88.5%
74.8%
%
%
%
44.5%
41.2%
15.8%
16.1%
www.communicationmonitor.eu / Zerfass et al. 2010 / n = 1,533 PR professionals in communication departments;Q 10 (scale 1-5; methods used = scale points 4-5). Financial costs, process quality, satisfaction, understanding, intangible/tangible resources, financial/strategic targets: significant differences between the groups (chi-square test, p≤0.05).
%
%
%
%
%
%
%
%
%
%
%
%
%
%
%
%
%
%
%
%
%
%
%
%
%
%
%
%
19.0%
17.7%
45.6%
50.4%
73.5%
78.3%
18.6%
54.9%
Jointstock PrivateJointstock Private Govern-
mentalJointstock Private Non-profitGovern-
mentalJointstock Private Overall
26.8%
29.8%
83.0%
62.0%
44.9%
32.4%
28.5%
35.1%
Overall
26.8%
29.8%
Overall
26.8%
83.0%
29.8%
Overall
26.8%
62.0%
83.0%
29.8%
Overall
26.8%
44.9%
62.0%
83.0%
29.8%
Overall
26.8%
32.4%
44.9%
62.0%
83.0%
29.8%
Overall
26.8%
28.5%
32.4%
44.9%
62.0%
83.0%
29.8%
Overall
26.8%
25.7%
24.3%
41.8%
54.3%
69.7%
82.3%
26.3%
Overall
57.2%
Financial costs for projects 51.3% 52.6% %37.0% 38.5% 35.1%47.7%
Personnel costs for projects 26.4% 27.9% %22.7% 24.3% 35.1%28.0%

104
104
Interpretation
Narrow view on communication controlling and measurement
_ In accordance with last year‘s survey, communication managers in Europe mainly rely on monitoring clippings and media response (82%) and internet/intranet usage (70%) when evaluating their activities. Only one fourth is tracking impact on financial/strategic targets or on intangible/tangible resources. Taking into account that self-reporting in this much-discussed area tends to be rather optimistic, this is a strong hint that measurement practice is far behind the ideal.
_ In spite of the economic recession, the percentage of respondents monitoring financial costs has only risen slightly by 1.7%. The practice of monitoring personnel costs for projects has even declined marginally.
_ When compared with the framework for communication measurement issued by PR associations and controller associations (Zerfass 2010), a predominance of external output evaluation is obvious, followed by exploring the direct outcome on stakeholder‘s perception or knowledge. Measures that catch the far ends of the overall process, i.e. evaluating the input invested by the organisation and value creation that pays off for the organisation, are utilised at a significantly lower rate.
_ The narrow view and the lack of measures on the outflow level is coherent with the strong search for clear links between communication and organisational goals identified in this survey.

105
105
Salaries

106
106
Basic annual salary of European PR practitioners (in Euros)
www.communicationmonitor.eu / Zerfass et al. 2010 / n = 1,688 PR professionals from 46 European countries; Q 19: In which of the following bands does your basic annual salary fall?
17,8%
11,3%
11,0%
9,4%
9,3%
8,0%
6,2%
6,0%
8,2%
5,3%
4,2%
2,0%
1,3%
0% 2% 4% 6% 8% 10% 12% 14% 16% 18% 20%
Up to €30,000
€30,001 - €40,000
€40,001 - €50,000
€50,001 - €60,000
€60,001 - €70,000
€70,001 - €80,000
€80,001 - €90,000
€90,001 - €100,000
€100,001 - €125,000
€125,001 - €150,000
€150,001 - €200,000
€200,001 - €300,000
More than €300,000
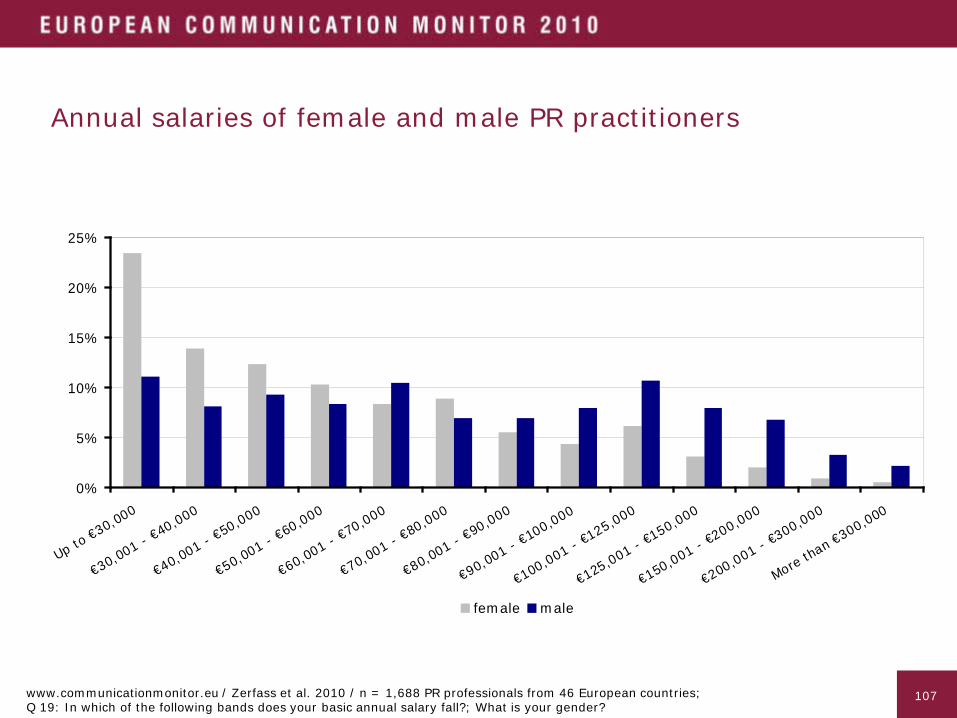
107
107
Annual salaries of female and male PR practitioners
www.communicationmonitor.eu / Zerfass et al. 2010 / n = 1,688 PR professionals from 46 European countries; Q 19: In which of the following bands does your basic annual salary fall?; What is your gender?
0%
5%
10%
15%
20%
25%
Up to €30,0
00
€30,001 - €
40,000
€40,001 - €
50,000
€50,001 - €
60,000
€60,001 - €
70,000
€70,001 - €
80,000
€80,001 - €
90,000
€90,001 - €
100,000
€100,001 - €125,000
€125,001 - €150,000
€150,001 - €200,000
€200,001 - €300,000
More tha
n €300,000
female male

108
108
Annual salaries of women and men in different hierarchical positions
€60,001 - €70,000 €90,001 - €100,000Head of Communication, Agency CEO
Female Male
€40,001 - €50,000 €60,001 - €70,000Unit Leader
€30,001 - €40,000 €40,001 - €50,000Team member
Average salary (Median)
www.communicationmonitor.eu / Zerfass et al. 2010 / n = 1,611 PR professionals from 46 European countries; Q 19: In which of the following bands does your basic annual salary fall?; What is your position?

109
109
Annual salary and membership by communication association
www.communicationmonitor.eu / Zerfass et al. 2010 / n = 1,066 PR professionals from 42 European countries; Q 19: In which of the following bands does your basic annual salary fall? Are you a member of a professional organisation?
0%
2%
4%
6%
8%
10%
12%
14%
16%
18%
Up to €
30,000
€30,001- €40,000
€40,001- €50,000
€50,001- €60,000
€60,001- €70,000
€70,001- €80,000
€80,001- €90,000
€90,001- €100,000
€100,001- €
125,000
€125,001- €
150,000
€150,001- €
200,000
€200,001- €
300,000
More th
an €300,000
National PR or communication association Other international communication association EACD
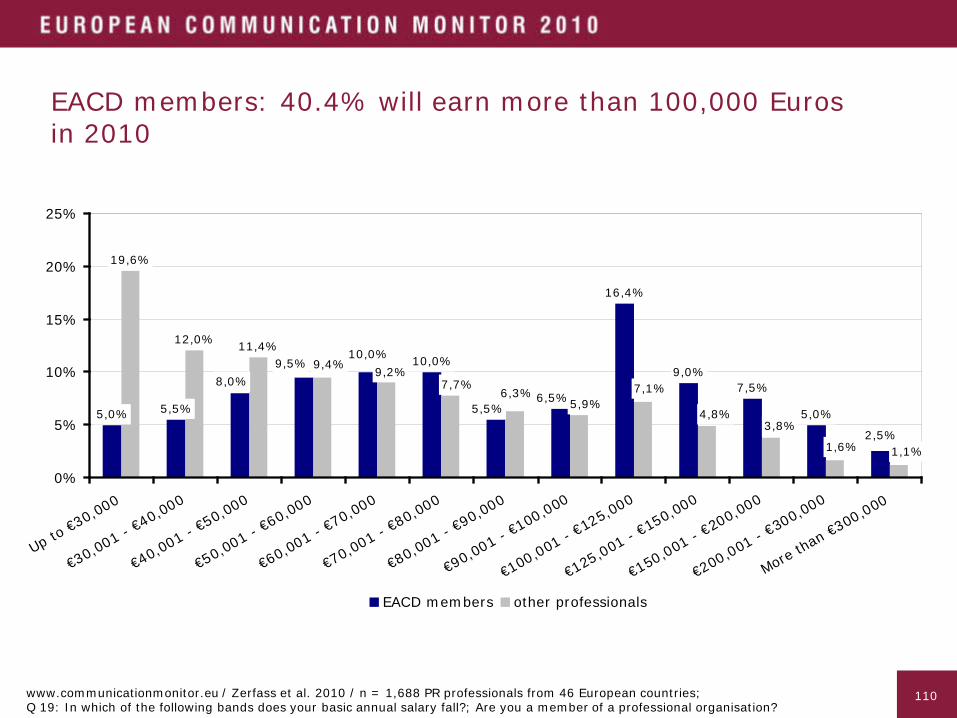
110
110
EACD members: 40.4% will earn more than 100,000 Euros in 2010
5,0% 5,5%
10,0%
16,4%
9,0%7,5%
5,0%
19,6%
12,0% 11,4%9,5%
5,5%6,5%
10,0%
8,0%
2,5%
9,4% 9,2%7,7%
5,9%7,1%
4,8%3,8%
1,6% 1,1%
6,3%
0%
5%
10%
15%
20%
25%
Up to €30,000
€30,001 - €40,000
€40,001 - €50,000
€50,001 - €60,000
€60,001 - €70,000
€70,001 - €80,000
€80,001 - €90,000
€90,001 - €100,000
€100,001 - €125,000
€125,001 - €150,000
€150,001 - €200,000
€200,001 - €300,000
More than €300,000
EACD members other professionals
www.communicationmonitor.eu / Zerfass et al. 2010 / n = 1,688 PR professionals from 46 European countries; Q 19: In which of the following bands does your basic annual salary fall?; Are you a member of a professional organisation?

111
111
Most professionals in Eastern and Southern Europe earn less than 40,000 Euros annually
0%
10%
20%
30%
40%
50%
Up to €
30,000
€30,001 -
€40,0
00
€40,001 -
€50,0
00
€50,001 -
€60,0
00
€60,001 -
€70,0
00
€70,001 -
€80,0
00
€80,001 -
€90,0
00
€90,001 -
€100,000
€100,001 - €125,0
00
€125,001 - €150,0
00
€150,001 - €200,0
00
€200,001 - €300,0
00
More th
an €300,000
Northern Europe Western Europe Southern Europe Eastern Europe
www.communicationmonitor.eu / Zerfass et al. 2010 / n = 1,688 PR professionals from 46 European countries; Q 19: In which of the following bands does your basic annual salary fall?; In which European state are you normally based?
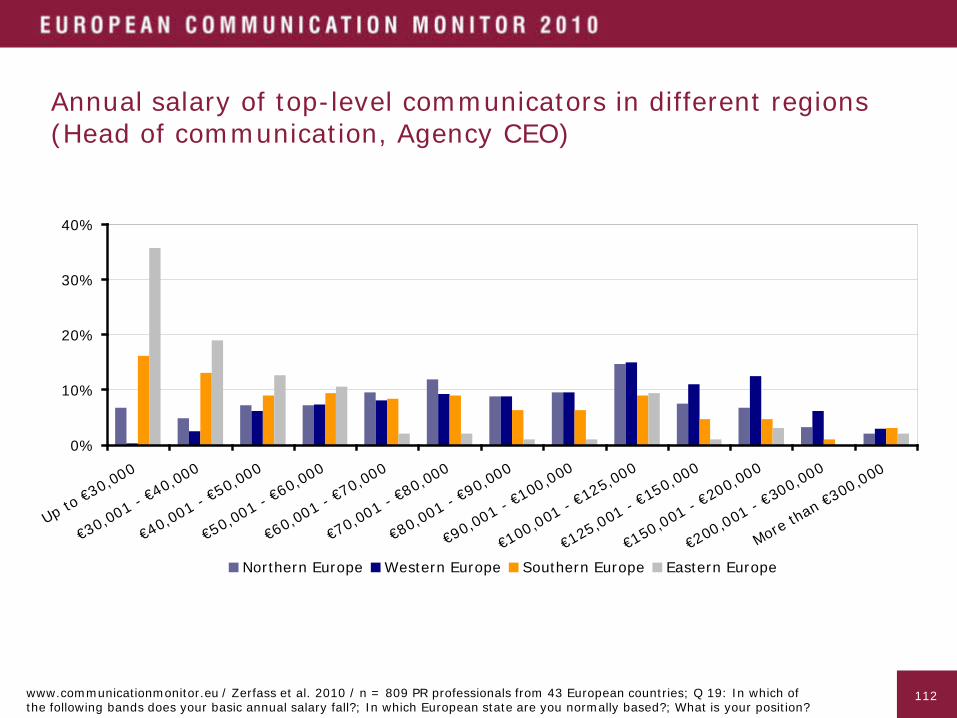
112
112
Annual salary of top-level communicators in different regions(Head of communication, Agency CEO)
0%
10%
20%
30%
40%
Up to €30,000
€30,001 - €40,000
€40,001 - €50,000
€50,001 - €60,000
€60,001 - €70,000
€70,001 - €80,000
€80,001 - €90,000
€90,001 - €100,000
€100,001 - €125,000
€125,001 - €150,000
€150,001 - €200,000
€200,001 - €300,000
More than €300,000
Northern Europe Western Europe Southern Europe Eastern Europe
www.communicationmonitor.eu / Zerfass et al. 2010 / n = 809 PR professionals from 43 European countries; Q 19: In which ofthe following bands does your basic annual salary fall?; In which European state are you normally based?; What is your position?

113
113
Professionals enacting the roles of strategic facilitators andbusiness advisers report a higher salary
0%
10%
20%
30%
Up to €
30,000
€30,001 -
€40,0
00
€40,001 -
€50,0
00
€50,001 -
€60,0
00
€60,001 -
€70,0
00
€70,001 -
€80,0
00
€80,001 -
€90,0
00
€90,001 -
€100,000
€100,001 - €125,0
00
€125,001 - €150,0
00
€150,001 - €200,0
00
€200,001 - €300,0
00
More tha
n €300,000
Isolated Experts Business Advisers Operational Supporters Strategic Faciliators
www.communicationmonitor.eu / Zerfass et al. 2010 / n = 1,688 PR professionals from 46 European countries; Q 19; Q 8.
114
114
Interpretation
Salaries have dropped since last year and differ widely throughout Europe
_ Compared to last year‘s survey (Zerfass et al. 2009), the percentage of respondents reporting high incomes above 100,000 Euros has declined.At the same time, 18% say they earn not more than 30,000 Euros per year.
_ These results may be partly influenced by the fact that the regional background of participants is better balanced than in previous surveys; this report is basedon a rising number of questionnaires from Southern and Eastern European countries with a lower level of income. However, the overall trend is obvious.
_ Salaries of communication professionals differ widely throughout Europe. Countries with a well-established occupational field in Western and Northern Europe lead the field. At the same time, the average salary (median) of womenis lower than the income of their male counterparts on every hierarchical level. The glass ceiling still exists.
_ Professionals enacting the „strategic facilitator“ and „business adviser“ roles tend to be in the top of the salary ranks, whereas a large portion of the „isolated experts“ are badly paid.

115
115
Annex
116
116
Authors
Prof. Dr. Ansgar Zerfass
_ Professor of Communication Management, University of Leipzig, [email protected]
Prof. Ralph Tench, Dr.
_ Professor of Public Relations, Leeds Metropolitan University, United Kingdom [email protected]
Ass. Prof. Dr. Piet Verhoeven
_ Associate Professor of Communication Science, University of Amsterdam, Netherlands [email protected]
Prof. Dejan Verčič, PhD
_ Professor of Public Relations and Communication Management,University of Ljubljana, [email protected]
Prof. Angeles Moreno, PhD
_ Professor of Public Relations and Communication Management,University Rey Juan Carlos, Madrid, [email protected]

117
117
Advisory board
Prof. Dr. Emanuele Invernizzi_ IULM University, Milano, Italy
Prof. Dr. Valerie Carayol_ University of Bordeaux 3, France
Ass. Prof. Dr. Francesco Lurati_ University of Lugano, Switzerland
Prof. Dr. Sven Hamrefors_ Mälardalen University, Sweden
Prof. Dr. Øyvind Ihlen_ BI Norwegian School of Management, Oslo, Norway
Prof. Dr. Ryszard Lawniczak_ Poznan University of Economics, Poland
118
118
References
Balmer, J., & Greyser, S. (Eds.) (2003). Revealing the Corporation: Perspectives on Identity, Image, Reputation, Corporate Branding and Corporate Level Marketing. London: Sage.
Carroll, C. (Ed.) (2010). Corporate Reputation and the News Media. New York: Routledge.
Christensen, L.T., Morsing, M., & Cheney, G. (2008). Corporate communication. Convention, complexity, and critique. London: Sage.
Ernest, R.C. (1985). Corporate cultures and effective planning. Personnel Administrator, Vol. 30 (3), 49-60.
Giddens, A. (1984). The constitution of society. Outline of the theory of structuration. Cambridge: Polity Press.
Grunig, L.A., Grunig, J.E., & Dozier, D.M. (2002). Excellent public relations and effective organizations. Mahwah (NJ): Lawrence Erlbaum Associates.
Hamrefors, S. (2009). The information officer’s role in leadership. Final report on the research project “Business effective information and communication”. Stockholm: Swedish Public Relations Association.
Hatch, M.J., & Schultz, M. (2008). Taking Brand Initiative: How Companies Can Align Strategy, Culture, and Identity Through Corporate Branding. San Francisco (CA): Jossey-Bass.
Klewes, J., & Wreschniok, R. (Eds.) (2009). Reputation Capital: Building and Maintaining Trust in the 21st Century. Berlin, Heidelberg, New York: Springer.
Lurati, F., & Eppler, M. (2006). Communication and Management: Researching Corporate Communication and Knowledge Communication in Organizational Settings. Studies in Communication Sciences, Vol. 6 (2), 75-98.
Moreno, A., Verhoeven, P., Tench, R., & Zerfass, A. (2010). European Communication Monitor 2009. An institutionalized view of how public relations and communication management professionals face the economic and media crises in Europe. Public Relations Review, Vol. 36, 97-104.
Moreno, A., Zerfass, A., Tench, R., Vercic, D., & Verhoeven, P. (2009). European Communication Monitor. Current developments, issues and tendencies of the professional practice of public relations in Europe. Public Relations Review, Vol. 35, 79-82.
Plowman, K.D. (2005). Conflict resolution. In R.L. Heath (Ed.), Encyclopedia of Public Relations (pp. 181-184). Thousand Oaks (CA): Sage.
Swerling, J. (2009). Questionnaire for Sixth Annual Public Relations Generally Accepted Practices (G.A.P.) Study, GAP VI. Los Angeles: University of Southern California. Unpublished document.
119
119
References (continued)
Tench, R., Verhoeven, P., & Zerfass, A. (2009). Institutionalizing Strategic Communication in Europe – An Ideal Home or a Mad House? Evidence from a Survey in 37 Countries. International Journal of Strategic Communication, Vol. 3 (2), 147-164.
United Nations Statistics Division (2010). Composition of macro geographical (continental) regions, geographical sub regions, and selected economic and other groupings (revised 01 April 2010). New York: United Nations. Available at: http://unstats.un.org/unsd/methods/m49/m49regin.htm#europe
Van Riel, C.B.M., & Fombrun, C. (2007). Essentials of corporate communication. Implementing practices for effective reputation management. London, New York: Routledge.
Van Ruler, B., & Vercic, D. (2005). Reflective communication management. Future ways for public relations research. In International Communication Association (Ed.), Communication Yearbook 29 (pp. 239-273). New Brunswick, NJ: Translation.
Vercic, D., & Zerfass, A. (2010). Constructing public relations in transnational research. In D. Stacks & K. Yamamura (Eds.), Ethical Issues for Public Relations Practice in a Multicultural World, 13th International Public Relations Research Conference, Miami (FL): IPR.
Verhoeven, P., & Zerfass, A. (2010). Reflectieve communicatie bij organisaties. [Reflective communication of organisations]. Tijdschrift voor Communicatiewetenschap [Journal for Communication Science], Vol. 38.
Werder, K.P., & Holtzhausen, D. (2009). An Analysis of the Influence of Public Relations Department Leadership Style on Public Relations Strategy Use and Effectiveness. Journal of Public Relations Research, Vol. 21 (4), 404-427.
Zerfass, A. (2008). Corporate Communication Revisited: Integrating Business Strategy and Strategic Communication. In A. Zerfass, B. van Ruler & K. Sriramesh (Eds.), Public Relations Research. European and International Perspectives and Innovations (pp. 65-96).Wiesbaden: VS Verlag für Sozialwissenschaften.
Zerfass, A. (2010). Assuring rationality and transparency in corporate communications. Theoretical foundations and empirical findings on communication controlling and communication performance management. In D. Stacks & K. Yamamura (Eds.), Ethical Issues for Public Relations Practice in a Multicultural World, 13th International Public Relations Research Conference, Miami (FL): IPR.
Zerfass, A., Moreno, A., Tench, R., Vercic, D., & Verhoeven, P. (2008). European Communication Monitor 2008. Trends in Communication Management and Public Relations – Results and Implications. Brussels, Leipzig: EUPRERA, University of Leipzig.
Zerfass, A., Moreno, A., Tench, R., Vercic, D., & Verhoeven, P. (2009). European Communication Monitor 2009. Trends in Communication Management and Public Relations – Results of a Survey in 34 Countries. Brussels: EACD, EUPRERA.
Zerfass, A., Van Ruler, B., Rogojinaru, A., Vercic, D., & Hamrefors, S. (2007). European Communication Monitor 2007. Trends in Communication Management and Public Relations – Results and Implications. Leipzig, Brussels: University of Leipzig, EUPRERA.

120
120
Imprint
Publication
Zerfass, A., Tench, R., Verhoeven, P., Verčič, D., & Moreno, A. European Communication Monitor 2010. Status Quo and Challenges for Public Relations in Europe.Results of an Empirical Survey in 46 Countries (Chart Version)Brussels: EACD, EUPRERA, July 2010This set of charts is available as a free PDF document at www.communicationmonitor.euThe full report (text and charts) is available as a book published by Helios Media, ISBN 978-3-942263-05-4
Publisher
EUPRERA European Public Relations Education and Research Association, www.euprera.org
Copyright
© 2010 by Ansgar Zerfass and the research team for the whole document and all parts, charts and data. The material presented in this document represents empirical insights and interpretation by the research team. It is intellectual property subject to international copyright.Illustration licensed by istockphoto.com. Title graphic provided by EACD.Permission is gained to quote from the content of this survey and reproduce any graphics, subject to the condition that the source including the internet address is clearly quoted and depicted on every chart. It is not allowed to use this data to illustrate promotional material for commercial services.Publishing this PDF document on websites run by third parties and storing this document in databases or on platforms which are only open to subscribers/members or charge payments for assessing information is not allowed. Please use a link to the official website www.communicationmonitor.eu
Acknowledgements
Special thanks to Ronny Fechner M.A. and Katharina Simon B.Sc. (University of Leipzig) for their most valuable statistical and organisational support and to Grit Fiedler (EACD, Brussels) for helpful suggestions.
Contact
Please contact any member of the research team or the advisory board in your country/region if you are interested in discussing the insights of this survey or in joint research projects. Questions regarding the overall research, including sponsorship opportunities for future surveys, may be directed to the lead researcher, Prof. Dr. Ansgar Zerfass, [email protected]

121
121

122
122