Commonwealth · PDF fileAustralia’s Commonwealth fisheries are a valuable natural asset....
63
Transcript of Commonwealth · PDF fileAustralia’s Commonwealth fisheries are a valuable natural asset....


ii
Commonwealth Fisheries Harvest Strategy Policy and Guidelines
September 2007
D E P A R T M E N T O F A G R I C U L T U R E , F I S H E R I E S A N D F O R E S T R Y

iii
Acknowledgements Commonwealth Fisheries Harvest Strategy Policy The Policy was developed by the Department of Agriculture, Fisheries and Forestry (DAFF), in close consultation with the Australian Fisheries Management Authority (AFMA) and the Department of the Environment and Water Resources (DEW). The Policy development was overseen by a Steering Committee comprising DAFF, AFMA, DEW, the Bureau of Rural Sciences (BRS), the Australian Bureau of Agricultural and Resource Economics (ABARE), Peter Franklin of the Commonwealth Fisheries Association and independent fisheries experts, including Ian Knuckey.
Guidelines The Guidelines were prepared by a project team headed by David Smith (CSIRO) as part of the FRDC-funded project “Implementation of Harvest Strategies across AFMA’s Fisheries”. The project team comprised the following members: David Smith (PI), Tony Smith, Cathy Dichmont, Campbell Davies (CSIRO), Andy Bodsworth (AFMA), Peter Gooday, David Galeano (ABARE), Kevin McLoughlin BRS), Ian Knuckey (industry), Malcolm Haddon (ScallopRAG) and George Jackson (SquidRAG). Project Officer: Natalie Dowling (CSIRO). The project was overseen by a Steering Committee comprising representatives from DAFF, AFMA, ABARE, BRS, CFA and CSIRO. Meredith Prendergast provided logistical and clerical support. ISBN 978-0-9803714-4-4
© Commonwealth of Australia 2007 This work is copyright. The Copyright Act 1968 permits fair dealing for study, research, news reporting, criticism or review. Selected passages, tables or diagrams may be reproduced for such purposes provided acknowledgment of the source is included. Major extracts or the entire document may not be reproduced by any process without the written permission of the Executive Director, Fisheries and Forestry Division, Department of Agriculture, Fisheries and Forestry. The Australian Government Department of Agriculture, Fisheries and Forestry seeks to publish its work to the highest professional standards. However, it cannot accept responsibility for any consequences arising from the use of information herein. Readers should rely on their own skill and judgment in applying any information for analysis to particular issues or circumstances.

iv
Foreword Australia’s Commonwealth fisheries are a valuable natural asset. They make an important contribution to both local and national economies, supply fresh, healthy seafood to consumers throughout the country and support valuable jobs and infrastructure, particularly in regional areas. I am pleased to introduce the Commonwealth Fisheries Harvest Strategy Policy (the Policy), which provides a framework for the management of Australia’s Commonwealth fisheries into the future. The Policy aims to maximise the net economic returns to the Australian community and at the same time ensure fish stocks remain at safe and productive levels. It reaffirms the Australian Government’s commitment to world’s best practice fisheries management, and is a key component of the Australian Government’s $220m Securing our Fishing Future initiative. In December 2005, the Australian Government Minister for Fisheries, Forestry and Conservation issued a Ministerial Direction to the Australian Fisheries Management Authority (AFMA) under section 91 of the Fisheries Administration Act 1991. The Ministerial Direction included a requirement for the development of a world’s best practice harvest strategy policy for Commonwealth fisheries. This Policy satisfies that requirement. The Policy provides a consistent framework for taking the available information about particular fish stocks and applying an evidence and risk-based approach to setting harvest levels on a fishery-by-fishery basis. The Policy also provides the fishing industry and other stakeholders with a more certain operating environment where management decisions for key species are more consistent, predictable and transparent. I am confident that this approach will see Australia well positioned to ensure the future health of both our Commonwealth fish stocks and of our Commonwealth fishing industry.
ERIC ABETZ Minister for Fisheries, Forestry and Conservation 10th September 2007

v
Contents Acknowledgements………………………………………………………………………..ii Foreword………………………………………………………………………..……....……iii Commonwealth Fisheries Harvest Strategy Policy……………………………….2 Guidelines for Implementation of the Commonwealth Fisheries Harvest Strategy Policy……………………...………12 Attachment A: Glossary of Terms…………………………………………………………53

vi
Commonwealth Fisheries Harvest Strategy Policy Introduction .................................................................................................................................. 1
What is a harvest strategy? .................................................................................................................... 3
Core Elements of the Policy ......................................................................................................... 4
Objective ............................................................................................................................................... 4 Strategy ................................................................................................................................................. 4
Interpretation ................................................................................................................................ 5 Implementation ............................................................................................................................ 5 Roles and Responsibilities ........................................................................................................... 5 Applying the Policy ..................................................................................................................... 6
Highly Migratory/Straddling or Joint Authority Fisheries Stocks ........................................................ 6 Relationship of the Policy and the Environment Protection and Biodiversity Conservation Act 1999 (EPBC Act) .................................. 7 Technical evaluation of harvest strategies ............................................................................................ 7
Amending Harvest Strategies ....................................................................................................... 7 Reporting and Review .................................................................................................................. 8 Extract from the Ministerial Direction to the Australian Fisheries Management Authority ......................................................................... 9

vii
Guidelines for Implementation of the Commonwealth Fisheries Harvest Strategy Policy Executive Summary ................................................................................................................... 12 1 Introduction ............................................................................................................................ 14
1.1 Objectives and structure of the Guidelines .................................................................................. 14
2 Harvest Strategies .................................................................................................................. 15
2.1 Introduction .................................................................................................................................. 15 2.2 The relationship between harvest strategies and other management measures ............................ 18 2.3 Highly Migratory/Straddling or Joint Authority Fisheries Stocks ............................................... 18 2.5 Process for Developing Harvest Strategies .................................................................................. 19 2.6 Cost Issues .................................................................................................................................... 21
3 Key Operational Objectives of the Harvest Strategy Policy .................................................. 22
3.1 HSP Reference Points .................................................................................................................. 22 3.2 Stock Rebuilding .......................................................................................................................... 24 3.3 Multi-species fisheries ................................................................................................................. 25
4 Harvest Strategy Design Criteria ........................................................................................... 26
4.1 Efficient and cost effective ........................................................................................................... 26 4.2 Consistent with ESD principles.................................................................................................... 26 4.3 Maximise the net economic returns to the Australian community ............................................... 26 4.4 A high level of transparency in decision making ......................................................................... 26 4.5 A high level of confidence that objectives will be met ................................................................ 26 4.6 Taking species’ life history into account ...................................................................................... 27
5 Economics and Harvest Strategies ......................................................................................... 27
5.1 What is MEY? .............................................................................................................................. 27 5.2 Calculating MEY ......................................................................................................................... 29 5.3 How often should MEY be updated? ........................................................................................... 31
6 Management Tools ................................................................................................................. 32

viii
7 Dealing with Different Levels of Information, Assessments and Data Poor Species............ 35 8 Dealing with Uncertainty and Risk ........................................................................................ 40 9 Dealing with High Variability ................................................................................................ 41
9.1 Short-lived species ....................................................................................................................... 41 9.2 Longer-lived species .................................................................................................................... 42
10 Stock Rebuilding Strategies and Stock Recovery Plans ...................................................... 43
10.1 Key elements of a stock rebuilding strategy/stock recovery plan .............................................. 44
11 Translating Recommended Biological Catches (RBCs) into Total Allowable Catch/Effort ....................................................................................... 45
11.1 Setting TAC/TAE from RBCs ................................................................................................... 45 11.2 Translating RBCs to TAEs ......................................................................................................... 45 11.3 Determining RBCs in a Spatial Context .................................................................................... 46
12 Developing Fisheries............................................................................................................ 46 13 Exceptional Circumstances .................................................................................................. 47 14 Management Strategy Evaluation ........................................................................................ 48
14.1 What is MSE? ............................................................................................................................ 48 14.2 When should MSE be used?....................................................................................................... 49
15 Amending Harvest Strategies............................................................................................... 50 Attachment A: Glossary of Terms ............................................................................................. 53

Commonwealth Fisheries Harvest Strategy Policy September 2007

Commonwealth Fisheries Harvest Strategy Policy
2
Introduction The Policy1
provides a framework for the development of harvest strategies for key commercial species taken in Australia’s Commonwealth fisheries. Harvest strategies consistent with the Policy will provide the Australian community with a high degree of confidence that commercial fish species are being managed for long-term biological sustainability and economic profitability. Harvest strategies will also provide the fishing industry with a more certain operating environment.
By its nature, fisheries management is an activity involving substantial elements of risk and uncertainty. Despite some significant advances in knowledge there is still uncertainty about the range, distribution, life cycle and population size of many commercial fish species and stocks. Given this, it is necessary to develop a consistent framework which will deliver an evidence-based, precautionary approach to achieving long-term sustainability and profitability drawing on available information. The Policy incorporates the relevant requirements of the Fisheries Management Act 1991 (the FM Act), the Fisheries Administration Act 1991 (the FA Act) and the Environment Protection and Biodiversity Conservation Act 1999 (the EPBC Act), together with the United Nations Fish Stocks Agreement and the Food and Agriculture Organization Code of Conduct for Responsible Fisheries, and is to be interpreted within the legislation. The Policy specifies the risk levels that are acceptable to the Australian Government in allowing access to, and use of fishery resources in Commonwealth fisheries. The Policy was developed as a direct response to a Ministerial Direction2
made to the Australian Fisheries Management Authority (AFMA) in December 2005 by the then Minister for Fisheries, Forestry and Conservation.
The Policy establishes outcomes to be achieved in Commonwealth fisheries and the need for harvest strategies to be established for managing these fisheries. The Policy allows for harvest strategies to be applied to single-species and multi-species fisheries. The Policy should be read in conjunction with the Guidelines for Implementation of the Commonwealth Fisheries Harvest Strategy Policy. The Policy (and the associated Guidelines) contains default settings for some key elements of a harvest strategy. Fishery and species-specific harvest strategies will be consistent with the objective of the Policy, recognising the wide variety of species in Commonwealth fisheries - from low productivity, long-lived species such as sharks, to short-lived species with high natural stock variability such as prawns and squid. Harvest strategies developed under the Policy will set out management actions that monitor and assess biological and economic conditions in a given fishery to control the fishing intensity in order to achieve defined biological and economic objectives. The management of fisheries using output controls is the Australian Government’s preferred approach. However, this Policy recognises that stocks can be maintained relative to reference points using a range of management tools, including input and/or output controls. AFMA has adopted Ecosystem Based Fisheries Management (EBFM) as its overarching framework for Commonwealth fisheries management. It must be emphasised that implementing a harvest strategy of itself will not achieve ecologically sustainable or profitable fisheries. Other processes are in place in
1 The Policy was prepared by the Australian Government Department of Agriculture, Fisheries and Forestry (DAFF), including the Bureau of Rural Sciences (BRS) and the Australian Bureau of Agricultural and Resource Economics (ABARE), with assistance from the Australian Fisheries Management Authority (AFMA), the Department of the Environment and Water Resources (DEW) and the Commonwealth Scientific and Industrial Research Organisation (CSIRO). Consultation also occurred with key stakeholders, and national and international experts. 2 An extract of the relevant part of the Direction is on Page 9.

Commonwealth Fisheries Harvest Strategy Policy
3
Commonwealth fisheries management to help achieve broader ecosystem objectives, including undertaking comprehensive ecological risk assessments (ERA) accompanied by appropriate risk management responses. The Ministerial Direction provides for further initiatives in support of EBFM, including reductions to bycatch, fishery independent monitoring, and increased focus on spatial management. Harvest strategies, in combination with this package of measures, constitute a whole of government approach to sustainable fisheries management. The experience of good fisheries management indicates that, in general terms:
• fisheries are more efficient, profitable, stable and sustainable, when stocks are larger than the stock size that produces the maximum sustainable yield3
• future productivity is at greater risk when stocks are reduced to a level where the recruitment of young fish relative to the portion of the stock subject to fishing declines precipitously (referred to as ‘recruitment failure’);
(referred to as BMSY);
• fisheries should be managed on a whole stock basis, and in a way that takes species life history into account;4
• economic returns can be maximised and in general, overcapitalisation avoided when fish stocks are maintained, on average, at a target adult biomass level equal to the maximum economic yield (BMEY);
5
• if stock sizes fall below BMEY, the associated increase in fishing costs is greater than the increase in fishing revenue, and as such is less efficient.
and
The Policy incorporates the above principles to provide a framework for the development of harvest strategies.
What is a harvest strategy? A harvest strategy sets out the management actions necessary to achieve defined biological and economic objectives in a given fishery. Harvest strategies must contain:
• a process for monitoring and conducting assessments of the biological and economic conditions of the fishery; and
• rules that control the intensity of fishing activity according to the biological and economic conditions of the fishery (as defined by the assessment). These rules are referred to as control rules6
.
Control rules are designed to keep the fishery on track in pursuit of its defined objectives by specifying the management actions or decisions that need to be taken. For control rules to be clear and effective, the objectives need to be expressed in the form of quantifiable reference points. These reference points are used to guide management decisions. Management decisions should be pre-agreed actions linked directly to the biological and economic status of the fishery relative to these reference points. With a harvest strategy in place, fishery managers and industry are able to operate with greater confidence, management decisions are more transparent, and there should be fewer unanticipated outcomes necessitating hasty management responses.
3 It should be noted that maximum sustainable yield is a theoretical maximum that can be taken from a stock in perpetuity. 4 Life history characteristics include, among other things, longevity, fecundity and recruitment variability. 5 Economic returns will only be maximised if a management regime is also in place that allows for fishing costs to be minimised and fishing revenue to be maximised. 6 Control rules are sometimes also known as harvest control rules or decision rules.

Commonwealth Fisheries Harvest Strategy Policy
4
Reference points for the status of fish populations or fishery management units (hereafter referred to as ‘stocks’) and the intensity of fishing activity are expressed as the amount of biomass (B) and the fishing mortality rate (F) respectively. The fishing mortality rate (F) is the rate of deaths of fish due to fishing. As with B reference levels, F reference levels may be applied to entire stocks or segments of stocks (e.g. the adult or fished population) and should match the scale of the management unit. Harvest strategies are commonly based around two types of reference points: ‘target’ reference points and ‘limit’ reference points. Target reference points express the desired status of stocks (BTARG) and desired fishing intensity (FTARG). Limit reference points (BLIM and FLIM) express situations to be avoided because they represent a point beyond which the risk to the stock as the basis of a commercial fishery is regarded as unacceptably high.
Core Elements of the Policy
Objective The objective of this Policy is the sustainable and profitable utilisation of Australia’s Commonwealth fisheries in perpetuity through the implementation of harvest strategies that maintain key commercial stocks at ecologically sustainable levels and within this context, maximise the economic returns to the Australian community.
Strategy To pursue the objective, harvest strategies for key commercial stocks taken in Australia’s Commonwealth fisheries will be designed to pursue maximum economic yield from the fishery and ensure those stocks remain above levels at which the risk to the stock is unacceptably high. Harvest strategies will seek to:
• maintain fish stocks, on average, at a target biomass point (BTARG) equal to the stock size required to produce maximum economic yield (BMEY)7
• ensure fish stocks will remain above a biomass level;
8 where the risk to the stock is regarded as too high, that is BLIM (or proxy)9
• ensure that the stock stays above the limit biomass level at least 90% of the time; and
8
.
For a stock below BLIM, a stock rebuilding strategy10
will be developed to rebuild the stock to BTARG. Once such a stock is above BLIM it may be appropriate for targeted fishing to re-commence in-line with the stock rebuilding strategy and harvest strategy.
7 In cases where BMEY is unknown, a proxy of 1.2BMSY (or a level 20% higher than a given proxy for BMSY) is to be used for a single species fishery and in the case of a multi-species fishery judgement needs to be exercised. AFMA may approve the use of an alternative proxy for BMEY if it can be demonstrated that a more appropriate alternative exists. 8 For highly variable species that may naturally (i.e. in the absence of fishing) breach BLIM, the harvest strategy for these species must be consistent with the intent of the Policy. 9 BLIM (or proxy) equal to or greater than ½ BMSY (or proxy). 10 Rebuilding strategy to be developed by AFMA and agreed to by the Minister for the Environment and Water Resources.

Commonwealth Fisheries Harvest Strategy Policy
5
For stocks above BLIM but below the level that will produce maximum sustainable yield (BMSY) it is necessary to first rebuild stocks to BMSY. Once stocks reach BMSY, rebuilding shall continue toward BTARG however the rate of rebuilding shall be determined in a way that considers the appropriate balance between short term losses and longer term economic gains. For stocks above BTARG, the rate of ‘fish down’ toward the target level will be determined by fishery-specific harvest strategies. In single and/or multi-species harvest strategies, alternate reference points may be determined by AFMA if they better pursue the objectives of the Policy. In meeting all of the outcomes harvest strategies are required to consider ecosystem interactions. One consideration is the relationship the species has with others in the food web or community, particularly if the harvested species is a keystone species. In such circumstances the biomass reference points described above may be increased to take account of a species’ importance to the maintenance of the food web or community. As noted in the introduction, harvest strategies form only one part of a more comprehensive approach to EBFM.
Interpretation The Policy is to be interpreted by reference to the Glossary of Terms at Attachment A.
Implementation The Policy comes into effect from the time of its approval by the Minister for Fisheries, Forestry and Conservation. Harvest strategies consistent with the Policy will be implemented in all Commonwealth fisheries by 1 January 2008. The Guidelines for Implementation of the Commonwealth Fisheries Harvest Strategy Policy provide direction on how to implement the Policy. Those stocks that are estimated to be below BLIM as at 1 January 2008 will be subject to a 12 month period of transitional arrangements. During this transitional period, targeted fishing for any of these stocks, not currently subject to zero catch, need not be reduced immediately to zero; however, management actions shall be directed to rapid rebuilding of these stocks. These transitional arrangements will apply for no more than one year and the Policy will apply to all stocks in full from 1 January 2009, which means that targeted fishing of key commercial species below BLIM will cease from that date. The incorporation of economics into the management of fisheries is essential given the legislative economic objective. AFMA will seek to ensure that there is economic capacity available to resource assessment groups (RAGs) and management advisory committees (MACs) to assist them to provide adequate advice to the AFMA Board.
Roles and Responsibilities AFMA is responsible for the implementation of the Policy. It must develop and implement harvest strategies for all Commonwealth fisheries by 1 January 2008. For those fisheries that have a MAC and/or RAG, the MAC and RAG is responsible for the provision of advice to AFMA on the implementation of the Policy in the fishery for which it is responsible.

Commonwealth Fisheries Harvest Strategy Policy
6
For internationally-managed fisheries, the Minister for Fisheries, Forestry and Conservation, in consultation with other relevant Australian Government Ministers and AFMA, is responsible for determining Australia’s negotiating position. In cases where a stock falls below BLIM, AFMA must, in agreement with the Minister for the Environment and Water Resources, determine the stock rebuilding strategy for that species or stock. DAFF, including ABARE and BRS, will monitor the implementation of the Policy by AFMA. The Australian Government will negotiate jurisdictional arrangements as required that support the objective of this policy.
Applying the Policy The Policy applies to the key commercial species of all Commonwealth-managed fisheries. It takes into account mortality resulting from all types of fishing, including recreational and state managed-catches. It does not necessarily require that all types of fishing be regulated, nor does it prescribe the type of fishery management regulations that will be applied. It is possible that a harvest strategy could meet the Policy objectives without the need for additional management arrangements or regulations. While the Policy does not prescribe the type of fishery management regulations that will be applied, it does require that they are designed to meet the targets specified under the harvest strategy. In situations where the adult biomass of a particular stock is greater than or equal to BTARG, AFMA will have a high degree of discretion in how that stock is managed. AFMA will continue to have flexibility in the management of a particular stock where the adult biomass is between BTARG and BLIM. When the stock is below BTARG the management response will be to set the control rules to take the stock back towards BTARG, with account taken of the life history and biology of the species, along with any relevant economic information. Where a harvest strategy applies to a multi-species fishery it may be appropriate for some species to be maintained below BMSY, but always above BLIM, to ensure that the fishery maximises net economic returns.
Highly Migratory/Straddling or Joint Authority Fisheries Stocks In the case of fisheries that are managed under the joint authority of the Australian Government and another Australian jurisdiction or international management body/arrangement, this Policy does not prescribe management arrangements. However, the Australian Government will negotiate with the relevant body with an aim of ensuring sustainable fisheries by advocating this policy as an example of best practice in setting sustainable catch levels. The Australian Governments position taken to regional fisheries management organisation/arrangement negotiations is underpinned by Australia’s domestic legislative obligations. Therefore it is Australian Government policy to support catch level decisions taken by these organisations and arrangements. In the absence of agreement, Australia's domestic catch allocation decision would be consistent with the agreed whole of government position. For fisheries issues that are not decided by an international management body or arrangement, DAFF and AFMA will consult on the management arrangements that will apply and AFMA will implement those arrangements.
Commonwealth Fisheries Harvest Strategy Policy
7
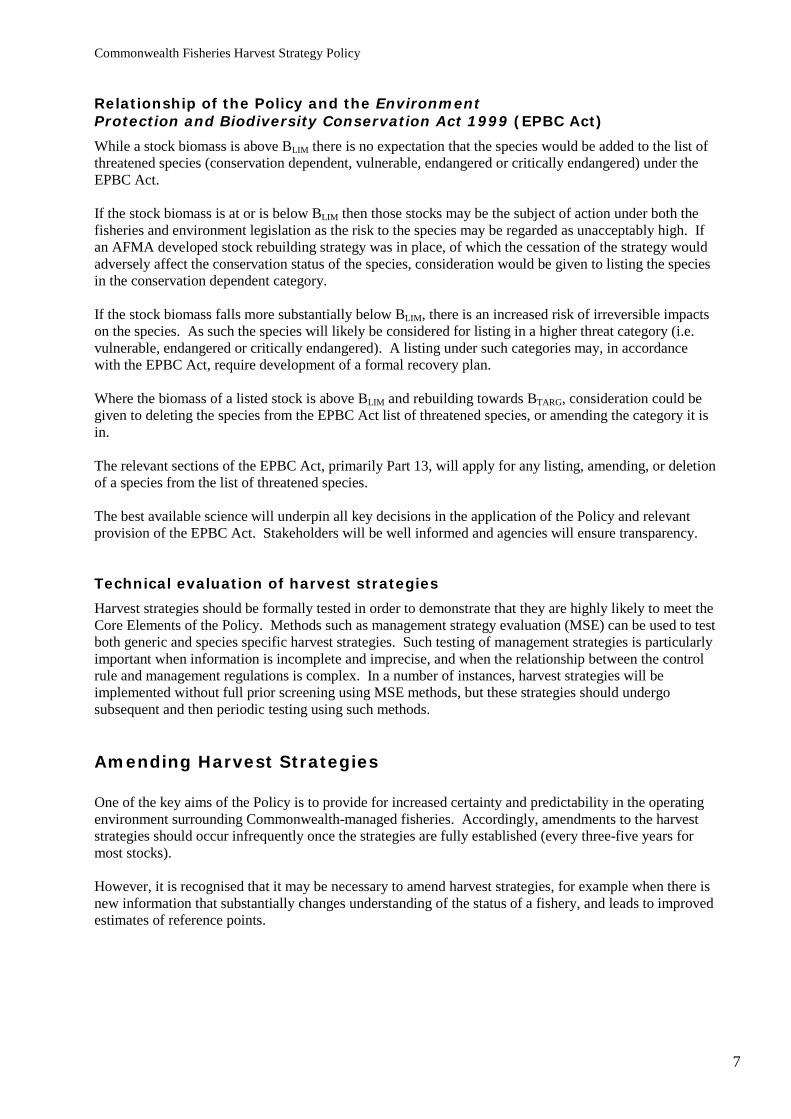
Relationship of the Policy and the Environment Protection and Biodiversity Conservation Act 1999 (EPBC Act) While a stock biomass is above BLIM there is no expectation that the species would be added to the list of threatened species (conservation dependent, vulnerable, endangered or critically endangered) under the EPBC Act. If the stock biomass is at or is below BLIM then those stocks may be the subject of action under both the fisheries and environment legislation as the risk to the species may be regarded as unacceptably high. If an AFMA developed stock rebuilding strategy was in place, of which the cessation of the strategy would adversely affect the conservation status of the species, consideration would be given to listing the species in the conservation dependent category. If the stock biomass falls more substantially below BLIM, there is an increased risk of irreversible impacts on the species. As such the species will likely be considered for listing in a higher threat category (i.e. vulnerable, endangered or critically endangered). A listing under such categories may, in accordance with the EPBC Act, require development of a formal recovery plan. Where the biomass of a listed stock is above BLIM and rebuilding towards BTARG, consideration could be given to deleting the species from the EPBC Act list of threatened species, or amending the category it is in. The relevant sections of the EPBC Act, primarily Part 13, will apply for any listing, amending, or deletion of a species from the list of threatened species. The best available science will underpin all key decisions in the application of the Policy and relevant provision of the EPBC Act. Stakeholders will be well informed and agencies will ensure transparency.
Technical evaluation of harvest strategies Harvest strategies should be formally tested in order to demonstrate that they are highly likely to meet the Core Elements of the Policy. Methods such as management strategy evaluation (MSE) can be used to test both generic and species specific harvest strategies. Such testing of management strategies is particularly important when information is incomplete and imprecise, and when the relationship between the control rule and management regulations is complex. In a number of instances, harvest strategies will be implemented without full prior screening using MSE methods, but these strategies should undergo subsequent and then periodic testing using such methods.
Amending Harvest Strategies One of the key aims of the Policy is to provide for increased certainty and predictability in the operating environment surrounding Commonwealth-managed fisheries. Accordingly, amendments to the harvest strategies should occur infrequently once the strategies are fully established (every three-five years for most stocks). However, it is recognised that it may be necessary to amend harvest strategies, for example when there is new information that substantially changes understanding of the status of a fishery, and leads to improved estimates of reference points.

Commonwealth Fisheries Harvest Strategy Policy
8
Reporting and Review AFMA is to report on the implementation of the Policy and of fishery-specific harvest strategies consistent with the Policy in its Annual Reports and otherwise as requested by the Minister for Fisheries, Forestry and Conservation. The Policy is to be reviewed with a report to be provided to the Minister for Fisheries, Forestry and Conservation and the Minister for the Environment and Water Resources within five years of commencement. DAFF will initiate the review and ensure that stakeholders are engaged in the review process.

Commonwealth Fisheries Harvest Strategy Policy
9
Extract from the Ministerial Direction to AFMA The following is an extract from the letter of 16 December 2005 from the Minister for Fisheries, Forestry and Conservation to the Chairman of AFMA, issuing a Ministerial Direction under s91 of the Fisheries Administration Act 1991. Gazetted 20 December 2005, Commonwealth of Australia Gazette No S234.
2. AFMA must take a more strategic, science-based approach to setting total allowable catch and/or effort levels in Commonwealth fisheries, consistent with a world's best practice Commonwealth Harvest Strategy Policy that has the objectives of managing fish stocks sustainably and profitably, putting an end to overfishing, and ensuring that currently overfished stocks are rebuilt within reasonable timeframes, as set out below:
a. Consistent with the United Nations Fish Stocks Agreement, and based on advice from CSIRO and other relevant scientists, the initial setting of the Commonwealth Harvest Strategy Policy, should be:
i. in all Commonwealth fisheries the exploitation rate of target stocks in any fishing year will not exceed that giving the Maximum Sustainable Yield. The catch of target stocks in all Commonwealth fisheries will not exceed the Maximum Sustainable Yield in any fishing year unless otherwise consistent with a scientifically robust harvest strategy designed to achieve a sustainable target level and that does not result in overfishing or overfished stocks;
ii. for the initial and default harvest strategy, reductions in exploitation rate and catch are to be implemented immediately when breeding stocks are assessed to have been reduced below 40% of pre-fished levels, and targeted fishing to cease when breeding stocks are assessed to have been reduced below 20% of pre-fished levels (known as a '20/40' harvest strategy). Alternative harvest strategies may be developed in specific cases where they meet the sustainability objectives and do not result in overfishing or overfished stocks;
iii. the harvest strategy must achieve the objective of avoiding overfishing and avoiding overfished stocks with at least 80% probability (where lack of knowledge about a fish stock precludes decision making with this level of certainty, decisions on catch/units should reflect the application of the precautionary principle); and
iv. noting that for internationally-managed fisheries to which Australia is a party (such as the Southern Bluefin Tuna Fishery and the Heard Island and McDonald Islands Fishery) the relevant international agreement will prevail where it includes an acceptable scientific process for setting sustainable catch levels. In such fora, Australia will advocate its domestic policy settings as an example of best practice.
b. Participate in an expert review of the policy referred to in paragraph 2(a) above which will report to me by 30 June 2006.
• The expert-based review of the above initial settings for the Commonwealth Harvest Strategy Policy will determine if, and by how much, these settings should be amended to ensure that the objectives in relation to sustainability and profitability, overfishing and recovery of stocks are met within specified time limits.
• The expectation is that for some species, the adoption of more conservative harvest strategies with higher stock size thresholds (eg. ‘30/50’ strategies), lower exploitation rates or a higher probability (e.g. 90-95%) of avoiding overfishing will be necessary to achieve these objectives.
• The review will be led by the Department of Agriculture, Fisheries and Forestry (DAFF), will involve relevant bodies, and will be peer reviewed by international fisheries experts.


Guidelines for Implementation of the Commonwealth Fisheries Harvest Strategy Policy September 2007

Guidelines for Implementation of the Commonwealth Fisheries Harvest Strategy Policy
12
Executive Summary
In December 2005 the Australian Government Minister for Fisheries, Forestry and Conservation issued a Ministerial Direction to the Australian Fisheries Management Authority (AFMA) under section 91 of the Fisheries Administration Act 1991 (FA Act). The Ministerial Direction included a requirement for the development of a world’s best practice harvest strategy policy for Commonwealth fisheries and the implementation of harvest strategies consistent with that policy in all Commonwealth fisheries by 1 January 2007 (subsequently amended to January 2008).
Subsequently, the Australian Government Department of Agriculture, Fisheries and Forestry – Australia (DAFF) issued its initial draft Commonwealth Fisheries Harvest Strategy Policy (HSP). The HSP provides a framework for the development of harvest strategies for key commercial species taken in Australia’s Commonwealth fisheries. Key objectives of the HSP are to stop overfishing, to recover overfished stocks, and to promote longer term profitability for the fishing industry.
The HSP reflects key domestic and international legislative and policy obligations for Commonwealth fisheries management. Additionally, it establishes a harvest strategy (HS) framework and default reference points to be applied in Commonwealth fisheries.
This Guidelines document sits between the HSP itself and the implementation of harvest strategies fishery by fishery. The aim of these Policy Guidelines is to provide practical assistance in the development of fishery specific harvest strategies under the HSP, and to illustrate the scope of application of the HSP. The Guidelines should ensure that a common approach and framework is applied across Commonwealth fisheries, to the extent possible for such a diverse set of fisheries.
The Guidelines are intended to support harvest strategy development across the full range of Commonwealth fisheries, including input and output managed fisheries, single and multi-species fisheries, large and small fisheries, and data rich to data poor situations. They also provide important contextual information to assist interpretation of the HSP, and to support harvest strategy development and implementation.
Specifically, the Guidelines provide practical advice to facilitate: i) the interpretation of the HSP; and ii) the application of the HSP to Australia’s Commonwealth fisheries.
It is important to note that the Guidelines provide guidance and are not meant to be prescriptive. Throughout the document, use is made of example boxes to illustrate key points or to provide practical examples.
The Guidelines are organised into a series of Sections.
Sections 2 – 4 are introductory. They provide an overview of the HSP, briefly explain what a harvest strategy is, describe a process for development, outline the key operational objectives of the HSP, and describe harvest strategy design criteria.
Section 5 describes the concept of Maximum Economic Yield: how it should be calculated, used, and revised, and its application to multi-species and multi-method fisheries.
Section 6 briefly outlines the types of management tools available for use in implementing a HS, making the point that harvest strategies can be applied to input-managed fisheries as well as output-managed (e.g. quota) fisheries.
Section 7 describes approaches that can be taken with data poor species and fisheries. The important issues of uncertainty and risk are dealt with in Section 8 and harvest strategies for highly variable species in Section 9.
Section 10 outlines recovery strategies and the key elements of stock rebuilding plans.

Guidelines for Implementation of the Commonwealth Fisheries Harvest Strategy Policy
13
Section 11 provides specific examples of how to turn recommended biological catches from the harvest strategy into management advice such as Total Allowable Catch (TAC) and Total Allowable Effort (TAE), including spatial controls.
Section 12 provides advice on determining harvest strategies for developing fisheries, such that the fishery can develop economically but is controlled to meet the intent of the HSP.
Occasionally there may be circumstances where management action arising from application of a harvest strategy is not meeting the intent of the HSP. Clearly such circumstances should be the exception rather than the rule and examples are described in Section 13.
The technical aspects of Management Strategy Evaluation and its role in identifying and evaluating harvest strategies are outlined in Section 14.
Section 15 describes the process for amending harvest strategies over time.

Guidelines for Implementation of the Commonwealth Fisheries Harvest Strategy Policy
14
1 Introduction
In December 2005 the then Australian Government Minister for Fisheries, Forestry and Conservation issued a Ministerial Direction to the Australian Fisheries Management Authority (AFMA) under section 91 of the Fisheries Administration Act 1991 (FA Act). The Ministerial Direction included a requirement for the development of a world’s best practice harvest strategy policy for Commonwealth fisheries and the implementation of harvest strategies consistent with that policy in all Commonwealth fisheries by 1 January 200710
.
Subsequently, the Australian Government Department of Agriculture, Fisheries and Forestry – Australia (DAFF) issued its initial draft Commonwealth Fisheries Harvest Strategy Policy (HSP). The HSP provides a framework for the development of harvest strategies for key commercial species taken in Australia’s Commonwealth fisheries. Harvest strategies consistent with the HSP will provide the Australian community with a high degree of confidence that commercial fish species are being managed for long-term biological sustainability and economic profitability. It also seeks to provide a more predictable operating environment for the fishing industry. The HSP reflects key domestic and international legislative and policy obligations for Commonwealth fisheries management. The HSP establishes a harvest strategy (HS) framework and default reference points to be applied in Commonwealth fisheries. This set of practical Policy Guidelines have been developed to assist with the implementation of fishery specific harvest strategies under the HSP and to illustrate the scope of application of the HSP and provide guidance on applying the HSP in various fishery circumstances. The Guidelines are intended to support HS development across the full range of Commonwealth fisheries, including input and output managed fisheries, single and multi-species fisheries, large and small fisheries and data rich to data poor situations. Rather than expecting a full quantitative assessment for each species in each fishery, the HSP advocates a risk management approach, whereby exploitation levels reduce as uncertainty around stock status increases. This will ensure fisheries are managed at an acceptable level of risk to the Australian Government irrespective of our level of knowledge. For a low value fishery, AFMA and stakeholders may accept that catches will remain precautionary with supporting fishery research at low levels, to better match the management costs to the business environment for that fishery. Harvest strategies should be applied to key commercial species, of all Commonwealth-managed fisheries. It takes into account mortality resulting from all types of fishing, including state managed and recreational fisheries. The HSP does not necessarily require that all types of fishing be regulated, nor does it prescribe the type of fishery management regulations that will be applied. It is possible that a HS could meet the policy objectives without the need for additional management arrangements or regulations.
1.1 Objectives and structure of the Guidelines
The Guidelines are intended to provide detailed practical guidance for the development and implementation of harvest strategies across the diverse range of Commonwealth fisheries. They also provide important contextual information to assist interpretation of the HSP, and to support HS development and implementation. The Guidelines are not meant to be prescriptive, and are to be interpreted in the light of the HSP.
10 In a subsequent letter to AFMA dated 9 October 2006, the Minister for Fisheries, Forestry and Conservation advised that full implementation of harvest strategies consistent with the revised Harvest Strategy Policy had been extended until January 2008.

Guidelines for Implementation of the Commonwealth Fisheries Harvest Strategy Policy
15
The guidelines are organised into a series of Sections. Sections 2 – 4 are introductory. They provide an overview of the HSP, briefly explain what a HS is and describe a process for development; and outline the key operational objectives of the HSP and describe harvest strategy design criteria. Section 5 describes the concept of Maximum Economic Yield, how it should be calculated, used and updated, and specifically how it applies to multi-species and multi-method fisheries. Section 6 briefly outlines the types of management tools available for use in a harvest strategy, making the point that harvest strategies can be applied to input-managed fisheries as well as output-managed (e.g. quota) fisheries. Section 7 describes approaches that can be taken with data poor species and fisheries. Section 8 deals with uncertainty and risk, and Section 9 harvest strategies for highly variable species. Section 10 outlines stock rebuilding strategies and the key elements of stock recovery plan. Section 11 provides specific examples of how to turn the recommended biological catches from the harvest strategy into management advice in terms of setting TACs and TAEs, including spatial aspects. Section 12 considers advice on determining harvest strategies for developing fisheries such that the fishery can develop but is controlled to meet the intent of the HSP. Section 13 deals with circumstances where management action arising from application of a harvest strategy is not meeting the intention of the HSP. Clearly such circumstances should be the exception rather than the rule and examples are described. Finally, Section 14 outlines the technical aspects of Management Strategy Evaluation and its role in evaluating harvest strategies. Section 15 discusses how harvest strategies should be amended over time.
2 Harvest Strategies
2.1 Introduction A Harvest Strategy (HS) is defined on page 3 of the HSP. Key elements of any HS include:
• a process for monitoring and conducting assessments of the biological and economic conditions of the fishery; and
• rules that control the intensity of fishing activity according to the biological and economic conditions of the fishery (as defined by the assessment). These rules are referred to as control rules (but are sometimes also known as harvest control rules or decision rules).
Monitoring and stock assessment are commonly undertaken in Australian fisheries, but the use of control rules is more recent and is described further below. Stock assessment requires that all forms of fishing mortality be accounted for in the analyses, including recreational catches. The HSP reflects this and when developing a harvest strategy, catches from all fisheries/jurisdictions need to be considered. The experience of good fisheries management indicates that, in general terms:
• fisheries are more efficient, profitable, stable and sustainable, when stocks are larger than the stock size that produces the maximum sustainable yield11
11 It should be noted that maximum sustainable yield is a theoretical maximum that can be taken from a stock in perpetuity.
(referred to as BMSY);

Guidelines for Implementation of the Commonwealth Fisheries Harvest Strategy Policy
16
• future productivity is at greater risk when stocks are reduced to a level where the recruitment of young fish relative to the portion of the stock subject to fishing declines precipitously (referred to as ‘recruitment failure’);
• fisheries should be managed on a whole stock basis, and in a way that takes species life history into account;12
• economic returns can be maximised and in general, overcapitalisation avoided when fish stocks are maintained, on average, at a target adult biomass level equal to the maximum economic yield (BMEY);
13
• if stock sizes fall below BMEY, the associated increase in fishing costs is greater than the increase in fishing revenue, and as such is less efficient.
and
The HSP incorporates the above principles to provide a framework for the development of harvest strategies. The relationship of the HS to the fishery management cycle is shown in Figure 1.
Figure 1: The fisheries adaptive management cycle. The HS is indicated by the shaded large oval. Control rules specify the management actions to be taken in response to assessment information about the current (economic and biological) status of the stock. The form of the control rules will depend on the management tools being used in the fishery (see Section 6 below). If output controls are in use, the control rules will specify the level of catch (e.g. quota) for any given level of stock. Where input controls are used, the control rules will specify the levels of input (effort levels, size limits, season length etc) for a given status of the stock. For new or developing fisheries, control rules may specify interim input or output controls and the monitoring, survey or assessment requirements necessary before these can be changed. Control rules should specify unambiguous management responses, and not simply call for unspecified changes in catch or effort, or further review of the situation. The form of the control rule will also depend on the form and nature of the information available from the assessment. Control rules should be fishery and stock specific. The main criterion for selecting control rules, and harvest strategies, is that 12 Life history characteristics include, among other things, longevity, fecundity and recruitment variability. 13 Economic returns will only be maximised if a management regime is also in place that allows for fishing costs to be minimised and fishing revenue to be maximised.
Fish Stock
Monitoring
Stock Assessment
Management Response
Fishery
Control Rule
Catch
Guidelines for Implementation of the Commonwealth Fisheries Harvest Strategy Policy
17
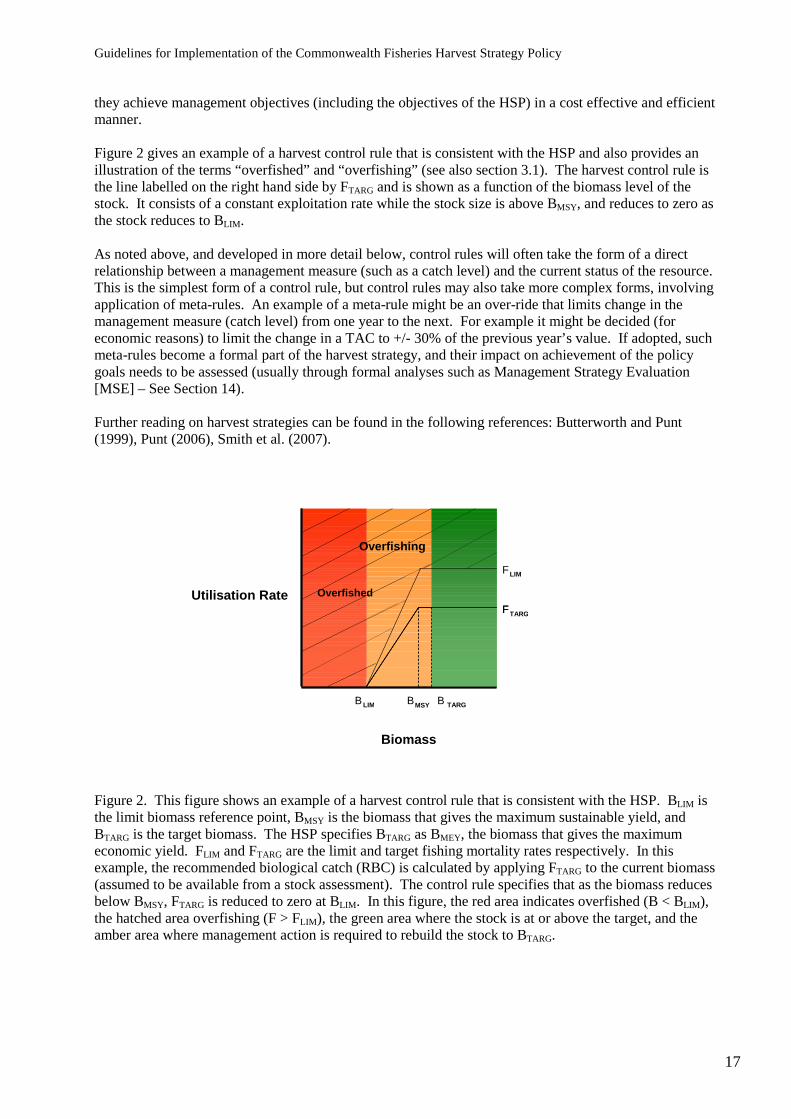
they achieve management objectives (including the objectives of the HSP) in a cost effective and efficient manner. Figure 2 gives an example of a harvest control rule that is consistent with the HSP and also provides an illustration of the terms “overfished” and “overfishing” (see also section 3.1). The harvest control rule is the line labelled on the right hand side by FTARG and is shown as a function of the biomass level of the stock. It consists of a constant exploitation rate while the stock size is above BMSY, and reduces to zero as the stock reduces to BLIM. As noted above, and developed in more detail below, control rules will often take the form of a direct relationship between a management measure (such as a catch level) and the current status of the resource. This is the simplest form of a control rule, but control rules may also take more complex forms, involving application of meta-rules. An example of a meta-rule might be an over-ride that limits change in the management measure (catch level) from one year to the next. For example it might be decided (for economic reasons) to limit the change in a TAC to +/- 30% of the previous year’s value. If adopted, such meta-rules become a formal part of the harvest strategy, and their impact on achievement of the policy goals needs to be assessed (usually through formal analyses such as Management Strategy Evaluation [MSE] – See Section 14). Further reading on harvest strategies can be found in the following references: Butterworth and Punt (1999), Punt (2006), Smith et al. (2007).
Figure 2. This figure shows an example of a harvest control rule that is consistent with the HSP. BLIM is the limit biomass reference point, BMSY is the biomass that gives the maximum sustainable yield, and BTARG is the target biomass. The HSP specifies BTARG as BMEY, the biomass that gives the maximum economic yield. FLIM and FTARG are the limit and target fishing mortality rates respectively. In this example, the recommended biological catch (RBC) is calculated by applying FTARG to the current biomass (assumed to be available from a stock assessment). The control rule specifies that as the biomass reduces below BMSY, FTARG is reduced to zero at BLIM. In this figure, the red area indicates overfished (B < BLIM), the hatched area overfishing (F > FLIM), the green area where the stock is at or above the target, and the amber area where management action is required to rebuild the stock to BTARG.
Utilisation Rate Overfished
Overfishing
F LIM
B LIM
Biomass
B TARG B MSY
F TARG F

Guidelines for Implementation of the Commonwealth Fisheries Harvest Strategy Policy
18
2.2 The relationship between harvest strategies and other management measures Whilst necessarily focused on the management of key commercial species, harvest strategies are also a key element of the Commonwealth’s overall Ecosystem Based Fisheries Management (EBFM) approach. It must be emphasised that implementing a harvest strategy of itself will not achieve ecologically sustainable or profitable fisheries. Other processes are in place in Commonwealth fisheries management to help achieve broader ecosystem objectives, including undertaking comprehensive ecological risk assessments (ERA) accompanied by appropriate risk management responses. The Ministerial Direction provides for further initiatives in support of EBFM, including reductions to bycatch, fishery independent monitoring, and increased focus on spatial management. Harvest strategies, in combination with this package of measures, constitute a whole of government approach to sustainable fisheries management. In meeting all of the outcomes harvest strategies are also required to consider ecosystem interactions. One consideration is the relationship the species has with others in the food web or community, particularly if the harvested species is a keystone species. In such circumstances the biomass reference points described above may be increased to take account of a species’ importance to the maintenance of the food web or community. A contemporary management framework for most commercial fisheries will include a harvest strategy as well as other management tools, often using a combination of input and output controls. Harvest strategies should be developed with due consideration of these other management tools. For example it is possible that Total Allowable Catches (TACs) or Total Allowable Effort (TAEs) recommended under harvest strategies at a stock or regional level may not prevent localised depletion even if overall stock sustainability objectives are achieved. In such cases, tools such as spatial management may need to be implemented separately or form part of the harvest strategy. An increasing focus on the management of discarded or bycatch species also suggests that effective gear controls and spatial management should be carefully considered in the design of single species harvest strategies. The relationship of the Policy and the Environment Protection and Biodiversity Conservation Act 1999 (EPBC Act) is described on page 7 of the HSP and discussed below in Section 3.2.
2.3 Highly Migratory/Straddling or Joint Authority Fisheries Stocks In the case of fisheries that are managed under the joint authority of the Australian Government and another Australian jurisdiction or international management body/arrangement, this Policy does not prescribe management arrangements. However, the Australian Government will negotiate with the relevant body with an aim of ensuring sustainable fisheries by advocating this policy as an example of best practice in setting sustainable catch levels. The Australian Governments position taken to regional fisheries management organisation/arrangement negotiations is underpinned by Australia’s domestic legislative obligations. Therefore it is Australian Government policy to support catch level decisions taken by these organisations and arrangements. In the absence of agreement, Australia’s domestic catch allocation decision would be consistent with the agreed whole of government position14
.
For fisheries issues that are not decided by an international management body or arrangement, DAFF and AFMA will consult on the management arrangements that will apply and AFMA will implement those arrangements.
14 The AFMA Board holds ultimate responsibility in determining TAC levels for all Commonwealth-managed fisheries as per the FMA.

Guidelines for Implementation of the Commonwealth Fisheries Harvest Strategy Policy
19
2.4 Indicators, Performance Measures and Reference Points In the following discussion of harvest strategies, terms such as “performance measure”, “indicators” and “reference points” are used commonly. In broad terms, a performance measure is used to measure progress against (management) objectives, and is a measure of where an indicator (such as stock size) sits in relation to a reference point. The indicator may be some direct observation (such as catch per unit effort - CPUE), or may be estimated using a stock assessment model (such as biomass). The reference point can be either a target (where you want to be) or a limit (where you don’t want to be) and is a particular level of an indicator (Figure 3). The types of performance measures and reference points used reflect the level of knowledge of the species and/or fishery and the sophistication of the assessment.
Figure 3: The relationship between indicators, reference points and performance measures.
2.5 Process for Developing Harvest Strategies In managing Commonwealth fisheries, AFMA adopts a partnership approach through its Management Advisory Committees (MACs), Resource Assessment Groups (RAGs), and other stakeholder consultation groups and processes. These groups will play a key role in developing and reviewing harvest strategies before final approval by the AFMA Board. It is anticipated that each HS will be developed by the appropriate RAG, working group or project team. Draft fishery harvest strategies should be critically evaluated by the Fishery RAG and MAC (Figure 4), taking into account the underlying principles and objectives of the harvest strategy as it relates to the adaptive fishery management cycle, the HS design criteria provided in Section 4, and the objectives stated in the HSP. Figure 5 shows the technical process for establishing harvest strategies.
INDI
CATO
R
TIME
Reference point (target)
Indicator
Performancemeasures
Reference point (limit)

Guidelines for Implementation of the Commonwealth Fisheries Harvest Strategy Policy
20
Figure 4: Flowchart indicating the engagement and consultative process for developing a harvest strategy.
Present to AFMA Board
Revise as appropriate
Present to MACs/AFMA
RAG/project team - draft harvest strategy
Fishery workshops - AFMA/project team plus key stakeholders (e.g. RAGs)
RAG and/or project team develop initial options for HS
Project team or RAG meet with AFMA managers - scope project, expectations, priorities etc.

Guidelines for Implementation of the Commonwealth Fisheries Harvest Strategy Policy
21
Figure 5: Flowchart indicating the technical process for developing a HS.
2.6 Cost Issues The costs of initial development of harvest strategies have been substantially offset by a special funding allocation from the Australian Government as part of the Securing Our Fishing Future package. This funding of $2M per annum for years 2006-07, 2007-08, and 2008-09 has been apportioned relatively
a. Policy setting
b. Management controls
c. Species to be considered
d. Data available
e. Analysis and assessment (existing)
f. Develop limits and targets (consistent with Policy)
h. Develop initial options for harvest control rule (HCR)
g. Operationalise; allocated Tiers if appropriate based on f. & g. above
i. Develop full harvest strategy including monitoring, assessment and HCR
j. Qualitative evaluation j. Full Management Strategy Evaluation (MSE)
k. Implementation (via RAGs, MACs)

Guidelines for Implementation of the Commonwealth Fisheries Harvest Strategy Policy
22
equally between compliance and monitoring, research (primarily harvest strategy development), and improved data collection as envisaged by the Ministerial Direction. The initial development costs for harvest strategies across AFMA’s fisheries are largely covered through the Minister’s $2M per annum allocation. However, the subsequent costs of setting TAC/TAE for stocks and fisheries are not covered through this special funding allocation but are recoverable from Commonwealth fishers in accordance with AFMA’s Guidelines for categorizing research costs in accordance with the Cost Recovery Impact Statement (CRIS) see http://www.afma.gov.au/information/publications/corporate/cris/cris.pdf The incorporation of economics into the management of fisheries is essential given the legislative economic objective. AFMA will seek to ensure that there is economic capacity available to resource assessment groups (RAGs) and management advisory committees (MACs) to assist them to provide adequate advice. Cost effective and efficient fisheries management is one of AFMA’s legislative objectives. Harvest strategies and associated data collection, as well as evaluation processes, must be carefully evaluated against this objective. Initial implementation costs and longer term operating costs should be quantified by the MAC/RAG. These should include implementation costs for alternative management tools if these are an integral part of the proposed HS, as well as ongoing monitoring, research and assessment costs associated with implementation of the HS. Selection of an appropriate harvest strategy for a stock or fishery should involve careful assessment of the costs and benefits (including management costs) of alternative strategies, given that any suitable HS must meet the minimum requirements of the HSP. Once harvest strategies are implemented, ongoing refinement and application of them will be considered as routine fisheries management activities and will also be subject to normal cost recovery processes under the CRIS.
3 Key Operational Objectives of the Harvest Strategy Policy
3.1 HSP Reference Points Harvest strategies for key commercial species taken in Australia’s Commonwealth fisheries will be designed to pursue maximising the economic yield from the fishery, and ensure fish stocks remain above levels at which the risk to the stock is unacceptably high. The HSP specifies minimum standards for reference points as detailed below:
• BTARG (or proxy) equal to or greater than BMEY. In cases where BMEY is unknown, a proxy of 1.2BMSY (or a level 20% higher than a given proxy for BMSY) is to be used15
• BLIM (or proxy) equal to or greater than ½ BMSY (or proxy);
. AFMA may approve the use of an alternative proxy for BMEY if it can be demonstrated that a more appropriate alternative exists;
• FLIM (or proxy) less than or equal to FMSY (or proxy)16
• FTARG (or proxy) at the level required to maintain the stock at BTARG. ; and
15 BMSY is a significant interim goal between stocks rebuilding from BLIM to BTARG. Once a stock has reached BMSY, it is the responsibility of the individual MAC and AFMA board to ensure that the stock is on a trajectory to achieve BMEY. 16 ‘Fish down’ strategies (where FCURRENT>FLIM) are acceptable only where there is strong evidence that stock biomass is well above BTARG and there are effective monitoring arrangements in place to ensure that as BTARG is approached, FCURRENT is reduced to FTARG. For stocks above BTARG, the rate of ‘fish down’ toward the target level will be determined by fishery specific harvest strategies.

Guidelines for Implementation of the Commonwealth Fisheries Harvest Strategy Policy
23
The HSP also requires well defined control rules that determine the level of fishing allowable for a given level of biomass. These control rules should:
• ensure that the fishery is maintained at (on average), or returned to, a target biomass point BTARG equal to the stock size required to produce maximum economic yield (BMEY), or an appropriate proxy (see above);
• ensure fish stocks in the long term will remain above a biomass level where the risk to the stock is regarded as too high, that is BLIM, or an appropriate proxy (see above);
• ensure that the stock stays above the limit biomass level at least 90% of the time (i.e. a 1 in 10 year risk that stocks will fall below BLIM). The 90% probability will form a key performance criterion in evaluating prospective harvest strategies when conducting management strategy evaluation analyses. It is important to note that this is a minimum standard, and that most harvest strategies that achieve the targets on average should perform better than this standard with regard to the probability of exceeding the limits. For highly variable species that may naturally (i.e. in the absence of fishing) breach BLIM, the harvest strategy for these species must be consistent with the intent of the Policy. Stocks that fall below BLIM due to natural variability will still be subject to the recovery measures as stipulated in the HSP; and
• progressively reduce the level of fishing when a stock moves below BMSY and moves toward BLIM.
Harvest strategies that result in higher levels of stock protection than required by the reference points may be developed where it is appropriate and cost effective and efficient to do so. The biomass limit reference point BLIM is a key component in the HSP and will generally play a key role in development of harvest control rules. It defines the point at which a stock will be defined as “overfished”, and the point in the harvest control rule below which there will be no further targeted fishery on that species, and a stock rebuilding strategy has to be set in place. In general, BLIM should correspond to a biomass level, or level of stock depletion, at which the risk to the stock is unacceptably high, for example the point at which recruitment overfishing is thought to occur. Empirical studies of fished species from around the world (Myers et al. 1994) show that this level varies over a considerable range, but a common assumption is that either ½BMSY or B20% (the stock size corresponding to 20% of unfished biomass B0) is a suitable proxy for BLIM. These Guidelines suggest that the proxy for BMSY in the absence of more specific information be 40% of B0, which would also imply that BLIM is at 20% of B0
17
.
It is recognised that the HSP cannot explicitly cater for every possible management circumstance across the diversity of Commonwealth fisheries. The HSP provides for the use of proxy settings for reference points to cater for unique fishery circumstances. This balance between prescription and flexibility will encourage the development of innovative and cost effective strategies to meet key policy objectives. Proxies must ensure stock conservation and economic performance as envisaged by the HSP. Such proxies, including those that exceed these minimum standards must be clearly justified. This justification will be a key consideration when fishery harvest strategies are evaluated for approval by the AFMA Board. For fisheries where data and or knowledge are limited, or the management environment is such that it is not appropriate and/or cost effective to determine MEY, or 1.2 BMSY as its proxy, harvest strategies should be developed that best meet the requirements of the HSP and AFMA’s legislative objectives. In general this will involve maximising fishery level profits whilst meeting ESD and other key management objectives. The justification for adopting a particular target reference point (TRP) will also be carefully considered by the AFMA Board.
17 Note that, for some fisheries, even when BMSY can be calculated, a depletion reference point as a proxy, such as 40% B0, is more likely to meet conservation objectives.

Guidelines for Implementation of the Commonwealth Fisheries Harvest Strategy Policy
24
For those stocks that do not meet the requirements of the HSP by 1 January 2008 – i.e. those stocks that are expected to be below the adult biomass limit reference point as at 1 January 2008, the HSP states they will be subject to transitional arrangements. Targeted fishing for any of these stocks, not currently subject to zero catch, need not be reduced immediately to zero, but management actions shall be directed to rapid rebuilding of these stocks. These transitional arrangements will apply for no more than one year and the HSP will apply to all stocks in full from 31 December 2008, which means that targeted fishing of key commercial species below BLIM will cease as of 1 January 2009.
3.2 Stock Rebuilding For a stock below BLIM, a rebuilding strategy18
will be developed to rebuild the stock to BTARG. Once such a stock is above BLIM it may be appropriate for targeted fishing to re-commence in-line with the stock rebuilding strategy and HS. The extent of breach, and the status of other stocks of the same species, will influence consideration of whether a given species or stock may be eligible for listing as ‘conservation dependent’, ‘vulnerable’ or a higher threat category under the EPBC Act.
For stocks above BLIM but below the level that will produce maximum sustainable yield (BMSY) it is necessary to first rebuild stocks to BMSY. Once stocks are above BMSY, rebuilding shall continue toward BTARG however the rate of rebuilding may be slower and shall be determined in a way that considers the appropriate balance between short term losses and longer term economic gains. While a species/stock biomass is above BLIM there is no expectation that the species/stock would be added to the list of threatened species (conservation dependent, vulnerable, endangered or critically endangered) under the EPBC Act. If the species/stock biomass is, at or below BLIM it may be the subject of action under both the fisheries and environment legislation as the risk to the stock is now regarded as unacceptably high.
If an AFMA developed stock rebuilding strategy was in place, of which the cessation of the strategy would adversely affect the conservation status of the species, consideration may be given to listing the species in the conservation dependent category. An adequate rebuilding strategy is likely to be one with the characteristics of a recovery plan that would provide for the research and management actions necessary to stop the decline of, and support the recovery of, the species concerned.
If the stock biomass falls more substantially below BLIM, there is an increased risk of irreversible impacts on the species. As such the species will likely be considered for listing in a higher threat category (i.e. vulnerable, endangered or critically endangered). A listing under such categories may, in accordance with the EPBC Act, require development of a formal recovery plan.
For a conservation dependent listed species, were the rebuilding strategy to prove unsuccessful in meeting the interim targets and the biomass were to fall more substantially below BLIM, (where there is an increased risk of irreversible impacts) then the species would likely be considered for listing under a higher threatened species category.
Where the biomass of a listed species/stock is rebuilding toward to BTARG, consideration may be given to deleting the species from the EPBC Act list of threatened species, or amending the category it is in. Deleting a species from the list of threatened species under the EPBC Act is effected via a legislative instrument issued by the Minister for the Environment and Water Resources. Advising the Minister that a recovering species that has rebuilt above BLIM should be considered for delisting will be the responsibility of AFMA on the advice of the AFMA Board, however any person can initiate the process. The relevant
18 Rebuilding strategy to be developed by AFMA and agreed to by the Minister for the Environment and Water Resources.

Guidelines for Implementation of the Commonwealth Fisheries Harvest Strategy Policy
25
sections of the EPBC Act, primarily Part 13, will apply for any listing, amending, or deletion of a species in the list of threatened species. In situations where the adult biomass of a particular stock is greater than or equal to BTARG, AFMA will have a high degree of discretion in how that stock is managed. AFMA will continue to have flexibility in the management of a particular stock where the adult biomass is between BTARG and BLIM. When the stock is below BTARG the management response will be to set the control rules to take the stock back towards BTARG. The best available science will underpin all key decisions in the application of the HSP and relevant provision of the EPBC Act. Stakeholders will be well informed and Government agencies will ensure transparency. See also section 10. The relationship of the Policy and the EPBC Act is summarised below:
3.3 Multi-species fisheries In fisheries that target or catch a number of species (e.g. those using less selective gears such as trawling and longlining), it will be extremely difficult to maintain all species at the TRP because not all species can be effectively targeted and some species will be caught as incidental catches of the main target species. Importantly, MEY applies to the fishery as a whole and is optimised across all species in the fishery. As a result, some secondary species (e.g. lower value species) may be being fished at levels that will result in their biomass remaining below their target biomass reference point (i.e. BMEY). In such circumstances, the estimated biomass of these secondary species must be maintained above their limit reference point, BLIM. Consideration should also be given to:
• demonstrating that economic modelling and other advice clearly supports such action; • no cost-effective, alternative management options (e.g. gear modification or spatial management)
are available; and • the associated ecosystem risks have been considered in full.
Such an approach would be consistent with the intent of the HSP (See also Section 5.4).
BTARG
Strong economic performance. High stock resilience. No expectation to undertake consideration of listing as threatened species under EPBC Act
No expectation of listing under the EPBC Act but harvest strategy in place to rebuild towards BTARG
BLIM Eg
Conservation Dependent Targeted catch set to zero. AFMA managed stock rebuilding strategy in place. May be listed as conservation dependent under the EPBC Act.
0.75BLIM Listed Threatened Species Markedly increased risk of irreversible impacts on the
species. Likely consideration of listing as vulnerable, endangered or critically endangered under the EPBC Act. Such a listing may require development of a formal recovery plan under the EPBC Act.
Guidelines for Implementation of the Commonwealth Fisheries Harvest Strategy Policy
26
4 Harvest Strategy Design Criteria
In addition to meeting the technical and operational requirements of the HSP, harvest strategies are required to meet a range of important design and implementation criteria. Many of these relate to efficient administrative and regulatory practice. They are detailed below.
4.1 Efficient and cost effective The operational and regulatory framework associated with managing a fishery under a harvest strategy approach must be cost effective and efficient whilst achieving the objectives of the HSP to the required standard. The HS must be developed to suit the management context of the fishery involved, having particular regard to the profitability of the fishery, the state of knowledge with respect to stock status and broader environmental impacts, the current and strategic business environment for the fishery, and other relevant factors.
4.2 Consistent with ESD principles The principles of ecologically sustainable development are provided in Section 3A of the Commonwealth’s Fisheries Management Act 1991. They require that:
• decision-making processes should effectively integrate both long-term and short-term economic, environmental, social and equity considerations;
• if there are threats of serious or irreversible environmental damage, lack of full scientific certainty should not be used as a reason for postponing measures to prevent environmental degradation;
• the principle of inter-generational equity: that the present generation should ensure that the health, diversity and productivity of the environment is maintained or enhanced for the benefit of future generations;
• the conservation of biological diversity and ecological integrity should be a fundamental consideration in decision-making; and
• improved valuation, pricing and incentive mechanisms should be promoted.
4.3 Maximise the net economic returns to the Australian community To ensure that the Australian community receives the maximum benefit from the exploitation of fishery resources, regulatory decisions, including in this case the nature of harvest strategies, should be made within a process where the full costs and benefits of alternative approaches are considered. There are two key aspects to maximising the profitability of a fishery for which AFMA has responsibility to implement. The first is that catch is set at the level (MEY) that maximises the return created in the fishery over time. The second is that for this given level of catch, fishing costs are minimised and revenues maximised. Detailed advice on the incorporation of economic efficiency measures within fishery harvest strategies is included in Section 5: “Economics and harvest strategies”.
4.4 A high level of transparency in decision making This principle requires that there is full consultation and disclosure of information with relevant parties that will be affected by the ongoing application of harvest strategies in Commonwealth fisheries. In general terms, this principle reflects the importance of affording procedural fairness to affected parties. Other key aspects include objectivity, consistency, and timeliness in communicating decisions. It should also be noted that the AFMA Board retains its role as the decision maker in setting catch or effort units in Commonwealth fisheries.
4.5 A high level of confidence that objectives will be met In addition to meeting the probability requirements of the HSP with respect to maintaining stocks at target levels and avoiding depletion to limit reference point levels, the application of this principle to harvest

Guidelines for Implementation of the Commonwealth Fisheries Harvest Strategy Policy
27
strategies will require that they are robust to the uncertainty inherent in the assessment and management of fisheries. This principle also requires that some form of MSE is conducted for each HS (see Section 14). Regular monitoring of HS performance against key objectives of the HSP is also required.
4.6 Taking species’ life history into account The HSP recognises that each stock/species/fishery will require an approach tailored to fishery circumstances, including species characteristics. This is particularly relevant in the context of setting Target and Limit Reference Points consistent with the objectives of the HSP, and in developing stock specific stock rebuilding strategies and stock recovery plans for overfished stocks. This principle recognises that some stocks are significantly less productive than others, and that these less productive stocks should be managed more conservatively to avoid over-fishing, and to ensure stock recovery within acceptable timeframes for depleted stocks. It also recognises that some stocks are highly productive, or are naturally variable in the absence of fishing, and need to be dealt with appropriately.
5 Economics and Harvest Strategies
5.1 What is MEY? Economic considerations are important in determining appropriate targets for a harvest strategy. Economic efficiency in a fishery implies that that the fish stock is protected and that the net returns (profits) of fishers are maximised. This occurs when the sustainable catch or effort level for the fishery as a whole maximises profits. This point is referred to as maximum economic yield (MEY). However, economic efficiency will only be ensured if a management regime is also in place that allows for fishing costs to be minimised and fishing revenue maximised at the given MEY catch level. That is, two conditions must be met simultaneously to achieve economic efficiency in a fishery:
• MEY catch level is set. This will account for the impact of current catches on future fish stocks, catches and fishing costs.
• A management regime is in place that allows fishers to apply the appropriate level of inputs in a fishery. This will help ensure that fishing costs are minimised and fishing revenue maximised for the given MEY catch level.
These Guidelines are focused on the first condition: MEY. MEY depends on a combination of biological and economic factors. In particular, it depends on the relationships between harvest, stocks and recruitment and on the way in which fishing behaviour, revenue and costs relate to those factors. A simplified static representation of these relationships for a single stock is shown in Figure 6, where it is assumed that there is no uncertainty about the state of nature. When a real bio-economic model is built, it is dynamic and the underlying biological data from the stock assessment are used. However, Figure 6 highlights the general conclusions regarding MEY. Figure 6 illustrates a typical surplus production model for a fishery as a whole. The vertical axis is dollar amounts and the horizontal axis measures fishing effort (for example, nominal fishing days). The total revenue curve is drawn from a sustainable yield curve. That is, the sustainable yield is multiplied by the price of fish. Initially each unit of fishing effort increases the total catch and revenue. However, because the size of the fish stock is being reduced, the extra catch (and hence extra revenue) taken by each additional unit of fishing effort will progressively reduce. There is a point where the additional unit of effort will not increase the total catch and total revenue any further — this is the point of maximum sustainable yield (MSY). At still higher levels of fishing effort total catch and total revenue is reduced. This is because the increased fishing effort impacts the whole fishery — the biomass size is reduced and consequently catch per unit of effort is reduced.

Guidelines for Implementation of the Commonwealth Fisheries Harvest Strategy Policy
28
The total cost curve is assumed to be increasing and linear in effort. These costs include payments for wages, fuel, repairs, etc as well as depreciation and a normal return on capital invested in the fishery.
Figure 6: Maximum economic yield (see text for explanation).
MEY occurs at the effort level that creates the largest difference between the total revenue and total fishing costs, thus maximising profits. The level of effort that corresponds with MEY will change given a change in any of the following factors:
• fish prices; • exchange rates; • input costs (fuel, gear, etc.); and • other factors such as changes in fishing technology and management controls.
In an open access fishery or where the level of effort set is well beyond MSY, all fishers acting in their own interest are induced to fish more, but because they do not take into account the effect of their fishing activity on other fishers in the fishery — including the increased cost of harvesting because of stock depletion — all fishers are eventually worse off. For illustrative purposes, assume that the initial effort level in a fishery is EA, where economic returns are positive. At this point, economic profits are relatively large because the stock is ‘thick’ so fish are easy to catch. This means less time is spent fishing and costs are lower. Large economic profits induce new fishers to enter and those already fishing to expand their effort. This process continues so long as economic returns remain positive, all the way to effort level EOA, where total revenue is just equal to total costs. There is no incentive for one fisher to reduce their effort because the profits this would create will be dissipated by another fisher expanding their effort. Point EOA is undesirable for two reasons: first, because economic returns are zero and, second, because it would have been possible to obtain greater catch with less effort, greater profits and larger stocks at point EMEY. When left unmanaged or significant latent effort is present, effort in a fishery will not gravitate naturally to a point where economic efficiency is maximised. The level of effort that enables profits to be maximised is EMEY. At EMEY, the difference between total fishery revenue and total fishing costs is greatest, so economic profits are maximised.
$
Fishing effort
Low stocks High stocks
RMEY
EMSY EMEY
Total fishing costs
Maximum profit
RMSY
Total fishing revenue
ROA
EOA EA

Guidelines for Implementation of the Commonwealth Fisheries Harvest Strategy Policy
29
5.2 Calculating MEY In cases where the stock recruitment relationship and economic parameters can be estimated with a reasonable degree of certainty, a bio-economic model can be used to help determine MEY (see northern prawn example below). Bio-economic models are usually optimisation models. That is, they are used to estimate a set of control variables, such as fleet size or aggregate catch, that maximise a given variable, such as profit.
ABARE has calculated the ratio of BMEY to BMSY for several of the stocks in the Commonwealth trawl sector of the southern and eastern scalefish and shark fishery (see Box below). Estimates of this ratio vary from 1.03 for tiger flathead to 1.47 for Cascade Plateau orange roughy.
Calculating MEY — an example from the northern prawn fishery Maximum economic yield (MEY) estimates for the Northern Prawn Fishery (NPF) are obtained from a bioeconomic model that combines stock assessment parameters with a profit function. The profit function measures the difference between the discounted total revenue and the total costs of fishing. The revenue function contains a harvest relationship that accounts for the effect of different stocks of prawns, given changes in fishing effort, on harvest. Key economic parameter values have defined mean values, drawn from ABARE survey data, as well as standard deviations to partially account for the effect of uncertainty. In the NPF, MEY estimates are obtained for both brown and grooved tiger prawns. Endeavour prawns are treated as an ‘economic bycatch’, adding to revenues but not the costs of fishing. Banana prawns are not accounted for in the model. Model output generates measures of the stock of prawns at MEY to the stock of prawns at maximum sustainable yield, along with measures of optimal effort and catch at MEY. An updated version of the model developed by ABARE and CSIRO now calculates the dynamic MEY value, that is, the economically optimal pathway to reach the MEY value. Results are presented at NORMAC each year. The model is calibrated for the current price of prawns, the cost of fuel and all other major input expenditures. Model results are also generated based on 3 to 5 year forecasts of the price of prawns and the cost of fuel, with annual updates. ABARE’s bioeconomic model of the tiger prawn component of the northern prawn fishery indicates that the current (2006) biomass of brown tiger prawn stocks is below the level associated with MSY. The ratio of biomass size at MEY (BMEY) to biomass size at MSY (BMSY) for brown tiger prawns is estimated to be 1.54. That is the biomass at MEY is estimated to be 1.54 times the biomass at MSY. Also the calculated optimal number of days fished per boat is 110 days, which results in an MEY target of approximately 50 boats.

Guidelines for Implementation of the Commonwealth Fisheries Harvest Strategy Policy
30
For data-poor fisheries, estimates of MSY are often not possible. In cases where estimates of B0 are available, but estimates of MSY are not, the HSP identifies B40 as a proxy for MSY. For many species, this proxy is likely to be an over or under estimate of the actual MSY for that stock. When BMEY is unknown, the HSP sets the proxy of BMEY = 1.2 BMSY. While this may over or underestimate the true value, if the unit cost of catch is dependent on the size of the stock, and practical discount rates apply, BMEY will always be larger than BMSY. In most cases, MEY occurs at higher biomass levels than at MSY. In cases where it can be demonstrated that BMEY is less than 1.2BMSY, then such a target could be used. It is important that consideration is given to the costs associated with determining more accurate estimates of MEY. It is possible that any benefits (particularly for low value species) from
Calculating MEY— an example from the Commonwealth trawl fishery ABARE has constructed a bioeconomic model of selected stocks for the Commonwealth trawl sector of the southern and eastern scalefish and shark fishery. Solutions to the bioeconomic model are obtained by maximising the discounted profits subject to a specification for harvest functions — the production function mapping fishing inputs to the harvest of fish — and the appropriate stock-recruitment relationship. All initial conditions for biomass are taken from virgin biomass measures provided by CSIRO. The results of the model are preliminary and the model likely requires further calibration based on biological studies and economic data. The results of the model are in two forms:
• Harvests and stocks in steady state (that is optimal harvests after stock rebuild)
• Harvests during the rebuild phase.
The preliminary results indicate that for four of the major stocks (orange roughy, pink ling, spotted warehou and tiger flathead) considerable stock rebuilding is required to maximise profits (table 1). That is, historical levels of harvest and fishing effort have resulted in current stock sizes that are below the stock level BMEY. Also in table 1 the stock level associated with MEY relative to MSY is shown and for each species BMEY is above BMSY. The optimal harvests at the steady state are also shown in table 1. However, during the rebuild phase, harvests need to be set lower than 2004 catch levels to allow the stock to rebuild to BMEY.
Table 1: Results of bioeconomic model of the Commonwealth trawl sector of the southern and eastern scalefish and shark fishery. Species BMEY/BCUR BMEY/BMSY Optimal
harvest at steady state (MEY)
Initial harvest TAC during rebuild *
Harvest (2004)
tonnes tonnes tonnes
Orange roughy – Cascade 1.64 1.47 995 665 1600
Spotted warehou 1.30 1.08 4117 3114 4100
Pink ling (trawl) 1.80 1.29 1397 914 1073
Tiger flathead 1.05 1.03 3830 2980 3200
* This is the initial TAC during the rebuild phase. The TAC will increase through time over the rebuild period up to the optimal TAC at steady state.

Guidelines for Implementation of the Commonwealth Fisheries Harvest Strategy Policy
31
a more accurate estimate of MEY would be outweighed by the costs of calculating it. In addition, if little is known about the biology or economics of a stock, then it is likely that the more conservative target of 1.2BMSY is appropriate. In some cases, future catches at MEY will be higher than current levels. For example, the bioeconomic work conducted for the SESS indicates that long run MEY harvest of flathead is around 3800 tonnes per year, which is higher than the current TAC and catches. While it might be the case that long run optimal catches are higher than current levels, it will be the case that catches will need to be reduced for a period to allow stocks to rebuild to those levels. This will impact negatively on fishing revenue and profits during this period, but the higher future profits will more than offset this short term loss. The following provides examples of the implication of using a proxy 1.2BMSY. Empirical results based on recent stock assessments for 5 SESSF quota species (see table below) show the expected reduction in long term replacement yield in moving from BMSY to BMEY (40% B0 to 48% B0, the latter approximating 1.2 BMSY) for several key shelf, upper slope and mid slope species.
SPECIES/STOCK % REDUCTION IN CATCH
Blue grenadier 11
Pink ling 10
Eastern Zone orange roughy 11
Flathead 9
Morwong 9
These results show that, in the long term, the reduction in catch (sustainable yield) is on the order of 10%. Further, if it is assumed that CPUE increases in proportion to biomass, then CPUE should increase by 20% in moving from 40% B0 to 48% B0, which, for a 10% reduction in catch, would imply that the effort to achieve this catch would decrease by 25% (EMEY/EMSY = 0.9/1.2 = 0.75). Put another way, 90% of the MSY catch can be achieved with only 75% of the effort at (the suggested proxy for) MEY. This reinforces the longer-term economic benefits of MEY as the TRP.
5.3 How often should MEY be updated? MEY is a dynamic concept — changes to fishing costs and fish prices will result in MEY changing both within and between seasons. However, it is not likely to be feasible or worthwhile to adjust MEY with respect to short term or temporary fluctuations in factors affecting MEY. Rather, basing MEY around expectations of future values of key factors (fish prices and fishing costs) over the medium term (3-5 years) would seem appropriate for most fish stocks. If major changes occur to factors affecting MEY in the interim, such as a significant change in the diesel price or exchange rate that were unexpected, then a review could be conducted and MEY adjusted if necessary. For shorter lived species such as prawns and squid, a shorter time horizon may be more appropriate.
5.4 MEY in multi-species/multi-method fisheries Where multiple species are normally caught together, the question is raised as to how to set harvest levels for individual species. While several species may be caught at the same time, they are likely to have different biological and economic characteristics. If harvest strategies are determined for each species in isolation, it is possible that the harvesting of one species in accordance with the TRP would lead to harvests (and hence biomass) inconsistent with the TRPs for other species. Therefore, in a multi-species fishery it is important that harvest strategies for species be determined in conjunction with each other. Given the different biology and economic characteristics of different species, there are likely to be trade-offs between the profits of different species. By optimising MEY across the fishery, some individual stocks may be below BMSY. That is, in order to maximise the overall profits of a fishery, it may

Guidelines for Implementation of the Commonwealth Fisheries Harvest Strategy Policy
32
be necessary to forego some profits of one species in order to generate higher profits from another. Note that the estimated biomass of all species must be maintained above their limit reference point, BLIM. Maximising the profit of the combined catch (subject to environmental constraints) may be a complex task given the uncertainty of the catch composition between shots or seasons, but is one that must be faced irrespective of the TRP. MEY in a multi-method fishery can be calculated by considering the differences in the cost and revenue structures of each sector of the fishery.
6 Management Tools
Harvest strategies have most commonly been applied to TAC-managed fisheries and whilst output controls in the form of Individual Transferable Quotas (ITQ’s) within a TAC framework remain the government’s preferred management approach they are nonetheless one of many potential fishery management tools or levers. Harvest strategies can be developed using input controls as well and this will be the case for some fisheries. Input or output controls may be used as:
• the primary harvest strategy tool within a fishery; • one of a suite of input/output controls within a harvest strategy; and • a separate management tool outside of a harvest strategy, and often to meet broader EBFM
objectives. Within harvest strategies the management response to decision rules should reflect management objectives related to that particular management circumstance. For highly depleted stocks this response will be focused on rapidly reducing risks to stocks and the dependant fisheries. As stated in Section 2 above, the decision rule and its management response should be clear and effective. Ambiguous decision rules should be avoided. The remainder of this section illustrates various approaches to decision rules and harvest strategies using real examples from Australia and overseas. Note that these examples are illustrative – the control rules in these examples are not necessarily consistent with the Commonwealth Harvest Strategy Policy. The South Australian Pilchard Fishery (as described in Example Box below) is a useful example of an output-managed fishery with a well-defined series of decision rules governing the setting of an annual Total Allowable Commercial Catch (TACC). In this case the rules are a function of two aspects of the state of the stocks – the current biomass and the strength of recent year classes. The management tools used for a fishery will vary depending on the extent, timeliness, and quality of data available. There is also a strong connection between the fishery’s management objectives, the selection of appropriate management tools, the data strategy and supporting research and scientific work, and the available resources. All should be carefully considered in the context of the fishery concerned, including its economic performance. The Falkland Island squid fishery (Example Box) illustrates the application of a harvest strategy to a short lived species. Within-season monitoring and analyses are used to change season length, and the incorporation of target reference points related to escapement (the proportion of the stock remaining unharvested at the end of the fishing season) are used to set fishing effort levels at the start of the season. One form of analysis is undertaken while fishing is occurring, and once the season is closed a full post-season assessment occurs. Management controls and levers can also be combined, as illustrated by the Tasmanian Scallop fishery (Example Box), which combines a TAC with rotational spatial management (note that this is not currently implemented as a formal Harvest Strategy). Alternatively, a series of simple decision rules may be invoked using a suite of indicators derived from fishery data. The Example Box below illustrates the decision rule proposed for the Eastern Tuna and

Guidelines for Implementation of the Commonwealth Fisheries Harvest Strategy Policy
33
Billfish Fishery/Western Tuna and Billfish Fishery, Tier 3-4 fisheries for which no formal local stock assessments exist.
South Australian Pilchards: TACC To set the total allowable commercial catch (TACC) two performance indicators are used:
• Estimate of spawning biomass derived from an annual egg survey (termed the daily egg production method DEPM).
• Presence of age classes. The decision rules are:
• If the estimate of spawning biomass is less than 100,000 the TACC should be set at 10% of the spawning biomass or at 5000 t (which ever is greater).
• If there is evidence that the 2 and 3 year old age classes are weak or of average strength (e.g. < 40% of the catch) and the estimate of spawning biomass is between 100,00 and 150,000 t then the TACC should be set at 10% of the spawning biomass.
• If there is evidence that the 2 and 3 year old age classes are strong (e.g. > 40% of the catch) and the estimate of spawning biomass is between 100,00 and 150,000 t then the TACC should be set at 12.5% of the spawning biomass.
• If there is evidence that the 2 and 3 year old age classes are weak or of average strength (e.g. < 40% of the catch) and the estimate of spawning biomass is between 150,000 t and 250,000 t then the TACC should be set at 12.5 % of the spawning biomass.
• If there is evidence that the 2 and 3 year old age classes are strong (e.g. > 40% of the catch) and the estimate of spawning biomass is between 150,000 t and 250,000 t then the TACC should be set at 15 % of the spawning biomass.
• If there is evidence that the 2 and 3 year old age classes are weak or of average strength (e.g. < 40% of the catch) and the estimate of spawning biomass is greater than 250,000 t then the TACC should be set at 15 % of the spawning biomass.
• If there is evidence that the 2 and 3 year old age classes are strong (e.g. > 40% of the catch) and the estimate of spawning biomass is greater than 250,000 t then the TACC should be set at 17.5 % of the spawning biomass.
For further information, see Shanks (2005)

Guidelines for Implementation of the Commonwealth Fisheries Harvest Strategy Policy
34
Falkland Island squid: input controls and within-season control rules
• A limited entry, input controlled fishery. The major annual effort control mechanism is in-season management (through changing the season length) (two fishing seasons per year).
• Pre-recruit surveys are not feasible: no estimate of stock size based on new data is available prior to fishing. The season is shortened or lengthened based on reference points for the two target species.
• Initial target reference point: proportional escapement should not fall below 40% (proportional escapement defined as the ratio between the number of spawners surviving under a given level of fishing mortality, and the number of spawners under no fishing mortality).
• Target subsequently changed to absolute escapement levels. In years that the spawning stock levels fall below threshold levels, the season is closed early.
• Before the start of the season, when the recruitment size is unknown, fishing effort levels are based on historical average recruitment and past escapement levels. Once fishing commences, daily reporting from fishing vessels allows almost real time stock assessments using modified Delury depletion models. Once the season is closed, post season assessment is undertaken with the full data set.
• There are ooccasions where catch rates for one species increase at the end of a fishing season, which is contrary to the assumptions behind the Delury methodology of a closed population. Modifications of this closed population assumption have been developed and tested, but no easy solution was found. In years where the depletion method does not work, annual trends in catchability coefficients together with individual vessel CPUE data are used to estimate stock size. Fishing effort is adjusted at six monthly intervals to reflect recommendations from revised stock assessments. This Delury method has now been adapted in a Bayesian framework and therefore uses priors for, amongst others, catchability.
For further information, see Barton (2002) and Basson et al. (1996).
Tasmanian Scallops: rotational management with TAC The fishery is managed by opening specific scallop beds on a rotational basis, while the remainder of the fishery remains closed. Rotational management allows for i) automatic high escapement, and ii) at least 3-4 years for the scallops to grow. To establish which beds are to be opened, a system of surveys undertaken by industry volunteers (bonus quota incentive) are undertaken: 1) Broad area surveys on size, condition and distribution. These surveys occur on a 3-4 year rolling
rotation and enable management to determine which beds are to be opened. A 3-4 year rotating system applies in that the beds identified here are opened at a rate of one or two per year, commencing with those in the best condition. Note that this obviously requires at least 3 beds to be identified as being in a fishable condition, otherwise there is no benefit to be had from rotation, unless a bed is sufficiently big that it can be subdivided.
2) Prior to an identified bed potentially being opened for the year, a second, fine-scale pre-season
survey is conducted whereby scallop condition (meat weight and roe size) is checked. If scallop condition is sub-optimal, industry have taken the initiative and not fished the bed remains until conditions improve.
Industry have also included an approach where they subdivide the bed and thoroughly fish each section before moving on to the next – this improves the overall scallop condition to the processor and appears to maximise the yield, as opposed to cross-sectioning the entire bed and wasting scallops through damage.

Guidelines for Implementation of the Commonwealth Fisheries Harvest Strategy Policy
35
7 Dealing with Different Levels of Information, Assessments and Data Poor Species It is recognised that information about many stocks is limited or uncertain, and that it may not be possible to make direct use of the target and limit reference points described in the HSP. Where only moderate or poor information is available, scientifically defensible proxies for reference points and corresponding control rules to achieve the intent of the HSP will need to be specified. Where information to quantify
Eastern and Western Tuna and Billfish Fisheries (ETBF/WTBF) draft harvest strategy: RBC/TAE via decision tree based on simple CPUE decision rule and further modified according to size-based indicators Recommended biological catch is determined via a simple Tier 4 (see Section 7) CPUE-based decision rule of the form RBC = (1 + α * slope-to-target) * CCUR, where CCUR is the CPUE trend for prime-sized fish over recent years (currently the last 5 years). The slope-to-target term considers the recent CPUE trend in the context of a target CPUE to be achieved within a specified timeframe (currently 5 years). The RBC is then adjusted according to information obtained from size-based indicators, specifically the catch rates of old (CPUEold) and young fish (CPUErecruits) and the proportion of old fish (PropOld) in the catch. The latter is included as an indicator that is independent of any bias that may be associated with CPUE. CPUEold and PropOld are compared to reference values corresponding to 40% of virgin spawner biomass per recruit (obtained from a simulation), while recent trends in CPUErecruits are considered. The schematic below illustrates the decision tree framework:

Guidelines for Implementation of the Commonwealth Fisheries Harvest Strategy Policy
36
risk levels is unavailable, a precautionary approach will be taken to fishery management leading to more conservative outcomes to account for the uncertainty. Where information is generally good, but insufficient to reliably estimate BMSY or BMEY and associated reference points, the HSP specifies that the following proxies will apply:
• the proxy for BMSY will be equal to or greater than 40% of the adult biomass (B0) that would occur on average in the long term (under prevailing environmental conditions) if there was no fishing mortality; and
• the proxy for FMSY will equal the fishing mortality rate that reduces the spawning output of a fishery on average to 40% of the output if there was no fishing mortality.
Additionally, there will be situations where neither BMSY nor B0 can be estimated. In such cases alternative approaches to setting proxies for reference levels will need to be formulated and applied using the available information. The HSP does not prescribe default proxies for such cases, as these will need to be fishery specific, including in the case of developmental fisheries. However, the settings will need to be consistent with the HSP and the precautionary approach, and tested using MSE approaches (see section 14). Having little information regarding the biological and economic characteristics of a stock does not necessarily justify that additional information be collected. The benefit of collecting further information needs to be set against the cost of collecting the additional information (see box on ‘Investment in information’ below for more detail). A tiered approach to control rules is encouraged in order to cater for different levels of certainty (or knowledge) about a stock (e.g. Smith and Smith 2005, Goodman et al, 2002). Such an approach provides for an increased level of precaution in association with increasing levels of uncertainty about stock status, such that the level of risk is approximately constant across the tiers. In this approach, each species is assigned to one of a number of Tier levels depending on the amount and type of information available to assess stock status, where Tier level 1 represents the highest quality of information available (e.g. a robust quantitative stock assessment). Consistent with the above, target exploitation rates will decrease as Tier levels increase. For example, Figure 7 shows a possible relationship between the TACs for higher tier levels expressed as a percentage of Tier 1 TACs.
0
20
40
60
80
100
1 2 3 4
Tier
%TA
C
Figure 7: Theoretical example of the relationship between the TAC for higher Tier Levels as a percentage of a Tier 1 (high information) TAC.
An example of the use of a Tiered approach to harvest strategies is the Southern and Eastern Scalefish and Shark Fishery (SESSF) – see Box below. In this fishery there are 34 stocks or species groups under quota management, and the harvest strategy framework developed and first applied in 2005 consists of

Guidelines for Implementation of the Commonwealth Fisheries Harvest Strategy Policy
37
four Tiers. Each stock is assigned to a Tier based on the quality of information available to assess stock status, and the control rules associated with each Tier are designed to be increasingly precautionary as the Tier level increases (uncertainty increases). Whether the Tier rules do act in this precautionary manner is being tested using MSE. The Tier 3 and 4 control rules in the SESSF HSF are but two examples of the type of approach that can be taken when full quantitative stock assessments are not available. An approach used in many fisheries is based on spawning stock biomass per recruit (SSBR). Specifically, a target fishing mortality is set that reduces the SSBR to some percentage of unfished levels (assuming constant recruitment). A fishing mortality that reduces SSBR to 50% (F50) would in general be consistent with the target provisions of the HSP. Information requirements are similar to that for Tier 3 in the SESSF example above:
• estimates of natural mortality M; • selectivity ogive (e.g. from catch curves); • size/age at first maturity; • weight at age or fecundity and maturity ogive if available; and • an estimate of current fishing mortality rate FCUR (e.g. from a catch curve).
The ratio of F50 to FCUR could be used as a basis for determining the RBC. There are many examples of triggers currently used in Australian fisheries that could be considered as part of a harvest strategy in data poor situations (see also section 12 on Developing Fisheries). Some examples of such triggers are given below, based on a variety of easily obtained fishery-dependent indicators such as catch, effort and size composition of the catch:
The SESSF 4 Tier Harvest Strategy Framework Adopted a 4 Tier system
– Tier 1: robust quantitative assessment – Tier 2: preliminary quantitative assessment – Tier 3: estimates of F from catch curves (age/length data) – Tier 4: trends in CPUE
Each Tier has its own harvest control rule which is used to determine a recommended biological catch (RBC). The RAGs advise on which species and stocks belong at which Tier level, with these decisions reviewed by SESSFRAG. The RBCs provide the best scientific advice on what the total kill (landings plus discards) should be for each species/stock and are used to advise on TACs. • Tier 1: FTARG = F40, BTARG = B40, RBC = Catch[FTARG BCUR] • Tier 2: FTARG = F50, BTARG = B50, RBC = Catch[FTARG BCUR] • Tier 3: RBC = * CCUR where can vary from 0 to 1.2 depending on the ratio of F/M • Tier 4: RBC = (1 + b*slope) * CCUR
– For Tiers 3 and 4, CCUR is the average catch over the past four years, and includes landings plus discards
– “slope” in Tier 4 is the slope in the trend in CPUE over the past 4 years (longer where CPUE is cyclical)
The Tier 1 and 2 harvest control rules are similar in form to that depicted in Figure 2. For further details see Smith and Smith (2005) and Smith et al. (2007).

Guidelines for Implementation of the Commonwealth Fisheries Harvest Strategy Policy
38
• Catch - outside range of reference years or greater than X % change from mean of reference years;
• Catch - greater than X % change in any one year; • Catch - change in distribution of catch by area; • TAC - catch is less than X % of TACC; • Effort - greater than upper limit; • Effort - outside range of reference years, percentage change as in catch; • CPUE (catch rate) - falls below X % of reference year or years; • CPUE (catch rate) - greater than X % change in any one year; • CPUE - statistically significant trend over X years; • Mean size - statistically significant trend over X years; • Size/age composition - significant change in distribution; • Recruitment indices - statistically significant trend over X years; • Recruitment indices - greater than X% change relative to mean of reference years; and • Proportion immature - falls below X % of reference years.
These examples relate primarily to biological considerations but a similar approach can be applied from an economic perspective. Economic data is an important input into the development of a harvest strategy. The minimum set of economic data required is information on the gross value of production by species (which is available for all Commonwealth fisheries), as well as information on the costs of fishing. This will allow for an assessment of the likely net economic returns being generated in a fishery. This cost of collecting fishing cost information will vary depending on the size and structure of the fishery and the level of accuracy required/justified (see box on 'Investment in Information'). Less expensive estimates of major fishing costs may be possible using logbook/effort data. More rigorous economic data may be collected via face to face surveys of operators. While the cost of collecting more rigorous economic data is larger, the major cost of more accurate estimates of MEY is not in the data collection, but in the construction of a bio-economic model. For stocks or fisheries where some data are available (for example estimates of natural mortality and fishing mortality), then at the very least MEY will involve higher stock levels than a purely biological target. The degree to which BMEY is above BMSY will depend on a number of factors. For example, for a given BMSY, BMEY will be higher:
• the ‘flatter’ the sustainable yield curve; • the ‘steeper’ the total cost curve; • the lower are fish prices; and • the higher fishing costs.
For many stocks, there will be little biological and economic information on which to base an estimate of MEY. For such stocks, a HS may be based on relatively little information and decision rules may be essentially empirical. It is important to note that this does not necessarily mean that significant expenditures are justified to reduce this uncertainty. For example, in small value fisheries it is unlikely that significant expenditure could be justified to collect the additional information required to undertake a quantitative stock assessment (see box on Investment in Information). For such stocks, data may be limited to catch levels and trends CPUE. In such cases, parallel monitoring of the profitability of operators in the fishery could also be conducted to determine the level of profits in the fishery. If profits are low, this indicates that the target level of biomass may be too low (that is, effort is set above the level that generates MEY). Monitoring the profitability of operators could be possible through the calculation of net returns, productivity indices or profit decompositions. However, some assessment of the likely benefits of such analysis should be undertaken relative to the costs.

Guidelines for Implementation of the Commonwealth Fisheries Harvest Strategy Policy
39
Latent effort may also be used as a simple indicator of profitability. A fishery operating at or near MEY will be generating above-average returns and will be attractive for permit/quota holders to enter. If significant latent effort exists, above average returns are likely to have been competed away to the point where it is no longer attractive for permit/quota holders to enter the fishery. In this case, the target level of effort set in the fishery is likely to be too high, or effort creep is likely to have reduced the effectiveness of the management tool. If no or little latent effort exists in a fishery and CPUE is stable or increasing, an assessment could be carried out regarding the likely benefits of collecting additional information in order to refine the estimates of allowable harvest. In a quota-managed fishery, sale and lease prices of quota can also provide an indication of the profitability of the fishery. How much a fisher is willing to pay for quota depends on the likely profits that the quota will generate. Over time, fishers competing for quota will result in the price of quota changing until it reflects the profits that can be made. It follows that low quota prices are associated with low profits and high quota prices are associated with higher profits. It is important to note that there are several factors that can affect the profitability of a fishery. Some of these factors may be the result of fishery management (such as increased fishing costs due to an inappropriate management regime) and others may be external to the management regime (such as a change in the foreign exchange rate which could impact on prices for fishing inputs and outputs). Regardless of whether the factor is internal or external, a management response would be required to adjust the level of effort/catch so it is consistent with MEY. The important point is that control rules have to be clearly articulated when biological and economic triggers and indicators such as these are used. Investment in information An issue that is often overlooked in the development of risk management policies concerns the appropriate amount of information needed by decision makers to make informed judgments about whether the risks being taken in managing a fishery are acceptable. This issue applies equally to both the scientific and economic aspects of risk analysis. More information is generally better than less. Yet the collection, interpretation and dissemination of information is not costless. As a result, there is an obvious trade-off that must be made concerning the quantity and quality of information that decision makers require and the level and cost of risk protection that is likely to result. Assessing such trade-offs is not always straightforward. Information should be gathered to the point where the expected benefit from gathering additional information equals the cost of obtaining that information. Additional information will produce benefits if it reduces the probability of making a wrong decision. So the expected net benefit from additional information depends on how much it reduces the chance of making a wrong decision, the cost of a wrong decision and the cost of gathering the information (Schuele et al. 1997). Collecting information is costly. Having little information regarding the biological and economic characteristics of a stock does not necessarily justify that additional information be collected. The benefit of collecting further information (to improve the harvest strategy and perhaps increase profits) needs to be set against the cost of collecting the additional information. The collection of additional information should only occur if these benefits are likely to outweigh the costs. It is important that any evaluation of the benefits and costs of collecting additional information be viewed in net present value terms. That is, all the benefits and costs in future years should be discounted to a single figure in today’s dollar terms. This is particularly important when costs are incurred up front and the benefits are likely to accrue in the future.
An issue that requires consideration is the process by which species within a fishery harvest strategy framework move between tier levels. Through investing in new information it may be possible to move

Guidelines for Implementation of the Commonwealth Fisheries Harvest Strategy Policy
40
from a higher to a lower tier. There will be a trade-off here, however, between the potentially higher yield at the new tier level and the cost of the investment, which will require close examination. The framework needs to specify how much precaution is built into the difference between tier levels as this provides the incentive for investing in information required to move to a new tier level (see Figure 7 above). Ideally, harvest strategies should be tested using scientifically defensible methods (e.g. management strategy evaluation including the use of operating models). Such testing of management strategies is particularly important when information is incomplete and imprecise, and when the relationship between the control rule and management regulations is complex. This approach is examined in more detail in Section 14. The point here is that such testing can also assess the costs and benefits of moving between tier levels, including the value of information. It is also important to recognise that control rules within a harvest strategy need not be limited to only adjusting catch or effort in a fishery. They can include responses such as initiating a survey or improving the quality of an assessment. This latter form of decision rule may be appropriate for data-poor and/or developing fisheries, where multiple TAC/TAE reference points would be in place, and as the less extreme of these are reached, a survey is undertaken to improve the understanding of stock status before further exploitation. For example, an initial TAE could be set as a small proportion of the historical high level, and the decision rule once this benchmark is reached could be to undertake a more extensive survey of the fishery. If this warrants an increase in the TAE, subsequent responses at higher benchmark levels of effort could be to adjust season length, or set a total catch alongside the TAE, or invoke some form of spatial management. At its most extreme, the decision rule would be to reduce the TAE. Alternatively, the status quo could be maintained until monitoring indicates that effort should be reduced.
8 Dealing with Uncertainty and Risk The HSP provides clear direction in relation to preferred exploitation rates and stock status for key commercial species taken in Commonwealth fisheries. This is articulated through the specification of target and limit biomass reference points, and related probability thresholds for meeting target reference points, and avoiding limit reference points. In this sense, the HSP provides direction on the level of risk acceptable to government in relation to the stock status of key commercial species in Commonwealth fisheries. The management of commercial fisheries is significantly complicated by scientific and process uncertainty inherent in the assessment and subsequent management of stocks. For stock assessments, and related supporting science, there are many sources of uncertainty. The more significant sources of uncertainty that will require explicit consideration in the development and application of harvest strategies include:
• observation error (e.g. survey variability); • process error (e.g. recruitment variability); and • model error (uncertainty about key assumptions or parameters).
Under most circumstances, these factors compound within assessment and management processes to generate substantial uncertainty about stock status, and the response of stocks to changing management arrangements. A key management objective of the HSP is to ensure that harvest strategies meet the probability and risk thresholds specified in the HSP regardless of the level of uncertainty in assessments. This is an explicit recognition of the need for precaution in the face of uncertainty. In general terms it requires that increasing assessment or management uncertainty will be mitigated by reducing exploitation rates.

Guidelines for Implementation of the Commonwealth Fisheries Harvest Strategy Policy
41
Where stock status is very uncertain, this may mean that the stock will be maintained on average well above the theoretical target level – BMEY. This approach has been adopted in current harvest strategies for the SESSF, and is examined in detail in Section 7 above. The correct interpretation of the risk criterion in the HSP is that the stock should stay above the limit biomass level at least 90% of the time (i.e. a 1 in 10 year risk that stocks will fall below BLIM), under the application of the HS. This is different from an interpretation that says that there should be a 90% probability that the stock should be above the limit in each and every year. However, there may be highly variable species (e.g. some small pelagic species such as pilchards) where this criterion is violated even in the absence of fishing. The HS for such species will need to reflect this and the risk criterion be suitably amended (but still consistent with the intent of the HSP). This might be done by specifying a limit to the increase in frequency of breaching the limit reference point under the application of the harvest strategy, or by altering BLIM itself for such species. Stocks that fall below BLIM due to natural variability will still be subject to the recovery measures as stipulated in the HSP (see also Section 10). It is feasible to consider strategies for achieving a given risk level where assessments generate an estimate of current biomass and an associated level of uncertainty. However, this situation is the exception rather than the rule. The most reliable method for determining whether a given harvest strategy meets the risk criterion is via an MSE analysis. This is examined in detail in section 14 describing MSE. The MSE allows an evaluation of the robustness of the whole harvest strategy (monitoring + assessment + control rule) (as per Figure 1), and allows explicit calculation of the probability of breaching BLIM, even for stocks where current biomass can not be calculated. The utility of MSE can be significantly compromised by the absence of clearly specified management objectives, particularly target and limit reference points, and risk criteria. These are now clearly specified in the HSP, significantly facilitating MSE of harvest strategies for those fisheries where it is appropriate. The HSP provides for flexibility in the development and specification of control rules within harvest strategies. This recognises the wide range of fishery, stock, and data circumstances to which the HSP will be applied. Some control rules may include estimates of risk directly in the control rule, but this is not a necessary feature. The more important point is that the control rule is part of the overall harvest strategy and has a high likelihood of maintaining stocks at or near the targets, and meets the probability requirements of the HSP in relation to avoiding depletion to, or below, the limits. This is best determined using MSE, as well as ongoing monitoring and performance review. Harvest strategies should be developed to minimise any implementation uncertainty (such as translating RBCs into input control measures) that might undermine achievement of the HSP objectives. This uncertainty should also be accounted for in MSE analyses.
9 Dealing with High Variability
9.1 Short-lived species Short-lived species (e.g. squid, prawns, scallops) have stocks comprised of very few or often only one year class and the stock abundance may vary tenfold on an annual basis depending on the recruitment success in a particular year. In these cases, one could expect the TAC/TAE to vary significantly on an annual basis reflecting stock abundance or an appropriate fishing mortality. With highly variable species it is important to develop a harvest strategy that meets the intent of the HSP. However, as noted above, stocks that fall below BLIM due to natural variability will still be subject to the recovery measures stipulated in the HSP. A number of adaptive management approaches may be used to deal with this:
• pre-season surveys to provide estimates of abundance to which the control rule is applied; • within season monitoring and triggers, e.g. NPF banana prawns (see Box below) and Falkland

Guidelines for Implementation of the Commonwealth Fisheries Harvest Strategy Policy
42
Island Squid (see Box in Section 6 above); or • allowing a set number of spawning events prior to harvest, e.g. Scallops.
9.2 Longer-lived species For longer-lived species, it is possible that the RBC derived from application of a control rule may vary significantly from year to year within the assigned Tier level of a species. There may be a number of reasons for this, but they generally fall into three categories: stock abundance, stock availability and uncertainty. The latter is discussed in Section 7. Stock abundance should be the main factor against which an RBC is determined, ensuring that fishing mortality remains below and stock biomass remains above appropriate reference levels. This is true if the indicators used in a HCR are a precise and accurate index of stock abundance. Unfortunately, variability
Banana Prawns (Fenneropenaeus merguinesis) caught in the Northern Prawn Fishery The common banana prawn season is about 1.5 months. The catch rates of this fishery generally follow a decay curve. However, in exceptional years, the catch rates start and remain very high for a long period. In these cases, the following control rules apply to extend the season for 2 weeks. The incidental catch of juvenile tiger prawns are also included in the rules, to reduce the chances of the extending the banana prawn season at the expense of tiger prawns. With this particular control rule the season can only extended. However, there is no reason why a rule could not be developed that reduces or increases the season length. Control rule to extend the banana prawn season:
The current control rule which will determine whether an extension will be made (or otherwise) is:
(a) If the average daily catch rate of banana prawns for the 4th week of the first season exceeds or equals 500 kg/boat/day.
AND (b) If the pro-rata total tiger prawn catch for the whole 4 weeks is less than 26.4 tonnes
(6.6 t/week*4) THEN (c) The season is extended for a further 2 weeks AND (d) All existing spatial closures and other management measures will be extended This decision rule is applied only if all catch data (kg/day, or total catch and total days) for the whole fleet (or >95% of NORMAC members and advisors) is informally supplied for the period 7-14 May by 9 am 15th May.
To facilitate the assessment of whether an extension to the season is appropriate based on the control rule, a “representative sample” of the catch rates for the season across the fleet is required. This can take the form of:
Either
(a) Providing a copy of the logbooks from each of these boat which are fishing for week 4 to AFMA, which shows the catch of banana and tiger prawns per day fished;
OR
(b) Providing company records indicating the total catch (broken down by banana and tiger prawns) for week 4 and the number of days fished per boat during that week.

Guidelines for Implementation of the Commonwealth Fisheries Harvest Strategy Policy
43
in stock availability and a range of uncertainties tend to create noise around the indicators of stock abundance. For this reason, RBCs may change for reasons other than changing stock abundance. These issues are discussed below. Stock abundance For long-lived species with fairly constant recruitment, (e.g. orange roughy, redfish), stocks are comprised of many year classes and stock abundance should not vary greatly from year to year. In such species, the RBC should remain relatively stable from year to year. Other species (such as blue grenadier) are moderately long-lived, but their stock abundance may oscillate considerably due to the influence of highly variable recruitment, with sometimes many years between periods of high recruitment. In these cases, we would expect the RBC to vary in multi-year cycles reflecting these periods. Variable availability Regardless of the species categories mentioned above, or whether stocks are at high or low abundance, there may be some portion of the stock that is unavailable to the fishery. This is not of great importance, in a relative sense, if the unavailable portion does not change over time (e.g. juvenile fish remain in nursery areas outside of the fishery), but it is important if the availability changes over time. Examples of this might include fish migrating to areas where they can not be captured by the fishery at certain times of the year or over multiple years (e.g. fish only come inshore to the fishery in certain oceanographic conditions such as periods of high upwelling; or fish avoid areas of certain water temperatures; or migrate outside the bounds of the fishery in some years). In such cases, it may be difficult to distinguish changes in availability from true changes in abundance.
10 Stock Rebuilding Strategies and Stock Recovery Plans
Stock rebuilding strategies and stock recovery plans come into play when stocks fall below BLIM and specific additional management measures need to be undertaken. They may also represent an important link between the HSP and the EPBC Act. In general, stock rebuilding strategies (developed by AFMA under fisheries legislation for species which fall below BLIM and are either not listed or listed as conservation dependent) and stock recovery plans (if formally required under EPBC Act for a species listed under a threat category of vulnerable or higher) will define targets for rebuilding and maximum timelines to achieve this. There may be substantial additional management costs involved in giving effect to stock rebuilding strategies and stock recovery plans and this is another reason to avoid having stocks in this situation. There are likely to be a number of alternative time paths to rebuild a stock that has been fished down to a level below its BTARG. One option may be to rebuild the stock in the shortest possible time frame (harvests would be zero). Another option may be to rebuild the stock over a set period of time or number of generations of fish. However, the optimal time path to rebuild a stock has an economic component. In determining the optimal time path to rebuild a stock, there is a trade-off between lost profits in the short term and the speed at which the stock is rebuilt. Clearly, reducing catch/effort to levels consistent with rebuilding a stock to levels consistent with the target biomass reference point will not immediately lead to an increase in revenues and profits. It takes time for the size of the fish stock to rebuild to levels associated with MEY. For example, a harvest strategy that reduced harvests to zero would result in larger lost profits in the short term, but the higher profits of a rebuilt stock would be earned sooner. A dynamic optimal control model can be used to balance this trade-off so that the net present value of future profits is maximised. However, such models are difficult and expensive to construct and only likely to be available in high value fisheries. Even in the absence of a formally designated “stock rebuilding strategy or stock recovery plan”, any HS that defines a management response for any given level of stock (or some other proxy indicator of stock status) already explicitly defines a stock rebuilding strategy. For example the current SESSF harvest

Guidelines for Implementation of the Commonwealth Fisheries Harvest Strategy Policy
44
strategy for Tiers 1 and 2 produce an RBC of zero if the stock falls below B20 (with greater than 50% probability), but would allow some limited targeting once the stock recovers to above B20 (defined by the upward sloping exploitation rate between B20 and BMSY). Several issues arise in considering whether this alone is adequate as a recovery strategy:
• Clearly, a zero RBC below BLIM provides the maximum possible recovery rate. However, achieving zero catches in a multi-species fishery may be difficult. The rebuilding strategy may impose additional constraints on bycatch allowance, up to and including closure of the fishery. The analysis of rebuilding strategy options and timelines can be complex and is further complicated by the social, economic and policy dimensions of such decisions.
• Even for a species managed by TACs, additional conservation measures may be appropriate if the stock is below BLIM. These might include gear restrictions and seasonal and spatial closures (e.g. to avoid spawning locations and times for the species of concern). A rebuilding strategy would define such additional measures although these could also be defined under “normal” harvest strategy conditions.
• The issue of when to allow targeted fishing after a stock recovers to above BLIM is also pertinent. For stocks that have recovered from below BLIM, and have not been listed in vulnerable or a higher threat category19
• It is also quite feasible that an updated stock assessment suggests that the stock actually never fell below BLIM due to uncertainty in assessment advice.
, targeted fishing will be allowed as long as fishing does not interfere with the agreed stock rebuilding strategy, as agreed to by AFMA and the Minister for the Environment and Water Resources.
• Recovery times are generally implicit in the HS.
Typically recovery times are defined as the minimum of 1) the mean generation time plus ten years, or 2) three times the mean generation time. Note that the mean generation time is defined as the average age of a reproductively mature animal in an unexploited population.
10.1 Key elements of a stock rebuilding strategy/stock recovery plan The core elements that make up an effective stock rebuilding strategy are largely consistent across fisheries jurisdictions. The core elements of the stock recovery plans are legislated under the EPBC Act. For most harvest strategies the management responses necessary to ensure recovery will form part of the HS and will operate under nearly all management circumstances. In cases where a stock is depleted to or below BLIM, the transition between management action under the HS and more dramatic responses under a separate stock recovery plan may be more formalised. It is possible however that a HS be constructed and tested to operate in “normal” circumstances, as well as cases where depletion has reached or exceeded BLIM. In general a stock rebuilding strategy must include, but is not limited to, the following requirements:
• clear specification of objectives including rebuilding targets and timeframes; • performance criteria to evaluate the effectiveness of the rebuilding strategy against its objectives; • actions required to achieve the objectives of the rebuilding strategy; • key threats to the recovery of the stock/species in question and strategies to counter these threats; • the estimated duration and cost of the recovery process, including the apportionment of costs
across government and other stakeholders; • parties affected by the implementation of the rebuilding strategy; and • significant related environmental impacts (positive or negative) arising from the implementation
of the rebuilding strategy.
19 Species which have been listed as vulnerable or in a higher threat category cannot be targeted until the Minister for the Environment and Water Resources has made a decision to delete the species from the list or move the species to the conservation dependant category.

Guidelines for Implementation of the Commonwealth Fisheries Harvest Strategy Policy
45
It is important to note that there may be additional cost burdens associated with monitoring for recovery of species that are subject to a rebuilding strategy. This is due to the fact that some of the usual data streams that are used to develop stock status indicators (such as CPUE and commercial catch at size or age data) may cease or not be comparable with previous data. A more dedicated fishery independent monitoring program may have to be developed. A stock rebuilding strategy must also be considered against the usual criteria for evaluating regulatory proposals. In brief, these are:
• consistency with relevant international and domestic legislation and policy; • cost effective and efficient; and • consistency with ESD principles.
11 Translating Recommended Biological Catches (RBCs) into Total Allowable Catch/Effort
RBCs are derived from the application of a harvest strategy and represent a total target mortality from all sources of fishing. This section discusses how to achieve the RBC given the control measures available for a particular stock and fishery.
11.1 Setting TAC/TAE from RBCs The over-riding objective of the HSP is to ensure that fishing mortality in Commonwealth fisheries is managed to meet the key objectives of the HSP. The HSP applies to fish stocks throughout their range and to mortality resulting from all types of fishing. When setting TACs/TAEs from RBCs, catches attributable to all types of fishing must be taken into account. This includes all fishing-induced mortality (for example, discards or state catches, and recreational catches). Whilst fishing mortality from other sectors and jurisdictions is considered in setting RBCs for Commonwealth fisheries, this does not necessarily mean that the TAC/TAE determined for Commonwealth fisheries will be unilaterally reduced in the absence of appropriate stock based management action from other sectors and/or jurisdictions.
11.2 Translating RBCs to TAEs In data and resource-rich fisheries where MSE analysis and/or formal stock assessments are undertaken, or for which fishery simulations are available, the estimate of catchability, q, may be used to obtain the TAE that yields catches corresponding to the RBC given by the harvest control rule. Clearly, this requires some knowledge of catchability, q, and how this parameter is likely to change with time and/or effort creep. Alternatively, TAEs may be directly estimated within an assessment and then translated into a target fishing mortality, F that then feeds back into the assessment model. For fisheries where there is moderate availability of data but no formal MSE or assessment, a TAE may be translated from the RBC on the basis of the historical relationship between catch and effort. A simple theoretical or statistical relationship can be fitted (e.g. simple linear regression, or GLM/GAM) to predict the effort required to achieve a given level of catch. Reliable logbook data will be imperative in such an approach. For data-poor fisheries, a TAE may have to be set directly as the average or maximum effort from a period during which there is no evidence of abundance decline, and multipliers applied that are set according to the perceived status of the stock relative to a reference point. Alternatively, a TAE could be directly set at some proportion of the current level of “active” effort in the fishery. Note that levels of effort (and hence mortality rates) required to achieve a given level of catch will be less than expected if the production curve (see Figure 6) is under-estimated and more than expected if the

Guidelines for Implementation of the Commonwealth Fisheries Harvest Strategy Policy
46
production curve is over-estimated. If the production function is overly optimistic, then the level of fishing effort required to take the catch quickly reaches a point where it is significantly greater than the ‘target’ level. However, if the production curve is ‘conservative’ and under-estimates the true production curve, the actual level of fishing effort required to take the catch will always be less than the target or expected level and actually declines at higher levels of ‘target’ fishing effort.
11.3 Determining RBCs in a Spatial Context In fisheries where spatial management is in place or is to be part of the fishery management for a species, RBCs or TAEs may be calculated separately for each designated area using spatially disaggregated data. Alternatively, an overall RBC/TAE may be allocated among areas according to historical proportions of catch or effort. Within-area monitoring against spatially explicit indicators should take place. This requires reliable spatially explicit fishery data. More generally, an overall RBC/TAE may be set with no spatial restrictions in the first instance, but with spatial monitoring to occur. Note that spatial management may also be in the form of imposing restricted effort within spawning seasons, and/or spawning/nursery areas. It may also involve rotational harvesting, as with the Tasmanian scallop fishery example referred to in Section 6. The identification of areas of key habitat may also be an important aspect of spatial management. Limited fractions of an overall RBC/TAE may be allocated to these key habitat areas. Management should seek to avoid the potential “cascading” effects of imposing spatial closures with no adjustment to the overall RBC/TAE. In this context, fishers may relocate to a smaller area, subjecting it to further fishing pressure and potentially leading to localised depletion of stocks. It is important to remember that spatial management is not an alternative to an RBC but may rather be a means to more effectively implement it.
12 Developing Fisheries
For developing fisheries, the main difficulty is that there is usually little biological information available and probably no time series of catch or catch rate data, much less a formal stock assessment, on which to base a HS. In these particular cases there is a requirement to balance the desire to develop a new fishery with the need to ensure any development is sustainable and the stocks are not put at risk. Harvest strategies for developing fisheries should also work to prevent over-capitalisation. Precautionary initial catch settings, good information and feedback are the key to this balance. Shown below is the proposed HS for the Great Australian Bight (GAB) deepwater fishery which integrates catch controls and spatial management. Although there are difficulties with lack of knowledge and uncertainty in a developing fishery, there are also some unique opportunities to collect information that will be invaluable in the future research and management of the species. Highest amongst these is the ability to collect information on the age and size structure of the population before there has been any significant fishing. From this information, estimates of natural mortality (one of the most difficult biological parameters to measure) can be obtained. Furthermore, this information from the start of exploitation provides a critical baseline of data against which the progress and exploitation of the developing fishery can be compared. Recognising the above, one of the more difficult aspects of fisheries assessment is that it is often difficult to measure the catch potential of a fishery until it has begun to make an impact on stock indicators. In other words, you can not determine the sustainable take of a species until you can begin to notice that fishing is impacting on the stock.
Guidelines for Implementation of the Commonwealth Fisheries Harvest Strategy Policy
47
An appropriate control rule for developing fisheries should therefore explicitly link the mandatory collection of critical biological information with an incremental precautionary development and expansion of the fishery to its target reference level. The following generic steps should be implemented once it is established that there is a developing fishery. Review available information Often, there is considerable literature already available on a particular species or genera from other fisheries, including internationally. This information may provide general indicators of life history, stock size, harvest levels that will help inform decisions about the appropriate development of the fishery. Conduct a risk assessment Based on information already available, conduct a risk assessment of the species as outlined in the ERA for a target species. This will highlight general risk levels comparative to other species and also indicate important gaps in knowledge. Set an initial conservative catch / effort trigger Although the initial catch trigger may vary greatly depending on the species and fishery, this level needs to be demonstratively precautionary. Monitoring and development The ability to continue to take a species under the initial catch trigger is allowed only if a minimum level of information is collected by those involved in the fishery. Once the initial catch trigger limit is reached in any one year, the targeted fishing for that species shall cease. Data analysis The trigger limit can not be exceeded in any one year until the length and age data are formally analysed and reviewed. As a minimum, a growth curve should be established and a catch curve analysis performed to get initial estimates of mortality. This can form the basis of a Tier 3 analysis, but as a catch history has not been established, another mechanism to develop the fishery needs to be established. It is suggested that, following the analysis of the data, and assuming there are no issues of concern arising from interpretation of age or length data, the trigger limit may be increased by a percentage (dependent on the species and HS) of the initial catch limit in any one year. Any increase is only allowed if a minimum level of analysis is performed.
13 Exceptional Circumstances
One of the main benefits of harvest strategies is that they provide an agreed and transparent process for arriving at management decisions. In particular, the harvest control rules provide an unambiguous prescription for the management response, given information about stock status. However experience has shown that there may be circumstances where management action arising from application of the HS is clearly not meeting the intention of the HSP. Such circumstances should be the exception rather than the rule, but a well considered HS should make provision for such “exceptional circumstances”. These would be circumstances, invoked under pre-agreed criteria, which result in an over-ride of the management advice arising from straightforward application of the HS. Such provisions should complement the HS and increase the likelihood of achieving management objectives. Examples that may warrant the use of exceptional circumstances provisions include:
• where assessments have not been completed due to unforeseen circumstances (e.g. a planned resource survey did not eventuate);
• where there has been an exceptional change in the nature of the fishery that can not be accommodated in the existing assessment method (e.g. a closure to a substantial part of the

Guidelines for Implementation of the Commonwealth Fisheries Harvest Strategy Policy
48
fishery, unrelated to concerns about impacts of fishing, that substantially alters catch and effort data); and
• where there has been a change in the ecological environment of the fishery unrelated to impacts of fishing (e.g. a fish kill, or climate induced changes).
In general, the use of exceptional circumstances should result in more precautionary management actions, given that in most instances the exceptional circumstances will have had the effect of increasing uncertainty, though there may also be cases where new information could lead to higher catches. The important point is to have both the criteria for invoking exceptional circumstances and the response to them clearly specified and agreed ahead of the need to apply them. There is little in the formally published literature about the application of exceptional circumstances, but a recent unpublished report is MCM (2007).
14 Management Strategy Evaluation
14.1 What is MSE? Management strategy evaluation (MSE) is a formal scientific procedure for testing adaptive or feedback management strategies. MSE has been defined as “assessing the consequences of a range of management options and laying bare the trade-offs in performance across a range of management objectives” (Smith et al.1999). Most of the applications of this approach have been to single species harvest strategies (Butterworth and Punt 1999), although some multi-species fisheries have been assessed (Punt et al.2001; De Oliveira et al.2004) and the method has been extended recently to assess whole fishery management systems (Smith et al.2007). The key steps in MSE include:
• defining management objectives; • turning management objectives into quantifiable performance measures; • selecting a set of management strategies; • developing an “operating model” of the system; • predicting the consequences of applying each strategy using the operating model; • summarising performance and highlighting trade-offs between meeting different objectives; and • communicating the results to decision makers.
In the context of HS development, performance measures for evaluating management objectives will largely be defined by the HSP. In particular, target and limit reference points and the definition of risk are clearly outlined in the HSP, and as such, performance measures will be set relative to these definitions. Having such formalised, pre-existing and unambiguous definitions represents a large step forward in the development of an MSE for any fishery. The operating model is usually a formally coded mathematical or statistical model of the population dynamics of the fishery, and represents the most plausible representation of the resource status and productivity and the fishing dynamics. The operating model is used to generate observations in the form of pseudo fishery data such as catch and CPUE, and these are then used in the management procedure. A key aspect of the MSE approach is to test for “robustness” of management strategies by specifically incorporating various sources of uncertainty in the operating model and analysis, including those in the underlying population dynamics and biology of the resource, random/environmental effects, uncertainty in the methods and data used to assess the status of the resource, and uncertainty in the ability to implement management actions. In this way, the MSE approach overcomes some of the problems and limitations discussed in sections 7 and 8 of these guidelines.

Guidelines for Implementation of the Commonwealth Fisheries Harvest Strategy Policy
49
While MSE analyses to date have generally not included an economic component, this should be included where appropriate data are available. Performance measures should be included and the operating model should include an economic representation providing observations of the likely profits in a fishery under various management scenarios.
Performancemeaures
Models ofsystem &impacts
Proposed action Scenariovisulisation
SIMULATE
Biological Dynamics
Initial System Structure
Final System Structure
SIMULATE
Management DecisionProcess
Observations
Parameter estimation(updating)
Apply managementstrategy decision rules
Implement decisons(tatctics)
Figure 8: Outline of the analytical structure involved in MSE. After Punt et al. (2001)
14.2 When should MSE be used? MSE should be used to test both generic and species specific harvest strategies. Such testing of management strategies is particularly important when information is incomplete and imprecise, and when the relationship between the control rule and management regulations is complex. Ideally, MSE should be used prior to implementation of a HS, to help design a robust HS that will meet management objectives. This will not be possible or practical in all instances, so some harvest strategies will be developed using “expert judgement” to design the combinations of monitoring, assessment and control rules that would appear to meet the objectives, and implemented without full prior screening using MSE methods. Where possible, in these instances, MSE should be undertaken after initial implementation to subsequently and periodically ensure that the harvest strategies are robust, and to help refine them over time. In this context, harvest strategies must be flexible enough to adapt given the outcomes of MSE undertaken after their implementation. Even for minor or data poor fisheries, it may still be worthwhile to develop MSE analyses, using assumptions/information for related species and/or from similar fisheries elsewhere in the world to substitute for where information gaps exist. Such initial MSE analyses can be updated as more reliable information becomes available. Sensitivity analyses using the MSE framework can also identify key information inputs to which the performance of the harvest strategies are sensitive, and in this way can help to prioritise monitoring and research needs. MSE will be relevant in two broad sets of circumstances. The first is to develop and test “generic” strategies for broad classes of fishery, or for particular stages of fishery development (e.g. developing

Guidelines for Implementation of the Commonwealth Fisheries Harvest Strategy Policy
50
fisheries). The second is to develop harvest strategies for specific stocks and fisheries. Each approach will use operating models to guide harvest strategy development, but for the latter case the operating models will have to be carefully tuned to the specific circumstances of each fishery. This typically requires a reasonable time series of fishery-dependent data and information regarding the population dynamics, biology and economics of the fishery. In all MSE analyses, but particularly those for data poor fisheries, it is important to be explicit about the associated uncertainties in the projected harvest strategy outcomes. While incorporating various sources of uncertainty in the operating model and analysis are a fundamental strength of MSE, these must be carefully explained and defined in the context of interpreting the MSE outcomes.
14.3 What resources are required for an MSE analysis? An MSE analysis is a time and resource intensive undertaking. Most such analyses have typically been developed over a minimum two year time frame, and require high level skills in stock assessment and modelling, which are often in short supply. They are also computationally intensive. Information resources are also important in conditioning or tuning the operating models for specific fisheries. Typically logbook data are required along with at least educated guesses or informed hypotheses regarding population growth, mortality, recruitment and possibly seasonal and spatial dynamics. A final requirement is to establish good channels of communication with industry and decision makers, so that the process may be transparent to all relevant parties and that useful input and feedback may be obtained from these sectors in the development of the framework. Fortunately, many of the major Commonwealth fisheries, and the major stocks within those fisheries, have already been the subject of MSE analyses, although some of these will have to be revisited in the light of the new policy directions and requirements under the HSP. To date there have been fewer MSE analyses on minor or data poor stocks and species, and the harvest strategies and MSE approaches for such stocks are generally not well developed
15 Amending Harvest Strategies
One of the key aims of the HSP is to provide for increased certainty and predictability in the operating environment surrounding Commonwealth-managed fisheries. Accordingly, amendments to the harvest strategies should occur infrequently once they are fully established (every three-five years for most stocks). However, the HSP recognises that it may be necessary to amend harvest strategies more regularly. The HSP identifies that this may be due to the following:
• there is new information that substantially changes understanding of the status of a fishery, leading to improved estimates of indicators relative to reference points. One example is where a harvest strategy is implemented without full prior screening using MSE methods (see section 14). In such an instance, harvest strategies must be flexible enough to adapt given the outcomes of MSE undertaken after their implementation; or
• external drivers that increase the risk to a fishery and fish stocks. In such cases, it may be necessary to use emergency authorities available to AFMA to implement a rapid response to reduce fishing intensity.
Additional reason to amend harvest strategies include:
• It is clear that harvest strategies are not working effectively and the intent of the HSP is not being met. For example, next years RBC is unduly influenced by previous RBCs, irrespective of stock status, i.e. the estimates are auto-correlated. This was identified as a potential issue in the Tiers 3

Guidelines for Implementation of the Commonwealth Fisheries Harvest Strategy Policy
51
and 4 of the SESSF harvest strategy framework. In most cases this will occur when harvest strategies are implemented without formal testing or evaluation using such methods as MSE.
It is anticipated that such amendments to harvest strategies would occur infrequently once they are fully established (every three-five years for most stocks). The process for amending harvest strategies should follow that for the initial development described in Section 2.5. The RAG or working group outlines the reasons for the proposed change and demonstrates their scientific basis. The MAC should support any proposed changes followed by approval by the AFMA Board.

Guidelines for Implementation of the Commonwealth Fisheries Harvest Strategy Policy
52
16 References
Barton, J., 2002 Fisheries and fisheries management in Falkland Islands Conservation Zones. Aquatic Conservation: Marine and Freshwater Ecosystems 12: 127-135.
Basson, M., Beddington, J.R., Crombie, J.A., Holden, S.J., Purchase, L.V., Tingley, G.A. 1996 Assessment and management techniques for migratory annual squid stocks: the Illex argentinus fishery in the Southwest Atlantic as an example. Fisheries Research 28: 3–27.
Butterworth, D. S. and Punt, A. E. 1999 Experience in the evaluation and implementation of management procedures. ICES Journal of Marine Science 56: 985-998.
Campbell, R.A. and Dowling, N.A. 2005 Evaluating harvest strategies for a rapidly expanding fishery: the Australian broadbill swordfish fishery. pp509-532 in Kruse, G.H., Galluci, V.F., Hay, D.E., Perry, R.I., Peterman, R.M., Shirley, T.C., Spencer, P.D., Wilson, B. and Woodby, D. (eds.). Fisheries assessment and management in data-limited situations. Alaska Sea Grant College Program, University of Alaska Fairbanks. 958pp.
De Oliveira, J. A. A. and D. S. Butterworth 2004 Developing and refining a joint management procedure for the multispecies South African pelagic fishery. ICES Journal of Marine Science 61: 1432-1442.
DPIW (2000) Living Marine Resources Management Act 1995: Tasmanian Scallop Fishery Policy Document, June 2000. Department of Primary Industries, Water and Environment: http://www.dpiw.tas.gov.au/inter.nsf/Attachments/ALIR-4Z95KF/$FILE/ScallopFisheryPolicyDocument2000.pdf
Fisheries (Scallop) Rules 2005, under the Living Marine Resources Management Act 1995: http://www.thelaw.tas.gov.au/tocview/index.w3p;cond=ALL;doc_id=%2B24%2B2005%2BAT%40EN%2B20070220110000;histon=;prompt=;rec=;term=scallop%20rules
Goodman, D., M. Mangel, G. Parkes, T. Quinn, V. Restrepo, T. Smith, K. Stokes 2002 Scientific review of the harvest strategy currently used in the BSAI and GOA groundfish management plans. Report to North Pacific Fishery Management Council, US.
MCM 2007 Procedures for deviating from OMP output for the recommendation for a TAC, and for initiating an OMP review. Unpublished report, Marine and Coastal Management, South Africa
Myers, R. A., A. A. Rosenberg, P. M. Mace, N. Barrowman, and V. R. Restrepo 1994 In search of thresholds for recruitment overfishing. ICES Journal of Marine Science 51: 191-205
Punt, A.E. (2006) The FAO precautionary approach after almost 10 years: have we progressed towards implementing simulation-tested feedback-control management systems for fisheries management? Natural Resource Modeling, 19: 441-464.
Punt, A.E., A.D.M. Smith, and G. Cui 2001 Review of progress in the introduction of Management Strategy Evaluation (MSE) approaches in Australia’s South East Fishery. Marine and Freshwater Research, 52: 719-726.
Schuele, M., Rose, R. and Treadwell, R. 1997 Valuing Recreational Fishing, ABARE Report Prepared for the Fisheries and Petroleum Branch, Department of Primary Industries and Energy, Canberra, July.
Shanks, S. 2005 Management Plan for the South Australian Pilchard Fishery. Fisheries Division, PIRSA, South Australian Government. 54p.
Smith, A. D. M., Sainsbury, K. J. and Stevens, R. A. 1999 Implementing effective fisheries management systems – management strategy evaluation and the Australian partnership approach. ICES Journal of Marine Science 56: 967-79.
Smith A.D.M. and D.C. Smith 2005 A harvest strategy framework for the SESSF. Report to AFMA. Smith, A. D. M., Fulton, E. J., Hobday, A.J., Smith, D. C., and Shoulder, P. 2007. Scientific tools to
support practical implementation of ecosystem based fisheries management. ICES Journal of Marine Science, 64: in press.

Commonwealth Fisheries Harvest Strategy Policy
53
Attachment A: Glossary of Terms (This glossary covers references in both the Harvest Strategy Policy and the Guidelines) ABARE: Australian Bureau of Agricultural and Resource Economics.
AFMA: Australian Fisheries Management Authority.
AFZ: Australian Fishing Zone.
(B) - Biomass: total weight of a stock or of a component of a stock; for example, the weight of spawning stock biomass is the combined weight of mature animals.
(BLIM) - Biomass limit reference point: the point beyond which the risk to the stock is regarded as unacceptably high.
(BMEY) - Biomass at maximum economic yield: average biomass corresponding to maximum economic yield as estimated from the assessment model applied.
(BMSY) - Biomass at maximum sustainable yield: average biomass corresponding to maximum sustainable yield.
(BTARG) - Target biomass: the desired condition of the stock.
(B0) - Mean equilibrium unfished biomass: average biomass level if fishing had not occurred. Sometimes the pre-exploitation level is used as a proxy.
BRS: Bureau of Rural Sciences.
Bycatch: species taken incidentally in a fishery where other species are the target, and which are always discarded.
Byproduct: species taken incidentally in a fishery that have some commercial value and are retained for sale.
Control rules: (also referred to as harvest control rules and decision rules) agreed responses that management must make under pre-defined circumstances regarding stock status.
DAFF: Department of Agriculture, Fisheries and Forestry.
DEW: Department of the Environment and Water Resources.
EPBC Act: Environment Protection and Biodiversity Conservation Act 1999.
Ecologically sustainable development: using, conserving and enhancing the community’s resources so that ecological processes, on which life depends, are maintained, and the total quality of life, now and in the future, can be increased.
Fish down: a fish stock that has not been heavily fished may have a large number of older fish. When such stocks are fished, catches are highest at first, but the rate cannot be sustained once the abundance of older fish has been reduced. Removing the older fish in this way is termed fish down [note: it could also be defined as the period of fishing from B0 to when BTARG is reached].
FA Act: Fisheries Administration Act 1991.
(F) - Fishing mortality: the instantaneous rate of deaths of fish due to fishing a designated component of the fish stock. F reference points may be applied to entire stocks or segments of the stocks and should match the scale of management unit.
(FLIM) - Fishing mortality limit reference point: the point above which the removal rate from the stock is too high.
(FMEY) - Fishing mortality at maximum economic yield: fishing mortality rate which corresponds to the maximum economic yield.

Commonwealth Fisheries Harvest Strategy Policy
54
(FMSY) - Fishing mortality at maximum sustainable yield: fishing mortality rate which achieves to the maximum sustainable yield as estimated by the assessment model applied. Note: FMSY is generally greater than FMEY.
(FTARG) - Fishing mortality: the target fishing mortality rate.
FM Act: Fisheries Management Act 1991.
Food and Agriculture Organization (FAO): of the United Nations.
Generation time: the average time taken for an individual to replace itself within the population.
Input controls: indirect restraints placed by management to reduce amount of fish caught; for example, gear restrictions and closed seasons.
Keystone species: an organism that has a greater role in maintaining ecosystem function than would be predicted based on its abundance.
Key commercial species: a species that is, or has been, specifically targeted and is, or has been, a significant component of a fishery.
MAC: Management Advisory Committee of AFMA.
Management Strategy Evaluation: a procedure whereby alternative management strategies are tested and compared using simulations of stock and fishery dynamics.
Maximum Economic Yield (MEY): The sustainable catch or effort level for a commercial fishery that allows net economic returns to be maximised. Note that for most practical discount rates and fishing costs MEY will imply that the equilibrium stock of fish is larger than that associated with MSY. In this sense MEY is more environmentally conservative than MSY and should in principle help protect the fishery from unfavourable environmental impacts that may diminish the fish population.
Maximum Sustainable Yield (MSY): the maximum average annual catch that can be removed from a stock over an indefinite period under prevailing environmental conditions.
Output Controls: management measures directly limiting fish catch or landings (for example by quota).
Overfished: a fish stock with a biomass below the biomass limit reference point.
Overfishing: A stock is experiencing too much fishing and the removal rate from the stock is unsustainable.
• Fishing mortality (F) exceeds the limit reference point (FLIM). When stock levels are at, or above, BMSY, FMSY will be the default level for FLIM.
• Fishing mortality in excess of FLIM will not be defined as overfishing if a formal ‘fish down’ or similar strategy is in place for a stock and the stock remains above the target level (BTARG).
• When the stock is less than BMSY but greater than BLIM, FLIM will decrease in proportion to the level of biomass relative to BMSY.
• At these stock levels, fishing mortality in excess of the target reference point (FTARG) but less than FLIM may also be defined as overfishing depending on the harvest strategy in place and/or recent trends in biomass levels.
• Any fishing mortality will be defined as overfishing if the stock level is below BLIM, unless fishing mortality is below the level that will allow the stock to recover within a period of 10 years plus one mean generation time, or three times the mean generation time, whichever is less.
Precautionary approach: (not to be confused with what is also sometimes referred to as the precautionary principle) where there are threats of serious irreversible environmental damage, lack of full scientific certainty should not be used as a reason for postponing measures to prevent environmental degradation. In the application of the precautionary approach, public and private decisions should be guided by (i) careful evaluation to avoid, wherever practicable, serious or irreversible damage to the environment and (ii) an assessment of the risk-weighted consequences of various options.
Commonwealth Fisheries Harvest Strategy Policy
55
RAG: Resource Assessment Group of AFMA.
RBC: Recommended biological catch. The total mortality from fishing by all sources – derived from application of the harvest control rule.
Recruitment overfishing: occurs when excessive fishing effort or catch reduces the spawning stock biomass to a level below which future recruitment levels may be jeopardised; this spawning biomass level should correspond closely to the biomass limit reference point.
Reference point: an indicator of the level of fishing (or stock size), used as a benchmark for interpreting the results of an assessment.
Spawning stock biomass: (also called spawning biomass) the total weight of all adult fish in a population.
Species: members of a species of fish that can breed with one another and produce fertile (capable of reproducing) offspring. In this way, a species maintains its ‘separateness’ from other species; for example, the yellowfin tuna and bigeye tuna are two distinct tuna species whereas the general term ‘tuna’ includes all tuna species.
Stock: a functionally discrete population of a species that is largely distinct from other populations of the same species. Such a population may be regarded as a separate entity for management or assessment purposes. Some species form a single stock (e.g. southern bluefin tuna), while others form several stocks (e.g. albacore tuna in the Pacific Ocean are divided into separate northern Pacific and southern Pacific stocks).
Stock recovery plan: a formal management process put in place under the EPBC Act to rebuild a stock when the measure of its status (e.g. its biomass) is substantially below the biomass limit point (BLIM, i.e. it is assessed as overfished). Stock recovery plans should include elements that define rebuilding targets, rebuilding time horizons and control rules related to the rate of progress.
Stock rebuilding strategy: a management process developed by AFMA to rebuild a stock to the target biomass reference point (BTARG) when the measure of its status is at or is below the biomass limit point (BLIM). The strategy is required to be approved by AFMA and the Minister for the Environment and Water Resources.
Sustainable Yield: the average catch that can be removed from a stock over an indefinite period without causing a further reduction in the biomass of the stock. This could be either a constant yield from year to year, or a yield that fluctuates in response to changes in abundance.
TAC: total allowable catch.
TAE: total allowable effort.
Targeting: fishing selectively for particular species or sizes of fish.
Target species: see key commercial species.
United Nations Fish Stocks Agreement: The Agreement for the Implementation of the Provisions of the United Nations Convention on the Law of the Sea of 10 December 1982 relating the Conservation and Management of Straddling Fish Stocks and Highly Migratory Fish Stocks, 1995.