Hypothesis Testing Introduction to Study Skills & Research Methods (HL10040) Dr James Betts.
Upload
ta-wei-huangCategory
view
62download
0
Introduction to StatisticsLecture 2: Testing and ANOVA
Ta-Wei Huang
Yoctol Info.
September 2, 2016
Ta-Wei Huang (Yoctol Info.) Introduction to Statistics September 2, 2016 1 / 27

Table of Contents
1 One Sample Test
2 Independent Two-Sample Test
3 Paired Sample t Test
4 One-way ANOVA and Multiple Comparison
Ta-Wei Huang (Yoctol Info.) Introduction to Statistics September 2, 2016 2 / 27

Table of Contents
1 One Sample Test
2 Independent Two-Sample Test
3 Paired Sample t Test
4 One-way ANOVA and Multiple Comparison
Ta-Wei Huang (Yoctol Info.) Introduction to Statistics September 2, 2016 2 / 27

Table of Contents
1 One Sample Test
2 Independent Two-Sample Test
3 Paired Sample t Test
4 One-way ANOVA and Multiple Comparison
Ta-Wei Huang (Yoctol Info.) Introduction to Statistics September 2, 2016 2 / 27

Table of Contents
1 One Sample Test
2 Independent Two-Sample Test
3 Paired Sample t Test
4 One-way ANOVA and Multiple Comparison
Ta-Wei Huang (Yoctol Info.) Introduction to Statistics September 2, 2016 2 / 27

One Sample Test
One-sample Test for Normal Population
Problem Setting
Let (X1, · · · , Xn) be a random sample from N (µ, σ2), where µ and σ2 are
unknown parameters.
Best estimator for µ: X = X1+···+Xnn .
Best estimator for σ2:∑n
i=1(Xi−X)2
n−1 .
Our goal is to compare (or infer)
(1) µ and a constant µ0 and (2) σ2 and a constant σ20.
Ta-Wei Huang (Yoctol Info.) Introduction to Statistics September 2, 2016 3 / 27

One Sample Test
One-sample t Test for Normal Population
Test Setting: One-sample t Test
Two-tail: H0 : µ = µ0 versus H1 : µ 6= µ0
Upper-tail: H0 : µ ≤ µ0 versus H1 : µ > µ0
Lower-tail: H0 : µ ≥ µ0 versus H1 : µ < µ0
Test Statistic: One-sample t Test
Under H0 : µ = µ0 (we use this setting even for one-tail testing),
T =X − µS/√n∼ t(n− 1),
the t distribution with degree of freedom n− 1.
Ta-Wei Huang (Yoctol Info.) Introduction to Statistics September 2, 2016 4 / 27
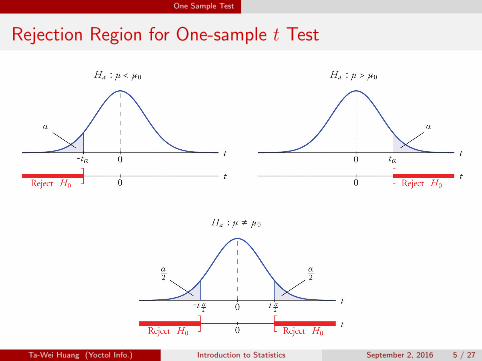
One Sample Test
Rejection Region for One-sample t Test
Ta-Wei Huang (Yoctol Info.) Introduction to Statistics September 2, 2016 5 / 27

One Sample Test
Example for One-sample t Test 1
ZARA is considering whether it should release a new pant. One business
analyst has calculated that they should sold out at least 125 clothes for one
store per month to achieve the break-even point. She randomly selected
40 identical stores to sell the pant for one month. The data has been
collected. Could you help ZARA to determine whether to sell the pant?
Ta-Wei Huang (Yoctol Info.) Introduction to Statistics September 2, 2016 6 / 27

One Sample Test
Example for One-sample t Test 2
Solution to the Result
H0 : µ ≤ µ0 versus H1 : µ > µ0, where µ0 = 120
1 Test statistic: T = 5.13, p-value: 0.0000 < α = 0.05
2 Reject H0, that is, µ > 120 significantly under α = 0.05.
Ta-Wei Huang (Yoctol Info.) Introduction to Statistics September 2, 2016 7 / 27

One Sample Test
One-sample Test for Normal Variance
Test Setting: One-sample Variance Test
Two-tail: H0 : σ2 = σ20 versus H1 : σ
2 6= σ20
Upper-tail: H0 : σ2 ≤ σ20 versus H1 : σ
2 > σ20
Lower-tail: H0 : σ2 ≥ σ20 versus H1 : σ
2 < σ20
Test Statistic: One-sample F Test
Under H0 : σ2 = σ20 (we use this setting even for one-tail testing),
Q =(n− 1)S2
σ20∼ χ2
n−1,
the χ2 distribution with degree of freedom n− 1.
Ta-Wei Huang (Yoctol Info.) Introduction to Statistics September 2, 2016 8 / 27

One Sample Test
Example for One-sample χ2 Test 1
The business analyst thinks that if σ ≥ 20, the risk of selling that pant will
be too high. Could you help her to determine whether the risk level is
acceptable?
Ta-Wei Huang (Yoctol Info.) Introduction to Statistics September 2, 2016 9 / 27

One Sample Test
Example for One-sample χ2 Test 2
Solution to the Result
H0 : σ2 ≥ σ20 = 400 versus H1 : σ
2 < σ20 = 400
1 Test statistic: T = 2.74, p-value: 0.0046 < α = 0.01
2 Reject H0, that is, µ > 120 significantly under α = 0.01.
Ta-Wei Huang (Yoctol Info.) Introduction to Statistics September 2, 2016 10 / 27

Independent Two-Sample Test
Independent Two-sample Test
Problem Setting
Let (X11, · · · , X1n1) be a random sample from N (µ1, σ21), and
(X21, · · · , X2n2) a random sample from N (µ2, σ22).
(X11, · · · , X1n1) and (X21, · · · , X2n2) are independent.
(µ1, σ21) and (µ2, σ
22) are unknown parameters.
Our goal is to compare (or infer)
(1) parameters σ21 and σ22 ⇒ Special case for Levene test
(2) parameters µ1 and µ2. ⇒ Independent t test
Ta-Wei Huang (Yoctol Info.) Introduction to Statistics September 2, 2016 11 / 27

Independent Two-Sample Test
Levene Test for Equality of Variance
Test Setting: Levene Test
Two-tail: H0 : σ21 = σ22 versus H1 : σ
21 6= σ22
Can be generalized to test
H0 : σ21 = σ22 = · · · = σ2k versus H1 : σ
2i 6= σ2j for some i 6= j
The test statistic is complicated, so I omit here. If you are interested in
this topic, check the following website:
http://www.itl.nist.gov/div898/handbook/eda/section3/eda35a.htm
Ta-Wei Huang (Yoctol Info.) Introduction to Statistics September 2, 2016 12 / 27

Independent Two-Sample Test
Independent Two-sample t Test: Unequal Variance
Test Setting: Independent Two-sample t Test
Two-tail: H0 : µ1 = µ2 versus H1 : µ1 6= µ2
Upper-tail: H0 : µ1 ≤ µ2 versus H1 : µ1 > µ2
Lower-tail: H0 : µ1 ≥ µ2 versus H1 : µ2 < µ2
Test Statistic: Independent Two-sample t Test
If σ21 6= σ22, under H0 : µ1 = µ2,
T =X1 −X2√
S21
n1+
S22
n2
∼ t(d.f.),
where d.f. =(s21/n1)+(s22/n2)
(s21/n1)2/(n1−1)+(s22/n2)2/(n2−1).
Ta-Wei Huang (Yoctol Info.) Introduction to Statistics September 2, 2016 13 / 27

Independent Two-Sample Test
Independent Two-sample t Test: Equal Variance
If the variances of two samples are equal, we use the pooled variance
S2p =
(n1−1)S21+(n2−1)S2
2n1+n2−1 .
Test Statistic: Independent Two-sample t Test
If σ21 6= σ22, under H0 : µ1 = µ2,
T =X1 −X2
Sp∼ t(d.f.),
where d.f. =(s21/n1)+(s22/n2)
(s21/n1)2/(n1−1)+(s22/n2)2/(n2−1).
Ta-Wei Huang (Yoctol Info.) Introduction to Statistics September 2, 2016 14 / 27

Independent Two-Sample Test
Example for Independent Two-sample t Test 1
The business analyst are further considering which type of store could sell
the pant better. So she want to test the difference between ”urban” stores
and ”rural” stores. She randomly select 50 homogeneous rural stores and
30 homogeneous urban stores, and sell the pant in each store for one
month. The data have been collected.
Ta-Wei Huang (Yoctol Info.) Introduction to Statistics September 2, 2016 15 / 27

Independent Two-Sample Test
Example for Independent Two-sample t Test 2
Step 1: Test for Equality of Variance
H0 : σ21 = σ22 versus H1 : σ
21 6= σ22
1 Test statistic: W = 0.37, p-value: 0.5431 > α = 0.05
2 Do not reject H0, i.e., no significant difference under α = 0.05
Step 2: Test for Difference
H0 : µ1 ≥ µ2 versus H1 : µ1 < µ2
1 Test statistic: T = −5.49, p-value: 0.0000 < α = 0.05
2 Reject H0, i.e., µ1 < µ2 significantly under α = 0.05
Ta-Wei Huang (Yoctol Info.) Introduction to Statistics September 2, 2016 16 / 27

Paired Sample t Test
Paired Sample t Test
Problem Setting
Let (X11, X21), · · · , (X1n, X2n) be the repeated measurements on one
property of n individuals. Define Di = X2i −X1i.
Assume (D1, · · · , Dn) is a random sample from N (µD, σ2D).
From the setting, we can see that it’s just a one-sample t test!!!
Ta-Wei Huang (Yoctol Info.) Introduction to Statistics September 2, 2016 17 / 27

Paired Sample t Test
Example: Paired Sample t Test 1
The business analyst decides to sell the pant in rural stores. The feedback
is quite good. Now, the business analyst wants to release a marketing
campaign around globe. She first chooses 30 stores to test her idea.
Ta-Wei Huang (Yoctol Info.) Introduction to Statistics September 2, 2016 18 / 27

Paired Sample t Test
Example: Paired Sample t Test 2
Solution and Result
H0 : µD ≤ 0 versus H1 : µD > 0.
1 Test statistic: T = 4.69, p-value: 0.0001 < α = 0.05
2 Reject H0, that is, µD > 0 significantly under α = 0.05.
Ta-Wei Huang (Yoctol Info.) Introduction to Statistics September 2, 2016 19 / 27

One-way ANOVA and Multiple Comparison
Statistical Experimental Design
Experimental design = assign experimental units to treatment conditions.
Spirit of Experimental Design
A good experimental design serves three purposes.
1 Make causal inferences about the relationship between independent
variables and a dependent variable.
2 Rule out alternative explanations due to the confounding effects of
extraneous variables.
3 Reduce variability within treatment conditions, which makes it easier
to detect differences in treatment outcomes.
Ta-Wei Huang (Yoctol Info.) Introduction to Statistics September 2, 2016 20 / 27

One-way ANOVA and Multiple Comparison
Statistical Experimental Design
Experimental design = assign experimental units to treatment conditions.
Spirit of Experimental Design
A good experimental design serves three purposes.
1 Make causal inferences about the relationship between independent
variables and a dependent variable.
2 Rule out alternative explanations due to the confounding effects of
extraneous variables.
3 Reduce variability within treatment conditions, which makes it easier
to detect differences in treatment outcomes.
Ta-Wei Huang (Yoctol Info.) Introduction to Statistics September 2, 2016 21 / 27

One-way ANOVA and Multiple Comparison
One Factor Experiment - Analysis of Variance
Problem for One-way Fixed Effect Model
Assume the interesting factor separate our model into K groups. In each
group i, we collect ni observations Xi,1, · · · , Xi,n.
Model: Xi,j = α+ µi + εi,j
Parameters: α - overall mean; µi - group mean
Distribution: εi,j are iid N (0, σ2)
Our goal is to compare K group means µ1, µ2, · · · , µK .
Ta-Wei Huang (Yoctol Info.) Introduction to Statistics September 2, 2016 22 / 27

One-way ANOVA and Multiple Comparison
One-way ANOVA Overall F Test
Overall F -test
We want to test the (fixed) treatment effect.
H0 : µ1 = µ2 = · · · = µK versus H1 : µi 6= µj for some (i, j).
We use overall F test to test whether (overall) there exists the treatment
effect.
Post-hoc Tukey-Kramer Procedure
Goal: simultaneously to the set of all pairwise comparisons µi − µj
Method: Studentized Range Distribution Qr,v
Ta-Wei Huang (Yoctol Info.) Introduction to Statistics September 2, 2016 23 / 27

One-way ANOVA and Multiple Comparison
Example: Comparing different classifiers
Ian, a well-known data scientist in Yoctol Info., proposes a new
classification model called ”deep-ian-say”. He uses one dataset, randomly
split them into 100 (training, validation) subsets, and then run different
algorithms on 100 datasets. Please help him to compare the result.
Ta-Wei Huang (Yoctol Info.) Introduction to Statistics September 2, 2016 24 / 27

One-way ANOVA and Multiple Comparison
Example: Comparing different classifiers
Construct the Tukey-Kramer simultaneous confidence interval.
Ta-Wei Huang (Yoctol Info.) Introduction to Statistics September 2, 2016 25 / 27

One-way ANOVA and Multiple Comparison
Example: Comparing different classifiers
Compare mean difference by Tukey-Kramer testing procedure.
Ta-Wei Huang (Yoctol Info.) Introduction to Statistics September 2, 2016 26 / 27

One-way ANOVA and Multiple Comparison
Example: Comparing different classifiers
R. Prashantha, Sumantra Dutta Roya, Pravat K. Mandalb,c, Shantanu Ghoshda.
High-Accuracy Detection of Early Parkinson’s Disease through Multimodal
Features and Machine Learning, International Journal of Medical Informatics.
Ta-Wei Huang (Yoctol Info.) Introduction to Statistics September 2, 2016 27 / 27