Common Core State Standards - Silicon Valley … · common core state standards, ... // hp: ......
71
In the Era of the Common Core Standards David Foster Silicon Valley Mathema0cs Ini0a0ve www.svmimac.org The Silicon Valley Mathematics Initiative Math Assessment Collaborative Content Student Teacher Learning
Transcript of Common Core State Standards - Silicon Valley … · common core state standards, ... // hp: ......

In the Era of the Common Core
Standards
David Foster Silicon Valley Mathema0cs
Ini0a0ve www.svmimac.org
The Silicon Valley Mathematics Initiative
Math Assessment Collaborative
Content Student
Teacher
Learning

The state of mathema+cs educa+on in America

Where are we a5er a decade of High Stakes Accountability?
WYTIWYG
What You Test Is What You Get!

NAEP 2009 US 4th Grade US 8th GradeAll Students 240 283Black 222 260White 248 292Hispanic 227 266Asian 255 300Low Income 228 266Mid-High Income 250 293English Learner 218 243English Fluent 242 284
Na+onal Achievement of Educa+on Progress (NAEP 2009 Math) The Na+on’s Report Card
Approximately 10 scale points is equivalent to a grade level of learning
The Achievement Gap
Source: U.S. Department of Educa+on

Approximately 10 scale points is equivalent to a grade level of learning
NAEP 2009 - Mathematics Eighth Grade
240
250
260
270
280
290
300
310
Black Hispanic White Asian
Ethnicity
Scale Scores
Na+onal Ave.

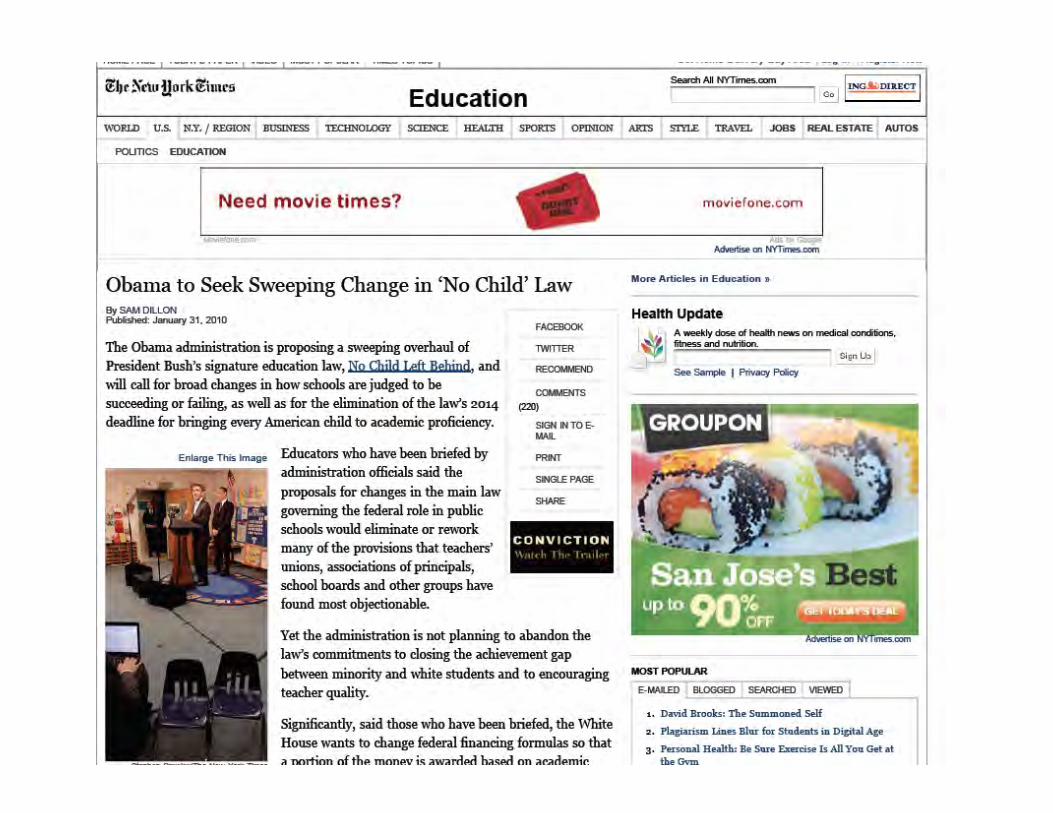
NY TIMES April 29, 2009
Persistent Racial Gap Seen in Students Test Scores By SAM DILLON
The achievement gap between white and minority students has not narrowed in recent years, despite the focus of the No Child Left Behind law on improving black and Hispanic scores, according to results of a federal test considered to be the nation’s best measure of long-term trends in math and reading proficiency.
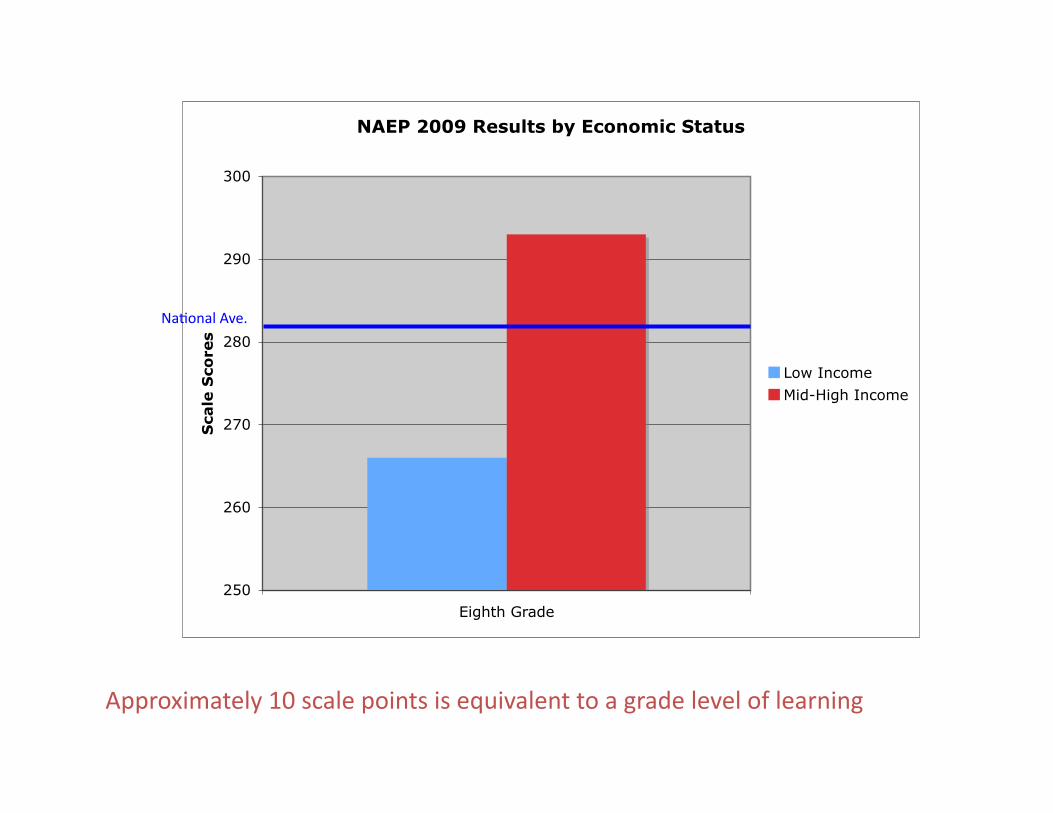
NAEP 2009 Results by Economic Status
250
260
270
280
290
300
Eighth Grade
Sca
le S
core
s
Low Income
Mid-High Income
Na+onal Ave.
Approximately 10 scale points is equivalent to a grade level of learning
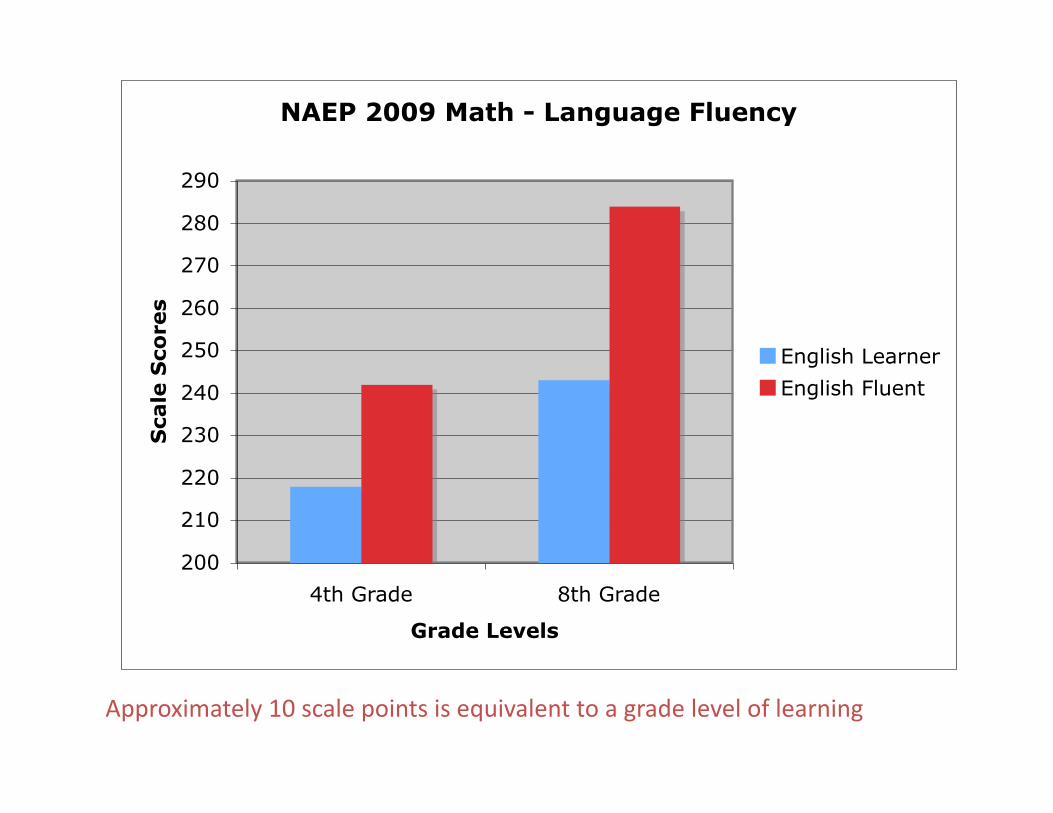
NAEP 2009 Math - Language Fluency
200
210
220
230
240
250
260
270
280
290
4th Grade 8th Grade
Grade Levels
Sca
le S
core
s
English Learner
English Fluent
Approximately 10 scale points is equivalent to a grade level of learning
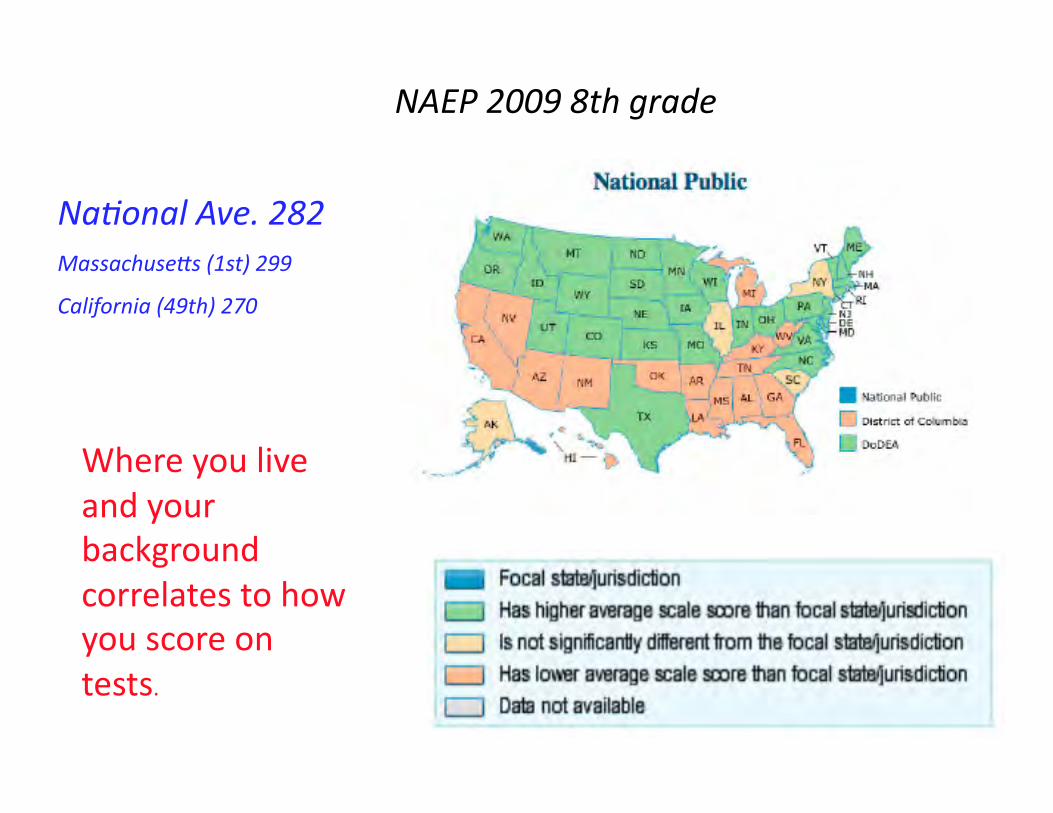
Na0onal Ave. 282 Massachuse:s (1st) 299
California (49th) 270
NAEP 2009 8th grade
Where you live and your background correlates to how you score on tests.

Link Assessment and Learning
“Assessment should be an integral part of teaching. It is the mechanism whereby teachers can learn how students think about mathema+cs as well as what students are able to accomplish.”
Everybody Counts
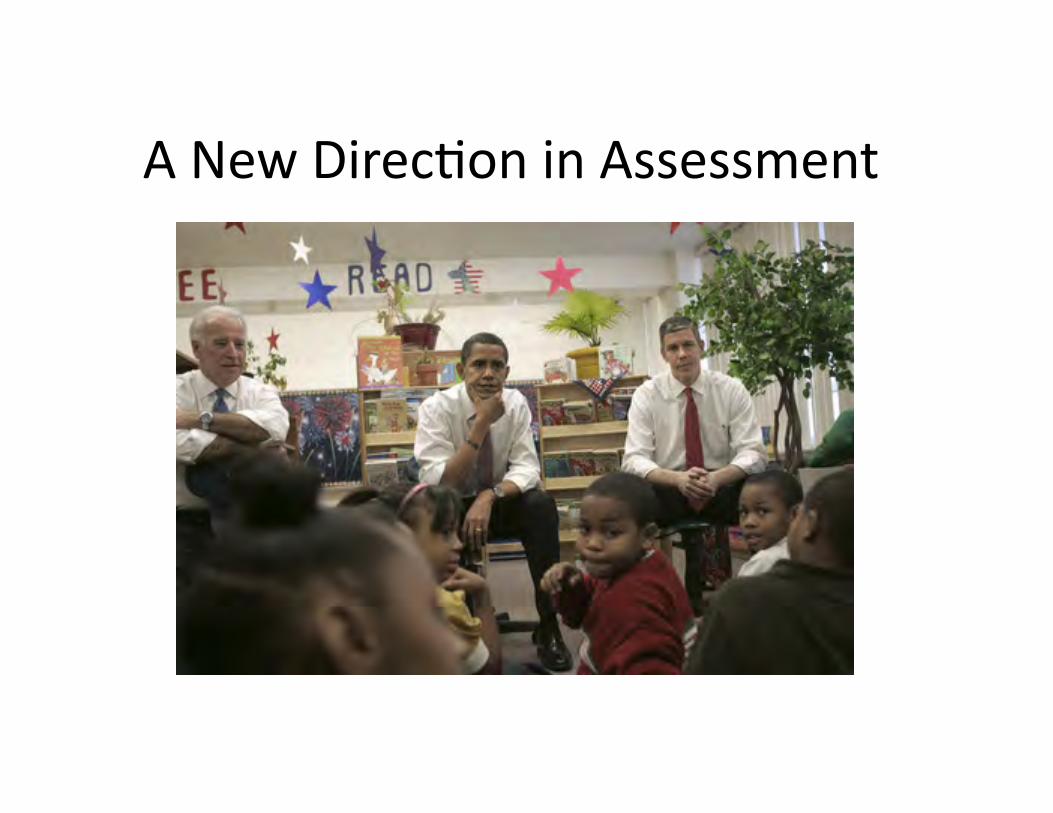
A New Direc+on in Assessment

The Common Core State Standards IniKaKve is a joint effort by the National Governors Association Center for Best Practices (NGA Center) and the Council of Chief State School Officers (CCSSO) in partnership with Achieve, ACT and the College Board. Governors and state commissioners of education from across the country committed to joining a state-led process to develop a common core of state standards in English-language arts and mathematics for grades K-12.These standards will be research and evidence-based, internationally benchmarked, aligned with college and work expectations and include rigorous content and skills. The NGA Center and CCSSO are coordinating the process to develop these standards and have created an expert validation committee to provide an independent review of the common core state standards, as well as the grade-by-grade standards. The college and career ready standards are expected to be publicly released in September 2009. The grade-by-grade standards work is expected to be completed in December 2009.
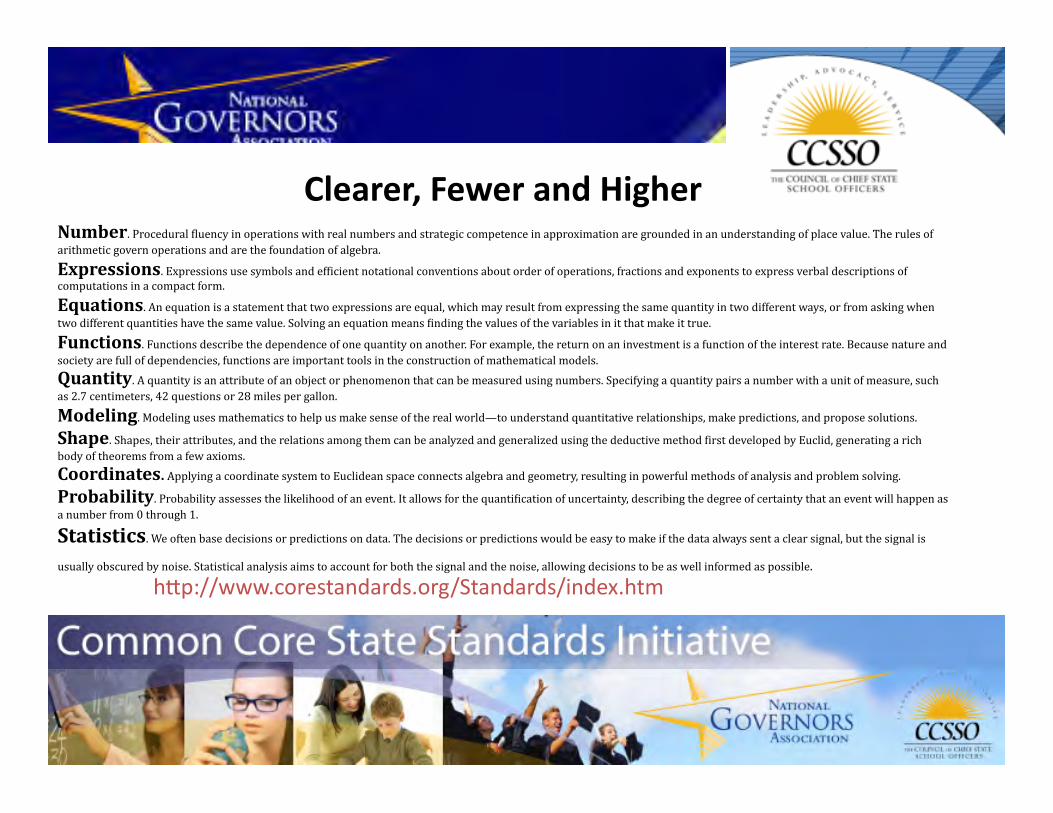
Number. Procedural ,luency in operations with real numbers and strategic competence in approximation are grounded in an understanding of place value. The rules of arithmetic govern operations and are the foundation of algebra.
Expressions. Expressions use symbols and ef,icient notational conventions about order of operations, fractions and exponents to express verbal descriptions of computations in a compact form.
Equations. An equation is a statement that two expressions are equal, which may result from expressing the same quantity in two different ways, or from asking when two different quantities have the same value. Solving an equation means ,inding the values of the variables in it that make it true.
Functions. Functions describe the dependence of one quantity on another. For example, the return on an investment is a function of the interest rate. Because nature and society are full of dependencies, functions are important tools in the construction of mathematical models. Quantity. A quantity is an attribute of an object or phenomenon that can be measured using numbers. Specifying a quantity pairs a number with a unit of measure, such as 2.7 centimeters, 42 questions or 28 miles per gallon.
Modeling. Modeling uses mathematics to help us make sense of the real world—to understand quantitative relationships, make predictions, and propose solutions.
Shape. Shapes, their attributes, and the relations among them can be analyzed and generalized using the deductive method ,irst developed by Euclid, generating a rich body of theorems from a few axioms. Coordinates. Applying a coordinate system to Euclidean space connects algebra and geometry, resulting in powerful methods of analysis and problem solving. Probability. Probability assesses the likelihood of an event. It allows for the quanti,ication of uncertainty, describing the degree of certainty that an event will happen as a number from 0 through 1.
Statistics. We often base decisions or predictions on data. The decisions or predictions would be easy to make if the data always sent a clear signal, but the signal is usually obscured by noise. Statistical analysis aims to account for both the signal and the noise, allowing decisions to be as well informed as possible.
Clearer, Fewer and Higher
hZp://www.corestandards.org/Standards/index.htm
hZp://www.corestandards.org/

1. Make sense of problems and persevere in solving them.
2. Reason abstractly and quanKtaKvely.
3. Construct viable arguments and criKque the reasoning of others.
4. Model with mathemaKcs.
5. Use appropriate tools strategically.
6. AWend to precision.
7. Look for and make use of structure.
8. Look for and express regularity in repeated reasoning.
Mathema+cal Prac+ce
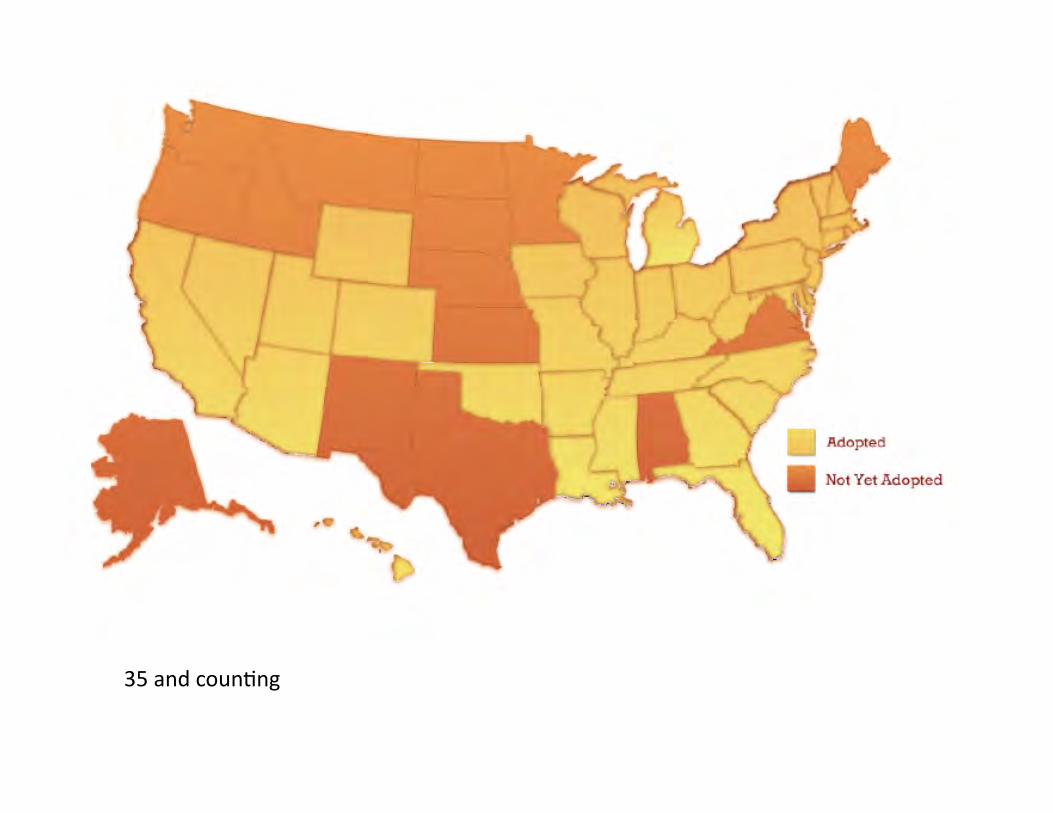
35 and coun+ng
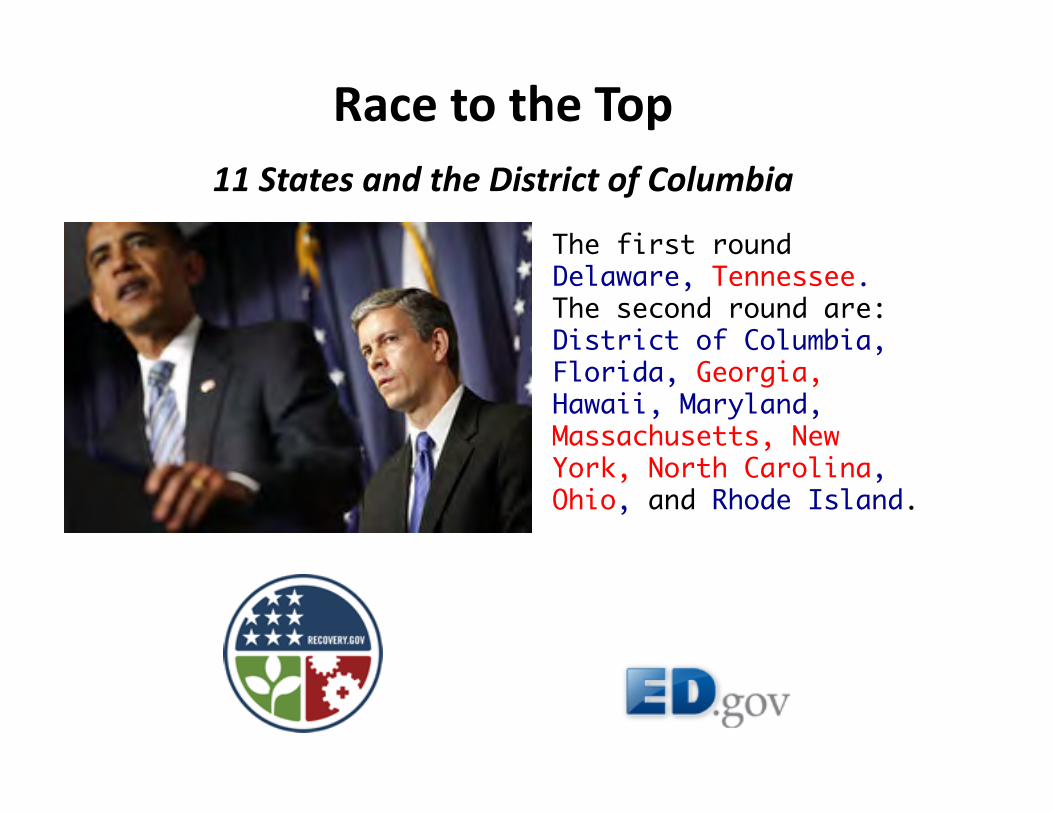
The first round Delaware, Tennessee. The second round are: District of Columbia, Florida, Georgia, Hawaii, Maryland, Massachusetts, New York, North Carolina, Ohio, and Rhode Island.
Race to the Top 11 States and the District of Columbia
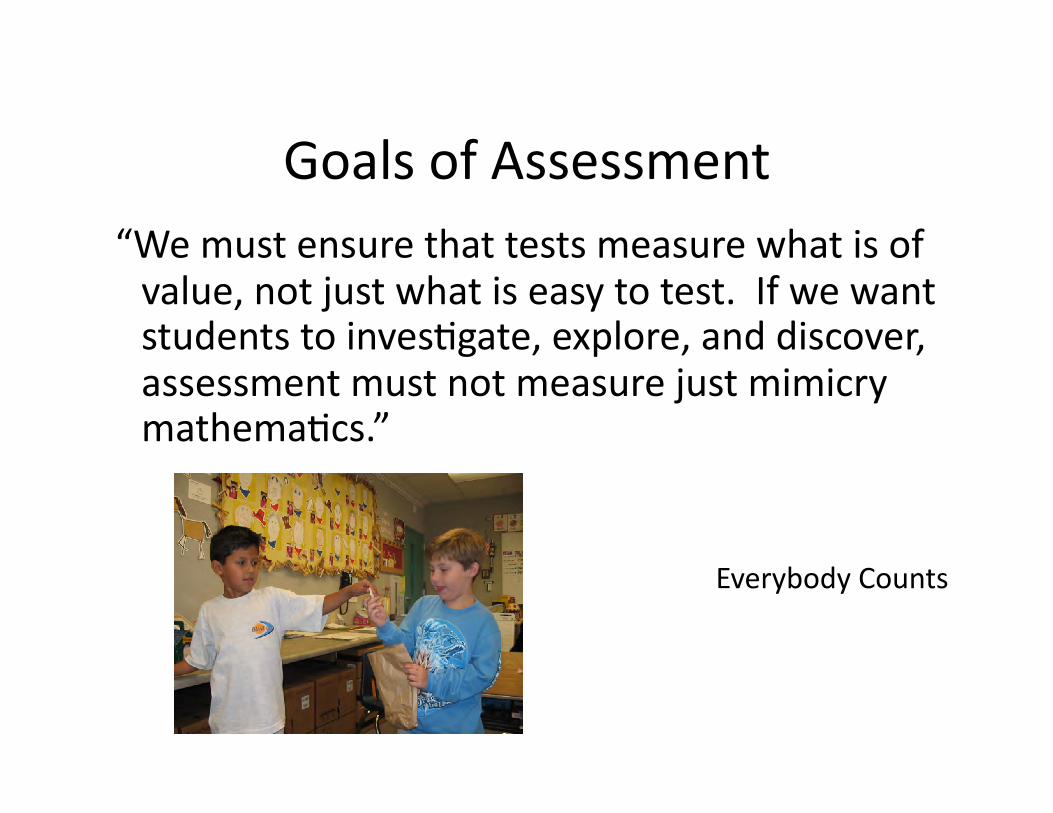
Goals of Assessment “We must ensure that tests measure what is of value, not just what is easy to test. If we want students to inves+gate, explore, and discover, assessment must not measure just mimicry mathema+cs.”
Everybody Counts
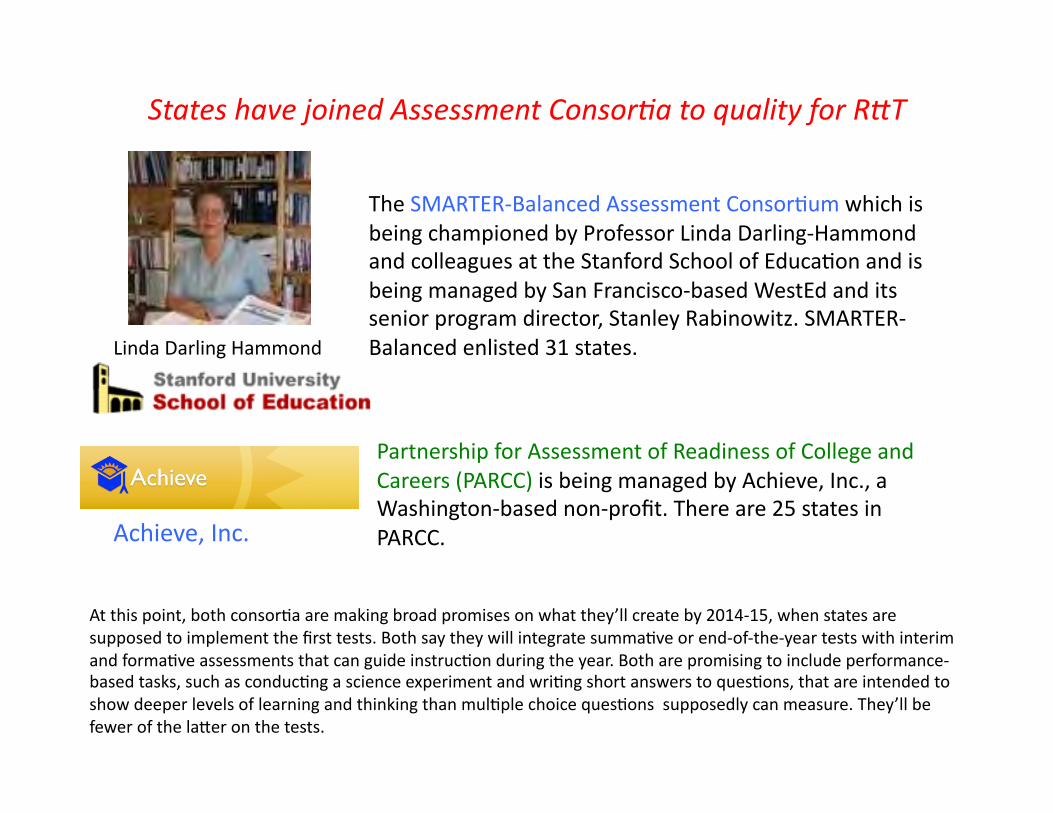
States have joined Assessment Consor0a to quality for R:T
Linda Darling Hammond
Achieve, Inc.
The SMARTER-‐Balanced Assessment Consor+um which is being championed by Professor Linda Darling-‐Hammond and colleagues at the Stanford School of Educa+on and is being managed by San Francisco-‐based WestEd and its senior program director, Stanley Rabinowitz. SMARTER-‐Balanced enlisted 31 states.
At this point, both consor+a are making broad promises on what they’ll create by 2014-‐15, when states are supposed to implement the first tests. Both say they will integrate summa+ve or end-‐of-‐the-‐year tests with interim and forma+ve assessments that can guide instruc+on during the year. Both are promising to include performance-‐based tasks, such as conduc+ng a science experiment and wri+ng short answers to ques+ons, that are intended to show deeper levels of learning and thinking than mul+ple choice ques+ons supposedly can measure. They’ll be fewer of the laZer on the tests.
Partnership for Assessment of Readiness of College and Careers (PARCC) is being managed by Achieve, Inc., a Washington-‐based non-‐profit. There are 25 states in PARCC.

Type of Tasks
• Novice Tasks – (skill/procedural knowledge) • Appren+ce Tasks -‐ (performance assessments)
• Expert Tasks – (mul+ple-‐day/complex/porgolio)

Designing a Standards-‐based Performance Assessment System:
New York City Performance Assessment Pilot
Mathema7cs
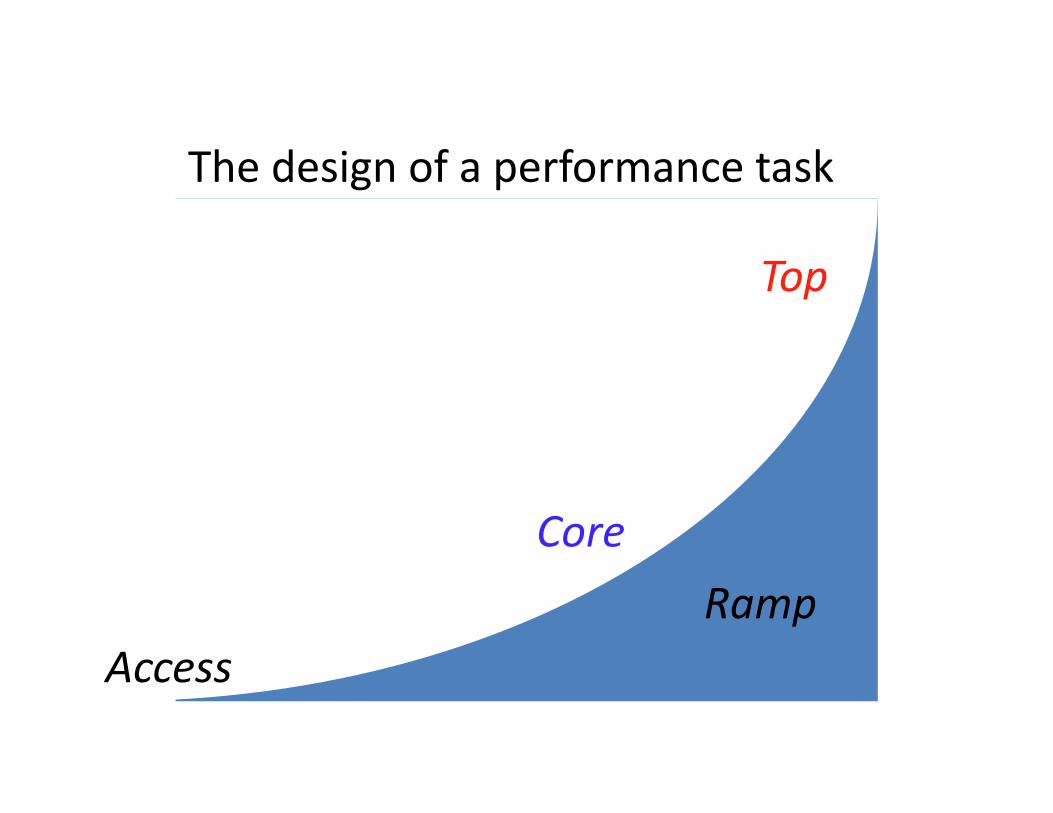
The design of a performance task
Core Ramp
Access
Top
Core


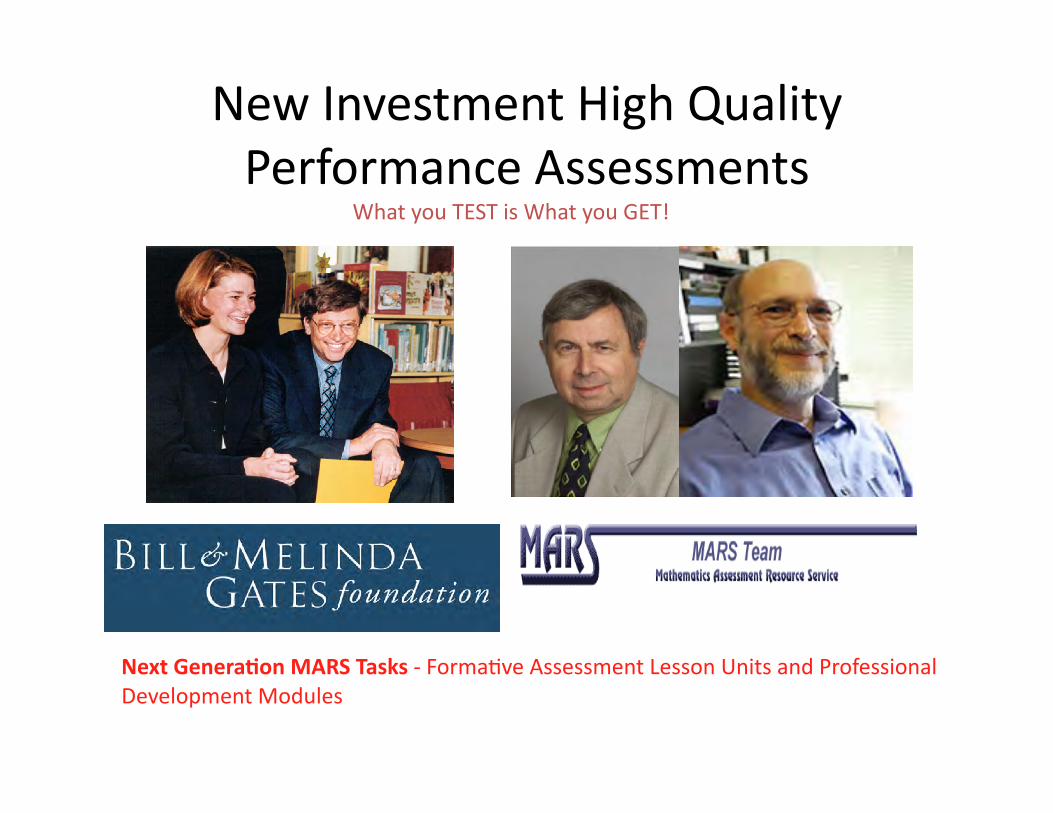
New Investment High Quality Performance Assessments
What you TEST is What you GET!
Next GeneraKon MARS Tasks -‐ Forma+ve Assessment Lesson Units and Professional Development Modules
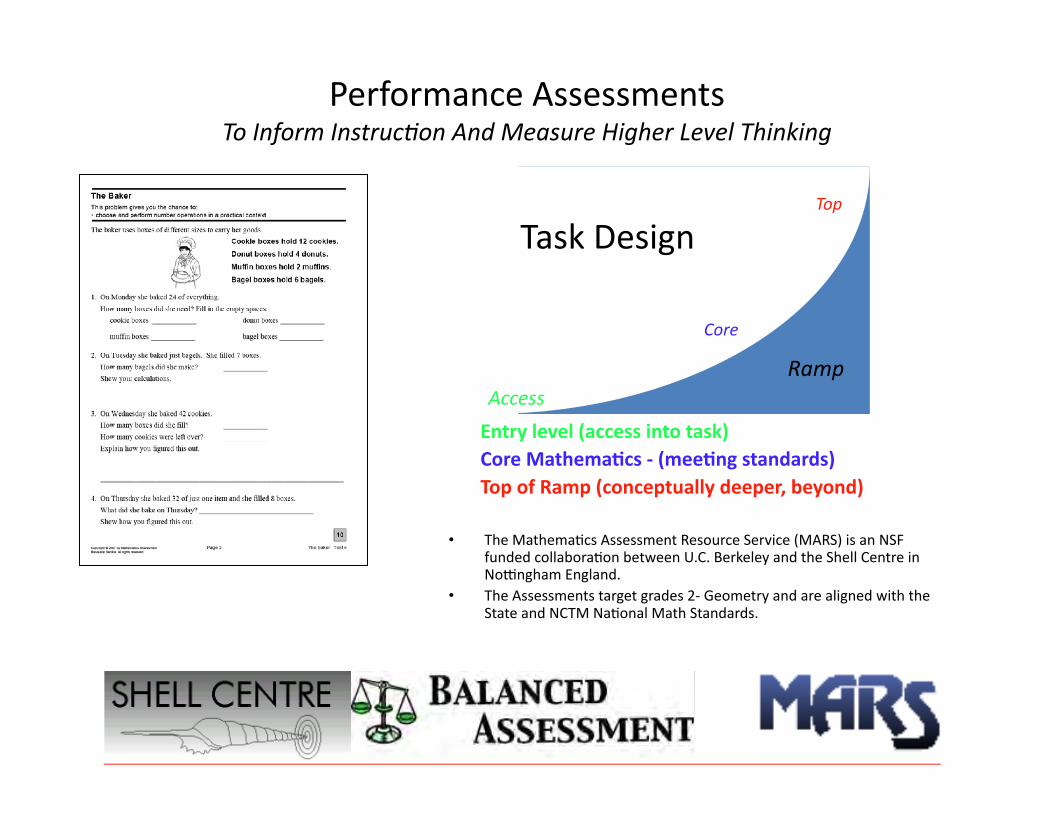
Performance Assessments To Inform Instruc0on And Measure Higher Level Thinking
• The Mathema+cs Assessment Resource Service (MARS) is an NSF funded collabora+on between U.C. Berkeley and the Shell Centre in Noingham England.
• The Assessments target grades 2-‐ Geometry and are aligned with the State and NCTM Na+onal Math Standards.
Ramp Access
Top
Core
Entry level (access into task) Core MathemaKcs -‐ (meeKng standards) Top of Ramp (conceptually deeper, beyond)
Task Design
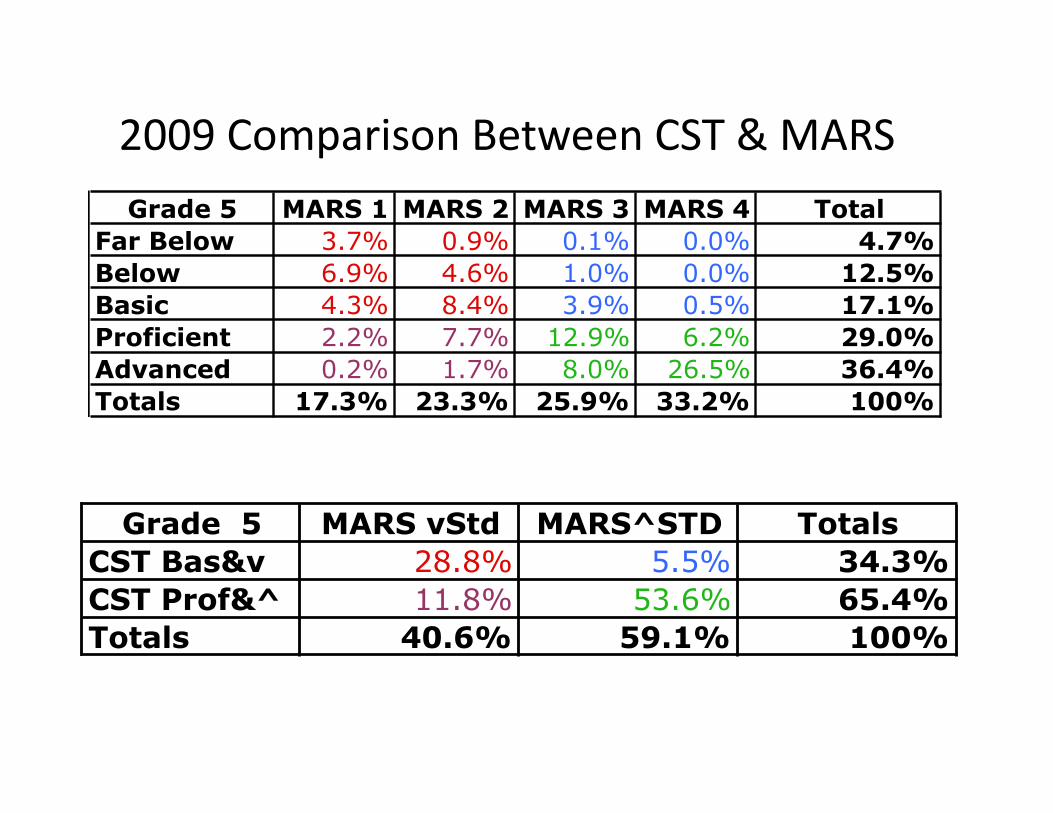
2009 Comparison Between CST & MARS Grade 5 MARS 1 MARS 2 MARS 3 MARS 4 Total
Far Below 3.7% 0.9% 0.1% 0.0% 4.7%Below 6.9% 4.6% 1.0% 0.0% 12.5%Basic 4.3% 8.4% 3.9% 0.5% 17.1%Proficient 2.2% 7.7% 12.9% 6.2% 29.0%Advanced 0.2% 1.7% 8.0% 26.5% 36.4%Totals 17.3% 23.3% 25.9% 33.2% 100%
Grade 5 MARS vStd MARS^STD TotalsCST Bas&v 28.8% 5.5% 34.3%CST Prof&^ 11.8% 53.6% 65.4%Totals 40.6% 59.1% 100%
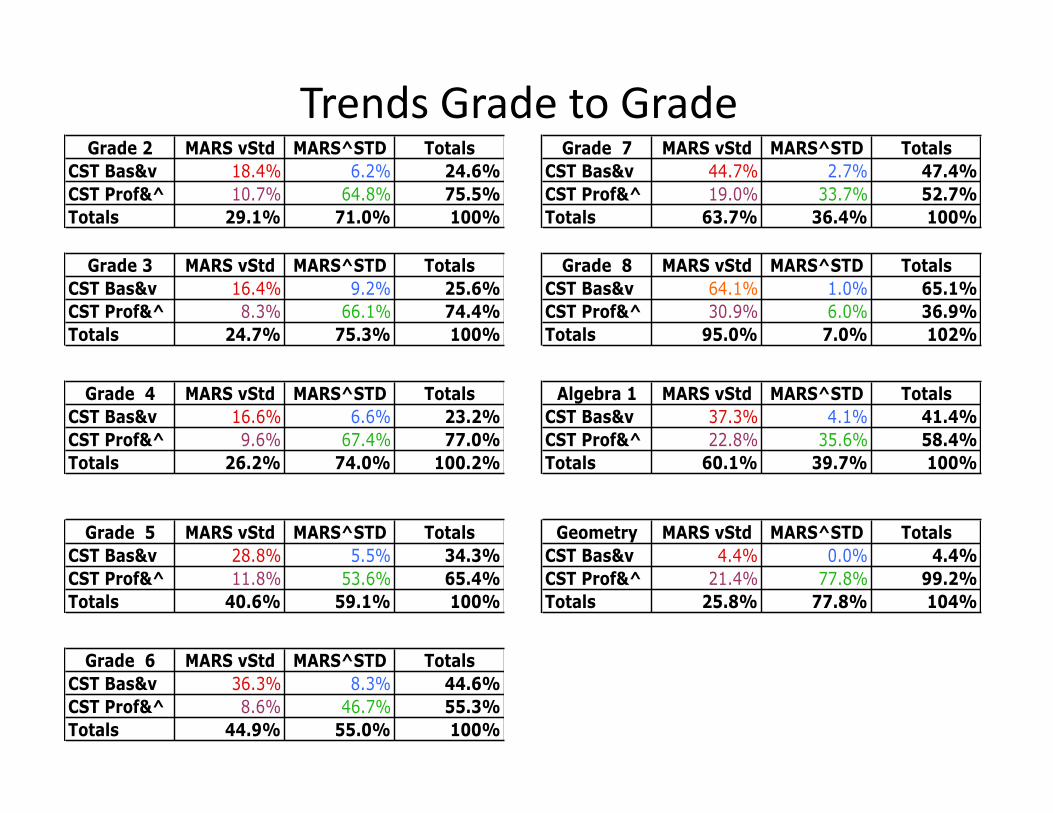
Trends Grade to Grade Grade 2 MARS vStd MARS^STD Totals
CST Bas&v 18.4% 6.2% 24.6%CST Prof&^ 10.7% 64.8% 75.5%Totals 29.1% 71.0% 100%
Grade 3 MARS vStd MARS^STD TotalsCST Bas&v 16.4% 9.2% 25.6%CST Prof&^ 8.3% 66.1% 74.4%Totals 24.7% 75.3% 100%
Grade 4 MARS vStd MARS^STD TotalsCST Bas&v 16.6% 6.6% 23.2%CST Prof&^ 9.6% 67.4% 77.0%Totals 26.2% 74.0% 100.2%
Grade 5 MARS vStd MARS^STD TotalsCST Bas&v 28.8% 5.5% 34.3%CST Prof&^ 11.8% 53.6% 65.4%Totals 40.6% 59.1% 100%
Grade 6 MARS vStd MARS^STD TotalsCST Bas&v 36.3% 8.3% 44.6%CST Prof&^ 8.6% 46.7% 55.3%Totals 44.9% 55.0% 100%
Grade 7 MARS vStd MARS^STD TotalsCST Bas&v 44.7% 2.7% 47.4%CST Prof&^ 19.0% 33.7% 52.7%Totals 63.7% 36.4% 100%
Grade 8 MARS vStd MARS^STD TotalsCST Bas&v 64.1% 1.0% 65.1%CST Prof&^ 30.9% 6.0% 36.9%Totals 95.0% 7.0% 102%
Algebra 1 MARS vStd MARS^STD TotalsCST Bas&v 37.3% 4.1% 41.4%CST Prof&^ 22.8% 35.6% 58.4%Totals 60.1% 39.7% 100%
Geometry MARS vStd MARS^STD TotalsCST Bas&v 4.4% 0.0% 4.4%CST Prof&^ 21.4% 77.8% 99.2%Totals 25.8% 77.8% 104%
Factors that Correlate to Student Achievement Rates
• Parent Educa+on • Economics (poverty -‐ affluence)
• Language Acquisi+on • Ethnicity

Efforts to Leverage Student Learning • Class Size Reduc+on • Whole School Reform (School Governance, Small Schools,
etc. ) • Re-‐vamp class +me (Bell Schedules, Year Around Schools,
Block Schedules, etc.) • Innova+ve Curriculum • Tradi+onal Curriculum (Back to Basics) • High-‐stakes Accountability (rewards/sanc+ons) • Choice (charter schools, magnet schools, etc.) • Centralize Leadership and Policies (State or Na+onal)
Not one of these strategies, in and of itself, has shown to have significant impact on student achievement!
Teaching
The most significant factor in student learning

Good Instruc0on Makes A Difference
Good teaching can make a significant difference in student achievement, equal to one effect size (a standard deviation), which is also equivalent to the affect that demographic classifications can have on achievement.
Paraphrase Dr. Heather Hill, University of Michigan

Our research indicates that there is a 15% variability difference in student achievement between teachers within the same schools.
Deborah Loewenberg Ball

We were led to teacher professional development as the fundamental lever for improving student learning by a growing research base on the influences on student learning, which shows that teacher quality trumps virtually all other influences on student achievement.
(e.g., Darling-Hammond, 1999; Hamre and Pianta, 2005; Hanushek, Kain, O'Brien and Rivken, 2005; Wright, Horn and Sanders, 1997)
What is Effec+ve Teaching?

Next Genera+on Assessments in Mathema+cs
Bill and Melinda Gates Foundation MATHEMATICS ASSESSMENT PROJECT

Malcolm Swan
Forma0ve
Lesson Units

Students start with
pre-‐assessment
tasks ( individual)

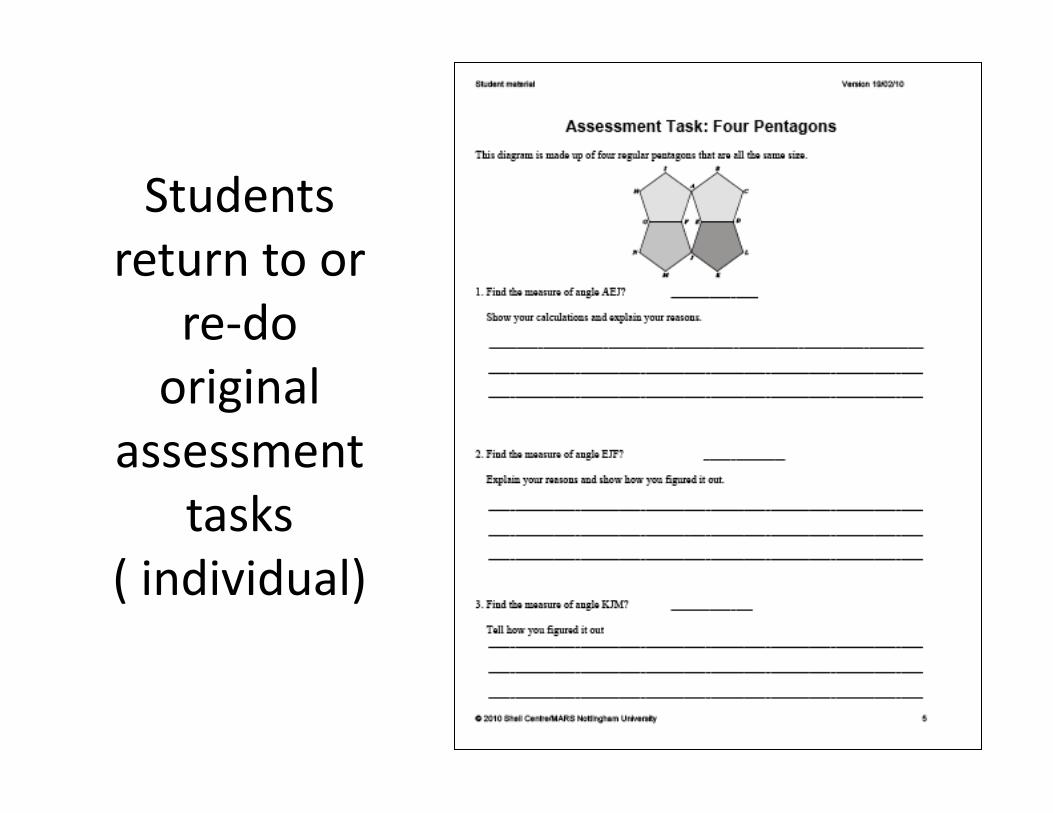
Students return to or
re-‐do original
assessment tasks
( individual)
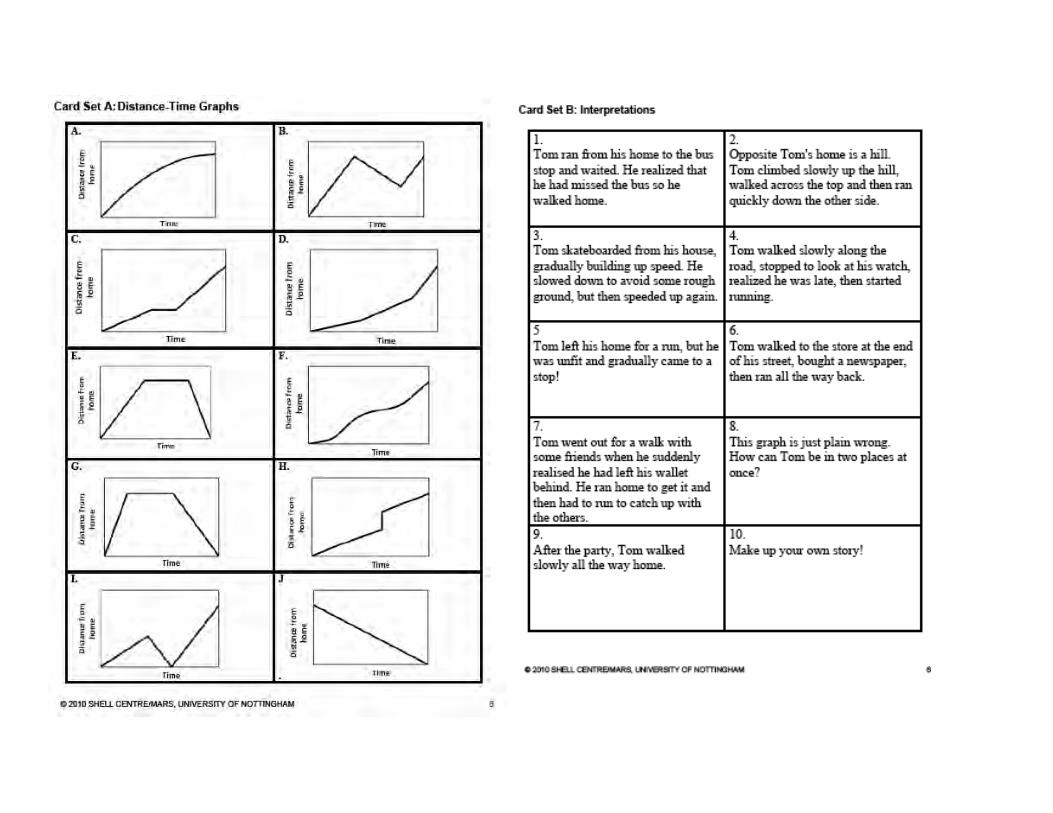
Concept Lessons
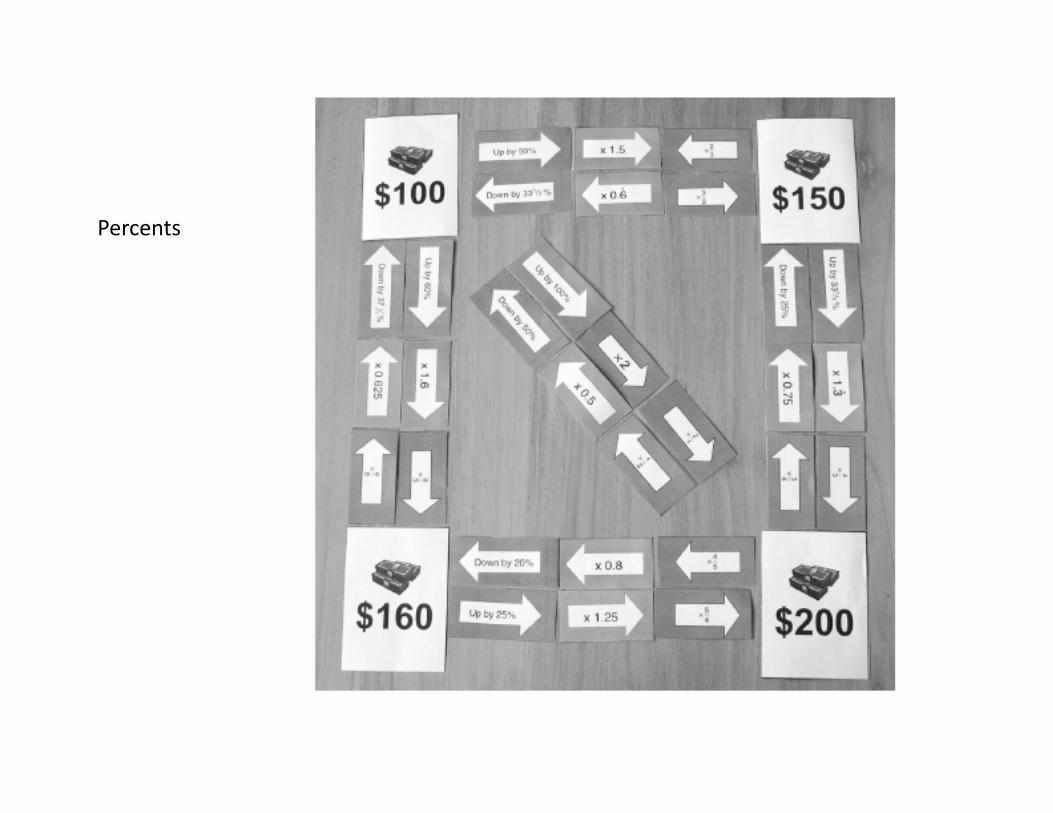
Percents


Problem Solving Lessons

A Case Of Muddying The Waters

Site A Site B
Site C
Site D
New water barrier
River flow
River flow
Factory
Water for domes+c use
Not to scale
Riverside Centre
Exhibit 1

Scene 2: At the Factory

Students’ Materials

Scene 1: The DA’s Office

What is the best strategy to prepare for the new Common Core State
Standards?
Implement an authen0c forma0ve assessment program, implemen0ng high quality performance assessments and develop learning communi0es that are genera0ve and foster teaching and learning.

Forma+ve Assessment Comple0ng the Forma0ve Assessment Cycle

The process of studying student work is a meaningful and challenging way to be data-‐driven, to reflect cri0cally on our instruc0onal prac0ces, and to iden0fy the research we might study to help us think more deeply and carefully about the challenges our students provide us. Rich, complex work samples show us how students are thinking, the fullness of their factual knowledge, the connec0ons they are making. Talking about them together in an accountable way helps us to learn how to adjust instruc0on to meet the needs of our students.
Annenberg Institute of School Reform
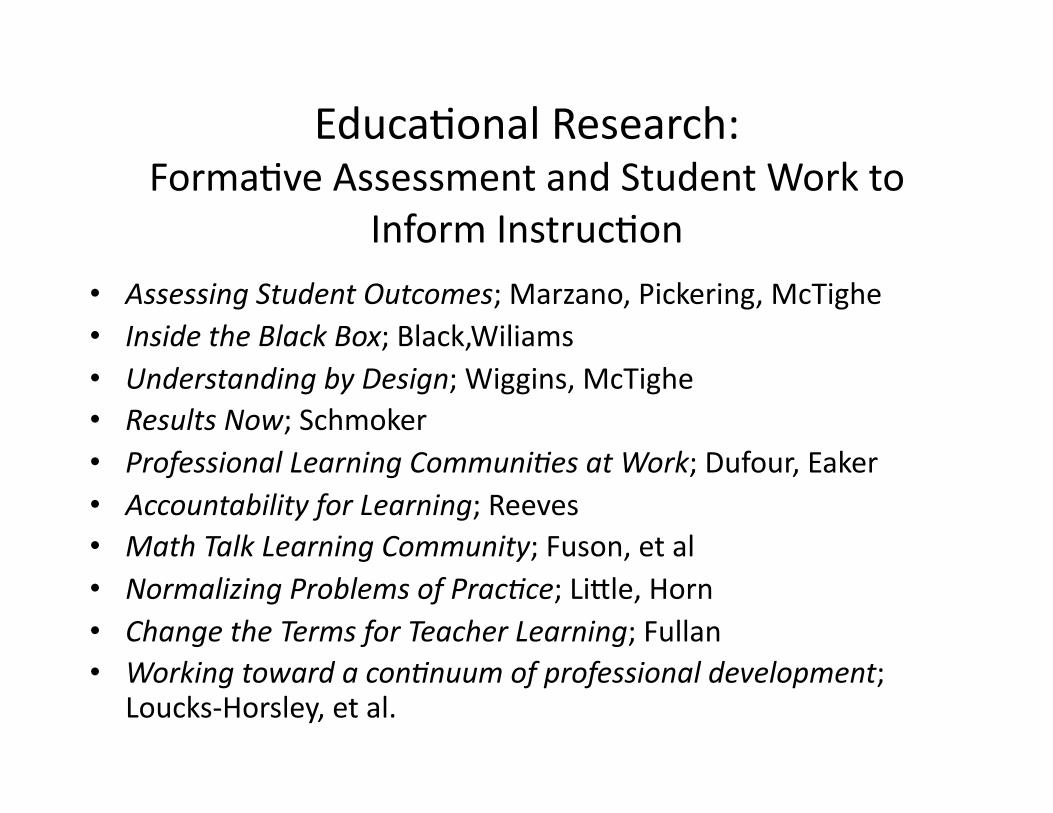
Educa+onal Research: Forma+ve Assessment and Student Work to
Inform Instruc+on • Assessing Student Outcomes; Marzano, Pickering, McTighe • Inside the Black Box; Black,Wiliams • Understanding by Design; Wiggins, McTighe • Results Now; Schmoker • Professional Learning Communi0es at Work; Dufour, Eaker • Accountability for Learning; Reeves • Math Talk Learning Community; Fuson, et al • Normalizing Problems of Prac0ce; LiZle, Horn • Change the Terms for Teacher Learning; Fullan • Working toward a con0nuum of professional development;
Loucks-‐Horsley, et al.
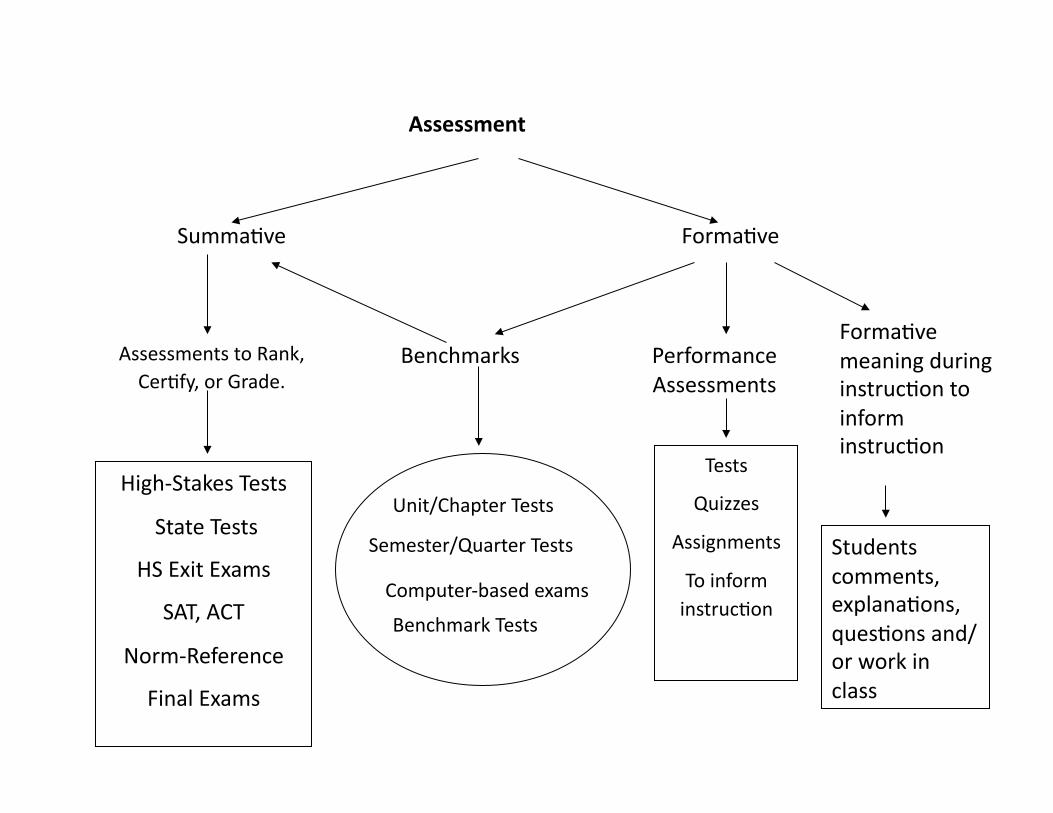
Assessment
Summa+ve Forma+ve
Benchmarks Performance Assessments
Forma+ve meaning during instruc+on to inform instruc+on
Tests
Quizzes
Assignments
To inform instruc+on
Assessments to Rank, Cer+fy, or Grade.
High-‐Stakes Tests
State Tests
HS Exit Exams
SAT, ACT
Norm-‐Reference
Final Exams
Students comments, explana+ons, ques+ons and/or work in class
Unit/Chapter Tests
Benchmark Tests
Semester/Quarter Tests
Computer-‐based exams
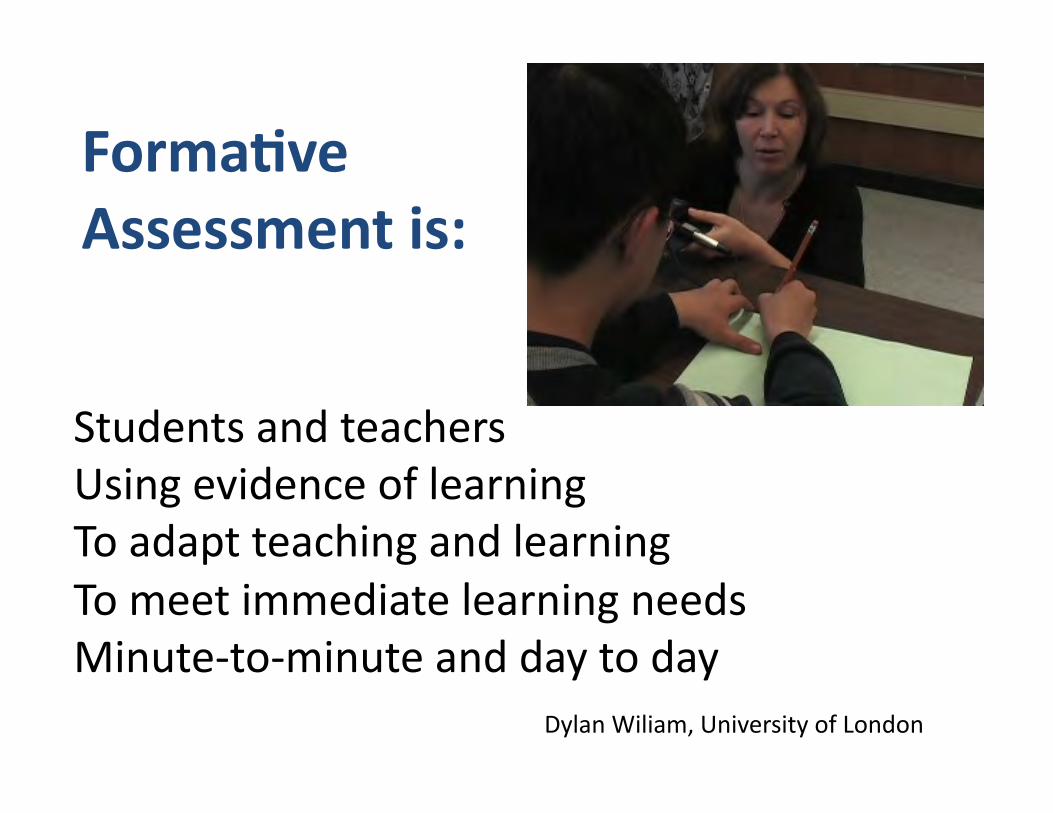
Students and teachers Using evidence of learning To adapt teaching and learning To meet immediate learning needs Minute-‐to-‐minute and day to day
Dylan Wiliam, University of London
FormaKve Assessment is:
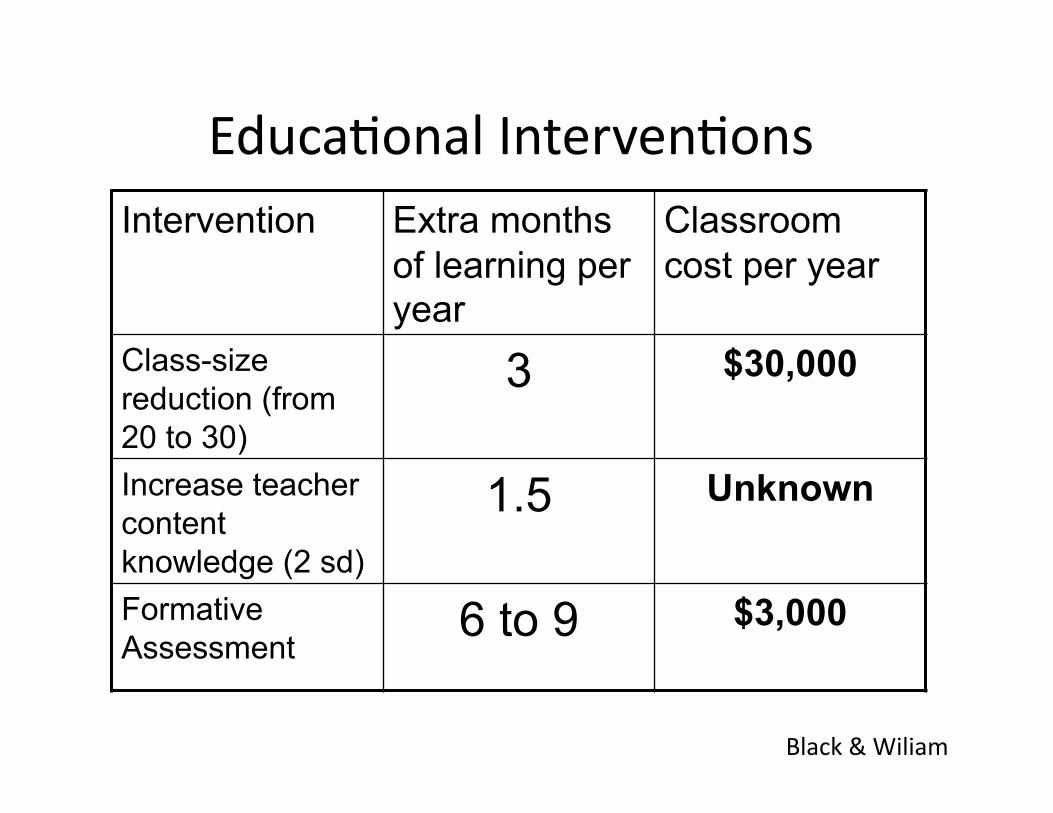
Educa+onal Interven+ons Intervention Extra months
of learning per year
Classroom cost per year
Class-size reduction (from 20 to 30)
3 $30,000
Increase teacher content knowledge (2 sd)
1.5 Unknown
Formative Assessment 6 to 9 $3,000
Black & Wiliam

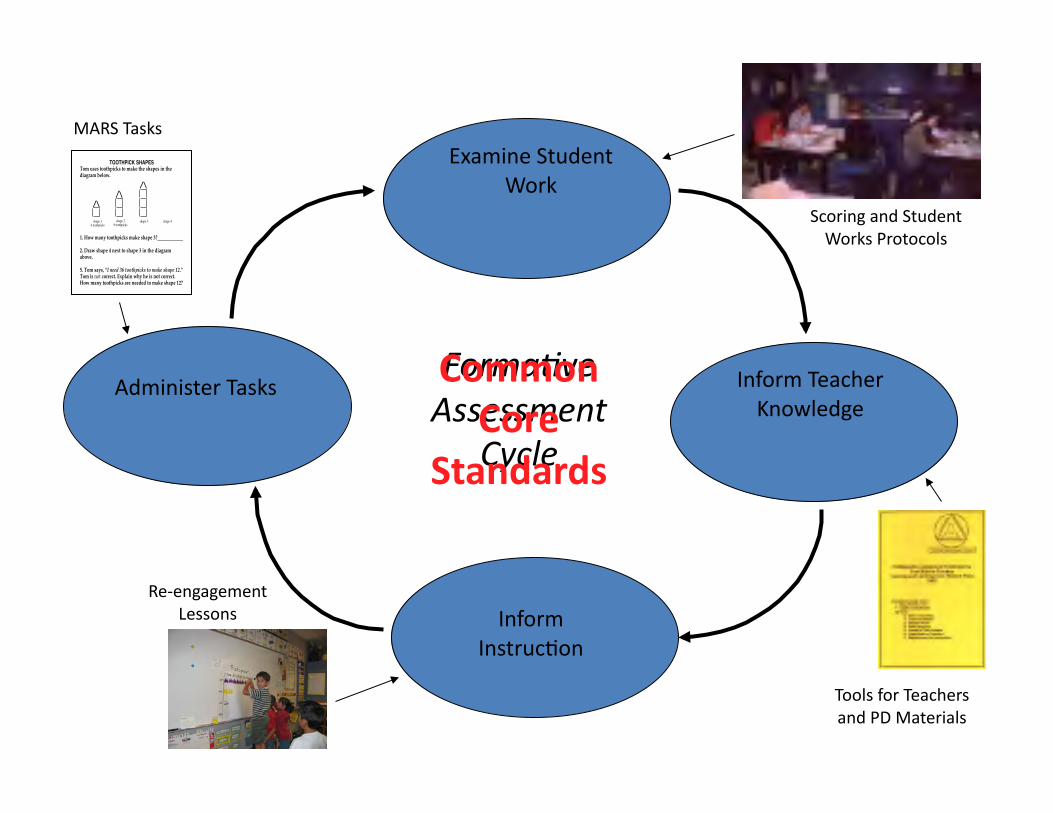
Administer Tasks
Examine Student Work
Inform Teacher Knowledge
Inform Instruc+on
Forma0ve Assessment
Cycle

The Results from an Assessment
X X
X
X
X
X
X
X
X
X
X
X
X
X
X
X
X
X
X
X
X
X
X
X
X
X
X
0 2 3 4 5 6 7 8 9 10 1
Students’ performances are across the con+nuum
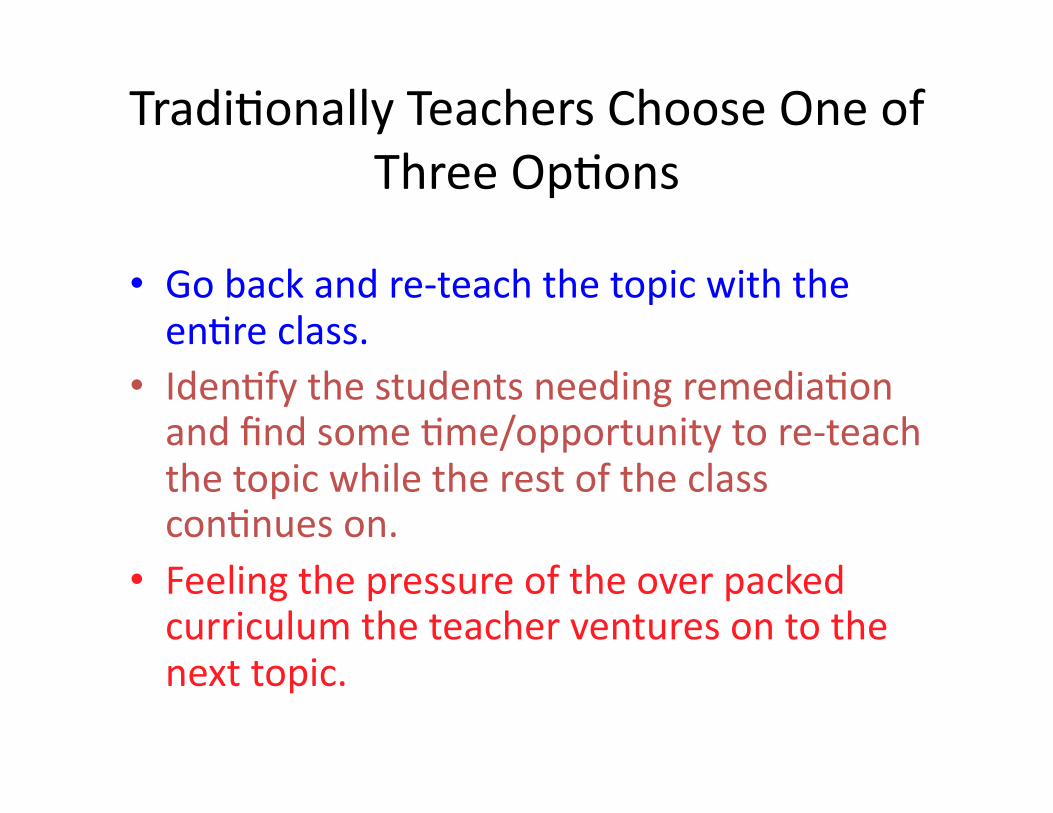
Tradi+onally Teachers Choose One of Three Op+ons
• Go back and re-‐teach the topic with the en+re class.
• Iden+fy the students needing remedia+on and find some +me/opportunity to re-‐teach the topic while the rest of the class con+nues on.
• Feeling the pressure of the over packed curriculum the teacher ventures on to the next topic.

Re-‐Engagement Lessons
Administer Tasks
Examine Student Work
Inform Teacher Knowledge
Inform Instruc+on
Forma0ve Assessment
Cycle
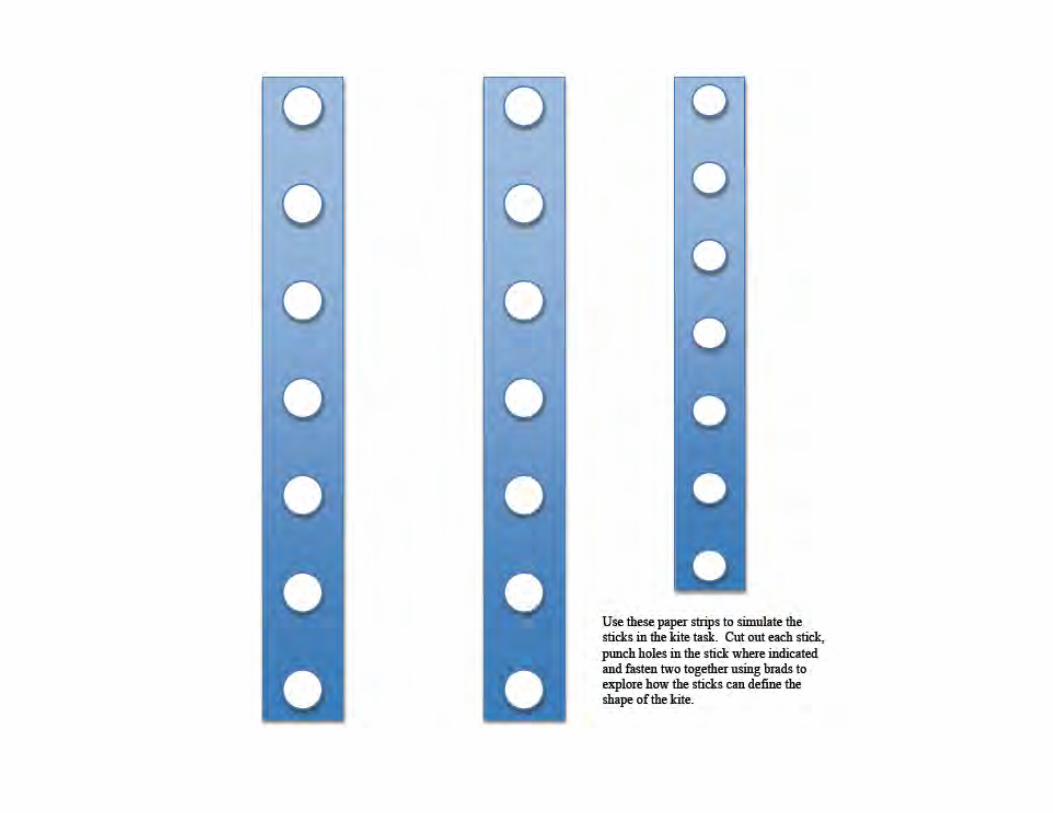
TOOTHPICK SHAPESTom uses toothpicks to make the shapes in thediagram below.
shape 16 toothpicks
shape 29 toothpicks
shape 3 shape 4
1. How many toothpicks make shape 3?_________________
2. Draw shape 4 next to shape 3 in the diagramabove.
5. Tom says, “I need 36 toothpicks to make shape 12.”Tom is not correct. Explain why he is not correct.How many toothpicks are needed to make shape 12?
MARS Tasks
Scoring and Student Works Protocols
Tools for Teachers and PD Materials
Re-‐engagement Lessons
Common Core
Standards

Welcome to the Inside Mathematics Website"
Welcome to Inside Mathematics, a professional resource for educators passionate about improving students' mathematics learning and performance."This site features classroom examples of innovative teaching methods and insights into student learning, tools for mathematics instruction that teachers can use immediately, and video tours of the ideas and materials on the site."Several allied initiatives dedicated to improving math teaching have contributed to this resource. We are glad you're here and look forward to learning with youe"
hZp://www.insidemathema+cs.org

Ques+ons