Commodity Currency Cross Hedging
32
E 05–6 International and Development Economics Asia Pacific School of Economics and Government WORKING PAPERS AUSTRALIAN NATIONAL UNIVERSITY ffective Cross-Hedging for Commodity Currencies Chakriya Bowman Asia Pacific School of Economics and Government THE AUSTRALIAN NATIONAL UNIVERSITY http://apseg.anu.edu.au
-
Upload
shreeharsha123 -
Category
Documents
-
view
312 -
download
6
Transcript of Commodity Currency Cross Hedging
E
05–6
International and Development Economics
Asia Pacific School of Economics and Government
WORKING PAPERS
AUSTRALIAN NATIONAL UNIVERSITY
ffective Cross-Hedging for Commodity Currencies
Asia PacifTHE AUS http://apse
Chakriya Bowman
ic School of Economics and Government TRALIAN NATIONAL UNIVERSITY
g.anu.edu.au
© Chakriya Bowman 2005 Abstract There has been little evidence in the past to support the use of commodity-currency cross-hedges (Demaskey and Pearce, 1998; Benet, 1990; Eaker and Grant, 1987). However, this paper shows that if currencies can be defined as commodity currencies, as per Chen and Rogoff (2003) and Cashin, Ce ́spedes and Sahay (2004), commodity-currency cross-hedges are effective and beneficial. Two commodity currencies, the Papua New Guinea kina and the Australian dollar, are shown here to be effectively hedged by commodity futures. Multiple commodity hedges generally improved performance, with four-commodity basket hedges effective for both currencies.
Effective cross-hedging for commodity currencies Chakriya Bowman
1
Effective Cross-Hedging for Commodity Currencies
Chakriya Bowman∗
Asia Pacific School of Economics and Government, Australian National University, Canberra, ACT 0200, Australia
JEL classification: F31, G15
Keywords: foreign exchange; cross-hedging; commodity currency
Abstract: There has been little evidence in the past to support the use of commodity-
currency cross-hedges (Demaskey and Pearce, 1998; Benet, 1990; Eaker and Grant,
1987). However, this paper shows that if currencies can be defined as commodity
currencies, as per Chen and Rogoff (2003) and Cashin, Ce ́spedes and Sahay (2004),
commodity-currency cross-hedges are effective and beneficial. Two commodity
currencies, the Papua New Guinea kina and the Australian dollar, are shown here to be
effectively hedged by commodity futures. Multiple commodity hedges generally
improved performance, with four-commodity basket hedges effective for both
currencies.
PT The author wishes to thank Satish Chand for input throughout the development of this paper. This paper was funded by an AusAID research grant. The opinions expressed here are those of the author and do not represent those of AusAID or the Commonwealth of Australia. ∗ Chakriya Bowman JG Crawford Building #13, Asia Pacific School of Economics and Government, Australian National University, ACT 0200 AUSTRALIA Tel: +61 2 6125 6556 email: [email protected]
Effective cross-hedging for commodity currencies Chakriya Bowman
2
1 Introduction
Recent studies propose that some currencies are more strongly influenced by
commodity prices than others. Typically these currencies belong to economies that are
largely dependent on primary industry exports for revenue, and they are often referred
to as commodity currencies - that is, currencies whose real exchange rates are
significantly affected by movements in the commodity prices of their primary exports.
Both Cashin, Ce ́spedes and Sahay (2004) and Chen and Rogoff (2003) use long-run
real relationships to identify a number of currencies as commodity currencies, from a
range of both developed and less developed economies. If a currency has a long-run
relationship with the price of its major export commodity prices, it may be anticipated
that futures in these commodities could be used to form an effective cross-hedge.
Cross-hedging can be used in situations where no exchange-traded derivative exists for
a particularly asset, and is therefore a technique that is particularly applicable to
emerging market currencies, which are less likely to have liquid exchange-traded
derivatives. A cross-hedge is created using a different but related asset, for which
exchange-traded derivatives exist, to form a hedge with an asset for which no
exchange-traded derivatives exist. While the hedge created is unlikely to be as
effective as a direct hedge (Eaker and Grant, 1987), a cross-hedge may be preferable to
creating a hedge using potentially more costly over-the-counter products or to leaving
the asset unhedged. Currency cross-hedges are typically formed with the derivatives of
other, related currencies, and have shown to be effective at reducing foreign exchange
risk (Aggarwal and Demaskey, 1997, Bowman, 2004). Cross-hedges can be formed
using any alternative derivative that has some relationship with the asset being hedged,
and so currency cross-hedging is not limited to alternative currency derivatives.
Effective cross-hedging for commodity currencies Chakriya Bowman
3
Commodity derivatives have also been used to cross-hedge currencies, but with little
success. Eaker and Grant (1987) use gold futures to cross-hedge several currencies, but
find that commodity-currency cross-hedges perform poorly compared to currency
cross-hedges. Even in the case of the South African rand, which the authors speculate
would be the most likely of the currencies to result in a successful gold cross-hedge,
gold futures eliminate only a small amount (7%) of risk compared with the
performance of currency hedges. Bennet (1990) also looks at commodity futures in
cross-hedges, motivated specifically by the desire to hedge currency exposures for less
developed countries. However, Bennet also finds no support for the use of commodity
futures to hedge currencies, and finds that the commodity futures hedges actually
increase risk compared to unhedged portfolios. Eaker and Grant likewise found this to
be the case in six of the nine gold/currency hedges they examined. From these studies,
it would not be wrong to conclude that there is little evidence in favour of commodity-
currency cross-hedges.
However, these studies did not seek to identify commodity currencies before creating
the hedge, and, without a demonstrable relationship between the currency and the
hedging commodity, it less likely that any hedge implemented would be successful.
Cashin et al. identify 58 commodity currencies, many in emerging markets, and
identify both the Papua New Guinea kina and the Australian dollar as commodity
currencies. One is from a developed small open economy (the Australian dollar), while
the other is from a least developed small open economy (the kina), and both follow
floating regimes. Indeed, the kina is the most significant of the Pacific Island
currencies, and the only one following a floating regime1. Cashin et al. demonstrate the
1 Note that there is still significant central bank control over the kina, with restrictions on conversions and withdrawls.
Effective cross-hedging for commodity currencies Chakriya Bowman
4
existence of a relationship between and an index of commodity prices and both the
Australian dollar and the kina, showing a significant correlation between real values
from 1980 – 2002. While Chen and Rogoff focus on a small set of major currencies,
they also include the Australian dollar and likewise define it as a commodity currency.
If these two currencies do in fact have long-run relationships with commodity prices, it
is possible that commodity-currency cross-hedges formed with these currencies will be
more effective than those formed with less related currencies. Prior studies of
commodity/currency cross-hedging have omitted this first step, the identification of
sustained relationships between the currency spot and the commodity derivatives. For
example, when examining the effectiveness of the rand/gold hedge, Eaker and Grant
do not provide any evidence to suggest that the value of the rand is in fact significantly
related to the gold price. Cashin et al. do not identify the rand as a commodity
currency, and it is possible that no relationship exists that is significant enough to
enable an effective cross-hedge to be formed.
If commodity-currency cross hedges can be shown to be effective, this provides an
alternative hedging strategy for an investor wishing to hedge exchange rate risk. This
can be particularly important for investors working in emerging markets, where
opportunities to implement a direct hedge using liquid exchange-traded currency
futures are fewer. This is particularly the case for the Papua New Guinea kina, as no
exchange-traded market exists for kina futures. The only alternative to a cross-hedge is
an over-the-counter solution provided by a bank, which may prove costly and can be
difficult to sell if the position of the investor changes (Stulz, 2004). A liquid exchange-
traded futures market exists for the Australian dollar, and this will be used to contrast
the effectiveness of the cross-hedge with that of a direct hedge.
Effective cross-hedging for commodity currencies Chakriya Bowman
5
This study begins by determining the most related commodities to the Australian dollar
and Papua New Guinea kina using correlation and cointegration analysis. These results
form the basis of a set of commodity futures that may be used to hedge each of the two
currencies. This study will investigate whether these two commodity currencies are
able to create effective hedges using commodity futures, where effective hedges are
defined as those providing an improvement in performance (using a variety of metrics
discussed in section 2) relative to the performance of the unhedged currency.
Once a relationship has been demonstrated between the two currencies and their major
commodity exports, commodity futures are then used to form moving-window hedges.
Both single commodity hedge and basket hedges, using two or four commodities, are
implemented and their performance contrasted. The well documented time-varying
nature of hedge ratios (Lien and Tse, 2002) is incorporated into this methodology
through the use of moving window (3 month) hedges, and by the use of t-statistics to
select commodity futures in order to determine the most appropriate two or four
commodities with which to form the hedge. This results in a number of different
combinations of commodity derivatives being used over the hedging period (January
1996 – September 2003).
As anticipated, commodity-currency cross-hedges are shown to be effective for both
these currencies, providing performance improvements over an unhedged currency
exposure. They are particularly effective in the case of Papua New Guinea, the country
with the greatest reliance on commodities for export revenue. Interestingly, gold is not
a particularly good hedge of these currencies during the study period, despite being a
major export for both countries, and a study restricting itself to gold, as with Eaker and
Grant, may not have found overwhelming evidence in favour of commodity-currency
Effective cross-hedging for commodity currencies Chakriya Bowman
cross-hedging. Four-commodity basket hedges form effective hedges and provide good
risk-return tradeoffs, indicating that this technique may be a useful and profitable way
to form a hedge for commodity currencies.
2 Method
In their studies of commodity currencies, both Cashin et al. (2004) and Chen and
Rogoff (2003) construct commodity indices with which they identify relationships
between currencies and commodities. Cashin et al. use the International Monetary
Fund’s International Financial Statistics Real Effective Exchange Rate (based on
relative CPI) to demonstrate this relationship. The Real Effective Exchange Rate
(REER) is defined as
( )[ ]⎭⎬⎫
⎩⎨⎧
=
∑=
n
ijjij
iii
NPW
NPREER
1lnexp
(1)
where i is the country in question,
j is an index of country i’s trading partners or competitors,
Wij is a weighting of trade between country i and country j,
Pi, Pj are seasonally adjusted CPI in country i and country j,
and Ni, Nj are the nominal exchange rates of each country in US dollars
with REERi in logs. Note that the consumer price indices are indices of trade in
manufacturing, services and non-oil primary commodities. A decline in REERi is
indicative of an increase in the country i’s international competitiveness, and the index
is baselined in 2000. The IMF International Financial Statistics database provides the
REER for Australia and Papua New Guinea. The REER indices are tested for the
6
Effective cross-hedging for commodity currencies Chakriya Bowman
presence of a unit root using the Augmented Dickey-Fuller (ADF) and Philips-Perron
(PP) tests (Dickey and Fuller, 1981; Philips and Perron, 1988).
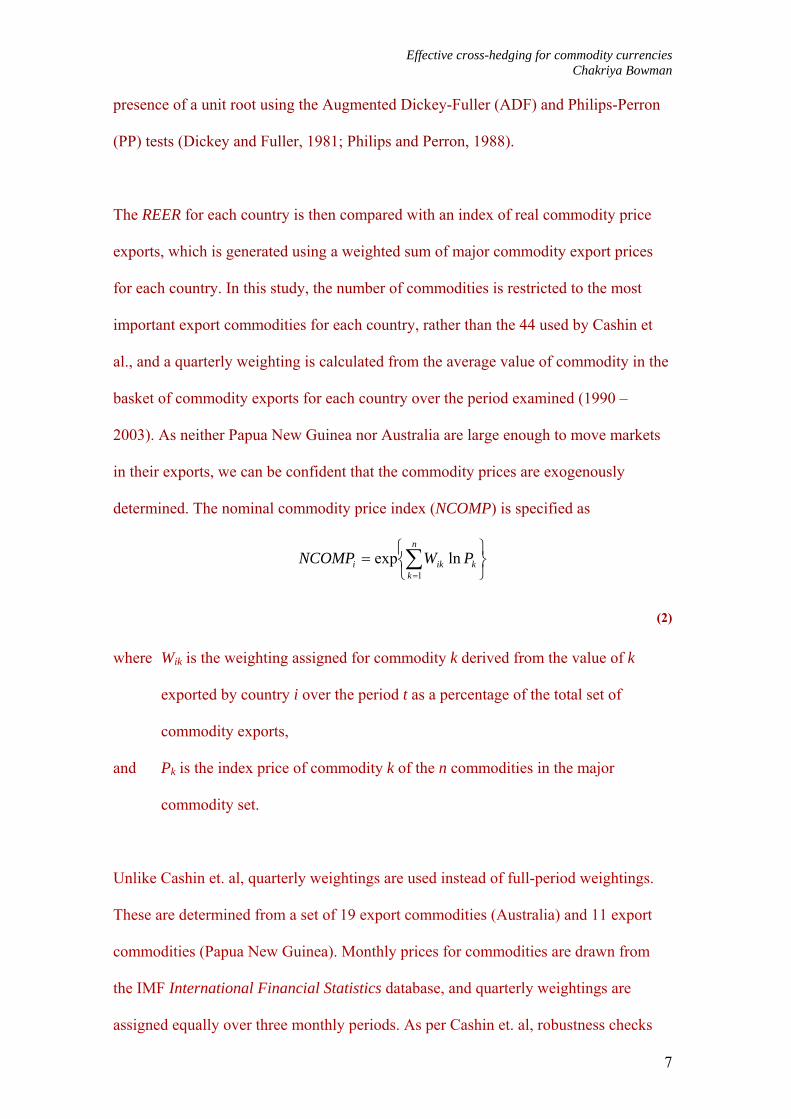
The REER for each country is then compared with an index of real commodity price
exports, which is generated using a weighted sum of major commodity export prices
for each country. In this study, the number of commodities is restricted to the most
important export commodities for each country, rather than the 44 used by Cashin et
al., and a quarterly weighting is calculated from the average value of commodity in the
basket of commodity exports for each country over the period examined (1990 –
2003). As neither Papua New Guinea nor Australia are large enough to move markets
in their exports, we can be confident that the commodity prices are exogenously
determined. The nominal commodity price index (NCOMP) is specified as
⎭⎬⎫
⎩⎨⎧
= ∑=
n
kkiki PWNCOMP
1lnexp
(2)
where Wik is the weighting assigned for commodity k derived from the value of k
exported by country i over the period t as a percentage of the total set of
commodity exports,
and Pk is the index price of commodity k of the n commodities in the major
commodity set.
Unlike Cashin et. al, quarterly weightings are used instead of full-period weightings.
These are determined from a set of 19 export commodities (Australia) and 11 export
commodities (Papua New Guinea). Monthly prices for commodities are drawn from
the IMF International Financial Statistics database, and quarterly weightings are
assigned equally over three monthly periods. As per Cashin et. al, robustness checks
7
Effective cross-hedging for commodity currencies Chakriya Bowman
have been performed by comparing the Australian NCOMP index with the Reserve
Bank of Australia’s Monthly Commodity Index, with satisfactory results. The nominal
NCOMP indices are then converted to real indices using the IMF’s Manufactures Unit
Value deflator.
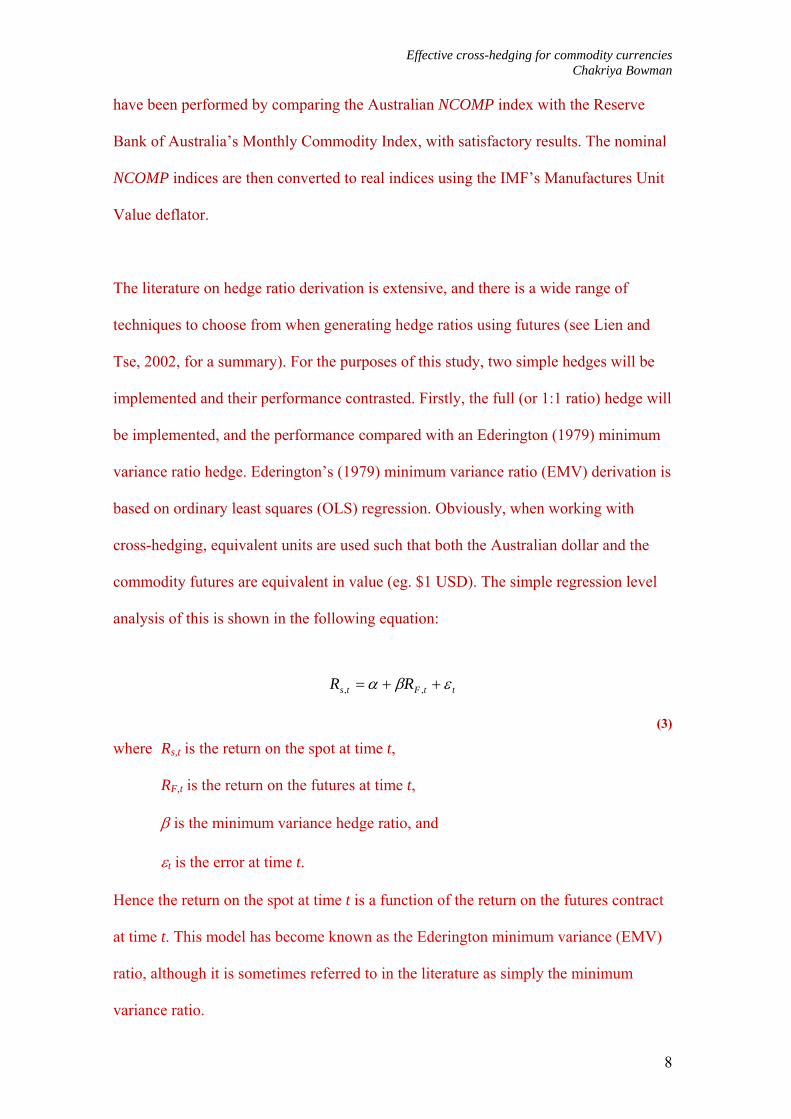
The literature on hedge ratio derivation is extensive, and there is a wide range of
techniques to choose from when generating hedge ratios using futures (see Lien and
Tse, 2002, for a summary). For the purposes of this study, two simple hedges will be
implemented and their performance contrasted. Firstly, the full (or 1:1 ratio) hedge will
be implemented, and the performance compared with an Ederington (1979) minimum
variance ratio hedge. Ederington’s (1979) minimum variance ratio (EMV) derivation is
based on ordinary least squares (OLS) regression. Obviously, when working with
cross-hedging, equivalent units are used such that both the Australian dollar and the
commodity futures are equivalent in value (eg. $1 USD). The simple regression level
analysis of this is shown in the following equation:
ttFts RR εβα ++= ,,
(3)
where Rs,t is the return on the spot at time t,
RF,t is the return on the futures at time t,
β is the minimum variance hedge ratio, and
εt is the error at time t.
Hence the return on the spot at time t is a function of the return on the futures contract
at time t. This model has become known as the Ederington minimum variance (EMV)
ratio, although it is sometimes referred to in the literature as simply the minimum
variance ratio.
8
Effective cross-hedging for commodity currencies Chakriya Bowman
Other hedge ratio derivation techniques have been explored with cross-hedging, such
as the error-correction model ratio hedge examined by Ghosh (1996). However,
Bowman (2004) does not find conclusive evidence in favour of the error-correction
model ratio hedge performance over the EMV ratio hedge, and more complex hedge
ratio derivation methods have been omitted in favour of the EMV ratio. It may be
worthwhile to consider alternate ratio estimation models, such as the error-correction
model which capitalises on long-run relationships between spot and futures prices, but
that will be left for future study.
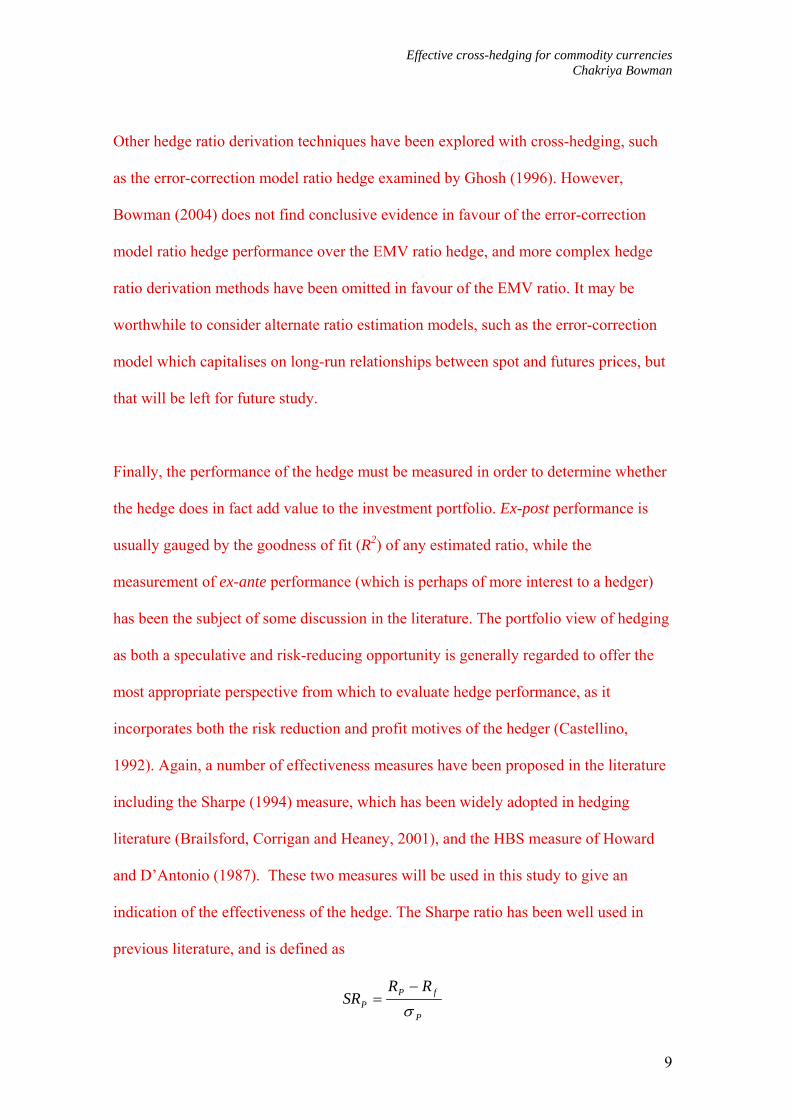
Finally, the performance of the hedge must be measured in order to determine whether
the hedge does in fact add value to the investment portfolio. Ex-post performance is
usually gauged by the goodness of fit (R2) of any estimated ratio, while the
measurement of ex-ante performance (which is perhaps of more interest to a hedger)
has been the subject of some discussion in the literature. The portfolio view of hedging
as both a speculative and risk-reducing opportunity is generally regarded to offer the
most appropriate perspective from which to evaluate hedge performance, as it
incorporates both the risk reduction and profit motives of the hedger (Castellino,
1992). Again, a number of effectiveness measures have been proposed in the literature
including the Sharpe (1994) measure, which has been widely adopted in hedging
literature (Brailsford, Corrigan and Heaney, 2001), and the HBS measure of Howard
and D’Antonio (1987). These two measures will be used in this study to give an
indication of the effectiveness of the hedge. The Sharpe ratio has been well used in
previous literature, and is defined as
P
fPP
RRSR
σ−
=
9
Effective cross-hedging for commodity currencies Chakriya Bowman
(4)
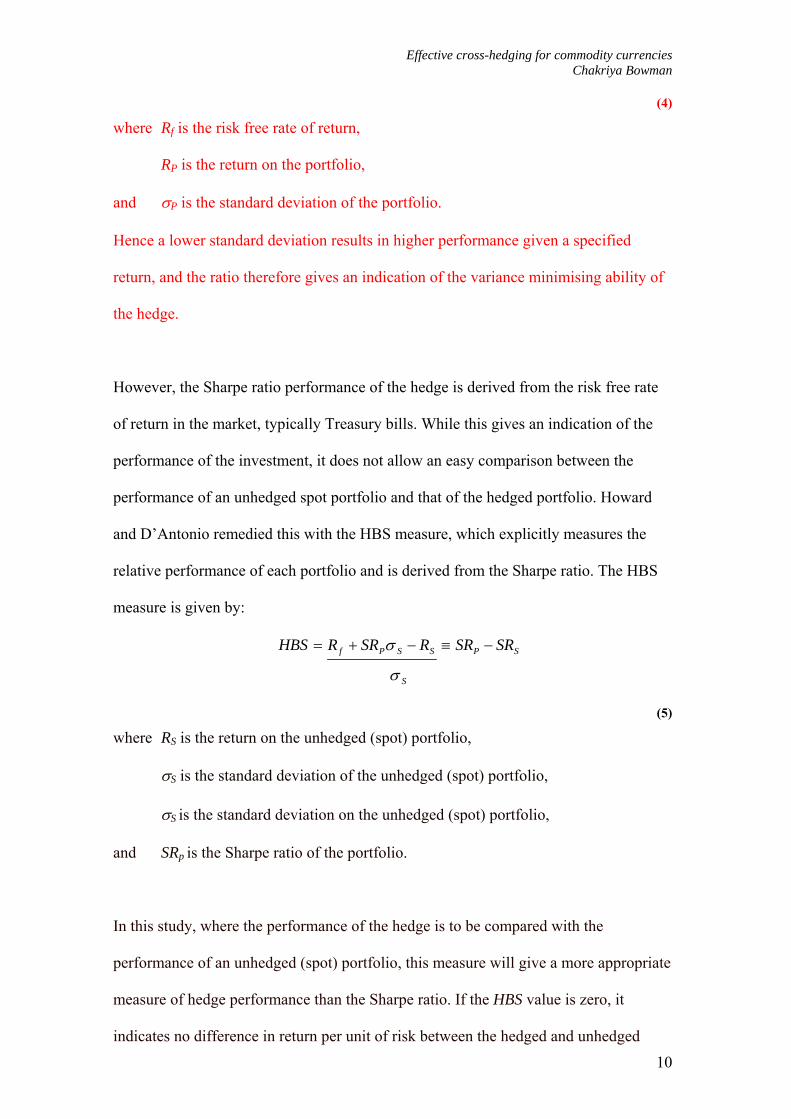
where Rf is the risk free rate of return,
RP is the return on the portfolio,
and σP is the standard deviation of the portfolio.
Hence a lower standard deviation results in higher performance given a specified
return, and the ratio therefore gives an indication of the variance minimising ability of
the hedge.
However, the Sharpe ratio performance of the hedge is derived from the risk free rate
of return in the market, typically Treasury bills. While this gives an indication of the
performance of the investment, it does not allow an easy comparison between the
performance of an unhedged spot portfolio and that of the hedged portfolio. Howard
and D’Antonio remedied this with the HBS measure, which explicitly measures the
relative performance of each portfolio and is derived from the Sharpe ratio. The HBS
measure is given by:
S
SPSSPf SRSRRSRRHBS
σ
σ −≡−+=
(5)
where RS is the return on the unhedged (spot) portfolio,
σS is the standard deviation of the unhedged (spot) portfolio,
σS is the standard deviation on the unhedged (spot) portfolio,
and SRp is the Sharpe ratio of the portfolio.
In this study, where the performance of the hedge is to be compared with the
performance of an unhedged (spot) portfolio, this measure will give a more appropriate
measure of hedge performance than the Sharpe ratio. If the HBS value is zero, it
indicates no difference in return per unit of risk between the hedged and unhedged 10
Effective cross-hedging for commodity currencies Chakriya Bowman
11
portfolio. A negative HBS value indicates that the unhedged portfolio shows a higher
return per unit of risk than the hedged portfolio, and a positive value shows that the
hedged portfolio shows a relatively higher return per unit of risk. For an investor to
prefer the hedged portfolio, the HBS value should be positive.
Basket Hedge Formation
Over time, the strength of the correlation between spot and futures prices may vary,
and it is not always the case that the commodity with the strongest long-term
relationships will form the most effective short-term hedge. This characteristic will be
explored using basket hedges. For each period, those commodities generating the
highest t-statistics when regressed on the currency in question will be used to form
hedges. One-, two- and four-commodity basket hedges will be created this way. One
commodity basket hedges can be contrasted with those found using the same
commodity in all periods, and effectively illustrate the way preference for a specific
commodity may change over time. This creates a sequence of period-specific hedge
combinations, which is applicable to practical implementation as similar calculations
could be performed by practitioners before selecting commodities with which to
implement hedges. Of course, any increase in the number of commodities used to form
a hedge may result in greater transaction costs, and as always careful consideration of
the costs to the individual must be considered before a hedging decision is made.
However, as these vary according to individual circumstance, transaction costs will not
be considered in this study.
Effective cross-hedging for commodity currencies Chakriya Bowman
12
3 Data
Testing for commodity currency status will use the method of Cashin et al. (2004) with
REER statistics sourced from the IMF International Financial Statistics database.
NCOMP indices for both Australia and Papua New Guinea are derived from IMF
International Financial Statistics commodity prices (with the exception of coffee,
which is derived from the International Coffee Organisation composite index), while
quarterly weightings are derived from composition of trade statistics published by the
Department of Foreign Affairs and Trade (Australia) and Bank of Papua New Guinea
(Papua New Guinea). The data set, from January 1990 to September 2003, provides
192 monthly observations per series. The top Australian exports by value (excluding
petroleum) are generally coal, iron ore, gold, aluminium, wheat and beef2. It is most
likely that these commodities, if any, will impact on the price of the Australian dollar.
Likewise, the most important exports for Papua New Guinea are generally gold,
copper, crude oil, logs, palm oil, cocoa and coffee3. This study will focus on non-
petroleum based commodities, which are less likely to be influenced by global non-
economic factors - the exclusion of petroleum commodities from the study is a
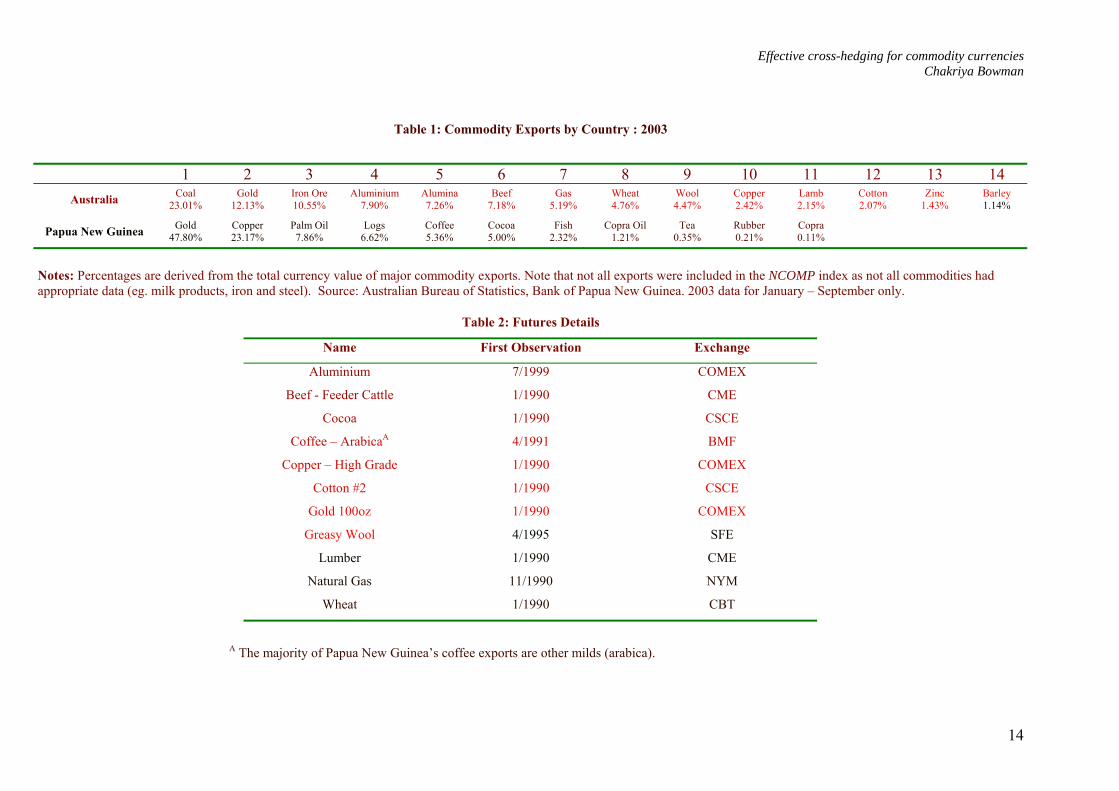
convention used throughout the commodity literature4. Rankings of the most important
non- petroleum commodities for both Australia and Papua New Guinea can be found in
Table 1.
This study will focus on liquid exchange-traded commodity futures for each currency.
Contracts are listed on several exchanges and monthly price series were obtained from
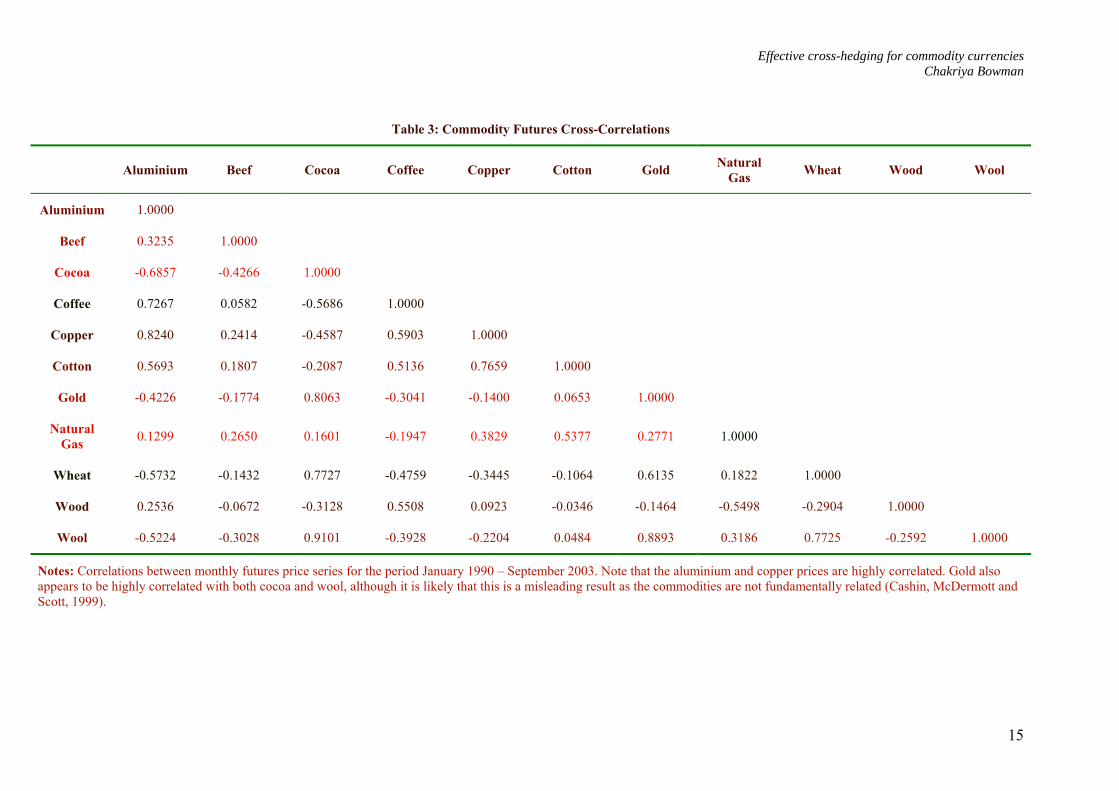
Datastream (details in Table 2). Cross-correlation results indicate that most commodity
futures series are unrelated (Table 3), the exceptions being the pair of aluminium and
2 Department of Foreign Affairs and Trade, Exports of Primary and Manufactured Products, 2002, 2003. 3 Bank of Papua New Guinea export statistics, 1990 - 2003
Effective cross-hedging for commodity currencies Chakriya Bowman
13
copper (0.824). Hedges are implemented from March 1996, with the final hedge
commencing in June 2003. Due to the restricted duration of the aluminium futures
series, the first aluminium hedge commences in January 2000. A moving window
approach is used, resulting in 88 hedges (42 for aluminium) implemented for each
currency. Sharpe ratios are calculated using US 90-day Treasury Bills.
4 See both Chen and Rogoff (2003) and Cashin et. al (2002).
Effective cross-hedging for commodity currencies Chakriya Bowman
Table 1: Commodity Exports by Country : 2003
1 2 3 4 5 6 7 8 9 10 11 12 13 14
Australia Coal 23.01%
Gold 12.13%
Iron Ore 10.55%
Aluminium 7.90%
Alumina 7.26%
Beef 7.18%
Gas 5.19%
Wheat 4.76%
Wool 4.47%
Copper 2.42%
Lamb 2.15%
Cotton 2.07%
Zinc 1.43%
Barley 1.14%
Papua New Guinea Gold 47.80%
Copper 23.17%
Palm Oil 7.86%
Logs 6.62%
Coffee 5.36%
Cocoa 5.00%
Fish 2.32%
Copra Oil 1.21%
Tea 0.35%
Rubber 0.21%
Copra 0.11%
Notes: Percentages are derived from the total currency value of major commodity exports. Note that not all exports were included in the NCOMP index as not all commodities had appropriate data (eg. milk products, iron and steel). Source: Australian Bureau of Statistics, Bank of Papua New Guinea. 2003 data for January – September only.
Table 2: Futures Details
Name First Observation Exchange
Aluminium 7/1999 COMEX
Beef - Feeder Cattle 1/1990 CME
Cocoa 1/1990 CSCE
Coffee – ArabicaA 4/1991 BMF
Copper – High Grade 1/1990 COMEX
Cotton #2 1/1990 CSCE
Gold 100oz 1/1990 COMEX
Greasy Wool 4/1995 SFE
Lumber 1/1990 CME
Natural Gas 11/1990 NYM
Wheat 1/1990 CBT
A The majority of Papua New Guinea’s coffee exports are other milds (arabica).
14
Effective cross-hedging for commodity currencies Chakriya Bowman
Table 3: Commodity Futures Cross-Correlations
Aluminium Beef Cocoa Coffee Copper Cotton Gold Natural Gas Wheat Wood Wool
Aluminium 1.0000
Beef 0.3235 1.0000
Cocoa -0.6857 -0.4266 1.0000
Coffee 0.7267 0.0582 -0.5686 1.0000
Copper 0.8240 0.2414 -0.4587 0.5903 1.0000
Cotton 0.5693 0.1807 -0.2087 0.5136 0.7659 1.0000
Gold -0.4226 -0.1774 0.8063 -0.3041 -0.1400 0.0653 1.0000
Natural Gas 0.1299 0.2650 0.1601 -0.1947 0.3829 0.5377 0.2771 1.0000
Wheat -0.5732 -0.1432 0.7727 -0.4759 -0.3445 -0.1064 0.6135 0.1822 1.0000
Wood 0.2536 -0.0672 -0.3128 0.5508 0.0923 -0.0346 -0.1464 -0.5498 -0.2904 1.0000
Wool -0.5224 -0.3028 0.9101 -0.3928 -0.2204 0.0484 0.8893 0.3186 0.7725 -0.2592 1.0000
Notes: Correlations between monthly futures price series for the period January 1990 – September 2003. Note that the aluminium and copper prices are highly correlated. Gold also appears to be highly correlated with both cocoa and wool, although it is likely that this is a misleading result as the commodities are not fundamentally related (Cashin, McDermott and Scott, 1999).
15

Effective cross-hedging for commodity currencies Chakriya Bowman
16
4 Results
This paper proceeds in two steps: initially, the REER of each country is analysed along
with RCOMP series constructed from the real prices of a suitable set of commodities to
determine if the currencies examined here can be described as commodity currencies.
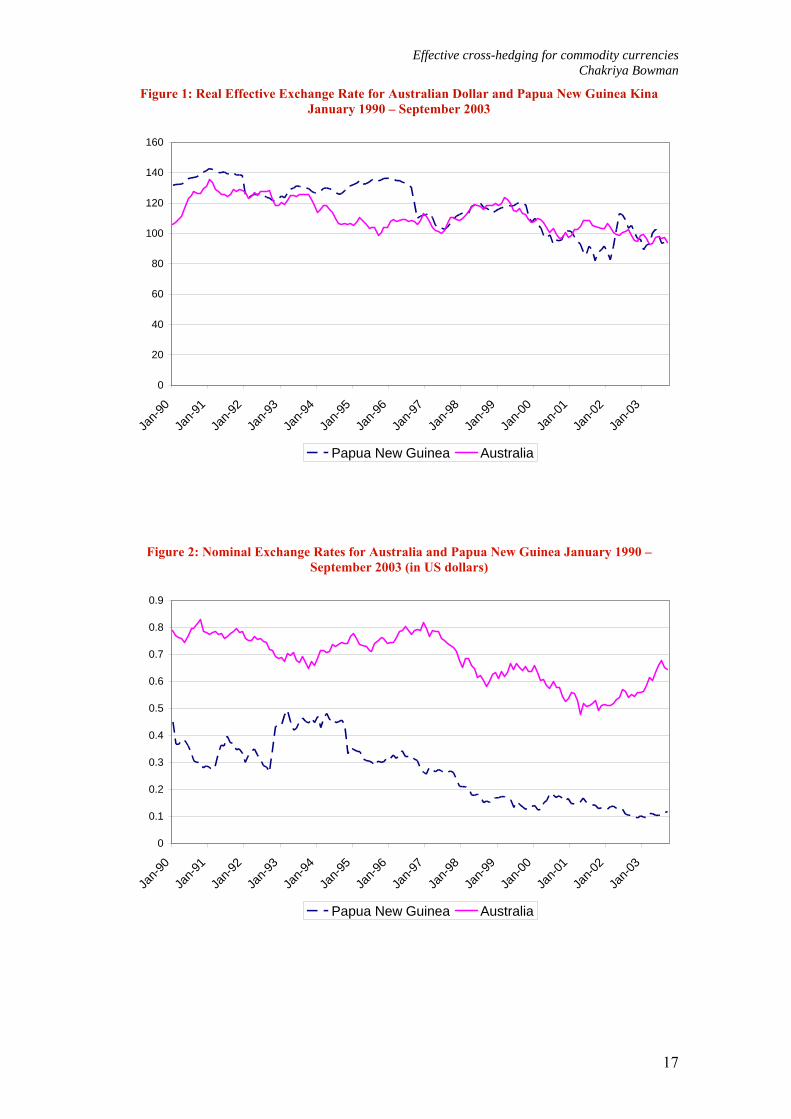
From an initial visual examination, it is evident that both the Australia and Papua New
Guinea REER declined in value over the study period (Figure 1). The most significant
decline has been for Papua New Guinea, which lost around 25% of its value in real
terms over the 13 year period. A similar decline in value against the US dollar is
evident from the nominal currency graph (Figure 2). Unit root testing indicates that
both REER indices are unit root processes, characterised with an intercept and trend.
The Australia REER rejects the null of no unit root for all three unit root tests, while
the Papua New Guinea REER rejects the null for two of the three tests. Importantly, the
Zivot and Andrews test indicates the presence of structural breaks in both series,
finding in favour of a unit root under these conditions. The presence of a structural
break may explain the low power of the Phillips-Perron test in the case of the
Australian REER, and the inability to reject the null hypothesis in the case of Papua
New Guinea. There is no evidence to suggest the RCOMP series contain a unit root.
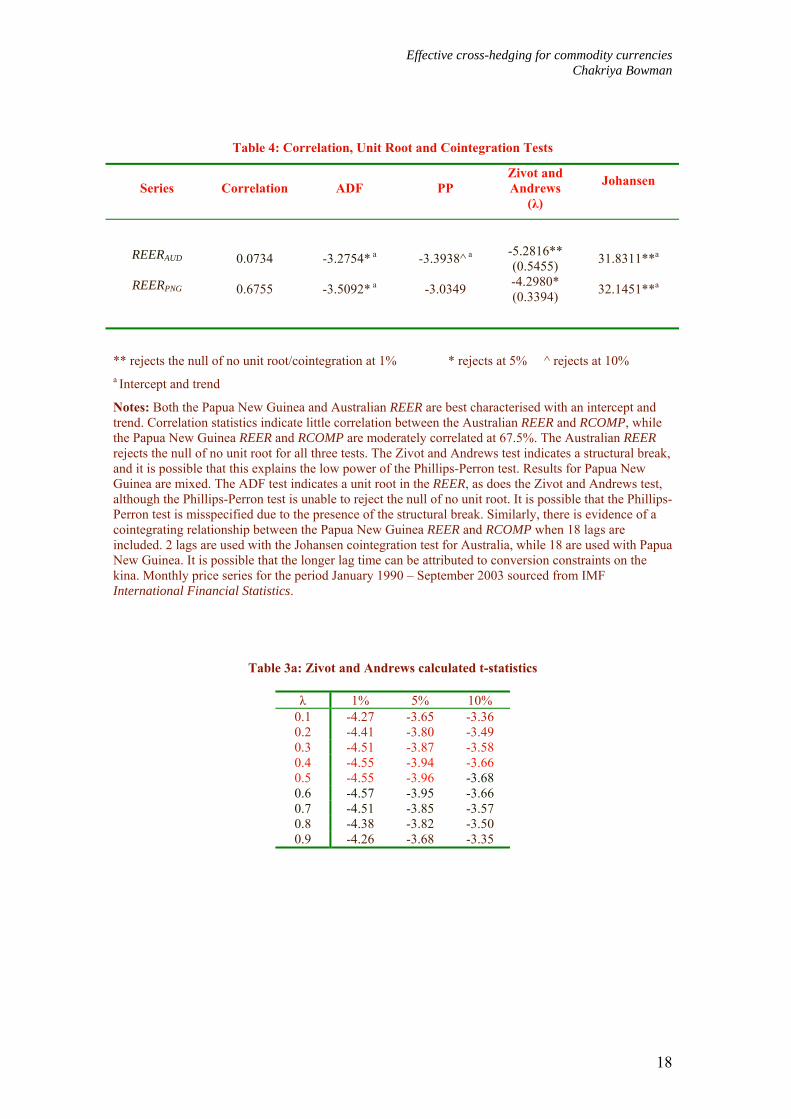
Correlation testing (Table 4) indicates little correlation between the Australian REER
and RCOMP (7.34%), but the results of the Johansen cointegration test are significant,
with evidence for cointegration at the 1% level with two lags. The Papua New Guinea
is more highly correlated with the RCOMP index (67.55%), and there is also evidence
of cointegration albeit with 18 lags in the equation. These results are consistent with
the findings of prior studies, and indicate that both the Papua New Guinea kina and the
Australian dollar are commodity currencies.
Effective cross-hedging for commodity currencies Chakriya Bowman
17
Figure 1: Real Effective Exchange Rate for Australian Dollar and Papua New Guinea Kina January 1990 – September 2003
0
20
40
60
80
100
120
140
160
Jan-9
0
Jan-9
1
Jan-9
2
Jan-9
3
Jan-9
4
Jan-9
5
Jan-9
6
Jan-9
7
Jan-9
8
Jan-9
9
Jan-0
0
Jan-0
1
Jan-0
2
Jan-0
3
Papua New Guinea Australia
Figure 2: Nominal Exchange Rates for Australia and Papua New Guinea January 1990 – September 2003 (in US dollars)
0
0.1
0.2
0.3
0.4
0.5
0.6
0.7
0.8
0.9
Jan-9
0
Jan-9
1
Jan-9
2
Jan-9
3
Jan-9
4
Jan-9
5
Jan-9
6
Jan-9
7
Jan-9
8
Jan-9
9
Jan-0
0
Jan-0
1
Jan-0
2
Jan-0
3
Papua New Guinea Australia
Effective cross-hedging for commodity currencies Chakriya Bowman
18
Table 4: Correlation, Unit Root and Cointegration Tests
Series Correlation ADF PP Zivot and Andrews
(λ)
Johansen
REERAUD 0.0734 -3.2754* a -3.3938^ a -5.2816** (0.5455) 31.8311**a
REERPNG 0.6755 -3.5092* a -3.0349 -4.2980* (0.3394) 32.1451**a
** rejects the null of no unit root/cointegration at 1% * rejects at 5% ^ rejects at 10% a Intercept and trend
Notes: Both the Papua New Guinea and Australian REER are best characterised with an intercept and trend. Correlation statistics indicate little correlation between the Australian REER and RCOMP, while the Papua New Guinea REER and RCOMP are moderately correlated at 67.5%. The Australian REER rejects the null of no unit root for all three tests. The Zivot and Andrews test indicates a structural break, and it is possible that this explains the low power of the Phillips-Perron test. Results for Papua New Guinea are mixed. The ADF test indicates a unit root in the REER, as does the Zivot and Andrews test, although the Phillips-Perron test is unable to reject the null of no unit root. It is possible that the Phillips-Perron test is misspecified due to the presence of the structural break. Similarly, there is evidence of a cointegrating relationship between the Papua New Guinea REER and RCOMP when 18 lags are included. 2 lags are used with the Johansen cointegration test for Australia, while 18 are used with Papua New Guinea. It is possible that the longer lag time can be attributed to conversion constraints on the kina. Monthly price series for the period January 1990 – September 2003 sourced from IMF International Financial Statistics.
Table 3a: Zivot and Andrews calculated t-statistics
λ 1% 5% 10% 0.1 -4.27 -3.65 -3.36 0.2 -4.41 -3.80 -3.49 0.3 -4.51 -3.87 -3.58 0.4 -4.55 -3.94 -3.66 0.5 -4.55 -3.96 -3.68 0.6 -4.57 -3.95 -3.66 0.7 -4.51 -3.85 -3.57 0.8 -4.38 -3.82 -3.50 0.9 -4.26 -3.68 -3.35

Effective cross-hedging for commodity currencies Chakriya Bowman
19
Having established that the two currencies can be defined as commodity currencies
over the study period, nominal short-term currency cross-hedges are formed based on
the major commodity exports for each country. In previous work on commodity-
currency cross-hedging, a single, specific commodity is used to hedge the currency
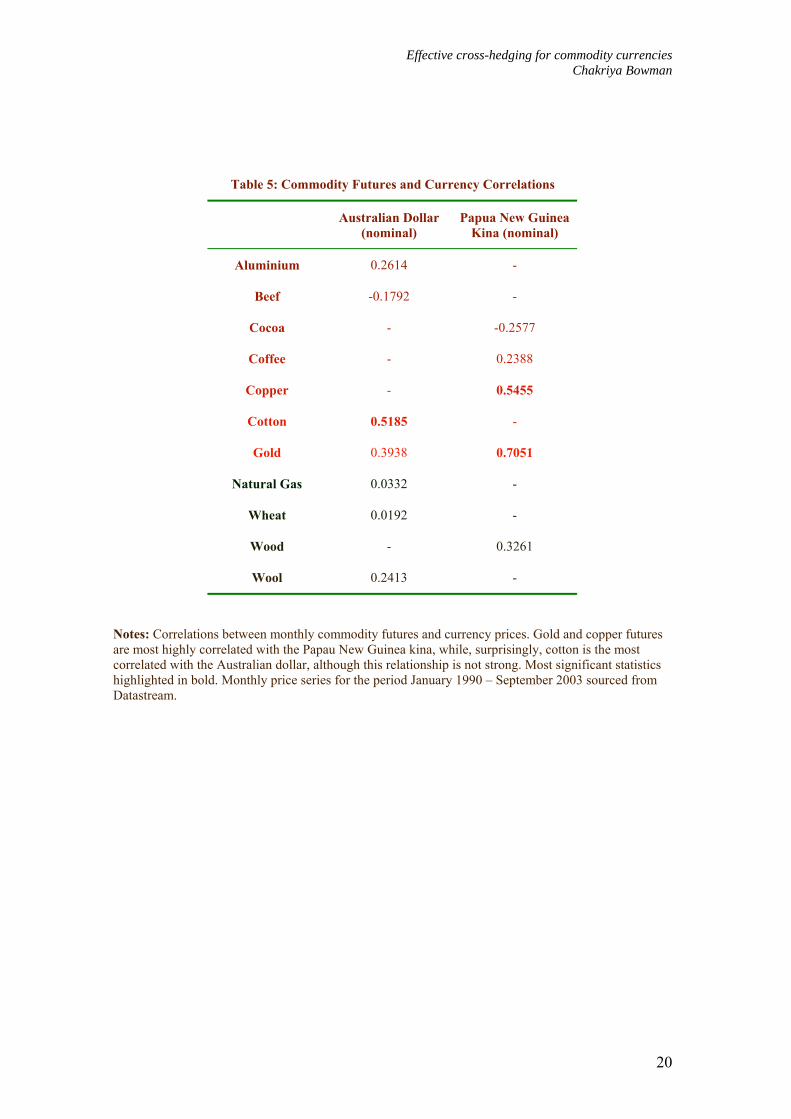
during each window, and this study begins similarly. Correlation testing (Table 5)
indicates that cotton is likely to be the most suitable hedging commodity for the
Australian dollar, while gold and copper are likely to perform best for the Papua New
Guinea kina. Single commodity cross-hedges are formed using each commodity
individually, and the results are shown in Table 5.
Single commodity hedges have varying levels of success, and performance depends on
the particularly commodity being used. An interesting initial observation is that gold
does not perform particularly well for either currency. While both sets of gold hedges
return positive average HBS ratios, indicating that it was generally preferable to hedge,
they do not provide the highest HBS ratios of the commodity set. Indeed, both result in
HBS ratios less than 1 (0.0382 for the Australian dollar, and 0.8807 for the kina), with
a preferable risk-return trade-off indicated by a higher HBS ratio. The best performing
results in each case were for farm products – cotton and wheat for Australia, cocoa and
coffee for Papua New Guinea.
Papua New Guinea forms the most effective single commodity cross-hedges, which is
perhaps unsurprising giving its heavy reliance on commodity exports and the
devaluation of the kina over this period. Each commodity-currency pair returns a
positive average HBS ratio, indicating that the hedge provides an effective risk-return
trade-off in each case. While average Sharpe ratios are negative, indicating that the
Effective cross-hedging for commodity currencies Chakriya Bowman
20
Table 5: Commodity Futures and Currency Correlations
Australian Dollar (nominal)
Papua New Guinea Kina (nominal)
Aluminium 0.2614 -
Beef -0.1792 -
Cocoa - -0.2577
Coffee - 0.2388
Copper - 0.5455
Cotton 0.5185 -
Gold 0.3938 0.7051
Natural Gas 0.0332 -
Wheat 0.0192 -
Wood - 0.3261
Wool 0.2413 -
Notes: Correlations between monthly commodity futures and currency prices. Gold and copper futures are most highly correlated with the Papau New Guinea kina, while, surprisingly, cotton is the most correlated with the Australian dollar, although this relationship is not strong. Most significant statistics highlighted in bold. Monthly price series for the period January 1990 – September 2003 sourced from Datastream.
Effective cross-hedging for commodity currencies Chakriya Bowman
Table 6: Single Commodity Hedges
Hedge Average Hedge Ratio
Average Sharpe Ratio
Average HBS Ratio
Average Excess Return5 % Outperforms2
AUD / Aluminium1 0.5541 0.4935 -0.1451 0.0077 54.76
AUD / Beef 0.3135 -0.3876 -0.2560 0.0056 52.27 AUD / Cotton 0.1836 0.0897 0.2214 -0.0020 48.86 AUD / Gold 0.5426 -0.0934 0.0382 -0.0039 48.86
AUD / Natural Gas 0.0583 -0.0858 0.0459 0.0038 54.55 AUD / Wheat 0.2548 0.0054 0.1370 -0.0024 54.55 AUD / Wool 0.2861 -0.4949 -0.3633 -0.0121 44.32
PNG / Cocoa 0.4048 -0.5219 1.3568 0.0024 64.77 PNG / Coffee 0.1870 -0.7218 1.1569 0.0149 68.18 PNG / Copper 0.3199 -0.8257 1.0530 0.0009 48.86 PNG / Gold 0.6390 -0.9980 0.8807 -0.0149 47.73 PNG / Wood 0.2639 -0.8450 1.0337 0.0017 51.14
Notes: Average Excess Return is defined as ( )∑=
−n
iSP RR
n 1
1. % Outperforms gives the percentage of times that the hedged
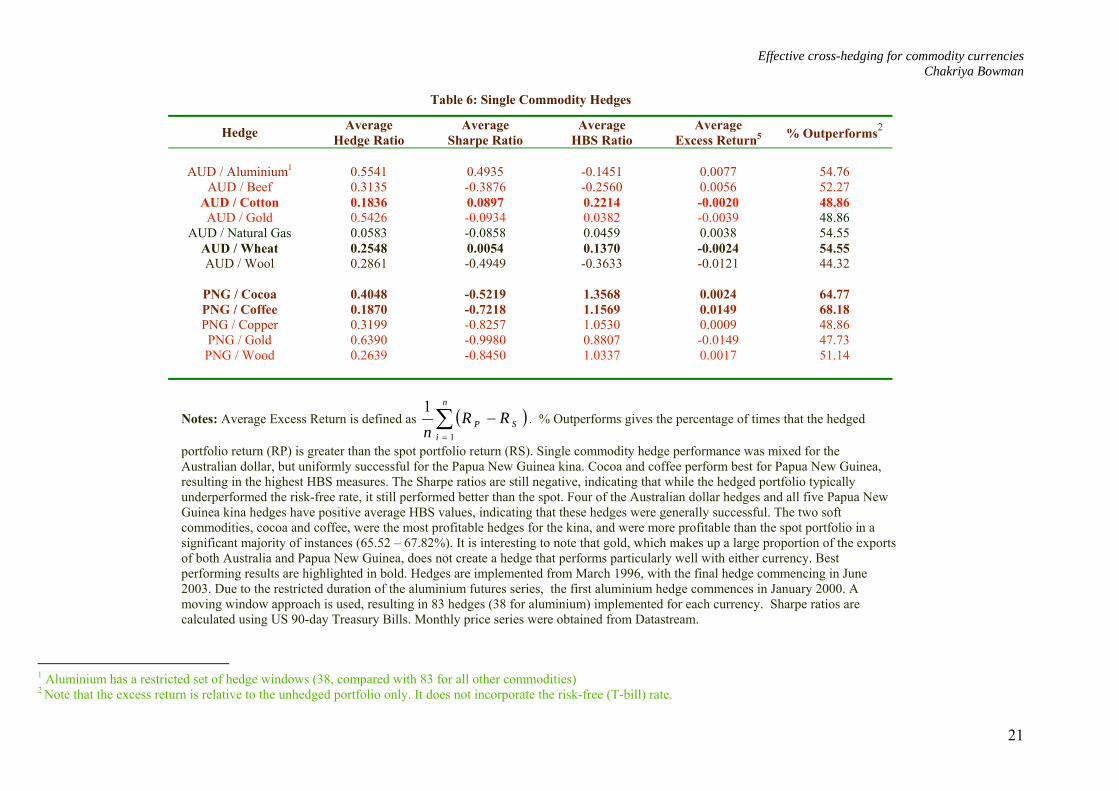
portfolio return (RP) is greater than the spot portfolio return (RS). Single commodity hedge performance was mixed for the Australian dollar, but uniformly successful for the Papua New Guinea kina. Cocoa and coffee perform best for Papua New Guinea, resulting in the highest HBS measures. The Sharpe ratios are still negative, indicating that while the hedged portfolio typically underperformed the risk-free rate, it still performed better than the spot. Four of the Australian dollar hedges and all five Papua New Guinea kina hedges have positive average HBS values, indicating that these hedges were generally successful. The two soft commodities, cocoa and coffee, were the most profitable hedges for the kina, and were more profitable than the spot portfolio in a significant majority of instances (65.52 – 67.82%). It is interesting to note that gold, which makes up a large proportion of the exports of both Australia and Papua New Guinea, does not create a hedge that performs particularly well with either currency. Best performing results are highlighted in bold. Hedges are implemented from March 1996, with the final hedge commencing in June 2003. Due to the restricted duration of the aluminium futures series, the first aluminium hedge commences in January 2000. A moving window approach is used, resulting in 83 hedges (38 for aluminium) implemented for each currency. Sharpe ratios are calculated using US 90-day Treasury Bills. Monthly price series were obtained from Datastream.
1 Aluminium has a restricted set of hedge windows (38, compared with 83 for all other commodities) 2 Note that the excess return is relative to the unhedged portfolio only. It does not incorporate the risk-free (T-bill) rate.
21
Effective cross-hedging for commodity currencies Chakriya Bowman
22
hedges underperformed the risk-free rate, the HBS ratio shows that the hedges still
generally outperformed the spot, and an investor expecting a revenue stream in kina
would have been wise to hedge over this period. The relative profitability of the hedge
to the spot portfolio is described here as the “excess return” (RP – RS). Most kina
hedges generated a small average return over the spot, and hedged portfolios typically
created more profit than the spot alone. The best performing hedges, cocoa and coffee,
have high HBS ratios, return a small profit over the spot, and outperform the spot in
more than 50% of hedges (64.77% for cocoa and 68.18% for coffee). Hedge ratios are
also small, with the average hedge ratio for cocoa (0.4048) and coffee (0.1870) lower
than that of gold (0.6390). A smaller number of futures purchased may result in lower
transaction costs, which the hedger may wish to take into account when selecting a
hedging instrument.
The Australian dollar hedges do not perform as consistently well as those of Papua
New Guinea. The best performing hedges, cotton and wheat, have low HBS ratios,
indicating that these hedges are not as efficient as those for the kina, which generally
have high HBS ratios. Three of the seven commodities have negative average HBS
ratios, indicating that it was generally preferable to hold the spot rather than hedge.
However, in three instances (cotton, wheat and aluminium), the hedge resulted in
positive average Sharpe measures, indicating that the hedge was profitable in its own
right and outperformed the risk-free rate. Despite this, the average return was still
likely to be negative, indicating that the spot profit in some windows was generally
greater than the hedge profit of others. Likewise the hedges did not consistently
outperform the spot, with results mixed and generally around 50%. Interestingly, wool
was the commodity that performed least well. This is remarkable as wool futures are
likely to be well aligned with the commodity, being listed on the Australian exchange.
Effective cross-hedging for commodity currencies Chakriya Bowman
23
Cotton, on the other hand, is a US listed contract and is less likely to be well aligned
with the Australian export product.
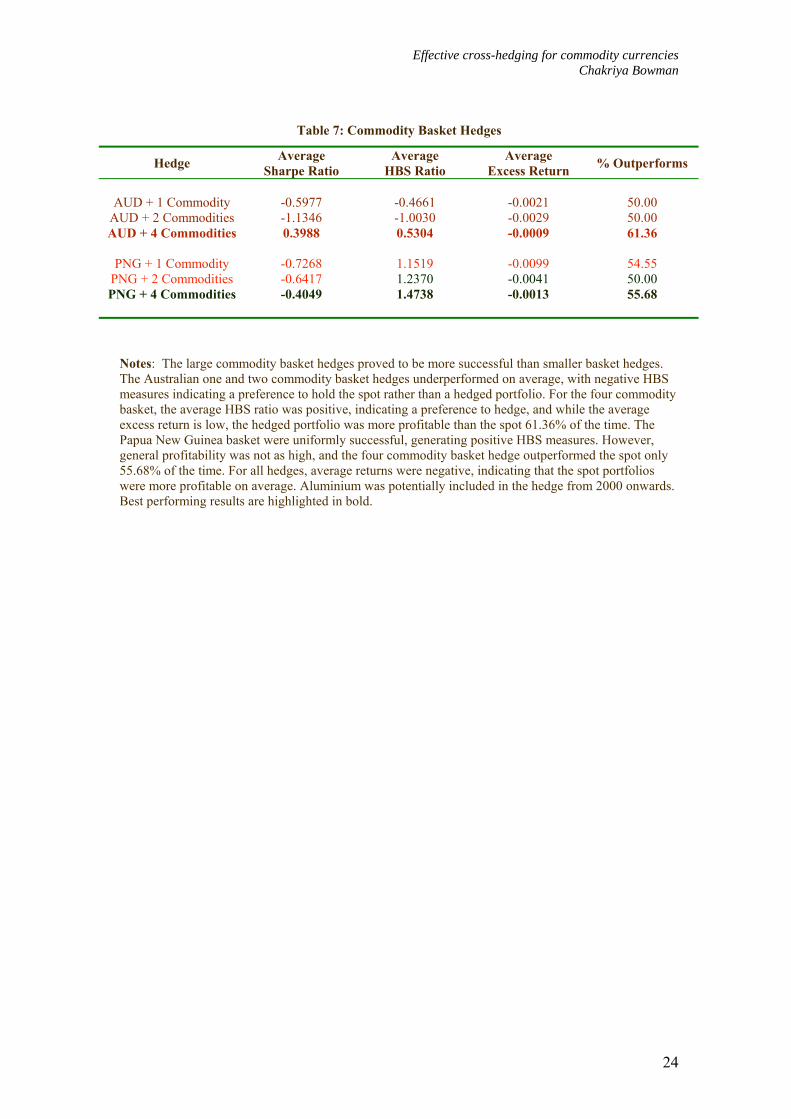
Commodity hedges were then implemented for each currency using the basket hedge
technique, selecting those commodities with the highest t-statistics when regressed
against the commodity currency. Commodity baskets of one, two and four
commodities were formed, with performance improving noticeably when four
commodities are used (Table 1). The average HBS ratios are highest when four-
commodity baskets are formed, and in each case they are higher than those for any of
the single commodity hedges in Table 6. They also result in the highest average Sharpe
ratios, demonstrating the improved profitability of the hedges, and in the case of the
Australian dollar the hedge outperforms the risk-free rate. Hedges also outperform the
spot in the majority of windows, in 61.36% of windows for the Australian dollar and
55.68% for the kina. While one- and two-commodity baskets perform poorly for the
Australian dollar, they do perform well for the kina, indicating that the most
appropriate hedging commodity for the kina is quite variable.
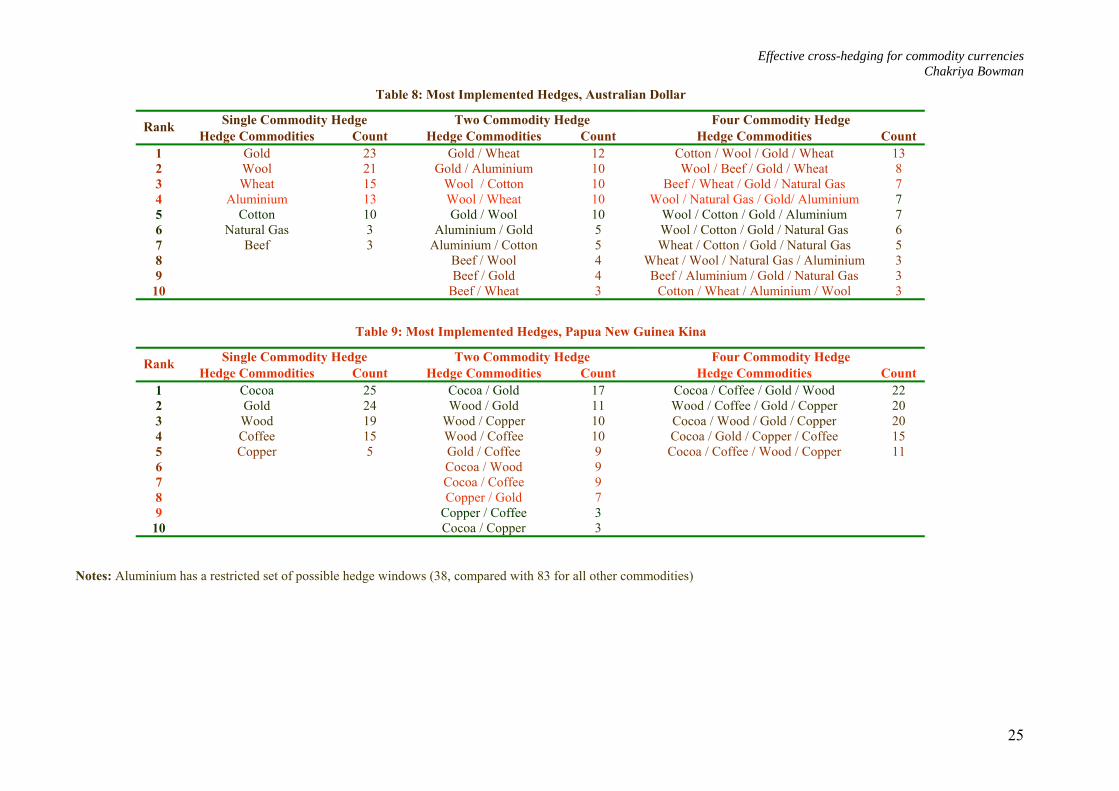
Table 8 and Table 9 list the combinations of commodities selected for each basket
hedge. Gold is one of the commodities selected most often for one-commodity hedges,
and both currencies use gold around 27% of the time. Kina hedges are split fairly
evenly between cocoa, gold, wood and coffee, while Australian dollar hedges are
biased more toward gold, wool, wheat and aluminium (which may have been selected
more often if the futures series was longer). It is interesting to note that the best
performing single commodity hedges for the Australian dollar, cotton and wheat, were
not the most frequently chosen for commodity baskets based on t-statistics. While one-
commodity hedges for the kina used cocoa most often, coffee was infrequently used,
Effective cross-hedging for commodity currencies Chakriya Bowman
24
Table 7: Commodity Basket Hedges
Hedge Average Sharpe Ratio
Average HBS Ratio
Average Excess Return % Outperforms
AUD + 1 Commodity -0.5977 -0.4661 -0.0021 50.00
AUD + 2 Commodities -1.1346 -1.0030 -0.0029 50.00 AUD + 4 Commodities 0.3988 0.5304 -0.0009 61.36
PNG + 1 Commodity -0.7268 1.1519 -0.0099 54.55
PNG + 2 Commodities -0.6417 1.2370 -0.0041 50.00 PNG + 4 Commodities -0.4049 1.4738 -0.0013 55.68
Notes: The large commodity basket hedges proved to be more successful than smaller basket hedges. The Australian one and two commodity basket hedges underperformed on average, with negative HBS measures indicating a preference to hold the spot rather than a hedged portfolio. For the four commodity basket, the average HBS ratio was positive, indicating a preference to hedge, and while the average excess return is low, the hedged portfolio was more profitable than the spot 61.36% of the time. The Papua New Guinea basket were uniformly successful, generating positive HBS measures. However, general profitability was not as high, and the four commodity basket hedge outperformed the spot only 55.68% of the time. For all hedges, average returns were negative, indicating that the spot portfolios were more profitable on average. Aluminium was potentially included in the hedge from 2000 onwards. Best performing results are highlighted in bold.
Effective cross-hedging for commodity currencies Chakriya Bowman
Table 8: Most Implemented Hedges, Australian Dollar
Single Commodity Hedge Two Commodity Hedge Four Commodity Hedge Rank Hedge Commodities Count Hedge Commodities Count Hedge Commodities Count
1 Gold 23 Gold / Wheat 12 Cotton / Wool / Gold / Wheat 13 2 Wool 21 Gold / Aluminium 10 Wool / Beef / Gold / Wheat 8 3 Wheat 15 Wool / Cotton 10 Beef / Wheat / Gold / Natural Gas 7 4 Aluminium 13 Wool / Wheat 10 Wool / Natural Gas / Gold/ Aluminium 7 5 Cotton 10 Gold / Wool 10 Wool / Cotton / Gold / Aluminium 7 6 Natural Gas 3 Aluminium / Gold 5 Wool / Cotton / Gold / Natural Gas 6 7 Beef 3 Aluminium / Cotton 5 Wheat / Cotton / Gold / Natural Gas 5 8 Beef / Wool 4 Wheat / Wool / Natural Gas / Aluminium 3 9 Beef / Gold 4 Beef / Aluminium / Gold / Natural Gas 3
10 Beef / Wheat 3 Cotton / Wheat / Aluminium / Wool 3
Table 9: Most Implemented Hedges, Papua New Guinea Kina
Single Commodity Hedge Two Commodity Hedge Four Commodity Hedge Rank Hedge Commodities Count Hedge Commodities Count Hedge Commodities Count
1 Cocoa 25 Cocoa / Gold 17 Cocoa / Coffee / Gold / Wood 22 2 Gold 24 Wood / Gold 11 Wood / Coffee / Gold / Copper 20 3 Wood 19 Wood / Copper 10 Cocoa / Wood / Gold / Copper 20 4 Coffee 15 Wood / Coffee 10 Cocoa / Gold / Copper / Coffee 15 5 Copper 5 Gold / Coffee 9 Cocoa / Coffee / Wood / Copper 11 6 Cocoa / Wood 9 7 Cocoa / Coffee 9 8 Copper / Gold 7 9 Copper / Coffee 3
10 Cocoa / Copper 3
Notes: Aluminium has a restricted set of possible hedge windows (38, compared with 83 for all other commodities)
25
Effective cross-hedging for commodity currencies Chakriya Bowman
26
and copper was hardly selected at all despite the much higher proportion of export
revenue derived from this commodity. Gold was used consistently in the two- and
four-commodity basket hedges for both currencies, although it should be noted that the
proportion of gold in the basket varied depending on the results of the regression in
each period. Those baskets not including gold were used least frequently. For each
currency, four-commodity currency baskets most frequently included those
commodities forming the best single commodity hedges (cotton and wheat for
Australia, coffee and cocoa for Papua New Guinea), as well as gold.
Overall, the results favour multiple-commodity hedges and indicate that this technique
could be used effectively by investors to form profitable hedges with advantageous
risk-return trade-offs. The results also show that commodity-currency cross-hedges can
be effective and profitable when the currencies in question are commodity currencies.
This is a departure from previous literature, which has found little support for
commodity-currency cross-hedging. However, this literature did not focus necessarily
on currencies with significant, long-run relationships with commodity prices, and
perhaps these relationships are the foundation upon which commodity-currency cross-
hedging should be based.
5 Conclusion
The Australian dollar and Papua New Guinea kina can be classified as commodity
currencies, currencies whose long-run real rates have significant cointegrating
relationships with the real values of their major commodity exports. Both countries are
highly dependent on commodity exports for revenue, and both have exchange rates
classified as floating. This study demonstrates that, under these circumstances,
Effective cross-hedging for commodity currencies Chakriya Bowman
27
commodity-currency cross-hedges perform effectively, and better than they have in
previous studies of the currencies of countries not dependent on exports for the
majority of their revenues. Further, a country more dependent on a small set of
commodities for its export revenues (such as Papua New Guinea) appears to be more
effectively hedged by commodities than one with more diversified sources of revenues
(such as Australia).
It is interesting to note that the most correlated commodities over the full study period
do not necessarily form the best hedges. Average results for single commodity hedges
do not find great support for gold as a hedging commodity, although gold was
consistently included in currency baskets based on t-statistics from estimation period
regressions, and was among the most correlated commodity for each currency. Four-
commodity basket hedges performed particularly well on average, and showed
improvement over other hedging combinations. While Papua New Guinea hedges
generally underperformed the risk free rate, likely to be a result of the significant
decline in the value of the kina against the US dollar over the study period, hedges
effectively minimised losses for those investors holding the spot. Australian dollar four
commodity hedges showed profit opportunities for investors, as they not only
outperformed the spot but also the risk-free rate.
The effectiveness of these hedges is a contrast to prior work, that has found little
support for the use of commodity-currency cross-hedges. However, the techniques
used here successfully optimise the chances of a successful hedge, and may be applied
in practice to those wishing to hedge commodity currencies.
Effective cross-hedging for commodity currencies Chakriya Bowman
28
6 References
Aggarwal, R. & Demaskey, A.J. (1997). Using derivatives in major currencies for cross-hedging currency risks in Asian emerging markets. Journal of Futures Markets, 17, 781 – 796. Benet, B.A. (1990). Commodity futures cross hedging of foreign exchange exposure. Journal of Futures Markets, 10, 287 – 306. Bowman, C. (2004). Cross-hedging effectiveness in emerging markets experiencing structural change. Unpublished working paper. Brailsford, T., Corrigan, K. & Heaney, R. (2001). A comparison of measures of hedging effectiveness: A case study using the Australian All Ordinaries share price index futures contract. Journal of Multinational Financial Management, 11, 465 – 481. Cashin, P., Ce ́spedes, L. & Sahay, R. (2004). Commodity currencies and the real exchange rate. Journal of Development Economics, 75, 239 - 268. Cashin, P., McDermott, C. J. & Scott, A. (1999). The myth of comoving commodity prices. IMF Working Paper Series WP/99/169. Castelino, M.G. (1992). Hedge effectiveness: Basis risk and minimum variance hedging. Journal of Futures Markets, 12, 187 – 201. Chen, Y. & Rogoff, K. (2003). Commodity currencies. Journal of International Economics, 60, 133 – 160. DeMaskey, A.L. & Pearce, J.A. (1998). Commodity and currency futures cross-hedging of ASEAN currency exposures. Journal of Transnational Management Development, 4, 5 – 24. Dickey, D.A & Fuller, W.A. (1981). Likelihood ratio statistics for autoregressive time series with a unit root. Econometrica, 49, 1057 – 1072. Eaker, M. R. & Grant, D.M. (1987). Cross-hedging foreign currency risk. Journal of International Money and Finance, 6, 85 – 105. Ederington, L.H. (1979). The hedging performance of the new futures market. Journal of Finance, 34, 157 – 170. Ghosh, A. (1996). Cross-hedging foreign currency risk: empirical evidence from an error correction model. Review of Quantitative Finance and Accounting, 6, 223 – 231. Howard, C. T. & D’Antonio, L.J. (1987). A risk-return measure of hedging effectiveness: A reply. Journal of Financial and Quantitative Analysis, 22, 377 – 381. Lien, D. & Tse, Y.K. (2002). Some recent developments in futures hedging. Journal of Economic Surveys, 16, 357 – 396.
Effective cross-hedging for commodity currencies Chakriya Bowman
29
Phillips, P.C.B. & Perron, P. (1988). Testing for a unit root in time series regressions. Biometrika, 75, 335 – 346. Sharpe, W.F. (1994). The Sharpe ratio. Journal of Portfolio Management, 21, 49 – 58. Stulz, R. (2004). Should we fear derivatives?. Journal of Economic Perspectives, 18, 173 – 192 Zivot, E. & Andrews, D.W.K. (1992). Further evidence on the great crash, the oil-price shock and the unit-root hypothesis. Journal of Business and Economic Statistics, 10, 251 – 270.
Effective cross-hedging for commodity currencies Chakriya Bowman
30