Commodity and Credit Cycles - bancaditalia.it · lending) from 1,9% (1st January, 2013) to 4,3%...
52
Commodity and Credit Cycles in Resource-rich Economies 1 Marina Tiunova Bank of Russia ESCB 16th Emerging Markets Workshop Rome, Italy 22-23 November, 2018 1 The views expressed in the paper are those of the author and do not necessarily reflect the official position of the Bank of Russia.
Transcript of Commodity and Credit Cycles - bancaditalia.it · lending) from 1,9% (1st January, 2013) to 4,3%...
Commodity and Credit Cyclesin Resource-rich Economies1
Marina Tiunova
Bank of Russia
ESCB 16th Emerging Markets WorkshopRome, Italy
22-23 November, 2018
1The views expressed in the paper are those of the author and do not necessarily reflect the official
position of the Bank of Russia.

Contents
IntroductionRelated LiteratureDataMethodologyResultsMacroprudential policy (MPP) in RussiaConclusions
Marina Tiunova (Bank of Russia) Commodity and Credit Cycles 22-23 November, 2018 2 / 52
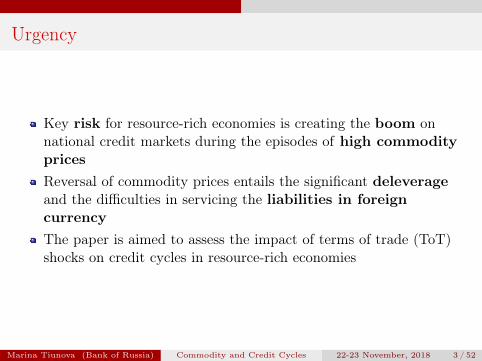
Urgency
Key risk for resource-rich economies is creating the boom onnational credit markets during the episodes of high commoditypricesReversal of commodity prices entails the significant deleverageand the difficulties in servicing the liabilities in foreigncurrencyThe paper is aimed to assess the impact of terms of trade (ToT)shocks on credit cycles in resource-rich economies
Marina Tiunova (Bank of Russia) Commodity and Credit Cycles 22-23 November, 2018 3 / 52
Urgency
The rise of commodity prices contributes to ...Foreign currency inflowCredit expansionAmplification of FX loans and external financingImprovement of economic and credit activity
The unexpected reversal of commodity prices entails...Deterioration of the solvency of economic agentsWorsening of the bank credit portfolioRisks of default of external debt and foreign loansRise of financial market volatility or even financial crisis
Marina Tiunova (Bank of Russia) Commodity and Credit Cycles 22-23 November, 2018 4 / 52

Related Literature
Rise of crude oil prices increases aggregate output and itscomponents [Bergholt, Larsen, 2016]Decline of crude oil prices results in credit contraction and theworsening of bank credit portfolio [Agarwal et al., 2017] and ...... the upsurge of the dollarization of bank credit and deposit, theNPL share and the probability of banking crisis [Kinda et al., 2016]Complementation of monetary policy by MMP instruments helpsto alleviate the credit activity during the expansion of financialcycle [Gonzalez et al., 2015; Bruno et al., 2015]MPP remains effective especially in developing economies [Ceruttiet al., 2017; Gambacorta, Murcia, 2017; Richter et al., 2018]
Marina Tiunova (Bank of Russia) Commodity and Credit Cycles 22-23 November, 2018 5 / 52
Related Literature (about Russia)
Increase in crude oil prices contributes to the rise of GDP[Malakhovskaya, Minabutdinov, 2017; Polbin, 2017]Positive ToT shock entails the upsurge of credit volume andexternal debt of corporate sector [Lomivorotov, 2015; Pestova,Mamonov, 2016]
Marina Tiunova (Bank of Russia) Commodity and Credit Cycles 22-23 November, 2018 6 / 52
Related Literature (conclusions)
1 Close relationship between the dynamics of the commodity andcredit cycle indicators in resource-rich economies
2 Sizeable sensitivity of financial cycle parameters to globalcommodity market development
3 Financial system risks’ accumulation in response to the decline ofcommodity prices
4 EMEs are mostly prone to negative external shocks5 MPP is essential!
Marina Tiunova (Bank of Russia) Commodity and Credit Cycles 22-23 November, 2018 7 / 52

Methodology
The vector autoregression (VAR) model with m variables и p lags:
Yt = Bconst + B1Yt−1 + B2Yt−2 + ... + BpYt−p + 𝜀t , 𝜀t ∼ N(0,Σ),
where Yt = (y1t ,y2t , ...,ymt)′ – the vector of endogenous variables with
dimension of m (t = 1,...,T ), Bconst = (b1,b2, ...,bm)′ – the vector ofconstants with the dimension of m, Bl – the matrix of autoregressivecoefficients m ×m, where l – the number of a lag from 1 to p
After transformation B = [BconstB1...Bp]′ and Xt = [1Y ′t−1...Y
′t−p]′
VAR in the reduced form:
Yt = B ′Xt + 𝜀t
Marina Tiunova (Bank of Russia) Commodity and Credit Cycles 22-23 November, 2018 8 / 52

Methodology
Structural identification – Cholesky decompositionThe identification of shocks in a small open economy (SOE):
External sector variables (volatility of global markets, commodityprices, global GDP)Domestic macroeconomic variables (aggregate output, inflation)Domestic financial variables (external debt, interest rate, credit riskindicator, monetary base, exchange rate, risk premium)
Marina Tiunova (Bank of Russia) Commodity and Credit Cycles 22-23 November, 2018 9 / 52
Methodology
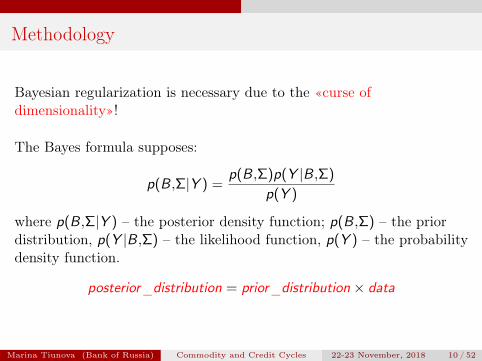
Bayesian regularization is necessary due to the «curse ofdimensionality»!
The Bayes formula supposes:
p(B,Σ|Y ) =p(B,Σ)p(Y |B,Σ)
p(Y )
where p(B,Σ|Y ) – the posterior density function; p(B,Σ) – the priordistribution, p(Y |B,Σ) – the likelihood function, p(Y ) – the probabilitydensity function.
posterior_distribution = prior_distribution × data
Marina Tiunova (Bank of Russia) Commodity and Credit Cycles 22-23 November, 2018 10 / 52

Methodology
Prior distribution: Independent Normal – Inverse WishartdistributionEvery element of the covariance matrix of model’s coefficients[Blake, Mumtaz, 2017]:
(𝜎i𝜆4)2 for constants
(𝜆1
l𝜆3)2 for i = j
(𝜎i𝜆1𝜆2
𝜎j l𝜆3)2 for i = j
Marina Tiunova (Bank of Russia) Commodity and Credit Cycles 22-23 November, 2018 11 / 52

Methodology
Choice of hyperparameters [Demeshev, Malakhovskaya, 2016; Pestova,Mamonov, 2015]:
𝜆1 = 0.1 (total «tightness» of the prior distribution)𝜆2 = 0.5 (Bayesian cross-regularization parameter)𝜆3 = 1𝜆4 = 100 (relative «tightness» of the distribution of a constant)
Marina Tiunova (Bank of Russia) Commodity and Credit Cycles 22-23 November, 2018 12 / 52
Data
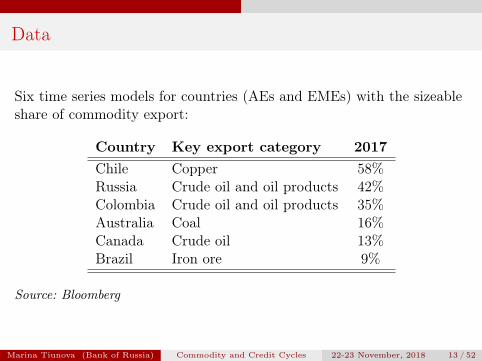
Six time series models for countries (AEs and EMEs) with the sizeableshare of commodity export:
Country Key export category 2017Chile Copper 58%Russia Crude oil and oil products 42%Colombia Crude oil and oil products 35%Australia Coal 16%Canada Crude oil 13%Brazil Iron ore 9%
Source: Bloomberg
Marina Tiunova (Bank of Russia) Commodity and Credit Cycles 22-23 November, 2018 13 / 52
Data (variables)
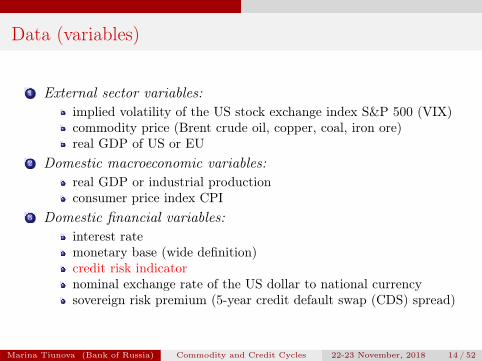
1 External sector variables:implied volatility of the US stock exchange index S&P 500 (VIX)commodity price (Brent crude oil, copper, coal, iron ore)real GDP of US or EU
2 Domestic macroeconomic variables:real GDP or industrial productionconsumer price index CPI
3 Domestic financial variables:interest ratemonetary base (wide definition)credit risk indicatornominal exchange rate of the US dollar to national currencysovereign risk premium (5-year credit default swap (CDS) spread)
Marina Tiunova (Bank of Russia) Commodity and Credit Cycles 22-23 November, 2018 14 / 52

Data (variables)
Credit risk indicators:growth rate of total creditgrowth rate of households and enterprise creditgrowth rate of credit in national and foreign currencyNPL ratiodollarization coefficientgrowth rate of external debtcredit-to-GDP ratio
Elasticities’ calculations are based on the impulse response function(IRF) analysis. The elasticity of the level of X implies that theacceleration of the annual commodity price growth rate by 1 p.p. entailsthe increase in the credit cycle indicator by X p.p.
Marina Tiunova (Bank of Russia) Commodity and Credit Cycles 22-23 November, 2018 15 / 52

Results
Marina Tiunova (Bank of Russia) Commodity and Credit Cycles 22-23 November, 2018 16 / 52

Russia
0%
10%
20%
30%
40%
50%
60%
70%
80%
90%
100%2
00
6
20
07
20
08
20
08
20
09
20
10
20
10
20
11
20
12
20
12
20
13
20
14
20
14
20
15
20
16
20
16
20
17
Crude oil
Oil products
Gas
Machinery
Ferrous metals
Coal
Carbon steel
Aluminium
Wheat
Copper
Other
Source: Federal Customs Service of RussiaMarina Tiunova (Bank of Russia) Commodity and Credit Cycles 22-23 November, 2018 17 / 52
Russia (elasticities)
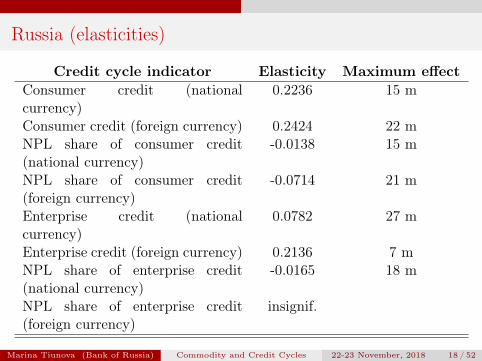
Credit cycle indicator Elasticity Maximum effectConsumer credit (nationalcurrency)
0.2236 15 m
Consumer credit (foreign currency) 0.2424 22 mNPL share of consumer credit(national currency)
-0.0138 15 m
NPL share of consumer credit(foreign currency)
-0.0714 21 m
Enterprise credit (nationalcurrency)
0.0782 27 m
Enterprise credit (foreign currency) 0.2136 7 mNPL share of enterprise credit(national currency)
-0.0165 18 m
NPL share of enterprise credit(foreign currency)
insignif.
Marina Tiunova (Bank of Russia) Commodity and Credit Cycles 22-23 November, 2018 18 / 52

Russia (elasticities)
Credit cycle indicator Elasticity Maximum effectTotal credit (national currency) 0.0872 26 mTotal credit (foreign currency) 0.1851 7 mTotal credit 0.0857 30 mDollarization of consumer credit 0.0359 18 mDollarization of enterprise credit 0.0284 21 mTotal dollarization 0.0339 20 mExternal debt of the corporatesector
0.1194 2 q
Credit-to-GDP ratio -0.2119 5 q
Source: author’s calculations
Marina Tiunova (Bank of Russia) Commodity and Credit Cycles 22-23 November, 2018 19 / 52

Russia
The improvement of the global energy markets is accompanied by ...decrease in the money market interest rates (recent introduction ofinflation targeting, countercyclical fiscal policy and MPPframework)accumulation of external debt of the corporate sectorrise of the growth rates of consumer and enterprise loansincrease in the dollarization ratedecline of NPL share
Marina Tiunova (Bank of Russia) Commodity and Credit Cycles 22-23 November, 2018 20 / 52

Macroprudential policy in Russia
Marina Tiunova (Bank of Russia) Commodity and Credit Cycles 22-23 November, 2018 21 / 52

Macroprudential policy in Russia
Three main episodes of MPP instruments’ implementation [Danilova,Elizarova, 2017; FSR, 2014; FSR, 2016]:
1 2007-2008:strong private capital inflowrise of the share of foreign debt in the banking sector’ liabilities upto 20%growth of reserve requirements from 4,5% in January, 2008 to 8,5%at the beginning of September, 2008
effectiveness: accumulation of additional 400 bln rub in the bankingsector
Marina Tiunova (Bank of Russia) Commodity and Credit Cycles 22-23 November, 2018 22 / 52

Macroprudential policy in Russia
2 2013-2014:growth rate of consumer lending was 60% that exceeded the similarindicator to enterprise growth rate (24,4%) (2011-2012)Bank of Russia raised loan-loss provisions for unsecured consumerloans and risk weightseffectiveness:
consumer lending growth rate decreased to 27% (1st April, 2014)decline of risky loans’ sharerise of coverage ratio of banks (specialized in unsecured consumerlending) from 1,9% (1st January, 2013) to 4,3% (1st January, 2015)
Marina Tiunova (Bank of Russia) Commodity and Credit Cycles 22-23 November, 2018 23 / 52

Macroprudential policy in Russia
3 2016:spike in market volatilityhigh level of dollarization of banks’ assets and liabilitiesrise of the volatility of the credit institutions’ required ratios andthe total credit riskBank of Russia introduced the increased risk weights for foreigncurrency claims on households and corporate entities withinsufficient foreign exchange earningseffectiveness:
dollarization of banking sector deposits fell by 5,9 pp to 18,8%
Marina Tiunova (Bank of Russia) Commodity and Credit Cycles 22-23 November, 2018 24 / 52

Colombia
0%
10%
20%
30%
40%
50%
60%
70%
80%
90%
100%
20
06
20
07
20
08
20
09
20
10
20
11
20
12
20
13
20
14
20
15
20
16
20
17
Crude oil and oil products
Coal
Industrial goods
Coffee
Agricultural goods
Precious metals
Ferronickel
Source: National Administrative Department of Statistics of Colombia
Marina Tiunova (Bank of Russia) Commodity and Credit Cycles 22-23 November, 2018 25 / 52

MPP index in commodity exporters
Country 03 04 05 06 07 08 09 10 11 12 13Angola 0 0 0 0 1 1 1 1 3 3 3Australia 1 1 1 1 1 1 1 1 1 1 1Brazil 2 2 2 2 2 2 2 2 2 2 2Canada 3 3 3 3 3 5 5 5 5 5 5Chile 6 6 6 6 6 6 6 6 6 6 6Colombia 6 6 6 6 7 7 7 7 7 7 7Kazakhstan 1 1 1 1 1 1 1 1 1 1 2Norway 1 1 1 1 1 1 1 3 3 3 4Russia 1 1 1 1 1 1 1 1 1 1 1Saudi Arabia 1 1 1 2 2 2 2 2 2 2 2UAE 2 2 2 2 2 2 2 2 3 3 3USA 3 3 3 3 3 3 3 3 3 3 3
Source: Cerutti et al., 2017
Marina Tiunova (Bank of Russia) Commodity and Credit Cycles 22-23 November, 2018 26 / 52

Colombia
Credit cycle indicator Elasticity Maximum effectTotal credit 0.0683 31 mTotal NPL share insignif.Consumer credit 0.1197 20 mNPL share of consumer credit -0.0037 2 mEnterprise credit 0.0564 33 mNPL share of enterprise credit insignif.External debt of the private sector -0.1078 9 mCredit (private non-financialsector)-to-GDP ratio
-0.0362 3 q
Loans in foreign currency -0.4804 2 q
Source: author’s calculations
Marina Tiunova (Bank of Russia) Commodity and Credit Cycles 22-23 November, 2018 27 / 52

Colombia
The Colombian economy is characterised by ...high level of MPP implementation [Cerutti et al., 2017]closeness (in terms of trade in GDP) [Vargas et al., 2017]importance of non-tradable sector
The increase in oil prices elicits:domestic financial conditions’ tighteningrise of consumer, enterprise and total creditdecrease in external debt of the private sector and total foreigncurrency loans
Marina Tiunova (Bank of Russia) Commodity and Credit Cycles 22-23 November, 2018 28 / 52

Chile
0%
10%
20%
30%
40%
50%
60%
70%
80%
90%
100%
20
03
20
04
20
05
20
06
20
07
20
08
20
09
20
10
20
11
20
12
20
13
20
14
20
15
20
16
20
17
Copper
Industrial goods
Agricultural goods
Other minerals
Source: Central Bank of Chile
Marina Tiunova (Bank of Russia) Commodity and Credit Cycles 22-23 November, 2018 29 / 52

Chile
Credit cycle indicator Elasticity Maximum effectTotal credit insignif.Consumer credit 0.0463 9 qEnterprise credit insignif.Total external debt 0.0481 3 qCredit(non-financial privatesector)-to-GDP
-0.0687 7 q
Loans in foreign curerency 0.2942 10 q
Source: author’s calculationsThe improvement of ToT results in:
increase in interest rates (high level of MPP usage [Cifuentes et al.,2017])responses of growth rates of total and enterprise loans remaininsignificant
Marina Tiunova (Bank of Russia) Commodity and Credit Cycles 22-23 November, 2018 30 / 52

Brazil
0%
10%
20%
30%
40%
50%
60%
70%
80%
90%
100%
20
00
20
01
20
02
20
03
20
04
20
05
20
06
20
07
20
08
20
09
20
10
20
11
20
12
20
13
20
14
20
15
20
16
20
17
Iron ore
Crude oil
Meat
Coffee
Sugar
Soybean
Industrial goods
Other
Source: Ministry of Industry and External Trade of BrazilMarina Tiunova (Bank of Russia) Commodity and Credit Cycles 22-23 November, 2018 31 / 52

Brazil
Credit cycle indicator Elasticity Maximum effectTotal credit 0.0804 5 qConsumer credit insignif.Enterprise credit 0.1213 5 qExternal debt of the private sector -0.1290 13 qCredit(private non-financialsector)-to-GDP
0.0898 13 q
Total loans in foreign currency 0.2178 2 qThe dollarization coefficient 0.1168 10 q
Source: author’s calculationsThe reaction of consumer lending is insignificant due to the regulationof car lending market
Marina Tiunova (Bank of Russia) Commodity and Credit Cycles 22-23 November, 2018 32 / 52

Canada and Australia
0%
10%
20%
30%
40%
50%
60%
70%
80%
90%
100%
20
00
20
01
20
02
20
03
20
04
20
05
20
06
20
07
20
08
20
09
20
10
20
11
20
12
20
13
20
14
20
15
20
16
20
17
Crude oil
Other energy
Forest
Machinery
Electronics
Agricultural goods, fishing andother foodChemistry
Consumer goods
Metals
Transport
Other
Source: Statistics CanadaMarina Tiunova (Bank of Russia) Commodity and Credit Cycles 22-23 November, 2018 33 / 52

Canada
Credit cycle indicator Elasticity Maximum effectTotal credit -0.0453 4 qConsumer credit insignif.Enterprise credit -0.0883 4 qMortgage outstanding -0.0158 8 qTotal external debt 0.0509 1 qCredit(private non-financialsector)-to-GDP
-0.0836 4 q
Total loans in foreign currency insignif.Dollarization coefficient -0.09826 2 q
Source: author’s calculations
Marina Tiunova (Bank of Russia) Commodity and Credit Cycles 22-23 November, 2018 34 / 52

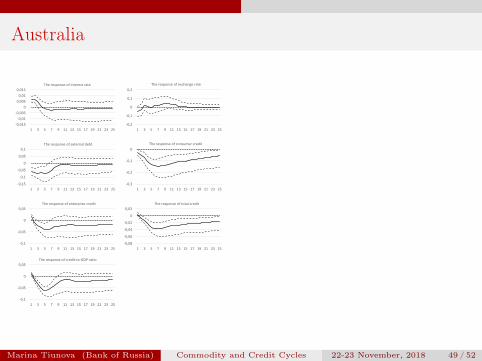
Australia
Credit cycle indicator Elasticity Maximum effectTotal credit -0.0365 7 qConsumer credit -0.1444 7 qEnterprise credit -0.0392 6 qExternal debt of the private sector -0.0774 5 qCredit(private non-financialsector)-to-GDP
-0.0628 5 q
Source: author’s calculations
Marina Tiunova (Bank of Russia) Commodity and Credit Cycles 22-23 November, 2018 35 / 52

Canada and Australia
Central banks in developed countries have more opportunities topursue countercyclical monetary policy in the historical perspective[Kaminsky et al., 2004]High level of MPP implementation in Canada [Cerutti et al., 2017;Allen et al., 2017]Wide national financial marketsSaturation of credit marketsIncrease in commodity prices entails the rise of interest rates andthe decrease in credit cycle indicators
Marina Tiunova (Bank of Russia) Commodity and Credit Cycles 22-23 November, 2018 36 / 52

Results (1)
The increase in the share of the predominant commodity exportcategory results in the rise of the sensitivity of sovereign risk premiumand national exchange rate to commodity prices shocks. Thisdependency is higher in EMEs.
0 20 40 60 80 100
Chile
Russia
Colombia
Australia
Canada
Brazil
The share of key export category in the total export (%)
The sensitivity of national exchange rates to the shock of commodity prices (%)
The sensitivity of CDS spread to the shock of commodity prices (%)
Marina Tiunova (Bank of Russia) Commodity and Credit Cycles 22-23 November, 2018 37 / 52

Results (2)
The market interest rates rise in response to positive ToT shocks inAEs. This tendency also exists in EMEs with high level of MPPimplementation.
-4 -2 0 2 4 6 8
Colombia
Chile
Canada
Brazil
Australia
Russia
The sensitivity of interest rate to the shock of commodity prices (%)
The average MPP index (p.)
Marina Tiunova (Bank of Russia) Commodity and Credit Cycles 22-23 November, 2018 38 / 52

Results (3)
There is less exposure of total and foreign currency credit growth tocommodity prices shocks in EMEs with high MPP score.
-50 -40 -30 -20 -10 0 10 20 30 40
Colombia
Chile
Brazil
Russia
The sensitivity of FX credit growth rate to the shock of commodity prices (%)
The sensitivity of the total credit growth rate to the shock of commodity prices (%)
The average MPP index (p.)
Marina Tiunova (Bank of Russia) Commodity and Credit Cycles 22-23 November, 2018 39 / 52

Conclusions
Commodity prices’ upsurge results in the increase in total creditgrowth rate, foreign currency credit growth rate and the rate ofaccumulation of external debt in most countriesThe improvement of the conditions of international tradecontributes to the rise of dollarization and the decline of NPL inRussiaInterest rates rise during the expansionary phase of commoditycycle in AEs and EMEs with high level of MPP implementationEMEs with active usage of MPP instruments are less exposed toexternal conditions’ vulnerabilitiesEconomic authorities in EMEs should develop national financialmarkets and pursue countercyclical MPP
Marina Tiunova (Bank of Russia) Commodity and Credit Cycles 22-23 November, 2018 40 / 52

Thank you for your attention!
Marina Tiunova (Bank of Russia) Commodity and Credit Cycles 22-23 November, 2018 41 / 52

Appendix
Marina Tiunova (Bank of Russia) Commodity and Credit Cycles 22-23 November, 2018 42 / 52

IRFs
Marina Tiunova (Bank of Russia) Commodity and Credit Cycles 22-23 November, 2018 43 / 52

Russia
-0,08
-0,06
-0,04
-0,02
0
0,02
1 4 7 10 13 16 19 22 25 28 31 34 37
The response of interest rate
-0,6
-0,4
-0,2
0
0,2
1 4 7 10 13 16 19 22 25 28 31 34 37
The response of exchange rate
-2
-1
0
1
2
1 4 7 10 13 16 19 22 25 28 31 34 37
The response of CDS spread
-0,1
0
0,1
0,2
0,3
0,4
1 4 7 10 13 16 19 22 25 28 31 34 37
The response of consumer credit in national currency
0
0,1
0,2
0,3
0,4
1 4 7 10 13 16 19 22 25 28 31 34 37
The response of consumer credit in foreign currency
-0,1
0
0,1
0,2
1 4 7 10 13 16 19 22 25 28 31 34 37
The response of enterprise credit in national currency
-0,1
0
0,1
0,2
0,3
1 4 7 10 13 16 19 22 25 28 31 34 37
The response of enterprise credit in foreign currency
-0,03
-0,02
-0,01
0
0,01
1 4 7 10 13 16 19 22 25 28 31 34 37
The response of the NPL share of consumer credit in national currency
-0,15
-0,1
-0,05
0
0,05
1 4 7 10 13 16 19 22 25 28 31 34 37
The response of the NPL share of consumer credit in foreign currency
-0,03
-0,02
-0,01
0
1 4 7 10 13 16 19 22 25 28 31 34 37
The response of the NPL share of enterprise credit in national currency
-0,05
0
0,05
0,1
0,15
0,2
1 4 7 10 13 16 19 22 25 28 31 34 37
The response of total credit in national currency
-0,1
0
0,1
0,2
0,3
1 4 7 10 13 16 19 22 25 28 31 34 37
The response of total credit in foreign currency
-0,05
0
0,05
0,1
0,15
0,2
1 4 7 10 13 16 19 22 25 28 31 34 37
The response of total credit
0
0,02
0,04
0,06
1 4 7 10 13 16 19 22 25 28 31 34 37
The response of the dollarization coefficient of consumer credit
0
0,02
0,04
0,06
1 4 7 10 13 16 19 22 25 28 31 34 37
The response of the dollarization coefficient of the enterprise credit
0
0,02
0,04
0,06
1 4 7 10 13 16 19 22 25 28 31 34 37
The response of total dollarization coefficient
-0,1
0
0,1
0,2
1 4 7 10 13 16 19 22 25 28 31
The response of external corporate sector debt
-0,4
-0,3
-0,2
-0,1
0
0,1
1 4 7 10 13 16 19 22 25 28 31
The response of credit-to-GDP ratio
Marina Tiunova (Bank of Russia) Commodity and Credit Cycles 22-23 November, 2018 44 / 52

Colombia
-0,04
-0,02
0
0,02
0,04
1 4 7 10 13 16 19 22 25 28 31 34 37
The response of interest rate
-0,3
-0,2
-0,1
0
0,1
1 4 7 10 13 16 19 22 25 28 31 34 37
The response of exchange rate
-1
-0,5
0
0,5
1 4 7 10 13 16 19 22 25 28 31 34 37
The response of CDS spread
-0,05
0
0,05
0,1
0,15
1 4 7 10 13 16 19 22 25 28 31 34 37
The response of total credit
0
0,05
0,1
0,15
0,2
1 4 7 10 13 16 19 22 25 28 31 34 37
The response of consumer credit
-0,01
-0,005
0
0,005
0,01
0,015
1 4 7 10 13 16 19 22 25 28 31 34 37
The response of the NPL share of consumer credit
-0,1
-0,05
0
0,05
0,1
0,15
1 4 7 10 13 16 19 22 25 28 31 34 37
The response of enterprise credit
-0,01
-0,005
0
0,005
0,01
1 4 7 10 13 16 19 22 25 28 31 34 37
The response of the NPL share of enterprise credit
-0,3
-0,2
-0,1
0
0,1
1 4 7 10 13 16 19 22 25 28 31 34 37
The response of the external debt of private sector
-0,1
-0,05
0
0,05
0,1
1 4 7 10 13 16 19 22 25 28 31 34 37
The response of credit-to-GDP ratio
-1,5
-1
-0,5
0
0,5
1
1,5
1 4 7 10 13 16 19 22 25
The response of credit in foreign currency
Marina Tiunova (Bank of Russia) Commodity and Credit Cycles 22-23 November, 2018 45 / 52

Chile
-0,04
-0,02
0
0,02
0,04
0,06
1 4 7 10 13 16 19 22 25 28 31 34 37
The response of interest rate
-0,3
-0,2
-0,1
0
0,1
0,2
1 4 7 10 13 16 19 22 25 28 31 34 37
The response of exchange rate
-2
-1
0
1
2
1 4 7 10 13 16 19 22 25 28 31 34 37
The response of CDS spread
-0,1
-0,05
0
0,05
0,1
1 3 5 7 9 11 13 15 17 19 21 23 25
The response of total credit
-0,02
0
0,02
0,04
0,06
0,08
1 3 5 7 9 11 13 15 17 19 21 23 25
The response of consumer credit
-0,1
-0,05
0
0,05
0,1
1 3 5 7 9 11 13 15 17 19 21 23 25
The response of enterprise credit
-0,1
-0,05
0
0,05
0,1
1 4 7 10 13 16 19 22 25 28 31 34 37
The response of external debt
-0,15
-0,1
-0,05
0
0,05
0,1
1 3 5 7 9 11 13 15 17 19 21 23 25
The response of credit-to-GDP ratio
-0,2
0
0,2
0,4
0,6
1 4 7 10 13 16 19 22 25
The response of credit in foreign currency
Marina Tiunova (Bank of Russia) Commodity and Credit Cycles 22-23 November, 2018 46 / 52

Brazil
-0,01
-0,005
0
0,005
1 4 7 10 13 16 19 22 25 28 31
The response of exchange rate
-1,5
-1
-0,5
0
0,5
1
1 4 7 10 13 16 19 22 25 28 31
The response of CDS spread
-0,05
0
0,05
0,1
0,15
1 4 7 10 13 16 19 22 25 28 31
The response of total credit
-0,1
-0,05
0
0,05
0,1
0,15
0,2
1 4 7 10 13 16 19 22 25 28 31
The response of enterprise credit
-0,3
-0,2
-0,1
0
0,1
1 4 7 10 13 16 19 22 25 28 31
The response of the external debt of private sector
-0,05
0
0,05
0,1
0,15
1 4 7 10 13 16 19 22 25 28 31
The response of credit-to-GDP ratio
-0,1
0
0,1
0,2
0,3
1 4 7 10 13 16 19 22 25 28 31
The response of credit in foreign currency
-0,1
0
0,1
0,2
0,3
1 4 7 10 13 16 19 22 25 28 31
The response of dollarization coefficient
Marina Tiunova (Bank of Russia) Commodity and Credit Cycles 22-23 November, 2018 47 / 52

Canada
-0,15
-0,1
-0,05
0
0,05
1 4 7 10 13 16 19 22 25
The response of exchange rate
-0,1
-0,05
0
0,05
0,1
0,15
1 4 7 10 13 16 19 22 25
The response of the external debt
-0,08
-0,06
-0,04
-0,02
0
0,02
0,04
1 4 7 10 13 16 19 22 25
The response of total credit
-0,15
-0,1
-0,05
0
0,05
1 4 7 10 13 16 19 22 25
The response of enterprise credit
-0,15
-0,1
-0,05
0
0,05
1 4 7 10 13 16 19 22 25
The response of credit-to-GDP ratio
-0,3
-0,2
-0,1
0
0,1
0,2
1 4 7 10 13 16 19 22 25
The response of credit in foreign currency
-0,4
-0,3
-0,2
-0,1
0
0,1
0,2
1 4 7 10 13 16 19 22 25
The response of dollarization coefficient
Marina Tiunova (Bank of Russia) Commodity and Credit Cycles 22-23 November, 2018 48 / 52
Australia
-0,015
-0,01
-0,005
0
0,005
0,01
0,015
1 3 5 7 9 11 13 15 17 19 21 23 25
The response of interest rate
-0,2
-0,1
0
0,1
0,2
1 3 5 7 9 11 13 15 17 19 21 23 25
The response of exchange rate
-0,15
-0,1
-0,05
0
0,05
0,1
1 3 5 7 9 11 13 15 17 19 21 23 25
The response of external debt
-0,3
-0,2
-0,1
0
1 3 5 7 9 11 13 15 17 19 21 23 25
The response of consumer credit
-0,1
-0,05
0
0,05
1 3 5 7 9 11 13 15 17 19 21 23 25
The response of enterprise credit
-0,08
-0,06
-0,04
-0,02
0
0,02
1 3 5 7 9 11 13 15 17 19 21 23 25
The response of total credit
-0,1
-0,05
0
0,05
1 3 5 7 9 11 13 15 17 19 21 23 25
The response of credit-to-GDP ratio
Marina Tiunova (Bank of Russia) Commodity and Credit Cycles 22-23 November, 2018 49 / 52

Literature
1. Agarwal I., Duttagupta R., Presbitero A. (2017). International commodity prices and domestic bank lendingin developing countries. IMF Working Paper, no. 279.2. Allen J., Grieder T., Peterson B., Roberts T. (2017). The impact of macroprudential housing finance tools inCanada. BIS Working Papers, no. 632.3. Barroso J., Gonzalez R., Doornik B. (2017). Credit supply responses to reserve requirement: loan-level evidencefrom macroprudential policy. BIS Working Papers, no. 674.4. Bergholt D., Larsen V. (2016). Business cycles in an oil economy: lessons from Norway. Norges Bank ResearchWorking Paper, no. 16.5. Blake A., Mumtaz H. (2017). Applied Bayesian econometrics for central bankers. Centre for Central BankingStudies.6. Bruno V., Shim I., Shin H.S. (2015). Comparative assessment of macroprudential policies. BIS Working Papers,no. 502.7. Cerutti E., Claessens S., Laeven L. (2017). The use and effectiveness of macroprudential policies: new evidence.Journal of Financial Stability, vol. 28, pp. 203–224.8. Cifuentes R., Claro S., Jara A. (2017). Macroeconomic and financial volatility and macroprudential policies inChile. BIS Working Papers, no. 94.9. Cizel J., Frost J., Wierts P. (2016). Effective macroprudential policy: cross-sector substitution from price andquantity measures. IMF Working Paper, no. 94.10. Coulibaly B. (2012). Monetary policy in emerging market economies: what lessons from the global financial crisis?Board of Governors of the Federal Reserve System International Finance Discussion Papers, no. 1042.11. Danilova E., Elizarova N. (2017). Macroprudential policy: theoretical aspects and practical experience of theBank of Russia. Russian Journal of Money and Finance, no. 6, pp. 5-17. (In Russian)12. De Moura M., Bandeira F. (2017). Macroprudential policy in Brazil. BIS Working Papers, no. 94.
Marina Tiunova (Bank of Russia) Commodity and Credit Cycles 22-23 November, 2018 50 / 52

Literature
13. Demeshev B., Malakhovskaya O. (2016). BVAR mapping. Applied econometrics, vol. 43, pp. 118-141. (InRussian)14. Gambacorta L., Murcia A. (2017). The impact of macroprudential policies and their interaction with monetarypolicy: an empirical analysis using credit registry data. BIS Working Papers, no. 636.15. Gomez E., Lizarazo A., Mendoza J., Murcia A. (2017). Evaluating the impact of macroprudential policies oncredit growth in Colombia. BIS Working Papers, no. 634.16. Gonzalez A., Hamann F., Rodrıguez D. (2015). Macroprudential policies in a commodity exporting economy.BIS Working Papers, no. 506.17. Kaminsky G., Reinhart C., Vegh C. (2004). When it rains, it pours: procyclical capital flows and macroeconomicpolicies. NBER Macroeconomics Annual, vol. 19, pp. 11-53.18. Kinda T., Mlachila M., Quedraogo R. (2016). Commodity price shocks and financial sector fragility. IMFWorking Paper, no. 12.19. Kolb B. (2016). Codes on Bayesian VARs using the Gibbs sampler.20. Lomivorotov R. (2015).The identification of the main macroeconomic shocks in Russia, the estimation of itsimpact on the economy and conclusions for the monetary policy. The dissertation for the candidate of economic sciences.(In Russian)21. Malakhovskaya O., Minabutdinov A. (2013). Dynamic Stochastic General Equilibrium model of the export-oriented economy. Scientific Reports of the Laboratory for Macroeconomic Analysis NRU HSE, WP12 Series, no. 04.(In Russian)22. Menna L., Tobal M. (2018). Financial and price stability in emerging markets: the role of the interest rate. BISWorking Papers, no. 717.23. Pestova A., Mamonov M. (2016). Estimating the influence of different shocks on macroeconomic indicators anddeveloping conditional forecasts on the basis of BVAR model for the Russian economy. Economic Policy, vol. 11, no. 4,pp. 56-92. (In Russian)24. Polbin A. (2017). Econometric estimation of the impact of oil prices shock on the Russian economy in VECMmodel. The Issues of Economics, no. 10, pp. 27-49. (In Russian)
Marina Tiunova (Bank of Russia) Commodity and Credit Cycles 22-23 November, 2018 51 / 52

Literature
25. Sinyakov A., Khotulev I. (2017). Optimal monetary, fiscal and macroprudential policy in oil exporting economy.Russian Journal of Money and Finance, no. 9, pp. 58-66.26. Richter B., Schularick M., Shim I. (2018). The macroeconomic effects of macroprudential policy. BIS WorkingPapers. 2018. No. 740.27. Vargas H., Cardoz P., Murcia A. (2017). The macroprudential policy framework in Colombia. BIS WorkingPapers, no. 94.28. Financial Stability Review. (2014). Informational and analytical materials, Bank of Russia. June 2014.29. Financial Stability Review. (2016). Informational and analytical materials. Bank of Russia. Q2 – Q3 2016. No.2.
Marina Tiunova (Bank of Russia) Commodity and Credit Cycles 22-23 November, 2018 52 / 52