Commission Special Meeting - Granicus
58
Serving with Excellence, Innovation and Integrity. July 22, 2020 Commission Special Meeting Business Plan II 1
Transcript of Commission Special Meeting - Granicus

Serving with Excellence, Innovation and Integrity.
July 22, 2020
Commission Special MeetingBusiness Plan II
1

Serving with Excellence, Innovation and Integrity.
Business Plan II Agenda
Next Steps
Forecasting Model
Business Initiatives
Fund Overviews
Current environment – Budgeting for FY2021
Current fiscal conditions

Serving with Excellence, Innovation and Integrity.
Current environmental conditions
3
COVID‐19
Volatile Stock Market
Social Change
Slowing of consumer confidence
Strong Real Estate Market
Business Closures

Serving with Excellence, Innovation and Integrity.
This budget focuses on adapting to rapidly
changing conditions while ensuring that our
residents and businesses continue to receive quality services. More than ever,
our budget needs flexibility to address our community needs, and this flexibility is possible because of the City’s
dedicated and innovative staff that continue to adapt to changing priorities without
sacrificing service levels.
4
“Can we afford to own what we currently own?”
Formulate Multiple Budget scenarios
FY2021 Prior COVID‐19 FY2020 LevelsFY2020 minus 2% of operations
FY2020 minus 5% of operations
Departments are asked to review and supply 18 items
Dept. Mission
Core Processes
Key Performance Indicators (KPI)
New & Ongoing Initiatives
Staffing
Capital Improvement
Program(CIP) &
Replacement Plans
Line Item Details
Budget Kick‐off

Serving with Excellence, Innovation and Integrity.
Effects of COVID‐19 on Revenues
5
• Scenario results in a $11.7M revenue loss over 3 years.
• Revenue loss is before any:o Federal Assistanceo Short or mid term borrowing to bridge cash flow shortfall
oAppropriating Fund Balance (Reserves)
Revenues With COVID‐19
Revenues Without COVID‐19
120,000,000.00
125,000,000.00
130,000,000.00
135,000,000.00
140,000,000.00
145,000,000.00
150,000,000.00
155,000,000.00
160,000,000.00
FY18 FY19 FY20 FY21 FY22 FY23 FY24 FY25 FY26
General Fund Revenue Loss
Baseline Variance Revenues With COVID Revenues Without COVID

Serving with Excellence, Innovation and Integrity.
Our Proposal Considers the following:
Assumptions:• Variable Revenues
• Property Values (+)• State Revenues (‐)• Charges for Services (unknown)
• One Time Financial Tactics• Equipment Svcs Fund Depreciation• Liquidate CIP• Restrict Travel• Health Fund cost restraint• Continue essential hiring practice• Hold on needed projects• Appropriations if needed
• Monthly Financial review• Quarterly Recommended action
Consequences on the Operations:• Training (Registration/Education)
• Equipment• Reduce Supplies• Travel/Meals/Lodging• Performance Incentives• Reduced Fund Balance – risky• Museum subsidy
6

Serving with Excellence, Innovation and Integrity.
Delaying MomentumFiscally – delay in plans• Increasing Reserves 17‐25%• Addressing CIP plan
• Recurring Capital• One‐Time Capital
• Developing plans to “afford to own what we own”
• Enhancing replacement plans• Facilities (A/C, Roof)• Parks Replacement ‐ fencing
• Establishing new replacement plans• Radio Equipment• Charter School CIP plan
Strategic Plan – delay in milestones• Charter School – on hold• Public Safety/Public Works Building – delay in milestones due to funding
• Amphitheater Development – on hold• Village Square Development ‐ delay• Corporate Park Business Development –different milestones
• Entertainment Destination Strategy – on hold• Co‐Work Space Development – on hold• University Presence Strategy – on hold
7
Strategic Plan Completion: 17/53Business Plan Completion: 91/185

Serving with Excellence, Innovation and Integrity.
CURRENT FISCAL CONDITIONS
8

Serving with Excellence, Innovation and Integrity.
FY 2020 Year‐end ProjectionGeneral Fund
Revenues Expenditures
$128,062,245 $131,385,704
Estimated Deficit = ($3,323,459)
Projections as of end of June (75% of Fiscal Year)
Estimated Year‐end Range Projection = $3 million ‐ $7 million . Forecasters encourage ranges as fluctuations and changes in market volatility are inevitable during this time.

Serving with Excellence, Innovation and Integrity.
FY 2020 Year‐end ProjectionFire Fund
Revenues Expenditures
$25,446,615 $25,569,162
Estimated Deficit = ($122,547)
Projections as of end of June (75% of Fiscal Year)

Serving with Excellence, Innovation and Integrity.
FY 2020 Year‐end ProjectionMuseum Fund
Revenues Expenditures
$299,665 $424,034
Estimated Deficit = ($124,368)
Projections as of end of June (75% of Fiscal Year)

Serving with Excellence, Innovation and Integrity.
BUSINESS INITIATIVES
12


Serving with Excellence, Innovation and Integrity.
CITY OF CORAL SPRINGSWHAT YOU GET FOR YOUR MONEY
• Playground Equipment Replacement• Light Fixture Replacement Program• Pickleball Courts at Cypress Park
• Police Replacement Equipment• Firefighter/Paramedics Equipment
• ADA Intersection Upgrades• Funding Road Resurfacing Program• Continued Median Improvements• Existing Walkway Renovations
Serving with Excellence, Innovation and Integrity.
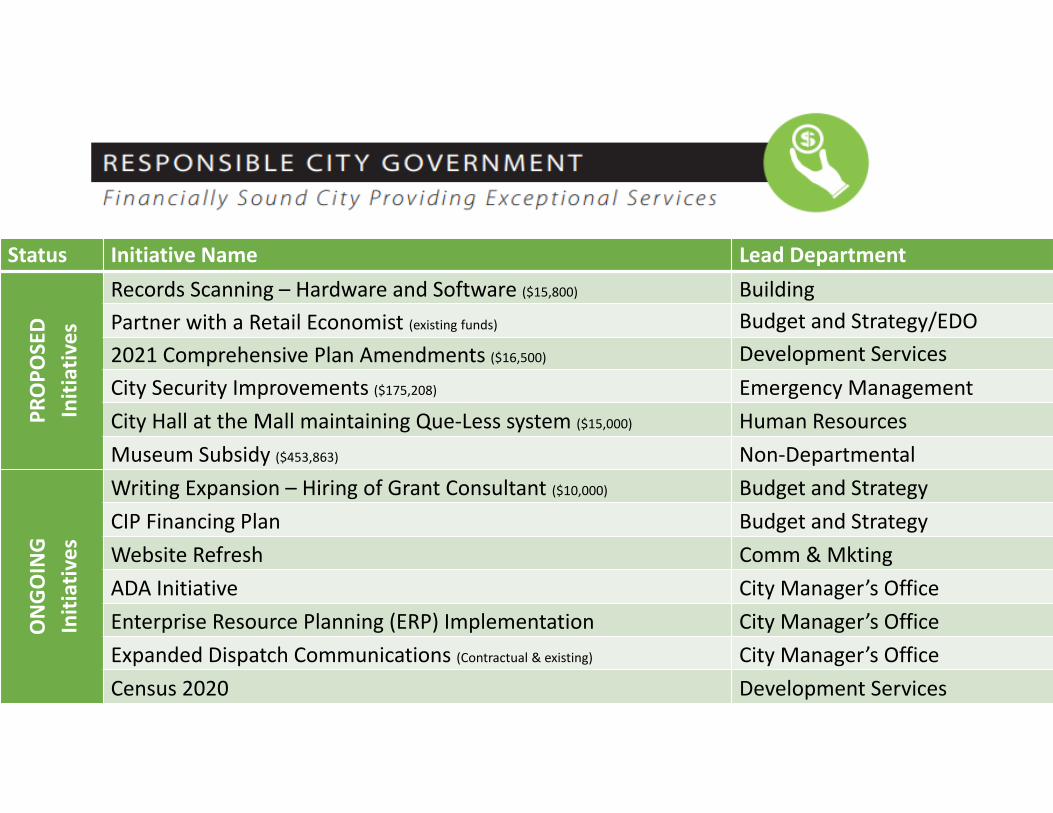
Status Initiative Name Lead Department
PROPO
SED
Initiatives
Records Scanning – Hardware and Software ($15,800) BuildingPartner with a Retail Economist (existing funds) Budget and Strategy/EDO2021 Comprehensive Plan Amendments ($16,500) Development ServicesCity Security Improvements ($175,208) Emergency ManagementCity Hall at the Mall maintaining Que‐Less system ($15,000) Human ResourcesMuseum Subsidy ($453,863) Non‐Departmental
ONGOING
Initiatives
Writing Expansion – Hiring of Grant Consultant ($10,000) Budget and StrategyCIP Financing Plan Budget and StrategyWebsite Refresh Comm & MktingADA Initiative City Manager’s OfficeEnterprise Resource Planning (ERP) Implementation City Manager’s OfficeExpanded Dispatch Communications (Contractual & existing) City Manager’s OfficeCensus 2020 Development Services

Serving with Excellence, Innovation and Integrity.
Status Initiative Name Lead Department
PROPO
SED
Initiatives
Fencing Replacement and Repair ($150,000) Parks & RecreationIrrigation Control System Upgrade ($100,000) Parks & RecreationCanopy Structures Replacement with NCP ($100,000) Parks & RecreationPublic Safety Building 2nd Floor UPS Batteries ($144,750) Police DepartmentPolice Dispatch Redundant A/C ($473,386) Police DepartmentRock Island Bike Lane ($135,000) Public WorksTurtle Creek Bike Lane ($85,000) Public Works
ONGOING
Initiatives
Public Safety/Public Works Campus (4150) Phase 2 City Manager’s OfficeCity Owned Property Master Plan Development Services
Parks Master Plan Implementation Early Phase (Including Senior Programing expansion/Senior Center & Sawgrass Nature Center)
Parks & Recreation
Traffic Calming Program: Implementation Development ServicesSawgrass/10th Street Plan: Advocacy Development Services

Serving with Excellence, Innovation and Integrity.
Status Initiative Name Lead Department
PROPO
SED
Initiatives
Enhanced Downtown Events/Entertainment (existing) Economic Development CRA
Infrastructure Improvements in Downtown (existing) Economic Development
Retail Strategy ($35,000) Economic Development
Commercial Retail Focus in downtown (existing) Economic Development
Feasibility Study for the Center for the Arts ($75,000) City Manager’s Office
Cornerstone ‐ beginning of project phase A (existing) Economic Development
ONGOING
Initiatives Charter School Location City Manager’s Office
Amphitheater Development City Manager’s Office
Village Square Development Economic Development

Serving with Excellence, Innovation and Integrity.
Status Initiative Name Lead Department
PROPO
SED
Initiatives
Q‐Less for queueing in the One Stop Shop ($9,012) Building
E‐Plan Review – Blue Beam Licenses ($13,000) Building
Coral Springs Regional Chamber Business ($8,000) Economic Development
Researching Local Procurement Options (existing funds) Finance/EDO/Legal
ONGOING
Initiatives
Renaming Commerce Park Economic Development
Increased Business Retention and Expansion Visits Economic Development
Entertainment Destination Strategy Comm & Mkting | EDO
Co‐Work Space Development Economic Development
University Presence Strategy Economic Development
Corporate Park Drainage and Infrastructure Upgrade Public Works

Serving with Excellence, Innovation and Integrity.
Status Initiative Name Lead Department
PROPO
SED
Initiatives
Revitalized Code Range Program (existing funds) Development Services
City Signage (existing funds) City Manager’s Office
Neighborhoods with Integrity ($21,100) Development Services
ONGOING
Initiatives Public Schools Partnership Strategy Budget and Strategy
Everglades Strategy City Manager’s Office
CDBG Sidewalk Replacements: NW 85TH Ave, NW 91st Ave, NW 35th Court
(CDBG Funding)
Development Services & Public Works

Serving with Excellence, Innovation and Integrity.
FY 2021 Tree Trust Fund ProjectsMedian Improvements $300,000Landscape improvements Sample Road
• From University Dr. to SR‐7• From the Sawgrass Expressway to
University Dr.
* If funds are available after Sample Road‐ Coral Ridge Dr. (Westview Dr. to Wiles Rd)
Serving with Excellence, Innovation and Integrity.
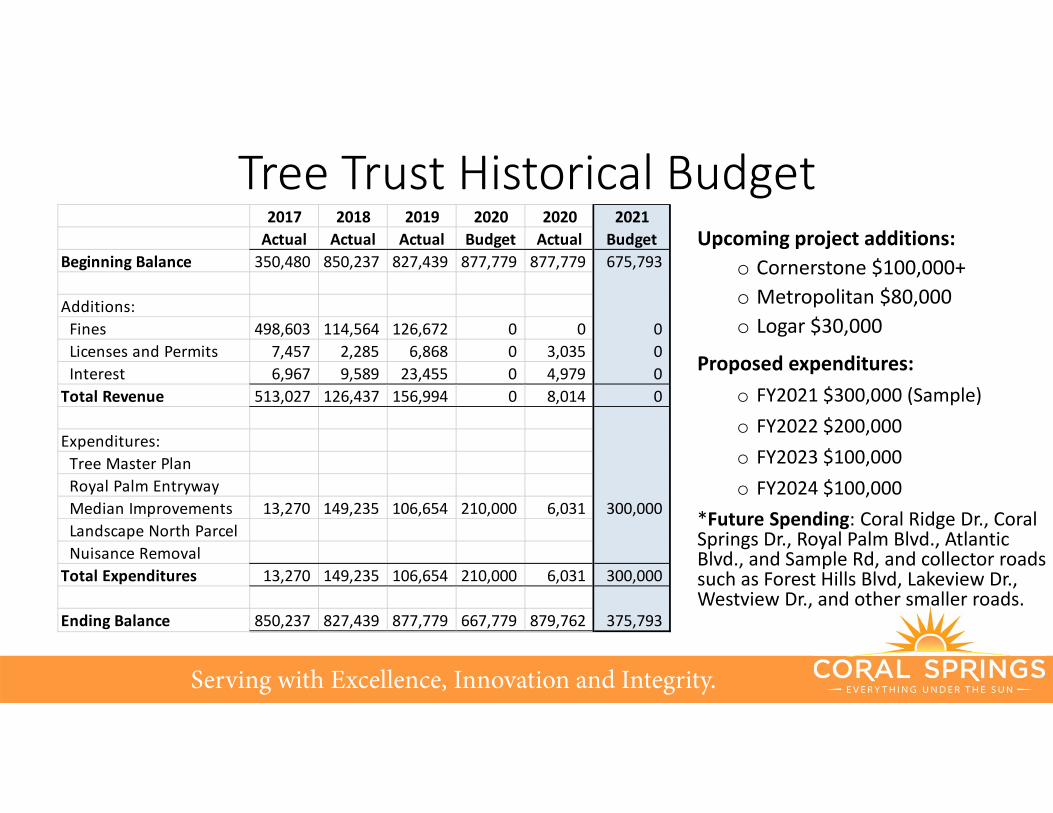
Tree Trust Historical BudgetUpcoming project additions:
o Cornerstone $100,000+o Metropolitan $80,000 o Logar $30,000
Proposed expenditures:o FY2021 $300,000 (Sample)o FY2022 $200,000 o FY2023 $100,000 o FY2024 $100,000
*Future Spending: Coral Ridge Dr., Coral Springs Dr., Royal Palm Blvd., Atlantic Blvd., and Sample Rd, and collector roads such as Forest Hills Blvd, Lakeview Dr., Westview Dr., and other smaller roads.
2017 2018 2019 2020 2020 2021Actual Actual Actual Budget Actual Budget
Beginning Balance 350,480 850,237 827,439 877,779 877,779 675,793
Additions: Fines 498,603 114,564 126,672 0 0 0 Licenses and Permits 7,457 2,285 6,868 0 3,035 0 Interest 6,967 9,589 23,455 0 4,979 0Total Revenue 513,027 126,437 156,994 0 8,014 0
Expenditures: Tree Master Plan Royal Palm Entryway Median Improvements 13,270 149,235 106,654 210,000 6,031 300,000 Landscape North Parcel Nuisance RemovalTotal Expenditures 13,270 149,235 106,654 210,000 6,031 300,000
Ending Balance 850,237 827,439 877,779 667,779 879,762 375,793

Serving with Excellence, Innovation and Integrity.
ENTERPRISE RESOURCE PLANNING (ERP) SYSTEM
Budget and Operational Challenges/Opportunities
PUBLIC SAFETY/ PUBLIC WORKS CAMPUS
DISPATCH COMMUNICATIONS
ADA INITIATIVE
DEPARTMENT REQUESTS & UNFUNDED CAPITAL IMPROVEMENT LEGISLATURE/
UNFUNDED MANDATES

Serving with Excellence, Innovation and Integrity.
New Staff for FY 2021 Initiatives
*Conversions from Part‐Time Full Time
Positions Added for FY2021 Initiative Position Count Operating Cost Capital Expenditure FundPension Coordinator* 1 ‐$ ‐$ General
1 New Staff Position 1 ‐$ ‐$
This position has no cost to the General Fund as the Police and Fire Pension Boards are funding this position

Number of Full‐Time Employees*
789753 751 752 764 777 792 795 798
823 828 831 837
34
34 34 3737
3736 36 36
36 42 42 41
Regular ContractFY21 TTAV
$11.2 billion
# Bu
dgeted
Positio
ns
*Excludes City Commission
Serving with Excellence, Innovation and Integrity.
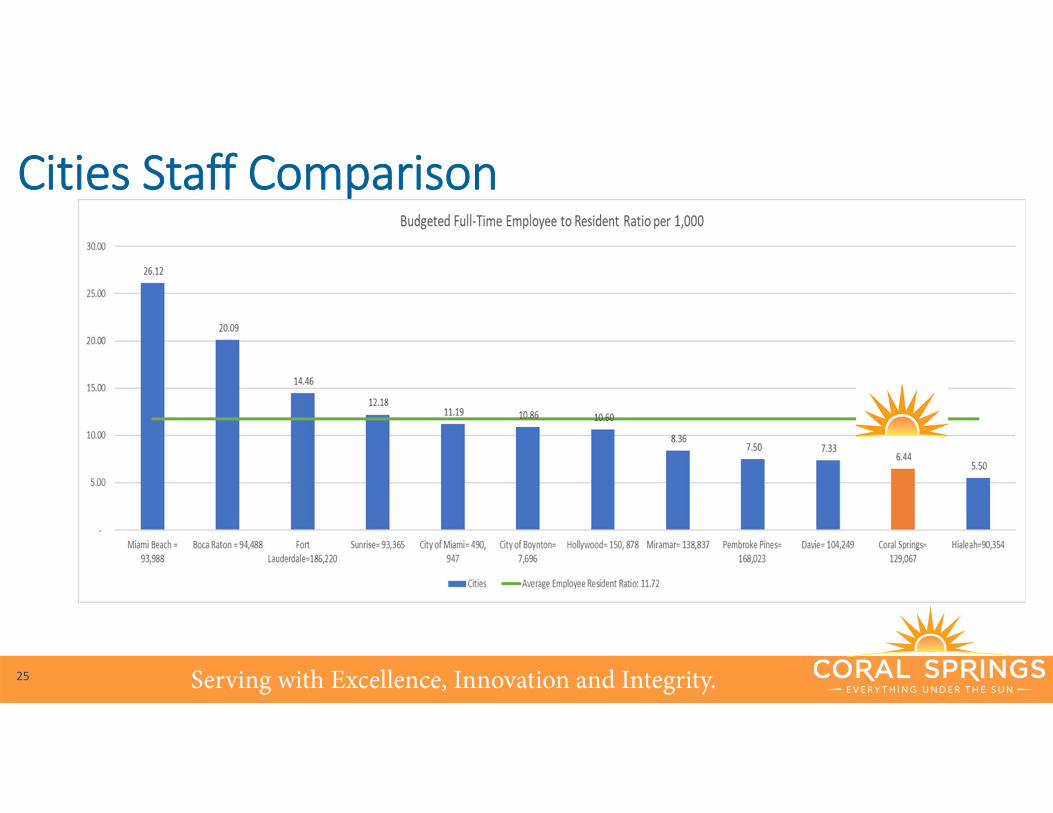
Cities Staff Comparison
25

Serving with Excellence, Innovation and Integrity.
FUND OVERVIEWS
26

Serving with Excellence, Innovation and Integrity.
Fire Assessment ComparisonLocal Cities with full service Fire Departments
372.8
4
350.0
0
256.0
0 300.0
0
222.0
0 271.4
8
175.0
0
180.0
0 209.5
0
163.0
0 196.0
0
398.2
3
350.0
0
256.0
0 300.0
0
285.0
0
271.7
5
175.0
0
200.0
0
209.5
0
210.0
0
206.0
0
398.2
3
350.0
0
311.0
0
300.0
0
285.0
0
282.3
8
235.0
0
227.8
2
229.5
0
220.0
0
206.0
0 234.0
0
$0
$50
$100
$150
$200
$250
$300
$350
$400
$450
*Miramar *Tamarac *Ft Lauderdale *Margate *Hollywood *PembrokePines
*DeerfieldBeach (BSO)
*Coral Springs Sunrise *PompanoBeach (+EMS
millage)
Davie
FY 2018 FY 2019 FY2020 FY 2021 Preliminary
*ISO 1 Fire Departments

Serving with Excellence, Innovation and Integrity.
FY 2021 Fire Fund Highlights • Preliminary Fire Assessment Rates
o Residential from $227.82 to $234.00o Commercial from $26.99 to $25.07o Industrial/Warehouse from $2.71 to $4.02o Institutional from $54.51 to $49.53
• Adds to Staff:o None
• Focus on Firefighter safety and health• Capital requests include:
o Personal Protective Equipment Replacement — $426,793o Self Contained Breathing Apparatus Replacement Plan — $125,431 o Fire Stations Painting & Improvements — $103,021o Vehicles (2) — $94,000o Residential Fire Sprinkler Feasibility Study — $10,000

Serving with Excellence, Innovation and Integrity.
$100
$150
$200
$250
$300
$350
$400
$450
$500
$550
Fort Lauderdale Hollywood Parkland Sunrise Coral Springs Coconut Creek Tamarac Davie
FY 2018 FY 2019 FY 2020
$379
.32
$370
.92
$372
.00
$273
.75
$223
.32
$207
.54
$198
.36
$260
.00
$248
.00
$390
.72
$377
.65
$278
.75
$223
.32
$215
.00
$204
.12$2
90.00
$488
.40
$456
.00
$388
.56
$324
.33
$284
.04
$278
.75
$230
.64
$372
.00
Residential Solid Waste Assessment Comparison

Serving with Excellence, Innovation and Integrity.
Preliminary Solid Waste Assessment FY 2019 FY 2020 FY 2021 FY 2021
Residential Service Actual ActualRecy to WTE
Option 1Recy to WTE
Option 2Collection- WastePro $78.35 $86.28 $87.89 $87.89Disposal- Wheelabrator $77.41 $78.92 $93.67 $93.67Franchise Fee $76.32 $76.32 $76.32 $76.32Recycle Processing – Waste Mgt $8.63 $12.63 $0.00 $0.00
Other: HHW/Paint $2.77 $2.81 $2.87 $2.87Admin/BCPA $5.99 $6.36 $6.36 $6.36
Reserve/Early Pmt Discount $9.82 $11.79 $11.79 $11.79Contingency $0.00 $14.89 $11.10 $5.00
Capital $1.02 $0.00 $0.00 $0.00Annual Assessment $260.00 $290.00 $290.00 $283.90

Serving with Excellence, Innovation and Integrity.
FY2021 Stormwater AssessmentCurrent projects in progress:
Corporate Park Drainageo Design completed in FY2020o Construction to commence November 2020
Meadows and Dells Drainageo Design in process in FY2020o Construction to commence May 2021
Westchester Drainageo Design in process FY2020o Construction to commence in FY2022
FY2020 Annual Assessment $115.66
FY2021 Proposed Assessment $119.13
Proposed Increase $ 3.47

Serving with Excellence, Innovation and Integrity.
Grant SummaryFY2020 YTDExplored (Total of all grants) = $30 millionApplied for (submitted) = $23.4 millionTotal Pending and In Process = $17.9 million State Requests = $4.1 millionState Requests Funded = $0Total Funded = $2.4 million
FY2019 TotalExplored (Total of all grants) = $25.3 millionApplied for (submitted) = $15.2 millionTotal Pending and In Process = $9.3 million State Requests = $7 millionState Requests Funded = $0Total Funded = $5.3 million

Serving with Excellence, Innovation and Integrity.
Connecting Local Businesses to Grants and Loans Program
• Total Businesses Enrolled: 335• Total returned Hold Harmless and Vetted: 175• Total Vetted and in Application Process: 175• Total Received Funding: 87 (26%)• Total Amount Received: $1,426,048
33

Serving with Excellence, Innovation and Integrity.
Replenish Fire Fund, Water & Sewer Fund for Irma expenses
Replenish Unassigned Reserves & Fund Balance
Reserve funding for Capital expenses to avoid issuing debt
Hurricane IRMA
ReimbursementsCOVID-19
Replenish General, Fire and Health Fund for expenses
Replenish Fund Balance & Capital
Reserve funding for Capital expenses to avoid issuing debt
City currently an $25M Open line of credit for 30 months
Hurricane DORIAN
Replenish General, Fire and Water & Sewer Fund for expenses
Replenish Fund Balance Reserve funding for Capital
expenses to avoid issuing debt

Serving with Excellence, Innovation and Integrity.
Surtax Update
35
While the City submitted an additional project for road resurfacing of the streets in 5 neighborhoods and portions of 2 collector streets, the project request of approximately $1.8 million was ranked 48th for R&M projects. Due to funding limitations for R&M projects, only the top 40 projects are able to be funded. While the County Commission could remove projects from the R&M list, there has been no indication that this would occur.

Serving with Excellence, Innovation and Integrity.
Top 8 Revenues, 27%
Ad Valorem Taxes, 48%
Other, 5%
Charges for Services/User Fees, 19%
FY 2021 General Fund Budget Total Revenues: $130,990,742
Ad Valorem = $62,796,766Top 8 Revenues* = $35,923,175Charges for Services* = $25,127,950/User FeesOther = $ 7,142,851TOTAL $130,990,742
*Revenues at Risk
Where the Money Comes From

General Fund 5 Year Forecast

Serving with Excellence, Innovation and Integrity.38Note: Slide from July 2017

Serving with Excellence, Innovation and Integrity.39Note: Slide from July 2017

Serving with Excellence, Innovation and Integrity.
FY2019 action to control expenditure growth assisted staff in addressing the current situation.Due to these proactive measures, staff was able to make the difficult, but necessary, decisionto pull back expenditures relative to revenue declines for FY2021. By the Budget & Strategystaff working with departments, we will be able to assess the current financial actuals andforecast the year ahead and either put forth mid-year budget amendments (assuming returnsexceeding expectations) or, if faced with deeper impacts, revert to the next scenario in ourtoolbox (-5%).
Expenditure ChangeThe General Fund Five-Year Forecast is an integral part of planning the City’sfuture fiscal position. It is an important tool used to determine a longer-rangepicture of the City’s financial horizon for financial stability. This tool is used toevaluate the level of risk the City could face over time if operational costs andexpenditure decisions are higher than revenue growth.
-2%
Controlled ExpendituresFY2021 Reduction of operating expenses
RevenueDiversificationPer Rating Agency review, continue to diversify revenues
Stabilization Current level is 18% of the Stabilization Reserve Requirement of 17-25%
Impact to StakeholderMaintain service levels to our residents and businesses amidst uncertain times
5 Year Forecast TrendFinancial Stability and recommended assumptions
‐4.0%
‐2.0%
0.0%
2.0%
4.0%
6.0%
8.0%
FY2021 FY2022 FY2023 FY2024 FY2025 FY2026
Revenue Change Expenditure Change

Serving with Excellence, Innovation and Integrity.
FORECASTING MODEL
41

• July 22, 202042
City of Coral SpringsGeneral Fund Sustainability Analysis

Agenda
1. Our Financial Sustainability Modeling Process
2. Background
3. Key Inputs / Assumptions
4. General Fund Diagnostic View & Future Millage Adjustments
5. Discussion & Live Modelling
43

Financial Sustainability Modeling Process Starts with a ten‐year diagnostic view of the financial sustainability of the General Fund
Provides a framework for scenario evaluation and sensitivity tests Considers future consequences of current decision alternatives Develops a long‐term financial management plan inclusive of: Revenue and operating costs forecasts Capital Funding Plans Reserve levels and other KPI’s Millage adjustments Customer / Property Impacts
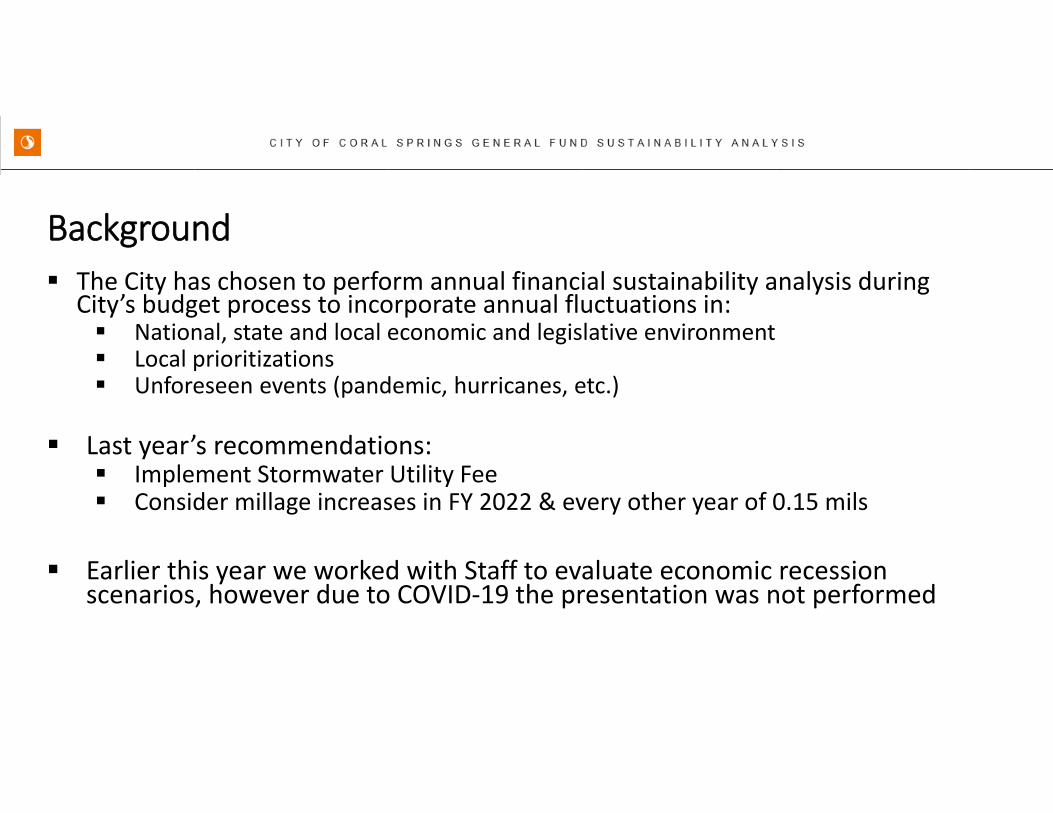
Background The City has chosen to perform annual financial sustainability analysis during
City’s budget process to incorporate annual fluctuations in: National, state and local economic and legislative environment Local prioritizations Unforeseen events (pandemic, hurricanes, etc.)
Last year’s recommendations: Implement Stormwater Utility Fee Consider millage increases in FY 2022 & every other year of 0.15 mils
Earlier this year we worked with Staff to evaluate economic recession scenarios, however due to COVID‐19 the presentation was not performed

Key Inputs / Assumptions $6 million of City staff estimated revenue losses in FY 2020 from COVID‐19 Offsetting adjustments identified by City staff to FY 2020 Budget such as:
~3% Reduction to Operating Expenses Savings in Salaries & Benefits from non‐essential hiring freeze Capital Savings from review, re‐prioritizing & repurposing of projects Use of Reserves which include $3.5M of Hurricane Irma related FEMA
reimbursements
Proposed FY 2021 Budget includes COVID‐19 revenue reductions to Sales Tax, State Shared, and Charges for Service revenues, and
Offsetting expense adjustments as estimated by Staff, including: One‐time alternative funding of vehicle depreciation chargebacks Overall departmental personnel and operating reductions
Revenues and expenses normalized in FY 2022, back to pre‐COVID levels
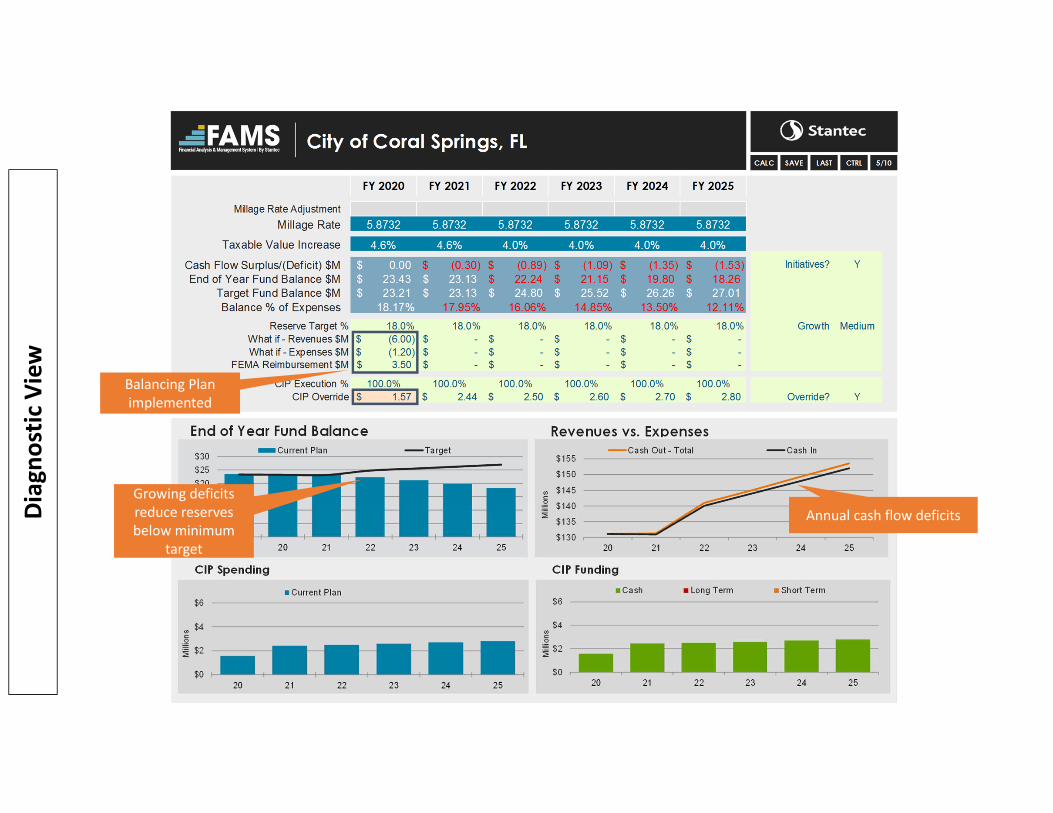
Annual cash flow deficitsGrowing deficits reduce reserves below minimum
target
Balancing Plan implemented
Diagn
ostic
View

Minimum reserves maintained
Minor adjustments to millage
Stable cash flows
Prop
osed
FY 20
21

Discussion & Live Modeling
49

Serving with Excellence, Innovation and Integrity.
8.98988.6000 8.5000 8.5000
7.4665 7.4000 7.2899 7.2500 7.1172 7.1171 7.00006.8102
6.53786.0880 6.0543 6.0018 5.9998 5.9587 5.8732 5.8000 5.6736 5.6270
5.18754.7940 4.6564
4.40004.1193
3.5893 3.5000 3.5000 3.3464
0.0000
1.0000
2.0000
3.0000
4.0000
5.0000
6.0000
7.0000
8.0000
9.0000
10.0000
City Operating Millage Rates ‐ Fiscal Year 2020
Operating Millage Rates

Serving with Excellence, Innovation and Integrity.
Operating Millage Rate
7.4665 7.11726.0018 6.0543 5.8732 5.8000 5.6736 5.6875 5.627
4.1193
$0$1
$2
$3
$4
$5$6
$7
$8
$9$10
Hollywood Miramar Deerfield Beach Sunrise Coral Springs Plantation PembrokePines
PompanoBeach*
Davie Ft Lauderdale
FY 2020 Final Millage Rates
* Pompano Beach includes a separate EMS millage of 0.5000

Serving with Excellence, Innovation and Integrity.
School Board of Broward County33.1%
South Florida Water Management District
1.4%City of Coral Springs
30.1%FL. Inland Navigation
0.2%
Hospital District5.1%
Children's Services2.4%
Broward County27.8%
School Board of Broward County
South Florida Water Management District
City of Coral Springs
FL. Inland Navigation
Hospital District
Children's Services
Broward County
How Much of Your Tax Bill Goes to the City?

Serving with Excellence, Innovation and Integrity.
FY 2021 Business Plan HighlightsStaff Recommendations Milestone Millage Yield Vote Count
ProposedMillage Rate
$5.8732 +$2.8 million revenue increase from FY 2020
State law requires 4/1 Vote to keep millage rate exactly the same
Rolled‐Back Rate
$5.6008 ‐$2.9 million cut to proposed FY 2021Budget
Simple Majority
Any millage rate above the Rolled‐Back Rate will be advertised as a Proposed Tax Increase

Serving with Excellence, Innovation and Integrity.
FY 2021 Business Plan Preliminary HighlightsStaff Recommendations
• Maintain current millage rate of 5.8732 • The average single‐family household will pay an additional $61.66 in property taxes if City maintains current
rate
• Voter‐Approved Debt Service preliminary millage rate will decrease from 0.2534 to 0.2412 (prelim)
• Fire Assessment Rates (prelim)• Residential increase from $227.82 to $234.00• Commercial decrease from $26.99 to $25.07 per sq ft.• Industrial/Warehouse increase from $2.71 to $4.02 per sq ft.• Institutional decrease from $54.51 to $49.53 per sq ft.
• Residential Solid Waste Assessment will remain the same or possibly decrease• $290.00 for Waste to Energy Recycling• $283.90 for Waste to Energy Recycling (decrease in Contingency)
• Stormwater Assessment will increase by $3.47 (prelim)• From $115.66 to $119.13
July 1 – BCPA values

Serving with Excellence, Innovation and Integrity.
Impact on Average SF Home$377,579 Average Market Value $292,482 Average Assessed Value Before Exemptions
$ Proposed $ Increase per year
$ Increase per month
Ad Valorem (SOH cap = 2.3%) $1,718 + $ 61.59 $5.13Voted Debt $ 70.53 ‐ $ 0.93 ‐ $0.08Fire Assessment $ 234.00 + $ 6.18 $0.52Stormwater Assessment $ 119.13 + $ 3.47 $0.29Solid Waste Assessment $ 290.00 + $ 0.00 $0.00Total City Taxes, Assessments $2,431.66 + $ 70.31 $5.86

What the Same Home Pays in Other Cities
‐
500.00
1,000.00
1,500.00
2,000.00
2,500.00
3,000.00
3,500.00Ad Valorem
GO Debt Service
Fire Assessment
EMS Assessment
Stormwater
Solid Waste
+$371
+$687
‐$75+$81
‐$110 ‐$169‐$257
*Nuisance Abatement Assessment was Adopted

Serving with Excellence, Innovation and Integrity.
FY2021 Budget Calendar

Serving with Excellence, Innovation and Integrity.
THANK YOU
58