Commission File No.: 0-50231 Federal National Mortgage … › resources › file › ir › pdf ›...
403
UNITED STATES SECURITIES AND EXCHANGE COMMISSION Washington, D.C. 20549 Form 10-K ANNUAL REPORT PURSUANT TO SECTION 13 OR 15(d) OF THE SECURITIES EXCHANGE ACT OF 1934 For the fiscal year ended December 31, 2010 Commission File No.: 0-50231 Federal National Mortgage Association (Exact name of registrant as specified in its charter) Fannie Mae Federally chartered corporation 52-0883107 (State or other jurisdiction of incorporation or organization) (I.R.S. Employer Identification No.) 3900 Wisconsin Avenue, NW Washington, DC (Address of principal executive offices) 20016 (Zip Code) Registrant’s telephone number, including area code: (202) 752-7000 Securities registered pursuant to Section 12(b) of the Act: Title of Each Class Name of Each Exchange on Which Registered None Securities registered pursuant to Section 12(g) of the Act: Common Stock, without par value (Title of class) 8.25% Non-Cumulative Preferred Stock, Series T, stated value $25 per share (Title of class) 8.75% Non-Cumulative Mandatory Convertible Preferred Stock, Series 2008-1, stated value $50 per share (Title of class) Fixed-to-Floating Rate Non-Cumulative Preferred Stock, Series S, stated value $25 per share (Title of class) 7.625% Non-Cumulative Preferred Stock, Series R, stated value $25 per share (Title of class) 6.75% Non-Cumulative Preferred Stock, Series Q, stated value $25 per share (Title of class) Variable Rate Non-Cumulative Preferred Stock, Series P, stated value $25 per share (Title of class) Variable Rate Non-Cumulative Preferred Stock, Series O, stated value $50 per share (Title of class) 5.375% Non-Cumulative Convertible Series 2004-1 Preferred Stock, stated value $100,000 per share (Title of class) 5.50% Non-Cumulative Preferred Stock, Series N, stated value $50 per share (Title of class) 4.75% Non-Cumulative Preferred Stock, Series M, stated value $50 per share (Title of class) 5.125% Non-Cumulative Preferred Stock, Series L, stated value $50 per share (Title of class) 5.375% Non-Cumulative Preferred Stock, Series I, stated value $50 per share (Title of class) 5.81% Non-Cumulative Preferred Stock, Series H, stated value $50 per share (Title of class) Variable Rate Non-Cumulative Preferred Stock, Series G, stated value $50 per share (Title of class) Variable Rate Non-Cumulative Preferred Stock, Series F, stated value $50 per share (Title of class) 5.10% Non-Cumulative Preferred Stock, Series E, stated value $50 per share (Title of class) 5.25% Non-Cumulative Preferred Stock, Series D, stated value $50 per share (Title of class) Indicate by check mark if the registrant is a well-known seasoned issuer, as defined in Rule 405 of the Securities Act. Yes ¥ No n Indicate by check mark if the registrant is not required to file reports pursuant to Section 13 or 15(d) of the Act. Yes n No ¥ Indicate by check mark whether the registrant (1) has filed all reports required to be filed by Section 13 or 15(d) of the Securities Exchange Act of 1934 during the preceding 12 months (or for such shorter period that the registrant was required to file such reports), and (2) has been subject to such filing requirements for the past 90 days. Yes ¥ No n Indicate by check mark whether the registrant has submitted electronically and posted on its corporate Web site, if any, every Interactive Data File required to be submitted and posted pursuant to Rule 405 of Regulation S-T (§ 232.405 of this chapter) during the preceding 12 months (or for such shorter period that the registrant was required to submit and post such files). Yes ¥ No n Indicate by check mark if disclosure of delinquent filers pursuant to Item 405 of Regulation S-K is not contained herein, and will not be contained, to the best of registrant’s knowledge, in definitive proxy or information statements incorporated by reference in Part III of this Form 10-K or any amendment to this Form 10-K. ¥ Indicate by check mark whether the registrant is a large accelerated filer, an accelerated filer, a non-accelerated filer, or a smaller reporting company. See the definitions of “large accelerated filer,” “accelerated filer” and “smaller reporting company” in Rule 12b-2 of the Exchange Act. (Check one): Large accelerated filer n Accelerated filer ¥ Non-accelerated filer n (Do not check if a smaller reporting company) Smaller Reporting company n Indicate by check mark whether the registrant is a shell company (as defined in Rule 12b-2 of the Act). Yes n No ¥ The aggregate market value of the common stock held by non-affiliates of the registrant computed by reference to the last reported sale price of the common stock quoted on the New York Stock Exchange on June 30, 2010 (the last business day of the registrant’s most recently completed second fiscal quarter) was approximately $383 million. As of January 31, 2011, there were 1,119,639,748 shares of common stock of the registrant outstanding. DOCUMENTS INCORPORATED BY REFERENCE: None
Transcript of Commission File No.: 0-50231 Federal National Mortgage … › resources › file › ir › pdf ›...

UNITED STATES SECURITIES AND EXCHANGE COMMISSIONWashington, D.C. 20549
Form 10-KANNUAL REPORT PURSUANT TO SECTION 13 OR 15(d)
OF THE SECURITIES EXCHANGE ACT OF 1934For the fiscal year ended December 31, 2010
Commission File No.: 0-50231
Federal National Mortgage Association(Exact name of registrant as specified in its charter)
Fannie MaeFederally chartered corporation 52-0883107
(State or other jurisdiction ofincorporation or organization)
(I.R.S. EmployerIdentification No.)
3900 Wisconsin Avenue,NW Washington, DC
(Address of principal executive offices)
20016(Zip Code)
Registrant’s telephone number, including area code:(202) 752-7000
Securities registered pursuant to Section 12(b) of the Act:Title of Each Class Name of Each Exchange on Which Registered
NoneSecurities registered pursuant to Section 12(g) of the Act:
Common Stock, without par value(Title of class)
8.25% Non-Cumulative Preferred Stock, Series T, stated value $25 per share(Title of class)
8.75% Non-Cumulative Mandatory Convertible Preferred Stock, Series 2008-1, stated value $50 per share(Title of class)
Fixed-to-Floating Rate Non-Cumulative Preferred Stock, Series S, stated value $25 per share(Title of class)
7.625% Non-Cumulative Preferred Stock, Series R, stated value $25 per share(Title of class)
6.75% Non-Cumulative Preferred Stock, Series Q, stated value $25 per share(Title of class)
Variable Rate Non-Cumulative Preferred Stock, Series P, stated value $25 per share(Title of class)
Variable Rate Non-Cumulative Preferred Stock, Series O, stated value $50 per share(Title of class)
5.375% Non-Cumulative Convertible Series 2004-1 Preferred Stock, stated value $100,000 per share(Title of class)
5.50% Non-Cumulative Preferred Stock, Series N, stated value $50 per share(Title of class)
4.75% Non-Cumulative Preferred Stock, Series M, stated value $50 per share(Title of class)
5.125% Non-Cumulative Preferred Stock, Series L, stated value $50 per share(Title of class)
5.375% Non-Cumulative Preferred Stock, Series I, stated value $50 per share(Title of class)
5.81% Non-Cumulative Preferred Stock, Series H, stated value $50 per share(Title of class)
Variable Rate Non-Cumulative Preferred Stock, Series G, stated value $50 per share(Title of class)
Variable Rate Non-Cumulative Preferred Stock, Series F, stated value $50 per share(Title of class)
5.10% Non-Cumulative Preferred Stock, Series E, stated value $50 per share(Title of class)
5.25% Non-Cumulative Preferred Stock, Series D, stated value $50 per share(Title of class)
Indicate by check mark if the registrant is a well-known seasoned issuer, as defined in Rule 405 of the Securities Act. Yes ¥ No n
Indicate by check mark if the registrant is not required to file reports pursuant to Section 13 or 15(d) of the Act. Yes n No ¥
Indicate by check mark whether the registrant (1) has filed all reports required to be filed by Section 13 or 15(d) of the Securities Exchange Act of 1934 during the preceding 12 months(or for such shorter period that the registrant was required to file such reports), and (2) has been subject to such filing requirements for the past 90 days. Yes ¥ No n
Indicate by check mark whether the registrant has submitted electronically and posted on its corporate Web site, if any, every Interactive Data File required to be submitted and postedpursuant to Rule 405 of Regulation S-T (§ 232.405 of this chapter) during the preceding 12 months (or for such shorter period that the registrant was required to submit and post suchfiles). Yes ¥ No n
Indicate by check mark if disclosure of delinquent filers pursuant to Item 405 of Regulation S-K is not contained herein, and will not be contained, to the best of registrant’s knowledge, indefinitive proxy or information statements incorporated by reference in Part III of this Form 10-K or any amendment to this Form 10-K. ¥
Indicate by check mark whether the registrant is a large accelerated filer, an accelerated filer, a non-accelerated filer, or a smaller reporting company. See the definitions of “largeaccelerated filer,” “accelerated filer” and “smaller reporting company” in Rule 12b-2 of the Exchange Act. (Check one):
Large accelerated filer n Accelerated filer ¥ Non-accelerated filer n
(Do not check if a smaller reporting company)Smaller Reporting company n
Indicate by check mark whether the registrant is a shell company (as defined in Rule 12b-2 of the Act). Yes n No ¥
The aggregate market value of the common stock held by non-affiliates of the registrant computed by reference to the last reported sale price of the common stock quoted on the NewYork Stock Exchange on June 30, 2010 (the last business day of the registrant’s most recently completed second fiscal quarter) was approximately $383 million.As of January 31, 2011, there were 1,119,639,748 shares of common stock of the registrant outstanding.
DOCUMENTS INCORPORATED BY REFERENCE: None

TABLE OF CONTENTS
PART I . . . . . . . . . . . . . . . . . . . . . . . . . . . . . . . . . . . . . . . . . . . . . . . . . . . . . . . . . . . . . . . . . . . . . . . . . 1
Item 1. Business . . . . . . . . . . . . . . . . . . . . . . . . . . . . . . . . . . . . . . . . . . . . . . . . . . . . . . . . . . . . . . . 1
Overview . . . . . . . . . . . . . . . . . . . . . . . . . . . . . . . . . . . . . . . . . . . . . . . . . . . . . . . . . . . . . . . 1
Residential Mortgage Market . . . . . . . . . . . . . . . . . . . . . . . . . . . . . . . . . . . . . . . . . . . . . . . . 2
Executive Summary . . . . . . . . . . . . . . . . . . . . . . . . . . . . . . . . . . . . . . . . . . . . . . . . . . . . . . . 5
Mortgage Securitizations . . . . . . . . . . . . . . . . . . . . . . . . . . . . . . . . . . . . . . . . . . . . . . . . . . . 21
Business Segments . . . . . . . . . . . . . . . . . . . . . . . . . . . . . . . . . . . . . . . . . . . . . . . . . . . . . . . . 23
Conservatorship and Treasury Agreements . . . . . . . . . . . . . . . . . . . . . . . . . . . . . . . . . . . . . . 32
Legislation and GSE Reform . . . . . . . . . . . . . . . . . . . . . . . . . . . . . . . . . . . . . . . . . . . . . . . . 37
Our Charter and Regulation of Our Activities . . . . . . . . . . . . . . . . . . . . . . . . . . . . . . . . . . . . 39
Making Home Affordable Program . . . . . . . . . . . . . . . . . . . . . . . . . . . . . . . . . . . . . . . . . . . . 47
Our Customers . . . . . . . . . . . . . . . . . . . . . . . . . . . . . . . . . . . . . . . . . . . . . . . . . . . . . . . . . . . 48
Competition . . . . . . . . . . . . . . . . . . . . . . . . . . . . . . . . . . . . . . . . . . . . . . . . . . . . . . . . . . . . . 48
Employees . . . . . . . . . . . . . . . . . . . . . . . . . . . . . . . . . . . . . . . . . . . . . . . . . . . . . . . . . . . . . . 49
Where You Can Find Additional Information . . . . . . . . . . . . . . . . . . . . . . . . . . . . . . . . . . . . 49
Forward-Looking Statements . . . . . . . . . . . . . . . . . . . . . . . . . . . . . . . . . . . . . . . . . . . . . . . . 50
Item 1A. Risk Factors . . . . . . . . . . . . . . . . . . . . . . . . . . . . . . . . . . . . . . . . . . . . . . . . . . . . . . . . . . . . . 53
Item 1B. Unresolved Staff Comments . . . . . . . . . . . . . . . . . . . . . . . . . . . . . . . . . . . . . . . . . . . . . . . . . 68
Item 2. Properties. . . . . . . . . . . . . . . . . . . . . . . . . . . . . . . . . . . . . . . . . . . . . . . . . . . . . . . . . . . . . . . 68
Item 3. Legal Proceedings . . . . . . . . . . . . . . . . . . . . . . . . . . . . . . . . . . . . . . . . . . . . . . . . . . . . . . . . 69
Item 4. [Removed and Reserved] . . . . . . . . . . . . . . . . . . . . . . . . . . . . . . . . . . . . . . . . . . . . . . . . . . . 70
PART II. . . . . . . . . . . . . . . . . . . . . . . . . . . . . . . . . . . . . . . . . . . . . . . . . . . . . . . . . . . . . . . . . . . . . . . . 70
Item 5. Market for Registrant’s Common Equity, Related Stockholder Matters and Issuer Purchasesof Equity Securities . . . . . . . . . . . . . . . . . . . . . . . . . . . . . . . . . . . . . . . . . . . . . . . . . . . . . . . 70
Item 6. Selected Financial Data . . . . . . . . . . . . . . . . . . . . . . . . . . . . . . . . . . . . . . . . . . . . . . . . . . . . 73
Item 7. Management’s Discussion and Analysis of Financial Condition and Results of Operations . . . 76
Critical Accounting Policies and Estimates . . . . . . . . . . . . . . . . . . . . . . . . . . . . . . . . . . . . . . 76
Consolidated Results of Operations . . . . . . . . . . . . . . . . . . . . . . . . . . . . . . . . . . . . . . . . . . . . 82
Business Segment Results. . . . . . . . . . . . . . . . . . . . . . . . . . . . . . . . . . . . . . . . . . . . . . . . . . . 104
Consolidated Balance Sheet Analysis . . . . . . . . . . . . . . . . . . . . . . . . . . . . . . . . . . . . . . . . . . 121
Supplemental Non-GAAP Information — Fair Value Balance Sheets . . . . . . . . . . . . . . . . . . . 126
Liquidity and Capital Management . . . . . . . . . . . . . . . . . . . . . . . . . . . . . . . . . . . . . . . . . . . . 131
Off-Balance Sheet Arrangements . . . . . . . . . . . . . . . . . . . . . . . . . . . . . . . . . . . . . . . . . . . . . 145
Risk Management . . . . . . . . . . . . . . . . . . . . . . . . . . . . . . . . . . . . . . . . . . . . . . . . . . . . . . . . 146
Glossary of Terms Used in This Report. . . . . . . . . . . . . . . . . . . . . . . . . . . . . . . . . . . . . . . . . 190
Item 7A. Quantitative and Qualitative Disclosures about Market Risk. . . . . . . . . . . . . . . . . . . . . . . . . . 192
Item 8. Financial Statements and Supplementary Data . . . . . . . . . . . . . . . . . . . . . . . . . . . . . . . . . . . . 192
Item 9. Changes in and Disagreements with Accountants on Accounting and Financial Disclosure . . . 192
Item 9A. Controls and Procedures . . . . . . . . . . . . . . . . . . . . . . . . . . . . . . . . . . . . . . . . . . . . . . . . . . . . 193
Item 9B. Other Information . . . . . . . . . . . . . . . . . . . . . . . . . . . . . . . . . . . . . . . . . . . . . . . . . . . . . . . . 199
i

PART III . . . . . . . . . . . . . . . . . . . . . . . . . . . . . . . . . . . . . . . . . . . . . . . . . . . . . . . . . . . . . . . . . . . . . . . 199
Item 10. Directors, Executive Officers and Corporate Governance . . . . . . . . . . . . . . . . . . . . . . . . . . . . 199
Directors . . . . . . . . . . . . . . . . . . . . . . . . . . . . . . . . . . . . . . . . . . . . . . . . . . . . . . . . . . . . . . . 199
Corporate Governance . . . . . . . . . . . . . . . . . . . . . . . . . . . . . . . . . . . . . . . . . . . . . . . . . . . . . 202
Executive Officers . . . . . . . . . . . . . . . . . . . . . . . . . . . . . . . . . . . . . . . . . . . . . . . . . . . . . . . . 206
Item 11. Executive Compensation. . . . . . . . . . . . . . . . . . . . . . . . . . . . . . . . . . . . . . . . . . . . . . . . . . . . 208
Compensation Discussion and Analysis . . . . . . . . . . . . . . . . . . . . . . . . . . . . . . . . . . . . . . . . . 208
Compensation Committee Report . . . . . . . . . . . . . . . . . . . . . . . . . . . . . . . . . . . . . . . . . . . . . 219
Compensation Risk Assessment . . . . . . . . . . . . . . . . . . . . . . . . . . . . . . . . . . . . . . . . . . . . . . 219
Compensation Tables . . . . . . . . . . . . . . . . . . . . . . . . . . . . . . . . . . . . . . . . . . . . . . . . . . . . . . 220
Item 12. Security Ownership of Certain Beneficial Owners and Management and Related StockholderMatters . . . . . . . . . . . . . . . . . . . . . . . . . . . . . . . . . . . . . . . . . . . . . . . . . . . . . . . . . . . . . . . . 233
Item 13. Certain Relationships and Related Transactions, and Director Independence . . . . . . . . . . . . . . 235
Policies and Procedures Relating to Transactions with Related Persons . . . . . . . . . . . . . . . . . 235
Transactions with Related Persons . . . . . . . . . . . . . . . . . . . . . . . . . . . . . . . . . . . . . . . . . . . . 237
Director Independence . . . . . . . . . . . . . . . . . . . . . . . . . . . . . . . . . . . . . . . . . . . . . . . . . . . . . 241
Item 14. Principal Accounting Fees and Services . . . . . . . . . . . . . . . . . . . . . . . . . . . . . . . . . . . . . . . . 244
PART IV . . . . . . . . . . . . . . . . . . . . . . . . . . . . . . . . . . . . . . . . . . . . . . . . . . . . . . . . . . . . . . . . . . . . . . . 246
Item 15. Exhibits, Financial Statement Schedules . . . . . . . . . . . . . . . . . . . . . . . . . . . . . . . . . . . . . . . . 246
INDEX TO EXHIBITS . . . . . . . . . . . . . . . . . . . . . . . . . . . . . . . . . . . . . . . . . . . . . . . . . . . . . . . . . . . . . E-1
INDEX TO CONSOLIDATED FINANCIAL STATEMENTS . . . . . . . . . . . . . . . . . . . . . . . . . . . . . . . . . F-1
ii

MD&A TABLE REFERENCE
Table Description Page
— Selected Financial Data . . . . . . . . . . . . . . . . . . . . . . . . . . . . . . . . . . . . . . . . . . . . . . . . . . . . . . . 73
1 Expected Lifetime Profitability of Single-Family Loans Acquired in 1991 through 2010. . . . . . . . 10
2 Single-Family Serious Delinquency Rates by Year of Acquisition . . . . . . . . . . . . . . . . . . . . . . . . 12
3 Credit Profile of Single-Family Conventional Loans Acquired . . . . . . . . . . . . . . . . . . . . . . . . . . . 13
4 Credit Statistics, Single-Family Guaranty Book of Business. . . . . . . . . . . . . . . . . . . . . . . . . . . . . 17
5 Level 3 Recurring Financial Assets at Fair Value . . . . . . . . . . . . . . . . . . . . . . . . . . . . . . . . . . . . 77
6 Summary of Consolidated Results of Operations . . . . . . . . . . . . . . . . . . . . . . . . . . . . . . . . . . . . . 83
7 Analysis of Net Interest Income and Yield . . . . . . . . . . . . . . . . . . . . . . . . . . . . . . . . . . . . . . . . . 85
8 Rate/Volume Analysis of Changes in Net Interest Income . . . . . . . . . . . . . . . . . . . . . . . . . . . . . . 86
9 Fair Value Losses, Net . . . . . . . . . . . . . . . . . . . . . . . . . . . . . . . . . . . . . . . . . . . . . . . . . . . . . . . . 89
10 Credit-Related Expenses. . . . . . . . . . . . . . . . . . . . . . . . . . . . . . . . . . . . . . . . . . . . . . . . . . . . . . . 92
11 Total Loss Reserves . . . . . . . . . . . . . . . . . . . . . . . . . . . . . . . . . . . . . . . . . . . . . . . . . . . . . . . . . . 93
12 Allowance for Loan Losses and Reserve for Guaranty Losses (Combined Loss Reserves) . . . . . . . 94
13 Nonperforming Single-Family and Multifamily Loans . . . . . . . . . . . . . . . . . . . . . . . . . . . . . . . . . 98
14 Credit Loss Performance Metrics . . . . . . . . . . . . . . . . . . . . . . . . . . . . . . . . . . . . . . . . . . . . . . . . 100
15 Credit Loss Concentration Analysis . . . . . . . . . . . . . . . . . . . . . . . . . . . . . . . . . . . . . . . . . . . . . . 101
16 Single-Family Credit Loss Sensitivity . . . . . . . . . . . . . . . . . . . . . . . . . . . . . . . . . . . . . . . . . . . . . 102
17 Impairments and Fair Value Losses on Loans in HAMP . . . . . . . . . . . . . . . . . . . . . . . . . . . . . . . 104
18 Business Segment Summary . . . . . . . . . . . . . . . . . . . . . . . . . . . . . . . . . . . . . . . . . . . . . . . . . . . . 107
19 Business Segment Results . . . . . . . . . . . . . . . . . . . . . . . . . . . . . . . . . . . . . . . . . . . . . . . . . . . . . 108
20 Single-Family Business Results . . . . . . . . . . . . . . . . . . . . . . . . . . . . . . . . . . . . . . . . . . . . . . . . . 109
21 Multifamily Business Results . . . . . . . . . . . . . . . . . . . . . . . . . . . . . . . . . . . . . . . . . . . . . . . . . . . 113
22 Capital Markets Group Results . . . . . . . . . . . . . . . . . . . . . . . . . . . . . . . . . . . . . . . . . . . . . . . . . . 116
23 Capital Markets Group’s Mortgage Portfolio Activity . . . . . . . . . . . . . . . . . . . . . . . . . . . . . . . . . 119
24 Capital Markets Group’s Mortgage Portfolio Composition . . . . . . . . . . . . . . . . . . . . . . . . . . . . . . 120
25 Summary of Consolidated Balance Sheets . . . . . . . . . . . . . . . . . . . . . . . . . . . . . . . . . . . . . . . . . . 122
26 Analysis of Losses on Alt-A and Subprime Private-Label Mortgage-Related Securities . . . . . . . . . 123
27 Credit Statistics of Loans Underlying Alt-A and Subprime Private-Label Mortgage-RelatedSecurities (Including Wraps) . . . . . . . . . . . . . . . . . . . . . . . . . . . . . . . . . . . . . . . . . . . . . . . . . . . 124
28 Changes in Risk Management Derivative Assets (Liabilities) at Fair Value, Net . . . . . . . . . . . . . . 126
29 Comparative Measures—GAAP Change in Stockholders’ Deficit and Non-GAAP Change in FairValue of Net Assets (Net of Tax Effect) . . . . . . . . . . . . . . . . . . . . . . . . . . . . . . . . . . . . . . . . . . . 127
30 Supplemental Non-GAAP Consolidated Fair Value Balance Sheets . . . . . . . . . . . . . . . . . . . . . . . 130
31 Activity in Debt of Fannie Mae . . . . . . . . . . . . . . . . . . . . . . . . . . . . . . . . . . . . . . . . . . . . . . . . . 133
32 Outstanding Short-Term Borrowings and Long-Term Debt . . . . . . . . . . . . . . . . . . . . . . . . . . . . . . 136
33 Outstanding Short-Term Borrowings . . . . . . . . . . . . . . . . . . . . . . . . . . . . . . . . . . . . . . . . . . . . . . 137
34 Maturity Profile of Outstanding Debt of Fannie Mae Maturing Within One Year . . . . . . . . . . . . . 139
iii

Table Description Page
35 Maturity Profile of Outstanding Debt of Fannie Mae Maturing in More Than One Year . . . . . . . . 139
36 Contractual Obligations . . . . . . . . . . . . . . . . . . . . . . . . . . . . . . . . . . . . . . . . . . . . . . . . . . . . . . . 140
37 Cash and Other Investments Portfolio . . . . . . . . . . . . . . . . . . . . . . . . . . . . . . . . . . . . . . . . . . . . . 141
38 Fannie Mae Credit Ratings . . . . . . . . . . . . . . . . . . . . . . . . . . . . . . . . . . . . . . . . . . . . . . . . . . . . . 143
39 Composition of Mortgage Credit Book of Business . . . . . . . . . . . . . . . . . . . . . . . . . . . . . . . . . . . 150
40 Risk Characteristics of Single-Family Conventional Business Volume and Guaranty Book ofBusiness . . . . . . . . . . . . . . . . . . . . . . . . . . . . . . . . . . . . . . . . . . . . . . . . . . . . . . . . . . . . . . . . . . 155
41 Delinquency Status of Single-Family Conventional Loans . . . . . . . . . . . . . . . . . . . . . . . . . . . . . . 160
42 Serious Delinquency Rates . . . . . . . . . . . . . . . . . . . . . . . . . . . . . . . . . . . . . . . . . . . . . . . . . . . . . 161
43 Single-Family Conventional Serious Delinquency Rate Concentration Analysis . . . . . . . . . . . . . . 162
44 Statistics on Single-Family Loan Workouts . . . . . . . . . . . . . . . . . . . . . . . . . . . . . . . . . . . . . . . . . 164
45 Loan Modification Profile . . . . . . . . . . . . . . . . . . . . . . . . . . . . . . . . . . . . . . . . . . . . . . . . . . . . . 165
46 Single-Family Foreclosed Properties . . . . . . . . . . . . . . . . . . . . . . . . . . . . . . . . . . . . . . . . . . . . . . 166
47 Single-Family Acquired Property Concentration Analysis . . . . . . . . . . . . . . . . . . . . . . . . . . . . . . 167
48 Multifamily Serious Delinquency Rates . . . . . . . . . . . . . . . . . . . . . . . . . . . . . . . . . . . . . . . . . . . 169
49 Multifamily Concentration Analysis . . . . . . . . . . . . . . . . . . . . . . . . . . . . . . . . . . . . . . . . . . . . . . 169
50 Multifamily Foreclosed Properties . . . . . . . . . . . . . . . . . . . . . . . . . . . . . . . . . . . . . . . . . . . . . . . 170
51 Mortgage Insurance Coverage. . . . . . . . . . . . . . . . . . . . . . . . . . . . . . . . . . . . . . . . . . . . . . . . . . . 174
52 Activity and Maturity Data for Risk Management Derivatives . . . . . . . . . . . . . . . . . . . . . . . . . . . 185
53 Interest Rate Sensitivity of Net Portfolio to Changes in Interest Rate Level and Slope of YieldCurve . . . . . . . . . . . . . . . . . . . . . . . . . . . . . . . . . . . . . . . . . . . . . . . . . . . . . . . . . . . . . . . . . . . . 187
54 Derivative Impact on Interest Rate Risk (50 Basis Points) . . . . . . . . . . . . . . . . . . . . . . . . . . . . . . 187
55 Interest Rate Sensitivity of Financial Instruments . . . . . . . . . . . . . . . . . . . . . . . . . . . . . . . . . . . . 188
iv

PART I
We have been under conservatorship, with the Federal Housing Finance Agency (“FHFA”) acting asconservator, since September 6, 2008. As conservator, FHFA succeeded to all rights, titles, powers andprivileges of the company, and of any shareholder, officer or director of the company with respect to thecompany and its assets. The conservator has since delegated specified authorities to our Board of Directorsand has delegated to management the authority to conduct our day-to-day operations. We describe therights and powers of the conservator, key provisions of our agreements with the U.S. Department of theTreasury (“Treasury”), and their impact on shareholders in “Conservatorship and Treasury Agreements.”
This report contains forward-looking statements, which are statements about matters that are not historicalfacts. Forward-looking statements often include words like “expects,” “anticipates,” “intends,” “plans,”“believes,” “seeks,” “estimates,” “would,” “should,” “could,” “may,” or similar words. Actual results coulddiffer materially from those projected in the forward-looking statements as a result of a number of factorsincluding those discussed in “Risk Factors” and elsewhere in this report. Please review “Forward-LookingStatements” for more information on the forward-looking statements in this report.
We provide a glossary of terms in “Management’s Discussion and Analysis of Financial Condition and Resultsof Operations (“MD&A”)—Glossary of Terms Used in This Report.”
Item 1. Business
OVERVIEW
Fannie Mae is a government-sponsored enterprise that was chartered by Congress in 1938 to support liquidity,stability and affordability in the secondary mortgage market, where existing mortgage-related assets arepurchased and sold. Our charter does not permit us to originate loans and lend money directly to consumers inthe primary mortgage market. Our most significant activities include providing market liquidity by securitizingmortgage loans originated by lenders in the primary mortgage market into Fannie Mae mortgage-backedsecurities, which we refer to as Fannie Mae MBS, and purchasing mortgage loans and mortgage-relatedsecurities in the secondary market for our mortgage portfolio. We acquire funds to purchase mortgage-relatedassets for our mortgage portfolio by issuing a variety of debt securities in the domestic and internationalcapital markets. We also make other investments that increase the supply of affordable housing. During 2010,we concentrated much of our efforts on minimizing our credit losses by using home retention solutions andforeclosure alternatives to address delinquent mortgages, starting with solutions, such as modifications, thatpermit people to stay in their homes. When there is no lower-cost alternative, our goal is to move toforeclosure expeditiously. We describe our business activities below.
As a federally chartered corporation, we are subject to extensive regulation, supervision and examination byFHFA, and regulation by other federal agencies, including Treasury, the Department of Housing and UrbanDevelopment (“HUD”), and the Securities and Exchange Commission (“SEC”).
Although we are a corporation chartered by the U.S. Congress, our conservator is a U.S. government agency,Treasury owns our senior preferred stock and a warrant to purchase 79.9% of our common stock, and Treasuryhas made a commitment under a senior preferred stock purchase agreement to provide us with funds underspecified conditions to maintain a positive net worth, the U.S. government does not guarantee our securities orother obligations. Our common stock was delisted from the New York Stock Exchange and the Chicago StockExchange on July 8, 2010 and since then has been traded in the over-the-counter market and quoted on theOTC Bulletin Board under the symbol “FNMA.” Our debt securities are actively traded in the over-the-countermarket.
The conservatorship we have been under since September 2008, with FHFA acting as conservator, has nospecified termination date. There can be no assurance as to when or how the conservatorship will beterminated, whether we will continue to exist following conservatorship, or what changes to our businessstructure will be made during or following the conservatorship.
1

Since our entry into conservatorship, we have entered into agreements with Treasury that include covenantsthat significantly restrict our business activities and provide for substantial U.S. government financial support.We provide additional information on the conservatorship, the provisions of our agreements with the Treasury,and its impact on our business below under “Conservatorship and Treasury Agreements” and “Risk Factors.”
RESIDENTIAL MORTGAGE MARKET
The U.S. Residential Mortgage Market
We conduct business in the U.S. residential mortgage market and the global securities market. In response tothe financial crisis and severe economic recession that began in December 2007, the U.S. government took anumber of extraordinary measures designed to provide fiscal stimulus, improve liquidity and protect andsupport the housing and financial markets. Examples of these measures include: (1) the Federal Reserve’stemporary programs to purchase up to $1.25 trillion of GSE mortgage-backed securities and approximately$175 billion of GSE debt by March 31, 2010, which were intended to provide support to mortgage lendingand the housing market and to improve overall conditions in private credit markets; (2) the Administration’sMaking Home Affordable Program, which was intended to stabilize the housing market by providingassistance to homeowners and preventing foreclosures; and (3) the first-time and move-up homebuyer taxcredits, enacted to help increase home sales and stabilize home prices. The homebuyer tax credits wereavailable for qualifying home purchases by buyers who entered into binding contracts by April 30, 2010.
Total U.S. residential mortgage debt outstanding, which includes $10.6 trillion of single-family mortgage debtoutstanding, was estimated to be approximately $11.5 trillion as of September 30, 2010, the latest date forwhich information was available, according to the Federal Reserve. After increasing every quarter since recordkeeping began in 1952 until the second quarter of 2008, single-family mortgage debt outstanding has beensteadily declining since then. We owned or guaranteed mortgage assets representing approximately 27.4% oftotal U.S. residential mortgage debt outstanding as of September 30, 2010.
We operate our business solely in the United States and its territories, and accordingly, we generate no revenuefrom and have no assets in geographic locations other than the United States and its territories.
Housing and Mortgage Market and Economic Conditions
During the fourth quarter of 2010, the United States economic recovery continued. The U.S. gross domesticproduct, or GDP, rose by 3.2% on an annualized basis during the quarter after adjusting for inflation,according to the Bureau of Economic Analysis advance estimate. The overall economy gained an estimated128,000 jobs in the fourth quarter, with the private sector continuing its recent trend of moderate employmentgrowth throughout the quarter and into January 2011. The unemployment rate was 9.0% in January 2011,compared with 9.6% in September 2010, based on data from the U.S. Bureau of Labor Statistics.
Housing activity rebounded modestly in the fourth quarter of 2010 after experiencing a pullback in the thirdquarter. For all of 2010, home sales declined for the fourth time in the past five years, despite low mortgagerates, reduced home prices and the first-time and move-up homebuyer tax credits that increased existing homesales earlier in the year. Weak demand for homes, a weak labor market, strengthened lending standards in theindustry and elevated vacancy and foreclosure rates are the main obstacles to the housing recovery. Totalexisting home sales fell by 4.8% in 2010 from 2009, according to data available through January 2011. Facedwith fierce competition from distressed sales, new home sales fared significantly worse, dropping by 14.2% in2010, according to data available through January 2011, and accounting for just 5.5% of total home sales inthe fourth quarter of 2010, down from a peak of more than 19% at the beginning of 2005. After fourconsecutive years of double-digit declines to an annual record low, total housing starts rose a modest 5.9% in2010.
2

The table below presents several key indicators related to the total U.S. residential mortgage market.
Housing and Mortgage Market Indicators(1)
2010 2009 2008 2010 2009% Change
Home sales (units in thousands). . . . . . . . . . . . . . . . . . . . . . . . . . . . . 5,229 5,530 5,398 (5.4)% 2.4%
New home sales . . . . . . . . . . . . . . . . . . . . . . . . . . . . . . . . . . . . . . 321 374 485 (14.2) (22.9)
Existing home sales . . . . . . . . . . . . . . . . . . . . . . . . . . . . . . . . . . . 4,908 5,156 4,913 (4.8) 4.9
Home price depreciation based on Fannie Mae Home Price Index(“HPI”)(2) . . . . . . . . . . . . . . . . . . . . . . . . . . . . . . . . . . . . . . . . . . (3.1)% (3.7)% (10.3)% — —
Annual average fixed-rate mortgage interest rate(3). . . . . . . . . . . . . . . . 4.7% 5.0% 6.0% — —
Single-family mortgage originations (in billions) . . . . . . . . . . . . . . . . . $ 1,530 $ 1,917 $ 1,580 (20.2) 21.3
Type of single-family mortgage origination:
Refinance share . . . . . . . . . . . . . . . . . . . . . . . . . . . . . . . . . . . . . . 65% 69% 52% — —
Adjustable-rate mortgage share . . . . . . . . . . . . . . . . . . . . . . . . . . . 5% 4% 7% — —
Total U.S. residential mortgage debt outstanding (in billions)(4) . . . . . . . $11,459 $11,712 $11,915 (2.2) (1.7)
(1) The sources of the housing and mortgage market data in this table are the Federal Reserve Board, the Bureau of theCensus, HUD, the National Association of Realtors, the Mortgage Bankers Association and FHFA. Homes sales dataare based on information available through January 2011. Single-family mortgage originations, as well as refinanceshares, are based on February 2011 estimates from Fannie Mae’s Economics & Mortgage Market Analysis Group.The adjustable-rate mortgage share is based on mortgage applications data reported by the Mortgage BankersAssociation. Certain previously reported data may have been changed to reflect revised historical data from any or allof these organizations.
(2) Calculated internally using property data information on loans purchased by Fannie Mae, Freddie Mac and otherthird-party home sales data. Fannie Mae’s HPI is a weighted repeat transactions index, meaning that it measuresaverage price changes in repeat sales on the same properties. Fannie Mae’s HPI excludes prices on properties sold inforeclosure. The reported home price depreciation reflects the percentage change in Fannie Mae’s HPI from thefourth quarter of the prior year to the fourth quarter of the reported year.
(3) Based on the annual average 30-year fixed-rate mortgage interest rate reported by Freddie Mac.(4) Information for 2010 is through September 30, 2010 and has been obtained from the Federal Reserve’s September
2010 mortgage debt outstanding release.
Home prices, which rose in the second quarter of 2010 when the home buyer tax credits were available, havefallen since the tax credits’ expiration. We estimate that home prices on a national basis declined byapproximately 3.1% in both the second half of 2010 and in 2010 overall. We estimate that home prices havedeclined by 20.5% from their peak in the third quarter of 2006. Our home price estimates are based onpreliminary data and are subject to change as additional data become available.
As a result of the increase in existing home sales in the fourth quarter of 2010 and the pause in foreclosurestriggered by the discovery of deficiencies in servicers’ foreclosure processes, the supply of unsold single-family homes dropped during the quarter. According to the National Association of Realtors’ December 2010Existing Home Sales Report, there was an 8.1 month average supply of existing unsold homes as ofDecember 31, 2010, compared with a 10.6 month average supply as of September 30, 2010 and a 7.2 monthaverage supply as of December 31, 2009. Although the supply of unsold homes dropped in the fourth quarter,the inventory of unsold homes remains above long-term average levels. The national average inventory/salesratio masks significant regional variation as some regions, such as Florida, struggle with large inventoryoverhang while others, such as California, are experiencing nearly depleted inventories in some marketsegments.
An additional factor weighing on the market is the elevated level of vacant properties, as reported by theCensus Bureau. While the inventory of vacant homes for sale and for rent appears to be stabilizing, accordingto the Bureau of the Census Housing Vacancy Survey, vacancy rates remain significantly above their normallevels and will continue to weigh down the market. The serious delinquency rate has trended down since
3

peaking in the fourth quarter of 2009 but has remained historically high, with an estimated four million loansseriously delinquent (90 days or more past due or in the foreclosure process), based on the Mortgage BankersAssociation National Delinquency Survey. The shadow supply from these mortgages will also negatively affectthe market. According to the minutes of the December Federal Reserve Open Market Committee, membersexpressed concern that the elevated supply of homes available for sale and the overhang of foreclosed homeswill contribute to further drops in home prices, reducing household wealth and thus restraining growth inconsumer spending. We provide information about Fannie Mae’s serious delinquency rate, which alsodecreased during 2010, in “Executive Summary—Credit Performance.”
We estimate that total single-family mortgage originations decreased by 20.2% in 2010 to $1.5 trillion, with apurchase share of 35% and a refinance share of 65%. For 2011, we expect an increase in mortgage rates willlikely reduce the share of refinance loans to approximately 35% and total single-family originations areexpected to decline to about $1.0 trillion.
Since the second quarter of 2008, single-family mortgage debt outstanding has been steadily declining due toseveral factors including rising foreclosures, declining house prices, increased cash sales, reduced householdformation, and reduced home equity extraction. We anticipate another approximately 2% decline in single-family mortgage debt outstanding in 2011. Total U.S. residential mortgage debt outstanding fell on anannualized basis by approximately 2.4% in both the second and third quarters of 2010.
Despite signs of stabilization and improvement, one out of seven borrowers was delinquent or in foreclosureduring the fourth quarter of 2010, according to the Mortgage Bankers Association National DelinquencySurvey. The housing market remains under pressure due to the high level of unemployment, which was aprimary driver of the significant number of mortgage delinquencies and defaults in 2010. At the start of therecession in December 2007, the unemployment rate was 5.0%, based on data from the U.S. Bureau of LaborStatistics. The unemployment rate peaked at a 26-year high of 10.1% in October 2009, and remained as highas 9.0% in January 2011. We expect the unemployment rate to decline modestly throughout 2011.
The most comprehensive measure of the unemployment rate, which includes those working part-time whowould rather work full-time (part-time workers for economic reasons) and those not looking for work but whowant to work and are available for work (discouraged workers), was 16.7% in December 2010, close to therecord high of 17.4% in October 2009.
The decline in house prices both nationally and regionally has left many homeowners with “negative equity”in their homes, which means the principal balances on their mortgages exceed the current market value oftheir homes. This provides an incentive for borrowers to walk away from their mortgage obligations and forthe loans to become delinquent and proceed to foreclosure. According to First American CoreLogic, Inc.approximately 11 million, or 23%, of all residential properties with mortgages were in negative equity in thethird quarter of 2010. This potential supply also weighs on the supply/demand balance putting downwardpressure on both house prices and rents. See “Risk Factors” for a description of risks to our businessassociated with the weak economy and housing market.
The multifamily sector improved during 2010 despite slow job growth. Multifamily fundamentalsstrengthened, driven primarily by increases in non-farm payrolls and tenants renting rather than purchasinghomes due to uncertainty surrounding home values. Vacancy rates, which had climbed to record levels in2009, have improved, and asking rents increased on a national basis. Preliminary third-party data suggest thatthe rate of apartment vacancies held steady in the fourth quarter of 2010. Rents appear to have risen duringmost of 2010, with overall rent growth up by an estimated 3%.
Vacancy rates and rents are important to loan performance because multifamily loans are generally repaidfrom the cash flows generated by the underlying property. Improvements in these fundamentals helped tostabilize property values during 2010 in a number of metropolitan areas.
Prolonged periods of high vacancies and negative or flat rent growth will adversely affect multifamilyproperties’ net operating incomes and related cash flows, which can strain the ability of borrowers to makeloan payments and thereby potentially increase delinquency rates and credit expenses.
4

While national multifamily market fundamentals improved during 2010, certain local markets and propertiescontinue to exhibit weak fundamentals. As a result, we expect that our multifamily nonperforming assets willincrease in certain areas and we may continue to experience an increase in delinquencies and credit lossesdespite generally improving market fundamentals. We expect the multifamily sector to continue to improvemodestly in 2011, even though unemployment levels remain elevated.
EXECUTIVE SUMMARY
Please read this Executive Summary together with our Management’s Discussion and Analysis of FinancialCondition and Results of Operations (“MD&A”) and our consolidated financial statements as ofDecember 31, 2010 and related notes. This discussion contains forward-looking statements that are basedupon management’s current expectations and are subject to significant uncertainties and changes incircumstances. Please review “Forward-Looking Statements” for more information on the forward-lookingstatements in this report and “Risk Factors” for a discussion of factors that could cause our actual results todiffer, perhaps materially, from our forward-looking statements. Please also see “MD&A—Glossary of TermsUsed in This Report.”
Our Mission
Our public mission is to support liquidity and stability in the secondary mortgage market and increase thesupply of affordable housing. In connection with our public mission, FHFA, as our conservator, and theObama Administration have given us an important role in addressing housing and mortgage market conditions.As we discuss below and elsewhere in “Business,” we are concentrating our efforts on supporting liquidity,stability and affordability in the secondary mortgage market and minimizing our credit losses from delinquentloans.
Our Business Objectives and Strategy
Our Board of Directors and management consult with our conservator in establishing our strategic direction,taking into consideration our role in addressing housing and mortgage market conditions. FHFA has approvedour business objectives. We face a variety of different, and potentially conflicting, objectives including:
• minimizing our credit losses from delinquent mortgages;
• providing liquidity, stability and affordability in the mortgage market;
• providing assistance to the mortgage market and to the struggling housing market;
• limiting the amount of the investment Treasury must make under our senior preferred stock purchaseagreement;
• returning to long-term profitability; and
• protecting the interests of the taxpayers.
We therefore regularly consult with and receive direction from our conservator on how to balance theseobjectives. Our pursuit of our mission creates conflicts in strategic and day-to-day decision-making that couldhamper achievement of some or all of these objectives.
We currently are concentrating our efforts on minimizing our credit losses. We use home retention solutionsand foreclosure alternatives to address delinquent mortgages, starting with solutions, such as modifications,that permit people to stay in their homes. When there is no lower-cost alternative, our goal is to move toforeclosure expeditiously. We also seek to minimize credit losses by actively managing our real estate owned(“REO”) inventory and by pursuing contractual remedies where third parties such as lenders or providers ofcredit enhancement are obligated to compensate us for losses.
Along with our efforts to minimize credit losses, we continue our significant role of providing support forliquidity and affordability in the mortgage market through our guaranty and capital markets businesses. In
5

2010, we continued our work to strengthen our book of business, acquiring loans with a strong overall creditprofile. We discuss the performance of single-family loans we acquired in 2009 and 2010 later in thisexecutive summary.
We will continue to need funds from Treasury as a result of ongoing adverse conditions in the housing andmortgage markets, the deteriorated credit performance of loans in our mortgage credit book of business thatwe acquired prior to 2009, the costs associated with our efforts pursuant to our mission, and the dividends weare required to pay Treasury on the senior preferred stock. As a result of these factors, we do not expect toearn profits in excess of our annual dividend obligation to Treasury for the indefinite future. Further, there issignificant uncertainty regarding the future of our company, as the Administration, Congress and our regulatorsconsider options for the future state of Fannie Mae, Freddie Mac and the U.S. government’s role in residentialmortgage finance.
On February 11, 2011, Treasury and HUD released a report to Congress on reforming America’s housingfinance market. The report provides that the Administration will work with FHFA to determine the best way toresponsibly reduce Fannie Mae’s and Freddie Mac’s role in the market and ultimately wind down bothinstitutions. The report emphasizes the importance of proceeding with a careful transition plan and providingthe necessary financial support to Fannie Mae and Freddie Mac during the transition period. We discuss thereport’s recommendations for a new long-term structure for the housing finance system in more detail in“Legislation and GSE Reform—GSE Reform.”
In the final quarter of 2010 we initiated a comprehensive review of our business processes, infrastructure andorganizational structure to assess the company’s readiness to operate effectively in the secondary mortgagemarket of the future. We expect to implement the plan in phases with goals of providing value to ourcustomers, simplifying and standardizing our operating model, and reducing our costs.
To provide context for analyzing our consolidated financial statements and understanding our MD&A, wediscuss the following topics in this executive summary:
• Our 2010 financial performance;
• Actions we take to provide liquidity to the mortgage market;
• Our expectations regarding profitability, the book of business we have acquired since the beginning of2009 and credit losses;
• Our strategies and actions to reduce credit losses;
• Our 2009 and 2010 credit performance;
• The servicer foreclosure process deficiencies discovered in 2010 and the related foreclosure pause;
• Our liquidity position; and
• Our outlook.
Summary of Our Financial Performance for 2010
Our financial results for 2010 reflect the continued weakness in the housing and mortgage markets, whichremain under pressure from high levels of unemployment and underemployment, and the impact of theadoption of new accounting standards and the consolidation of the majority of our MBS trusts.
Effective January 1, 2010, we prospectively adopted new accounting standards on the transfers of financialassets and the consolidation of variable interest entities. We refer to these accounting standards together as the“new accounting standards.” In this report, we also refer to January 1, 2010 as the “transition date.”
Our adoption of the new accounting standards had a major impact on the presentation of our consolidatedfinancial statements. The new standards require that we consolidate the substantial majority of Fannie MaeMBS trusts we guarantee and recognize the underlying assets (typically mortgage loans) and debt (typically
6

bonds issued by the trusts in the form of Fannie Mae MBS certificates) of these trusts as assets and liabilitiesin our consolidated balance sheets.
Although the new accounting standards did not change the economic risk to our business, we recorded adecrease of $3.3 billion in our total deficit as of January 1, 2010 to reflect the cumulative effect of adoptingthese new standards. We provide a detailed discussion of the impact of the new accounting standards on ouraccounting and financial statements in “Note 2, Adoption of the New Accounting Standards on the Transfersof Financial Assets and Consolidation of Variable Interest Entities.” Upon adopting the new accountingstandards, we changed the presentation of segment financial information that is currently evaluated bymanagement, as we discuss in “Business Segment Results — Changes to Segment Reporting.”
We recognized a net loss of $14.0 billion for 2010, a net loss attributable to common stockholders of$21.7 billion, which includes $7.7 billion in dividends on senior preferred stock paid to Treasury, and a dilutedloss per share of $3.81. In comparison, we recognized a net loss of $72.0 billion, a net loss attributable tocommon stockholders of $74.4 billion, including $2.5 billion in dividends on senior preferred stock, and adiluted loss per share of $13.11 in 2009.
The $58.0 billion decrease in our net loss for 2010 compared with 2009 was due primarily to:
• a $46.9 billion decrease in credit-related expenses, which consist of the provision for loan losses, theprovision for guaranty losses (collectively referred to as the “provision for credit losses”) plus foreclosedproperty expense, due to the factors described below;
• a $9.1 billion decrease in net other-than-temporary impairments due to slower deterioration of theestimated credit component of the fair value losses of Alt-A and subprime securities. In addition, net-other-than temporary impairment decreased in 2010 compared with 2009 because, effective beginning inthe second quarter of 2009, we recognize only the credit portion of other-than-temporary impairment inour consolidated statements of operations due to the adoption of a new other-than-temporary impairmentaccounting standard;
• a $6.7 billion decrease in losses from partnership investments resulting primarily from the recognition, inthe fourth quarter of 2009, of $5.0 billion in other-than-temporary impairment losses on our federal low-income housing tax credit (“LIHTC”) investments; and
• a $2.3 billion decrease in net fair value losses primarily due to lower fair value losses on riskmanagement derivatives.
Our credit-related expenses were $26.6 billion for 2010 compared with $73.5 billion for 2009. Our provisionfor credit losses was substantially lower in 2010, primarily because there was neither a significant increase inthe number of seriously delinquent loans, nor a sharp decline in home prices. Therefore, we did not need tosubstantially increase our total loss reserves in 2010. Another contributing factor was the insignificant amountof fair value losses on acquired credit-impaired loans recognized in 2010, because only purchases of credit-deteriorated loans from unconsolidated MBS trusts or as a result of other credit guarantees generate fair valuelosses upon acquisition, due to our adoption of the new accounting standards. Additionally, on December 31,2010, we entered into an agreement with Bank of America, N.A., and its affiliates, to address outstandingrepurchase requests for residential mortgage loans. Bank of America agreed, among other things, to a cashpayment of $1.3 billion, $930 million of which was recognized as a recovery of charge-offs, resulting in areduction to our provision for loan losses and allowance for loan losses, and $266 million as a reduction toforeclosed property expense. For additional information on the terms of this agreement, see “RiskManagement — Credit Risk Management — Institutional Counterparty Credit Risk Management.”
We had a net worth deficit of $2.5 billion as of December 31, 2010 and $2.4 billion as of September 30, 2010,compared with $15.3 billion as of December 31, 2009. Our net worth as of December 31, 2010 was negativelyimpacted by the recognition of our net loss of $14.0 billion and the senior preferred stock dividends of$7.7 billion. These reductions in our net worth were offset by our receipt of $27.7 billion in funds fromTreasury under our senior preferred stock purchase agreement with Treasury, a $3.3 billion cumulative effectfrom the adoption of new accounting standards as of January 1, 2010, and a $3.1 billion reduction in
7

unrealized losses in our holdings of available-for-sale securities. Our net worth, which is the basis fordetermining the amount that Treasury has committed to provide us under the senior preferred stock purchaseagreement, equals the “Total deficit” reported in our consolidated balance sheets. In February 2011, the ActingDirector of FHFA submitted a request to Treasury on our behalf for $2.6 billion to eliminate our net worthdeficit as of December 31, 2010. When Treasury provides the requested funds, the aggregate liquidationpreference on the senior preferred stock will be $91.2 billion, which will require an annualized dividendpayment of $9.1 billion. This amount exceeds our reported annual net income for each of the last nine years,in most cases by a significant margin. Through December 31, 2010, we have paid an aggregate of$10.2 billion to Treasury in dividends on the senior preferred stock.
Our total loss reserves, which reflect our estimate of the probable losses we have incurred in our guarantybook of business, increased to $66.3 billion as of December 31, 2010 from $64.7 billion as of September 30,2010, $61.4 billion as of January 1, 2010 and $64.9 billion as of December 31, 2009. Our total loss reservecoverage to total nonperforming loans was 30.85% as of December 31, 2010, compared with 30.34% as ofSeptember 30, 2010 and 29.98% as of December 31, 2009.
We recognized net income of $73 million for the fourth quarter of 2010, driven primarily by net interestincome of $4.6 billion and fair value gains of $366 million, which were partially offset by credit-relatedexpenses of $4.3 billion and administrative expenses of $592 million. Our fourth quarter results werefavorably impacted by the cash payment received from Bank of America, because it reduced our credit-relatedexpenses for the period. The net loss attributable to common stockholders, which includes $2.2 billion individends on senior preferred stock, was $2.1 billion and our diluted loss per share was $0.37. In comparison,we recognized a net loss of $1.3 billion, a net loss attributable to common stockholders of $3.5 billion and adiluted loss per share of $0.61 for the third quarter of 2010. We recognized a net loss of $15.2 billion, a netloss attributable to common stockholders of $16.3 billion and a diluted loss per share of $2.87 for the fourthquarter of 2009.
Providing Mortgage Market Liquidity
We support liquidity and stability in the secondary mortgage market, serving as a stable source of funds forpurchases of homes and multifamily rental housing and for refinancing existing mortgages. We provide thisfinancing through the activities of our three complementary businesses: our Single-Family business (“Single-Family”), our Multifamily Mortgage Business (“Multifamily,” formerly “Housing and CommunityDevelopment,” or “HCD”) and our Capital Markets group. Our Single-Family and Multifamily businesseswork with our lender customers to purchase and securitize mortgage loans customers deliver to us into FannieMae MBS. Our Capital Markets group manages our investment activity in mortgage-related assets, fundinginvestments primarily through proceeds we receive from the issuance of debt securities in the domestic andinternational capital markets. The Capital Markets group works with lender customers to provide funds to themortgage market through short-term financing and other activities, making short-term use of our balance sheet.These financing activities include whole loan conduit transactions, early funding transactions, Real EstateMortgage Investment Conduit (“REMIC”) and other structured securitization activities, and dollar rolls, whichwe describe in more detail in “Business Segments — Capital Markets Group.”
In 2010, we purchased or guaranteed approximately $856 billion in loans, measured by unpaid principalbalance, which includes approximately $217 billion in delinquent loans we purchased from our single-familyMBS trusts. Our purchases and guarantees financed approximately 2,712,000 single-family conventional loans,excluding delinquent loans purchased from our MBS trusts, and approximately 306,000 units in multifamilyproperties.
Our mortgage credit book of business — which consists of the mortgage loans and mortgage-related securitieswe hold in our investment portfolio, Fannie Mae MBS held by third parties and other credit enhancements thatwe provide on mortgage assets — totaled $3.1 trillion as of September 30, 2010, which representedapproximately 27.4% of U.S. residential mortgage debt outstanding on September 30, 2010, the latest date forwhich the Federal Reserve has estimated U.S. residential mortgage debt outstanding. We remained the largestsingle issuer of mortgage-related securities in the secondary market, with an estimated market share of new
8

single-family mortgage-related securities of 49.0% during the fourth quarter of 2010 and 44.0% for the fullyear. In comparison, our estimated market share of new single-family mortgage-related securities issuanceswas 44.5% in the third quarter of 2010 and 38.9% in the fourth quarter of 2009. If the Federal HousingAdministration (“FHA”) continues to be the lower-cost option for some consumers, and in some cases the onlyoption, for loans with higher loan-to-value (“LTV”) ratios, our market share could be adversely impacted if themarket shifts away from refinance activity, which is likely to occur when interest rates rise. In the multifamilymarket, we remain a constant source of liquidity, guaranteeing an estimated 20.1% of multifamily mortgagedebt outstanding as of September 30, 2010, the latest date for which the Federal Reserve has estimatedmortgage debt outstanding for multifamily residences.
Our Expectations Regarding Profitability, the Single-Family Loans We Acquired Beginning in 2009, andCredit Losses
In this section we discuss our expectations regarding the profitability, performance and credit profile of thesingle-family loans we have purchased or guaranteed since the beginning of 2009, shortly after entering intoconservatorship in late 2008, and our expected single-family credit losses. We refer to loans we havepurchased or guaranteed as loans that we have “acquired.”
• Since the beginning of 2009, we have acquired single-family loans that have a strong overall credit profileand are performing well. We expect these loans will be profitable, by which we mean they will generatemore fee income than credit losses and administrative costs, as we discuss in “Expected Profitability ofOur Single-Family Acquisitions” below. For further information, see “Table 2: Single-Family SeriousDelinquency Rates by Year of Acquisition” and “Table 3: Credit Profile of Single-Family ConventionalLoans Acquired.”
• The vast majority of our realized credit losses in 2009 and 2010 on single-family loans are attributable tosingle-family loans that we purchased or guaranteed from 2005 through 2008. While these loans will giverise to additional credit losses that we have not yet realized, we estimate that we have reserved for thesubstantial majority of the remaining losses.
Factors that Could Cause Actual Results to be Materially Different from Our Estimates and Expectations
In this discussion, we present a number of estimates and expectations regarding the profitability of single-family loans we have acquired, our single-family credit losses, and our draws from and dividends to be paid toTreasury. These estimates and expectations are forward-looking statements based on our current assumptionsregarding numerous factors, including future home prices and the future performance of our loans. Our futureestimates of these amounts, as well as the actual amounts, may differ materially from our current estimatesand expectations as a result of home price changes, changes in interest rates, unemployment, direct andindirect consequences resulting from failures by servicers to follow proper procedures in the administration offoreclosure cases, government policy, changes in generally accepted accounting principles (“GAAP”), creditavailability, social behaviors, other macro-economic variables, the volume of loans we modify, theeffectiveness of our loss mitigation strategies, management of our REO inventory and pursuit of contractualremedies, changes in the fair value of our assets and liabilities, impairments of our assets, or many otherfactors, including those discussed in “Risk Factors” and “MD&A — Forward-Looking Statements.” Forexample, if the economy were to enter a deep recession during this time period, we would expect actualoutcomes to differ substantially from our current expectations.
Expected Profitability of Our Single-Family Acquisitions
While it is too early to know how loans we have acquired since January 1, 2009 will ultimately perform,given their strong credit risk profile, low levels of payment delinquencies shortly after their acquisition, andlow serious delinquency rate, we expect that, over their lifecycle, these loans will be profitable. Table 1provides information about whether we expect loans we acquired in 1991 through 2010 to be profitable, andthe percentage of our single-family guaranty book of business represented by these loans as of December 31,2010. The expectations reflected in Table 1 are based on the credit risk profile of the loans we have acquired,
9

which we discuss in more detail in “Table 3: Credit Profile of Single-Family Conventional Loans Acquired”and in “Table 40: Risk Characteristics of Single-Family Conventional Business Volume and Guaranty Book ofBusiness.” These expectations are also based on numerous other assumptions, including our expectationsregarding home price declines set forth below in “Outlook.” As shown in Table 1, we expect loans we haveacquired in 2009 and 2010 to be profitable. If future macroeconomic conditions turn out to be significantlymore adverse than our expectations, these loans could become unprofitable. For example, we believe that theseloans would become unprofitable if home prices declined more than 20% from their December 2010 levelsover the next five years based on our home price index, which would be an approximately 36% decline fromtheir peak in the third quarter of 2006.
Table 1: Expected Lifetime Profitability of Single-Family Loans Acquired in 1991 through 2010
Acquisition YearExpectation for
Percentage of
Single-Family Guaranty
Book of Business
as of December 31, 2010Profitability
1991 to 2000 Profitable
2001 Profitable
2002 Profitable
2003 Profitable
2004 Break-even
2005 Not Profitable
2006 Not Profitable
2007 Not Profitable
2008 Not Profitable
2009 Profitable
2010 Profitable
21%
39%
40%
As Table 1 shows, the key years in which we acquired loans that we expect will be unprofitable are 2005through 2008, and the vast majority of our realized credit losses in 2009 and 2010 to date are attributable tothese loans. Loans we acquired in 2004 were originated under more conservative acquisition policies thanloans we acquired from 2005 through 2008; however, we expect them to perform close to break-even becausethese loans were made as home prices were rapidly increasing and therefore suffered from the subsequentdecline in home prices.
Loans we have acquired since the beginning of 2009 comprised over 40% of our single-family guaranty bookof business as of December 31, 2010. Our 2005 to 2008 acquisitions are becoming a smaller percentage of ourguaranty book of business, having decreased from 50% of our guaranty book of business as of December 31,2009 to 39% as of December 31, 2010.
10

Performance of Our Single-Family Acquisitions
In our experience, an early predictor of the ultimate performance of loans is the rate at which the loansbecome seriously delinquent within a short period of time after acquisition. Loans we acquired in 2009 haveexperienced historically low levels of delinquencies shortly after their acquisition. Table 2 shows, for single-family loans we acquired in each year from 2001 to 2009, the percentage that were seriously delinquent (threeor more months past due or in the foreclosure process) as of the end of the fourth quarter following theacquisition year. Loans we acquired in 2010 are not included in this table because a substantial portion ofthem were originated so recently that they could not yet have become seriously delinquent. As Table 2 shows,the percentage of our 2009 acquisitions that were seriously delinquent as of the end of the fourth quarterfollowing their acquisition year was more than nine times lower than the average comparable seriousdelinquency rate for loans acquired in 2005 through 2008. Table 2 also shows serious delinquency rates foreach year’s acquisitions as of December 31, 2010. Except for the most recent acquisition years, whose seriousdelinquency rates are likely lower than they will be after the loans have aged, Table 2 shows that the seriousdelinquency rate as of December 31, 2010 generally tracks the trend of the serious delinquency rate as of theend of the fourth quarter following the year of acquisition. Below the table we provide information about theeconomic environment in which the loans were acquired, specifically home price appreciation andunemployment levels.
11

Table 2: Single-Family Serious Delinquency Rates by Year of Acquisition
Home Price Appreciation
(1)6.3 % 7.5% 7.6% 10.7% 11.5% 2.7%
% % % % % %
(4.1)% (10.3)% (3.7)% (3.1) %
% % % %Unemployment rate 4.7 5.8 6.0 5.5 5.1 4.6 4.6 5.8 9.3 9.6
20092001 2002 2003 2004 2005 2006 2007 2008 2010
SD
Q R
ate
(2)
0.0%
0.8%
1.6%
2.4%
3.2%
4.0%
4.8%
5.6%
6.4%
7.2%
8.0%
8.8%
9.6%
10.4%
11.2%
12.0%
12.8%
13.6%
2001 2002 2003 2004 2005 2006 2007 2008 2009 *
SDQ Rate as of December 31, 2010
SDQ Rate as of end of 4th quarter following
acquisition year
* For 2009, the serious delinquency rate as of December 31, 2010 is the same as the serious delinquency rate as of theend of the fourth quarter following the acquisition year.
(1) Based on Fannie Mae’s HPI, which measures average price changes based on repeat sales on the same properties. For2010, the data show an initial estimate based on purchase transactions in Fannie-Freddie acquisition and public deeddata available through the end of January 2011. Previously reported data has been revised to reflect additionalavailable historical data. Including subsequently available data may lead to materially different results.
(2) Based on the average national unemployment rates for each month reported in the labor force statistics currentpopulation survey (CPS), Bureau of Labor Statistics.
Credit Profile of Our Single-Family Acquisitions
Single-family loans we purchased or guaranteed from 2005 through 2008 were acquired during a period whenhome prices were rising rapidly, peaked, and then started to decline sharply, and underwriting and eligibilitystandards were more relaxed than they are now. These loans were characterized, on average and as discussedbelow, by higher LTV ratios and lower FICO credit scores than loans we have acquired since January 1, 2009.In addition, many of these loans were Alt-A loans or had other higher-risk loan attributes such as interest-onlypayment features. As a result of the sharp declines in home prices, 29% of the loans that we acquired from
12

2005 through 2008 had mark-to-market LTV ratios that were greater than 100% as of December 31, 2010,which means the principal balance of the borrower’s primary mortgage exceeded the current market value ofthe borrower’s home. This percentage is higher when second lien loans secured by the same properties thatsecure our loans are included. The sharp decline in home prices, the severe economic recession that began inDecember 2007 and continued through June 2009, and continuing high unemployment and underemploymenthave significantly and adversely impacted the performance of loans we acquired from 2005 through 2008. Weare taking a number of actions to reduce our credit losses. We discuss these actions and our strategy below in“Our Strategies and Actions to Reduce Credit Losses on Loans in our Single-Family Guaranty Book ofBusiness” and in “MD&A — Risk Management — Credit Risk Management — Single-Family MortgageCredit Risk Management.”
In 2009, we began to see the effect of actions we took, beginning in 2008, to significantly strengthen ourunderwriting and eligibility standards and change our pricing to promote sustainable homeownership andstability in the housing market. As a result of these changes and other market conditions, we reduced ouracquisitions of loans with higher-risk loan attributes. The loans we have purchased or guaranteed sinceJanuary 1, 2009 have had a better credit risk profile overall than loans we acquired in 2005 through 2008, andtheir early performance has been strong. Our experience has been that loans with stronger credit risk profilesperform better than loans without stronger credit risk profiles. For example, one measure of a loan’s credit riskprofile that we believe is a strong predictor of performance is LTV ratio, which indicates the amount of equitya borrower has in the underlying property. As Table 3 demonstrates, the loans we have acquired sinceJanuary 1, 2009 have a strong credit risk profile, with lower original LTV ratios, higher FICO credit scores,and a product mix with a greater percentage of fully amortizing fixed-rate mortgage loans than loans weacquired from 2005 through 2008.
Table 3: Credit Profile of Single-Family Conventional Loans Acquired(1)
Acquisitions from 2009through 2010
Acquisitions from 2005through 2008
Weighted average loan-to-value ratio at origination . . . . . . . . . . . . . . . . 68% 73%
Weighted average FICO credit score at origination . . . . . . . . . . . . . . . . . 762 722
Fully amortizing, fixed-rate loans. . . . . . . . . . . . . . . . . . . . . . . . . . . . . 95% 86%
Alt-A loans(2) . . . . . . . . . . . . . . . . . . . . . . . . . . . . . . . . . . . . . . . . . . 1% 14%
Interest-only . . . . . . . . . . . . . . . . . . . . . . . . . . . . . . . . . . . . . . . . . . . 1% 12%
Original loan-to-value ratio H 90 . . . . . . . . . . . . . . . . . . . . . . . . . . . . 5% 11%
FICO credit score G 620 . . . . . . . . . . . . . . . . . . . . . . . . . . . . . . . . . . * 5%
* Represent less than 0.5% of the total acquisitions.(1) Loans that meet more than one category are included in each applicable category.(2) Newly originated Alt-A loans acquired in 2009 and 2010 consist of the refinance of existing Alt-A loans.
Improvements in the credit risk profile of our 2009 and 2010 acquisitions over acquisitions in prior yearsreflect changes that we made to our pricing and eligibility standards, as well as changes that mortgage insurersmade to their eligibility standards. In addition, FHA’s role as the lower-cost option for some consumers forloans with higher LTV ratios has also reduced our acquisitions of these types of loans. The credit risk profileof our 2009 and 2010 acquisitions has been influenced further by a significant percentage of refinanced loans,which generally perform well as they demonstrate a borrower’s desire to maintain homeownership. In 2010our acquisitions of refinanced loans included a significant number of loans under the Refi PlusTM initiative,which involves refinancing existing, performing Fannie Mae loans with current LTV ratios up to 125%, andpossibly lower FICO credit scores, into loans that reduce the borrowers’ monthly payments or are otherwisemore sustainable. A substantial portion of the refinances with higher LTV ratios were done as part of theHome Affordable Refinance Program (“HARP”), which is for loans on primary residences with current LTVratios in excess of 80% and up to 125%. Due to the volume of HARP loans, the LTV ratios at origination forour 2010 acquisitions are higher than for our 2009 acquisitions. However, the overall credit profile of our 2010acquisitions remained significantly stronger than the credit profile of our 2005 through 2008 acquisitions.
13

Whether the loans we acquire in the future exhibit an overall credit profile similar to our acquisitions sinceJanuary 1, 2009 will depend on a number of factors, including our future eligibility standards and those ofmortgage insurers, the percentage of loan originations representing refinancings, our future objectives, andmarket and competitive conditions.
Beginning in 2008, we made changes to our pricing and eligibility standards and underwriting that wereintended to more accurately reflect the risk in the housing market and to significantly reduce our acquisitionsof loans with higher-risk attributes. These changes included the following:
• Established a minimum FICO credit score and reduced maximum debt-to-income ratio for most loans;
• Limited or eliminated certain loan products with higher-risk characteristics, including discontinuing theacquisition of newly originated Alt-A loans, except for those that represent the refinancing of an existingAlt-A Fannie Mae loan (we may also continue to selectively acquire seasoned Alt-A loans that meetacceptable eligibility and underwriting criteria; however, we expect our acquisitions of Alt-A mortgageloans to continue to be minimal in future periods);
• Updated our comprehensive risk assessment model in Desktop Underwriter», our proprietary automatedunderwriting system, and implemented a comprehensive risk assessment worksheet to assist lenders in themanual underwriting of loans;
• Increased our guaranty fee pricing to better align risk and pricing;
• Updated our policies regarding appraisals of properties backing loans; and
• Established a national down payment policy requiring borrowers to have a minimum down payment (orminimum equity, for refinances) of 3%, in most cases.
If we had applied our current pricing and eligibility standards and underwriting to loans we acquired in 2005through 2008, our losses on loans acquired in those years would have been lower, although we would stillhave experienced losses due to the rise and subsequent sharp decline in home prices and increasedunemployment.
Expectations Regarding Credit Losses
The single-family credit losses we realized in 2009 and 2010, combined with the amounts we have reservedfor single-family credit losses as of December 31, 2010, total approximately $110 billion. The vast majority ofthese losses are attributable to single-family loans we purchased or guaranteed from 2005 through 2008.
While loans we acquired in 2005 through 2008 will give rise to additional credit losses that we have not yetrealized, we estimate that we have reserved for the substantial majority of the remaining losses. While webelieve our results of operations have already reflected a substantial majority of the credit losses we have yetto realize on these loans, we expect that defaults on these loans and the resulting charge-offs will occur over aperiod of years. In addition, given the large current and anticipated supply of single-family homes in themarket, we anticipate that it will take years before our REO inventory approaches pre-2008 levels.
We show how we calculate our realized credit losses in “Table 14: Credit Loss Performance Metrics.” Ourreserves for credit losses consist of (1) our allowance for loan losses, (2) our allowance for accrued interestreceivable, (3) our allowance for preforeclosure property taxes and insurance receivables, and (4) our reservefor guaranty losses (collectively, our “total loss reserves”), plus the portion of fair value losses on loanspurchased out of MBS trusts reflected in our consolidated balance sheets that we estimate representsaccelerated credit losses we expect to realize. For more information on our reserves for credit losses, pleasesee “Table 11: Total Loss Reserves.”
The fair value losses that we consider part of our reserves are not included in our “total loss reserves.” Themajority of the fair value losses were recorded prior to our adoption of the new accounting standards in 2010.Upon our acquisition of credit-impaired loans out of unconsolidated MBS trusts, we recorded fair value losscharge-offs against our reserve for guaranty losses to the extent that the acquisition cost of these loansexceeded their estimated fair value. We expect to realize a portion of these fair value losses as credit losses in
14

the future (for loans that eventually involve charge-offs or foreclosure), yet these fair value losses have alreadyreduced the mortgage loan balances reflected in our consolidated balance sheets and have effectively beenrecognized in our consolidated statements of operations through our provision for guaranty losses. We considerthese fair value losses as an “effective reserve,” apart from our total loss reserves, to the extent that we expectto realize them as credit losses in the future.
As a result of the substantial reserving for and realizing of our credit losses to date, we have drawn asignificant amount of funds from Treasury through December 31, 2010. As our draws from Treasury for creditlosses abate, we expect our draws instead to be driven increasingly by dividend payments to Treasury.
Our Strategies and Actions to Reduce Credit Losses on Loans in our Single-Family Guaranty Book ofBusiness
To reduce the credit losses we ultimately incur on our single-family guaranty book of business, we arefocusing our efforts on the following strategies:
• Reducing defaults to avoid losses that otherwise would occur;
• Efficiently managing timelines for home retention solutions, foreclosure alternatives, and foreclosures;
• Pursuing foreclosure alternatives to reduce the severity of the losses we incur;
• Managing our REO inventory to reduce costs and maximize sales proceeds; and
• Pursuing contractual remedies from lenders and providers of credit enhancement, including mortgageinsurers.
We refer to actions taken by our servicers with borrowers to resolve the problem of existing or potentialdelinquent loan payments as “workouts,” which include our home retention solutions and foreclosurealternatives discussed below. As “Table 4: Credit Statistics, Single-Family Guaranty Book of Business”illustrates, our single-family serious delinquency rate decreased to 4.48% as of December 31, 2010 from5.38% as of December 31, 2009. This decrease is primarily the result of workouts and foreclosed propertyacquisitions completed during the year and reflects our work with servicers to reduce delays in determiningand executing the appropriate approach for a given loan. During 2010, we completed approximately 772,000workouts and foreclosed property acquisitions. The decrease is also attributable to our acquisition of loanswith stronger credit profiles in 2010. Serious delinquency rates declined in 2010 and, as of September 30,2010, we experienced the first year-over-year decline in our serious delinquency rate since 2007. Thisyear-over-year decline continued as of December 31, 2010. We expect serious delinquency rates will continueto be affected in the future by home price changes, changes in other macroeconomic conditions, and the extentto which borrowers with modified loans again become delinquent in their payments.
Reducing Defaults. We are working to reduce defaults through improved servicing, refinancing initiatives andsolutions that help borrowers retain their homes, such as modifications.
• Improved Servicing. Our mortgage servicers are the primary point of contact for borrowers and performa vital role in our efforts to reduce defaults and pursue foreclosure alternatives. We seek to improve theservicing of our delinquent loans through a variety of means, including increasing our resources formanaging the oversight of servicers, increasing our communications with servicers, and holding servicersaccountable for following our requirements. We are also working with some of our servicers to test andimplement high-touch protocols for servicing our higher risk loans, including lowering the ratio of loansper servicer employee, prescribing borrower outreach strategies to be used at earlier stages of delinquency,and providing distressed borrowers a single point of contact to resolve issues.
• Refinancing Initiatives. Through our Refi PlusTM initiative, which provides expanded refinanceopportunities for eligible Fannie Mae borrowers, we acquired or guaranteed approximately 659,000 loansin 2010 that helped borrowers obtain more affordable monthly payments now and in the future or a morestable mortgage product (for example, by moving from an adjustable-rate mortgage to a fixed-ratemortgage). These refinancing activities may help prevent future delinquencies and defaults. Loans
15

refinanced through the Refi Plus initiative in 2010 reduced our borrowers’ monthly mortgage payments byan average of $149.
• Home Retention Solutions. Our home retention solutions are intended to help borrowers stay in theirhomes and include loan modifications, repayment plans and forbearances. We provide information on ourhome retention solutions completed during 2010 in Table 4. Please also see “Risk Management—CreditRisk Management—Single-Family Mortgage Credit Risk Management—Management of Problem Loansand Loan Workout Metrics” for a discussion of our home retention strategies.
Managing Timelines. We believe that repayment plans, short-term forbearances and loan modifications canbe most effective in preventing defaults when completed at an early stage of delinquency. Similarly, webelieve that our foreclosure alternatives are more likely to be successful in reducing our loss severity if theyare executed expeditiously. Accordingly, it is important for servicers to work with delinquent borrowers earlyin the delinquency to determine whether home retention solutions or foreclosure alternatives will be viableand, where no workout is viable, to reduce delays in proceeding to foreclosure.
Pursuing Foreclosure Alternatives. If we are unable to provide a viable home retention solution for aproblem loan, we seek to offer foreclosure alternatives and complete them in a timely manner. Theseforeclosure alternatives are primarily preforeclosure sales, which are sometimes referred to as “short sales,” aswell as deeds-in-lieu of foreclosure. These alternatives are intended to reduce the severity of our loss resultingfrom a borrower’s default while permitting the borrower to avoid going through a foreclosure. We provideinformation about the volume of foreclosure alternatives we completed during 2010 in Table 4.
Managing Our REO Inventory. Since January 2009, we have strengthened our REO sales capabilities bysignificantly increasing the number of resources in this area, and we are working to manage our REOinventory to reduce costs and maximize sales proceeds. As Table 4 shows, in 2010 we increased ourdispositions of foreclosed single-family properties by 51% as compared with 2009, while our acquisition ofproperties increased by 80%. Given the large number of seriously delinquent loans in our single-familyguaranty book of business and the large current and anticipated supply of single-family homes in the market,we expect it will take years before our REO inventory approaches pre-2008 levels.
Pursuing Contractual Remedies. We conduct reviews of delinquent loans and, when we discover loans thatdo not meet our underwriting and eligibility requirements, we make demands for lenders to repurchase theseloans or compensate us for losses sustained on the loans. We also make demands for lenders to repurchase orcompensate us for loans for which the mortgage insurer rescinds coverage. We increased the volume of ourrepurchase requests in 2010 as compared with 2009, and we expect the number of repurchase requests wemake in 2011 to remain high. During 2010, lenders repurchased from us or reimbursed us for losses onapproximately $8.8 billion in loans, measured by unpaid principal balance, pursuant to their contractualobligations. In addition, as of December 31, 2010, we had outstanding requests for lenders to repurchase fromus or reimburse us for losses on $5.0 billion in loans, of which 30% had been outstanding for more than120 days.
These dollar amounts represent the unpaid principal balance of the loans underlying the repurchase requests,not the actual amounts we have received or requested from the lenders. When lenders pay us for theserequests, they pay us either to repurchase the loans or else to make us whole for our losses in cases where wehave acquired and disposed of the property underlying the loans. Make-whole payments are typically for lessthan the unpaid principal balance because we have already recovered some of the balance through the sale ofthe REO. As a result, our actual cash receipts relating to these outstanding repurchase requests aresignificantly lower than the unpaid principal balance of the loans.
We entered into an agreement on December 31, 2010, with Bank of America, N.A., BAC Home LoansServicing LP, and Countrywide Home Loans, Inc., each of which is an affiliate of Bank of AmericaCorporation. The agreement addresses outstanding repurchase requests on loans with an unpaid principalbalance of approximately $3.9 billion delivered to Fannie Mae by affiliates of Countrywide FinancialCorporation (collectively, “Countrywide”), with which Bank of America Corporation merged in 2008. For
16

more information regarding this agreement, please see “MD&A—Risk Management—Credit RiskManagement—Institutional Counterparty Credit Risk Management.”
We are also pursuing contractual remedies from providers of credit enhancement on our loans, includingmortgage insurers. We received proceeds under our mortgage insurance policies for single-family loans of$1.9 billion for the fourth quarter of 2010. Please see “Risk Management—Credit Risk Management—Institutional Counterparty Credit Risk Management” for a discussion of our repurchase and reimbursementrequests and outstanding receivables from mortgage insurers, as well as the risk that one or more of thesecounterparties fails to fulfill its obligations to us.
While the actions we have taken to stabilize the housing market and minimize our credit losses have beenundertaken with the goal of reducing our future credit losses below what they otherwise would have been, it isdifficult to predict how effective these actions ultimately will be in reducing our credit losses and, in thefuture, it may be difficult to measure the impact our actions ultimately have on our credit losses.
Credit Performance
Table 4 presents information for each quarter of 2010 and for 2009 about the credit performance of mortgageloans in our single-family guaranty book of business and our loan workouts. The workout information in Table4 does not reflect repayment plans and forbearances that have been initiated but not completed, nor does itreflect trial modifications that have not become permanent.
Table 4: Credit Statistics, Single-Family Guaranty Book of Business(1)
FullYear Q4 Q3 Q2 Q1
FullYear
2010 2009
(Dollars in millions)
As of the end of each period:
Serious delinquency rate(2) . . . . . . . . . . . . 4.48% 4.48% 4.56% 4.99% 5.47% 5.38%
Nonperforming loans(3) . . . . . . . . . . . . . . $ 212,858 $212,858 $212,305 $217,216 $222,892 $ 215,505
Foreclosed property inventory:
Number of properties . . . . . . . . . . . . . . 162,489 162,489 166,787 129,310 109,989 86,155
Carrying value . . . . . . . . . . . . . . . . . . . $ 14,955 $ 14,955 $ 16,394 $ 13,043 $ 11,423 $ 8,466
Combined loss reserves(4) . . . . . . . . . . . . . $ 60,163 $ 60,163 $ 58,451 $ 59,087 $ 58,900 $ 62,312
Total loss reserves(5) . . . . . . . . . . . . . . . . $ 64,469 $ 64,469 $ 63,105 $ 64,877 $ 66,479 $ 62,848
During the period:
Foreclosed property (number of properties):
Acquisitions(6) . . . . . . . . . . . . . . . . . . . 262,078 45,962 85,349 68,838 61,929 145,617
Dispositions. . . . . . . . . . . . . . . . . . . . . (185,744) (50,260) (47,872) (49,517) (38,095) (123,000)
Credit-related expenses(7) . . . . . . . . . . . . . $ 26,420 $ 4,064 $ 5,559 $ 4,871 $ 11,926 $ 71,320
Credit losses(8) . . . . . . . . . . . . . . . . . . . . $ 23,133 $ 3,111 $ 8,037 $ 6,923 $ 5,062 $ 13,362
Loan workout activity (number of loans):
Home retention loan workouts(9) . . . . . . . . 440,276 89,691 113,367 132,192 105,026 160,722
Preforeclosure sales and deeds-in-lieu offoreclosure . . . . . . . . . . . . . . . . . . . . . 75,391 15,632 20,918 21,515 17,326 39,617
Total loan workouts . . . . . . . . . . . . . . . . . 515,667 105,323 134,285 153,707 122,352 200,339
Loan workouts as a percentage of ourdelinquent loans in our guaranty book ofbusiness(10) . . . . . . . . . . . . . . . . . . . . . 37.30% 30.47% 37.86% 41.18% 31.59% 12.24%
(1) Our single-family guaranty book of business consists of (a) single-family mortgage loans held in our mortgageportfolio, (b) single-family mortgage loans underlying Fannie Mae MBS, and (c) other credit enhancements that weprovide on single-family mortgage assets, such as long-term standby commitments. It excludes non-Fannie Maemortgage-related securities held in our mortgage portfolio for which we do not provide a guaranty.
17

(2) Calculated based on the number of single-family conventional loans that are three or more months past due and loansthat have been referred to foreclosure but not yet foreclosed upon, divided by the number of loans in our single-family conventional guaranty book of business. We include all of the single-family conventional loans that we ownand those that back Fannie Mae MBS in the calculation of the single-family serious delinquency rate.
(3) Represents the total amount of nonperforming loans, including troubled debt restructurings and HomeSaver Advancefirst-lien loans, which are unsecured personal loans in the amount of past due payments used to bring mortgage loanscurrent, that are on accrual status. A troubled debt restructuring is a restructuring of a mortgage loan in which aconcession is granted to a borrower experiencing financial difficulty. We generally classify loans as nonperformingwhen the payment of principal or interest on the loan is two months or more past due.
(4) Consists of the allowance for loan losses for loans recognized in our consolidated balance sheets and the reserve forguaranty losses related to both single-family loans backing Fannie Mae MBS that we do not consolidate in ourconsolidated balance sheets and single-family loans that we have guaranteed under long-term standby commitments.Prior period amounts have been restated to conform to the current period presentation. The amounts shown as ofMarch 31, 2010, June 30, 2010, September 30, 2010 and December 31, 2010 reflect a decrease from the amountshown as of December 31, 2009 as a result of the adoption of the new accounting standards. For additionalinformation on the change in our loss reserves see “Consolidated Results of Operations—Credit-Related Expenses—Provision for Credit Losses.”
(5) Consists of (a) the combined loss reserves, (b) allowance for accrued interest receivable, and (c) allowance forpreforeclosure property taxes and insurance receivables.
(6) Includes acquisitions through deeds-in-lieu of foreclosure.(7) Consists of the provision for loan losses, the provision (benefit) for guaranty losses and foreclosed property expense.(8) Consists of (a) charge-offs, net of recoveries and (b) foreclosed property expense; adjusted to exclude the impact of
fair value losses resulting from credit-impaired loans acquired from MBS trusts and HomeSaver Advance loans.(9) Consists of (a) modifications, which do not include trial modifications or repayment plans or forbearances that have
been initiated but not completed; (b) repayment plans and forbearances completed and (c) HomeSaver Advance first-lien loans. See “Table 44: Statistics on Single-Family Loan Workouts” in “Risk Management—Credit RiskManagement” for additional information on our various types of loan workouts.
(10) Calculated based on annualized problem loan workouts during the period as a percentage of delinquent loans in oursingle-family guaranty book of business as of the end of the period.
We provide additional information on our credit-related expenses in “Consolidated Results of Operations—Credit-Related Expenses” and on the credit performance of mortgage loans in our single-family book ofbusiness and our loan workouts in “Risk Management—Credit Risk Management—Single-Family MortgageCredit Risk Management.”
Servicer Foreclosure Process Deficiencies and Foreclosure Pause
In the fall of 2010, a number of our single-family mortgage servicers temporarily halted foreclosures in someor all states after discovering deficiencies in their processes and the processes of their lawyers and otherservice providers relating to the execution of affidavits in connection with the foreclosure process.Deficiencies include improperly notarized affidavits and affidavits signed without appropriate knowledge andreview of the documents. These foreclosure process deficiencies have generated significant concern and arecurrently being investigated by various government agencies and by the attorneys general of all fifty states.This has resulted in new foreclosure laws and court rules in several states that we anticipate will increase costsand may lengthen the time to foreclose.
We have directed our servicers and certain of the law firms that handle foreclosure processes for our mortgageservicers to review their policies and procedures relating to the execution of affidavits, verifications and otherlegal documents in connection with the foreclosure process. We are also addressing concerns that have beenraised regarding the practices of some law firms that handle the foreclosure process for our mortgage servicersin Florida. In the case of one firm under investigation by the Florida attorney general’s office, we terminatedthe firm’s handling of Fannie Mae matters and moved all Fannie Mae matters pending with the firm to otherfirms. We have also served a termination notice on a second Florida law firm handling foreclosure relatedmatters for us. We have expanded the list of law firms that our servicers may use to process foreclosures inFlorida.
18
The Acting Director of FHFA issued statements on October 1 and October 13, 2010 regarding servicers’foreclosure processing issues. We are currently coordinating with FHFA regarding appropriate correctiveactions consistent with the four-point policy framework issued by FHFA on October 13, 2010. Under thisframework, servicers are required to: (1) review their processes and verify that all documents are incompliance with legal requirements; (2) remediate problems identified through this review in an appropriate,timely and sustainable manner; (3) report suspected fraudulent activity; and (4) without delay, proceed toforeclose on mortgage loans that have no problems relating to process, on which the borrower has stoppedpayment, and for which home retention solutions and foreclosure alternatives have been unsuccessful.
Due to the servicer affidavit issues, we temporarily suspended certain eviction proceedings and the closing ofsome REO sales. On November 24, 2010, we authorized the scheduling and closing of REO sale transactionsto resume. Effective January 18, 2011, we issued instructions to counsel to proceed with scheduling andcompleting the eviction actions previously placed on hold.
Although the foreclosure pause has negatively affected our serious delinquency rates, credit-related expensesand foreclosure timelines, we cannot yet predict the full extent of its impact. The foreclosure pause also couldnegatively affect housing market conditions and delay the recovery of the housing market. Some servicershave lifted the foreclosure pause in certain jurisdictions, while continuing the pause in others. At this time, wecannot predict how long the pause on foreclosures will last, how many of our loans will be affected by it or itsultimate impact on our business or the housing market. See “Risk Factors” for further information about thepotential impact of the servicer foreclosure process deficiencies and the foreclosure pause on our business,results of operations, financial condition and liquidity position.
Liquidity
In response to the strong demand that we experienced for our debt securities during 2010, we issued a varietyof non-callable and callable debt securities in a wide range of maturities to achieve cost-efficient funding andto extend our debt maturity profile. In particular, we issued a significant amount of long-term debt during thisperiod, which we then used to repay maturing debt and prepay more expensive callable long-term debt.
We believe that our ready access to long-term debt funding during 2009 and 2010 has been primarily due tothe actions taken by the federal government to support us and the financial markets. Accordingly, we believethat continued federal government support of our business and the financial markets, as well as our status as aGSE, are essential to maintaining our access to debt funding. Changes or perceived changes in thegovernment’s support could materially and adversely affect our ability to refinance our debt as it becomes due,which could have a material adverse impact on our liquidity, financial condition, results of operations andability to continue as a going concern. Demand for our debt securities could decline in the future, as theAdministration, Congress and our regulators debate our future. Despite the conclusion of the Federal Reserve’sprogram to purchase agency debt and MBS during the first quarter of 2010, as of the date of this filing,demand for our long-term debt securities continues to be strong. See “MD&A—Liquidity and CapitalManagement—Liquidity Management” for more information on our debt funding activities and “Risk Factors”for a discussion of the risks to our business posed by our reliance on the issuance of debt securities to fundour operations.
Outlook
Overall Market Conditions. We expect weakness in the housing and mortgage markets to continue in 2011.The high level of delinquent mortgage loans will result in the foreclosure of troubled loans, which is likely toadd to the excess housing inventory. Home sales are unlikely to rise before the unemployment rate improves.In addition, the servicer foreclosure process deficiencies described above create uncertainty for potential homebuyers, because foreclosed homes account for a substantial part of the existing home market. Thus, widespreadconcerns about foreclosure process deficiencies could suppress home sales in the near term and interfere withthe housing recovery.
We expect that single-family default and severity rates, as well as the level of single-family foreclosures, willremain high in 2011. Despite the initial signs of multifamily sector improvement, we expect multifamily
19

charge-offs to remain commensurate with 2010 levels throughout 2011. All of these conditions as well as oursingle-family serious delinquency rate may worsen if the unemployment rate increases on either a national orregional basis. We expect our overall business volume in 2011 will be lower than in 2010 as a result of ourexpectations that, in 2011 (1) residential mortgage debt outstanding will continue to decline, (2) totaloriginations will decline, and (3) the portion of originations represented by refinancings will decline.Approximately 78% of our single-family business in 2010 consisted of refinancings.
Home Price Declines. We expect that home prices on a national basis will decline slightly, with greaterdeclines in some geographic areas than others, before stabilizing later in 2011, and that the peak-to-troughhome price decline on a national basis will range between 21% and 26%. These estimates are based on ourhome price index, which is calculated differently from the S&P/Case-Shiller U.S. National Home Price Indexand therefore results in different percentages for comparable declines. These estimates also contain significantinherent uncertainty in the current market environment regarding a variety of critical assumptions we makewhen formulating these estimates, including the effect of actions the federal government has taken and maytake with respect to the national economic recovery; the management of the Federal Reserve’s MBS holdings;and the impact of those actions on home prices, unemployment and the general economic and interest rateenvironment. Because of these uncertainties, the actual home price decline we experience may differsignificantly from these estimates. We also expect significant regional variation in home price declines andstabilization.
Our 21% to 26% peak-to-trough home price decline estimate corresponds to an approximate 32% to 40%peak-to-trough decline using the S&P/Case-Shiller index method. Our estimates differ from the S&P/Case-Shiller index in two principal ways: (1) our estimates weight expectations by number of properties, whereaswe believe the S&P/Case-Shiller index weights expectations based on property value, causing home pricedeclines on higher priced homes to have a greater effect on the overall result; and (2) our estimates attempt toexclude sales of foreclosed homes because we believe that differing maintenance practices and the forcednature of the sales make foreclosed home prices less representative of market values, whereas we believe theS&P/Case-Shiller index includes foreclosed homes sales. The S&P/Case-Shiller comparison numbers arecalculated using our models and assumptions, but modified to account for weighting based on property valueand the impact of foreclosed property sales. In addition to these differences, our estimates are based on ourown internally available data combined with publicly available data, and are therefore based on data collectednationwide, whereas the S&P/Case-Shiller index is based on publicly available data, which may be limited incertain geographic areas of the country. Our comparative calculations to the S&P/Case-Shiller index providedabove are not modified to account for this data pool difference. We are working on enhancing our home priceestimates to identify and exclude a greater portion of foreclosed home sales. When we begin reporting theseenhanced home price estimates, we expect that some period to period comparisons of home prices may differfrom those determined using our current estimates.
Credit-Related Expenses and Credit Losses. We expect that our credit-related expenses will remain high in2011 and that our credit losses will increase in 2011 as compared to 2010. We describe our credit loss outlookabove under “Our Expectations Regarding Profitability, the Single-Family Loans We Acquired Beginning in2009, and Credit Losses.”
Uncertainty Regarding our Long-Term Financial Sustainability and Future Status. There is significantuncertainty in the current market environment, and any changes in the trends in macroeconomic factors thatwe currently anticipate, such as home prices and unemployment, may cause our future credit-related expensesand credit losses to vary significantly from our current expectations. Although Treasury’s funds under thesenior preferred stock purchase agreement permit us to remain solvent and avoid receivership, the resultingdividend payments are substantial. Given our expectations regarding future losses, which we describe aboveunder “Our Expectations Regarding Profitability, the Single-Family Loans We Acquired Beginning in 2009,and Credit Losses,” we do not expect to earn profits in excess of our annual dividend obligation to Treasuryfor the indefinite future. As a result of these factors, there is significant uncertainty as to our long-termfinancial sustainability.
20
In addition, there is significant uncertainty regarding the future of our company, including how long we willcontinue to be in existence, the extent of our role in the market, what form we will have, and what ownershipinterest, if any, our current common and preferred stockholders will hold in us after the conservatorship isterminated. We expect this uncertainty to continue. In December 2009, while announcing amendments to thesenior preferred stock purchase agreement and to Treasury’s preferred stock purchase agreement with FreddieMac, Treasury noted that the amendments “should leave no uncertainty about the Treasury’s commitment tosupport [Fannie Mae and Freddie Mac] as they continue to play a vital role in the housing market during thiscurrent crisis.” Treasury and HUD’s February 11, 2011 report to Congress on reforming America’s housingfinance market provides that the Administration will work with FHFA to determine the best way toresponsibly wind down both Fannie Mae and Freddie Mac. The report emphasizes the importance of providingthe necessary financial support to Fannie Mae and Freddie Mac during the transition period. We cannot predictthe prospects for the enactment, timing or content of legislative proposals regarding long-term reform of theGSEs. Please see “Legislation and GSE Reform” for a discussion of recent legislative reform of the financialservices industry, and proposals for GSE reform, that could affect our business and “Risk Factors” for adiscussion of the risks to our business relating to the uncertain future of our company.
MORTGAGE SECURITIZATIONS
We support market liquidity by securitizing mortgage loans, which means we place loans in a trust and FannieMae MBS backed by the mortgage loans are then issued. We guarantee to the MBS trust that we willsupplement amounts received by the MBS trust as required to permit timely payment of principal and intereston the trust certificates. In return for this guaranty, we receive guaranty fees.
Below we discuss (1) two broad categories of securitization transactions: lender swaps and portfoliosecuritizations; (2) features of our MBS trusts; (3) circumstances under which we purchase loans from MBStrusts; and (4) single-class and multi-class Fannie Mae MBS.
Lender Swaps and Portfolio Securitizations
We currently securitize a majority of the single-family and multifamily mortgage loans we acquire. Oursecuritization transactions primarily fall within two broad categories: lender swap transactions and portfoliosecuritizations.
Our most common type of securitization transaction is our “lender swap transaction.” Mortgage lenders thatoperate in the primary mortgage market generally deliver pools of mortgage loans to us in exchange forFannie Mae MBS backed by these mortgage loans. A pool of mortgage loans is a group of mortgage loanswith similar characteristics. After receiving the mortgage loans in a lender swap transaction, we place them ina trust that is established for the sole purpose of holding the mortgage loans separate and apart from ourassets. We deliver to the lender (or its designee) Fannie Mae MBS that are backed by the pool of mortgageloans in the trust and that represent an undivided beneficial ownership interest in each of the mortgage loans.We guarantee to each MBS trust that we will supplement amounts received by the MBS trust as required topermit timely payment of principal and interest on the related Fannie Mae MBS. We retain a portion of theinterest payment as the fee for providing our guaranty. Then, on behalf of the trust, we make monthlydistributions to the Fannie Mae MBS certificateholders from the principal and interest payments and othercollections on the underlying mortgage loans. The structured securitization transactions we describe below in“Business Segments—Capital Markets—Securitization Activities” involve a process that is very similar to theprocess involved in our lender swap securitizations.
In contrast to our lender swap securitizations, in which lenders deliver pools of mortgage loans to us that weimmediately place in a trust for securitization, our “portfolio securitization transactions” involve creating andissuing Fannie Mae MBS using mortgage loans and mortgage-related securities that we hold in our mortgageportfolio.
21

Features of Our MBS Trusts
We serve as trustee for our MBS trusts, each of which is established for the sole purpose of holding mortgageloans separate and apart from our assets. Our MBS trusts hold either single-family or multifamily mortgageloans or mortgage-related securities. Each trust operates in accordance with a trust agreement or a trustindenture. Each MBS trust is also governed by an issue supplement documenting the formation of that MBStrust, the identification of its related assets and the issuance of the related Fannie Mae MBS. The trustagreement or the trust indenture, together with the issue supplement and any amendments, are considered the“trust documents” that govern an individual MBS trust.
In 2010 we established a new multifamily master trust agreement that governs our multifamily MBS trustsformed on or after October 1, 2010. The new master trust agreement provides greater flexibility in certainservicing activities related to multifamily mortgage loans held in an MBS trust formed on or after that date.
Purchases of Loans from our MBS Trusts
Under the terms of our MBS trust documents, we have the option or, in some instances, the obligation, topurchase mortgage loans that meet specific criteria from an MBS trust. In particular, we have the option topurchase a loan from an MBS trust if the loan is delinquent as to four or more consecutive monthly payments.Our acquisition cost for these loans is the unpaid principal balance of the loan plus accrued interest.
In deciding whether and when to purchase a loan from a single-family MBS trust, we consider a variety offactors, including: our legal ability or obligation to purchase loans under the terms of the trust documents; ourmission and public policy; our loss mitigation strategies and the exposure to credit losses we face under ourguaranty; our cost of funds; the impact on our results of operations; relevant market yields; the accountingimpact; the administrative costs associated with purchasing and holding the loans; counterparty exposure tolenders that have agreed to cover losses associated with delinquent loans; general market conditions; ourstatutory obligations under our Charter Act; and other legal obligations such as those established by consumerfinance laws. The weight we give to these factors changes depending on market circumstances and otherfactors.
With the adoption of new accounting standards on January 1, 2010, we no longer recognize the acquisition ofloans from the MBS trusts that we have consolidated as a purchase with an associated fair value loss for thedifference between the fair value of the acquired loan and its acquisition cost, as these loans are alreadyreflected on our consolidated balance sheet. Currently, the cost of purchasing most delinquent loans fromFannie Mae MBS trusts and holding them in our portfolio is less than the cost of advancing delinquentpayments to security holders. In light of these factors, in the first half of 2010 we significantly increased thesepurchases, purchasing the substantial majority of our previously outstanding delinquent loan population in oursingle-family MBS trusts. As a result, during 2010 we reduced the total unpaid principal balance of loans insingle-family MBS trusts that were delinquent for four or more consecutive months to approximately$8 billion as of December 31, 2010 from approximately $127 billion as of December 31, 2009. We expect tocontinue to purchase loans from MBS trusts as they become four or more consecutive monthly paymentsdelinquent subject to market conditions, economic benefit, servicer capacity, and other constraints, includingthe limit on mortgage assets that we may own pursuant to the senior preferred stock purchase agreement. Wecontinue to review the economics of purchasing loans that are four or more months delinquent in the futureand may reevaluate our delinquent loan purchase practices and alter them if circumstances warrant.
For our multifamily MBS trusts, we typically exercise our option to purchase a loan from the trust if the loanis delinquent, in whole or in part, as to four or more consecutive monthly payments.
Single-Class and Multi-Class Fannie Mae MBS
Fannie Mae MBS trusts may be single-class or multi-class. Single-class MBS are MBS in which the investorsreceive principal and interest payments in proportion to their percentage ownership of the MBS issuance.Multi-class MBS are MBS, including REMICs, in which the cash flows on the underlying mortgage assets aredivided, creating several classes of securities, each of which represents an undivided beneficial ownership
22

interest in the assets of the related MBS trust and entitles the related holder to a specific portion of cash flows.Terms to maturity of some multi-class Fannie Mae MBS, particularly REMIC classes, may match or beshorter than the maturity of the underlying mortgage loans and/or mortgage-related securities. After theseclasses expire, cash flows received on the underlying mortgage assets are allocated to the remaining classes inaccordance with the terms of the securities’ structures. As a result, each of the classes in a multi-class MBSmay have a different coupon rate, average life, repayment sensitivity or final maturity. Structured Fannie MaeMBS are either multi-class MBS or single-class MBS that are typically resecuritizations of other single-class Fannie Mae MBS. In a resecuritization, pools of MBS are collected and securitized.
BUSINESS SEGMENTS
We have three business segments for management reporting purposes: Single-Family Credit Guaranty,Multifamily, and Capital Markets. We refer to our business groups that run these segments as our“Single-Family business,” our “Multifamily business” and our “Capital Markets group.” These groups engagein complementary business activities in pursuing our mission of providing liquidity, stability and affordabilityto the U.S. housing market. These activities are summarized in the table below and described in more detailfollowing this table. We also summarize in the table below the key sources of revenue for each of oursegments and the primary expenses.
BusinessSegment Primary Business Activities Primary Revenues Primary Expenses
Single-FamilyCreditGuaranty, orSingle-Family
• Mortgage securitizations:Works with our lendercustomers to securitizesingle-family mortgage loansdelivered to us by lendersinto Fannie Mae MBS, whichwe refer to as “lender swap”transactions
• Mortgage acquisitions:Works with our CapitalMarkets group to facilitatethe purchase of single-familymortgage loans for ourmortgage portfolio
• Credit risk management:Prices and manages thecredit risk on loans in oursingle-family guaranty bookof business
• Credit loss management:Works to preventforeclosures and reduce costsof defaulted loans throughforeclosure alternatives,through management of REOwe acquire upon foreclosureor through a deed-in-lieu offoreclosure, and throughlender repurchases
• Guaranty fees: Compensationfor assuming and managingthe credit risk on our single-family guaranty book ofbusiness
• Fee and other income:Compensation received forproviding lender services
• Credit-related expenses.Consists of provision forsingle-family loan losses,provision for single-familyguaranty losses andforeclosed property expenseon loans underlying oursingle-family guaranty bookof business
• Administrative expenses:Consists of salaries andbenefits, occupancy costs,professional services, andother expenses associatedwith the Single-Familybusiness operations
23

BusinessSegment Primary Business Activities Primary Revenues Primary Expenses
Multifamily • Mortgage securitizations:Works with our lendercustomers to securitizemultifamily mortgage loansdelivered to us by lendersinto Fannie Mae MBS inlender swap transactions
• Mortgage acquisitions:Works with our CapitalMarkets group to facilitatethe purchase of multifamilymortgage loans for ourmortgage portfolio
• Affordable housinginvestments: Providesfunding for investments inaffordable multifamily rentalhousing projects
• Credit risk management:Prices and manages thecredit risk on loans in ourmultifamily guaranty book ofbusiness
• Credit loss management:Works to preventforeclosures and reduce costsof defaulted loans throughforeclosure alternatives,through management of REOwe acquire upon foreclosureor through a deed-in-lieu offoreclosure, and throughlender repurchases
• Guaranty fees: Compensationfor assuming and managingthe credit risk on ourmultifamily guaranty book ofbusiness
• Fee and other income:Compensation received forengaging in multifamilytransactions and bond creditenhancements
• Credit-related expenses:Consists of provision formultifamily loan losses,provision for multifamilyguaranty losses andforeclosed property expenseon loans underlying ourmultifamily guaranty book ofbusiness
• Net operating losses:Generated by our affordablehousing investments, net ofany tax benefits generated bythese investments that we areable to utilize
• Administrative expenses:Consists of salaries andbenefits, occupancy costs,professional services, andother expenses associatedwith our Multifamilybusiness operations
24

BusinessSegment Primary Business Activities Primary Revenues Primary Expenses
Capital Markets • Mortgage and otherinvestments: Purchasesmortgage assets and makesinvestments in other non-mortgage interest-earningassets
• Mortgage securitizations:Purchases loans from a largegroup of lenders, securitizesthem, and may sell thesecurities to dealers andinvestors
• Structured mortgagesecuritizations and othercustomer services: Issuesstructured Fannie Mae MBSfor customers in exchangefor a transaction fee andprovides other fee-relatedservices to our lendercustomers
• Interest rate riskmanagement: Manages theinterest rate risk on ourportfolio by issuing a varietyof debt securities in a widerange of maturities and byusing derivatives
• Net interest income:Generated from thedifference between theinterest income earned onour interest-earning assetsand the interest expenseassociated with the debtfunding those assets
• Fee and other income:Compensation received forproviding structuredtransactions and other lenderservices
• Fair value gains and losses:Primarily consists of fairvalue gains and losses onderivatives and tradingsecurities
• Investment gains and losses:Primarily consists of gainsand losses on the sale orsecuritization of mortgageassets
• Other-than-temporaryimpairment: Consists ofimpairment recognized onour investments
• Administrative expenses:Consists of salaries andbenefits, occupancy costs,professional services, andother expenses associatedwith our Capital Marketsbusiness operations
Revenues from our Business Segments
The following table shows the percentage of our total net revenues accounted for by our business segments foreach of the last three years. Our prospective adoption of the new accounting standards had a significant impacton our financial statements. Also, effective in 2010 we changed the presentation of segment financialinformation that is currently evaluated by management. As a result of the new accounting standards andchanges to our segment presentation, our 2010 segment results are not comparable to prior years’ segmentresults. We have not restated prior years’ results, nor have we presented 2010 results under the oldpresentation, because we determined that it was impracticable to do so. For more information about changes inour segment reporting and the financial results and performance of each of our segments, please see“MD&A—Business Segment Results” and “Note 15, Segment Reporting.”
Business Segment Revenues(1)
2010(2) 2009 2008
For the Year EndedDecember 31,
Single-Family Credit Guaranty . . . . . . . . . . . . . . . . . . . . . . . . . . . . . . . . . . . . . . . . . . . . . . . . 12% 39% 54%Multifamily(3) . . . . . . . . . . . . . . . . . . . . . . . . . . . . . . . . . . . . . . . . . . . . . . . . . . . . . . . . . . . . 5 3 3Capital Markets . . . . . . . . . . . . . . . . . . . . . . . . . . . . . . . . . . . . . . . . . . . . . . . . . . . . . . . . . . 77 58 43
(1) Amounts presented represent the percentage of our total net revenues accounted for by each of our businesssegments.
(2) Segment results for 2010 are not comparable with prior years’ results. In addition, under our current segment reportingstructure, the sum of net revenues for our three business segments does not equal our consolidated total net revenuesbecause we separate the activity related to our consolidated trusts from the results generated by our three segments.
(3) These amounts do not include the net interest income we earn on our multifamily investments in our mortgageportfolio, which is reflected in the revenues of our Capital Markets segment.
25

Under the terms of our intracompany guaranty arrangement, Capital Markets receives reimbursementsprimarily from Single-Family for the contractual interest due on mortgage loans held in our portfolio wheninterest income on the loans is no longer recognized in accordance with our nonaccrual accounting policy. Asa result, the substantial increase in the number of nonaccrual loans purchased from our consolidated MBStrusts in 2010 significantly increased Capital Markets’ net revenue in 2010, while reducing the net revenues ofSingle-Family.
Single-Family Business
Our Single-Family business works with our lender customers to provide funds to the mortgage market bysecuritizing single-family mortgage loans into Fannie Mae MBS. Our Single-Family business also works withour Capital Markets group to facilitate the purchase of single-family mortgage loans for our mortgageportfolio. Our Single-Family business has primary responsibility for pricing and managing the credit risk onour single-family guaranty book of business, which consists of single-family mortgage loans underlying FannieMae MBS and single-family loans held in our mortgage portfolio.
A single-family loan is secured by a property with four or fewer residential units. Our Single-Family businessand Capital Markets group securitize and purchase primarily conventional (not federally insured or guaranteed)single-family fixed-rate or adjustable-rate, first lien mortgage loans, or mortgage-related securities backed bythese types of loans. We also securitize or purchase loans insured by FHA, loans guaranteed by theDepartment of Veterans Affairs (“VA”), and loans guaranteed by the Rural Development Housing andCommunity Facilities Program of the Department of Agriculture, manufactured housing loans, reversemortgage loans, multifamily mortgage loans, subordinate lien mortgage loans (for example, loans secured bysecond liens) and other mortgage-related securities.
Revenues for our Single-Family business are derived primarily from guaranty fees received as compensationfor assuming the credit risk on the mortgage loans underlying single-family Fannie Mae MBS. We alsoallocate guaranty fee revenues to the Single-Family business for assuming and managing the credit risk on thesingle-family mortgage loans held in our portfolio. The aggregate amount of single-family guaranty fees wereceive or that are allocated to our Single-Family business in any period depends on the amount of single-family Fannie Mae MBS outstanding and loans held in our mortgage portfolio during the period and theapplicable guaranty fee rates. The amount of Fannie Mae MBS outstanding at any time is primarilydetermined by the rate at which we issue new Fannie Mae MBS and by the repayment rate for the loansunderlying our outstanding Fannie Mae MBS. Other factors affecting the amount of Fannie Mae MBSoutstanding are the extent to which (1) we purchase loans from our MBS trusts because of borrower defaults(with the amount of these purchases affected by the rate of borrower defaults on the loans and the extent ofloan modification programs in which we engage) and (2) sellers and servicers repurchase loans from us uponour demand based on a breach in the selling representations and warranties provided upon delivery of theloans.
We describe the credit risk management process employed by our Single-Family business, including its keystrategies in managing credit risk and key metrics used in measuring and evaluating our single-family creditrisk in “MD&A—Risk Management—Credit Risk Management.”
Single-Family Mortgage Securitizations and Acquisitions
Our Single-Family business securitizes single-family mortgage loans and issues single-class Fannie Mae MBS,which are described above in “Mortgage Securitizations—Single-Class and Multi-Class Fannie Mae MBS,” forour lender customers. Unlike our Capital Markets group, which securitizes loans from our portfolio, ourSingle-Family business securitizes loans solely in lender swap transactions, in which lenders deliver pools ofmortgage loans to us, which are placed immediately in a trust, in exchange for Fannie Mae MBS backed bythese loans. We describe lender swap transactions, and how they differ from portfolio securitizations, in“Mortgage Securitizations—Lender Swaps and Portfolio Securitizations.”
Loans from our lender customers are delivered to us through either our “flow” or “bulk” transaction channels.In our flow business, we enter into agreements that generally set agreed-upon guaranty fee prices for a
26

lender’s future delivery of individual loans to us over a specified time period. Our bulk business generallyconsists of transactions in which a set of loans is delivered to us in bulk, typically with guaranty fees andother contract terms negotiated individually for each transaction.
Single-Family Mortgage Servicing
Servicing
Generally, the servicing of the mortgage loans held in our mortgage portfolio or that back our Fannie MaeMBS is performed by mortgage servicers on our behalf. Typically, lenders who sell single-family mortgageloans to us service these loans for us. For loans we own or guarantee, the lender or servicer must obtain ourapproval before selling servicing rights to another servicer.
Our mortgage servicers typically collect and deliver principal and interest payments, administer escrowaccounts, monitor and report delinquencies, perform default prevention activities, evaluate transfers ofownership interests, respond to requests for partial releases of security, and handle proceeds from casualty andcondemnation losses. Our mortgage servicers are the primary point of contact for borrowers and perform a keyrole in the effective implementation of our homeownership assistance initiatives, negotiation of workouts oftroubled loans, and loss mitigation activities. If necessary, mortgage servicers inspect and preserve propertiesand process foreclosures and bankruptcies. Because we generally delegate the servicing of our mortgage loansto mortgage servicers and do not have our own servicing function, our ability to actively manage troubledloans that we own or guarantee may be limited. For more information on the risks of our reliance on servicers,refer to “Risk Factors” and “MD&A—Risk Management—Credit Risk Management—InstitutionalCounterparty Credit Risk Management.”
We compensate servicers primarily by permitting them to retain a specified portion of each interest paymenton a serviced mortgage loan as a servicing fee. Servicers also generally retain prepayment premiums,assumption fees, late payment charges and other similar charges, to the extent they are collected fromborrowers, as additional servicing compensation. We also compensate servicers for negotiating workouts onproblem loans.
In January 2011, FHFA announced that it directed Fannie Mae and Freddie Mac to work on a joint initiative,in coordination with FHFA and HUD, to consider alternatives for future mortgage servicing structures andservicing compensation for their single-family mortgage loans. Alternatives that may be considered include afee for service compensation structure for nonperforming loans, as well as the possibility of reducing oreliminating the minimum mortgage servicing fee for performing loans, or other structures. In itsannouncement, FHFA stated that any implementation of a new servicing compensation structure would not beexpected to occur before summer 2012.
REO Management and Lender Repurchase Evaluations
In the event a loan defaults and we acquire a home through foreclosure or a deed-in-lieu of foreclosure, wefocus on selling the home through a national network of real estate agents. Our primary objectives are both tominimize the severity of loss to Fannie Mae by maximizing sales prices and also to stabilize neighborhoods—to prevent empty homes from depressing home values. We also continue to seek non-traditional ways to sellproperties, including by selling homes to cities, municipalities and other public entities, and by sellingproperties in bulk or through public auctions.
We also conduct post-purchase quality control file reviews to ensure that loans sold to and serviced for usmeet our guidelines. If we discover violations through reviews, we issue repurchase demands to the seller andseek to collect on our repurchase claims.
Multifamily Business
A core part of Fannie Mae’s mission is to support the U.S. multifamily housing market to help serve thenation’s rental housing needs, focusing on low- to middle-income households and communities. Multifamilymortgage loans relate to properties with five or more residential units, which may be apartment communities,
27

cooperative properties or manufactured housing communities. During 2010, we changed the name of ourmultifamily business division from Housing and Community Development to Multifamily Mortgage Business.The new name better reflects the division’s realignment to focus on our core multifamily activities and thediscontinuation of some of our non-mortgage secured debt and equity investment activities as instructed byFHFA.
Our Multifamily business works with our lender customers to provide funds to the mortgage market bysecuritizing multifamily mortgage loans into Fannie Mae MBS. Through our Multifamily business, we provideliquidity and support to the U.S. multifamily housing market principally by purchasing or securitizing loansthat finance multifamily rental housing properties. We also provide some limited debt financing for otheracquisition, development, construction and rehabilitation activity related to projects that complement thisbusiness. Our Multifamily business also works with our Capital Markets group to facilitate the purchase andsecuritization of multifamily mortgage loans and securities for Fannie Mae’s portfolio, as well as to facilitateportfolio securitization and resecuritization activities. Our multifamily guaranty book of business consists ofmultifamily mortgage loans underlying Fannie Mae MBS and multifamily loans and securities held in ourmortgage portfolio. Our Multifamily business has primary responsibility for pricing the credit risk on ourmultifamily guaranty book of business and for managing the credit risk on multifamily loans and Fannie MaeMBS backed by multifamily loans that are held in our mortgage portfolio.
Revenues for our Multifamily business are derived from a variety of sources, including: (1) guaranty feesreceived as compensation for assuming the credit risk on the mortgage loans underlying multifamily FannieMae MBS and on the multifamily mortgage loans held in our portfolio and on other mortgage-relatedsecurities; (2) transaction fees associated with the multifamily business and (3) other bond credit enhancementrelated fees.
We describe the credit risk management process employed by our Multifamily business, along with ourMultifamily Enterprise Risk Management group, including its key strategies in managing credit risk and keymetrics used in measuring and evaluating our multifamily credit risk, in “MD&A—Risk Management—CreditRisk Management—Multifamily Mortgage Credit Risk Management.”
Key Characteristics of the Multifamily Mortgage Market and Multifamily Transactions
The multifamily mortgage market and our transactions in that market have a number of key characteristics thataffect our multifamily activities and distinguish them from our activities in the single-family residentialmortgage market.
• Funding sources: Unlike the single-family residential mortgage market in which the GSEs’predominance makes us a driver of market standards and rates, the multifamily market is made up of awide variety of lending sources, including commercial banks, life insurance companies, investment banks,small community banks, FHA, state and local housing finance agencies and the GSEs.
• Number of lenders; lender relationships: In 2010, we executed multifamily transactions with 32 lenders.Of these, 24 lenders delivered loans to us under our Delegated Underwriting and Servicing, or DUS»,product line. In determining whether to do business with a multifamily lender, we consider the lender’sfinancial strength, multifamily underwriting and servicing experience, portfolio performance andwillingness and ability to share in the risk of loss associated with the multifamily loans they originate.
• Loan size: On average, loans in our multifamily guaranty book of business are several million dollars insize. A significant number of our multifamily loans are under $5 million, and some of our multifamilyloans are greater than $25 million.
• Collateral: Multifamily loans are collateralized by properties that generate cash flows, such as gardenand high-rise apartment complexes, seniors housing communities, cooperatives, dedicated student housingand manufactured housing communities. These rental properties are operated as businesses.
• Borrower profile: Most multifamily borrowers are for-profit corporations, limited liability companies,partnerships, real estate investment trusts and individuals who invest in real estate for cash flow and
28

equity returns in exchange for their original investment in the asset. Multifamily loans are generally non-recourse to the borrower. When considering a multifamily borrower, creditworthiness is evaluated througha combination of quantitative and qualitative data including liquid assets, net worth, number of unitsowned, experience in a market and/or property type, multifamily portfolio performance, access toadditional liquidity, debt maturities, asset/property management platform, senior management experience,reputation and lender exposure.
• Borrower and lender investment: Borrowers are required to contribute cash equity into multifamilyproperties on which they borrow, while lenders generally share in any losses realized from the loans thatwe purchase.
• Underwriting process: Some multifamily loans require a detailed underwriting process due to the size ofthe loan or the complexity of the collateral or transaction.
• Term and lifecycle: In contrast to the standard 30-year single-family residential loan, multifamily loanstypically have terms of 5, 7 or 10 years, with balloon payments due at maturity.
• Prepayment terms: Multifamily Fannie Mae loans and MBS trade in a market in which investors expectcommercial investment terms, particularly limitations on prepayments of loans and the imposition ofprepayment premiums.
Multifamily Mortgage Securitizations and Acquisitions
Our Multifamily business generally creates multifamily Fannie Mae MBS and acquires multifamily mortgageassets in the same manner as our Single-Family business, as described above in “Single-Family Business—Mortgage Securitizations and Acquisitions.”
Delegated Underwriting and Servicing (DUS)
In an effort to promote product standardization in the multifamily marketplace, in 1988 Fannie Mae initiatedthe DUS product line for acquiring individual multifamily loans.
DUS is a unique business model in the commercial mortgage industry. The standard industry practice for amultifamily loan requires the purchaser or guarantor to underwrite or re-underwrite each loan prior to decidingwhether to purchase or guaranty the loan. Under our model, DUS lenders are pre-approved and delegated theauthority to underwrite and service loans on behalf of Fannie Mae. In exchange for this authority, DUSlenders are required to share with us the risk of loss over the life of the loan, generally retaining one-third ofthe underlying credit risk on each loan sold to Fannie Mae. Since DUS lenders share in the credit risk, theservicing fee to the lenders includes compensation for credit risk. Delegation permits lenders to respond tocustomers more rapidly, as the lender generally has the authority to approve a loan within prescribedparameters, which provides an important competitive advantage.
We believe our DUS model aligns the interests of the borrower, lender and Fannie Mae. Our current 25-member DUS lender network, which is comprised of large financial institutions and independent mortgagelenders, continues to be our principal source of multifamily loan deliveries.
Fannie Mae MBS secured by DUS loans are typically backed by a single mortgage loan, which is often afixed-rate loan. We believe this structure increases the liquidity of the securities in the market. StructuringMBS to be backed by a single multifamily loan also facilitates securitizations by our smaller lenders.
Multifamily Mortgage Servicing
As with the servicing of single-family mortgages, multifamily mortgage servicing is typically performed bythe lenders who sell the mortgages to us. Many of our multifamily mortgage servicers have agreed, as part ofthe DUS relationship, to accept loss sharing, which we believe increases the alignment of interests between usand our multifamily loan servicers. Because of our loss-sharing arrangements with our multifamily lenders,transfers of multifamily servicing rights are infrequent, and we carefully monitor all our servicing relationshipsand enforce our right to approve all servicing transfers. As a seller-servicer, the lender is responsible for
29

evaluating the financial condition of properties and property owners, administering various types ofagreements (including agreements regarding replacement reserves, completion or repair, and operations andmaintenance), as well as conducting routine property inspections.
The Multifamily Markets in which We Operate
In the multifamily mortgage market, we aim to address the rental housing needs of a wide range of thepopulation, from those at the lower end of the income range up through middle-income households. Ourmission requires us to serve the market steadily, rather than moving in and out depending on marketconditions. Through the secondary mortgage market, we support rental housing for the workforce, for seniorcitizens and students, and for families with the greatest economic need. Our Multifamily business is organizedand operated as an integrated commercial real estate finance business, with dedicated teams that address thespectrum of multifamily housing finance needs, including the teams described below.
• To meet the growing need for affordable financing, we have a team that focuses on the purchase andguarantee of multifamily loans under $3 million ($5 million in high income areas), which financeaffordable housing. We purchase these loans from DUS lenders as well as small community banks andnonprofits or similar entities. Over the years, we have been an active purchaser of these loans from bothDUS and non-DUS lenders and, as of December 31, 2010, they represented 70% of our multifamilyguaranty book of business by loan count and 18% based on unpaid principal balance.
• To serve low- and very low-income households, we also have a team that focuses exclusively onrelationships with lenders financing privately-owned multifamily properties that receive public subsidies inexchange for maintaining long-term affordable rents. We enable borrowers to leverage housing programsand subsidies provided by local, state and federal agencies. These public subsidy programs are largelytargeted to providing housing to families earning less than 60% of area median income (as defined byHUD) and are structured to ensure that the low and very low-income households who benefit from thesubsidies pay no more than 30% of their gross monthly income for rent and utilities. As of December 31,2010, this type of financing represented approximately 14% of our multifamily guaranty book of business,based on unpaid principal balance, including $16.5 billion in bond credit enhancements.
Capital Markets
Our Capital Markets group manages our investment activity in mortgage-related assets and other interest-earning non-mortgage investments. We fund our investments primarily through proceeds we receive from theissuance of debt securities in the domestic and international capital markets. Our Capital Markets group hasprimary responsibility for managing the interest rate risk associated with our investments in mortgage assets.
The business model for our Capital Markets group has evolved in recent years. Our business activity is nowfocused on making short-term use of our balance sheet rather than long-term investments. As a result, ourCapital Markets group works with lender customers to provide funds to the mortgage market through short-term financing and investing activities. Activities we are undertaking to provide liquidity to the mortgagemarket include the following:
• Whole Loan Conduit. Whole loan conduit activities involve our purchase of both single-family andmultifamily loans principally for the purpose of securitizing them. We purchase loans from a large groupof lenders and then securitize them as Fannie Mae MBS, which may then be sold to dealers and investors.
• Early Funding. Lenders who deliver whole loans or pools of whole loans to us in exchange for MBStypically must wait between 30 and 45 days from the closing and settlement of the loans or pools and theissuance of the MBS. This delay may limit lenders’ ability to originate new loans. Under our early lenderfunding programs, we purchase whole loans or pools of loans on an accelerated basis, allowing lenders toreceive quicker payment for the whole loans and pools, which replenishes their funds and allows them tooriginate more mortgage loans.
30

• REMICs and Other Structured Securitizations. We issue structured Fannie Mae MBS (includingREMICs), typically for our lender customers or securities dealer customers, in exchange for a transactionfee.
• Dollar Roll Transactions. We engaged in dollar roll activity in 2010, but the transaction volume waslower than in 2009 and 2008 due to lower market demand for short-term financing. A dollar rolltransaction is a commitment to purchase a mortgage-related security with a concurrent agreement to re-sell a substantially similar security at a later date or vice versa.
In 2010, our Capital Markets group substantially increased the amount of loans purchased out of our single-family MBS trusts because, as a result of the adoption of the new accounting standards, the cost of purchasingmost delinquent loans from Fannie Mae MBS trusts and holding them in our portfolio is less than the cost ofadvancing delinquent payments to security holders.
Securitization Activities
Our Capital Markets group is engaged in issuing both single-class and multi-class Fannie Mae MBS throughboth portfolio securitizations and structured securitizations involving third party assets.
• Portfolio securitizations. Our Capital Markets group creates single-class and multi-class Fannie MaeMBS from mortgage-related assets held in our mortgage portfolio. Our Capital Markets group may sellthese Fannie Mae MBS into the secondary market or may retain the Fannie Mae MBS in our investmentportfolio.
• Structured securitizations: Our Capital Markets group creates single-class and multi-class structuredFannie Mae MBS, typically for our lender customers or securities dealer customers, in exchange for atransaction fee. In these transactions, the customer “swaps” a mortgage-related asset that it owns(typically a mortgage security) in exchange for a structured Fannie Mae MBS we issue. Our CapitalMarkets group earns transaction fees for creating structured Fannie Mae MBS for third parties. Theprocess for issuing Fannie Mae MBS in a structured securitization is similar to the process involved in ourlender swap securitizations. For more information about that process and how it differs from portfoliosecuritizations, please see “Mortgage Securitizations—Lender Swaps and Portfolio Securitizations.”
For a description of single-class Fannie Mae MBS, please see “Mortgage Securitizations—Single-Class andMulti-Class Fannie Mae MBS.”
Other Customer Services
Our Capital Markets group provides our lender customers and their affiliates with services that includeoffering to purchase a wide variety of mortgage assets, including non-standard mortgage loan products;segregating customer portfolios to obtain optimal pricing for their mortgage loans; and assisting customerswith hedging their mortgage business. These activities provide a significant flow of assets for our mortgageportfolio, help to create a broader market for our customers and enhance liquidity in the secondary mortgagemarket.
Mortgage Asset Portfolio
Although our Capital Markets group’s business activities are focused on short-term financing and investing,revenue from our Capital Markets group is derived primarily from the difference, or spread, between theinterest we earn on our mortgage and non-mortgage investments and the interest we incur on the debt we issueto fund these assets. Our Capital Markets revenues are primarily derived from our mortgage asset portfolio.Over time, we expect these revenues to decrease as the maximum allowable size of our mortgage assetportfolio decreases by 10% annually under our senior preferred stock purchase agreement with Treasury. See“Conservatorship and Treasury Agreements—Treasury Agreements—Covenants under Treasury Agreements”for more information on the decreasing limits on the amount of mortgage assets we are permitted to hold.
31

We describe the interest rate risk management process employed by our Capital Markets group, including itskey strategies in managing interest rate risk and key metrics used in measuring and evaluating our interest raterisk in “MD&A—Risk Management—Market Risk Management, Including Interest Rate Risk.”
Investment and Financing Activities
Our Capital Markets group seeks to increase the liquidity of the mortgage market by maintaining a presenceas an active investor in mortgage loans and mortgage-related securities and, in particular, supports the liquidityand value of Fannie Mae MBS in a variety of market conditions.
Our Capital Markets group funds its investments primarily through the issuance of a variety of debt securitiesin a wide range of maturities in the domestic and international capital markets. The most active investors inour debt securities include commercial bank portfolios and trust departments, investment fund managers,insurance companies, pension funds, state and local governments, and central banks. The approved dealers forunderwriting various types of Fannie Mae debt securities may differ by funding program. See “MD&A—Liquidity and Capital Management—Liquidity Management” for information on the composition of ouroutstanding debt and a discussion of our liquidity.
Our Capital Markets group’s investment and financing activities are affected by market conditions and thetarget rates of return that we expect to earn on the equity capital underlying our investments. When weestimate that we can earn returns in excess of our targets, we generally will be an active purchaser ofmortgage loans and mortgage-related securities. When potential returns are below our investment targets, wegenerally will be a less active purchaser, and may be a net seller, of mortgage assets. Our investment activitiesalso are subject to contractual limitations, the provisions of the senior preferred stock agreement withTreasury, capital requirements (although our regulator has announced that these are not binding on us duringconservatorship) and other regulatory constraints, to the extent described below under “Conservatorship andTreasury Agreements” and “Our Charter and Regulation of Our Activities.”
CONSERVATORSHIP AND TREASURY AGREEMENTS
Conservatorship
On September 6, 2008, the Director of FHFA appointed FHFA as our conservator, pursuant to its authorityunder the Federal Housing Enterprises Financial Safety and Soundness Act of 1992, as amended by theFederal Housing Finance Regulatory Reform Act of 2008, or 2008 Reform Act (together, the “GSE Act”). Theconservatorship is a statutory process designed to preserve and conserve our assets and property, and put thecompany in a sound and solvent condition.
The conservatorship has no specified termination date and there continues to be uncertainty regarding thefuture of our company, including how long we will continue to be in existence, the extent of our role in themarket, what form we will have, and what ownership interest, if any, our current common and preferredstockholders will hold in us after the conservatorship is terminated. For more information on the risks to ourbusiness relating to the conservatorship and uncertainties regarding the future of our company and business, aswell as the adverse effects of the conservatorship on the rights of holders of our common stock, please see“Risk Factors.”
Management of the Company during Conservatorship
Upon its appointment, the conservator immediately succeeded to (1) all rights, titles, powers and privileges ofFannie Mae, and of any shareholder, officer or director of Fannie Mae with respect to Fannie Mae and itsassets, and (2) title to the books, records and assets of any other legal custodian of Fannie Mae. Theconservator has since delegated specified authorities to our Board of Directors and has delegated tomanagement the authority to conduct our day-to-day operations. The conservator retains the authority towithdraw its delegations at any time.
32

Our directors serve on behalf of the conservator and exercise their authority as directed by and with theapproval, where required, of the conservator. Our directors do not have any duties to any person or entityexcept to the conservator. Accordingly, our directors are not obligated to consider the interests of the company,the holders of our equity or debt securities or the holders of Fannie Mae MBS unless specifically directed todo so by the conservator. In addition, the conservator directed the Board to consult with and obtain theapproval of the conservator before taking action in specified areas, as described in “Directors, ExecutiveOfficers and Corporate Governance—Corporate Governance—Conservatorship and Delegation of Authority toBoard of Directors.”
Because we are in conservatorship, our common shareholders currently do not have the ability to electdirectors or to vote on other matters. The conservator eliminated common and preferred stock dividends (otherthan dividends on the senior preferred stock issued to Treasury) during the conservatorship, and we are nolonger managed with a strategy to maximize shareholder returns. In a letter to Congress dated February 2,2010, the Acting Director of FHFA stated that minimizing our credit losses is our central goal and that we willbe limited to continuing our existing core business activities and taking actions necessary to advance the goalsof the conservatorship. The Acting Director also stated that FHFA does not expect that we will be asubstantial buyer or seller of mortgages for our retained portfolio, except for purchases of delinquentmortgages out of our guaranteed MBS pools. For additional information about our business strategy, please see“Executive Summary—Our Business Objectives and Strategy.”
Powers of the Conservator under the GSE Act
FHFA has broad powers when acting as our conservator. As conservator, FHFA can direct us to enter intocontracts or enter into contracts on our behalf. Further, FHFA may transfer or sell any of our assets orliabilities (subject to limitations and post-transfer notice provisions for transfers of certain types of financialcontracts), without any approval, assignment of rights or consent of any party. The GSE Act provides,however, that mortgage loans and mortgage-related assets that have been transferred to a Fannie Mae MBStrust must be held by the conservator for the beneficial owners of the Fannie Mae MBS and cannot be used tosatisfy the general creditors of the company. As of February 24, 2011, FHFA has not exercised its power totransfer or sell our assets or liabilities.
In addition, FHFA has the power to disaffirm or repudiate most contracts that we entered into prior to itsappointment as conservator, provided that it exercises this power within a “reasonable period” following suchappointment. FHFA’s proposed rule on conservatorship and receivership operations, published on July 9, 2010,defines a “reasonable period” as a period of 18 months following the appointment of a conservator or receiver.This proposed rule has not been finalized. As of February 24, 2011, FHFA has not disaffirmed or repudiatedany contracts we entered into prior to its appointment as conservator.
Neither the conservatorship nor the terms of our agreements with Treasury changes our obligation to makerequired payments on our debt securities or perform under our mortgage guaranty obligations.
Under the GSE Act, FHFA must place us into receivership if the Director of FHFA makes a writtendetermination that our assets are less than our obligations (that is, we have a net worth deficit) or if we havenot been paying our debts, in either case, for a period of 60 days. In addition, the Director of FHFA may placeus in receivership at his discretion at any time for other reasons, including conditions that FHFA has alreadyasserted existed at the time the Director of FHFA placed us into conservatorship. Placement into receivershipwould have a material adverse effect on holders of our common stock, preferred stock, debt securities andFannie Mae MBS. Should we be placed into receivership, different assumptions would be required todetermine the carrying value of our assets, which could lead to substantially different financial results. Formore information on the risks to our business relating to conservatorship and uncertainties regarding the futureof our business, see “Risk Factors.”
Treasury Agreements
On September 7, 2008, we, through FHFA, in its capacity as conservator, and Treasury entered into a seniorpreferred stock purchase agreement, which was subsequently amended on September 26, 2008, May 6, 2009
33

and December 24, 2009. Unless the context indicates otherwise, references in this report to the seniorpreferred stock purchase agreement refer to the agreement as amended through December 24, 2009. The termsof the senior preferred stock purchase agreement, senior preferred stock and the warrant discussed below willcontinue to apply to us even if we are released from the conservatorship. Please see “Risk Factors” for adescription of the risks to our business relating to the Treasury agreements, as well as the adverse effects ofthe senior preferred stock and the warrant on the rights of holders of our common stock and other series ofpreferred stock.
Senior Preferred Stock Purchase Agreement and Related Issuance of Senior Preferred Stock and CommonStock Warrant
Senior Preferred Stock Purchase Agreement
Under the senior preferred stock purchase agreement, we issued to Treasury (a) one million shares of VariableLiquidation Preference Senior Preferred Stock, Series 2008-2, which we refer to as the “senior preferredstock,” and (b) a warrant to purchase, for a nominal price, shares of common stock equal to 79.9% of the totalnumber of shares of our common stock outstanding on a fully diluted basis at the time the warrant isexercised, which we refer to as the “warrant.”
The senior preferred stock and warrant were issued to Treasury as an initial commitment fee in considerationof the commitment from Treasury to provide funds to us under the terms and conditions set forth in the seniorpreferred stock purchase agreement. The senior preferred stock purchase agreement provides that, on aquarterly basis, we generally may draw funds up to the amount, if any, by which our total liabilities exceedour total assets, as reflected on our consolidated balance sheet, prepared in accordance with GAAP, for theapplicable fiscal quarter (referred to as the “deficiency amount”).
On December 24, 2009, the maximum amount of Treasury’s funding commitment to us under the seniorpreferred stock purchase agreement was increased pursuant to an amendment to the agreement. Theamendment provides that the maximum amount under the senior preferred stock purchase agreement willincrease as necessary to accommodate any net worth deficits for calendar quarters in 2010 through 2012. Forany net worth deficits after December 31, 2012, Treasury’s remaining funding commitment will be$124.8 billion, ($200 billion less the $75.2 billion cumulatively drawn through March 31, 2010), less thesmaller of either (a) our positive net worth as of December 31, 2012 or (b) our cumulative draws fromTreasury for the calendar quarters in 2010 through 2012.
In announcing the December 24, 2009 amendments to the senior preferred stock purchase agreement and toTreasury’s preferred stock purchase agreement with Freddie Mac, Treasury noted that the amendments “shouldleave no uncertainty about the Treasury’s commitment to support [Fannie Mae and Freddie Mac] as theycontinue to play a vital role in the housing market during this current crisis.” The senior preferred stockpurchase agreement provides that the deficiency amount will be calculated differently if we become subject toreceivership or other liquidation process. We discuss our net worth deficits and FHFA’s requests on our behalffor funds from Treasury in “Executive Summary—Summary of our Financial Performance for 2010.”
Under the senior preferred stock purchase agreement, beginning on March 31, 2011, we were scheduled tobegin paying a quarterly commitment fee to Treasury. On December 29, 2010, Treasury notified FHFA thatTreasury was waiving the commitment fee for the first quarter of 2011 due to adverse conditions in theU.S. mortgage market and because it believed that imposing the commitment fee would not generate increasedcompensation for taxpayers. Treasury further noted that it would reevaluate matters in the next calendarquarter to determine whether to set the quarterly commitment fee under the senior preferred stock purchaseagreement.
The senior preferred stock purchase agreement provides that the Treasury’s funding commitment willterminate under any of the following circumstances: (1) the completion of our liquidation and fulfillment ofTreasury’s obligations under its funding commitment at that time, (2) the payment in full of, or reasonableprovision for, all of our liabilities (whether or not contingent, including mortgage guaranty obligations), or(3) the funding by Treasury of the maximum amount that may be funded under the agreement. In addition,
34

Treasury may terminate its funding commitment and declare the senior preferred stock purchase agreementnull and void if a court vacates, modifies, amends, conditions, enjoins, stays or otherwise affects theappointment of the conservator or otherwise curtails the conservator’s powers. Treasury may not terminate itsfunding commitment under the agreement solely by reason of our being in conservatorship, receivership orother insolvency proceeding, or due to our financial condition or any adverse change in our financialcondition.
The senior preferred stock purchase agreement provides that most provisions of the agreement may be waivedor amended by mutual written agreement of the parties; however, no waiver or amendment of the agreement ispermitted that would decrease Treasury’s aggregate funding commitment or add conditions to Treasury’sfunding commitment if the waiver or amendment would adversely affect in any material respect the holders ofour debt securities or guaranteed Fannie Mae MBS.
In the event of our default on payments with respect to our debt securities or guaranteed Fannie Mae MBS, ifTreasury fails to perform its obligations under its funding commitment and if we and/or the conservator arenot diligently pursuing remedies in respect of that failure, the holders of our debt securities or Fannie MaeMBS may file a claim in the United States Court of Federal Claims for relief requiring Treasury to fund to usthe lesser of (1) the amount necessary to cure the payment defaults on our debt and Fannie Mae MBS and(2) the lesser of (a) the deficiency amount and (b) the maximum amount that may be funded under theagreement less the aggregate amount of funding previously provided under the commitment. Any payment thatTreasury makes under those circumstances will be treated for all purposes as a draw under the senior preferredstock purchase agreement that will increase the liquidation preference of the senior preferred stock.
Senior Preferred Stock
Pursuant to the senior preferred stock purchase agreement, we issued one million shares of senior preferredstock to Treasury on September 8, 2008 with an aggregate initial liquidation preference of $1.0 billion. Thestock’s liquidation preference is subject to adjustment. Dividends that are not paid in cash for any dividendperiod will accrue and be added to the liquidation preference. In addition, any amounts Treasury pays to uspursuant to its funding commitment under the senior preferred stock purchase agreement and any quarterlycommitment fees that are either not paid in cash to Treasury or not waived by Treasury will be added to theliquidation preference. Accordingly, the aggregate liquidation preference of the senior preferred stock was$88.6 billion as of December 31, 2010 and will increase to $91.2 billion as a result of FHFA’s request on ourbehalf for funds to eliminate our net worth deficit as of December 31, 2010.
Treasury, as holder of the senior preferred stock, is entitled to receive, when, as and if declared by our Boardof Directors, out of legally available funds, cumulative quarterly cash dividends at the annual rate of 10% peryear on the then-current liquidation preference of the senior preferred stock. If at any time we fail to pay cashdividends in a timely manner, then immediately following such failure and for all dividend periods thereafteruntil the dividend period following the date on which we have paid in cash full cumulative dividends(including any unpaid dividends added to the liquidation preference), the dividend rate will be 12% per year.
The senior preferred stock ranks ahead of our common stock and all other outstanding series of our preferredstock, as well as any capital stock we issue in the future, as to both dividends and rights upon liquidation. Thesenior preferred stock provides that we may not, at any time, declare or pay dividends on, make distributionswith respect to, or redeem, purchase or acquire, or make a liquidation payment with respect to, any commonstock or other securities ranking junior to the senior preferred stock unless (1) full cumulative dividends on theoutstanding senior preferred stock (including any unpaid dividends added to the liquidation preference) havebeen declared and paid in cash, and (2) all amounts required to be paid with the net proceeds of any issuanceof capital stock for cash (as described in the following paragraph) have been paid in cash. Shares of the seniorpreferred stock are not convertible. Shares of the senior preferred stock have no general or special votingrights, other than those set forth in the certificate of designation for the senior preferred stock or otherwiserequired by law. The consent of holders of at least two-thirds of all outstanding shares of senior preferredstock is generally required to amend the terms of the senior preferred stock or to create any class or series ofstock that ranks prior to or on parity with the senior preferred stock.
35

We are not permitted to redeem the senior preferred stock prior to the termination of Treasury’s fundingcommitment under the senior preferred stock purchase agreement. Moreover, we are not permitted to paydown the liquidation preference of the outstanding shares of senior preferred stock except to the extent of(1) accrued and unpaid dividends previously added to the liquidation preference and not previously paid down;and (2) quarterly commitment fees previously added to the liquidation preference and not previously paiddown. In addition, if we issue any shares of capital stock for cash while the senior preferred stock isoutstanding, the net proceeds of the issuance must be used to pay down the liquidation preference of thesenior preferred stock; however, the liquidation preference of each share of senior preferred stock may not bepaid down below $1,000 per share prior to the termination of Treasury’s funding commitment. Following thetermination of Treasury’s funding commitment, we may pay down the liquidation preference of all outstandingshares of senior preferred stock at any time, in whole or in part.
Common Stock Warrant
Pursuant to the senior preferred stock purchase agreement, on September 7, 2008, we, through FHFA, in itscapacity as conservator, issued a warrant to purchase common stock to Treasury. The warrant gives Treasurythe right to purchase shares of our common stock equal to 79.9% of the total number of shares of ourcommon stock outstanding on a fully diluted basis on the date of exercise, for an exercise price of $0.00001per share. The warrant may be exercised in whole or in part at any time on or before September 7, 2028.
Covenants under Treasury Agreements
The senior preferred stock purchase agreement and warrant contain covenants that significantly restrict ourbusiness activities and require the prior written consent of Treasury before we can take certain actions. Thesecovenants prohibit us from:
• paying dividends or other distributions on or repurchasing our equity securities (other than the seniorpreferred stock or warrant);
• issuing additional equity securities (except in limited instances);
• selling, transferring, leasing or otherwise disposing of any assets, other than dispositions for fair marketvalue, except in limited circumstances including if the transaction is in the ordinary course of businessand consistent with past practice;
• issuing subordinated debt; and
• entering into any new compensation arrangements or increasing amounts or benefits payable underexisting compensation arrangements for any of our executive officers (as defined by SEC rules) withoutthe consent of the Director of FHFA, in consultation with the Secretary of the Treasury.
In November 2009, Treasury withheld its consent under these covenants to our proposed transfer of LIHTCinvestments. Please see “MD&A—Consolidated Results of Operations—Losses from Partnership Investments”for information on the resulting other-than-temporary impairment losses we recognized during the fourthquarter of 2009.
We also are subject to limits, which are described below, on the amount of mortgage assets that we may ownand the total amount of our indebtedness. As a result, we can no longer obtain additional equity financing(other than pursuant to the senior preferred stock purchase agreement) and we are limited in the amount andtype of debt financing we may obtain.
• Mortgage Asset Limit. We are restricted in the amount of mortgage assets that we may own. Themaximum allowable amount was reduced by $90 billion to $810 billion on December 31, 2010. On eachDecember 31 thereafter, we are required to reduce our mortgage assets to 90% of the maximum allowableamount that we were permitted to own as of December 31 of the immediately preceding calendar year,until the amount of our mortgage assets reaches $250 billion. Accordingly, the maximum allowableamount of mortgage assets we may own on December 31, 2011 is $729 billion. The definition ofmortgage asset is based on the unpaid principal balance of such assets and does not reflect market
36

valuation adjustments, allowance for loan losses, impairments, unamortized premiums and discounts andthe impact of consolidation of variable interest entities. Under this definition, our mortgage assets onDecember 31, 2010 were $788.8 billion. We disclose the amount of our mortgage assets on a monthlybasis under the caption “Gross Mortgage Portfolio” in our Monthly Summaries, which are available onour Web site and announced in a press release.
• Debt Limit. We are subject to a limit on the amount of our indebtedness. Our debt limit in 2010 was$1,080 billion and in 2011 is $972 billion. For every year thereafter, our debt cap will equal 120% of theamount of mortgage assets we are allowed to own on December 31 of the immediately preceding calendaryear. The definition of indebtedness is based on the par value of each applicable loan for purposes of ourdebt cap. Under this definition, our indebtedness as of December 31, 2010 was $793.9 billion. Wedisclose the amount of our indebtedness on a monthly basis under the caption “Total Debt Outstanding”in our Monthly Summaries, which are available on our Web site and announced in a press release.
Under the terms of the senior preferred stock purchase agreement, “mortgage assets” and “indebtedness” arecalculated without giving effect to changes made after May 2009 to the accounting rules governing thetransfer and servicing of financial assets and the extinguishment of liabilities or similar accounting standards.Accordingly, our adoption in 2010 of new accounting policies regarding consolidation and transfers offinancial assets did not affect these calculations.
LEGISLATION AND GSE REFORM
Financial Regulatory Reform Legislation: The Dodd-Frank Act
On July 21, 2010, President Obama signed into law financial regulatory reform legislation known as the Dodd-Frank Wall Street Reform and Consumer Protection Act (the “Dodd-Frank Act”). The Dodd-Frank Act willsignificantly change the regulation of the financial services industry, including by its creation of new standardsrelated to regulatory oversight of systemically important financial companies, derivatives transactions, asset-backed securitization, mortgage underwriting and consumer financial protection. The Dodd-Frank Act willdirectly affect our business because new and additional regulatory oversight and standards will apply to us. Wemay also be affected by provisions of the Dodd-Frank Act and implementing regulations that impact theactivities of our customers and counterparties in the financial services industry. Extensive regulatory guidanceis needed to implement and clarify many of the provisions of the Dodd-Frank Act and regulators have notcompleted the required administrative processes. It is therefore difficult to assess fully the impact of thislegislation on our business and industry at this time. We discuss the potential risks to our business resultingfrom the Dodd-Frank Act in “Risk Factors.” Below we summarize some key provisions of the legislation.
The Dodd-Frank Act established the Financial Stability Oversight Council (the “FSOC”), chaired by theSecretary of the Treasury, to ensure that all financial companies whose failure could pose a threat to thefinancial stability of the United States—not just banks—will be subject to strong oversight. The FSOC hasheld meetings and issued a proposed rule describing the criteria that will inform the FSOC’s designation ofsystemically important nonbank financial companies. Under the proposed rule, the FSOC will make such adesignation if it determines that material financial distress at the nonbank financial company, or the nature,scope, size, scale, concentration, interconnectedness, or mix of the activities of the company, could pose athreat to the financial stability of the United States. FSOC action on the final designation criteria and processis expected later this year. If we are so designated, we may be subject to stricter prudential standards to beestablished by the Federal Reserve, including standards related to risk-based capital, leverage limits, liquidity,credit concentrations, resolution plans, reporting credit exposures and other risk management measures. TheFederal Reserve may also impose other standards related to contingent capital, enhanced public disclosure,short-term debt limits and other requirements as appropriate.
The Dodd-Frank Act requires certain institutions meeting the definition of “swap dealer” or “major swapparticipant” to register with the Commodity Futures Trading Commission (the “CFTC”). The CFTC and SEChave issued a joint proposed rule regarding certain definitions in the Dodd-Frank Act, including the definitionof “major swap participant.” If we are determined to be a major swap participant, minimum capital and
37

margin requirements would apply to our swap transactions, including transactions that are not subject toclearing. Even if we are not deemed to be a major swap participant, the Dodd-Frank Act includes provisionsthat may require us to submit new swap transactions for clearing to a derivatives clearing organization.
The Dodd-Frank Act requires creditors to determine that borrowers have a “reasonable ability to repay”mortgage loans prior to making such loans. The act provides a presumption of compliance for mortgage loansthat meet certain terms and characteristics (so-called “qualified mortgages”); however, the presumption isrebuttable by a borrower bringing a claim. If a creditor fails to comply, a borrower may be able to offsetamounts owed as part of a foreclosure or recoup monetary damages. The new Bureau of Consumer FinancialProtection, created by the Dodd-Frank Act, is responsible for prescribing the criteria that define a qualifiedmortgage.
The Dodd-Frank Act requires financial regulators to jointly prescribe regulations requiring securitizers and/ororiginators to maintain a portion of the credit risk in assets transferred, sold or conveyed through the issuanceof asset-backed securities, with certain exceptions. This risk retention requirement does not appear to apply tous and, in any event, we already retain the credit risk on mortgages we own or guarantee. How thisrequirement will affect our customers and counterparties on loans sold to and guaranteed by us will depend onhow the regulations are implemented.
In accordance with the Dodd-Frank Act’s requirements, the SEC recently adopted a rule requiring securitizersto disclose certain information regarding fulfilled and unfulfilled repurchase requests, to allow investors toidentify asset originators with clear underwriting deficiencies. As adopted, the rule will require us to filequarterly reports on our repurchase activity, with our initial report to cover a three-year period and be filed inFebruary 2012. We anticipate that providing the required disclosure will involve a significant operationalburden.
GSE Reform
The Dodd-Frank Act does not contain substantive GSE reform provisions, but does state that it is the sense ofCongress that efforts to regulate the terms and practices related to residential mortgage credit would beincomplete without enactment of meaningful structural reforms of Fannie Mae and Freddie Mac. The Dodd-Frank Act also required the Treasury Secretary to submit a report to Congress with recommendations forending the conservatorships of Fannie Mae and Freddie Mac.
On February 11, 2011, Treasury and HUD released their report to Congress on reforming America’s housingfinance market. The report provides that the Administration will work with FHFA to determine the best way toresponsibly reduce Fannie Mae’s and Freddie Mac’s role in the market and ultimately wind down bothinstitutions.
The report identifies a number of policy steps that could be used to wind down Freddie Mac and Fannie Mae,reduce the government’s role in housing finance and help bring private capital back to the mortgage market.These steps include (1) increasing guaranty fees, (2) gradually increasing the level of required down paymentso that any mortgages insured by Freddie Mac or Fannie Mae eventually have at least a 10% down payment,(3) reducing conforming loan limits to those established in the 2008 Reform Act, (4) encouraging Freddie Macand Fannie Mae to pursue additional credit loss protection and (5) reducing Freddie Mac and Fannie Mae’sportfolios, consistent with Treasury’s senior preferred stock purchase agreements with the companies.
In addition, the report outlines three potential options for a new long-term structure for the housing financesystem following the wind-down of Fannie Mae and Freddie Mac. The first option would privatize housingfinance almost entirely. The second option would add a government guaranty mechanism that could scale upduring times of crisis. The third option would involve the government offering catastrophic reinsurance behindprivate mortgage guarantors. Each of these options assumes the continued presence of programs operated byFHA, the Department of Agriculture and the VA to assist targeted groups of borrowers. The report does notstate whether or how the existing infrastructure or human capital of Fannie Mae may be used in theestablishment of such a reformed system. The report emphasizes the importance of proceeding with a careful
38

transition plan and providing the necessary financial support to Fannie Mae and Freddie Mac during thetransition period.
A copy of the report can be found on the Housing Finance Reform section of Treasury’s Web site,www.Treasury.gov. We are providing Treasury’s Web site address solely for your information, and informationappearing on Treasury’s Web site is not incorporated into this annual report on Form 10-K.
During 2010, Congress held hearings on the future status of Fannie Mae and Freddie Mac, the CongressionalBudget Office released a study examining various alternatives for the future of the secondary mortgagemarket, and members of Congress offered legislative proposals relating to the future status of the GSEs. Weexpect hearings on GSE reform to continue in 2011 and additional proposals to be discussed, includingproposals that would result in a substantial change to our business structure or that involve Fannie Mae’sliquidation or dissolution. We cannot predict the prospects for the enactment, timing or content of legislativeproposals regarding the future status of the GSEs.
On January 27, 2011, the Financial Crisis Inquiry Commission released its Final Report on the Causes of theFinancial and Economic Crisis in the United States, which consists of a majority report and two dissentingviews. The report addresses, among other things, the roles that the GSEs played in the financial crisis, andmay be considered by policymakers as they assess legislative proposals related to the future status of theGSEs. We cannot predict how the report may impact such deliberations.
In sum, there continues to be uncertainty regarding the future of our company, including how long we willcontinue to be in existence, the extent of our role in the market, what form we will have, and what ownershipinterest, if any, our current common and preferred stockholders will hold in us after the conservatorship isterminated. Please see “Risk Factors” for a discussion of the risks to our business relating to the uncertainfuture of our company.
Energy Loan Tax Assessment Legislation
A number of states have enacted or are considering legislation allowing localities to create energy loanassessment programs for the purpose of financing energy efficient home improvements. These programs aretypically named Property Assessed Clean Energy, or PACE, programs. While the specific terms may vary,these laws generally grant lenders of energy efficient loans the equivalent of a tax lien, giving them priorityover all other liens on the property, including previously recorded first lien mortgage loans.
On July 6, 2010, FHFA announced that it had determined that certain of these programs present significantsafety and soundness concerns that must be addressed by the GSEs. FHFA directed Fannie Mae and FreddieMac to waive the uniform mortgage document prohibitions against senior liens for any homeowner whoobtained a PACE or PACE-like loan with a first priority lien before July 6, 2010 and to undertake actions toprotect the safe and sound operation of the companies as it relates to loans originated under PACE programs.
On August 31, 2010, we released a new directive to our seller-servicers in which we reinforced our long-standing requirement that mortgages sold to us must be and remain in the first-lien position, while alsoproviding guidance on our requirements for refinancing loans that were originated with PACE obligationsbefore July 6, 2010.
During 2010, legislation was introduced in Congress that would require us to adopt standards to support PACEprograms. We and FHFA are also subject to a number of lawsuits relating to PACE programs. We cannotpredict the outcome of the litigation, or the prospects for enactment, timing or content of federal or statelegislative proposals relating to PACE or PACE-like programs.
OUR CHARTER AND REGULATION OF OUR ACTIVITIES
Charter Act
We are a shareholder-owned corporation, originally established in 1938, organized and existing under theFederal National Mortgage Association Charter Act, as amended, which we refer to as the Charter Act or our
39

charter. The Charter Act sets forth the activities that we are permitted to conduct, authorizes us to issue debtand equity securities, and describes our general corporate powers. The Charter Act states that our purposes areto:
• provide stability in the secondary market for residential mortgages;
• respond appropriately to the private capital market;
• provide ongoing assistance to the secondary market for residential mortgages (including activities relatingto mortgages on housing for low- and moderate-income families involving a reasonable economic returnthat may be less than the return earned on other activities) by increasing the liquidity of mortgageinvestments and improving the distribution of investment capital available for residential mortgagefinancing; and
• promote access to mortgage credit throughout the nation (including central cities, rural areas andunderserved areas) by increasing the liquidity of mortgage investments and improving the distribution ofinvestment capital available for residential mortgage financing.
It is from these sections of the Charter Act that we derive our mission of providing liquidity, increasingstability and promoting affordability in the residential mortgage market. In addition to the alignment of ouroverall strategy with these purposes, all of our business activities must be permissible under the Charter Act.Our charter authorizes us to: purchase, service, sell, lend on the security of, and otherwise deal in certainmortgage loans; issue debt obligations and mortgage-related securities; and “do all things as are necessary orincidental to the proper management of [our] affairs and the proper conduct of [our] business.”
Loan Standards
Mortgage loans we purchase or securitize must meet the following standards required by the Charter Act.
• Principal Balance Limitations. Our charter permits us to purchase and securitize mortgage loans securedby either a single-family or multifamily property. Single-family conventional mortgage loans are subjectto maximum original principal balance limits, known as “conforming loan limits.” The conforming loanlimits are established each year based on the average prices of one-family residences.
In 2010, the national conforming loan limit for mortgages that finance one-family residences was$417,000, with higher limits for mortgages secured by two- to four-family residences and in fourstatutorily-designated states and territories (Alaska, Hawaii, Guam and the U.S. Virgin Islands). Higherloan limits also apply in high-cost areas (counties or county-equivalent areas) that are designated byFHFA annually. Our charter sets permanent loan limits for high-cost areas up to 150% of the nationalloan limit ($625,500 for a one-family residence; higher for two- to four-family residences and in the fourstatutorily-designated states and territories). Since early 2008, however, a series of legislative acts haveincreased our loan limits for loans originated during a designated time period in high-cost areas, to up to175% of the national loan limit ($729,750 for a one-family residence; higher for two- to four-familyresidences and in the four statutorily-designated states and territories). These loan limits are currently ineffect for mortgages originated through September 30, 2011.
No statutory limits apply to the maximum original principal balance of multifamily mortgage loans thatwe purchase or securitize. In addition, the Charter Act imposes no maximum original principal balancelimits on loans we purchase or securitize that are insured by FHA or guaranteed by the VA.
• Loan-to-Value and Credit Enhancement Requirements. The Charter Act generally requires creditenhancement on any conventional single-family mortgage loan that we purchase or securitize if it has aloan-to-value ratio over 80% at the time of purchase. We also do not purchase or securitize second liensingle-family mortgage loans when the combined loan-to-value ratio exceeds 80%, unless the second lienmortgage loan has credit enhancement in accordance with the requirements of the Charter Act. The creditenhancement required by our charter may take the form of one or more of the following: (1) insurance ora guaranty by a qualified insurer of the over-80% portion of the unpaid principal balance of the mortgage;(2) a seller’s agreement to repurchase or replace the mortgage in the event of default (for such period and
40

under such circumstances as we may require); or (3) retention by the seller of at least a 10% participationinterest in the mortgage. Regardless of loan-to-value ratio, the Charter Act does not require us to obtaincredit enhancement to purchase or securitize loans insured by FHA or guaranteed by the VA.
Authority of U.S. Treasury to Purchase GSE Securities
Pursuant to our charter, at the discretion of the Secretary of the Treasury, Treasury may purchase ourobligations up to a maximum of $2.25 billion outstanding at any one time. While the 2008 Reform Act gaveTreasury expanded temporary authority to purchase our obligations and other securities in unlimited amounts(up to the national debt limit), this authority expired on December 31, 2009. We describe Treasury’sinvestment in our senior preferred stock and a common stock warrant pursuant to this expanded temporaryauthority under “Conservatorship and Treasury Agreements—Treasury Agreements.”
Other Charter Act Provisions
The Charter Act has the following additional provisions.
• Issuances of Our Securities. We are authorized, upon the approval of the Secretary of the Treasury, toissue debt obligations and mortgage-related securities. Neither the U.S. government nor any of itsagencies guarantees, directly or indirectly, our debt or mortgage-related securities.
• Exemptions for Our Securities. The Charter Act generally provides that our securities are exempt underthe federal securities laws administered by the SEC. As a result, we are not required to file registrationstatements with the SEC under the Securities Act of 1933 with respect to offerings of any of oursecurities. Our non-equity securities are also exempt securities under the Securities Exchange Act of 1934(the “Exchange Act”). However, our equity securities are not treated as exempted securities for purposesof Sections 12, 13, 14 or 16 of the Exchange Act. Consequently, we are required to file periodic andcurrent reports with the SEC, including annual reports on Form 10-K, quarterly reports on Form 10-Q andcurrent reports on Form 8-K.
• Exemption from Specified Taxes. We are exempt from taxation by states, territories, counties,municipalities and local taxing authorities, except for taxation by those authorities on our real property.We are not exempt from the payment of federal corporate income taxes.
• Other Limitations and Requirements. We may not originate mortgage loans or advance funds to amortgage seller on an interim basis, using mortgage loans as collateral, pending the sale of the mortgagesin the secondary market. In addition, we may only purchase or securitize mortgages on properties locatedin the United States and its territories.
Regulation and Oversight of Our Activities
As a federally chartered corporation, we are subject to government regulation and oversight. FHFA is anindependent agency of the federal government with general supervisory and regulatory authority over FannieMae, Freddie Mac and the 12 Federal Home Loan Banks. FHFA was established in July 2008, assuming theduties of our former safety and soundness regulator, the Office of Federal Housing Enterprise Oversight(“OFHEO”), and our former mission regulator, HUD. HUD remains our regulator with respect to fair lendingmatters. Our regulators also include the SEC and Treasury.
The GSE Act provides FHFA with safety and soundness authority that is comparable to and in some respectsbroader than that of the federal banking agencies. Even if we were not in conservatorship, the GSE Act givesFHFA the authority to raise capital levels above statutory minimum levels, regulate the size and content of ourportfolio and approve new mortgage products, among other things.
FHFA is responsible for implementing the various provisions of the GSE Act. In general, we remain subject toexisting regulations, orders and determinations until new ones are issued or made.
Capital. The GSE Act provides FHFA with broad authority to increase the level of our required minimumcapital and to establish capital or reserve requirements for specific products and activities. FHFA also has
41

broad authority to establish risk-based capital requirements, to ensure that we operate in a safe and soundmanner and maintain sufficient capital and reserves. During the conservatorship, FHFA has suspended ourcapital classifications. We continue to submit capital reports to FHFA during the conservatorship, and FHFAcontinues to monitor our capital levels. We describe our capital requirements below under “Capital AdequacyRequirements.”
Portfolio. The GSE Act requires FHFA to establish standards governing our portfolio holdings, to ensure thatthey are backed by sufficient capital and consistent with our mission and safe and sound operations. FHFA isalso required to monitor our portfolio and, in some circumstances, may require us to dispose of or acquireassets. On December 28, 2010, FHFA published a final rule adopting, as the standard for our portfolioholdings, the portfolio limits specified in the senior preferred stock purchase agreement described under“Treasury Agreements—Covenants under Treasury Agreements,” as it may be amended from time to time.The rule is effective for as long as we remain subject to the terms and obligations of the senior preferred stockpurchase agreement.
New Products. The GSE Act requires us to obtain FHFA’s approval before initially offering any product,subject to certain exceptions. The GSE Act also requires us to provide FHFA with written notice beforecommencing any new activity. On July 2, 2009, FHFA published an interim final rule implementing theseprovisions of the GSE Act. Subsequently, the Acting Director of FHFA concluded that permitting us to offernew products at this time is inconsistent with the goals of the conservatorship. He therefore instructed us notto submit requests for approval of new products under the interim final rule. We cannot predict when or ifFHFA will permit us to submit new product requests under the rule.
Receivership. Under the GSE Act, FHFA must place us into receivership if it determines that our assets areless than our obligations for 60 days, or we have not been paying our debts as they become due for 60 days.FHFA has notified us that the measurement period for any mandatory receivership determination with respectto our assets and liabilities would commence no earlier than the SEC public filing deadline for our quarterlyor annual financial statements and would continue for 60 calendar days thereafter. FHFA has advised us thatif, during that 60-day period, we receive funds from Treasury in an amount at least equal to the deficiencyamount under the senior preferred stock purchase agreement, the Director of FHFA will not make a mandatoryreceivership determination.
In addition, we could be put into receivership at the discretion of the Director of FHFA at any time for otherreasons, including conditions that FHFA has already asserted existed at the time the then-Director of FHFAplaced us into conservatorship. The statutory grounds for discretionary appointment of a receiver include: asubstantial dissipation of assets or earnings due to unsafe or unsound practices; the existence of an unsafe orunsound condition to transact business; an inability to meet our obligations in the ordinary course of business;a weakening of our condition due to unsafe or unsound practices or conditions; critical undercapitalization; thelikelihood of losses that will deplete substantially all of our capital; or by consent.
On July 9, 2010, FHFA published a proposed rule to establish a framework for conservatorship andreceivership operations for the GSEs. The proposed rule would, among other things, clarify that: (1) all claimsarising from an equity interest in a regulated entity in receivership would be given the same treatment as theinterests of shareholders; and (2) claims by shareholders would receive the lowest priority in a receivership,behind administrative expenses of the receiver, general liabilities of the regulated entity and liabilitiessubordinated to those of general creditors. The proposed rule would also provide that payment of certainsecurities litigation claims would be held in abeyance during conservatorship, except as otherwise ordered byFHFA. The proposed rule is part of FHFA’s implementation of the powers provided by the 2008 Reform Act,and does not seek to anticipate or predict future conservatorships or receiverships. In announcing thepublication of this proposed rule for comment, the Acting Director of FHFA said it had “no impact” oncurrent conservatorship operations. This rule has not been finalized.
Prudential Management and Operational Standards. The GSE Act requires FHFA to establish prudentialstandards for a broad range of our operations. These standards must address internal controls, independenceand adequacy of internal audit systems, management of interest rate risk exposure, management of marketrisk, adequacy and maintenance of liquidity and reserves, management of asset and investment portfolio
42

growth, investments and asset acquisitions, overall risk management processes, management of credit andcounterparty risk and recordkeeping. FHFA may also establish any additional operational and managementstandards the Director of FHFA deems appropriate.
Affordable Housing Goals and Duty to Serve. We discuss our affordable housing goals and our duty to serveunderserved markets below under “Housing Goals and Duty to Serve Underserved Markets.”
Affordable Housing Allocations. The GSE Act requires us to set aside in each fiscal year an amount equal to4.2 basis points for each dollar of the unpaid principal balance of our total new business acquisitions, and toallocate such amount to certain government funds. The GSE Act also allows FHFA to suspend allocations on atemporary basis. In November 2008, FHFA advised us that it was suspending our allocations until furthernotice.
Executive Compensation. The GSE Act directs FHFA to prohibit us from providing unreasonable or non-comparable compensation to our executive officers. FHFA may at any time review the reasonableness andcomparability of an executive officer’s compensation and may require us to withhold any payment to theofficer during such review. FHFA is also authorized to prohibit or limit certain golden parachute andindemnification payments to directors, officers and certain other parties. FHFA has issued rules relating togolden parachute payments, setting forth factors to be considered by the Director of FHFA in acting upon hisauthority to limit such payments.
Fair Lending. The GSE Act requires the Secretary of HUD to assure that the GSEs meet their fair lendingobligations. Among other things, HUD is required to periodically review and comment on the underwritingand appraisal guidelines of each company to ensure consistency with the Fair Housing Act. HUD is currentlyconducting such a review.
Capital Adequacy Requirements
The GSE Act establishes capital adequacy requirements. The statutory capital framework incorporates twodifferent quantitative assessments of capital—a minimum capital requirement and a risk-based capitalrequirement. The minimum capital requirement is ratio-based, while the risk-based capital requirement isbased on simulated stress test performance. The GSE Act requires us to maintain sufficient capital to meetboth of these requirements in order to be classified as “adequately capitalized.” However, during theconservatorship, FHFA has suspended capital classification of us and announced that our existing statutory andFHFA-directed regulatory capital requirements will not be binding. FHFA has advised us that, because we areunder conservatorship, we will not be subject to corrective action requirements that would ordinarily resultfrom our receiving a capital classification of “undercapitalized.”
Minimum Capital Requirement. Under the GSE Act, we must maintain an amount of core capital that equalsor exceeds our minimum capital requirement. The GSE Act defines core capital as the sum of the stated valueof outstanding common stock (common stock less treasury stock), the stated value of outstanding non-cumulative perpetual preferred stock, paid-in capital, and retained earnings, as determined in accordance withGAAP. Our minimum capital requirement is generally equal to the sum of 2.50% of on-balance sheet assetsand 0.45% of off-balance sheet obligations.
Effective January 1, 2010, we adopted new accounting standards that resulted in our recording on ourconsolidated balance sheet substantially all of the loans backing our Fannie Mae MBS. However, FHFA hasdirected us, for purposes of minimum capital, to continue reporting loans backing Fannie Mae MBS held bythird parties based on 0.45% of the unpaid principal balance. FHFA retains authority under the GSE Act toraise the minimum capital requirement for any of our assets or activities.
Risk-Based Capital Requirement. The GSE Act requires FHFA to establish risk-based capital requirementsfor Fannie Mae and Freddie Mac, to ensure that we operate in a safe and sound manner. Existing risk-basedcapital regulation ties our capital requirements to the risk in our book of business, as measured by a stress testmodel. The stress test simulates our financial performance over a ten-year period of severe economicconditions characterized by both extreme interest rate movements and high mortgage default rates. FHFA hasstated that it does not intend to publish our risk-based capital level during the conservatorship and has
43

discontinued stress test simulations under the existing rule. We continue to submit detailed profiles of ourbooks of business to FHFA to support FHFA’s monitoring of our business activity and their research intofuture risk-based capital rules.
Critical Capital Requirement. The GSE Act also establishes a critical capital requirement, which is theamount of core capital below which we would be classified as “critically undercapitalized.” Under the GSEAct, such classification is a discretionary ground for appointing a conservator or receiver. Our critical capitalrequirement is generally equal to the sum of 1.25% of on-balance sheet assets and 0.25% of off-balance sheetobligations. FHFA has directed us, for purposes of critical capital, to continue reporting loans backing FannieMae MBS held by third parties based on 0.25% of the unpaid principal balance, notwithstanding ourconsolidation of substantially all of the loans backing these securities. FHFA has stated that it does not intendto publish our critical capital level during the conservatorship.
Bank Capital Requirements. In the wake of the financial crisis and as a result of the Dodd-Frank Act and ofactions by international bank regulators, the capital regime for the banking industry is undergoing majorchanges. The Basel Committee on Banking Supervision finalized a set of revisions (known as Basel III) to theinternational capital requirements in December 2010. Basel III generally narrows the definition of capital thatcan be used to meet risk-based standards and raises the amount of capital that must be held. U.S. bankregulators are expected to issue detailed implementing regulations for U.S. banks in the coming months.
Although the GSEs are not currently subject to bank capital requirements, any revised framework for GSEcapital standards may be based on bank requirements, particularly if the GSEs are deemed to be systemicallyimportant financial companies subject to Federal Reserve oversight.
Housing Goals and Duty to Serve Underserved Markets
Since 1993, we have been subject to housing goals. For 2010, the structure of our housing goals changed as aresult of the 2008 Reform Act. The 2008 Reform Act also created a new duty for us to serve threeunderserved markets, which we discuss below.
Housing Goals
FHFA published a final rule establishing our 2010 and 2011 housing goals on September 14, 2010. FHFA’sfinal rule and subsequent notices dated October 29, 2010 and January 28, 2011 established the followingsingle-family home purchase and refinance housing goal benchmarks for 2010 and 2011. A home purchasemortgage may be counted toward more than one home purchase benchmark.
• Low-Income Families Home Purchase Benchmark: At least 27% of our acquisitions of single-familyowner-occupied mortgage loans financing home purchases must be affordable to low-income families(defined as families with income no higher than 80% of area median income).
• Very Low-Income Families Home Purchase Benchmark: At least 8% of our acquisitions of single-familyowner-occupied mortgage loans financing home purchases must be affordable to very low-income families(defined as families with income no higher than 50% of area median income).
• Low-Income Areas Home Purchase Benchmarks: At least 24% of our acquisitions of single-family owner-occupied mortgage loans financing home purchases must be for families in low-income census tracts, formoderate-income families (defined as families with income no higher than 100% of area median income) indesignated disaster areas or for moderate-income families in minority census tracts. In addition, at least 13%of our acquisitions of single-family owner-occupied purchase money mortgage loans must be for families inlow-income census tracts or for moderate-income families in minority census tracts.
• Low-Income Families Refinancing Benchmark: At least 21% of our acquisitions of single-family owner-occupied refinance mortgage loans must be affordable to low-income families, which may includequalifying permanent modifications of mortgages under HAMP completed during the year.
If we do not meet these benchmarks, we may still meet our goals. The final rule specifies that our single-family housing goals performance will be measured against these benchmarks and against goals-qualifying
44
originations in the primary mortgage market. We will be in compliance with the housing goals if we meeteither the benchmarks or market share measures.
The final rule also established a new multifamily goal and subgoal. For each of 2010 and 2011, ourmultifamily mortgage acquisitions must finance at least 177,750 units affordable to low-income families, andat least 42,750 units affordable to very low-income families. There is no market-based alternativemeasurement for the multifamily goals.
FHFA’s final rule made significant changes to prior housing goals regulations regarding the types of productsthat count towards the housing goals. Private-label mortgage-related securities, second liens and single-familygovernment loans do not count towards the housing goals. In addition, only permanent modifications ofmortgages under HAMP completed during the year will count towards the housing goals; trial modificationswill not be counted. Moreover, these modifications will count only towards the single-family low-incomefamilies refinance goal, not any of the home purchase goals.
The final rule notes that “FHFA does not intend for [Fannie Mae] to undertake uneconomic or high-riskactivities in support of the [housing] goals. However, the fact that [Fannie Mae is] in conservatorship shouldnot be a justification for withdrawing support from these market segments.” If our efforts to meet our goalsprove to be insufficient, FHFA will determine whether the goals were feasible. If FHFA finds that our goalswere feasible, we may become subject to a housing plan that could require us to take additional steps thatcould have an adverse effect on our results of operations and financial condition. The housing plan mustdescribe the actions we would take to meet the goal in the next calendar year and be approved by FHFA. Thepotential penalties for failure to comply with housing plan requirements include a cease-and-desist order andcivil money penalties. See “Risk Factors” for a description of how we may be unable to meet our housinggoals and how actions we may take to meet these goals and other regulatory requirements could adverselyaffect our business, results of operations and financial condition.
The following table presents our performance against our 2010 single-family housing benchmarks andmultifamily housing goals. These performance results have not yet been validated by FHFA.
2010 Housing Goals PerformanceResult(1) Benchmark(2)
Single-family housing goals:(3)
Low-income families home purchases . . . . . . . . . . . . . . . . . . . . . . . . . . . . . . . . . . . . . . . . 25.1% 27.0%
Very low-income families home purchases . . . . . . . . . . . . . . . . . . . . . . . . . . . . . . . . . . . . . 7.2 8.0
Low-income areas home purchases . . . . . . . . . . . . . . . . . . . . . . . . . . . . . . . . . . . . . . . . . . 24.0 24.0
Low-income and high-minority areas home purchases . . . . . . . . . . . . . . . . . . . . . . . . . . . . . 12.4 13.0
Low-income families refinancing . . . . . . . . . . . . . . . . . . . . . . . . . . . . . . . . . . . . . . . . . . . 20.9 21.0
Result(1) Goal
Multifamily housing goals:
Affordable to families with incomes no higher than 80% of area median income . . . . . 212,768 units 177,750 units
Affordable to families with incomes no higher than 50% of area median income . . . . . 53,184 units 42,750 units
(1) Our 2010 results have not been validated by FHFA, and after validation they may differ from the results reportedabove.
(2) Even if our results do not meet the benchmarks, we may still meet our goals. The final rule specifies that our single-family housing goals performance will be measured not only against these benchmarks, but also against the share ofgoals-qualifying originations in the primary mortgage market. We will be in compliance with the housing goals if wemeet either the benchmarks or market share measures. The amount of goals-qualifying originations in the marketduring 2010 will not be available until the release of data reported by primary market originators under the HomeMortgage Disclosure Act in the fall of 2011.
(3) Our single-family results and benchmarks are expressed as a percentage of the total number of eligible mortgagesacquired during the period.
45

We believe we met our single-family low-income areas home purchase benchmark for 2010, as well as our2010 multifamily goals. To determine whether we met our other 2010 single-family goals, we and FHFA willhave to compare our performance with that of the market after the release of data reported by primary marketoriginators under the Home Mortgage Disclosure Act in the fall of 2011, because we believe we did not meetthe benchmarks for these goals. As noted in FHFA’s final rule establishing our 2010 housing goals, FHFA hasindicated that we should not undertake uneconomic or high-risk activities in support of our housing goals.
We will file our assessment of our performance with FHFA in mid-March. FHFA will then determine our finalperformance numbers and whether we met our goals.
Duty to Serve
The 2008 Reform Act created the duty to serve underserved markets in order for us and Freddie Mac to“provide leadership to the market in developing loan products and flexible underwriting guidelines to facilitatea secondary market for very low-, low-, and moderate-income families” with respect to three underservedmarkets: manufactured housing, affordable housing preservation, and rural areas.
The duty to serve is a new oversight responsibility for FHFA. The Director of FHFA is required to establishby regulation a method for evaluating and rating the performance by us and Freddie Mac of the duty to serveunderserved markets. On June 7, 2010, FHFA published its proposed rule to implement this new duty,although the final rule has not been issued.
Under the proposed rule, we would be required to submit an underserved markets plan at least 90 days beforethe plan’s effective date of January 1st of a particular year establishing benchmarks and objectives againstwhich FHFA would evaluate and rate our performance. The plan term is two years. We will likely need tosubmit a plan as soon as practicable after the publication of the final rule that will be effective for the firstplan period.
The 2008 Reform Act requires FHFA to separately evaluate the following four assessment factors:
• The loan product assessment factor requires evaluation of our “development of loan products, moreflexible underwriting guidelines, and other innovative approaches to providing financing to each”underserved market.
• The outreach assessment factor requires evaluation of “the extent of outreach to qualified loan sellers andother market participants.” We are expected to engage market participants and pursue relationships withqualified sellers that serve each underserved market.
• The loan purchase assessment factor requires FHFA to consider the volume of loans acquired in eachunderserved market relative to the market opportunities available to us. The 2008 Reform Act prohibitsthe establishment of specific quantitative targets by FHFA. However, in its evaluation FHFA couldconsider the volume of loans acquired in past years.
• The investment and grants assessment factor requires evaluation of the amount of investment and grants inprojects that assist in meeting the needs of underserved markets.
Under the proposed rule, FHFA would give the loan purchase and outreach assessment factors significantweight. Because we are in conservatorship, the investment and grants assessment factor would receive little orno weight. In addition, FHFA would consider the loan product assessment factor, even though we are currentlyprohibited from entering into new lines of business and developing new products. The proposed rule states thatacquisitions and activities pursuant to the duty to serve should be profitable, even if less profitable than otheractivities.
FHFA would evaluate our performance on each assessment factor annually, and assign a rating of“satisfactory” or “unsatisfactory” to each factor in each underserved market. The evaluation would be basedon whether we have substantially met our benchmarks and objectives as outlined in our underserved marketsplan. FHFA would also consider the impact of overall market conditions and other factors outside our controlthat could impact our ability to meet our benchmarks and objectives. Based on the assessment factor findings,
46

FHFA would assign a rating of “in compliance” or “noncompliance” with the duty to serve each underservedmarket.
With some exceptions, the counting rules and other requirements would be similar to those established for thehousing goals. For the loan purchase assessment factor, FHFA proposes to measure performance in terms ofunits rather than mortgages or unpaid principal balance. All single-family loans we acquire must meet thestandards in the Interagency Statement on Subprime Mortgage Lending and the Interagency Guidance onNontraditional Mortgage Product Risks. We are expected to review the operations of loan sellers to ensurecompliance with these standards.
If we fail to comply with, or there is a substantial probability that we will not comply with, our duty to servea particular underserved market in a given year, FHFA would determine whether the benchmarks andobjectives in our underserved markets plan are or were feasible. If we fail to meet our duty to serve, andFHFA determines that the benchmarks and objectives in our underserved markets plan are or were feasible,then, in the Director’s discretion, we may be required to submit a housing plan. Under the proposed rule, thehousing plan must describe the activities that we will take to comply with the duty to serve a particularunderserved market for the next calendar year, or improvements and changes in operations that we will makeduring the remainder of the current year.
Under the proposed rule, we would be required to provide quarterly and annual reports on our performanceand progress towards meeting our duty to serve.
See “Risk Factors” for a description of how changes we may make in our business strategies in order to meetour housing goals and duty to serve requirement may increase our credit losses and adversely affect our resultsof operations.
MAKING HOME AFFORDABLE PROGRAM
The Obama Administration’s Making Home Affordable Program, which was introduced in February 2009, isintended to provide assistance to homeowners and prevent foreclosures. Working with our conservator, wehave devoted significant effort and resources to help distressed homeowners through initiatives that support theMaking Home Affordable Program. Below we describe key aspects of the Making Home Affordable Programand our role in the program. For additional information about our activities under the program, please see“Business—Making Home Affordable Program” in our Annual Report on Form 10-K for the year endedDecember 31, 2009. For information about the program’s financial impact on us, please see “MD&A—Consolidated Results of Operations—Financial Impact of the Making Home Affordable Program on FannieMae.”
The Making Home Affordable Program is comprised primarily of a Home Affordable Refinance Program(“HARP”), under which we acquire or guarantee loans that are refinancings of mortgage loans we own orguarantee, and Freddie Mac does the same, and a Home Affordable Modification Program (“HAMP”), whichprovides for the modification of mortgage loans owned or guaranteed by us or Freddie Mac, as well as othermortgage loans. These two programs were designed to expand the number of borrowers who can refinance ormodify their mortgages to achieve a monthly payment that is more affordable now and into the future or toobtain a more stable loan product, such as a fixed-rate mortgage loan in lieu of an adjustable-rate mortgageloan. We participate in the Making Home Affordable Program, and our sellers and servicers offer HARP andHAMP to Fannie Mae borrowers. We also serve as Treasury’s program administrator for HAMP and otherinitiatives under the Making Home Affordable Program.
Our Role as Program Administrator
Treasury has engaged us to serve as program administrator for HAMP and other initiatives under the MakingHome Affordable Program. Our principal activities as program administrator include the following:
• Implementing the guidelines and policies of the Treasury program;
• Preparing the requisite forms, tools and training to facilitate efficient loan modifications by servicers;
47

• Creating, making available and managing the process for servicers to report modification activity andprogram performance;
• Calculating incentive compensation consistent with program guidelines;
• Acting as record-keeper for executed loan modifications and program administration;
• Coordinating with Treasury and other parties toward achievement of the program’s goals, includingassisting with development and implementation of updates to the program and initiatives expanding theprogram’s reach; and
• Performing other tasks as directed by Treasury from time to time.
In our capacity as program administrator for the program, we support over 100 servicers that have signed upto participate with respect to non-agency loans under the program. To help servicers implement the program,we have provided information and resources through a Web site dedicated to servicers under the program. Wehave also communicated information about the program to servicers and helped servicers implement andintegrate the program with new systems and processes. As program administrator, we have taken the followingsteps to help servicers implement the program:
• dedicated Fannie Mae personnel to work closely with participating servicers;
• established a servicer support call center;
• conducted ongoing conference calls with the leadership of participating servicers;
• provided training through live Web seminars and recorded tutorials; and
• made checklists and job aids available on the program Web site.
OUR CUSTOMERS
Our principal customers are lenders that operate within the primary mortgage market where mortgage loansare originated and funds are loaned to borrowers. Our customers include mortgage banking companies, savingsand loan associations, savings banks, commercial banks, credit unions, community banks, insurancecompanies, and state and local housing finance agencies. Lenders originating mortgages in the primarymortgage market often sell them in the secondary mortgage market in the form of whole loans or in the formof mortgage-related securities.
During 2010, approximately 1,100 lenders delivered single-family mortgage loans to us, either forsecuritization or for purchase. We acquire a significant portion of our single-family mortgage loans fromseveral large mortgage lenders. During both 2010 and 2009, our top five lender customers, in the aggregate,accounted for approximately 62% of our single-family business volume. Three lender customers, WellsFargo & Company, Bank of America Corporation, and JPMorgan Chase & Co., including their respectiveaffiliates, in the aggregate accounted for more than 52% of our single-family business volume for 2010.
Due to ongoing consolidation within the mortgage industry, as well as the number of mortgage lenders thathave gone out of business since late 2006, we, as well as our competitors, seek business from a decreasingnumber of large mortgage lenders. To the extent we become more reliant on a smaller number of lendercustomers, our negotiating leverage with these customers decreases, which could diminish our ability to priceour products and services optimally. In addition, many of our lender customers are experiencing financial andliquidity problems that may affect the volume of business they are able to generate. We discuss these andother risks that this customer concentration poses to our business in “Risk Factors.”
COMPETITION
Historically, our competitors have included Freddie Mac, FHA, Ginnie Mae (which primarily guaranteessecurities backed by FHA-insured loans), the 12 Federal Home Loan Banks (“FHLBs”), financial institutions,
48

securities dealers, insurance companies, pension funds, investment funds and other investors. During 2008,almost all of our competitors, other than Freddie Mac, FHA, Ginnie Mae and the FHLBs, ceased theiractivities in the residential mortgage finance business, and we remained the largest single issuer of mortgage-related securities in the secondary market in 2010.
We compete to acquire mortgage assets in the secondary market both for securitization into Fannie Mae MBSand, to a significantly lesser extent, for our investment portfolio. We also compete for the issuance ofmortgage-related securities to investors. Competition in these areas is affected by many factors, including theamount of residential mortgage loans offered for sale in the secondary market by loan originators and othermarket participants, the nature of the residential mortgage loans offered for sale (for example, whether theloans represent refinancings), the current demand for mortgage assets from mortgage investors, the interestrate risk investors are willing to assume and the yields they will require as a result, and the credit risk andprices associated with available mortgage investments.
Competition to acquire mortgage assets is significantly affected by pricing and eligibility standards. Changesin our pricing and eligibility standards and in the eligibility standards of the mortgage insurance companies in2008 and 2009 have reduced our acquisition of loans with higher LTV ratios and other high-risk features. Inaddition, FHA has become the lower-cost option, or in some cases the only option, for loans with higher LTVratios.
During 2010, our primary competitors for the issuance of mortgage-related securities were Ginnie Mae andFreddie Mac. Prior to the severe market downturn, there was a significant increase in the issuance ofmortgage-related securities by non-agency issuers, which caused a decrease in our share of the market for newissuances of single-family mortgage-related securities from 2003 to 2006. Non-agency issuers, also referred toas private-label issuers, are those issuers of mortgage-related securities other than agency issuers Fannie Mae,Freddie Mac and Ginnie Mae. The subsequent mortgage and credit market disruption led to a significantdecline in the issuance of private-label mortgage-related securities. Accordingly, our market share significantlyincreased during 2008 and has remained high since then. Our estimated market share of new single-familymortgage-related securities issuances was 44.0% in 2010, compared with 46.3% in 2009, 45.4% in 2008, and33.9% in 2007. Our estimated market share of 46.3% in 2009 includes $94.6 billion of whole loans held forinvestment in our mortgage portfolio that were securitized into Fannie Mae MBS in the second quarter, butretained in our mortgage portfolio and consolidated on our consolidated balance sheets. Excluding theseFannie Mae MBS from the estimate of our market share, our estimated 2009 market share of new single-family mortgage-related securities issuances was 43.2%.
We also compete for low-cost debt funding with institutions that hold mortgage portfolios, including FreddieMac and the FHLBs.
Although we do not know the structure that long-term GSE reform will ultimately take, we expect that, if ourcompany continues, we will face more competition in the future. Please see “Business—Legislation and GSEReform” for a discussion of proposals for GSE reform, as well as recent legislative reform of the financialservices industry that could affect our business.
EMPLOYEES
As of January 31, 2011, we employed approximately 7,300 personnel, including full-time and part-timeemployees, term employees and employees on leave.
WHERE YOU CAN FIND ADDITIONAL INFORMATION
We make available free of charge through our Web site our annual reports on Form 10-K, quarterly reports onForm 10-Q, current reports on Form 8-K and all other SEC reports and amendments to those reports as soonas reasonably practicable after we electronically file the material with, or furnish it to, the SEC. Our Web siteaddress is www.fanniemae.com. Materials that we file with the SEC are also available from the SEC’s Website, www.sec.gov. You may also request copies of any filing from us, at no cost, by calling the Fannie Mae
49

Fixed-Income Securities Helpline at (800) 237-8627 or (202) 752-7115 or by writing to Fannie Mae,Attention: Fixed-Income Securities, 3900 Wisconsin Avenue, NW, Area 2H-3S, Washington, DC 20016.
We are providing our Web site addresses and the Web site address of the SEC solely for your information.Information appearing on our Web site or on the SEC’s Web site is not incorporated into this annual report onForm 10-K.
FORWARD-LOOKING STATEMENTS
This report includes statements that constitute forward-looking statements within the meaning of Section 21Eof the Exchange Act. In addition, our senior management may from time to time make forward-lookingstatements orally to analysts, investors, the news media and others. Forward-looking statements often includewords such as “expect,” “anticipate,” “intend,” “plan,” “believe,” “seek,” “estimate,” “forecast,” “project,”“would,” “should,” “could,” “may,” “prospects,” or similar words.
Among the forward-looking statements in this report are statements relating to:
• Our expectation that mortgage interest rates will increase in 2011, which will likely reduce the share ofrefinance loans;
• The size of the declines nationwide in total single-family originations and mortgage debt outstanding thatwe expect in 2011;
• Our expectation that the unemployment rate will decline modestly throughout 2011;
• Our expectations that our multifamily nonperforming assets will increase in certain geographic areas andthat we may continue to experience an increase in delinquencies and credit losses despite improvingmarket fundamentals;
• Our expectation that the multifamily sector will continue to improve modestly in 2011, even thoughunemployment levels remain elevated;
• Our expectation that we will not earn profits in excess of our annual dividend obligation to Treasury forthe indefinite future;
• Our expectation that, if FHA continues to be the lower-cost option for some consumers, and in somecases the only option, for loans with higher LTV ratios, our market share could be adversely impacted ifthe market shifts away from refinance activity;
• Our expectation that the single-family loans we have acquired since 2009 will be profitable;
• Our estimate that, while single-family loans that we acquired from 2005 through 2008 will give rise toadditional credit losses that we have not yet realized, we have reserved for the substantial majority of theremaining losses;
• Our expectation that our draws from Treasury for credit losses will abate and our draws will increasinglybe driven by dividend payments;
• Our belief that loans we have acquired since 2009 would become unprofitable if home prices declined bymore than 20% from their December 2010 levels over the next five years based on our home price index;
• Our expectations regarding whether loans we acquired in specific years prior to 2009 will be profitable orunprofitable;
• Our expectation that defaults on loans we acquired from 2005 through 2008 and the resulting charge-offswill occur over a period of years;
• Our expectation that it will take years before our REO inventory approaches pre-2008 levels;
• Our expectation that the number of our repurchase requests to seller/servicers will remain high in 2011;
50

• Our expectation that we will realize as credit losses an estimated two-thirds of the fair value losses onloans purchased out of MBS trusts that are reflected in our consolidated balance sheets, and recover theremaining third through our consolidated statements of operations;
• Our belief that continued federal government support of our business and the financial markets, as well asour status as a GSE, are essential to maintaining our access to debt funding;
• Our expectation that weakness in the housing and mortgage markets will continue in 2011;
• Our expectation that home sales are unlikely to increase until the unemployment rate improves;
• Our expectation that single-family default and severity rates and the level of single-family foreclosureswill remain high in 2011;
• Our expectation that multifamily charge-offs will remain commensurate with 2010 levels throughout2011;
• Our expectation that our overall business volume in 2011 will be lower than in 2010;
• Our expectation that home prices on a national basis will decline slightly, with greater declines in somegeographic areas than others, before stabilizing later in 2011, and that the peak-to-trough home pricedecline on a national basis will range between 21% and 26%;
• Our expectation that our credit-related expenses will remain high in 2011 and that our credit losses willincrease in 2011 as compared to 2010;
• Our expectation that we will continue to purchase loans from MBS trusts as they become delinquent forfour or more consecutive monthly payments subject to market conditions, servicer capacity, and otherconstraints, including the limit on mortgage assets that we may own pursuant to the senior preferred stockpurchase agreement;
• Our expectation that revenues from our mortgage asset portfolio will decrease over time;
• Whether during conservatorship we will be limited to continuing our existing core business activities andtaking actions necessary to advance the goals of the conservatorship;
• Our not being a substantial buyer or seller of mortgages for our retained portfolio, except for purchases ofdelinquent mortgages out of our guaranteed MBS pools;
• Our expectations that FHFA will request additional funds from Treasury on our behalf to ensure wemaintain a positive net worth and avoid mandatory receivership, that Treasury will provide such funds,and that the dividends on Treasury’s investments in us will therefore increase;
• Our expectation that the Dodd-Frank Act will significantly change the regulation of the financial servicesindustry, directly affect our business, and may involve a significant operational burden;
• Our expectation that some or all of the conditions that negatively affected our ability to meet our 2010single-family housing goals are likely to continue in 2011;
• Our expectation that the pause in foreclosures as a result of servicer foreclosure process deficiencies willlikely result in higher serious delinquency rates, longer foreclosure timelines and higher foreclosedproperty expenses;
• Our expectation that we may continue to experience substantial changes in management, employees andour business structure and practices;
• Our intention to maximize the value of nonperforming loans over time, utilizing loan modification,foreclosure, repurchases and other preferable loss mitigation actions;
• Our estimation of the amount that we could realize over the fair value of our nonperforming loansreported in our non-GAAP consolidated fair value balance sheet;
51

• Our expectation that the current market premium portion of our current estimate of fair value will notimpact future Treasury draws, which is based on our intention not to have another party assume the creditrisk inherent in our book of business;
• Our expectation that our debt funding needs will decline in future periods as we reduce the size of ourmortgage portfolio in compliance with the requirements of the senior preferred stock purchase agreement;
• Our expectation that, due to the large size of our portfolio of mortgage-related securities, current marketconditions and the significant amount of distressed assets in our mortgage portfolio, it is unlikely thatthere would be sufficient market demand for large amounts of these securities over a prolonged period oftime, particularly during a liquidity crisis;
• Our expectation that our acquisitions of Alt-A mortgage loans will continue to be minimal in futureperiods and the percentage of the book of business attributable to Alt-A will decrease over time;
• Our belief that we have limited exposure to losses on home equity conversion mortgages, a type ofreverse mortgage insured by the federal government;
• Our expectation that serious delinquency rates will continue to be affected in the future by home pricechanges, changes in other macroeconomic conditions and the extent to which borrowers with modifiedloans again become delinquent in their payments;
• Our expectation that we will increase our use of foreclosure alternatives;
• Our belief that the performance of our workouts will be highly dependent on economic factors, such asunemployment rates, household wealth and home prices;
• Our belief that one or more of our financial guarantor counterparties may not be able to fully meet theirobligations to us in the future;
• Our assumption that the guaranty fee income generated from future business activity will largely replaceguaranty fee income lost due to mortgage prepayments; and
• Our anticipated 2011 contributions to our benefit plans.
Forward-looking statements reflect our management’s expectations or predictions of future conditions, eventsor results based on various assumptions and management’s estimates of trends and economic factors in themarkets in which we are active, as well as our business plans. They are not guarantees of future performance.By their nature, forward-looking statements are subject to risks and uncertainties. Our actual results andfinancial condition may differ, possibly materially, from the anticipated results and financial conditionindicated in these forward-looking statements. There are a number of factors that could cause actualconditions, events or results to differ materially from those described in the forward-looking statementscontained in this report, including, but not limited to, the following: the uncertainty of our future; legislativeand regulatory changes affecting us; challenges we face in retaining and hiring qualified employees; thedeteriorated credit performance of many loans in our guaranty book of business; the conservatorship and itseffect on our business; the investment by Treasury and its effect on our business; adverse effects fromactivities we undertake to support the mortgage market and help borrowers; limitations on our ability to accessthe debt capital markets; further disruptions in the housing and credit markets; defaults by one or moreinstitutional counterparties; our reliance on mortgage servicers; deficiencies in servicer and law firmforeclosure processes and the consequences of those deficiencies; guidance by the Financial AccountingStandards Board (“FASB”); operational control weaknesses; our reliance on models; the level and volatility ofinterest rates and credit spreads; changes in the structure and regulation of the financial services industry; andthose factors described in this report, including those factors described in “Risk Factors.”
Readers are cautioned to place forward-looking statements in this report or that we make from time to timeinto proper context by carefully considering the factors discussed in “Risk Factors.” These forward-lookingstatements are representative only as of the date they are made, and we undertake no obligation to update anyforward-looking statement as a result of new information, future events or otherwise, except as required underthe federal securities laws.
52

Item 1A. Risk Factors
This section identifies specific risks that should be considered carefully in evaluating our business. The risksdescribed in “Risks Relating to Our Business” are specific to us and our business, while those described in“Risks Relating to Our Industry” relate to the industry in which we operate. Refer to “MD&A—RiskManagement” for a more detailed description of the primary risks to our business and how we seek to managethose risks.
In addition to the risks we discuss below, we face risks and uncertainties not currently known to us or that wecurrently deem to be immaterial. The risks we face could materially adversely affect our business, results ofoperations, financial condition, liquidity and net worth and could cause our actual results to differ materiallyfrom our past results or the results contemplated by the forward-looking statements contained in this report.
RISKS RELATING TO OUR BUSINESS
The future of our company is uncertain.
There is significant uncertainty regarding the future of our company, including how long we will continue tobe in existence, the extent of our role in the market, what form we will have, and what ownership interest, ifany, our current common and preferred stockholders will hold in us after the conservatorship is terminated.
On February 11, 2011, Treasury and HUD released a report to Congress on reforming America’s housingfinance market. The report provides that the Administration will work with FHFA to determine the best way toresponsibly reduce Fannie Mae’s and Freddie Mac’s role in the market and ultimately wind down bothinstitutions. The report does not state whether or how the existing infrastructure or human capital of FannieMae may be used in the establishment of such a reformed system. The report emphasizes the importance ofproceeding with a careful transition plan and providing the necessary financial support to Fannie Mae andFreddie Mac during the transition period.
During 2010, Congress held hearings on the future status of Fannie Mae and Freddie Mac, the CongressionalBudget Office released a study examining various alternatives for the future of the secondary mortgagemarket, and legislative proposals were introduced that would substantially change our business structure andthe operation of our business. We expect hearings on GSE reform to continue in 2011 and additional proposalsto be discussed, including proposals that would result in a substantial change to our business structure or thatinvolve Fannie Mae’s liquidation or dissolution. We cannot predict the prospects for the enactment, timing orcontent of legislative proposals regarding the future status of the GSEs. See “Business—Legislation and GSEReform” for more information about the Treasury report and Congressional proposals regarding reform of theGSEs.
We expect FHFA to request additional funds from Treasury on our behalf to ensure we maintain a positivenet worth and avoid mandatory receivership. The dividends we must pay or that accrue on Treasury’sinvestments are substantial and are expected to increase, and we likely will not be able to fund themthrough net income.
FHFA must place us into receivership if the Director of FHFA makes a written determination that our assetsare less than our obligations (which we refer to as a net worth deficit) or if we have not been paying ourdebts, in either case, for a period of 60 days after the filing deadline for our Form 10-K or Form-Q with theSEC. We have had a net worth deficit as of the end of each of the last nine fiscal quarters, including as ofDecember 31, 2010. Treasury provided us with funds under the senior preferred stock purchase agreement tocure the net worth deficits in prior periods before the end of the 60-day period, and we expect Treasury to dothe same with respect to the December 31, 2010 deficit. When Treasury provides the additional $2.6 billionFHFA has requested on our behalf, the aggregate liquidation preference on the senior preferred stock will be$91.2 billion, and will require an annualized dividend of $9.1 billion. The prospective $9.1 billion annualdividend obligation exceeds our reported annual net income for each of the last nine years, in most cases by asignificant margin. Our ability to maintain a positive net worth has been and continues to be adverselyaffected by market conditions. To the extent we have a negative net worth as of the end of future fiscal
53

quarters, we expect that FHFA will request on our behalf additional funds from Treasury under the seniorpreferred stock purchase agreement. Further funds from Treasury under the senior preferred stock purchaseagreement will increase the liquidation preference of and the dividends we owe on the senior preferred stockand, therefore, we will need additional funds from Treasury in order to meet our dividend obligation toTreasury.
In addition, beginning in 2011, the senior preferred stock purchase agreement requires that we pay a quarterlycommitment fee to Treasury. Although Treasury has waived this fee for the first quarter of 2011 due toadverse conditions in the mortgage market and its belief that imposing the commitment fee would not generateincreased compensation for taxpayers, Treasury indicated that it would reevaluate whether to set the fee nextquarter. The aggregate liquidation preference and dividend obligations relating to the preferred stock also willincrease by the amount of any required dividend on the senior preferred stock that we fail to pay in cash andby the amount of any required quarterly commitment fee on the senior preferred stock that we fail to pay. Thesubstantial dividend obligations and potentially substantial quarterly commitment fees on the senior preferredstock, coupled with our effective inability to pay down draws under the senior preferred stock purchaseagreement, will continue to strain our financial resources and have an adverse impact on our results ofoperations, financial condition, liquidity and net worth, both in the short and long term.
Our regulator is authorized or required to place us into receivership under specified conditions, whichwould result in the liquidation of our assets. Amounts recovered from the liquidation may be insufficient tocover our obligations or aggregate liquidation preference on our preferred stock, or provide any proceeds tocommon shareholders.
Because of the weak economy, conditions in the housing market and our dividend obligation to Treasury, wewill continue to need funding from Treasury to avoid a trigger of mandatory receivership under the GSE Act.In addition, we could be put into receivership at the discretion of the Director of FHFA at any time for otherreasons, including conditions that FHFA has already asserted existed at the time the former Director of FHFAplaced us into conservatorship.
A receivership would terminate the conservatorship. In addition to the powers FHFA has as our conservator,the appointment of FHFA as our receiver would terminate all rights and claims that our shareholders andcreditors may have against our assets or under our charter arising from their status as shareholders or creditors,except for their right to payment, resolution or other satisfaction of their claims as permitted under the GSEAct. Unlike a conservatorship, the purpose of which is to conserve our assets and return us to a sound andsolvent condition, the purpose of a receivership is to liquidate our assets and resolve claims against us.
In the event of a liquidation of our assets, only after payment of the secured and unsecured claims against thecompany (including repaying all outstanding debt obligations), the administrative expenses of the receiver andthe liquidation preference of the senior preferred stock, would any liquidation proceeds be available to repaythe liquidation preference on any other series of preferred stock. Finally, only after the liquidation preferenceon all series of preferred stock is repaid would any liquidation proceeds be available for distribution to theholders of our common stock. It is unlikely that there would be sufficient proceeds to repay the liquidationpreference of any series of our preferred stock or to make any distribution to the holders of our commonstock. To the extent we are placed into receivership and do not or cannot fulfill our guaranty to the holders ofour Fannie Mae MBS, the MBS holders could become unsecured creditors of ours with respect to claims madeunder our guaranty.
Our business and results of operations may be materially adversely affected if we are unable to retain andhire qualified employees.
Our business processes are highly dependent on the talents and efforts of our employees. The uncertainty ofour future and the public policy debate surrounding GSE reform, as well as limitations on employeecompensation, our inability to offer equity compensation and our conservatorship, have adversely affected andmay in the future adversely affect our ability to retain and recruit well-qualified employees. We facecompetition from within the financial services industry and from businesses outside of the financial servicesindustry for qualified employees. An improving economy is likely to put additional pressures on turnover, as
54

attractive opportunities become available to our employees. If we lose a significant number of employees andare not able to quickly recruit and train new employees, it could negatively affect customer relationships andgoodwill, and could have a material adverse effect on our ability to do business and our results of operations.In addition, management turnover may impair our ability to manage our business effectively. Since August2008, we have had significant departures by various members of senior management, including two ChiefExecutive Officers and two Chief Financial Officers. Further turnover in key management positions andchallenges in integrating new management could harm our ability to manage our business effectively andultimately adversely affect our financial performance.
Since 2008, we have experienced substantial deterioration in the credit performance of mortgage loans thatwe own or that back our guaranteed Fannie Mae MBS, which we expect to continue and result inadditional credit-related expenses.
We are exposed to mortgage credit risk relating to the mortgage loans that we hold in our investment portfolioand the mortgage loans that back our guaranteed Fannie Mae MBS. When borrowers fail to make requiredpayments of principal and interest on their mortgage loans, we are exposed to the risk of credit losses andcredit-related expenses.
While serious delinquency rates improved in recent months, conditions in the housing market contributed to adeterioration in the credit performance of our book of business, negatively impacting serious delinquencyrates, default rates and average loan loss severity on the mortgage loans we hold or that back our guaranteedFannie Mae MBS, as well as increasing our inventory of foreclosed properties. Increases in delinquencies,default rates and loss severity cause us to experience higher credit-related expenses. The credit performance ofour book of business has also been negatively affected by the extent and duration of the decline in homeprices and high unemployment. These credit performance trends have been notable in certain of our higherrisk loan categories, states and vintages. Home price declines, adverse market conditions and continuing highlevels of unemployment also have affected the credit performance of our broader book of business. Further,home price declines have resulted in a large number of borrowers with “negative equity” in their properties(that is, they owe more on their mortgage loans than their houses are worth), which increases the likelihoodthat either these borrowers will strategically default on their mortgage loans even if they have the ability tocontinue to pay the loans or that their homes will be sold in a “short sale” for significantly less than theunpaid amount of the loans. We present detailed information about the risk characteristics of our conventionalsingle-family guaranty book of business in “MD&A—Risk Management—Credit Risk Management—Mortgage Credit Risk Management,” and we present detailed information on our 2010 credit-related expenses,credit losses and results of operations in “MD&A—Consolidated Results of Operations.”
Adverse credit performance trends may resume, particularly if we experience further national and regionaldeclines in home prices, weak economic conditions and high unemployment.
We expect further losses and write-downs relating to our investment securities.
We experienced significant fair value losses and other-than-temporary impairment write-downs relating to ourinvestment securities in 2008 and recorded significant other-than-temporary impairment write-downs of someof our available-for-sale securities in 2009. A substantial portion of these fair value losses and write-downsrelated to our investments in private-label mortgage-related securities backed by Alt-A and subprime mortgageloans and, in the case of fair value losses, our investments in commercial mortgage-backed securities(“CMBS”) due to the decline in home prices and the weak economy. We expect to experience additionalother-than-temporary impairment write-downs of our investments in private-label mortgage-related securities,including those that continue to be AAA-rated. See “MD&A—Consolidated Balance Sheet Analysis—Investments in Mortgage-Related Securities—Investments in Private-Label Mortgage-Related Securities” for
detailed information on our investments in private-label mortgage-related securities backed by Alt-A andsubprime mortgage loans.
If the market for securities we hold in our investment portfolio is not liquid, we must use a greater amount ofmanagement judgment to value these securities. Later valuations and any price we ultimately would realize if
55

we were to sell these securities could be materially lower than the estimated fair value at which we carry themon our balance sheet.
Any of the above factors could require us to record additional write-downs in the value of our investmentportfolio, which could have a material adverse effect on our business, results of operations, financial condition,liquidity and net worth.
Our business activities are significantly affected by the conservatorship and the senior preferred stockpurchase agreement.
We are currently under the control of our conservator, FHFA, and we do not know when or how theconservatorship will be terminated. As conservator, FHFA can direct us to enter into contracts or enter intocontracts on our behalf, and generally has the power to transfer or sell any of our assets or liabilities. Inaddition, our directors do not have any duties to any person or entity except to the conservator. Accordingly,our directors are not obligated to consider the interests of the company, the holders of our equity or debtsecurities or the holders of Fannie Mae MBS in making or approving a decision unless specifically directed todo so by the conservator.
The conservator has determined that while we are in conservatorship, we will be limited to continuing ourexisting core business activities and taking actions necessary to advance the goals of the conservatorship. Inview of the conservatorship and the reasons stated for its establishment, it is likely that our business modeland strategic objectives will continue to change, possibly significantly, including in pursuit of our publicmission and other non-financial objectives. Among other things, we could experience significant changes inthe size, growth and characteristics of our guarantor and investment activities, and we could further changeour operational objectives, including our pricing strategy in our core mortgage guaranty business. Accordingly,our strategic and operational focus going forward may not be consistent with the investment objectives of ourinvestors. In addition, we may be directed to engage in activities that are operationally difficult, costly toimplement or unprofitable.
The senior preferred stock purchase agreement with Treasury includes a number of covenants that significantlyrestrict our business activities. We cannot, without the prior written consent of Treasury: pay dividends (excepton the senior preferred stock); sell, issue, purchase or redeem Fannie Mae equity securities; sell, transfer, leaseor otherwise dispose of assets in specified situations; engage in transactions with affiliates other than on arm’s-length terms or in the ordinary course of business; issue subordinated debt; or incur indebtedness that wouldresult in our aggregate indebtedness exceeding 120% of the amount of mortgage assets we are allowed to own.In deciding whether to consent to any request for approval it receives from us under the agreement, Treasuryhas the right to withhold its consent for any reason and is not required by the agreement to consider anyparticular factors, including whether or not management believes that the transaction would benefit thecompany. Pursuant to the senior preferred stock purchase agreement, the maximum allowable amount ofmortgage assets we may own on December 31, 2010 is $810 billion. (Our mortgage assets were approximately$788.8 billion as of that date.) On December 31, 2011, and each December 31 thereafter, our mortgage assetsmay not exceed 90% of the maximum allowable amount that we were permitted to own as of December 31 ofthe immediately preceding calendar year. The maximum allowable amount is reduced annually until it reaches$250 billion. This limit on the amount of mortgage assets we are permitted to hold could constrain the amountof delinquent loans we purchase from single-family MBS trusts, which could increase our costs.
We discuss the powers of the conservator, the terms of the senior preferred stock purchase agreement, andtheir impact on us and shareholders in “Business—Conservatorship and Treasury Agreements.” These factorsmay adversely affect our business, results of operations, financial condition, liquidity and net worth.
The conservatorship and investment by Treasury have had, and will continue to have, a material adverseeffect on our common and preferred shareholders.
We do not know when or how the conservatorship will be terminated. Moreover, even if the conservatorship isterminated, we remain subject to the terms of the senior preferred stock purchase agreement, senior preferredstock and warrant, which can only be cancelled or modified by mutual consent of Treasury and the
56

conservator. The conservatorship and investment by Treasury have had, and will continue to have, materialadverse effects on our common and preferred shareholders, including the following:
No voting rights during conservatorship. The rights and powers of our shareholders are suspended during theconservatorship. The conservatorship has no specified termination date. During the conservatorship, ourcommon shareholders do not have the ability to elect directors or to vote on other matters unless theconservator delegates this authority to them.
Dividends to common and preferred shareholders, other than to Treasury, have been eliminated. Under theterms of the senior preferred stock purchase agreement, dividends may not be paid to common or preferredshareholders (other than on the senior preferred stock) without the consent of Treasury, regardless of whetherwe are in conservatorship.
Liquidation preference of senior preferred stock will increase, likely substantially. The senior preferred stockranks prior to our common stock and all other series of our preferred stock, as well as any capital stock weissue in the future, as to both dividends and distributions upon liquidation. Accordingly, if we are liquidated,the senior preferred stock is entitled to its then-current liquidation preference, plus any accrued but unpaiddividends, before any distribution is made to the holders of our common stock or other preferred stock. As ofDecember 31, 2010, the liquidation preference on the senior preferred stock was $88.6 billion; however, it willincrease to $91.2 billion when Treasury provides the additional $2.6 billion FHFA has already requested onour behalf. The liquidation preference could increase substantially as we draw on Treasury’s fundingcommitment, if we do not pay dividends owed on the senior preferred stock or if we do not pay the quarterlycommitment fee under the senior preferred stock purchase agreement. If we are liquidated, it is unlikely thatthere would be sufficient funds remaining after payment of amounts to our creditors and to Treasury as holderof the senior preferred stock to make any distribution to holders of our common stock and other preferredstock.
Exercise of the Treasury warrant would substantially dilute investment of current shareholders. If Treasuryexercises its warrant to purchase shares of our common stock equal to 79.9% of the total number of shares ofour common stock outstanding on a fully diluted basis, the ownership interest in the company of our thenexisting common shareholders will be substantially diluted, and we would thereafter have a controllingshareholder.
No longer managed for the benefit of shareholders. Because we are in conservatorship, we are no longermanaged with a strategy to maximize shareholder returns.
For additional description of the restrictions on us and the risks to our shareholders, see “Business—Conservatorship and Treasury Agreements.”
Efforts we are required or asked to undertake by FHFA, other government agencies or Congress in pursuitof providing liquidity, stability and affordability to the mortgage market and providing assistance tostruggling homeowners, or in pursuit of other goals, may adversely affect our business, results ofoperations, financial condition, liquidity and net worth.
Prior to the conservatorship, our business was managed with a strategy to maximize shareholder returns, whilefulfilling our mission. Our conservator has directed us to focus primarily on minimizing our credit losses fromdelinquent mortgages and providing assistance to struggling homeowners to help them remain in their homes.As a result, we may continue to take a variety of actions designed to address this focus that could adverselyaffect our economic returns, possibly significantly, such as: reducing our guaranty fees and modifying loans toextend the maturity, lower the interest rate or defer or forgive principal owed by the borrower. These activitiesmay have short- and long-term adverse effects on our business, results of operations, financial condition,liquidity and net worth. Other agencies of the U.S. government or Congress also may ask us to undertakesignificant efforts to support the housing and mortgage markets, as well as struggling homeowners. Forexample, under the Administration’s Making Home Affordable Program, we are offering HAMP. We haveincurred substantial costs in connection with the program, as we discuss in “MD&A—Consolidated Results ofOperations—Financial Impact of the Making Home Affordable Program on Fannie Mae.”
57
We may be unable to meet our housing goals and duty to serve requirements, and actions we take to meetthose requirements may adversely affect our business, results of operations, financial condition, liquidityand net worth.
To meet our housing goals obligations, a portion of the mortgage loans we acquire must be for low- and very-low income families, families in low-income census tracts and moderate-income families in minority censustracts or designated disaster areas. In addition, when a final duty-to-serve rule is issued, we will have a duty toserve three underserved markets: manufactured housing, affordable housing preservation and rural areas. Wemay take actions to meet these obligations that could increase our credit losses and credit-related expenses. Ifwe fail to meet our housing goals in a given year and FHFA finds that they were feasible, or if we fail tocomply with our duty to serve requirements, we may become subject to a housing plan that could require usto take additional steps that could have an adverse effect on our financial condition. The housing plan mustdescribe the actions we would take to meet the goals and/or duty to serve in the next calendar year and beapproved by FHFA. With respect to our housing goals, the potential penalties for failure to comply withhousing plan requirements are a cease-and-desist order and civil money penalties.
Mortgage market conditions during 2010 negatively affected our ability to meet our goals. These conditionsincluded a reduction in single-family borrowing by low-income purchasers following the expiration of thehome buyer tax credits, an increase in the share of mortgages made to moderate-income borrowers due to lowinterest rates, continuing high unemployment, strengthened underwriting and eligibility standards, increasedstandards of private mortgage insurers and the increased role of FHA in acquiring goals-qualifying mortgageloans. Some or all of these conditions are likely to continue in 2011. We cannot predict the impact that marketconditions during 2011 will have on our ability to meet our 2011 housing goals and duty to serverequirements.
For more information about our housing goals and duty to serve requirements, as well as our 2010 housinggoals performance, please see “Business—Our Charter and Regulation of Our Activities—Housing Goals andDuty to Serve Underserved Markets.”
Limitations on our ability to access the debt capital markets could have a material adverse effect on ourability to fund our operations and generate net interest income.
Our ability to fund our business depends primarily on our ongoing access to the debt capital markets. Ourlevel of net interest income depends on how much lower our cost of funds is compared to what we earn onour mortgage assets. Market concerns about matters such as the extent of government support for our businessand the future of our business (including future profitability, future structure, regulatory actions and GSEstatus) could cause a severe negative effect on our access to the unsecured debt markets, particularly for long-term debt. We believe that our ability in 2010 to issue debt of varying maturities at attractive pricing resultedfrom federal government support of us and the financial markets, including the Federal Reserve’s purchases ofour debt and MBS. As a result, we believe that our status as a GSE and continued federal government supportof our business is essential to maintaining our access to debt funding. Changes or perceived changes in thegovernment’s support of us or the markets could have a material adverse effect on our ability to fund ouroperations. On February 11, 2011, Treasury and HUD released a report to Congress on reforming America’shousing finance market. The report provides that the Administration will work with FHFA to determine thebest way to responsibly wind down both Fannie Mae and Freddie Mac. The report emphasizes the importanceof proceeding with a careful transition plan and providing the necessary financial support to Fannie Mae andFreddie Mac during the transition period. Please see “MD&A—Liquidity and Capital Management—LiquidityManagement—Debt Funding—Fannie Mae Debt Funding Activity” for a more complete discussion of actionstaken by the federal government to support us and the financial markets. However, there can be no assurancethat the government will continue to support us or that our current level of access to debt funding willcontinue.
In addition, future changes or disruptions in the financial markets could significantly change the amount, mixand cost of funds we obtain, as well as our liquidity position. If we are unable to issue both short- and long-term debt securities at attractive rates and in amounts sufficient to operate our business and meet our
58

obligations, it likely would interfere with the operation of our business and have a material adverse effect onour liquidity, results of operations, financial condition and net worth.
Our liquidity contingency plans may be difficult or impossible to execute during a liquidity crisis.
We believe that our liquidity contingency plans may be difficult or impossible to execute during a liquiditycrisis. As a result if we cannot access the unsecured debt markets, our ability to repay maturing indebtednessand fund our operations could be significantly impaired. If adverse market conditions resulted in our beingunable to access the unsecured debt markets, our alternative sources of liquidity consist of our cash and otherinvestments portfolio and the unencumbered mortgage assets in our mortgage portfolio.
We believe that the amount of mortgage-related assets that we could successfully borrow against or sell in theevent of a liquidity crisis or significant market disruption is substantially lower than the amount of mortgage-related assets we hold. Due to the large size of our portfolio of mortgage assets, current market conditions andthe significant amount of distressed assets in our mortgage portfolio, it is unlikely that there would besufficient market demand for large amounts of these assets over a prolonged period of time, particularlyduring a liquidity crisis, which could limit our ability to borrow against or sell these assets.
To the extent that we would be able to obtain funding by pledging or selling mortgage-related securities ascollateral, we anticipate that a discount would be applied that would reduce the value assigned to thosesecurities. Depending on market conditions at the time, this discount would result in proceeds significantlylower than the current market value of these securities and would thereby reduce the amount of financing wewould obtain. In addition, our primary source of collateral is Fannie Mae MBS that we own. In the event of aliquidity crisis in which the future of our company is uncertain, counterparties may be unwilling to acceptFannie Mae MBS as collateral. As a result, we may not be able to sell or borrow against these securities insufficient amounts to meet our liquidity needs.
A decrease in the credit ratings on our senior unsecured debt would likely have an adverse effect on ourability to issue debt on reasonable terms and trigger additional collateral requirements.
Our borrowing costs and our access to the debt capital markets depend in large part on the high credit ratingson our senior unsecured debt. Credit ratings on our debt are subject to revision or withdrawal at any time bythe rating agencies. Actions by governmental entities impacting the support we receive from Treasury couldadversely affect the credit ratings on our senior unsecured debt. The reduction in our credit ratings wouldlikely increase our borrowing costs, limit our access to the capital markets and trigger additional collateralrequirements under our derivatives contracts and other borrowing arrangements. It may also reduce ourearnings and materially adversely affect our liquidity, our ability to conduct our normal business operations,our financial condition and results of operations. Our credit ratings and ratings outlook are included in“MD&A—Liquidity and Capital Management—Liquidity Management—Credit Ratings.”
Deterioration in the credit quality of, or defaults by, one or more of our institutional counterparties couldresult in financial losses, business disruption and decreased ability to manage risk.
We face the risk that one or more of our institutional counterparties may fail to fulfill their contractualobligations to us. Unfavorable market conditions since 2008 have adversely affected the liquidity and financialcondition of our institutional counterparties. Our primary exposures to institutional counterparty risk are withmortgage seller/servicers that service the loans we hold in our mortgage portfolio or that back our Fannie MaeMBS; seller/servicers that are obligated to repurchase loans from us or reimburse us for losses in certaincircumstances; third-party providers of credit enhancement on the mortgage assets that we hold in ourmortgage portfolio or that back our Fannie Mae MBS, including mortgage insurers, lenders with risk sharingarrangements and financial guarantors; issuers of securities held in our cash and other investments portfolio;and derivatives counterparties.
We may have multiple exposures to one counterparty as many of our counterparties provide several types ofservices to us. For example, our lender customers or their affiliates also act as derivatives counterparties,mortgage servicers, custodial depository institutions or document custodians. Accordingly, if one of these
59

counterparties were to become insolvent or otherwise default on its obligations to us, it could harm ourbusiness and financial results in a variety of ways.
An institutional counterparty may default in its obligations to us for a number of reasons, such as changes infinancial condition that affect its credit rating, a reduction in liquidity, operational failures or insolvency. Anumber of our institutional counterparties are currently experiencing financial difficulties that may negativelyaffect the ability of these counterparties to meet their obligations to us and the amount or quality of theproducts or services they provide to us. Counterparty defaults or limitations on their ability to do business withus could result in significant financial losses or hamper our ability to do business, which would adverselyaffect our business, results of operations, financial condition, liquidity and net worth.
We routinely execute a high volume of transactions with counterparties in the financial services industry.Many of the transactions we engage in with these counterparties expose us to credit risk relating to thepossibility of a default by our counterparties. In addition, to the extent these transactions are secured, ourcredit risk may be exacerbated to the extent that the collateral we hold cannot be realized or can be liquidatedonly at prices too low to recover the full amount of the loan or derivative exposure. We have exposure to thesefinancial institutions in the form of unsecured debt instruments and derivatives transactions. As a result, wecould incur losses relating to defaults under these instruments or relating to impairments to the carrying valueof our assets represented by these instruments. These losses could materially and adversely affect our business,results of operations, financial condition, liquidity and net worth.
We depend on our ability to enter into derivatives transactions in order to manage the duration andprepayment risk of our mortgage portfolio. If we lose access to our derivatives counterparties, it couldadversely affect our ability to manage these risks, which could have a material adverse effect on our business,results of operations, financial condition, liquidity and net worth.
Deterioration in the credit quality of, or defaults by, one or more of our mortgage insurer counterpartiescould result in nonpayment of claims under mortgage insurance policies, business disruptions andincreased concentration risk.
We rely heavily on mortgage insurers to provide insurance against borrower defaults on conventional single-family mortgage loans with LTV ratios over 80% at the time of acquisition. The current weakened financialcondition of our mortgage insurer counterparties creates a significant risk that these counterparties will fail tofulfill their obligations to reimburse us for claims under insurance policies. Since January 1, 2009, the insurerfinancial strength ratings of all of our major mortgage insurer counterparties have been downgraded to reflecttheir weakened financial condition, in some cases more than once. One of our mortgage insurer counterpartiesceased issuing commitments for new mortgage insurance in 2008, and, under an order received from itsregulator, is now paying all valid claims 60% in cash and 40% by the creation of a deferred paymentobligation, which may be paid in the future.
A number of our mortgage insurers publicly disclosed that they have exceeded or might exceed the state-imposed risk-to-capital limits under which they operate and they might not have access to sufficient capital tocontinue to write new business in accordance with state regulatory requirements. In addition, a number of ourmortgage insurers have received waivers from their regulators regarding state-imposed risk-to-capital limits.However, these waivers are temporary. Some mortgage insurers have been exploring corporate restructurings,intended to provide relief from risk-to-capital limits in certain states. A restructuring plan that would involvecontributing capital to a subsidiary would result in less liquidity available to its parent company to pay claimson its existing book of business and an increased risk that its parent company will not pay its claims in full inthe future.
If mortgage insurers are not able to raise capital and exceed their risk-to-capital limits, they will likely beforced into run-off or receivership unless they can secure a waiver from their state regulator. This wouldincrease the risk that they will fail to pay our claims under insurance policies, and could also cause the qualityand speed of their claims processing to deteriorate. If our assessment of one or more of our mortgage insurercounterparty’s ability to fulfill its obligations to us worsens and our internal credit rating for the insurer is
60

further downgraded, it could result in a significant increase in our loss reserves and a significant increase inthe fair value of our guaranty obligations.
Many mortgage insurers stopped insuring new mortgages with higher loan-to-value ratios or with lowerborrower credit scores or on select property types, which has contributed to the reduction in our businessvolumes for high loan-to-value ratio loans. As our charter generally requires us to obtain credit enhancementon conventional single-family mortgage loans with loan-to-value ratios over 80% at the time of purchase, aninability to find suitable credit enhancement may inhibit our ability to pursue new business opportunities, meetour housing goals and otherwise support the housing and mortgage markets. For example, where mortgageinsurance or other credit enhancement is not available, we may be hindered in our ability to refinance loansinto more affordable loans. In addition, access to fewer mortgage insurer counterparties will increase ourconcentration risk with the remaining mortgage insurers in the industry.
The loss of business volume from any one of our key lender customers could adversely affect our businessand result in a decrease in our revenues.
Our ability to generate revenue from the purchase and securitization of mortgage loans depends on our abilityto acquire a steady flow of mortgage loans from the originators of those loans. We acquire most of ourmortgage loans through mortgage purchase volume commitments that are negotiated annually or semiannuallywith lender customers and that establish a minimum level of mortgage volume that these customers willdeliver to us. We acquire a significant portion of our mortgage loans from several large mortgage lenders.During 2010, our top five lender customers, in the aggregate, accounted for approximately 62% of our single-family business volume, with three of our customers accounting for greater than 52% of our single-familybusiness volume. Accordingly, maintaining our current business relationships and business volumes with ourtop lender customers is critical to our business.
The mortgage industry has been consolidating and a decreasing number of large lenders originate most single-family mortgages. The loss of business from any one of our major lender customers could adversely affect ourrevenues and the liquidity of Fannie Mae MBS, which in turn could have an adverse effect on their marketvalue. In addition, as we become more reliant on a smaller number of lender customers, our negotiatingleverage with these customers decreases, which could diminish our ability to price our products optimally.
In addition, many of our lender customers are experiencing, or may experience in the future, financial andliquidity problems that may affect the volume of business they are able to generate. Many of our lendercustomers also strengthened their lending criteria, which reduced their loan volume. If any of our key lendercustomers significantly reduces the volume or quality of mortgage loans that the lender delivers to us or thatwe are willing to buy from them, we could lose significant business volume that we might be unable toreplace, which could adversely affect our business and result in a decrease in our revenues. Our demands thatour lender customers repurchase or compensate us for losses on loans that do not meet our underwriting andeligibility standards may strain our relationships with our lender customers and may also result in ourcustomers reducing the volume of loans they provide us. A significant reduction in the volume of mortgageloans that we securitize could reduce the liquidity of Fannie Mae MBS, which in turn could have an adverseeffect on their market value.
Our reliance on third parties to service our mortgage loans may impede our efforts to keep people in theirhomes, as well as the re-performance rate of loans we modify.
Mortgage servicers, or their agents and contractors, typically are the primary point of contact for borrowers aswe delegate servicing responsibilities to them. We rely on these mortgage servicers to identify and contacttroubled borrowers as early as possible, to assess the situation and offer appropriate options for resolving theproblem and to successfully implement a solution. The demands placed on experienced mortgage loanservicers to service delinquent loans have increased significantly across the industry, straining servicercapacity. The Making Home Affordable Program is also impacting servicer resources. To the extent thatmortgage servicers are hampered by limited resources or other factors, they may not be successful inconducting their servicing activities in a manner that fully accomplishes our objectives within the timeframewe desire. Further, our servicers have advised us that they have not been able to reach many of the borrowers
61

who may need help with their mortgage loans even when repeated efforts have been made to contact theborrower.
For these reasons, our ability to actively manage the troubled loans that we own or guarantee, and toimplement our homeownership assistance and foreclosure prevention efforts quickly and effectively, may belimited by our reliance on our mortgage servicers. Our inability to effectively manage these loans andimplement these efforts could have a material adverse effect on our business, results of operations andfinancial condition.
Deficiencies in servicer and law firm foreclosure processes and the resulting foreclosure pause may causehigher credit losses and credit-related expenses.
A number of our single-family mortgage servicers temporarily halted foreclosures in the fall of 2010 in someor all states after discovering deficiencies in their processes and the processes of their lawyers and otherservice providers relating to the execution of affidavits in connection with the foreclosure process. Thisforeclosure pause could expand to additional servicers and states, and possibly to all or substantially all of ourloans in the foreclosure process. Some servicers have lifted the foreclosure pause in some jurisdictions, whilecontinuing the pause in others.
Although we cannot predict the ultimate impact of this foreclosure pause on our business at this time, weexpect the pause will likely result in higher serious delinquency rates, longer foreclosure timelines and higherforeclosed property expenses. This foreclosure pause could also negatively affect the value of our REOinventory and the severity of our losses on foreclosed properties. In addition, this foreclosure pause couldnegatively affect housing market conditions and delay the recovery of the housing market. As a result, weexpect this foreclosure pause will likely result in higher credit losses and credit-related expenses. Thisforeclosure pause may also negatively affect the value of the private-label securities we hold and result inadditional impairments on these securities.
The foreclosure process deficiencies have generated significant concern and are currently being investigated byvarious government agencies and the attorneys general of all fifty states. These foreclosure processdeficiencies could lead to expensive or time-consuming new regulation, such as new rules applicable to theforeclosure process recently issued by courts in some states. In addition, the failure of our servicers or a lawfirm to apply prudent and effective process controls and to comply with legal and other requirements in theforeclosure process poses operational, reputational and legal risks for us. As a result, depending on theduration and extent of the foreclosure pause and the foreclosure process deficiencies, these matters could havea material adverse effect on our business.
Challenges to the MERS» System could pose counterparty, operational, reputational and legal risks for us.
MERSCORP, Inc. is a privately held company that maintains an electronic registry (the “MERS System”) thattracks servicing rights and ownership of loans in the United States. Mortgage Electronic Registration Systems,Inc. (“MERS”), a wholly owned subsidiary of MERSCORP, Inc., can serve as a nominee for the owner of amortgage loan and, in that role, become the mortgagee of record for the loan in local land records. FannieMae seller/servicers may choose to use MERS as a nominee; however, we have prohibited servicers frominitiating foreclosures on Fannie Mae loans in MERS’s name. Approximately half of the loans we own orguarantee are registered in MERS’s name and the related servicing rights are tracked in the MERS System.The MERS System is widely used by participants in the mortgage finance industry. Along with a number ofother organizations in the mortgage finance industry, we are a shareholder of MERSCORP, Inc.
Several legal challenges have been made disputing MERS’s legal standing to initiate foreclosures and/or act asnominee in local land records. These challenges have focused public attention on MERS and on how loans arerecorded in local land records. As a result, these challenges could negatively affect MERS’s ability to serve asthe mortgagee of record in some jurisdictions. In addition, where MERS is the mortgagee of record, it mustexecute assignments of mortgages, affidavits and other legal documents in connection with foreclosureproceedings. As a result, investigations by governmental authorities and others into the servicer foreclosureprocess deficiencies discussed above may impact MERS. Failures by MERS to apply prudent and effectiveprocess controls and to comply with legal and other requirements could pose counterparty, operational,
62

reputational and legal risks for us. If investigations or new regulation or legislation restricts servicers’ use ofMERS, our counterparties may be required to record all mortgage transfers in land records, incurringadditional costs and time in the recordation process. At this time, we cannot predict the ultimate outcome ofthese legal challenges to MERS or the impact on our business, results of operations and financial condition.
Changes in accounting standards can be difficult to predict and can materially impact how we record andreport our financial results.
Our accounting policies and methods are fundamental to how we record and report our financial condition andresults of operations. From time to time, FASB changes the financial accounting and reporting standards thatgovern the preparation of our financial statements. In addition, those who set or interpret accounting standardsmay amend or even reverse their previous interpretations or positions on how these standards should beapplied. These changes can be difficult to predict and expensive to implement, can divert management’sattention from other matters, and can materially impact how we record and report our financial condition andresults of operations.
Material weaknesses in our internal control over financial reporting could result in errors in our reportedresults or disclosures that are not complete or accurate.
Management has determined that, as of the date of this filing, we have ineffective disclosure controls andprocedures and a material weakness in our internal control over financial reporting. In addition, ourindependent registered public accounting firm, Deloitte & Touche LLP, has expressed an adverse opinion onour internal control over financial reporting because of the material weakness. Our ineffective disclosurecontrols and procedures and material weakness could result in errors in our reported results or disclosures thatare not complete or accurate, which could have a material adverse effect on our business and operations.
Our material weakness relates specifically to the impact of the conservatorship on our disclosure controls andprocedures. Because we are under the control of FHFA, some of the information that we may need to meetour disclosure obligations may be solely within the knowledge of FHFA. As our conservator, FHFA has thepower to take actions without our knowledge that could be material to our shareholders and otherstakeholders, and could significantly affect our financial performance or our continued existence as an ongoingbusiness. Because FHFA currently functions as both our regulator and our conservator, there are inherentstructural limitations on our ability to design, implement, test or operate effective disclosure controls andprocedures relating to information within FHFA’s knowledge. As a result, we have not been able to update ourdisclosure controls and procedures in a manner that adequately ensures the accumulation and communicationto management of information known to FHFA that is needed to meet our disclosure obligations under thefederal securities laws, including disclosures affecting our financial statements. Given the structural nature ofthis material weakness, it is likely that we will not remediate this weakness while we are underconservatorship. See “Controls and Procedures” for further discussion of management’s conclusions on ourdisclosure controls and procedures and internal control over financial reporting.
Operational control weaknesses could materially adversely affect our business, cause financial losses andharm our reputation.
Shortcomings or failures in our internal processes, people or systems could have a material adverse effect onour risk management, liquidity, financial statement reliability, financial condition and results of operations;disrupt our business; and result in legislative or regulatory intervention, liability to customers and financiallosses or damage to our reputation, including as a result of our inadvertent dissemination of confidential orinaccurate information. For example, our business is dependent on our ability to manage and process, on adaily basis, an extremely large number of transactions across numerous and diverse markets and in anenvironment in which we must make frequent changes to our core processes in response to changing externalconditions. These transactions are subject to various legal and regulatory standards.
We rely upon business processes that are highly dependent on people, legacy technology and the use ofnumerous complex systems and models to manage our business and produce books and records upon whichour financial statements are prepared. This reliance increases the risk that we may be exposed to financial,
63

reputational or other losses as a result of inadequately designed internal processes or systems, or failedexecution of our systems. Our operational risk management efforts are aimed at reducing this risk.
We continue to implement our operational risk management framework, which consists of a set of integratedprocesses, tools and strategies designed to support the identification, assessment, mitigation and control, andreporting and monitoring of operational risk. We also have made a number of changes in our structure,business focus and operations during the past two years, as well as changes to our risk management processes,to keep pace with changing external conditions. These changes, in turn, have necessitated modifications to ordevelopment of new business models, processes, systems, policies, standards and controls. While we believethat the steps we have taken and are taking to enhance our technology and operational controls andorganizational structure will help identify, assess, mitigate, control and monitor operational risk, ourimplementation of our operational risk management framework may not be effective to manage these risks andmay create additional operational risk as we execute these enhancements.
In addition, we have experienced, and expect we may continue to experience, substantial changes inmanagement, employees and our business structure and practices since the conservatorship began. Thesechanges could increase our operational risk and result in business interruptions and financial losses. Inaddition, due to events that are wholly or partially beyond our control, employees or third parties could engagein improper or unauthorized actions, or our systems could fail to operate properly, which could lead tofinancial losses, business disruptions, legal and regulatory sanctions and reputational damage.
In many cases, our accounting policies and methods, which are fundamental to how we report our financialcondition and results of operations, require management to make judgments and estimates about mattersthat are inherently uncertain. Management also relies on models in making these estimates.
Our accounting policies and methods are fundamental to how we record and report our financial condition andresults of operations. Our management must exercise judgment in applying many of these accounting policiesand methods so that these policies and methods comply with GAAP and reflect management’s judgment of themost appropriate manner to report our financial condition and results of operations. In some cases,management must select the appropriate accounting policy or method from two or more alternatives, any ofwhich might be reasonable under the circumstances but might affect the amounts of assets, liabilities, revenuesand expenses that we report. See “Note 1, Summary of Significant Accounting Policies” for a description ofour significant accounting policies.
We have identified three accounting policies as critical to the presentation of our financial condition andresults of operations. These accounting policies are described in “MD&A—Critical Accounting Policies andEstimates.” We believe these policies are critical because they require management to make particularlysubjective or complex judgments about matters that are inherently uncertain and because of the likelihood thatmaterially different amounts would be reported under different conditions or using different assumptions. Dueto the complexity of these critical accounting policies, our accounting methods relating to these policiesinvolve substantial use of models. Models are inherently imperfect predictors of actual results because they arebased on assumptions, including assumptions about future events. Our models may not include assumptionsthat reflect very positive or very negative market conditions and, accordingly, our actual results could differsignificantly from those generated by our models. As a result of the above factors, the estimates that we use toprepare our financial statements, as well as our estimates of our future results of operations, may beinaccurate, potentially significantly.
Failure of our models to produce reliable results may adversely affect our ability to manage risk and makeeffective business decisions.
We make significant use of business and financial models to measure and monitor our risk exposures and tomanage our business. For example, we use models to measure and monitor our exposures to interest rate,credit and market risks, and to forecast credit losses. The information provided by these models is used inmaking business decisions relating to strategies, initiatives, transactions, pricing and products.
Models are inherently imperfect predictors of actual results because they are based on historical data availableto us and our assumptions about factors such as future loan demand, borrower behavior, creditworthiness,
64

home price trends and other factors that may overstate or understate future experience. Models can produceunreliable results for a number of reasons, including invalid or incorrect assumptions, incorrect computercoding, flaws in data or data use, inappropriate application of a model to products or events outside themodel’s intended use and, fundamentally, the inherent limitations of relying on historical data to predict futureresults, especially in the face of unprecedented events. Adjustments to models or model results are sometimesrequired to align the results with management’s best judgment.
We continually receive new economic and mortgage market data, such as housing starts and sales and homeprice changes. Our critical accounting estimates, such as our loss reserves and other-than-temporaryimpairments, are subject to change, sometimes significantly, due to the nature and magnitude of changes inmarket conditions. However, there is generally a lag between the availability of this market information andthe preparation of our financial statements. When market conditions change quickly and in unforeseen ways,there is an increased risk that the assumptions and inputs reflected in our models are not representative of themost recent market conditions.
In addition, we may take actions that require us to rely on management judgment and adjustments to ourmodels if circumstances preclude effective execution of our standard control processes required for a formalmodel update. These control processes include model research, testing, independent validation andimplementation. In a rapidly changing environment, it may not be possible to update existing models quicklyenough to ensure they properly account for the most recently available data and events. Model adjustments area means of mitigating circumstances where models cannot be updated quickly enough, but the resulting modeloutput is only as reliable as the underlying management judgment.
If our models fail to produce reliable results on an ongoing basis, we may not make appropriate riskmanagement decisions, including decisions affecting loan purchases, management of credit losses, guaranty feepricing, asset and liability management and the management of our net worth. Any of these decisions couldadversely affect our businesses, results of operations, liquidity, net worth and financial condition. Furthermore,strategies we employ to manage the risks associated with our use of models may not be effective or fullyreliable.
Changes in interest rates or our loss of the ability to manage interest rate risk successfully, could adverselyaffect our net interest income and increase interest rate risk.
We fund our operations primarily through the issuance of debt and invest our funds primarily in mortgage-related assets that permit mortgage borrowers to prepay their mortgages at any time. These business activitiesexpose us to market risk, which is the risk of adverse changes in the fair value of financial instrumentsresulting from changes in market conditions. Our most significant market risks are interest rate risk andprepayment risk. We describe these risks in more detail in “MD&A—Risk Management—Market RiskManagement, Including Interest Rate Risk Management.” Changes in interest rates affect both the value of ourmortgage assets and prepayment rates on our mortgage loans.
Changes in interest rates could have a material adverse effect on our business, results of operations, financialcondition, liquidity and net worth. Our ability to manage interest rate risk depends on our ability to issue debtinstruments with a range of maturities and other features, including call provisions, at attractive rates and toengage in derivatives transactions. We must exercise judgment in selecting the amount, type and mix of debtand derivatives instruments that will most effectively manage our interest rate risk. The amount, type and mixof financial instruments that are available to us may not offset possible future changes in the spread betweenour borrowing costs and the interest we earn on our mortgage assets.
Our business is subject to laws and regulations that restrict our activities and operations, which mayprohibit us from undertaking activities that management believes would benefit our business and limit ourability to diversify our business.
As a federally chartered corporation, we are subject to the limitations imposed by the Charter Act, extensiveregulation, supervision and examination by FHFA and regulation by other federal agencies, including Treasury,HUD and the SEC. As a company under conservatorship, our primary regulator has management authority
65

over us in its role as our conservator. We are also subject to other laws and regulations that affect ourbusiness, including those regarding taxation and privacy.
The Charter Act defines our permissible business activities. For example, we may not originate mortgage loansor purchase single-family loans in excess of the conforming loan limits, and our business is limited to theU.S. housing finance sector. In addition, our conservator has determined that, while in conservatorship, we willnot be permitted to engage in new products and will be limited to continuing our existing business activitiesand taking actions necessary to advance the goals of the conservatorship. As a result of these limitations onour ability to diversify our operations, our financial condition and earnings depend almost entirely onconditions in a single sector of the U.S. economy, specifically, the U.S. housing market. The weak andunstable condition of the U.S. housing market over the past approximately three to four years has thereforehad a significant adverse effect on our results of operations, financial condition and net worth, which is likelyto continue.
We could be required to pay substantial judgments, settlements or other penalties as a result of pendinggovernment investigations and civil litigation.
We are subject to investigations by the Department of Justice and the SEC, and are a party to a number oflawsuits. We are unable at this time to estimate our potential liability in these matters, but may be required topay substantial judgments, settlements or other penalties and incur significant expenses in connection withthese investigations and lawsuits, which could have a material adverse effect on our business, results ofoperations, financial condition, liquidity and net worth. In addition, responding to requests for information inthese investigations and lawsuits may divert significant internal resources away from managing our business.More information regarding these investigations and lawsuits is included in “Legal Proceedings” and“Note 20, Commitments and Contingencies.”
Our common and preferred stock have been delisted from the NYSE and the Chicago Stock Exchange,which could adversely affect the market price and liquidity of our delisted securities.
Our common stock and previously-listed series of our preferred stock were delisted from the New York StockExchange and the Chicago Stock Exchange on July 8, 2010 and are now traded exclusively in theover-the-counter market. The market price of our common stock has declined significantly since June 16,2010, the date we announced our intention to delist these securities, and may decline further.
There can be no assurance that an active trading market in our equity securities will continue to exist. Ourquoted securities are likely to experience price and volume fluctuations which may be more significant thanwhen our securities were listed on a national securities exchange, which could adversely affect the marketprice of these securities. We cannot predict the actions of market makers, investors or other marketparticipants, and can offer no assurances that the market for our securities will be stable.
Mortgage fraud could result in significant financial losses and harm to our reputation.
We use a process of delegated underwriting in which lenders make specific representations and warrantiesabout the characteristics of the single-family mortgage loans we purchase and securitize. As a result, we donot independently verify most borrower information that is provided to us. This exposes us to the risk that oneor more of the parties involved in a transaction (the borrower, seller, broker, appraiser, title agent, lender orservicer) will engage in fraud by misrepresenting facts about a mortgage loan. We have experienced financiallosses resulting from mortgage fraud, including institutional fraud perpetrated by counterparties. In the future,we may experience additional financial losses or reputational damage as a result of mortgage fraud.
RISKS RELATING TO OUR INDUSTRY
A further decline in U.S. home prices or activity in the U.S. housing market would likely cause highercredit losses and credit-related expenses, and lower business volumes.
We expect weakness in the real estate financial markets to continue in 2011. The deterioration in the creditcondition of outstanding mortgages will result in the foreclosure of some troubled loans, which is likely to add
66

to excess inventory of unsold homes. We also expect heightened default and severity rates to continue duringthis period, and home prices, particularly in some geographic areas, may decline further. Any resultingincrease in delinquencies or defaults, or in severity, will likely result in a higher level of credit losses andcredit-related expenses, which in turn will reduce our earnings and adversely affect our net worth and financialcondition.
Our business volume is affected by the rate of growth in total U.S. residential mortgage debt outstanding andthe size of the U.S. residential mortgage market. The rate of growth in total U.S. residential mortgage debtoutstanding has declined substantially in response to the reduced activity in the housing market and declines inhome prices, and we expect single-family mortgage debt outstanding to decrease by approximately 2% in2011. A decline in the rate of growth in mortgage debt outstanding reduces the unpaid principal balance ofmortgage loans available for us to purchase or securitize, which in turn could reduce our net interest incomeand guaranty fee income. Even if we are able to increase our share of the secondary mortgage market, it maynot be sufficient to make up for the decline in the rate of growth in mortgage originations, which couldadversely affect our results of operations and financial condition.
The Dodd-Frank Act and regulatory changes in the financial services industry may negatively impact ourbusiness.
The Dodd-Frank Act will significantly change the regulation of the financial services industry, including bythe creation of new standards related to regulatory oversight of systemically important financial companies,derivatives transactions, asset-backed securitization, mortgage underwriting and consumer financial protection.This legislation will directly and indirectly affect many aspects of our business and could have a materialadverse effect on our business, results of operations, financial condition, liquidity and net worth. The Dodd-Frank Act and related future regulatory changes could require us to change certain business practices, cause usto incur significant additional costs, limit the products we offer, require us to increase our regulatory capital orotherwise adversely affect our business. Additionally, implementation of this legislation will result in increasedsupervision and more comprehensive regulation of our customers and counterparties in the financial servicesindustry, which may have a significant impact on the business practices of our customers and counterparties,as well as on our counterparty credit risk.
Examples of aspects of the Dodd-Frank Act and related future regulatory changes that, if applicable, maysignificantly affect us include mandatory clearing of certain derivatives transactions, which could imposesignificant additional costs on us; minimum standards for residential mortgage loans, which could subject usto increased legal risk for loans we purchase or guarantee; and the development of credit risk retentionregulations applicable to residential mortgage loan securitizations, which could impact the types and volumeof loans sold to us. We could also be designated as a systemically important nonbank financial companysubject to supervision and regulation by the Federal Reserve. If this were to occur, the Federal Reserve wouldhave the authority to examine us and could impose stricter prudential standards on us, including risk-basedcapital requirements, leverage limits, liquidity requirements, credit concentration limits, resolution plan andcredit exposure reporting requirements, overall risk management requirements, contingent capital requirements,enhanced public disclosures and short-term debt limits. Regulators have been seeking public commentregarding the criteria for designating nonbank financial companies for heightened supervision.
Because federal agencies have not completed the extensive rulemaking processes needed to implement andclarify many of the provisions of the Dodd-Frank Act, it is difficult to assess fully the impact of thislegislation on our business and industry at this time, nor can we predict what similar changes to statutes orregulations will occur in the future.
Recent revisions by the Basel Committee on Banking Supervision to international capital requirements,referred to as Basel III, may also have a significant impact on us or on the business practices of our customersand counterparties. Depending on how they are implemented by regulators, the Basel III rules could be thebasis for a revised framework for GSE capital standards that could increase our capital requirements. TheBasel III rules could also affect investor demand for our debt and MBS securities, and could limit somelenders’ ability to count their rights to service mortgage loans toward meeting their regulatory capital
67

requirements, which may reduce the economic value of mortgage servicing rights. As a result, a number ofour customers and counterparties may change their business practices.
In addition, the actions of Treasury, the CFTC, the SEC, the Federal Deposit Insurance Corporation, theFederal Reserve and international central banking authorities directly or indirectly impact financialinstitutions’ cost of funds for lending, capital raising and investment activities, which could increase ourborrowing costs or make borrowing more difficult for us. Changes in monetary policy are beyond our controland difficult to anticipate.
Legislative and regulatory changes could affect us in substantial and unforeseeable ways and could have amaterial adverse effect on our business, results of operations, financial condition, liquidity and net worth. Inparticular, these changes could affect our ability to issue debt and may reduce our customer base.
Structural changes in the financial services industry may negatively impact our business.
The financial market crisis has resulted in mergers of some of our most significant institutional counterparties.Consolidation of the financial services industry has increased and may continue to increase our concentrationrisk to counterparties in this industry, and we are and may become more reliant on a smaller number ofinstitutional counterparties. This both increases our risk exposure to any individual counterparty and decreasesour negotiating leverage with these counterparties. The structural changes in the financial services industrycould affect us in substantial and unforeseeable ways and could have a material adverse effect on our business,results of operations, financial condition, liquidity and net worth.
The occurrence of a major natural or other disaster in the United States could negatively impact our creditlosses and credit-related expenses or disrupt our business operations in the affected geographic area.
We conduct our business in the residential mortgage market and own or guarantee the performance ofmortgage loans throughout the United States. The occurrence of a major natural or environmental disaster,terrorist attack, pandemic, or similar event (a “major disruptive event”) in a regional geographic area of theUnited States could negatively impact our credit losses and credit-related expenses in the affected area.
The occurrence of a major disruptive event could negatively impact a geographic area in a number of differentways, depending on the nature of the event. A major disruptive event that either damaged or destroyedresidential real estate underlying mortgage loans in our book of business or negatively impacted the ability ofhomeowners to continue to make principal and interest payments on mortgage loans in our book of businesscould increase our delinquency rates, default rates and average loan loss severity of our book of business inthe affected region or regions, which could have a material adverse effect on our business, results ofoperations, financial condition, liquidity and net worth. While we attempt to create a geographically diversemortgage credit book of business, there can be no assurance that a major disruptive event, depending on itsmagnitude, scope and nature, will not generate significant credit losses and credit-related expenses.
Additionally, the contingency plans and facilities that we have in place may be insufficient to prevent anadverse effect on our ability to conduct business, which could lead to financial losses. Substantially all of oursenior management and investment personnel work out of our offices in the Washington, DC metropolitanarea. If a disruption occurs and our senior management or other employees are unable to occupy our offices,communicate with other personnel or travel to other locations, our ability to interact with each other and withour customers may suffer, and we may not be successful in implementing contingency plans that depend oncommunication or travel.
Item 1B. Unresolved Staff Comments
None.
Item 2. Properties
We own our principal office, which is located at 3900 Wisconsin Avenue, NW, Washington, DC, as well asadditional Washington, DC facilities at 3939 Wisconsin Avenue, NW and 4250 Connecticut Avenue, NW. Wealso own two office facilities in Herndon, Virginia, as well as two additional facilities located in Reston,
68

Virginia; and Urbana, Maryland. These owned facilities contain a total of approximately 1,459,000 square feetof space. We lease the land underlying the 4250 Connecticut Avenue building pursuant to a ground lease thatautomatically renews on July 1, 2029 for an additional 49 years unless we elect to terminate the lease byproviding notice to the landlord of our decision to terminate at least one year prior to the automatic renewaldate. In addition, we lease approximately 429,000 square feet of office space, including a conference center, at4000 Wisconsin Avenue, NW, which is adjacent to our principal office. The present lease term for the officespace at 4000 Wisconsin Avenue expires in April 2013 and we have one additional 5-year renewal optionremaining under the original lease. The lease term for the conference center at 4000 Wisconsin Avenueexpires in April 2018. We also lease an additional approximately 317,000 square feet of office space at threeother locations in Washington, DC and Virginia. We maintain approximately 723,000 square feet of officespace in leased premises in Pasadena, California; Irvine, California; Atlanta, Georgia; Chicago, Illinois;Philadelphia, Pennsylvania; and three facilities in Dallas, Texas.
Item 3. Legal Proceedings
This item describes our material legal proceedings. We describe additional material legal proceedings in“Note 20, Commitments and Contingencies” in the section titled “Litigation and Regulatory Matters,” which isincorporated herein by reference. In addition to the matters specifically described or incorporated by referencein this item, we are involved in a number of legal and regulatory proceedings that arise in the ordinary courseof business that do not have a material impact on our business. Litigation claims and proceedings of all typesare subject to many factors that generally cannot be predicted accurately.
We record reserves for legal claims when losses associated with the claims become probable and the amountscan reasonably be estimated. The actual costs of resolving legal claims may be substantially higher or lowerthan the amounts reserved for those claims. For matters where the likelihood or extent of a loss is notprobable or cannot be reasonably estimated, we have not recognized in our consolidated financial statementsthe potential liability that may result from these matters. We presently cannot determine the ultimateresolution of the matters described or incorporated by reference below. We have recorded a reserve for legalclaims related to those matters for which we were able to determine a loss was both probable and reasonablyestimable. If certain of these matters are determined against us, it could have a material adverse effect on ourresults of operations, liquidity and financial condition, including our net worth.
Shareholder Derivative Litigation
Four shareholder derivative cases, filed at various times between June 2007 and June 2008, naming certain ofour current and former directors and officers as defendants, and Fannie Mae as a nominal defendant, arecurrently pending in the U.S. District Court for the District of Columbia: Kellmer v. Raines, et al. (filedJune 29, 2007); Middleton v. Raines, et al. (filed July 6, 2007); Arthur v. Mudd, et al. (filed November 26,2007); and Agnes v. Raines, et al. (filed June 25, 2008). Three of the cases (Kellmer, Middleton, and Agnes)rely on factual allegations that Fannie Mae’s accounting statements were inconsistent with the GAAPrequirements relating to hedge accounting and the amortization of premiums and discounts. Two of the cases(Arthur and Agnes) rely on factual allegations that defendants wrongfully failed to disclose our exposure to thesubprime mortgage crisis and that the Board improperly authorized the company to buy back $100 million inshares while the stock price was artificially inflated. Plaintiffs seek, on behalf of Fannie Mae, various forms ofmonetary and non-monetary relief, including unspecified money damages (including restitution, legal fees andexpenses, disgorgement and punitive damages); corporate governance changes; an accounting; and attaching,impounding or imposing a constructive trust on the individual defendants’ assets. Pursuant to a June 25, 2009order, FHFA, as our conservator, substituted itself for shareholder plaintiffs in all of these actions. On July 27,2010, the U.S. District Court for the District of Columbia dismissed Kellmer and Middleton with prejudice andArthur and Agnes without prejudice. FHFA filed motions to reconsider the decisions dismissing Kellmer andMiddleton with prejudice, and those motions were denied on October 22, 2010. FHFA appealed that denial onNovember 22, 2010. Plaintiffs Kellmer and Agnes also appealed the substitution and the dismissal orders. OnJanuary 20, 2011, the Court of Appeals for the District of Columbia issued an order in the Kellmer appealgranting FHFA’s motions for the voluntary dismissal of defendants Kenneth M. Duberstein, Frederic Malek
69
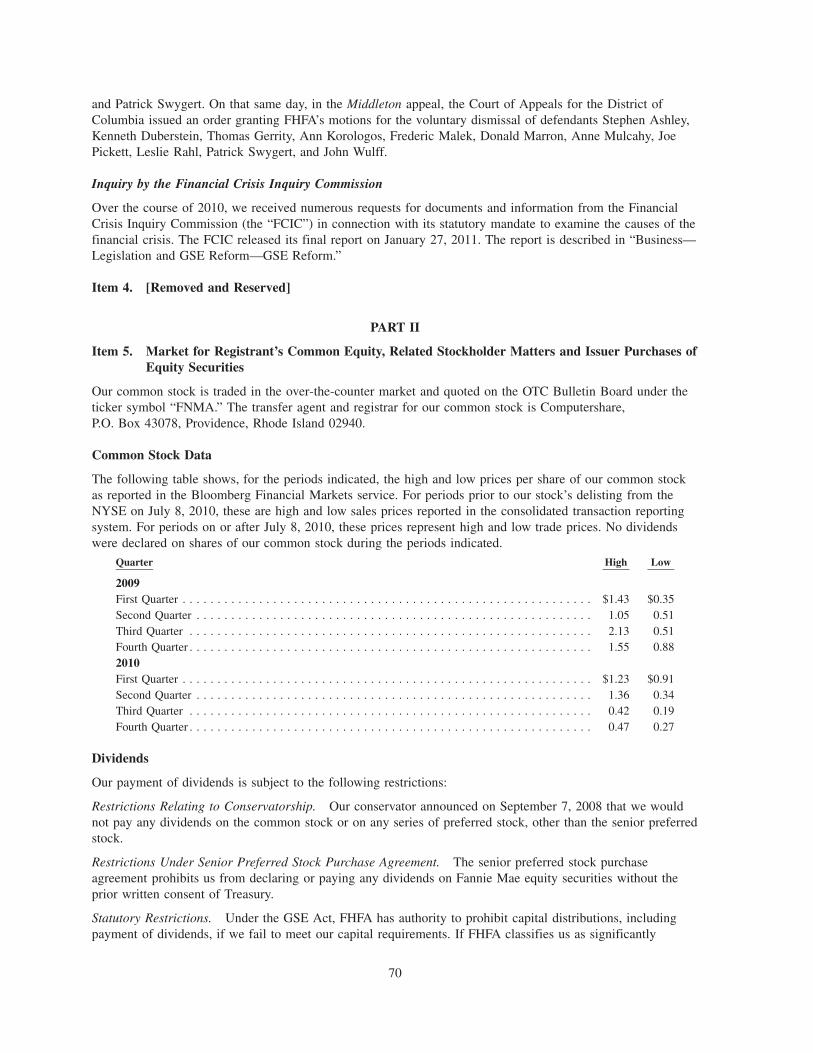
and Patrick Swygert. On that same day, in the Middleton appeal, the Court of Appeals for the District ofColumbia issued an order granting FHFA’s motions for the voluntary dismissal of defendants Stephen Ashley,Kenneth Duberstein, Thomas Gerrity, Ann Korologos, Frederic Malek, Donald Marron, Anne Mulcahy, JoePickett, Leslie Rahl, Patrick Swygert, and John Wulff.
Inquiry by the Financial Crisis Inquiry Commission
Over the course of 2010, we received numerous requests for documents and information from the FinancialCrisis Inquiry Commission (the “FCIC”) in connection with its statutory mandate to examine the causes of thefinancial crisis. The FCIC released its final report on January 27, 2011. The report is described in “Business—Legislation and GSE Reform—GSE Reform.”
Item 4. [Removed and Reserved]
PART II
Item 5. Market for Registrant’s Common Equity, Related Stockholder Matters and Issuer Purchases ofEquity Securities
Our common stock is traded in the over-the-counter market and quoted on the OTC Bulletin Board under theticker symbol “FNMA.” The transfer agent and registrar for our common stock is Computershare,P.O. Box 43078, Providence, Rhode Island 02940.
Common Stock Data
The following table shows, for the periods indicated, the high and low prices per share of our common stockas reported in the Bloomberg Financial Markets service. For periods prior to our stock’s delisting from theNYSE on July 8, 2010, these are high and low sales prices reported in the consolidated transaction reportingsystem. For periods on or after July 8, 2010, these prices represent high and low trade prices. No dividendswere declared on shares of our common stock during the periods indicated.
Quarter High Low
2009First Quarter . . . . . . . . . . . . . . . . . . . . . . . . . . . . . . . . . . . . . . . . . . . . . . . . . . . . . . . . . . . $1.43 $0.35Second Quarter . . . . . . . . . . . . . . . . . . . . . . . . . . . . . . . . . . . . . . . . . . . . . . . . . . . . . . . . . 1.05 0.51Third Quarter . . . . . . . . . . . . . . . . . . . . . . . . . . . . . . . . . . . . . . . . . . . . . . . . . . . . . . . . . . 2.13 0.51Fourth Quarter . . . . . . . . . . . . . . . . . . . . . . . . . . . . . . . . . . . . . . . . . . . . . . . . . . . . . . . . . . 1.55 0.882010First Quarter . . . . . . . . . . . . . . . . . . . . . . . . . . . . . . . . . . . . . . . . . . . . . . . . . . . . . . . . . . . $1.23 $0.91Second Quarter . . . . . . . . . . . . . . . . . . . . . . . . . . . . . . . . . . . . . . . . . . . . . . . . . . . . . . . . . 1.36 0.34Third Quarter . . . . . . . . . . . . . . . . . . . . . . . . . . . . . . . . . . . . . . . . . . . . . . . . . . . . . . . . . . 0.42 0.19Fourth Quarter . . . . . . . . . . . . . . . . . . . . . . . . . . . . . . . . . . . . . . . . . . . . . . . . . . . . . . . . . . 0.47 0.27
Dividends
Our payment of dividends is subject to the following restrictions:
Restrictions Relating to Conservatorship. Our conservator announced on September 7, 2008 that we wouldnot pay any dividends on the common stock or on any series of preferred stock, other than the senior preferredstock.
Restrictions Under Senior Preferred Stock Purchase Agreement. The senior preferred stock purchaseagreement prohibits us from declaring or paying any dividends on Fannie Mae equity securities without theprior written consent of Treasury.
Statutory Restrictions. Under the GSE Act, FHFA has authority to prohibit capital distributions, includingpayment of dividends, if we fail to meet our capital requirements. If FHFA classifies us as significantly
70

undercapitalized, approval of the Director of FHFA is required for any dividend payment. Under the GSE Act,we are not permitted to make a capital distribution if, after making the distribution, we would beundercapitalized, except the Director of FHFA may permit us to repurchase shares if the repurchase is made inconnection with the issuance of additional shares or obligations in at least an equivalent amount and willreduce our financial obligations or otherwise improve our financial condition.
Restrictions Relating to Subordinated Debt. During any period in which we defer payment of interest onqualifying subordinated debt, we may not declare or pay dividends on, or redeem, purchase or acquire, ourcommon stock or preferred stock.
Restrictions Relating to Preferred Stock. Payment of dividends on our common stock is also subject to theprior payment of dividends on our preferred stock and our senior preferred stock. Payment of dividends on alloutstanding preferred stock, other than the senior preferred stock, is also subject to the prior payment ofdividends on the senior preferred stock.
See “MD&A—Liquidity and Capital Management” for information on dividends declared and paid toTreasury on the senior preferred stock.
Holders
As of January 31, 2011, we had approximately 18,000 registered holders of record of our common stock,including holders of our restricted stock. In addition, as of January 31, 2011, Treasury held a warrant giving itthe right to purchase shares of our common stock equal to 79.9% of the total number of shares of ourcommon stock outstanding on a fully diluted basis on the date of exercise.
Recent Sales of Unregistered Securities
Under the terms of our senior preferred stock purchase agreement with Treasury, we are prohibited fromselling or issuing our equity interests, other than as required by (and pursuant to) the terms of a bindingagreement in effect on September 7, 2008, without the prior written consent of Treasury.
We previously provided stock compensation to employees and members of the Board of Directors under theFannie Mae Stock Compensation Plan of 1993 and the Fannie Mae Stock Compensation Plan of 2003 (the“Stock Compensation Plans”). Information about sales and issuances of our unregistered securities during thefirst three quarters of 2010, some of which were made pursuant to these Stock Compensation Plans, wasprovided in our quarterly reports on Form 10-Q for the quarters ended March 31, 2010, June 30, 2010 andSeptember 30, 2010 filed with the SEC on May 10, 2010, August 5, 2010 and November 5, 2010,respectively.
During the quarter ended December 31, 2010, 520,589 shares of common stock were issued upon conversionof 337,871 shares of 8.75% Non-Cumulative Mandatory Convertible Preferred Stock, Series 2008-1, at theoption of the holders pursuant to the terms of the preferred stock. All series of preferred stock, other than thesenior preferred stock, were issued prior to September 7, 2008.
The securities we issue are “exempted securities” under laws administered by the SEC to the same extent assecurities that are obligations of, or are guaranteed as to principal and interest by, the United States, exceptthat, under the GSE Act, our equity securities are not treated as exempted securities for purposes ofSection 12, 13, 14 or 16 of the Exchange Act. As a result, our securities offerings are exempt from SECregistration requirements and we do not file registration statements or prospectuses with the SEC under theSecurities Act with respect to our securities offerings.
Information about Certain Securities Issuances by Fannie Mae
Pursuant to SEC regulations, public companies are required to disclose certain information when they incur amaterial direct financial obligation or become directly or contingently liable for a material obligation under anoff-balance sheet arrangement. The disclosure must be made in a current report on Form 8-K under Item 2.03
71

or, if the obligation is incurred in connection with certain types of securities offerings, in prospectuses for thatoffering that are filed with the SEC.
Because the securities we issue are exempted securities, we do not file registration statements or prospectuseswith the SEC with respect to our securities offerings. To comply with the disclosure requirements of Form 8-Krelating to the incurrence of material financial obligations, we report our incurrence of these types ofobligations either in offering circulars or prospectuses (or supplements thereto) that we post on our Web siteor in a current report on Form 8-K that we file with the SEC, in accordance with a “no-action” letter wereceived from the SEC staff in 2004. In cases where the information is disclosed in a prospectus or offeringcircular posted on our Web site, the document will be posted on our Web site within the same time period thata prospectus for a non-exempt securities offering would be required to be filed with the SEC.
The Web site address for disclosure about our debt securities is www.fanniemae.com/debtsearch. From thisaddress, investors can access the offering circular and related supplements for debt securities offerings underFannie Mae’s universal debt facility, including pricing supplements for individual issuances of debt securities.
Disclosure about our obligations pursuant to some of the MBS we issue, some of which may be off-balancesheet obligations, can be found at www.fanniemae.com/mbsdisclosure. From this address, investors can accessinformation and documents about our MBS, including prospectuses and related prospectus supplements.
We are providing our Web site address solely for your information. Information appearing on our Web site isnot incorporated into this annual report on Form 10-K.
Purchases of Equity Securities by the Issuer
The following table shows shares of our common stock we repurchased during the fourth quarter of 2010.
TotalNumber of
SharesPurchased(1)
AveragePrice Paidper Share
Total Number ofShares Purchased as
Part of PubliclyAnnouncedProgram(2)
Maximum Number ofShares thatMay Yet be
Purchased Underthe Program(2)
(Shares in thousands)
2010
October 1-31 . . . . . . . . . . . . . . . . . . . . . . . . . 1 $0.37 — —
November 1-30 . . . . . . . . . . . . . . . . . . . . . . . 1 0.38 — —
December 1-31 . . . . . . . . . . . . . . . . . . . . . . . . 1 0.32 — —
Total . . . . . . . . . . . . . . . . . . . . . . . . . . . . . 3
(1) Consists of shares of common stock reacquired from employees to pay an aggregate of approximately $930 inwithholding taxes due upon the vesting of previously issued restricted stock. Does not include 337,871 shares of 8.75%Non-Cumulative Mandatory Convertible Series 2008-1 Preferred Stock received from holders upon conversion of thoseshares into 520,589 shares of common stock.
(2) On January 21, 2003, we publicly announced that the Board of Directors had approved an open market sharerepurchase program under which we could purchase in open market transactions the sum of (a) up to 5% of the sharesof common stock outstanding as of December 31, 2002 (49.4 million shares) and (b) additional shares to offset stockissued or expected to be issued under our employee benefit plans. Since August 2004, no shares have beenrepurchased pursuant to this program. The Board of Directors terminated this share repurchase program on October 14,2010.
72

Item 6. Selected Financial Data
The selected consolidated financial data presented below is summarized from our results of operations for thefive-year period ended December 31, 2010, as well as selected consolidated balance sheet data as of the endof each year within this five-year period. Certain prior period amounts have been reclassified to conform tothe current period presentation. This data should be reviewed in conjunction with the audited consolidatedfinancial statements and related notes and with the MD&A included in this annual report on Form 10-K.
2010(1) 2009 2008 2007 2006For the Year Ended December 31,
(Dollars and shares in millions, except per share amounts)
Statement of operations data:(2)
Net interest income . . . . . . . . . . . . . . . . . . . . . . . . . . . $ 16,409 $ 14,510 $ 8,782 $ 4,581 $ 6,752
Guaranty fee income . . . . . . . . . . . . . . . . . . . . . . . . . . 202 7,211 7,621 5,071 4,250
Net other-than-temporary impairments . . . . . . . . . . . . . . (722) (9,861) (6,974) (814) (853)
Investment gains (losses), net . . . . . . . . . . . . . . . . . . . . 346 1,458 (246) (53) 162
Fair value losses, net(3) . . . . . . . . . . . . . . . . . . . . . . . . . (511) (2,811) (20,129) (4,668) (1,744)
Administrative expenses . . . . . . . . . . . . . . . . . . . . . . . . (2,597) (2,207) (1,979) (2,669) (3,076)
Credit-related expenses(4) . . . . . . . . . . . . . . . . . . . . . . . (26,614) (73,536) (29,809) (5,012) (783)
Other income (expenses), net(5) . . . . . . . . . . . . . . . . . . . 240 (6,287) (743) (923) (84)
(Provision) benefit for federal income taxes . . . . . . . . . . 82 985 (13,749) 3,091 (166)
Net (loss) income attributable to Fannie Mae . . . . . . (14,014) (71,969) (58,707) (2,050) 4,059
Preferred stock dividends and issuance costs atredemption . . . . . . . . . . . . . . . . . . . . . . . . . . . . . . . (7,704) (2,474) (1,069) (513) (511)
Net (loss) income attributable to commonstockholders . . . . . . . . . . . . . . . . . . . . . . . . . . . (21,718) (74,443) (59,776) (2,563) 3,548
Per common share data:
Earnings (loss) per share:
Basic . . . . . . . . . . . . . . . . . . . . . . . . . . . . . . . . . . . $ (3.81) $ (13.11) $ (24.04) $ (2.63) $ 3.65
Diluted . . . . . . . . . . . . . . . . . . . . . . . . . . . . . . . . . . (3.81) (13.11) (24.04) (2.63) 3.65
Weighted-average common shares outstanding:(6)
Basic . . . . . . . . . . . . . . . . . . . . . . . . . . . . . . . . . . . 5,694 5,680 2,487 973 971
Diluted . . . . . . . . . . . . . . . . . . . . . . . . . . . . . . . . . . 5,694 5,680 2,487 973 972
Cash dividends declared per share . . . . . . . . . . . . . . . . . $ — $ — $ 0.75 $ 1.90 $ 1.18
New business acquisition data:
Fannie Mae MBS issues acquired by third parties(7) . . . . . $497,975 $496,067 $434,711 $563,648 $417,471
Mortgage portfolio purchases(8) . . . . . . . . . . . . . . . . . . . 357,573 327,578 196,645 182,471 185,507
New business acquisitions . . . . . . . . . . . . . . . . . . . . . $855,548 $823,645 $631,356 $746,119 $602,978
73

2010(1) 2009 2008 2007 2006As of December 31,
(Dollars in millions)
Balance sheet data:(2)
Investments in securities:Fannie Mae MBS . . . . . . . . . . . . . . . . . . . . . . . . . . . $ 30,226 $ 229,169 $ 234,250 $ 179,401 $ 196,678Other agency MBS . . . . . . . . . . . . . . . . . . . . . . . . . . 19,951 43,905 35,440 32,957 31,484Mortgage revenue bonds . . . . . . . . . . . . . . . . . . . . . . . 11,650 13,446 13,183 16,213 17,221Other mortgage-related securities . . . . . . . . . . . . . . . . . 56,668 54,265 56,781 90,827 97,156Non-mortgage-related securities . . . . . . . . . . . . . . . . . . 32,753 8,882 17,640 38,115 47,573
Mortgage loans:(9)
Loans held for sale . . . . . . . . . . . . . . . . . . . . . . . . . . 915 18,462 13,270 7,008 4,868Loans held for investment, net of allowance . . . . . . . . . . 2,922,805 376,099 412,142 396,516 378,687
Total assets . . . . . . . . . . . . . . . . . . . . . . . . . . . . . . . . . 3,221,972 869,141 912,404 879,389 841,469Short-term debt . . . . . . . . . . . . . . . . . . . . . . . . . . . . . . 157,243 200,437 330,991 234,160 165,810Long-term debt . . . . . . . . . . . . . . . . . . . . . . . . . . . . . . 3,039,757 574,117 539,402 562,139 601,236Total liabilities . . . . . . . . . . . . . . . . . . . . . . . . . . . . . . . 3,224,489 884,422 927,561 835,271 799,827Senior preferred stock . . . . . . . . . . . . . . . . . . . . . . . . . . 88,600 60,900 1,000 — —Preferred stock . . . . . . . . . . . . . . . . . . . . . . . . . . . . . . . 20,204 20,348 21,222 16,913 9,108Total Fannie Mae stockholders’ equity (deficit) . . . . . . . . . (2,599) (15,372) (15,314) 44,011 41,506Net worth surplus (deficit)(10) . . . . . . . . . . . . . . . . . . . . . $ (2,517) $ (15,281) $ (15,157) $ 44,118 $ 41,642
Book of business data:Total mortgage assets(11) . . . . . . . . . . . . . . . . . . . . . . . . $3,099,250 $ 769,252 $ 792,196 $ 727,903 $ 728,932Unconsolidated Fannie Mae MBS, held by third parties(12) . . 21,323 2,432,789 2,289,459 2,118,909 1,777,550Other guarantees(13) . . . . . . . . . . . . . . . . . . . . . . . . . . . . 35,619 27,624 27,809 41,588 19,747
Mortgage credit book of business . . . . . . . . . . . . . . . . . $3,156,192 $3,229,665 $3,109,464 $2,888,400 $2,526,229
Guaranty book of business(14) . . . . . . . . . . . . . . . . . . . $3,054,488 $3,097,201 $2,975,710 $2,744,237 $2,379,986
Credit quality:Nonperforming loans(15) . . . . . . . . . . . . . . . . . . . . . . . . . $ 214,752 $ 216,455 $ 119,232 $ 27,156 $ 13,846Total loss reserves. . . . . . . . . . . . . . . . . . . . . . . . . . . . . 66,251 64,891 24,753 3,391 859Total loss reserves as a percentage of total guaranty book of
business . . . . . . . . . . . . . . . . . . . . . . . . . . . . . . . . . . 2.17% 2.10% 0.83% 0.12% 0.04%Total loss reserves as a percentage of total nonperforming
loans . . . . . . . . . . . . . . . . . . . . . . . . . . . . . . . . . . . . 30.85 29.98 20.76 12.49 6.20
2010(1) 2009 2008 2007 2006For the Year Ended December 31,
Performance ratios:Net interest yield(16) . . . . . . . . . . . . . . . . . . . . 0.51% 1.65% 1.03% 0.57% 0.85%Average effective guaranty fee rate (in basis
points)(17) . . . . . . . . . . . . . . . . . . . . . . . . . . N/A 27.6 bp 31.0 bp 23.7 bp 22.2 bpCredit loss ratio (in basis points)(18) . . . . . . . . . 77.4 bp 44.6 bp 22.7 bp 5.3 bp 2.2 bpReturn on assets(19)* . . . . . . . . . . . . . . . . . . . . (0.67)% (8.27)% (6.77)% (0.30)% 0.42%
(1) As discussed in “Business—Executive Summary,” prospectively adopting the new accounting standards had asignificant impact on the presentation and comparability of our consolidated financial statements due to theconsolidation of the substantial majority of our single-class securitization trusts and the elimination of previouslyrecorded deferred revenue from our guaranty arrangements. While some line items in our consolidated statements ofoperations and balance sheet were not impacted, others were impacted significantly, which reduces the comparabilityof our results for 2010 with the results for prior years. See “Note 2, Adoption of the New Accounting Standards onthe Transfers of Financial Assets and Consolidation of Variable Interest Entities” for a further discussion of theimpact of the new accounting standards on our consolidated financial statements.
(2) Certain prior period amounts have been reclassified to conform to the current period presentation.
74
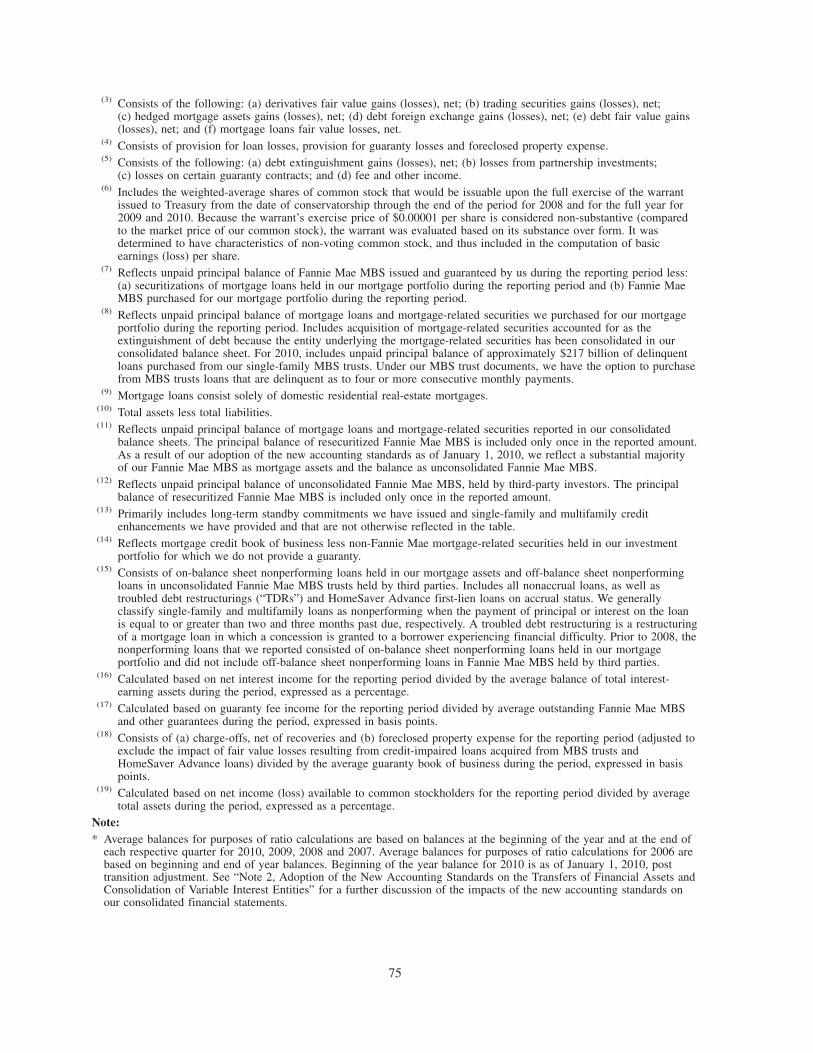
(3) Consists of the following: (a) derivatives fair value gains (losses), net; (b) trading securities gains (losses), net;(c) hedged mortgage assets gains (losses), net; (d) debt foreign exchange gains (losses), net; (e) debt fair value gains(losses), net; and (f) mortgage loans fair value losses, net.
(4) Consists of provision for loan losses, provision for guaranty losses and foreclosed property expense.(5) Consists of the following: (a) debt extinguishment gains (losses), net; (b) losses from partnership investments;
(c) losses on certain guaranty contracts; and (d) fee and other income.(6) Includes the weighted-average shares of common stock that would be issuable upon the full exercise of the warrant
issued to Treasury from the date of conservatorship through the end of the period for 2008 and for the full year for2009 and 2010. Because the warrant’s exercise price of $0.00001 per share is considered non-substantive (comparedto the market price of our common stock), the warrant was evaluated based on its substance over form. It wasdetermined to have characteristics of non-voting common stock, and thus included in the computation of basicearnings (loss) per share.
(7) Reflects unpaid principal balance of Fannie Mae MBS issued and guaranteed by us during the reporting period less:(a) securitizations of mortgage loans held in our mortgage portfolio during the reporting period and (b) Fannie MaeMBS purchased for our mortgage portfolio during the reporting period.
(8) Reflects unpaid principal balance of mortgage loans and mortgage-related securities we purchased for our mortgageportfolio during the reporting period. Includes acquisition of mortgage-related securities accounted for as theextinguishment of debt because the entity underlying the mortgage-related securities has been consolidated in ourconsolidated balance sheet. For 2010, includes unpaid principal balance of approximately $217 billion of delinquentloans purchased from our single-family MBS trusts. Under our MBS trust documents, we have the option to purchasefrom MBS trusts loans that are delinquent as to four or more consecutive monthly payments.
(9) Mortgage loans consist solely of domestic residential real-estate mortgages.(10) Total assets less total liabilities.(11) Reflects unpaid principal balance of mortgage loans and mortgage-related securities reported in our consolidated
balance sheets. The principal balance of resecuritized Fannie Mae MBS is included only once in the reported amount.As a result of our adoption of the new accounting standards as of January 1, 2010, we reflect a substantial majorityof our Fannie Mae MBS as mortgage assets and the balance as unconsolidated Fannie Mae MBS.
(12) Reflects unpaid principal balance of unconsolidated Fannie Mae MBS, held by third-party investors. The principalbalance of resecuritized Fannie Mae MBS is included only once in the reported amount.
(13) Primarily includes long-term standby commitments we have issued and single-family and multifamily creditenhancements we have provided and that are not otherwise reflected in the table.
(14) Reflects mortgage credit book of business less non-Fannie Mae mortgage-related securities held in our investmentportfolio for which we do not provide a guaranty.
(15) Consists of on-balance sheet nonperforming loans held in our mortgage assets and off-balance sheet nonperformingloans in unconsolidated Fannie Mae MBS trusts held by third parties. Includes all nonaccrual loans, as well astroubled debt restructurings (“TDRs”) and HomeSaver Advance first-lien loans on accrual status. We generallyclassify single-family and multifamily loans as nonperforming when the payment of principal or interest on the loanis equal to or greater than two and three months past due, respectively. A troubled debt restructuring is a restructuringof a mortgage loan in which a concession is granted to a borrower experiencing financial difficulty. Prior to 2008, thenonperforming loans that we reported consisted of on-balance sheet nonperforming loans held in our mortgageportfolio and did not include off-balance sheet nonperforming loans in Fannie Mae MBS held by third parties.
(16) Calculated based on net interest income for the reporting period divided by the average balance of total interest-earning assets during the period, expressed as a percentage.
(17) Calculated based on guaranty fee income for the reporting period divided by average outstanding Fannie Mae MBSand other guarantees during the period, expressed in basis points.
(18) Consists of (a) charge-offs, net of recoveries and (b) foreclosed property expense for the reporting period (adjusted toexclude the impact of fair value losses resulting from credit-impaired loans acquired from MBS trusts andHomeSaver Advance loans) divided by the average guaranty book of business during the period, expressed in basispoints.
(19) Calculated based on net income (loss) available to common stockholders for the reporting period divided by averagetotal assets during the period, expressed as a percentage.
Note:* Average balances for purposes of ratio calculations are based on balances at the beginning of the year and at the end of
each respective quarter for 2010, 2009, 2008 and 2007. Average balances for purposes of ratio calculations for 2006 arebased on beginning and end of year balances. Beginning of the year balance for 2010 is as of January 1, 2010, posttransition adjustment. See “Note 2, Adoption of the New Accounting Standards on the Transfers of Financial Assets andConsolidation of Variable Interest Entities” for a further discussion of the impacts of the new accounting standards onour consolidated financial statements.
75

Item 7. Management’s Discussion and Analysis of Financial Condition and Results of Operations
You should read this Management’s Discussion and Analysis of Financial Condition and Results of Operations(“MD&A”) in conjunction with our consolidated financial statements as of December 31, 2010 and relatednotes, and with “Business—Executive Summary.”
This report contains forward-looking statements that are based upon management’s current expectations andare subject to significant uncertainties and changes in circumstances. Please review “Business—Forward-Looking Statements” for more information on the forward-looking statements in this report and “RiskFactors” for a discussion of factors that could cause our actual results to differ, perhaps materially, from ourforward-looking statements. Please also see “MD&A—Glossary of Terms Used in This Report.”
CRITICAL ACCOUNTING POLICIES AND ESTIMATES
The preparation of financial statements in accordance with GAAP requires management to make a number ofjudgments, estimates and assumptions that affect the reported amount of assets, liabilities, income and expenses inthe consolidated financial statements. Understanding our accounting policies and the extent to which we usemanagement judgment and estimates in applying these policies is integral to understanding our financial statements.We describe our most significant accounting policies in “Note 1, Summary of Significant Accounting Policies.”
We evaluate our critical accounting estimates and judgments required by our policies on an ongoing basis andupdate them as necessary based on changing conditions. Management has discussed any significant changes injudgments and assumptions in applying our critical accounting policies with the Audit Committee of ourBoard of Directors. See “Risk Factors” for a discussion of the risk associated with the use of models. We haveidentified three of our accounting policies as critical because they involve significant judgments andassumptions about highly complex and inherently uncertain matters, and the use of reasonably differentestimates and assumptions could have a material impact on our reported results of operations or financialcondition. These critical accounting policies and estimates are as follows:
• Fair Value Measurement
• Total Loss Reserves
• Other-Than-Temporary Impairment of Investment Securities
Effective January 1, 2010, we adopted the new accounting standards on the transfers of financial assets andthe consolidation of variable interest entities. Refer to “Note 1, Summary of Significant Accounting Policies”and “Note 2, Adoption of the New Accounting Standards on the Transfers of Financial Assets andConsolidation of Variable Interest Entities” for additional information.
In this section, we discuss significant changes in the judgments and assumptions we made during 2010 inapplying our critical accounting policies, significant changes to critical estimates and the impact of the newaccounting standards on our total loss reserves.
Fair Value Measurement
The use of fair value to measure our assets and liabilities is fundamental to our financial statements and is acritical accounting estimate because we account for and record a portion of our assets and liabilities at fairvalue. In determining fair value, we use various valuation techniques. We describe the valuation techniquesand inputs used to determine the fair value of our assets and liabilities and disclose their carrying value andfair value in “Note 19, Fair Value.”
The fair value accounting rules provide a three-level fair value hierarchy for classifying financial instruments.This hierarchy is based on whether the inputs to the valuation techniques used to measure fair value areobservable or unobservable. Each asset or liability is assigned to a level based on the lowest level of any inputthat is significant to the fair value measurement. The three levels of the fair value hierarchy are described below:
Level 1: Quoted prices (unadjusted) in active markets for identical assets or liabilities.
76

Level 2: Observable market-based inputs, other than quoted prices in active markets for identical assetsor liabilities.
Level 3: Unobservable inputs.
The majority of the financial instruments that we report at fair value in our consolidated financial statements fallwithin the Level 2 category and are valued primarily utilizing inputs and assumptions that are observable in themarketplace, that can be derived from observable market data or that can be corroborated by recent tradingactivity of similar instruments with similar characteristics. For example, we generally request non-binding pricesfrom at least four independent pricing services to estimate the fair value of our trading and available-for-salesecurities at an individual security level. We use the average of these prices to determine the fair value.
In the absence of such information or if we are not able to corroborate these prices by other available, relevantmarket information, we estimate their fair values based on single source quotations from brokers or dealers orby using internal calculations or discounted cash flow techniques that incorporate inputs, such as prepaymentrates, discount rates and delinquency, default and cumulative loss expectations, that are implied by marketprices for similar securities and collateral structure types. Because this valuation technique relies on significantunobservable inputs, the fair value estimation is classified as Level 3. The process for determining fair valueusing unobservable inputs is generally more subjective and involves a high degree of management judgmentand assumptions. These assumptions may have a significant effect on our estimates of fair value, and the useof different assumptions as well as changes in market conditions could have a material effect on our results ofoperations or financial condition.
Fair Value Hierarchy—Level 3 Assets and Liabilities
The assets and liabilities that we have classified as Level 3 consist primarily of financial instruments forwhich there is limited market activity and therefore little or no price transparency. As a result, the valuationtechniques that we use to estimate the fair value of Level 3 instruments involve significant unobservableinputs, which generally are more subjective and involve a high degree of management judgment andassumptions. Our Level 3 assets and liabilities consist of certain mortgage- and asset-backed securities andresidual interests, certain mortgage loans, acquired property, partnership investments, our guaranty assets andbuy-ups, our master servicing assets, certain long-term debt arrangements and certain highly structured,complex derivative instruments.
Table 5 presents a comparison, by balance sheet category, of the amount of financial assets carried in ourconsolidated balance sheets at fair value on a recurring basis ( “recurring asset”) that were classified asLevel 3 as of December 31, 2010 and 2009. The availability of observable market inputs to measure fair valuevaries based on changes in market conditions, such as liquidity. As a result, we expect the amount of financialinstruments carried at fair value on a recurring basis and classified as Level 3 to vary each period.
Table 5: Level 3 Recurring Financial Assets at Fair Value
Balance Sheet Category 2010 2009As of December 31,
(Dollars in millions)
Trading securities . . . . . . . . . . . . . . . . . . . . . . . . . . . . . . . . . . . . . . . . . . . . . . . . . . . . . . . . $ 4,576 $ 8,861
Available-for-sale securities . . . . . . . . . . . . . . . . . . . . . . . . . . . . . . . . . . . . . . . . . . . . . . . . . 31,934 36,154
Mortgage loans. . . . . . . . . . . . . . . . . . . . . . . . . . . . . . . . . . . . . . . . . . . . . . . . . . . . . . . . . . 2,207 —
Other assets . . . . . . . . . . . . . . . . . . . . . . . . . . . . . . . . . . . . . . . . . . . . . . . . . . . . . . . . . . . . 247 2,727
Level 3 recurring assets . . . . . . . . . . . . . . . . . . . . . . . . . . . . . . . . . . . . . . . . . . . . . . . . . . . . $ 38,964 $ 47,742
Total assets . . . . . . . . . . . . . . . . . . . . . . . . . . . . . . . . . . . . . . . . . . . . . . . . . . . . . . . . . . . . $3,221,972 $869,141
Total recurring assets measured at fair value . . . . . . . . . . . . . . . . . . . . . . . . . . . . . . . . . . . . . $ 161,696 $353,718
Level 3 recurring assets as a percentage of total assets . . . . . . . . . . . . . . . . . . . . . . . . . . . . . . 1% 5%
Level 3 recurring assets as a percentage of total recurring assets measured at fair value . . . . . . . 24% 13%
Total recurring assets measured at fair value as a percentage of total assets . . . . . . . . . . . . . . . . 5% 41%
77

The decrease in assets classified as Level 3 during 2010 includes a $2.6 billion decrease due to derecognitionof guaranty assets and buy-ups at the transition date as well as net transfers of approximately $6.0 billion inassets to Level 2 from Level 3. The assets transferred from Level 3 consist primarily of Fannie Maeguaranteed mortgage-related securities and private-label mortgage-related securities.
Assets measured at fair value on a nonrecurring basis and classified as Level 3, which are not presented in thetable above, primarily include held-for-sale loans, held-for-investment loans, acquired property and partnershipinvestments. The fair value of Level 3 nonrecurring assets totaled $63.0 billion during the year endedDecember 31, 2010, and $21.2 billion during the year ended December 31, 2009.
Financial liabilities measured at fair value on a recurring basis and classified as Level 3 consisted of long-termdebt with a fair value of $1.0 billion as of December 31, 2010 and $601 million as of December 31, 2009, andderivatives liabilities with a fair value of $143 million as of December 31, 2010 and $27 million as ofDecember 31, 2009.
Fair Value Control Processes
We have control processes that are designed to ensure that our fair value measurements are appropriate andreliable, that they are based on observable inputs wherever possible and that our valuation approaches areconsistently applied and the assumptions used are reasonable. Our control processes consist of a frameworkthat provides for a segregation of duties and oversight of our fair value methodologies and valuations andvalidation procedures.
Our Valuation Oversight Committee, which includes senior representation from our three business segments,our Enterprise Risk Office and our Finance Division, is responsible for reviewing the valuation methodologiesused in our fair value measurements and any significant valuation adjustments, judgments, controls and results.Actual valuations are performed by personnel independent of our business units. Our Price Verification Group,which is an independent control group separate from the group responsible for obtaining prices, is responsiblefor performing monthly independent price verification. The Price Verification Group also performsindependent reviews of the assumptions used in determining the fair value of products we hold that havematerial estimation risk because observable market-based inputs do not exist.
Our validation procedures are intended to ensure that the individual prices we receive are consistent with ourobservations of the marketplace and prices that are provided to us by pricing services or dealers. We verifyselected prices using a variety of methods, including comparing the prices to secondary pricing services,corroborating the prices by reference to other independent market data, such as non-binding broker or dealerquotations, relevant benchmark indices, and prices of similar instruments. We review prices for reasonablenessbased on variations from prices provided in previous periods, comparing prices to internally calculatedexpected prices and conducting relative value comparisons based on specific characteristics of securities. Inaddition, we compare our derivatives valuations to counterparty valuations as part of the collateral exchangeprocess. We have formal discussions with the pricing services as part of our due diligence process in order tomaintain a current understanding of the models and related assumptions and inputs that these vendors use indeveloping prices. The prices provided to us by independent pricing services reflect the existence of creditenhancements, including monoline insurance coverage, and the current lack of liquidity in the marketplace. Ifwe determine that a price provided to us is outside established parameters, we will further examine the price,including having follow-up discussions with the pricing service or dealer. If we conclude that a price is notvalid, we will adjust the price for various factors, such as liquidity, bid-ask spreads and credit considerations.These adjustments are generally based on available market evidence. In the absence of such evidence,management’s best estimate is used. All of these processes are executed before we use the prices in preparingour financial statements.
We continually refine our valuation methodologies as markets and products develop and the pricing for certainproducts becomes more or less transparent. While we believe our valuation methods are appropriate andconsistent with those of other market participants, using different methodologies or assumptions to determinefair value could result in a materially different estimate of the fair value of some of our financial instruments.
78

The dislocation of historical pricing relationships between certain financial instruments persisted during 2010due to the housing and financial market crisis. These conditions, which have resulted in greater marketvolatility, wider credit spreads and a lack of price transparency, made the measurement of fair value moredifficult and complex for some financial instruments, particularly for financial instruments for which there isno active market, such as our guaranty contracts and loans purchased with evidence of credit deterioration.
Other-Than-Temporary Impairment of Investment Securities
We evaluate available-for-sale securities in an unrealized loss position as of the end of each quarter forother-than-temporary impairment. A debt security is evaluated for other-than-temporary impairment if its fairvalue is less than its amortized cost basis. We recognize other-than-temporary impairment in earnings if one ofthe following conditions exists: (1) our intent is to sell the security; (2) it is more likely than not that we willbe required to sell the security before the impairment is recovered; or (3) we do not expect to recover ouramortized cost basis. If, by contrast, we do not intend to sell the security and will not be required to sell priorto recovery of the amortized cost basis, we recognize only the credit component of other-than-temporaryimpairment in earnings. We record the noncredit component in other comprehensive income. The creditcomponent is the difference between the security’s amortized cost basis and the present value of its expectedfuture cash flows, while the noncredit component is the remaining difference between the security’s fair valueand the present value of expected future cash flows. If, subsequent to recognizing other-than-temporaryimpairment, our estimates of future cash flows improve, we recognize the change in estimate prospectivelyover the remaining life of securities as a component of interest income.
Our evaluation requires significant management judgment and consideration of various factors to determine if wewill receive the amortized cost basis of our investment securities. We evaluate a debt security forother-than-temporary impairment using an econometric model that estimates the present value of cash flowsgiven multiple factors. These factors include: the severity and duration of the impairment; recent events specificto the issuer and/or industry to which the issuer belongs; the payment structure of the security; external creditratings and the failure of the issuer to make scheduled interest or principal payments. We rely on expected futurecash flow projections to determine if we will recover the amortized cost basis of our available-for-sale securities.To reduce costs associated with maintaining our internal model and decrease the operational risk, in the fourthquarter of 2010, we ceased to use our internally developed model and began using a third-party model to projectcash flow estimates on our private-label securities. This model change resulted in more favorable cash flowestimates that, based on estimates as of December 31, 2010, increased the amount that we will recognizeprospectively as interest income over the remaining life of the securities by $2.5 billion.
We provide more detailed information on our accounting for other-than-temporary impairment in “Note 1,Summary of Significant Accounting Policies” and “Note 6, Investments in Securities.” Also refer to“Consolidated Balance Sheet Analysis—Investments in Mortgage-Related Securities—Investments in Private-Label Mortgage-Related Securities” for a discussion of other-than-temporary impairment recognized on ourinvestments in Alt-A and subprime private-label securities. See “Risk Factors” for a discussion of the risksassociated with possible future write-downs of our investment securities.
Total Loss Reserves
Our total loss reserves consist of the following components:
• Allowance for loan losses;
• Allowance for accrued interest receivable;
• Reserve for guaranty losses; and
• Allowance for preforeclosure property tax and insurance receivable.
These components can be further divided into single-family portions, which collectively make up our single-family loss reserves, and multifamily portions, which collectively make up our multifamily loss reserves.
We maintain an allowance for loan losses and an allowance for accrued interest receivable for loans classifiedas held for investment, including both loans we hold in our portfolio and loans held in consolidated Fannie
79

Mae MBS trusts. We maintain a reserve for guaranty losses for loans held in unconsolidated Fannie Mae MBStrusts we guarantee and loans we have guaranteed under long-term standby commitments and other creditenhancements we have provided. We also maintain an allowance for preforeclosure property tax and insurancereceivable on delinquent loans that is included in “Other assets” in our consolidated balance sheets. Theseamounts, which we collectively refer to as our total loss reserves, represent probable losses related to loans inour guaranty book of business as of the balance sheet date.
The allowance for loan losses, allowance for accrued interest receivable and allowance for preforeclosureproperty tax and insurance receivable are valuation allowances that reflect an estimate of incurred credit lossesrelated to our recorded investment in loans held for investment. The reserve for guaranty losses is a liabilityaccount in our consolidated balance sheets that reflects an estimate of incurred credit losses related to ourguaranty to each unconsolidated Fannie Mae MBS trust that we will supplement amounts received by theFannie Mae MBS trust as required to permit timely payments of principal and interest on the related FannieMae MBS. As a result, the guaranty reserve considers not only the principal and interest due on the loan atthe current balance sheet date, but also an estimate of any additional interest payments due to the trust fromthe current balance sheet date until the point of loan acquisition or foreclosure. Our loss reserves consist of aspecific loss reserve for individually impaired loans and a collective loss reserve for all other loans.
We have an established process, using analytical tools, benchmarks and management judgment, to determineour loss reserves. Although our loss reserve process benefits from extensive historical loan performance data,this process is subject to risks and uncertainties, including a reliance on historical loss information that maynot be representative of current conditions. We continually monitor delinquency and default trends and makechanges in our historically developed assumptions and estimates as necessary to better reflect presentconditions, including current trends in borrower risk and/or general economic trends, changes in riskmanagement practices, and changes in public policy and the regulatory environment. We also consider therecoveries that we expect to receive on mortgage insurance and other loan-specific credit enhancementsentered into contemporaneously with and in contemplation of a guaranty or loan purchase transaction, as suchrecoveries reduce the severity of the loss associated with defaulted loans. Due to the stress in the housing andcredit markets, and the speed and extent of deterioration in these markets, our process for determining our lossreserves has become significantly more complex and involves a greater degree of management judgment thanprior to this period of housing and mortgage market stress.
Single-Family Loss Reserves
We establish a specific single-family loss reserve for individually impaired loans, which includes loans werestructure in troubled debt restructurings, certain nonperforming loans in MBS trusts and acquired credit-impaired loans that have been further impaired subsequent to acquisition. The single-family loss reserve forindividually impaired loans has grown as a proportion of the total single-family loss reserves in recent periodsdue to increases in the population of restructured loans. We typically measure impairment based on thedifference between our recorded investment in the loan and the present value of the estimated cash flows weexpect to receive, which we calculate using the effective interest rate of the original loan or the effectiveinterest rate at acquisition for an acquired credit-impaired loan. However, when foreclosure is probable on anindividually impaired loan, we measure impairment based on the difference between our recorded investmentin the loan and the fair value of the underlying property, adjusted for the estimated discounted costs to sell theproperty and estimated insurance or other proceeds we expect to receive. We then allocate a portion of thereserve to interest accrued on the loans as of the balance sheet date.
We establish a collective single-family loss reserve for all other single-family loans in our single-family guarantybook of business using a model that estimates the probability of default of loans to derive an overall loss reserveestimate given multiple factors such as: origination year, mark-to-market LTV ratio, delinquency status and loanproduct type. We believe that the loss severity estimates we use in determining our loss reserves reflect currentavailable information on actual events and conditions as of each balance sheet date, including current homeprices. Our loss severity estimates do not incorporate assumptions about future changes in home prices. We do,however, use a look back period to develop our loss severity estimates for all loan categories. We then allocate aportion of the reserve to interest accrued on the loans as of the balance sheet date.
80

Our allowance for loan losses includes an estimate for the benefit of payments from lenders and servicers tomake us whole for losses on loans due to a breach of selling or servicing representations and warranties.Historically, this estimate was based significantly on historical cash collections. In the fourth quarter of 2010,the following factors impacted this estimate:
• we revised our methodology to take into account trends in management actions taken before cashcollections, which resulted in our allowance for loan losses being $1.1 billion higher than it would havebeen under the previous methodology; and
• agreements with seller/servicers that addressed their loan repurchase and other obligations to us impactedour expectation of future make-whole payments, resulting in a decrease in our allowance for loan lossesof approximately $700 million.
In the fourth quarter of 2010, we updated our allowance for loan loss models to incorporate more recent dataon prepayments and modified loan performance which reduced the allowance on individually impaired loansby $670 million, driven primarily by more favorable default expectations for modified loans that withstoodsuccessful trial periods. In the second quarter of 2010, we updated our allowance for loan loss model to reflecta change in our severity calculations to use mark-to-market LTV ratios rather than LTV ratios at origination,which we believe better reflects the current values of the loans. This model change resulted in a change inestimate and a decrease to our allowance for loan losses of approximately $1.6 billion.
Multifamily Loss Reserves
We establish a specific multifamily loss reserve for multifamily loans that we determine are individuallyimpaired. We use an internal credit-risk rating system, delinquency status and management judgment toevaluate the credit quality of our multifamily loans and to determine which loans we believe are impaired. Ourrisk-rating system assigns an internal rating through an assessment of the credit risk profile and repaymentprospects of each loan, taking into consideration available operating statements and expected cash flows fromthe underlying property, the estimated value of the property, the historical loan payment experience andcurrent relevant market conditions that may impact credit quality. If we conclude that a multifamily loan isimpaired, we measure the impairment based on the difference between our recorded investment in the loanand the fair value of the underlying property less the estimated discounted costs to sell the property. When amodified loan is deemed individually impaired, we measure the impairment based on the difference betweenour recorded investment in the loan and the present value of expected cash flows discounted at the loan’soriginal interest rate. However, when foreclosure is probable on an individually impaired loan, we measureimpairment based on the difference between our recorded investment in the loan and the fair value of theunderlying property, adjusted for the estimated discounted costs to sell the property and estimated insurance orother proceeds we expect to receive. We generally obtain property appraisals from independent third-parties todetermine the fair value of multifamily loans that we consider to be individually impaired. We also obtainproperty appraisals when we foreclose on a multifamily property. We then allocate a portion of the reserve tointerest accrued on the loans as of the balance sheet date.
The collective multifamily loss reserve for all other loans in our multifamily guaranty book of business isestablished using an internal model that applies loss factors to loans with similar risk ratings. Our loss factorsare developed based on our historical default and loss severity experience. Management may also applyjudgment to adjust the loss factors derived from our models, taking into consideration model imprecision andspecifically known events, such as current credit conditions, that may affect the credit quality of ourmultifamily loan portfolio but are not yet reflected in our model-generated loss factors. We then allocate aportion of the reserve to interest accrued on the loans as of the balance sheet date.
Transition Impact
Upon recognition of the mortgage loans held by newly consolidated trusts and the associated accrued interestreceivable at the transition date of our adoption of the new accounting standards, we increased our “Allowancefor loan losses” by $43.6 billion, increased our “Allowance for accrued interest receivable” by $7.0 billion anddecreased our “Reserve for guaranty losses” by $54.1 billion. The net decrease of $3.5 billion reflects the
81

difference in the methodology used to estimate incurred losses for our allowances for loans losses and accruedinterest receivable versus our reserve for guaranty losses.
Upon adoption of the new accounting standards, we derecognized the substantial majority of the “Reserve forguaranty losses” relating to loans in previously unconsolidated trusts that were consolidated in our consolidatedbalance sheet. We continue to record a reserve for guaranty losses related to loans in unconsolidated trusts and toloans that we have guaranteed under long-term standby commitments.
CONSOLIDATED RESULTS OF OPERATIONS
The section below provides a discussion of our consolidated results of operations for the periods indicated. Youshould read this section together with our consolidated financial statements including the accompanying notes.
As discussed in “Business—Executive Summary,” on January 1, 2010 we prospectively adopted newaccounting standards, which had a significant impact on the presentation and comparability of ourconsolidated financial statements. The new standards resulted in the consolidation of the substantial majorityof our single-class securitization trusts and the elimination of previously recorded deferred revenue from ourguaranty arrangements. While some line items in our consolidated statements of operations were not impacted,others were impacted significantly, which reduces the comparability of our results for 2010 with the results forprior years. The following table describes the impact to our 2010 results for those line items that wereimpacted significantly as a result of our adoption of the new accounting standards.
Item Consolidation Impact
Net interestincome
• We now recognize the underlying assets and liabilities of the substantial majority of our MBS trustsin our consolidated balance sheets, which increases both our interest-earning assets and interest-bearing liabilities and related interest income and interest expense.
• Contractual guaranty fees and the amortization of deferred cash fees received after December 31,2009 are recognized into interest income.
• We now include nonaccrual loans from the majority of our MBS trusts in our consolidated financialstatements, which decreases our net interest income as we do not recognize interest income on theseloans while we continue to recognize interest expense for amounts owed to MBS certificateholders.
• Trust management income and certain fee income from consolidated trusts are now recognized asinterest income.
Guaranty feeincome
• Upon adoption of the new accounting standards, we eliminated substantially all of our guaranty-related assets and liabilities in our consolidated balance sheets. As a result, consolidated trusts’deferred cash fees and non-cash fees through December 31, 2009 were recognized into our totaldeficit through the transition adjustment effective January 1, 2010, and we no longer recognizeincome or loss from amortizing these assets and liabilities nor do we recognize changes in their fairvalue. As noted above, we now recognize both contractual guaranty fees and the amortization ofdeferred cash fees received after December 31, 2009 through interest income, thereby reducingguaranty fee income to only those amounts related to unconsolidated trusts and other creditenhancement arrangements, such as our long-term standby commitments.
Credit-relatedexpenses
• As the majority of our trusts are consolidated, we no longer record fair value losses on credit-impaired loans acquired from the substantial majority of our trusts.
• The substantial majority of our combined loss reserves are now recognized in our allowance for loanlosses to reflect the loss allowance against the consolidated mortgage loans. We use a differentmethodology to estimate incurred losses for our allowance for loan losses as compared with ourreserve for guaranty losses, which reduces our credit-related expenses.
Investmentgains (losses),net
• Our portfolio securitization transactions that reflect transfers of assets to consolidated trusts do notqualify as sales, thereby reducing the amount we recognize as portfolio securitization gains andlosses.
• We no longer designate the substantial majority of our loans held for securitization as held-for-salebecause the substantial majority of related MBS trusts will be consolidated, thereby reducing lowerof cost or fair value adjustments.
• We no longer record gains or losses on the sale from our portfolio of the substantial majority of ouravailable-for-sale MBS because these securities were eliminated in consolidation.
82

Item Consolidation Impact
Fair valuegains (losses),net
• We no longer record fair value gains or losses on the majority of our trading MBS, thereby reducingthe amount of securities subject to recognition of changes in fair value in our consolidated statementof operations.
Other non-interestexpenses
• Upon purchase of MBS securities issued by consolidated trusts where the purchase price of the MBSdoes not equal the carrying value of the related consolidated debt, we recognize a gain or loss ondebt extinguishment.
See “Note 2, Adoption of the New Accounting Standards on the Transfers of Financial Assets andConsolidation of Variable Interest Entities” for a further discussion of the impacts of the new accountingstandards on our consolidated financial statements.
Additionally, we expect high levels of period-to-period volatility in our results of operations and financialcondition, principally due to changes in market conditions that result in periodic fluctuations in the estimatedfair value of financial instruments that we mark to market through our earnings. These instruments includetrading securities and derivatives. The estimated fair value of our trading securities and derivatives mayfluctuate substantially from period to period because of changes in interest rates, credit spreads and interestrate volatility, as well as activity related to these financial instruments.
Table 6 summarizes our consolidated results of operations for the periods indicated.
Table 6: Summary of Consolidated Results of Operations
2010 2009 2008 2010 vs. 2009 2009 vs. 2008For the Year Ended December 31, Variance
(Dollars in millions)
Net interest income . . . . . . . . . . . . . . . . . . . . . . . . . $ 16,409 $ 14,510 $ 8,782 $ 1,899 $ 5,728Guaranty fee income . . . . . . . . . . . . . . . . . . . . . . . . 202 7,211 7,621 (7,009) (410)Fee and other income(1) . . . . . . . . . . . . . . . . . . . . . . 882 773 1,033 109 (260)
Net revenues . . . . . . . . . . . . . . . . . . . . . . . . . . . . . $ 17,493 $ 22,494 $ 17,436 $ (5,001) $ 5,058
Investment gains (losses), net(2) . . . . . . . . . . . . . . . . . 346 1,458 (246) (1,112) 1,704Net other-than-temporary impairments(2) . . . . . . . . . . (722) (9,861) (6,974) 9,139 (2,887)Fair value losses, net . . . . . . . . . . . . . . . . . . . . . . . . (511) (2,811) (20,129) 2,300 17,318Losses from partnership investments . . . . . . . . . . . . . (74) (6,735) (1,554) 6,661 (5,181)Administrative expenses . . . . . . . . . . . . . . . . . . . . . . (2,597) (2,207) (1,979) (390) (228)Credit-related expenses(3) . . . . . . . . . . . . . . . . . . . . . (26,614) (73,536) (29,809) 46,922 (43,727)Other non-interest expenses(4) . . . . . . . . . . . . . . . . . . (1,421) (1,809) (1,315) 388 (494)
Loss before federal income taxes and extraordinarylosses . . . . . . . . . . . . . . . . . . . . . . . . . . . . . . . . . (14,100) (73,007) (44,570) 58,907 (28,437)
Benefit (provision) for federal income taxes . . . . . . . . 82 985 (13,749) (903) 14,734Extraordinary losses, net of tax effect . . . . . . . . . . . . — — (409) — 409
Net loss . . . . . . . . . . . . . . . . . . . . . . . . . . . . . . . . . (14,018) (72,022) (58,728) 58,004 (13,294)Less: Net loss attributable to the noncontrolling
interest . . . . . . . . . . . . . . . . . . . . . . . . . . . . . . . . 4 53 21 (49) 32
Net loss attributable to Fannie Mae . . . . . . . . . . . . $(14,014) $(71,969) $(58,707) $57,955 $(13,262)
(1) Certain prior period amounts have been reclassified to conform to the current period presentation. Trust managementincome is included in fee and other income.
(2) Prior to an April 2009 change in accounting for impairments, net other-than-temporary impairments also included thenon-credit portion, which in subsequent periods is recorded in other comprehensive income.
(3) Consists of provision for loan losses, provision for guaranty losses and foreclosed property expense.(4) Consists of debt extinguishment losses, net and other expenses.
83

Net Interest Income
Net interest income represents the difference between interest income and interest expense and is a primarysource of our revenue. The amount of interest income and interest expense we recognize in the consolidatedstatements of operations is affected by our investment activity, our debt activity, asset yields and our fundingcosts.
Table 7 presents an analysis of our net interest income, average balances, and related yields earned on assetsand incurred on liabilities for the periods indicated. For most components of the average balances, we used adaily weighted average of amortized cost. When daily average balance information was not available, such asfor mortgage loans, we used monthly averages. Table 8 presents the change in our net interest income betweenperiods and the extent to which that variance is attributable to: (1) changes in the volume of our interest-earning assets and interest-bearing liabilities; or (2) changes in the interest rates of these assets and liabilities.In 2010, we changed the presentation to distinguish the change in net interest income of Fannie Mae from thechange in net interest income of consolidated trusts. Prior period results have been revised to conform to thecurrent period presentation.
84

Table 7: Analysis of Net Interest Income and Yield
AverageBalance
InterestIncome/Expense
AverageRates
Earned/PaidAverageBalance
InterestIncome/Expense
AverageRates
Earned/PaidAverageBalance
InterestIncome/Expense
AverageRates
Earned/Paid
2010 2009 2008For the Year Ended December 31,
(Dollars in millions)
Interest-earning assets:Mortgage loans of Fannie Mae(1) . . . $ 362,785 $ 14,992 4.13% $321,394 $15,378 4.78% $344,922 $18,547 5.38%Mortgage loans of consolidated
trusts(1) . . . . . . . . . . . . . . . . . . 2,619,258 132,591 5.06 104,385 6,143 5.88 71,694 4,145 5.78
Total mortgage loans . . . . . . . . . 2,982,043 147,583 4.95 425,779 21,521 5.05 416,616 22,692 5.45Mortgage-related securities . . . . . . . 387,798 19,552 5.04Elimination of Fannie Mae MBS held
in portfolio . . . . . . . . . . . . . . . (250,748) (13,232) 5.28
Total mortgage-related securities,net . . . . . . . . . . . . . . . . . . . 137,050 6,320 4.61 347,467 17,230 4.96 332,442 17,344 5.22
Non-mortgage securities(2) . . . . . . . 91,613 221 0.24 53,724 247 0.46 60,230 1,748 2.90Federal funds sold and securities
purchased under agreements toresell or similar arrangements . . . . 28,685 62 0.22 46,073 260 0.56 41,991 1,158 2.76
Advances to lenders . . . . . . . . . . . 3,523 84 2.38 4,580 97 2.12 3,521 181 5.14
Total interest-earning assets . . . . . . . . $3,242,914 $154,270 4.76% $877,623 $39,355 4.48% $854,800 $43,123 5.04%
Interest-bearing liabilities:Short-term debt . . . . . . . . . . . . . . $ 212,741 $ 619 0.29% $280,215 $ 2,305 0.82% $277,503 $ 7,806 2.81%Long-term debt . . . . . . . . . . . . . . 583,369 18,857 3.23 561,907 22,195 3.95 543,358 26,145 4.81
Total short-term and long-termfunding debt . . . . . . . . . . . . . 796,110 19,476 2.45 842,122 24,500 2.91 820,861 33,951 4.14
Federal funds purchased andsecurities sold underagreements to repurchase . . . . . . . 43 — 0.14 45 1 1.44 428 9 2.10
Debt securities of consolidatedtrusts . . . . . . . . . . . . . . . . . . . 2,682,434 131,617 4.91
Elimination of Fannie Mae MBS heldin portfolio . . . . . . . . . . . . . . . (250,748) (13,232) 5.28
Total debt securities ofconsolidated trusts held by thirdparties . . . . . . . . . . . . . . . . . 2,431,686 118,385 4.87 6,033 344 5.70 6,475 381 5.88
Total interest-bearing liabilities . . . . . . $3,227,839 $137,861 4.27% $848,200 $24,845 2.93% $827,764 $34,341 4.15%
Impact of net non-interest bearingfunding . . . . . . . . . . . . . . . . . . . $ 15,075 0.02% $ 29,423 0.10% $ 27,036 0.14%
Net interest income/net interest yield . . $ 16,409 0.51% $14,510 1.65% $ 8,782 1.03%
Net interest income/net interest yield ofconsolidated trusts . . . . . . . . . . . . $ 974 0.04%
Selected benchmark interest rates atend of period:(3)
3-month LIBOR . . . . . . . . . . . . . . 0.30% 0.25% 1.43%2-year swap interest rate . . . . . . . . . 0.80 1.42 1.475-year swap interest rate . . . . . . . . . 2.17 2.98 2.1330-year Fannie Mae MBS par coupon
rate . . . . . . . . . . . . . . . . . . . . 4.13 4.56 3.89
(1) Interest income includes interest income on acquired credit-impaired loans of $2.2 billion, $619 million and$634 million for 2010, 2009 and 2008, respectively. These amounts include accretion income of $1.0 billion,$405 million and $158 million for 2010, 2009 and 2008, respectively, relating to a portion of the fair value lossesrecorded upon the acquisition of the loans. Average balance includes loans on nonaccrual status, for which interestincome is recognized when collected.
(2) Includes cash equivalents.(3) Data from British Bankers’ Association, Thomson Reuters Indices and Bloomberg.
85

Table 8: Rate/Volume Analysis of Changes in Net Interest Income
TotalVariance Volume Rate
TotalVariance Volume Rate
Variance Due to:(1) Variance Due to:(1)
2010 vs. 2009 2009 vs. 2008
(Dollars in millions)
Interest income:Mortgage loans of Fannie Mae . . . . . . . . . . . . . . $ (386) $ 1,849 $(2,235) $(3,169) $(1,212) $ (1,957)Mortgage loans of consolidated trusts . . . . . . . . . 126,448 127,426 (978) 1,998 1,923 75
Total mortgage loans . . . . . . . . . . . . . . . . . . . 126,062 129,275 (3,213) (1,171) 711 (1,882)Total mortgage-related securities, net . . . . . . . . . . (10,910) (9,779) (1,131) (114) 765 (879)Non-mortgage securities(2) . . . . . . . . . . . . . . . . . (26) 125 (151) (1,501) (171) (1,330)Federal funds sold and securities purchased under
agreements to resell or similar arrangements . . . (198) (75) (123) (898) 103 (1,001)Advances to lenders . . . . . . . . . . . . . . . . . . . . . . (13) (24) 11 (84) 44 (128)
Total interest income . . . . . . . . . . . . . . . . . . . . . . . 114,915 119,522 (4,607) (3,768) 1,452 (5,220)
Interest expense:Short-term debt . . . . . . . . . . . . . . . . . . . . . . . . . (1,686) (458) (1,228) (5,501) 76 (5,577)Long-term debt . . . . . . . . . . . . . . . . . . . . . . . . . (3,338) 821 (4,159) (3,950) 867 (4,817)
Total short-term and long-term funding debt . . . . . (5,024) 363 (5,387) (9,451) 943 (10,394)Federal funds purchased and securities sold under
agreements to repurchase . . . . . . . . . . . . . . . . (1) — (1) (8) (6) (2)Total debt securities of consolidated trusts held by
third parties . . . . . . . . . . . . . . . . . . . . . . . . . . 118,041 118,099 (58) (37) (25) (12)
Total interest expense . . . . . . . . . . . . . . . . . . . . . . 113,016 118,462 (5,446) (9,496) 912 (10,408)
Net interest income . . . . . . . . . . . . . . . . . . . . . . . . $ 1,899 $ 1,060 $ 839 $ 5,728 $ 540 $ 5,188
(1) Combined rate/volume variances are allocated to both rate and volume based on the relative size of each variance.(2) Includes cash equivalents.
Net interest income increased during 2010 compared with 2009 primarily as a result of an increase in interestincome due to the recognition of contractual guaranty fees in interest income upon adoption of the newaccounting standards and a reduction in the interest expense on debt that we have issued as lower borrowingrates allowed us to replace higher-cost debt with lower-cost debt. Partially offsetting these positive effects for2010 was lower interest income from the interest earning assets that we own due to lower yields on ourmortgage and non-mortgage assets. The increase in net interest income was further offset by a significantincrease in the number of loans on nonaccrual status in our consolidated balance sheets, because we do notrecognize interest income on loans that have been placed on nonaccrual status, except when cash payments arereceived. The increase in loans on nonaccrual status in 2010 was due to our adoption of the new accountingstandards.
For 2010, interest income that we did not recognize for nonaccrual mortgage loans, net of recoveries, was$8.4 billion, which resulted in a 26 basis point reduction in net interest yield, compared with $1.2 billion for2009, which resulted in a 14 basis point reduction in net interest yield and $381 million for 2008, whichresulted in a 4 basis point reduction in net interest yield. Of the $8.4 billion of interest income that we did notrecognize for nonaccrual mortgage loans for 2010, $4.7 billion was related to the unsecuritized mortgage loansthat we own.
Net interest yield significantly decreased for 2010 compared with 2009. We recognize the contractual guarantyfee and the amortization of deferred cash fees received after December 31, 2009 on the underlying mortgageloans of consolidated trusts as interest income, which represents the spread between the net interest yield onthe underlying mortgage assets and the rate on the debt of the consolidated trusts. Upon adoption of the newaccounting standards, our interest-earning assets and interest-bearing liabilities both increased by
86

approximately $2.4 trillion. The lower spread on these interest-earning assets and liabilities reduced our netinterest yield for 2010 as compared with 2009.
Net interest income and net interest yield increased during 2009 compared with 2008, driven by lower fundingcosts and by growth in the average size of our mortgage portfolio. The significant reduction in the averagecost of our debt was primarily attributable to a decline in borrowing rates as we replaced higher cost debt withlower cost debt.
During 2008, we increased our portfolio balance as mortgage-to-debt spreads reached historic highs, andliquidations were reduced due to the disruption of the housing and credit markets. As a result, we began 2009with a substantially higher balance of interest-earning assets compared with the beginning of 2008. Althoughportfolio actions and high liquidation levels reduced our balance of interest-earning assets during the course of2009, the higher beginning balance resulted in a higher average balance of interest-earning assets for the fullyear of 2009 compared with 2008.
The net interest income for our Capital Markets group reflects interest income from the assets we havepurchased and the interest expense from the debt we have issued. See “Business Segment Results” for adetailed discussion of our Capital Markets group’s net interest income.
Guaranty Fee Income
Guaranty fee income primarily consists of contractual guaranty fees related to unconsolidated Fannie MaeMBS trusts and other credit enhancement arrangements. Guaranty fee income also includes adjustments for theamortization of deferred cash and non-cash fees and fair value adjustments related to our guaranty to thetrusts. Beginning January 1, 2010, the vast majority of guaranty fees related to Fannie Mae trusts are reflectedin interest income on a consolidated basis due to our adoption of new accounting standards that require us toconsolidate the substantial majority of our MBS trusts. At adoption of the new accounting standards, ourguaranty-related assets and liabilities pertaining to previously unconsolidated trusts were eliminated; therefore,we no longer recognize amortization of previously recorded deferred cash and non-cash fees or fair valueadjustments related to our guaranty to these trusts.
Guaranty fee income decreased in 2010 compared with 2009 because, as noted above, we now recognize bothcontractual guaranty fees and the amortization of deferred cash fees received after December 31, 2009 throughinterest income, thereby reducing guaranty fee income to only those amounts related to unconsolidated trustsand other credit enhancement arrangements, such as our long-term standby commitments.
The decrease in guaranty fee income in 2009 compared with 2008 resulted primarily from a decrease in theaverage effective guaranty fee rate as a sharp decline in interest rates generated an acceleration of deferredamounts into income during 2008. In addition, the effective guaranty fee rate declined due to a lower averagecharged fee on new acquisitions due to a reduction in our acquisition of loans with higher risk characteristics.This decline was partially offset by higher fair value adjustments on buy-ups and certain guaranty assetsrecorded in 2009 and an increase in average outstanding Fannie Mae MBS and other guarantees.
Fee and Other Income
Fee and other income includes transaction fees, technology fees and multifamily fees. Beginning in 2010, feeand other income also includes trust management income we earn as master servicer, issuer, and trustee forFannie Mae MBS relating only to unconsolidated trusts. Upon adoption of the new accounting standards, wereport trust management income earned by consolidated trusts as a component of net interest income in ourconsolidated statement of operations. We derive trust management income from the interest earned on cashflows between the date of remittance of mortgage and other payments to us by servicers and the date of thedistribution of these payments to MBS certificateholders.
The increase in fee and other income in 2010 compared with 2009 was primarily attributable to an increase intransaction fees due to a higher volume of structured Fannie Mae MBS created for third parties.
87

The decrease in fee and other income in 2009 as compared with 2008 was primarily attributable to lower trustmanagement income due to a significant decline in short-term interest rates.
Investment Gains (Losses), Net
Investment gains and losses, net consist of: gains and losses recognized on the securitization of loans andsecurities from our portfolio; gains and losses recognized from the sale of available-for-sale securities; gainsand losses on the consolidation and deconsolidation of securities; lower of cost or fair value adjustments onheld-for-sale loans; and other investment gains and losses. Investment gains and losses may fluctuatesignificantly from period to period depending upon our portfolio investment and securitization activities.Investment gains declined in 2010 compared with 2009 due to a decline in gains from securitizations and ingains from sales of available-for-sale securities as a result of adopting the new accounting standards. Underthese standards, our portfolio securitization transactions that reflect transfers of assets to consolidated trusts nolonger qualify for sale treatment, which reduced our portfolio securitization gains and losses. We no longerrecord gains and losses on the sale from our portfolio of the substantial majority of available-for-sale FannieMae MBS because these securities were eliminated in consolidation. The decline in investment gains in 2010was partially offset by a decrease in lower of cost or fair value adjustments on held-for-sale loans due to thereclassification of most of our held-for-sale loans to held for investment upon adoption of the new accountingstandards.
The shift to gains in 2009 compared with losses in 2008 was primarily attributable to increased securitizationgains due to MBS issuances and sales related to whole loan conduit activity and increased gains onavailable-for-sale securities due to tightening of investment spreads on agency MBS, which led to higher saleprices. These gains were partially offset by an increase in lower of cost or fair value adjustments on loansprimarily driven by a decline in the credit quality of these loans and an increase in interest rates.
Net Other-Than-Temporary Impairment
The net other-than-temporary impairment charges recorded in 2010 were primarily driven by a net decline inforecasted home prices for certain geographic regions, which resulted in a decrease in the present value of ourcash flow projections on Alt-A and subprime securities. Net other-than-temporary impairment decreased in2010 compared with 2009 due to slower deterioration of the estimated credit component of the fair valuelosses of these securities. In addition, net other-than-temporary impairment decreased in 2010 compared with2009 because, effective beginning in the second quarter of 2009, we recognize only the credit portion ofother-than-temporary impairment in our consolidated statements of operations due to the adoption of a newother-than-temporary impairment accounting standard. The net other-than-temporary impairment chargerecorded prior to April 1, 2009 included both the credit and non-credit components of the loss in fair value.Approximately 57% of the impairment recorded in 2009 was recorded in the first quarter of 2009 prior to thechange in accounting standards. See “Note 6, Investments in Securities” for additional information regardingthe net other-than-temporary impairment recognized in 2010. The increase in net other-than-temporaryimpairment in 2009 compared with 2008 was principally related to an increase in the expected losses on ourprivate-label securities.
Fair Value Losses, Net
Table 9 presents the components of fair value gains and losses.
88

Table 9: Fair Value Losses, Net
2010 2009 2008For the Year Ended December 31,
(Dollars in millions)
Risk management derivatives fair value losses attributable to:
Net contractual interest expense accruals on interest rate swaps . . . . . . . . . . . . . . $(2,895) $(3,359) $ (1,576)
Net change in fair value during the period . . . . . . . . . . . . . . . . . . . . . . . . . . . . . 1,088 (1,337) (13,387)
Total risk management derivatives fair value losses, net . . . . . . . . . . . . . . . . . . (1,807) (4,696) (14,963)
Mortgage commitment derivatives fair value losses, net . . . . . . . . . . . . . . . . . . . . . . (1,193) (1,654) (453)
Total derivatives fair value losses, net . . . . . . . . . . . . . . . . . . . . . . . . . . . . . . . . . . (3,000) (6,350) (15,416)
Trading securities gains (losses), net . . . . . . . . . . . . . . . . . . . . . . . . . . . . . . . . . . . 2,692 3,744 (7,040)
Hedged mortgage assets gains, net(1) . . . . . . . . . . . . . . . . . . . . . . . . . . . . . . . . . . . — — 2,154
Debt foreign exchange gains (losses), net . . . . . . . . . . . . . . . . . . . . . . . . . . . . . . . . (77) (173) 230
Debt fair value gains (losses), net . . . . . . . . . . . . . . . . . . . . . . . . . . . . . . . . . . . . . 5 (32) (57)
Mortgage loans fair value losses, net . . . . . . . . . . . . . . . . . . . . . . . . . . . . . . . . . . . (131) — —
Fair value losses, net . . . . . . . . . . . . . . . . . . . . . . . . . . . . . . . . . . . . . . . . . . . . $ (511) $(2,811) $(20,129)
2010 2009 2008
5-year swap interest rate:
As of March 31 . . . . . . . . . . . . . . . . . . . . . . . . . . . . . . . . . . . . . . . . . . . . . . . . . . . . . . . 2.73% 2.22% 3.31%
As of June 30. . . . . . . . . . . . . . . . . . . . . . . . . . . . . . . . . . . . . . . . . . . . . . . . . . . . . . . . . 2.06 2.97 4.26
As of September 30 . . . . . . . . . . . . . . . . . . . . . . . . . . . . . . . . . . . . . . . . . . . . . . . . . . . . 1.51 2.65 4.11
As of December 31 . . . . . . . . . . . . . . . . . . . . . . . . . . . . . . . . . . . . . . . . . . . . . . . . . . . . . 2.18 2.98 2.13
(1) Represents adjustments to the carrying value of mortgage assets designated for hedge accounting that are attributableto changes in interest rates.
Risk Management Derivatives Fair Value Losses, Net
Risk management derivative instruments are an integral part of our management of interest rate risk. Wesupplement our issuance of debt securities with derivative instruments to further reduce duration andprepayment risks. We generally are the purchaser of risk management derivatives. In cases where optionsobtained through callable debt issuances are not needed for risk management derivative purposes, we may selloptions in the over-the-counter derivatives market in order to offset the options obtained in the callable debt.Our principal purpose in using derivatives is to manage our aggregate interest rate risk profile withinprescribed risk parameters. We generally use only derivatives that are relatively liquid and straightforward tovalue. We consider the cost of derivatives used in our management of interest rate risk to be an inherent partof the cost of funding and hedging our mortgage investments and economically similar to the interest expensethat we recognize on the debt we issue to fund our mortgage investments.
We present, by derivative instrument type, the fair value gains and losses on our derivatives for the yearsended December 31, 2010, 2009 and 2008 in “Note 10, Derivative Instruments and Hedging Activities.”
The primary factors affecting the fair value of our risk management derivatives include the following.
• Changes in interest rates: Our derivatives, in combination with our issuances of debt securities, areintended to offset changes in the fair value of our mortgage assets, which tend to increase in value wheninterest rates decrease and, conversely, decrease in value when interest rates rise. Pay-fixed swapsdecrease in value and receive-fixed swaps increase in value as swap interest rates decrease (with theopposite being true when swap interest rates increase). Because the composition of our pay-fixed andreceive-fixed derivatives varies across the yield curve, the overall fair value gains and losses of ourderivatives are sensitive to flattening and steepening of the yield curve.
89

• Implied interest rate volatility: Our derivatives portfolio includes option-based derivatives, which we useto economically hedge the prepayment option embedded in our mortgage investments. A key variable inestimating the fair value of option-based derivatives is implied volatility, which reflects the market’sexpectation of the magnitude of future changes in interest rates. Assuming all other factors are held equal,including interest rates, a decrease in implied volatility would reduce the fair value of our purchasedoptions and an increase in implied volatility would increase the fair value of our purchased options.
• Changes in our derivative activity: As interest rates change, we are likely to take actions to rebalanceour portfolio to manage our interest rate exposure. As interest rates decrease, expected mortgageprepayments are likely to increase, which reduces the duration of our mortgage investments. In thisscenario, we generally will rebalance our existing portfolio to manage this risk by terminating pay-fixedswaps or adding receive-fixed swaps, which shortens the duration of our liabilities. Conversely, wheninterest rates increase and the duration of our mortgage assets increases, we are likely to rebalance ourexisting portfolio by adding pay-fixed swaps that have the effect of extending the duration of ourliabilities. We use foreign-currency swaps to manage the foreign exchange impact of our foreign currencydenominated debt issuances. We also use derivatives in various interest rate environments to hedge therisk of incremental mortgage purchases that we are not able to accomplish solely through our issuance ofdebt securities.
• Time value of purchased options: Intrinsic value and time value are the two primary components of anoption’s price. The intrinsic value is the amount that can be immediately realized by exercising theoption—the amount by which the market rate exceeds or is below the exercise, or strike rate, such thatthe option is in-the-money. The time value of an option is the amount by which the price of an optionexceeds its intrinsic value. Time decay refers to the diminishing value of an option over time as less timeremains to exercise the option. We have a significant amount of purchased options where the time valueof the upfront premium we pay decreases due to the passage of time.
We recorded risk management derivative fair value losses in 2010 primarily as a result of: (1) time decay onour purchased options; (2) a decrease in the fair value of our pay-fixed derivatives due to a decline in swapinterest rates during the first quarter of 2010; and (3) a decrease in implied interest rate volatility, whichreduced the fair value of our purchased options.
Risk management derivative losses in 2009 were driven by losses on our receive-fixed swaps and receive-fixedoption-based derivatives due to an increase in swap interest rates and by time decay on our purchased options,partially offset by gains on our net-pay fixed book due to higher swap interest rates.
We recorded risk management derivative losses in 2008 primarily attributable to the decline in swap interestrates, which resulted in substantial fair value losses on our pay-fixed swaps that exceeded our fair value gainson our receive-fixed swaps.
Because risk management derivatives are an important part of our interest rate risk management strategy, it isimportant to evaluate the impact of our derivatives in the context of our overall interest rate risk profile and inconjunction with the other offsetting mark-to-market gains and losses presented in Table 9. For additionalinformation on our use of derivatives to manage interest rate risk, including the economic objective of our useof various types of derivative instruments, changes in our derivatives activity and the outstanding notionalamounts, see “Risk Management—Market Risk Management, Including Interest Rate Risk Management—Interest Rate Risk Management.” See “Consolidated Balance Sheet Analysis—Derivative Instruments” for adiscussion of the effect of derivatives on our consolidated balance sheets.
Mortgage Commitment Derivatives Fair Value Losses, Net
Commitments to purchase or sell some mortgage-related securities and to purchase single-family mortgageloans are generally accounted for as derivatives. For open mortgage commitment derivatives, we includechanges in their fair value in our consolidated statements of operations. When derivative purchasecommitments settle, we include the fair value of the commitment on the settlement date in the cost basis ofthe loan or security we purchase. When derivative commitments to sell securities settle, we include the fair
90
value of the commitment on the settlement date in the cost basis of the security we sell. Purchases and salesof securities issued by our consolidated MBS trusts are treated as extinguishment or issuance of debt,respectively. For commitments to purchase and sell securities issued by our consolidated MBS trusts, werecognize the fair value of the commitment on the settlement date as a component of debt extinguishmentgains and losses or in the cost basis of the debt issued, respectively. In 2010 and 2009, the majority of ourmortgage commitments were commitments to sell mortgage-related securities and we recognized losses due totheir increased prices during the commitment period. Additionally, mortgage commitment losses in 2009 wereassociated with a large volume of dollar roll transactions. Mortgage commitment derivative losses in 2008were primarily driven by losses on our securities purchase commitments as mortgage-related securities pricesdecreased during the commitment period.
Trading Securities Gains (Losses), Net
Gains from trading securities in 2010 were primarily driven by a decrease in interest rates and narrowing ofcredit spreads, primarily on CMBS. The decline in gains from trading securities in 2010 compared with 2009was primarily due to lower gains on non-mortgage securities because credit spreads were relatively flat in2010 compared with significant narrowing of credit spreads in 2009. Gains from trading securities in 2009were primarily attributable to the narrowing of spreads on CMBS, agency MBS and non-mortgage relatedsecurities, partially offset by an increase in interest rates. The losses from trading securities in 2008 wereprimarily attributable to widening of spreads, particularly on private-label mortgage-related securities backedby Alt-A and subprime loans and CMBS, as well as losses on non-mortgage securities in our cash and otherinvestments portfolio.
We provide additional information on our trading and available-for-sale securities in “Consolidated BalanceSheet Analysis—Trading and Available-for-Sale Investment Securities” and disclose the sensitivity of changesin the fair value of our trading securities to changes in interest rates in “Risk Management—Market RiskManagement, Including Interest Rate Risk Management—Measurement of Interest Rate Risk.”
Hedged Mortgage Assets Gains, Net
We applied hedge accounting during a period of time in 2008. We did not have any derivatives designated ashedges during 2010 or 2009.
Our hedge accounting relationships during 2008 consisted of pay-fixed interest rate swaps designated as fairvalue hedges of changes in the fair value, attributable to changes in the LIBOR benchmark interest rate, ofspecified mortgage assets. These fair value accounting hedges resulted in gains on the hedged mortgage assetsof $2.2 billion for 2008, which were offset by losses of $2.2 billion on the pay-fixed swaps designated ashedging instruments. The losses on these pay-fixed swaps are included as a component of derivatives fairvalue losses, net.
Losses from Partnership Investments
We are a limited liability investor in LIHTC and non-LIHTC investments formed for the purpose of providingequity funding for affordable multifamily rental properties. Historically, we generally received tax benefits (taxcredits and tax deductions for net operating losses) on our LIHTC investments that we used to reduce ourincome tax expense. Given our current tax position, it is unlikely that we will be able to use the tax benefitsthat we expect to receive this year and in the future from these LIHTC investments.
Losses from partnership investments declined significantly during 2010 because we no longer recognize netoperating losses or impairment on our LIHTC investments. During 2009, we explored options to sell orotherwise transfer our LIHTC investments for value consistent with our mission. On February 18, 2010, FHFAinformed us by letter that, after consultation with Treasury, we may not sell or transfer our LIHTC partnershipinterests and that FHFA sees no disposition options. Therefore, we no longer have the intent and ability to sellor otherwise transfer our LIHTC investments for value. As a result, we recognized a loss of $5.0 billion duringthe fourth quarter of 2009 to reduce the carrying value of our LIHTC partnership investments to zero in our
91
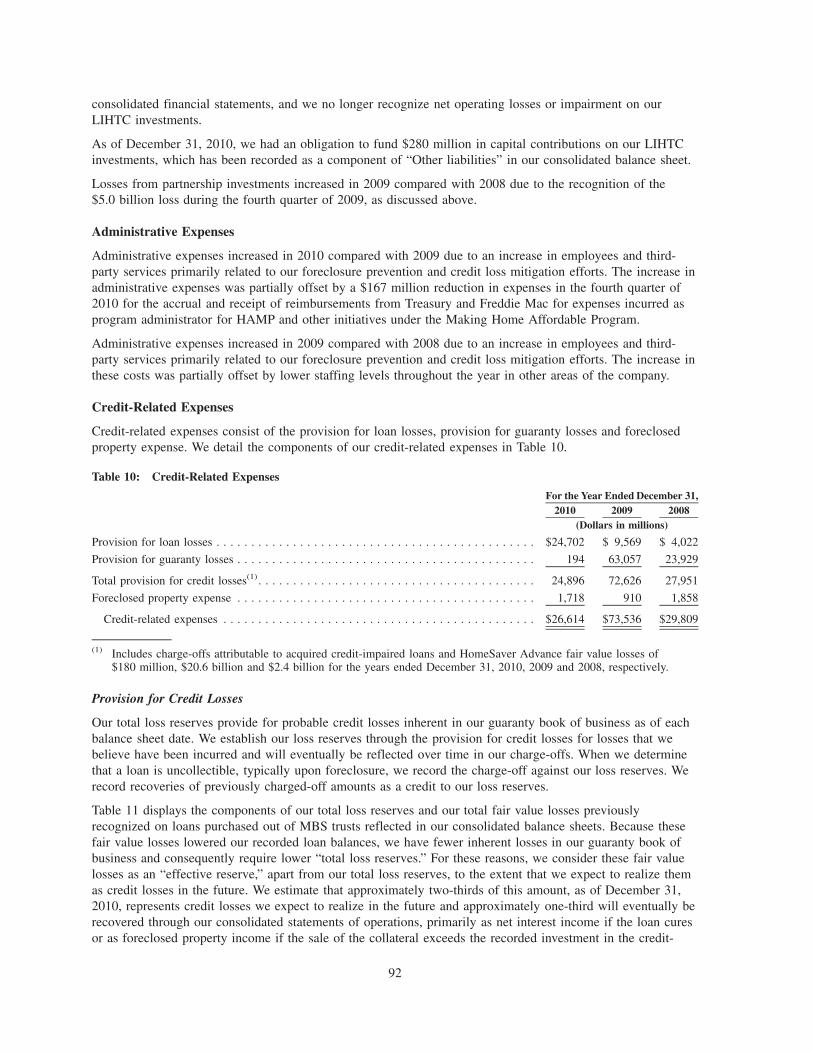
consolidated financial statements, and we no longer recognize net operating losses or impairment on ourLIHTC investments.
As of December 31, 2010, we had an obligation to fund $280 million in capital contributions on our LIHTCinvestments, which has been recorded as a component of “Other liabilities” in our consolidated balance sheet.
Losses from partnership investments increased in 2009 compared with 2008 due to the recognition of the$5.0 billion loss during the fourth quarter of 2009, as discussed above.
Administrative Expenses
Administrative expenses increased in 2010 compared with 2009 due to an increase in employees and third-party services primarily related to our foreclosure prevention and credit loss mitigation efforts. The increase inadministrative expenses was partially offset by a $167 million reduction in expenses in the fourth quarter of2010 for the accrual and receipt of reimbursements from Treasury and Freddie Mac for expenses incurred asprogram administrator for HAMP and other initiatives under the Making Home Affordable Program.
Administrative expenses increased in 2009 compared with 2008 due to an increase in employees and third-party services primarily related to our foreclosure prevention and credit loss mitigation efforts. The increase inthese costs was partially offset by lower staffing levels throughout the year in other areas of the company.
Credit-Related Expenses
Credit-related expenses consist of the provision for loan losses, provision for guaranty losses and foreclosedproperty expense. We detail the components of our credit-related expenses in Table 10.
Table 10: Credit-Related Expenses
2010 2009 2008For the Year Ended December 31,
(Dollars in millions)
Provision for loan losses . . . . . . . . . . . . . . . . . . . . . . . . . . . . . . . . . . . . . . . . . . . . . . $24,702 $ 9,569 $ 4,022
Provision for guaranty losses . . . . . . . . . . . . . . . . . . . . . . . . . . . . . . . . . . . . . . . . . . . 194 63,057 23,929
Total provision for credit losses(1) . . . . . . . . . . . . . . . . . . . . . . . . . . . . . . . . . . . . . . . . 24,896 72,626 27,951
Foreclosed property expense . . . . . . . . . . . . . . . . . . . . . . . . . . . . . . . . . . . . . . . . . . . 1,718 910 1,858
Credit-related expenses . . . . . . . . . . . . . . . . . . . . . . . . . . . . . . . . . . . . . . . . . . . . . $26,614 $73,536 $29,809
(1) Includes charge-offs attributable to acquired credit-impaired loans and HomeSaver Advance fair value losses of$180 million, $20.6 billion and $2.4 billion for the years ended December 31, 2010, 2009 and 2008, respectively.
Provision for Credit Losses
Our total loss reserves provide for probable credit losses inherent in our guaranty book of business as of eachbalance sheet date. We establish our loss reserves through the provision for credit losses for losses that webelieve have been incurred and will eventually be reflected over time in our charge-offs. When we determinethat a loan is uncollectible, typically upon foreclosure, we record the charge-off against our loss reserves. Werecord recoveries of previously charged-off amounts as a credit to our loss reserves.
Table 11 displays the components of our total loss reserves and our total fair value losses previouslyrecognized on loans purchased out of MBS trusts reflected in our consolidated balance sheets. Because thesefair value losses lowered our recorded loan balances, we have fewer inherent losses in our guaranty book ofbusiness and consequently require lower “total loss reserves.” For these reasons, we consider these fair valuelosses as an “effective reserve,” apart from our total loss reserves, to the extent that we expect to realize themas credit losses in the future. We estimate that approximately two-thirds of this amount, as of December 31,2010, represents credit losses we expect to realize in the future and approximately one-third will eventually berecovered through our consolidated statements of operations, primarily as net interest income if the loan curesor as foreclosed property income if the sale of the collateral exceeds the recorded investment in the credit-
92

impaired loan. We exclude these fair value losses from our credit loss calculation as described in “Credit LossPerformance Metrics.”
Table 11: Total Loss Reserves
2010 2009As of December 31,
(Dollars in millions)
Allowance for loan losses . . . . . . . . . . . . . . . . . . . . . . . . . . . . . . . . . . . . . . . . . . . . . . . . . . . . . $61,556 $ 9,925
Reserve for guaranty losses . . . . . . . . . . . . . . . . . . . . . . . . . . . . . . . . . . . . . . . . . . . . . . . . . . . . 323 54,430
Combined loss reserves . . . . . . . . . . . . . . . . . . . . . . . . . . . . . . . . . . . . . . . . . . . . . . . . . . . . . 61,879 64,355
Allowance for accrued interest receivable . . . . . . . . . . . . . . . . . . . . . . . . . . . . . . . . . . . . . . . . . . 3,414 536
Allowance for preforeclosure property taxes and insurance receivable(1) . . . . . . . . . . . . . . . . . . . . . 958 —
Total loss reserves . . . . . . . . . . . . . . . . . . . . . . . . . . . . . . . . . . . . . . . . . . . . . . . . . . . . . . . . . 66,251 64,891
Fair value losses previously recognized on acquired credit impaired loans(2) . . . . . . . . . . . . . . . . . . 19,171 22,295
Total loss reserves and fair value losses previously recognized on acquired credit impaired loans . . $85,422 $87,186
(1) Amount included in “Other assets” in our consolidated balance sheets.(2) Represents the fair value losses on loans purchased out of MBS trusts reflected in our consolidated balance sheets.
We summarize the changes in our combined loss reserves in Table 12. Upon recognition of the mortgage loansheld by newly consolidated trusts on January 1, 2010, we increased our “Allowance for loan losses” anddecreased our “Reserve for guaranty losses.” The impact at transition is reported as “Adoption of newaccounting standards” in Table 12. The decrease in the combined loss reserves from transition represents adifference in the methodology used to estimate incurred losses for our allowance for loan losses as comparedwith our reserve for guaranty losses and our separate presentation of the portion of the allowance related toaccrued interest as our “Allowance for accrued interest receivable.” These changes are discussed in “Note 2,Adoption of the New Accounting Standards on the Transfers of Financial Assets and Consolidation of VariableInterest Entities.”
93

Table 12: Allowance for Loan Losses and Reserve for Guaranty Losses (Combined Loss Reserves)
OfFannie
Mae
OfConsolidated
Trusts Total 2009 2008 2007 2006
2010
(Dollars in millions)
As of December 31,
Changes in combined loss reserves:Allowance for loan losses:
Beginning balance(1) . . . . . . . . . . . . . . . . . . . . . $ 8,078 $ 1,847 $ 9,925 $ 2,772 $ 629 $ 284 $ 246Adoption of new accounting standards . . . . . . . . — 43,576 43,576 — — — —Provision for loan losses . . . . . . . . . . . . . . . . . 13,067 11,635 24,702 9,569 4,022 658 174Charge-offs(2) . . . . . . . . . . . . . . . . . . . . . . . . (15,852) (7,026) (22,878) (2,245) (1,987) (407) (206)Recoveries . . . . . . . . . . . . . . . . . . . . . . . . . . 1,913 1,164 3,077 214 190 107 70Transfers(3) . . . . . . . . . . . . . . . . . . . . . . . . . . 44,714 (44,714) — — — — —Net reclassifications(1)(4) . . . . . . . . . . . . . . . . . (3,390) 6,544 3,154 (385) (82) (13) —
Ending balance(1)(5) . . . . . . . . . . . . . . . . . . . . . . $ 48,530 $ 13,026 $ 61,556 $ 9,925 $ 2,772 $ 629 $ 284
Reserve for guaranty losses:Beginning balance . . . . . . . . . . . . . . . . . . . . . . . $ 54,430 $ — $ 54,430 $ 21,830 $ 2,693 $ 519 $ 422
Adoption of new accounting standards . . . . . . . . (54,103) — (54,103) — — — —Provision for guaranty losses . . . . . . . . . . . . . . 194 — 194 63,057 23,929 3,906 415Charge-offs . . . . . . . . . . . . . . . . . . . . . . . . . (203) — (203) (31,142) (4,986) (1,782) (336)Recoveries . . . . . . . . . . . . . . . . . . . . . . . . . . 5 — 5 685 194 50 18
Ending balance . . . . . . . . . . . . . . . . . . . . . . . . . $ 323 $ — $ 323 $ 54,430 $21,830 $ 2,693 $ 519
Combined loss reserves:Beginning balance(1) . . . . . . . . . . . . . . . . . . . . . $ 62,508 $ 1,847 $ 64,355 $ 24,602 $ 3,322 $ 803 $ 668
Adoption of new accounting standards . . . . . . . . (54,103) 43,576 (10,527) — — — —Total provision for credit losses . . . . . . . . . . . . 13,261 11,635 24,896 72,626 27,951 4,564 589Charge-offs(2) . . . . . . . . . . . . . . . . . . . . . . . . (16,055) (7,026) (23,081) (33,387) (6,973) (2,189) (542)Recoveries . . . . . . . . . . . . . . . . . . . . . . . . . . 1,918 1,164 3,082 899 384 157 88Transfers(3) . . . . . . . . . . . . . . . . . . . . . . . . . . 44,714 (44,714) — — — — —Net reclassifications(1)(4) . . . . . . . . . . . . . . . . . (3,390) 6,544 3,154 (385) (82) (13) —
Ending balance(1)(5) . . . . . . . . . . . . . . . . . . . . . . $ 48,853 $ 13,026 $ 61,879 $ 64,355 $24,602 $ 3,322 $ 803
Attribution of charge-offs:Charge-offs attributable to guaranty book of
business . . . . . . . . . . . . . . . . . . . . . . . . . . . . $(22,901) $(12,832) $ (4,544) $ (825) $(338)Charge-offs attributable to fair value losses on:
Acquired credit-impaired loans . . . . . . . . . . . . . (180) (20,327) (2,096) (1,364) (204)HomeSaver Advance loans . . . . . . . . . . . . . . . — (228) (333) — —
Total charge-offs . . . . . . . . . . . . . . . . . . . . . . . . $(23,081) $(33,387) $ (6,973) $(2,189) $(542)
Allocation of combined loss reserves:Balance at end of each period attributable to:
Single-family(1) . . . . . . . . . . . . . . . . . . . . . . . . $ 60,163 $ 62,312 $24,498 $ 3,249 $ 729Multifamily . . . . . . . . . . . . . . . . . . . . . . . . . . . 1,716 2,043 104 73 74
Total . . . . . . . . . . . . . . . . . . . . . . . . . . . . . . . $ 61,879 $ 64,355 $24,602 $ 3,322 $ 803
Single-family and multifamily combined lossreserves as a percentage of applicable guarantybook of business:Single-family(1) . . . . . . . . . . . . . . . . . . . . . . . . 2.10% 2.14% 0.87% 0.13% 0.03%Multifamily . . . . . . . . . . . . . . . . . . . . . . . . . . . 0.91 1.10 0.06 0.05 0.06
Combined loss reserves as a percentage of:Total guaranty book of business(1) . . . . . . . . . . . . 2.03% 2.08% 0.83% 0.12% 0.03%Total nonperforming loans(1) . . . . . . . . . . . . . . . . 28.81 29.73 20.63 12.23 5.80
94

(1) Prior period amounts have been reclassified and respective percentages have been recalculated to conform to thecurrent period presentation.
(2) Includes accrued interest of $2.4 billion, $1.5 billion, $642 million, $128 million and $39 million for the years endedDecember 31, 2010, 2009, 2008, 2007 and 2006, respectively.
(3) Includes transfers from trusts for delinquent loan purchases.(4) Represents reclassification of amounts recorded in provision for loan losses and charge-offs that relate to allowances
for accrued interest receivable and preforeclosure property taxes and insurance receivable from borrowers.(5) Includes $385 million, $726 million, $150 million, $39 million and $28 million as of December 31, 2010, 2009, 2008,
2007 and 2006, respectively, for acquired credit-impaired loans.
Our provision for credit losses decreased in 2010 compared with 2009, primarily due to the moderate changein our total loss reserves during 2010 compared with the substantial increase in our total loss reserves during2009. The substantial increase in our total loss reserves during 2009 reflected the significant growth in thenumber of loans that were seriously delinquent during that period, which was partly the result of the economicdeterioration during 2009. Another impact of economic deterioration during 2009 was sharply falling homeprices, which resulted in higher losses on defaulted loans, further increasing the loss reserves. Our provisionfor credit losses was substantially lower in 2010 because there was neither an increase in the number ofseriously delinquent loans, nor a sharp decline in home prices; therefore we did not need to substantiallyincrease our reserves in 2010. Although lower for 2010 than in 2009, our provision for credit losses, level ofdelinquencies and defaults, and our total loss reserves remained high and were primarily affected by thefollowing factors:
• Continued stress on a broader segment of borrowers due to continued high levels of unemployment andunderemployment and the prolonged decline in home prices has resulted in elevated delinquency rates onloans in our single-family guaranty book of business that do not have characteristics typically associatedwith higher-risk loans.
• Certain loan categories continued to contribute disproportionately to the increase in our nonperformingloans and credit losses. These categories include: loans on properties in California, Florida, Arizona andNevada and certain Midwest states; loans originated in 2006 and 2007; and loans related to higher-riskproduct types, such as Alt-A loans. Although we have identified each year of our 2005 through 2008vintages as unprofitable, the largest and most disproportionate contributors to credit losses have been the2006 and 2007 vintages. Accordingly, our concentration statistics throughout the MD&A focus on onlythese two vintages.
• The prolonged decline in home prices has also resulted in negative home equity for some borrowers,especially when the impact of existing second mortgage liens is taken into account, which has affectedtheir ability to refinance or willingness to make their mortgage payments, and caused loans to remaindelinquent for an extended period of time as shown in “Table 41: Delinquency Status of Single-FamilyConventional Loans.”
• The number of loans that are seriously delinquent remained high due to delays in foreclosures because:(1) legislation or judicial changes in the foreclosure process in a number of states have lengthened theforeclosure timeline; (2) some jurisdictions are experiencing foreclosure processing backlogs due to highforeclosure case volumes; and (3) as discussed in “Executive Summary—Servicer Foreclosure ProcessDeficiencies and Foreclosure Pause,” a number of our single-family mortgage servicers temporarily haltedforeclosures in some or all states after discovering deficiencies in their processes and the processes oftheir lawyers and other service providers relating to the execution of affidavits in connection with theforeclosure process, which has lengthened the time to foreclose. However, during 2010, the number ofloans that transitioned out of seriously delinquent status exceeded the number of loans that becameseriously delinquent, primarily due to an increase in loan modifications and foreclosure alternatives and ahigher volume of foreclosures.
• A greater proportion of our total loss reserves is attributable to individual impairment rather than thecollective reserve for loan losses. We consider a loan to be individually impaired when, based on currentinformation, it is probable that we will not receive all amounts due, including interest, in accordance with
95

the contractual terms of the loan agreement. Individually impaired loans currently include, among others,those restructured in a TDR, which is a form of restructuring a mortgage loan in which a concession isgranted to a borrower experiencing financial difficulty. Any impairment recognized on these loans is partof our provision for loan losses and allowance for loan losses. The higher level of workouts initiated as aresult of our home retention and foreclosure prevention efforts during 2010, increased our total number ofindividually impaired loans, especially those considered to be TDRs, compared with 2009. Individualimpairment for TDRs is based on the restructured loan’s expected cash flows over the life of the loan,taking into account the effect of any concessions granted to the borrower, discounted at the loan’s originaleffective interest rate. The model includes forward-looking assumptions using multiple scenarios of thefuture economic environment, including interest rates and home prices. Based on the structure of themodifications, in particular the size of the concession granted, and performance of loans modified during2010 combined with the forward looking assumptions used in our model, the allowance calculated for anindividually impaired loan has generally been greater than the allowance that would be calculated underthe collective reserve.
• We recorded an out-of-period adjustment of $1.1 billion to our provision for loan losses in the secondquarter of 2010, related to an additional provision for losses on preforeclosure property taxes andinsurance receivables. For additional information about this adjustment, see “Note 5, Allowance for LoanLosses and Reserve for Guaranty Losses.”
• On December 31, 2010, we entered into an agreement with Bank of America, N.A., and its affiliates, toaddress outstanding repurchase requests for residential mortgage loans. Bank of America agreed, amongother things, to a cash payment of $1.3 billion, $930 million of which was recognized as a recovery ofcharge-offs resulting in a reduction to our provision for loan losses and allowance for loan losses.
• Additionally, as discussed in “Critical Account Policies and Estimates—Total Loss Reserves—Single-Family Loss Reserves,” the impact on our expectations of future payments from servicers due to thiscollection resulted in a decrease of approximately $700 million in our allowance for loan losses and werevised our methodology for estimating the benefit of payments from servicers, which resulted in ourallowance for loan losses being $1.1 billion higher than it would have been under the previousmethodology. For additional information on the terms of this agreement, see “Risk Management—CreditRisk Management—Institutional Counterparty Credit Risk Management.”
The decline in our fair value losses on acquired credit-impaired loans was another significant factorcontributing to the decline in our provision for credit losses in 2010 compared with 2009. In our capacity asguarantor of our MBS trusts, we have the option under the trust agreements to purchase mortgage loans thatmeet specific criteria from our MBS trusts. We generally are not permitted to complete a modification of aloan while the loan is held in the MBS trust. As a result, we generally exercise our option to purchase anydelinquent loan that we intend to modify from an MBS trust prior to the time that the modification becomeseffective. See “Mortgage Securitizations—Purchases of Loans from our MBS Trusts” for additionalinformation on the provisions in our MBS trust agreements that govern the purchase of loans from our MBStrusts and the factors that we consider in determining whether to purchase delinquent loans from our MBStrusts. While we acquired significantly more credit-impaired loans from MBS trusts in 2010, we experienced asignificant decline in fair value losses on acquired credit-impaired loans because of our adoption of the newaccounting standards. Only purchases of credit-deteriorated loans from unconsolidated MBS trusts or as aresult of other credit guarantees generate fair value losses upon acquisition. In 2010, we acquiredapproximately 1,118,000 loans from MBS trusts.
In 2009, we generally recorded our net investment in acquired credit-impaired loans at the lower of theacquisition cost of the loan or the estimated fair value at the date of purchase or consolidation. To the extentthat the acquisition cost of these loans exceeded the estimated fair value, we recorded a fair value loss charge-off against the “Reserve for guaranty losses” at the time we acquired the loan. We expect to realize a portionof these fair value losses as credit losses in the future (for loans that eventually involve charge-offs orforeclosure), yet these fair value losses have already reduced the mortgage loan balances reflected in ourconsolidated balance sheets and have effectively been recognized in our consolidated statements of operations
96

through our provision for guaranty losses. Because these fair value losses lowered our recorded loan balances,we have fewer inherent losses in our guaranty book of business and consequently require lower “total lossreserves.” However, any incremental impairment recognized on these loans after the date of acquisitionbecomes a component of our total loss reserves.
Loans in certain states, certain higher-risk categories and our 2006 and 2007 vintages continue to contributedisproportionately to our credit losses, as displayed in Table 15. Our combined single-family loss reserves arealso disproportionately higher for certain states, Alt-A loans and our 2006 and 2007 vintages. The Midwestaccounted for approximately 14% of our combined single-family loss reserves as of December 31, 2010,compared with approximately 13% as of December 31, 2009. Our mortgage loans in California, Florida,Arizona and Nevada together accounted for approximately 52% of our combined single-family loss reserves asof December 31, 2010, compared with approximately 53% as of December 31, 2009. Our Alt-A loansrepresented approximately 30% of our combined single-family loss reserves as of December 31, 2010,compared with approximately 35% as of December 31, 2009, and our 2006 and 2007 loan vintages togetheraccounted for approximately 67% of our combined single-family loss reserves as of December 31, 2010,compared with approximately 69% as of December 31, 2009.
For additional discussion of our loan workout activities, delinquent loans and concentrations, see “RiskManagement—Credit Risk Management—Single-Family Mortgage Credit Risk Management—Problem LoanManagement.” For a discussion of our charge-offs, see “Consolidated Results of Operations—Credit-RelatedExpenses—Credit Loss Performance Metrics.” We provide additional information on credit-impaired loansacquired from MBS trusts in “Note 4, Mortgage Loans.”
Our balance of nonperforming single-family loans remained high as of December 31, 2010 due to both highlevels of delinquencies and an increase in TDRs. When a TDR is executed, the loan status becomes current,but the loan will continue to be classified as a nonperforming loan as the loan is not performing per theoriginal terms. The composition of our nonperforming loans is shown in Table 13. For information on theimpact of TDRs and other individually impaired loans on our allowance for loan losses, see “Note 4,Mortgage Loans.”
97

Table 13: Nonperforming Single-Family and Multifamily Loans
2010 2009 2008 2007 2006As of December 31,
(Dollars in millions)
On-balance sheet nonperforming loans including loans in consolidatedFannie Mae MBS trusts:
Nonaccrual loans . . . . . . . . . . . . . . . . . . . . . . . . . . . . . . . . . . . . . . $152,756 $ 34,079 $ 17,634 $ 8,343 $ 5,961
Troubled debt restructurings on accrual status . . . . . . . . . . . . . . . . . . . 58,078 6,922 1,931 1,765 1,086
HomeSaver Advance first-lien loans on accrual status . . . . . . . . . . . . . . 3,829 866 1,121 — —
Total on-balance sheet nonperforming loans . . . . . . . . . . . . . . . . . . . 214,663 41,867 20,686 10,108 7,047
Off-balance sheet nonperforming loans in unconsolidated
Fannie Mae MBS trusts:
Nonperforming loans, excluding HomeSaver Advance first-lien loans(1) . . 89 161,406 89,617 17,048 6,799
HomeSaver Advance first-lien loans(2) . . . . . . . . . . . . . . . . . . . . . . . . — 13,182 8,929 — —
Total off-balance sheet nonperforming loans . . . . . . . . . . . . . . . . . . 89 174,588 98,546 17,048 6,799
Total nonperforming loans . . . . . . . . . . . . . . . . . . . . . . . . . . . . . . . . . $214,752 $216,455 $119,232 $27,156 $13,846
Accruing on-balance sheet loans past due 90 days or more(3) . . . . . . . . . . . $ 896 $ 612 $ 317 $ 204 $ 147
2010 2009 2008 2007 2006For the Year Ended December 31,
(Dollars in millions)
Interest related to on-balance sheet nonperforming loans:
Interest income forgone(4) . . . . . . . . . . . . . . . . . . . . . . . . . . . . . . . . $ 8,185 $ 1,341 $ 401 $ 215 $ 163
Interest income recognized for the period(5). . . . . . . . . . . . . . . . . . . . . 7,995 1,206 771 328 295
(1) Represents loans that would meet our criteria for nonaccrual status if the loans had been on-balance sheet.(2) Represents all off-balance sheet first-lien loans associated with unsecured HomeSaver Advance loans, including first-
lien loans that are not seriously delinquent.(3) Recorded investment in loans as of the end of each period that are 90 days or more past due and continuing to accrue
interest, the majority includes loans insured or guaranteed by the U.S. government and loans where we have recourseagainst the seller in the event of a default.
(4) Represents the amount of interest income that would have been recorded during the period for on-balance sheetnonperforming loans as of the end of each period had the loans performed according to their original contractualterms.
(5) Represents interest income recognized during the period based on stated coupon rate for on-balance sheet loansclassified as nonperforming as of the end of each period. Includes primarily amounts accrued while loan wasperforming and cash payments received on nonaccrual loans.
Foreclosed Property Expense
Foreclosed property expense increased during 2010 compared with 2009 primarily due to the substantialincrease in our REO inventory and an increase in valuation adjustments that reduced the value of our REOinventory. The increase in foreclosed property expense was partially offset by the recognition of $796 millionin 2010 from the cancellation and restructuring of some of our mortgage insurance coverage compared with arecognition of $668 million from restructurings in 2009. These fees represented an acceleration of, anddiscount on, claims to be paid pursuant to the coverage in order to reduce our future exposure to our mortgageinsurers. Further, under our December 31, 2010 agreement with Bank of America, N.A., and its affiliates,Bank of America agreed, among other things, to a cash payment of $1.3 billion, $266 million of which wasrecognized as a reduction to foreclosed property expense. For additional information on the terms of thisagreement, see “Risk Management—Credit Risk Management—Institutional Counterparty Credit RiskManagement.” In addition, during the second quarter of 2010, we began recording expenses related topreforeclosure property taxes and insurance to the provision for loan losses.
98

While we experienced an increase in foreclosure activity in 2009 compared with 2008 due to higher foreclosedproperty acquisitions, foreclosed property expense decreased in 2009 compared with 2008 primarily driven by$668 million in cash fees received from the cancellation and restructuring of some of our mortgage insurancecoverage.
As described in “Business—Executive Summary,” although the current servicer foreclosure pause hasnegatively affected our serious delinquency rates, credit-related expenses and foreclosure timelines, we cannotyet predict the full extent of its impact.
Credit Loss Performance Metrics
Our credit-related expenses should be considered in conjunction with our credit loss performance metrics.These credit loss performance metrics are not defined terms within GAAP and may not be calculated in thesame manner as similarly titled measures reported by other companies. Because management does not viewchanges in the fair value of our mortgage loans as credit losses, we adjust our credit loss performance metricsfor the impact associated with HomeSaver Advance loans and the acquisition of credit-impaired loans asfollows:
• We include the impact of any credit losses that ultimately result from foreclosure.
• We exclude the impact of fair value losses recorded upon acquisition.
• We add back to our credit losses the amount of charge-offs and foreclosed property expense that wewould have recorded if we had calculated these amounts based on the acquisition cost. Because the fairvalue amount at acquisition was lower than the acquisition cost, any loss recorded at foreclosure is lessthan it would have been if we had recorded the loan at its acquisition cost.
Interest forgone on nonperforming loans in our mortgage portfolio reduces our net interest income but is notreflected in our credit losses total. In addition, other-than-temporary impairment losses resulting fromdeterioration in the credit quality of our mortgage-related securities and accretion of interest income onacquired credit-impaired loans are excluded from credit losses.
Historically, management viewed our credit loss performance metrics, which include our historical creditlosses and our credit loss ratio, as indicators of the effectiveness of our credit risk management strategies. Asour credit losses are now at such high levels, management has shifted focus to our loss mitigation strategiesand the reduction of our total credit losses and away from the credit loss ratio to measure performance.However, we believe that credit loss performance metrics may be useful to investors as the losses arepresented as a percentage of our book of business and have historically been used by analysts, investors andother companies within the financial services industry. They also provide a consistent treatment of creditlosses for on- and off-balance sheet loans. Moreover, by presenting credit losses with and without the effect offair value losses associated with the acquisition of credit-impaired loans and HomeSaver Advance loans,investors are able to evaluate our credit performance on a more consistent basis among periods. Table 14details the components of our credit loss performance metrics as well as our average single-family default rateand average single-family loss severity rate.
99

Table 14: Credit Loss Performance Metrics
Amount Ratio(1) Amount Ratio(1) Amount Ratio(1)2010 2009 2008
For the Year Ended December 31,
(Dollars in millions)
Charge-offs, net of recoveries (2)(3) . . . . . . . . . . . . . . . $19,999 65.6 bp $ 32,488 106.7 bp $ 6,589 22.9 bp
Foreclosed property expense(2)(3) . . . . . . . . . . . . . . . . . 1,718 5.6 910 3.0 1,858 6.5
Credit losses including the effect of fair value losses onacquired credit-impaired loans and HomeSaverAdvance loans . . . . . . . . . . . . . . . . . . . . . . . . . . . . 21,717 71.2 33,398 109.7 8,447 29.4
Less: Fair value losses resulting from acquired credit-impaired loans and HomeSaver Advance loans . . . . . (180) (0.6) (20,555) (67.5) (2,429) (8.4)
Plus: Impact of acquired credit-impaired loans oncharge-offs and foreclosed property expense . . . . . . . 2,094 6.8 739 2.4 501 1.7
Credit losses and credit loss ratio . . . . . . . . . . . . . . . . $23,631 77.4 bp $ 13,582 44.6 bp $ 6,519 22.7 bp
Credit losses attributable to:
Single-family. . . . . . . . . . . . . . . . . . . . . . . . . . . . . $23,133 $ 13,362 $ 6,467
Multifamily . . . . . . . . . . . . . . . . . . . . . . . . . . . . . . 498 220 52
Total . . . . . . . . . . . . . . . . . . . . . . . . . . . . . . . . . . $23,631 $ 13,582 $ 6,519
Average single-family default rate . . . . . . . . . . . . . . . . 1.99% 1.07% 0.59%
Average single-family initial charge-off severityrate(4) . . . . . . . . . . . . . . . . . . . . . . . . . . . . . . . . . . 34.07% 37.21% 25.65%
(1) Basis points are based on the amount for each line item presented divided by the average guaranty book of businessduring the period.
(2) Beginning in the second quarter of 2010, expenses relating to preforeclosure taxes and insurance, previously recordedas foreclosed property expense, were recorded as charge-offs. The impact of including these costs was 4.7 basis pointsfor the year ended December 31, 2010.
(3) Includes cash received pursuant to our December 31, 2010 agreement with Bank of America. The impact of this cashreceipt was a reduction in charge-offs, net of recoveries, of $930 million or 3.0 basis points and a reduction inforeclosed property expense of $266 million or 0.9 basis points for the year ended December 31, 2010.
(4) Excludes fair value losses on credit-impaired loans acquired from MBS trusts and HomeSaver Advance loans andcharge-offs from preforeclosure sales and any costs, gains or losses associated with REO after initial acquisitionthrough final disposition.
The increase in our credit losses in 2010 reflects the increase in the number of defaults, particularly due to ouracquisition of loans in 2005 through 2008 with higher-risk attributes compared with current underwritingstandards, the prolonged period of high unemployment and the decline in home prices. In addition, defaults in2009 were lower than they could have been due to the foreclosure moratoria during the end of 2008 and firstquarter of 2009. The increase in defaults during 2010 was partially offset by a slight reduction in average lossseverity as home prices improved in some geographic regions.
Table 15 provides an analysis of our credit losses in certain higher-risk loan categories, loan vintages andloans within certain states that continue to account for a disproportionate share of our credit losses ascompared with our other loans.
100

Table 15: Credit Loss Concentration Analysis
2010 2009 2008 2010 2009 2008As of December 31,
Percentage ofSingle-FamilyConventional
Guaranty Bookof Business
Outstanding(1)For the Year Ended
December 31,
Percentage of Single-Family Credit Losses
Geographical distribution:
Arizona, California, Florida and Nevada . . . . . . . . . . . . . . . . . . . . . . . . 28% 28% 27% 56% 57% 49%
Illinois, Indiana, Michigan and Ohio . . . . . . . . . . . . . . . . . . . . . . . . . . . 11 11 11 14 15 21
All other states . . . . . . . . . . . . . . . . . . . . . . . . . . . . . . . . . . . . . . . . . . 61 61 62 30 28 30
Select higher-risk product features(2) . . . . . . . . . . . . . . . . . . . . . . . . . . . . 22 24 28 61 69 75
Vintages:
2006 . . . . . . . . . . . . . . . . . . . . . . . . . . . . . . . . . . . . . . . . . . . . . . . . . 8 11 14 29 31 35
2007 . . . . . . . . . . . . . . . . . . . . . . . . . . . . . . . . . . . . . . . . . . . . . . . . . 12 15 20 36 36 28
All other vintages . . . . . . . . . . . . . . . . . . . . . . . . . . . . . . . . . . . . . . . . 80 74 66 35 33 37
(1) Calculated based on the unpaid principal balance of loans, where we have detailed loan-level information, for eachcategory divided by the unpaid principal balance of our single-family conventional guaranty book of business.
(2) Includes Alt-A loans, subprime loans, interest-only loans, loans with original LTV ratios greater than 90% and loanswith FICO credit scores less than 620.
Our 2009 and 2010 vintages accounted for less than 1% of our single-family credit losses for 2010. Typically,credit losses on mortgage loans do not peak until the third through fifth years following origination. Weprovide more detailed credit performance information, including serious delinquency rates by geographicregion, statistics on nonperforming loans and foreclosure activity in “Risk Management—Credit RiskManagement—Mortgage Credit Risk Management.”
Regulatory Hypothetical Stress Test Scenario
Under a September 2005 agreement with OFHEO, we are required to disclose on a quarterly basis the presentvalue of the change in future expected credit losses from our existing single-family guaranty book of businessfrom an immediate 5% decline in single-family home prices for the entire United States. Although otherprovisions of the September 2005 agreement were suspended in March 2009 by FHFA until further notice, thisdisclosure requirement was not suspended. For purposes of this calculation, we assume that, after the initial5% shock, home price growth rates return to the average of the possible growth rate paths used in our internalcredit pricing models. The sensitivity results represent the difference between future expected credit lossesunder our base case scenario, which is derived from our internal home price path forecast, and a scenario thatassumes an instantaneous nationwide 5% decline in home prices.
Table 16 compares the credit loss sensitivities for the periods indicated for first lien single-family whole loanswe own or that back Fannie Mae MBS, before and after consideration of projected credit risk sharingproceeds, such as private mortgage insurance claims and other credit enhancement.
101

Table 16: Single-Family Credit Loss Sensitivity(1)
2010 2009As of December 31,
(Dollars in millions)
Gross single-family credit loss sensitivity . . . . . . . . . . . . . . . . . . . . . . . . . . . . . . . . . . . . . . $ 25,937 $ 18,311
Less: Projected credit risk sharing proceeds . . . . . . . . . . . . . . . . . . . . . . . . . . . . . . . . . . . . . (2,771) (2,533)
Net single-family credit loss sensitivity . . . . . . . . . . . . . . . . . . . . . . . . . . . . . . . . . . . . . . . . $ 23,166 $ 15,778
Outstanding single-family whole loans and Fannie Mae MBS(2) . . . . . . . . . . . . . . . . . . . . . . . $2,782,512 $2,830,004
Single-family net credit loss sensitivity as a percentage of outstanding single-family wholeloans and Fannie Mae MBS . . . . . . . . . . . . . . . . . . . . . . . . . . . . . . . . . . . . . . . . . . . . . . 0.83% 0.56%
(1) Represents total economic credit losses, which consist of credit losses and forgone interest. Calculations are based on97% of our total single-family guaranty book of business as of both December 31, 2010 and 2009. The mortgage loansand mortgage-related securities that are included in these estimates consist of: (a) single-family Fannie Mae MBS(whether held in our mortgage portfolio or held by third parties), excluding certain whole loan REMICs and private-label wraps; (b) single-family mortgage loans, excluding mortgages secured only by second liens, subprime mortgages,manufactured housing chattel loans and reverse mortgages; and (c) long-term standby commitments. We expect theinclusion in our estimates of the excluded products may impact the estimated sensitivities set forth in this table.
(2) As a result of our adoption of the new accounting standards, the balance reflects a reduction as of December 31, 2010from 2009 due to unscheduled principal payments.
Because these sensitivities represent hypothetical scenarios, they should be used with caution. Our regulatorystress test scenario is limited in that it assumes an instantaneous uniform 5% nationwide decline in homeprices, which is not representative of the historical pattern of changes in home prices. Changes in home pricesgenerally vary on a regional, as well as a local, basis. In addition, these stress test scenarios are calculatedindependently without considering changes in other interrelated assumptions, such as unemployment rates orother economic factors, which are likely to have a significant impact on our future expected credit losses.
Other Non-Interest Expenses
Other non-interest expenses consist of credit enhancement expenses, which reflect the amortization of thecredit enhancement asset we record at the inception of guaranty contracts; costs associated with the purchaseof additional mortgage insurance to protect against credit losses; net gains and losses on the extinguishment ofdebt; servicer incentive fees in connection with loans modified under HAMP; and other miscellaneousexpenses. Other non-interest expenses decreased in 2010 compared with 2009 due primarily to a decrease inmaster servicing costs related to our master servicing assets and liabilities as a result of derecognizing theportion of our master servicing asset and liability relating to consolidated trusts upon adoption of the newaccounting standards; lower expenses for legal claim reserves; and lower interest expense associated withunrecognized tax benefits related to certain unresolved tax positions. The decrease in 2010 was partially offsetby an increase in HAMP incentive payments and net losses recorded on the extinguishment of debt, becauseour borrowing costs declined and it became advantageous for us to redeem higher cost debt and replace it withlower cost debt.
Other non-interest expenses increased in 2009 compared with 2008 primarily due to an increase in our masterservicing costs, recording reserves for legal claims, and an increase in net losses recorded on theextinguishment of debt. The increased expenses were partially offset by a reduction in interest expenseassociated with unrecognized tax benefits related to certain unresolved tax positions.
Federal Income Taxes
We recorded a tax benefit for federal income taxes of $82 million for 2010 primarily due to the reversal of aportion of the valuation allowance for deferred tax assets resulting from a settlement agreement reached withthe IRS for our unrecognized tax benefits for the tax years 1999 through 2004. We were not able to recognizean income tax benefit for our pre-tax loss in 2010 as there has been no change to our conclusion that it ismore likely than not that we will not generate sufficient taxable income in the foreseeable future to realize our
102

net deferred tax assets. As a result, we recorded an increase in our valuation allowance in 2010 that resulted inthe recognition of $5.9 billion in our provision for income taxes. This amount represented the tax effectassociated with a portion of the pre-tax loss. The change in our 2010 valuation allowance also includes a$2.4 billion reduction primarily due to our adoption of the new accounting standards for amounts originallyrecognized in “Accumulated deficit.” The valuation allowance recorded against our deferred tax assets totaled$56.3 billion as of December 31, 2010, resulting in a net deferred tax asset of $754 million. Our tax benefitfor the year resulted in an effective income tax rate of less than 1%. Our effective tax rate was different fromthe statutory rate of 35% primarily due to an increase in our valuation allowance. The difference in rates wasalso the result of the settlement agreement with the IRS.
We recorded a tax benefit for federal income taxes of $985 million for 2009, due primarily to the benefit ofcarrying back a portion of our 2009 loss, net of the reversal of the use of certain tax credits, to prior years. Incomparison, we recorded a provision for federal income taxes of $13.7 billion in 2008, due primarily to thevaluation allowance recorded against our deferred tax assets that totaled $30.8 billion as of December 31,2008, resulting in a net deferred tax asset of $3.9 billion.
We discuss the factors that led us to record a partial valuation allowance against our net deferred tax assets in“Note 11, Income Taxes.” The amount of deferred tax assets considered realizable is subject to adjustment infuture periods. We will continue to monitor all available evidence related to our ability to utilize ourremaining deferred tax assets. If we determine that recovery is not likely, we will record an additionalvaluation allowance against the deferred tax assets that we estimate may not be recoverable. Our income taxexpense in future periods will be reduced or increased to the extent of offsetting decreases or increases to ourvaluation allowance.
Financial Impact of the Making Home Affordable Program on Fannie Mae
Home Affordable Refinance Program
Because we already own or guarantee the original mortgages that we refinance under HARP, our expensesunder that program consist mostly of limited administrative costs.
Home Affordable Modification Program
Modifying loans we own or guarantee under HAMP, pursuant to our mission, directly affects our financialresults in the following ways:
Key elements affecting our financial results
Loans in trial modification plans are treated as individually impaired. Under HAMP, a borrower must satisfythe terms of a trial modification plan, typically for a period of at least three months, before the modificationof the loan can become effective. A trial modification period begins when the borrower and Fannie Mae agreeto the terms of the trial modification plan. If the loan is recorded on our consolidated balance sheet, weaccount for the loan as a TDR, because it is a restructuring of a mortgage loan in which a concession isgranted to a borrower experiencing financial hardship. As a result, we consider the loan to be individuallyimpaired when it enters a trial modification period, and we calculate our allowance for loan losses for therestructured loan on an individual basis. Once a permanent loan modification becomes effective, the loan willcontinue to be considered individually impaired.
We continually reassess our loss reserves to determine if the amount of impairment recorded is appropriateand make adjustments as required. Consequently, after a loan has entered into a trial modification underHAMP, we continue to adjust the amount of impairment.
When we begin to individually assess a loan for impairment, we exclude the loan from the population of loanson which we calculate our collective loss reserves. Amounts in the table below do not reflect the impact ofremoving these individually impaired loans from this population. The collective loss reserves are reduced bythe fact that these loans are no longer included in the population for which the collective reserves arecalculated.
103

The following table provides information about the impairments and fair value losses associated with theseactivities for Fannie Mae loans entering trial modifications under HAMP. These amounts have been includedin the calculation of our provision for credit losses in our consolidated results of operations for the yearsended December 31, 2010 and 2009.
Table 17: Impairments and Fair Value Losses on Loans in HAMP(1)
2010 2009
For the YearEnded December 31,
(Dollars in millions)
Impairments(2) . . . . . . . . . . . . . . . . . . . . . . . . . . . . . . . . . . . . . . . . . . . . . . . . . . . . . . . . . . . $ 14,120 $ 15,777
Fair value losses on credit-impaired loans acquired from MBS trusts(3) . . . . . . . . . . . . . . . . . . . . 6 10,637
Total . . . . . . . . . . . . . . . . . . . . . . . . . . . . . . . . . . . . . . . . . . . . . . . . . . . . . . . . . . . . . . . . $ 14,126 $ 26,414
Loans entered into a trial modification under the program . . . . . . . . . . . . . . . . . . . . . . . . . . . . . 163,000 333,300
Credit-impaired loans acquired from MBS trusts in trial modifications under the program(4). . . . . . 65 83,700
(1) Includes amounts for loans that entered into a trial modification under the program but that have not yet received, orthat have been determined to be ineligible for, a permanent modification under the program. Some of these ineligibleloans have since been modified outside of the program.
(2) Impairments consist of (a) impairments recognized on loans accounted for as loans restructured in a troubled debtrestructuring and (b) credit losses on loans in MBS trusts that have entered into a trial modification and beenindividually assessed for incurred credit losses. Amount includes impairments recognized subsequent to the date ofloan acquisition.
(3) These fair value losses are recorded as charge-offs against the “Reserve for guaranty losses” and have the effect ofincreasing the provision for guaranty losses in our consolidated statements of operations.
(4) Excludes loans purchased from consolidated trusts for the year ended December 31, 2010, for which no fair valuelosses were recognized.
The decline in fair value losses on credit-impaired loans in trial modifications under the program acquiredfrom MBS trusts in 2010 compared with 2009 was due to the adoption of the new accounting standards.Under the new standards, only purchases of credit-deteriorated loans from unconsolidated MBS trusts or as aresult of other credit guarantees generate fair value losses upon acquisition.
Servicer and Borrower Incentives
We incurred $339 million during 2010 and $17 million during 2009 in paid and accrued incentive fees forservicers in connection with loans modified under HAMP, which we recorded as part of “Other expenses.”Borrower incentive payments are included in the calculation of our allowance for loan losses for individuallyimpaired loans.
Overall Impact of the Making Home Affordable Program
Because of the unprecedented nature of the circumstances that led to the Making Home Affordable Program,we cannot quantify what the impact would have been on Fannie Mae if the Making Home Affordable Programhad not been introduced. We do not know how many loans we would have modified under alternativeprograms, what the terms or costs of those modifications would have been, how many foreclosures would haveresulted nationwide, and at what pace, or the impact on housing prices if the program had not been put inplace. As a result, the amounts we discuss above are not intended to measure how much the program iscosting us in comparison to what it would have cost us if we did not have the program at all.
BUSINESS SEGMENT RESULTS
We provide a more complete description of our business segments in “Business—Business Segments.” Resultsof our three business segments are intended to reflect each segment as if it were a stand-alone business. Wedescribe the management reporting and allocation process used to generate our segment results in “Note 15,
104

Segment Reporting.” In this section, we discuss changes to our presentation for reporting results for our threebusiness segments, Single-Family, Multifamily and Capital Markets, which have been revised due to ourprospective adoption of the new accounting standards. We then discuss our business segment results. Thissection should be read together with our consolidated results of operations in “Consolidated Results ofOperations.”
Changes to Segment Reporting
Our prospective adoption of the new accounting standards had a significant impact on the presentation andcomparability of our consolidated financial statements because we consolidated the substantial majority of oursingle-class securitization trusts and eliminated previously recorded deferred revenue from our guarantyarrangements. We continue to manage Fannie Mae based on the same three business segments; however,effective in 2010 we changed the presentation of segment financial information that is currently evaluated bymanagement.
While some line items in our segment results were not impacted by either the change from the new accountingstandards or changes to our segment presentation, others were impacted materially, which reduces thecomparability of our segment results with prior years. We have not restated prior years’ results nor have wepresented current year results under the old presentation because we determined that it was impracticable to doso; therefore, our segment results reported in the current period are not comparable with prior years. In thetable below, we compare our current segment reporting for our three business segments with our segmentreporting in prior years.
Segment Reporting in Current Periods Compared with Prior Years
Line Item Current Segment Reporting Prior Year Segment Reporting
Single-Family and Multifamily
Guaranty fee income • At adoption of the newaccounting standards, weeliminated a substantial majorityof our guaranty-related assets andliabilities in our consolidatedbalance sheet. We re-establishedan asset and a liability related tothe deferred cash fees on Single-Family’s balance sheet and weamortize these fees as guarantyfee income with our contractualguaranty fees.
• At the inception of a guaranty toan unconsolidated entity, weestablished a guaranty asset andguaranty obligation, whichincluded deferred cash fees.These guaranty-related assets andliabilities were then amortizedand recognized in guaranty feeincome with our contractualguaranty fees over the life of theguaranty.
• We use a static yield method toamortize deferred cash fees tobetter align with the recognitionof contractual guaranty feeincome.
• We used a prospective level yieldmethod to amortize our guaranty-related assets and liabilities,which created significantfluctuations in our guaranty feeincome as the interest rateenvironment shifted.
• We eliminated substantially all ofour guaranty assets that werepreviously recorded at fair valueupon adoption of the newaccounting standards. As such,the recognition of fair valueadjustments as a component ofSingle-Family guaranty feeincome has been essentiallyeliminated.
• We recorded fair valueadjustments on our buy-up assetsand certain guaranty assets as acomponent of Single-Familyguaranty fee income.
105

Line Item Current Segment Reporting Prior Year Segment Reporting
Single-Family and Multifamily
Net interest income (expense) • Because we now recognize loansunderlying the substantialmajority of our MBS trusts in ourconsolidated balance sheets, theamount of interest expenseSingle-Family and Multifamilyrecognize related to interest notrecorded on nonperforming loansunderlying MBS trusts hassignificantly increased.
• Interest payments expected to bedelinquent on off-balance sheetnonperforming loans wereconsidered in the reserve forguaranty losses.
Credit-related expenses • Because we now recognize loansunderlying the substantialmajority of our MBS trusts in ourconsolidated balance sheets, weno longer recognize fair valuelosses upon acquiring credit-impaired loans from these trusts.
• We recorded a fair value loss oncredit-impaired loans acquiredfrom MBS trusts.
• Upon recognition of mortgageloans held by newly consolidatedtrusts, we increased ourallowance for loan losses anddecreased our reserve forguaranty losses. We use adifferent methodology inestimating incurred losses underour allowance for loan lossesversus under our reserve forguaranty losses which will resultin lower credit-related expenses.
• The majority of our combinedloss reserves were recorded in thereserve for guaranty losses, whichused a different methodology forestimating incurred losses versusthe methodology used for theallowance for loan losses.
Line Item Current Segment Reporting Prior Year Segment Reporting
Multifamily only
Income (losses) from partnershipinvestments
• We report income or losses frompartnership investments on anequity basis in the Multifamilybalance sheet. As a result, netincome or loss attributable tononcontrolling interests is notincluded in income (losses) frompartnership investments.
• Income (losses) from partnershipinvestments included net incomeor loss attributable tononcontrolling interests for theMultifamily segment.
Line Item Current Segment Reporting Prior Year Segment Reporting
Capital Markets
Net interest income • We recognize interest income oninterest-earning assets that weown and interest expense on debtthat we have issued.
• In addition to the assets we ownand the debt we issue, we alsoincluded interest income onmortgage-related assetsunderlying MBS trusts that weconsolidated under the priorconsolidation accountingstandards and the interest expenseon the corresponding debt of suchtrusts.
106

Line Item Current Segment Reporting Prior Year Segment Reporting
Capital Markets
Investment gains (losses), net • We no longer designate thesubstantial majority of our loansheld for securitization as held forsale as the substantial majority ofrelated MBS trusts will beconsolidated, thereby reducinglower of cost or fair valueadjustments.
• We designated loans held forsecuritization as held for saleresulting in recognition of lowerof cost or fair value adjustmentson our held-for-sale loans.
• We include the securities that weown, regardless of whether thetrust has been consolidated, inreporting gains and losses onsecuritizations and sales ofavailable-for-sale securities.
• We excluded the securities ofconsolidated trusts that we ownedin reporting of gains and losseson securitizations and sales ofavailable-for-sale securities.
Fair value gains (losses), net • We include the trading securitiesthat we own, regardless ofwhether the trust has beenconsolidated, in recognizing fairvalue gains and losses on tradingsecurities.
• MBS trusts that wereconsolidated were reported asloans and thus any securities weowned issued by these trusts didnot have fair value adjustments.
Under the current segment reporting structure, the sum of the results for our three business segments does not equalour consolidated results of operations as we separate the activity related to our consolidated trusts from the resultsgenerated by our three segments. In addition, because we apply accounting methods that differ from our consolidatedresults for segment reporting purposes, we include an eliminations/adjustments category to reconcile our businesssegment results and the activity related to our consolidated trusts to our consolidated results of operations.
Summary
Table 18 displays a summary of our segment results under our current segment reporting presentation for 2010and our prior segment presentation for 2009 and 2008.
Table 18: Business Segment Summary
2010 2009 2008For the Year Ended December 31,
(Dollars in millions)
Net revenues:(1)
Single-Family . . . . . . . . . . . . . . . . . . . . . . . . . . . . . . . . . . . . . . . . . . . . . . . . . . $ 2,126 $ 8,784 $ 9,434
Multifamily. . . . . . . . . . . . . . . . . . . . . . . . . . . . . . . . . . . . . . . . . . . . . . . . . . . . 940 582 476
Capital Markets . . . . . . . . . . . . . . . . . . . . . . . . . . . . . . . . . . . . . . . . . . . . . . . . . 13,400 13,128 7,526
Consolidated trusts . . . . . . . . . . . . . . . . . . . . . . . . . . . . . . . . . . . . . . . . . . . . . . 460 — —
Eliminations/adjustments . . . . . . . . . . . . . . . . . . . . . . . . . . . . . . . . . . . . . . . . . . 567 — —
Total . . . . . . . . . . . . . . . . . . . . . . . . . . . . . . . . . . . . . . . . . . . . . . . . . . . . . . . $ 17,493 $ 22,494 $ 17,436
Net income (loss) attributable to Fannie Mae:
Single-Family . . . . . . . . . . . . . . . . . . . . . . . . . . . . . . . . . . . . . . . . . . . . . . . . . . $(26,680) $(63,798) $(27,101)
Multifamily. . . . . . . . . . . . . . . . . . . . . . . . . . . . . . . . . . . . . . . . . . . . . . . . . . . . 216 (9,028) (2,189)
Capital Markets . . . . . . . . . . . . . . . . . . . . . . . . . . . . . . . . . . . . . . . . . . . . . . . . . 16,074 857 (29,417)
Consolidated trusts . . . . . . . . . . . . . . . . . . . . . . . . . . . . . . . . . . . . . . . . . . . . . . (224) — —
Eliminations/adjustments . . . . . . . . . . . . . . . . . . . . . . . . . . . . . . . . . . . . . . . . . . (3,400) — —
Total . . . . . . . . . . . . . . . . . . . . . . . . . . . . . . . . . . . . . . . . . . . . . . . . . . . . . . . $(14,014) $(71,969) $(58,707)
107

2010 2009 2008As of December 31,
(Dollars in millions)
Total assets:
Single-Family(2) . . . . . . . . . . . . . . . . . . . . . . . . . . . . . . . . . . . . . . . . . . . . . . $ 14,843 $ 19,991 $ 24,115
Multifamily(2) . . . . . . . . . . . . . . . . . . . . . . . . . . . . . . . . . . . . . . . . . . . . . . . . 4,881 5,698 10,994
Capital Markets. . . . . . . . . . . . . . . . . . . . . . . . . . . . . . . . . . . . . . . . . . . . . . . 873,052 843,452 877,295
Consolidated trusts . . . . . . . . . . . . . . . . . . . . . . . . . . . . . . . . . . . . . . . . . . . . 2,673,937 — —
Eliminations/adjustments(2) . . . . . . . . . . . . . . . . . . . . . . . . . . . . . . . . . . . . . . . (344,741) — —
Total . . . . . . . . . . . . . . . . . . . . . . . . . . . . . . . . . . . . . . . . . . . . . . . . . . . . $3,221,972 $869,141 $912,404
(1) Includes net interest income, guaranty fee income, and fee and other income (expense).(2) Beginning in 2010, the allowance for loan losses, allowance for accrued interest receivable and fair value losses
previously recognized on acquired credit impaired loans are not treated as assets for Single-Family and Multifamilysegment reporting purposes because these allowances and losses relate to loan assets that are held by the CapitalMarkets segment and consolidated trusts.
Segment Results
Table 19 displays our segment results under our current segment reporting presentation for 2010.
Table 19: Business Segment Results
Single-Family Multifamily
CapitalMarkets
ConsolidatedTrusts(1)
Eliminations/Adjustments(2)
TotalResults
Business SegmentsOther Activity/Reconciling
Items
For the Year Ended December 31, 2010
(Dollars in millions)
Net interest income (expense). . . . . . . . $ (5,386) $ 3 $14,321 $ 5,073 $ 2,398(3) $ 16,409Provision for loan losses . . . . . . . . . . . (24,503) (199) — — — (24,702)
Net interest income (expense) afterprovision for loan losses. . . . . . . . . . (29,889) (196) 14,321 5,073 2,398 (8,293)
Guaranty fee income (expense) . . . . . . . 7,206 791 (1,440) (4,525)(4) (1,830)(4) 202Investment gains (losses), net . . . . . . . . 9 6 4,047 (418) (3,298)(5) 346Net other-than-temporary impairments . . — — (720) (2) — (722)Fair value gains (losses), net . . . . . . . . — — 239 (155) (595)(6) (511)Debt extinguishment losses, net . . . . . . — — (459) (109) — (568)Losses from partnership investments . . . — (70) — — (4) (74)Fee and other income (expense) . . . . . . 306 146 519 (88) (1) 882Administrative expenses . . . . . . . . . . . (1,628) (384) (585) — — (2,597)Benefit (provision) for guaranty losses. . (237) 43 — — — (194)Foreclosed property expense . . . . . . . . (1,680) (38) — — — (1,718)Other income (expenses) . . . . . . . . . . . (836) (68) 125 — (74)(7) (853)
Income (loss) before federal incometaxes . . . . . . . . . . . . . . . . . . . . . . . (26,749) 230 16,047 (224) (3,404) (14,100)
Benefit (provision) for federal incometaxes . . . . . . . . . . . . . . . . . . . . . . . 69 (14) 27 — — 82
Net income (loss) . . . . . . . . . . . . . . (26,680) 216 16,074 (224) (3,404) (14,018)Less: Net income attributable to
noncontrolling interests . . . . . . . . . — — — — 4(8) 4
Net income (loss) attributable toFannie Mae . . . . . . . . . . . . . . . . . $(26,680) $ 216 $16,074 $ (224) $(3,400) $(14,014)
(1) Represents activity related to the assets and liabilities of consolidated trusts in our balance sheet under the newaccounting standards.
108
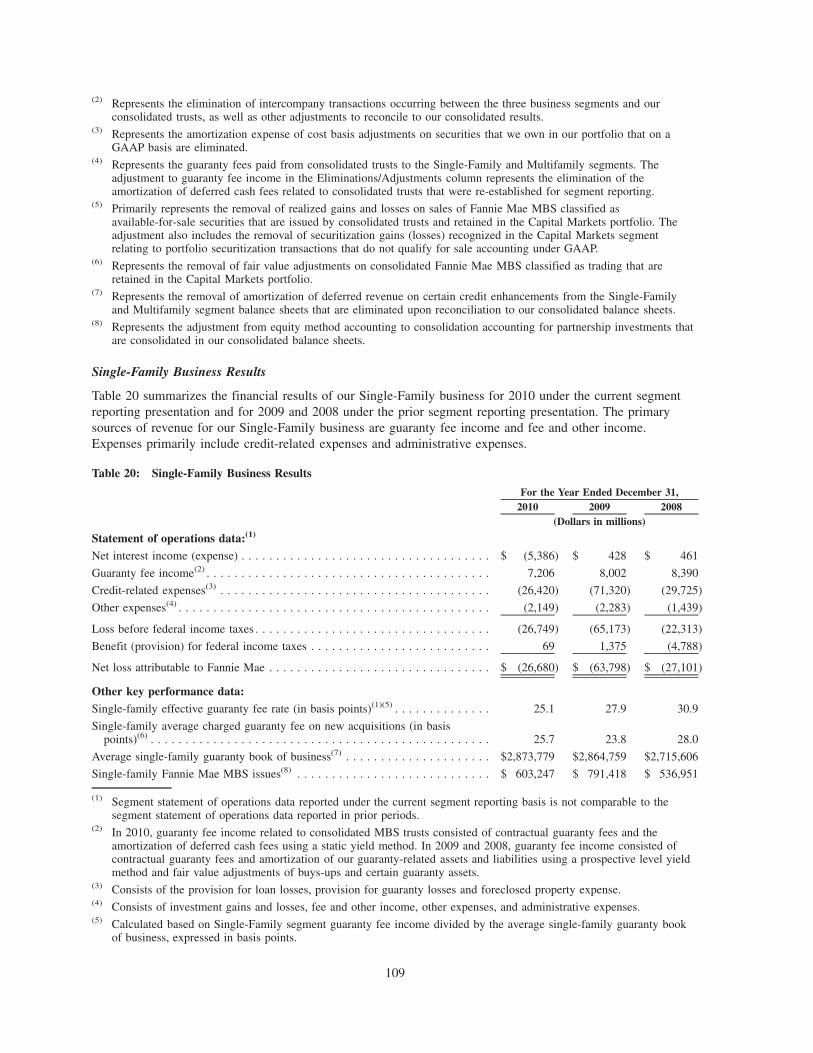
(2) Represents the elimination of intercompany transactions occurring between the three business segments and ourconsolidated trusts, as well as other adjustments to reconcile to our consolidated results.
(3) Represents the amortization expense of cost basis adjustments on securities that we own in our portfolio that on aGAAP basis are eliminated.
(4) Represents the guaranty fees paid from consolidated trusts to the Single-Family and Multifamily segments. Theadjustment to guaranty fee income in the Eliminations/Adjustments column represents the elimination of theamortization of deferred cash fees related to consolidated trusts that were re-established for segment reporting.
(5) Primarily represents the removal of realized gains and losses on sales of Fannie Mae MBS classified asavailable-for-sale securities that are issued by consolidated trusts and retained in the Capital Markets portfolio. Theadjustment also includes the removal of securitization gains (losses) recognized in the Capital Markets segmentrelating to portfolio securitization transactions that do not qualify for sale accounting under GAAP.
(6) Represents the removal of fair value adjustments on consolidated Fannie Mae MBS classified as trading that areretained in the Capital Markets portfolio.
(7) Represents the removal of amortization of deferred revenue on certain credit enhancements from the Single-Familyand Multifamily segment balance sheets that are eliminated upon reconciliation to our consolidated balance sheets.
(8) Represents the adjustment from equity method accounting to consolidation accounting for partnership investments thatare consolidated in our consolidated balance sheets.
Single-Family Business Results
Table 20 summarizes the financial results of our Single-Family business for 2010 under the current segmentreporting presentation and for 2009 and 2008 under the prior segment reporting presentation. The primarysources of revenue for our Single-Family business are guaranty fee income and fee and other income.Expenses primarily include credit-related expenses and administrative expenses.
Table 20: Single-Family Business Results
2010 2009 2008For the Year Ended December 31,
(Dollars in millions)
Statement of operations data:(1)
Net interest income (expense) . . . . . . . . . . . . . . . . . . . . . . . . . . . . . . . . . . . . $ (5,386) $ 428 $ 461
Guaranty fee income(2) . . . . . . . . . . . . . . . . . . . . . . . . . . . . . . . . . . . . . . . . . 7,206 8,002 8,390
Credit-related expenses(3) . . . . . . . . . . . . . . . . . . . . . . . . . . . . . . . . . . . . . . . (26,420) (71,320) (29,725)
Other expenses(4) . . . . . . . . . . . . . . . . . . . . . . . . . . . . . . . . . . . . . . . . . . . . . (2,149) (2,283) (1,439)
Loss before federal income taxes . . . . . . . . . . . . . . . . . . . . . . . . . . . . . . . . . . (26,749) (65,173) (22,313)
Benefit (provision) for federal income taxes . . . . . . . . . . . . . . . . . . . . . . . . . . 69 1,375 (4,788)
Net loss attributable to Fannie Mae . . . . . . . . . . . . . . . . . . . . . . . . . . . . . . . . $ (26,680) $ (63,798) $ (27,101)
Other key performance data:
Single-family effective guaranty fee rate (in basis points)(1)(5) . . . . . . . . . . . . . . 25.1 27.9 30.9
Single-family average charged guaranty fee on new acquisitions (in basispoints)(6) . . . . . . . . . . . . . . . . . . . . . . . . . . . . . . . . . . . . . . . . . . . . . . . . . 25.7 23.8 28.0
Average single-family guaranty book of business(7) . . . . . . . . . . . . . . . . . . . . . $2,873,779 $2,864,759 $2,715,606
Single-family Fannie Mae MBS issues(8) . . . . . . . . . . . . . . . . . . . . . . . . . . . . $ 603,247 $ 791,418 $ 536,951
(1) Segment statement of operations data reported under the current segment reporting basis is not comparable to thesegment statement of operations data reported in prior periods.
(2) In 2010, guaranty fee income related to consolidated MBS trusts consisted of contractual guaranty fees and theamortization of deferred cash fees using a static yield method. In 2009 and 2008, guaranty fee income consisted ofcontractual guaranty fees and amortization of our guaranty-related assets and liabilities using a prospective level yieldmethod and fair value adjustments of buys-ups and certain guaranty assets.
(3) Consists of the provision for loan losses, provision for guaranty losses and foreclosed property expense.(4) Consists of investment gains and losses, fee and other income, other expenses, and administrative expenses.(5) Calculated based on Single-Family segment guaranty fee income divided by the average single-family guaranty book
of business, expressed in basis points.
109

(6) Calculated based on the average contractual fee rate for our single-family guaranty arrangements entered into duringthe period plus the recognition of any upfront cash payments ratably over an estimated average life, expressed in basispoints.
(7) Consists of single-family mortgage loans held in our mortgage portfolio, single-family mortgage loans held byconsolidated trusts, single-family Fannie Mae MBS issued from unconsolidated trusts held by either third parties orwithin our retained portfolio, and other credit enhancements that we provide on single-family mortgage assets.Excludes non-Fannie Mae mortgage-related securities held in our investment portfolio for which we do not provide aguaranty.
(8) Reflects unpaid principal balance of Fannie Mae MBS issued and guaranteed by the Single-Family segment during theperiod. In 2009, we entered into a memorandum of understanding with Treasury, FHFA and Freddie Mac in which weagreed to provide assistance to state and local housing finance agencies (“HFAs”) through three separate assistanceprograms: a temporary credit and liquidity facilities program, a new issue bond program and a multifamily creditenhancement program. Includes HFA new issue bond program issuances of $3.1 billion for the year endedDecember 31, 2010.
2010 compared with 2009
Key factors affecting the results of our Single-Family business for 2010 compared with 2009 included thefollowing:
Net Interest Income (Expense)
Net interest income (expense) for the Single-Family business segment includes the fee paid to the CapitalMarkets group for the contractual interest due on the nonaccrual loans held in our portfolio under the terms ofour intracompany guarantee arrangement and in consolidated trusts. It also includes an allocated cost of capitalcharge among our three business segments. The shift from net interest income in 2009 to net interest expensein 2010 was primarily driven by an increase in interest not recorded on nonaccrual loans, which increased to$8.4 billion in 2010 from $1.2 billion in 2009. The number of nonaccrual loans in our consolidated balancesheets increased as a result of our adoption of the new accounting standards.
Guaranty Fee Income
Guaranty fee income decreased in 2010, compared with 2009, primarily because: (1) we now amortize oursingle-family deferred cash fees under the static yield method, which resulted in lower amortization incomecompared with 2009 when we amortized these fees under the prospective level yield method; (2) guaranty feeincome in 2009 included the amortization of certain non-cash deferred items, the balance of which waseliminated upon adoption of the new accounting standards and was not re-established on Single-Family’sbalance sheet at the transition date; and (3) guaranty fee income in 2009 reflected an increase in the fair valueof buy-ups and certain guaranty assets which are no longer adjusted to fair value under the new segmentreporting.
Our average single-family guaranty book of business was relatively flat period over period despite ourcontinued high market share because of the decline in U.S. residential mortgage debt outstanding. There werefewer new mortgage originations due to weakness in the housing market and an increase in liquidations due tothe high level of foreclosures. Our estimated market share of new single-family mortgage-related securitiesissuances, which is based on publicly available data and excludes previously securitized mortgages, remainedhigh at 44.0% for 2010.
The single-family average charged guaranty fee on new acquisitions increased in 2010 compared with 2009primarily due to an increase in acquisitions of loans with characteristics that receive risk-based pricingadjustments.
Credit-Related Expenses
Single-family credit-related expenses decreased in 2010 compared with 2009 primarily due to the moderatechange in our total single-family loss reserves during 2010 compared with the substantial increase in our totalsingle-family loss reserves during 2009. The substantial increase in our single-family total loss reserves during2009 reflected the significant growth in the number of loans that were seriously delinquent during that period,
110

which was partly the result of the economic deterioration during 2009. Another impact of the economicdeterioration during 2009 was sharply falling home prices, which resulted in higher losses on defaulted loans,further increasing the loss reserves. Our single-family provision for credit losses was substantially lower in2010 because there has not been an increase in seriously delinquent loans, nor a sharp decline in house prices.Therefore, we did not need to substantially increase our reserves in 2010. Additionally, because we nowrecognize loans underlying the substantial majority of our MBS trusts in our consolidated balance sheets, weno longer recognize fair value losses upon acquiring credit-impaired loans from these trusts. Although ourcredit-related expenses declined in 2010, our credit losses were higher in 2010 compared with 2009 due to anincrease in the number of defaults.
Credit-related expenses and credit losses in the Single-Family business represent the substantial majority ofour consolidated totals. We provide additional information on our credit-related expenses in “ConsolidatedResults of Operations — Credit-Related Expenses.”
Federal Income Taxes
We recognized an income tax benefit in 2010 due to the reversal of a portion of the valuation allowance fordeferred tax assets primarily due to a settlement agreement reached with the IRS in 2010 for our unrecognizedtax benefits for the tax years 1999 through 2004. The tax benefit recognized for 2009 was primarily due to thebenefit of carrying back to prior years a portion of our 2009 tax loss, net of the reversal of the use of certaintax credits.
2009 compared with 2008
Key factors affecting the results of our Single-Family business for 2009 compared with 2008 included thefollowing:
Guaranty Fee Income
Our guaranty fee income decreased due to a decrease in our average effective guaranty fee rate partially offsetby growth in the average single-family guaranty book of business. The decrease in our average effectiveguaranty fee rate was primarily attributable to lower amortization of deferred revenue in 2009 as the sharpdecline in interest rates in 2008 generated an acceleration of deferred amounts. This decline was partiallyoffset by a higher fair value adjustment on our buy-ups and certain guaranty assets recorded during 2009 dueto increased market prices on interest only-strips.
Our average single-family guaranty book of business increased by 5.5% in 2009 over 2008. We experiencedan increase in our average outstanding Fannie Mae MBS and other guarantees as our market share of newsingle-family mortgage-related securities issuances remained high and new MBS issuances outpacedliquidations. Our estimated market share of new single-family mortgage-related securities issuances, which isbased on publicly available data and excludes previously securitized mortgages, increased to 46.3% for 2009from 45.4% for 2008.
The average charged guaranty fee on our new single-family business decreased in 2009 compared with 2008.The decrease in the average charged fee was primarily the result of a reduction in our acquisition of loanswith higher risk, higher fee categories such as higher LTV and lower FICO scores due to (1) changes in ourunderwriting and eligibility standards; (2) changes in the eligibility standards of the mortgage insurancecompanies; and (3) the increased presence of FHA in the higher-LTV market.
Credit-Related Expenses
The increase in credit-related expenses was due to worsening credit performance trends, including significantincreases in delinquencies, defaults and loss severities, throughout our guaranty book of business, reflectingthe adverse impact of the decline in home prices, the weak economy and high unemployment. Certain higherrisk loan categories, loan vintages and loans within certain states that have had the greatest home pricedepreciation from their peaks continue to account for a disproportionate share of our credit losses, but we arealso experiencing deterioration in the credit performance of loans with fewer risk layers. In addition, the
111

increased level of troubled debt restructurings, particularly through workouts initiated as part of ourforeclosure prevention efforts, increased the number of loans that were individually impaired, contributing tothe increase in the provision for credit losses.
We also experienced a significant increase in fair value losses on credit-impaired loans acquired from MBStrusts for the purpose of modifying them during 2009, reflecting the increase in the number of delinquentloans acquired from MBS trusts, and the decrease in the estimated fair value of these loans compared with2008.
Credit-related expenses in the Single-Family business represent the substantial majority of the company’s totalcredit-related expenses. We provide additional information on total credit-related expenses in “ConsolidatedResults of Operations — Credit-Related Expenses.”
Federal Income Taxes
The net tax benefit recognized in 2009 was attributable to our ability to carry back current year tax losses toprevious tax years. We recorded a valuation allowance for the majority of the tax benefits associated with thepre-tax losses recognized in 2009 that we were unable to carry back to previous tax years as there has been nochange in the conclusion we reached in 2008 that it was more likely than not that we would not generatesufficient taxable income in the foreseeable future to realize all of the tax benefits generated from these losses.We recorded a non-cash charge in 2008 to establish a partial deferred tax asset valuation allowance against ournet deferred tax assets.
Multifamily Business Results
Table 21 summarizes the financial results of our Multifamily business for 2010 under the current segmentreporting presentation and for 2009 and 2008 under the prior segment reporting presentation. The primarysources of revenue for our Multifamily business are guaranty fee income and fee and other income. Expensesprimarily include credit-related expenses, net operating losses associated with our partnership investments, andadministrative expenses.
112

Table 21: Multifamily Business Results
2010 2009 2008For the Year Ended December 31,
(Dollars in millions)
Statement of operations data:(1)
Guaranty fee income(2). . . . . . . . . . . . . . . . . . . . . . . . . . . . . . . . . . . . . . . . . . . . . $ 791 $ 675 $ 633
Fee and other income . . . . . . . . . . . . . . . . . . . . . . . . . . . . . . . . . . . . . . . . . . . . . 146 100 186
Losses from partnership investments(3) . . . . . . . . . . . . . . . . . . . . . . . . . . . . . . . . . . (70) (6,735) (1,554)
Credit-related expenses(4) . . . . . . . . . . . . . . . . . . . . . . . . . . . . . . . . . . . . . . . . . . . (194) (2,216) (84)
Other expenses(5) . . . . . . . . . . . . . . . . . . . . . . . . . . . . . . . . . . . . . . . . . . . . . . . . . (443) (594) (880)
Income (loss) before federal income taxes . . . . . . . . . . . . . . . . . . . . . . . . . . . . . . . 230 (8,770) (1,699)
Provision for federal income taxes. . . . . . . . . . . . . . . . . . . . . . . . . . . . . . . . . . . . . (14) (311) (511)
Net income (loss) . . . . . . . . . . . . . . . . . . . . . . . . . . . . . . . . . . . . . . . . . . . . . . . . 216 (9,081) (2,210)
Less: Net loss attributable to the noncontrolling interests(3) . . . . . . . . . . . . . . . . . . . — 53 21
Net income (loss) attributable to Fannie Mae . . . . . . . . . . . . . . . . . . . . . . . . . . . . . $ 216 $ (9,028) $ (2,189)
Other key performance data:
Multifamily effective guaranty fee rate (in basis
points)(1)(6) . . . . . . . . . . . . . . . . . . . . . . . . . . . . . . . . . . . . . . . . . . . . . . . . . . . 42.3 37.6 39.1
Credit loss performance ratio (in basis points)(7) . . . . . . . . . . . . . . . . . . . . . . . . . . . 26.6 12.3 3.2
Average Multifamily guaranty book of business(8) . . . . . . . . . . . . . . . . . . . . . . . . . . $186,867 $179,315 $161,722
Multifamily new business volumes(9) . . . . . . . . . . . . . . . . . . . . . . . . . . . . . . . . . . . $ 17,919 $ 20,183 $ 35,025
Multifamily units financed from new business volumes(10) . . . . . . . . . . . . . . . . . . . . 306,000 372,000 577,000
Fannie Mae Multifamily MBS issuances(11) . . . . . . . . . . . . . . . . . . . . . . . . . . . . . . $ 26,499 $ 16,435 $ 5,862
Fannie Mae Multifamily structured securities issuances (issued by Capital Marketsgroup)(12) . . . . . . . . . . . . . . . . . . . . . . . . . . . . . . . . . . . . . . . . . . . . . . . . . . . . $ 4,808 $ 1,648 $ —
Additional net interest income earned on Fannie Mae
Multifamily mortgage loans and MBS (included in Capital Markets Group’sresults)(13) . . . . . . . . . . . . . . . . . . . . . . . . . . . . . . . . . . . . . . . . . . . . . . . . . . $ 865 $ 785 $ 565
Average Fannie Mae Multifamily mortgage loans and MBS in Capital MarketsGroup’s portfolio(14) . . . . . . . . . . . . . . . . . . . . . . . . . . . . . . . . . . . . . . . . . . . . . $115,839 $117,417 $102,422
2010 2009As of December 31,
(Dollars in millions)
Multifamily serious delinquency rate . . . . . . . . . . . . . . . . . . . . . . . . . . . . . . . . . . . . . . . . . . . . . . 0.71% 0.63%
Percentage of guaranty book of business with credit enhancement . . . . . . . . . . . . . . . . . . . . . . . . . 89% 89%
Fannie Mae percentage of total multifamily mortgage debt outstanding(15) . . . . . . . . . . . . . . . . . . . . 20.1% 19.8%
Fannie Mae Multifamily MBS outstanding(16) . . . . . . . . . . . . . . . . . . . . . . . . . . . . . . . . . . . . . . . $77,251 $59,852
(1) Segment statement of operations data reported under the current segment reporting basis is not comparable to thesegment statement of operations data reported in prior periods.
(2) In 2010, guaranty fee income related to consolidated MBS trusts consisted of contractual guaranty fees. In 2009 and2008, guaranty fee income also consisted of contractual guaranty fees and amortization of our guaranty-related assetsand liabilities using a prospective level yield method.
(3) In 2010, income or losses from partnership investments is reported using the equity method of accounting. As a result,net income or losses attributable to noncontrolling interests from partnership investments is not included in income orlosses for the Multifamily segment. In 2009 and 2008, income or losses from partnership investments is reported usingeither the equity method or consolidation, in accordance with GAAP, with net income or losses attributable tononcontrolling interests included in partnership investments income or losses.
(4) Consists of the provision for loan losses, provision or benefit for guaranty losses and foreclosed property expense.(5) Consists of net interest income or expense, investment gains, other expenses, and administrative expenses.
113

(6) Calculated based on Multifamily segment guaranty fee income divided by the average multifamily guaranty book ofbusiness, expressed in basis points.
(7) Calculated based on credit losses divided by the average multifamily guaranty book of business, expressed in basispoints.
(8) Consists of multifamily mortgage loans held in our mortgage portfolio, multifamily mortgage loans held byconsolidated trusts, multifamily Fannie Mae MBS issued from unconsolidated trusts held by either third parties orwithin our retained portfolio, and other credit enhancements that we provide on multifamily mortgage assets. Excludesnon-Fannie Mae mortgage-related securities held in our investment portfolio for which we do not provide a guaranty.
(9) Reflects unpaid principal balance of Fannie Mae MBS issued (excluding portfolio securitizations) and loans purchasedduring the period. Includes $1.0 billion and $391 million from the HFA new issue bond program for the years endedDecember 31, 2010 and December 31, 2009, respectively.
(10) Excludes HFA new issue bond program.(11) Reflects unpaid principal balance of Fannie Mae MBS issued during the period. Includes: (a) issuances of new MBS
volumes, (b) $8.7 billion of Fannie Mae portfolio securitization transactions for the year ended December 31, 2010and (c) $389 million of conversion of adjustable rate loans to fixed rate loans and DMBS securities to MBS securitiesfor the year ended December 31, 2010.
(12) Reflects original face value of out-of-portfolio structured securities issuances by our Capital Markets Group.(13) Interest expense estimate based on allocated duration matched funding costs. Net interest income was reduced by
guaranty fees allocated to Multifamily from the Capital Markets Group on multifamily loans in Fannie Mae’sportfolio.
(14) Based on unpaid principal balance.(15) Includes mortgage loans and Fannie Mae MBS issued and guaranteed by the Multifamily segment. Information for
2010 is through September 30, 2010 and has been obtained from the Federal Reserve’s September 2010 mortgagedebt outstanding release, the latest date for which the Federal Reserve has estimated mortgage debt outstanding formultifamily residences.
(16) Includes $19.9 billion of Fannie Mae multifamily MBS held in the mortgage portfolio, the vast majority of whichhave been consolidated to loans in our consolidated balance sheet, and $1.4 billion of bonds issued by HFAs as ofDecember 31, 2010.
2010 compared with 2009
Key factors affecting the results of our Multifamily business for 2010 compared with 2009 included thefollowing:
Guaranty Fee Income
Multifamily guaranty fee income increased in 2010 compared with 2009 primarily due to higher fees chargedon new acquisitions in recent years. New acquisitions with higher guaranty fees have become an increasinglylarge part of our book of business.
Losses from Partnership Investments
In 2009, we reduced the carrying value of our LIHTC investments to zero. As a result, we no longer recognizenet operating losses or other-than-temporary impairment on our LIHTC investments, which resulted in adecrease in losses from partnership investments in 2010 compared with 2009.
Credit-Related Expenses
Multifamily credit-related expenses decreased in 2010 compared with 2009 primarily due to a modest decreasein the allowance for loan losses in 2010, as multifamily credit trends stabilized, compared with the increase inthe allowance for 2009. The provision for credit losses for 2010 was $156 million compared with $2.2 billionfor 2009.
Although our allowance and provision for multifamily credit losses decreased, our multifamily charge-offs andforeclosed property expense remained elevated. Our multifamily net charge-offs and foreclosed propertyexpense increased from $220 million in 2009 to $498 million in 2010. The increase in net charge-offs and
114

foreclosed property expense was driven by increased volumes of multifamily REO acquisitions in 2010. Ourexpectation is that multifamily charge-offs will remain commensurate with 2010 levels throughout 2011 as wecontinue through the current economic cycle.
Federal Income Taxes
We recognized a provision for income taxes in 2010 resulting from a settlement agreement reached with theIRS with respect to our unrecognized tax benefits for tax years 1999 through 2004. The tax provisionrecognized in 2009 was attributable to the reversal of previously utilized tax credits because of our ability tocarry back net operating losses to recover taxes from prior years.
2009 compared with 2008
Key factors affecting the results of our Multifamily business for 2009 compared with 2008 included thefollowing:
Guaranty Fee Income
The increase in guaranty fee income in 2009 compared with 2008 was primarily attributable to growth in theaverage multifamily guaranty book of business. The increase in the average multifamily guaranty book ofbusiness reflected the investment and liquidity we have been providing to the multifamily mortgage market.Compared with 2008, during 2009 there was also an increase in the average charged guaranty fee rate, whichwas offset by lower guaranty-related amortization income.
Losses from Partnership Investments
We recorded $5.0 billion of other-than-temporary impairment on our LIHTC investments during the fourthquarter of 2009. We provide further discussion of losses from partnership investments, including detailsregarding other-than-temporary impairments of these assets, in “Consolidated Results of Operations—Lossesfrom Partnership Investments.”
Credit-Related Income (Expenses)
The increase in credit-related expenses in 2009 compared with 2008 largely reflected the increase in ourmultifamily combined loss reserves to $2.0 billion, or 1.10% of our multifamily guaranty book of business, asof December 31, 2009 from $104 million, or 0.06% of our multifamily guaranty book of business as ofDecember 31, 2008. The increase in the multifamily reserve was driven by several factors including higherseverity, deterioration in some large loans, lower property values, and weaker financial results from borrowers,all of which are a reflection of the weak economy. Net charge-offs and foreclosed property expenses totaled$220 million in 2009 compared with $52 million in 2008.
Federal Income Taxes
The net tax provision recognized in 2009 was attributable to the reversal of the use of certain tax credits, netof our ability to carryback current tax losses. In addition, we recorded a valuation allowance for all of the taxbenefits associated with the tax credits generated by our partnership investments in 2009. We recorded a non-cash charge in 2008 to establish a partial deferred tax asset valuation allowance against our net deferred taxassets.
Capital Markets Group Results
Table 22 summarizes the financial results of our Capital Markets group for 2010 under the current segmentreporting presentation and for 2009 and 2008 under the prior segment reporting presentation. Following thetable we discuss the Capital Markets group’s financial results and describe the Capital Markets group’smortgage portfolio. For a discussion on the debt issued by the Capital Markets group to fund its investmentactivities, see “Liquidity and Capital Management.” For a discussion on the derivative instruments that CapitalMarkets uses to manage interest rate risk, see “Consolidated Balance Sheet Analysis—Derivative Instruments,”
115
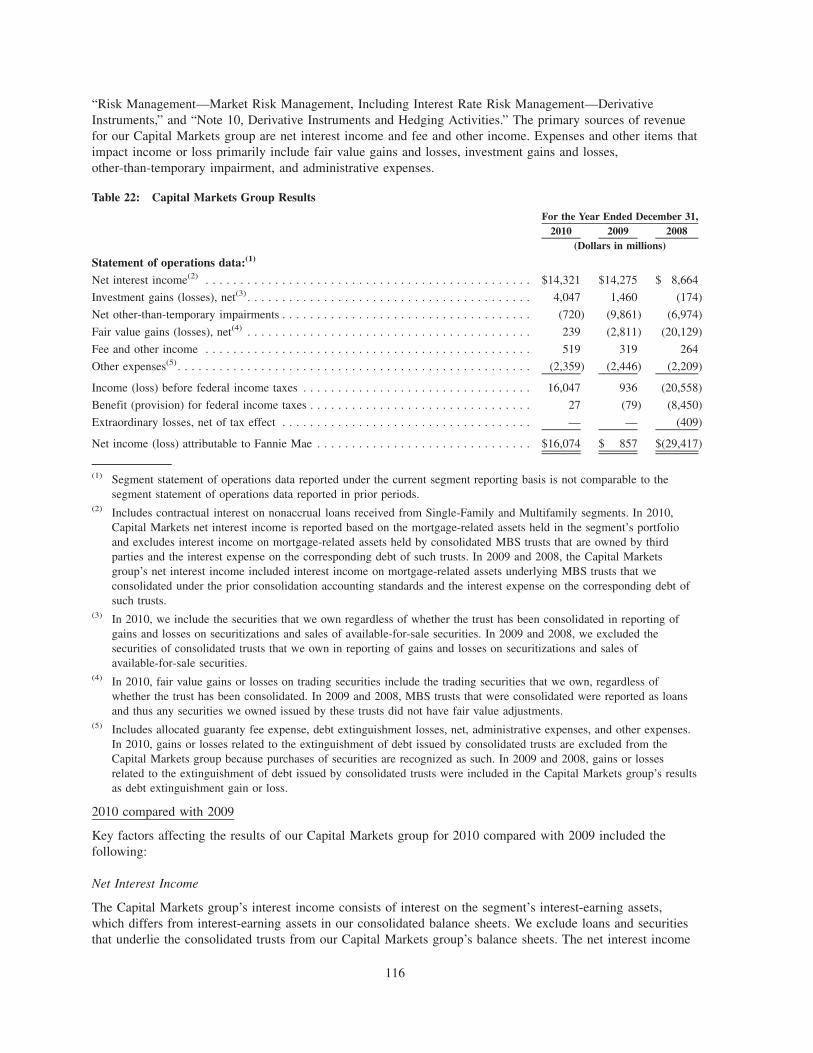
“Risk Management—Market Risk Management, Including Interest Rate Risk Management—DerivativeInstruments,” and “Note 10, Derivative Instruments and Hedging Activities.” The primary sources of revenuefor our Capital Markets group are net interest income and fee and other income. Expenses and other items thatimpact income or loss primarily include fair value gains and losses, investment gains and losses,other-than-temporary impairment, and administrative expenses.
Table 22: Capital Markets Group Results
2010 2009 2008For the Year Ended December 31,
(Dollars in millions)
Statement of operations data:(1)
Net interest income(2) . . . . . . . . . . . . . . . . . . . . . . . . . . . . . . . . . . . . . . . . . . . . . . . $14,321 $14,275 $ 8,664
Investment gains (losses), net(3) . . . . . . . . . . . . . . . . . . . . . . . . . . . . . . . . . . . . . . . . . 4,047 1,460 (174)
Net other-than-temporary impairments . . . . . . . . . . . . . . . . . . . . . . . . . . . . . . . . . . . . (720) (9,861) (6,974)
Fair value gains (losses), net(4) . . . . . . . . . . . . . . . . . . . . . . . . . . . . . . . . . . . . . . . . . 239 (2,811) (20,129)
Fee and other income . . . . . . . . . . . . . . . . . . . . . . . . . . . . . . . . . . . . . . . . . . . . . . . 519 319 264
Other expenses(5) . . . . . . . . . . . . . . . . . . . . . . . . . . . . . . . . . . . . . . . . . . . . . . . . . . . (2,359) (2,446) (2,209)
Income (loss) before federal income taxes . . . . . . . . . . . . . . . . . . . . . . . . . . . . . . . . . 16,047 936 (20,558)
Benefit (provision) for federal income taxes . . . . . . . . . . . . . . . . . . . . . . . . . . . . . . . . 27 (79) (8,450)
Extraordinary losses, net of tax effect . . . . . . . . . . . . . . . . . . . . . . . . . . . . . . . . . . . . — — (409)
Net income (loss) attributable to Fannie Mae . . . . . . . . . . . . . . . . . . . . . . . . . . . . . . . $16,074 $ 857 $(29,417)
(1) Segment statement of operations data reported under the current segment reporting basis is not comparable to thesegment statement of operations data reported in prior periods.
(2) Includes contractual interest on nonaccrual loans received from Single-Family and Multifamily segments. In 2010,Capital Markets net interest income is reported based on the mortgage-related assets held in the segment’s portfolioand excludes interest income on mortgage-related assets held by consolidated MBS trusts that are owned by thirdparties and the interest expense on the corresponding debt of such trusts. In 2009 and 2008, the Capital Marketsgroup’s net interest income included interest income on mortgage-related assets underlying MBS trusts that weconsolidated under the prior consolidation accounting standards and the interest expense on the corresponding debt ofsuch trusts.
(3) In 2010, we include the securities that we own regardless of whether the trust has been consolidated in reporting ofgains and losses on securitizations and sales of available-for-sale securities. In 2009 and 2008, we excluded thesecurities of consolidated trusts that we own in reporting of gains and losses on securitizations and sales ofavailable-for-sale securities.
(4) In 2010, fair value gains or losses on trading securities include the trading securities that we own, regardless ofwhether the trust has been consolidated. In 2009 and 2008, MBS trusts that were consolidated were reported as loansand thus any securities we owned issued by these trusts did not have fair value adjustments.
(5) Includes allocated guaranty fee expense, debt extinguishment losses, net, administrative expenses, and other expenses.In 2010, gains or losses related to the extinguishment of debt issued by consolidated trusts are excluded from theCapital Markets group because purchases of securities are recognized as such. In 2009 and 2008, gains or lossesrelated to the extinguishment of debt issued by consolidated trusts were included in the Capital Markets group’s resultsas debt extinguishment gain or loss.
2010 compared with 2009
Key factors affecting the results of our Capital Markets group for 2010 compared with 2009 included thefollowing:
Net Interest Income
The Capital Markets group’s interest income consists of interest on the segment’s interest-earning assets,which differs from interest-earning assets in our consolidated balance sheets. We exclude loans and securitiesthat underlie the consolidated trusts from our Capital Markets group’s balance sheets. The net interest income
116

reported by the Capital Markets group excludes the interest income earned on assets held by consolidatedtrusts. As a result, the Capital Markets group reports interest income and amortization of cost basisadjustments only on securities and loans that are held in our portfolio. For mortgage loans held in ourportfolio, when interest income is no longer recognized in accordance with our nonaccrual accounting policy,the Capital Markets group recognizes as interest income reimbursements the group receives primarily fromSingle-Family for the contractual interest due.
Capital Markets group’s interest expense consists of contractual interest on the Capital Markets group’sinterest-bearing liabilities, including the accretion and amortization of any cost basis adjustments. It excludesinterest expense on debt issued by consolidated trusts. Therefore, the interest expense recognized on theCapital Markets group’s statement of operations is limited to our funding debt, which is reported as “Debt ofFannie Mae” in our consolidated balance sheets. Net interest expense also includes an allocated cost of capitalcharge among the three business segments.
The Capital Markets group’s net interest income increased in 2010 compared with 2009 primarily due to adecline in funding costs as we replaced higher cost debt with lower cost debt. Also, Capital Markets’ netinterest income and net interest yield benefited from funds we received from Treasury under the seniorpreferred stock purchase agreement as the cash received was used to reduce our debt and the cost of thesefunds is included in dividends rather than interest expense.
We supplement our issuance of debt with interest rate-related derivatives to manage the prepayment andduration risk inherent in our mortgage investments. The effect of these derivatives, in particular the periodicnet interest expense accruals on interest rate swaps, is not reflected in Capital Markets’ net interest income butis included in our results as a component of “Fair value losses, net” and is shown in “Table 9: Fair ValueLosses, Net.” If we had included the economic impact of adding the net contractual interest accruals on ourinterest rate swaps in our Capital Markets’ interest expense, Capital Markets’ net interest income would havedecreased by $2.9 billion in 2010 compared with a $3.4 billion decrease in 2009.
Investment Gains (Losses), Net
The increase in investment gains in 2010 compared with 2009 was primarily driven by an increase in gains onsecuritizations as well as a significant decline in lower of cost or fair value adjustments on held-for-sale loans.
Net Other-Than-Temporary Impairment
The net other-than-temporary impairment recognized by the Capital Markets group is generally consistent withthe net other-than-temporary impairment reported in our consolidated results of operations. We discuss detailson net other-than-temporary impairment in “Consolidated Results of Operations—Net Other-Than-TemporaryImpairment.”
Fair Value Gains (Losses), Net
The derivative gains and losses and foreign exchange gains and losses that are reported for the CapitalMarkets group are consistent with these same losses reported in our consolidated results of operations. Wediscuss details of these components of fair value gains and losses in “Consolidated Results of Operations—Fair Value Gains (Losses), Net.”
The gains on our trading securities for the segment during 2010 were driven by a decrease in interest rates andnarrowing of credit spreads on CMBS.
The gains on our trading securities during 2009 were primarily attributable to the narrowing of credit spreadson CMBS, asset-backed securities, corporate debt securities and agency MBS, partially offset by an increase ininterest rates in 2009.
117

Federal Income Taxes
We recognized an income tax benefit in 2010 primarily due to the reversal of a portion of the valuationallowance for deferred tax assets resulting from a settlement agreement reached with the IRS in the firstquarter of 2010 for our unrecognized tax benefits for the tax years 1999 through 2004. We recorded avaluation allowance for the majority of the tax benefits associated with the pre-tax losses recognized in 2009.
2009 compared with 2008
Key factors affecting the results of our Capital Markets group for 2009 compared with 2008 included thefollowing:
Net Interest Income
The increase in net interest income in 2009 compared with 2008 was primarily attributable to an expansion ofour net interest yield driven by a reduction in the average cost of our debt that more than offset a decline inthe average yield on our interest-earning assets. The significant reduction in the average cost of our debtduring 2009 compared with 2008 was primarily attributable to a decline in borrowing rates as we replacedhigher cost debt with lower cost debt. Our net interest income does not include the effect of the periodic netcontractual interest accruals on our interest rate swaps which totaled $3.4 billion in 2009, compared with$1.6 billion in 2008.
Investment Gains (Losses), Net
The shift to investment gains in 2009 compared with investment losses in 2008 was primarily attributable to:(1) an increase in gains on portfolio securitizations as we increased our MBS issuance volumes and salesrelated to whole loan conduit activity and (2) an increase in realized gains on sales of available-for-salesecurities as tightening of investment spreads on agency MBS led to higher sale prices. These gains werepartially offset by an increase in lower of cost or fair value adjustments on loans, primarily driven by a declinein the credit quality of these loans and an increase in interest rates.
Net Other-Than-Temporary Impairment
Net other-than-temporary impairment increased during 2009. We discuss net-other-than-temporary impairmentin “Consolidated Results of Operations—Net Other-Than-Temporary Impairment.”
Fair Value Gains (Losses), Net
Fair value losses substantially decreased in 2009. We discuss our fair value losses in “Consolidated Results ofOperations—Fair Value Gains (Losses), Net.”
Federal Income Taxes
Federal income tax provision substantially declined in 2009 compared with 2008 as we recorded a non-cashcharge in 2008 to establish a partial deferred tax asset valuation allowance against our net deferred tax assets.
The Capital Markets Group’s Mortgage Portfolio
The Capital Markets group’s mortgage portfolio consists of mortgage-related securities and mortgage loansthat we own. Mortgage-related securities held by Capital Markets include Fannie Mae MBS and non-FannieMae mortgage-related securities. The Fannie Mae MBS that we own are maintained as securities on theCapital Markets group’s balance sheets. Mortgage-related assets held by consolidated MBS trusts are notincluded in the Capital Markets group’s mortgage portfolio.
We are restricted in the amount of mortgage assets that we may own. Please see “Conservatorship andTreasury Agreements—Treasury Agreements—Covenants under Treasury Agreement.”
118

Table 23 summarizes our Capital Markets group’s mortgage portfolio activity based on unpaid principalbalance for 2010.
Table 23: Capital Markets Group’s Mortgage Portfolio Activity
2010(Dollars in millions)
Total Capital Markets mortgage portfolio, beginning balance as of January 1, 2010 . . . . . . . . . . $ 772,728Mortgage loans:
Beginning balance as of January 1, 2010 . . . . . . . . . . . . . . . . . . . . . . . . . . . . . . . . . . . . . . . . . . 281,162Purchases . . . . . . . . . . . . . . . . . . . . . . . . . . . . . . . . . . . . . . . . . . . . . . . . . . . . . . . . . . . . . . 313,075Securitizations(1) . . . . . . . . . . . . . . . . . . . . . . . . . . . . . . . . . . . . . . . . . . . . . . . . . . . . . . . . . (95,783)Liquidations(2) . . . . . . . . . . . . . . . . . . . . . . . . . . . . . . . . . . . . . . . . . . . . . . . . . . . . . . . . . . (71,380)
Mortgage loans, ending balance as of December 31, 2010 . . . . . . . . . . . . . . . . . . . . . . . . . . . . . . 427,074Mortgage securities:
Beginning balance as of January 1, 2010 . . . . . . . . . . . . . . . . . . . . . . . . . . . . . . . . . . . . . . . . . . $ 491,566Purchases(3) . . . . . . . . . . . . . . . . . . . . . . . . . . . . . . . . . . . . . . . . . . . . . . . . . . . . . . . . . . . . 44,495Securitizations(1) . . . . . . . . . . . . . . . . . . . . . . . . . . . . . . . . . . . . . . . . . . . . . . . . . . . . . . . . . 95,783Sales . . . . . . . . . . . . . . . . . . . . . . . . . . . . . . . . . . . . . . . . . . . . . . . . . . . . . . . . . . . . . . . . . (179,620)Liquidations(2) . . . . . . . . . . . . . . . . . . . . . . . . . . . . . . . . . . . . . . . . . . . . . . . . . . . . . . . . . . (90,527)
Mortgage securities, ending balance as of December 31, 2010 . . . . . . . . . . . . . . . . . . . . . . . . . . . 361,697
Total Capital Markets mortgage portfolio, ending balance as of December 31, 2010 . . . . . . . . . . $ 788,771
(1) Includes portfolio securitization transactions that do not qualify for sale treatment under the new accounting standardson the transfers of financial assets.
(2) Includes scheduled repayments, prepayments, foreclosures and lender repurchases.(3) Includes purchases of Fannie Mae MBS issued by consolidated trusts.
The Capital Markets group’s mortgage portfolio activity for 2010 has been impacted by an increase inpurchases of delinquent loans from single-family MBS trusts. We purchased approximately 1,118,000delinquent loans with an unpaid principal balance of approximately $217 billion from our single-family MBStrusts in 2010. The substantial majority of these delinquent loan purchases were completed in the first half of2010.
Table 24 shows the composition of the Capital Markets group’s mortgage portfolio based on unpaid principalbalance as of December 31, 2010 and as of January 1, 2010, immediately after we adopted the newaccounting standards.
119
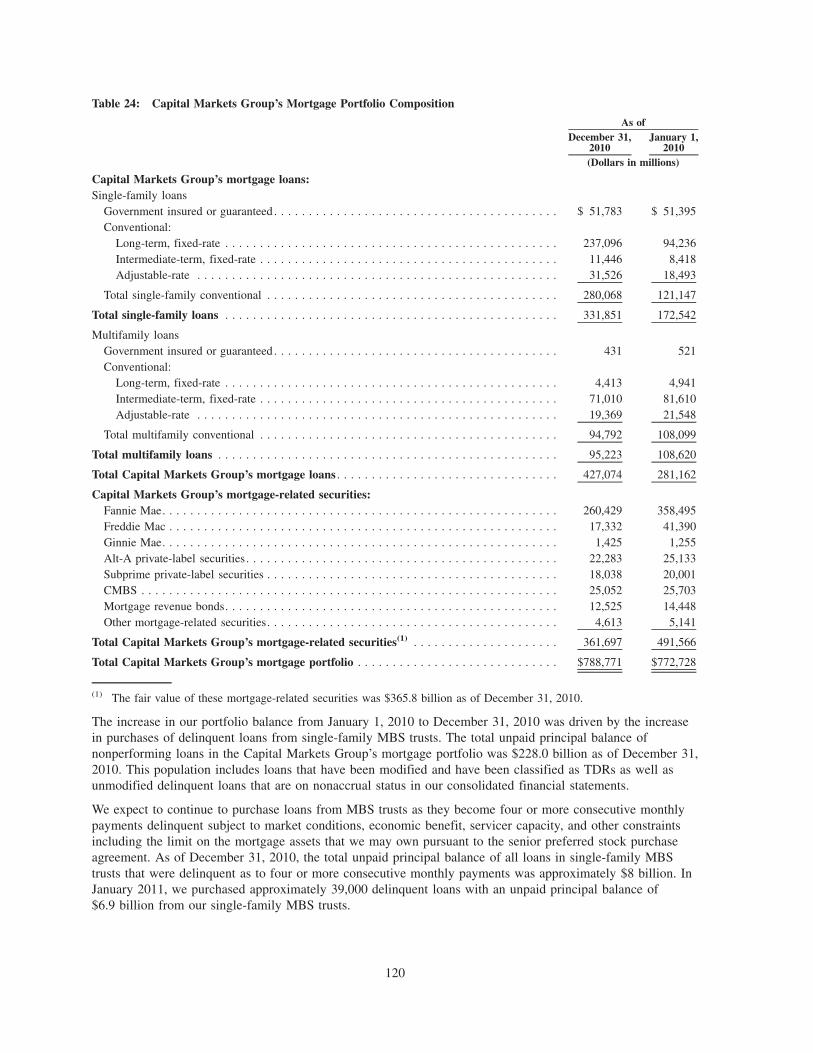
Table 24: Capital Markets Group’s Mortgage Portfolio Composition
December 31,2010
January 1,2010
As of
(Dollars in millions)
Capital Markets Group’s mortgage loans:Single-family loans
Government insured or guaranteed . . . . . . . . . . . . . . . . . . . . . . . . . . . . . . . . . . . . . . . . . $ 51,783 $ 51,395Conventional:
Long-term, fixed-rate . . . . . . . . . . . . . . . . . . . . . . . . . . . . . . . . . . . . . . . . . . . . . . . . 237,096 94,236Intermediate-term, fixed-rate . . . . . . . . . . . . . . . . . . . . . . . . . . . . . . . . . . . . . . . . . . . 11,446 8,418Adjustable-rate . . . . . . . . . . . . . . . . . . . . . . . . . . . . . . . . . . . . . . . . . . . . . . . . . . . . 31,526 18,493
Total single-family conventional . . . . . . . . . . . . . . . . . . . . . . . . . . . . . . . . . . . . . . . . . . 280,068 121,147
Total single-family loans . . . . . . . . . . . . . . . . . . . . . . . . . . . . . . . . . . . . . . . . . . . . . . . . 331,851 172,542
Multifamily loansGovernment insured or guaranteed . . . . . . . . . . . . . . . . . . . . . . . . . . . . . . . . . . . . . . . . . 431 521Conventional:
Long-term, fixed-rate . . . . . . . . . . . . . . . . . . . . . . . . . . . . . . . . . . . . . . . . . . . . . . . . 4,413 4,941Intermediate-term, fixed-rate . . . . . . . . . . . . . . . . . . . . . . . . . . . . . . . . . . . . . . . . . . . 71,010 81,610Adjustable-rate . . . . . . . . . . . . . . . . . . . . . . . . . . . . . . . . . . . . . . . . . . . . . . . . . . . . 19,369 21,548
Total multifamily conventional . . . . . . . . . . . . . . . . . . . . . . . . . . . . . . . . . . . . . . . . . . . 94,792 108,099
Total multifamily loans . . . . . . . . . . . . . . . . . . . . . . . . . . . . . . . . . . . . . . . . . . . . . . . . . 95,223 108,620
Total Capital Markets Group’s mortgage loans . . . . . . . . . . . . . . . . . . . . . . . . . . . . . . . . 427,074 281,162
Capital Markets Group’s mortgage-related securities:Fannie Mae. . . . . . . . . . . . . . . . . . . . . . . . . . . . . . . . . . . . . . . . . . . . . . . . . . . . . . . . . 260,429 358,495Freddie Mac . . . . . . . . . . . . . . . . . . . . . . . . . . . . . . . . . . . . . . . . . . . . . . . . . . . . . . . . 17,332 41,390Ginnie Mae. . . . . . . . . . . . . . . . . . . . . . . . . . . . . . . . . . . . . . . . . . . . . . . . . . . . . . . . . 1,425 1,255Alt-A private-label securities . . . . . . . . . . . . . . . . . . . . . . . . . . . . . . . . . . . . . . . . . . . . . 22,283 25,133Subprime private-label securities . . . . . . . . . . . . . . . . . . . . . . . . . . . . . . . . . . . . . . . . . . 18,038 20,001CMBS . . . . . . . . . . . . . . . . . . . . . . . . . . . . . . . . . . . . . . . . . . . . . . . . . . . . . . . . . . . . 25,052 25,703Mortgage revenue bonds. . . . . . . . . . . . . . . . . . . . . . . . . . . . . . . . . . . . . . . . . . . . . . . . 12,525 14,448Other mortgage-related securities. . . . . . . . . . . . . . . . . . . . . . . . . . . . . . . . . . . . . . . . . . 4,613 5,141
Total Capital Markets Group’s mortgage-related securities(1) . . . . . . . . . . . . . . . . . . . . . 361,697 491,566
Total Capital Markets Group’s mortgage portfolio . . . . . . . . . . . . . . . . . . . . . . . . . . . . . $788,771 $772,728
(1) The fair value of these mortgage-related securities was $365.8 billion as of December 31, 2010.
The increase in our portfolio balance from January 1, 2010 to December 31, 2010 was driven by the increasein purchases of delinquent loans from single-family MBS trusts. The total unpaid principal balance ofnonperforming loans in the Capital Markets Group’s mortgage portfolio was $228.0 billion as of December 31,2010. This population includes loans that have been modified and have been classified as TDRs as well asunmodified delinquent loans that are on nonaccrual status in our consolidated financial statements.
We expect to continue to purchase loans from MBS trusts as they become four or more consecutive monthlypayments delinquent subject to market conditions, economic benefit, servicer capacity, and other constraintsincluding the limit on the mortgage assets that we may own pursuant to the senior preferred stock purchaseagreement. As of December 31, 2010, the total unpaid principal balance of all loans in single-family MBStrusts that were delinquent as to four or more consecutive monthly payments was approximately $8 billion. InJanuary 2011, we purchased approximately 39,000 delinquent loans with an unpaid principal balance of$6.9 billion from our single-family MBS trusts.
120

CONSOLIDATED BALANCE SHEET ANALYSIS
We seek to structure the composition of our balance sheet and manage its size to comply with our regulatoryrequirements, to provide adequate liquidity to meet our needs, and to mitigate our interest rate risk and creditrisk exposure. The major asset components of our consolidated balance sheet include our mortgageinvestments and our cash and other investments portfolio. We fund and manage the interest rate risk on theseinvestments through the issuance of debt securities and the use of derivatives. Our debt securities andderivatives represent the major liability components of our consolidated balance sheet.
As discussed in “Business—Executive Summary,” on January 1, 2010 we prospectively adopted newaccounting standards, which had a significant impact on the presentation and comparability of ourconsolidated financial statements. The new standards resulted in the consolidation of the substantial majorityof our single-class securitization trusts and the elimination of previously recorded deferred revenue from ourguaranty arrangements. In the table below, we summarize the primary impacts of the new accountingstandards to our consolidated balance sheet for 2010.
Item Consolidation Impact
Restricted cash We recognize unscheduled cash payments that have been either received by the servicer or that areheld by consolidated trusts and have not yet been remitted to MBS certificateholders.
Investments insecurities
Fannie Mae MBS that we own were consolidated resulting in a decrease in our investments insecurities.
Mortgage loans
Accrued interestreceivable
We now record the underlying assets of the majority of our MBS trusts in our consolidated balancesheets, which significantly increases mortgage loans and related accrued interest receivable.
Allowance for loanlosses
Reserve forguaranty losses
The substantial majority of our combined loss reserves are now recognized in our allowance forloan losses to reflect the loss allowance against the consolidated mortgage loans. We use a differentmethodology to estimate incurred losses for our allowance for loan losses as compared with ourreserve for guaranty losses.
Guaranty assets
Guarantyobligations
We eliminated our guaranty accounting for the newly consolidated trusts, which resulted inderecognizing previously recorded guaranty-related assets and liabilities associated with the newlyconsolidated trusts from our consolidated balance sheets. We continue to have guaranty assets andobligations on unconsolidated trusts and other credit enhancements arrangements, such as our long-term standby commitments.
Debt
Accrued interestpayable
We recognize the MBS certificates issued by the consolidated trusts and that are held by third-partycertificateholders as debt, which significantly increases our debt outstanding and related accruedinterest payable.
We recognized a decrease of $3.3 billion in our stockholders’ deficit to reflect the cumulative effect ofadopting the new accounting standards. See “Note 2, Adoption of the New Accounting Standards on theTransfers of Financial Assets and Consolidation of Variable Interest Entities” for a further discussion of theimpacts of the new accounting standards on our consolidated financial statements.
Table 25 presents a summary of our consolidated balance sheets as of December 31, 2010 and 2009, as wellas the impact of the transition to the new accounting standards on January 1, 2010. Following the table is adiscussion of material changes in the major components of our assets, liabilities and deficit from January 1,2010 to December 31, 2010.
121

Table 25: Summary of Consolidated Balance Sheets
December 31,2010
January 1,2010
December 31,2009
January 1 toDecember 31, 2010
December 31, 2009 toJanuary 1, 2010
As of Variance
(Dollars in millions)
Assets
Cash and cash equivalents and federalfunds sold and securities purchasedunder agreements to resell or similararrangements . . . . . . . . . . . . . . . . . . $ 29,048 $ 60,161 $ 60,496 $(31,113) $ (335)
Restricted cash . . . . . . . . . . . . . . . . . . . 63,678 48,653 3,070 15,025 45,583
Investments in securities(1) . . . . . . . . . . . 151,248 161,088 349,667 (9,840) (188,579)
Mortgage loans . . . . . . . . . . . . . . . . . . . 2,985,276 2,985,445 404,486 (169) 2,580,959
Allowance for loan losses . . . . . . . . . . . . (61,556) (53,501) (9,925) (8,055) (43,576)
Mortgage loans, net of allowance forloan losses . . . . . . . . . . . . . . . . . . 2,923,720 2,931,944 394,561 (8,224) 2,537,383
Other assets(2) . . . . . . . . . . . . . . . . . . . 54,278 44,389 61,347 9,889 (16,958)
Total assets . . . . . . . . . . . . . . . . . . . . $3,221,972 $3,246,235 $869,141 $(24,263) $2,377,094
Liabilities and equity (deficit)
Debt(3) . . . . . . . . . . . . . . . . . . . . . . . . $3,197,052 $3,223,054 $774,554 $(26,002) $2,448,500
Other liabilities(4) . . . . . . . . . . . . . . . . . 27,437 35,164 109,868 (7,727) (74,704)
Total liabilities . . . . . . . . . . . . . . . . . 3,224,489 3,258,218 884,422 (33,729) 2,373,796
Senior preferred stock . . . . . . . . . . . . . . 88,600 60,900 60,900 27,700 —
Other equity (deficit)(5) . . . . . . . . . . . . . (91,117) (72,883) (76,181) (18,234) 3,298
Total stockholders’ equity (deficit) . . . . (2,517) (11,983) (15,281) 9,466 3,298
Total liabilities and stockholders’deficit . . . . . . . . . . . . . . . . . . . . . . . $3,221,972 $3,246,235 $869,141 $(24,263) $2,377,094
(1) Includes $32.8 billion as of December 31, 2010 and $8.9 billion as of both January 1, 2010 and December 31, 2009 ofnon-mortgage-related securities that are included in our other investments portfolio in “Table 37: Cash and OtherInvestments Portfolio.”
(2) Consists of: accrued interest receivable, net; acquired property, net; servicer and MBS trust receivable and other assets.(3) Consists of: federal funds purchased and securities sold under agreements to repurchase; short-term debt; and long-
term debt.(4) Consists of: accrued interest payable; reserve for guaranty losses; servicer and MBS trust payable; and other liabilities.(5) Consists of: preferred stock; common stock; additional paid-in capital; retained earnings (accumulated deficit);
accumulated other comprehensive loss; treasury stock; and noncontrolling interest.
Cash and Cash Equivalents and Federal Funds Sold and Securities Purchased under Agreements toResell or Similar Arrangements
Cash and cash equivalents and federal funds sold and securities purchased under agreements to resell orsimilar arrangements are included in our cash and other investments portfolio. See “Liquidity and CapitalManagement—Liquidity Management— Liquidity Risk Management Practices and Contingency Planning—Cash and Other Investments Portfolio” for additional information on our cash and other investments portfolio.
Investments in Mortgage-Related Securities
Our investments in mortgage-related securities are classified in our consolidated balance sheets as eithertrading or available-for-sale and are reported at fair value. Gains and losses on trading securities arerecognized in earnings, while unrealized gains and losses on available-for-sale securities are recorded instockholders’ equity (deficit) as a component of “Accumulated other comprehensive loss” (“AOCI”). See
122

“Note 6, Investments in Securities” for additional information on our investments in mortgage-relatedsecurities, including the composition of our trading and available-for-sale securities at amortized cost and fairvalue and the gross unrealized gains and losses related to our available-for-sale securities as of December 31,2010.
Investments in Agency Mortgage-Related Securities
Our investments in agency mortgage-related securities consist of securities issued by Fannie Mae, Freddie Macand Ginnie Mae. Investments in agency mortgage securities declined to $50.2 billion as of December 31, 2010compared with $83.7 billion as of January 1, 2010. The decline was primarily due to settlement of salescommitments related to dollar roll transactions.
Investments in Private-Label Mortgage-Related Securities
We classify private-label securities as Alt-A, subprime, multifamily or manufactured housing if the securitieswere labeled as such when issued. We have also invested in private-label subprime mortgage-related securitiesthat we have resecuritized to include our guaranty (“wraps”).
The continued negative impact of the current economic environment, including sustained weakness in thehousing market and high unemployment, has adversely affected the performance of our Alt-A and subprimeprivate-label securities. The unpaid principal balance of our investments in Alt-A and subprime securities was$40.7 billion as of December 31, 2010, of which $30.8 billion was rated below investment grade. Table 26presents the fair value of our investments in Alt-A and subprime private-label securities and an analysis of thecumulative losses on these investments as of December 31, 2010. As of December 31, 2010, we had realizedactual cumulative principal shortfalls of approximately 2% of the total cumulative credit losses reported in thistable and reflected in our consolidated financial statements.
Table 26: Analysis of Losses on Alt-A and Subprime Private-Label Mortgage-Related Securities
UnpaidPrincipalBalance
FairValue
TotalCumulative
Losses(1)Noncredit
Component(2)Credit
Component (3)
As of December 31, 2010
(Dollars in millions)
Trading securities:(4)
Alt-A private-label securities . . . . . . . . . . . . . . $ 3,082 $ 1,683 $ (1,351) $ (188) $(1,163)
Subprime private-label securities . . . . . . . . . . . 2,767 1,581 (1,186) (278) (908)
Total . . . . . . . . . . . . . . . . . . . . . . . . . . . . . . $ 5,849 $ 3,264 $ (2,537) $ (466) $(2,071)
Available-for-sale securities:
Alt-A private-label securities . . . . . . . . . . . . . . $19,201 $13,890 $ (5,410) $(1,899) $(3,511)
Subprime private-label securities(5) . . . . . . . . . 15,643 9,932 (5,751) (1,391) (4,360)
Total . . . . . . . . . . . . . . . . . . . . . . . . . . . . . . $34,844 $23,822 $(11,161) $(3,290) $(7,871)
Grand Total . . . . . . . . . . . . . . . . . . . . . . . . . . . $40,693 $27,086 $(13,698) $(3,756) $(9,942)
(1) Amounts reflect the difference between the fair value and unpaid principal balance net of unamortized premiums,discounts and certain other cost basis adjustments.
(2) Represents the estimated portion of the total cumulative losses that is noncredit-related. We have calculated the creditcomponent based on the difference between the amortized cost basis of the securities and the present value of expectedfuture cash flows. The remaining difference between the fair value and the present value of expected future cash flowsis classified as noncredit-related.
(3) For securities classified as trading, amounts reflect the estimated portion of the total cumulative losses that is credit-related. For securities classified as available-for-sale, amounts reflect the portion of other-than-temporary impairmentlosses net of accretion that are recognized in earnings in accordance with the accounting standards forother-than-temporary impairments.
123

(4) Excludes resecuritizations, or wraps, of private-label securities backed by subprime loans that we have guaranteed andhold in our mortgage portfolio as Fannie Mae securities.
(5) Includes a wrap transaction that has been partially consolidated on our balance sheet, which effectively resulted in aportion of the underlying structure of the transaction being accounted for and reported as available-for-sale securities.
Table 27 presents the 60 days or more delinquency rates and average loss severities for the loans underlyingour Alt-A and subprime private-label mortgage-related securities for the most recent remittance period of thecurrent reporting quarter. The delinquency rates and average loss severities are based on available dataprovided by Intex Solutions, Inc. (“Intex”) and First American CoreLogic, LoanPerformance (“First AmericanCoreLogic”). We also present the average credit enhancement and monoline financial guaranteed amount forthese securities as of December 31, 2010. Based on the stressed condition of some of our financial guarantors,we believe some of these counterparties will not fully meet their obligation to us in the future. See “RiskManagement—Credit Risk Management—Institutional Counterparty Credit Risk Management—FinancialGuarantors” for additional information on our financial guarantor exposure and the counterparty riskassociated with our financial guarantors.
Table 27: Credit Statistics of Loans Underlying Alt-A and Subprime Private-Label Mortgage-Related Securities(Including Wraps)
Trading
Available-for-Sale Wraps(1)
� 60 DaysDelinquent(2)(3)
AverageLoss
Severity(3)(4)
AverageCredit
Enhancement(3)(5)
MonolineFinancial
GuaranteedAmount(6)
Unpaid Principal BalanceAs of December 31, 2010
(Dollars in millions)
Private-label mortgage-related securities backed by:(7)
Alt-A mortgage loans:Option ARM Alt-A
mortgage loans:2004 and prior . . . . . . . . $ — $ 521 $ — 33.5% 48.8% 19.5% $ —2005 . . . . . . . . . . . . . . . — 1,401 — 44.3 54.1 43.8 2722006 . . . . . . . . . . . . . . . — 1,379 — 46.6 58.9 33.9 1552007 . . . . . . . . . . . . . . . 2,145 — — 45.8 60.0 60.2 781
Other Alt-A mortgageloans:2004 and prior . . . . . . . . — 6,927 — 10.1 56.8 12.3 142005 . . . . . . . . . . . . . . . 93 4,460 136 24.6 54.8 7.2 —2006 . . . . . . . . . . . . . . . 68 4,384 — 30.6 56.0 2.3 —2007 . . . . . . . . . . . . . . . 776 — 200 44.8 65.2 33.3 3222008(8) . . . . . . . . . . . . . — 129 — — — — —
Total Alt-A mortgageloans: . . . . . . . . . . . . . . 3,082 19,201 336 1,544
Subprime mortgage loans:2004 and prior(9) . . . . . . — 2,216 679 24.6 87.2 60.0 6882005(8) . . . . . . . . . . . . . — 206 1,504 45.0 78.4 58.1 2292006 . . . . . . . . . . . . . . . — 12,565 — 50.2 76.7 20.7 522007 . . . . . . . . . . . . . . . 2,767 656 5,833 49.5 73.2 24.2 183
Total subprime mortgageloans: . . . . . . . . . . . . . . 2,767 15,643 8,016 1,152
Total Alt-A and subprimemortgage loans: . . . . . . . $5,849 $34,844 $8,352 $2,696
(1) Represents our exposure to private-label Alt-A and subprime mortgage-related securities that have been resecuritized(or wrapped) to include our guarantee.
124

(2) Delinquency data provided by Intex, where available, for loans backing Alt-A and subprime private-label mortgage-related securities that we own or guarantee. The reported Intex delinquency data reflects information from December2010 remittances for November 2010 payments. For consistency purposes, we have adjusted the Intex delinquencydata, where appropriate, to include all bankruptcies, foreclosures and REO in the delinquency rates.
(3) The average delinquency, severity and credit enhancement metrics are calculated for each loan pool associated withsecurities where Fannie Mae has exposure and are weighted based on the unpaid principal balance of those securities.
(4) Severity data obtained from First American CoreLogic, where available, for loans backing Alt-A and subprime private-label mortgage-related securities that we own or guarantee. The First American CoreLogic severity data reflectsinformation from December 2010 remittances for November 2010 payments. For consistency purposes, we haveadjusted the severity data, where appropriate.
(5) Average credit enhancement percentage reflects both subordination and financial guarantees. Reflects the ratio of thecurrent amount of the securities that will incur losses in the securitization structure before any losses are allocated tosecurities that we own or guarantee. Percentage generally calculated based on the quotient of the total unpaid principalbalance of all credit enhancements in the form of subordination or financial guarantee of the security divided by thetotal unpaid principal balance of all of the tranches of collateral pools from which credit support is drawn for thesecurity that we own or guarantee.
(6) Reflects amount of unpaid principal balance supported by financial guarantees from monoline financial guarantors.(7) Vintages are based on series date and not loan origination date.(8) The unpaid principal balance includes private-label REMIC securities that have been resecuritized totaling
$129 million for the 2008 vintage of other Alt-A loans and $23 million for the 2005 vintage of subprime loans. Thesesecurities are excluded from the delinquency, severity and credit enhancement statistics reported in this table.
(9) Includes a wrap transaction that has been partially consolidated on our balance sheet, which effectively resulted in aportion of the underlying structure of the transaction being accounted for and reported as available-for-sale securities.
Mortgage Loans
The mortgage loans reported in our consolidated balance sheets include loans owned by Fannie Mae and loansheld in consolidated trusts and are classified as either held for sale or held for investment. Mortgage loansremained relatively flat from January 1, 2010 to December 31, 2010 as the principal balance of the loanssecuritized through our lender swap and portfolio securitization programs was offset by scheduled principalpaydowns and prepayments. For additional information on our mortgage loans, see “Note 4, Mortgage Loans.”For additional information on the mortgage loan purchase and sale activities reported by our Capital Marketsgroup, see “Business Segment Results—Segment Results—Capital Markets Group Results.”
Debt Instruments
The debt reported in our consolidated balance sheets consists of two categories of debt, which we refer to as“debt of Fannie Mae” and “debt of consolidated trusts.” Debt of Fannie Mae, which consists of short-termdebt, long-term debt and federal funds purchased and securities sold under agreements to repurchase, is theprimary means of funding our mortgage investments. Debt of consolidated trusts represents our liability tothird-party beneficial interest holders when we have included the assets of a corresponding trust in ourconsolidated balance sheets. We provide a summary of the activity of the debt of Fannie Mae and acomparison of the mix between our outstanding short-term and long-term debt as of December 31, 2010 and2009 in “Liquidity and Capital Management—Liquidity Management—Debt Funding.” Also see “Note 9,Short-Term Borrowings and Long-Term Debt” for additional information on our outstanding debt.
The decrease in debt of consolidated trusts from January 1, 2010 to December 31, 2010 was primarily drivenby the purchase of delinquent loans from MBS trusts as purchasing these loans from MBS trusts for ourportfolio results in the extinguishment of the associated consolidated trust debt.
Derivative Instruments
We supplement our issuance of debt with interest rate-related derivatives to manage the prepayment andduration risk inherent in our mortgage investments. We aggregate, by derivative counterparty, the net fair value
125
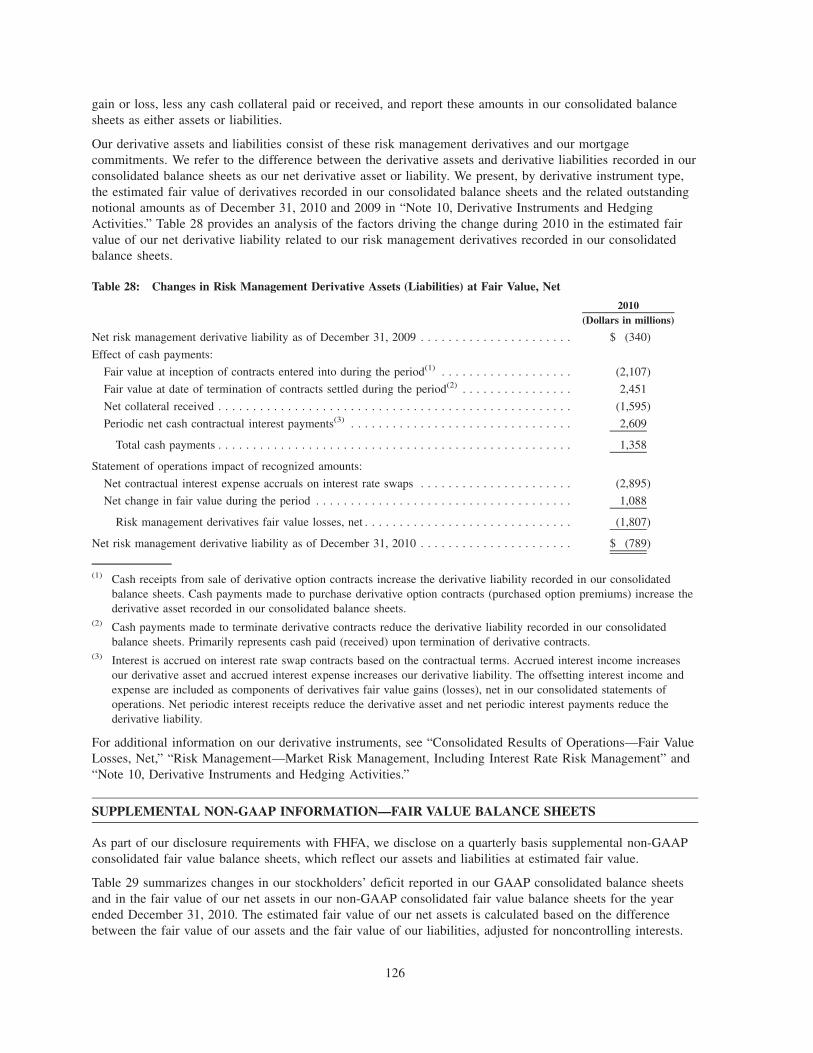
gain or loss, less any cash collateral paid or received, and report these amounts in our consolidated balancesheets as either assets or liabilities.
Our derivative assets and liabilities consist of these risk management derivatives and our mortgagecommitments. We refer to the difference between the derivative assets and derivative liabilities recorded in ourconsolidated balance sheets as our net derivative asset or liability. We present, by derivative instrument type,the estimated fair value of derivatives recorded in our consolidated balance sheets and the related outstandingnotional amounts as of December 31, 2010 and 2009 in “Note 10, Derivative Instruments and HedgingActivities.” Table 28 provides an analysis of the factors driving the change during 2010 in the estimated fairvalue of our net derivative liability related to our risk management derivatives recorded in our consolidatedbalance sheets.
Table 28: Changes in Risk Management Derivative Assets (Liabilities) at Fair Value, Net
2010(Dollars in millions)
Net risk management derivative liability as of December 31, 2009 . . . . . . . . . . . . . . . . . . . . . . $ (340)
Effect of cash payments:
Fair value at inception of contracts entered into during the period(1) . . . . . . . . . . . . . . . . . . . (2,107)
Fair value at date of termination of contracts settled during the period(2) . . . . . . . . . . . . . . . . 2,451
Net collateral received . . . . . . . . . . . . . . . . . . . . . . . . . . . . . . . . . . . . . . . . . . . . . . . . . . . (1,595)
Periodic net cash contractual interest payments(3) . . . . . . . . . . . . . . . . . . . . . . . . . . . . . . . . 2,609
Total cash payments . . . . . . . . . . . . . . . . . . . . . . . . . . . . . . . . . . . . . . . . . . . . . . . . . . . 1,358
Statement of operations impact of recognized amounts:
Net contractual interest expense accruals on interest rate swaps . . . . . . . . . . . . . . . . . . . . . . (2,895)
Net change in fair value during the period . . . . . . . . . . . . . . . . . . . . . . . . . . . . . . . . . . . . . 1,088
Risk management derivatives fair value losses, net . . . . . . . . . . . . . . . . . . . . . . . . . . . . . . (1,807)
Net risk management derivative liability as of December 31, 2010 . . . . . . . . . . . . . . . . . . . . . . $ (789)
(1) Cash receipts from sale of derivative option contracts increase the derivative liability recorded in our consolidatedbalance sheets. Cash payments made to purchase derivative option contracts (purchased option premiums) increase thederivative asset recorded in our consolidated balance sheets.
(2) Cash payments made to terminate derivative contracts reduce the derivative liability recorded in our consolidatedbalance sheets. Primarily represents cash paid (received) upon termination of derivative contracts.
(3) Interest is accrued on interest rate swap contracts based on the contractual terms. Accrued interest income increasesour derivative asset and accrued interest expense increases our derivative liability. The offsetting interest income andexpense are included as components of derivatives fair value gains (losses), net in our consolidated statements ofoperations. Net periodic interest receipts reduce the derivative asset and net periodic interest payments reduce thederivative liability.
For additional information on our derivative instruments, see “Consolidated Results of Operations—Fair ValueLosses, Net,” “Risk Management—Market Risk Management, Including Interest Rate Risk Management” and“Note 10, Derivative Instruments and Hedging Activities.”
SUPPLEMENTAL NON-GAAP INFORMATION—FAIR VALUE BALANCE SHEETS
As part of our disclosure requirements with FHFA, we disclose on a quarterly basis supplemental non-GAAPconsolidated fair value balance sheets, which reflect our assets and liabilities at estimated fair value.
Table 29 summarizes changes in our stockholders’ deficit reported in our GAAP consolidated balance sheetsand in the fair value of our net assets in our non-GAAP consolidated fair value balance sheets for the yearended December 31, 2010. The estimated fair value of our net assets is calculated based on the differencebetween the fair value of our assets and the fair value of our liabilities, adjusted for noncontrolling interests.
126

We use various valuation techniques to estimate fair value, some of which incorporate internal assumptionsthat are subjective and involve a high degree of management judgment. We describe the specific valuationtechniques used to determine fair value and disclose the carrying value and fair value of our financial assetsand liabilities in “Note 19, Fair Value.”
Table 29: Comparative Measures—GAAP Change in Stockholders’ Deficit and Non-GAAP Change in Fair Valueof Net Assets (Net of Tax Effect)
2010(Dollars in millions)
GAAP consolidated balance sheets:
Fannie Mae stockholders’ deficit as of December 31, 2009 . . . . . . . . . . . . . . . . . . . . . . . . . . . . . . . $ (15,372)
Impact of new accounting standards on Fannie Mae stockholders’ deficit as of January 1, 2010(1) . . . . 3,312
Fannie Mae stockholders’ deficit as of January 1, 2010(2) . . . . . . . . . . . . . . . . . . . . . . . . . . . . . . . . (12,060)
Net loss attributable to Fannie Mae . . . . . . . . . . . . . . . . . . . . . . . . . . . . . . . . . . . . . . . . . . . . . . . (14,014)
Changes in net unrealized losses on available-for-sale securities, net of tax. . . . . . . . . . . . . . . . . . . . 3,054
Reclassification adjustment for other-than-temporary impairments recognized in net loss, net of tax . . 469
Capital transactions:(3)
Funds received from Treasury under the senior preferred stock purchase agreement . . . . . . . . . . . . 27,700
Senior preferred stock dividends. . . . . . . . . . . . . . . . . . . . . . . . . . . . . . . . . . . . . . . . . . . . . . . . (7,706)
Capital transactions, net . . . . . . . . . . . . . . . . . . . . . . . . . . . . . . . . . . . . . . . . . . . . . . . . . . . . . . . 19,994
Other equity transactions . . . . . . . . . . . . . . . . . . . . . . . . . . . . . . . . . . . . . . . . . . . . . . . . . . . . . . (42)
Fannie Mae stockholders’ deficit as of December 31, 2010(2) . . . . . . . . . . . . . . . . . . . . . . . . . . . . . $ (2,599)
Non-GAAP consolidated fair value balance sheets:
Estimated fair value of net assets as of December 31, 2009 . . . . . . . . . . . . . . . . . . . . . . . . . . . . . . $ (98,792)
Impact of new accounting standards on Fannie Mae estimated fair value of net assets as of January 1,2010(1) . . . . . . . . . . . . . . . . . . . . . . . . . . . . . . . . . . . . . . . . . . . . . . . . . . . . . . . . . . . . . . . . . (52,302)
Estimated fair value of net assets as of January 1, 2010 . . . . . . . . . . . . . . . . . . . . . . . . . . . . . . . . . (151,094)
Capital transactions, net . . . . . . . . . . . . . . . . . . . . . . . . . . . . . . . . . . . . . . . . . . . . . . . . . . . . . . . 19,994
Change in estimated fair value of net assets(4) . . . . . . . . . . . . . . . . . . . . . . . . . . . . . . . . . . . . . . . . 10,806
Increase in estimated fair value of net assets, net . . . . . . . . . . . . . . . . . . . . . . . . . . . . . . . . . . . . . . 30,800
Estimated fair value of net assets as of December 31, 2010 . . . . . . . . . . . . . . . . . . . . . . . . . . . . . . $(120,294)
(1) Reflects our adoption of the new accounting standards for transfers of financial assets and consolidation of variableinterest entities.
(2) Our net worth, as defined under the senior preferred stock purchase agreement, is equivalent to the “Total deficit”amount reported in our consolidated balance sheets. Our net worth, or total deficit, is comprised of “Total FannieMae’s stockholders’ equity (deficit)” and “Noncontrolling interests” reported in our consolidated balance sheets.
(3) Represents capital transactions, which are reflected in our consolidated statements of changes in equity (deficit).(4) Excludes cumulative effect of our adoption of the new accounting standards and capital transactions.
The $10.8 billion increase in the fair value of our net assets during 2010, excluding the cumulative effect ofour January 1, 2010 adoption of the new accounting standards and capital transactions, was attributable to:
• An increase in the fair value of the net portfolio attributable to the positive impact of changes in thespread between mortgage assets and associated debt and derivatives partially offset by,
• A net decrease in the fair value due to credit-related items principally related to declining actual andexpected home prices as well as an increase in estimated severity rates based on recent experience,particularly for loans with a high mark-to-market LTV ratio.
127

The decline in the fair value of net assets due to the new accounting standards was primarily associated withrecording delinquent loans underlying consolidated MBS trusts and eliminating our net guaranty obligationsrelated to MBS trusts that were consolidated on January 1, 2010. The fair value of our guaranty obligations isa measure of the credit risk related to mortgage loans underlying Fannie Mae MBS that we assume throughour guaranty. With consolidation of MBS trusts and the elimination of our guaranty obligation, we ceasedvaluing our credit risk associated with delinquent loans in consolidated MBS trusts using our guarantyobligation models and began valuing those delinquent loans based on nonperforming loan prices.
Since market participants’ assumptions inherent in the pricing for nonperforming loans differ fromassumptions we use in estimating the fair value of our guaranty obligations, most significantly expectedreturns and liquidity discounts, consolidation of MBS trusts directly impacted the fair value of our net assets.Market prices for nonperforming loans are reflective of highly negotiated transactions in aprincipal-to-principal market that often involve loan-level due diligence prior to completion of a transaction.Many of these transactions involve sellers who previously acquired the loans in distressed transactions andbuyers who demand significant return opportunities.
We intend to maximize the value of nonperforming loans over time, utilizing loan modifications, foreclosures,repurchases and other preferable loss mitigation actions (for example, preforeclosure sales) that to date haveresulted in per loan net recoveries materially higher than those that would have been available had they beensold in the nonperforming loan market. By following our loss mitigation strategies, rather than selling ournonperforming loans at the current estimated market price, we estimate, based on our proprietary creditvaluation models, that we could realize approximately $45 billion more than the fair value of ournonperforming loans reported in our non-GAAP consolidated fair value balance sheet as of December 31,2010. Nonperforming loans in this fair value balance sheet disclosure include loans that are delinquent by oneor more payments. Key inputs and assumptions used in our credit valuation models included the amount ofestimated default costs, including estimated unrecoverable principal and interest that we expected to incur overthe life of the underlying mortgage loans backing our Fannie Mae MBS, estimated foreclosure-related costsand estimated administrative and other costs related to our guaranty.
Cautionary Language Relating to Supplemental Non-GAAP Financial Measures
In reviewing our non-GAAP consolidated fair value balance sheets, there are a number of important factorsand limitations to consider. The estimated fair value of our net assets is calculated as of a particular point intime based on our existing assets and liabilities. It does not incorporate other factors that may have asignificant impact on our long-term fair value, including revenues generated from future business activities inwhich we expect to engage, the value from our foreclosure and loss mitigation efforts or the impact thatlegislation or potential regulatory actions may have on us. As a result, the estimated fair value of our netassets presented in our non-GAAP consolidated fair value balance sheets does not represent an estimate of ournet realizable value, liquidation value or our market value as a whole. Amounts we ultimately realize from thedisposition of assets or settlement of liabilities may vary materially from the estimated fair values presented inour non-GAAP consolidated fair value balance sheets.
In addition, the fair value of our net assets attributable to common stockholders presented in our fair valuebalance sheet does not represent an estimate of the value we expect to realize from operating the company orwhat we expect to draw from Treasury under the terms of our senior preferred stock purchase agreement,primarily because:
• The estimated fair value of our credit exposures significantly exceeds our projected credit losses as fairvalue takes into account certain assumptions about liquidity and required rates of return that a marketparticipant may demand in assuming a credit obligation. Because we do not intend to have another partyassume the credit risk inherent in our book of business, and therefore would not be obligated to pay amarket premium for its assumption, we do not expect the current market premium portion of our currentestimate of fair value to impact future Treasury draws;
• The fair value balance sheet does not reflect amounts we expect to draw in the future to pay dividends onthe senior preferred stock; and
128

• The fair value of our net assets reflects a point in time estimate of the fair value of our existing assets andliabilities, and does not incorporate the value associated with new business that may be added in thefuture.
The fair value of our net assets is not a measure defined within GAAP and may not be comparable tosimilarly titled measures reported by other companies.
Supplemental Non-GAAP Consolidated Fair Value Balance Sheets
We present our non-GAAP fair value balance sheets in Table 30. Credit risk is managed by our guarantybusiness and is computed for intracompany allocation purposes. By computing this intracompany allocation,we reflect the value associated with credit risk, which is managed by our guaranty business, versus the interestrate risk, which is measured by our Capital Markets group. As a result of our adoption of the new accountingstandards, we shifted from presenting the fair value of mortgage loans separately from the fair value of netguaranty obligations of MBS trusts as of December 31, 2009 to presenting consolidated mortgage loans, net ofthe fair value of guaranty assets and obligations as of December 31, 2010. We have not changed our fair valuemethodologies or our methodology of computing our credit risk for intracompany allocation purposes.
129

Table 30: Supplemental Non-GAAP Consolidated Fair Value Balance Sheets
GAAPCarrying
ValueFair Value
Adjustment(2)EstimatedFair Value
GAAPCarrying
ValueFair Value
Adjustment(2)EstimatedFair Value
As of December 31, 2010 As of December 31, 2009(1)
(Dollars in millions)
Assets:Cash and cash equivalents . . . . . . . . . . . . . . . $ 80,975 $ — $ 80,975 $ 9,882 $ — $ 9,882Federal funds sold and securities purchased
under agreements to resell or similararrangements . . . . . . . . . . . . . . . . . . . . . . 11,751 — 11,751 53,684 (28) 53,656
Trading securities . . . . . . . . . . . . . . . . . . . . . 56,856 — 56,856 111,939 — 111,939Available-for-sale securities . . . . . . . . . . . . . . 94,392 — 94,392 237,728 — 237,728Mortgage loans:
Mortgage loans held for sale . . . . . . . . . . . . 915 — 915 18,462 153 18,615Mortgage loans held for investment, net of
allowance for loan losses:Of Fannie Mae . . . . . . . . . . . . . . . . . . . 358,698 (39,331) 319,367 246,509 (5,209) 241,300Of consolidated trusts . . . . . . . . . . . . . . . 2,564,107 46,038(3) 2,610,145(4) 129,590 (45) 129,545(4)
Total mortgage loans . . . . . . . . . . . . . . . . . 2,923,720 6,707 2,930,427(5) 394,561 (5,101) 389,460(5)
Advances to lenders . . . . . . . . . . . . . . . . . . . 7,215 (225) 6,990(6)(7) 5,449 (305) 5,144(6)(7)
Derivative assets at fair value . . . . . . . . . . . . . 1,137 — 1,137(6)(7) 1,474 — 1,474(6)(7)
Guaranty assets and buy-ups, net . . . . . . . . . . . 458 356 814(6)(7) 9,520 5,104 14,624(6)(7)
Total financial assets . . . . . . . . . . . . . . . . . 3,176,504 6,838 3,183,342(8) 824,237 (330) 823,907(8)
Master servicing assets and creditenhancements . . . . . . . . . . . . . . . . . . . . . 479 3,286 3,765(6)(7) 651 5,917 6,568(6)(7)
Other assets . . . . . . . . . . . . . . . . . . . . . . . . 44,989 (261) 44,728(6)(7) 44,253 373 44,626(6)(7)
Total assets . . . . . . . . . . . . . . . . . . . . . . . $3,221,972 $ 9,863 $3,231,835 $869,141 $ 5,960 $ 875,101
Liabilities:Federal funds purchased and securities sold
under agreements to repurchase . . . . . . . . . . $ 52 $ (1) $ 51 $ — $ — $ —Short-term debt:
Of Fannie Mae . . . . . . . . . . . . . . . . . . . . . 151,884 90 151,974 200,437 56 200,493Of consolidated trusts . . . . . . . . . . . . . . . . 5,359 — 5,359 — — —
Long-term debt:Of Fannie Mae . . . . . . . . . . . . . . . . . . . . . 628,160(9) 21,524 649,684 567,950(9) 19,473 587,423Of consolidated trusts . . . . . . . . . . . . . . . . 2,411,597(9) 103,332(3) 2,514,929 6,167(9) 143 6,310
Derivative liabilities at fair value . . . . . . . . . . . 1,715 — 1,715(10)(11) 1,029 — 1,029(10)(11)
Guaranty obligations. . . . . . . . . . . . . . . . . . . 769 3,085 3,854(10)(11) 13,996 124,586 138,582(10)(11)
Total financial liabilities . . . . . . . . . . . . . . . 3,199,536 128,030 3,327,566(8) 789,579 144,258 933,837(8)
Other liabilities . . . . . . . . . . . . . . . . . . . . . . 24,953 (472) 24,481(10)(11) 94,843 (54,878) 39,965(10)(11)
Total liabilities . . . . . . . . . . . . . . . . . . . . . 3,224,489 127,558 3,352,047 884,422 89,380 973,802Equity (deficit):Fannie Mae stockholders’ equity (deficit):Senior preferred(12) . . . . . . . . . . . . . . . . . . . . 88,600 — 88,600 60,900 — 60,900Preferred . . . . . . . . . . . . . . . . . . . . . . . . . . 20,204 (19,829) 375 20,348 (19,629) 719Common . . . . . . . . . . . . . . . . . . . . . . . . . . (111,403) (97,866) (209,269) (96,620) (63,791) (160,411)
Total Fannie Mae stockholders’ deficit/non-GAAP fair value of net assets . . . . . . . . $ (2,599) $(117,695) $ (120,294) $ (15,372) $ (83,420) $ (98,792)
Noncontrolling interests . . . . . . . . . . . . . . . 82 — 82 91 — 91
Total deficit . . . . . . . . . . . . . . . . . . . . . . . (2,517) (117,695) (120,212) (15,281) (83,420) (98,701)
Total liabilities and equity (deficit) . . . . . . . . $3,221,972 $ 9,863 $3,231,835 $869,141 $ 5,960 $ 875,101
Explanation and Reconciliation of Non-GAAP Measures to GAAP Measures(1) Certain prior period amounts have been reclassified to conform to the current period presentation.(2) Each of the amounts listed as a “fair value adjustment” represents the difference between the carrying value included in our GAAP
consolidated balance sheets and our best judgment of the estimated fair value of the listed item.(3) Fair value exceeds the carrying value of consolidated loans and debt of consolidated trusts due to the fact that the loans and debt
were consolidated in our GAAP consolidated balance sheet at unpaid principal balance at transition. Also impacting the difference
130
between fair value and carrying value of the consolidated loans is the credit component of the loan. This credit component isreflected in the net guaranty obligation, which is included in the consolidated loan fair value, but was presented as a separate lineitem in our fair value balance sheet in prior periods.
(4) Includes certain mortgage loans that we elected to report at fair value in our GAAP consolidated balance sheet of $3.0 billion as ofDecember 31, 2010. We did not elect to report any mortgage loans at fair value in our consolidated balance sheet as ofDecember 31, 2009.
(5) Performing loans had a fair value of $2.8 trillion and an unpaid principal balance of $2.7 trillion as of December 31, 2010 comparedto a fair value of $345.5 billion and an unpaid principal balance of $348.2 billion as of December 31, 2009. Nonperforming loans,which include loans that are delinquent by one or more payments, had a fair value of $168.5 billion and an unpaid principal balanceof $287.4 billion as of December 31, 2010 compared to a fair value of $43.9 billion and an unpaid principal balance of $79.8 billionas of December 31, 2009. See “Note 19, Fair Value” for additional information on valuation techniques for performing andnonperforming loans.
(6) The following line items: (a) Advances to lenders; (b) Derivative assets at fair value; (c) Guaranty assets and buy-ups, net;(d) Master servicing assets and credit enhancements and (e) Other assets, together consist of the following assets presented in ourGAAP consolidated balance sheets: (a) Total accrued interest receivable, net of allowance; (b) Acquired property, net; (c) Servicerand MBS trust receivable; and (d) Other assets.
(7) “Other assets” include the following GAAP consolidated balance sheets line items: (a) Total accrued interest receivable, net ofallowance; (b) Acquired property, net; and (c) Servicer and MBS trust receivable. The carrying value of these items in our GAAPconsolidated balance sheets totaled $28.4 billion and $31.2 billion as of December 31, 2010 and 2009, respectively. “Other assets” inour GAAP consolidated balance sheets includes the following: (a) Advances to Lenders; (b) Derivative assets at fair value;(c) Guaranty assets and buy-ups, net; and (d) Master servicing assets and credit enhancements. The carrying value of these itemstotaled $9.3 billion and $17.1 billion as of December 31, 2010 and 2009, respectively.
(8) We determined the estimated fair value of these financial instruments in accordance with the fair value accounting standard asdescribed in “Note 19, Fair Value.”
(9) Includes certain long-term debt instruments that we elected to report at fair value in our GAAP consolidated balance sheets of$3.2 billion and $3.3 billion as of December 31, 2010 and 2009, respectively.
(10) The following line items: (a) Derivative liabilities at fair value; (b) Guaranty obligations; and (c) Other liabilities, consist of thefollowing liabilities presented in our GAAP consolidated balance sheets: (a) Accrued interest payable of Fannie Mae; (b) Accruedinterest payable of consolidated trusts; (c) Reserve for guaranty losses; (d) Servicer and MBS trust payable; and (e) Other liabilities.
(11) “Other liabilities” include the following GAAP consolidated balance sheets line items: (a) Accrued interest payable of Fannie Mae;(b) Accrued interest payable of consolidated trusts; (c) Reserve for guaranty losses; and (d) Servicer and MBS trust payable. Thecarrying value of these items in our GAAP consolidated balance sheets totaled $17.0 billion and $85.3 billion as of December 31, 2010and 2009, respectively. We assume that certain other liabilities, such as deferred revenues, have no fair value. Although we report the“Reserve for guaranty losses” as a separate line item in our consolidated balance sheets, it is incorporated into and reported as part ofthe fair value of our guaranty obligations in our non-GAAP supplemental consolidated fair value balance sheets. “Other liabilities” inour GAAP consolidated balance sheets include the following: (a) Derivative liabilities at fair value and (b) Guaranty obligations. Thecarrying value of these items totaled $2.5 billion and $15.0 billion as of December 31, 2010 and 2009, respectively.
(12) The amount included in “estimated fair value” of the senior preferred stock is the liquidation preference, which is the same as theGAAP carrying value, and does not reflect fair value.
LIQUIDITY AND CAPITAL MANAGEMENT
Liquidity Management
Our business activities require that we maintain adequate liquidity to fund our operations. Our liquidity policyis designed to address our liquidity risk. Liquidity risk is the risk that we will not be able to meet our fundingobligations in a timely manner. Liquidity management involves forecasting funding requirements andmaintaining sufficient capacity to meet these needs. Our Treasury group is responsible for our liquidity andcontingency planning strategies.
Primary Sources and Uses of Funds
Our primary source of funds is proceeds from the issuance of short-term and long-term debt securities.Accordingly, our liquidity depends largely on our ability to issue unsecured debt in the capital markets. Ourstatus as a GSE and federal government support of our business continue to be essential to maintaining ouraccess to the unsecured debt markets. Our senior unsecured debt obligations are rated AAA, or its equivalent,by the major rating agencies.
131

In addition to funding we obtain from the issuance of debt securities, our other sources of cash include:
• principal and interest payments received on mortgage loans, mortgage-related securities and non-mortgageinvestments we own;
• proceeds from the sale of mortgage-related securities, mortgage loans and non-mortgage assets, includingproceeds from the sales of foreclosed real estate assets;
• funds from Treasury pursuant to the senior preferred stock purchase agreement;
• borrowings under secured and unsecured intraday funding lines of credit we have established with severallarge financial institutions;
• guaranty fees received on Fannie Mae MBS;
• borrowings against mortgage-related securities and other investment securities we hold pursuant torepurchase agreements and loan agreements;
• payments received from mortgage insurance counterparties; and
• net receipts on derivative instruments.
Our primary funding needs include:
• the repayment of matured, redeemed and repurchased debt;
• the purchase of mortgage loans (including delinquent loans from MBS trusts), mortgage-related securitiesand other investments;
• interest payments on outstanding debt;
• dividend payments made to Treasury pursuant to the senior preferred stock purchase agreement;
• net payments on derivative instruments;
• the pledging of collateral under derivative instruments;
• administrative expenses; and
• losses incurred in connection with our Fannie Mae MBS guaranty obligations.
An increased proportion of our funding needs during 2010, compared with 2009, came from: (1) purchasingdelinquent loans from MBS trusts; (2) an increase in the redemption of callable debt; and (3) increaseddividend payments to Treasury under the senior preferred stock purchase agreement. As we draw more fundspursuant to the senior preferred stock purchase agreement, we expect our cash dividend payments to Treasurywill continue to increase in future periods if we continue to pay the dividend on a quarterly basis, rather thanallowing the dividend to accrue at an increased rate of 12% and be added to the liquidation preference of thesenior preferred stock.
Debt Funding
Effective January 1, 2010, we adopted new accounting standards that resulted in the consolidation of thesubstantial majority of our MBS trusts and recognized the underlying assets and debt of these trusts in ourconsolidated balance sheet. Debt from consolidations represents our liability to third-party beneficial interestholders of MBS that we guarantee when we have included the assets of a corresponding trust in ourconsolidated balance sheets. Despite the increase in debt recognized in our consolidated balance sheets due toconsolidations, the adoption of the new accounting standards did not change our exposure to liquidity risk. Weseparately present the debt from consolidations (“debt of consolidated trusts”) and the debt issued by us (“debtof Fannie Mae”) in our consolidated balance sheets and in the debt tables below. Our discussion regardingdebt funding in this section focuses on the debt of Fannie Mae.
132

We fund our business primarily through the issuance of short-term and long-term debt securities in thedomestic and international capital markets. Because debt issuance is our primary funding source, we aresubject to “roll-over,” or refinancing, risk on our outstanding debt.
We have a diversified funding base of domestic and international investors. Purchasers of our debt securitiesinclude fund managers, commercial banks, pension funds, insurance companies, foreign central banks,corporations, state and local governments, and other municipal authorities. Purchasers of our debt securitiesare also geographically diversified, with a significant portion of our investors located in North America, SouthAmerica, Europe and Asia.
Although our funding needs may vary from quarter to quarter depending on market conditions, we currentlyexpect our debt funding needs will decline in future periods as we reduce the size of our mortgage portfolio incompliance with the requirement of the senior preferred stock purchase agreement that we reduce ourmortgage portfolio 10% per year until it reaches $250 billion.
Fannie Mae Debt Funding Activity
Table 31 summarizes the activity in the debt of Fannie Mae for the periods indicated. This activity includesfederal funds purchased and securities sold under agreements to repurchase but excludes the debt ofconsolidated trusts as well as intraday loans. The reported amounts of debt issued and paid off during theperiod represent the face amount of the debt at issuance and redemption, respectively. Activity for short-termdebt of Fannie Mae relates to borrowings with an original contractual maturity of one year or less whileactivity for long-term debt of Fannie Mae relates to borrowings with an original contractual maturity ofgreater than one year.
Table 31: Activity in Debt of Fannie Mae
2010 2009(3) 2008For the Year Ended December 31,
(Dollars in millions)
Issued during the period:
Short-term: (1)
Amount . . . . . . . . . . . . . . . . . . . . . . . . . . . . . . . . . . . . . . . . . . . . . . . . . $451,289 $1,381,640 $1,624,868
Weighted-average interest rate . . . . . . . . . . . . . . . . . . . . . . . . . . . . . . . . . 0.25% 0.18% 2.11%
Long-term:
Amount . . . . . . . . . . . . . . . . . . . . . . . . . . . . . . . . . . . . . . . . . . . . . . . . . $463,157 $ 295,147 $ 248,168
Weighted-average interest rate . . . . . . . . . . . . . . . . . . . . . . . . . . . . . . . . . 1.88% 2.52% 3.76%
Total issued:
Amount . . . . . . . . . . . . . . . . . . . . . . . . . . . . . . . . . . . . . . . . . . . . . . . . . $914,446 $1,676,787 $1,873,036
Weighted-average interest rate . . . . . . . . . . . . . . . . . . . . . . . . . . . . . . . . . 1.08% 0.59% 2.33%
Paid off during the period: (2)
Short-term:(1)
Amount . . . . . . . . . . . . . . . . . . . . . . . . . . . . . . . . . . . . . . . . . . . . . . . . . $499,828 $1,513,683 $1,529,368
Weighted-average interest rate . . . . . . . . . . . . . . . . . . . . . . . . . . . . . . . . . 0.23% 0.51% 2.54%
Long-term:
Amount . . . . . . . . . . . . . . . . . . . . . . . . . . . . . . . . . . . . . . . . . . . . . . . . . $406,267 $ 260,578 $ 266,764
Weighted-average interest rate . . . . . . . . . . . . . . . . . . . . . . . . . . . . . . . . . 3.16% 4.09% 4.89%
Total paid off:
Amount . . . . . . . . . . . . . . . . . . . . . . . . . . . . . . . . . . . . . . . . . . . . . . . . . $906,095 $1,774,261 $1,796,132
Weighted-average interest rate . . . . . . . . . . . . . . . . . . . . . . . . . . . . . . . . . 1.54% 1.04% 2.89%
(1) The amount of short-term debt issued and paid off included $766.8 billion and $482.5 billion for the years endedDecember 31, 2009 and 2008, respectively, of debt issued and repaid to Fannie Mae MBS trusts.
133

(2) Consists of all payments on debt, including regularly scheduled principal payments, payments at maturity, paymentsresulting from calls and payments for any other repurchases.
(3) For the year ended December 31, 2009, we revised the weighted-average interest rate on short-term issued, totalissued, short-term paid-off and total paid-off debt primarily to reflect weighting based on transaction level data.
Due to the adoption of the new accounting standards, we no longer include debt issued and repaid to FannieMae MBS trusts in our short-term debt activity, as the substantial majority of our MBS trusts wereconsolidated and the underlying assets and debt of these trusts were recognized in our consolidated balancesheets. In 2009, short-term debt activity of Fannie Mae, excluding debt issued and repaid to Fannie Mae MBStrusts, consisted of issuances of $614.6 billion with a weighted-average interest rate of 0.27% and repaymentsof $746.6 billion with a weighted-average interest rate of 0.93%. In 2008, short-term debt activity of FannieMae, excluding debt issued and repaid to Fannie Mae MBS trusts, consisted of issuances of $1.1 trillion witha weighted-average interest rate of 2.20% and repayments of $1.0 trillion with a weighted-average interest rateof 2.84%.
Excluding debt issued and repaid to Fannie Mae MBS trusts, debt funding activity in 2010 was relatively flatcompared with 2009 because the increase in our issuances of long-term debt offset a decrease in our issuancesof short-term debt. Our issuances of long-term debt increased primarily because we: (1) increased ourredemption of debt with higher interest rates and replaced it with issuances of debt with lower interest rates;(2) issued additional debt to fund purchases of delinquent loans from MBS trusts; and (3) issued additionallong-term debt in lieu of short-term debt to meet our liquidity risk management requirements.
During 2010, we purchased from MBS trusts the substantial majority of delinquent loans that were four ormore consecutive monthly payments delinquent. We purchased approximately $217 billion of delinquent loansfrom single-family MBS trusts during 2010. The substantial majority of these delinquent loan purchases werecompleted in the first half of 2010. We expect to continue to purchase loans from MBS trusts as they becomefour or more consecutive monthly payments delinquent subject to market conditions, economic benefit,servicer capacity, and other constraints including the limit on the mortgage assets that we may own pursuantto the senior preferred stock purchase agreement.
Our ability to issue long-term debt has been strong in recent quarters primarily due to actions taken by thefederal government to support us and the financial markets. Many of these programs initiated by the federalgovernment have expired. The Treasury credit facility and Treasury MBS purchase program terminated onDecember 31, 2009 and the Federal Reserve’s agency debt and MBS purchase programs expired on March 31,2010. Despite the expiration of these programs, demand for our long-term debt securities continues to bestrong as of the date of this filing.
We believe that continued federal government support of our business and the financial markets, as well as ourstatus as a GSE, are essential to maintaining our access to debt funding. Changes or perceived changes in thegovernment’s support could materially adversely affect our ability to refinance our debt as it becomes due,which could have a material adverse impact on our liquidity, financial condition and results of operations. OnFebruary 11, 2011, Treasury and HUD released a report to Congress on reforming America’s housing financemarket. The report provides that the Administration will work with FHFA to determine the best way toresponsibly wind down both Fannie Mae and Freddie Mac. The report emphasizes the importance ofproceeding with a careful transition plan and providing the necessary financial support to Fannie Mae andFreddie Mac during the transition period.
In addition, future changes or disruptions in the financial markets could significantly change the amount, mixand cost of funds we obtain, which also could increase our liquidity and roll-over risk and have a materialadverse impact on our liquidity, financial condition and results of operations. See “Risk Factors” for adiscussion of the risks to our business related to our ability to obtain funds for our operations through theissuance of debt securities, the relative cost at which we are able to obtain these funds and our liquiditycontingency plans. Also see “Risk Factors” in this report for discussions of the risks to our business relating tothe uncertain future of our company and to our reliance on access to the debt capital markets, as well as thepossibility that legislative proposals regarding our business could have a material impact on our ability to issuedebt or refinance existing debt as it becomes due.
134

Outstanding Debt
Table 32 provides information as of December 31, 2010 and 2009 on our outstanding short-term and long-term debt based on its original contractual terms. Our total outstanding debt of Fannie Mae, which consists offederal funds purchased and securities sold under agreements to repurchase and short-term and long-term debt,excluding debt of consolidated trusts, increased to $780.1 billion as of December 31, 2010, from$768.4 billion as of December 31, 2009.
As of December 31, 2010, our outstanding short-term debt, based on its original contractual maturity,decreased as a percentage of our total outstanding debt to 19% from 26% as of December 31, 2009. Forinformation on our outstanding debt maturing within one year, including the current portion of our long-termdebt, as a percentage of our total debt, see “Maturity Profile of Outstanding Debt of Fannie Mae.” In addition,the weighted-average interest rate on our long-term debt, based on its original contractual maturity, decreasedto 2.77% as of December 31, 2010 from 3.71% as of December 31, 2009.
Pursuant to the terms of the senior preferred stock purchase agreement, we are prohibited from issuing debtwithout the prior consent of Treasury if it would result in our aggregate indebtedness exceeding 120% of theamount of mortgage assets we are allowed to own on December 31 of the immediately preceding calendaryear. Our debt cap under the senior preferred stock purchase agreement was $1,080 billion in 2010 and is$972 billion in 2011. As of December 31, 2010, our aggregate indebtedness totaled $793.9 billion, which was$286.1 billion below our debt limit. The calculation of our indebtedness for purposes of complying with ourdebt cap reflects the unpaid principal balance and excludes debt basis adjustments and debt of consolidatedtrusts. Because of our debt limit, we may be restricted in the amount of debt we issue to fund our operations.
135

Table 32: Outstanding Short-Term Borrowings and Long-Term Debt(1)
Maturities Outstanding
Weighted-AverageInterest
Rate Maturities Outstanding
Weighted-AverageInterest
Rate
2010 2009As of December 31,
(Dollars in millions)
Federal funds purchased and securities soldunder agreements to repurchase . . . . . . . . — $ 52 2.20% — $ — —%
Short-term debt:Fixed-rate:
Discount notes . . . . . . . . . . . . . . . . . . — $ 151,500 0.32% — $199,987 0.27%Foreign exchange discount notes . . . . . . — 384 2.43 — 300 1.50Other short-term debt . . . . . . . . . . . . . — — — — 100 0.53
Total fixed-rate . . . . . . . . . . . . . . . . 151,884 0.32 200,387 0.27Floating-rate(2) . . . . . . . . . . . . . . . . . . . — — — — 50 0.02
Total short-term debt of Fannie Mae(3) . . . . . 151,884 0.32 200,437 0.27Debt of consolidated trusts . . . . . . . . . . . — 5,359 0.23 — — —
Total short-term debt . . . . . . . . . . . . . . . . . $ 157,243 0.32% $200,437 0.27%
Long-term debt:Senior fixed:
Benchmark notes and bonds . . . . . . . . . 2011 - 2030 $ 300,344 3.20% 2010 - 2030 $279,945 4.10%Medium-term notes . . . . . . . . . . . . . . . 2011 - 2020 199,266 2.13 2010 - 2019 171,207 2.97Foreign exchange notes and bonds . . . . . 2017 - 2028 1,177 6.21 2010 - 2028 1,239 5.64Other long-term debt(2) . . . . . . . . . . . . 2011 - 2040 44,893 5.64 2010 - 2039 62,783 5.80
Total senior fixed . . . . . . . . . . . . . . 545,680 3.02 515,174 3.94Senior floating:
Medium-term notes . . . . . . . . . . . . . . . 2011 - 2015 72,039 0.31 2010 - 2014 41,911 0.26Other long-term debt(2) . . . . . . . . . . . . 2020 - 2037 386 4.92 2020 - 2037 1,041 4.12
Total senior floating . . . . . . . . . . . . . 72,425 0.34 42,952 0.34Subordinated fixed-rate:
Qualifying subordinated(4) . . . . . . . . . . 2011 - 2014 7,392 5.47 2011 - 2014 7,391 5.47Subordinated debentures . . . . . . . . . . . 2019 2,663 9.91 2019 2,433 9.89
Total subordinated fixed-rate . . . . . . . 10,055 6.65 9,824 6.57
Total long-term debt of Fannie Mae(5) . . . . . . 628,160 2.77 567,950 3.71Debt of consolidated trusts(2) . . . . . . . . . . 2011 - 2051 2,411,597 4.59 2010 - 2039 6,167 5.63
Total long-term debt . . . . . . . . . . . . . . . . . $3,039,757 4.22% $574,117 3.73%
Outstanding callable debt of Fannie Mae(6). . . $ 219,804 2.53% $210,181 3.48%
(1) Outstanding debt amounts and weighted-average interest rates reported in this table include the effect of unamortizeddiscounts, premiums and other cost basis adjustments. Reported amounts include fair value gains and losses associatedwith debt that we elected to carry at fair value. The unpaid principal balance of outstanding debt, which excludesunamortized discounts, premiums and other cost basis adjustments and debt of consolidated trusts, totaled$792.6 billion and $784.0 billion as of December 31, 2010 and 2009, respectively.
(2) Includes a portion of structured debt instruments that is reported at fair value.(3) Short-term debt of Fannie Mae consists of borrowings with an original contractual maturity of one year or less and,
therefore, does not include the current portion of long-term debt. Reported amounts include a net discount and othercost basis adjustments of $128 million and $129 million as of December 31, 2010 and 2009, respectively.
(4) Consists of subordinated debt with an interest deferral feature.
136

(5) Long-term debt of Fannie Mae consists of borrowings with an original contractual maturity of greater than one year.Reported amounts include the current portion of long-term debt that is due within one year, which totaled $95.4 billionand $106.5 billion as of December 31, 2010 and 2009, respectively. Reported amounts also include unamortizeddiscounts, premiums and other cost basis adjustments of $12.4 billion and $15.6 billion as of December 31, 2010 and2009, respectively. The unpaid principal balance of long-term debt of Fannie Mae, which excludes unamortizeddiscounts, premiums, fair value adjustments and other cost basis adjustments and amounts related to debt ofconsolidated trusts, totaled $640.5 billion and $583.4 billion as of December 31, 2010 and 2009, respectively.
(6) Consists of long-term callable debt of Fannie Mae that can be paid off in whole or in part at our option at any time onor after a specified date. Includes the unpaid principal balance, and excludes unamortized discounts, premiums andother cost basis adjustments.
Table 33 below presents additional information for each category of our short-term borrowings.
Table 33: Outstanding Short-Term Borrowings(1)
Outstanding
WeightedAverageInterest
Rate Outstanding(2)
WeightedAverageInterest
RateMaximum
Outstanding(3)
As of December 31 Average During the Year2010
(Dollars in millions)
Federal funds purchased and securities sold underagreements to repurchase . . . . . . . . . . . . . . . . $ 52 2.20% $ 72 0.16% $ 200
Fixed-rate short-term debt:
Discount notes . . . . . . . . . . . . . . . . . . . . . . . $151,500 0.32% $210,986 0.29% $260,377
Foreign exchange discount notes . . . . . . . . . . . 384 2.43 299 1.86 384
Other fixed-rate short-term debt . . . . . . . . . . . — — 15 0.53 100
Floating-rate short-term debt . . . . . . . . . . . . . . . — — 8 0.02 50
Total short-term debt . . . . . . . . . . . . . . . . . . . $151,884 0.32%
Outstanding
WeightedAverageInterest
Rate Outstanding(2)
WeightedAverageInterest
RateMaximum
Outstanding(3)
As of December 31 Average During the Year2009
(Dollars in millions)
Federal funds purchased and securities sold underagreements to repurchase . . . . . . . . . . . . . . . . $ — —% $ 42 1.55% $ 189
Fixed-rate short-term debt:
Discount notes . . . . . . . . . . . . . . . . . . . . . . . $199,987 0.27% $253,884 0.92% $325,239
Foreign exchange discount notes . . . . . . . . . . . 300 1.50 222 1.41 300
Other fixed-rate short-term debt . . . . . . . . . . . 100 0.53 199 1.30 334
Floating-rate short-term debt . . . . . . . . . . . . . . . 50 0.02 2,744 1.20 3,136
Total short-term debt . . . . . . . . . . . . . . . . . . . $200,437 0.27%
137
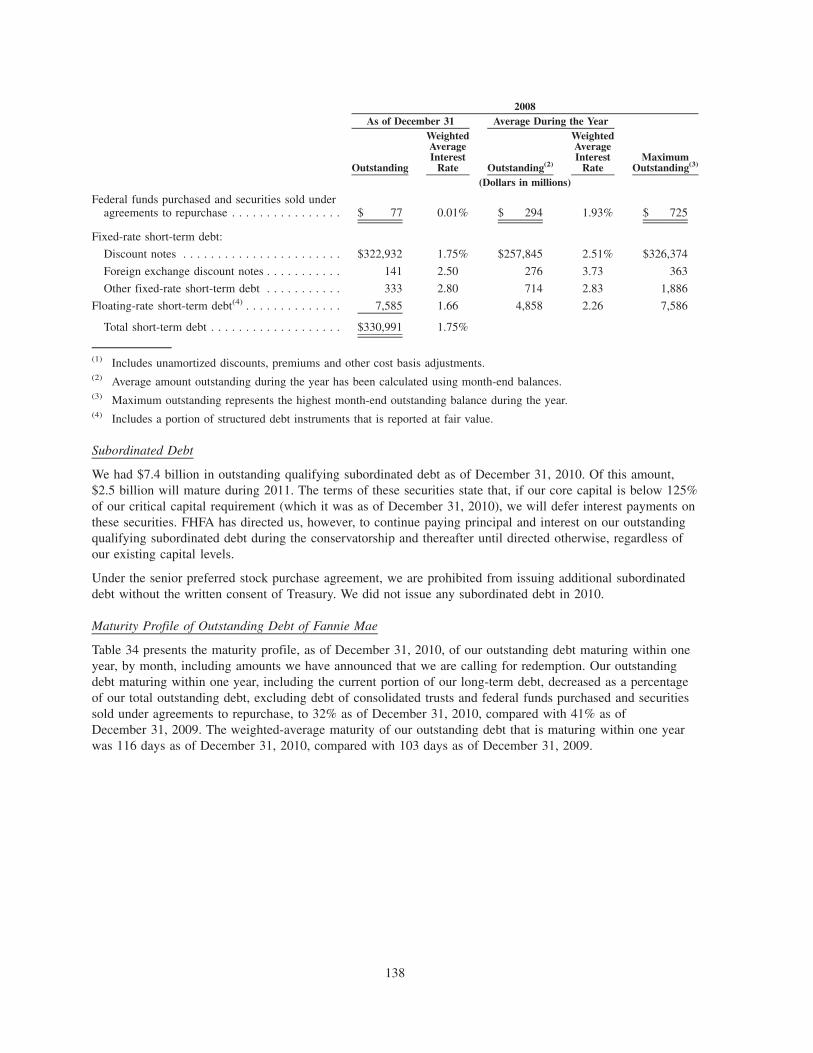
Outstanding
WeightedAverageInterest
Rate Outstanding(2)
WeightedAverageInterest
RateMaximum
Outstanding(3)
As of December 31 Average During the Year2008
(Dollars in millions)
Federal funds purchased and securities sold underagreements to repurchase . . . . . . . . . . . . . . . . $ 77 0.01% $ 294 1.93% $ 725
Fixed-rate short-term debt:
Discount notes . . . . . . . . . . . . . . . . . . . . . . . $322,932 1.75% $257,845 2.51% $326,374
Foreign exchange discount notes . . . . . . . . . . . 141 2.50 276 3.73 363
Other fixed-rate short-term debt . . . . . . . . . . . 333 2.80 714 2.83 1,886
Floating-rate short-term debt(4) . . . . . . . . . . . . . . 7,585 1.66 4,858 2.26 7,586
Total short-term debt . . . . . . . . . . . . . . . . . . . $330,991 1.75%
(1) Includes unamortized discounts, premiums and other cost basis adjustments.(2) Average amount outstanding during the year has been calculated using month-end balances.(3) Maximum outstanding represents the highest month-end outstanding balance during the year.(4) Includes a portion of structured debt instruments that is reported at fair value.
Subordinated Debt
We had $7.4 billion in outstanding qualifying subordinated debt as of December 31, 2010. Of this amount,$2.5 billion will mature during 2011. The terms of these securities state that, if our core capital is below 125%of our critical capital requirement (which it was as of December 31, 2010), we will defer interest payments onthese securities. FHFA has directed us, however, to continue paying principal and interest on our outstandingqualifying subordinated debt during the conservatorship and thereafter until directed otherwise, regardless ofour existing capital levels.
Under the senior preferred stock purchase agreement, we are prohibited from issuing additional subordinateddebt without the written consent of Treasury. We did not issue any subordinated debt in 2010.
Maturity Profile of Outstanding Debt of Fannie Mae
Table 34 presents the maturity profile, as of December 31, 2010, of our outstanding debt maturing within oneyear, by month, including amounts we have announced that we are calling for redemption. Our outstandingdebt maturing within one year, including the current portion of our long-term debt, decreased as a percentageof our total outstanding debt, excluding debt of consolidated trusts and federal funds purchased and securitiessold under agreements to repurchase, to 32% as of December 31, 2010, compared with 41% as ofDecember 31, 2009. The weighted-average maturity of our outstanding debt that is maturing within one yearwas 116 days as of December 31, 2010, compared with 103 days as of December 31, 2009.
138

Table 34: Maturity Profile of Outstanding Debt of Fannie Mae Maturing Within One Year(1)
Long-TermShort-Term
(Dol
lars
in b
illio
ns)
$33.2 $27.8 $23.7 $20.9 $16.9 $12.1 $10.2 $4.6 $1.9
$2.8 $5.9
$19.5
$13.2 $17.6
$1.1$5.2
$14.6
$3.0 $3.0
$11.2
$0
$5
$10
$15
$20
$25
$30
$35
$40
$45
$50
Jan-11 Feb-11 Mar-11 Apr-11 May-11 Jun-11 Jul-11 Aug-11 Sep-11 Oct-11 Nov-11 Dec-11
$0.1$0.1
$0.1$0.4
(1) Includes unamortized discounts, premiums and other cost basis adjustments of $176 million as of December 31, 2010.Excludes debt of consolidated trusts maturing within one year of $9.8 billion and federal funds purchased andsecurities sold under agreements to repurchase of $52 million as of December 31, 2010.
Table 35 presents the maturity profile, as of December 31, 2010, of the portion of our long-term debt thatmatures in more than one year, on a quarterly basis for one year and on an annual basis thereafter, excludingamounts we have announced that we are calling for redemption within one year. The weighted-averagematurity of our outstanding debt maturing in more than one year was approximately 58 months as ofDecember 31, 2010, compared with approximately 72 months as of December 31, 2009.
Table 35: Maturity Profile of Outstanding Debt of Fannie Mae Maturing in More Than One Year(1)
(Dol
lars
in b
illio
ns)
$19.5 $21.3
$50.6$59.5
$122.3
$71.7 $66.7
$119.3
$0
$50
$100
$150
Q1 2012 Q2 2012 Q3 2012 Q4 2012 2013 2014 2015 2016 &thereafter
(1) Includes unamortized discounts, premiums and other cost basis adjustments of $12.4 billion as of December 31, 2010.Excludes debt of consolidated trusts of $2.4 trillion as of December 31, 2010.
We intend to repay our short-term and long-term debt obligations as they become due primarily throughproceeds from the issuance of additional debt securities. We also intend to use funds we receive from Treasuryunder the senior preferred stock purchase agreement to pay our debt obligations and to pay dividends on thesenior preferred stock.
Contractual Obligations
Table 36 summarizes, by remaining maturity, our future cash obligations related to our long-term debt,announced calls, operating leases, purchase obligations and other material noncancelable contractualobligations as of December 31, 2010.
139

Table 36: Contractual Obligations
TotalLess than
1 Year1 to G 3
Years3 to 5Years
More than5 Years
Payment Due by Period as of December 31, 2010
(Dollars in millions)
Long-term debt obligations(1) . . . . . . . . . . . . . . . . . . . . . . $628,160 $ 97,245 $273,191 $138,446 $119,278
Contractual interest on long-term debt obligations(2) . . . . . . 95,358 14,718 23,769 15,622 41,249
Operating lease obligations(3) . . . . . . . . . . . . . . . . . . . . . . 158 40 61 31 26
Purchase obligations:
Mortgage commitments(4) . . . . . . . . . . . . . . . . . . . . . . 54,858 54,837 21 — —
Other purchase obligations(5) . . . . . . . . . . . . . . . . . . . . 274 106 163 5 —
Other long-term liabilities reflected in the consolidatedbalance sheet(6) . . . . . . . . . . . . . . . . . . . . . . . . . . . . 1,087 862 156 37 32
Total contractual obligations . . . . . . . . . . . . . . . . . . . . . . $779,895 $167,808 $297,361 $154,141 $160,585
(1) Represents the carrying amount of our long-term debt assuming payments are made in full at maturity. Amountsexclude $2.4 trillion in long-term debt from consolidations. Amounts include unamortized net discount and other costbasis adjustments of $12.4 billion.
(2) Excludes contractual interest on long-term debt from consolidations.(3) Includes certain premises and equipment leases.(4) Includes on- and off-balance sheet commitments to purchase mortgage loans and mortgage-related securities.(5) Includes only unconditional purchase obligations that are subject to a cancellation penalty for certain telecom services,
software and computer services, and other agreements. Excludes arrangements that may be cancelled without penalty.Amounts also include off-balance sheet commitments for the unutilized portion of lending agreements entered intowith multifamily borrowers.
(6) Excludes risk management derivative transactions that may require cash settlement in future periods and ourobligations to stand ready to perform under our guarantees relating to Fannie Mae MBS and other financial guarantees,because the amount and timing of payments under these arrangements are generally contingent upon the occurrence offuture events. For a description of the amount of our on- and off-balance sheet Fannie Mae MBS and other financialguarantees as of December 31, 2010, see “Off-Balance Sheet Arrangements.” Includes future cash payments due underour contractual obligations to fund LIHTC and other partnerships that are unconditional and legally binding and cashreceived as collateral from derivative counterparties, which are included in our consolidated balance sheets under“Other liabilities.”
Equity Funding
As a result of the covenants under the senior preferred stock purchase agreement and Treasury’s ownership ofthe warrant to purchase up to 79.9% of the total shares of our common stock outstanding, we no longer haveaccess to equity funding except through draws under the senior preferred stock purchase agreement. For adescription of the covenants under the senior preferred stock purchase agreement, see “Business—Conservatorship and Treasury Agreements—Treasury Agreements—Covenants Under Treasury Agreements.”We discuss our funding under the senior preferred stock purchase agreement below in “Liquidity and CapitalManagement—Capital Management—Capital Activity—Senior Preferred Stock Purchase Agreement.”
Liquidity Risk Management Practices and Contingency Planning
Our liquidity position could be adversely affected by many causes, both internal and external to our business,including: actions taken by the conservator, the Federal Reserve, Treasury or other government agencies;legislation relating to us or our business; an unexpected systemic event leading to the withdrawal of liquidityfrom the market; an extreme market-wide widening of credit spreads; public statements by key policy makers;a downgrade of our or the U.S. government’s credit ratings from the major ratings organizations; a significantfurther decline in our net worth; loss of demand for our debt, or certain types of our debt, from a major groupof investors; a significant credit event involving one of our major institutional counterparties; a sudden
140

catastrophic operational failure in the financial sector due to a terrorist attack or other event; or elimination ofour GSE status. See “Risk Factors” for a description of factors that could adversely affect our liquidity.
We conduct liquidity contingency planning to prepare for an event in which our access to the unsecured debtmarkets becomes limited. We plan for alternative sources of liquidity that are designed to allow us to meet ourcash obligations without relying upon the issuance of unsecured debt.
In 2010, under direction from FHFA, we revised our liquidity management policies and practices. FHFArequires that we:
• maintain a portfolio of highly liquid securities to cover 30 calendar days of net cash needs, assuming noaccess to the short- and long-term unsecured debt markets and other assumptions required by FHFA;
• maintain within our cash and other investments portfolio a daily balance of U.S. Treasury securities thathas a redemption amount greater than or equal to 50% of the average of the previous three month-endbalances of our cash and other investments portfolio (as adjusted in agreement with FHFA); and
• maintain a portfolio of unencumbered agency mortgage securities and U.S. Treasury securities with morethan one year remaining to maturity with a market value (less a discount and expected prepaymentsduring the year) that meets or exceeds our projected 365-day net cash needs.
As of December 31, 2010, we were in compliance with each of the liquidity risk management policies andpractices set forth above.
In addition to these FHFA requirements, we run routine operational testing of our ability to rely uponidentified sources of liquidity, such as mortgage repurchase arrangements with counterparties. One method weuse to conduct these tests involves entering into a relatively small mortgage repurchase agreement(approximately $100 million) with a counterparty in order to confirm that we have the operational and systemscapability to enter into repurchase arrangements. In addition, we have provided collateral in advance to anumber of clearing banks in the event we seek to enter into mortgage repurchase arrangements in the future.We do not, however, have committed repurchase arrangements with specific counterparties, as historically wehave not relied on this form of funding. As a result, our use of such facilities and our ability to enter intothem in significant dollar amounts may be challenging in a stressed market environment.
Below we describe in detail our alternative sources of liquidity if our access to the debt markets becamelimited.
Cash and Other Investments Portfolio
Table 37 provides information on the composition of our cash and other investments portfolio for the periodsindicated.
Table 37: Cash and Other Investments Portfolio
2010 2009 2008As of December 31,
(Dollars in millions)
Cash and cash equivalents(1) . . . . . . . . . . . . . . . . . . . . . . . . . . . . . . . . . . . . . . . . . . . $17,297 $ 6,812 $17,933
Federal funds sold and securities purchased under agreements to resell or similararrangements . . . . . . . . . . . . . . . . . . . . . . . . . . . . . . . . . . . . . . . . . . . . . . . . . . . . 11,751 53,684 57,418
Non-mortgage-related securities:
U.S. Treasury securities . . . . . . . . . . . . . . . . . . . . . . . . . . . . . . . . . . . . . . . . . . . . . 27,432 — —
Asset-backed securities(2) . . . . . . . . . . . . . . . . . . . . . . . . . . . . . . . . . . . . . . . . . . . . 5,321 8,515 10,598
Corporate debt securities . . . . . . . . . . . . . . . . . . . . . . . . . . . . . . . . . . . . . . . . . . . . — 364 6,037
Other . . . . . . . . . . . . . . . . . . . . . . . . . . . . . . . . . . . . . . . . . . . . . . . . . . . . . . . . . . — 3 1,005
Total non-mortgage-related securities . . . . . . . . . . . . . . . . . . . . . . . . . . . . . . . . . . 32,753 8,882 17,640
Total cash and other investments . . . . . . . . . . . . . . . . . . . . . . . . . . . . . . . . . . . . . . . . $61,801 $69,378 $92,991
141

(1) Includes $4.0 billion of U.S. Treasury securities and $2.3 billion of money market fund as of December 31, 2010, witha maturity at the date of acquisition of three months or less.
(2) Includes securities primarily backed by credit cards loans, student loans and automobile loans.
Our total cash and other investments portfolio consists of cash and cash equivalents, federal funds sold andsecurities purchased under agreements to resell or similar arrangements and non-mortgage investmentsecurities. Our cash and other investments portfolio decreased in 2010 compared with 2009 primarily due tothe reduction in our short-term debt balances, which reduced the amount of cash we needed on hand as ofDecember 31, 2010.
See “Risk Management—Credit Risk Management—Institutional Counterparty Credit Risk Management—Issuers of Investments Held in our Cash and Other Investments Portfolio” for additional information on therisks associated with the assets in our cash and other investments portfolio.
Unencumbered Mortgage Portfolio
Another source of liquidity in the event our access to the unsecured debt market becomes impaired is theunencumbered mortgage assets in our mortgage portfolio, which could be sold or used as collateral for securedborrowing.
We continue to make enhancements to our systems to facilitate the securitization of a significant portion of theperforming whole loans in our mortgage portfolio into Fannie Mae MBS. We have securitized the majority ofthe performing single-family whole loans in our retained portfolio and, in October 2010, we developed thecapability to securitize the multifamily loans in our mortgage portfolio. These mortgage-related securitiescould be used as collateral in repurchase agreements or other lending arrangements to the extent they have notbeen sold or encumbered. Despite these enhancements to our systems, we do not have the capability tosecuritize all of the whole loans in our unencumbered mortgage portfolio.
We believe that the amount of mortgage-related securities that we could successfully sell or borrow against inthe event of a liquidity crisis or significant market disruption is substantially lower than the amount ofmortgage-related securities we hold. Due to the large size of our portfolio of mortgage-related assets, currentmarket conditions, and the significant amount of distressed assets in our mortgage portfolio, it is unlikely thatthere would be sufficient market demand for large amounts of these assets over a prolonged period of time,particularly during a liquidity crisis, which could limit our ability to sell or borrow against these assets. To theextent that we would be able to obtain funding by selling or pledging mortgage-related securities as collateral,we anticipate that a discount would be applied that would reduce the value assigned to those securities.Depending on market conditions at the time, this discount would result in proceeds significantly lower thanthe current market value of these assets and would thereby reduce the amount of financing we could obtain. Inaddition, our primary source of collateral is Fannie Mae MBS that we own. In the event of a liquidity crisis inwhich the future of our company is uncertain, counterparties may be unwilling to accept Fannie Mae MBS ascollateral. As a result, we may not be able to sell or borrow against these securities in sufficient amounts tomeet our liquidity needs.
While our liquidity contingency planning attempts to address stressed market conditions and our status underconservatorship and Treasury arrangements, we believe that our liquidity contingency plans may be difficult orimpossible to execute for a company of our size in our circumstances. See “Risk Factors” for a description ofthe risks associated with our liquidity contingency planning.
Credit Ratings
Our ability to access the capital markets and other sources of funding, as well as our cost of funds, are highlydependent on our credit ratings from the major ratings organizations. In addition, our credit ratings areimportant when we seek to engage in certain long-term transactions, such as derivative transactions. Factorsthat may influence our credit ratings include our status as a GSE, Treasury’s funding commitment under thesenior preferred stock purchase agreement, the rating agencies’ assessment of the general operating andregulatory environment, the credit ratings of the U.S. government, our relative position in the market, our
142

financial condition, our reputation, our liquidity position, the level and volatility of our earnings, and ourcorporate governance and risk management policies. Our senior unsecured debt (both long-term and short-term), qualifying subordinated debt and preferred stock are rated and monitored by Standard & Poor’s,Moody’s and Fitch. There have been no changes in our credit ratings from December 31, 2009 to February 21,2011. Table 38 presents the credit ratings issued by each of these rating agencies as of February 21, 2011.
Table 38: Fannie Mae Credit Ratings
Standard & Poor’s Moody’s FitchAs of February 21, 2011
Long-term senior debt . . . . . . . . . . AAA Aaa AAA
Short-term senior debt . . . . . . . . . . A-1+ P-1 F1+
Qualifying subordinated debt . . . . . A Aa2 AA-
Preferred stock . . . . . . . . . . . . . . . C Ca C/RR6
Bank financial strength rating . . . . . — E+ —
Outlook . . . . . . . . . . . . . . . . . . . . Stable Stable Stable
(for Long Term Senior Debt (for all ratings) (for AAA rated Long Term
and Qualifying Subordinated Debt) Issuer Default Rating)
We have no covenants in our existing debt agreements that would be violated by a downgrade in our creditratings. However, in connection with certain derivatives counterparties, we could be required to provideadditional collateral to or terminate transactions with certain counterparties in the event that our seniorunsecured debt ratings are downgraded. The amount of additional collateral required depends on the contractand is usually a fixed incremental amount, the market value of the exposure, or both. See “Note 10, DerivativeInstruments and Hedging Activities” for additional information on collateral we are required to provide to ourderivatives counterparties in the event of downgrades in our credit ratings.
Cash Flows
Year Ended December 31, 2010. Cash and cash equivalents of $17.3 billion as of December 31, 2010increased by $10.5 billion from December 31, 2009. Net cash generated from investing activities totaled$540.2 billion, resulting primarily from proceeds received from repayments of loans held for investment.These net cash inflows were partially offset by net cash outflows used in operating activities of $27.4 billionresulting primarily from purchases of trading securities. The net cash used in financing activities of$502.3 billion was primarily attributable to a significant amount of short-term and long-term debt redemptionsin excess of proceeds received from the issuance of short-term and long-term debt.
Year Ended December 31, 2009. Cash and cash equivalents of $6.8 billion as of December 31, 2009decreased by $11.1 billion from December 31, 2008. Net cash generated from investing activities totaled$117.7 billion, resulting primarily from proceeds received from the sale of available-for-sale securities. Thesenet cash inflows were partially offset by net cash outflows used in operating activities of $85.9 billion, largelyattributable to our purchases of loans held-for-sale due to a significant increase in whole loan conduit activity,and net cash outflows used in financing activities of $42.9 billion. The net cash used in financing activitieswas attributable to the redemption of a significant amount of short-term debt, which was partially offset by theissuance of long-term debt in excess of amounts redeemed and the funds received from Treasury under thesenior preferred stock purchase agreement.
Capital Management
Regulatory Capital
FHFA has announced that, during the conservatorship, our existing statutory and FHFA-directed regulatorycapital requirements will not be binding and FHFA will not issue quarterly capital classifications. We submitminimum capital reports to FHFA during the conservatorship and FHFA monitors our capital levels. We reportour minimum capital requirement, core capital and GAAP net worth in our periodic reports on Form 10-Q andForm 10-K, and FHFA also reports them on its website. FHFA is not reporting on our critical capital, risk-
143

based capital or subordinated debt levels during the conservatorship. For information on our minimum capitalrequirements see “Note 17, Regulatory Capital Requirements.”
Capital Activity
Following our entry into conservatorship, FHFA advised us to manage to a positive net worth, which isrepresented as the “total deficit” line item in our consolidated balance sheet. Our ability to manage our networth continues to be very limited. We are effectively unable to raise equity capital from private sources atthis time and, therefore, are reliant on the senior preferred stock purchase agreement to address any net worthdeficit.
Senior Preferred Stock Purchase Agreement
We have received a total of $87.6 billion from Treasury pursuant to the senior preferred stock purchaseagreement as of December 31, 2010. These funds allowed us to eliminate our net worth deficits as of the endof each of the eight prior quarters. In February 2011, the Acting Director of FHFA submitted a request for$2.6 billion from Treasury under the senior preferred stock purchase agreement to eliminate our net worthdeficit as of December 31, 2010, and requested receipt of those funds on or prior to March 31, 2011. Uponreceipt of the requested funds, the aggregate liquidation preference of the senior preferred stock, including theinitial aggregate liquidation preference of $1.0 billion, will equal $91.2 billion. We continue to expect to havea net worth deficit in future periods and therefore will be required to obtain additional funding from Treasurypursuant to the senior preferred stock purchase agreement. Treasury’s maximum funding commitment to usprior to a December 2009 amendment of the senior preferred stock purchase agreement was $200 billion. Theamendment to the agreement stipulates that the cap on Treasury’s funding commitment to us under the seniorpreferred stock purchase agreement will increase as necessary to accommodate any net worth deficits forcalendar quarters in 2010 through 2012. For any net worth deficits as of December 31, 2012, Treasury’sremaining funding commitment will be $124.8 billion ($200 billion less $75.2 billion cumulatively drawnthrough March 31, 2010) less the smaller of either (a) our positive net worth as of December 31, 2012 or(b) our cumulative draws from Treasury for the calendar quarters in 2010 through 2012.
Dividends
The conservator announced in September, 2008 that we would not pay any dividends on the common stock oron any series of outstanding preferred stock. In addition, the senior preferred stock purchase agreementprohibits us from declaring or paying any dividends on Fannie Mae equity securities (other than the seniorpreferred stock) without the prior written consent of Treasury. Dividends on our outstanding preferred stock(other than the senior preferred stock) are non-cumulative; therefore, holders of this preferred stock are notentitled to receive any forgone dividends in the future.
Holders of the senior preferred stock are entitled to receive, when, as and if declared by our Board ofDirectors, cumulative quarterly cash dividends at the annual rate of 10% per year on the then-currentliquidation preference of the senior preferred stock. Treasury is the current holder of our senior preferredstock. As conservator and under our charter, FHFA has authority to declare and approve dividends on thesenior preferred stock. If at any time we do not pay cash dividends on the senior preferred stock when theyare due, then immediately following the period we did not pay dividends and for all dividend periodsthereafter until the dividend period following the date on which we have paid in cash full cumulativedividends (including any unpaid dividends added to the liquidation preference), the dividend rate will be 12%per year. Dividends on the senior preferred stock that are not paid in cash for any dividend period will accrueand be added to the liquidation preference of the senior preferred stock.
Our fourth quarter dividend of $2.2 billion was declared by the conservator and paid by us on December 31,2010. Upon receipt of additional funds from Treasury in March 2011, which FHFA requested on our behalf inFebruary 2011, the annualized dividend on the senior preferred stock will be $9.1 billion based on the 10%dividend rate. The level of dividends on the senior preferred stock will increase in future periods if, as we
144

expect, the conservator requests additional funds on our behalf from Treasury under the senior preferred stockpurchase agreement.
OFF-BALANCE SHEET ARRANGEMENTS
We enter into certain business arrangements to facilitate our statutory purpose of providing liquidity to thesecondary mortgage market and to reduce our exposure to interest rate fluctuations. Some of thesearrangements are not recorded in our consolidated balance sheets or may be recorded in amounts differentfrom the full contract or notional amount of the transaction, depending on the nature or structure of, andaccounting required to be applied to, the arrangement. These arrangements are commonly referred to as “off-balance sheet arrangements” and expose us to potential losses in excess of the amounts recorded in ourconsolidated balance sheets.
Our off-balance sheet arrangements result primarily from the following:
• our guaranty of mortgage loan securitization and resecuritization transactions over which we do not havecontrol;
• other guaranty transactions;
• liquidity support transactions; and
• partnership interests.
In 2009 and prior, most MBS trusts created as part of our guaranteed securitizations were not consolidated bythe company for financial reporting purposes because the trusts were considered to be qualifying specialpurpose entities under the accounting rules governing the transfer and servicing of financial assets and theextinguishment of liabilities. Effective January 1, 2010, we prospectively adopted the new accountingstandards, which resulted in the majority of our single-class securitization trusts being consolidated by us uponadoption.
Our Fannie Mae MBS and other credit guarantees outstanding totaled $2.7 trillion as of December 31, 2010and $2.8 trillion as of December 31, 2009. These totals include $2.6 trillion of consolidated Fannie Mae MBSand $7.5 billion of Fannie Mae MBS held in portfolio as of December 31, 2010 and $147.9 billion ofconsolidated Fannie Mae MBS and $220.2 billion of Fannie Mae MBS held in portfolio as of December 31,2009.
Our maximum potential exposure to credit losses relating to our outstanding and unconsolidated Fannie MaeMBS and other financial guarantees is primarily represented by the unpaid principal balance of the mortgageloans underlying outstanding and unconsolidated Fannie Mae MBS and other financial guarantees of$56.9 billion as of December 31, 2010 and $2.5 trillion as of December 31, 2009.
For information on the mortgage loans underlying both our on- and off-balance sheet Fannie Mae MBS, aswell as whole mortgage loans that we own, see “Risk Management—Credit Risk Management.”
Partnership Investment Interests
For partnership investments where we have determined that we are the primary beneficiary, we haveconsolidated these investments and recorded all of the partnership assets and liabilities in our consolidatedbalance sheets. The carrying value of our partnership investments, which primarily include investments inaffordable rental and for-sale housing partnerships, totaled $1.8 billion as of December 31, 2010, comparedwith $2.4 billion as of December 31, 2009.
LIHTC Partnership Interests
In most instances, we are not the primary beneficiary of our LIHTC partnership investments, and therefore ourconsolidated balance sheets reflect only our investment in the LIHTC partnership, rather than the full amountof the LIHTC partnership’s assets and liabilities. During 2009, we explored options to sell or otherwise
145

transfer our LIHTC investments for value consistent with our mission. On February 18, 2010, FHFA informedus that after consultation with Treasury, we were not authorized to sell or transfer our LIHTC partnershipinterests.
In the fourth quarter of 2009, we reduced the carrying value of our LIHTC partnership investments to zero,recognizing a loss of $5.0 billion, as we no longer had both the intent and ability to sell or otherwise transferour LIHTC investments for value. As a result, we no longer recognize net operating losses orother-than-temporary impairment on our LIHTC investments. However, we still have an obligation to fund ourLIHTC partnership investments and have recorded such obligation as a liability in our financial statements.Our obligation to fund consolidated LIHTC partnerships was $139 million as of December 31, 2010 and$282 million as of December 31, 2009. Our obligation to fund unconsolidated LIHTC partnerships was$141 million as of December 31, 2010 and $259 million as of December 31, 2009. Our contributions toconsolidated LIHTC partnerships were $114 million for the year ended December 31, 2010 and $341 millionfor the year ended December 31, 2009. Our contribution to unconsolidated LIHTC partnerships was$158 million for the year ended December 31, 2010 and $293 million for the year ended December 31, 2009.As a result of our current tax position, we currently are not making any new LIHTC investments, other thanpursuant to commitments existing prior to 2008, and are not recognizing any tax benefits in our consolidatedstatements of operations associated with the tax credits and net operating losses. For additional informationregarding our holdings in off-balance sheet limited partnerships and other off-balance sheet transactions, referto “Note 3, Consolidations and Transfers of Financial Assets” and “Note 18, Concentrations of Credit Risk.”
Treasury Housing Finance Agency Initiative
During the fourth quarter of 2009, we entered into agreements with Treasury, FHFA and Freddie Mac underwhich we provided assistance to state and local housing finance agencies (“HFAs”) through two primaryprograms, which together comprise what we refer to as the HFA initiative. See “Certain Relationships andRelated Transactions, and Director Independence—Transactions with Related Persons—Transactions withTreasury—Treasury Housing Finance Agency Initiative” for a discussion of the HFA initiative.
Through assistance to state and local HFAs and pursuant to the temporary credit and liquidity facilitiesprograms that we describe in “Related Parties” in “Note 1, Summary of Significant Accounting Policies,”Treasury has purchased participation interests in temporary credit and liquidity facilities provided by us andFreddie Mac to the HFAs. These facilities create a credit and liquidity backstop for the HFAs. Our outstandingcommitments under the temporary credit and liquidity facilities program totaled $3.7 billion as ofDecember 31, 2010 and $870 million as of December 31, 2009.
Our total outstanding liquidity commitments to advance funds for securities backed by multifamily housingrevenue bonds totaled $17.8 billion as of December 31, 2010 and $15.5 billion as of December 31, 2009.These commitments require us to advance funds to third parties that enable them to repurchase tendered bondsor securities that are unable to be remarketed. Any repurchased securities are pledged to us to secure fundinguntil the securities are remarketed. We hold cash and cash equivalents in our cash and other investmentsportfolio in excess of these commitments to advance funds (exclusive of $3.7 billion as of December 31, 2010and $870 million as of December 31, 2009, of our outstanding commitments under the HFA temporary creditand liquidity facilities program, for which we are not required to hold excess cash).
As of both December 31, 2010 and 2009, there were no liquidity guarantee advances outstanding.
RISK MANAGEMENT
Our business activities expose us to the following three major categories of financial risk: credit risk, marketrisk (including interest rate and liquidity risk) and operational risk. We seek to manage these risks andmitigate our losses by using an established risk management framework. Our risk management framework isintended to provide the basis for the principles that govern our risk management activities.
• Credit Risk. Credit risk is the potential for financial loss resulting from the failure of a borrower orinstitutional counterparty to honor its financial or contractual obligations, resulting in a potential loss of
146

earnings or cash flows. In regards to financial securities or instruments, credit risk is the risk of notreceiving principal, interest or any other financial obligation on a timely basis, for any reason. Credit riskexists primarily in our mortgage credit book of business and derivatives portfolio.
• Market Risk. Market risk is the exposure generated by adverse changes in the value of financialinstruments caused by a change in market prices or interest rates. Two significant market risks we faceand actively manage are interest rate risk and liquidity risk. Interest rate risk is the risk of changes in ourlong-term earnings or in the value of our net assets due to fluctuations in interest rates. Liquidity risk isour potential inability to meet our funding obligations in a timely manner.
• Operational Risk. Operational risk is the loss resulting from inadequate or failed internal processes,people, systems, or from external events.
We are also subject to a number of other risks that could adversely impact our business, financial condition,earnings and cash flow, including legal and reputational risks that may arise due to a failure to comply withlaws, regulations or ethical standards and codes of conduct applicable to our business activities and functions.Another risk that can impact our financial condition, earnings and cash flow is model risk, which is defined asthe potential for model errors to adversely affect the company. See “Risk Factors” for a discussion of the risksassociated with our reliance on models.
Our risk management framework and governance structure are intended to provide comprehensive controls andongoing management of the major risks inherent in our business activities. Our ability to identify, assess,mitigate and control, and report and monitor risk is crucial to our safety and soundness.
• Risk Identification. Risk identification is the process of finding, recognizing and describing risk. Theidentification of risk facilitates effective risk management by achieving awareness of the sources, impactand magnitude of risk.
• Risk Assessment. We assess risk using a variety of methodologies, such as calculation of potential lossesfrom loans and stress tests relating to interest rate sensitivity. When we assess risk we look at metricssuch as frequency, severity, concentration, correlation, volatility and loss. Information obtained from theseassessments is reviewed on a regular basis to ensure that our risk assumptions are reasonable and reflectour current positions.
• Risk Mitigation & Control. We proactively develop appropriate mitigation strategies to preventexcessive risk exposure, address risks that exceed established tolerances, and address risks that createunanticipated business impact. Mitigation strategies and controls can be in the form of reduction,transference, acceptance or avoidance of the identified risk. We also manage risk through four controlelements that are designed to work in conjunction with each other: (1) risk policies; (2) risk limits;(3) delegations of authority; and (4) risk committees.
• Risk Reporting & Monitoring. Our business units actively monitor emerging and identified risks thatare taken when executing our strategies. Risks and concerns are reported to the appropriate level ofmanagement to ensure that the necessary action is taken to mitigate the risk.
Enterprise Risk Governance
Our enterprise risk management structure is designed to balance a strong corporate risk managementphilosophy, appetite and culture with a well-defined independent risk management function. Our objective is toensure that people and processes are organized in a way to promote a cross-functional approach to riskmanagement and that controls are in place to better manage our risks and comply with legal and regulatoryrequirements.
Our enterprise risk governance structure consists of the Board of Directors, executive leadership, including theChief Risk Officer, the Enterprise Risk Management division, designated officers responsible for managing ourfinancial risks, business unit chief risk officers, and risk management committees. This structure is designed toencourage a culture of accountability within the divisions and promote effective risk management throughoutthe company.
147

Our organizational structure and risk management framework work in conjunction with each other to identifyrisk-related trends with respect to customers, products or portfolios and external events to develop appropriatestrategies to mitigate emerging and identified risks.
Board of Directors
The Board of Directors is responsible for the oversight of risk management primarily through the Board’s RiskPolicy and Capital Committee. This board committee oversees risk-related policies, including: review of thecorporate-level risk policies and limits; performance against these policies and limits; and the sufficiency ofrisk management capabilities. In addition, the Audit Committee reviews the system of internal controls that werely upon to provide reasonable assurance of compliance with our enterprise risk management processes.
Enterprise Risk Management Division
Our Enterprise Risk Management division is headed by the Chief Risk Officer. The Chief Risk Officer reportsdirectly to the Chief Executive Officer and independently to the Board of Directors, primarily through theBoard’s Risk Policy and Capital Committee. Enterprise Risk Management is responsible for providing our riskmanagement directives and functions as well as for establishing effective controls, including policydevelopment, risk management methodologies and risk reporting.
Our Enterprise Risk Management division has designated chief risk officers for each of our business segmentsin addition to risk officers who are responsible for the management of our financial risks. These chief riskofficers are responsible for oversight and approval of key risks within their respective business unit and fordeveloping the appropriate risk policies and reporting requirements for their business unit.
Risk Committees
We use our risk committees as a forum for discussing emerging risks, risk mitigation strategies, andcommunication across business lines. Risk committees enhance the risk management framework by reinforcingour risk management culture and providing accountability for the resolution of key risk issues and decisions.Each business risk committee is co-chaired by the business unit chief risk officer and the business unitexecutive vice president and includes key business and risk leaders.
Our current committee structure includes four Business Risk Committees (Capital Markets Risk, CreditPortfolio Management Risk, Multifamily Risk and Single-Family Risk) and five Enterprise Risk Committees(Asset and Liability, Credit Risk, Credit Expense Forecast and Allowance, Model Risk Oversight and ChangeManagement, and Operational Risk).
Internal Audit
Our Internal Audit group, under the direction of the Chief Audit Executive, provides an objective assessmentof the design and execution of our internal control system, including our management systems, riskgovernance, and policies and procedures. The Chief Audit Executive reports directly and independently to theAudit Committee of the Board of Directors, and audit personnel are compensated on objectives set for thegroup by the Audit Committee rather than corporate financial results or goals. The Chief Audit Executivereports administratively to the Chief Executive Officer and may be removed only upon approval by theBoard’s Audit Committee. Internal audit activities are designed to provide reasonable assurance that resourcesare safeguarded; that significant financial, managerial and operating information is complete, accurate andreliable; and that employee actions comply with our policies and applicable laws and regulations.
Compliance and Ethics
The Compliance and Ethics division, under the direction of the Chief Compliance Officer, is dedicated todeveloping policies and procedures to help ensure that Fannie Mae and its employees comply with the law,our Code of Conduct, and all regulatory obligations. The Chief Compliance Officer reports directly to ourChief Executive Officer and independently to the Audit Committee of the Board of Directors, and Compliance
148

and Ethics personnel are compensated on objectives set for the group by the Audit Committee of the Board ofDirectors rather than corporate financial results or goals. The Chief Compliance Officer may be removed onlyupon Board approval. The Chief Compliance Officer is responsible for overseeing our compliance activities;developing and promoting a code of ethical conduct; evaluating and investigating any allegations ofmisconduct; and overseeing and coordinating regulatory reporting and examinations.
Credit Risk Management
We are generally subject to two types of credit risk: mortgage credit risk and institutional counterparty creditrisk. Continuing adverse market conditions have resulted in significant exposure to mortgage and institutionalcounterparty credit risk. The metrics used to measure credit risk are generated using internal models. Ourinternal models require numerous assumptions and there are inherent limitations in any methodology used toestimate macro-economic factors such as home prices, unemployment and interest rates and their impact onborrower behavior. When market conditions change rapidly and dramatically the assumptions of our modelsmay no longer accurately capture or reflect the changing conditions. On a continuous basis, managementmakes judgments about the appropriateness of the risk assessments indicated by the models. See “RiskFactors” for a discussion of the risks associated with our use of models.
Mortgage Credit Risk Management
Mortgage credit risk is the risk that a borrower will fail to make required mortgage payments. We are exposedto credit risk on our mortgage credit book of business because we either hold mortgage assets, have issued aguaranty in connection with the creation of Fannie Mae MBS backed by mortgage assets or provided othercredit enhancements on mortgage assets. While our mortgage credit book of business includes all of ourmortgage-related assets, both on- and off-balance sheet, our guaranty book of business excludes non-FannieMae mortgage-related securities held in our portfolio for which we do not provide a guaranty.
Mortgage Credit Book of Business
Table 39 displays the composition of our entire mortgage credit book of business as of the periods indicated.Our total single-family mortgage credit book of business accounted for 93% of our total mortgage credit bookof business as of both December 31, 2010 and 2009. As a result of our adoption of the new accountingstandards, we reflect a substantial majority of our Fannie Mae MBS as mortgage loans, which are reported onan actual unpaid principal balance basis and include the recognition of unscheduled payments made byborrowers in the month received. Previously, we recorded these Fannie Mae MBS in our mortgage credit bookof business on a scheduled basis and recognized these payments when we remitted payment to the MBS trustsone month after the unscheduled payments were received. As a result of this timing difference, our mortgagecredit book of business decreased upon adoption of the new accounting standards.
The total mortgage credit book of business is not impacted by our repurchase of delinquent loans as thisactivity is a reclassification from loans of consolidated trusts to loans of Fannie Mae.
149

Table 39: Composition of Mortgage Credit Book of Business(1)
Conventional(2) Government(3) Conventional(2) Government(3) Conventional(2) Government(3)Single-Family Multifamily Total
As of December 31, 2010
(Dollars in millions)
Mortgage assets:
Mortgage loans(4) . . . . . . $2,766,870 $52,577 $170,074 $ 476 $2,936,944 $53,053
Fannie Mae MBS(5)(7) . . . 5,961 1,586 — 2 5,961 1,588
Agency mortgage-relatedsecurities(5)(6) . . . . . . . . 17,291 1,506 — 24 17,291 1,530
Mortgage revenuebonds(5) . . . . . . . . . . . 2,197 1,190 7,449 1,689 9,646 2,879
Other mortgage-relatedsecurities(5) . . . . . . . . . 43,634 1,657 25,052 15 68,686 1,672
Total mortgage assets . . . . . 2,835,953 58,516 202,575 2,206 3,038,528 60,722
Unconsolidated Fannie MaeMBS(5)(7) . . . . . . . . . . . . 2,230 17,238 37 1,818 2,267 19,056
Other credit guarantees(8) . . . 15,529 3,096 16,601 393 32,130 3,489
Mortgage credit book ofbusiness . . . . . . . . . . . $2,853,712 $78,850 $219,213 $4,417 $3,072,925 $83,267
Guaranty book ofbusiness . . . . . . . . . . . $2,790,590 $74,497 $186,712 $2,689 $2,977,302 $77,186
Conventional(2) Government(3) Conventional(2) Government(3) Conventional(2) Government(3)Single-Family Multifamily Total
As of December 31, 2009
(Dollars in millions)
Mortgage portfolio:
Mortgage loans(4) . . . . . . $ 243,730 $52,399 $119,829 $ 585 $ 363,559 $52,984
Fannie Mae MBS(5) . . . . . 218,033 1,816 314 82 218,347 1,898
Agency mortgage-relatedsecurities(5)(6) . . . . . . . . 41,337 1,309 — 21 41,337 1,330
Mortgage revenuebonds(5) . . . . . . . . . . . 2,709 2,056 7,734 1,954 10,443 4,010
Other mortgage-relatedsecurities(5) . . . . . . . . . 47,825 1,796 25,703 20 73,528 1,816
Total mortgage portfolio . . . 553,634 59,376 153,580 2,662 707,214 62,038
Fannie Mae MBS held bythird parties(5)(7) . . . . . . . 2,370,037 15,197 46,628 927 2,416,665 16,124
Other credit guarantees(8) . . . 9,873 802 16,909 40 26,782 842
Mortgage credit book ofbusiness . . . . . . . . . . . $2,933,544 $75,375 $217,117 $3,629 $3,150,661 $79,004
Guaranty book ofbusiness . . . . . . . . . . . $2,841,673 $70,214 $183,680 $1,634 $3,025,353 $71,848
(1) Based on unpaid principal balance.(2) Refers to mortgage loans and mortgage-related securities that are not guaranteed or insured by the U.S. government or
any of its agencies.(3) Refers to mortgage loans and mortgage-related securities guaranteed or insured, in whole or in part, by the U.S.
government or one of its agencies.(4) Includes unscheduled borrower principal payments.
150

(5) Excludes unscheduled borrower principal payments.(6) Consists of mortgage-related securities issued by Freddie Mac and Ginnie Mae.(7) The principal balance of resecuritized Fannie Mae MBS is included only once in the reported amount.(8) Includes single-family and multifamily credit enhancements that we have provided and that are not otherwise reflected
in the table.
Single-Family Mortgage Credit Risk Management
Our strategy in managing single-family mortgage credit risk consists of four primary components: (1) ouracquisition and servicing policies and underwriting standards, including the use of credit enhancements;(2) portfolio diversification and monitoring; (3) management of problem loans; and (4) REO management.These strategies, which we discuss in detail below, may increase our expenses and may not be effective inreducing our credit-related expenses or credit losses. We provide information on our credit-related expensesand credit losses in “Consolidated Results of Operations—Credit-Related Expenses.”
In evaluating our single-family mortgage credit risk, we closely monitor changes in housing and economicconditions and the impact of those changes on the credit risk profile of our single-family mortgage credit bookof business. We regularly review and provide updates to our underwriting standards and eligibility guidelinesthat take into consideration changing market conditions. The credit risk profile of our single-family mortgagecredit book of business is influenced by, among other things, the credit profile of the borrower, features of theloan, loan product type, the type of property securing the loan and the housing market and general economy.We focus our efforts more on loans that we believe pose a higher risk of default, which typically have beenloans associated with higher mark-to-market LTV ratios, loans to borrowers with lower FICO credit scores andcertain higher risk loan product categories, including Alt-A loans. These and other factors affect both theamount of expected credit loss on a given loan and the sensitivity of that loss to changes in the economicenvironment.
The credit statistics reported below, unless otherwise noted, pertain generally to the portion of our single-family guaranty book of business for which we have access to detailed loan-level information, whichconstituted over 99% of our single-family conventional guaranty book of business as of December 31, 2010and 98% as of December 31, 2009. We typically obtain this data from the sellers or servicers of the mortgageloans in our guaranty book of business and receive representations and warranties from them as to theaccuracy of the information. While we perform various quality assurance checks by sampling loans to assesscompliance with our underwriting and eligibility criteria, we do not independently verify all reportedinformation. See “Risk Factors” for a discussion of the risk that we could experience mortgage fraud as aresult of this reliance on lender representations.
Because we believe we have limited credit exposure on our government loans, the single-family creditstatistics we focus on and report in the sections below generally relate to our single-family conventionalguaranty book of business, which represents the substantial majority of our total single-family guaranty bookof business.
We provide information on the performance of non-Fannie Mae mortgage-related securities held in ourportfolio, including the impairment that we have recognized on these securities, in “Consolidated BalanceSheet Analysis—Investments in Mortgage-Related Securities—Investments in Private-Label Mortgage-RelatedSecurities.”
Single-Family Acquisition and Servicing Policies and Underwriting Standards
Our Single-Family business, in conjunction with our Enterprise Risk Management division, is responsible forpricing and managing credit risk relating to the portion of our single-family mortgage credit book of businessconsisting of single-family mortgage loans and Fannie Mae MBS backed by single-family mortgage loans(whether held in our portfolio or held by third parties). Desktop UnderwriterTM, our proprietary automatedunderwriting system which measures default risk by assessing the primary risk factors of a mortgage, is usedto evaluate the majority of the loans we purchase or securitize. As part of our regular evaluation of DesktopUnderwriter, we conduct periodic examinations of the underlying risk assessment models to improve Desktop
151

Underwriter’s ability to effectively analyze risk by recalibrating the models based on actual loan performanceand market assumptions. Subject to our prior approval, we also may purchase and securitize mortgage loansthat have been underwritten using other automated underwriting systems, as well as mortgage loansunderwritten to agreed-upon standards that differ from our standard underwriting and eligibility criteria.Additionally, as the number of our delinquent and defaulted loans has increased, so has the correspondingnumber of these loans reviewed for compliance with our requirements. We use the information obtained fromthese loan quality reviews to provide more timely feedback to lenders on possible areas for correction in theirorigination practices.
We initiated underwriting and eligibility changes that became effective in 2009 such as establishing aminimum FICO credit score and a maximum debt-to-income cap, updating Desktop Underwriter’s credit riskassessment model by implementing Desktop Underwriter 8.0, and we provided updates to our property-relatedpolicies. All of the changes focused on strengthening the underwriting and eligibility standards to promotesustainable homeownership. The result of many of these changes is reflected in the substantially improved riskprofile of the single-family acquisitions in 2010 and 2009.
Our charter requires that single-family conventional mortgage loans with LTV ratios above 80% at acquisitionthat we purchase or that back Fannie Mae MBS generally be covered by one or more of the following:(1) insurance or a guaranty by a qualified insurer; (2) a seller’s agreement to repurchase or replace anymortgage loan in default (for such period and under such circumstances as we may require); or (3) retentionby the seller of at least a 10% participation interest in the mortgage loans. However, under our Refi Plusinitiative, which includes HARP, we allow our borrowers who have mortgage loans with current LTV ratios upto 125% to refinance their mortgages without obtaining new mortgage insurance in excess of what was alreadyin place. We have worked with FHFA to provide us with the flexibility to implement this element of RefiPlus.FHFA granted our request for an extension of this flexibility for loans originated through June 2011. We havesubmitted a request to FHFA for an additional extension.
Borrower-paid primary mortgage insurance is the most common type of credit enhancement in our single-family mortgage credit book of business. Primary mortgage insurance transfers varying portions of the creditrisk associated with a mortgage loan to a third-party insurer. In order for us to receive a payment in settlementof a claim under a primary mortgage insurance policy, the insured loan must be in default and the borrower’sinterest in the property that secured the loan must have been extinguished, generally in a foreclosure action.The claims process for primary mortgage insurance typically takes three to six months after title to theproperty has been transferred.
Mortgage insurers may also provide pool mortgage insurance, which is insurance that applies to a definedgroup of loans. Pool mortgage insurance benefits typically are based on actual loss incurred and are subject toan aggregate loss limit. Under some of our pool mortgage insurance policies, we are required to meetspecified loss deductibles before we can recover under the policy. We typically collect claims under poolmortgage insurance three to six months after disposition of the property that secured the loan.
For a discussion of our aggregate mortgage insurance coverage as of December 31, 2010 and 2009, see “RiskManagement—Credit Risk Management—Institutional Counterparty Credit Risk Management—MortgageInsurers.”
We monitor both housing and economic market conditions as well as loan performance, to manage andevaluate our credit risks. During 2010, we announced several changes to our single-family acquisition andservicing policies and underwriting standards that were intended to improve the credit quality of mortgageloans delivered to us, strengthen our servicing policies, continue our corporate focus on sustainablehomeownership and further reduce our acquisition of higher-risk conventional loan categories. Some of thesechanges include:
• Implementation of a Loan Quality Initiative (“LQI”) which is a longer-term strategy that will helpmortgage loans meet our credit, eligibility, and pricing standards by capturing critical loan data earlier inthe loan delivery process. This initiative is intended to reduce lender repurchase requests in the futurethrough improved data integrity and early feedback on some aspects of policy compliance, thereby
152

reducing investor and lender risks. As part of the LQI, we have implemented or announced certaininitiatives designed to validate certain borrower and property information and collect additional propertyand appraisal data prior to or at the time of delivery of the mortgage loan:
• Implementation of FHFA’s Uniform Mortgage Data Program that provides a common approach tocollection of the appraisal and loan delivery data required on the loans that lenders sell to Fannie Mae;
• Development of the Uniform Loan Delivery Dataset definition of single-family loan delivery datarequirements for all mortgages delivered to either GSE on or after March 19, 2012;
• Launch of EarlyCheckTM, a new service that provides lenders access to loan delivery data checks thatare designed to help them identify potential data problems at any point prior to loan delivery;
• Adjustments to pricing of flow business for mortgage loans with certain risk characteristics to ensure thatFannie Mae is positioned to provide a stable source of liquidity to its lender partners;
• On October 18, 2010, the Federal Reserve Board released an interim final rule on appraiser independence.Under the Dodd-Frank Act, promulgation of the interim final rule resulted in the termination of the HomeValuation Code of Conduct (“HVCC”). In October 2010, we announced the Appraiser IndependenceRequirements that we, FHFA and key industry participants developed to replace the HVCC. TheAppraiser Independence Requirements maintain the spirit and intent of the HVCC and continue to provideimportant protections for mortgage investors, home buyers, and the housing market;
• Updating of our existing quality control standards to require that lenders follow our revised requirementsfor their quality control plans, reviews and processes, as well as updated requirements for the approvaland management of third-party originators. We have also increased our enforcement and monitoringresources to increase lender compliance with these revised standards;
• Changes to interest-only mortgage loans, including minimum reserve and FICO credit score requirements,lower LTV ratios, and the elimination of interest-only eligibility for certain products, including cash-outrefinances, 2- to 4- unit properties and investment properties;
• Adjustments to the qualifying interest rate requirements for adjustable-rate mortgage loans with an initialterm of five years or less to help increase the probability that borrowers are able to absorb future paymentincreases;
• Elimination of balloon mortgage loans as an eligible product under our standard business;
• Continuation of our providing guidance to assist servicers in implementing the eligibility, underwritingand servicing requirements of HAMP. For example, we implemented changes to require full verificationof borrower eligibility prior to offering a trial period plan and issued guidance around income verificationoptions;
• Enhancements to loss mitigation options to provide payment relief for homeowners who have lost theirjobs by offering eligible unemployed borrowers a forbearance plan to temporarily reduce or suspend theirmortgage payments;
• Introduction of the Home Affordable Foreclosure Alternatives program which is designed to mitigate theimpact of foreclosures on borrowers who were eligible for a loan modification under HAMP butultimately were unsuccessful in obtaining one;
• Introduction of servicer requirements for staffing, training and performance monitoring of default-relatedactivities as well as enhanced guidance for call coverage and borrower contact;
• Adjustment to the minimum waiting period that must elapse after a foreclosure before a borrower withoutextenuating circumstances is eligible for a new mortgage loan. The adjustment is designed to increasedisincentives for borrowers to walk away from their mortgages without working with servicers to pursuealternatives to foreclosure. Borrowers with extenuating circumstances or those who agree to foreclosurealternatives may qualify for new mortgage loans eligible for sale to Fannie Mae in as little as two to threeyears;
153

• Addition of new requirements for financial information verification before borrowers can be offered aloan modification outside of HAMP;
• Introduction of a Unique Hardship policy to allow servicers to grant forbearance, and a provision forcredit bureau reporting relief, to borrowers who face difficulty maintaining timely payments due to anevent or temporary financial hardship that has been classified by us as a unique hardship;
• Adjustments to foreclosure time frames and notice of compensatory fees for breach of servicingobligations, which are designed to hold servicers accountable for their servicing requirements and aim toimprove servicer performance and costly delays in foreclosure proceedings; and
• Introduction of the Second Lien Modification Program (2MP), which is designed to work in tandem withHAMP for first liens to create a comprehensive solution to help borrowers achieve greater affordability bylowering payments on both first and second lien mortgage loans for borrowers whose second lien loan isowned by Fannie Mae.
On September 29, 2010, Congress passed a continuing resolution that, among other things, extended thecurrent GSE loan limits for high cost areas through September 30, 2011. See “Business—Our Charter andRegulation of Our Activities—Charter Act—Loan Standards” for additional information on our loan limits.
Single-Family Portfolio Diversification and Monitoring
Diversification within our single-family mortgage credit book of business by product type, loan characteristicsand geography is an important factor that influences credit quality and performance and may reduce our creditrisk. We also review the payment performance of loans in order to help identify potential problem loans earlyin the delinquency cycle and to guide the development of our loss mitigation strategies.
The profile of our guaranty book of business is comprised of the following key loan attributes:
— LTV ratio. LTV ratio is a strong predictor of credit performance. The likelihood of default and thegross severity of a loss in the event of default are typically lower as the LTV ratio decreases. This alsoapplies to the estimated mark-to-market LTV ratios, particularly those over 100%, as this indicates thatthe borrower’s mortgage balance exceeds the property value.
— Product type. Certain loan product types have features that may result in increased risk. Generally,intermediate-term, fixed-rate mortgages exhibit the lowest default rates, followed by long-term, fixed-rate mortgages. ARMs and balloon/reset mortgages typically exhibit higher default rates than fixed-ratemortgages, partly because the borrower’s future payments may rise, within limits, as interest rateschange. Negative-amortizing and interest-only loans also default more often than traditional fixed-ratemortgage loans.
— Number of units. Mortgages on one-unit properties tend to have lower credit risk than mortgages ontwo-, three- or four-unit properties.
— Property type. Certain property types have a higher risk of default. For example, condominiumsgenerally are considered to have higher credit risk than single-family detached properties.
— Occupancy type. Mortgages on properties occupied by the borrower as a primary or secondaryresidence tend to have lower credit risk than mortgages on investment properties.
— Credit score. Credit score is a measure often used by the financial services industry, including ourcompany, to assess borrower credit quality and the likelihood that a borrower will repay futureobligations as expected. A higher credit score typically indicates lower credit risk.
— Loan purpose. Loan purpose indicates how the borrower intends to use the funds from a mortgageloan. Cash-out refinancings have a higher risk of default than either mortgage loans used for thepurchase of a property or other refinancings that restrict the amount of cash returned to the borrower.
— Geographic concentration. Local economic conditions affect borrowers’ ability to repay loans and thevalue of collateral underlying loans. Geographic diversification reduces mortgage credit risk.
154

— Loan age. We monitor year of origination and loan age, which is defined as the number of years sinceorigination. Statistically, the peak ages for default are currently from two to six years after origination.However, we have seen higher early default rates for loans originated in 2006 and 2007, due to a highernumber of loans originated during these years with risk layering. Risk layering means permitting a loanto have several features that compound risk, such as loans with reduced documentation and higher riskloan product types.
Table 40 presents our single-family conventional business volumes and our single-family conventionalguaranty book of business for the periods indicated, based on certain key risk characteristics that we use toevaluate the risk profile and credit quality of our single-family loans.
Table 40: Risk Characteristics of Single-Family Conventional Business Volume and Guaranty Book of Business(1)
2010 2009 2008 2010 2009 2008
Percent of Single-FamilyConventional Business Volume(2)
For the Year Ended December 31,
Percent of Single-FamilyConventional Guaranty
Book of Business(3)(4)
As of December 31,
(Dollars in millions)
Original LTV ratio:(5)
G= 60% . . . . . . . . . . . . . . . . . . . . . 30% 33% 23% 24% 24% 22%60.01% to 70% . . . . . . . . . . . . . . . . . 16 17 16 16 16 1670.01% to 80% . . . . . . . . . . . . . . . . . 38 40 39 41 42 4380.01% to 90%(6) . . . . . . . . . . . . . . . 9 7 12 9 9 990.01% to 100%(6) . . . . . . . . . . . . . . 5 3 10 9 9 10Greater than 100%(6) . . . . . . . . . . . . . 2 * * 1 * *
Total . . . . . . . . . . . . . . . . . . . . . . 100% 100% 100% 100% 100% 100%
Weighted average. . . . . . . . . . . . . . 68% 67% 72% 71% 71% 72%Average loan amount . . . . . . . . . . . . . . $219,431 $219,118 $208,652 $155,531 $153,302 $148,824Estimated mark-to-market LTV ratio:(7)
G= 60% . . . . . . . . . . . . . . . . . . . . . 28% 31% 36%60.01% to 70% . . . . . . . . . . . . . . . . . 13 13 1370.01% to 80% . . . . . . . . . . . . . . . . . 19 19 1780.01% to 90% . . . . . . . . . . . . . . . . . 15 14 1490.01% to 100% . . . . . . . . . . . . . . . . 9 9 8Greater than 100% . . . . . . . . . . . . . . 16 14 12
Total . . . . . . . . . . . . . . . . . . . . . . 100% 100% 100%
Weighted average. . . . . . . . . . . . . . 77% 75% 70%Product type:
Fixed-rate:(8)
Long-term . . . . . . . . . . . . . . . . . . . 72% 82% 78% 74% 75% 74%Intermediate-term. . . . . . . . . . . . . . 22 15 12 14 13 13Interest-only . . . . . . . . . . . . . . . . . * * 2 2 3 3
Total fixed-rate. . . . . . . . . . . . . . 94 97 92 90 91 90
Adjustable-rate:Interest-only . . . . . . . . . . . . . . . . . 1 1 4 4 4 5Negative-amortizing . . . . . . . . . . . . — * — * 1 1Other ARMs . . . . . . . . . . . . . . . . . 5 2 4 6 4 4
Total adjustable-rate . . . . . . . . . 6 3 8 10 9 10
Total . . . . . . . . . . . . . . . . . . . . . 100% 100% 100% 100% 100% 100%
Number of property units:1 unit . . . . . . . . . . . . . . . . . . . . . . . . 98% 98% 97% 97% 96% 96%2-4 units. . . . . . . . . . . . . . . . . . . . . . 2 2 3 3 4 4
Total . . . . . . . . . . . . . . . . . . . . . . 100% 100% 100% 100% 100% 100%
155

2010 2009 2008 2010 2009 2008
Percent of Single-FamilyConventional Business Volume(2)
For the Year Ended December 31,
Percent of Single-FamilyConventional Guaranty
Book of Business(3)(4)
As of December 31,
(Dollars in millions)
Property type:Single-family homes . . . . . . . . . . . . . 91% 92% 89% 91% 91% 91%Condo/Co-op . . . . . . . . . . . . . . . . . . 9 8 11 9 9 9
Total . . . . . . . . . . . . . . . . . . . . . . 100% 100% 100% 100% 100% 100%
Occupancy type:Primary residence . . . . . . . . . . . . . . . 91% 93% 89% 90% 90% 90%Second/vacation home . . . . . . . . . . . . 4 5 5 4 4 4Investor . . . . . . . . . . . . . . . . . . . . . . 5 2 6 6 6 6
Total . . . . . . . . . . . . . . . . . . . . . . 100% 100% 100% 100% 100% 100%
FICO credit score:G 620 . . . . . . . . . . . . . . . . . . . . . . . *% * % 3% 4% 4% 5%620 to G 660 . . . . . . . . . . . . . . . . . . 2 2 6 7 8 9660 to G 700 . . . . . . . . . . . . . . . . . . 7 7 14 15 16 17700 to G 740 . . . . . . . . . . . . . . . . . . 16 17 22 21 22 23H= 740 . . . . . . . . . . . . . . . . . . . . . . 75 74 55 53 50 45Not available . . . . . . . . . . . . . . . . . . * * — — * 1
Total . . . . . . . . . . . . . . . . . . . . . . 100% 100% 100% 100% 100% 100%
Weighted average. . . . . . . . . . . . . . 762 761 738 735 730 724Loan purpose:
Purchase . . . . . . . . . . . . . . . . . . . . . 22% 20% 41% 33% 36% 41%Cash-out refinance. . . . . . . . . . . . . . . 20 27 31 29 31 32Other refinance . . . . . . . . . . . . . . . . . 58 53 28 38 33 27
Total . . . . . . . . . . . . . . . . . . . . . . 100% 100% 100% 100% 100% 100%
Geographic concentration:(9)
Midwest . . . . . . . . . . . . . . . . . . . . . . 16% 16% 15% 15% 16% 16%Northeast . . . . . . . . . . . . . . . . . . . . . 20 19 18 19 19 19Southeast . . . . . . . . . . . . . . . . . . . . . 18 20 23 24 24 25Southwest. . . . . . . . . . . . . . . . . . . . . 15 15 16 15 15 16West . . . . . . . . . . . . . . . . . . . . . . . . 31 30 28 27 26 24
Total . . . . . . . . . . . . . . . . . . . . . . 100% 100% 100% 100% 100% 100%
Origination year:G=2000. . . . . . . . . . . . . . . . . . . . . . 1% 2% 2%2001 . . . . . . . . . . . . . . . . . . . . . . . . 1 1 22002 . . . . . . . . . . . . . . . . . . . . . . . . 3 4 52003 . . . . . . . . . . . . . . . . . . . . . . . . 11 14 182004 . . . . . . . . . . . . . . . . . . . . . . . . 7 7 102005 . . . . . . . . . . . . . . . . . . . . . . . . 9 10 132006 . . . . . . . . . . . . . . . . . . . . . . . . 8 11 142007 . . . . . . . . . . . . . . . . . . . . . . . . 12 15 202008 . . . . . . . . . . . . . . . . . . . . . . . . 9 13 162009 . . . . . . . . . . . . . . . . . . . . . . . . 21 23 —2010 . . . . . . . . . . . . . . . . . . . . . . . . 18 — —
Total . . . . . . . . . . . . . . . . . . . . . . 100% 100% 100%
* Represents less than 0.5% of single-family conventional business volume or book of business.(1) We reflect second lien mortgage loans in the original LTV ratio calculation only when we own both the first and second lien
mortgage loans or we own only the second lien mortgage loan. Second lien mortgage loans represented less than 0.6% of our single-
156

family conventional guaranty book of business as of December 31, 2010, 2009 and 2008. Second lien mortgage loans held by thirdparties are not reflected in the original LTV or mark-to-market LTV ratios in this table.
(2) Percentages calculated based on unpaid principal balance of loans at time of acquisition. Single-family business volume refers to bothsingle-family mortgage loans we purchase for our mortgage portfolio and single-family mortgage loans we securitize into Fannie MaeMBS.
(3) Percentages calculated based on unpaid principal balance of loans as of the end of each period.(4) Our single-family conventional guaranty book of business includes jumbo-conforming and high-balance loans that represented
approximately 3.9% of our single-family conventional guaranty book of business as of December 31, 2010 and 2.4% as ofDecember 31, 2009. See “Business—Our Charter and Regulation of Our Activities—Charter Act-Loan Standards” for additionalinformation on loan limits.
(5) The original LTV ratio generally is based on the original unpaid principal balance of the loan divided by the appraised property valuereported to us at the time of acquisition of the loan. Excludes loans for which this information is not readily available.
(6) We purchase loans with original LTV ratios above 80% to fulfill our mission to serve the primary mortgage market and provideliquidity to the housing system. Except as permitted under Refi Plus, our charter generally requires primary mortgage insurance orother credit enhancement for loans that we acquire that have a LTV ratio over 80%.
(7) The aggregate estimated mark-to-market LTV ratio is based on the unpaid principal balance of the loan as of the end of each reportedperiod divided by the estimated current value of the property, which we calculate using an internal valuation model that estimatesperiodic changes in home value. Excludes loans for which this information is not readily available.
(8) Long-term fixed-rate consists of mortgage loans with maturities greater than 15 years, while intermediate-term fixed-rate hasmaturities equal to or less than 15 years. Loans with interest-only terms are included in the interest-only category regardless of theirmaturities.
(9) Midwest consists of IL, IN, IA, MI, MN, NE, ND, OH, SD and WI. Northeast includes CT, DE, ME, MA, NH, NJ, NY, PA, PR, RI,VT and VI. Southeast consists of AL, DC, FL, GA, KY, MD, MS, NC, SC, TN, VA and WV. Southwest consists of AZ, AR, CO, KS,LA, MO, NM, OK, TX and UT. West consists of AK, CA, GU, HI, ID, MT, NV, OR, WA and WY.
Credit Profile Summary
In 2009, we began to see the positive effects of actions we took, beginning in 2008, to significantly restrictour underwriting and eligibility standards and change our pricing to promote sustainable homeownership andstability in the housing market. As a result of these changes and other market conditions, we reduced ouracquisition of loans with higher-risk loan attributes. The single-family loans we purchased or guaranteed in2010 have had a strong credit profile with a weighted average original LTV ratio of 68%, a weighted averageFICO credit score of 762, and a product mix with a significant percentage of fully amortizing fixed-ratemortgage loans. Due to the relatively high volume of Refi Plus loans (including HARP), the LTV ratios atorigination for our 2010 acquisitions to date are higher than for our 2009 acquisitions.
Improvements in the credit profile of our acquisitions since January 1, 2009 reflect changes we made in ourpricing and eligibility standards, as well as changes our mortgage insurers made in their eligibility standards.Whether our acquisitions in 2011 will exhibit the same credit profile as our recent acquisitions depends onmany factors, including our future pricing and eligibility standards, our future objectives, mortgage insurers’eligibility standards, our future volume of Refi Plus acquisitions, which typically include higher LTV ratiosand lower FICO credit scores, and future market conditions. In addition, FHA’s role as the lower-cost optionfor some consumers, or in some cases the only option, for loans with higher LTV ratios further reduced ouracquisition of these types of loans. However, in October 2010, changes to FHA’s pricing structure becameeffective, which may reduce its cost advantage to some consumers. We expect the ultimate performance of allour loans will be affected by macroeconomic trends, including unemployment, the economy, and home prices.
The credit profile of our acquisitions in 2010 was further influenced by a significant percentage of ouracquisitions representing refinanced loans, which generally have a strong credit profile because refinancingindicates the borrower’s ability to make their mortgage payment and desire to maintain homeownership.Refinancings represented 78% of our single-family acquisitions in 2010. While refinanced loans havehistorically tended to perform better than loans used for initial home purchase, Refi Plus loans may notultimately perform as strongly as traditional refinanced loans because these loans, which relate to non-delinquent Fannie Mae mortgages that were refinanced, may have original LTV ratios as high as 125% andlower FICO credit scores than traditional refinanced loans. Our regulator granted our request for an extensionof these flexibilities for loans originated through June 2011. Approximately 10% of our single-family
157

conventional business volume for 2009 consisted of loans with a LTV ratio higher than 80% at the time ofpurchase. For the year ended December 31, 2010, these loans accounted for 16% of our single-family businessvolume.
The prolonged and severe decline in home prices has resulted in the overall estimated weighted averagemark-to-market LTV ratio of our single-family conventional guaranty book of business to remain high at 77%as of December 31, 2010, and 75% as of 2009. The portion of our single-family conventional guaranty bookof business with an estimated mark-to-market LTV ratio greater than 100% was 16% as of December 31,2010, and 14% as of December 31, 2009. If home prices decline further, more loans may have mark-to-marketLTV ratios greater than 100%, which increases the risk of delinquency and default.
Our exposure, as discussed in this paragraph, to Alt-A and subprime loans included in our single-familyconventional guaranty book of business does not include (1) our investments in private-label mortgage-relatedsecurities backed by Alt-A and subprime loans or (2) resecuritizations, or wraps, of private-label mortgage-related securities backed by Alt-A mortgage loans that we have guaranteed. See “Consolidated Balance SheetAnalysis—Investments in Mortgage-Related Securities—Investments in Private-Label Mortgage-RelatedSecurities” for a discussion of our exposure to private-label mortgage-related securities backed by Alt-A andsubprime loans. As a result of our decision to discontinue the purchase of newly originated Alt-A loans,except for those that represent the refinancing of an existing Fannie Mae Alt-A loan, we expect ouracquisitions of Alt-A mortgage loans to continue to be minimal in future periods and the percentage of thebook of business attributable to Alt-A to decrease over time. We are also not currently acquiring newlyoriginated subprime loans. We have classified a mortgage loan as Alt-A if the lender that delivered the loan tous classified the loan as Alt-A based on documentation or other features. We have classified a mortgage loanas subprime if the loan was originated by a lender specializing in subprime business or by a subprime divisionof a large lender. We exclude from the subprime classification loans originated by these lenders if we acquiredthe loans in accordance with our standard underwriting criteria, which typically require compliance by theseller with our Selling Guide (including standard representations and warranties) and/or evaluation of the loansthrough our Desktop Underwriter system. We apply our classification criteria in order to determine our Alt-Aand subprime loan exposures; however, we have other loans with some features that are similar to Alt-A andsubprime loans that we have not classified as Alt-A or subprime because they do not meet our classificationcriteria. The unpaid principal balance of Alt-A and subprime loans included in our single-family conventionalguaranty book of business of $218.3 billion as of December 31, 2010, represented approximately 7.8% of oursingle-family conventional guaranty book of business. See “Note 18, Concentration of Credit Risk” foradditional information on our total exposure to Alt-A and subprime loans and mortgage-related securities and“Table 40: Risk Characteristics of Single-Family Conventional Business Volume and Guaranty Book ofBusiness” for information on our single-family book of business.
We also provide information on our jumbo-conforming, high-balance loans and reverse mortgages. Theoutstanding unpaid principal balance of our jumbo-conforming and high-balance loans was $109.7 billion, or3.9% of our single-family conventional guaranty book of business, as of December 31, 2010 and $66.6 billion,or 2.4% of our single-family conventional guaranty book of business, as of December 31, 2009. Jumbo-conforming and high-balance loans refer to high-balance loans we acquired pursuant to the EconomicStimulus Act of 2008, the 2008 Reform Act and the American Recovery and Reinvestment Act of 2009,which increased our conforming loan limits in certain high-cost areas above our standard conforming loanlimit. The standard conforming loan limit for a one-unit property was $417,000 in 2010 and 2009. See“Business—Our Charter and Regulation of Our Activities—Charter Act—Loan Standards” for additionalinformation on our loan limits.
The outstanding unpaid principal balance of reverse mortgage whole loans included in our mortgage portfoliowas $50.8 billion as of December 31, 2010 and $50.2 billion as of December 31, 2009. The majority of theseloans are home equity conversion mortgages insured by the federal government through the FHA. Becausehome equity conversion mortgages are insured by the federal government, we believe that we have limitedexposure to losses on these loans. Our market share of new reverse mortgage acquisitions was 2% in 2010 and50% in 2009. The decrease in our market share was a result of changes in our pricing strategy and market
158

conditions. In December 2010 we communicated to our lenders that we are exiting the reverse mortgagebusiness and will no longer acquire newly originated home equity conversion mortgages.
Problem Loan Management
Our problem loan management strategies are primarily focused on reducing defaults to avoid losses that wouldotherwise occur and pursuing foreclosure alternatives to reduce the severity of the losses we incur. If aborrower does not make required payments, we work with the servicers of our loans to offer workout solutionsto minimize the likelihood of foreclosure as well as the severity of loss. We refer to actions taken by servicerswith borrowers to resolve the problem of existing or potential delinquent loan payments as “workouts.” Ourloan workouts reflect our various types of home retention strategies and foreclosure alternatives.
Our home retention solutions are intended to help borrowers stay in their homes and include loanmodifications, repayment plans and forbearances. Because we believe that reducing delays and implementingsolutions that can be executed in a timely manner and early in the delinquency increases the likelihood thatour problem loan management strategies will be successful in avoiding a default or minimizing severity, it isimportant for our servicers to work with borrowers to complete these solutions as early in their delinquency asfeasible. If the servicer cannot provide a viable home retention solution for a problem loan, the servicer willseek to offer foreclosure alternatives, primarily preforeclosure sales and deeds-in-lieu of foreclosure. Thesealternatives reduce the severity of our loss resulting from a borrower’s default while permitting the borrower toavoid going through a foreclosure. However, the existence of a second lien may limit our ability to provideborrowers with loan workout options, including those that are part of our foreclosure prevention efforts. Weoccasionally execute third-party sales, where we sell the property to a third party immediately prior to enteringthe foreclosure process. When appropriate, we seek to move to foreclosure expeditiously.
Our mortgage servicers are the primary point of contact for borrowers and perform a vital role in our efforts toreduce defaults and pursue foreclosure alternatives. We seek to improve the servicing of our delinquent loansthrough a variety of means, including improving our communications with and training of our servicers,increasing the number of our personnel who manage our servicers, directing servicers to contact borrowers atan earlier stage of delinquency and improve their telephone communications with borrowers, and holding ourservicers accountable for following our requirements. We continue to work with some of our servicers to testand implement “high-touch” servicing protocols designed for managing higher-risk loans, which include lowerratios of loans per servicer employee, beginning borrower outreach strategies earlier in the delinquency cycleand establishing a single point of resolution for distressed borrowers. Additionally, partnering with ourservicers, civic and community leaders and housing industry partners, we have launched a series of nationwideMortgage Help Centers that will accelerate the response time for struggling borrowers with loans owned by us.During 2010, we established six Mortgage Help Centers and completed approximately 900 home retentionplans that kept borrowers in their homes. We plan to open additional Mortgage Help Centers in 2011.
In the following section, we present statistics on our problem loans, describe specific efforts undertaken tomanage these loans and prevent foreclosures and provide metrics regarding the performance of our loanworkout activities. We generally define single-family problem loans as loans that have been identified as beingat imminent risk of payment default; early stage delinquent loans that are either 30 days or 60 days past due;and seriously delinquent loans, which are loans that are three or more monthly payments past due or in theforeclosure process. Unless otherwise noted, single-family delinquency data is calculated based on number ofloans. We include single-family conventional loans that we own and that back Fannie Mae MBS in thecalculation of the single-family delinquency rate. Percentage of book outstanding calculations are based on theunpaid principal balance of loans for each category divided by the unpaid principal balance of our total single-family guaranty book of business for which we have detailed loan-level information.
159

Problem Loan Statistics
The following table displays the delinquency status of loans in our single-family conventional guaranty bookof business (based on number of loans) as of the periods indicated.
Table 41: Delinquency Status of Single-Family Conventional Loans
2010 2009 2008As of December 31,
As of period end:
Delinquency status:
30 to 59 days delinquent . . . . . . . . . . . . . . . . . . . . . . . . . . . . . . . . . . . . . . . . . . . . . . . . . 2.32% 2.46% 2.52%
60 to 89 days delinquent . . . . . . . . . . . . . . . . . . . . . . . . . . . . . . . . . . . . . . . . . . . . . . . . . 0.87 1.07 1.00
Seriously delinquent . . . . . . . . . . . . . . . . . . . . . . . . . . . . . . . . . . . . . . . . . . . . . . . . . . . . 4.48 5.38 2.42
Percentage of seriously delinquent loans that have been delinquent for more than180 days . . . . . . . . . . . . . . . . . . . . . . . . . . . . . . . . . . . . . . . . . . . . . . . . . . . . . . . . . 67.30% 57.22% 40.00%
Early Stage Delinquency
The prolonged and severe decline in home prices, coupled with continued high unemployment, caused anoverall increase in the number of early stage delinquencies—loans that are less than three monthly paymentspast due—over the past several years. The number of early stage delinquencies has decreased as ofDecember 31, 2010 compared with 2009; however, the potential number of loans at imminent risk of paymentdefault remains elevated.
Serious Delinquency
The potential number of loans at risk of becoming seriously delinquent has diminished in 2010. As ofDecember 31, 2010, the percentage and number of our single-family conventional loans that were seriouslydelinquent decreased, as compared to December 31, 2009 and has decreased every month since February2010. The decrease in our serious delinquency rate in 2010 is primarily the result of:
• Home retention workouts and foreclosure alternatives we completed.
• Higher volume of foreclosures during 2010.
• Higher percentage of our single-family guaranty book of business from 2009 and later vintages, whichhave strong credit characteristics.
We expect serious delinquency rates will continue to be affected in the future by home price changes, changesin other macroeconomic conditions, and the extent to which borrowers with modified loans again becomedelinquent in their payments.
We continue to work with our servicers to reduce delays in determining and executing the appropriate workoutsolution. However, the continued negative trends in the current economic environment, such as the sustainedweakness in the housing market and high unemployment, have continued to adversely affect the seriousdelinquency rates across our single-family conventional guaranty book of business and the serious delinquencyrate remains elevated. Additionally, the period of time that loans are seriously delinquent continues to remainextended as the factors present during 2009 were relatively unchanged during 2010. During 2009, the numberof loans that transitioned to seriously delinquent and the aging of our seriously delinquent loans increasedsubstantially from 2008 due to the following factors:
• Declines in home prices lengthen the period of time that loans are seriously delinquent because adelinquent borrower may not have sufficient equity in the home to refinance or sell the property andrecover enough proceeds to pay off the loan and avoid foreclosure.
• High levels of unemployment are hampering the ability of many delinquent borrowers to curedelinquencies and return their loans to current status.
160
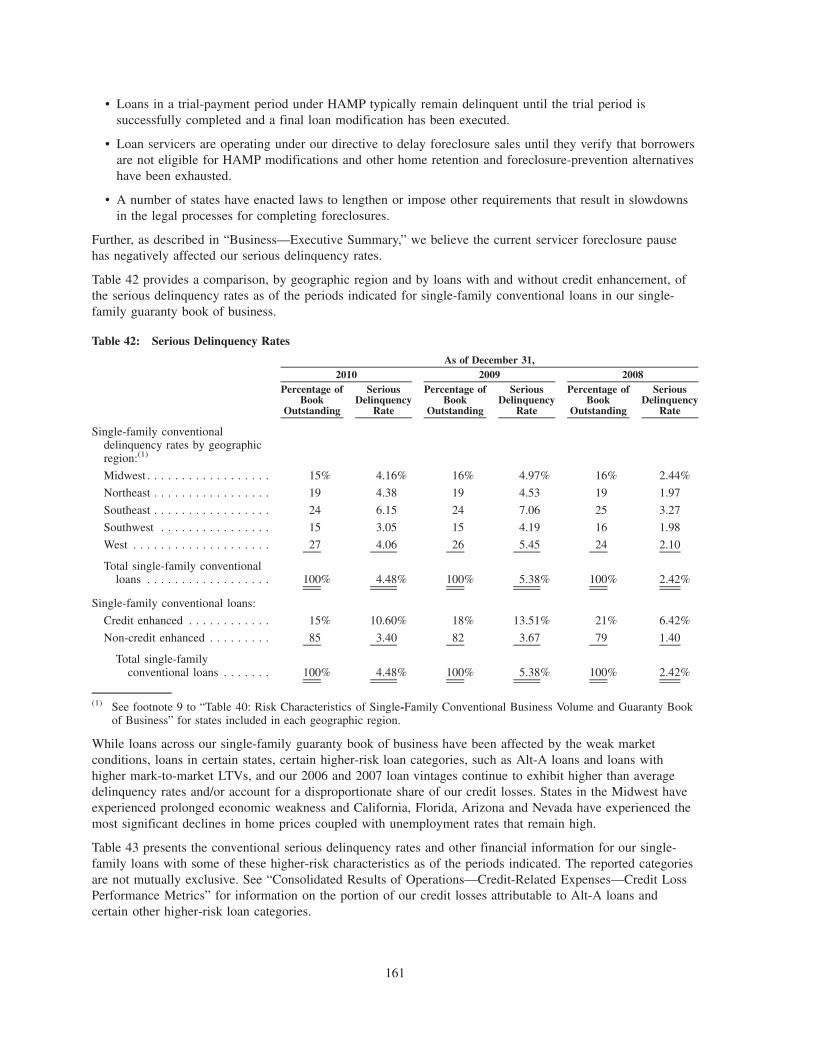
• Loans in a trial-payment period under HAMP typically remain delinquent until the trial period issuccessfully completed and a final loan modification has been executed.
• Loan servicers are operating under our directive to delay foreclosure sales until they verify that borrowersare not eligible for HAMP modifications and other home retention and foreclosure-prevention alternativeshave been exhausted.
• A number of states have enacted laws to lengthen or impose other requirements that result in slowdownsin the legal processes for completing foreclosures.
Further, as described in “Business—Executive Summary,” we believe the current servicer foreclosure pausehas negatively affected our serious delinquency rates.
Table 42 provides a comparison, by geographic region and by loans with and without credit enhancement, ofthe serious delinquency rates as of the periods indicated for single-family conventional loans in our single-family guaranty book of business.
Table 42: Serious Delinquency Rates
Percentage ofBook
Outstanding
SeriousDelinquency
Rate
Percentage ofBook
Outstanding
SeriousDelinquency
Rate
Percentage ofBook
Outstanding
SeriousDelinquency
Rate
2010 2009 2008As of December 31,
Single-family conventionaldelinquency rates by geographicregion:(1)
Midwest . . . . . . . . . . . . . . . . . . 15% 4.16% 16% 4.97% 16% 2.44%
Northeast . . . . . . . . . . . . . . . . . 19 4.38 19 4.53 19 1.97
Southeast . . . . . . . . . . . . . . . . . 24 6.15 24 7.06 25 3.27
Southwest . . . . . . . . . . . . . . . . 15 3.05 15 4.19 16 1.98
West . . . . . . . . . . . . . . . . . . . . 27 4.06 26 5.45 24 2.10
Total single-family conventionalloans . . . . . . . . . . . . . . . . . . 100% 4.48% 100% 5.38% 100% 2.42%
Single-family conventional loans:
Credit enhanced . . . . . . . . . . . . 15% 10.60% 18% 13.51% 21% 6.42%
Non-credit enhanced . . . . . . . . . 85 3.40 82 3.67 79 1.40
Total single-familyconventional loans . . . . . . . 100% 4.48% 100% 5.38% 100% 2.42%
(1) See footnote 9 to “Table 40: Risk Characteristics of Single-Family Conventional Business Volume and Guaranty Bookof Business” for states included in each geographic region.
While loans across our single-family guaranty book of business have been affected by the weak marketconditions, loans in certain states, certain higher-risk loan categories, such as Alt-A loans and loans withhigher mark-to-market LTVs, and our 2006 and 2007 loan vintages continue to exhibit higher than averagedelinquency rates and/or account for a disproportionate share of our credit losses. States in the Midwest haveexperienced prolonged economic weakness and California, Florida, Arizona and Nevada have experienced themost significant declines in home prices coupled with unemployment rates that remain high.
Table 43 presents the conventional serious delinquency rates and other financial information for our single-family loans with some of these higher-risk characteristics as of the periods indicated. The reported categoriesare not mutually exclusive. See “Consolidated Results of Operations—Credit-Related Expenses—Credit LossPerformance Metrics” for information on the portion of our credit losses attributable to Alt-A loans andcertain other higher-risk loan categories.
161
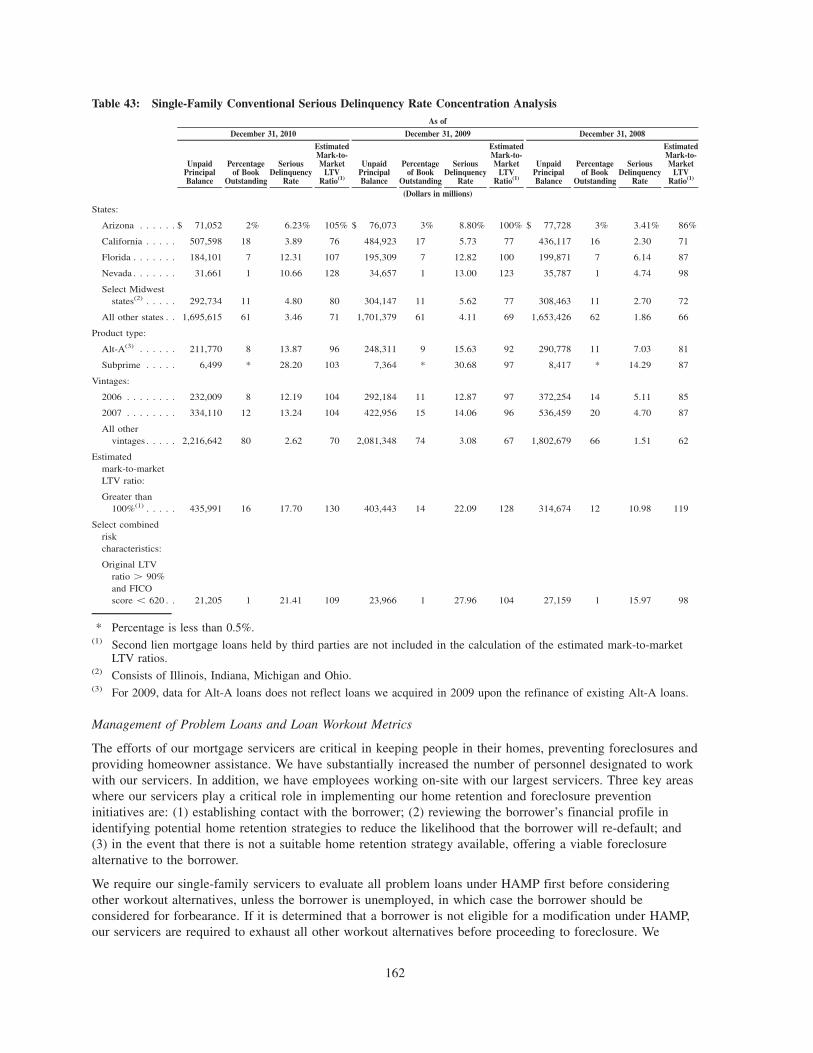
Table 43: Single-Family Conventional Serious Delinquency Rate Concentration Analysis
UnpaidPrincipalBalance
Percentageof Book
Outstanding
SeriousDelinquency
Rate
EstimatedMark-to-Market
LTVRatio(1)
UnpaidPrincipalBalance
Percentageof Book
Outstanding
SeriousDelinquency
Rate
EstimatedMark-to-Market
LTVRatio(1)
UnpaidPrincipalBalance
Percentageof Book
Outstanding
SeriousDelinquency
Rate
EstimatedMark-to-Market
LTVRatio(1)
December 31, 2010 December 31, 2009 December 31, 2008
As of
(Dollars in millions)
States:
Arizona . . . . . . $ 71,052 2% 6.23% 105% $ 76,073 3% 8.80% 100% $ 77,728 3% 3.41% 86%
California . . . . . 507,598 18 3.89 76 484,923 17 5.73 77 436,117 16 2.30 71
Florida . . . . . . . 184,101 7 12.31 107 195,309 7 12.82 100 199,871 7 6.14 87
Nevada . . . . . . . 31,661 1 10.66 128 34,657 1 13.00 123 35,787 1 4.74 98
Select Midweststates(2) . . . . . 292,734 11 4.80 80 304,147 11 5.62 77 308,463 11 2.70 72
All other states . . 1,695,615 61 3.46 71 1,701,379 61 4.11 69 1,653,426 62 1.86 66
Product type:
Alt-A(3) . . . . . . 211,770 8 13.87 96 248,311 9 15.63 92 290,778 11 7.03 81
Subprime . . . . . 6,499 * 28.20 103 7,364 * 30.68 97 8,417 * 14.29 87
Vintages:
2006 . . . . . . . . 232,009 8 12.19 104 292,184 11 12.87 97 372,254 14 5.11 85
2007 . . . . . . . . 334,110 12 13.24 104 422,956 15 14.06 96 536,459 20 4.70 87
All othervintages . . . . . 2,216,642 80 2.62 70 2,081,348 74 3.08 67 1,802,679 66 1.51 62
Estimatedmark-to-marketLTV ratio:
Greater than100%(1) . . . . . 435,991 16 17.70 130 403,443 14 22.09 128 314,674 12 10.98 119
Select combinedriskcharacteristics:
Original LTVratio H 90%and FICOscore G 620 . . 21,205 1 21.41 109 23,966 1 27.96 104 27,159 1 15.97 98
* Percentage is less than 0.5%.(1) Second lien mortgage loans held by third parties are not included in the calculation of the estimated mark-to-market
LTV ratios.(2) Consists of Illinois, Indiana, Michigan and Ohio.(3) For 2009, data for Alt-A loans does not reflect loans we acquired in 2009 upon the refinance of existing Alt-A loans.
Management of Problem Loans and Loan Workout Metrics
The efforts of our mortgage servicers are critical in keeping people in their homes, preventing foreclosures andproviding homeowner assistance. We have substantially increased the number of personnel designated to workwith our servicers. In addition, we have employees working on-site with our largest servicers. Three key areaswhere our servicers play a critical role in implementing our home retention and foreclosure preventioninitiatives are: (1) establishing contact with the borrower; (2) reviewing the borrower’s financial profile inidentifying potential home retention strategies to reduce the likelihood that the borrower will re-default; and(3) in the event that there is not a suitable home retention strategy available, offering a viable foreclosurealternative to the borrower.
We require our single-family servicers to evaluate all problem loans under HAMP first before consideringother workout alternatives, unless the borrower is unemployed, in which case the borrower should beconsidered for forbearance. If it is determined that a borrower is not eligible for a modification under HAMP,our servicers are required to exhaust all other workout alternatives before proceeding to foreclosure. We
162

continue to work with our servicers to implement our foreclosure prevention initiatives effectively and to findways to enhance our workout protocols and their workflow processes.
Loan modifications involve changes to the original mortgage terms such as product type, interest rate,amortization term, maturity date and/or unpaid principal balance. Modifications include TDRs, which is theonly form of modification in which we do not expect to collect the full original contractual principal andinterest due under the loan. Other resolutions and modifications may result in our receiving the full amountdue, or certain installments due, under the loan over a period of time that is longer than the period of timeoriginally provided for under the terms of the loan.
During 2009 and 2010, we experienced a significant shift in our approach to workouts to address theincreasing number of borrowers facing long-term, rather than short-term, financial hardships. While it hasalways been our objective to help borrowers retain their homes, prior to 2009, our workout solutions focusedon borrowers after the hardship that caused them to be delinquent on their mortgage obligation had beenresolved. These solutions included (1) loan modifications that capitalized the delinquent principal and interestpayments and/or extended the term of the loan, or (2) a personal loan, called a HomeSaver Advance, used tocover the delinquent principal and interest. When a home retention solution was not available, the borrowerwould sell the property as a means of paying off the entire mortgage obligation as the value of the propertywas generally in excess of their mortgage obligation.
During 2009 and 2010, the prolonged economic stress and high levels of unemployment hindered the effortsof many delinquent borrowers to bring their loans current. Accordingly, borrowers have become increasinglyin need of a workout solution prior to the resolution of the hardships that are causing their mortgagedelinquency. As a result, we completed more loan modifications during 2010 that are concentrated onlowering or deferring the borrowers’ monthly mortgage payments for a predetermined period of time to allowborrowers to work through their hardships. The vast majority of our loan modifications during 2010 and 2009were designed to help distressed borrowers by reducing the borrower’s monthly principal and interest paymentthrough an extension of the loan term, a reduction in the interest rate, or a combination of both.
In March 2009, we implemented HAMP, a modification initiative under the Making Home AffordableProgram. Intended to be uniform across servicers, HAMP is aimed at helping borrowers whose loan is eithercurrently delinquent or is at imminent risk of default. HAMP modifications can include reduced interest rates,term extensions, and/or principal forbearance to bring the monthly payment down to 31% of the borrower’sgross (pre-tax) income. We require that servicers first evaluate borrowers for eligibility under HAMP beforeconsidering other workout options or foreclosure. By design, not all borrowers facing foreclosure will beeligible for a HAMP modification. As a result, we are working with servicers to ensure that borrowers who donot qualify for HAMP or who fail to successfully complete the HAMP required trial period are provided withalternative home retention options or a foreclosure avoidance alternative.
In addition, there has been greater focus on alternatives to foreclosure for borrowers who are unable to retaintheir homes. Foreclosure alternatives may be more appropriate if the borrower has experienced a significantadverse change in financial condition due to events such as unemployment or reduced income, divorce, orunexpected issues like medical bills and is therefore no longer able to make the required mortgage payments.Since the cost of foreclosure can be significant to both the borrower and Fannie Mae, to avoid foreclosure andsatisfy the first lien mortgage obligation, our servicers work with a borrower to sell their home prior toforeclosure in a preforeclosure sale or accept the deed-in-lieu of foreclosure whereby the borrower voluntarilysigns over the title to their property to the servicer. These alternatives are designed to reduce our credit losseswhile helping borrowers avoid the pressure and stigma associated with a foreclosure.
Table 44 provides statistics on our single-family loan workouts that were completed, by type, for the periodsindicated. These statistics include loan modifications but do not include trial modifications under HAMP orrepayment and forbearance plans that have been initiated but not completed.
163

Table 44: Statistics on Single-Family Loan Workouts
UnpaidPrincipalBalance
Numberof Loans
UnpaidPrincipalBalance
Numberof Loans
UnpaidPrincipalBalance
Numberof Loans
2010 2009 2008For the Year Ended
(Dollars in millions)
Home retention strategies:
Modifications . . . . . . . . . . . . . . . . . . . . . . . . . $ 82,826 403,506 $18,702 98,575 $ 5,119 33,388
Repayment plans and forbearances completed(1) . . 4,385 31,579 2,930 22,948 936 7,892
HomeSaver Advance first-lien loans. . . . . . . . . . 688 5,191 6,057 39,199 11,196 70,967
$ 87,899 440,276 $27,689 160,722 $17,251 112,247
Foreclosure alternatives:
Preforeclosure sales . . . . . . . . . . . . . . . . . . . . . $ 15,899 69,634 $ 8,457 36,968 $ 2,212 10,355
Deeds-in-lieu of foreclosure . . . . . . . . . . . . . . . 1,053 5,757 491 2,649 252 1,341
$ 16,952 75,391 $ 8,948 39,617 $ 2,464 11,696
Total loan workouts . . . . . . . . . . . . . . . . . . . . . . . $104,851 515,667 $36,637 200,339 $19,715 123,943
Loan workouts as a percentage of single-familyguaranty book of business(2) . . . . . . . . . . . . . . . 3.66% 2.87% 1.26% 1.10% 0.70% 0.68%
(1) For the years ended December 31, 2010 and 2009, repayment plans reflected those plans associated with loans thatwere 60 days or more delinquent. For the year ended December 31, 2008, repayment plans reflected those plansassociated with loans that were 90 days or more delinquent. If we had included repayment plans associated with loansthat were 60 days or more delinquent for the year ended December 31, 2008, the unpaid principal balance that hadrepayment plans and forbearances completed would have been $2.8 billion and the number of loans that hadrepayment plans and forbearances completed would have been 22,337.
(2) Represents total loan workouts during the period as a percentage of our single-family guaranty book of business as ofthe end of each year.
We increased the volume of workouts during 2010 compared with 2009, through our home retention andforeclosure prevention efforts. Loan modification volume was more than four times larger in 2010 than in2009, as the number of borrowers who were experiencing financial difficulty increased and a significantnumber of HAMP trial modifications were completed and became permanent HAMP modifications.HomeSaver Advance workout volume substantially declined and this workout option was ultimately retired in2010. HomeSaver Advances were only used in limited circumstances as a result of more borrowers facingpermanent, instead of short-term, hardships as well as our requirement that all potential loan workouts first beevaluated under HAMP before being considered for other alternatives. We also agreed to an increasing numberof preforeclosure sales and accepted a higher number of deeds-in-lieu of foreclosure during 2010 as these arefavorable solutions for a growing number of borrowers. The volume of our foreclosure alternatives remainedhigh throughout 2010.
Because we did not begin implementing HAMP until March 2009, the vast majority of loan modificationsperformed during 2009 were not made under HAMP; during 2010, slightly less than half of our loanmodifications were completed under HAMP. During 2010, we initiated approximately 163,000 trialmodifications under HAMP, along with other types of loan modifications, repayment plans and forbearancecompared with 333,000 during 2009. It is difficult to predict how many of these trial modifications andinitiated plans will be completed. During 2009, there were only a limited number of permanent HAMPmodifications because the program entails at least a three month trial period. During this trial period, the loanservicer evaluates the borrower’s ability to make the required modified loan payment and collects all requireddocumentation before making the modification effective. The inability to obtain proper documentation fromborrowers who had entered into a trial modification was a significant factor in the low number ofmodifications that became permanent under HAMP in 2009. In a February 2010 announcement, as directed byTreasury, servicers are required to conduct a full verification of a borrower’s eligibility prior to offering a
164

HAMP trial period plan. This is effective for all HAMP trial period plans with effective dates on or afterJune 1, 2010.
We remain focused on our goals to minimize our credit losses and continue to look for additional solutions tohelp borrowers stay in their homes and avoid foreclosure. However, in those instances where borrowers areunable to stay in their homes, we expect to increase the use of foreclosure alternatives. Also during 2010, webegan offering an Alternative ModificationTM option for Fannie Mae borrowers who were believed to beeligible for and accepted a HAMP trial modification plan, made their required payments during their trialperiod, but were subsequently denied a permanent modification because they were unable to demonstratecompliance with the eligibility requirements for a permanent modification under HAMP. In many cases, theseborrowers initially qualified for a HAMP trial modification based on verbal information and, upon verificationof their income, it was discovered that their income was either too high or too low relative to their monthlymortgage payment for them to meet the program’s requirements. Alternative Modifications are available onlyfor borrowers who were in a HAMP trial modification that was initiated by March 1, 2010. AlternativeModifications were not available after August 31, 2010.
Table 45 displays the profile of loan modifications (HAMP and non-HAMP) provided to borrowers during2010, 2009 and 2008.
Table 45: Loan Modification Profile
2010 2009 2008
Term extension, interest rate reduction, or combination of both(1) . . . . . . . . . . . . . . . . . . . . . . . . . 93% 93% 57%
Initial reduction in monthly payment(2). . . . . . . . . . . . . . . . . . . . . . . . . . . . . . . . . . . . . . . . . . . . 91 87 38
Estimated mark-to-market LTV ratio H 100% . . . . . . . . . . . . . . . . . . . . . . . . . . . . . . . . . . . . . . 53 47 22
Troubled debt restructurings . . . . . . . . . . . . . . . . . . . . . . . . . . . . . . . . . . . . . . . . . . . . . . . . . . . 94 92 60
(1) Reported statistics for term extension, interest rate reduction or the combination include subprime adjustable-ratemortgage loans that have been modified to a fixed-rate loan.
(2) These modification statistics do not include subprime adjustable-rate mortgage loans that were modified to a fixed-rateloan and were current at the time of the modification.
A significant portion of our modifications pertain to loans with a mark-to-market LTV ratio greater than 100%because these borrowers are typically unable to refinance their mortgages or sell their homes for a price thatallows them to pay off their mortgage obligation as their mortgages are greater than the value of their homes.Additionally, the serious delinquency rate for these loans tends to be significantly higher than the overallaverage serious delinquency rate. As of December 31, 2010, the serious delinquency rate for loans with amark-to-market LTV ratio greater than 100% was 18%, compared with our overall average single-familyserious delinquency rate of 4.48%.
Approximately 50% of loans modified during 2009 were current or had paid off as of one year following loanmodification date. In comparison, 36% of loans modified during 2008 were current or had paid off as of oneyear following the loan modification date. There is significant uncertainty regarding the ultimate long termsuccess of our current modification efforts because of the economic and financial pressures on borrowers.Modifications, even those with reduced monthly payments, may also not be sufficient to help borrowers withsecond liens and other significant non-mortgage debt obligations. FHFA, other agencies of theU.S. government or Congress may ask us to undertake new initiatives to support the housing and mortgagemarkets should our current modification efforts ultimately not perform in a manner that results in thestabilization of these markets.
As we have focused our efforts on distressed borrowers who are experiencing current economic hardship, theshort-term performance of our workouts may not be indicative of long-term performance. We believe theperformance of our workouts will be highly dependent on economic factors, such as unemployment rates,household wealth and home prices.
165

REO Management
Foreclosure and REO activity affect the level of credit losses. Table 46 compares our foreclosure activity, byregion, for the periods indicated. Regional REO acquisition and charge-off trends generally follow a patternthat is similar to, but lags, that of regional delinquency trends.
Table 46: Single-Family Foreclosed Properties
2010 2009 2008For the Year Ended December 31,
Single-family foreclosed properties (number of properties):
Beginning of period inventory of single-family foreclosed properties (REO)(1). . . . 86,155 63,538 33,729
Acquisitions by geographic area:(2)
Midwest . . . . . . . . . . . . . . . . . . . . . . . . . . . . . . . . . . . . . . . . . . . . . . . . . 57,761 36,072 30,026
Northeast . . . . . . . . . . . . . . . . . . . . . . . . . . . . . . . . . . . . . . . . . . . . . . . . 14,049 7,934 5,984
Southeast . . . . . . . . . . . . . . . . . . . . . . . . . . . . . . . . . . . . . . . . . . . . . . . . 79,453 39,302 24,925
Southwest. . . . . . . . . . . . . . . . . . . . . . . . . . . . . . . . . . . . . . . . . . . . . . . . 55,276 31,197 18,340
West . . . . . . . . . . . . . . . . . . . . . . . . . . . . . . . . . . . . . . . . . . . . . . . . . . . 55,539 31,112 15,377
Total properties acquired through foreclosure . . . . . . . . . . . . . . . . . . . . . . . . . 262,078 145,617 94,652
Dispositions of REO . . . . . . . . . . . . . . . . . . . . . . . . . . . . . . . . . . . . . . . . . . (185,744) (123,000) (64,843)
End of period inventory of single-family foreclosed properties (REO)(1) . . . . . . . . 162,489 86,155 63,538
Carrying value of single-family foreclosed properties (dollars in millions)(3) . . . . . $ 14,955 $ 8,466 $ 6,531
Single-family foreclosure rate(4) . . . . . . . . . . . . . . . . . . . . . . . . . . . . . . . . . . . . 1.46% 0.80% 0.52%
(1) Includes acquisitions through deeds-in-lieu of foreclosure.(2) See footnote 9 to “Table 40: Risk Characteristics of Single-Family Conventional Business Volume and Guaranty Book
of Business” for states included in each geographic region.(3) Excludes foreclosed property claims receivables, which are reported in our consolidated balance sheets as a component
of “Acquired property, net.”(4) Estimated based on the total number of properties acquired through foreclosure as a percentage of the total number of
loans in our single-family conventional guaranty book of business as of the end of each respective period.
The continued weak economy, as well as high unemployment rates, continues to result in an increase in thepercentage of our mortgage loans that transition from delinquent to REO status, either through foreclosure ordeed-in-lieu of foreclosure. Additionally, the prolonged decline in home prices on a national basis hassignificantly reduced the values of our single-family REO. Despite the increase in our foreclosure rate during2010, foreclosure levels were lower than what they otherwise would have been due to our directive toservicers to delay foreclosure sales until the loan servicer verifies that the borrower is ineligible for a HAMPmodification and that all other home retention and foreclosure prevention alternatives have been exhausted andthe delay due to the foreclosure pause. Additionally, foreclosure levels during 2009 were affected by theforeclosure moratoria. To increase the effectiveness of our loss mitigation efforts, it is important that ourservicers work with delinquent borrowers early in the delinquency to determine whether a home retention orforeclosure alternative will be viable and, where no alternative is viable, to reduce delays in proceeding toforeclosure. Accordingly, we are working to manage our foreclosure timelines more efficiently.
Further, we have seen an increase in the percentage of our properties that we are unable to market for sale in2010 compared with 2009. The most common reasons for our inability to market properties for sale are:(1) properties are within the period during which state law allows the former mortgagor and second lienholders to redeem the property (states which allow this are known as “redemption states”); (2) properties arestill occupied by the person or personal property and the eviction process is not yet complete (“occupiedstatus”); or (3) properties are being repaired. As we are unable to market a higher portion of our inventory, itslows the pace at which we can dispose of our properties and increases our foreclosed property expenserelated to costs associated with ensuring that the property is vacant and maintaining the property. For example,
166
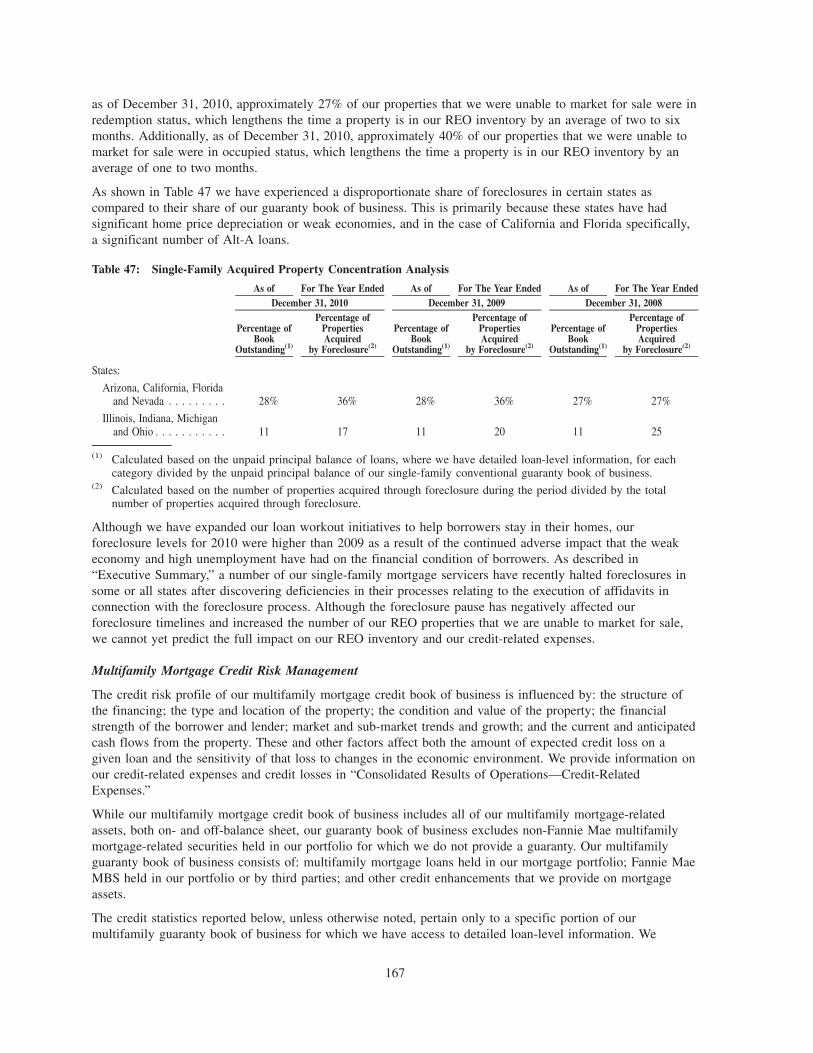
as of December 31, 2010, approximately 27% of our properties that we were unable to market for sale were inredemption status, which lengthens the time a property is in our REO inventory by an average of two to sixmonths. Additionally, as of December 31, 2010, approximately 40% of our properties that we were unable tomarket for sale were in occupied status, which lengthens the time a property is in our REO inventory by anaverage of one to two months.
As shown in Table 47 we have experienced a disproportionate share of foreclosures in certain states ascompared to their share of our guaranty book of business. This is primarily because these states have hadsignificant home price depreciation or weak economies, and in the case of California and Florida specifically,a significant number of Alt-A loans.
Table 47: Single-Family Acquired Property Concentration Analysis
Percentage ofBook
Outstanding(1)
Percentage ofPropertiesAcquired
by Foreclosure(2)
Percentage ofBook
Outstanding(1)
Percentage ofPropertiesAcquired
by Foreclosure(2)
Percentage ofBook
Outstanding(1)
Percentage ofPropertiesAcquired
by Foreclosure(2)
December 31, 2010 December 31, 2009 December 31, 2008As of For The Year Ended As of For The Year Ended As of For The Year Ended
States:
Arizona, California, Floridaand Nevada . . . . . . . . . 28% 36% 28% 36% 27% 27%
Illinois, Indiana, Michiganand Ohio . . . . . . . . . . . 11 17 11 20 11 25
(1) Calculated based on the unpaid principal balance of loans, where we have detailed loan-level information, for eachcategory divided by the unpaid principal balance of our single-family conventional guaranty book of business.
(2) Calculated based on the number of properties acquired through foreclosure during the period divided by the totalnumber of properties acquired through foreclosure.
Although we have expanded our loan workout initiatives to help borrowers stay in their homes, ourforeclosure levels for 2010 were higher than 2009 as a result of the continued adverse impact that the weakeconomy and high unemployment have had on the financial condition of borrowers. As described in“Executive Summary,” a number of our single-family mortgage servicers have recently halted foreclosures insome or all states after discovering deficiencies in their processes relating to the execution of affidavits inconnection with the foreclosure process. Although the foreclosure pause has negatively affected ourforeclosure timelines and increased the number of our REO properties that we are unable to market for sale,we cannot yet predict the full impact on our REO inventory and our credit-related expenses.
Multifamily Mortgage Credit Risk Management
The credit risk profile of our multifamily mortgage credit book of business is influenced by: the structure ofthe financing; the type and location of the property; the condition and value of the property; the financialstrength of the borrower and lender; market and sub-market trends and growth; and the current and anticipatedcash flows from the property. These and other factors affect both the amount of expected credit loss on agiven loan and the sensitivity of that loss to changes in the economic environment. We provide information onour credit-related expenses and credit losses in “Consolidated Results of Operations—Credit-RelatedExpenses.”
While our multifamily mortgage credit book of business includes all of our multifamily mortgage-relatedassets, both on- and off-balance sheet, our guaranty book of business excludes non-Fannie Mae multifamilymortgage-related securities held in our portfolio for which we do not provide a guaranty. Our multifamilyguaranty book of business consists of: multifamily mortgage loans held in our mortgage portfolio; Fannie MaeMBS held in our portfolio or by third parties; and other credit enhancements that we provide on mortgageassets.
The credit statistics reported below, unless otherwise noted, pertain only to a specific portion of ourmultifamily guaranty book of business for which we have access to detailed loan-level information. We
167

typically obtain this data from the sellers or servicers of the mortgage loans in our guaranty book of businessand receive representations and warranties from them as to the accuracy of the information. While we performvarious quality assurance checks by sampling loans to assess compliance with our underwriting and eligibilitycriteria, we do not independently verify all reported information. The portion of our multifamily guarantybook of business for which we have detailed loan level-information, excluding loans that have been defeased,constituted 99% of our total multifamily guaranty book as of both December 31, 2010 and 2009. See “RiskFactors” for a discussion of the risk due to our reliance on lender representations regarding the accuracy of thecharacteristics of loans in our guaranty book of business.
Multifamily Acquisition Policy and Underwriting Standards
Our Multifamily business, in conjunction with our Enterprise Risk Management division, is responsible forpricing and managing the credit risk on multifamily mortgage loans we purchase and on Fannie Mae MBSbacked by multifamily loans (whether held in our portfolio or held by third parties). Our primary multifamilydelivery channel is the DUS program, which is comprised of multiple lenders that span the spectrum fromlarge financial institutions to smaller independent multifamily lenders. Multifamily loans that we purchase orthat back Fannie Mae MBS are either underwritten by a Fannie Mae-approved lender or subject to ourunderwriting review prior to closing depending on the product type and/or loan size. Loans delivered to us byDUS lenders and their affiliates represented 84% of our multifamily guaranty book of business as ofDecember 31, 2010 compared with 81% as of December 31, 2009.
We use various types of credit enhancement arrangements for our multifamily loans, including lenderrisk-sharing, lender repurchase agreements, pool insurance, subordinated participations in mortgage loans orstructured pools, cash and letter of credit collateral agreements, and cross-collateralization/cross-defaultprovisions. The most prevalent form of credit enhancement on multifamily loans is lender risk-sharing.Lenders in the DUS program typically share in loan-level credit losses in one of two ways: (1) they bearlosses up to the first 5% of unpaid principal balance of the loan and share in remaining losses up to aprescribed limit; or (2) they share up to one-third of the credit losses on an equal basis with us. Other lenderstypically share or absorb credit losses based on a negotiated percentage of the loan or the pool balance.
Multifamily Portfolio Diversification and Monitoring
Diversification within our multifamily mortgage credit book of business by geographic concentration,term-to-maturity, interest rate structure, borrower concentration and credit enhancement arrangements is animportant factor that influences credit quality and performance and helps reduce our credit risk.
The weighted average original LTV ratio for our multifamily guaranty book of business was 67% as of eachof the three years ended December 31, 2010, 2009, and 2008. The percentage of our multifamily guarantybook of business with an original LTV ratio greater than 80% was 5% as of each of the three years endedDecember 31, 2010, 2009, and 2008. We present the current risk profile of our multifamily guaranty book ofbusiness in “Note 7, Financial Guarantees and Master Servicing.”
We monitor the performance and risk concentrations of our multifamily loans and the underlying properties onan ongoing basis throughout the life of the investment at the loan, property and portfolio level. We closelytrack the physical condition of the property, the relevant local market and economic conditions that may signalchanging risk or return profiles and other risk factors. For example, we closely monitor the rental paymenttrends and vacancy levels in local markets to identify loans that merit closer attention or loss mitigationactions. We are managing our exposure to refinancing risk for multifamily loans maturing in the next severalyears. We recently formed a team to proactively manage upcoming loan maturities and minimize losses onmaturing loans. This team assists lenders and borrowers with timely and appropriate refinancing of maturingloans with the goal of reducing defaults and foreclosures related to loans maturing in the near term. For ourinvestments in multifamily loans, the primary asset management responsibilities are performed by our DUSand other multifamily lenders. We periodically evaluate the performance of our third-party service providersfor compliance with our asset management criteria.
168

Problem Loan Management and Foreclosure Prevention
Unfavorable economic conditions have caused continued increases in our multifamily serious delinquency rateand the level of defaults. Since delinquency rates are a lagging indicator, even if the market shows someimprovement, we expect to incur additional credit losses. We periodically refine our underwriting standards inresponse to market conditions and enact proactive portfolio management and monitoring which are eachdesigned to keep credit losses to a low level relative to our multifamily guaranty book of business.
Problem Loan Statistics
Table 48 provides a comparison of our multifamily serious delinquency rates for loans with and without creditenhancement in our multifamily guaranty book of business. We classify multifamily loans as seriouslydelinquent when payment is 60 days or more past due. We include the unpaid principal balance of multifamilyloans that we own or that back Fannie Mae MBS and any housing bonds for which we provide creditenhancement in the calculation of the multifamily serious delinquency rate.
Table 48: Multifamily Serious Delinquency Rates
Percentage ofBook
Outstanding
SeriousDelinquency
Rate
Percentage ofBook
Outstanding
SeriousDelinquency
Rate
Percentage ofBook
Outstanding
SeriousDelinquency
Rate
2010 2009 2008As of December 31,
Multifamily loans:
Credit enhanced . . . . . . . . . . . . 89% 0.67% 89% 0.54% 86% 0.26%
Non-credit enhanced . . . . . . . . . 11 1.01 11 1.33 14 0.54
Total multifamily loans . . . . . 100% 0.71% 100% 0.63% 100% 0.30%
Table 49 provides a comparison of our multifamily serious delinquency rates for loans acquired through DUSlenders and loans acquired through non-DUS lenders.
Table 49: Multifamily Concentration Analysis
Percentage ofBook
Outstanding
SeriousDelinquency
Rate
Percentage ofBook
Outstanding
SeriousDelinquency
Rate
Percentage ofBook
Outstanding
SeriousDelinquency
Rate 2010 2009 2008
Percentage ofMultifamily
CreditLosses For the
Year EndedDecember 31,
2010 2009 2008As of December 31,
DUS small balance loans(1) . . . . . . . 8% 0.55% 7% 0.47% 7% 0.24% 7% 9% 15%
DUS non small balance loans(2) . . . . 70 0.56 69 0.38 66 0.24 61 77 66
Non-DUS small balance loans(1) . . . 10 1.47 11 1.16 13 0.52 10 11 10
Non-DUS non small balanceloans(2) . . . . . . . . . . . . . . . . . . 12 0.97 13 1.54 14 0.37 22 3 9
(1) Loans with unpaid principal balances less than or equal to $3 million except in high cost markets where they are loanswith unpaid principal balances less than or equal to $5 million.
(2) Loans with unpaid principal balances greater than $3 million except in high cost markets where they are loans withunpaid principal balances greater than $5 million.
The weak economic environment negatively affected serious delinquency rates across our multifamily guarantybook of business, with all loan sizes experiencing higher delinquencies. The multifamily serious delinquencyrate increased as of December 31, 2010 compared with December 31, 2009, even as market conditions beganto stabilize throughout the year, as delinquency rates are a lagging indicator. The DUS loans in our guarantybook of business have a lower rate of delinquencies when compared with the total book of business while thenon-DUS loans are experiencing a higher rate of delinquencies.
169

Multifamily loans with an original balance of less than $3 million nationwide or $5 million in high costmarkets, which we refer to as small balance loans, acquired through non-DUS lenders continue to exhibithigher delinquencies than small balance loans acquired through DUS lenders. These small balance non-DUSloans account for 21% of our multifamily serious delinquency rate while representing approximately 10% ofour multifamily guaranty book of business as of December 31, 2010. These small balance non-DUS loanacquisitions were most common in 2007 and 2008 and have not been a significant portion of our totalmultifamily acquisitions since 2008. Although our 2007 and early 2008 acquisitions were underwritten to ourthen-current credit standards and required borrower cash equity, they were acquired near the peak ofmultifamily housing values. During the second half of 2008, our underwriting standards were adjusted toreflect the evolving market trends at that time. While these non-DUS small balance loans represent a higherproportionate share of delinquencies, they generally are covered by loss sharing arrangements, which limits thecredit losses incurred.
In addition, Arizona, Florida, Georgia, and Ohio, have a disproportionate share of seriously delinquent loanscompared to their share of the multifamily guaranty book of business as a result of slow economic recovery incertain areas of these states. These states accounted for 39% of multifamily serious delinquencies but only10% of the multifamily guaranty book of business.
REO Management
Foreclosure and REO activity affect the level of credit losses. Table 50 compares our multifamily REObalances for the periods indicated.
Table 50: Multfamily Foreclosed Properties
2010 2009 2008As of December 31,
Multifamily foreclosed properties (number of properties):
Beginning of period inventory of multifamily foreclosed properties (REO) . . . . . . . . . . . . . . . . . . 73 29 9
Total properties acquired through foreclosure . . . . . . . . . . . . . . . . . . . . . . . . . . . . . . . . . . . 232 105 33
Disposition of REO . . . . . . . . . . . . . . . . . . . . . . . . . . . . . . . . . . . . . . . . . . . . . . . . . . . . (83) (61) (13)
End of period inventory of multifamily foreclosed properties (REO) . . . . . . . . . . . . . . . . . . . . . . 222 73 29
Carrying value of multifamily foreclosed properties (dollars in millions) . . . . . . . . . . . . . . . . . . . $596 $265 $105
Our multifamily foreclosed property inventory increase reflects the continuing stress on our multifamilyguaranty book of business as weak economic conditions have caused new foreclosures to outpace dispositions.
Institutional Counterparty Credit Risk Management
We rely on our institutional counterparties to provide services and credit enhancements, including primary andpool mortgage insurance coverage, risk sharing agreements with lenders and financial guaranty contracts thatare critical to our business. Institutional counterparty risk is the risk that these institutional counterparties mayfail to fulfill their contractual obligations to us, including seller/servicers who are obligated to repurchaseloans from us or reimburse us for losses in certain circumstances. Defaults by a counterparty with significantobligations to us could result in significant financial losses to us.
Several of our institutional counterparties may now be subject to provisions of the Dodd-Frank Act, which wassigned into law in July 2010. However, we cannot predict its potential impact on our company or our industryat this time. For additional discussion on key provisions and additional information about this legislationplease see “Legislation and GSE Reform—Financial Regulatory Reform Legislation: The Dodd-Frank Act”and “Risk Factors” in this report.
170

We have exposure primarily to the following types of institutional counterparties:
• mortgage seller/servicers that service the loans we hold in our investment portfolio or that back ourFannie Mae MBS;
• third-party providers of credit enhancement on the mortgage assets that we hold in our investmentportfolio or that back our Fannie Mae MBS, including mortgage insurers, financial guarantors and lenderswith risk sharing arrangements;
• custodial depository institutions that hold principal and interest payments for Fannie Mae portfolio loansand MBS certificateholders, as well as collateral posted by derivatives counterparties, repurchasetransaction counterparties and mortgage originators or servicers;
• issuers of securities held in our cash and other investments portfolio;
• derivatives counterparties;
• mortgage originators and investors;
• debt security and mortgage dealers; and
• document custodians.
We routinely enter into a high volume of transactions with counterparties in the financial services industry,including brokers and dealers, mortgage lenders and commercial banks, and mortgage insurers, resulting in asignificant credit concentration with respect to this industry. We also have significant concentrations of creditrisk with particular counterparties. Many of our institutional counterparties provide several types of servicesfor us. For example, many of our lender customers or their affiliates act as mortgage seller/servicers,derivatives counterparties, custodial depository institutions and document custodians on our behalf.
Unfavorable market conditions have adversely affected, and continue to adversely affect, the liquidity andfinancial condition of many of our institutional counterparties, which has significantly increased the risk to ourbusiness of defaults by these counterparties due to bankruptcy or receivership, lack of liquidity, insufficientcapital, operational failure or other reasons. Although we believe that government actions to provide liquidityand other support to specified financial market participants has initially helped and may continue to helpimprove the financial condition and liquidity position of a number of our institutional counterparties, there canbe no assurance that these actions will continue to be effective or will be sufficient. As described in “RiskFactors,” the financial difficulties that our institutional counterparties are experiencing may negatively affecttheir ability to meet their obligations to us and the amount or quality of the products or services they provideto us.
In the event of a bankruptcy or receivership of one of our counterparties, we may be required to establish ourownership rights to the assets these counterparties hold on our behalf to the satisfaction of the bankruptcycourt or receiver, which could result in a delay in accessing these assets causing a decline in their value. Inaddition, if we are unable to replace a defaulting counterparty that performs services that are critical to ourbusiness with another counterparty, it could materially adversely affect our ability to conduct our operations.
On September 22, 2009, we filed a proof of claim as a creditor in the bankruptcy case of Lehman BrothersHoldings, Inc., which filed for bankruptcy in September 2008. The claim of $8.9 billion included losses weincurred in connection with the termination of our outstanding derivatives contracts with a subsidiary ofLehman Brothers, federal securities law claims related to Lehman Brothers private-label securities and notesheld in our cash and other investments portfolio, losses arising under certain REMIC and grantor trusttransactions, and mortgage loan repurchase obligations. A contingent claim of $6.9 billion was also included,primarily relating to a large multifamily transaction. However, based on Lehman Brothers’ financial condition,we believe we will receive only a portion of these claims.
171

Mortgage Seller/Servicers
Mortgage seller/servicers collect mortgage and escrow payments from borrowers, pay taxes and insurancecosts from escrow accounts, monitor and report delinquencies, and perform other required activities on ourbehalf. We have minimum standards and financial requirements for mortgage seller/servicers. For example, werequire servicers to collect and retain a sufficient level of servicing fees to reasonably compensate areplacement servicer in the event of a servicing contract breach. In addition, we perform periodic on-site andfinancial reviews of our servicers and monitor their financial and portfolio performance as compared to peersand internal benchmarks. We work with our largest servicers to establish performance goals and monitorperformance against the goals, and our servicing consultants work with servicers to improve servicing resultsand compliance with our servicing guide.
Our business with our mortgage seller/servicers is concentrated. Our ten largest single-family mortgageservicers, including their affiliates, serviced 77% of our single-family guaranty book of business as ofDecember 31, 2010, compared to 80% as of December 31, 2009. Our largest mortgage servicer is Bank ofAmerica, which, together with its affiliates, serviced approximately 26% of our single-family guaranty book ofbusiness as of December 31, 2010, compared to 27% as of December 31, 2009. In addition, we had two othermortgage servicers, JP Morgan and Wells Fargo, that, with their affiliates, each serviced over 10% of oursingle-family guaranty book of business as of December 31, 2010 and 2009. In addition, Wells Fargo, with itsaffiliates, serviced over 10% of our multifamily guaranty book of business as of both December 31, 2010 and2009. Also, PNC Financial Services Group, Inc., together with its affiliates, serviced over 10% of ourmultifamily guaranty book of business as of December 31, 2009. Because we delegate the servicing of ourmortgage loans to mortgage servicers and do not have our own servicing function, servicers’ lack ofappropriate process controls or the loss of business from a significant mortgage servicer counterparty couldpose significant risks to our ability to conduct our business effectively.
Unfavorable market conditions have adversely affected, and continue to adversely affect, the liquidity andfinancial condition and performance of many of our mortgage seller/servicers. Several mortgage seller/servicers have experienced ratings downgrades and liquidity constraints. However, our primary mortgageservicer counterparties have generally continued to meet their obligations to us during 2009 and 2010. Thegrowth in the number of delinquent loans on their books of business may negatively affect the ability of thesecounterparties to continue to meet their obligations to us in the future. We are also relying on our mortgageseller/servicers to play a significant role in our homeownership assistance programs; the broad scope of someof these programs, as well as the recent economic challenges in the market, may limit their capacity to supportthese programs.
Our mortgage seller/servicers are obligated to repurchase loans or foreclosed properties, or reimburse us forlosses if the foreclosed property has been sold, under certain circumstances, such as if it is determined that themortgage loan did not meet our underwriting or eligibility requirements, if loan representations and warrantiesare violated or if mortgage insurers rescind coverage. We refer to these collectively as “repurchase requests.”In 2010 and 2009, the number of our repurchase requests remained high. During 2010, the aggregate unpaidprincipal balance of loans repurchased by our seller/servicers pursuant to their contractual obligations wasapproximately $8.8 billion, compared to $4.6 billion during 2009. As of December 31, 2010, we had$5.0 billion in outstanding repurchase requests related to loans that had been reviewed for potential breachesof contractual obligations. Approximately 41% of our total outstanding repurchase requests had been made toone of our seller/servicers. As of December 31, 2010, 30% of our outstanding repurchase requests had beenoutstanding for more than 120 days from either the original loan repurchase request date or, for lendersremitting after the REO is disposed, the date of our final loss determination.
The amount of our outstanding repurchase requests provided above is based on the unpaid principal balance ofthe loans underlying the repurchase request issued, not the actual amount we have requested from the lenders.Lenders have the option to remit payment equal to our loss, including imputed interest, on the loan after wehave disposed of the REO, which is less than the unpaid principal balance of the loan. As a result, we expectour actual cash receipts relating to these outstanding repurchase requests to be significantly lower than thisamount. In addition, amounts relating to repurchase requests originating from missing documentation or loan
172

files are excluded from the total requests outstanding until the completion of a full underwriting review, oncethe documents and loan files are received.
On December 31, 2010, we entered into an agreement with Bank of America, N.A., and its affiliates, BACHome Loans Servicing, LP, and Countrywide Home Loans, Inc., to address outstanding repurchase requestsfor residential mortgage loans with an unpaid principal balance of $3.9 billion delivered to us by affiliates ofCountrywide Financial Corporation. Bank of America agreed, among other things, to a resolution amount of$1.5 billion, consisting of a cash payment of $1.3 billion made by Bank of America on December 31, 2010,and other payments recently made or to be made by them.
The agreement substantially resolves or addresses outstanding repurchase requests on loans sold to us byCountrywide and permits us to bring claims for any additional breaches of our representations and warrantiesthat are identified with respect to those loans. We continue to work with Bank of America to resolverepurchase requests that remain outstanding, including requests relating to loans delivered to us by Bank ofAmerica, N.A.
In December 2010, we entered into an agreement with certain wholly-owned subsidiaries of Ally Financial,Inc. (“Ally”). Under the agreement, we received a cash payment of $462 million in exchange for our releaseof specified Ally affiliates from potential liability relating to certain private-label securities sponsored by thesubsidiaries and for certain selling representation and warranty liability related to mortgage loans sold and/orserviced by one of the subsidiaries as of or prior to June 30, 2010.
We continue to work with our mortgage seller/servicers to fulfill outstanding repurchase requests; however, asthe volume of repurchase requests increases, the risk increases that affected seller/servicers will not be willingor able to meet the terms of their repurchase obligations and we may be unable to recover on all outstandingloan repurchase obligations resulting from seller/servicers’ breaches of contractual obligations. If a significantseller/servicer counterparty, or a number of seller/servicer counterparties, fails to fulfill its repurchaseobligations to us, it could result in a significant increase in our credit losses and have a material adverse effecton our results of operations and financial condition. We expect that the amount of our outstanding repurchaserequests could remain high in 2011.
We likely would incur costs and potential increases in servicing fees and could also face operational risks ifwe decide to replace a mortgage seller/servicer due to its default, our assessment of its financial condition orfor other reasons. If a significant mortgage servicer counterparty fails, and its mortgage servicing obligationsare not transferred to a company with the ability and intent to fulfill all of these obligations, we could incurpenalties for late payment of taxes and insurance on the properties that secure the mortgage loans serviced bythat mortgage seller/servicer. We could also be required to absorb losses on defaulted loans that a failedservicer is obligated to repurchase from us if we determine there was an underwriting or eligibility breach.
We are exposed to the risk that a mortgage seller/servicer or another party involved in a mortgage loantransaction will engage in mortgage fraud by misrepresenting the facts about the loan. We have experiencedfinancial losses in the past and may experience significant financial losses and reputational damage in thefuture as a result of mortgage fraud. See “Risk Factors” for additional discussion on risks of mortgage fraudwe are exposed to.
Risk management steps we have taken to mitigate our risk to servicers with whom we have materialcounterparty exposure include guaranty of obligations by a higher-rated entity, reduction or elimination ofexposures, reduction or elimination of certain business activities, transfer of exposures to third parties, receiptof additional collateral and suspension or termination of the servicing relationship.
Mortgage Insurers
We use several types of credit enhancement to manage our single-family mortgage credit risk, includingprimary and pool mortgage insurance coverage. Mortgage insurance “risk in force” represents our maximumpotential loss recovery under the applicable mortgage insurance policies. We had total mortgage insurancecoverage risk in force of $95.9 billion on the single-family mortgage loans in our guaranty book of business asof December 31, 2010, which represented approximately 3% of our single-family guaranty book of business as
173
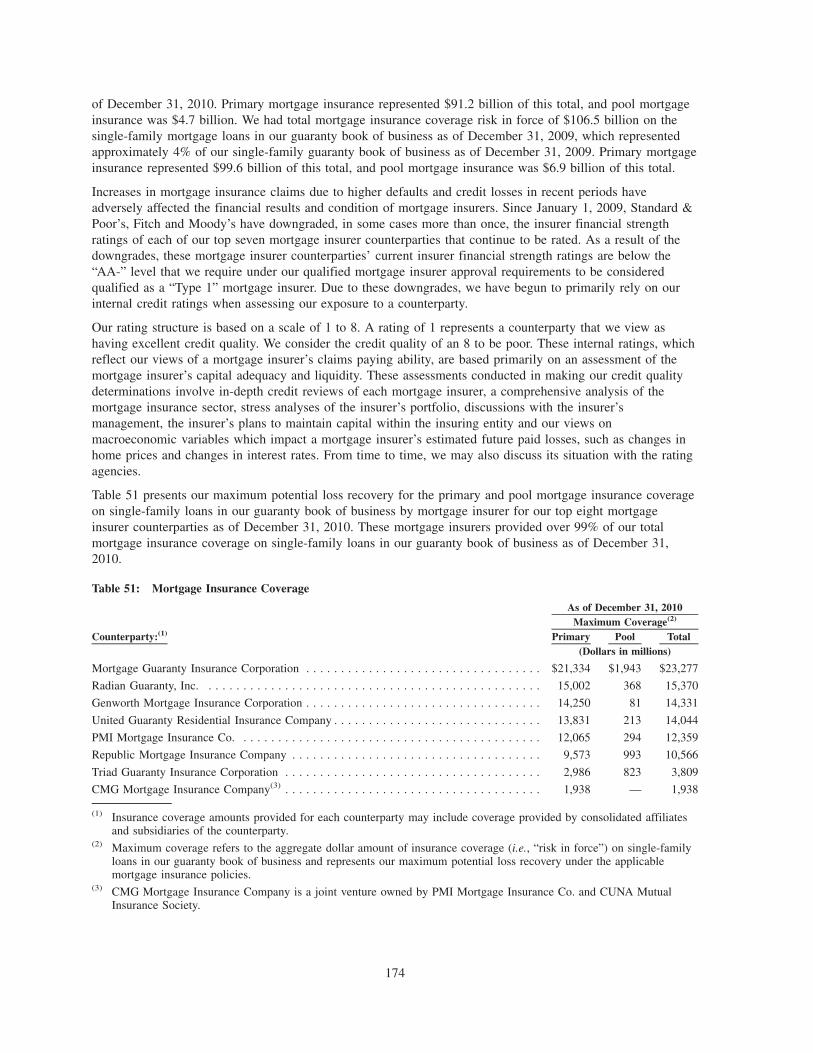
of December 31, 2010. Primary mortgage insurance represented $91.2 billion of this total, and pool mortgageinsurance was $4.7 billion. We had total mortgage insurance coverage risk in force of $106.5 billion on thesingle-family mortgage loans in our guaranty book of business as of December 31, 2009, which representedapproximately 4% of our single-family guaranty book of business as of December 31, 2009. Primary mortgageinsurance represented $99.6 billion of this total, and pool mortgage insurance was $6.9 billion of this total.
Increases in mortgage insurance claims due to higher defaults and credit losses in recent periods haveadversely affected the financial results and condition of mortgage insurers. Since January 1, 2009, Standard &Poor’s, Fitch and Moody’s have downgraded, in some cases more than once, the insurer financial strengthratings of each of our top seven mortgage insurer counterparties that continue to be rated. As a result of thedowngrades, these mortgage insurer counterparties’ current insurer financial strength ratings are below the“AA-” level that we require under our qualified mortgage insurer approval requirements to be consideredqualified as a “Type 1” mortgage insurer. Due to these downgrades, we have begun to primarily rely on ourinternal credit ratings when assessing our exposure to a counterparty.
Our rating structure is based on a scale of 1 to 8. A rating of 1 represents a counterparty that we view ashaving excellent credit quality. We consider the credit quality of an 8 to be poor. These internal ratings, whichreflect our views of a mortgage insurer’s claims paying ability, are based primarily on an assessment of themortgage insurer’s capital adequacy and liquidity. These assessments conducted in making our credit qualitydeterminations involve in-depth credit reviews of each mortgage insurer, a comprehensive analysis of themortgage insurance sector, stress analyses of the insurer’s portfolio, discussions with the insurer’smanagement, the insurer’s plans to maintain capital within the insuring entity and our views onmacroeconomic variables which impact a mortgage insurer’s estimated future paid losses, such as changes inhome prices and changes in interest rates. From time to time, we may also discuss its situation with the ratingagencies.
Table 51 presents our maximum potential loss recovery for the primary and pool mortgage insurance coverageon single-family loans in our guaranty book of business by mortgage insurer for our top eight mortgageinsurer counterparties as of December 31, 2010. These mortgage insurers provided over 99% of our totalmortgage insurance coverage on single-family loans in our guaranty book of business as of December 31,2010.
Table 51: Mortgage Insurance Coverage
Counterparty:(1) Primary Pool TotalMaximum Coverage(2)
As of December 31, 2010
(Dollars in millions)
Mortgage Guaranty Insurance Corporation . . . . . . . . . . . . . . . . . . . . . . . . . . . . . . . . . . $21,334 $1,943 $23,277
Radian Guaranty, Inc. . . . . . . . . . . . . . . . . . . . . . . . . . . . . . . . . . . . . . . . . . . . . . . . . 15,002 368 15,370
Genworth Mortgage Insurance Corporation . . . . . . . . . . . . . . . . . . . . . . . . . . . . . . . . . . 14,250 81 14,331
United Guaranty Residential Insurance Company . . . . . . . . . . . . . . . . . . . . . . . . . . . . . . 13,831 213 14,044
PMI Mortgage Insurance Co. . . . . . . . . . . . . . . . . . . . . . . . . . . . . . . . . . . . . . . . . . . . 12,065 294 12,359
Republic Mortgage Insurance Company . . . . . . . . . . . . . . . . . . . . . . . . . . . . . . . . . . . . 9,573 993 10,566
Triad Guaranty Insurance Corporation . . . . . . . . . . . . . . . . . . . . . . . . . . . . . . . . . . . . . 2,986 823 3,809
CMG Mortgage Insurance Company(3) . . . . . . . . . . . . . . . . . . . . . . . . . . . . . . . . . . . . . 1,938 — 1,938
(1) Insurance coverage amounts provided for each counterparty may include coverage provided by consolidated affiliatesand subsidiaries of the counterparty.
(2) Maximum coverage refers to the aggregate dollar amount of insurance coverage (i.e., “risk in force”) on single-familyloans in our guaranty book of business and represents our maximum potential loss recovery under the applicablemortgage insurance policies.
(3) CMG Mortgage Insurance Company is a joint venture owned by PMI Mortgage Insurance Co. and CUNA MutualInsurance Society.
174
The current weakened financial condition of our mortgage insurer counterparties creates an increased risk thatthese counterparties will fail to fulfill their obligations to reimburse us for claims under insurance policies. Anumber of our mortgage insurers have received waivers from their regulators regarding state-imposedrisk-to-capital limits. Without these waivers, these mortgage insurers would not be able to continue to writenew business in accordance with state regulatory requirements, should they fall below their regulatory capitalrequirements. In 2010, the parent companies of several of our largest mortgage insurer counterparties raisedcapital, which may improve their ability to meet state-imposed risk-to-capital limits and their ability tocontinue paying our claims in full as they come due, to the extent that the capital raised by the parentcompanies is contributed to their respective mortgage insurance entities. It is uncertain as to how long ourmortgage insurer counterparties will remain below their state-imposed risk-to-capital limits. Additionally,mortgage insurers continue to approach us with various proposed corporate restructurings that would requireour approval of affiliated mortgage insurance writing entities. In 2010, we approved PMI Mortgage AssuranceCo., a wholly-owned subsidiary of PMI Mortgage Insurance Co., to provide mortgage insurance in a limitednumber of states, subject to certain conditions.
If mortgage insurers are not able to raise capital and exceed their risk-to-capital limits, they will likely beforced into run-off or receivership unless they can secure a waiver from their state regulator. A mortgageinsurer that is in run-off continues to collect premiums and pay claims on its existing insurance business, butno longer writes new insurance. This would increase the risk that the mortgage insurer will fail to pay ourclaims under insurance policies, and could also cause the quality and speed of their claims processing todeteriorate. In addition, if we are no longer willing or able to conduct business with one or more of ourmortgage insurer counterparties, and we are unable to replace them with another mortgage insurer, it is likelywe would further increase our concentration risk with the remaining mortgage insurers in the industry.
Triad Guaranty Insurance Corporation ceased issuing commitments for new mortgage insurance and began torun-off its existing business in July 2008. In April 2009, Triad received an order from its regulator thatchanges the way it will pay all policyholder claims. Under the order, all valid claims under Triad’s mortgageguaranty insurance policies will be paid 60% in cash and 40% by the creation of a deferred paymentobligation. Triad began paying claims through this combination of cash and deferred payment obligations inJune 2009. When, and if, Triad’s financial position permits, Triad’s regulator will allow Triad to begin payingits deferred payment obligations and/or increase the amount of cash Triad pays on claims.
When we estimate the credit losses that are inherent in our mortgage loan portfolio and under the terms of ourguaranty obligations we also consider the recoveries that we will receive on primary mortgage insurance, asmortgage insurance recoveries would reduce the severity of the loss associated with defaulted loans. We adjustthe contractually due recovery amount to ensure that only amounts which are probable of collection as of thebalance sheet date are included in our loss reserve estimate. As a result, if our assessment of one or more ofour mortgage insurer counterparty’s ability to fulfill their respective obligations to us worsens, it could resultin an increase in our loss reserves.
As of December 31, 2010, our allowance for loan losses of $61.6 billion, allowance for accrued interestreceivable of $3.4 billion and reserve for guaranty losses of $323 million incorporated an estimated recoveryamount of approximately $16.4 billion from mortgage insurance related both to loans that are individuallymeasured for impairment and those that are measured collectively for impairment. This amount is comprisedof the contractual recovery of approximately $17.5 billion as of December 31, 2010 and an adjustment ofapproximately $1.2 billion which reduces the contractual recovery for our assessment of our mortgage insurercounterparties’ inability to fully pay those claims. As of December 31, 2009, our allowance for loan losses of$9.9 billion, allowance for accrued interest receivable of $536 million and reserve for guaranty losses of$54.4 billion incorporated an estimated recovery amount of approximately $16.3 billion from mortgageinsurance related both to loans that are individually measured for impairment and those that are measuredcollectively for impairment. This amount is comprised of the contractual recovery of approximately$18.5 billion as of December 31, 2009 and an adjustment of approximately $2.2 billion which reduces thecontractual recovery for our assessment of our mortgage insurer counterparties’ inability to fully pay thoseclaims.
175

For loans that are collectively evaluated for impairment, we estimate the portion of our incurred loss that weexpect to recover from each of our mortgage insurance counterparties based on the losses that have beenincurred, the contractual mortgage insurance coverage, and an estimate of each counterparty’s resourcesavailable to pay claims to Fannie Mae. An analysis by our Counterparty Risk division determines whether,based on all the information available to us, any counterparty is considered probable to fail to meet theirobligations in the next 30 months. This period is consistent with the amount of time over which claims relatedto losses incurred today are expected to be paid. If that separate analysis finds a counterparty is probable tofail, we then reserve for the shortfall between incurred claims and estimated resources available to pay claimsto Fannie Mae.
For loans that have been determined to be individually impaired, we calculate a net present value of theexpected cash flows for each loan to determine the level of impairment, which is included in our allowancefor loan losses or reserve for guaranty losses. These expected cash flow projections include proceeds frommortgage insurance, that are based, in part, on the internal credit ratings for each of our mortgage insurancecounterparties. Specifically, for loans insured by a mortgage insurer with a poorer credit rating, our cash flowprojections include fewer proceeds from the insurer. Also, as our internal credit ratings of our mortgageinsurer counterparties decrease, we reduce the amount of benefits we expect to receive from the insurance theyprovide, which in turn increases the fair value of our guaranty obligation.
As described above, our methodologies for individually and collectively impaired loans differ as required byGAAP, but both consider the ability of our counterparties to pay their obligations in a manner that isconsistent with each methodology. As the loans individually assessed for impairment consider the life of theloan, we use the noted risk ratings to adjust the loss severity in our best estimates of future cash flows. As theloans collectively assessed for impairment only look to the probable payments we would receive associatedwith our loss emergence period, we use the noted shortfall to adjust the loss severity.
When an insured loan held in our mortgage portfolio subsequently goes into foreclosure, we charge off theloan, eliminating any previously-recorded loss reserves, and record REO and a mortgage insurance receivablefor the claim proceeds deemed probable of recovery, as appropriate. However, if a mortgage insurer rescindstheir insurance coverage, the initial receivable becomes due from the mortgage seller/servicer. We hadoutstanding receivables of $4.4 billion as of December 31, 2010 and $2.5 billion as of December 31, 2009related to amounts claimed on insured, defaulted loans that we have not yet received, of which $648 millionas of December 31, 2010 and $301 million as of December 31, 2009 was due from our mortgage seller/servicers. We assessed the receivables for collectibility, and they are recorded net of a valuation allowance of$317 million as of December 31, 2010 and $51 million as of December 31, 2009 in “Other assets.” Thesemortgage insurance receivables are short-term in nature, having a duration of approximately three to sixmonths, and the valuation allowance reduces our claim receivable to the amount that we consider probable ofcollection. We received proceeds under our primary and pool mortgage insurance policies for single-familyloans of $6.4 billion for the year ended December 31, 2010 and $3.6 billion for the year ended December 31,2009. During the years ended December 31, 2010 and 2009, we negotiated the cancellation and restructuringsof some of our mortgage insurance coverage in exchange for a fee. The cash fees received of $796 million forthe year ended December 31, 2010 and $668 million for the year ended December 31, 2009 are included inour total insurance proceeds amount.
Our mortgage insurer counterparties have generally continued to pay claims owed to us, except where deferredpayment terms have been established. Our mortgage insurer counterparties have increased the number ofmortgage loans for which they have rescinded coverage. In those cases where the mortgage insurance wasobtained to meet our charter requirements or where we independently agree with the materiality of the findingthat was the basis for the rescission, we generally require the seller/servicer to repurchase the loan orindemnify us against loss. We also independently review the origination loan files based upon internalprotocols, and seek repurchase of those loans where we discover material underwriting defects,misrepresentation, or fraud.
In the second quarter of 2010, some mortgage insurers disclosed agreements with certain lenders whereby theyagree to waive certain rights to investigate claims for significant product segments of the insured loans for that
176

particular lender, and in return receive some compensation. This means that these mortgage insurers willrequire fewer mortgage insurance rescissions for origination defects for the impacted loans. For loans coveredby these agreements, to the extent we do not uncover loan defects independently for loans that otherwisewould have resulted in mortgage insurance rescission, we may be at risk of additional loss. It is unclear howprevalent this type of agreement between mortgage insurers and lenders may become or how many loans itmay impact. We have required our top mortgage insurer counterparties to notify us promptly of any suchagreements to waive rights either to investigate claims or to rescind mortgage insurance coverage. Becauseloans covered by such agreements will be subject to fewer mortgage insurance rescissions, we expect that ourown independent review process will lead to loan repurchases that otherwise would have been subject to arescission of mortgage insurance coverage. We examine these arrangements to determine if other actions arenecessary.
Besides evaluating their condition to assess whether we have incurred probable losses in connection with ourcoverage, we also evaluate these counterparties individually to determine whether or under what conditionsthey will remain eligible to insure new mortgages sold to us. Except for Triad Guaranty InsuranceCorporation, as of February 24, 2011, our private mortgage insurer counterparties remain qualified to conductbusiness with us. However, based on our evaluation of them, we may impose additional terms and conditionsof approval on some of our mortgage insurers, including: limiting the volume and types of loans they mayinsure for us; requiring them to obtain our consent prior to providing risk sharing arrangements with mortgagelenders; and requiring them to meet certain financial conditions, such as maintaining a minimum level ofpolicyholders’ surplus, a maximum risk-to-capital ratio, a maximum combined ratio, parental or other capitalsupport agreements and limitations on the types and volumes of certain assets that may be considered as liquidassets.
From time to time, we may enter into negotiated transactions with mortgage insurer counterparties pursuant towhich we agree to cancel or restructure insurance coverage, in excess of charter requirements, in exchange fora fee. These insurance cancellations and restructurings may provide our counterparties with capital relief andprovide us with cash in lieu of future claims that the counterparty may not be able to pay, thereby reducingour future counterparty credit exposure. We may negotiate additional insurance coverage restructurings in2011, though fewer than prior years.
We generally are required pursuant to our charter to obtain credit enhancement on single-family conventionalmortgage loans that we purchase or securitize with LTV ratios over 80% at the time of purchase. Inconnection with Refi Plus, we are generally able to purchase an eligible loan if the loan has mortgageinsurance in an amount at least equal to the amount of mortgage insurance that existed on the loan that wasrefinanced. As a result, these refinanced loans with updated LTV ratios above 80% and up to 125% may haveno mortgage insurance or less insurance than we would otherwise require for a loan not originated under thisprogram. In the current environment, many mortgage insurers have stopped insuring new mortgages withhigher LTV ratios or with lower borrower credit scores or on select property types, which has contributed tothe reduction in our business volumes for high LTV ratio loans. In addition, FHA’s role as the lower-costoption for loans with higher LTV ratios has also reduced our acquisitions of these types of loans. If ourmortgage insurer counterparties further restrict their eligibility requirements or new business volumes for highLTV ratio loans, or if we are no longer willing or able to obtain mortgage insurance from these counterparties,and we are not able to find suitable alternative methods of obtaining credit enhancement for these loans, or ifFHA continues to be the lower-cost option for some consumers, and in some cases the only option, for loanswith higher LTV ratios, we may be further restricted in our ability to purchase or securitize loans with LTVratios over 80% at the time of purchase.
Financial Guarantors
We were the beneficiary of financial guarantees totaling $8.8 billion as of December 31, 2010 and $9.6 billionas of December 31, 2009 on securities held in our investment portfolio or on securities that have beenresecuritized to include a Fannie Mae guaranty and sold to third parties. The securities covered by theseguarantees consist primarily of private-label mortgage-related securities and mortgage revenue bonds. We arealso the beneficiary of financial guarantees included in securities issued by Freddie Mac, the federal
177

government and its agencies that totaled $25.7 billion as of December 31, 2010 and $51.3 billion as ofDecember 31, 2009.
Most of the financial guarantors that provided bond insurance coverage to us as of December 31, 2010experienced material adverse changes to their investment grade ratings and their financial condition during2010 and 2009 because of significantly higher claim losses that have impaired their claims paying ability.From time to time, we may enter into negotiated transactions with financial guarantor counterparties pursuantto which we agree to cancellation of their guaranty in exchange for a cancellation fee. With the exception ofAmbac Assurance Corporation (“Ambac”), as described below, none of our financial guarantor counterpartieshas failed to repay us for claims under guaranty contracts. However, based on the stressed financial conditionof our financial guarantor counterparties, we believe that one or more of our financial guarantor counterpartiesmay not be able to fully meet their obligations to us in the future. We model our securities assuming thebenefit of those external financial guarantees that are deemed creditworthy. For additional discussions of ourmodel methodology and key inputs used to estimate other-than-temporary impairment see “Note 6,Investments in Securities.”
In March 2010, Ambac and its insurance regulator, the Wisconsin Office of the Commissioner of Insurance,imposed a court-ordered moratorium on certain claim payments under Ambac’s bond insurance coverage,including claims arising under coverage on $1.2 billion of our private-label securities insured by Ambac as ofDecember 31, 2010. Prior to March 2010, we received payments from Ambac for our claims on Ambacinsured private-label securities. As a result of the moratorium, we have not received payments for theadditional claims filed with Ambac in 2010. On January 24, 2011, the Wisconsin Circuit Court of DaneCounty confirmed Ambac’s rehabilitation plan; however, the plan is subject to stay and appeal. The outcomeof legal proceedings regarding the moratorium and the proposed company rehabilitation each remain uncertainat this time. We assumed no benefit for Ambac’s financial guaranty when estimating other-than-temporaryimpairment. See “Consolidated Balance Sheet Analysis—Investments in Mortgage-Related Securities” formore information on our investments in private-label mortgage-related securities.
Lenders with Risk Sharing
We enter into risk sharing agreements with lenders pursuant to which the lenders agree to bear all or someportion of the credit losses on the covered loans. Our maximum potential loss recovery from lenders underthese risk sharing agreements on single-family loans was $15.6 billion as of December 31, 2010 and$18.3 billion as of December 31, 2009. As of December 31, 2010, 56% of our maximum potential lossrecovery on single-family loans was from three lenders. As of December 31, 2009, 53% of our maximumpotential loss recovery on single-family loans was from three lenders. Our maximum potential loss recoveryfrom lenders under these risk sharing agreements on multifamily loans was $30.3 billion as of December 31,2010 and $28.7 billion as of December 31, 2009. As of December 31, 2010, 41% of our maximum potentialloss recovery on multifamily loans was from three lenders. As of December 31, 2009, 51% of our maximumpotential loss recovery on multifamily loans was from three lenders.
Unfavorable market conditions have adversely affected, and continue to adversely affect, the liquidity andfinancial condition of our lender counterparties. The percentage of single-family recourse obligations tolenders with investment grade credit ratings (based on the lower of Standard & Poor’s, Moody’s and Fitchratings) was 46% as of December 31, 2010, compared with 45% as of December 31, 2009. The percentage ofthese recourse obligations to lender counterparties rated below investment grade was 23% as of December 31,2010, compared to 22% as of December 31, 2009. The remaining percentage of these recourse obligationswere to lender counterparties that were not rated by rating agencies, which was 31% as of December 31,2010, compared with 33% as of December 31, 2009. Given the stressed financial condition of some of ourlenders, we expect in some cases we will recover less, perhaps significantly less, than the amount the lender isobligated to provide us under our risk sharing arrangement with them. Depending on the financial strength ofthe counterparty, we may require a lender to pledge collateral to secure its recourse obligations.
As noted above in “Multifamily Credit Risk Management,” our primary multifamily delivery channel is ourDUS program, which is comprised of lenders that span the spectrum from large depositories to independent
178
non-bank financial institutions. As of December 31, 2010, loans representing approximately 55% of the unpaidprincipal balance of loans in our guaranty book of business acquired from our DUS lenders are serviced byinstitutions with an external investment grade credit rating or a guarantee from an affiliate with an externalinvestment grade credit rating. Given the recourse nature of the DUS program, the lenders are bound byeligibility standards that dictate, among other items, minimum capital and liquidity levels, and the posting ofcollateral at a highly rated custodian to backstop a portion of the lenders’ future obligations. To ensure thelevel of risk associated with these lenders remains within our standards, we actively monitor their financialcondition. Due to the current credit trends within the multifamily market, effective January 2011, we increasedthe collateral requirements for DUS lenders to better align with more recent actual and modeled lossprojections. Lenders delivering loans with higher-risk characteristics will be required to maintain increasedlevels of collateral with our designated custodian. Although the current capital requirements have withstoodsignificant testing, we believe these changes will more closely align the DUS program with current levels ofrisk in the market and better protect our assets.
Several of our DUS lenders and their parent companies, including Capmark Finance Inc. (“Capmark”), haveexperienced financial stress during the recent market downturn. Capmark, along with its parent and variousother affiliates, filed for Chapter 11 bankruptcy protection on October 25, 2009. On December 11, 2009,Berkadia Commercial Mortgage LLC (“Berkadia”) acquired Capmark’s mortgage origination and servicingbusiness, including its Fannie Mae portfolio, through the Section 363 bankruptcy auction process. WhileBerkadia subsequently became an active DUS lender and servicer of the former Capmark Fannie Maeportfolio, our contractual and investment relationships continue with other Capmark affiliates that remainsubject to bankruptcy court jurisdiction. At this time, we cannot determine what, if any, impact the bankruptcymight have on us. Any action taken by Capmark, including an entity or asset sale, likely would affect only ourinvestments in LIHTC funds, which have a carrying value of zero in our consolidated financial statements.
Custodial Depository Institutions
A total of $75.4 billion in deposits for single-family payments were received and held by 289 institutions inthe month of December 2010 and a total of $51.0 billion in deposits for single-family payments were receivedand held by 284 institutions in the month of December 2009. Of these total deposits, 92% as of December 31,2010 and 95% as of December 31, 2009 were held by institutions rated as investment grade by Standard &Poor’s, Moody’s and Fitch. Our ten largest custodial depository institutions held 93% of these deposits as ofboth December 31, 2010 and 2009.
If a custodial depository institution were to fail while holding remittances of borrower payments of principaland interest due to us in our custodial account, we would be an unsecured creditor of the depository forbalances in excess of the deposit insurance protection and might not be able to recover all of the principal andinterest payments being held by the depository on our behalf, or there might be a substantial delay inreceiving these amounts. If this were to occur, we would be required to replace these amounts with our ownfunds to make payments that are due to Fannie Mae MBS certificateholders. Accordingly, the insolvency ofone of our principal custodial depository counterparties could result in significant financial losses to us.
Due to the challenging market conditions, several of our custodial depository counterparties experiencedratings downgrades and liquidity constraints. In response, we reduced the aggregate amount of our fundspermitted to be held with these counterparties and required more frequent remittances of funds. These rulesare effective through December 2013.
The Dodd-Frank Act, signed into law July 21, 2010, permanently increased the amount of federal depositinsurance available to $250,000 per depositor, which substantially lowered our counterparty exposure relatingto principal and interest payments held on our behalf. Prior to this legislation, this increase was set to expirein December 2013.
Issuers of Investments Held in our Cash and Other Investments Portfolio
Our cash and other investments portfolio primarily consists of cash and cash equivalents, federal funds soldand securities purchased under agreements to resell or similar arrangements, U.S. Treasury securities and
179

asset-backed securities. See “Liquidity and Capital Management—Liquidity Management—Liquidity RiskManagement Practices and Contingency Planning—Cash and Other Investments Portfolio” for more detailedinformation on our cash and other investments portfolio. Our counterparty risk is primarily with financialinstitutions and U.S. Treasury.
Our cash and other investments portfolio, which totaled $61.8 billion as of December 31, 2010, included$31.5 billion of U.S. Treasury securities and $10.3 billion of unsecured positions all of which were short-termdeposits with financial institutions which had short-term credit ratings of A-1, P-1, F1 (or equivalent) orhigher from Standard & Poor’s, Moody’s and Fitch ratings, respectively. As of December 31, 2009, our cashand other investments portfolio totaled $69.4 billion and included $45.8 billion of unsecured positions withissuers of corporate debt securities or short-term deposits with financial institutions, of which approximately92% were with issuers which had short-term credit ratings of A-1, P-1, F1 (or its equivalent) or higher fromStandard & Poor’s, Moody’s and Fitch ratings, respectively.
We monitor the credit risk position of our cash and other investments portfolio by duration and rating level. Inaddition, we monitor the financial position and any downgrades of these counterparties. The outcome of ourmonitoring could result in a range of events, including selling some of these investments. If one of ourprimary cash and other investments portfolio counterparties fails to meet its obligations to us under the termsof the investments, it could result in financial losses to us and have a material adverse effect on our earnings,liquidity, financial condition and net worth. During 2010, we evaluated the growing uncertainty of the stabilityof various European economies and financial institutions and as a result of this evaluation, reduced the numberof counterparties in our cash and other investments portfolio in those markets and began to lend to remainingcounterparties on a secured basis.
Derivatives Counterparties
Our derivative credit exposure relates principally to interest rate and foreign currency derivatives contracts. Weestimate our exposure to credit loss on derivative instruments by calculating the replacement cost, on a presentvalue basis, to settle at current market prices all outstanding derivative contracts in a net gain position bycounterparty where the right of legal offset exists, such as master netting agreements, and by transaction wherethe right of legal offset does not exist. Derivatives in a gain position are included in our consolidated balancesheets in “Other assets.”
We expect our credit exposure on derivative contracts to fluctuate with changes in interest rates, impliedvolatility and the collateral thresholds of the counterparties. Typically, we seek to manage this exposure bycontracting with experienced counterparties that are rated A- (or its equivalent) or better. These counterpartiesconsist of large banks, broker-dealers and other financial institutions that have a significant presence in thederivatives market.
We also manage our exposure to derivatives counterparties by requiring collateral in specified instances. Wehave a collateral management policy with provisions for requiring collateral on interest rate and foreigncurrency derivative contracts in net gain positions based upon the counterparty’s credit rating. The collateralincludes cash, U.S. Treasury securities, agency debt and agency mortgage-related securities. We analyze creditexposure on our derivative instruments daily and make collateral calls as appropriate based on the results ofinternal pricing models and dealer quotes. In the case of a bankruptcy filing by an interest rate or foreigncurrency derivative counterparty or other default by the counterparty under the derivative contract, we wouldhave the right to terminate all outstanding derivative contracts with that counterparty and may retain collateralpreviously posted by that counterparty to the extent that we are in a net gain position on the termination date.
Our net credit exposure on derivatives contracts decreased to $152 million as of December 31, 2010, from$238 million as of December 31, 2009. We had outstanding interest rate and foreign currency derivativetransactions with 15 counterparties as of December 31, 2010 and 16 counterparties as of December 31, 2009.Derivatives transactions with nine of our counterparties accounted for approximately 90% of our totaloutstanding notional amount as of December 31, 2010, with each of these counterparties accounting forbetween approximately 5% and 19% of the total outstanding notional amount. In addition to the 15counterparties with whom we had outstanding notional amounts as of December 31, 2010, we had master
180

netting agreements with three counterparties with whom we may enter into interest rate derivative or foreigncurrency derivative transactions in the future.
The Dodd-Frank Act includes additional regulation of the over-the-counter derivatives market that will likelydirectly and indirectly affect many aspects of our business and our business partners. Under the Dodd-FrankAct, if a swap is required by the CFTC to be cleared, it will be unlawful to enter into such a swap unless it issubmitted for clearing to a derivatives clearing organization. In anticipation of those requirements, we cleareda small number of new interest rate swap transactions with a derivatives clearing organization. TheDodd-Frank Act also requires certain institutions meeting the definition of “swap dealer” or “major swapparticipant” to register with the CFTC. The CFTC and SEC issued joint proposed rules regarding certaindefinitions in the Dodd-Frank Act, including the definition of “major swap participant.” See “Legislation andGSE Reform—Financial Regulatory Reform Legislation: The Dodd-Frank Act” and “Risk Factors” foradditional details regarding the Dodd-Frank Act and risks to our business posed by the Act.
See “Note 10, Derivative Instruments and Hedging Activities” for information on the outstanding notionalamount and additional information on our risk management derivative contracts as of December 31, 2010 and2009. See “Risk Factors” for a discussion of the risks to our business posed by interest rate risk and adiscussion of the risks to our business as a result of the increasing concentration of our derivativescounterparties.
Mortgage Originators and Investors
We are routinely exposed to pre-settlement risk through the purchase or sale of closed mortgage loans andmortgage-related securities with mortgage originators and mortgage investors. The risk is the possibility thatthe counterparty will be unable or unwilling to either deliver closed mortgage assets or compensate us for thecost to cancel or replace the transaction. We manage this risk by determining position limits with thesecounterparties, based upon our assessment of their creditworthiness, and monitoring and managing theseexposures.
Debt Security and Mortgage Dealers
The credit risk associated with dealers that commit to place our debt securities is that they will fail to honortheir contracts to take delivery of the debt, which could result in delayed issuance of the debt through anotherdealer. The primary credit risk associated with dealers who make forward commitments to deliver mortgagepools to us is that they may fail to deliver the agreed-upon loans to us on the agreed-upon date, which couldresult in our having to replace the mortgage pools at higher cost to meet a forward commitment to sell theMBS. We manage these risks by establishing approval standards and limits on exposure and monitoring bothour exposure positions and changes in the credit quality of dealers.
Document Custodians
We use third-party document custodians to provide loan document certification and custody services for someof the loans that we purchase and securitize. In many cases, our lender customers or their affiliates also serveas document custodians for us. Our ownership rights to the mortgage loans that we own or that back ourFannie Mae MBS could be challenged if a lender intentionally or negligently pledges or sells the loans that wepurchased or fails to obtain a release of prior liens on the loans that we purchased, which could result infinancial losses to us. When a lender or one of its affiliates acts as a document custodian for us, the risk thatour ownership interest in the loans may be adversely affected is increased, particularly in the event the lenderwere to become insolvent. We mitigate these risks through legal and contractual arrangements with thesecustodians that identify our ownership interest, as well as by establishing qualifying standards for documentcustodians and requiring removal of the documents to our possession or to an independent third-partydocument custodian if we have concerns about the solvency or competency of the document custodian.
181

Market Risk Management, Including Interest Rate Risk Management
We are subject to market risk, which includes interest rate risk, spread risk and liquidity risk. These risks arisefrom our mortgage asset investments. Interest rate risk is the risk of loss in value or expected future earningsthat may result from changes to interest rates. Spread risk is the resulting impact of changes in the spreadbetween our mortgage assets and our debt and derivatives we use to hedge our position. Liquidity risk is therisk that we will not be able to meet our funding obligations in a timely manner.
Interest Rate Risk Management
Our goal is to manage market risk to be neutral to the movements in interest rates and volatility, subject tomodel constraints and prevailing market conditions. We employ an integrated interest rate risk managementstrategy that allows for informed risk taking within pre-defined corporate risk limits. Decisions regarding ourstrategy in managing interest rate risk are based upon our corporate market risk policy and limits that areestablished by our Chief Market Risk Officer and our Chief Risk Officer and are subject to review andapproval by our Board of Directors. Our Capital Markets Group has primary responsibility for executing ourinterest rate risk management strategy.
We have actively managed the interest rate risk of our “net portfolio,” which is defined below, through thefollowing techniques: (1) asset selection and structuring (that is, by identifying or structuring mortgage assetswith attractive prepayment and other risk characteristics); (2) issuing a broad range of both callable and non-callable debt instruments; and (3) using LIBOR-based interest-rate derivatives. We have not actively managedor hedged our spread risk, or the impact of changes in the spread between our mortgage assets and debt(referred to as mortgage-to-debt spreads) after we purchase mortgage assets, other than through assetmonitoring and disposition. For mortgage assets in our portfolio that we intend to hold to maturity to realizethe contractual cash flows, we accept period-to-period volatility in our financial performance attributable tochanges in mortgage-to-debt spreads that occur after our purchase of mortgage assets. For more informationon the impact that changes in spreads have on the value of the fair value of our net assets, see “SupplementalNon-GAAP Information—Fair Value Balance Sheets.”
We monitor current market conditions, including the interest rate environment, to assess the impact of theseconditions on individual positions and our overall interest rate risk profile. In addition to qualitative factors,we use various quantitative risk metrics in determining the appropriate composition of our consolidatedbalance sheet and relative mix of debt and derivatives positions in order to remain within pre-defined risktolerance levels that we consider acceptable. We regularly disclose two interest rate risk metrics that estimateour overall interest rate exposure: (1) fair value sensitivity to changes in interest rate levels and the slope ofthe yield curve and (2) duration gap.
The metrics used to measure our interest rate exposure are generated using internal models. Our internalmodels, consistent with standard practice for models used in our industry, require numerous assumptions.There are inherent limitations in any methodology used to estimate the exposure to changes in market interestrates. The reliability of our prepayment estimates and interest rate risk metrics depends on the availability andquality of historical data for each of the types of securities in our net portfolio. When market conditionschange rapidly and dramatically, as they did during the financial market crisis of late 2008, the assumptions ofour models may no longer accurately capture or reflect the changing conditions. On a continuous basis,management makes judgments about the appropriateness of the risk assessments indicated by the models.
Sources of Interest Rate Risk Exposure
The primary source of our interest rate risk is the composition of our net portfolio. Our net portfolio consistsof our existing investments in mortgage assets, investments in non-mortgage securities, our outstanding debtused to fund those assets and the derivatives used to supplement our debt instruments and manage interest raterisk, and any fixed-price asset, liability or derivative commitments.
Our mortgage assets consist mainly of single-family fixed-rate mortgage loans that give borrowers the optionto prepay at any time before the scheduled maturity date or continue paying until the stated maturity. Given
182

this prepayment option held by the borrower, we are exposed to uncertainty as to when or at what rateprepayments will occur, which affects the length of time our mortgage assets will remain outstanding and thetiming of the cash flows related to these assets. This prepayment uncertainty results in a potential mismatchbetween the timing of receipt of cash flows related to our assets and the timing of payment of cash flowsrelated to our liabilities.
Changes in interest rates, as well as other factors, influence mortgage prepayment rates and duration and alsoaffect the value of our mortgage assets. When interest rates decrease, prepayment rates on fixed-ratemortgages generally accelerate because borrowers usually can pay off their existing mortgages and refinanceat lower rates. Accelerated prepayment rates have the effect of shortening the duration and average life of thefixed-rate mortgage assets we hold in our portfolio. In a declining interest rate environment, existing mortgageassets held in our portfolio tend to increase in value or price because these mortgages are likely to have higherinterest rates than new mortgages, which are being originated at the then-current lower interest rates.Conversely, when interest rates increase, prepayment rates generally slow, which extends the duration andaverage life of our mortgage assets and results in a decrease in value.
Although the fair value of our guaranty assets and our guaranty obligations is highly sensitive to changes ininterest rates and the market’s perception of future credit performance, we do not actively manage the changein the fair value of our guaranty business that is attributable to changes in interest rates. We do not believethat periodic changes in fair value due to movements in interest rates are the best indication of the long-termvalue of our guaranty business because these changes do not take into account future guaranty businessactivity.
Interest Rate Risk Management Strategy
Our strategy for managing the interest rate risk of our net portfolio involves asset selection and structuring ofour liabilities to match and offset the interest rate characteristics of our balance sheet assets and liabilities asmuch as possible. Our strategy consists of the following principal elements:
• Debt Instruments. We issue a broad range of both callable and non-callable debt instruments to managethe duration and prepayment risk of expected cash flows of the mortgage assets we own.
• Derivative Instruments. We supplement our issuance of debt with derivative instruments to furtherreduce duration and prepayment risks.
• Monitoring and Active Portfolio Rebalancing. We continually monitor our risk positions and activelyrebalance our portfolio of interest rate-sensitive financial instruments to maintain a close match betweenthe duration of our assets and liabilities.
Debt Instruments
Historically, the primary tool we have used to fund the purchase of mortgage assets and manage the interestrate risk implicit in our mortgage assets is the variety of debt instruments we issue. The debt we issue is a mixthat typically consists of short- and long-term, non-callable debt and callable debt. The varied maturities andflexibility of these debt combinations help us in reducing the mismatch of cash flows between assets andliabilities in order to manage the duration risk associated with an investment in long-term fixed-rate assets.Callable debt helps us manage the prepayment risk associated with fixed-rate mortgage assets because theduration of callable debt changes when interest rates change in a manner similar to changes in the duration ofmortgage assets. See “Liquidity and Capital Management—Liquidity Management—Debt Funding” foradditional information on our debt activity.
Derivative Instruments
Derivative instruments also are an integral part of our strategy in managing interest rate risk. Derivativeinstruments may be privately negotiated contracts, which are often referred to as over-the-counter derivatives,or they may be listed and traded on an exchange. When deciding whether to use derivatives, we consider a
183

number of factors, such as cost, efficiency, the effect on our liquidity, results of operations, and our overallinterest rate risk management strategy.
The derivatives we use for interest rate risk management purposes fall into four broad categories:
• Interest rate swap contracts. An interest rate swap is a transaction between two parties in which eachagrees to exchange, or swap, interest payments. The interest payment amounts are tied to different interestrates or indices for a specified period of time and are generally based on a notional amount of principal.The types of interest rate swaps we use include pay-fixed swaps, receive-fixed swaps and basis swaps.
• Interest rate option contracts. These contracts primarily include pay-fixed swaptions, receive-fixedswaptions, cancelable swaps and interest rate caps. A swaption is an option contract that allows us or acounterparty to enter into a pay-fixed or receive-fixed swap at some point in the future.
• Foreign currency swaps. These swaps convert debt that we issue in foreign-denominated currencies intoU.S. dollars. We enter into foreign currency swaps only to the extent that we issue foreign currency debt.
• Futures. These are standardized exchange-traded contracts that either obligate a buyer to buy an asset ata predetermined date and price or a seller to sell an asset at a predetermined date and price. The types offutures contracts we enter into include Eurodollar, U.S. Treasury and swaps.
We use interest rate swaps, interest rate options and futures, in combination with our issuance of debtsecurities, to better match the prepayment risk and duration of our assets with the duration of our liabilities.We are generally an end user of derivatives; our principal purpose in using derivatives is to manage ouraggregate interest rate risk profile within prescribed risk parameters. We generally only use derivatives that arerelatively liquid and straightforward to value. We use derivatives for four primary purposes:
(1) As a substitute for notes and bonds that we issue in the debt markets;
(2) To achieve risk management objectives not obtainable with debt market securities;
(3) To quickly and efficiently rebalance our portfolio and
(4) To hedge foreign currency exposure.
Decisions regarding the repositioning of our derivatives portfolio are based upon current assessments of ourinterest rate risk profile and economic conditions, including the composition of our consolidated balancesheets and relative mix of our debt and derivative positions, the interest rate environment and expected trends.
Table 52 presents, by derivative instrument type, our risk management derivative activity, excluding mortgagecommitments, for the years ended December 31, 2010 and 2009 along with the stated maturities of derivativesoutstanding as of December 31, 2010.
184

Table 52: Activity and Maturity Data for Risk Management Derivatives(1)
Pay-Fixed
Receive-Fixed(2) Basis(3)
ForeignCurrency(4)
Pay-Fixed
Receive-Fixed
InterestRate Caps Futures Other(5) Total
Interest Rate SwapsInterest Rate
Swaptions
(Dollars in millions)
Notional balance as ofDecember 31, 2008 . . . . . $ 546,916 $ 451,081 $ 24,560 $1,652 $ 79,500 $ 93,560 $ 500 $ — $827 $1,198,596
Additions . . . . . . . . . . . . 297,379 279,854 2,765 577 32,825 19,175 6,500 — 13 639,088
Terminations(6) . . . . . . . . (461,695) (455,518) (24,100) (692) (13,025) (37,355) — — (92) (992,477)
Notional balance as ofDecember 31, 2009 . . . . . $ 382,600 $ 275,417 $ 3,225 $1,537 $ 99,300 $ 75,380 $7,000 $ — $748 $ 845,207
Additions . . . . . . . . . . . . 212,214 250,417 55 636 51,700 51,025 — 598 — 566,645
Terminations(6) . . . . . . . . (317,587) (301,657) (2,795) (613) (53,850) (47,790) — (353) (59) (724,704)
Notional balance as ofDecember 31, 2010 . . . . . $ 277,227 $ 224,177 $ 485 $1,560 $ 97,150 $ 78,615 $7,000 $ 245 $689 $ 687,148
Future maturities of notionalamounts:(7)
Less than 1 year . . . . . . . $ 70,656 $ 14,200 $ 50 $ 386 $ 20,750 $ — $ — $ 125 $ 75 $ 106,242
1 to less than 5 years . . . . 90,788 168,000 35 — 35,300 4,500 7,000 120 593 306,336
5 to less than 10 years. . . . 96,400 29,632 100 511 10,200 20,970 — — 21 157,834
10 years and over . . . . . . . 19,383 12,345 300 663 30,900 53,145 — — — 116,736
Total . . . . . . . . . . . . . $ 277,227 $ 224,177 $ 485 $1,560 $ 97,150 $ 78,615 $7,000 $ 245 $689 $ 687,148
Weighted-average interest rateas of December 31, 2010:
Pay rate . . . . . . . . . . . . . 2.84% 0.29% 0.09% — 5.14% — — — —
Receive rate . . . . . . . . . . 0.28% 2.27% 4.61% — — 4.15% 3.58% — —
Weighted-average interest rateas of December 31, 2009:
Pay rate . . . . . . . . . . . . . 3.46% 0.26% 0.05% — 5.46% — — — —
Receive rate . . . . . . . . . . 0.26% 3.47% 1.59% — — 4.45% 3.58% — —
(1) Dollars represent notional amounts that indicate only the amount on which payments are being calculated and do notrepresent the amount at risk of loss.
(2) Notional amounts include swaps callable by Fannie Mae of $394 million, $406 million and $418 million as ofDecember 31, 2010, 2009 and 2008, respectively. The notional amounts of swaps callable by derivatives counterpartieswere $3.2 billion and $10.4 billion as of December 31, 2010 and 2008, respectively. There were no swaps callable byderivatives counterparties as of December 31, 2009.
(3) Notional amounts include swaps callable by derivatives counterparties of $50 million, $610 million and $925 millionas of December 31, 2010, 2009 and 2008, respectively.
(4) Exchange rate adjustments to foreign currency swaps existing at both the beginning and the end of the period areincluded in terminations. Exchange rate adjustments to foreign currency swaps that are added or terminated during theperiod are reflected in the respective categories.
(5) Includes swap credit enhancements and mortgage insurance contracts.(6) Includes matured, called, exercised, assigned and terminated amounts.(7) Amounts reported are based on contractual maturities. Some of these amounts represent swaps that are callable by
Fannie Mae or by a derivative counterparty, in which case the notional amount would cease to be outstanding prior tomaturity if the call option were exercised. See notes (2) and (3) for information on notional amounts that are callable.
Measurement of Interest Rate Risk
Our interest rate risk measurement framework is based on the fair value of our assets, liabilities and derivativeinstruments and the sensitivity of these values to changes in market factors. Estimating the impact ofprepayment risk is critical in managing interest rate risk. We use prepayment models to determine theestimated duration and convexity of our mortgage assets and various quantitative methods for measuring ourinterest rate exposure. Because no single method can reflect all aspects of the interest rate risk inherent in our
185

mortgage portfolio, we utilize various risk measurements that together provide a more complete assessment ofour aggregate interest rate risk profile.
We measure and monitor the fair value sensitivity to both small and large changes in the level of interest rates,changes in the shape of the yield curve, and changes in interest rate volatility. In addition, we perform a rangeof stress test analyses that measure the sensitivity of the portfolio to severe hypothetical changes in marketconditions.
Our fair value sensitivity and duration gap metric, which are based on our net portfolio defined above, arecalculated using internal models that require standard assumptions regarding interest rates and futureprepayments of principal over the remaining life of our securities. These assumptions are derived based on thecharacteristics of the underlying structure of the securities and historical prepayment rates experienced atspecified interest rate levels, taking into account current market conditions, the current mortgage rates of ourexisting outstanding loans, loan age and other factors. On a continuous basis, management makes judgmentsabout the appropriateness of the risk assessments and will make adjustments as appropriate to properly assessour interest rate exposure and manage our interest rate risk. The methodologies used to calculate risk estimatesare periodically changed on a prospective basis to reflect improvements in the underlying estimation process.
Below we present two quantitative metrics that provide estimates of our interest rate exposure: (1) fair valuesensitivity of net portfolio to changes in interest rate levels and slope of yield curve; and (2) duration gap. Wealso provide additional information that may be useful in evaluating our interest rate exposure. Our overallinterest rate exposure, as reflected in the fair value sensitivity to changes in interest rate levels and the slopeof the yield curve and duration gap, was within acceptable, pre-defined corporate limits as of December 31,2010.
Interest Rate Sensitivity to Changes in Interest Rate Level and Slope of Yield Curve
As part of our disclosure commitments with FHFA, we disclose on a monthly basis the estimated adverseimpact on the fair value of our net portfolio that would result from the following hypothetical situations:
• A 50 basis point shift in interest rates.
• A 25 basis point change in the slope of the yield curve.
In measuring the estimated impact of changes in the level of interest rates, we assume a parallel shift in allmaturities of the U.S. LIBOR interest rate swap curve.
In measuring the estimated impact of changes in the slope of the yield curve, we assume a constant 7-yearrate and a shift in the 1-year and 30-year rates of 16.7 basis points and 8.3 basis points, respectively. Webelieve the aforementioned interest rate shocks for our monthly disclosures represent moderate movements ininterest rates over a one-month period.
Duration Gap
Duration gap measures the price sensitivity of our assets and liabilities to changes in interest rates byquantifying the difference between the estimated durations of our assets and liabilities. Our duration gapanalysis reflects the extent to which the estimated maturity and repricing cash flows for our assets arematched, on average, over time and across interest rate scenarios to the estimated cash flows of our liabilities.A positive duration indicates that the duration of our assets exceeds the duration of our liabilities. We discloseduration gap on a monthly basis under the caption “Interest Rate Risk Disclosures” in our MonthlySummaries, which are available on our website and announced in a press release.
The sensitivity measures presented in Table 53, which we disclose on a quarterly basis as part of ourdisclosure commitments with FHFA, are an extension of our monthly sensitivity measures. There are threeprimary differences between our monthly sensitivity disclosure and the quarterly sensitivity disclosurepresented below: (1) the quarterly disclosure is expanded to include the sensitivity results for larger rate levelshocks of plus or minus 100 basis points; (2) the monthly disclosure reflects the estimated pre-tax impact onthe market value of our net portfolio calculated based on a daily average, while the quarterly disclosure
186

reflects the estimated pre-tax impact calculated based on the estimated financial position of our net portfolioand the market environment as of the last business day of the quarter; and (3) the monthly disclosure showsthe most adverse pre-tax impact on the market value of our net portfolio from the hypothetical interest rateshocks, while the quarterly disclosure includes the estimated pre-tax impact of both up and down interest rateshocks.
In addition, Table 53 also provides the average, minimum, maximum and standard deviation for duration gapand for the most adverse market value impact on the net portfolio for non-parallel and parallel interest rateshocks for the three months ended December 31, 2010.
Table 53: Interest Rate Sensitivity of Net Portfolio to Changes in Interest Rate Level and Slope of Yield Curve(1)
2010 2009As of December 31,
(Dollars in billions)
Rate level shock:
-100 basis points . . . . . . . . . . . . . . . . . . . . . . . . . . . . . . . . . . . . . . . . . . . . . . . . . . . $(0.8) $(0.1)
-50 basis points . . . . . . . . . . . . . . . . . . . . . . . . . . . . . . . . . . . . . . . . . . . . . . . . . . . . (0.2) 0.1
+50 basis points . . . . . . . . . . . . . . . . . . . . . . . . . . . . . . . . . . . . . . . . . . . . . . . . . . . (0.2) (0.4)
+100 basis points . . . . . . . . . . . . . . . . . . . . . . . . . . . . . . . . . . . . . . . . . . . . . . . . . . . (0.5) (0.9)
Rate slope shock:
-25 basis points (flattening). . . . . . . . . . . . . . . . . . . . . . . . . . . . . . . . . . . . . . . . . . . . (0.1) (0.2)
+25 basis points (steepening) . . . . . . . . . . . . . . . . . . . . . . . . . . . . . . . . . . . . . . . . . . 0.1 0.1
DurationGap
Rate Slope Shock25 Bps
Rate Level Shock50 Bps
For the Three Months Ended December 31, 2010
(In months)Exposure
(Dollars in billions)
Average . . . . . . . . . . . . . . . . . . . . . . . . . . . . . . . . . . . . . 0.3 $0.1 $0.3
Minimum . . . . . . . . . . . . . . . . . . . . . . . . . . . . . . . . . . . (0.7) — —
Maximum . . . . . . . . . . . . . . . . . . . . . . . . . . . . . . . . . . . 0.9 0.1 0.4
Standard deviation . . . . . . . . . . . . . . . . . . . . . . . . . . . . . 0.3 — 0.1
(1) Computed based on changes in LIBOR swap rates.
A majority of the interest rate risk associated with our mortgage-related securities and loans is hedged withour debt issuance, which includes callable debt. We use derivatives to help manage the residual interest raterisk exposure between our assets and liabilities. Derivatives have enabled us to keep our interest-rate riskexposure at consistently low levels in a wide range of interest-rate environments. Table 54 shows an exampleof how derivatives impacted the net market value exposure for a 50 basis point parallel interest rate shock.
Table 54: Derivative Impact on Interest Rate Risk (50 Basis Points)
BeforeDerivatives
AfterDerivatives
Effect ofDerivatives
(Dollars in billions)
As of December 31, 2010 . . . . . . . . . . . . . . . . . . . . . . . . . . . . . . . . . $(0.9) $(0.2) $0.7
As of December 31, 2009 . . . . . . . . . . . . . . . . . . . . . . . . . . . . . . . . . $(2.1) $(0.4) $1.7
Other Interest Rate Risk Information
The interest rate risk measures discussed above exclude the impact of changes in the fair value of our netguaranty assets resulting from changes in interest rates. We exclude our guaranty business from thesesensitivity measures based on our current assumption that the guaranty fee income generated from futurebusiness activity will largely replace guaranty fee income lost due to mortgage prepayments.
187

We provide additional interest rate sensitivities below in Table 55, including separate disclosure of thepotential impact on the fair value of our trading assets and our other financial instruments for the periodsindicated, from the same hypothetical changes in the level of interest rates as presented above in Table 53. Wealso assume a parallel shift in all maturities along the interest rate swap curve in calculating these sensitivities.We believe these interest rate changes represent reasonably possible near-term changes in interest rates overthe next twelve months.
Table 55: Interest Rate Sensitivity of Financial Instruments
EstimatedFair Value -100 -50 +50 +100
Change in Interest Rates(in basis points)
Pre-tax Effect on Estimated FairValue
As of December 31, 2010
(Dollars in billions)
Trading financial instruments . . . . . . . . . . . . . . . . . . . . . . . . . . . . . . $ 56.9 $ 0.9 $0.4 $(0.4) $(0.8)
Other financial instruments, net(1)(2) . . . . . . . . . . . . . . . . . . . . . . . . . (201.1) 10.8 4.1 (3.9) (6.1)
EstimatedFair Value -100 -50 +50 +100
Change in Interest Rates(in basis points)
Pre-tax Effect on Estimated FairValue
As of December 31, 2009
(Dollars in billions)
Trading financial instruments . . . . . . . . . . . . . . . . . . . . . . . . . . . . . $ 111.9 $ 2.7 $ 1.6 $(1.9) $(4.0)
Guaranty assets and guaranty obligations, net(1) . . . . . . . . . . . . . . . . . (149.3) 11.3 5.7 (6.0) (4.3)
Other financial instruments, net(2) . . . . . . . . . . . . . . . . . . . . . . . . . . (72.5) (2.2) (1.1) 1.2 2.7
(1) Consists of the net of “Guaranty assets” and “Guaranty obligations” reported in our consolidated balance sheets. Inaddition, includes certain amounts that have been reclassified from “Mortgage loans held for investment, net ofallowance for loan losses” reported in our consolidated balance sheets to reflect how the risk of the interest rate andcredit risk components of these loans are managed by our business segments.
(2) Also consists of the net of all other financial instruments reported in “Note 19, Fair Value.”
Liquidity Risk Management
See “Liquidity and Capital Management—Liquidity Management—Liquidity Risk Management Practices andContingency Planning” for a discussion on how we manage liquidity risk.
Operational Risk Management
Our corporate operational risk framework is based on the OFHEO Enterprise Guidance on Operational RiskManagement, published September 23, 2008. Our framework is intended to provide a methodology to identify,assess, mitigate, control and monitor operational risks across the company. Included in this framework is arequirement and plan for the development of a new system for tracking and reporting of operational riskincidents. The framework also includes a methodology for business owners to conduct risk and control selfassessments to self identify potential operational risks and points of execution failure, the effectiveness ofassociated controls, and document corrective action plans to close identified deficiencies. This methodology isin its early stage of execution and the success of our operational risk effort will depend on the consistentexecution of the operational risk programs and the timely remediation of high operational risk issues.
We have made a number of enhancements to our operational risk management efforts in 2010 including ourbusiness process focus, policies and framework. To quantify our operational risk exposure, we rely on theBasel Standardized approach, which is based on a percentage of revenue. As our operational risk managementprogram matures, it is our goal to measure our operational risk exposure using quantitative models that willleverage data from our various operational risk programs.
188

Management of Business Resiliency
Our business resiliency program is designed to provide reasonable assurance for continuity of critical businessoperations in the event of disruptions caused by the loss of facilities, technology or personnel. Despiteproactive planning, testing and continuous preparation of back up venues, these measures may not prevent asignificant business disruption from an improbable but highly catastrophic event.
Non-Mortgage Related Fraud Risk
Our anti-fraud program provides a framework for managing non-mortgage related fraud risk. The program isdesigned to provide reasonable assurance for the prevention and detection of non-mortgage related fraudulentactivity. However, because fraudulent activity requires the intentional circumvention of the internal controlstructure, the efforts of the program may not always prevent, or immediately detect, instances of such activity.
See “Risk Factors” for a discussion on our operational risk.
189

GLOSSARY OF TERMS USED IN THIS REPORT
Terms used in this report have the following meanings, unless the context indicates otherwise.
An “Acquired credit-impaired loan” refers to a loan we have acquired for which there is evidence of creditdeterioration since origination and for which it is probable we will not be able to collect all of thecontractually due cash flows. We record our net investment in such loans at the lower of the acquisition costof the loan or the estimated fair value of the loan at the date of acquisition. Typically, loans we acquire fromour MBS trusts pursuant to our option to purchase upon default meet these criteria. Because we acquire theseloans from our MBS trusts at par value plus accrued interest, to the extent the par value of a loan exceeds theestimated fair value at the time we acquire the loan, we record the related fair value loss as a charge againstthe “Reserve for guaranty losses.”
“Alt-A mortgage loan” or “Alt-A loan” generally refers to a mortgage loan originated under a lender’sprogram offering reduced or alternative documentation than that required for a full documentation mortgageloan but may also include other alternative product features. As a result, Alt-A mortgage loans have a higherrisk of default than non-Alt-A mortgage loans. In reporting our Alt-A exposure, we have classified mortgageloans as Alt-A if the lenders that delivered the mortgage loans to us classified the loans as Alt-A based ondocumentation or other product features. We have classified private-label mortgage-related securities held inour investment portfolio as Alt-A if the securities were labeled as such when issued.
“Business volume” or “new business acquisitions” refers to the sum in any given period of the unpaidprincipal balance of: (1) the mortgage loans and mortgage-related securities we purchase for our investmentportfolio; (2) the mortgage loans we securitize into Fannie Mae MBS that are acquired by third parties; and(3) credit enhancements that we provide on our mortgage assets. It excludes mortgage loans we securitizefrom our portfolio and the purchase of Fannie Mae MBS for our investment portfolio.
“Buy-ups” refer to upfront payments we make to lenders to adjust the monthly contractual guaranty fee rateon a Fannie Mae MBS so that the pass-through coupon rate on the MBS is in a more easily tradableincrement of a whole or half percent.
“Buy-downs” refer to upfront payments we receive from lenders to adjust the monthly contractual guarantyfee rate on a Fannie Mae MBS so that the pass-through coupon rate on the MBS is in a more easily tradableincrement of a whole or half percent.
“Charge-off” refers to loan amounts written off as uncollectible bad debts. When repayment is consideredunlikely, these loan amounts are removed from our consolidated balance sheet and charged against our lossreserves.
“Conventional mortgage” refers to a mortgage loan that is not guaranteed or insured by the U.S. governmentor its agencies, such as the VA, the FHA or the Rural Development Housing and Community FacilitiesProgram of the Department of Agriculture.
“Credit enhancement” refers to an agreement used to reduce credit risk by requiring collateral, letters ofcredit, mortgage insurance, corporate guarantees, or other agreements to provide an entity with some assurancethat it will be compensated to some degree in the event of a financial loss.
“Duration” refers to the sensitivity of the value of a security to changes in interest rates. The duration of afinancial instrument is the expected percentage change in its value in the event of a change in interest rates of100 basis points.
“Guaranty book of business” refers to the sum of the unpaid principal balance of: (1) mortgage loans held inour mortgage portfolio; (2) Fannie Mae MBS held in our mortgage portfolio; (3) Fannie Mae MBS held bythird parties; and (4) other credit enhancements that we provide on mortgage assets. It excludes non-FannieMae mortgage-related securities held in our investment portfolio for which we do not provide a guaranty.
“HomeSaver Advance” refers to a 15-year unsecured personal loan in an amount equal to all past duepayments relating to a borrower’s first lien mortgage loan, generally up to the lesser of $15,000 or 15% of the
190

unpaid principal balance of the delinquent first lien loan. The advance is used to bring the first lien mortgageloan current.
“HomeSaver Advance fair value losses” refer to losses recorded at the time we make a HomeSaver Advanceloan to a borrower, which result from our recording HomeSaver Advance loans at their estimated fair value atthe date of purchase from the servicers.
“Implied volatility” refers to the market’s expectation of the magnitude of future changes in interest rates.
“Interest rate swap” refers to a transaction between two parties in which each agrees to exchange paymentstied to different interest rates or indices for a specified period of time, generally based on a notional principalamount. An interest rate swap is a type of derivative.
“LIHTC partnerships” refer to low-income housing tax credit limited partnerships or limited liabilitycompanies.
“Loans,” “mortgage loans” and “mortgages” refer to both whole loans and loan participations, secured byresidential real estate, cooperative shares or by manufactured housing units.
“Mortgage assets,” when referring to our assets, refers to both mortgage loans and mortgage-related securitieswe hold in our investment portfolio.
“Mortgage credit book of business” refers to the sum of the unpaid principal balance of: (1) mortgage loansheld in our mortgage portfolio; (2) Fannie Mae MBS held in our mortgage portfolio; (3) non-Fannie Maemortgage-related securities held in our investment portfolio; (4) Fannie Mae MBS held by third parties; and(5) other credit enhancements that we provide on mortgage assets.
“Multifamily mortgage loan” refers to a mortgage loan secured by a property containing five or moreresidential dwelling units.
“Notional amount” refers to the hypothetical dollar amount in an interest rate swap transaction on whichexchanged payments are based. The notional amount in an interest rate swap transaction generally is not paidor received by either party to the transaction and is typically significantly greater than the potential market orcredit loss that could result from such transaction.
“Option-adjusted spread” or “OAS” refers to the incremental expected return between a security, loan orderivative contract and a benchmark yield curve (typically, U.S. Treasury securities, LIBOR and swaps, oragency debt securities). The OAS provides explicit consideration of the variability in the security’s cash flowsacross multiple interest rate scenarios resulting from any options embedded in the security, such asprepayment options. For example, the OAS of a mortgage that can be prepaid by the homeowner withoutpenalty is typically lower than a nominal yield spread to the same benchmark because the OAS reflects theexercise of the prepayment option by the homeowner, which lowers the expected return of the mortgageinvestor. In other words, OAS for mortgage loans is a risk-adjusted spread after consideration of theprepayment risk in mortgage loans. The market convention for mortgages is typically to quote their OAS toswaps. The OAS of our debt and derivative instruments are also frequently quoted to swaps. The OAS of ournet mortgage assets is therefore the combination of these two spreads to swaps and is the option-adjustedspread between our assets and our funding and hedging instruments.
“Outstanding Fannie Mae MBS” refers to the total unpaid principal balance of Fannie Mae MBS that is heldby third-party investors and held in our mortgage portfolio.
“Pay-fixed swap” refers to an agreement under which we pay a predetermined fixed rate of interest basedupon a set notional principal amount and receive a variable interest payment based upon a stated index, withthe index resetting at regular intervals over a specified period of time. These contracts generally increase invalue as interest rates rise and decrease in value as interest rates fall.
“Private-label securities” refers to mortgage-related securities issued by entities other than agency issuersFannie Mae, Freddie Mac or Ginnie Mae.
191

“Receive-fixed swap” refers to an agreement under which we make a variable interest payment based upon astated index, with the index resetting at regular intervals, and receive a predetermined fixed rate of interestbased upon a set notional amount and over a specified period of time. These contracts generally increase invalue as interest rates fall and decrease in value as interest rates rise.
“REMIC” or “Real Estate Mortgage Investment Conduit” refers to a type of mortgage-related security inwhich interest and principal payments from mortgages or mortgage-related securities are structured intoseparately traded securities.
“REO” refers to real-estate owned by Fannie Mae because we have foreclosed on the property or obtained theproperty through a deed-in-lieu of foreclosure.
“Severity rate” or “loss severity rate” refers to the percentage of our total loss, which includes the unpaidprincipal balance of a loan, purchased interest, and selling costs if applicable, that we believe will not berecovered in the event of default.
“Single-class Fannie Mae MBS” refers to Fannie Mae MBS where the investors receive principal and interestpayments in proportion to their percentage ownership of the MBS issue.
“Single-family mortgage loan” refers to a mortgage loan secured by a property containing four or fewerresidential dwelling units.
“Small balance loans” refers to multifamily loans with an original balance of less than $3 million nationwideor $5 million in high cost markets.
“Subprime mortgage loan” generally refers to a mortgage loan made to a borrower with a weaker creditprofile than that of a prime borrower. As a result of the weaker credit profile, subprime borrowers have ahigher likelihood of default than prime borrowers. Subprime mortgage loans were typically originated bylenders specializing in this type of business or by subprime divisions of large lenders, using processes uniqueto subprime loans. In reporting our subprime exposure, we have classified mortgage loans as subprime if themortgage loans were originated by one of these specialty lenders or a subprime division of a large lender. Weexclude loans originated by these lenders if we acquired the loans in accordance with our standardunderwriting criteria, which typically require compliance by the seller with our Selling Guide (includingstandard representations and warranties) and/or evaluation of the loans through our Desktop Underwritersystem. We have classified private-label mortgage-related securities held in our investment portfolio assubprime if the securities were labeled as such when issued.
“Structured Fannie Mae MBS” refers to Fannie Mae MBS that are resecuritizations of other Fannie MaeMBS.
“Swaptions” refers to options on interest rate swaps in the form of contracts granting an option to one partyand creating a corresponding commitment from the counterparty to enter into specified interest rate swaps inthe future. Swaptions are traded in the over-the-counter market and not through an exchange.
Item 7A. Quantitative and Qualitative Disclosures About Market Risk
Quantitative and qualitative disclosure about market risk is set forth in “MD&A—Risk Management—MarketRisk Management, including Interest Rate Risk Management.”
Item 8. Financial Statements and Supplementary Data
Our consolidated financial statements and notes thereto are included elsewhere in this annual report onForm 10-K as described below in “Exhibits and Financial Statement Schedules.”
Item 9. Changes in and Disagreements with Accountants on Accounting and Financial Disclosure
None.
192

Item 9A. Controls and Procedures
OVERVIEW
We are required under applicable laws and regulations to maintain controls and procedures, which includedisclosure controls and procedures as well as internal control over financial reporting, as further describedbelow.
EVALUATION OF DISCLOSURE CONTROLS AND PROCEDURES
Disclosure Controls and Procedures
Disclosure controls and procedures refer to controls and other procedures designed to provide reasonableassurance that information required to be disclosed in the reports we file or submit under the Exchange Act isrecorded, processed, summarized and reported within the time periods specified in the rules and forms of theSEC. Disclosure controls and procedures include, without limitation, controls and procedures designed to providereasonable assurance that information required to be disclosed by us in the reports that we file or submit underthe Exchange Act is accumulated and communicated to management, including our Chief Executive Officer andDeputy Chief Financial Officer, who is acting as our chief financial officer, as appropriate, to allow timelydecisions regarding our required disclosure. In designing and evaluating our disclosure controls and procedures,management recognizes that any controls and procedures, no matter how well designed and operated, canprovide only reasonable assurance of achieving the desired control objectives, and management was required toapply its judgment in evaluating and implementing possible controls and procedures.
Evaluation of Disclosure Controls and Procedures
As required by Rule 13a-15 under the Exchange Act, management has evaluated, with the participation of ourChief Executive Officer and Deputy Chief Financial Officer, the effectiveness of our disclosure controls andprocedures as in effect as of December 31, 2010, the end of the period covered by this report. As a result ofmanagement’s evaluation, our Chief Executive Officer and Deputy Chief Financial Officer concluded that ourdisclosure controls and procedures were not effective at a reasonable assurance level as of December 31, 2010or as of the date of filing this report.
Our disclosure controls and procedures were not effective as of December 31, 2010 or as of the date of filingthis report because they did not adequately ensure the accumulation and communication to management ofinformation known to FHFA that is needed to meet our disclosure obligations under the federal securities laws.
As a result, we were not able to rely upon the disclosure controls and procedures that were in place as ofDecember 31, 2010 or as of the date of this filing, and we continue to have a material weakness in ourinternal control over financial reporting. This material weakness is described in more detail below under“Description of Material Weakness.”
Based on discussions with FHFA and the structural nature of the weakness in our disclosure controls andprocedures, it is likely that we will not remediate the weakness in our disclosure controls and proceduresrelating to information known to FHFA while we are under conservatorship.
MANAGEMENT’S REPORT ON INTERNAL CONTROL OVER FINANCIAL REPORTING
Overview
Our management is responsible for establishing and maintaining adequate internal control over financialreporting. Internal control over financial reporting, as defined in rules promulgated under the Exchange Act, isa process designed by, or under the supervision of, our Chief Executive Officer and Deputy Chief FinancialOfficer and effected by our Board of Directors, management and other personnel to provide reasonableassurance regarding the reliability of financial reporting and the preparation of financial statements for external
193

purposes in accordance with GAAP. Internal control over financial reporting includes those policies andprocedures that:
• pertain to the maintenance of records that in reasonable detail accurately and fairly reflect the transactionsand dispositions of our assets;
• provide reasonable assurance that transactions are recorded as necessary to permit preparation of financialstatements in accordance with GAAP, and that our receipts and expenditures are being made only inaccordance with authorizations of our management and our Board of Directors; and
• provide reasonable assurance regarding prevention or timely detection of unauthorized acquisition, use ordisposition of our assets that could have a material effect on our financial statements.
Internal control over financial reporting cannot provide absolute assurance of achieving financial reportingobjectives because of its inherent limitations. Internal control over financial reporting is a process that involveshuman diligence and compliance and is subject to lapses in judgment and breakdowns resulting from humanfailures. Internal control over financial reporting also can be circumvented by collusion or improper override.Because of such limitations, there is a risk that material misstatements may not be prevented or detected on atimely basis by internal control over financial reporting. However, these inherent limitations are knownfeatures of the financial reporting process, and it is possible to design into the process safeguards to reduce,though not eliminate, this risk.
Our management assessed the effectiveness of our internal control over financial reporting as of December 31,2010. In making its assessment, management used the criteria established in Internal Control—IntegratedFramework issued by the Committee of Sponsoring Organizations of the Treadway Commission (“COSO”).Management’s assessment of our internal control over financial reporting as of December 31, 2010 identified amaterial weakness, which is described below. Because of this material weakness, management has concludedthat our internal control over financial reporting was not effective as of December 31, 2010 or as of the dateof filing this report.
Our independent registered public accounting firm, Deloitte & Touche LLP, has issued an audit report on ourinternal control over financial reporting, expressing an adverse opinion on the effectiveness of our internalcontrol over financial reporting as of December 31, 2010. This report is included below.
Description of Material Weakness
The Public Company Accounting Oversight Board’s Auditing Standard No. 5 defines a material weakness as adeficiency or a combination of deficiencies in internal control over financial reporting, such that there is areasonable possibility that a material misstatement of the company’s annual or interim financial statementswill not be prevented or detected on a timely basis.
Management has determined that we had the following material weakness as of December 31, 2010:
• Disclosure Controls and Procedures. We have been under the conservatorship of FHFA sinceSeptember 6, 2008. Under the Regulatory Reform Act, FHFA is an independent agency that currentlyfunctions as both our conservator and our regulator with respect to our safety, soundness and mission.Because of the nature of the conservatorship under the Regulatory Reform Act, which places us under the“control” of FHFA (as that term is defined by securities laws), some of the information that we may needto meet our disclosure obligations may be solely within the knowledge of FHFA. As our conservator,FHFA has the power to take actions without our knowledge that could be material to our shareholders andother stakeholders, and could significantly affect our financial performance or our continued existence asan ongoing business. Although we and FHFA attempted to design and implement disclosure policies andprocedures that would account for the conservatorship and accomplish the same objectives as a disclosurecontrols and procedures policy of a typical reporting company, there are inherent structural limitations onour ability to design, implement, test or operate effective disclosure controls and procedures. As both ourregulator and our conservator under the Regulatory Reform Act, FHFA is limited in its ability to designand implement a complete set of disclosure controls and procedures relating to Fannie Mae, particularly
194

with respect to current reporting pursuant to Form 8-K. Similarly, as a regulated entity, we are limited inour ability to design, implement, operate and test the controls and procedures for which FHFA isresponsible.
Due to these circumstances, we have not been able to update our disclosure controls and procedures in amanner that adequately ensures the accumulation and communication to management of informationknown to FHFA that is needed to meet our disclosure obligations under the federal securities laws,including disclosures affecting our consolidated financial statements. As a result, we did not maintaineffective controls and procedures designed to ensure complete and accurate disclosure as required byGAAP as of December 31, 2010 or as of the date of filing this report. Based on discussions with FHFAand the structural nature of this weakness, it is likely that we will not remediate this material weaknesswhile we are under conservatorship.
MITIGATING ACTIONS RELATING TO MATERIAL WEAKNESS
Disclosure Controls and Procedures
As described above under “Description of Material Weakness,” we continue to have a material weakness inour internal control over financial reporting relating to our disclosure controls and procedures. However, weand FHFA have engaged in the following practices intended to permit accumulation and communication tomanagement of information needed to meet our disclosure obligations under the federal securities laws:
• FHFA has established the Office of Conservatorship Operations, which is intended to facilitate operationof the company with the oversight of the conservator.
• We have provided drafts of our SEC filings to FHFA personnel for their review and comment prior tofiling. We also have provided drafts of external press releases, statements and speeches to FHFApersonnel for their review and comment prior to release.
• FHFA personnel, including senior officials, have reviewed our SEC filings prior to filing, including thisannual report on Form 10-K for the year ended December 31, 2010 (“2010 Form 10-K”), and engaged indiscussions regarding issues associated with the information contained in those filings. Prior to filing our2010 Form 10-K, FHFA provided Fannie Mae management with a written acknowledgement that it hadreviewed the 2010 Form 10-K, and it was not aware of any material misstatements or omissions in the2010 Form 10-K and had no objection to our filing the Form 10-K.
• The Director of FHFA or, after August 2009, the Acting Director of FHFA, and our Chief ExecutiveOfficer have been in frequent communication, typically meeting on a weekly basis.
• FHFA representatives attend meetings frequently with various groups within the company to enhance theflow of information and to provide oversight on a variety of matters, including accounting, credit andmarket risk management, liquidity, external communications and legal matters.
• Senior officials within FHFA’s Office of the Chief Accountant have met frequently with our senior financeexecutives regarding our accounting policies, practices and procedures.
195

CHANGES IN INTERNAL CONTROL OVER FINANCIAL REPORTING
Overview
Management has evaluated, with the participation of our Chief Executive Officer and Deputy Chief FinancialOfficer, whether any changes in our internal control over financial reporting that occurred during our lastfiscal quarter have materially affected, or are reasonably likely to materially affect, our internal control overfinancial reporting. Below we describe changes in our internal control over financial reporting sinceSeptember 30, 2010 that management believes have materially affected, or are reasonably likely to materiallyaffect, our internal control over financial reporting.
• Change in Management. During the fourth quarter of 2010, our Chief Financial Officer resigned fromthe company and our Deputy Chief Financial Officer assumed his responsibilities as chief financialofficer.
• Model Change. In the fourth quarter of 2010, we transitioned from using an internal model to a third-party vendor as the source for determining cash flows used to assess other-than-temporary impairment onAlt-A and subprime private-label securities. The implementation of the third-party vendor model requiredoperational and system changes to enable the processing of the cash flows and analytical data that includecertain internal controls. Accordingly, the implementation has required revisions to our internal controlover financial reporting. We reviewed the implementation of the third-party vendor model, as well as thecontrols impacted, and made appropriate changes to affected internal controls.
196

REPORT OF INDEPENDENT REGISTERED PUBLIC ACCOUNTING FIRM
To Fannie Mae:
We have audited Fannie Mae and consolidated entities’ (in conservatorship) (the “Company”) internal controlover financial reporting as of December 31, 2010, based on criteria established in Internal Control—IntegratedFramework issued by the Committee of Sponsoring Organizations of the Treadway Commission. TheCompany’s management is responsible for maintaining effective internal control over financial reporting andfor its assessment of the effectiveness of internal control over financial reporting, included in theaccompanying Management’s Report on Internal Control over Financial Reporting. Our responsibility is toexpress an opinion on the Company’s internal control over financial reporting based on our audit.
We conducted our audit in accordance with the standards of the Public Company Accounting Oversight Board(United States). Those standards require that we plan and perform the audit to obtain reasonable assuranceabout whether effective internal control over financial reporting was maintained in all material respects. Ouraudit included obtaining an understanding of internal control over financial reporting, assessing the risk that amaterial weakness exists, testing and evaluating the design and operating effectiveness of internal controlbased on that risk, and performing such other procedures as we considered necessary in the circumstances. Webelieve that our audit provides a reasonable basis for our opinion.
A company’s internal control over financial reporting is a process designed by, or under the supervision of, thecompany’s principal executive and principal financial officers, or persons performing similar functions, andeffected by the company’s board of directors, management, and other personnel to provide reasonableassurance regarding the reliability of financial reporting and the preparation of financial statements for externalpurposes in accordance with generally accepted accounting principles. A company’s internal control overfinancial reporting includes those policies and procedures that (1) pertain to the maintenance of records that,in reasonable detail, accurately and fairly reflect the transactions and dispositions of the assets of thecompany; (2) provide reasonable assurance that transactions are recorded as necessary to permit preparation offinancial statements in accordance with generally accepted accounting principles, and that receipts andexpenditures of the company are being made only in accordance with authorizations of management anddirectors of the company; and (3) provide reasonable assurance regarding prevention or timely detection ofunauthorized acquisition, use, or disposition of the company’s assets that could have a material effect on thefinancial statements.
Because of the inherent limitations of internal control over financial reporting, including the possibility ofcollusion or improper management override of controls, material misstatements due to error or fraud may notbe prevented or detected on a timely basis. Also, projections of any evaluation of the effectiveness of theinternal control over financial reporting to future periods are subject to the risk that the controls may becomeinadequate because of changes in conditions, or that the degree of compliance with the policies or proceduresmay deteriorate.
A material weakness is a deficiency, or a combination of deficiencies, in internal control over financialreporting, such that there is a reasonable possibility that a material misstatement of the company’s annual orinterim financial statements will not be prevented or detected on a timely basis. The following materialweakness has been identified and included in management’s assessment:
• Disclosure Controls and Procedures—The Company’s disclosure controls and procedures did notadequately ensure the accumulation and communication to management of information known to theFederal Housing Finance Agency that is needed to meet its disclosure obligations under the federalsecurities laws as they relate to financial reporting.
This material weakness was considered in determining the nature, timing, and extent of audit tests applied inour audit of the consolidated financial statements as of and for the year ended December 31, 2010, of theCompany and this report does not affect our report on such financial statements.
In our opinion, because of the effect of the material weakness identified above on the achievement of theobjectives of the control criteria, the Company has not maintained effective internal control over financial
197

reporting as of December 31, 2010, based on the criteria established in Internal Control—IntegratedFramework issued by the Committee of Sponsoring Organizations of the Treadway Commission.
We have also audited, in accordance with the standards of the Public Company Accounting Oversight Board(United States), the consolidated financial statements as of and for the year ended December 31, 2010, of theCompany and our report dated February 24, 2011 expressed an unqualified opinion on those financialstatements and included explanatory paragraphs regarding the Company’s adoption of new accountingstandards and the Company’s dependence upon the continued support of the United States Government,various United States Government agencies and the Company’s conservator and regulator, the Federal HousingFinance Agency.
/s/ DELOITTE & TOUCHE LLP
Washington, DCFebruary 24, 2011
198

Item 9B. Other Information
None.
PART III
Item 10. Directors, Executive Officers and Corporate Governance
DIRECTORS
Our current directors are listed below. They have provided the following information about their principaloccupation, business experience and other matters. Upon FHFA’s appointment as our conservator onSeptember 6, 2008, FHFA succeeded to all rights, titles, powers and privileges of any director of Fannie Maewith respect to Fannie Mae and its assets. More information about FHFA’s September 6, 2008 appointment asour conservator and its subsequent reconstitution of our Board and direction regarding the Board’s functionand authorities can be found below in “Corporate Governance—Conservatorship and Delegation of Authorityto Board of Directors.”
As discussed in more detail below under “Corporate Governance—Composition of Board of Directors,” FHFA,as conservator, appointed an initial group of directors to our Board following our entry into conservatorship,delegated to the Board the authority to appoint directors to subsequent vacancies subject to conservator review,and defined the term of service of directors during conservatorship. The Nominating and CorporateGovernance Committee evaluates the qualifications of individual directors on an annual basis. In itsassessment of current directors and evaluation of potential candidates for director, the Nominating andCorporate Governance Committee considers, among other things, whether the Board as a whole possessesmeaningful experience, qualifications and skills in the following subject areas:
• business;
• finance;
• capital markets;
• accounting;
• risk management;
• public policy;
• mortgage lending, real estate, low-income housing and/or homebuilding; and
• the regulation of financial institutions.
See “Corporate Governance—Composition of Board of Directors” below for further information on the factorsthe Nominating and Corporate Governance Committee considers in evaluating and selecting board members.
Dennis R. Beresford, 72, has served as Ernst & Young Executive Professor of Accounting at the J.M. TullSchool of Accounting, Terry College of Business, University of Georgia since 1997. From 1987 to 1997,Mr. Beresford served as Chairman of the Financial Accounting Standards Board, or FASB, the designatedorganization in the private sector for establishing standards of financial accounting and reporting in theU.S. From 1961 to 1986, Mr. Beresford was with Ernst & Young LLP, including ten years as a Senior Partnerand National Director of Accounting. In addition, Mr. Beresford served on the SEC Advisory Committee onImprovements to Financial Reporting. Mr. Beresford is currently a member of the Board of Directors andChairman of the Audit Committee of Kimberly-Clark Corporation and of Legg Mason, Inc. He also serves asa member of the Risk Committee of Legg Mason, Inc. He previously was a member of the Board of Directorsof MCI, Inc. from July 2002 to January 2006, where he served as Chairman of the Audit Committee.Mr. Beresford is a certified public accountant. Mr. Beresford initially became a Fannie Mae director in May2006, before we were put into conservatorship, and FHFA appointed Mr. Beresford to Fannie Mae’s Board in
199

December 2008. Mr. Beresford serves as Chair of the Audit Committee and is also a member of theCompensation Committee and the Executive Committee.
The Nominating and Corporate Governance Committee concluded that Mr. Beresford should continue to serveas a director due to his extensive experience in accounting, finance, business and risk management, which hegained in the positions described above.
William Thomas Forrester, 62, served as Chief Financial Officer of The Progressive Corporation from 1999until his retirement in March 2007, and served in a variety of senior financial and operating positions withProgressive prior to that time. Prior to joining The Progressive Corporation in 1984, Mr. Forrester was withPrice Waterhouse LLP, a major public accounting firm, from 1976 to 1984. Mr. Forrester is currently amember of the Board of Directors and Chairman of the Audit Committee of The Navigators Group, Inc. Healso serves on the Finance Committee and Compensation Committee of The Navigators Group, Inc.Mr. Forrester is also currently a member of the Board of Directors of Alterra Capital Holdings Limited, wherehe serves on the Audit and Risk Management Committee. He previously was a member of the Board ofDirectors of Axis Capital Holdings Limited from December 2003 to May 2006, where he served as Chairmanof the Audit Committee. Mr. Forrester has been a Fannie Mae director since December 2008. Mr. Forresterserves as a member of both the Audit Committee and the Nominating and Corporate Governance Committee.
The Nominating and Corporate Governance Committee concluded that Mr. Forrester should continue to serveas a director due to his extensive experience in business, finance, accounting and risk management, which hegained in the positions described above.
Brenda J. Gaines, 61, served as President and Chief Executive Officer of Diners Club North America, asubsidiary of Citigroup, from October 2002 until her retirement in April 2004. She served as President, DinersClub North America, from February 1999 to September 2002. From 1988 until her appointment as President,she held various positions within Diners Club North America, Citigroup and Citigroup’s predecessorcorporations. She also served as Deputy Chief of Staff for the Mayor of the City of Chicago from 1985 to1987 and as Chicago Commissioner of Housing from 1983 to 1985. Ms. Gaines also has over 12 years ofexperience with the Department of Housing and Urban Development, including serving as Deputy RegionalAdministrator from 1980 to 1981. Ms. Gaines is currently a member of the Board of Directors of OfficeDepot, Inc., where she serves as Chair of the Audit Committee and a member of the Corporate Governanceand Nominating Committee. Ms. Gaines is also a member of the Board of Directors of NICOR, Inc., whereshe serves as a member of the Corporate Governance Committee, and Tenet Healthcare Corporation, whereshe serves as a member of both the Audit Committee and Compensation Committee. She previously was amember of the Board of Directors of CNA Financial Corporation from October 2004 to May 2007, where sheserved as Chair of the Audit Committee. Ms. Gaines initially became a Fannie Mae director in September2006, before we were put into conservatorship, and FHFA appointed Ms. Gaines to Fannie Mae’s Board inDecember 2008. Ms. Gaines serves as Chair of the Compensation Committee and is also a member of theAudit Committee and the Executive Committee.
The Nominating and Corporate Governance Committee concluded that Ms. Gaines should continue to serve asa director due to her extensive experience in business, finance, accounting, risk management, public policymatters, mortgage lending, low-income housing, and the regulation of financial institutions, which she gainedin the positions described above.
Charlynn Goins, 68, served as Chairperson of the Board of Directors of New York City Health and HospitalsCorporation from June 2004 to October 2008. She also served on the Board of Trustees of The MainstayFunds, New York Life Insurance Company’s retail family of funds, from June 2001 through July 2006 and onthe Board of Directors of The Community’s Bank from February 2001 through June 2004. Ms. Goins also wasa Senior Vice President of Prudential Financial, Inc. (formerly, Prudential Securities, Inc.) from 1990 to 1997.Ms. Goins serves as the Chairperson of the New York Community Trust. She also serves as a director and amember of the Organization and Compensation Committee of AXA Financial Inc. She is also a director ofAXA Equitable, MONY Life and MONY Life of America, which are subsidiaries of AXA Financial Inc.Ms. Goins is an attorney. Ms. Goins has been a Fannie Mae director since December 2008. Ms. Goins serves
200

as Chair of the Nominating and Corporate Governance Committee and is also a member of the CompensationCommittee and the Executive Committee.
The Nominating and Corporate Governance Committee concluded that Ms. Goins should continue to serve asa director due to her extensive experience in business, finance, public policy matters, and the regulation offinancial institutions, which she gained in the positions described above.
Frederick B. “Bart” Harvey III, 61, retired in March 2008 from his role as chairman of the Board of Trusteesof Enterprise Community Partners and Enterprise Community Investment, providers of development capitaland technical expertise to create affordable housing and rebuild communities. Enterprise is a national non-profit that raises funds from the private sector to finance homes primarily for low and very low incomepeople. Enterprise has also pioneered “green” affordable housing with its EnterpriseGreen Communitiesinitiative. Mr. Harvey was Enterprise’s chief executive officer from 1993 to 2007. He joined Enterprise in1984, and a year later became vice chairman. Before joining Enterprise, Mr. Harvey served for 10 years invarious domestic and international positions with Dean Witter Reynolds (now Morgan Stanley), leaving asManaging Director of Corporate Finance. Mr. Harvey was a member of the Board of Directors of the FederalHome Loan Bank of Atlanta from 1996 to 1999, a director of the National Housing Trust from 1990 to 2008,and also served as an executive committee member of the National Housing Conference from 1999 to 2008.Mr. Harvey initially became a Fannie Mae director in August 2008, before we were put into conservatorship,and FHFA appointed Mr. Harvey to Fannie Mae’s Board in December 2008. Mr. Harvey serves as a memberof the Audit Committee, the Nominating and Corporate Governance Committee, and the Risk Policy andCapital Committee.
The Nominating and Corporate Governance Committee concluded that Mr. Harvey should continue to serve asa director due to his extensive experience in business, finance, capital markets, risk management, public policymatters, mortgage lending, low-income housing and homebuilding, which he gained in the positions describedabove.
Philip A. Laskawy, 69, retired from Ernst & Young in September 2001, after having held several positionsduring his employment there from 1961 to 2001, including serving as Chairman and Chief Executive Officerfrom 1994 until his retirement in September 2001. Mr. Laskawy currently serves on the Boards of Directors ofGeneral Motors Corporation, Henry Schein, Inc., Lazard Ltd. and Loews Corporation. He is a member of theAudit Committee of each of these companies, including Chairman of the Audit Committee of General MotorsCorporation. He is also Chair of the Nominating and Governance Committee and a member of the StrategicAdvisory Committee at Henry Schein, Inc. Mr. Laskawy previously was a member of the Board of Directorsof The Progressive Corporation (from 2001 through December 2007) and Discover Financial Services (fromJune 2007 through September 2008). He served as Chairman of the Audit Committee at each of thesecompanies. Mr. Laskawy initially became a director and Chairman of Fannie Mae’s Board in September 2008.Mr. Laskawy is Chair of the Executive Committee.
The Nominating and Corporate Governance Committee concluded that Mr. Laskawy should continue to serveas a director due to his extensive experience in business, finance, accounting and risk management, which hegained in the positions described above.
Egbert L. J. Perry, 55, is the Chairman and Chief Executive Officer of The Integral Group LLC. Founded in1993 by Mr. Perry, Integral is a real estate advisory, investment management and development company basedin Atlanta. Mr. Perry has over 29 years experience as a real estate professional, including work in urbandevelopment, developing and investing in mixed-income, mixed-use communities, affordable/work forcehousing and commercial real estate projects in markets across the country. Mr. Perry currently serves as Chairof the Board of Directors of Atlanta Life Financial Group, where he serves as a member of the AuditCommittee, as Chair of the Advisory Board of the Penn Institute for Urban Research and as a trustee of theUniversity of Pennsylvania and Children’s Healthcare of Atlanta. Mr. Perry served from 2002 through 2008 asa director of the Federal Reserve Bank of Atlanta. Mr. Perry has been a Fannie Mae director sinceDecember 2008. Mr. Perry is a member of both the Nominating and Corporate Governance Committee and theRisk Policy and Capital Committee.
201

The Nominating and Corporate Governance Committee concluded that Mr. Perry should continue to serve as adirector due to his extensive experience in business, finance, accounting, mortgage lending, real estate, low-income housing and homebuilding, which he gained in the positions described above.
Jonathan Plutzik, 56, has served as Chairman of Betsy Ross Investors, LLC since August 2005. He also hasserved as President of the Jonathan Plutzik and Lesley Goldwasser Family Foundation Inc. and as Chairman ofthe Coro New York Leadership Center since January 2003. Mr. Plutzik served as Non-Executive Chairman ofthe Board of Directors at Firaxis Games from June 2002 to December 2005. Before that, he served from 1978to June 2002 in various positions with Credit Suisse First Boston, retiring in June 2002 from his role as ViceChairman. Mr. Plutzik has been a Fannie Mae director since November 2009. Mr. Plutzik is a member of boththe Compensation Committee and the Risk Policy and Capital Committee.
The Nominating and Corporate Governance Committee concluded that Mr. Plutzik should continue to serve asa director due to his extensive experience in business, finance, capital markets, risk management and theregulation of financial institutions, which he gained in the positions described above.
David H. Sidwell, 57, served as Executive Vice President and Chief Financial Officer of Morgan Stanley fromMarch 2004 to October 2007, when he retired. From 1984 to March 2004, Mr. Sidwell worked for JPMorganChase & Co. in a variety of financial and operating positions, most recently as Chief Financial Officer ofJPMorgan Chase’s investment bank from January 2000 to March 2004. Prior to joining JP Morgan in 1984,Mr. Sidwell was with Price Waterhouse LLP, a major public accounting firm, from 1975 to 1984. Mr. Sidwellserves as a Trustee of the International Accounting Standards Committee Foundation. Mr. Sidwell is currentlya member of the Board of Directors, Senior Independent Director, and Chair of the Risk Committee of UBSAG. He previously was a member of the Board of Directors of MSCI Inc. from November 2007 throughSeptember 2008, where he served as Chair of the Audit Committee and a member of the Nominating andCorporate Governance Committee. Mr. Sidwell has been a Fannie Mae director since December 2008.Mr. Sidwell is Chair of the Risk Policy and Capital Committee and a member of the Compensation Committeeand the Executive Committee.
The Nominating and Corporate Governance Committee concluded that Mr. Sidwell should continue to serve asa director due to his extensive experience in business, finance, capital markets, accounting, risk managementand the regulation of financial institutions, which he gained in the positions described above.
Michael J. Williams, 53, has been President and Chief Executive Officer of Fannie Mae since April 2009. Hepreviously served as Fannie Mae’s Executive Vice President and Chief Operating Officer from November 2005to April 2009. Mr. Williams also served as Fannie Mae’s Executive Vice President for Regulatory Agreementsand Restatement from February 2005 to November 2005, as President—Fannie Mae eBusiness from July 2000to February 2005 and as Senior Vice President—e-commerce from July 1999 to July 2000. Prior to this,Mr. Williams served in various roles in the Single-Family and Corporate Information Systems divisions ofFannie Mae. Mr. Williams joined Fannie Mae in 1991. Mr. Williams has been a Fannie Mae director sinceApril 2009. He is a member of the Executive Committee.
Mr. Williams serves as a member of our Board of Directors pursuant to a FHFA order that specifies that ourChief Executive Officer will serve as a member of the Board. In addition, the Nominating and CorporateGovernance Committee concluded that Mr. Williams should continue to serve as a director due to hisextensive experience in business, finance, accounting, mortgage lending, real estate, low-income housing andthe regulation of financial institutions, which he gained in the positions described above.
CORPORATE GOVERNANCE
Conservatorship and Delegation of Authority to Board of Directors
On September 6, 2008, the Director of FHFA appointed FHFA as our conservator in accordance with the GSEAct. Upon its appointment, the conservator immediately succeeded to all rights, titles, powers and privileges ofFannie Mae, and of any shareholder, officer or director of Fannie Mae with respect to Fannie Mae and itsassets, and succeeded to the title to the books, records and assets of any other legal custodian of Fannie Mae.
202

As a result, our Board of Directors no longer had the power or duty to manage, direct or oversee our businessand affairs.
On November 24, 2008, FHFA, as conservator, reconstituted our Board of Directors and directed us regardingthe function and authorities of the Board of Directors. FHFA has delegated to our Board of Directors andmanagement the authority to conduct our day-to-day operations, subject to the direction of the conservator.FHFA’s delegation of authority to the Board became effective on December 19, 2008 when FHFA appointednine Board members to serve in addition to the Board Chairman, who was appointed by FHFA onSeptember 16, 2008. Pursuant to FHFA’s delegation of authority to the Board, the Board is responsible forcarrying out normal Board functions, but is required to obtain the review and approval of FHFA as conservatorbefore taking action in the specified areas described below. The delegation of authority will remain in effectuntil modified or rescinded by the conservator. The conservatorship has no specified termination date. Thedirectors serve on behalf of the conservator and exercise their authority as directed by and with the approval,where required, of the conservator. Our directors have no duties to any person or entity except to theconservator. Accordingly, our directors are not obligated to consider the interests of the company, the holdersof our equity or debt securities or the holders of Fannie Mae MBS unless specifically directed to do so by theconservator.
The conservator instructed that in taking actions the Board should ensure that appropriate regulatory approvalshave been received. In addition, the conservator directed the Board to consult with and obtain the approval ofthe conservator before taking action in the following areas:
(1) actions involving capital stock, dividends, the senior preferred stock purchase agreement, increases in risklimits, material changes in accounting policy and reasonably foreseeable material increases in operationalrisk;
(2) the creation of any subsidiary or affiliate or any substantial non-ordinary course transactions with anysubsidiary or affiliate;
(3) matters that relate to conservatorship;
(4) actions involving hiring, compensation and termination benefits of directors and officers at the executivevice president level and above and other specified executives;
(5) actions involving retention and termination of external auditors and law firms serving as consultants to theBoard;
(6) settlements of litigation, claims, regulatory proceedings or tax-related matters in excess of a specifiedthreshold;
(7) any merger with or acquisition of a business for consideration in excess of $50 million; and
(8) any action that in the reasonable business judgment of the Board at the time that the action is taken islikely to cause significant reputational risk.
For more information on the conservatorship, refer to “Business—Conservatorship and Treasury Agreements—Conservatorship.”
Composition of Board of Directors
In November 2008, FHFA directed that our Board will have a minimum of nine and not more than thirteendirectors. There will be a non-executive Chairman of the Board, and our Chief Executive Officer will be theonly corporate officer serving as a director. Our initial directors were appointed by the conservator andsubsequent vacancies have been and may continue to be filled by the Board, subject to review by theconservator. Each director will serve on the Board until the earlier of (1) resignation or removal by theconservator or (2) the election of a successor director at an annual meeting of shareholders.
Fannie Mae’s bylaws provide that each director holds office for the term to which he or she was elected orappointed and until his or her successor is chosen and qualified or until he or she dies, resigns, retires or is
203

removed from office in accordance with the law, whichever occurs first. Under the Charter Act, each directoris elected or appointed for a term ending on the date of our next shareholders’ meeting. As noted above,however, the conservator appointed the initial directors to our Board, delegated to the Board the authority toappoint directors to subsequent vacancies subject to conservator review, and defined the term of service ofdirectors during conservatorship.
Under the Charter Act, our Board shall at all times have as members at least one person from each of thehomebuilding, mortgage lending and real estate industries, and at least one person from an organization thathas represented consumer or community interests for not less than two years or one person who hasdemonstrated a career commitment to the provision of housing for low-income households. It is the policy ofthe Board that a substantial majority of Fannie Mae’s directors will be independent, in accordance with thestandards adopted by the Board. In addition, the Board, as a group, must be knowledgeable in business,finance, capital markets, accounting, risk management, public policy, mortgage lending, real estate, low-income housing, homebuilding, regulation of financial institutions and any other areas that may be relevant tothe safe and sound operation of Fannie Mae.
In addition to knowledge in the areas noted above, the Nominating and Corporate Governance Committeeconsiders the personal attributes and diversity of backgrounds offered by candidates, but does not have aformal policy on the consideration of diversity in identifying Board members. The Nominating and CorporateGovernance Committee seeks out Board members who possess the highest personal values, judgment andintegrity, diverse ideas and perspectives, and an understanding of the regulatory environment in which FannieMae does business. The Committee also considers whether a prospective candidate for the Board has theability to attend meetings and fully participate in the activities of the Board.
The Nominating and Corporate Governance Committee evaluates the qualifications of current directors on anannual basis. Factors taken into consideration by the Committee in making this evaluation include:
• a director’s contribution to the effective functioning of the corporation;
• any change in the director’s principal area of responsibility with his or her company or his or herretirement from the company;
• whether the director continues to bring relevant experience to the Board;
• whether the director has the ability to attend meetings and fully participate in the activities of the Board;
• whether the director has developed any relationships with Fannie Mae or another organization, or othercircumstances have arisen, that might make it inappropriate for the director to continue serving on theBoard;
• the director’s age and length of service on the Board; and
• the director’s particular experience, qualifications, attributes and skills.
Information regarding the particular experience, qualifications, attributes or skills of each of our currentdirectors is provided above under “Directors.”
Board Leadership Structure
We have had a non-executive Chairman of the Board since 2004. FHFA examination guidance requiresseparate Chairman of the Board and Chief Executive Officer positions and requires that the Chairman of theBoard be an independent director. Our Board is also structured so that all but one of our directors, our ChiefExecutive Officer, are independent. A non-executive Chairman structure enables non-management directors toraise issues and concerns for Board consideration without immediately involving management and isconsistent with the Board’s emphasis on independent oversight, as well as our conservator’s directives.
Our Board has five standing committees: the Audit Committee, the Compensation Committee, the ExecutiveCommittee, the Nominating and Corporate Governance Committee, and the Risk Policy and CapitalCommittee. The Board and the standing Board committees function in accordance with their designated duties
204

and with the authorities as set forth in federal statutes, regulations and FHFA examination and policyguidance, Delaware law (for corporate governance purposes) and in Fannie Mae’s bylaws and applicablecharters of Fannie Mae’s Board committees. Such duties or authorities may be modified by the conservator atany time. In January 2011, the Board dissolved the Strategic Planning Committee and determined that itsstrategic planning oversight roles and responsibilities would be discharged by the full Board of Directors.
The Board oversees risk management primarily through the Risk Policy and Capital Committee. ThisCommittee oversees management’s risk-related policies, including receiving, reviewing and discussing withmanagement presentations and analyses on corporate level risk policies and limits, performance against thesepolicies and limits, and the sufficiency of risk management capabilities. For more information on the Board’srole in risk oversight, see “MD&A—Risk Management—Enterprise Risk Governance—Board of Directors.”
Corporate Governance Information, Committee Charters and Codes of Conduct
Our Corporate Governance Guidelines, as well as the charters for our Board’s Audit Committee,Compensation Committee, Nominating and Corporate Governance Committee, and Risk Policy and CapitalCommittee, are posted on our Web site, www.fanniemae.com, under “Corporate Governance” in the “AboutUs” section of our Web site. Our Executive Committee does not have a written charter. The responsibilities,duties and authorities of the Executive Committee are set forth in our Bylaws, which are also posted on ourWeb site, www.fanniemae.com, under “Corporate Governance” in the “About Us” section of our Web site.
We have a Code of Conduct that is applicable to all officers and employees and a Code of Conduct andConflicts of Interest Policy for Members of the Board of Directors. Our Code of Conduct also serves as thecode of ethics for our Chief Executive Officer and senior financial officers required by the Sarbanes-OxleyAct of 2002 and implementing regulations of the SEC. We have posted these codes on our Web site,www.fanniemae.com, under “Corporate Governance” in the “About Us” section of our Web site. We intend todisclose any changes to or waivers from these codes that apply to any of our executive officers or directors byposting this information on our Web site.
Although our equity securities are no longer listed on the New York Stock Exchange (“NYSE”), we arerequired by FHFA’s corporate governance regulations and examination guidance for corporate governance,compensation practices and accounting practices to follow specified NYSE corporate governance requirementsrelating to, among other things, the independence of our Board members and the charters, independence,composition, expertise, duties and other requirements of our Board Committees.
Audit Committee Membership
Our Board has a standing Audit Committee consisting of Mr. Beresford, who is the Chair, Mr. Forrester,Ms. Gaines and Mr. Harvey, all of whom are independent under the requirements of independence set forth inFHFA’s corporate governance regulations (which requires the standard of independence adopted by theNYSE), Fannie Mae’s Corporate Governance Guidelines and other SEC rules and regulations applicable toaudit committees. The Board has determined that Mr. Beresford, Mr. Forrester, Ms. Gaines and Mr. Harveyeach have the requisite experience to qualify as an “audit committee financial expert” under the rules andregulations of the SEC and has designated each of them as such.
Executive Sessions
Our non-management directors meet regularly in executive sessions without management present. Our Boardof Directors reserves time for executive sessions at every regularly scheduled Board meeting. The non-executive Chairman of the Board, Mr. Laskawy, presides over these sessions.
Communications with Directors
Interested parties wishing to communicate any concerns or questions about Fannie Mae to the non-executiveChairman of the Board or to our non-management directors individually or as a group may do so by electronicmail addressed to “[email protected],” or by U.S. mail addressed to Fannie Mae Board of Directors,
205
c/o Office of the Corporate Secretary, Fannie Mae, Mail Stop 1H-2S/05, 3900 Wisconsin Avenue NW,Washington, DC 20016-2892. Communications may be addressed to a specific director or directors, includingMr. Laskawy, the Chairman of the Board, or to groups of directors, such as the independent or non-management directors.
The Office of the Corporate Secretary is responsible for processing all communications to a director ordirectors. Communications that are deemed by the Office of the Corporate Secretary to be commercialsolicitations, ordinary course customer inquiries, incoherent or obscene are not forwarded to directors.
Director Nominations; Shareholder Proposals
During the conservatorship, FHFA, as conservator, has all powers of the shareholders and Board of Directorsof Fannie Mae. As a result, under the GSE Act, Fannie Mae’s common shareholders no longer have the abilityto recommend director nominees or elect the directors of Fannie Mae or bring business before any meeting ofshareholders pursuant to the procedures in our bylaws. In consultation with the conservator, we currently donot plan to hold an annual meeting of shareholders in 2011. For more information on the conservatorship,refer to “Business—Conservatorship and Treasury Agreements—Conservatorship.”
EXECUTIVE OFFICERS
Our current executive officers who are not also members of the Board of Directors are listed below. They haveprovided the following information about their principal occupation, business experience and other matters.
Kenneth J. Bacon, 56, has been Executive Vice President—Multifamily (formerly, Housing and CommunityDevelopment) since July 2005 and was interim head of Housing and Community Development from January2005 to July 2005. He was Senior Vice President—Multifamily Lending and Investment from May 2000 toJanuary 2005, and Senior Vice President—American Communities Fund from October 1999 to May 2000.From August 1998 to October 1999 he was Senior Vice President of the Community Development CapitalCorporation. He was Senior Vice President of Fannie Mae’s Northeastern Regional Office in Philadelphia fromMay 1993 to August 1998. Mr. Bacon was a director of the Fannie Mae Foundation from January 1995 until itwas dissolved in June 2009. He was Vice Chairman of the Fannie Mae Foundation from January 2005 toSeptember 2008 and was Chairman from September 2008 to June 2009. Mr. Bacon is a director of ComcastCorporation and the Corporation for Supportive Housing. He is a member of the Executive LeadershipCouncil.
David C. Benson, 51, has been Executive Vice President—Capital Markets since April 2009 and has alsoserved as Treasurer since June 2010. Mr. Benson previously served as Fannie Mae’s Executive VicePresident—Capital Markets and Treasury from August 2008 to April 2009, as Fannie Mae’s Senior VicePresident and Treasurer from March 2006 to August 2008, and as Fannie Mae’s Vice President and AssistantTreasurer from June 2002 to February 2006. Prior to joining Fannie Mae in 2002, Mr. Benson was ManagingDirector in the fixed income division of Merrill Lynch & Co. From 1988 through 2002, he served in severalcapacities at Merrill Lynch in the areas of risk management, trading, debt syndication and e-commerce basedin New York and London.
Terence W. Edwards, 55, has been Executive Vice President—Credit Portfolio Management since September2009, when he joined Fannie Mae. Prior to joining Fannie Mae, Mr. Edwards served as the President andChief Executive Officer of PHH Corporation, a leading outsource provider of mortgage and fleet managementservices, from January 2005 to June 2009. Mr. Edwards was also a member of the Board of Directors of PHHCorporation from January 2005 through June 2009. Prior to PHH Corporation’s spin-off from CendantCorporation (now known as Avis Budget Group, Inc.) in January 2005, Mr. Edwards served as President andChief Executive Officer of Cendant Mortgage Corporation (now known as PHH Mortgage Corporation), asubsidiary of Cendant Corporation, beginning in February 1996. Mr. Edwards had previously served in otherexecutive roles at PHH Corporation, which he joined in 1980.
David C. Hisey, 50, has been Executive Vice President and Deputy Chief Financial Officer since November2008 and also assumed the responsibilities of Chief Financial Officer in December 2010. Mr. Hisey previously
206

served as Executive Vice President and Chief Financial Officer from August to November 2008, as SeniorVice President and Controller from February 2005 to August 2008 and as Senior Vice President, FinancialControls and Operations from January to February 2005. Prior to joining Fannie Mae, Mr. Hisey wasCorporate Vice President of Financial Services Consulting, Managing Director and practice leader of theLending and Leasing Group of BearingPoint, Inc., a management consulting and systems integration company.Prior to joining BearingPoint in 2000, Mr. Hisey was an audit partner with KPMG, LLP. Mr. Hisey serves asour principal accounting officer and is a certified public accountant.
Linda K. Knight, 60, has served as the Executive Vice President leading Fannie Mae’s operating plan sinceSeptember 2010. Since January 2011, Ms. Knight has also led the Financial Planning & Analysis business unitand the Strategy, Execution & Transformation business unit. Ms. Knight served as Executive Vice President—Mortgage-Backed Securities and Pricing from June 2010 to September 2010, and she served as Executive VicePresident and Treasurer from April 2009 to June 2010. Ms. Knight previously served as Executive VicePresident—Enterprise Operations & Securities from November 2008 to April 2009. Ms. Knight wasresponsible for securities operations from August 2008 to September 2010. She was responsible for enterpriseoperations from April 2007 to April 2009, except for a period from August 2008 to September 2008.Ms. Knight served under the title Executive Vice President—Securities from August to November 2008 and asExecutive Vice President—Enterprise Operations from April 2007 until August 2008. Previously, Ms. Knightserved as Executive Vice President—Capital Markets from March 2006 to April 2007. Before that, she servedas Senior Vice President and Treasurer from February 1993 to March 2006, and Vice President and AssistantTreasurer from November 1986 to February 1993. Ms. Knight held the position of Director, Treasurer’s Officefrom November 1984 to November 1986. Ms. Knight joined Fannie Mae in August 1982 as a senior marketanalyst.
Timothy J. Mayopoulos, 51, has been Executive Vice President, Chief Administrative Officer, General Counseland Corporate Secretary since September 2010. Mr. Mayopoulos was Executive Vice President, GeneralCounsel and Corporate Secretary from April 2009 to September 2010. Before joining Fannie Mae,Mr. Mayopoulos was Executive Vice President and General Counsel of Bank of America Corporation fromJanuary 2004 to December 2008. He was Managing Director and General Counsel, Americas of DeutscheBank AG’s Corporate and Investment Bank from January 2002 to January 2004. He was Managing Directorand Senior Deputy General Counsel, Americas of Credit Suisse First Boston from November 2000 to May2001, and Managing Director and Associate General Counsel of Donaldson, Lufkin & Jenrette, Inc. from May1996 to November 2000. Mr. Mayopoulos was previously in private law practice at Davis Polk & Wardwelland served in the Office of the Independent Counsel during the Whitewater investigation.
Karen R. Pallotta, 47, has been Executive Vice President—Single-Family Mortgage Business since June 2009.Ms. Pallotta served as Senior Vice President—Product Acquisition Strategy and Support from September 2005to May 2009. She previously served as Vice President—Marketing and Lender Strategies from November2001 to September 2005. Ms. Pallotta held the positions of Director—Marketing from December 1999 toNovember 2001 and Director—Transactions and Account Management from July 1997 to December 1999.From July 1990, when she joined Fannie Mae, to July 1997, Ms. Pallotta held various analyst, manager andspecialist positions with Fannie Mae.
Kenneth J. Phelan, 51, has been Executive Vice President—Chief Risk Officer, from April 2009 throughFebruary 2011. Prior to joining Fannie Mae, Mr. Phelan served as Chief Risk Officer of WachoviaCorporation, a financial holding company and bank holding company, from October 2008 to January 2009.Prior to Wachovia, Mr. Phelan served as Head of Risk Management Services at JPMorgan Chase & Co., afinancial holding company, from August 2004 to September 2008. He also served as Head of Risk StrategyDevelopment for Bank One Corporation, which was acquired by JPMorgan Chase & Co. in 2004, fromSeptember 2001 to August 2004.
Michael A. Shaw, 63, has been Executive Vice President and Chief Credit Officer since April 2009. Mr. Shawpreviously served as Executive Vice President and Enterprise Risk Officer from November 2008 to April 2009,and as Executive Vice President and Chief Risk Officer from August 2008 to November 2008. Prior to thattime, Mr. Shaw served as Senior Vice President—Credit Risk Oversight beginning in April 2006, when he
207
joined Fannie Mae. Prior to that time, Mr. Shaw was employed at JPMorgan Chase & Co., where he served asSenior Credit Executive from 2004 to 2006, as Senior Risk Executive, Policy, Reporting, Analytics andFinance during 2004 and as Senior Credit Executive—Consumer, Chase Financial Services from 2003 to 2004.Prior to joining JP Morgan, Mr. Shaw held senior risk positions at GE Capital and a subsidiary from 1997 to2003. Mr. Shaw previously served in several senior risk positions at Citigroup Inc., which he joined in 1972.
Edward G. Watson, 49, has been Executive Vice President—Operations and Technology, since April 2009,when he joined Fannie Mae. Prior to joining Fannie Mae, Mr. Watson held a variety of positions withCitigroup Inc., a global diversified financial services holding company. From April 2004 to April 2008, he wasGlobal Head, Capital Markets Operations and Institutional Clients Group Business Services. Before that, heserved in a series of senior finance positions, including as Chief Financial Officer of Citigroup International,the European Investment Bank, and of Global Investment Management. Upon joining Citigroup in 1994,Mr. Watson led the effort to build the infrastructure for a start-up interest rate and equity over-the-counterderivatives business, which he ran until 1998.
Under our bylaws, each executive officer holds office until his or her successor is chosen and qualified or untilhe or she dies, resigns, retires or is removed from office.
Section 16(a) Beneficial Ownership Reporting Compliance
Our directors and officers file with the SEC reports on their ownership of our stock and on changes in theirstock ownership. Based on a review of forms filed during 2010 or with respect to 2010 and on writtenrepresentations from our directors and officers, we believe that all of our directors and officers timely filed allrequired reports and reported all transactions reportable during 2010.
Item 11. Executive Compensation
COMPENSATION DISCUSSION AND ANALYSIS
Executive Summary
Our Board of Directors approved an executive compensation program in December 2009, which we used for2009 and 2010 compensation actions. The program was approved by FHFA in consultation with theDepartment of the Treasury.
As described in more detail below, our executive compensation structure consists of three principal elements:base salary, deferred pay and a long-term incentive award. A key objective of our compensation program is totie pay to performance. Accordingly, half of the deferred pay award is based on achievement of corporategoals and the entire long-term incentive award is based on performance against individual and corporate goals.Another key objective of our compensation program is to attract and retain the executive talent needed tocontinue to fulfill the company’s important role in providing liquidity to the mortgage market and supportingthe housing market, as well as to prudently manage our $3.2 trillion book of business and be an effectivesteward of the government’s support. Our executive compensation program is also designed to follow the samegeneral structure of compensation arrangements approved by Treasury’s Special Master for TARP ExecutiveCompensation for top executives at financial institutions that have received exceptional assistance under theTroubled Asset Relief Program (“TARP”).
As compared to 2009, our executive compensation program for 2010 includes the following changes designedto further the objectives of the program:
• We increased the amount of the named executives’ pay that is subject to performance: half of deferredpay is now based on corporate performance, whereas in 2009 all of deferred pay was service-based;
• We lengthened the performance period for the second installment of the 2010 long-term incentive awardto two years, whereas the performance period for the 2009 long-term incentive award was only one year;
208

• We implemented a policy to limit perquisites for our named executives to no more than $25,000 perperson per year (with any exceptions to this limit requiring FHFA approval), and perquisites madeavailable to our named executives in 2010 were substantially lower than this limit. We also eliminated taxreimbursements on perquisites for the named executives, as well as our executive life insuranceprogram; and
• We froze benefit accruals in the Executive Pension Plan for all participants, including our Chief ExecutiveOfficer, for compensation years after 2009.
In addition, the Board of Directors did not increase the named executives’ 2010 target total directcompensation from 2009 levels.
Our 2010 corporate performance goals were designed to support our current business objectives, which includeproviding support to the housing and mortgage markets during this critical time while minimizing our creditlosses from delinquent mortgages. As such, our goals for 2010 were to achieve our mission of providingliquidity, stability and affordability to the U.S. housing and mortgage markets, build a more streamlined andhigher-performing company, and build a stronger service and delivery model. The Compensation Committeedetermined that our performance against these goals was strong in many areas in 2010. For example, weprovided significant liquidity to the market while maintaining the credit quality and expected economic returnsof our new business. The Compensation Committee also determined, however, that we did not fully meet oursubgoals relating to the management of our credit book and our risk and control environment. Based on itsreview of our corporate performance for 2010, the Compensation Committee determined that, subject to FHFAapproval, the performance-based portion of 2010 deferred pay would be paid at 90% of target and the pool forthe first installment of the 2010 long-term incentive awards for executive officers would be funded at 90% oftarget. Payment of the first installment of the 2010 long-term incentive awards was also subject to individualperformance. FHFA reviewed and approved the Compensation Committee’s determinations. See“Determination of 2010 Compensation” for more information about how corporate and individual performancewere used to determine compensation of our named executives.
Named Executives for 2010
This Compensation Discussion and Analysis focuses on compensation decisions relating to our ChiefExecutive Officer, our former Chief Financial Officer, our Deputy Chief Financial Officer (who assumed theresponsibilities of our former Chief Financial Officer on December 30, 2010), and our next three most highlycompensated executive officers during 2010. We refer to these individuals as our named executives. For 2010,our named executives were:
• Michael J. Williams, President and Chief Executive Officer;
• David C. Hisey, Executive Vice President and Deputy Chief Financial Officer (assumed responsibilities ofthe former Chief Financial Officer on December 30, 2010);
• David M. Johnson, Executive Vice President and Chief Financial Officer (through December 29, 2010);
• David C. Benson, Executive Vice President—Capital Markets;
• Terence W. Edwards, Executive Vice President—Credit Portfolio Management; and
• Timothy J. Mayopoulos, Executive Vice President, Chief Administrative Officer, General Counsel andCorporate Secretary.
Impact of Conservatorship
As discussed above under “Business—Conservatorship and Treasury Agreements—Conservatorship,” we havebeen under the conservatorship of FHFA since September 2008. The conservatorship has had a significantimpact on the compensation received by our named executives in 2010, as well as the process by which
209

executive compensation for 2010 was determined. Regulatory requirements affecting our executivecompensation include:
• Our directors serve on behalf of FHFA and exercise their authority subject to the direction of FHFA.More information about the role of our directors is described above in “Directors, Executive Officers andCorporate Governance—Corporate Governance—Conservatorship and Delegation of Authority to Board ofDirectors.”
• While we are in conservatorship, FHFA, as our conservator, retains the authority to approve and to modifyboth the terms and amount of any compensation to any of our executive officers. FHFA, as ourconservator, has directed that our Board consult with and obtain FHFA’s consent before taking any actionsinvolving hiring, compensation or termination benefits of any officer at the executive vice president leveland above and including, regardless of title, executives who hold positions with the functions of the chiefoperating officer, chief financial officer, general counsel, chief business officer, chief investment officer,treasurer, chief compliance officer, chief risk officer and chief/general/internal auditor.
• FHFA, as our regulator, must approve any termination benefits we offer to our named executives andcertain other officers identified by FHFA.
• Under the terms of the senior preferred stock purchase agreement with Treasury, we may not enter intoany new compensation arrangements with, or increase amounts or benefits payable under existingcompensation arrangements of, any named executives or executive officers without the consent of theDirector of FHFA, in consultation with the Secretary of the Treasury.
• Under the terms of the senior preferred stock purchase agreement, we may not sell or issue any equitysecurities without the prior written consent of Treasury, other than as required by the terms of any bindingagreement in effect on the date of the senior preferred stock purchase agreement. This effectivelyeliminates our ability to offer stock-based compensation.
• Under the Housing and Economic Recovery Act of 2008 and related regulations issued by FHFA, theDirector of FHFA has the authority to prohibit or limit us from making any “golden parachute payment”to specified categories of persons, including our named executives.
As a result of these requirements, the 2010 compensation determinations for our named executives discussedin this Compensation Discussion and Analysis were approved by the Acting Director of FHFA.
2010 Executive Compensation Program
Overview of Program Objectives and Structure
Our executive compensation program is designed to fulfill two primary objectives:
• Pay for Performance. Our executive compensation program is intended to drive a pay for performanceenvironment through the use of performance-based long-term incentive awards and deferred pay.
• Attract and Retain Executive Talent. Our executive compensation program is also intended to attract andretain the executive talent needed to continue to fulfill the company’s important role in providing liquidityto the mortgage market and supporting the housing market, as well as to prudently manage our book ofbusiness and be an effective steward of the government’s support.
As described in our 2009 Form 10-K, in 2009, FHFA worked with our management and Board of Directors,and sought the guidance of Treasury’s Special Master for TARP Executive Compensation, to develop anexecutive compensation program that meets these objectives and also reflects evolving standards regardingexecutive compensation and, to the extent appropriate, is generally consistent with the structural standardscreated for firms that received exceptional TARP assistance. The views of management and the Board ofDirectors in the development of this executive compensation program reflected input from management’s andthe Compensation Committee’s compensation consultants.
210

As a result of these efforts, in December 2009, we adopted a compensation program based on FHFA’sguidance consisting of three primary elements: base salary, deferred pay and a long-term incentive award.With regard to the relative distribution of total compensation among these elements, based on guidance fromFHFA, we targeted the long-term incentive award component at one-third of total direct compensation, withbase salary and deferred pay together constituting the remaining two-thirds of total direct compensation. Inaddition, based on guidance from FHFA, we limited annual base salary rates to no more than $500,000, exceptin the case of our Chief Executive Officer and Chief Financial Officer, which is similar to the pay structurecreated for firms that received exceptional TARP assistance. FHFA, in consultation with Treasury, approvedour compensation program and the level of salary, deferred pay target and long-term incentive target for eachof our named executives.
The Board and the Compensation Committee reviewed compensation arrangements for the named executivesin March 2010 and did not make any changes to the named executives’ salaries, deferred pay targets or long-term incentive targets for 2010.
Elements of 2010 Compensation Program
Direct Compensation
• Base Salary. Base salary is paid in cash throughout the year on a bi-weekly basis and provides aminimum, fixed level of cash compensation for the named executives. Base salary reflects the namedexecutive’s level of responsibility and experience, as well as individual performance over time. Basesalary is capped at $500,000 for all of our executive officers, including the named executives, other thanour Chief Executive Officer and Chief Financial Officer.
• Deferred Pay. Deferred pay is paid to the named executives in cash in quarterly installments in the yearfollowing the performance year. We will pay 2010 deferred pay to the named executives in four equalquarterly installments in March, June, September and December of 2011. Deferred pay is designed toreplicate the “stock salary” element of the compensation program applicable to financial institutions thatreceived exceptional TARP assistance and is also intended to serve as a retention incentive for the namedexecutives; however, deferred pay is paid in cash, not stock. Given the low market value of our commonstock since our entry into conservatorship, we and FHFA believe that stock-based compensation would notprovide appropriate retention incentives for our named executives. Further, large grants of low-pricedstock could provide substantial incentives for the named executives to seek and take large risks. Inaddition, we are prohibited from paying new stock-based compensation under the senior preferred stockpurchase agreement without Treasury’s consent. Except in the limited circumstances described under“Compensation Tables—Potential Payments Upon Termination or Change-in-Control” below, we will payinstallments of deferred pay only if the named executive is employed by Fannie Mae on the scheduledpayment dates.
Half of 2010 deferred pay is based on the Board of Directors’ determination of corporate performance in2010, as approved by FHFA; the remaining half of 2010 deferred pay is service based. Accordingly, theperformance-based portion of deferred pay that a named executive actually receives may be more or lessthan the named executive’s target.
• Long-term Incentive Award. A long-term incentive award is a performance-based cash award that is paidover two calendar years. Long-term incentive awards are designed to provide incentives to the namedexecutives to achieve corporate and individual performance goals, and to serve as a retention incentive. Anamed executive’s target for a long-term incentive award is one-third of the executive’s target total directcompensation. Except in the limited circumstances described under “Compensation Tables—PotentialPayments Upon Termination or Change-in-Control” below, we will pay installments of a long-termincentive award only if the named executive is employed by Fannie Mae on the scheduled payment dates.
Half of the 2010 long-term incentive award is based on corporate and individual performance for 2010,and is paid in February 2011. The remaining half of the award will be determined and paid in early 2012based on corporate and individual performance for both 2010 and 2011. Because the award is
211

performance based, the long-term incentive award that a named executive actually receives may be moreor less than the named executive’s target; however, the sum of the individual long-term incentive awardsto all executive officers cannot exceed the overall amount of the long-term incentive pool for ourexecutive officers. In addition, each long-term incentive award paid to an executive officer must beapproved by FHFA.
Employee Benefits
Our employee benefits are a fundamental part of our executive compensation program, and serve as animportant tool in attracting and retaining senior executives. We describe these employee benefits below.
• Retirement Plans. Eligibility for our retirement plans is dependent on the named executive’s date of hire,as we have made significant changes to our retirement programs over the last several years.
• Mr. Williams. Mr. Williams has a frozen benefit under the Executive Pension Plan. Mr. Williams alsoparticipates in our tax-qualified defined benefit pension plan and supplemental defined benefit pensionplans. See “Compensation Tables—Pension Benefits—Defined Benefit Pension Plans” for moreinformation about Mr. Williams’ retirement benefits and changes made to those benefits during 2010.
• Messrs. Hisey and Benson. Messrs. Hisey and Benson participate in our tax-qualified defined benefitpension plan and supplemental defined benefit pension plans.
• Messrs. Johnson, Edwards and Mayopoulos. Messrs. Johnson, Edwards and Mayopoulos do notparticipate in any of our defined benefit pension plans because they were hired after we frozeparticipation in these plans. They participate instead in our Supplemental Retirement Savings Plan,which is an unfunded, non-tax-qualified defined contribution plan.
All of the named executives are also eligible to participate in our Retirement Savings Plan, which is a401(k) plan that is available to our employee population as a whole. We provide more detail on ourretirement plans under “Compensation Tables—Pension Benefits” and “Compensation Tables—Nonqualified Deferred Compensation.”
• Other Employee Benefits and Plans. In general, the named executives are eligible for employee benefitsavailable to our employee population as a whole, including our medical insurance plans, life insuranceprogram and matching charitable gifts program. The named executives are also eligible to participate inour voluntary supplemental long-term disability plan, which is available to many of our employees.
• Perquisites. Our policy is to limit perquisites for our named executives to no more than $25,000 perperson per year. Any exceptions to this limit would require the approval of FHFA in consultation withTreasury. No named executive received more than $2,400 in perquisites in 2010.
• Severance Benefits. We have not entered into employment agreements with any of our named executivesthat would entitle the executive to severance benefits. Information on compensation that we may pay to anamed executive in certain circumstances in the event the executive’s employment is terminated isprovided below in “Compensation Tables—Potential Payments Upon Termination or Change-in-Control.”FHFA must approve any termination benefits we offer our named executives.
Determination of 2010 Compensation
Summary of 2010 Compensation Actions
The table below displays the named executives’ 2010 compensation targets compared to the actual awards orpayments to be received by the named executives. Only the first installment of the 2010 long-term incentiveaward, which is paid in February 2011, is included in this chart. The target amount for the second installmentof the 2010 long-term incentive award is the same as the target for the first installment of the award. Thesecond installment of the 2010 long-term incentive award will be determined and paid in 2012 based on 2010and 2011 corporate and individual performance, and therefore is excluded from the chart. This table is notintended to replace the summary compensation table, required under applicable SEC rules, which is includedbelow under “Compensation Tables—Summary Compensation Table for 2010, 2009 and 2008.”
212

Named Executive2010 Base
Salary Rate Target
Actual AmountApproved to bePaid in 2011(1) Target
Actual AmountApproved to be
Paid in 2011Percentageof Target
2010 Long-Term Incentive Award(First Installment Only)(2)2010 Deferred Pay
Michael Williams . . . . . . . . . . . . . . . . . . . $900,000 $3,100,000 $2,945,000 $1,000,000 $900,000 90%David Hisey. . . . . . . . . . . . . . . . . . . . . . . 425,000 1,045,000 992,750 365,000 325,000 89David Johnson(3) . . . . . . . . . . . . . . . . . . . . 650,000 1,700,000 — 575,000 — —David Benson . . . . . . . . . . . . . . . . . . . . . 500,000 1,369,667 1,301,184 465,167 440,000 95Terence Edwards . . . . . . . . . . . . . . . . . . . 500,000 1,369,667 1,301,184 465,167 420,000 90Timothy Mayopoulos . . . . . . . . . . . . . . . . . 500,000 1,469,667 1,396,184 490,167 485,000 99
(1) Target 2010 deferred pay is 50% service-based and 50% corporate performance-based. The Compensation Committeedetermined that the corporate performance-based portion of 2010 deferred pay would be paid at 90% of target.
(2) Amounts do not include the second installment of each named executive’s 2010 long-term incentive award. For eachnamed executive, the target amount for the second installment of the award is the same as the target for the firstinstallment of the award. The amount of the second installment that will actually be paid to each named executivewill be determined and paid in 2012 based on an assessment of 2010 and 2011 corporate and individual performance.
(3) Mr. Johnson left the company in December 2010 and therefore will not receive 2010 deferred pay or payment of a2010 long-term incentive award.
2010 Corporate Performance Goals and Assessment of 2010 Corporate Performance
In May 2010, the Board established, and FHFA approved, 2010 corporate performance goals for theperformance-based portion of deferred pay and for the first installment of the 2010 long-term incentive award,as well as continuing two-year (2010 and 2011) corporate performance goals for the second installment of the2010 long-term incentive award. The Board did not assign any relative weight to the goals and theCompensation Committee may consider other factors in addition to the goals in assessing corporateperformance.
In December 2010 and January 2011, the Compensation Committee reviewed our performance against each ofour 2010 performance goals and related subgoals to determine the funding of the pool for the first installmentof the 2010 long-term incentive awards for the named executives and the amounts of the performance-basedportion of 2010 deferred pay for the named executives. In conducting its review, the Compensation Committeetook into consideration the views of the Committee members and its objective to correlate compensation withperformance, the views of FHFA, management’s assessment of the company’s performance against the goals,and the discussion and review of corporate performance with the Chief Executive Officer. The results of theCompensation Committee’s review are summarized below.
• Goal 1: Our first 2010 performance goal was to achieve our mission of providing liquidity, stability andaffordability to the U.S. housing and mortgage markets. Our subgoals under this goal consisted of:providing liquidity to the market while maintaining the credit quality and expected economic returns ofour new business; managing our credit book of business; administering Treasury’s Making HomeAffordable Program; and addressing our duty to serve and housing goals. Key achievements during 2010pursuant to this goal were as follows:
• Our Single-Family business provided liquidity to the market by achieving a market share of new single-family mortgage-related securities issuances of 44.0% for 2010, significantly exceeding its target of33% while actively balancing this market position with prudent lending and pricing.
• Our Multifamily business provided liquidity to the market by achieving a multifamily GSE marketshare of 53% for 2010, exceeding its target of 50% while actively balancing this market position withprudent lending and pricing. Multifamily GSE market share refers to the percentage of multifamilycredit guaranty acquisitions by Fannie Mae versus Freddie Mac.
• Our Capital Markets business provided liquidity to the market through securities structuring, earlyfunding, whole loan conduit and related activities that generated revenues well in excess of its target of$320 million.
213
• We incurred single-family credit-related expenses of $26.4 billion for 2010, significantly lower than ourtarget of $45.4 billion.
• We significantly increased our default prevention and loss mitigation activities in 2010 as compared to2009, completing over 400,000 modifications, disposing of more than 185,000 REO properties andproviding over 75,000 foreclosure alternatives in 2010. In addition, our serious delinquency ratedeclined by more than 100 basis points from its peak in February 2010.
• We made improvements to the HAMP system of record, supported Treasury-hosted borrower outreachevents and conducted training of industry stakeholders and participating servicers.
• We made significant progress in meeting our new 2010 housing goals despite difficult marketconditions. We also prepared for implementation of the final duty to serve rule.
The Compensation Committee concluded that the company had substantially met this goal. TheCompensation Committee recognized the company’s 2010 achievements described above, particularly thecompany’s strong performance with respect to its liquidity subgoal. The company provided substantialliquidity to the market in 2010, while also acquiring new business with a high credit quality that isexpected to be profitable. The Compensation Committee concluded, however, that the company onlypartially met its subgoal relating to the management of its credit book of business. While the company’scredit losses were lower than expected in 2010, it was partially due to the temporary halt to foreclosuresby some of our servicers during the fourth quarter of 2010. In addition, the Committee took into accountthe foreclosure process deficiencies of servicers, lawyers and other service providers that were discoveredin 2010.
• Goal 2: Our second 2010 performance goal was to build a more streamlined, higher-performingcompany. Our subgoals under this goal consisted of: enhancing our financial metrics; improving ourbusiness processes and technology infrastructure; developing and retaining employees; and achieving andmaintaining a strong risk and control environment. Key achievements during 2010 pursuant to this goalwere as follows:
• We operated within our 2010 corporate forecast of revenues and expenses, developed a three-year costreduction plan and developed new reporting and tracking methodologies for key business metrics.
• We implemented a corporate project quality office, documented the current state architecture, created abaseline future state and made a number of organizational changes to optimize the technology andoperations areas.
• We enhanced our talent development and review processes, and retained high-performing employees ata higher rate than lower performers.
• We resolved specified risk and control matters identified by internal audit and FHFA, and remediatedour material weakness in internal control over financial reporting relating to change management bySeptember 30, 2010.
• We conducted risk control self-assessments for all high risk and a majority of medium risk processesand developed remediation plans for identified high exposure items.
The Compensation Committee concluded that the company had substantially met this goal. In making itsdetermination, the Committee took into account the company’s 2010 achievements described above. Inaddition, while the Committee acknowledged the significant progress the company had made inaddressing risk and control issues in 2010, it concluded that the company only partially met its subgoalrelating to its risk and control environment, and that the company must continue to work towardoperational excellence and better manage its internal controls. For example, the company initiallyproduced information for Treasury’s June MHA report that contained an error.
• Goal 3: Our third 2010 performance goal was to build a stronger service and delivery model. TheCompensation Committee concluded that we met this goal for 2010 by successfully developing a three-year operating plan to improve organizational efficiency and reduce costs.
214

The Compensation Committee considered other factors in evaluating our 2010 performance in addition toperformance against the 2010 corporate goals. These factors included: the company’s implementation ofconsolidation accounting; its launch of an initiative to improve the quality of loan data and underwriting in theprimary market; its participation in FHFA’s initiative to review and evaluate servicing compensation for single-family loans; its development and implementation of a strategy to move high-risk servicing portfolios; and itsresolution of a significant portion of its outstanding repurchase requests. The Compensation Committee alsoconsidered the company’s continued substantial financial losses in 2010.
Based on its evaluation of the company’s performance against its goals and these additional factors, theCompensation Committee determined that, subject to FHFA approval, the performance-based portion of 2010deferred pay would be paid at 90% of target and the pool for the first installment of the 2010 long-termincentive awards for executive officers would be funded at 90% of target. In making this determination, theCompensation Committee did not give more weight to one goal or subgoal than any other goal or subgoal.The Board and FHFA have reviewed and approved this determination.
Assessment of 2010 Individual Performance
Overview. The amounts of the first installment of the 2010 long-term incentive awards for the namedexecutives took into account not only the company’s performance against the 2010 corporate goals andsubgoals described above, but also an assessment by the Board of Directors of each named executive’sperformance during the year. The Board assessed the Chief Executive Officer’s performance with input fromthe Compensation Committee and assessed each other named executive’s performance with input from boththe Compensation Committee and the Chief Executive Officer. Based on these assessments, the Board used itsjudgment and discretion to determine the amount of compensation it deemed appropriate for each namedexecutive. The Board did not evaluate the performance of Mr. Johnson, who left the company in December2010 and therefore did not receive a 2010 long-term incentive award.
We describe the Board’s determination with respect to the first installment of each named executive’s 2010long-term incentive award, as well as the elements of each named executive’s performance the Boardconsidered in making this determination, below. FHFA has reviewed and approved these determinations. Moreinformation on the compensation arrangements for each of our named executives is set forth below in the“Summary Compensation Table for 2010, 2009 and 2008.”
Michael Williams, President and Chief Executive Officer. The Board determined that the first installment ofMr. Williams’ 2010 long-term incentive award would be $900,000, which was 90% of his target.Mr. Williams’ individual 2010 performance was evaluated based on the company’s performance against thecorporate performance goals for 2010, reflecting the fact that he is accountable for the success of the entireorganization. In addition, other achievements not reflected in the corporate performance goals wereconsidered. The Board determined that, under Mr. Williams’ leadership in 2010, the company substantiallymet its corporate goals and subgoals, made solid progress in managing credit losses on its pre-2009 book ofbusiness, acquired a 2010 book of business with a strong credit profile that is expected to be profitable, andachieved substantial progress in making the company more operationally disciplined and efficient. The Boardalso determined that, during his tenure as Chief Executive Officer, Mr. Williams has provided strong andsteady leadership in an extraordinarily challenging period for the company and a difficult market environment.He has built and maintained good relationships with FHFA and Treasury. In addition, he has built an effectiveexecutive management team and has also been instrumental in attracting and retaining strong employees at thesenior vice president level.
David Hisey, Executive Vice President—Deputy Chief Financial Officer. The Chief Executive Officerrecommended to the Board that the first installment of Mr. Hisey’s 2010 long-term incentive award be$325,000, which was approximately 89% of his target. The Board approved this recommendation. Inrecommending the amount of Mr. Hisey’s long-term incentive award, the Chief Executive Officer consideredMr. Hisey’s leadership of the company’s implementation of the new consolidation accounting standards, whichwas completed in the first quarter of 2010. Implementation of these new accounting standards required thecompany to make major, complex operational and system changes in a very short time. The implementation
215

effort involved the work of hundreds of people, and had a substantial impact on our overall internal controlenvironment. Mr. Hisey’s leadership of this project was critical in ensuring that it was completed successfullyand on time. The Chief Executive Officer also considered Mr. Hisey’s key partnership role in supporting theCredit Portfolio Management team, particularly with respect to special servicing efforts. In addition, the ChiefExecutive Officer considered Mr. Hisey’s leadership of the company’s participation in FHFA’s ongoinginitiative to review and evaluate servicing compensation for single-family loans, which includes not onlymanaging a large internal team but also coordinating with FHFA.
David Benson, Executive Vice President—Capital Markets. The Chief Executive Officer recommended to theBoard that the first installment of Mr. Benson’s 2010 long-term incentive award be $440,000, which wasapproximately 95% of his target. The Board approved this recommendation. In recommending the amount ofMr. Benson’s long-term incentive award, the Chief Executive Officer considered that, under Mr. Benson’sleadership, the Capital Markets group provided significant liquidity support to the market through securitiesstructuring, early funding, whole loan conduit and related activities. The Chief Executive Officer alsoconsidered the additional responsibilities Mr. Benson took on as the company’s Treasurer in 2010, and his keyrole in refinancing and restructuring a significant portion of our outstanding debt. Mr. Benson also had asignificant role in obtaining funding for the company’s purchase of over $200 billion in delinquent loans fromour single-family MBS trusts in 2010, which had a beneficial impact on our financial results. The ChiefExecutive Officer also considered Mr. Benson’s integral role in communicating with the company’s regulatorsand his significant work in the company’s efforts to improve its culture.
Terence Edwards, Executive Vice President—Credit Portfolio Management. The Chief Executive Officerrecommended to the Board that the first installment of Mr. Edwards’ 2010 long-term incentive award be$420,000, which was approximately 90% of his target. The Board approved this recommendation. Inrecommending the amount of Mr. Edwards’ long-term incentive award, the Chief Executive Officer consideredMr. Edwards’ outstanding leadership in transforming the credit portfolio management team, which was one ofthe company’s most critical leadership challenges in 2010. Mr. Edwards built a strong credit portfoliomanagement team, adding over 600 people to his division through both internal and external resources. UnderMr. Edwards’ effective leadership, his division handled an extraordinarily large volume of default preventionand loss mitigation activities in 2010, which had a positive impact on both homeowners and Fannie Mae’scredit losses. In addition, the Chief Executive Officer determined that Mr. Edwards’ leadership made itpossible for the credit portfolio management team to make significant progress in addressing and remediatingcontrol issues.
Timothy Mayopoulos, Executive Vice President, Chief Administrative Officer, General Counsel and CorporateSecretary. The Chief Executive Officer recommended to the Board that the first installment ofMr. Mayopoulos’ 2010 long-term incentive award be $485,000, which was approximately 99% of his target.The Board approved this recommendation. In recommending the amount of Mr. Mayopoulos’ long-termincentive award, the Chief Executive Officer considered the additional responsibilities Mr. Mayopoulos tookon in 2010 as the company’s new Chief Administrative Officer, with responsibility for the Human Resources,Communications and Marketing Services, and Government and Industry Relations divisions. The ChiefExecutive Officer also considered Mr. Mayopoulos’ many significant accomplishments in 2010, whichincluded his effective leadership relating to the settlement and ongoing handling of the company’s litigationmatters and his critical leadership role relating to the company’s participation in Congressional hearings and inthe Financial Crisis Inquiry Commission hearings. In addition, the Chief Executive Officer consideredMr. Mayopoulos’ significant role in developing the company’s operating plan as part of the company’s goal ofbuilding a stronger service and delivery model, particularly in the early stages of this effort. He alsoconsidered that Mr. Mayopoulos continues to play a key advisory role in connection with the company’soperating plan.
Compensation Arrangements with our Former Chief Financial Officer
Mr. Johnson, the company’s former Chief Financial Officer, received base salary in 2010 through his departuredate of December 29, 2010. Mr. Johnson was not eligible to receive the fourth quarterly installment of his2009 deferred pay because he was not employed by us on the payment date for that installment. In addition,
216

Mr. Johnson is not eligible to receive payments of the second installment of his 2009 long-term incentiveaward, the first or second installment of his 2010 long-term incentive award or any of the quarterlyinstallments of his 2010 deferred pay because he will not be employed by us on the respective payment datesfor these installments. In addition to base salary, Mr. Johnson received company contributions to hisRetirement Savings Plan and company credits to a Supplemental Retirement Savings Plan in 2010; however,due to his resignation, he forfeited the 2% company contributions to the Retirement Savings Plan and the 2%company credits to the Supplemental Retirement Savings Plan for 2008, 2009 and 2010, which have a three-year vesting period. Mr. Johnson did not receive any severance payments as a result of his resignation fromFannie Mae. For more detailed information regarding Mr. Johnson’s 2010, 2009 and 2008 compensation, referto the “Summary Compensation Table for 2010, 2009 and 2008” below.
Other Executive Compensation Considerations
Role of Compensation Consultants
Our current executive compensation program was developed in 2009 with assistance from the company’soutside compensation consultant, McLagan, and the Compensation Committee’s independent compensationconsultant, Frederic W. Cook & Co., Inc. (“FW Cook”).
McLagan advised management on various compensation and human resources matters during 2010, includingthe company’s risk assessment of its 2010 compensation program and the performance metrics under ourcompensation plans. McLagan also advised management on competitive pay levels, organization structure andheadcount, and various compensation proposals for new hires and promotions. In addition, McLagan providedmarket compensation data for senior management positions for purposes of determining 2011 compensationtargets, including the named executives’ positions.
FW Cook advised the Compensation Committee and the Board on various executive compensation mattersduring 2010, including the company’s risk assessment of its 2010 compensation program, changes to the ChiefExecutive Officer’s retirement benefits and various compensation proposals for new hires and promotions. FWCook also evaluated the company’s 2010 corporate performance goals and assisted the CompensationCommittee in its assessment of the company’s performance against these goals. In addition, FW Cookinformed the Compensation Committee of market trends in compensation and assisted the Committee in itsevaluation of our executive compensation program, including reviewing the market compensation dataprepared by McLagan for senior management positions for purposes of determining 2011 compensationtargets, including the named executives’ positions. FW Cook did not provide any services to management in2010.
Compensation Recoupment Policy
Beginning with compensation for the 2009 performance year, our executive officers’ compensation is subjectto the following forfeiture and repayment provisions, also known as “clawback” provisions:
• Materially Inaccurate Information. If an executive officer has been granted deferred pay or incentivepayments (including long-term incentive awards) based on materially inaccurate financial statements orany other materially inaccurate performance metric criteria, he or she will forfeit or must repay amountsgranted in excess of the amounts the Board of Directors determines would likely have been granted usingaccurate metrics.
• Termination for Cause. If we terminate an executive officer’s employment for cause, he or she willimmediately forfeit all deferred pay, long-term incentive awards and any other incentive payments thathave not yet been paid. We may terminate an executive officer’s employment for cause if we determinethat the officer has: (a) materially harmed the company by, in connection with the officer’s performanceof his or her duties for the company, engaging in gross misconduct or performing his or her duties in agrossly negligent manner, or (b) been convicted of, or pleaded nolo contendere with respect to, a felony.
• Subsequent Determination of Cause. If an executive officer’s employment was not terminated for cause,but the Board of Directors later determines, within a specified period of time, that he or she could have
217
been terminated for cause and that the officer’s actions materially harmed the business or reputation of thecompany, the officer will forfeit or must repay, as the case may be, deferred pay, long-term incentiveawards and any other incentive payments received by the officer to the extent the Board of Directorsdeems appropriate under the circumstances. The Board of Directors may require the forfeiture orrepayment of all deferred pay, long-term incentive awards and any other incentive payments so that theofficer is in the same economic position as if he or she had been terminated for cause as of the date oftermination of his or her employment.
• Effect of Willful Misconduct. If an executive officer’s employment: (a) is terminated for cause (or theBoard of Directors later determines that cause for termination existed) due to either (i) willful misconductby the officer in connection with his or her performance of his or her duties for the company or (ii) theofficer has been convicted of, or pleaded nolo contendere with respect to, a felony consisting of an act ofwillful misconduct in the performance of his or her duties for the company and (b) in the determinationof the Board of Directors, this has materially harmed the business or reputation of the company, then, tothe extent the Board of Directors deems it appropriate under the circumstances, in addition to theforfeiture or repayment of deferred pay, long-term incentive awards and any other incentive paymentsdescribed above, the executive officer will also forfeit or must repay, as the case may be, deferred payand annual incentives or long-term awards paid to him or her in the two-year period prior to the date oftermination of his or her employment or payable to him or her in the future. Misconduct is not consideredwillful unless it is done or omitted to be done by the officer in bad faith or without reasonable belief thathis or her action or omission was in the best interest of the company.
Certain of the bonus or other incentive-based or equity-based compensation for our Chief Executive Officerand Chief Financial Officer also may be subject to a requirement that they be reimbursed to the company inthe event that Section 304 of the Sarbanes-Oxley Act of 2002 applies to that compensation.
Our complete compensation repayment provisions are attached as Exhibit 99.1 to our Form 8-K filed onDecember 24, 2009.
The Compensation Committee plans to review our compensation recoupment policy and revise it as necessaryto comply with the Dodd-Frank Act once rules implementing the Act’s clawback requirements have beenfinalized by the SEC.
Stock Ownership and Hedging Policies
In January 2009, our Board eliminated our stock ownership requirements because of the difficulty of meeting therequirements at current market prices and because we had ceased paying our executives stock-based compensation.All employees, including our named executives, are prohibited from transacting in derivative securities related toour securities, including options, puts and calls, other than pursuant to our stock-based benefit plans.
Tax Deductibility of our Compensation Expenses
Subject to certain exceptions, section 162(m) of the Internal Revenue Code imposes a $1 million limit on theamount that a company may annually deduct for compensation to its CEO and certain other named executives,unless, among other things, the compensation is “performance-based,” as defined in section 162(m), and providedunder a plan that has been approved by the shareholders. We have not adopted a policy requiring all compensationto be deductible under section 162(m). The impact of a potential lost deduction because of Section 162(m) issubstantially mitigated by our current and projected tax losses, and this approach allows us flexibility in light of theconservatorship. Awards under the 2008 Retention Program, 2009 deferred pay and long-term incentive awards for2009 performance received by the named executives in 2010 do not qualify as performance-based compensationunder section 162(m). In addition, 2010 deferred pay and long-term incentive awards for 2010 performance are notstructured to qualify as performance-based compensation under section 162(m).
218

2011 Compensation
The Board and the Compensation Committee reviewed the current compensation arrangements for our namedexecutives in January 2011 and determined that the named executives’ base salary, deferred pay targets andlong-term incentive targets will not change in 2011. As of February 24, 2011, the Board of Directors had notestablished 2011 corporate performance goals for purposes of determining the first installment of the 2011long-term incentive awards.
The continuing two-year (2010 and 2011) performance goals against which the company’s performance willbe measured for purposes of the second installment of the 2010 long-term incentive awards (which are payablein the first quarter of 2012) are to: reduce fixed general and administrative expenses; achieve our targetrelating to the reduction of credit-related expenses; achieve risk-adjusted return on economic capital targets;meet deliverables on business process and technology improvements; address all matters requiring attentionidentified by our regulator; and make progress on certain strategic projects.
COMPENSATION COMMITTEE REPORT
The Compensation Committee of the Board of Directors of Fannie Mae has reviewed and discussed theCompensation Discussion and Analysis included in this Form 10-K with management. Based on such reviewand discussions, the Compensation Committee has recommended to the Board of Directors that theCompensation Discussion and Analysis be included in this Form 10-K.
Compensation Committee:
Brenda J. Gaines, ChairDennis R. BeresfordCharlynn Goins (member since January 2011)Jonathan PlutzikDavid H. Sidwell
COMPENSATION RISK ASSESSMENT
We conducted a risk assessment of our employee compensation policies and practices. In conducting this riskassessment, we reviewed, among other things, our compensation plans, pay profiles, performance goals andperformance appraisal management process. We also assessed whether policies, procedures or other mitigatingcontrols existed that would reduce the opportunity for excessive or inappropriate risk-taking within ourcompensation policies and practices.
Based on the results of our risk assessment, we concluded that our employee compensation policies andpractices do not create risks that are reasonably likely to have a material adverse effect on the company.Several factors contributed to our conclusion, including:
• Payment of incentive compensation is based on the achievement of performance metrics that we haveconcluded do not encourage unnecessary or excessive risk-taking. Our mix of multiple qualitative andquantitative performance metrics without undue emphasis on any one metric provides an appropriatebalance of incentives.
• Our extensive performance appraisal process ensures achievement of goals without encouraging executivesor employees to take inappropriate risks.
• Although we have an all cash compensation program while under conservatorship, FHFA approval of ourexecutive compensation arrangements and our payment of most incentive payments over time, with aportion based on future performance, encourages appropriate decision-making.
219

• Our Board and Compensation Committee have an active and significant oversight role in compensation-related decisions, including approving the company’s overall compensation structure, determining whethercorporate goals have been achieved and determining the overall funding level of the pool for incentiveawards, with final approval from FHFA. The Compensation Committee regularly reviews compensationdata and consults with its independent compensation consultant on compensation matters.
• Deferred pay and incentive compensation for our senior executive officers is subject to the terms of aclawback policy.
• We have no severance arrangements for our executive officers that would pay additional compensationwhen an executive leaves and there is no guarantee that an executive would receive payments ofpreviously awarded deferred pay or long-term incentive compensation if an executive’s employment wereterminated.
COMPENSATION TABLES
Summary Compensation Table for 2010, 2009 and 2008
The following table shows summary compensation information for 2010, 2009 and 2008 for the namedexecutives.
Name andPrincipal Position Year
Salary($)(1)
Bonus($)(2)
StockAwards
($)(3)
Non-EquityIncentive
PlanCompensation
($)(4)
Change inPension
Value andNonqualified
DeferredCompensation
Earnings($)(5)
All OtherCompensation
($)(6)Total
($)
Michael Williams(7) . . . . . . . . . . . . . . . . . . . 2010 900,000 1,550,000 — 2,295,000 833,156 16,300 5,594,456President and Chief Executive 2009 860,523 2,867,200 — 2,051,100 790,803 111,180 6,680,806Officer 2008 676,000 871,000 4,783,993 — 724,874 43,034 7,098,901
David Hisey(8) . . . . . . . . . . . . . . . . . . . . . . 2010 408,654 522,500 — 795,250 130,600 15,950 1,872,954Executive Vice President and 2009 441,347 1,045,000 — 983,700 70,894 44,600 2,585,541Deputy Chief Financial Officer 2008 382,904 737,000 940,487 160,000 62,450 43,209 2,326,050
David Johnson(9) . . . . . . . . . . . . . . . . . . . . . 2010 645,000 — — — — 79,200 724,200Executive Vice President and 2009 675,000 1,275,000 — 517,500 — 178,865 2,646,365Chief Financial Officer 2008 48,077 — — — — — 48,077
David Benson . . . . . . . . . . . . . . . . . . . . . . . 2010 500,000 684,834 — 1,056,350 218,844 22,250 2,482,278Executive Vice President—Capital 2009 519,231 1,369,667 — 1,282,800 125,157 47,815 3,344,670Markets
Terence Edwards . . . . . . . . . . . . . . . . . . . . . 2010 500,000 684,834 — 1,036,350 — 54,439 2,275,623Executive Vice President—Credit PortfolioManagement
Timothy Mayopoulos(10) . . . . . . . . . . . . . . . . 2010 500,000 734,834 — 1,146,350 — 88,308 2,469,492Executive Vice President, 2009 439,346 1,278,610 — 842,601 — 87,138 2,647,695Chief Administrative Officer, GeneralCounsel and Corporate Secretary
(1) Calendar year 2009 contained 27 biweekly pay periods, rather than the usual 26 biweekly pay periods. As a result,salary amounts for 2009 reflect an additional biweekly pay period.
(2) Amounts shown for 2010 in the “Bonus” column consist of the service-based portion of 2010 deferred pay, which is50% of the total 2010 deferred pay target. As described in footnote 4 below, the performance-based portion of 2010deferred pay is included in the “Non-Equity Incentive Plan Compensation” column. Deferred pay for 2010 will bepaid in four equal installments in March, June, September and December 2011. These amounts generally will be paidonly if the named executive remains employed by us on the payment date. More information about deferred pay ispresented in “Compensation Discussion and Analysis—2010 Executive Compensation Program—Elements of 2010Compensation Program.”
Amounts shown for 2009 in the “Bonus” column consist of the entire amount of 2009 deferred pay, all of which wasservice-based. As noted in footnote 9 below, the amount of 2009 deferred pay originally awarded to Mr. Johnson was$1,700,000; however, Mr. Johnson did not receive the fourth $425,000 installment of this award because he left thecompany prior to the payment date for the installment. Accordingly, the 2009 amount shown in this column forMr. Johnson consists of only the $1,275,000 in 2009 deferred pay actually paid to him.
220

(3) Amounts shown in the “Stock Awards” column represent the aggregate grant date fair value of restricted stockgranted during the applicable year computed in accordance with the accounting standards for stock compensation.The amounts shown exclude the impact of estimated forfeitures related to service-based vesting conditions. The grantdate fair value of restricted stock for each year is the average of the high and low trading price of our common stockon the date of grant.
(4) Amounts shown for 2010 in the “Non-Equity Incentive Plan Compensation” column include the first installment ofthe 2010 long-term incentive award, which was based on corporate and individual performance for 2010. The amountof the first installment of the 2010 long-term incentive award awarded to each named executive was as follows:$900,000 for Mr. Williams, $325,000 for Mr. Hisey, $440,000 for Mr. Benson, $420,000 for Mr. Edwards and$485,000 for Mr. Mayopoulos. This first installment of the 2010 long-term incentive award is paid in February 2011.The second installment of the 2010 long-term incentive award will be determined and paid in the first quarter of2012 based on corporate and individual performance for both 2010 and 2011, and therefore is not included as 2010compensation in this table. As noted in footnote 9 below, Mr. Johnson will not receive payment of a 2010 long-termincentive award because he left the company prior to the payment dates for the award.
Amounts shown for 2010 in the “Non-Equity Incentive Plan Compensation” column also include the performance-based portion of 2010 deferred pay, which was based on corporate performance for 2010. The amount of theperformance-based portion of 2010 deferred pay awarded to each named executive was as follows: $1,395,000 forMr. Williams, $470,250 for Mr. Hisey, $616,350 for Mr. Benson, $616,350 for Mr. Edwards and $661,350 forMr. Mayopoulos. These amounts represent 90% of the target amount of the performance-based portion of 2010deferred pay for each named executive. As noted in footnote 2, 2010 deferred pay will be paid in four equalinstallments in March, June, September and December 2011. These amounts generally will be paid only if the namedexecutive remains employed by us on the payment date. As noted in footnote 9 below, Mr. Johnson will not receivepayment of 2010 deferred pay because he left the company prior to the payment dates.
More information about deferred pay and long-term incentive awards is presented in “Compensation Discussion andAnalysis—2010 Executive Compensation Program—Elements of 2010 Compensation Program.”
Amounts shown for 2009 in the “Non-Equity Incentive Plan Compensation” column include long-term incentiveawards awarded based on 2009 corporate and individual performance. The amount of this award was $1,665,000 forMr. Williams, $657,000 for Mr. Hisey, $837,300 for Mr. Benson and $842,601 for Mr. Mayopoulos. These long-termincentive awards were payable in two equal installments. The first installment was paid in February 2010 and thesecond installment is paid in February 2011. As described in footnote 9 below, the amount of the 2009 long-termincentive award originally awarded to Mr. Johnson was $1,035,000; however, Mr. Johnson did not receive the second$517,500 installment of this award because he left the company prior to the payment date for the installment.Accordingly, the 2009 amount shown in this column for Mr. Johnson consists of only the first $517,500 installmentpaid to him in February 2010.
Amounts shown for 2009 in the “Non-Equity Incentive Plan Compensation” column for Messrs. Williams, Hisey andBenson also include the performance-based portion of their 2008 Retention Program award, which was based on2009 corporate performance. The amount of this award was $386,100 for Mr. Williams, $326,700 for Mr. Hisey and$445,500 for Mr. Benson. This portion of the 2008 Retention Program award was paid in February 2010.Messrs. Johnson and Mayopoulos did not receive 2008 Retention Program awards.
(5) The reported amounts represent change in pension value. We calculated these amounts using the same assumptionswe use for financial reporting under GAAP, using a discount rate of 5.65% at December 31, 2010. None of ournamed executives received above-market or preferential earnings on nonqualified deferred compensation.
(6) The table below shows more information about the amounts reported for 2010 in the “All Other Compensation”column, which include (1) company contributions under our Retirement Savings Plan (401(k) Plan); (2) companycredits to our Supplemental Retirement Savings Plan; and (3) matching charitable contributions under our matchingcharitable gifts program.
Name
CompanyContributions to
Retirement Savings(401(k)) Plan
CompanyCredits to
SupplementalRetirement Savings
Plan
CharitableAward
Programs
Michael Williams . . . . . . . . . . . . . . . . . . . . . . . . . . . . $ 7,350 — $ 8,950David Hisey . . . . . . . . . . . . . . . . . . . . . . . . . . . . . . . . 12,250 — 3,700David Johnson . . . . . . . . . . . . . . . . . . . . . . . . . . . . . . 14,700 $ 64,500 —David Benson . . . . . . . . . . . . . . . . . . . . . . . . . . . . . . . 12,250 — 10,000Terence Edwards . . . . . . . . . . . . . . . . . . . . . . . . . . . . 19,600 30,339 4,500Timothy Mayopoulos . . . . . . . . . . . . . . . . . . . . . . . . . 19,600 48,708 20,000
221

In accordance with SEC rules, amounts shown under “All Other Compensation” for 2010 do not include perquisitesor personal benefits for any named executives, because aggregate perquisites for each named executive in 2010 weresubstantially less than $10,000.
Amounts shown in the “Charitable Award Programs” column reflect gifts we made under our matching charitablegifts program, under which gifts made by our employees and directors to Section 501(c)(3) charities are matched, upto an aggregate total of $10,000 in any calendar year. Effective January 1, 2011, we changed our matching charitablegifts program to reduce the maximum amount of matching gifts to $5,000 in any calendar year. Amounts included inthis column for Mr. Mayopoulos consist of a $10,000 matching contribution submitted in March 2010 relating tocharitable contributions he made in 2009 and a $10,000 matching contribution submitted in January 2011 relating tocharitable contributions he made in 2010.
Mr. Johnson left the company before completing the three-year vesting period for the company’s 2% contribution tothe Retirement Savings Plan for 2010 and 2% credit to the Supplemental Retirement Savings Plan for 2010.Accordingly, he forfeited the 2% company contribution to the Retirement Savings Plan for 2010 and the 2% companycredit to the Supplemental Retirement Savings Plan for 2010. Amounts included in this table for Mr. Johnson includeonly the 6% company contribution to the Retirement Savings Plan for 2010 and the 6% company credit to theSupplemental Retirement Savings Plan for 2010 that immediately vested, and do not include these forfeited amounts.
(7) Mr. Williams became our President and Chief Executive Officer on April 21, 2009. He previously served as FannieMae’s Executive Vice President and Chief Operating Officer from November 2005 through April 20, 2009.
(8) Mr. Hisey joined Fannie Mae in January 2005. He has been Executive Vice President and Deputy Chief FinancialOfficer since November 2008 and also assumed the responsibilities of Chief Financial Officer on December 30, 2010,following the departure of Mr. Johnson. Mr. Hisey previously served as Executive Vice President and Chief FinancialOfficer from August to November 2008, and as Senior Vice President and Controller from February 2005 to August2008.
(9) Mr. Johnson joined Fannie Mae in November 2008 and left the company on December 29, 2010. Mr. Johnson wasnot eligible to receive 2010 deferred pay or payment of his 2010 long-term incentive award because he left thecompany prior to the payment dates for the awards. In addition, he did not receive the fourth installment of his 2009deferred pay ($425,000) or the second installment of his 2009 long-term incentive award ($517,500) because he wasnot employed by Fannie Mae on the respective payment dates for these installments. Mr. Johnson also forfeited the2% company contributions to the Retirement Savings Plan and the 2% company credits to the SupplementalRetirement Savings Plan for 2008, 2009 and 2010, which have a three-year vesting period. The amounts reported asMr. Johnson’s 2008, 2009 and 2010 compensation in this table exclude these forfeited payments and represent theamounts he actually received, rather than the original amounts awarded to him.
(10) Mr. Mayopoulos has been an employee of Fannie Mae since April 21, 2009 and was engaged as a consultant forFannie Mae from February 17, 2009 through April 20, 2009. Amounts reported as Mr. Mayopoulos’ 2009compensation in the “Salary” column consist of (a) $353,846 in base salary paid to him from April 21, 2009 (thedate he became an employee of Fannie Mae) through December 31, 2009; and (b) $85,500 in fees paid to him fromFebruary 17, 2009 through April 20, 2009 for his services as a consultant.
222

Grants of Plan-Based Awards in 2010
The following table shows grants of awards made to the named executives during 2010 under our long-termincentive plan and deferred pay plan. The terms of these long-term incentive and deferred pay awards aredescribed above in “Compensation Discussion and Analysis—2010 Executive Compensation Program—Elements of 2010 Compensation Program.” Deferred pay amounts shown represent only the performance-based portion (50%) of the named executives’ 2010 deferred pay award.
NameAwardType(1)
Threshold($)
Target($)
Maximum($)
Estimated Future Payouts UnderNon-Equity Incentive Plan Awards(2)
Michael Williams . . . . . . . . . . . . . . . . . . . . . . . . . . . . . . . . . . . . . . LTI — 2,000,000 —DP — 1,550,000 —
David Hisey . . . . . . . . . . . . . . . . . . . . . . . . . . . . . . . . . . . . . . . . . LTI — 730,000 —DP — 522,500 —
David Johnson(3) . . . . . . . . . . . . . . . . . . . . . . . . . . . . . . . . . . . . . . LTI — 1,150,000 —DP — 850,000 —
David Benson . . . . . . . . . . . . . . . . . . . . . . . . . . . . . . . . . . . . . . . . LTI — 930,333 —DP — 684,834 —
Terence Edwards . . . . . . . . . . . . . . . . . . . . . . . . . . . . . . . . . . . . . . LTI — 930,333 —DP — 684,834 —
Timothy Mayopoulos . . . . . . . . . . . . . . . . . . . . . . . . . . . . . . . . . . . LTI — 980,333 —DP — 734,834 —
(1) LTI indicates an award under our long-term incentive plan. DP indicates the corporate performance-based portion(50%) of the named executives’ 2010 deferred pay award.
(2) For awards under our long-term incentive plan, the amounts shown are the target amounts of the named executives’2010 long-term incentive awards established by our Board in 2010. Except for Mr. Johnson, the actual amount of thefirst installment (50%) of each named executive’s 2010 long-term incentive award was determined in 2011 based on2010 performance against pre-established corporate and individual performance goals. The second installment (50%)of each named executive’s 2010 long-term incentive award will be determined in 2012 based on performance in 2010and 2011 against pre-established corporate and individual performance goals. No amounts are shown in the“Threshold” and “Maximum” columns because our long-term incentive plan does not specify threshold or maximumpayout amounts. Our Board has the discretion to pay awards in amounts below or above these target amounts, subjectto the approval of FHFA. The actual amounts of the first installment of the 2010 long-term incentive award awardedby the Board and approved by FHFA for 2010 performance are included in the “Non-Equity Incentive PlanCompensation” column of the “Summary Compensation Table for 2010, 2009 and 2008” and explained in footnote 4to that table. The first installment of the long-term incentive award is paid to the named executives in February 2011.The second installment of the long-term incentive award will be determined and paid in 2012.
For deferred pay awards, the amounts shown are the target amounts of the performance-based portion (50%) of thenamed executives’ 2010 deferred pay award. Except for Mr. Johnson, the actual amount of the performance-basedportion of 2010 deferred pay was determined in 2011 based on 2010 performance against pre-established corporateperformance goals. No amounts are shown in the “Threshold” and “Maximum” columns because our deferred pay plandoes not specify threshold or maximum payout amounts. Our Board has the discretion to pay awards in amountsbelow or above these target amounts, subject to the approval of FHFA. The actual amounts of the performance-basedportion of 2010 deferred pay awarded by the Board and approved by FHFA for 2010 performance are included in the“Non-Equity Incentive Plan Compensation” column of the “Summary Compensation Table for 2010, 2009 and 2008”and explained in footnote 4 to that table. The performance-based portion of 2010 deferred pay will paid to the namedexecutives in four equal quarterly installments in March, June, September and December 2011.
(3) Because Mr. Johnson left the company before the payment dates for the awards, he did not receive any payment of his2010 long-term incentive award or 2010 deferred pay. See “Compensation Discussion and Analysis—Determination of2010 Compensation—Assessment of 2010 Individual Performance” for further information.
Outstanding Equity Awards at 2010 Fiscal Year-End
The following table shows outstanding stock option awards and unvested restricted stock held by the namedexecutives as of December 31, 2010. The market value of stock awards shown in the table below is based on aper share price of $0.30, which was the closing market price of our common stock on December 31, 2010. As
223

of December 31, 2010, the exercise prices of all of the outstanding options referenced in the table below weresubstantially higher than the market price of our common stock.
NameAwardType(1)
GrantDate
Number ofSecurities
UnderlyingUnexercisedOptions (#)Exercisable
OptionExercisePrice ($)
OptionExpiration
Date
Number ofShares orUnits of
Stock ThatHave NotVested (#)
Market Value ofShares orUnits of
Stock ThatHave NotVested ($)
Option Awards(2) Stock Awards(2)
Michael Williams . . . . . . . . . . . . . . O 11/20/2001 44,735 80.95 11/20/2011O 1/21/2003 63,836 69.43 1/21/2013O 1/23/2004 73,880 78.32 1/23/2014RS 1/25/2007 23,156 6,947RS 1/28/2008 74,378 22,313
David Hisey . . . . . . . . . . . . . . . . . . O 1/3/2005 10,000 71.31 1/3/2015RS 1/25/2007 4,022 1,207RS 1/28/2008 14,622 4,387
David Johnson . . . . . . . . . . . . . . . . N/ADavid Benson . . . . . . . . . . . . . . . . . O 6/3/2002 12,000 79.33 6/3/2012
O 6/3/2002 20,080(3) 79.33 6/3/2012O 1/21/2003 9,624 69.43 1/21/2013O 1/23/2004 12,223 78.32 1/23/2014RS 1/25/2007 2,983 895RS 1/28/2008 11,971 3,591
Terence Edwards . . . . . . . . . . . . . . . N/ATimothy Mayopoulos . . . . . . . . . . . . N/A
(1) O indicates stock options and RS indicates restricted stock.(2) Except as otherwise indicated, all awards of options and restricted stock listed in this table vest in four equal annual
installments beginning on the first anniversary of the date of grant. Amounts reported in this table for restricted stockrepresent only the unvested portion of awards. Amounts reported in this table for options represent only theunexercised portions of awards.
(3) This option award had special vesting provisions: 3,860 options vested immediately upon grant, 9,080 vested onAugust 31, 2002, 4,370 vested on January 31, 2003, 1,610 vested on January 31, 2004 and 1,160 vested onJanuary 31, 2005.
Option Exercises and Stock Vested in 2010
The following table shows information regarding vesting of restricted stock held by the named executivesduring 2010. We have calculated the value realized on vesting by multiplying the number of shares of stock bythe fair market value (based on the closing market price) of our common stock on the vesting date. We haveprovided no information regarding stock option exercises because no named executives exercised stock optionsduring 2010.
NameNumber of Shares
Acquired on Vesting (#)Value Realized on
Vesting ($)
Stock Awards
Michael Williams . . . . . . . . . . . . . . . . . . . . . . . . . . . . . . . . . . . . 75,747 74,698
David Hisey . . . . . . . . . . . . . . . . . . . . . . . . . . . . . . . . . . . . . . . 18,246 19,403
David Johnson . . . . . . . . . . . . . . . . . . . . . . . . . . . . . . . . . . . . . . — —
David Benson . . . . . . . . . . . . . . . . . . . . . . . . . . . . . . . . . . . . . . 10,383 10,261
Terence Edwards . . . . . . . . . . . . . . . . . . . . . . . . . . . . . . . . . . . . — —
Timothy Mayopoulos . . . . . . . . . . . . . . . . . . . . . . . . . . . . . . . . . — —
224

Pension Benefits
Defined Benefit Pension Plans
Executive Pension Plan. The Executive Pension Plan was designed to supplement the benefits payable underour tax-qualified defined benefit retirement plan (the Federal National Mortgage Association Retirement Planfor Employees Not Covered Under Civil Service Retirement Law or “Retirement Plan”). Mr. Williams is theonly named executive with a benefit under the Executive Pension Plan, and his benefit under the plan wasfrozen as of December 31, 2009. Because the Executive Pension Plan is frozen, Mr. Williams’ compensation,years of service and Retirement Plan benefits earned for years after 2009 are not taken into account indetermining his benefit under the Executive Pension Plan.
Executive Pension Plan benefits vested after ten years of participation in the plan, and Mr. Williams was 90%vested at the time the plan was frozen. Mr. Williams’ maximum annual pension benefit under the ExecutivePension Plan, based on his status as 90% vested and a pension goal formula of 40%, is 36% of his averageannual covered compensation earned for the years 2007, 2008 and 2009. Covered compensation isMr. Williams’ average annual base salary, including deferred compensation, plus eligible incentivecompensation. For this purpose, eligible incentive compensation is limited in the aggregate to 50% ofMr. Williams’ base salary, and consists of his Annual Incentive Plan cash bonus for 2007 and his 2008Retention Program awards earned for 2008 and 2009. His payments under the Executive Pension Plan arereduced by his Retirement Plan benefit determined as of December 31, 2009.
Early retirement is available under the plan at age 55, with a reduction in the plan benefit of 2% for each yearbetween the year in which benefit payments begin and the year in which the participant turns 60. The benefitpayment for Mr. Williams is a monthly amount equal to 1/12th of his annual retirement benefit payable duringthe lives of Mr. Williams and his surviving spouse. If he dies before receiving benefits under the ExecutivePension Plan, his surviving spouse will be entitled to a death benefit that begins when Mr. Williams wouldhave reached age 55, based on his pension benefit at the date of death.
Supplemental Pension Plan and 2003 Supplemental Pension Plan. The purpose of the Supplemental PensionPlan is to provide supplemental retirement benefits to employees whose salary exceeds the statutorycompensation cap applicable to the Retirement Plan or whose benefit under the Retirement Plan is limited bythe statutory benefit cap applicable to the Retirement Plan. The purpose of the Supplemental Pension Plan of2003 (the “2003 Supplemental Pension Plan”) is to provide additional benefits based on eligible incentivecompensation not taken into account under the Retirement Plan or the Supplemental Pension Plan. Forexecutive officers, eligible incentive compensation includes Annual Incentive Plan bonuses, and awards underthe 2008 Retention Program for 2008 and 2009. Beginning with awards for 2009 performance, eligibleincentive compensation for executive officers also includes deferred pay awards. For purposes of determiningbenefits under the 2003 Supplemental Pension Plan, the amount of an officer’s eligible incentive compensationtaken into account is limited in the aggregate to 50% of the officer’s base salary. Benefits under these plansvest at the same time as benefits under the Retirement Plan, and benefits under these plans typicallycommence at the later of age 55 or separation from service.
Messrs. Williams, Hisey and Benson are the only named executives who participate in the SupplementalPension Plan and the 2003 Supplemental Pension Plan. In general, officers who are eligible to participate inthe Executive Pension Plan receive the greater of their Executive Pension Plan benefits or combinedSupplemental Pension Plan and 2003 Supplemental Pension Plan benefits. However, for 2010 and 2011,Mr. Williams will accrue benefits under the Supplemental Pension Plan and the 2003 Supplemental PensionPlan that will not be offset by his Executive Pension Plan benefit. In light of its decision to freezeMr. Williams’ benefit under the Executive Pension Plan, the Board adopted this change, with the approval ofFHFA, to provide Mr. Williams a pension benefit for 2010 and 2011.
Retirement Plan. Participation in the Retirement Plan has been frozen, and employees hired afterDecember 31, 2007 and employees who did not satisfy the age and service requirements to be grandfatheredparticipants under the Retirement Plan do not earn benefits under the Retirement Plan. Prior to 2007,participation in the Retirement Plan was generally available to employees. Participants are fully vested in the
225
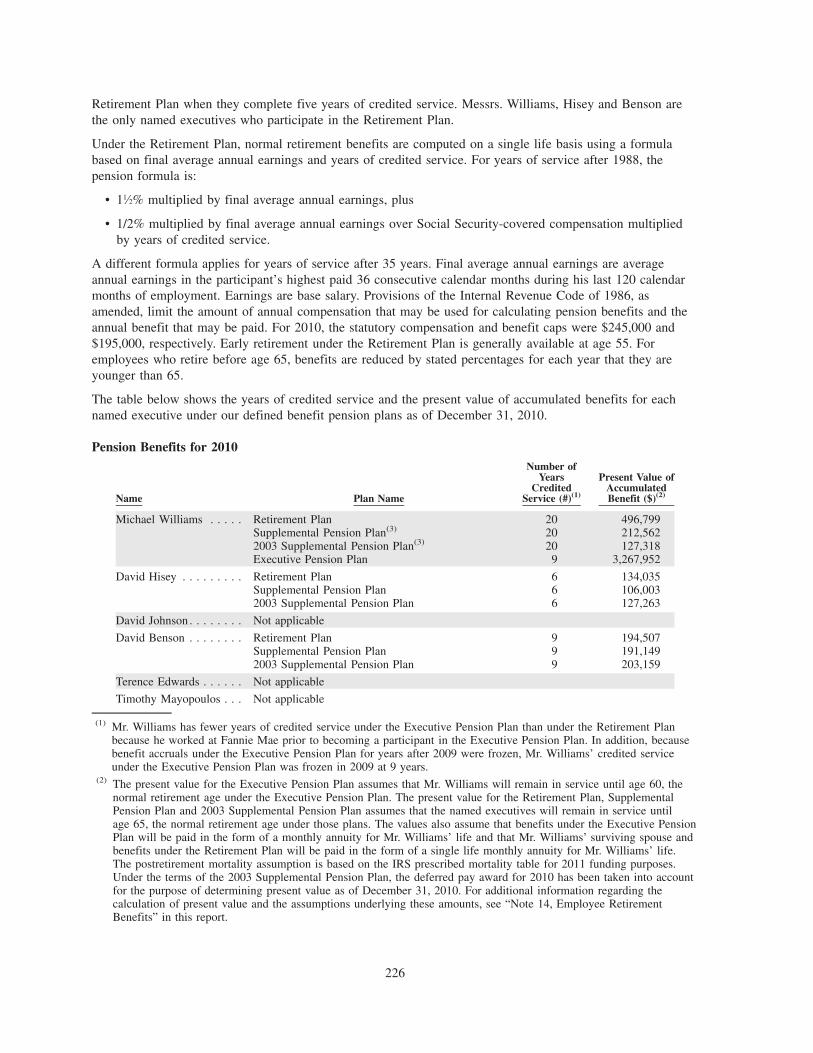
Retirement Plan when they complete five years of credited service. Messrs. Williams, Hisey and Benson arethe only named executives who participate in the Retirement Plan.
Under the Retirement Plan, normal retirement benefits are computed on a single life basis using a formulabased on final average annual earnings and years of credited service. For years of service after 1988, thepension formula is:
• 11⁄2% multiplied by final average annual earnings, plus
• 1/2% multiplied by final average annual earnings over Social Security-covered compensation multipliedby years of credited service.
A different formula applies for years of service after 35 years. Final average annual earnings are averageannual earnings in the participant’s highest paid 36 consecutive calendar months during his last 120 calendarmonths of employment. Earnings are base salary. Provisions of the Internal Revenue Code of 1986, asamended, limit the amount of annual compensation that may be used for calculating pension benefits and theannual benefit that may be paid. For 2010, the statutory compensation and benefit caps were $245,000 and$195,000, respectively. Early retirement under the Retirement Plan is generally available at age 55. Foremployees who retire before age 65, benefits are reduced by stated percentages for each year that they areyounger than 65.
The table below shows the years of credited service and the present value of accumulated benefits for eachnamed executive under our defined benefit pension plans as of December 31, 2010.
Pension Benefits for 2010
Name Plan Name
Number ofYears
CreditedService (#)(1)
Present Value ofAccumulatedBenefit ($)(2)
Michael Williams . . . . . Retirement Plan 20 496,799Supplemental Pension Plan(3) 20 212,5622003 Supplemental Pension Plan(3) 20 127,318Executive Pension Plan 9 3,267,952
David Hisey . . . . . . . . . Retirement Plan 6 134,035Supplemental Pension Plan 6 106,0032003 Supplemental Pension Plan 6 127,263
David Johnson . . . . . . . . Not applicable
David Benson . . . . . . . . Retirement Plan 9 194,507Supplemental Pension Plan 9 191,1492003 Supplemental Pension Plan 9 203,159
Terence Edwards . . . . . . Not applicable
Timothy Mayopoulos . . . Not applicable
(1) Mr. Williams has fewer years of credited service under the Executive Pension Plan than under the Retirement Planbecause he worked at Fannie Mae prior to becoming a participant in the Executive Pension Plan. In addition, becausebenefit accruals under the Executive Pension Plan for years after 2009 were frozen, Mr. Williams’ credited serviceunder the Executive Pension Plan was frozen in 2009 at 9 years.
(2) The present value for the Executive Pension Plan assumes that Mr. Williams will remain in service until age 60, thenormal retirement age under the Executive Pension Plan. The present value for the Retirement Plan, SupplementalPension Plan and 2003 Supplemental Pension Plan assumes that the named executives will remain in service untilage 65, the normal retirement age under those plans. The values also assume that benefits under the Executive PensionPlan will be paid in the form of a monthly annuity for Mr. Williams’ life and that Mr. Williams’ surviving spouse andbenefits under the Retirement Plan will be paid in the form of a single life monthly annuity for Mr. Williams’ life.The postretirement mortality assumption is based on the IRS prescribed mortality table for 2011 funding purposes.Under the terms of the 2003 Supplemental Pension Plan, the deferred pay award for 2010 has been taken into accountfor the purpose of determining present value as of December 31, 2010. For additional information regarding thecalculation of present value and the assumptions underlying these amounts, see “Note 14, Employee RetirementBenefits” in this report.
226

(3) The present value of accumulated benefit for Mr. Williams for the Supplemental Pension Plan and 2003 SupplementalPension Plan shown in this table reflects only the amounts accrued under these plans in 2010. Although Mr. Williamshas 20 years of credited service under the Supplemental Pension Plan and 2003 Supplemental Pension Plan, as ofDecember 31, 2010, his benefit for years prior to 2010 under these plans is offset by the benefit that he would receiveupon his retirement under the Executive Pension Plan.
Retirement Savings Plan
The Retirement Savings Plan is a defined contribution plan that includes a 401(k) before-tax feature, a regularafter-tax feature and a Roth after-tax feature. Under the plan, eligible employees may allocate investmentbalances to a variety of investment options. Subject to IRS limits for 401(k) plans, we match in cash employeecontributions up to 3% of base salary for employees who are grandfathered participants in our Retirement Planand up to 6% of base salary and eligible incentive compensation (which for the applicable named executivesincludes annual bonuses and deferred pay) for employees who are not grandfathered participants in ourRetirement Plan. All non-grandfathered employees are 100% vested in our matching contributions.Grandfathered employees receive benefits under the 3% of base salary matching program and are fully vestedin our matching contributions after five years of service. Messrs. Williams, Hisey and Benson aregrandfathered employees under our Retirement Plan and therefore receive benefits under the 3% matchingprogram, while Messrs. Johnson, Edwards and Mayopoulos are non-grandfathered employees and thereforereceive benefits under the 6% matching program.
All regular employees, with the exception of those who participated in the Executive Pension Plan (whichincludes Mr. Williams), receive an additional 2% contribution (based on base salary for grandfatheredemployees and on base salary and eligible incentive compensation for non-grandfathered employees) from thecompany regardless of employee contributions to this plan. Participants are fully vested in this 2%contribution after three years of service.
Nonqualified Deferred Compensation
Our Supplemental Retirement Savings Plan is an unfunded, non-tax-qualified defined contribution plan fornon-grandfathered employees. The Supplemental Retirement Savings Plan is intended to supplement ourRetirement Savings Plan, or 401(k) plan, by providing benefits to participants whose annual eligible earningsexceed the IRS annual limit on eligible compensation for 401(k) plans (for 2010, the limit was $245,000).Messrs. Johnson, Edwards and Mayopoulos are the named executives who participated in the SupplementalRetirement Savings Plan in 2010.
For 2010, we credited 8% of the eligible compensation for Messrs. Johnson, Edwards and Mayopoulos thatexceeded the IRS annual limit for 2010. Eligible compensation for Messrs. Johnson, Edwards and Mayopoulosconsists of base salary plus any eligible incentive compensation (which includes annual bonuses and deferredpay) earned for that year, plus any awards earned for that year under the 2008 Retention Program, up to acombined maximum of two times base salary. The 8% credit consists of two parts: (1) a 2% credit that willvest after the participant has completed three years of service with us; and (2) a 6% credit that is immediatelyvested.
While the Supplemental Retirement Savings Plan is not funded, amounts credited on behalf of a participantunder the Supplemental Retirement Savings Plan are deemed to be invested in mutual fund investments similarto the investments offered under our 401(k) plan. Participants may change their investment elections on a dailybasis.
Amounts deferred under the Supplemental Retirement Savings Plan are payable to participants in the Januaryor July following separation from service with us, subject to a six month delay in payment for the 50 mosthighly-compensated officers. Participants may not withdraw amounts from the Supplemental RetirementSavings Plan while they are employed by us.
The table below provides information on the nonqualified deferred compensation of the named executives for2010.
227

Nonqualified Deferred Compensation for 2010
Name
ExecutiveContributions
in LastFiscal Year ($)
CompanyContributions in
Last FiscalYear ($)(1)
AggregateEarnings inLast FiscalYear ($)(2)
AggregateWithdrawals/
Distributions ($)
AggregateBalance atLast Fiscal
Year-End ($)(3)
Michael Williams2001 Special Stock Award(4) . . . . . . . . . . — — (1,208) — 412
David Hisey . . . . . . . . . . . . . . . . . . . . . . . — — — — —David Johnson
Supplemental Retirement Savings Plan . . . — 64,500 14,027 — 106,909
David Benson . . . . . . . . . . . . . . . . . . . . . . — — — — —Terence Edwards
Supplemental Retirement Savings Plan . . . — 30,339 1,409 — 31,748
Timothy MayopoulosSupplemental Retirement Savings Plan . . . — 48,708 7,118 — 64,708
(1) All amounts reported in this column for Messrs. Johnson, Edwards and Mayopoulos as company contributions in thelast fiscal year pursuant to the Supplemental Retirement Savings Plan are also reported as 2010 compensation in the“All Other Compensation” column of the “Summary Compensation Table for 2010, 2009 and 2008.” Companycontributions for Mr. Johnson in this column do not include $21,500 in company credits made under the SupplementalRetirement Savings Plan in 2010 that he forfeited by leaving the company before completing the three-year vestingperiod.
(2) None of the earnings reported in this column are reported as 2010 compensation in the “Summary CompensationTable for 2010, 2009 and 2008” because the earnings are neither above-market nor preferential.
(3) Amounts reported in this column for Mr. Johnson include company contributions in 2009 to the SupplementalRetirement Savings Plan of $25,800 that are also reported as 2009 compensation in the “All Other Compensation”column of the “Summary Compensation Table for 2010, 2009 and 2008.” Amounts reported in this column forMr. Mayopoulos include company contributions in 2009 to the Supplemental Retirement Savings Plan of $8,708 thatare also reported as 2009 compensation in the “All Other Compensation” column of the “Summary CompensationTable for 2010, 2009 and 2008.”
(4) The Board previously approved a special stock award to officers for 2001 performance. On January 15, 2002,Mr. Williams deferred until retirement 1,142 shares he received in connection with this award. Aggregate earnings onthese shares reflect changes in stock price. Mr. Williams’ number of shares has grown through the reinvestment ofdividends to 1,373 shares as of December 31, 2010.
Potential Payments upon Termination or Change-in-Control
The information below describes and quantifies certain compensation and benefits that may have becomepayable to each of our named executives under our existing plans and arrangements if our named executive’semployment had terminated on December 31, 2010, taking into account the named executive’s compensationand service levels as of that date and based on a per share price of $0.30, which was the closing price of ourcommon stock on December 31, 2010. The discussion below does not reflect retirement or deferredcompensation benefits to which our named executives may be entitled, as these benefits are described aboveunder “Pension Benefits” and “Nonqualified Deferred Compensation.” The information below also does notgenerally reflect compensation and benefits available to all salaried employees upon termination ofemployment with us under similar circumstances. We are not obligated to provide any additionalcompensation to our named executives in connection with a change-in-control.
FHFA Must Approve Any Termination Benefits We Provide Named Executives
FHFA, as our regulator, must approve any termination benefits we offer our named executives. Moreover, asour conservator, FHFA has directed that our Board consult with and obtain FHFA’s consent before taking anyaction involving termination benefits for any officer at the executive vice president level and above andincluding, regardless of title, executives who hold positions with the functions of the chief operating officer,chief financial officer, general counsel, chief business officer, chief investment officer, treasurer, chiefcompliance officer, chief risk officer and chief/general/internal auditor. In addition, as described below under“Potential Payments to Named Executives,” in the event Fannie Mae terminates a named executive’s
228

employment other than for cause, any determination by the Board to pay unpaid deferred pay or long-termincentive awards to the named executive is subject to the approval of FHFA in consultation with Treasury.
Potential Payments to Named Executives
We have not entered into employment agreements with any of our named executives that would entitle ourexecutives to severance benefits. Below we discuss various elements of compensation that may becomepayable in the event a named executive dies or retires, or that may be paid in the event his employment isterminated by Fannie Mae. We then quantify the amounts that might have been paid to our named executivesin these circumstances, in each case as of December 31, 2010.
• Deferred Pay and Long-Term Incentive Awards. In general, an executive officer, including our namedexecutives, must continue to be employed to receive payments of deferred pay or the long-term incentiveaward, and will forfeit any unpaid amounts upon termination of his or her employment. Exceptions to thisgeneral rule apply in the case of an executive officer’s death or retirement, and may apply in the event anexecutive officer’s employment is terminated by Fannie Mae other than for cause, as follows:
• Death. In the event an executive officer’s employment is terminated due to his or her death, his or herestate will receive the remaining installment payments of deferred pay for the prior year, as well as apro rata portion of deferred pay for the current year, based on time worked during the year. In addition,his or her estate will receive any remaining installment payment of a long-term incentive award for acompleted performance year and a pro rata portion of a long-term incentive award for the currentperformance year, based on time worked during the year; provided that the executive officer wasemployed at least one complete calendar quarter during the current performance year.
• Retirement. If an executive officer retires from Fannie Mae at or after age 65 with at least 5 years ofservice, he or she will receive the remaining installment payments of deferred pay for the prior year. Inaddition, he or she will receive any remaining installment payment of a long-term incentive award for acompleted performance year.
• Termination by Fannie Mae. If Fannie Mae terminates an executive officer’s employment other thanfor cause, the Board of Directors may determine, subject to the approval of FHFA in consultation withTreasury, that he or she may receive certain unpaid deferred pay or long-term incentive awards. Thedetermination to pay amounts of unpaid deferred pay or long-term incentive awards is in the discretionof the Board of Directors and FHFA; the named executives do not have any contractual right or rightunder the terms of the deferred pay plan or the long-term incentive plan to receive any unpaid deferredpay or long-term incentive awards in the event of a termination by Fannie Mae.
In each case, for any portion of a long-term incentive award or any performance-based portion of a deferredpay award that has not been finally determined, the award will be adjusted based on performance relative tothe applicable performance goals and, in the case of a termination by Fannie Mae, cannot exceed 100% ofthe target award. In addition, installment payments of the awards will be made on the original paymentschedule, rather than being provided in a lump sum. In the case of a termination by Fannie Mae, anexecutive officer must agree to the terms of a standard termination agreement with the company in order toreceive these post-termination of employment payments. More information about deferred pay and the long-term incentive awards is provided above in “Compensation Discussion and Analysis—2010 ExecutiveCompensation Program—Elements of 2010 Compensation Program.”
• Stock Compensation Plans. Under the Fannie Mae Stock Compensation Plan of 2003, stock options,restricted stock and restricted stock units held by our employees, including our named executives, fully vestupon the employee’s death, total disability or retirement. Under both the Fannie Mae Stock CompensationPlan of 2003 and the Fannie Mae Stock Compensation Plan of 1993, upon the occurrence of these events, orif an option holder leaves our employment after age 55 with at least 5 years of service, the option holder, orthe holder’s estate in the case of death, can exercise any stock options until the initial expiration date of thestock option, which is generally 10 years after the date of grant. For these purposes, “retirement” generally
229

means that the executive retires at or after age 60 with 5 years of service or age 65 (with no servicerequirement).
• Retiree Medical Benefits. We currently make certain retiree medical benefits available to our full-timeemployees who retire and meet certain age and service requirements.
The table below shows the amounts that would have become payable if a named executive’s employment hadterminated on December 31, 2010 as a result of his death. The table below does not show any amounts thatwould have become payable if a named executive had retired on December 31, 2010 since as of that date noneof the named executives had reached the minimum age required to receive any of these amounts upon hisretirement.
Potential Payments Upon Death as of December 31, 2010(1)
NameRestricted
Stock(2)2010
Deferred Pay(3)
2009Long-TermIncentiveAward(4)
2010Long-TermIncentiveAward(5) Total
Michael Williams . . . . . . . . . . . . . . . . . . . . . . $29,260 $2,945,000 $832,500 $900,000 $4,706,760
David Hisey . . . . . . . . . . . . . . . . . . . . . . . . . 5,594 992,750 328,500 325,000 1,651,844David Johnson(6) . . . . . . . . . . . . . . . . . . . . . . — — — — —
David Benson . . . . . . . . . . . . . . . . . . . . . . . . 4,486 1,301,184 418,650 440,000 2,164,320Terence Edwards . . . . . . . . . . . . . . . . . . . . . . — 1,301,184 163,095 420,000 1,884,279
Timothy Mayopoulos . . . . . . . . . . . . . . . . . . . — 1,396,184 421,301 485,000 2,302,485
(1) The named executives would also have received the applicable amounts shown in the “Restricted Stock” column ofthis table in the event of their total disability, but not the amounts shown under any other column.
(2) These values are based on a per share price of $0.30, which was the closing price of our common stock onDecember 31, 2010.
(3) Assumes that each named executive (other than Mr. Johnson) would have received the 2010 deferred pay awarded tohim, which is payable in March, June, September and December 2011. Each named executive was awarded 95% of histarget 2010 deferred pay (50% of deferred pay was based on corporate performance, which the CompensationCommittee determined would be paid at 90% of target, and the remaining 50% of deferred pay was service based andtherefore the named executives will receive 100% of this portion of the award).
(4) Assumes that each named executive (other than Mr. Johnson) would have received the second installment of his 2009long-term incentive award, which was determined in February 2010 and is paid in February 2011.
(5) Assumes that each named executive (other than Mr. Johnson) would have received the first installment of his 2010long-term incentive award, which was determined in January 2011 and is paid in February 2011. The namedexecutives would not have received the second installment of the 2010 long-term incentive award in the event of theirdeath on December 31, 2010, because that installment will be determined in the first quarter of 2012 based oncorporate and individual performance for both 2010 and 2011.
(6) Mr. Johnson left the company on December 29, 2010 and therefore would not be entitled to any payments upon deathas of December 31, 2010.
The table below shows the maximum amount of deferred pay and long-term incentive award that could havebecome payable to the named executive if his employment was terminated other than for cause onDecember 31, 2010. The named executives do not have any contractual right or right under the terms of thedeferred pay plan or the long-term incentive plan to receive any unpaid deferred pay or long-term incentiveawards in the event of a termination by Fannie Mae. Any amounts of unpaid deferred pay or long-termincentive awards paid to executive officers if they are terminated other than for cause will be determined on acase-by-case basis in the discretion of our Board of Directors and also subject to the approval of FHFA inconsultation with Treasury. We therefore cannot make a reasonable estimate of the amounts that wouldbecome payable in such cases.
230

Maximum Potential Payments Upon Termination Other Than For Cause as of December 31, 2010
Name2010
Deferred Pay(1)
2009Long-TermIncentiveAward(2)
2010Long-TermIncentiveAward(3) Total
Michael Williams . . . . . . . . . . . . . . . . . . . . . . . . . $2,945,000 $832,500 $900,000 $4,677,500
David Hisey . . . . . . . . . . . . . . . . . . . . . . . . . . . . . 992,750 328,500 325,000 1,646,250David Johnson(4) . . . . . . . . . . . . . . . . . . . . . . . . . . — — — —
David Benson . . . . . . . . . . . . . . . . . . . . . . . . . . . . 1,301,184 418,650 440,000 2,159,834Terence Edwards . . . . . . . . . . . . . . . . . . . . . . . . . . 1,301,184 163,095 420,000 1,884,279
Timothy Mayopoulos . . . . . . . . . . . . . . . . . . . . . . . 1,396,184 421,301 485,000 2,302,485
(1) Assumes that each named executive (other than Mr. Johnson) would have received 100% of the 2010 deferred payawarded to him, which is payable in March, June, September and December 2011. Each named executive was awarded95% of his target 2010 deferred pay (50% of deferred pay was based on corporate performance, which theCompensation Committee determined would be paid at 90% of target, and the remaining 50% of deferred pay wasservice based and therefore the named executives will receive 100% of this portion of the award). The actual amountof unpaid deferred pay a named executive would receive in the event his employment is terminated would be in thediscretion of our Board of Directors and also subject to the approval of FHFA in consultation with Treasury, and couldrange from 0% to 100% of the amount shown in this column.
(2) Assumes that each named executive (other than Mr. Johnson) would have received 100% of the second installment ofhis 2009 long-term incentive award, which was determined in February 2010 and is paid in February 2011. The actualamount of the unpaid 2009 long-term incentive award a named executive would receive in the event his employment isterminated would be in the discretion of our Board of Directors and also subject to the approval of FHFA inconsultation with Treasury, and could range from 0% to 100% of the amount shown in this column.
(3) Assumes that each named executive (other than Mr. Johnson) would have received 100% of the first installment of his2010 long-term incentive award, which was determined in January 2011 and is paid in February 2011. We have notincluded the second installment of the 2010 long-term incentive award because that installment will not be determineduntil the first quarter of 2012 based on corporate and individual performance for both 2010 and 2011. The actualamount of the unpaid 2010 long-term incentive award a named executive would receive in the event his employment isterminated would be in the discretion of our Board of Directors and also subject to the approval of FHFA inconsultation with Treasury, and could range from 0% to 100% of the amount shown in this column.
(4) Mr. Johnson left the company on December 29, 2010 and therefore would not be entitled to any payments upontermination as of December 31, 2010.
Payments to Former Chief Financial Officer
Mr. Johnson, who served as our Chief Financial Officer from November 2008 to December 2010, received noseverance payments from us as a result of his resignation from Fannie Mae.
Director Compensation
In November 2008, FHFA approved a new program under which our non-management directors receive allcompensation in cash, as described below. This compensation for the directors was designed to be reasonable,appropriate and commensurate with the duties and responsibilities of their Board service.
The total 2010 compensation for our non-management directors is shown in the table below. Mr. Williams, ouronly director who also served as an employee of Fannie Mae during 2010, was not entitled to receive any ofthe benefits provided to our non-management directors other than those provided under the matchingcharitable gifts program, which is available to all of our employees.
231

2010 Non-Employee Director Compensation Table
Name
Fees Earnedor Paidin Cash
($)
All OtherCompensation
($)(1)Total
($)
Dennis R. Beresford. . . . . . . . . . . . . . . . . . . . . . . . . . . . . . . . . . . . . . . . . . . 185,000 — 185,000
William Thomas Forrester . . . . . . . . . . . . . . . . . . . . . . . . . . . . . . . . . . . . . . 170,000 — 170,000
Brenda J. Gaines . . . . . . . . . . . . . . . . . . . . . . . . . . . . . . . . . . . . . . . . . . . . . 180,000 — 180,000
Charlynn Goins . . . . . . . . . . . . . . . . . . . . . . . . . . . . . . . . . . . . . . . . . . . . . . 170,000 — 170,000
Frederick B. “Bart” Harvey III . . . . . . . . . . . . . . . . . . . . . . . . . . . . . . . . . . . 170,000 10,000 180,000
Philip A. Laskawy . . . . . . . . . . . . . . . . . . . . . . . . . . . . . . . . . . . . . . . . . . . . 290,000 10,000 300,000
Egbert L. J. Perry . . . . . . . . . . . . . . . . . . . . . . . . . . . . . . . . . . . . . . . . . . . . 160,000 — 160,000
Jonathan Plutzik . . . . . . . . . . . . . . . . . . . . . . . . . . . . . . . . . . . . . . . . . . . . . 160,000 10,000 170,000
David H. Sidwell . . . . . . . . . . . . . . . . . . . . . . . . . . . . . . . . . . . . . . . . . . . . . 160,000 10,000 170,000
(1) “All Other Compensation” consists of gifts we made or will make under our matching charitable gifts program. Ourmatching charitable gifts program is discussed in greater detail following this table.
Compensation Arrangements for our Non-Management Directors
Our non-management directors receive a retainer at an annual rate of $160,000, with no meeting fees.Committee chairs and Audit Committee members receive an additional retainer at an annual rate of $25,000for the Audit Committee chair, $15,000 for the Risk Policy and Capital Committee chair and $10,000 for allother committee chairs and each member of the Audit Committee. In recognition of the substantial amount oftime and effort necessary to fulfill the duties of non-executive Chairman of the Board, the annual retainer forour non-executive Chairman, Mr. Laskawy, is $290,000. Our directors receive no equity compensation.
Additional Arrangements with our Non-Management Directors
Matching Charitable Gifts Program. To further our support for charitable giving, non-employee directors areable to participate in our corporate matching gifts program on the same terms as our employees. Under thisprogram, gifts made by employees and directors to Section 501(c)(3) charities are matched, up to an aggregatetotal of $10,000 in any calendar year, including up to $500 that may be matched on a 2-for-1 basis. EffectiveJanuary 1, 2011, we changed our matching charitable gifts program to reduce the maximum amount ofmatching gifts to $5,000 in any calendar year and to eliminate the ability to match up to $500 on a 2-for-1basis.
Stock Ownership Guidelines for Directors. In January 2009, our Board eliminated our stock ownershiprequirements for directors and for senior officers in light of the difficulty of meeting the requirements atcurrent market prices and because we have ceased paying stock-based compensation.
Other Expenses. We also pay for or reimburse directors for out-of-pocket expenses incurred in connectionwith their service on the Board, including travel to and from our meetings, accommodations, meals andtraining.
232

Item 12. Security Ownership of Certain Beneficial Owners and Management and Related StockholderMatters
The following table provides information as of December 31, 2010 with respect to shares of common stockthat may be issued under our existing equity compensation plans. At this time, we are prohibited from issuingnew stock without the prior written consent of Treasury under the terms of the senior preferred stock purchaseagreement, other than as required by the terms of any binding agreement in effect on the date of the seniorpreferred stock purchase agreement, including as required by the terms of outstanding stock options andrestricted stock units.
Equity Compensation Plan Information
Plan Category
Number ofSecurities to be
Issued uponExercise of
OutstandingOptions, Warrants
and Rights (#)
Weighted-AverageExercise Price of
OutstandingOptions, Warrants
and Rights
Number ofSecurities
Remaining Availablefor Future Issuance
under EquityCompensation Plans
(ExcludingSecurities
Reflected in FirstColumn) (#)
As of December 31, 2010
Equity compensation plans approved by stockholders. . . . . 4,942,332(1) $75.07(2) 40,989,913(3)
Equity compensation plans not approved by stockholders . . N/A N/A N/A
Total. . . . . . . . . . . . . . . . . . . . . . . . . . . . . . . . . . . . . 4,942,332 $75.07 40,989,913
(1) This amount includes outstanding stock options; restricted stock units; deferred stock units; and shares issuable uponthe payout of deferred stock balances. Outstanding awards, options and rights include grants under the Fannie MaeStock Compensation Plan of 1993, the Stock Compensation Plan of 2003 and the payout of shares deferred upon thesettlement of awards made under the 1993 plan and a prior plan.
(2) The weighted average exercise price is calculated for the outstanding options and does not take into account restrictedstock units or deferred shares.
(3) This number of shares consists of 11,960,258 shares available under the 1985 Employee Stock Purchase Plan and29,029,655 shares available under the Stock Compensation Plan of 2003 that may be issued as restricted stock, stockbonuses, stock options or in settlement of restricted stock units, performance share program awards, stock appreciationrights or other stock-based awards. No more than 1,433,784 of the shares issuable under the Stock Compensation Planof 2003 may be issued as restricted stock or restricted stock units vesting in full in fewer than three years,performance shares with a performance period of less than one year or bonus shares subject to similar vestingprovisions or performance periods.
233

Beneficial Ownership
The following table shows the beneficial ownership of our common stock by each of our current directors andthe named executives, and all current directors and executive officers as a group, as of February 15, 2011,unless otherwise indicated. As of that date, no director or named executive, nor all directors and currentexecutive officers as a group, owned as much as 1% of our outstanding common stock.
Name and Position
Common StockBeneficially
Owned ExcludingStock Options
Stock OptionsExercisable orOther SharesObtainable
Within 60 Days ofFebruary 15,
2011(2)
TotalCommon Stock
BeneficiallyOwned
Amount and Nature of Beneficial Ownership(1)
David C. Benson(3) . . . . . . . . . . . . . . . . . . . . . . . . . . . . . . . . . 17,367 53,927 71,294Executive Vice President—Capital Markets
Dennis R. Beresford . . . . . . . . . . . . . . . . . . . . . . . . . . . . . . . . 4,719 0 4,719Director
Terence W. Edwards . . . . . . . . . . . . . . . . . . . . . . . . . . . . . . . . 0 0 0Executive Vice President—Credit Portfolio Management
W. Thomas Forrester . . . . . . . . . . . . . . . . . . . . . . . . . . . . . . . 0 0 0Director
Brenda J. Gaines . . . . . . . . . . . . . . . . . . . . . . . . . . . . . . . . . . 487 0 487Director
Charlynn Goins . . . . . . . . . . . . . . . . . . . . . . . . . . . . . . . . . . . 0 0 0Director
Frederick Barton Harvey, III . . . . . . . . . . . . . . . . . . . . . . . . . . 0 0 0Director
David C. Hisey(4) . . . . . . . . . . . . . . . . . . . . . . . . . . . . . . . . . . 14,517 10,000 24,517Executive Vice President and Deputy Chief Financial Officer
David M. Johnson . . . . . . . . . . . . . . . . . . . . . . . . . . . . . . . . . 0 0 0Executive Vice President and Chief Financial Officer
Philip A. Laskawy . . . . . . . . . . . . . . . . . . . . . . . . . . . . . . . . . 0 0 0Chairman of the Board
Timothy J. Mayopoulos . . . . . . . . . . . . . . . . . . . . . . . . . . . . . 0 0 0Executive Vice President, Chief Administrative Officer,General Counsel and Corporate Secretary
Egbert L. J. Perry. . . . . . . . . . . . . . . . . . . . . . . . . . . . . . . . . . 0 0 0Director
Jonathan Plutzik. . . . . . . . . . . . . . . . . . . . . . . . . . . . . . . . . . . 0 0 0Director
David H. Sidwell . . . . . . . . . . . . . . . . . . . . . . . . . . . . . . . . . . 0 0 0Director
Michael J. Williams(5) . . . . . . . . . . . . . . . . . . . . . . . . . . . . . . 254,657 183,824 438,481President and Chief Executive Officer
All directors and current executive officers as a group(20 persons)(6) . . . . . . . . . . . . . . . . . . . . . . . . . . . . . . . . . . 457,286 403,965 861,251
(1) Beneficial ownership is determined in accordance with the rules of the SEC for computing the number of shares ofcommon stock beneficially owned by each person and the percentage owned. Holders of restricted stock have noinvestment power but have sole voting power over the shares and, accordingly, these shares are included in this table.Holders of stock options have no investment or voting power over the shares issuable upon the exercise of the optionsuntil the options are exercised. Shares issuable upon the vesting of restricted stock units are not considered to bebeneficially owned under applicable SEC rules and, accordingly, restricted stock units are not included in the amountsshown.
(2) These shares are issuable upon the exercise of outstanding stock options, except for 1,373 shares of deferred stockheld by Mr. Williams, which he could obtain within 60 days in certain circumstances.
(3) Mr. Benson’s shares include 5,986 shares of restricted stock.
234
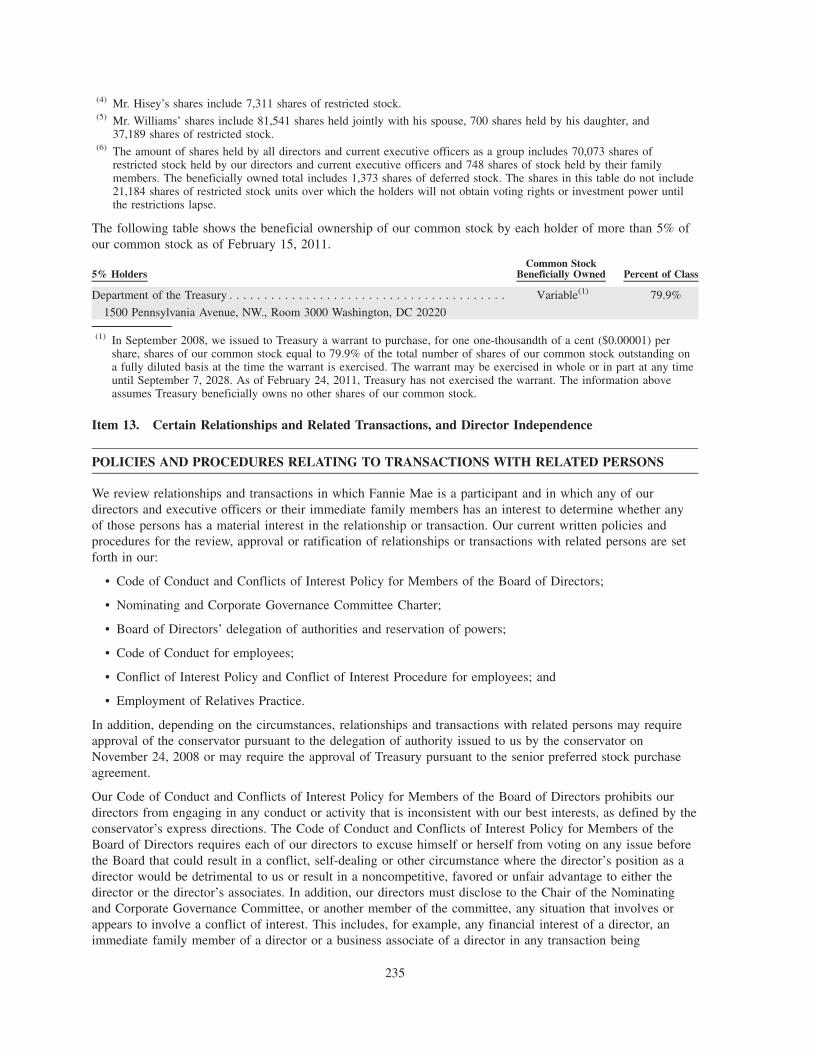
(4) Mr. Hisey’s shares include 7,311 shares of restricted stock.(5) Mr. Williams’ shares include 81,541 shares held jointly with his spouse, 700 shares held by his daughter, and
37,189 shares of restricted stock.(6) The amount of shares held by all directors and current executive officers as a group includes 70,073 shares of
restricted stock held by our directors and current executive officers and 748 shares of stock held by their familymembers. The beneficially owned total includes 1,373 shares of deferred stock. The shares in this table do not include21,184 shares of restricted stock units over which the holders will not obtain voting rights or investment power untilthe restrictions lapse.
The following table shows the beneficial ownership of our common stock by each holder of more than 5% ofour common stock as of February 15, 2011.
5% HoldersCommon Stock
Beneficially Owned Percent of Class
Department of the Treasury . . . . . . . . . . . . . . . . . . . . . . . . . . . . . . . . . . . . . . . . Variable(1) 79.9%
1500 Pennsylvania Avenue, NW., Room 3000 Washington, DC 20220
(1) In September 2008, we issued to Treasury a warrant to purchase, for one one-thousandth of a cent ($0.00001) pershare, shares of our common stock equal to 79.9% of the total number of shares of our common stock outstanding ona fully diluted basis at the time the warrant is exercised. The warrant may be exercised in whole or in part at any timeuntil September 7, 2028. As of February 24, 2011, Treasury has not exercised the warrant. The information aboveassumes Treasury beneficially owns no other shares of our common stock.
Item 13. Certain Relationships and Related Transactions, and Director Independence
POLICIES AND PROCEDURES RELATING TO TRANSACTIONS WITH RELATED PERSONS
We review relationships and transactions in which Fannie Mae is a participant and in which any of ourdirectors and executive officers or their immediate family members has an interest to determine whether anyof those persons has a material interest in the relationship or transaction. Our current written policies andprocedures for the review, approval or ratification of relationships or transactions with related persons are setforth in our:
• Code of Conduct and Conflicts of Interest Policy for Members of the Board of Directors;
• Nominating and Corporate Governance Committee Charter;
• Board of Directors’ delegation of authorities and reservation of powers;
• Code of Conduct for employees;
• Conflict of Interest Policy and Conflict of Interest Procedure for employees; and
• Employment of Relatives Practice.
In addition, depending on the circumstances, relationships and transactions with related persons may requireapproval of the conservator pursuant to the delegation of authority issued to us by the conservator onNovember 24, 2008 or may require the approval of Treasury pursuant to the senior preferred stock purchaseagreement.
Our Code of Conduct and Conflicts of Interest Policy for Members of the Board of Directors prohibits ourdirectors from engaging in any conduct or activity that is inconsistent with our best interests, as defined by theconservator’s express directions. The Code of Conduct and Conflicts of Interest Policy for Members of theBoard of Directors requires each of our directors to excuse himself or herself from voting on any issue beforethe Board that could result in a conflict, self-dealing or other circumstance where the director’s position as adirector would be detrimental to us or result in a noncompetitive, favored or unfair advantage to either thedirector or the director’s associates. In addition, our directors must disclose to the Chair of the Nominatingand Corporate Governance Committee, or another member of the committee, any situation that involves orappears to involve a conflict of interest. This includes, for example, any financial interest of a director, animmediate family member of a director or a business associate of a director in any transaction being
235

considered by the Board, as well as any financial interest a director may have in an organization doingbusiness with us. Each of our directors also must annually certify compliance with the Code of Conduct andConflicts of Interest Policy for Members of the Board of Directors.
The Nominating and Corporate Governance Committee Charter and our Board’s delegation of authorities andreservation of powers require the Nominating and Corporate Governance Committee to approve anytransaction that Fannie Mae engages in with any director, nominee for director or executive officer, or anyimmediate family member of a director, nominee for director or executive officer, that is required to bedisclosed pursuant to Item 404 of Regulation S-K. In addition, the Board’s delegation of authorities andreservation of powers requires the Board and the conservator to approve any action, including a related partytransaction, that in the reasonable business judgment of the Board at the time the action is taken is likely tocause significant reputational risk.
Our Code of Conduct for employees requires that we and our employees seek to avoid any actual or apparentconflict between our business interests and the personal interests of our employees or their relatives orassociates. An employee who knows or suspects a violation of our Code of Conduct must raise the issue withthe employee’s manager, another appropriate member of management, a member of our Human Resourcesdivision or our Compliance and Ethics division.
Under our Conflict of Interest Policy and Conflict of Interest Procedure for employees, an employee who hasa potential or actual conflict of interest must request review and approval of the conflict. Conflicts requiringreview and approval include situations where the employee or a close relative of the employee has (1) afinancial interest worth more than $100,000 in an entity that does business with or seeks to do business withor competes with Fannie Mae, (2) a financial interest worth more than $10,000 in such an entity combinedwith the ability to control or influence Fannie Mae’s relationship with the entity, or (3) for senior vicepresidents and above, any financial interest in specified significant Fannie Mae counterparties and otherentities. In accordance with its charter, our Nominating and Corporate Governance Committee must reviewactivities engaged in by our Chief Executive Officer, Chief Operating Officer, Chief Financial Officer,Enterprise Risk Officer, General Counsel, Chief Audit Executive or Chief Compliance Officer that may resultin an actual or potential conflict of interest under the Employee Code of Conduct or Conflict of Interest Policyand Conflict of Interest Procedure. Our Chief Executive Officer is responsible for reviewing and approvingconflicts involving other executive officers. If any conflicts are determined to involve significant reputationalrisk, they must be raised to the conservator.
Our Employment of Relatives Practice prohibits, among other things, situations where an employee wouldexercise influence, control or authority over the employee’s relative’s areas of responsibility or terms ofemployment, including but not limited to job responsibilities, performance ratings or compensation.Employees have an obligation to disclose the existence of any relation to another current employee prior toapplying for any position or engaging in any other work situation that may give rise to prohibited influence,control or authority.
We are required by the conservator to obtain its approval for various matters, some of which may involverelationships or transactions with related persons. These matters include actions involving the senior preferredstock purchase agreement, the creation of any subsidiary or affiliate or any substantial non-ordinary coursetransactions with any subsidiary or affiliate, actions involving hiring, compensation and termination benefits ofdirectors and officers at the executive vice president level and above and other specified executives, and anyaction that in the reasonable business judgment of the Board at the time that the action is taken is likely to causesignificant reputational risk. The senior preferred stock purchase agreement requires us to obtain writtenTreasury approval of transactions with affiliates unless, among other things, the transaction is upon terms no lessfavorable to us than would be obtained in a comparable arm’s-length transaction with a non-affiliate or thetransaction is undertaken in the ordinary course or pursuant to a contractual obligation or customary employmentarrangement in existence at the time the senior preferred stock purchase agreement was entered into.
We require our directors and executive officers, not less than annually, to describe to us any situationinvolving a transaction with us in which a director or executive officer could potentially have a personalinterest that would require disclosure under Item 404 of Regulation S-K. In addition, our Conflict of Interest
236

Policy and Conflict of Interest Procedure for employees require our executive officers to request review andapproval of any existing or proposed transaction with us, whether or not in the ordinary course of business, inwhich that officer or a member of his or her immediate family has a direct or indirect interest.
TRANSACTIONS WITH RELATED PERSONS
Transactions with Treasury
Treasury beneficially owns more than 5% of the outstanding shares of our common stock by virtue of thewarrant we issued to Treasury on September 7, 2008. The warrant entitles Treasury to purchase shares of ourcommon stock equal to 79.9% of our outstanding common stock on a fully diluted basis on the date ofexercise, for an exercise price of $0.00001 per share, and is exercisable in whole or in part at any time on orbefore September 7, 2028. We describe below our current agreements with Treasury.
Treasury Senior Preferred Stock Purchase Agreement
We issued the warrant to Treasury pursuant to the terms of the senior preferred stock purchase agreement weentered into with Treasury on September 7, 2008. Under the senior preferred stock purchase agreement, wealso issued to Treasury one million shares of senior preferred stock. We issued the warrant and the seniorpreferred stock as an initial commitment fee in consideration of Treasury’s commitment to provide up to$100 billion in funds to us under the terms and conditions set forth in the senior preferred stock purchaseagreement. On May 6, 2009, Treasury amended the senior preferred stock purchase agreement to increase itsfunding commitment to $200 billion and to revise some of the covenants in the agreement. Treasury furtheramended the senior preferred stock purchase agreement on December 24, 2009 in order to further increase itsfunding commitment to accommodate any net worth deficits for calendar quarters in 2010 through 2012. Forany net worth deficits after December 31, 2012, Treasury’s remaining funding commitment will be$124.8 billion, ($200 billion less the $75.2 billion cumulatively drawn through March 31, 2010), less thesmaller of either (a) our positive net worth as of December 31, 2012 or (b) our cumulative draws fromTreasury for the calendar quarters in 2010 through 2012. The amendment also made some other revisions tothe agreement. The senior preferred stock purchase agreement also requires that we pay a quarterlycommitment fee, beginning on March 31, 2011, in an amount to be determined by Treasury no later thanDecember 31, 2010. In December 2010, Treasury notified FHFA that Treasury was waiving the quarterlycommitment fee for the first quarter of 2011 due to adverse conditions in the U.S. mortgage market andbecause it believed that imposing the commitment fee would not generate increased compensation fortaxpayers. Treasury further noted that it would reevaluate matters in the next calendar quarter to determinewhether to set the quarterly commitment fee.
We have received an aggregate of $87.6 billion from Treasury under the senior preferred stock purchaseagreement, and in February 2011, the Acting Director of FHFA submitted a request on behalf of Fannie Maeto Treasury for an additional $2.6 billion from Treasury under the senior preferred purchase stock agreement.Through December 31, 2010, we have paid an aggregate of $10.2 billion to Treasury in dividends on thesenior preferred stock. See “Business—Conservatorship and Treasury Agreements—Treasury Agreements” formore information about the senior preferred stock purchase agreement.
Treasury Making Home Affordable Program
On February 18, 2009, the Obama Administration announced its Homeowner Affordability and Stability Plan,a plan to provide stability and affordability to the U.S. housing market. Pursuant to this plan, in March 2009,the Administration announced the details of its Making Home Affordable Program, a program intended toprovide assistance to homeowners and prevent foreclosures. One of the primary initiatives under the MakingHome Affordable Program is the Home Affordable Modification Program, or HAMP, which is aimed athelping borrowers whose loan is either currently delinquent or at imminent risk of default by modifying theirmortgage loan to make their monthly payments more affordable. In addition to our participation in theAdministration’s initiatives under the Making Home Affordable Program, Treasury engaged us to serve asprogram administrator for loans modified under HAMP pursuant to the financial agency agreement between
237

Treasury and us, dated February 18, 2009. See “Business—Making Home Affordable Program—Our Role asProgram Administrator” for a description of our principal activities as program administrator for HAMP andother initiatives under the Making Home Affordable Program.
Under our arrangement with Treasury, Treasury has agreed to compensate us for a significant portion of thework we have performed in our role as program administrator for HAMP and other initiatives under theMaking Home Affordable Program. In December 2009, Treasury established an initial budget for servicesprovided by us in our role as program administrator. This initial budget covered U.S. government fiscal years2009, 2010 and 2011, and has since been updated to reflect changes in program scope. We expect to receivean aggregate of approximately $200.5 million from Treasury for our work as program administrator forU.S. government fiscal years 2009, 2010 and 2011, as well as receive from Treasury an additional amount ofapproximately $45.3 million to be passed through to third-party vendors engaged by us for HAMP and otherinitiatives under the Making Home Affordable Program. These amounts are based on current workloadestimates and program scope, and will be updated to reflect any changes in policy, workload and programscope.
Treasury Housing Finance Agency Initiative
On October 19, 2009, we entered into a memorandum of understanding with Treasury, FHFA and Freddie Macthat established terms under which we, Freddie Mac and Treasury would provide assistance to state and localhousing finance agencies (“HFAs”) so that the HFAs could continue to meet their mission of providingaffordable financing for both single-family and multifamily housing. Pursuant to this HFA initiative, we,Freddie Mac and Treasury are providing assistance to the HFAs through two primary programs: a temporarycredit and liquidity facilities (“TCLF”) program, which is intended to improve the HFAs’ access to liquidityfor outstanding HFA bonds, and a new issue bond (“NIB”) program, which is intended to support new lendingby the HFAs. We entered into various agreements in November and December 2009 to implement these HFAassistance programs, including several to which Treasury is a party. Pursuant to the TCLF program, Treasuryhas purchased participation interests in temporary credit and liquidity facilities provided by us and FreddieMac to the HFAs, which facilities create a credit and liquidity backstop for the HFAs. Pursuant to the NIBprogram, Treasury has purchased new securities issued by us and Freddie Mac backed by new housing bondsissued by the HFAs. Freddie Mac is also providing assistance to the HFAs through a multifamily creditenhancement program. We did not participate in this program.
The total amount originally established by Treasury for the TCLF program and the NIB program was$23.4 billion: an aggregate of $8.2 billion for the TCLF program (of which $7.7 billion consisted of principaland approximately $500 million consisted of accrued interest) and an aggregate of $15.2 billion for the NIBprogram (of which $12.4 billion related to single-family bonds and $2.8 billion related to multifamily bonds).The amounts outstanding under these programs have been reduced since the programs were established andwill continue to be reduced over time as principal payments are received on the mortgage loans financed bythe NIB program and as liquidity facilities under the TCLF program are replaced by the HFAs. As ofDecember 31, 2010, the total outstanding principal balance under the TCLF program was $6.9 billion and thetotal unpaid principal amount outstanding under the NIB program was $15.2 billion.
We and Freddie Mac administer these programs on a coordinated basis. We provide temporary credit andliquidity facility support and issued securities backed by HFA bonds on a 50-50 pro rata basis with FreddieMac under these programs. Treasury will bear the initial losses of principal under the TCLF program and theNIB program up to 35% of total principal on a combined program-wide basis, and thereafter we and FreddieMac each will bear the losses of principal that are attributable to our own portion of the temporary credit andliquidity facilities and the securities that we have issued. Treasury will bear all losses of unpaid interest underthe two programs. Accordingly, as of December 31, 2010, Fannie Mae’s maximum potential risk of loss underthese programs, assuming a 100% loss of principal, was approximately $7.2 billion.
FHFA, as conservator, approved the senior preferred stock purchase agreement and the amendments to theagreement, our role as program administrator for HAMP and other initiatives under the Making HomeAffordable Program, and the HFA transactions described above.
238

Transactions with PHH Corporation
Terence W. Edwards has been Executive Vice President—Credit Portfolio Management of Fannie Mae sinceSeptember 14, 2009, when he joined Fannie Mae. Prior to joining Fannie Mae, Mr. Edwards served as thePresident and Chief Executive Officer, as well as a member of the Board of Directors, of PHH Corporation,until June 17, 2009. Mr. Edwards continued to be employed by PHH Corporation until September 11, 2009.
PHH Mortgage Corporation (“PHH”), a subsidiary of PHH Corporation, is a single-family seller-servicercustomer of Fannie Mae. We regularly enter into transactions with PHH in the ordinary course of this businessrelationship. In 2010, PHH delivered approximately $15 billion in mortgage loans to us, which included thedelivery of loans for direct payment and the delivery of pools of mortgage loans in exchange for Fannie MaeMBS. We acquired most of these mortgage loans pursuant to our early funding programs. This representedapproximately 2.5% of our single-family business volume in 2010 and made PHH our eighth-largest single-family customer. In addition, as of December 31, 2010, PHH serviced approximately $66 billion of single-family mortgage loans either owned directly by Fannie Mae or backing Fannie Mae MBS, which representedapproximately 2.4% of our single-family servicing book, making PHH our seventh-largest servicer. PHH alsoentered into transactions with us to purchase or sell approximately $16 billion in Fannie Mae, Freddie Macand Ginnie Mae mortgage-related securities in 2010. As a single-family seller-servicer customer, PHH alsopays us fees for its use of certain Fannie Mae technology, enters into risk-sharing arrangements with us, andprovides us with collateral to secure some of its obligations. PHH renewed its delivery commitment to us inNovember 2010 for a 17-month term.
In December 2010, we entered into a committed purchase facility with PHH, pursuant to which PHH mayhave, at any given time during the term of the facility, up to $1.0 billion in outstanding early fundingtransactions with us. This agreement is in addition to our existing uncommitted transaction limits with PHHunder our early funding programs. We have also provided PHH with an early reimbursement facility to fundcertain of PHH’s servicing advances. The maximum amount outstanding under this early reimbursementfacility during 2010 was approximately $68 million. PHH is also a participating lender in our HomePath»Mortgage financing initiative relating to our REO properties.
We believe that Fannie Mae is one of PHH’s largest business partners and that transactions with Fannie Maeare material to PHH’s business. According to PHH Corporation’s quarterly report on Form 10-Q for thequarter ended September 30, 2010, 96% of its mortgage loan sales during the first nine months of 2010 wereto Fannie Mae, Freddie Mac or Ginnie Mae, and its business is highly dependent on programs administered bythe GSEs.
Pursuant to a separation agreement with PHH Corporation, Mr. Edwards is entitled to receive additionalcompensation from PHH Corporation for his prior services to the company. Some of this additionalcompensation is dependent on the performance of PHH Corporation. According to Forms 8-K filed by PHHCorporation on August 5, 2009 and September 16, 2009, Mr. Edwards’ separation agreement with PHHCorporation provided that he would receive the following additional compensation from PHH Corporation:(a) an amount equal to his base salary for a 24-month period beginning on PHH Corporation’s first regular paydate after March 11, 2010; (b) annual cash bonuses for calendar years 2009, 2010 and 2011 in an amountequal to the bonus he would have received based on actual performance of the company (except that the 2011bonus will be prorated to reflect the actual number of months covered by the severance period in 2011), whichbonuses will be paid to Mr. Edwards at the same time bonuses are payable to corporate employees, but nolater than March 15 after the end of the applicable performance year; and (c) a cash transition payment of$50,000 on PHH Corporation’s first regular pay date after March 11, 2010. In addition, the outstandingoptions and restricted stock units that have been previously awarded to him will continue to vest and, on thelast day of the severance period, all remaining unvested options and restricted stock units will become fullyvested, except for the 2009 performance-based restricted stock units which will become vested only to theextent that performance goals have been satisfied.
Our policies and procedures for the review and approval of related party transactions described above under“Policies and Procedures Relating to Transactions with Related Persons” did not require the review, approvalor ratification of the above-described transactions with PHH. Our Nominating and Corporate Governance
239

Committee Charter and our Board’s delegation of authorities did not require the Nominating and CorporateGovernance Committee to review and approve these transactions because Fannie Mae did not engage in anysuch transactions directly with Mr. Edwards. As required under our Conflict of Interest Policy and Conflict ofInterest Procedure for employees, Mr. Edwards reported his ongoing financial interest in PHH Corporation atthe time of his employment and requested review and approval of the conflict. Our Chief Executive Officerreviewed and approved of the conflict, and to address the conflict has required that Mr. Edwards be recusedfrom all matters relating to PHH.
Transactions with Phelan Firms
Kenneth J. Phelan has been Executive Vice President—Chief Risk Officer from April 2009 throughFebruary 2011. Mr. Phelan’s brother, Lawrence T. Phelan, is an equity partner with ownership interests in twolaw firms that perform services for Fannie Mae, as well as a minority owner in a company that performsservices for these law firms on Fannie Mae matters. The services performed by these firms for Fannie Maeinclude loss mitigation, foreclosures, bankruptcies, REO matters, evictions and related services.
Phelan Hallinan and Schmieg. Lawrence Phelan has an approximately 49% ownership interest in PhelanHallinan and Schmieg, LLP (“PHS”), a law firm representing lenders and servicers in Pennsylvania. PHS orits predecessor (Federman and Phelan) has provided legal services to Fannie Mae for over 25 years, and iscurrently part of Fannie Mae’s retained attorney network. In 2010, PHS invoiced approximately $8.5 millionin legal fees relating to work performed for Fannie Mae, which represented a significant portion of the firm’soverall legal fees invoiced in 2010. PHS also invoiced approximately $17.9 million in third-party costs relatingto Fannie Mae matters in 2010. In 2009, PHS invoiced approximately $6.8 million in legal fees relating towork performed for Fannie Mae, which represented a significant portion of the firm’s overall legal feesinvoiced in 2009. PHS also invoiced approximately $15.3 million in third-party costs relating to Fannie Maematters in 2009.
Phelan Hallinan Schmieg and Diamond. Lawrence Phelan also has an approximately 41% ownership interest inPhelan Hallinan Schmieg and Diamond, PC (“PHSD”), a law firm representing lenders and servicers in NewJersey. PHSD has provided legal services to Fannie Mae for over 10 years, and is currently part of Fannie Mae’sretained attorney network. PHSD invoiced approximately $6.8 million in legal fees in 2010 relating to workperformed for Fannie Mae, which represented a significant portion of the firm’s overall legal fees invoiced in2010. PHSD also invoiced approximately $11.2 million in third-party costs relating to Fannie Mae matters in2010. PHSD invoiced approximately $4.7 million in legal fees in 2009 relating to work performed for FannieMae, which represented a significant portion of the firm’s overall legal fees invoiced in 2009. PHSD alsoinvoiced approximately $6.7 million in third-party costs relating to Fannie Mae matters in 2009.
Full Spectrum Holdings. Lawrence Phelan also has an approximately 31% interest in Full SpectrumHoldings LCC, a company that provides support services for PHS, PHSD and other firms. Full SpectrumHoldings performs services such as title searches, investigations and service of process for PHSD and PHS onFannie Mae-related matters. Full Spectrum Holdings billed PHS and PHSD approximately $12.9 million forwork performed on Fannie Mae matters in 2010, which represented a significant portion of their 2010revenues. This amount represents approximately 44% of the third-party costs invoiced by PHS and PHSD in2010 described above. Full Spectrum Holdings billed PHS and PHSD approximately $8.3 million for workperformed on Fannie Mae matters in 2009, which represented a significant portion of their 2009 revenues.This amount represents approximately 38% of the third-party costs invoiced by PHS and PHSD in 2009described above.
Kenneth Phelan has no affiliation with PHS, PHSD or Full Spectrum Holdings and receives no compensationor other financial benefits from these firms. In exercising his duties, Kenneth Phelan is required to recusehimself from any decisions specifically relating to Fannie Mae’s relationship or transactions with PHS, PHSDor Full Spectrum Holdings. In accordance with the requirements of our Nominating and Corporate GovernanceCommittee Charter and our Board’s delegation of authorities, the Nominating and Corporate GovernanceCommittee has approved Fannie Mae’s transactions with these firms.
240

Transactions involving The Integral Group LLC
Mr. Perry, who joined our Board in December 2008, is the Chairman, Chief Executive Officer and controllingshareholder of The Integral Group LLC, referred to as Integral. Over the past nine years, our Multifamily(formerly, Housing and Community Development) business has invested indirectly in certain limitedpartnerships or limited liability companies that are controlled and managed by entities affiliated with Integral,in the capacity of general partner or managing member, as the case may be. These limited partnerships orlimited liability companies are referred to as the Integral Property Partnerships. The Integral PropertyPartnerships own and manage LIHTC properties. We also hold multifamily mortgage loans made to borrowingentities sponsored by Integral. We believe that Mr. Perry has no material direct or indirect interest in thesetransactions. Mr. Perry has informed us that Integral accepted no further equity investments from us relating toIntegral Property Partnerships beginning in December 2008, when he joined our Board. Mr. Perry has alsoinformed us that Integral does not intend to seek debt financing intended specifically to be purchased by us,although, as a secondary market participant, in the ordinary course of our business we may purchasemultifamily mortgage loans made to borrowing entities sponsored by Integral. See “Director Independence—Our Board of Directors” below for further information.
DIRECTOR INDEPENDENCE
Our Board of Directors, with the assistance of the Nominating and Corporate Governance Committee, hasreviewed the independence of all current Board members under the requirements set forth in FHFA’s corporategovernance regulations (which requires the standard of independence adopted by the NYSE) and under thestandards of independence adopted by the Board, as set forth in our Corporate Governance Guidelines andoutlined below. It is the policy of our Board of Directors that a substantial majority of our seated directors willbe independent in accordance with these standards. Our Board is currently structured so that all but one of ourdirectors, our Chief Executive Officer, is independent. Based on its review, the Board has determined that allof our non-employee directors meet the director independence requirements set forth in FHFA’s corporategovernance regulations and in our Corporate Governance Guidelines.
Independence Standards
Under the standards of independence adopted by our Board, which meet and in some respects exceed the definitionof independence required by FHFA’s corporate governance regulations (which requires the standard ofindependence adopted by the NYSE), an “independent director” must be determined to have no materialrelationship with us, either directly or through an organization that has a material relationship with us. Arelationship is “material” if, in the judgment of the Board, it would interfere with the director’s independentjudgment. The Board did not consider the Board’s duties to the conservator, together with the federal government’scontrolling beneficial ownership of Fannie Mae, in determining independence of the Board members.
In addition, under FHFA’s corporate governance regulations, our Audit Committee is required to be incompliance with the NYSE’s listing requirements for audit committees, under which members of a company’saudit committee must meet additional, heightened independence criteria. Our own independence standardsrequire all independent directors to meet these criteria.
To assist it in determining whether a director is independent, our Board has adopted the standards set forthbelow, which are posted on our Web site, www.fanniemae.com, under “Corporate Governance” in the “AboutUs” section of our Web site:
• A director will not be considered independent if, within the preceding five years:
• the director was our employee; or
• an immediate family member of the director was employed by us as an executive officer.
241

• A director will not be considered independent if:
• the director is a current partner or employee of our external auditor, or within the preceding five years,was (but is no longer) a partner or employee of our external auditor and personally worked on our auditwithin that time; or
• an immediate family member of the director is a current partner of our external auditor, or is a currentemployee of our external auditor and personally works on Fannie Mae’s audit, or, within the precedingfive years, was (but is no longer) a partner or employee of our external auditor and personally workedon our audit within that time.
• A director will not be considered independent if, within the preceding five years:
• the director was employed by a company at a time when one of our current executive officers sat onthat company’s compensation committee; or
• an immediate family member of the director was employed as an officer by a company at a time whenone of our current executive officers sat on that company’s compensation committee.
• A director will not be considered independent if, within the preceding five years:
• the director received any compensation from us, directly or indirectly, other than fees for service as adirector; or
• an immediate family member of the director received any compensation from us, directly or indirectly,other than compensation received for service as our employee (other than an executive officer).
• A director will not be considered independent if:
• the director is a current executive officer, employee, controlling stockholder or partner of a company orother entity that does or did business with us and to which we made, or from which we received,payments within the preceding five years that, in any single fiscal year, were in excess of $1 million or2% of the entity’s consolidated gross annual revenues, whichever is greater; or
• an immediate family member of the director is a current executive officer of a company or other entitythat does or did business with us and to which we made, or from which we received, payments withinthe preceding five years that, in any single fiscal year, were in excess of $1 million or 2% of theentity’s consolidated gross annual revenues, whichever is greater.
• A director will not be considered independent if the director or the director’s spouse is an executiveofficer, employee, director or trustee of a nonprofit organization to which we make or have madecontributions within the preceding three years (including contributions made by the Fannie MaeFoundation prior to December 31, 2008) that in any year were in excess of 5% of the organization’sconsolidated gross annual revenues, or $120,000, whichever is less (amounts contributed under ourMatching Gifts Program are not included in the contributions calculated for purposes of this standard).The Nominating and Corporate Governance Committee also will receive periodic reports regardingcharitable contributions to organizations otherwise associated with a director or any spouse of a director.
After considering all the facts and circumstances, our Board may determine in its judgment that a director isindependent (in other words, the director has no relationship with us that would interfere with the director’sindependent judgment), even though the director does not meet the standards listed above, so long as thedetermination of independence is consistent with the NYSE definition of “independence.” Where theguidelines above and the NYSE independence requirements do not address a particular relationship, thedetermination of whether the relationship is material, and whether a director is independent, will be made byour Board, based upon the recommendation of the Nominating and Corporate Governance Committee.
Our Board of Directors
Our Board of Directors, with the assistance of the Nominating and Corporate Governance Committee, hasreviewed the independence of all current Board members under the requirements set forth in FHFA’s corporate
242

governance regulations (which requires the standard of independence adopted by the NYSE) and under thestandards of independence adopted by the Board contained in our Corporate Governance Guidelines, asoutlined above. Based on its review, the Board has affirmatively determined that all of our non-employeedirectors meet the director independence standards of our Guidelines and the NYSE, and that each of thefollowing nine directors is independent: Philip A. Laskawy, Dennis R. Beresford, William Thomas Forrester,Brenda J. Gaines, Charlynn Goins, Frederick B. Harvey III, Egbert L. J. Perry, Jonathan Plutzik and David H.Sidwell.
In determining the independence of each of these Board members, the Board of Directors considered thefollowing relationships in addition to those addressed by the standards contained in our Guidelines as set forthabove:
• Certain of these Board members also serve as directors or advisory Board members of other companiesthat engage in business with Fannie Mae. In each of these cases, the Board members are only directors oradvisory Board members of these other companies. In addition, in most instances, the payments made byor to Fannie Mae pursuant to these relationships during the past five years fell below our Guidelines’thresholds of materiality for a Board member that is a current executive officer, employee, controllingshareholder or partner of a company engaged in business with Fannie Mae. In light of these facts, theBoard of Directors has concluded that these business relationships are not material to the independence ofthese Board members.
• Certain of these Board members also serve as trustees or board members for charitable organizations thathave received donations from Fannie Mae. In each case, the amounts of these charitable donations fellsubstantially below our Guidelines’ thresholds of materiality for a Board member who is a current trusteeor board member of a charitable organization that receives donations from Fannie Mae. In light of thisfact, the Board of Directors has concluded that these relationships with charitable organizations are notmaterial to the independence of these Board members.
• Certain of these Board members serve as directors of other companies that hold Fannie Mae fixed incomesecurities or control entities that direct investments in such securities. It is not possible for Fannie Mae todetermine the extent of the holdings of these companies in Fannie Mae fixed income securities as allpayments to holders are made through the Federal Reserve, and most of these securities are held in turnby financial intermediaries. Each director has confirmed that the transactions by these other companies inFannie Mae fixed income securities are entered into in the ordinary course of business of these companiesand are not entered into at the direction of, or upon approval by, him or her in his or her capacity as adirector of these companies. In light of these facts, the Board of Directors has concluded that thesebusiness relationships are not material to the independence of these Board members.
• Mr. Perry is an executive officer and majority shareholder of The Integral Group LLC, which indirectlydoes business with Fannie Mae. This business includes the following:
• Fannie Mae purchased a 50% participation in a mortgage loan made in 2001 to a limited partnershipborrower sponsored by Integral. This mortgage loan was paid off in 2006.
• Since 2006, Fannie Mae has held six multifamily mortgage loans made to six borrowing entitiessponsored by Integral. In each case, Integral participates in the borrowing entity as a general partner ofthe limited partnership, or as a managing member of the limited liability company, as the case may be,and holds a 0.01% economic interest in such entity. The aggregate unpaid principal balance of theseloans as of December 31, 2010 constituted approximately 5% of Integral’s total debt outstanding. Theborrowing entities have made interest payments on these loans. The total amount of Integral’s pro ratashare of the interest payments made to Fannie Mae on these loans since 2006 is less than $1 million.
• Fannie Mae has invested as a limited partner or member in certain LIHTC funds that in turn haveinvested indirectly as a limited partner or member in various Integral Property Partnerships, which arelower-tier project partnerships or limited liability companies that own LIHTC properties. Integralparticipates indirectly as a member or the general partner of the Integral Property Partnerships (each a“Project General Partner”). The Integral Property Partnerships construct, develop and manage housing
243

projects, a portion of which includes affordable housing units. Each Project General Partner and itsaffiliates earn certain fees each year in connection with those project activities, and such fees are paidfrom income generated by the project (other than certain developer fees paid from developmentsources). Fannie Mae’s indirect investments in the Integral Property Partnerships, through the LIHTCfunds, have not resulted in any direct payments by Fannie Mae to any Project General Partner or itsaffiliates, including Integral. Fannie Mae’s indirect equity investment in the Integral PropertyPartnerships as of December 31, 2010 constituted approximately 3% of the total capitalization andapproximately 10% of the total equity in all of the Integral Property Partnerships.
The aggregate debt service and other required payments made, directly and indirectly, to or on behalf ofFannie Mae pursuant to these relationships with Integral fall below our Guidelines’ thresholds ofmateriality for a Board member who is a current executive officer, employee, controlling shareholder orpartner of a company that engages in business with Fannie Mae. In addition, as a limited partner ormember in the LIHTC funds, which in turn are limited partners in the Integral Property Partnerships,Fannie Mae has no direct dealings with Integral or Mr. Perry and has not been involved in themanagement of the Integral Property Partnerships. Mr. Perry also was not generally aware of the identityof the limited partners or members of the LIHTC funds, as Integral sells the partnership or LLC intereststo syndicators who, in turn, syndicate these interests to limited partners or members of their choosing.Further, Integral has not accepted additional equity investments from Fannie Mae since Mr. Perry joinedthe Board and Mr. Perry has informed Fannie Mae that Integral does not intend to seek debt financingspecifically to be purchased by Fannie Mae. Based on the foregoing, the Board of Directors hasconcluded that these business relationships are not material to Mr. Perry’s independence.
• Mr. Plutzik’s wife, Leslie Goldwasser, is a Managing Director with Credit Suisse. She is not an executiveofficer of Credit Suisse. Fannie Mae has multiple business relationships with Credit Suisse in the ordinarycourse of its business. We believe that payments made by or to Fannie Mae pursuant to its relationshipswith Credit Suisse during the past five years likely fell below our Guidelines’ thresholds of materiality forwhen an immediate family member of a director is a current executive officer, employee, controllingshareholder or partner of a company engaged in business with Fannie Mae. Ms. Goldwasser hasconfirmed that she has no direct or indirect interest or involvement in any transactions between FannieMae and Credit Suisse and that her compensation is not affected directly or indirectly by any suchtransactions. In light of these facts, the Board of Directors has concluded that these business relationshipsare not material to Mr. Plutzik’s independence.
The Board determined that none of these relationships would interfere with the director’s independentjudgment.
Mr. Williams is not considered an independent director under the Guidelines because of his position as ChiefExecutive Officer.
Item 14. Principal Accounting Fees and Services
The Audit Committee of our Board of Directors is directly responsible for the appointment, oversight andevaluation of our independent registered public accounting firm, subject to conservator approval of mattersrelating to retention and termination. In accordance with the Audit Committee’s charter, it must approve, inadvance of the service, all audit and permissible non-audit services to be provided by our independentregistered public accounting firm and establish policies and procedures for the engagement of the externalauditor to provide audit and permissible non-audit services. Our independent registered public accounting firmmay not be retained to perform non-audit services specified in Section 10A(g) of the Exchange Act.
Deloitte & Touche LLP was our independent registered public accounting firm for the years endedDecember 31, 2010 and 2009. Deloitte & Touche LLP has advised the Audit Committee that they areindependent accountants with respect to the company, within the meaning of standards established by thePCAOB and federal securities laws administered by the SEC.
244

The following table sets forth the aggregate estimated or actual fees for professional services provided byDeloitte & Touche LLP in 2010 and 2009, including fees for the 2010 and 2009 audits.
Description of Fees 2010 2009
For the Year EndedDecember 31,
Audit fees(1) . . . . . . . . . . . . . . . . . . . . . . . . . . . . . . . . . . . . . . . . . . . . . . . . . . $37,000,000 $42,600,000
Audit-related fees(2) . . . . . . . . . . . . . . . . . . . . . . . . . . . . . . . . . . . . . . . . . . . . . 2,500,000 2,800,000
Total fees . . . . . . . . . . . . . . . . . . . . . . . . . . . . . . . . . . . . . . . . . . . . . . . . . . . . $39,500,000 $45,400,000
(1) 2009 amounts include costs associated with the audit of our adoption of the new accounting standard on consolidation.(2) Mainly consists of: (1) fees billed for attest-related services on securitization transactions and (2) in 2009,
reimbursement of costs associated with responding to subpoenas relating to Fannie Mae’s securities litigation.
Pre-Approval Policy
The Audit Committee’s policy is to pre-approve all audit and permissible non-audit services to be provided bythe independent registered public accounting firm. The independent registered public accounting firm andmanagement are required to present reports on the nature of the services provided by the independentregistered public accounting firm for the past year and the fees for such services, categorized into auditservices, audit-related services, tax services and other services.
In connection with its approval of Deloitte & Touche as Fannie Mae’s independent registered publicaccounting firm for Fannie Mae’s 2010 integrated audit, the Audit Committee delegated the authority to pre-approve any additional audit and audit-related services to its Chairman, Mr. Beresford, who was required toreport any such pre-approvals at the next scheduled meeting of the Audit Committee. Additionally, anyservices provided by Deloitte & Touche outside of the scope of this engagement must be approved by theConservator.
In 2010, we paid no fees to the independent registered public accounting firm pursuant to the de minimisexception established by the SEC, and all services were pre-approved.
245

PART IV
Item 15. Exhibits, Financial Statement Schedules
(a) Documents filed as part of this report
1. Consolidated Financial Statements
Report of Independent Registered Public Accounting Firm. . . . . . . . . . . . . . . . . . . . . . . . . . . . . . F-2
Financial Statements . . . . . . . . . . . . . . . . . . . . . . . . . . . . . . . . . . . . . . . . . . . . . . . . . . . . . . . . . . F-3
Consolidated Balance Sheets as of December 31, 2010 and 2009 . . . . . . . . . . . . . . . . . . . . . . . . . F-3
Consolidated Statements of Operations for the years ended December 31, 2010, 2009, and 2008. . F-4
Consolidated Statements of Cash Flows for the years ended December 31, 2010, 2009, and2008. . . . . . . . . . . . . . . . . . . . . . . . . . . . . . . . . . . . . . . . . . . . . . . . . . . . . . . . . . . . . . . . . . . . F-5
Consolidated Statements of Changes in Equity (Deficit) for the years ended December 31, 2010,2009, and 2008 . . . . . . . . . . . . . . . . . . . . . . . . . . . . . . . . . . . . . . . . . . . . . . . . . . . . . . . . . . . . F-6
Notes to Consolidated Financial Statements . . . . . . . . . . . . . . . . . . . . . . . . . . . . . . . . . . . . . . . . . F-8
Note 1— Summary of Significant Accounting Policies . . . . . . . . . . . . . . . . . . . . . . . . . . . . . F-8
Note 2— Adoption of the New Accounting Standards on the Transfers of Financial Assetsand Consolidation of Variable Interest Entities . . . . . . . . . . . . . . . . . . . . . . . . . . . . . . . . . . . F-36
Note 3— Consolidations and Transfers of Financial Assets . . . . . . . . . . . . . . . . . . . . . . . . . . F-45
Note 4— Mortgage Loans . . . . . . . . . . . . . . . . . . . . . . . . . . . . . . . . . . . . . . . . . . . . . . . . . . F-50
Note 5— Allowance for Loan Losses and Reserve for Guaranty Losses . . . . . . . . . . . . . . . . . F-55
Note 6— Investments in Securities . . . . . . . . . . . . . . . . . . . . . . . . . . . . . . . . . . . . . . . . . . . . F-60
Note 7— Financial Guarantees and Master Servicing. . . . . . . . . . . . . . . . . . . . . . . . . . . . . . . F-68
Note 8— Acquired Property, Net . . . . . . . . . . . . . . . . . . . . . . . . . . . . . . . . . . . . . . . . . . . . . F-73
Note 9— Short-term Borrowings and Long-term Debt . . . . . . . . . . . . . . . . . . . . . . . . . . . . . . F-74
Note 10— Derivative Instruments and Hedging Activities . . . . . . . . . . . . . . . . . . . . . . . . . . . . F-77
Note 11— Income Taxes . . . . . . . . . . . . . . . . . . . . . . . . . . . . . . . . . . . . . . . . . . . . . . . . . . . . F-83
Note 12— Loss Per Share . . . . . . . . . . . . . . . . . . . . . . . . . . . . . . . . . . . . . . . . . . . . . . . . . . . F-86
Note 13— Stock-Based Compensation . . . . . . . . . . . . . . . . . . . . . . . . . . . . . . . . . . . . . . . . . . F-87
Note 14— Employee Retirement Benefits . . . . . . . . . . . . . . . . . . . . . . . . . . . . . . . . . . . . . . . . F-89
Note 15— Segment Reporting . . . . . . . . . . . . . . . . . . . . . . . . . . . . . . . . . . . . . . . . . . . . . . . . F-96
Note 16— Equity (Deficit) . . . . . . . . . . . . . . . . . . . . . . . . . . . . . . . . . . . . . . . . . . . . . . . . . . . F-103
Note 17— Regulatory Capital Requirements . . . . . . . . . . . . . . . . . . . . . . . . . . . . . . . . . . . . . . F-110
Note 18— Concentrations of Credit Risk . . . . . . . . . . . . . . . . . . . . . . . . . . . . . . . . . . . . . . . . F-112
Note 19— Fair Value . . . . . . . . . . . . . . . . . . . . . . . . . . . . . . . . . . . . . . . . . . . . . . . . . . . . . . . F-117
Note 20— Commitments and Contingencies . . . . . . . . . . . . . . . . . . . . . . . . . . . . . . . . . . . . . . F-134Note 21— Selected Quarterly Financial Information (Unaudited) . . . . . . . . . . . . . . . . . . . . . . . F-138
2. Financial Statement Schedules
None.
3. Exhibits
An index to exhibits has been filed as part of this report beginning on page E-1 and is incorporatedherein by reference.
246

SIGNATURES
Pursuant to the requirements of Section 13 or 15(d) of the Securities Exchange Act of 1934, the registrant hasduly caused this report to be signed on its behalf by the undersigned, thereunto duly authorized.
Federal National Mortgage Association
/s/ Michael J. Williams
Michael J. WilliamsPresident and Chief Executive Officer
Date: February 24, 2011
KNOW ALL PERSONS BY THESE PRESENTS, that each person whose signature appears below constitutesand appoints Michael J. Williams and David C. Hisey, and each of them severally, his or her true and lawfulattorney-in-fact with power of substitution and resubstitution to sign in his or her name, place and stead, inany and all capacities, to do any and all things and execute any and all instruments that such attorney maydeem necessary or advisable under the Securities Exchange Act of 1934 and any rules, regulations andrequirements of the U.S. Securities and Exchange Commission in connection with the Annual Report onForm 10-K and any and all amendments hereto, as fully for all intents and purposes as he or she might orcould do in person, and hereby ratifies and confirms all said attorneys-in-fact and agents, each acting alone,and his or her substitute or substitutes, may lawfully do or cause to be done by virtue hereof.
Pursuant to the requirements of the Securities Exchange Act of 1934, this report has been signed below by thefollowing persons on behalf of the registrant and in the capacities and on the dates indicated.
Signature Title Date
/s/ Philip A. Laskawy
Philip A. Laskawy
Chairman of the Board of Directors February 24, 2011
/s/ Michael J. Williams
Michael J. Williams
President and Chief Executive Officer andDirector
February 24, 2011
/s/ David C. Hisey
David C. Hisey
Executive Vice President and Deputy ChiefFinancial Officer
February 24, 2011
/s/ Dennis R. Beresford
Dennis R. Beresford
Director February 24, 2011
/s/ William Thomas Forrester
William Thomas Forrester
Director February 24, 2011
247

Signature Title Date
/s/ Brenda J. Gaines
Brenda J. Gaines
Director February 24, 2011
/s/ Charlynn Goins
Charlynn Goins
Director February 24, 2011
/s/ Frederick B. Harvey III
Frederick B. Harvey III
Director February 24, 2011
/s/ Egbert L. J. Perry
Egbert L. J. Perry
Director February 24, 2011
/s/ Jonathan Plutzik
Jonathan Plutzik
Director February 24, 2011
/s/ David H. Sidwell
David H. Sidwell
Director February 24, 2011
248

INDEX TO EXHIBITSItem Description
3.1 Fannie Mae Charter Act (12 U.S.C. § 1716 et seq.) as amended through July 30, 2008
3.2 Fannie Mae Bylaws, as amended through January 30, 2009 (Incorporated by reference toExhibit 3.2 to Fannie Mae’s Annual Report on Form 10-K for the year ended December 31, 2008,filed February 26, 2009.)
4.1 Certificate of Designation of Terms of Fannie Mae Preferred Stock, Series D (Incorporated byreference to Exhibit 4.1 to Fannie Mae’s registration statement on Form 10, filed March 31,2003.)
4.2 Certificate of Designation of Terms of Fannie Mae Preferred Stock, Series E (Incorporated byreference to Exhibit 4.2 to Fannie Mae’s registration statement on Form 10, filed March 31,2003.)
4.3 Certificate of Designation of Terms of Fannie Mae Preferred Stock, Series F (Incorporated byreference to Exhibit 4.3 to Fannie Mae’s registration statement on Form 10, filed March 31,2003.)
4.4 Certificate of Designation of Terms of Fannie Mae Preferred Stock, Series G (Incorporated byreference to Exhibit 4.4 to Fannie Mae’s registration statement on Form 10, filed March 31,2003.)
4.5 Certificate of Designation of Terms of Fannie Mae Preferred Stock, Series H (Incorporated byreference to Exhibit 4.5 to Fannie Mae’s registration statement on Form 10, filed March 31,2003.)
4.6 Certificate of Designation of Terms of Fannie Mae Preferred Stock, Series I (Incorporated byreference to Exhibit 4.6 to Fannie Mae’s registration statement on Form 10, filed March 31,2003.)
4.7 Certificate of Designation of Terms of Fannie Mae Preferred Stock, Series L (Incorporated byreference to Exhibit 4.7 to Fannie Mae’s Quarterly Report on Form 10-Q, filed August 8, 2008.)
4.8 Certificate of Designation of Terms of Fannie Mae Preferred Stock, Series M (Incorporated byreference to Exhibit 4.8 to Fannie Mae’s Quarterly Report on Form 10-Q, filed August 8, 2008.)
4.9 Certificate of Designation of Terms of Fannie Mae Preferred Stock, Series N (Incorporated byreference to Exhibit 4.9 to Fannie Mae’s Quarterly Report on Form 10-Q, filed August 8, 2008.)
4.10 Certificate of Designation of Terms of Fannie Mae Non-Cumulative Convertible Preferred Stock,Series 2004-1(Incorporated by reference to Exhibit 4.10 to Fannie Mae’s Annual Report onForm 10-K for the year ended December 31, 2009, filed February 26, 2010.)
4.11 Certificate of Designation of Terms of Fannie Mae Preferred Stock, Series O (Incorporated byreference to Exhibit 4.11 to Fannie Mae’s Annual Report on Form 10-K for the year endedDecember 31, 2009, filed February 26, 2010.)
4.12 Certificate of Designation of Terms of Fannie Mae Preferred Stock, Series P (Incorporated byreference to Exhibit 4.1 to Fannie Mae’s Current Report on Form 8-K, filed September 28, 2007.)
4.13 Certificate of Designation of Terms of Fannie Mae Preferred Stock, Series Q (Incorporated byreference to Exhibit 4.1 to Fannie Mae’s Current Report on Form 8-K, filed October 5, 2007.)
4.14 Certificate of Designation of Terms of Fannie Mae Preferred Stock, Series R (Incorporated byreference to Exhibit 4.1 to Fannie Mae’s Current Report on Form 8-K, filed November 21, 2007.)
4.15 Certificate of Designation of Terms of Fannie Mae Preferred Stock, Series S (Incorporated byreference to Exhibit 4.1 to Fannie Mae’s Current Report on Form 8-K, filed December 11, 2007.)
4.16 Certificate of Designation of Terms of Fannie Mae Non-Cumulative Mandatory ConvertiblePreferred Stock, Series 2008-1 (Incorporated by reference to Exhibit 4.1 to Fannie Mae’s CurrentReport on Form 8-K, filed May 14, 2008.)
4.17 Certificate of Designation of Terms of Fannie Mae Preferred Stock, Series T (Incorporated byreference to Exhibit 4.1 to Fannie Mae’s Current Report on Form 8-K, filed May 19, 2008.)
4.18 Certificate of Designation of Terms of Variable Liquidation Preference Senior Preferred Stock,Series 2008-2 (Incorporated by reference to Exhibit 4.2 to Fannie Mae’s Current Report onForm 8-K, filed September 11, 2008.)
E-1

Item Description
4.19 Warrant to Purchase Common Stock, dated September 7, 2008 conservator (Incorporated byreference to Exhibit 4.3 to Fannie Mae’s Current Report on Form 8-K, filed September 11, 2008.)
4.20 Amended and Restated Senior Preferred Stock Purchase Agreement, dated as of September 26,2008, between the United States Department of the Treasury and Federal National MortgageAssociation, acting through the Federal Housing Finance Agency as its duly appointed conservator(Incorporated by reference to Exhibit 4.1 to Fannie Mae’s Current Report on Form 8-K, filedOctober 2, 2008.)
4.21 Amendment to Amended and Restated Senior Preferred Stock Purchase Agreement, dated as ofMay 6, 2009, between the United States Department of the Treasury and Federal NationalMortgage Association, acting through the Federal Housing Finance Agency as its duly appointedconservator (Incorporated by reference to Exhibit 4.21 to Fannie Mae’s Quarterly Report onForm 10-Q, filed May 8, 2009.)
4.22 Second Amendment to Amended and Restated Senior Preferred Stock Purchase Agreement, datedas of December 24, 2009, between the United States Department of the Treasury and FederalNational Mortgage Association, acting through the Federal Housing Finance Agency as its dulyappointed conservator (Incorporated by reference to Exhibit 4.1 to Fannie Mae’s Current Reporton Form 8-K, filed December 30, 2009.)
10.1 Fannie Mae’s Elective Deferred Compensation Plan, as amended effective November 15, 2004†(Incorporated by reference to Exhibit 10.21 to Fannie Mae’s Annual Report on Form 10-K for theyear ended December 31, 2007, filed February 27, 2008.)
10.2 Amendment to Fannie Mae Elective Deferred Compensation Plan I, effective October 27, 2008†(Incorporated by reference to Exhibit 10.7 to Fannie Mae’s Annual Report on Form 10-K for theyear ended December 31, 2008, filed February 26, 2009.)
10.3 Fannie Mae Elective Deferred Compensation Plan II† (Incorporated by reference to Exhibit 10.7to Fannie Mae’s Annual Report on Form 10-K for the year ended December 31, 2007, filedFebruary 27, 2008.)
10.4 Amendment to Fannie Mae Elective Deferred Compensation Plan II, effective April 29, 2008†(Incorporated by reference to Exhibit 10.1 to Fannie Mae’s Quarterly Report on Form 10-Q, filedAugust 8, 2008.)
10.5 Amendment to Fannie Mae Elective Deferred Compensation Plan II, effective October 27, 2008†(Incorporated by reference to Exhibit 10.10 to Fannie Mae’s Annual Report on Form 10-K for theyear ended December 31, 2008, filed February 26, 2009.)
10.6 Compensation Repayment Provisions† (Incorporated by reference to Exhibit 99.1 to Fannie Mae’sCurrent Report on Form 8-K, filed December 24, 2009.)
10.7 Long-Term Incentive Plan, effective December 16, 2009† (Incorporated by reference toExhibit 10.9 to Fannie Mae’s Annual Report on Form 10-K for the year ended December 31,2009, filed February 26, 2010.)
10.8 Deferred Pay Plan, effective December 16, 2009† (Incorporated by reference to Exhibit 10.10 toFannie Mae’s Annual Report on Form 10-K for the year ended December 31, 2009, filedFebruary 26, 2010.)
10.9 Fannie Mae Form of Indemnification Agreement for directors and officers of Fannie Mae(Incorporated by reference to Exhibit 10.15 to Fannie Mae’s Annual Report on Form 10-K for theyear ended December 31, 2008, filed February 26, 2009.)
10.10 Federal National Mortgage Association Supplemental Pension Plan, as amended November 20,2007† (Incorporated by reference to Exhibit 10.10 to Fannie Mae’s Annual Report on Form 10-Kfor the year ended December 31, 2007, filed February 27, 2008.)
10.11 Amendment to Fannie Mae Supplemental Pension Plan for Internal Revenue Code Section 409A,effective January 1, 2009† (Incorporated by reference to Exhibit 10.11 to Fannie Mae’s AnnualReport on Form 10-K for the year ended December 31, 2007, filed February 27, 2008.)
10.12 Amendment to Fannie Mae Supplemental Pension Plan, executed December 22, 2008†(Incorporated by reference to Exhibit 10.18 to Fannie Mae’s Annual Report on Form 10-K for theyear ended December 31, 2008, filed February 26, 2009.)
E-2

Item Description
10.13 Fannie Mae Supplemental Pension Plan of 2003, as amended November 20, 2007† (Incorporatedby reference to Exhibit 10.12 to Fannie Mae’s Annual Report on Form 10-K for the year endedDecember 31, 2007, filed February 27, 2008.)
10.14 Amendment to Fannie Mae Supplemental Pension Plan of 2003 for Internal Revenue CodeSection 409A, effective January 1, 2009† (Incorporated by reference to Exhibit 10.13 to FannieMae’s Annual Report on Form 10-K for the year ended December 31, 2007, filed February 27,2008.)
10.15 Amendment to Fannie Mae Supplemental Pension Plan of 2003 for Internal Revenue CodeSection 409A, adopted December 22, 2008† (Incorporated by reference to Exhibit 10.21 to FannieMae’s Annual Report on Form 10-K for the year ended December 31, 2008, filed February 26,2009.)
10.16 Amendment to Fannie Mae Supplement Pension Plan of 2003, effective May 14, 2010†(Incorporated by reference to Exhibit 10.1 to Fannie Mae’s Quarterly Report on Form 10-Q, filedAugust 5, 2010.)
10.17 Executive Pension Plan of the Federal National Mortgage Association as amended and restated†(Incorporated by reference to Exhibit 10.10 to Fannie Mae’s registration statement on Form 10,filed March 31, 2003)
10.18 Amendment to the Executive Pension Plan of the Federal National Mortgage Association, asamended and restated, effective March 1, 2007† (Incorporated by reference to Exhibit 10.20 toFannie Mae’s Annual Report on Form 10-K for the year ended December 31, 2005, filed May 2,2007.)
10.19 Amendment to Fannie Mae Executive Pension Plan, effective November 20, 2007† (Incorporatedby reference to Exhibit 10.16 to Fannie Mae’s Annual Report on Form 10-K for the year endedDecember 31, 2007, filed February 27, 2008.)
10.20 Amendment to the Executive Pension Plan of the Federal National Mortgage Association,effective January 1, 2008† (Incorporated by reference to Exhibit 10.25 to Fannie Mae’s AnnualReport on Form 10-K for the year ended December 31, 2008, filed February 26, 2009.)
10.21 Amendment to the Executive Pension Plan of the Federal National Mortgage Association,effective December 16, 2009† (Incorporated by reference to Exhibit 10.23 to Fannie Mae’sAnnual Report on Form 10-K for the year ended December 31, 2009, filed February 26, 2010.)
10.22 Amendment to the Executive Pension Plan of the Federal National Mortgage Association,effective January 1, 2010†
10.23 Fannie Mae Annual Incentive Plan, as amended December 10, 2007† (Incorporated by referenceto Exhibit 10.17 to Fannie Mae’s Annual Report on Form 10-K for the year ended December 31,2007, filed February 27, 2008.)
10.24 Fannie Mae Stock Compensation Plan of 2003, as amended through December 14, 2007†(Incorporated by reference to Exhibit 10.18 to Fannie Mae’s Annual Report on Form 10-K for theyear ended December 31, 2007, filed February 27, 2008.)
10.25 Amendment to Fannie Mae Stock Compensation Plan of 2003, as amended, for Internal RevenueCode Section 409A, adopted December 22, 2008† (Incorporated by reference to Exhibit 10.28 toFannie Mae’s Annual Report on Form 10-K for the year ended December 31, 2008, filedFebruary 26, 2009.)
10.26 Fannie Mae Stock Compensation Plan of 1993† (Incorporated by reference to Exhibit 10.18 toFannie Mae’s Annual Report on Form 10-K for the year ended December 31, 2004, filedDecember 6, 2006.)
10.27 2009 Amendment to Fannie Mae Stock Compensation Plans of 1993 and 2003† (Incorporated byreference to Exhibit 10.1 to Fannie Mae’s Quarterly Report on Form 10-Q, filed November 5,2009.)
10.28 Fannie Mae Procedures for Deferral and Diversification of Awards, as amended effectiveDecember 10, 2007† (Incorporated by reference to Exhibit 10.30 to Fannie Mae’s Annual Reporton Form 10-K for the year ended December 31, 2008, filed February 26, 2009.)
E-3
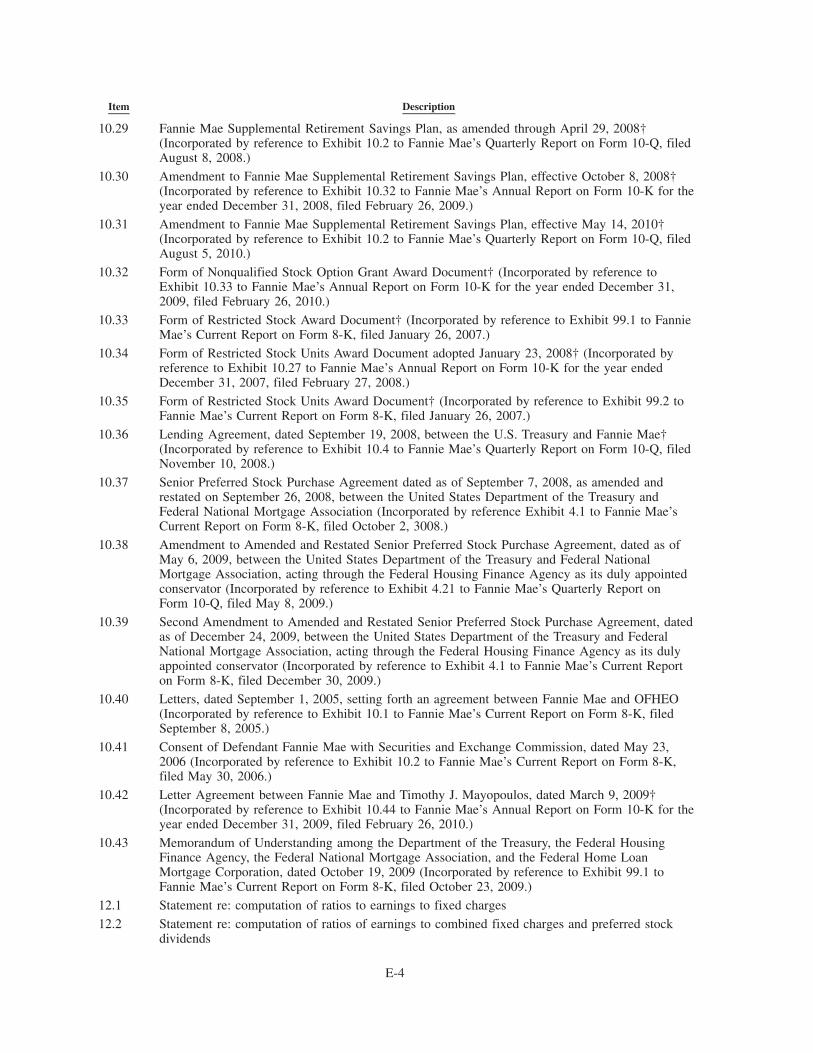
Item Description
10.29 Fannie Mae Supplemental Retirement Savings Plan, as amended through April 29, 2008†(Incorporated by reference to Exhibit 10.2 to Fannie Mae’s Quarterly Report on Form 10-Q, filedAugust 8, 2008.)
10.30 Amendment to Fannie Mae Supplemental Retirement Savings Plan, effective October 8, 2008†(Incorporated by reference to Exhibit 10.32 to Fannie Mae’s Annual Report on Form 10-K for theyear ended December 31, 2008, filed February 26, 2009.)
10.31 Amendment to Fannie Mae Supplemental Retirement Savings Plan, effective May 14, 2010†(Incorporated by reference to Exhibit 10.2 to Fannie Mae’s Quarterly Report on Form 10-Q, filedAugust 5, 2010.)
10.32 Form of Nonqualified Stock Option Grant Award Document† (Incorporated by reference toExhibit 10.33 to Fannie Mae’s Annual Report on Form 10-K for the year ended December 31,2009, filed February 26, 2010.)
10.33 Form of Restricted Stock Award Document† (Incorporated by reference to Exhibit 99.1 to FannieMae’s Current Report on Form 8-K, filed January 26, 2007.)
10.34 Form of Restricted Stock Units Award Document adopted January 23, 2008† (Incorporated byreference to Exhibit 10.27 to Fannie Mae’s Annual Report on Form 10-K for the year endedDecember 31, 2007, filed February 27, 2008.)
10.35 Form of Restricted Stock Units Award Document† (Incorporated by reference to Exhibit 99.2 toFannie Mae’s Current Report on Form 8-K, filed January 26, 2007.)
10.36 Lending Agreement, dated September 19, 2008, between the U.S. Treasury and Fannie Mae†(Incorporated by reference to Exhibit 10.4 to Fannie Mae’s Quarterly Report on Form 10-Q, filedNovember 10, 2008.)
10.37 Senior Preferred Stock Purchase Agreement dated as of September 7, 2008, as amended andrestated on September 26, 2008, between the United States Department of the Treasury andFederal National Mortgage Association (Incorporated by reference Exhibit 4.1 to Fannie Mae’sCurrent Report on Form 8-K, filed October 2, 3008.)
10.38 Amendment to Amended and Restated Senior Preferred Stock Purchase Agreement, dated as ofMay 6, 2009, between the United States Department of the Treasury and Federal NationalMortgage Association, acting through the Federal Housing Finance Agency as its duly appointedconservator (Incorporated by reference to Exhibit 4.21 to Fannie Mae’s Quarterly Report onForm 10-Q, filed May 8, 2009.)
10.39 Second Amendment to Amended and Restated Senior Preferred Stock Purchase Agreement, datedas of December 24, 2009, between the United States Department of the Treasury and FederalNational Mortgage Association, acting through the Federal Housing Finance Agency as its dulyappointed conservator (Incorporated by reference to Exhibit 4.1 to Fannie Mae’s Current Reporton Form 8-K, filed December 30, 2009.)
10.40 Letters, dated September 1, 2005, setting forth an agreement between Fannie Mae and OFHEO(Incorporated by reference to Exhibit 10.1 to Fannie Mae’s Current Report on Form 8-K, filedSeptember 8, 2005.)
10.41 Consent of Defendant Fannie Mae with Securities and Exchange Commission, dated May 23,2006 (Incorporated by reference to Exhibit 10.2 to Fannie Mae’s Current Report on Form 8-K,filed May 30, 2006.)
10.42 Letter Agreement between Fannie Mae and Timothy J. Mayopoulos, dated March 9, 2009†(Incorporated by reference to Exhibit 10.44 to Fannie Mae’s Annual Report on Form 10-K for theyear ended December 31, 2009, filed February 26, 2010.)
10.43 Memorandum of Understanding among the Department of the Treasury, the Federal HousingFinance Agency, the Federal National Mortgage Association, and the Federal Home LoanMortgage Corporation, dated October 19, 2009 (Incorporated by reference to Exhibit 99.1 toFannie Mae’s Current Report on Form 8-K, filed October 23, 2009.)
12.1 Statement re: computation of ratios to earnings to fixed charges
12.2 Statement re: computation of ratios of earnings to combined fixed charges and preferred stockdividends
E-4

Item Description
31.1 Certification of Deputy Chief Executive Officer pursuant to Securities Exchange ActRule 13a-14(a)
31.2 Certification of Chief Financial Officer pursuant to Securities Exchange Act Rule 13a-14(a)
32.1 Certification of Deputy Chief Executive Officer pursuant to 18 U.S.C. Section 1350
32.2 Certification of Chief Financial Officer pursuant to 18 U.S.C. Section 1350
101. INS XBRL Instance Document*
101. SCH XBRL Taxonomy Extension Schema*
101. CAL XBRL Taxonomy Extension Calculation*
101. LAB XBRL Taxonomy Extension Labels*
101. PRE XBRL Taxonomy Extension Presentation*
101. DEF XBRL Taxonomy Extension Definition*
* The financial information contained in these XBRL documents is unaudited. The information in theseexhibits shall not be deemed “filed” for purposes of Section 18 of the Securities Exchange Act of 1934, orotherwise subject to the liabilities of Section 18, nor shall they be deemed incorporated by reference intoany disclosure document relating to Fannie Mae, except to the extent, if any, expressly set forth byspecific reference in such filing.
† This Exhibit is a management contract or compensatory plan or arrangement.
E-5

INDEX TO CONSOLIDATED FINANCIAL STATEMENTS
Report of Independent Registered Public Accounting Firm . . . . . . . . . . . . . . . . . . . . . . . . . . . . . . . . . F-2
Financial Statements . . . . . . . . . . . . . . . . . . . . . . . . . . . . . . . . . . . . . . . . . . . . . . . . . . . . . . . . . . . . . F-3
Consolidated Balance Sheets as of December 31, 2010 and 2009 . . . . . . . . . . . . . . . . . . . . . . . . . . . . F-3
Consolidated Statements of Operations for the years ended December 31, 2010, 2009, and 2008 . . . . . F-4
Consolidated Statements of Cash Flows for the years ended December 31, 2010, 2009, and 2008 . . . . . F-5
Consolidated Statements of Changes in Equity (Deficit) for the years ended December 31, 2010, 2009,and 2008 . . . . . . . . . . . . . . . . . . . . . . . . . . . . . . . . . . . . . . . . . . . . . . . . . . . . . . . . . . . . . . . . . . . . F-6
Notes to Consolidated Financial Statements . . . . . . . . . . . . . . . . . . . . . . . . . . . . . . . . . . . . . . . . . . . . F-8
Note 1— Summary of Significant Accounting Policies . . . . . . . . . . . . . . . . . . . . . . . . . . . . . . . . . F-8
Note 2— Adoption of the New Accounting Standards on the Transfers of Financial Assets andConsolidation of Variable Interest Entities . . . . . . . . . . . . . . . . . . . . . . . . . . . . . . . . . . . . . . . . . . F-36
Note 3— Consolidations and Transfers of Financial Assets . . . . . . . . . . . . . . . . . . . . . . . . . . . . . . F-45
Note 4— Mortgage Loans . . . . . . . . . . . . . . . . . . . . . . . . . . . . . . . . . . . . . . . . . . . . . . . . . . . . . . F-50
Note 5— Allowance for Loan Losses and Reserve for Guaranty Losses. . . . . . . . . . . . . . . . . . . . . F-55
Note 6— Investments in Securities . . . . . . . . . . . . . . . . . . . . . . . . . . . . . . . . . . . . . . . . . . . . . . . . F-60
Note 7— Financial Guarantees and Master Servicing . . . . . . . . . . . . . . . . . . . . . . . . . . . . . . . . . . F-68
Note 8— Acquired Property, Net . . . . . . . . . . . . . . . . . . . . . . . . . . . . . . . . . . . . . . . . . . . . . . . . . F-73
Note 9— Short-term Borrowings and Long-term Debt . . . . . . . . . . . . . . . . . . . . . . . . . . . . . . . . . F-74Note 10— Derivative Instruments and Hedging Activities . . . . . . . . . . . . . . . . . . . . . . . . . . . . . . . . F-77
Note 11— Income Taxes . . . . . . . . . . . . . . . . . . . . . . . . . . . . . . . . . . . . . . . . . . . . . . . . . . . . . . . . F-83
Note 12— Loss Per Share . . . . . . . . . . . . . . . . . . . . . . . . . . . . . . . . . . . . . . . . . . . . . . . . . . . . . . . F-86
Note 13— Stock-Based Compensation . . . . . . . . . . . . . . . . . . . . . . . . . . . . . . . . . . . . . . . . . . . . . . F-87
Note 14— Employee Retirement Benefits . . . . . . . . . . . . . . . . . . . . . . . . . . . . . . . . . . . . . . . . . . . F-89
Note 15— Segment Reporting . . . . . . . . . . . . . . . . . . . . . . . . . . . . . . . . . . . . . . . . . . . . . . . . . . . . F-96
Note 16— Equity (Deficit) . . . . . . . . . . . . . . . . . . . . . . . . . . . . . . . . . . . . . . . . . . . . . . . . . . . . . . F-103
Note 17— Regulatory Capital Requirements . . . . . . . . . . . . . . . . . . . . . . . . . . . . . . . . . . . . . . . . . . F-110
Note 18— Concentrations of Credit Risk . . . . . . . . . . . . . . . . . . . . . . . . . . . . . . . . . . . . . . . . . . . . F-112
Note 19— Fair Value. . . . . . . . . . . . . . . . . . . . . . . . . . . . . . . . . . . . . . . . . . . . . . . . . . . . . . . . . . . F-117
Note 20— Commitments and Contingencies . . . . . . . . . . . . . . . . . . . . . . . . . . . . . . . . . . . . . . . . . . F-134
Note 21— Selected Quarterly Financial Information (Unaudited) . . . . . . . . . . . . . . . . . . . . . . . . . . F-138
F-1
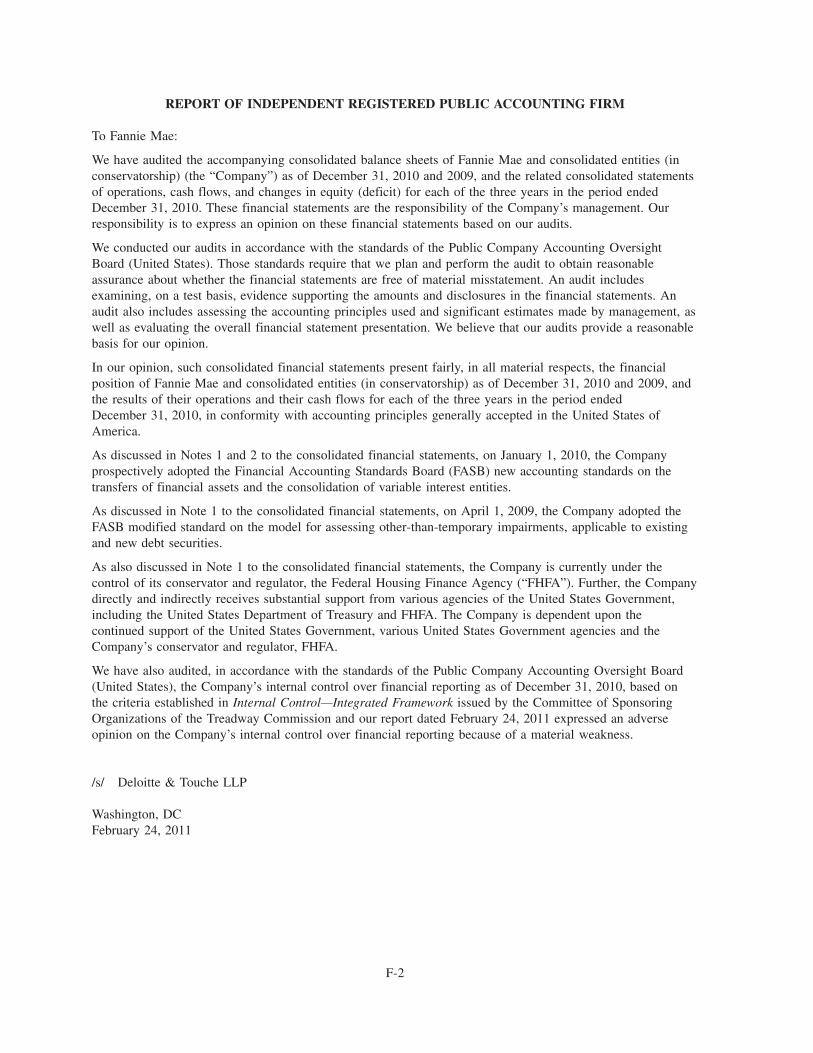
REPORT OF INDEPENDENT REGISTERED PUBLIC ACCOUNTING FIRM
To Fannie Mae:
We have audited the accompanying consolidated balance sheets of Fannie Mae and consolidated entities (inconservatorship) (the “Company”) as of December 31, 2010 and 2009, and the related consolidated statementsof operations, cash flows, and changes in equity (deficit) for each of the three years in the period endedDecember 31, 2010. These financial statements are the responsibility of the Company’s management. Ourresponsibility is to express an opinion on these financial statements based on our audits.
We conducted our audits in accordance with the standards of the Public Company Accounting OversightBoard (United States). Those standards require that we plan and perform the audit to obtain reasonableassurance about whether the financial statements are free of material misstatement. An audit includesexamining, on a test basis, evidence supporting the amounts and disclosures in the financial statements. Anaudit also includes assessing the accounting principles used and significant estimates made by management, aswell as evaluating the overall financial statement presentation. We believe that our audits provide a reasonablebasis for our opinion.
In our opinion, such consolidated financial statements present fairly, in all material respects, the financialposition of Fannie Mae and consolidated entities (in conservatorship) as of December 31, 2010 and 2009, andthe results of their operations and their cash flows for each of the three years in the period endedDecember 31, 2010, in conformity with accounting principles generally accepted in the United States ofAmerica.
As discussed in Notes 1 and 2 to the consolidated financial statements, on January 1, 2010, the Companyprospectively adopted the Financial Accounting Standards Board (FASB) new accounting standards on thetransfers of financial assets and the consolidation of variable interest entities.
As discussed in Note 1 to the consolidated financial statements, on April 1, 2009, the Company adopted theFASB modified standard on the model for assessing other-than-temporary impairments, applicable to existingand new debt securities.
As also discussed in Note 1 to the consolidated financial statements, the Company is currently under thecontrol of its conservator and regulator, the Federal Housing Finance Agency (“FHFA”). Further, the Companydirectly and indirectly receives substantial support from various agencies of the United States Government,including the United States Department of Treasury and FHFA. The Company is dependent upon thecontinued support of the United States Government, various United States Government agencies and theCompany’s conservator and regulator, FHFA.
We have also audited, in accordance with the standards of the Public Company Accounting Oversight Board(United States), the Company’s internal control over financial reporting as of December 31, 2010, based onthe criteria established in Internal Control—Integrated Framework issued by the Committee of SponsoringOrganizations of the Treadway Commission and our report dated February 24, 2011 expressed an adverseopinion on the Company’s internal control over financial reporting because of a material weakness.
/s/ Deloitte & Touche LLP
Washington, DCFebruary 24, 2011
F-2

FANNIE MAE(In conservatorship)
Consolidated Balance Sheets(Dollars in millions, except share amounts)
2010 2009As of December 31,
ASSETSCash and cash equivalents (includes cash of consolidated trusts of $348 and $2,092, respectively) . . . . . . . . . . $ 17,297 $ 6,812Restricted cash (includes restricted cash of consolidated trusts of $59,619 and $-, respectively) . . . . . . . . . . . . 63,678 3,070Federal funds sold and securities purchased under agreements to resell or similar arrangements . . . . . . . . . . . . 11,751 53,684Investments in securities:
Trading, at fair value (includes securities of consolidated trusts of $21 and $5,599, respectively) . . . . . . . . . 56,856 111,939Available-for-sale, at fair value (includes securities of consolidated trusts of $1,055 and $10,513, respectively, and
securities pledged as collateral that may be sold or repledged of $- and $1,148, respectively) . . . . . . . . . . . . 94,392 237,728Total investments in securities . . . . . . . . . . . . . . . . . . . . . . . . . . . . . . . . . . . . . . . . . . . . . . . . . 151,248 349,667
Mortgage loans:Loans held for sale, at lower of cost or fair value . . . . . . . . . . . . . . . . . . . . . . . . . . . . . . . . . . . . . . . . 915 18,462Loans held for investment, at amortized cost:
Of Fannie Mae . . . . . . . . . . . . . . . . . . . . . . . . . . . . . . . . . . . . . . . . . . . . . . . . . . . . . . . . . . . . . 407,228 256,434Of consolidated trusts (includes loans at fair value of $2,962 and $-, respectively, and loans pledged as
collateral that may be sold or repledged of $2,522 and $1,947, respectively) . . . . . . . . . . . . . . . . . . . 2,577,133 129,590Total loans held for investment . . . . . . . . . . . . . . . . . . . . . . . . . . . . . . . . . . . . . . . . . . . . . . . . . . 2,984,361 386,024Allowance for loan losses . . . . . . . . . . . . . . . . . . . . . . . . . . . . . . . . . . . . . . . . . . . . . . . . . . . . . . (61,556) (9,925)
Total loans held for investment, net of allowance . . . . . . . . . . . . . . . . . . . . . . . . . . . . . . . . . . . . . 2,922,805 376,099Total mortgage loans . . . . . . . . . . . . . . . . . . . . . . . . . . . . . . . . . . . . . . . . . . . . . . . . . . . . . . 2,923,720 394,561
Accrued interest receivable:Of Fannie Mae . . . . . . . . . . . . . . . . . . . . . . . . . . . . . . . . . . . . . . . . . . . . . . . . . . . . . . . . . . . . . . 5,344 3,774Of consolidated trusts . . . . . . . . . . . . . . . . . . . . . . . . . . . . . . . . . . . . . . . . . . . . . . . . . . . . . . . . . . 9,349 519
Allowance for accrued interest receivable . . . . . . . . . . . . . . . . . . . . . . . . . . . . . . . . . . . . . . . . . . . . (3,414) (536)Total accrued interest receivable, net of allowance . . . . . . . . . . . . . . . . . . . . . . . . . . . . . . . . . . . . 11,279 3,757
Acquired property, net . . . . . . . . . . . . . . . . . . . . . . . . . . . . . . . . . . . . . . . . . . . . . . . . . . . . . . . . . . . 16,173 9,142Servicer and MBS trust receivable. . . . . . . . . . . . . . . . . . . . . . . . . . . . . . . . . . . . . . . . . . . . . . . . . . . . 951 18,329Other assets . . . . . . . . . . . . . . . . . . . . . . . . . . . . . . . . . . . . . . . . . . . . . . . . . . . . . . . . . . . . . . . . . . 25,875 30,119
Total assets . . . . . . . . . . . . . . . . . . . . . . . . . . . . . . . . . . . . . . . . . . . . . . . . . . . . . . . . . . . . . . . . . $3,221,972 $869,141
LIABILITIES AND EQUITY (DEFICIT)Liabilities:
Accrued interest payable:Of Fannie Mae . . . . . . . . . . . . . . . . . . . . . . . . . . . . . . . . . . . . . . . . . . . . . . . . . . . . . . . . . . . . . $ 4,052 $ 4,951Of consolidated trusts. . . . . . . . . . . . . . . . . . . . . . . . . . . . . . . . . . . . . . . . . . . . . . . . . . . . . . . . . 9,712 29
Federal funds purchased and securities sold under agreements to repurchase . . . . . . . . . . . . . . . . . . . . . . . 52 —Short-term debt:
Of Fannie Mae . . . . . . . . . . . . . . . . . . . . . . . . . . . . . . . . . . . . . . . . . . . . . . . . . . . . . . . . . . . . . 151,884 200,437Of consolidated trusts. . . . . . . . . . . . . . . . . . . . . . . . . . . . . . . . . . . . . . . . . . . . . . . . . . . . . . . . . 5,359 —
Long-term debt:Of Fannie Mae (includes debt at fair value of $893 and $3,274, respectively) . . . . . . . . . . . . . . . . . . . . 628,160 567,950Of consolidated trusts (includes debt at fair value of $2,271 and $-, respectively) . . . . . . . . . . . . . . . . . . 2,411,597 6,167
Reserve for guaranty losses (includes $54 and $4,772, respectively, related to Fannie Mae MBS included inInvestments in securities) . . . . . . . . . . . . . . . . . . . . . . . . . . . . . . . . . . . . . . . . . . . . . . . . . . . . . . 323 54,430
Servicer and MBS trust payable . . . . . . . . . . . . . . . . . . . . . . . . . . . . . . . . . . . . . . . . . . . . . . . . . . . 2,950 25,872Other liabilities . . . . . . . . . . . . . . . . . . . . . . . . . . . . . . . . . . . . . . . . . . . . . . . . . . . . . . . . . . . . . . 10,400 24,586
Total liabilities . . . . . . . . . . . . . . . . . . . . . . . . . . . . . . . . . . . . . . . . . . . . . . . . . . . . . . . . . . . . . 3,224,489 884,422Commitments and contingencies (Note 20) . . . . . . . . . . . . . . . . . . . . . . . . . . . . . . . . . . . . . . . . . . . . . . — —Fannie Mae stockholders’ equity (deficit):
Senior preferred stock, 1,000,000 shares issued and outstanding . . . . . . . . . . . . . . . . . . . . . . . . . . . . . . . 88,600 60,900Preferred stock, 700,000,000 shares are authorized—576,868,139 and 579,735,457 shares issued and
outstanding, respectively . . . . . . . . . . . . . . . . . . . . . . . . . . . . . . . . . . . . . . . . . . . . . . . . . . . . . . . 20,204 20,348Common stock, no par value, no maximum authorization—1,270,092,708 and 1,265,674,761 shares issued,
respectively; 1,118,504,194 and 1,113,358,051 shares outstanding, respectively . . . . . . . . . . . . . . . . . . . 667 664Additional paid-in capital . . . . . . . . . . . . . . . . . . . . . . . . . . . . . . . . . . . . . . . . . . . . . . . . . . . . . . . . — 2,083Accumulated deficit . . . . . . . . . . . . . . . . . . . . . . . . . . . . . . . . . . . . . . . . . . . . . . . . . . . . . . . . . . . (102,986) (90,237)Accumulated other comprehensive loss . . . . . . . . . . . . . . . . . . . . . . . . . . . . . . . . . . . . . . . . . . . . . . . (1,682) (1,732)Treasury stock, at cost, 151,588,514 and 152,316,710 shares, respectively . . . . . . . . . . . . . . . . . . . . . . . . (7,402) (7,398)Total Fannie Mae stockholders’ deficit . . . . . . . . . . . . . . . . . . . . . . . . . . . . . . . . . . . . . . . . . . . . . . . (2,599) (15,372)
Noncontrolling interest . . . . . . . . . . . . . . . . . . . . . . . . . . . . . . . . . . . . . . . . . . . . . . . . . . . . . . . . . . . 82 91Total deficit . . . . . . . . . . . . . . . . . . . . . . . . . . . . . . . . . . . . . . . . . . . . . . . . . . . . . . . . . . . . . . . . (2,517) (15,281)
Total liabilities and equity (deficit) . . . . . . . . . . . . . . . . . . . . . . . . . . . . . . . . . . . . . . . . . . . . . . . . . . . $3,221,972 $869,141
See Notes to Consolidated Financial Statements
F-3

FANNIE MAE(In conservatorship)
Consolidated Statements of Operations(Dollars and shares in millions, except per share amounts)
2010 2009 2008
For the Year EndedDecember 31,
Interest income:Trading securities . . . . . . . . . . . . . . . . . . . . . . . . . . . . . . . . . . . . . . . . . . . . . . . . . . . . $ 1,251 $ 3,859 $ 5,878Available-for-sale securities . . . . . . . . . . . . . . . . . . . . . . . . . . . . . . . . . . . . . . . . . . . . . 5,290 13,618 13,214Mortgage loans:
Of Fannie Mae . . . . . . . . . . . . . . . . . . . . . . . . . . . . . . . . . . . . . . . . . . . . . . . . . . . . 14,992 15,378 18,547Of consolidated trusts . . . . . . . . . . . . . . . . . . . . . . . . . . . . . . . . . . . . . . . . . . . . . . . . 132,591 6,143 4,145
Other . . . . . . . . . . . . . . . . . . . . . . . . . . . . . . . . . . . . . . . . . . . . . . . . . . . . . . . . . . . . 146 357 1,339
Total interest income . . . . . . . . . . . . . . . . . . . . . . . . . . . . . . . . . . . . . . . . . . . . . . 154,270 39,355 43,123
Interest expense:Short-term debt:
Of Fannie Mae . . . . . . . . . . . . . . . . . . . . . . . . . . . . . . . . . . . . . . . . . . . . . . . . . . . . 619 2,306 7,815Of consolidated trusts . . . . . . . . . . . . . . . . . . . . . . . . . . . . . . . . . . . . . . . . . . . . . . . . 12 — —
Long-term debt:Of Fannie Mae . . . . . . . . . . . . . . . . . . . . . . . . . . . . . . . . . . . . . . . . . . . . . . . . . . . . 18,857 22,195 26,145Of consolidated trusts . . . . . . . . . . . . . . . . . . . . . . . . . . . . . . . . . . . . . . . . . . . . . . . . 118,373 344 381
Total interest expense . . . . . . . . . . . . . . . . . . . . . . . . . . . . . . . . . . . . . . . . . . . . . . 137,861 24,845 34,341
Net interest income . . . . . . . . . . . . . . . . . . . . . . . . . . . . . . . . . . . . . . . . . . . . . . . . . . . . 16,409 14,510 8,782
Provision for loan losses . . . . . . . . . . . . . . . . . . . . . . . . . . . . . . . . . . . . . . . . . . . . . . . . . (24,702) (9,569) (4,022)
Net interest income (loss) after provision for loan losses . . . . . . . . . . . . . . . . . . . . . . . . . . . . (8,293) 4,941 4,760
Guaranty fee income (includes imputed interest of $111, $1,333 and $1,423, respectively) . . . . . 202 7,211 7,621Investment gains (losses), net . . . . . . . . . . . . . . . . . . . . . . . . . . . . . . . . . . . . . . . . . . . . . . 346 1,458 (246)Other-than-temporary impairments . . . . . . . . . . . . . . . . . . . . . . . . . . . . . . . . . . . . . . . . . . (694) (9,057) (6,974)Noncredit portion of other-than-temporary impairments recognized in other comprehensive loss. . (28) (804) —
Net other-than-temporary impairments . . . . . . . . . . . . . . . . . . . . . . . . . . . . . . . . . . . . . . . . (722) (9,861) (6,974)Fair value losses, net . . . . . . . . . . . . . . . . . . . . . . . . . . . . . . . . . . . . . . . . . . . . . . . . . . . (511) (2,811) (20,129)Debt extinguishment losses, net (includes debt extinguishment losses related to consolidated
trusts of $109, $- and $-, respectively) . . . . . . . . . . . . . . . . . . . . . . . . . . . . . . . . . . . . . . (568) (325) (222)Losses from partnership investments . . . . . . . . . . . . . . . . . . . . . . . . . . . . . . . . . . . . . . . . . (74) (6,735) (1,554)Fee and other income . . . . . . . . . . . . . . . . . . . . . . . . . . . . . . . . . . . . . . . . . . . . . . . . . . . 882 773 1,033
Non-interest loss . . . . . . . . . . . . . . . . . . . . . . . . . . . . . . . . . . . . . . . . . . . . . . . . . . . (445) (10,290) (20,471)
Administrative expenses:Salaries and employee benefits . . . . . . . . . . . . . . . . . . . . . . . . . . . . . . . . . . . . . . . . . . . 1,277 1,133 1,032Professional services . . . . . . . . . . . . . . . . . . . . . . . . . . . . . . . . . . . . . . . . . . . . . . . . . . 942 684 529Occupancy expenses . . . . . . . . . . . . . . . . . . . . . . . . . . . . . . . . . . . . . . . . . . . . . . . . . . 170 205 227Other administrative expenses . . . . . . . . . . . . . . . . . . . . . . . . . . . . . . . . . . . . . . . . . . . . 208 185 191
Total administrative expenses. . . . . . . . . . . . . . . . . . . . . . . . . . . . . . . . . . . . . . . . . . . 2,597 2,207 1,979Provision for guaranty losses . . . . . . . . . . . . . . . . . . . . . . . . . . . . . . . . . . . . . . . . . . . . . . 194 63,057 23,929Foreclosed property expense . . . . . . . . . . . . . . . . . . . . . . . . . . . . . . . . . . . . . . . . . . . . . . 1,718 910 1,858Other expenses . . . . . . . . . . . . . . . . . . . . . . . . . . . . . . . . . . . . . . . . . . . . . . . . . . . . . . . 853 1,484 1,093
Total expenses . . . . . . . . . . . . . . . . . . . . . . . . . . . . . . . . . . . . . . . . . . . . . . . . . . . . 5,362 67,658 28,859
Loss before federal income taxes and extraordinary losses . . . . . . . . . . . . . . . . . . . . . . . . . . . (14,100) (73,007) (44,570)Provision (benefit) for federal income taxes . . . . . . . . . . . . . . . . . . . . . . . . . . . . . . . . . . . . (82) (985) 13,749
Loss before extraordinary losses . . . . . . . . . . . . . . . . . . . . . . . . . . . . . . . . . . . . . . . . . . . . (14,018) (72,022) (58,319)Extraordinary losses, net of tax effect . . . . . . . . . . . . . . . . . . . . . . . . . . . . . . . . . . . . . . . . — — (409)
Net loss . . . . . . . . . . . . . . . . . . . . . . . . . . . . . . . . . . . . . . . . . . . . . . . . . . . . . . . . . . . . (14,018) (72,022) (58,728)Less: Net loss attributable to the noncontrolling interest. . . . . . . . . . . . . . . . . . . . . . . . . . . 4 53 21
Net loss attributable to Fannie Mae . . . . . . . . . . . . . . . . . . . . . . . . . . . . . . . . . . . . . . . . . . (14,014) (71,969) (58,707)Preferred stock dividends. . . . . . . . . . . . . . . . . . . . . . . . . . . . . . . . . . . . . . . . . . . . . . . . . (7,704) (2,474) (1,069)
Net loss attributable to common stockholders . . . . . . . . . . . . . . . . . . . . . . . . . . . . . . . . . . . $ (21,718) $(74,443) $(59,776)
Loss per share — Basic and Diluted . . . . . . . . . . . . . . . . . . . . . . . . . . . . . . . . . . . . . . . . . $ (3.81) $ (13.11) $ (24.04)Cash dividends per common share . . . . . . . . . . . . . . . . . . . . . . . . . . . . . . . . . . . . . . . . . . $ — $ — $ 0.75Weighted-average common shares outstanding — Basic and Diluted . . . . . . . . . . . . . . . . . . . . 5,694 5,680 2,487
See Notes to Consolidated Financial Statements
F-4

FANNIE MAE(In conservatorship)
Consolidated Statements of Cash Flows(Dollars in millions)
2010 2009 2008For the Year Ended December 31,
Cash flows (used in) provided by operating activities:Net loss . . . . . . . . . . . . . . . . . . . . . . . . . . . . . . . . . . . . . . . . . . . . . . . . . . . . . . . . . $ (14,018) $ (72,022) $ (58,728)Reconciliation of net loss to net cash (used in) provided by operating activities:
Amortization of cost basis adjustments . . . . . . . . . . . . . . . . . . . . . . . . . . . . . . . . . . . . 126 2,568 8,189Provisions for loan and guaranty losses. . . . . . . . . . . . . . . . . . . . . . . . . . . . . . . . . . . . 24,896 72,626 27,951Valuation (gains) losses . . . . . . . . . . . . . . . . . . . . . . . . . . . . . . . . . . . . . . . . . . . . . . (1,289) 3,425 12,725Losses from partnership investments . . . . . . . . . . . . . . . . . . . . . . . . . . . . . . . . . . . . . 74 6,735 1,554Current and deferred federal income taxes . . . . . . . . . . . . . . . . . . . . . . . . . . . . . . . . . . 258 (1,919) 12,904Extraordinary losses, net of tax effect . . . . . . . . . . . . . . . . . . . . . . . . . . . . . . . . . . . . . — — 409Purchases of loans held for sale . . . . . . . . . . . . . . . . . . . . . . . . . . . . . . . . . . . . . . . . (81) (109,684) (56,768)Proceeds from repayments of loans held for sale . . . . . . . . . . . . . . . . . . . . . . . . . . . . . 88 2,413 617Net change in trading securities, excluding non-cash transfers . . . . . . . . . . . . . . . . . . . . . (23,612) 11,976 72,689Other, net . . . . . . . . . . . . . . . . . . . . . . . . . . . . . . . . . . . . . . . . . . . . . . . . . . . . . . . (13,837) (2,027) (5,689)
Net cash (used in) provided by operating activities . . . . . . . . . . . . . . . . . . . . . . . . . . . . . . (27,395) (85,909) 15,853Cash flows provided by (used in) investing activities:
Purchases of trading securities held for investment . . . . . . . . . . . . . . . . . . . . . . . . . . . . (8,547) (48,659) (7,635)Proceeds from maturities of trading securities held for investment . . . . . . . . . . . . . . . . . . 2,638 12,918 9,530Proceeds from sales of trading securities held for investment. . . . . . . . . . . . . . . . . . . . . . 21,556 39,261 2,823Purchases of available-for-sale securities . . . . . . . . . . . . . . . . . . . . . . . . . . . . . . . . . . . (413) (165,103) (147,337)Proceeds from maturities of available-for-sale securities . . . . . . . . . . . . . . . . . . . . . . . . . 17,102 48,096 33,369Proceeds from sales of available-for-sale securities . . . . . . . . . . . . . . . . . . . . . . . . . . . . 7,867 306,598 146,630Purchases of loans held for investment . . . . . . . . . . . . . . . . . . . . . . . . . . . . . . . . . . . . (86,724) (52,148) (63,097)Proceeds from repayments of loans held for investment of Fannie Mae . . . . . . . . . . . . . . . 20,715 30,958 39,098Proceeds from repayments of loans held for investment of consolidated trusts. . . . . . . . . . . 574,740 26,184 10,230Net change in restricted cash . . . . . . . . . . . . . . . . . . . . . . . . . . . . . . . . . . . . . . . . . . (15,025) — —Advances to lenders . . . . . . . . . . . . . . . . . . . . . . . . . . . . . . . . . . . . . . . . . . . . . . . . (74,130) (79,163) (81,483)Proceeds from disposition of acquired property and preforeclosure sales . . . . . . . . . . . . . . 39,682 22,667 10,905Contributions to partnership investments . . . . . . . . . . . . . . . . . . . . . . . . . . . . . . . . . . . (351) (688) (1,507)Proceeds from partnership investments . . . . . . . . . . . . . . . . . . . . . . . . . . . . . . . . . . . . 129 87 1,042Net change in federal funds sold and securities purchased under agreements to resell or
similar agreements . . . . . . . . . . . . . . . . . . . . . . . . . . . . . . . . . . . . . . . . . . . . . . . 41,471 4,230 (9,793)Other, net . . . . . . . . . . . . . . . . . . . . . . . . . . . . . . . . . . . . . . . . . . . . . . . . . . . . . . . (531) (27,503) (15,282)
Net cash provided by (used in) investing activities . . . . . . . . . . . . . . . . . . . . . . . . . . . . . . 540,179 117,735 (72,507)Cash flows (used in) provided by financing activities:
Proceeds from issuance of short-term debt of Fannie Mae . . . . . . . . . . . . . . . . . . . . . . . 699,346 1,641,119 1,913,685Payments to redeem short-term debt of Fannie Mae . . . . . . . . . . . . . . . . . . . . . . . . . . . (748,550) (1,773,977) (1,824,511)Proceeds from issuance of long-term debt of Fannie Mae . . . . . . . . . . . . . . . . . . . . . . . . 456,602 289,806 243,180Payments to redeem long-term debt of Fannie Mae . . . . . . . . . . . . . . . . . . . . . . . . . . . . (397,813) (256,728) (266,758)Proceeds from issuance of short-term debt of consolidated trusts . . . . . . . . . . . . . . . . . . . 12,613 — —Payments to redeem short-term debt of consolidated trusts . . . . . . . . . . . . . . . . . . . . . . . (37,210) — —Proceeds from issuance of long-term debt of consolidated trusts . . . . . . . . . . . . . . . . . . . 263,962 58 377Payments to redeem long-term debt of consolidated trusts . . . . . . . . . . . . . . . . . . . . . . . (771,292) (601) (467)Payments of cash dividends on senior preferred stock to Treasury . . . . . . . . . . . . . . . . . . (7,706) (2,470) (31)Payments of cash dividends on common and preferred stock . . . . . . . . . . . . . . . . . . . . . . — — (1,774)Proceeds from issuance of common and preferred stock . . . . . . . . . . . . . . . . . . . . . . . . . — — 7,211Proceeds from senior preferred stock purchase agreement with Treasury . . . . . . . . . . . . . . 27,700 59,900 —Net change in federal funds purchased and securities sold under agreements to repurchase . . 49 (54) (266)
Net cash (used in) provided by financing activities . . . . . . . . . . . . . . . . . . . . . . . . . . . . . . (502,299) (42,947) 70,646Net increase (decrease) in cash and cash equivalents . . . . . . . . . . . . . . . . . . . . . . . . . . . 10,485 (11,121) 13,992Cash and cash equivalents at beginning of period . . . . . . . . . . . . . . . . . . . . . . . . . . . . . . . 6,812 17,933 3,941
Cash and cash equivalents at end of period . . . . . . . . . . . . . . . . . . . . . . . . . . . . . . . . . . . $ 17,297 $ 6,812 $ 17,933
Cash paid during the period for:Interest . . . . . . . . . . . . . . . . . . . . . . . . . . . . . . . . . . . . . . . . . . . . . . . . . . . . . . . . . . $ 140,651 $ 26,344 $ 35,959Income taxes . . . . . . . . . . . . . . . . . . . . . . . . . . . . . . . . . . . . . . . . . . . . . . . . . . . . . . — 876 845Non-cash activities (excluding transition-related impacts — see Note 2):Mortgage loans acquired by assuming debt . . . . . . . . . . . . . . . . . . . . . . . . . . . . . . . . . . . $ 484,699 $ — $ 167Net transfers from mortgage loans held for investment of consolidated trusts to mortgage loans
held for investment of Fannie Mae . . . . . . . . . . . . . . . . . . . . . . . . . . . . . . . . . . . . . . 121,852 — —Transfers from advances to lenders to investments in securities . . . . . . . . . . . . . . . . . . . . . . — 77,191 83,534Transfers from advances to lenders to loans held for investment of consolidated trusts . . . . . . . 68,385 — —Net transfers from mortgage loans to acquired property . . . . . . . . . . . . . . . . . . . . . . . . . . . 66,081 5,707 4,272
See Notes to Consolidated Financial Statements
F-5

FANNIE MAE(In conservatorship)
Consolidated Statements of Changes in Equity (Deficit)(Dollars and shares in millions, except per share amounts)
SeniorPreferred Preferred Common
SeniorPreferred
PreferredStock
CommonStock
AdditionalPaid-InCapital
RetainedEarnings
(AccumulatedDeficit)
AccumulatedOther
ComprehensiveLoss
TreasuryStock
NonControlling
Interest
TotalEquity
(Deficit)
Shares Outstanding
Fannie Mae Stockholders’ Equity (Deficit)
Balance as of December 31, 2007 . . . . . . — 466 974 $ — $16,913 $593 $ 1,831 $ 33,548 $ (1,362) $(7,512) $107 $ 44,118Cumulative effect from the adoption of the
accounting standards on the fair valueoption for financial instruments and fairvalue measurement, net of tax . . . . . . — — — — — — — 148 (93) — — 55
Balances of January 1, 2008 adjusted . . . . — 466 974 — 16,913 593 1,831 33,696 (1,455) (7,512) 107 44,173Change in investment in noncontrolling
interest . . . . . . . . . . . . . . . . . . . — — — — — — — — — — 71 71Comprehensive loss:Net loss . . . . . . . . . . . . . . . . . . . — — — — — — — (58,707) — — (21) (58,728)Other comprehensive loss, net of tax
effect:Changes in net unrealized losses on
available-for-sale securities (net of taxof $5,395) . . . . . . . . . . . . . . . . — — — — — — — — (10,020) — — (10,020)
Reclassification adjustment forother-than- temporary impairmentsrecognized in net loss (net of tax of$2,441) . . . . . . . . . . . . . . . . . — — — — — — — — 4,533 — — 4,533
Reclassification adjustment for gainsincluded in net loss (net of tax of$36) . . . . . . . . . . . . . . . . . . — — — — — — — — (67) — — (67)
Unrealized losses on guaranty assets andguaranty fee buy-ups . . . . . . . . . . — — — — — — — — (342) — — (342)
Amortization of net cash flow hedginggains . . . . . . . . . . . . . . . . . . — — — — — — — — 1 — — 1
Prior service cost and actuarial gains,net of amortization for defined benefitplans . . . . . . . . . . . . . . . . . . — — — — — — — — (323) — — (323)
Total comprehensive loss . . . . . . . . . . (64,946)Common stock dividends ($0.75 per
share) . . . . . . . . . . . . . . . . . . . — — — — — — — (741) — — — (741)Senior preferred stock dividends . . . . . . — — — — — — (31) — — — — (31)Common stock issued . . . . . . . . . . . . — — 94 — — 49 2,477 — — — — 2,526Common stock warrant issued . . . . . . . — — — — — — 3,518 — — — — 3,518Preferred stock dividends declared . . . . . — — — — — — — (1,038) — — — (1,038)Senior preferred stock issued . . . . . . . . 1 — — 1,000 — — — — — — — 1,000Preferred stock issued . . . . . . . . . . . . — 141 — — 4,812 — (127) — — — — 4,685Conversion of convertible preferred stock
into common stock . . . . . . . . . . . . — (10) 16 — (503) 8 495 — — — — —Treasury commitment . . . . . . . . . . . . — — — — — — (4,518) — — — — (4,518)Other . . . . . . . . . . . . . . . . . . . . . — — 1 — — — (24) — — 168 — 144
Balance as of December 31, 2008 . . . . . . 1 597 1,085 1,000 21,222 650 3,621 (26,790) (7,673) (7,344) 157 (15,157)Cumulative effect from the adoption of a
new accounting standard on other-than-temporary impairments, net of tax . . . . — — — — — — — 8,520 (5,556) — — 2,964
Change in investment in noncontrollinginterest . . . . . . . . . . . . . . . . . . . — — — — — — — — — — (13) (13)
Comprehensive loss:Net loss . . . . . . . . . . . . . . . . . . . — — — — — — — (71,969) — — (53) (72,022)Other comprehensive loss, net of tax
effect:Changes in net unrealized losses on
available-for-sale securities (net of taxof $2,658) . . . . . . . . . . . . . . . . — — — — — — — — 4,936 — — 4,936
Reclassification adjustment forother-than- temporary impairmentsrecognized in net loss (net of tax of$3,441) . . . . . . . . . . . . . . . . . — — — — — — — — 6,420 — — 6,420
Reclassification adjustment for gainsincluded in net loss (net of tax of$119) . . . . . . . . . . . . . . . . . . — — — — — — — — (220) — — (220)
Unrealized gains on guaranty assets andguaranty fee buy-ups . . . . . . . . . . — — — — — — — — 245 — — 245
Amortization of net cash flow hedginggains . . . . . . . . . . . . . . . . . . — — — — — — — — 9 — — 9
Prior service cost and actuarial gains,net of amortization for defined benefitplans . . . . . . . . . . . . . . . . . . — — — — — — — — 107 — — 107
Total comprehensive loss . . . . . . . . . . (60,525)Senior preferred stock dividends . . . . . . — — — — — — (2,470) — — — — (2,470)Increase to senior preferred liquidation
preference . . . . . . . . . . . . . . . . . — — — 59,900 — — — — — — — 59,900Conversion of convertible preferred stock
into common stock . . . . . . . . . . . . — (17) 27 — (874) 14 860 — — — — —Other . . . . . . . . . . . . . . . . . . . . . — — 1 — — — 72 2 — (54) — 20
F-6
See Notes to Consolidated Financial Statements

SeniorPreferred Preferred Common
SeniorPreferred
PreferredStock
CommonStock
AdditionalPaid-InCapital
RetainedEarnings
(AccumulatedDeficit)
AccumulatedOther
ComprehensiveLoss
TreasuryStock
NonControlling
Interest
TotalEquity
(Deficit)
Shares Outstanding
Fannie Mae Stockholders’ Equity (Deficit)
Balance as of December 31, 2009 . . . . . . 1 580 1,113 $60,900 $20,348 $664 $ 2,083 $ (90,237) $ (1,732) $(7,398) $ 91 $(15,281)Cumulative effect from the adoption of the
accounting standards on transfers offinancial assets and consolidation . . . . — — — — — — — 6,706 (3,394) — (14) 3,298
Balance as of January 1, 2010, adjusted . . 1 580 1,113 60,900 20,348 664 2,083 (83,531) (5,126) (7,398) 77 (11,983)Change in investment in noncontrolling
interest . . . . . . . . . . . . . . . . . . . — — — — — — — — — — 9 9Comprehensive loss:Net loss . . . . . . . . . . . . . . . . . . . — — — — — — — (14,014) — — (4) (14,018)Other comprehensive loss, net of tax
effect:Changes in net unrealized losses on
available-for-sale securities, (net oftax of $1,644) . . . . . . . . . . . . . — — — — — — — — 3,054 — — 3,054
Reclassification adjustment forother-than- temporary impairmentsrecognized in net loss (net of tax of$253) . . . . . . . . . . . . . . . . . . — — — — — — — — 469 — — 469
Reclassification adjustment for gainsincluded in net loss (net of taxof $10) . . . . . . . . . . . . . . . . . — — — — — — — — (19) — — (19)
Unrealized gains on guaranty assets andguaranty fee buy-ups . . . . . . . . . . — — — — — — — — 1 — — 1
Prior service cost and actuarial gains,net of amortization for defined benefitplans . . . . . . . . . . . . . . . . . . — — — — — — — — (61) — — (61)
Total comprehensive loss . . . . . . . . . . (10,574)Senior preferred stock dividends . . . . . . — — — — — — (2,265) (5,441) — — — (7,706)Increase to senior preferred liquidation
preference . . . . . . . . . . . . . . . . . — — — 27,700 — — — — — — — 27,700Conversion of convertible preferred stock
into common stock . . . . . . . . . . . . — (3) 5 — (144) 3 141 — — — — —Other . . . . . . . . . . . . . . . . . . . . . — — 1 — — — 41 — — (4) — 37
Balance as of December 31, 2010 . . . . . . 1 577 1,119 $88,600 $20,204 $667 $ — $(102,986) $ (1,682) $(7,402) $ 82 $ (2,517)
F-7
See Notes to Consolidated Financial Statements

FANNIE MAE(In conservatorship)
NOTES TO CONSOLIDATED FINANCIAL STATEMENTS
1. Summary of Significant Accounting Policies
Organization
We are a stockholder-owned corporation organized and existing under the Federal National MortgageAssociation Charter Act (the “Charter Act” or our “charter”). We are a government-sponsored enterprise(“GSE”), and we are subject to government oversight and regulation. Our regulators include the FederalHousing Finance Agency (“FHFA”), the U.S. Department of Housing and Urban Development (“HUD”), theU.S. Securities and Exchange Commission (“SEC”), and the U.S. Department of the Treasury (“Treasury”).The U.S. government does not guarantee our securities or other obligations.
We operate in the secondary mortgage market by purchasing mortgage loans and mortgage-related securities,including mortgage-related securities guaranteed by us, from primary mortgage market institutions, such ascommercial banks, savings and loan associations, mortgage banking companies, securities dealers and otherinvestors. We do not lend money directly to consumers in the primary mortgage market. We provide additionalliquidity in the secondary mortgage market by issuing guaranteed mortgage-related securities.
We operate under three business segments: Single-Family Credit Guaranty (“Single-Family”), Multifamily(“Multifamily”—formerly “Housing and Community Development”) and Capital Markets. Our Single-Familysegment generates revenue primarily from the guaranty fees on the mortgage loans underlying guaranteedsingle-family Fannie Mae mortgage-backed securities (“Fannie Mae MBS”). Our Multifamily segmentgenerates revenue from a variety of sources, including guaranty fees on the mortgage loans underlyingmultifamily Fannie Mae MBS and on the multifamily mortgage loans held in our portfolio, transaction feesassociated with the multifamily business and bond credit enhancement fees. Our Capital Markets segmentinvests in mortgage loans, mortgage-related securities and other investments, and generates income primarilyfrom the difference, or spread, between the yield on the mortgage assets we own and the interest we pay onthe debt we issue in the global capital markets to fund the purchases of these mortgage assets.
Conservatorship
On September 7, 2008, the Secretary of the Treasury and the Director of FHFA announced several actionstaken by Treasury and FHFA regarding Fannie Mae, which included: (1) placing us in conservatorship; (2) theexecution of a senior preferred stock purchase agreement by our conservator, on our behalf, and Treasury,pursuant to which we issued to Treasury both senior preferred stock and a warrant to purchase common stock;and (3) Treasury’s agreement to establish a temporary secured lending credit facility that was available to usand the other GSEs regulated by FHFA under identical terms until December 31, 2009.
Under the Federal Housing Enterprises Financial Safety and Soundness Act of 1992, as amended by theFederal Housing Finance Regulatory Reform Act of 2008, (together, the “GSE Act”), the conservatorimmediately succeeded to (1) all rights, titles, powers and privileges of Fannie Mae, and of any stockholder,officer or director of Fannie Mae with respect to Fannie Mae and its assets, and (2) title to the books, recordsand assets of any other legal custodian of Fannie Mae. The conservator has since delegated specifiedauthorities to our Board of Directors and has delegated to management the authority to conduct our day-to-dayoperations. The conservator retains the authority to withdraw its delegations at any time.
We were directed by FHFA to voluntarily delist our common stock and each listed series of our preferredstock from the New York Stock Exchange and the Chicago Stock Exchange. The last trading day for the listedsecurities on the New York Stock Exchange and the Chicago Stock Exchange was July 7, 2010, and sinceJuly 8, 2010, the securities have been quoted on the over-the-counter market.
As of February 24, 2011, the conservator has advised us that it has not disaffirmed or repudiated any contractswe entered into prior to its appointment as conservator. The GSE Act requires FHFA to exercise its right to
F-8

disaffirm or repudiate most contracts within a reasonable period of time after its appointment as conservator.FHFA’s proposed rule on conservatorship and receivership operations, published on July 9, 2010, defines“reasonable period” as a period of 18 months following the appointment of a conservator or receiver. Thisproposed rule has not been finalized.
The conservator has the power to transfer or sell any asset or liability of Fannie Mae (subject to limitationsand post-transfer notice provisions for transfers of qualified financial contracts) without any approval,assignment of rights or consent of any party. The GSE Act, however, provides that mortgage loans andmortgage-related assets that have been transferred to a Fannie Mae MBS trust must be held by the conservatorfor the beneficial owners of the Fannie Mae MBS and cannot be used to satisfy the general creditors of thecompany. As of February 24, 2011, FHFA has not exercised this power.
Neither the conservatorship nor the terms of our agreements with Treasury change our obligation to makerequired payments on our debt securities or perform under our mortgage guaranty obligations.
The conservatorship has no specified termination date and there continues to be uncertainty regarding thefuture of our company, including how long we will continue to be in existence, the extent of our role in themarket, what form we will have, and what ownership interest, if any, our current common and preferredstockholders will hold in us after the conservatorship is terminated. Under the GSE Act, FHFA must place usinto receivership if the Director of FHFA makes a written determination that our assets are less than ourobligations (that is, we have a net worth deficit) or if we have not been paying our debts, in either case, for aperiod of 60 days. In addition, the Director of FHFA may place us in receivership at his discretion at any timefor other reasons, including conditions that FHFA has already asserted existed at the time the Director ofFHFA placed us into conservatorship. Placement into receivership would have a material adverse effect onholders of our common stock, preferred stock, debt securities and Fannie Mae MBS. Should we be placed intoreceivership, different assumptions would be required to determine the carrying value of our assets, whichcould lead to substantially different financial results.
Senior Preferred Stock and Warrant Issued to Treasury
On September 7, 2008, we, through FHFA in its capacity as conservator, entered into a senior preferred stockpurchase agreement with Treasury. The agreement was amended on September 26, 2008, May 6, 2009 andDecember 24, 2009. Pursuant to the amended senior preferred stock purchase agreement, Treasury hascommitted to provide us with funding as needed to help us maintain a positive net worth thereby avoiding themandatory receivership trigger described above. Treasury’s maximum funding commitment to us under theagreement is the greater of (a) $200 billion or (b) $200 billion plus the cumulative amount of our net worthdeficit (the amount by which our total liabilities exceed our total assets) as of the end of any and eachcalendar quarter in 2010, 2011 and 2012, less any positive net worth as of December 31, 2012. Asconsideration for Treasury’s funding commitment, we issued one million shares of senior preferred stock and awarrant to purchase shares of our common stock to Treasury. We were scheduled to begin paying Treasury aquarterly commitment fee beginning on March 31, 2011. On December 29, 2010, FHFA was notified byTreasury that Treasury was waiving the commitment fee for the first quarter of 2011 due to adverse conditionsin the U.S. mortgage market and because Treasury believed that imposing the commitment fee would notgenerate increased compensation for taxpayers. Treasury further noted that it would reevaluate whether to setthe fee the next quarter. Treasury, as holder of the senior preferred stock, is entitled to receive, when, as and ifdirected by our conservator, cumulative quarterly cash dividends at the annual rate of 10% per year on thecurrent liquidation preference of the senior preferred stock. If at any time we do not pay cash dividends in atimely manner, then all dividend periods thereafter until the dividend period following the date on which wehave paid in cash full cumulative dividends, the dividend rate will be 12% per year. We have received a totalof $87.6 billion to date under Treasury’s funding commitment and the Acting Director of FHFA has submitted
F-9
FANNIE MAE(In conservatorship)
NOTES TO CONSOLIDATED FINANCIAL STATEMENTS—(Continued)

a request for an additional $2.6 billion from Treasury to eliminate our net worth deficit as of December 31,2010. The aggregate liquidation preference of the senior preferred stock was $88.6 billion as of December 31,2010 and will increase to $91.2 billion as a result of FHFA’s request on our behalf for funds to eliminate ournet worth deficit as of December 31, 2010.
On September 7, 2008, we issued a warrant to Treasury giving it the right to purchase, at a nominal price,shares of our common stock equal to 79.9% of the total common stock outstanding on a fully diluted basis onthe date Treasury exercises the warrant. Treasury has the right to exercise the warrant, in whole or in part, atany time on or before September 7, 2028. We recorded the warrant at fair value in our stockholders’ equity asa component of additional paid-in-capital. The fair value of the warrant was calculated using the Black-Scholes Option Pricing Model. Since the warrant has an exercise price of $0.00001 per share, the model isinsensitive to the risk-free rate and volatility assumptions used in the calculation and the share value of thewarrant is equal to the price of the underlying common stock. We estimated that the fair value of the warrantat issuance was $3.5 billion based on the price of our common stock on September 8, 2008, which was afterthe dilutive effect of the warrant had been reflected in the market price. Subsequent changes in the fair valueof the warrant are not recognized in the financial statements. If the warrant is exercised, the stated value of thecommon stock issued will be reclassified as “Common stock” in our consolidated balance sheets. Because thewarrant’s exercise price per share is considered non-substantive (compared to the market price of our commonstock), the warrant was determined to have characteristics of non-voting common stock, and thus is includedin the computation of basic and diluted loss per share. The weighted-average shares of common stockoutstanding for the years ended December 31, 2010, 2009 and 2008, included shares of common stock thatwould be issuable upon full exercise of the warrant issued to Treasury.
Impact of U.S. Government Support
We are dependent upon the continued support of Treasury to eliminate our net worth deficit, which avoids ourbeing placed into receivership. Based on consideration of all the relevant conditions and events affecting ouroperations, including our dependence on the U.S. Government, we continue to operate as a going concern andin accordance with our delegation of authority from FHFA.
Pursuant to the amended senior preferred stock purchase agreement, Treasury has committed to provide uswith funding as needed to help us maintain a positive net worth thereby avoiding the mandatory receivershiptrigger described above.
We fund our business primarily through the issuance of short-term and long-term debt securities in thedomestic and international capital markets. Because debt issuance is our primary funding source, we aresubject to “roll-over,” or refinancing, risk on our outstanding debt. Our ability to issue long-term debt has beenstrong in 2009 and 2010 primarily due to actions taken by the federal government to support us and thefinancial markets. Demand for our long-term debt securities continues to be strong.
We believe that continued federal government support of our business and the financial markets, as well as ourstatus as a GSE, are essential to maintaining our access to debt funding. Changes or perceived changes in thegovernment’s support could materially adversely affect our ability to refinance our debt as it becomes due,which could have a material adverse impact on our liquidity, financial condition and results of operations. Inaddition, future changes or disruptions in the financial markets could significantly change the amount, mix andcost of funds we obtain, which also could increase our liquidity and roll-over risk and have a material adverseimpact on our liquidity, financial condition and results of operations.
On February 11, 2011, Treasury and HUD released a report to Congress on reforming America’s housingfinance market. The report provides that the Administration will work with FHFA to determine the best way toresponsibly reduce Fannie Mae’s and Freddie Mac’s role in the market and ultimately wind down both
F-10
FANNIE MAE(In conservatorship)
NOTES TO CONSOLIDATED FINANCIAL STATEMENTS—(Continued)

institutions. The report emphasizes the importance of proceeding with a careful transition plan and providingthe necessary financial support to Fannie Mae and Freddie Mac during the transition period.
Basis of Presentation
The accompanying consolidated financial statements have been prepared in accordance with accountingprinciples generally accepted in the United States of America (“GAAP”). The accompanying consolidatedfinancial statements include our accounts as well as the accounts of other entities in which we have acontrolling financial interest. All intercompany balances and transactions have been eliminated.
Related Parties
As a result of our issuance to Treasury of the warrant to purchase shares of Fannie Mae common stock equalto 79.9% of the total number of shares of Fannie Mae common stock, we and the Treasury are deemed relatedparties. As of December 31, 2010, Treasury held an investment in our senior preferred stock with a liquidationpreference of $88.6 billion. Beginning in 2009, Treasury engaged us to serve as program administrator for theHome Affordable Modification Program (“HAMP”) and other initiatives under the Making Home AffordableProgram. Our administrative expenses were reduced by $167 million in the fourth quarter 2010 due to accrualand receipt of reimbursements from Treasury and Freddie Mac for expenses incurred as program administrator.
In January 2011, we received a refund of $1.1 billion from the IRS, a bureau of Treasury, related to thecarryback of our 2009 operating loss to the 2008 and 2007 tax years.
In December 2010, we entered into an agreement with certain wholly-owned subsidiaries of Ally Financial,Inc. (“Ally”). Under the agreement, we received $462 million in exchange for our release of specified Allyaffiliates from potential liability relating to certain private-label securities sponsored by the affiliates and forcertain selling representation and warranty liability related to mortgage loans sold and/or serviced by one ofthe subsidiaries as of or prior to June 30, 2010. Treasury has majority ownership of Ally.
In addition, in 2009, we entered into a memorandum of understanding with Treasury, FHFA and Freddie Macin which we agreed to provide assistance to state and local housing finance agencies (“HFAs”) through threeseparate assistance programs: a temporary credit and liquidity facilities (“TCLF”) program, a new issue bond(“NIB”) program and a multifamily credit enhancement program.
Under the TCLF program, we had $3.7 billion and $870 million outstanding, which includes principal andinterest, of three-year standby credit and liquidity support as of December 31, 2010 and 2009, respectively.Treasury has purchased participating interests in these temporary credit and liquidity facilities. Under the NIBprogram, we had $7.6 billion and $3.5 billion outstanding of pass-through securities backed by single-familyand multifamily housing bonds issued by HFAs as of December 31, 2010 and 2009, respectively. Treasurybears the initial loss of principal under the TCLF program and the NIB program up to 35% of the totalprincipal on a combined program-wide basis. We are not participating in the multifamily credit enhancementprogram.
FHFA’s control of both us and Freddie Mac has caused us and Freddie Mac to be related parties. Notransactions outside of normal business activities have occurred between us and Freddie Mac. As ofDecember 31, 2010 and 2009, we held Freddie Mac mortgage-related securities with a fair value of$18.3 billion and $42.6 billion, respectively, and accrued interest receivable of $93 million and $230 million,respectively. We recognized interest income on Freddie Mac mortgage-related securities held by us of$1.1 billion, $2.0 billion and $1.6 billion for the years ended December 31, 2010, 2009 and 2008, respectively.In addition, Freddie Mac may be an investor in variable interest entities that we have consolidated, and wemay be an investor in variable interest entities that Freddie Mac has consolidated.
F-11
FANNIE MAE(In conservatorship)
NOTES TO CONSOLIDATED FINANCIAL STATEMENTS—(Continued)

Use of Estimates
Preparing consolidated financial statements in accordance with GAAP requires management to make estimatesand assumptions that affect our reported amounts of assets and liabilities, and disclosure of contingent assetsand liabilities as of the dates of our consolidated financial statements, as well as our reported amounts ofrevenues and expenses during the reporting periods. Management has made significant estimates in a varietyof areas including, but not limited to, valuation of certain financial instruments and other assets and liabilities,the allowance for loan losses and reserve for guaranty losses, and other-than-temporary impairment ofinvestment securities. Actual results could be different from these estimates.
Our allowance for loan losses includes an estimate for the benefit of payments from lenders and servicers tomake us whole for losses on loans due to a breach of selling or servicing representations and warranties.Historically, this estimate was based significantly on historical cash collections. In the fourth quarter of 2010,the following factors impacted this estimate:
• we revised our methodology to take into account trends in management actions taken before cashcollections, which resulted in our allowance for loan losses being $1.1 billion higher than it would havebeen under the previous methodology; and
• agreements with seller/servicers that addressed their loan repurchase and other obligations to us impactedour expectation of future make-whole payments, resulting in a decrease in our allowance for loan lossesof approximately $700 million.
In the fourth quarter of 2010, we updated our allowance for loan loss models to incorporate more recent dataon prepayments and modified loan performance which reduced the allowance on individually impaired loansby $670 million, driven primarily by more favorable default expectations for modified loans that withstoodsuccessful trial periods. In the second quarter of 2010, we updated our allowance for loan loss model to reflecta change in our cohort structure for our severity calculations which resulted in a change in estimate and adecrease in our allowance for loan losses of approximately $1.6 billion.
Principles of Consolidation
Our consolidated financial statements include our accounts as well as the accounts of other entities in whichwe have a controlling financial interest. The typical condition for a controlling financial interest is ownershipof a majority of the voting interests of an entity. A controlling financial interest may also exist in entitiesthrough arrangements that do not involve voting interests, such as a variable interest entity (“VIE”).
VIE Assessment
We have interests in various entities that are considered VIEs. A VIE is an entity (1) that has total equity atrisk that is not sufficient to finance its activities without additional subordinated financial support from otherentities, (2) where the group of equity holders does not have the power to direct the activities of the entity thatmost significantly impact the entity’s economic performance, or the obligation to absorb the entity’s expectedlosses or the right to receive the entity’s expected residual returns, or both, or (3) where the voting rights ofsome investors are not proportional to their obligations to absorb the expected losses of the entity, their rightsto receive the expected residual returns of the entity, or both, and substantially all of the entity’s activitieseither involve or are conducted on behalf of an investor that has disproportionately few voting rights.
In order to determine if an entity is considered a VIE, we first perform a qualitative analysis, which requirescertain subjective decisions including, but not limited to, the design of the entity, the variability that the entitywas designed to create and pass along to its interest holders, the rights of the parties, and the purpose of the
F-12
FANNIE MAE(In conservatorship)
NOTES TO CONSOLIDATED FINANCIAL STATEMENTS—(Continued)

arrangement. If we cannot conclude after a qualitative analysis whether an entity is a VIE, we perform aquantitative analysis.
The primary types of VIE entities with which we are involved are securitization trusts guaranteed by us vialender swap and portfolio securitization transactions, limited partnership investments in low-income housingtax credit (“LIHTC”) and other housing partnerships, as well as mortgage and asset-backed trusts that werenot created by us.
In June 2009, the Financial Accounting Standards Board (“FASB”) revised the accounting standard on theconsolidation of VIEs (the “new accounting standard”), and we adopted the new accounting standardprospectively for all existing VIEs effective January 1, 2010.
Prior to the adoption of the new accounting standard on January 1, 2010, we were exempt from evaluatingcertain securitization entities for consolidation if the entities met the criteria of a qualifying special purposeentity (“QSPE”), and if we did not have the unilateral ability to cause the entity to liquidate or change theentity’s QSPE status. The QSPE requirements significantly limited the activities in which a QSPE couldengage and the types of assets and liabilities it could hold. To the extent any entity failed to meet thosecriteria, we were required to consolidate its assets and liabilities if we were determined to be the primarybeneficiary of the entity. The new accounting standard removed the concept of a QSPE and replaced theprevious primarily quantitative consolidation model with a qualitative model for determining the primarybeneficiary of a VIE.
Primary Beneficiary Determination
Upon the adoption of the new accounting standard on January 1, 2010, if an entity is a VIE, we considerwhether our variable interest in that entity causes us to be the primary beneficiary. Under the new accountingstandard, an enterprise is deemed to be the primary beneficiary of a VIE when the enterprise has both (1) thepower to direct the activities of the VIE that most significantly impact the entity’s economic performance, and(2) exposure to benefits and/or losses that could potentially be significant to the entity. The primarybeneficiary of the VIE is required to consolidate and account for the assets, liabilities, and noncontrollinginterests of the VIE in its consolidated financial statements. The assessment of the party that has the power todirect the activities of the VIE may require significant management judgment when (1) more than one partyhas power or (2) more than one party is involved in the design of the VIE but no party has the power to directthe ongoing activities that could be significant.
We are required to continually assess whether we are the primary beneficiary and therefore may consolidate aVIE through the duration of our involvement. Examples of certain events that may change whether or not weconsolidate the VIE include a change in the design of the entity or a change in our ownership such that we nolonger hold substantially all of the certificates issued by a multi-class resecuritization trust.
Prior to January 1, 2010, we determined whether our variable interest caused us to be considered the primarybeneficiary through a combination of qualitative and quantitative analyses. The qualitative analysis consideredthe design of the entity, the risks that cause variability, the purpose for which the entity was created, and thevariability that the entity was designed to pass along to its variable interest holders. When the primarybeneficiary could not be identified through a qualitative analysis, we used internal cash flow models, which incertain cases included Monte Carlo simulations, to compute and allocate expected losses or expected residualreturns to each variable interest holder based upon the relative contractual rights and preferences of eachinterest holder in the VIE’s capital structure. We were the primary beneficiary and were required toconsolidate the entity if we absorbed the majority of expected losses or expected residual returns, or both.
F-13
FANNIE MAE(In conservatorship)
NOTES TO CONSOLIDATED FINANCIAL STATEMENTS—(Continued)

Measurement of Consolidated Assets and Liabilities
In accordance with the new accounting standard, on the transition date, January 1, 2010, we initially measuredthe assets and liabilities of the newly consolidated securitization trusts at their unpaid principal balances andestablished a corresponding valuation allowance and accrued interest, as it was not practicable to determinethe carrying amount of such assets and liabilities. The securitization assets and liabilities that did not qualifyfor the use of this practical expedient were initially measured at fair value. As such, we recognized in ourconsolidated balance sheet the mortgage loans underlying our consolidated trusts as “Mortgage loans held forinvestment of consolidated trusts.” We also recognized securities issued by these trusts that are held by thirdparties in our consolidated balance sheet as either “Short-term debt of consolidated trusts” or “Long-term debtof consolidated trusts.”
Except for securitization trusts consolidated on the transition date, when we transfer assets into a VIE that weconsolidate at the time of transfer, we recognize the assets and liabilities of the VIE at the amounts that theywould have been recognized if they had not been transferred, and no gain or loss is recognized on the transfer.For all other VIEs that we consolidate subsequent to transition, we recognize the assets and liabilities of theVIE in our consolidated financial statements at fair value, and we recognize a gain or loss for the differencebetween (1) the fair value of the consideration paid, fair value of noncontrolling interests and the reportedamount of any previously held interests, and (2) the net amount of the fair value of the assets and liabilitiesconsolidated. However, for the securitization trusts established under our lender swap program, no gain or lossis recognized if the trust is consolidated at formation as there is no difference in the respective fair value of(1) and (2) above.
If we cease to be deemed the primary beneficiary of a VIE, we deconsolidate the VIE. We use fair value tomeasure the initial cost basis for any retained interests that are recorded upon the deconsolidation of a VIE.Any difference between the fair value and the previous carrying amount of our investment in the VIE isrecorded as “Investment gains (losses), net” in our consolidated statements of operations. We also record gainsor losses that are associated with the consolidation of a VIE as “Investment gains (losses), net” in ourconsolidated statements of operations.
Purchase/Sale of Fannie Mae Securities
We actively purchase and may subsequently sell guaranteed MBS that have been issued through our lenderswap and portfolio securitization transaction programs. The accounting for the purchase and sale of ourguaranteed MBS issued by the trusts differs based on the characteristics of the securitization trusts andwhether the trusts are consolidated.
Single-Class Securitization Trusts
Our single-class securitization trusts are trusts we create to issue single-class Fannie Mae MBS that evidencean undivided interest in the mortgage loans held in the trust. Investors in single-class Fannie Mae MBS receiveprincipal and interest payments in proportion to their percentage ownership of the MBS issuance. Weguarantee to each single-class securitization trust that we will supplement amounts received by the single-classsecuritization trust as required to permit timely payments of principal and interest on the related Fannie MaeMBS. This guaranty exposes us to credit losses on the loans underlying Fannie Mae MBS.
We create single-class securitization trusts through both our lender swap and portfolio securitizationtransaction programs. A lender swap transaction occurs when a mortgage lender delivers a pool of single-family mortgage loans to us, which we immediately deposit into an MBS trust. The MBS are then issued tothe lender in exchange for the mortgage loans. A portfolio securitization transaction occurs when we purchasemortgage loans from third-party sellers for cash and later deposit these loans into an MBS trust. The securitiesissued through a portfolio securitization are then sold to investors for cash. We consolidate most of the single-
F-14
FANNIE MAE(In conservatorship)
NOTES TO CONSOLIDATED FINANCIAL STATEMENTS—(Continued)

class securitization trusts that are issued under these programs because our role as guarantor and masterservicer provides us with the power to direct matters that impact the credit risk to which we are exposed.
When we purchase single-class Fannie Mae MBS issued from a consolidated trust, we account for thetransaction as an extinguishment of the related debt in our consolidated financial statements. We record a gainor loss on the extinguishment of such debt to the extent that the purchase price of the MBS does not equal thecarrying value of the related consolidated debt reported in our consolidated balance sheet (includingunamortized premiums, discounts or the other cost basis adjustments) at the time of purchase. We account forthe sale of an MBS from Fannie Mae’s portfolio to a third party that was issued from a consolidated trust asthe issuance of debt in our consolidated financial statements. We amortize the related premiums, discounts andother cost basis adjustments into income over time.
To determine the order in which consolidated debt is extinguished, we have elected to use a daily conventionin the application of the last-issued first-extinguished method. Under this method, we record the net dailychange in each MBS holding as either the issuance of debt if there has been an increase in the position that isheld by third parties, or the extinguishment of the most recently issued related debt if there has been adecrease in the position held by third parties. The impact of this method is that we record the net dailyactivity for an MBS as if it were a single buy or sell trade, which results in a change in our beginning debtbalance if the total unpaid principal balance purchased does not match the total unpaid principal balance sold.
If a single-class securitization trust is not consolidated, we account for the purchase and subsequent sale ofsuch securities as the transfer of an investment security in accordance with the new accounting standard forthe transfers of financial assets.
Single-Class Resecuritization Trusts
Single-class resecuritization trusts are created by depositing Fannie Mae MBS into a new securitization trustfor the purpose of aggregating multiple MBS into a single larger security. The cash flows from the newsecurity represent an aggregation of the cash flows from the underlying MBS. We guarantee to each single-class resecuritization trust that we will supplement amounts received by the trust as required to permit timelypayments of principal and interest on the related Fannie Mae securities. However, we assume no additionalcredit risk in such a resecuritization transaction, because the underlying assets are MBS for which we havealready provided a guaranty. Additionally, our involvement with these trusts does not provide any incrementalrights or power that would enable Fannie Mae to direct any activities of the trusts. As a result, we are not theprimary beneficiaries of, and therefore do not consolidate, our single-class resecuritization trusts.
As our single-class resecuritization securities pass through all of the cash flows of the underlying MBSdirectly to the holders of the securities, they are deemed to be substantially the same as the underlying MBS.Therefore, we account for purchases of our single-class resecuritization securities as an extinguishment of theunderlying MBS debt and the sale of these securities as an issuance of the underlying MBS debt.
Multi-Class Resecuritization Trusts
Multi-class resecuritization trusts are trusts we create to issue multi-class Fannie Mae securities, includingReal Estate Mortgage Investment Conduits (“REMICs”) and strip securities, in which the cash flows of theunderlying mortgage assets are divided, creating several classes of securities, each of which represents abeneficial ownership interest in a separate portion of cash flows. We guarantee to each multi-classresecuritization trust that we will supplement amounts received by the trusts as required to permit timelypayments of principal and interest, as applicable, on the related Fannie Mae securities. However, we assumeno additional credit risk in such a resecuritization transaction because the underlying assets are Fannie MaeMBS for which we have already provided a guaranty. Although we may be exposed to prepayment risk via
F-15
FANNIE MAE(In conservatorship)
NOTES TO CONSOLIDATED FINANCIAL STATEMENTS—(Continued)

our ownership of the securities issued by these trusts, we do not have the ability via our involvement with amulti-class resecuritization trust to impact the economic risk to which we are exposed. Therefore, we do notconsolidate such a multi-class resecuritization trust until we hold a substantial portion of the outstandingbeneficial interests that have been issued by the trust and are therefore considered the primary beneficiary ofthe trust.
We account for the purchase of the securities issued by consolidated multi-class resecuritization trusts as anextinguishment of the debt issued by these trusts and the subsequent sale of such securities as the issuance ofmulti-class debt. In contrast to our single-class resecuritization trust, the cash flows from the underlyingmortgage assets are divided between the debt securities issued by the multi-class resecuritization trust, andtherefore, the debt issued by a multi-class resecuritization trust is not substantially the same as theconsolidated MBS debt. As a result, if a multi-class resecuritization trust is not consolidated, we account forthe purchase and subsequent sale of such securities as the transfer of an investment security rather than theissuance or extinguishment of the related multi-class debt in accordance with the new accounting standard forthe transfers of financial assets.
When we do not consolidate a multi-class resecuritization trust, we recognize in our consolidated financialstatements both our investment in the trust and the mortgage loans of the Fannie Mae MBS trusts that weconsolidate that underlie the multi-class resecuritization trust. Additionally, we recognize the unsecuredcorporate debt issued to third parties to fund the purchase of our investments in the multi-class resecuritizationtrusts as well as the debt issued to third parties of the MBS trusts we consolidate that underlie the multi-classresecuritization trusts. This results in the recognition of interest income from investments in multi-classresecuritization trusts and interest expense from the unsecured debt issued to third parties to fund the purchaseof the investments in multi-class resecuritization trusts, as well as interest income from the mortgage loans andinterest expense from the debt issued to third parties from the MBS trusts we consolidate that underlie themulti-class resecuritization trusts.
See “Note 2, Adoption of the New Accounting Standards on the Transfers of Financial Assets andConsolidation of Variable Interest Entities,” for additional information regarding the impact upon adoption.
Portfolio Securitizations
We evaluate a transfer of financial assets in a portfolio securitization transaction to an entity that is notconsolidated to determine whether the transfer qualifies as a sale. If a portfolio securitization does not meetthe criteria for sale treatment, the transferred assets remain in our consolidated balance sheets and we record aliability to the extent of any proceeds received in connection with such a transfer. Transfers of financial assetsfor which we surrender control of the transferred assets are recorded as sales.
When a transfer that qualifies as a sale is completed, we derecognize all assets transferred and recognize allassets obtained and liabilities incurred at fair value. The difference between the carrying basis of the assetstransferred and the fair value of the proceeds from the sale is recorded as a component of “Investment gains(losses), net” in our consolidated statements of operations. Retained interests are primarily in the form ofFannie Mae MBS, REMIC certificates, guaranty assets and master servicing assets (“MSAs”). We separatelydescribe the subsequent accounting, as well as how we determine fair value, for our retained interests in the“Investment in Securities,” and “Guaranty Accounting” sections of this note.
We also enter into repurchase agreements, including dollar roll transactions, which we account for as securedborrowings. Refer to the “Securities Purchased under Agreements to Resell and Securities Sold underAgreements to Repurchase” section of this note for discussion of our accounting policies related to thesetransfers.
F-16
FANNIE MAE(In conservatorship)
NOTES TO CONSOLIDATED FINANCIAL STATEMENTS—(Continued)

Cash and Cash Equivalents and Statements of Cash Flows
Short-term investments that have a maturity at the date of acquisition of three months or less and are readilyconvertible to known amounts of cash are generally considered cash equivalents. We may pledge as collateralcertain short-term investments classified as cash equivalents.
In the presentation of our consolidated statements of cash flows, we present cash flows from derivatives thatdo not contain financing elements and mortgage loans held for sale as operating activities. We present cashflows from federal funds sold and securities purchased under agreements to resell or similar arrangements asinvesting activities and cash flows from federal funds purchased and securities sold under agreements torepurchase as financing activities. We classify cash flows related to dollar roll transactions that do not meetthe requirements to be accounted for as secured borrowings as purchases and sales of securities in investingactivities. We classify cash flows from trading securities based on their nature and purpose. We classify cashflows from trading securities that we intend to hold for investment (the majority of our mortgage-relatedtrading securities) as investing activities and cash flows from trading securities that we do not intend to holdfor investment (primarily our non-mortgage-related securities) as operating activities.
Prior to the adoption of the new accounting standards on the transfers of financial assets and the consolidationof VIEs (“the new accounting standards”), we reflected the creation of Fannie Mae MBS through either thesecuritization of loans held for sale or advances to lenders as a non-cash activity in our consolidatedstatements of cash flows in the line items “Securitization-related transfers from mortgage loans held for sale toinvestments in securities” or “Transfers from advances to lenders to investments in securities,” respectively.Cash inflows from the sale of a Fannie Mae MBS created through the securitization of loans held for salewere reflected in the consolidated statements of cash flows based on the balance sheet classification of theassociated Fannie Mae MBS as either “Net change in trading securities, excluding non-cash transfers,” or“Proceeds from sales of available-for-sale securities.” Subsequent to the adoption of these new accountingstandards, we continue to apply this presentation to unconsolidated trusts. For consolidated trusts, we classifycash flows related to mortgage loans held by our consolidated trusts as either investing activities (for principalrepayments) or operating activities (for interest received from borrowers included as a component of our netloss). Cash flows related to debt securities issued by consolidated trusts are classified as either financingactivities (for repayments of principal to certificateholders) or operating activities (for interest payments tocertificateholders included as a component of our net loss). We distinguish between the payments andproceeds related to the debt of Fannie Mae and the debt of consolidated trusts, as applicable. We present ournon-cash activities in the consolidated statements of cash flows at the associated unpaid principal balance.
During the fourth quarter of 2010, we identified certain servicer and consolidation related transactions thatwere not appropriately reflected in our condensed consolidated statements of cash flows for the three, six andnine month periods ended March 31, June 30, and September 30, 2010, respectively. As a result, ourconsolidated statement of cash flows for the year ended December 31, 2010 includes a $6.6 billion adjustmentto increase net cash used in operating activities, included within “Other, net,” a $7.0 billion adjustment toincrease net cash provided by investing activities, primarily related to “Purchases of loans held forinvestment,” and a $357 million adjustment to increase net cash used in financing activities. We haveevaluated the effects of these misstatements, both quantitatively and qualitatively, on our three months endedMarch 31, 2010, six months ended June 30, 2010, and nine months ended September 30, 2010 condensedconsolidated statements of cash flows and concluded that these prior periods were not materially misstated.
Restricted Cash
We and our servicers advance payments on delinquent loans to consolidated Fannie Mae MBS trusts. Werecognize the cash advanced as “Restricted cash” in our consolidated balance sheets to the extent suchamounts are due to, but have not yet been remitted to, the MBS certificateholders. In addition, when we or our
F-17
FANNIE MAE(In conservatorship)
NOTES TO CONSOLIDATED FINANCIAL STATEMENTS—(Continued)

servicers collect and hold cash that is due to certain Fannie Mae MBS trusts in advance of our requirement toremit these amounts to the trusts, we recognize the collected cash amounts as “Restricted cash.”
We also recognize “Restricted cash” as a result of restrictions related to certain consolidated partnership fundsas well as for certain collateral arrangements.
Securities Purchased under Agreements to Resell and Securities Sold under Agreements to Repurchase
When securities purchased under agreements to resell or securities sold under agreements to repurchaseresulting from dollar roll transactions do not meet all of the conditions of a secured financing, we account forthe transactions as purchases or sales, respectively. We treat securities purchased under agreements to reselland securities sold under agreements to repurchase as secured financing transactions when all of the conditionshave been met. We record these transactions at the amounts at which the securities will be subsequentlyreacquired or resold, including accrued interest.
Investments in Securities
Securities Classified as Available-for-Sale or Trading
We classify and account for our securities as either available-for-sale (“AFS”) or trading. We measure AFSsecurities at fair value in our consolidated balance sheets, with unrealized gains and losses included in“Accumulated other comprehensive loss” (“AOCI”), net of applicable income taxes. We recognize realizedgains and losses on AFS securities when securities are sold. We calculate the gains and losses using thespecific identification method and record them in “Investment gains (losses), net” in our consolidatedstatements of operations. We measure trading securities at fair value in our consolidated balance sheets withunrealized and realized gains and losses included as a component of “Fair value losses, net” in ourconsolidated statements of operations. We include interest and dividends on securities, including amortizationof the premium and discount at acquisition, in our consolidated statements of operations. When we receivemultiple deliveries of securities on the same day that are backed by the same pools of loans, we calculate thespecific cost of each security as the average price of the trades that delivered those securities. Currently, we donot have any securities classified as held-to-maturity, although we may elect to do so in the future.
We determine fair value using quoted market prices in active markets for identical assets when available. Ifquoted market prices in active markets for identical assets are not available, we use quoted market prices forsimilar securities that we adjust for observable or corroborated (i.e., information purchased from third-partyservice providers) market information. In the absence of observable or corroborated market data, we useinternally developed estimates, incorporating market-based assumptions when such information is available.
Other-Than-Temporary Impairment of Debt Securities
On April 1, 2009, we adopted the FASB modified standard on the model for assessing other-than-temporaryimpairments, applicable to existing and new debt securities held by us as of April 1, 2009. Under this newstandard, an other-than-temporary impairment is considered to have occurred when the fair value of a debtsecurity is below its amortized cost basis and we intend to sell or it is more likely than not that we will berequired to sell the security before recovery. In this case, we recognize in the consolidated statements ofoperations the entire difference between the amortized cost basis of the security and its fair value. Another-than-temporary impairment is also considered to have occurred if we do not expect to recover the entireamortized cost basis of a debt security even if we do not intend or it is not more likely than not we will berequired to sell the security before recovery. In this case, we separate the difference between the amortizedcost basis of the security and its fair value into the amount representing the credit loss, which we recognize inour consolidated statements of operations, and the amount related to all other factors, which we recognize in
F-18
FANNIE MAE(In conservatorship)
NOTES TO CONSOLIDATED FINANCIAL STATEMENTS—(Continued)

“Other comprehensive loss,” net of applicable taxes. In determining whether a credit loss exists, we use ourbest estimate of cash flows expected to be collected from the debt security.
We consider guarantees, insurance contracts or other credit enhancements (such as collateral) in determiningour best estimate of cash flows expected to be collected only if (1) such guarantees, insurance contracts orother credit enhancements provide for payments to be made solely to reimburse us for failure of the issuer tosatisfy its required payment obligations, (2) such guarantees, insurance contracts or other credit enhancementsare contractually attached to the security and (3) collection of the amounts receivable under these agreementsis deemed probable. Guarantees, insurance contracts or other credit enhancements are considered contractuallyattached if they are part of and trade with the security upon transfer of the security to a third party.
In periods after we recognize an other-than-temporary impairment of debt securities, we use the prospectiveinterest method to recognize interest income. Under the prospective interest method, we use the new cost basisand the cash flows expected to be collected from the security to calculate the effective yield.
As a result of adopting the FASB modified standard on the model for assessing other-than-temporaryimpairments, we recorded a cumulative-effect adjustment at April 1, 2009 of $8.5 billion on a pre-tax basis($5.6 billion after tax) to reclassify the noncredit portion of previously recognized other-than-temporaryimpairments from “Accumulated deficit” to AOCI. We also reduced the “Accumulated deficit” and valuationallowance by $3.0 billion for the deferred tax asset related to the amounts previously recognized asother-than-temporary impairments in our consolidated statements of operations based upon the assertion of ourintent and ability to hold certain of these securities until recovery.
Prior to April 1, 2009, we considered a debt security to be other-than-temporarily impaired if its estimated fairvalue was less than its amortized cost basis and we determined that it was probable that we would be unableto collect all of the contractual principal and interest payments or we did not intend to hold the security untilit recovered to its previous carrying amount. In making an other-than-temporary impairment assessment, weconsidered many factors, including the severity and duration of the impairment, recent events specific to theissuer and/or the industry to which the issuer belongs, external credit ratings and recent downgrades, as well asour ability and intent to hold such securities until recovery.
We considered guarantees, insurance contracts or other credit enhancements (such as collateral) in determiningwhether it was probable that we would be unable to collect all amounts due according to the contractual termsof a debt security to the same extent that we currently consider them in estimating expected cash flows. Whenwe determined that it was probable that we would not collect all of the contractual principal and interestamounts due or we determined that we did not have the ability or intent to hold the security until recovery ofan unrealized loss, we identified the security as other-than-temporarily impaired. For all other securities in anunrealized loss position, we had the positive intent and ability to hold such securities until the earlier of fullrecovery or maturity.
When we determined an investment was other-than-temporarily impaired, we wrote down the cost basis of theinvestment to its fair value and included the loss in “Other-than-temporary-impairments” in our consolidatedstatements of operations. The fair value of the investment then became its new cost basis. We did not increasethe investment’s cost basis for subsequent recoveries in fair value, which were recorded in AOCI.
F-19
FANNIE MAE(In conservatorship)
NOTES TO CONSOLIDATED FINANCIAL STATEMENTS—(Continued)

Mortgage Loans
Loans Held for Investment
When we acquire mortgage loans that we have the ability and the intent to hold for the foreseeable future oruntil maturity, we classify the loans as held for investment (“HFI”). When we consolidate a trust, werecognize the loans underlying the trust in our consolidated balance sheet. The trusts do not have the ability tosell mortgage loans and the use of such loans is limited exclusively to the settlement of obligations of thetrusts. Therefore, mortgages acquired when we have the intent to securitize via trusts that are consolidated willgenerally be classified as HFI in our consolidated balance sheets both prior to and subsequent to theirsecuritization. This is consistent with our intent and ability to hold the loans for the foreseeable future or untilmaturity.
We report HFI loans at their outstanding unpaid principal balance adjusted for any deferred and unamortizedcost basis adjustments, including purchase premiums, discounts and other cost basis adjustments. Werecognize interest income on HFI loans on an accrual basis using the interest method, unless we determinethat the ultimate collection of contractual principal or interest payments in full is not reasonably assured.
Historically, mortgage loans held both by us and by consolidated trusts were reported collectively as“Mortgage loans held for investment.” We now report loans held by consolidated trusts as “Mortgage loansheld for investment of consolidated trusts” and those held directly by us as “Mortgage loans held forinvestment of Fannie Mae” in our consolidated balance sheets.
Loans Held for Sale
When we acquire mortgage loans that we intend to sell or securitize via trusts that are not consolidated, weclassify the loans as held for sale (“HFS”). Prior to the adoption of the new accounting standards, we initiallyclassified loans as HFS if they were product types that we actively securitized from our portfolio because wehad the intent, at acquisition, to securitize the loans (either during the month in which the acquisition occurredor during the following month) via a trust that we did not consolidate and for which we sold all or a portionof the resulting securities. At month-end, we reclassified the loans acquired during the month from HFS toHFI, if we had not securitized or were not in the process of securitizing them because we had the intent tohold the loans for the foreseeable future or until maturity.
We report HFS loans at the lower of cost or fair value. Any excess of an HFS loan’s cost over its fair value isrecognized as a valuation allowance, with changes in the valuation allowance recognized as “Investment gains(losses), net” in our consolidated statements of operations. We recognize interest income on HFS loans on anaccrual basis, unless we determine that the ultimate collection of contractual principal or interest payments infull is not reasonably assured. Purchase premiums, discounts and other cost basis adjustments on HFS loansare deferred upon loan acquisition, included in the cost basis of the loan, and not amortized. We determineany lower of cost or fair value adjustment on HFS loans on a pool basis by aggregating those loans based onsimilar risks and characteristics, such as product types and interest rates.
In the event that we reclassify HFS loans to HFI, we record the loans at lower of cost or fair value on the dateof reclassification. We recognize any lower of cost or fair value adjustment recognized upon reclassification asa basis adjustment to the HFI loan.
Nonaccrual Loans
We discontinue accruing interest on single-family and multifamily loans when we believe collectibility ofprincipal or interest is not reasonably assured, unless the loan is well secured and in the process of collectionbased upon an individual loan assessment. When a loan is placed on nonaccrual status, interest previously
F-20
FANNIE MAE(In conservatorship)
NOTES TO CONSOLIDATED FINANCIAL STATEMENTS—(Continued)

accrued but not collected becomes part of our recorded investment in the loan and is collectively reviewed forimpairment. We recognize interest income for loans on non-accrual status when cash is received. If we havedoubt regarding the ultimate collectibility of the remaining recorded investment in a nonaccrual loan, we applyany payment received to reduce principal to the extent necessary to eliminate such doubt. We return a loan toaccrual status when we determine that the collectibility of principal and interest is reasonably assured.
Restructured Loans
A modification to the contractual terms of a loan that results in granting a concession to a borrowerexperiencing financial difficulties is considered a troubled debt restructuring (“TDR”). For single-family loans,we conclude that a concession has been granted to a borrower when we determine that the effective yieldbased on the restructured loan term is less than the effective yield prior to the modification. For multifamilyloans, we consider other factors to determine if a concession has been granted to the borrower, such aswhether the modified loan terms represent a market rate of return relative to the risk profile of the borrower.We measure impairment of a loan restructured in a TDR individually based on the excess of the recordedinvestment in the loan over the present value of the expected future cash inflows discounted at the loan’soriginal effective interest rate. Costs incurred to effect a TDR are expensed as incurred.
A loan modification for reasons other than a borrower experiencing financial difficulties or that results interms at least as favorable to us as the terms for comparable loans to other customers with similar credit riskswho are not refinancing or restructuring a loan is not considered a TDR. We further evaluate such a loanmodification to determine whether the modification is considered more than minor. If the modification isconsidered more than minor and the modified loan is not subject to the accounting requirements for acquiredcredit-impaired loans, we treat the modification as an extinguishment of the previously recorded loan and therecognition of a new loan. We recognize any unamortized basis adjustments on the previously recorded loanimmediately in “Interest income” in our consolidated statements of operations. We account for a minormodification as a continuation of the previously recorded loan.
Loans Purchased or Eligible to be Purchased from Trusts
For our single-class securitization trusts that include a Fannie Mae guaranty, we have the option to purchase aloan from the trust after four or more consecutive monthly payments due under the loan are delinquent inwhole or in part. With respect to single-family mortgage loans in trusts with issue dates on or after January 1,2009, we also have the option to purchase a loan from the trust after the loan has been delinquent for at leastone monthly payment, if the delinquency has not been fully cured on or before the next payment date (that is,30 days delinquent), and it is determined that it is appropriate to execute loss mitigation activity that is notpermissible while the loan is held in a trust. Fannie Mae, as guarantor or as issuer, may also purchasemortgage loans when other pre-defined contingencies have been met, such as when there is a material breachof a seller’s representation and warranty. Under long-term standby commitments, we purchase credit-impairedloans from lenders when the loans subject to these commitments meet certain delinquency criteria. Thisarrangement also allows the lender to deliver qualified loans in exchange for our guaranteed Fannie MaeMBS.
When we purchase mortgage loans from consolidated trusts, we reclassify the loans from “Mortgage loansheld for investment of consolidated trusts” to “Mortgage loans held for investment by Fannie Mae” and, uponsettlement, we record an extinguishment of the corresponding portion of the debt of the consolidated trusts.
For unconsolidated trusts and long-term standby commitments, loans that are credit impaired at the time ofacquisition are recorded at the lower of their acquisition cost (unpaid principal balance plus accrued interest)or fair value. A loan is considered credit impaired at acquisition when there is evidence of credit deteriorationsubsequent to the loan’s origination and it is probable, at acquisition, that we will be unable to collect all
F-21
FANNIE MAE(In conservatorship)
NOTES TO CONSOLIDATED FINANCIAL STATEMENTS—(Continued)

contractually required payments receivable (ignoring insignificant delays in contractual payments). We recordeach acquired loan that does not meet these criteria at its acquisition cost.
For unconsolidated trusts where we are considered the transferor, we recognize the loan in our consolidatedbalance sheets at fair value and record a corresponding liability to the unconsolidated trust when thecontingency on our option to purchase the loan from the trust has been met and we regain effective controlover the transferred loan.
We base our estimate of the fair value of delinquent loans purchased from unconsolidated trusts or long-termstandby commitments upon an assessment of what a market participant would pay for the loan at the date ofacquisition. We utilize indicative market prices from large, experienced dealers to estimate the initial fair valueof delinquent loans purchased from unconsolidated trusts or long-term standby commitments. We consideracquired credit-impaired loans to be individually impaired at acquisition, and no valuation allowance isestablished or carried over. We record the excess of the loan’s acquisition cost over its fair value as a charge-off against our “Reserve for guaranty losses” at acquisition. We recognize any subsequent decreases inestimated future cash flows to be collected subsequent to acquisition as impairment losses through our“Allowance for loan losses.”
We place credit-impaired loans that we acquire from unconsolidated trusts or long-term standby commitmentson nonaccrual status at acquisition in accordance with our nonaccrual policy. If we subsequently determinethat the collectibility of principal and interest is reasonably assured, we return the loan to accrual status. Wedetermine the initial accrual status of acquired loans that are not credit impaired in accordance with ournonaccrual policy. Accordingly, we place loans purchased from trusts under other contingent call options onaccrual status at acquisition if they are current or if there has been only an insignificant delay in payment andthere are no other facts and circumstances that would lead us to conclude that the collection of principal andinterest is not reasonably assured.
When an acquired credit-impaired loan is returned to accrual status, the portion of the expected cash flowsincorporating changes in the timing and amount that are associated with credit and prepayment events thatexceeds the recorded investment in the loan is accreted into interest income over the expected remaining lifeof the loan. We prospectively recognize increases in future cash flows expected to be collected as interestincome over the remaining expected life of the loan through a yield adjustment. If we subsequently refinanceor restructure an acquired credit-impaired loan, other than through a TDR, the loan is not accounted for as anew loan but continues to be accounted for under the accounting standard for acquired credit-impaired loans.
Allowance for Loan Losses and Reserve for Guaranty Losses
The allowance for loan losses is a valuation allowance that reflects an estimate of incurred credit losses relatedto our recorded investment in both single-family and multifamily HFI loans. This population includes bothHFI loans held by Fannie Mae and by consolidated Fannie Mae MBS trusts. The reserve for guaranty losses isa liability account in our consolidated balance sheets that reflects an estimate of incurred credit losses relatedto our guaranty to each unconsolidated Fannie Mae MBS trust that we will supplement amounts received bythe Fannie Mae MBS trust as required to permit timely payments of principal and interest on the relatedFannie Mae MBS and our agreements to purchase credit-impaired loans from lenders under the terms of ourlong-term standby commitments. As a result, the guaranty reserve considers not only the principal and interestdue on the loan at the current balance sheet date, but also any additional interest payments due to the trustfrom the current balance sheet date until the point of loan acquisition or foreclosure. We recognize incurredlosses by recording a charge to the “Provision for loan losses” or the “Provision for guaranty losses” in ourconsolidated statements of operations.
F-22
FANNIE MAE(In conservatorship)
NOTES TO CONSOLIDATED FINANCIAL STATEMENTS—(Continued)

Single-Family Loans
Credit losses related to groups of similar single-family HFI loans that are not individually impaired arerecognized when (1) available information as of each balance sheet date indicates that it is probable a loss hasoccurred and (2) the amount of the loss can be reasonably estimated. We aggregate single-family loans (exceptfor those that are deemed to be individually impaired), based on similar risk characteristics for purposes ofestimating incurred credit losses and establish a collective single-family loss reserve using an econometricmodel that derives an overall loss reserve estimate given multiple factors which include but are not limited to:origination year; loan product type; mark-to-market loan-to-value (“LTV”) ratio; and delinquency status. Onceloans are aggregated, there typically is not a single, distinct event that would result in an individual loan orpool of loans being impaired. Accordingly, to determine an estimate of incurred credit losses, we base ourallowance and reserve methodology on historical events and trends, such as loss severity, default rates, andrecoveries from mortgage insurance contracts and other credit enhancements that provide loan level losscoverage and are either contractually attached to a loan or that were entered into contemporaneous with and incontemplation of a guaranty or loan purchase transaction. Our allowance calculation also incorporates a lossconfirmation period (the anticipated time lag between a credit loss event and the confirmation of the creditloss resulting from that event) to ensure our allowance estimate captures credit losses that have been incurredas of the balance sheet date but have not been confirmed. In addition, management performs a review of theobservable data used in its estimate to ensure it is representative of prevailing economic conditions and otherevents existing as of the balance sheet date.
We record charge-offs as a reduction to the allowance for loan losses or reserve for guaranty losses whenlosses are confirmed through the receipt of assets, such as cash in a preforeclosure sale or the underlyingcollateral in full satisfaction of the mortgage loan upon foreclosure. The excess of a loan’s unpaid principalbalance, accrued interest, and any applicable cost basis adjustments (“our total exposure”) over the fair valueof the assets received in full satisfaction of the loan is treated as a charge-off loss that is deducted from theallowance for loan losses or reserve for guaranty losses. Any excess of the fair value of the assets received infull satisfaction over our total exposure at charge-off is applied first to recover any forgone, yet contractuallypast due interest (for mortgage loans recognized in our consolidated balance sheets), and then to “Foreclosedproperty expense” in our consolidated statements of operations. We also apply estimated proceeds fromprimary mortgage insurance or other credit enhancements that provide loan level loss coverage and are eithercontractually attached to a loan or that were entered into contemporaneous with and in contemplation of aguaranty or loan purchase transaction as a recovery of our total exposure, up to the amount of loss recognizedas a charge-off. We record proceeds from credit enhancements in excess of our total exposure in “Foreclosedproperty expense” in our consolidated statements of operations when received.
Individually Impaired Single-Family Loans
We consider a loan to be impaired when, based on current information, it is probable that we will not receiveall amounts due, including interest, in accordance with the contractual terms of the loan agreement. Whenmaking our assessment as to whether a loan is impaired, we also take into account more than insignificantdelays in payment and shortfalls in amount received. Determination of whether a delay in payment or shortfallin amount is more than insignificant requires management’s judgment as to the facts and circumstancessurrounding the loan.
Individually impaired single-family loans currently include those restructured in a TDR and acquired credit-impaired loans. Our measurement of impairment on an individually impaired loan follows the method that ismost consistent with our expectations of recovery of our recorded investment in the loan. When a loan hasbeen restructured, we measure impairment using a cash flow analysis discounted at the loan’s originaleffective interest rate. If we expect to recover our recorded investment in an individually impaired loan
F-23
FANNIE MAE(In conservatorship)
NOTES TO CONSOLIDATED FINANCIAL STATEMENTS—(Continued)
through probable foreclosure of the underlying collateral, we measure impairment based on the fair value ofthe collateral, reduced by estimated disposal costs on a discounted basis and adjusted for estimated proceedsfrom mortgage, flood, or hazard insurance or similar sources.
We use internal models to project cash flows used to assess impairment of individually impaired loans,including acquired credit-impaired loans. We generally update the market and loan characteristic inputs we usein these models monthly, using month-end data. Market inputs include information such as interest rates,volatility and spreads, while loan characteristic inputs include information such as mark-to-market LTV ratiosand delinquency status. The loan characteristic inputs are key factors that affect the predicted rate of defaultfor loans evaluated for impairment through our internal cash flow models. We evaluate the reasonableness ofour models by comparing the results with actual performance and our assessment of current market conditions.In addition, we review our models at least annually for reasonableness and predictive ability in accordancewith our corporate model review policy. Accordingly, we believe the projected cash flows generated by ourmodels that we use to assess impairment appropriately reflect the expected future performance of the loans.
Multifamily Loans
We identify multifamily loans for evaluation for impairment through a credit risk classification process andindividually assign them a risk rating. Based on this evaluation, we determine for loans that are not inhomogeneous pools whether or not a loan is individually impaired. If we deem a multifamily loan to beindividually impaired, we generally measure impairment on that loan based on the fair value of the underlyingcollateral less estimated costs to sell the property on a discounted basis. If we determine that an individualloan that was specifically evaluated for impairment is not individually impaired, we include the loan as part ofa pool of loans with similar characteristics that are evaluated collectively for incurred losses.
We stratify multifamily loans into different risk rating categories based on the credit risk inherent in eachindividual loan. We categorize credit risk based on relevant observable data about a borrower’s ability to pay,including reviews of current borrower financial information, operating statements on the underlying collateral,historical payment experience, collateral values when appropriate, and other related credit documentation.Multifamily loans that are categorized into pools based on their relative credit risk ratings are assigned certaindefault and severity factors representative of the credit risk inherent in each risk category. We apply thesefactors against our recorded investment in the loans, including recorded accrued interest associated with suchloans, to determine an appropriate allowance. As part of our allowance process for multifamily loans, we alsoconsider other factors based on observable data such as historical charge-off experience, loan size and trendsin delinquency. In addition, we consider any loss sharing arrangements with our lenders.
Advances to Lenders
Advances to lenders represent payments of cash in exchange for the receipt of mortgage loans from lenders ina transfer that is accounted for as a secured lending arrangement. These transfers primarily occur when weprovide early funding to lenders for loans that they will subsequently either sell to us or securitize into aFannie Mae MBS that they will deliver to us. We individually negotiate early lender funding advances withour lender customers. Early lender funding advances have terms up to 60 days and earn a short-term marketrate of interest. In other cases, the transfers are of loans that the lender has the unilateral ability to repurchasefrom us.
We report cash outflows from advances to lenders as an investing activity in our consolidated statements ofcash flows. Settlements of the advances to lenders, other than through lender repurchases of loans, are notcollected in cash, but rather in the receipt of either loans or Fannie Mae MBS. Accordingly, this activity isreflected as a non-cash transfer in our consolidated statements of cash flows. Currently, in our consolidatedstatements of cash flows, we include advances settled through receipt of securities in the line item entitled
F-24
FANNIE MAE(In conservatorship)
NOTES TO CONSOLIDATED FINANCIAL STATEMENTS—(Continued)
“Transfers from advances to lenders to investments in securities” or, if the security is issued from aconsolidated Fannie Mae MBS trust, in the line item entitled “Transfers from advances to lenders to loans heldfor investment of consolidated trusts.”
Acquired Property, Net
“Acquired property, net” includes foreclosed property and any receivable outstanding on preforeclosure salesreceived in full satisfaction of a loan. We recognize foreclosed property upon the earlier of the loanforeclosure event or when we take physical possession of the property (i.e., through a deed-in-lieu offoreclosure transaction). We initially measure foreclosed property at its fair value less its estimated costs tosell. We treat any excess of our recorded investment in the loan over the fair value less estimated costs to sellthe property as a charge-off to the “Allowance for loan losses.” Any excess of the fair value less estimatedcosts to sell the property over our recorded investment in the loan is recognized first to recover any forgone,contractually due interest, then to “Foreclosed property expense” in our consolidated statements of operations.
Foreclosed properties that we intend to sell and are actively marketing and that are available for immediatesale in their current condition such that the sale is reasonably expected to take place within one year areclassified as held for sale. We report these properties at the lower of their carrying amount or fair value lessestimated selling costs, on a discounted basis if the sale is expected to occur beyond one year from the date offoreclosure. We do not depreciate these properties.
We determine the fair value of our foreclosed properties using third-party appraisals, when available. Whenthird-party appraisals are not available, we estimate fair value based on factors such as prices for similarproperties in similar geographical areas and/or assessment through observation of such properties. Werecognize a loss for any subsequent write-down of the property to its fair value less its estimated costs to sellthrough a valuation allowance with an offsetting charge to “Foreclosed property expense” in our consolidatedstatements of operations. We recognize a recovery for any subsequent increase in fair value less estimatedcosts to sell up to the cumulative loss previously recognized through the valuation allowance. We recognizegains or losses on sales of foreclosed property through “Foreclosed property expense” in our consolidatedstatements of operations.
Properties that we do not intend to sell or that are not ready for immediate sale in their current condition areclassified separately as held for use, are depreciated and are evaluated for impairment when circumstancesindicate that the carrying amount of the property is no longer recoverable. Properties classified as held for useare recorded in “Other assets” in our consolidated balance sheets.
Guaranty Accounting
Our primary guaranty transactions result from mortgage loan securitizations in which we issue Fannie MaeMBS. The majority of our Fannie Mae MBS issuances fall within two broad categories: (1) lender swaptransactions, where a lender delivers mortgage loans to us to deposit into a trust in exchange for ourguaranteed Fannie Mae MBS backed by those mortgage loans and (2) portfolio securitizations, where wesecuritize loans that were previously included in our consolidated balance sheets, and create guaranteed FannieMae MBS backed by those loans. As guarantor, we guaranty to each MBS trust that we will supplementamounts received by the MBS trust as required to permit timely payments of principal and interest on therelated Fannie Mae MBS. This obligation represents an obligation to stand ready to perform over the term ofthe guaranty. Therefore, our guaranty exposes us to credit losses on the loans underlying Fannie Mae MBS.
The majority of our guaranty obligations have historically arisen from lender swap transactions. In a lenderswap transaction, we receive a monthly guaranty fee for our unconditional guaranty to the Fannie Mae MBStrust. The guaranty fee we receive varies depending on factors such as the risk profile of the securitized loans
F-25
FANNIE MAE(In conservatorship)
NOTES TO CONSOLIDATED FINANCIAL STATEMENTS—(Continued)
and the level of credit risk we assume. In lieu of charging a higher guaranty fee for loans with greater creditrisk, we may require that the lender pay an upfront fee to compensate us for assuming additional credit risk.We refer to this payment as a risk-based pricing adjustment. In addition, we may charge a lower guaranty feeif the lender assumes a portion of the credit risk through recourse or other risk-sharing arrangements. We referto these arrangements as credit enhancements. We also adjust the monthly guaranty fee so that the pass-through coupon rates on Fannie Mae MBS are in more easily tradable increments of a whole or half percentby making an upfront payment to the lender (“buy-up”) or receiving an upfront payment from the lender(“buy-down”).
Upon adoption of the new accounting standards on the transfer of financial assets and the consolidation ofVIE’s on January 1, 2010, we consolidated most of the single-class securitization trusts that are issued underour guaranty accounting programs. As such, a significant portion of our guaranty-related assets and liabilitieshave been derecognized from our consolidated balance sheet.
For those trusts that are not consolidated, we initially recognize a liability for the fair value of our obligationto stand ready to perform over the term of the guaranty as a component of “Other liabilities” in ourconsolidated balance sheets. We also record an offsetting asset (a retained interest for portfolio securitizations)that represents the present value of cash flows expected to be received as compensation over the life of theguaranty as a component of “Other assets.”
For lender swap transactions, we initially recognize our guaranty obligation at fair value using the transactionprice, as a practical expedient, upon initial recognition. Specifically, we estimate the compensation that wewould require to issue the same guaranty in a standalone arm’s-length transaction with an unrelated party.Because the fair value of those guaranty obligations equals the fair value of the total compensation we receive,we do not recognize losses or record deferred profit in our consolidated financial statements at inception ofour guaranty contracts. As such, all upfront cash received for buy-downs and risk-based price adjustments areincluded as a component of our guaranty obligation at inception.
For portfolio securitizations, we initially recognize our guaranty obligation at fair value using an estimate of ahypothetical transaction price that we would receive if we were to issue our guaranty to an unrelated party in astandalone arm’s-length transaction at the measurement date. We recognize any difference between the fairvalue of the guaranty asset and the fair value of the guaranty obligation as a component of the gain or loss onthe sale of mortgage-related assets and record the difference as “Investment gains (losses), net” in ourconsolidated statements of operations.
Subsequent to initial recognition, we account for the guaranty asset on lender swap transactions at amortizedcost. As we collect monthly guaranty fees, we reduce guaranty assets to reflect cash payments received andrecognize imputed interest income on guaranty assets as a component of “Guaranty fee income” under theprospective interest method. We reduce the corresponding guaranty obligation in proportion to the reduction inguaranty assets and recognize this reduction in our consolidated statements of operations as an additionalcomponent of “Guaranty fee income.” We assess guaranty assets for other-than-temporary impairment basedon changes in our estimate of the cash flows to be received. When we determine a guaranty asset isother-than-temporarily impaired, we write down the cost basis of the guaranty asset to its fair value andinclude the amount written-down in “Guaranty fee income” in our consolidated statements of operations. Anyother-than-temporary impairment recorded on guaranty assets results in a proportionate reduction in thecorresponding guaranty obligations. For portfolio securitizations, we subsequently account for the retainedguarantee asset in the same manner as a trading security, with unrealized gains and losses included in“Guaranty fee income” in our consolidated statements of operations.
We record buy-ups in our consolidated balance sheets at fair value in “Other assets.” We subsequently accountfor buy-ups in the same manner as a trading security.
F-26
FANNIE MAE(In conservatorship)
NOTES TO CONSOLIDATED FINANCIAL STATEMENTS—(Continued)

We account for our guaranty related to a long term standby commitment in the same manner as our guarantyresulting from an unconsolidated lender swap transaction as described above.
In addition to our guaranty assets and obligations, we recognize a liability for estimable and probable lossesfor the credit risk we assume on loans underlying Fannie Mae MBS and long term standby commitmentsbased on management’s estimate of probable losses incurred on those loans as of each balance sheet date. Werecord this contingent liability in our consolidated balance sheets as “Reserve for guaranty losses.”
Fannie Mae MBS included in “Investments in securities”
When we own unconsolidated Fannie Mae MBS, we do not derecognize any components of the guarantyassets, guaranty obligations, reserve for guaranty losses, or any other outstanding recorded amounts associatedwith the guaranty transaction because our contractual obligation to the MBS trust remains in force until thetrust is liquidated. We value Fannie Mae MBS based on their legal terms, which includes the Fannie Maeguaranty to the MBS trust, and continue to reflect the unamortized obligation to stand ready to perform overthe term of our guaranty and any incurred credit losses in our “Other liabilities” and “Reserve for guarantylosses,” respectively. We disclose the aggregate amount of Fannie Mae MBS held as “Investments insecurities” in our consolidated balance sheets as well as the amount of our “Reserve for guaranty losses” and“Other liabilities” that relates to Fannie Mae MBS held as “Investments in securities.” Upon subsequent saleof a Fannie Mae MBS, we continue to account for any outstanding recorded amounts associated with theguaranty transaction on the same basis of accounting as prior to the sale of Fannie Mae MBS, as no newassets were retained and no new liabilities have been assumed upon the subsequent sale.
Credit Enhancements
Credit enhancements that we recognize separately as “Other assets” in our consolidated balance sheets areamortized in our consolidated statements of operations as “Other expenses.” We amortize these assets at thegreater of amounts calculated (1) commensurate with the observed decline in the unpaid principal balance ofcovered mortgage loans or (2) on a straight-line basis over a credit enhancement’s contract term. We recordrecurring insurance premiums at the amount paid and amortize them over their contractual life.
Amortization of Cost Basis Adjustments
We amortize cost basis adjustments, including premiums and discounts on mortgage loans and securities, as ayield adjustment using the interest method over the contractual or estimated life of the loan or security. Weamortize these cost basis adjustments into interest income for mortgage securities and for loans we classify asHFI. We do not amortize cost basis adjustments for loans that we classify as HFS, but include them in thecalculation of the gain or loss on the sale of those loans.
F-27
FANNIE MAE(In conservatorship)
NOTES TO CONSOLIDATED FINANCIAL STATEMENTS—(Continued)

The following table displays unamortized premiums, discounts, and other cost basis adjustments included inour consolidated balances sheets as of December 31, 2010 and 2009, that may result in net interest income inour consolidated statements of operations in future periods.
2010 2009As of December 31,
(Dollars in millions)
Of Fannie Mae:
Investments in securities:
Unamortized premiums and other cost basis adjustments, net . . . . . . . . . . . . . . . . $ 938 $ 1,185
Other-than-temporary impairments(1). . . . . . . . . . . . . . . . . . . . . . . . . . . . . . . . . (3,057) (821)
Mortgage loans held-for-investment:
Unamortized discounts and other cost basis adjustments of loans in portfolio, net,excluding acquired credit-impaired loans and hedged mortgage assets(2) . . . . . . (17,056) (10,332)
Unamortized discount on acquired credit-impaired loans(3) . . . . . . . . . . . . . . . . . (3,240) (11,467)
Unamortized premium on hedged mortgage assets(4) . . . . . . . . . . . . . . . . . . . . . . 598 806
Other assets(5) . . . . . . . . . . . . . . . . . . . . . . . . . . . . . . . . . . . . . . . . . . . . . . . . . . . . (88) (254)
Total . . . . . . . . . . . . . . . . . . . . . . . . . . . . . . . . . . . . . . . . . . . . . . . . . . . . . . . . $(21,905) $(20,883)
Of consolidated trusts:
Unamortized premiums, net in loans of consolidated trusts . . . . . . . . . . . . . . . . . $ 11,785
Unamortized premiums, net in debt of consolidated trusts . . . . . . . . . . . . . . . . . . (16,803)
Net unamortized premiums from consolidations. . . . . . . . . . . . . . . . . . . . . . . . . . . $ (5,018)
(1) Represents the increase in expected cash flows since original impairment that we currently expect will be recorded asinterest income in future periods. This amount is calculated as the excess of expected cash flows, discounted at theinternal rate of return at acquisition, over the amortized cost basis of the security. To reduce costs associated withmaintaining our internal model and decrease the operational risk, in the fourth quarter of 2010, we ceased to use ourinternally developed model and began using a third-party model as the source for cash flows used to assessother-than-temporary impairments on Alt-A and subprime private-label securities. This model change resulted in morefavorable cash flow estimates that, based on estimates as of December 31, 2010, increased the amount that we willrecognize prospectively as interest income over the remaining life of the securities by $2.5 billion.
(2) Includes the unamortized balance of the fair value discounts that were recorded upon acquisition of credit-impairedloans that have been subsequently modified as TDRs, which accretes into interest income for TDRs that are placed onaccrual status.
(3) Represents the unamortized balance of the fair value discounts that were recorded upon acquisition and consolidationthat may accrete into interest income for acquired credit-impaired loans that are placed on accrual status.
(4) Represents the net premium on mortgage assets designated for hedge accounting that are attributable to changes ininterest rates and will be amortized through interest income over the life of the hedged assets.
(5) Represents the fair value discount related to unsecured HomeSaver Advance loans that will accrete into interestincome based on the contractual terms of the loans for loans on accrual status.
We have elected to use the contractual payment terms to determine the amortization of cost basis adjustmentson mortgage loans and mortgage securities initially recognized on or after January 1, 2010 in our consolidatedbalance sheets.
For substantially all mortgage loans and mortgage securities initially recorded on or before December 31,2009, we use prepayment estimates in determining the periodic amortization of cost basis adjustments underthe interest method using a constant effective yield. For those mortgage loans and mortgage securities forwhich we did not estimate prepayments, we used the contractual payment terms of the loan or security to
F-28
FANNIE MAE(In conservatorship)
NOTES TO CONSOLIDATED FINANCIAL STATEMENTS—(Continued)

apply the interest method. When we anticipate prepayments for the application of the interest method tomortgage loans initially recognized before January 1, 2010, we aggregate individual mortgage loans basedupon coupon rate, product type and origination year and consider Fannie Mae MBS to be aggregations ofsimilar loans for the purpose of estimating prepayments. We also recalculate the constant effective yield eachreporting period to reflect the actual payments and prepayments we have received to date and our newestimate of future prepayments. We then adjust our net investment in the mortgage loans and mortgagesecurities to the amount the investment would have been had we applied the recalculated constant effectiveyield since their acquisition, with a corresponding charge or credit to interest income.
We cease amortization of cost basis adjustments during periods in which we are not recognizing interestincome on a loan because the collection of the principal and interest payments is not reasonably assured (thatis, when the loan is placed on nonaccrual status).
Other Investments
We primarily account for unconsolidated investments in limited partnerships under the equity method ofaccounting. These investments include our LIHTC and other partnership investments. Under the equitymethod, we increase or decrease our investment for our share of the limited partnership’s net income or lossreflected in “Losses from partnership investments” in our consolidated statements of operations. Theseinvestments are included as “Other assets” in our consolidated balance sheets. We periodically review ourinvestments to determine if an other-than-temporary loss in value has occurred.
Commitments to Purchase and Sell Mortgage Loans and Securities
We enter into commitments to purchase and sell mortgage-backed securities and to purchase single-family andmultifamily mortgage loans. Commitments to purchase or sell some mortgage-backed securities and topurchase single-family mortgage loans are generally accounted for as derivatives. Our commitments topurchase multifamily loans are not accounted for as derivatives because they do not meet the criteria for netsettlement.
For those commitments that we account for as derivatives, we report them in our consolidated balance sheetsat fair value in “Other assets” or “Other liabilities” and include changes in their fair value in “Fair valuelosses, net” in our consolidated statements of operations. When derivative purchase commitments settle, weinclude the fair value on the settlement date in the cost basis of the loan or unconsolidated security wepurchase. When derivative commitments to sell securities settle, we include the fair value of the commitmenton the settlement date in the cost basis of the security we sell. Purchases and sales of securities issued by ourconsolidated MBS trusts are treated as extinguishment or issuance of debt, respectively. For commitments topurchase and sell securities issued by our consolidated MBS trusts, we recognize the fair value of thecommitment on the settlement date as a component of debt extinguishment gains and losses or in the costbasis of the debt issued, respectively.
Regular-way securities trades provide for delivery of securities within the time generally established byregulations or conventions in the market in which the trade occurs and are exempt from application of thederivative accounting literature. Commitments to purchase or sell securities that we account for on a trade-datebasis are also exempt from the derivative accounting requirements. We record the purchase and sale of anexisting security on its trade date when the commitment to purchase or sell the existing security settles withinthe period of time that is customary in the market in which those trades take place.
Additionally, contracts for the forward purchase or sale of when-issued and to-be-announced (“TBA”)securities are exempt from the derivative accounting requirements if there is no other way to purchase or sellthat security, delivery of that security and settlement will occur within the shortest period possible for that
F-29
FANNIE MAE(In conservatorship)
NOTES TO CONSOLIDATED FINANCIAL STATEMENTS—(Continued)

type of security, and it is probable at inception and throughout the term of the individual contract that physicaldelivery of the security will occur. Since our commitments for the purchase of when-issued and TBAsecurities can be net settled and we do not document that physical settlement is probable, we account for allsuch commitments as derivatives.
Commitments to purchase securities that we do not account for as derivatives and do not require trade-dateaccounting are accounted for as forward contracts to purchase securities. We designate these commitments asAFS or trading at inception and account for them in a manner consistent with that category of securities.
Derivative Instruments
We recognize all derivatives as either assets or liabilities in our consolidated balance sheets at their fair valueon a trade date basis. We report derivatives in a gain position after offsetting by counterparty in “Other assets”and derivatives in a loss position after offsetting by counterparty in “Other liabilities” in our consolidatedbalance sheets.
We offset the carrying amounts of derivatives (other than commitments) that are in gain positions and losspositions with the same counterparty, as well as cash collateral receivables and payables associated withderivative positions in master netting arrangements. We offset these amounts because the derivative contractshave determinable amounts, we have the legal right to offset amounts with each counterparty, that right isenforceable by law, and we intend to offset the amounts to settle the contracts.
We determine fair value using quoted market prices in active markets when available. If quoted market pricesare not available for particular derivatives, we use quoted market prices for similar derivatives that we adjustfor directly observable or corroborated (i.e., information purchased from third-party service providers) marketinformation. In the absence of observable or corroborated market data, we use internally-developed estimates,incorporating market-based assumptions wherever such information is available. For derivatives (other thancommitments), we use a mid-market price when there is a spread between a bid and ask price.
We evaluate financial instruments that we purchase or issue and other financial and non-financial contracts forembedded derivatives. To identify embedded derivatives that we must account for separately, we determine if:(1) the economic characteristics of the embedded derivative are not clearly and closely related to the economiccharacteristics of the financial instrument or other contract; (2) the financial instrument or other contract (i.e.,the hybrid contract) itself is not already measured at fair value with changes in fair value included in earnings;and (3) a separate instrument with the same terms as the embedded derivative would meet the definition of aderivative. If the embedded derivative meets all three of these conditions we elect to carry the hybrid financialinstrument in its entirety at fair value with changes in fair value recorded in earnings.
Collateral
We enter into various transactions where we pledge and accept collateral, the most common of which are ourderivative transactions. Required collateral levels vary depending on the credit rating and type of counterparty.We also pledge and receive collateral under our repurchase and reverse repurchase agreements. In order toreduce potential exposure to repurchase counterparties, a third-party custodian typically maintains thecollateral and any margin. We monitor the fair value of the collateral received from our counterparties, and wemay require additional collateral from those counterparties, as we deem appropriate. Collateral received underearly funding agreements with lenders, whereby we advance funds to lenders prior to the settlement of asecurity commitment, must meet our standard underwriting guidelines for the purchase or guarantee ofmortgage loans.
F-30
FANNIE MAE(In conservatorship)
NOTES TO CONSOLIDATED FINANCIAL STATEMENTS—(Continued)
Cash Collateral
We record cash collateral accepted from a counterparty that we have the right to use as “Cash and cashequivalents” and cash collateral accepted from a counterparty that we do not have the right to use as“Restricted cash” in our consolidated balance sheets. We net our obligation to return cash collateral pledged tous against the fair value of derivatives in a gain position recorded in “Other assets” in our consolidatedbalance sheets as part of our counterparty netting calculation.
For derivative positions with the same counterparty under master netting arrangements where we pledge cashcollateral, we remove it from “Cash and cash equivalents” and net the right to receive it against the fair valueof derivatives in a loss position recorded in “Other liabilities” in our consolidated balance sheets as a part ofour counterparty netting calculation.
The following table displays cash collateral accepted and pledged as of December 31, 2010 and 2009.
2010 2009As of December 31,
(Dollars in millions)
Cash collateral accepted(1) . . . . . . . . . . . . . . . . . . . . . . . . . . . . . . . . . . . . . . . . . . . . . . . $3,101 $ 4,052
Cash collateral pledged . . . . . . . . . . . . . . . . . . . . . . . . . . . . . . . . . . . . . . . . . . . . . . . . . $5,884 $ 5,434
Cash collateral pledged related to derivatives activities . . . . . . . . . . . . . . . . . . . . . . . . . . . 3,453 5,437
Total cash collateral pledged . . . . . . . . . . . . . . . . . . . . . . . . . . . . . . . . . . . . . . . . . . . . $9,337 $10,871
(1) Includes restricted cash of $2.5 billion and $3.0 billion as of December 31, 2010 and 2009, respectively.
Non-Cash Collateral
We classify securities pledged to counterparties as either “Investments in securities” or “Cash and cashequivalents” in our consolidated balance sheets. Securities pledged to counterparties that have beenconsolidated with the underlying assets recognized as loans are included as “Mortgage loans” in ourconsolidated balance sheets. The following table displays non-cash collateral pledged and accepted as ofDecember 31, 2010 and 2009.
2010 2009As of December 31,
(Dollars in millions)
Non-cash collateral pledged where the secured party has the right to sell or repledge:
Available-for-sale securities . . . . . . . . . . . . . . . . . . . . . . . . . . . . . . . . . . . . . . . . . . . . $ — $1,148
Held-for-investment loans of consolidated trusts . . . . . . . . . . . . . . . . . . . . . . . . . . . . . . 2,522 1,947
Non-cash collateral accepted with the right to sell or repledge(1) . . . . . . . . . . . . . . . . . . . . $7,500 $ 67
Non-cash collateral accepted without the right to sell or repledge . . . . . . . . . . . . . . . . . . . . 6,744 6,285
(1) None of this collateral was sold or repledged as of December 31, 2010 and 2009.
Additionally, we provide early funding to lenders on a collateralized basis and account for the advances assecured lending arrangements. We recognized $7.2 billion and $5.4 billion funded to lenders in “Other assets”in our consolidated balance sheets as of December 31, 2010 and 2009, respectively.
Our liability to third-party holders of Fannie Mae MBS that arises as the result of a consolidation of asecuritization trust is collateralized by the underlying loans and/or mortgage-related securities.
F-31
FANNIE MAE(In conservatorship)
NOTES TO CONSOLIDATED FINANCIAL STATEMENTS—(Continued)

When securities sold under agreements to repurchase meet all of the conditions of a secured financing, wereport the collateral of the transferred securities at fair value, excluding accrued interest. The fair value ofthese securities is classified in “Investments in securities” in our consolidated balance sheets. We had$49 million in repurchase agreements outstanding as of December 31, 2010. We had no such repurchaseagreements outstanding as of December 31, 2009.
Debt
Our consolidated balance sheets contain debt of Fannie Mae as well as debt of consolidated trusts. We classifyour outstanding debt as either short-term or long-term based on the initial contractual maturity. Prior toJanuary 1, 2010, we reported debt issued both by us and by consolidated trusts collectively as either “Short-term debt” or “Long-term debt” in our consolidated balance sheets. Effective January 1, 2010, the debt ofconsolidated trusts is reported as either “Short-term debt of consolidated trusts” or “Long-term debt ofconsolidated trusts,” and represents the amount of Fannie Mae MBS issued from such trusts and held by third-party certificateholders. Debt issued by us is reported as either “Short-term debt of Fannie Mae” or “Long-term debt of Fannie Mae,” and represents debt that we issue to third parties to fund our general businessactivities. The debt of consolidated trusts is prepayable without penalty at any time. We report deferred items,including premiums, discounts and other cost basis adjustments, as adjustments to the related debt balances inour consolidated balance sheets. We remeasure the carrying amount, accrued interest and basis adjustments ofdebt denominated in a foreign currency into U.S. dollars using foreign exchange spot rates as of the balancesheet dates and report any associated gains or losses as “Debt foreign exchange gains (losses), net” which is acomponent of “Fair value losses, net” in our consolidated statements of operations.
We classify interest expense as either short-term or long-term based on the contractual maturity of the relateddebt. We recognize the amortization of premiums, discounts and other cost basis adjustments through interestexpense using the effective interest method usually over the contractual term of the debt. Amortization ofpremiums, discounts and other cost basis adjustments begins at the time of debt issuance. We remeasureinterest expense for debt denominated in a foreign currency into U.S. dollars using the daily spot rates. Thedifference in rates arising from the month-end spot exchange rate used to calculate the interest accruals andthe daily spot rates used to record the interest expense is a foreign currency transaction gain or loss for theperiod and is recognized as “Debt foreign exchange gains (losses), net” which is a component of “Fair valuelosses, net” in our consolidated statements of operations.
When we purchase a Fannie Mae MBS issued from a consolidated single-class securitization trust, weextinguish the related debt of the consolidated trust as the MBS debt is no longer owed to a third-party. Werecord debt extinguishment gains or losses related to debt of consolidated trusts to the extent that the purchaseprice of the MBS does not equal the carrying value of the related consolidated MBS debt reported on ourbalance sheets (including unamortized premiums, discounts and other cost basis adjustments) at the time ofpurchase.
Fees Received on the Structuring of Transactions
We offer certain re-securitization services to customers in exchange for fees. Such services include, but are notlimited to, the issuance, guarantee and administration of Fannie Mae REMIC, stripped mortgage-backedsecurities (“SMBS”), grantor trust, and Fannie Mae Mega» securities (collectively, the “StructuredSecurities”). We receive a one-time conversion fee upon issuance of a Structured Security that varies based onthe value of securities issued and the transaction structure. The conversion fee compensates us for all serviceswe provide in connection with the Structured Security, including services provided at and prior to securityissuance and over the life of the Structured Securities. Except for Structured Securities where the underlyingcollateral is whole loans or private-label securities, we generally do not receive a guaranty fee as
F-32
FANNIE MAE(In conservatorship)
NOTES TO CONSOLIDATED FINANCIAL STATEMENTS—(Continued)
compensation in connection with the issuance of a Structured Security, because the transferred mortgage-related securities have previously been guaranteed by us or another party.
We defer a portion of the fee received upon issuance of a Structured Security based on our estimate of the fairvalue of our future administration services. We amortize this portion of the fee on a straight-line basis over theexpected life of the Structured Security. We recognize the excess of the total fee over the fair value of thefuture services in our consolidated statements of operations upon issuance of a Structured Security. However,when we acquire a portion of a Structured Security contemporaneous with our structuring of the transaction,we defer and amortize a portion of this upfront fee as an adjustment to the yield of the purchased security. Wepresent fees received and costs incurred related to our structuring of securities in “Fee and other income” inour consolidated statements of operations.
Income Taxes
We recognize deferred tax assets and liabilities for the difference in the basis of assets and liabilities forfinancial accounting and tax purposes. We measure deferred tax assets and liabilities using enacted tax ratesthat are expected to be applicable to the taxable income or deductions in the period(s) the assets are realizedor the liabilities are settled. We adjust deferred tax assets and liabilities for the effects of changes in tax lawsand rates on the date of enactment. We recognize investment and other tax credits through our effective taxrate calculation assuming that we will be able to realize the full benefit of the credits. We reduce our deferredtax asset by an allowance if, based on the weight of available positive and negative evidence, it is more likelythan not that we will not realize some portion, or all, of the deferred tax asset.
We account for income tax uncertainty using a two-step approach whereby we recognize an income taxbenefit if, based on the technical merits of a tax position, it is more likely than not (a probability of greaterthan 50%) that the tax position would be sustained upon examination by the taxing authority, which includesall related appeals and litigation. We then recognize a tax benefit equal to the largest amount of tax benefitthat is greater than 50% likely to be realized upon settlement with the taxing authority, considering allinformation available at the reporting date. We recognize interest expense on unrecognized tax benefits as“Other expenses” in our consolidated statements of operations.
Pension and Other Postretirement Benefits
We provide pension and postretirement benefits and account for these benefit costs on an accrual basis. Wedetermine pension and postretirement benefit amounts recognized in our consolidated financial statements onan actuarial basis using several different assumptions. The two most significant assumptions used in thevaluation are the discount rate and the long-term rate of return on assets. In determining our net periodicbenefit cost, we apply a discount rate in the actuarial valuation of our pension and postretirement benefitobligations. In determining the discount rate as of each balance sheet date, we consider the current yields onhigh-quality, corporate fixed-income debt instruments with maturities corresponding to the expected durationof our benefit obligations. Additionally, the net periodic benefit cost recognized in our consolidated financialstatements for our qualified pension plan is impacted by the long-term rate of return on plan assets. We baseour assumption of the long-term rate of return on the current investment portfolio mix, actual long-termhistorical return information and the estimated future long-term investment returns for each class of assets. Wemeasure plan assets and obligations as of the date of our consolidated financial statements. We recognize theover-funded or under-funded status of our benefit plans as a prepaid benefit cost (an asset) in “Other assets” oran accrued benefit cost (a liability) in “Other liabilities,” respectively, in our consolidated balance sheets. Werecognize actuarial gains and losses and prior service costs and credits when incurred as adjustments to theprepaid benefit cost or accrued benefit cost with a corresponding offset in other comprehensive income (loss).
F-33
FANNIE MAE(In conservatorship)
NOTES TO CONSOLIDATED FINANCIAL STATEMENTS—(Continued)

Earnings (Loss) per Share
Earnings (loss) per share (“EPS”) is presented for both basic EPS and diluted EPS. We compute basic EPS bydividing net income (loss) available to common stockholders by the weighted-average number of shares ofcommon stock outstanding during the year. In addition to common shares outstanding, the computation ofbasic EPS includes instruments for which the holder has (or is deemed to have) the present rights as of theend of the reporting period to share in current period earnings (loss) with common stockholders (i.e.,participating securities and common shares that are currently issuable for little or no cost to the holder). Weinclude in the denominator of our EPS computation the weighted-average shares of common stock that wouldbe issued upon the full exercise of the warrant issued to Treasury. Diluted EPS is computed by dividing netincome (loss) available to common stockholders by the weighted-average number of shares of common stockoutstanding during the year, plus the dilutive effect of common stock equivalents such as convertiblesecurities, stock options and other performance awards. We exclude these common stock equivalents from thecalculation of diluted EPS when the effect of inclusion, assessed individually, would be anti-dilutive.
Other Comprehensive Income (Loss)
Other comprehensive income (loss) is the change in equity, net of tax, resulting from transactions that werecord directly to stockholders’ equity. These transactions include: unrealized gains and losses on AFSsecurities and certain commitments whose underlying securities are classified as AFS; deferred hedging gainsand losses from cash flow hedges; unrealized gains and losses on guaranty assets resulting from portfoliosecuritization transactions; buy-ups resulting from lender swap transactions; and change in prior service costsand credits and actuarial gains and losses associated with pension and postretirement benefits in othercomprehensive income (loss).
As of December 31, 2010 and 2009, we recorded a valuation allowance for our deferred tax asset for theportion of the future tax benefit that we more likely than not will not utilize in the future. We established novaluation allowance for the deferred tax asset amount related to unrealized losses recorded through AOCI onour AFS securities. We believe this deferred tax amount is recoverable because we have the intent and abilityto hold these securities until recovery of the unrealized loss amounts.
Servicer and MBS Trust Receivable and Payable
When a servicer advances payments to a consolidated MBS trust for delinquent loans, we record restrictedcash and a corresponding liability to reimburse the servicer. When a delinquency advance is made to anunconsolidated trust, we record a receivable from the MBS trust, net of a valuation allowance, and acorresponding liability to reimburse the servicer. Servicers are reimbursed for amounts that they do not collectfrom the borrower at the earlier of our purchase of the loan out of the trust under our default call option orforeclosure.
For unconsolidated MBS trusts where we are considered the transferor, when the contingency on our option topurchase loans from the trust has been met and we regain effective control over the transferred loan, werecognize the loan in our consolidated balance sheets at fair value and record a corresponding liability to theunconsolidated MBS trust.
F-34
FANNIE MAE(In conservatorship)
NOTES TO CONSOLIDATED FINANCIAL STATEMENTS—(Continued)

Fair Value Losses, Net
The following table displays the composition of “Fair value losses, net” for the years ended December 31,2010, 2009 and 2008.
2010 2009 2008For the Year Ended December 31,
(Dollars in millions)
Derivatives fair value losses, net . . . . . . . . . . . . . . . . . . . . . . . . . . . . . . . . $(3,000) $(6,350) $(15,416)
Trading securities gains (losses), net . . . . . . . . . . . . . . . . . . . . . . . . . . . . . 2,692 3,744 (7,040)
Hedged mortgage asset gains, net(1) . . . . . . . . . . . . . . . . . . . . . . . . . . . . . . — — 2,154
Debt foreign exchange gains (losses), net . . . . . . . . . . . . . . . . . . . . . . . . . . (77) (173) 230
Debt fair value gain (losses), net . . . . . . . . . . . . . . . . . . . . . . . . . . . . . . . . 5 (32) (57)
Mortgage loans fair value losses, net . . . . . . . . . . . . . . . . . . . . . . . . . . . . . (131) — —
Fair value losses, net . . . . . . . . . . . . . . . . . . . . . . . . . . . . . . . . . . . . . . $ (511) $(2,811) $(20,129)
(1) Represents adjustments to the carrying value of mortgage assets designated for hedge accounting that are attributableto changes in interest rates.
Reclassifications
To conform to our current period presentation, we have reclassified amounts reported in our consolidatedfinancial statements.
In our consolidated balance sheet as of December 31, 2009, we reclassified $536 million from “Allowance forloan losses” to “Allowance for accrued interest receivable.” Also, the following table displays the balancesheet line items that were reclassified to “Other assets” and “Other liabilities.”
BeforeReclassification
AfterReclassification
As of December 31, 2009
(Dollars in millions)
Reclassified lines to:
Other assets:
Advances to lenders . . . . . . . . . . . . . . . . . . . . . . . . . . . . . . . . . . . . . . $ 5,449 $
Derivative assets, at fair value . . . . . . . . . . . . . . . . . . . . . . . . . . . . . . . 1,474
Guaranty assets . . . . . . . . . . . . . . . . . . . . . . . . . . . . . . . . . . . . . . . . . 8,356
Deferred tax assets, net . . . . . . . . . . . . . . . . . . . . . . . . . . . . . . . . . . . . 909
Partnership investments . . . . . . . . . . . . . . . . . . . . . . . . . . . . . . . . . . . 2,372
Other assets. . . . . . . . . . . . . . . . . . . . . . . . . . . . . . . . . . . . . . . . . . . . 11,559 30,119
Total other assets . . . . . . . . . . . . . . . . . . . . . . . . . . . . . . . . . . . . . . $30,119 $30,119
Other liabilities:
Derivatives liabilities, at fair value . . . . . . . . . . . . . . . . . . . . . . . . . . . . $ 1,029 $
Guaranty obligations . . . . . . . . . . . . . . . . . . . . . . . . . . . . . . . . . . . . . 13,996
Partnership liabilities . . . . . . . . . . . . . . . . . . . . . . . . . . . . . . . . . . . . . 2,541
Other liabilities . . . . . . . . . . . . . . . . . . . . . . . . . . . . . . . . . . . . . . . . . 7,020 24,586
Total other liabilities . . . . . . . . . . . . . . . . . . . . . . . . . . . . . . . . . . . . $24,586 $24,586
In our consolidated statements of operations, we reclassified $63.1 billion and $9.6 billion for 2009 from“Provision for credit losses,” which is no longer presented, to “Provision for guaranty losses” and “Provision
F-35
FANNIE MAE(In conservatorship)
NOTES TO CONSOLIDATED FINANCIAL STATEMENTS—(Continued)

for loan losses,” respectively. For 2008, we reclassified $23.9 billion to “Provision for guaranty losses” and$4.0 billion to “Provision for loan losses.”
In our consolidated statements of cash flows, we reclassified $27.5 billion and $15.3 billion from“Reimbursements to servicers for loan advances,” which is no longer presented, to “Other, net,” within “Cashflows provided by (used in) investing activities” for the years ended December 31, 2009 and 2008,respectively. Also, the following table displays the cash flows line items that we reclassified within “Cashflows (used in) provided by operating activities” for the years ended December 31, 2009 and 2008.
BeforeReclassification
AfterReclassification
BeforeReclassification
AfterReclassification
2009 2008For the Year Ended December 31,
(Dollars in millions)
Reclassified lines to:Amortization of cost basis
adjustments:Amortization of investment cost basis
adjustments . . . . . . . . . . . . . . . . . $ (687) $ $ (400) $Amortization of debt cost basis
adjustments . . . . . . . . . . . . . . . . . 3,255 8,589
Amortization of cost basisadjustments . . . . . . . . . . . . . . . $ 2,568 $ 2,568 $ 8,189 $ 8,189
Valuation (gains) losses:Derivatives fair value adjustments . . . $(1,105) $ $ (1,239) $Valuation losses . . . . . . . . . . . . . . . 4,530 3,425 13,964 12,725
Total valuation (gains) losses . . . . $ 3,425 $ 3,425 $12,725 $12,725
Other, net:Debt extinguishment losses, net . . . . $ 325 $ $ 222 $Debt foreign currency transaction
(gains) losses, net . . . . . . . . . . . . 173 (230)Net change in:
Guaranty assets . . . . . . . . . . . . . . (1,072) 2,089Guaranty obligations . . . . . . . . . . (903) (5,312)
Other, net . . . . . . . . . . . . . . . . . . . . (550) (2,027) (2,458) (5,689)
Total other, net . . . . . . . . . . . . . . $(2,027) $(2,027) $ (5,689) $ (5,689)
2. Adoption of the New Accounting Standards on the Transfers of Financial Assets and Consolidationof Variable Interest Entities
Effective January 1, 2010, we prospectively adopted the new accounting standards on the transfer of financialassets and the consolidation of VIEs for all VIEs existing as of January 1, 2010 (“transition date”). The newaccounting standards removed the scope exception for QSPEs and replaced the previous consolidation modelwith a qualitative model for determining the primary beneficiary of a VIE. Upon adoption of the new accountingstandards, we consolidated the substantial majority of our single-class securitization trusts, which had significantimpacts on our consolidated financial statements. The key financial statement impacts are summarized below.
The mortgage loans and debt reported in our consolidated balance sheet increased significantly at thetransition date because we recognized the underlying assets and liabilities of the newly consolidated trusts. Werecorded the trusts’ mortgage loans and the debt held by third parties at their unpaid principal balance at thetransition date. Prospectively, we recognized the interest income on the trusts’ mortgage loans and interest
F-36
FANNIE MAE(In conservatorship)
NOTES TO CONSOLIDATED FINANCIAL STATEMENTS—(Continued)

expense on the trusts’ debt, resulting in an increase in the interest income and interest expense reported in ourconsolidated statements of operations compared to prior periods.
Another significant impact was the elimination of our guaranty accounting for the newly consolidated trusts.We derecognized the previously recorded guaranty-related assets and liabilities associated with the newlyconsolidated trusts from our consolidated balance sheets. We also eliminated our reserve for guaranty lossesand recognized an allowance for loan losses for such trusts. In our consolidated statements of operations, weno longer recognize guaranty fee income for the newly consolidated trusts, as the revenue is now recorded as acomponent of loan interest income.
When we recognized the newly consolidated trusts’ assets and liabilities at the transition date, we alsoderecognized our investments in these trusts, resulting in a decrease in our investments in MBS that are classifiedas trading and AFS securities. Instead of being recorded as an asset, our investments in Fannie Mae MBS reducethe debt reported in our consolidated balance sheets. Accordingly, the purchase and subsequent sale of MBSissued by consolidated trusts are accounted for in our consolidated financial statements as the extinguishment andissuance of the debt of consolidated trusts, respectively. Furthermore, under the new accounting standards, atransfer of mortgage loans from our portfolio to a trust will generally not qualify for sale treatment.
The new accounting standards do not change the economic risk to our business, specifically our exposure toliquidity, credit, and interest rate risks. We continue to securitize mortgage loans originated by lenders in theprimary mortgage market into Fannie Mae MBS.
Refer to the “Principles of Consolidation” section in “Note 1, Summary of Significant Accounting Policies”for additional information.
Summary of Transition Adjustments
The cumulative impact of our adoption of the new accounting standards was a decrease to our total deficit of$3.3 billion at the transition date. This amount includes:
• A net decrease in our accumulated deficit of $6.7 billion, primarily driven by the reversal of the guarantyassets and guaranty obligations related to the newly consolidated trusts; and
• A net increase in our accumulated other comprehensive loss of $3.4 billion primarily driven by thereversal of net unrealized gains related to our investments in Fannie Mae MBS classified as AFS.
Our transition adjustment is a result of the following changes to our accounting:
• Net recognition of assets and liabilities of newly consolidated entities. At the transition date, trust assetsand liabilities required to be consolidated were recognized in our consolidated balance sheet at their unpaidprincipal balance plus any accrued interest. An allowance for loan losses was established for the newlyconsolidated mortgage loans. The reserve for guaranty losses previously established for such loans waseliminated. Our investments in Fannie Mae MBS issued by the newly consolidated trusts were eliminatedalong with the related accrued interest receivable and unrealized gains or losses at the transition date.
• Accounting for portfolio securitizations. At the transition date, we reclassified the majority of our HFSloans to HFI. Under the new accounting standards, the transfer of mortgage loans to a trust and the saleof the related securities in a portfolio securitization transaction will generally not qualify for saletreatment. As such, mortgage loans acquired with the intent to securitize will generally be classified asheld for investment in our consolidated balance sheets both prior to and subsequent to their securitization.
• Elimination of accounting for guarantees. At the transition date, a significant portion of our guaranty-related assets and liabilities were derecognized from our consolidated balance sheet. Upon consolidation
F-37
FANNIE MAE(In conservatorship)
NOTES TO CONSOLIDATED FINANCIAL STATEMENTS—(Continued)

of a trust, our guaranty activities represent intercompany activities that must be eliminated for purposes ofour consolidated financial statements.
We also describe in this note the ongoing impacts of the new accounting standards on our consolidatedstatements of operations, as well as the changes we have made to our segment reporting as a result of ouradoption of the new accounting standards. The substantial majority of the transition impact related to non-cashactivity, which has not been included in our consolidated statement of cash flows.
Balance Sheet Impact
In accordance with the new accounting standards, effective on the transition date, we report the assets andliabilities of consolidated trusts separately from the assets and liabilities of Fannie Mae in our consolidatedbalance sheets. As such, we have reclassified prior period amounts to conform to our current periodpresentation. The following table presents the impact to our consolidated balance sheet at the transition date.
As ofDecember 31,
2009Transition
Impact
As ofJanuary 1,
2010(Dollars in millions)
Assets
Cash and cash equivalents . . . . . . . . . . . . . . . . . . . . . . . . . . . . . . $ 6,812 $ (19) $ 6,793
Restricted cash . . . . . . . . . . . . . . . . . . . . . . . . . . . . . . . . . . . . . . 3,070 45,583 48,653
Federal funds sold and securities purchased under agreements toresell or similar arrangements . . . . . . . . . . . . . . . . . . . . . . . . . . 53,684 (316) 53,368
Investments in securities:
Trading, at fair value . . . . . . . . . . . . . . . . . . . . . . . . . . . . . . . . 111,939 (66,251) 45,688
Available-for-sale, at fair value . . . . . . . . . . . . . . . . . . . . . . . . . 237,728 (122,328) 115,400
Total investments in securities . . . . . . . . . . . . . . . . . . . . . . . . 349,667 (188,579) 161,088
Mortgage loans:
Loans held for sale, at lower of cost or fair value . . . . . . . . . . . . 18,462 (18,115) 347
Loans held for investment, at amortized cost:
Of Fannie Mae . . . . . . . . . . . . . . . . . . . . . . . . . . . . . . . . . . . 256,434 3,753 260,187
Of consolidated trusts . . . . . . . . . . . . . . . . . . . . . . . . . . . . . . 129,590 2,595,321 2,724,911
Total loans held for investment . . . . . . . . . . . . . . . . . . . . . . 386,024 2,599,074 2,985,098
Allowance for loan losses . . . . . . . . . . . . . . . . . . . . . . . . (9,925) (43,576) (53,501)
Total loans held for investment, net of allowance . . . . . . 376,099 2,555,498 2,931,597
Total mortgage loans . . . . . . . . . . . . . . . . . . . . . . . . 394,561 2,537,383 2,931,944
Accrued interest receivable:
Of Fannie Mae . . . . . . . . . . . . . . . . . . . . . . . . . . . . . . . . . . . . 3,774 (659) 3,115
Of consolidated trusts . . . . . . . . . . . . . . . . . . . . . . . . . . . . . . . . 519 16,329 16,848
Allowance for accrued interest receivable . . . . . . . . . . . . . . . . (536) (6,989) (7,525)
Total accrued interest receivable, net of allowance . . . . . . . . 3,757 8,681 12,438
Acquired property, net . . . . . . . . . . . . . . . . . . . . . . . . . . . . . . . . . 9,142 — 9,142
Servicer and MBS trust receivable . . . . . . . . . . . . . . . . . . . . . . . . . 18,329 (17,143) 1,186
Other assets . . . . . . . . . . . . . . . . . . . . . . . . . . . . . . . . . . . . . . . . 30,119 (8,496) 21,623
Total assets . . . . . . . . . . . . . . . . . . . . . . . . . . . . . . . . . . . . . . . $869,141 $2,377,094 $3,246,235
F-38
FANNIE MAE(In conservatorship)
NOTES TO CONSOLIDATED FINANCIAL STATEMENTS—(Continued)

As ofDecember 31,
2009Transition
Impact
As ofJanuary 1,
2010(Dollars in millions)
Liabilities and Equity (Deficit)
Liabilities:
Accrued interest payable:
Of Fannie Mae . . . . . . . . . . . . . . . . . . . . . . . . . . . . . . . . . . . $ 4,951 $ 8 $ 4,959
Of consolidated trusts . . . . . . . . . . . . . . . . . . . . . . . . . . . . . . 29 10,564 10,593
Federal funds purchased and securities sold under agreements torepurchase . . . . . . . . . . . . . . . . . . . . . . . . . . . . . . . . . . . . . . — — —
Short-term debt:
Of Fannie Mae . . . . . . . . . . . . . . . . . . . . . . . . . . . . . . . . . . . 200,437 — 200,437
Of consolidated trusts . . . . . . . . . . . . . . . . . . . . . . . . . . . . . . — 6,425 6,425
Long-term debt:
Of Fannie Mae . . . . . . . . . . . . . . . . . . . . . . . . . . . . . . . . . . . 567,950 (205) 567,745
Of consolidated trusts . . . . . . . . . . . . . . . . . . . . . . . . . . . . . . 6,167 2,442,280 2,448,447
Reserve for guaranty losses . . . . . . . . . . . . . . . . . . . . . . . . . . . . 54,430 (54,103) 327
Servicer and MBS trust payable. . . . . . . . . . . . . . . . . . . . . . . . . 25,872 (16,600) 9,272
Other liabilities . . . . . . . . . . . . . . . . . . . . . . . . . . . . . . . . . . . . 24,586 (14,573) 10,013
Total liabilities . . . . . . . . . . . . . . . . . . . . . . . . . . . . . . . . . . . . 884,422 2,373,796 3,258,218
Fannie Mae’s stockholders’ equity (deficit):
Senior preferred stock . . . . . . . . . . . . . . . . . . . . . . . . . . . . . . . 60,900 — 60,900
Preferred stock . . . . . . . . . . . . . . . . . . . . . . . . . . . . . . . . . . . . 20,348 — 20,348
Common stock . . . . . . . . . . . . . . . . . . . . . . . . . . . . . . . . . . . . 664 — 664
Additional paid-in capital . . . . . . . . . . . . . . . . . . . . . . . . . . . . . 2,083 — 2,083
Accumulated deficit . . . . . . . . . . . . . . . . . . . . . . . . . . . . . . . . . (90,237) 6,706 (83,531)
Accumulated other comprehensive loss. . . . . . . . . . . . . . . . . . . . (1,732) (3,394) (5,126)
Treasury stock . . . . . . . . . . . . . . . . . . . . . . . . . . . . . . . . . . . . . (7,398) — (7,398)
Total Fannie Mae stockholders’ deficit . . . . . . . . . . . . . . . . . . . . (15,372) 3,312 (12,060)
Noncontrolling interest . . . . . . . . . . . . . . . . . . . . . . . . . . . . . . . . . 91 (14) 77
Total equity (deficit). . . . . . . . . . . . . . . . . . . . . . . . . . . . . . . . . (15,281) 3,298 (11,983)
Total liabilities and equity (deficit) . . . . . . . . . . . . . . . . . . . . . . . . $869,141 $2,377,094 $3,246,235
In the following sections, we describe the impacts to our consolidated balance sheet at the transition date inthe context of the three categories of transition adjustments noted above.
Net Recognition of the Assets and Liabilities of Newly Consolidated Entities
At the transition date, the majority of the net increase to both total assets and total liabilities resulted from therecognition of the assets and liabilities of newly consolidated trusts. This includes the impact of derecognizingour investments in Fannie Mae MBS issued from newly consolidated trusts. We describe the impacts to ourconsolidated balance sheet resulting from the recognition of the assets and liabilities of newly consolidatedtrusts below.
F-39
FANNIE MAE(In conservatorship)
NOTES TO CONSOLIDATED FINANCIAL STATEMENTS—(Continued)

Investments in Securities
At the transition date, we derecognized $66.3 billion and $122.3 billion in investments in securities classifiedas trading and AFS, respectively. The net transition impact to our investments in securities was driven both bythe derecognition of investments in Fannie Mae MBS issued by the newly consolidated trusts and therecognition of mortgage-related securities held by the newly consolidated trusts. We derecognized from ourconsolidated balance sheet investments in the Fannie Mae MBS issued by the newly consolidated trusts asthese investments represent debt securities that are both debt of the consolidated trusts and investments in ourportfolio and therefore represent intercompany activity. Such investments act to reduce the debt held by thirdparties in our consolidated balance sheets. We also derecognized the accrued interest receivable and netunrealized gains related to securities that we derecognized at transition.
Additionally, we recognized mortgage-related securities at transition in situations where trusts that werepreviously consolidated in our consolidated balance sheets deconsolidated under the new accounting standards.Upon deconsolidation of these trusts, we derecognized the collateral of the trusts (that is, mortgage loans) andrecognized our investment in securities issued from the trusts in our consolidated balance sheet.
The table below presents the impact at the transition date to our investments in securities.
As of December 31,2009
TransitionImpact
As of January 1,2010
(Dollars in millions)
Mortgage-related securities:
Fannie Mae . . . . . . . . . . . . . . . . . . . . . . . . . . . . . . . . $229,169 $(189,360) $ 39,809
Freddie Mac . . . . . . . . . . . . . . . . . . . . . . . . . . . . . . . . 42,551 — 42,551
Ginnie Mae . . . . . . . . . . . . . . . . . . . . . . . . . . . . . . . . 1,354 (21) 1,333
Alt-A private-label securities . . . . . . . . . . . . . . . . . . . . 15,505 533 16,038
Subprime private-label securities . . . . . . . . . . . . . . . . . . 12,526 (118) 12,408
CMBS . . . . . . . . . . . . . . . . . . . . . . . . . . . . . . . . . . . . 22,528 — 22,528
Mortgage revenue bonds . . . . . . . . . . . . . . . . . . . . . . . 13,446 21 13,467
Other mortgage-related securities . . . . . . . . . . . . . . . . . 3,706 366 4,072
Total mortgage-related securities . . . . . . . . . . . . . . . . 340,785 (188,579) 152,206
Total non-mortgage-related securities . . . . . . . . . . . . . . . . 8,882 — 8,882
Total investments in securities . . . . . . . . . . . . . . . . . . . . . $349,667 $(188,579) $161,088
Mortgage Loans
At the transition date, the recognition of loans held by the newly consolidated trusts resulted in an increase in“Mortgage loans held for investment of consolidated trusts.” Loans held by consolidated trusts are generallyclassified as HFI in our consolidated balance sheets. Prior to the transition date, we reported mortgage loansheld both by us in our mortgage portfolio and those held by consolidated trusts collectively as “Mortgageloans held for investment” in our consolidated balance sheets. Effective at the transition date, we report loansheld by us as “Mortgage loans held for investment of Fannie Mae” and loans held by consolidated trusts as“Mortgage loans held for investment of consolidated trusts.” Prior period amounts have been reclassified toconform to our current period presentation.
The recognition of the mortgage loans held by newly consolidated trusts also resulted in an increase in“Accrued interest receivable of consolidated trusts.” This increase was offset in part by an increase to“Allowance for accrued interest receivable,” which represents estimated incurred losses on our accruedinterest. Prior to the transition date, incurred losses on interest of unconsolidated trusts were reported as a
F-40
FANNIE MAE(In conservatorship)
NOTES TO CONSOLIDATED FINANCIAL STATEMENTS—(Continued)

portion of our “Reserve for guaranty losses.” Prior to the transition date, we reported the accrued interestreceivable relating to loans held by consolidated trusts as a component of “Accrued interest receivable.” Priorperiod amounts have been reclassified to conform to our current period presentation.
The table below presents the impact to the unpaid principal balance of our mortgage loans at the transitiondate.
Of FannieMae
Of ConsolidatedTrusts
Of FannieMae
Of ConsolidatedTrusts
Of FannieMae
Of ConsolidatedTrusts
As of December 31, 2009 Transition Impact As of January 1, 2010
(Dollars in millions)
Single-family:
Government insured orguaranteed . . . . . . . . . . . . . . . . $ 51,454 $ 945 $ — $ 1 $ 51,454 $ 946
Conventional:
Long-term fixed-rate . . . . . . . . . 90,245 89,409 (5,272) 2,029,932 84,973 2,119,341
Intermediate-term fixed-rate . . . . 8,069 21,405 (178) 318,329 7,891 339,734
Adjustable-rate . . . . . . . . . . . . . 16,889 17,713 (2) 190,706 16,887 208,419
Total single-family conventional . . . 115,203 128,527 (5,452) 2,538,967 109,751 2,667,494
Total single-family . . . . . . . . . $166,657 $129,472 $(5,452) $2,538,968 $161,205 $2,668,440
Multifamily:
Government insured orguaranteed . . . . . . . . . . . . . . . . $ 585 $ — $ — $ — $ 585 $ —
Conventional:
Long-term fixed-rate . . . . . . . . . 4,937 790 — 3,752 4,937 4,542
Intermediate-term fixed-rate . . . . 81,456 10,304 — 35,672 81,456 45,976
Adjustable-rate . . . . . . . . . . . . . 21,535 807 — 5,603 21,535 6,410
Total multifamily conventional . . . . 107,928 11,901 — 45,027 107,928 56,928
Total multifamily . . . . . . . . . . $108,513 $ 11,901 $ — $ 45,027 $108,513 $ 56,928
Allowance for Loan Losses and Reserve for Guaranty Losses
We maintain an allowance for loan losses related to HFI loans reported in our consolidated balance sheets anda reserve for guaranty losses related to loans held by unconsolidated trusts. Upon recognition of the mortgageloans held by newly consolidated trusts at the transition date, we increased our “Allowance for loan losses”and decreased our “Reserve for guaranty losses.” The overall decrease in the combined reserves represents adifference in the methodology used to estimate incurred losses for our allowance for loan losses versus ourreserve for guaranty losses. Our guaranty reserve considers all contractually past due interest income includingpayments expected to be missed between the balance sheet date and the point of loan acquisition orforeclosure, however, for our loan loss allowance, we consider only our net recorded investment in the loan atthe balance sheet date, which only includes interest income accrued while the loan was on accrual status. Werecognize the portion of the allowance related to principal as our “Allowance for loan losses” and the portionof the allowance related to accrued interest as our “Allowance for accrued interest receivable.” We continue torecord a reserve for guaranty losses related to loans in unconsolidated trusts and loans that we have guaranteedunder long-term standby commitments, which require us to purchase loans from lenders if the loans meetcertain delinquency criteria. See “Note 5, Allowance for Loan Losses and Reserve for Guaranty Losses” foradditional information.
F-41
FANNIE MAE(In conservatorship)
NOTES TO CONSOLIDATED FINANCIAL STATEMENTS—(Continued)

Short-Term Debt and Long-Term Debt
At the transition date, we recognized an increase of $6.4 billion in “Short-term debt of consolidated trusts”and $2.4 trillion in “Long-term debt of consolidated trusts.” The debt of consolidated trusts represents theamount of Fannie Mae debt securities issued by such trusts and held by third-party certificateholders. Werecognized an increase of $10.6 billion in “Accrued interest payable of consolidated trusts,” which representsthe interest expense accrued as of the transition date on the long-term debt of the newly consolidated trusts.
Prior to the transition date, we reported debt issued both by us and by consolidated trusts collectively as either“Short-term debt” or “Long-term debt.” Effective at the transition date, we report debt issued by us as either“Short-term debt of Fannie Mae” or “Long-term debt of Fannie Mae.” We report the debt of consolidatedtrusts as either “Short-term debt of consolidated trusts” or “Long-term debt of consolidated trusts.” Priorperiod amounts have been reclassified to conform to our current period presentation.
Servicer and MBS Trust Receivable and Payable
At the transition date we recognized a net decrease of $17.1 billion in “Servicer and MBS trust receivable.”Prior to our adoption of the new accounting standards, we recorded a receivable from unconsolidated trusts,net of a valuation allowance, when a delinquency advance was made to the trust. This receivable nowrepresents intercompany activity that we eliminate for the purpose of our consolidated financial statements.
We also recognized a decrease of $16.6 billion in “Servicer and MBS trust payable,” which consisted of twocomponents. First, we have the option to purchase loans and foreclosed properties from the trust when certaincontingencies have been met. At December 31, 2009, we recorded a payable to the trust for loans andforeclosed properties that had been purchased during the month of December. Second, prior to theconsolidation of certain out of portfolio trusts, we recognized a loan in our consolidated balance sheets at fairvalue and recorded a corresponding liability to the unconsolidated trust when the contingency on our option topurchase loans from the trust had been met. These payables now represent intercompany activity that weeliminate for the purpose of our consolidated financial statements.
Restricted Cash
At the transition date, “Restricted cash” increased by $45.6 billion to record cash payments received by theservicer or consolidated trusts due to be remitted to the MBS certificateholders that have been determined tobe restricted for use.
Federal Funds Sold and Securities Purchased Under Agreements to Resell or Similar Arrangements
At the transition date, we recognized a decrease of $316 million in “Federal funds sold and securitiespurchased under agreements to resell or similar arrangements” relating to dollar roll transactions that utilizedFannie Mae MBS. As a result of the dollar roll transactions, we held investments in Fannie Mae MBS in ourconsolidated balance sheet as of December 31, 2009 that were issued from trusts that subsequentlyconsolidated at the transition date. Similar to our treatment of Fannie Mae MBS classified as trading or AFS,we eliminated our secured financing receivable related to these dollar roll transactions and recharacterized thetransfer of the Fannie Mae MBS as debt extinguishment in our consolidated financial statements.
Accounting for Portfolio Securitizations
At the transition date, we reclassified the majority of our HFS mortgage loans to HFI due to the change in ouraccounting for portfolio securitizations. Prior to our adoption of the new accounting standards, we classifiedmortgage loans acquired with the intent to securitize as HFS in our consolidated balance sheets as the majorityof the transfers of mortgage loans under portfolio securitization transactions qualified as sales under the
F-42
FANNIE MAE(In conservatorship)
NOTES TO CONSOLIDATED FINANCIAL STATEMENTS—(Continued)

previous accounting standards. Under the new accounting standards, the transfer of mortgage loans throughportfolio securitization transactions will generally not result in the derecognition of mortgage loans, thus wehave classified the loans as HFI.
Certain mortgage loans continue to be classified as HFS in our consolidated balance sheets, consistent withour intent to securitize and transfer the mortgage loans to an MBS trust that we will not consolidate.
Elimination of Accounting for Guarantees
At the transition date, we made adjustments relating to our accounting for guarantees and master servicing.We describe the impact of the new accounting standards on our accounting for guarantees and masterservicing below.
Guaranty Accounting
We continue to guarantee to our MBS trusts that we will supplement amounts received by the trust as requiredto permit timely payments of principal and interest on the related Fannie Mae MBS, regardless of theirconsolidation status. However, for consolidated trusts, our guarantee to the trust represents an intercompanyactivity that must be eliminated for purposes of our consolidated financial statements. Thus, uponconsolidation of the trusts, we eliminated the related guaranty asset, guaranty obligation, buy-up, buy-downand risk-based price adjustments from our consolidated balance sheet. This transition adjustment is included in“Other assets” and “Other liabilities”. We continue to record guaranty assets and guaranty obligations in ourconsolidated balance sheets relating to unconsolidated trusts.
Master Servicing
The transition adjustment to our “Other assets” and “Other liabilities” includes the derecognition of theportion of our master servicing asset and master servicing liability relating to newly consolidated trusts, whichrepresents intercompany activity.
Impact on Statements of Operations
Our adoption of the new accounting standards affects how certain income and expense items are reported inour consolidated statements of operations on an ongoing basis. We explain the key impacts below.
Interest Income on Mortgage Loans
The interest income earned on mortgage loans held by the newly consolidated trusts is recorded in ourconsolidated statements of operations as loan interest income. This interest income was not recorded in ourconsolidated statements of operations prior to the transition date as the trusts were not consolidated.
Prior to our adoption of the new accounting standards, we reported interest income on mortgage loans heldboth by us and by consolidated trusts collectively as “Interest income on mortgage loans.” Effective at thetransition date, we report interest income on loans held by us as “Interest income on mortgage loans of FannieMae” and interest income on loans held by consolidated trusts as “Interest income on mortgage loans ofconsolidated trusts.” Prior period amounts have been reclassified to conform to our current period presentation.“Interest income on mortgage loans of Fannie Mae” is not impacted by our adoption of the new accountingstandards.
F-43
FANNIE MAE(In conservatorship)
NOTES TO CONSOLIDATED FINANCIAL STATEMENTS—(Continued)

Interest Expense on Short-Term and Long-Term Debt
The interest expense incurred on debt of newly consolidated trusts is recorded in our consolidated statementsof operations as interest expense on short-term and long-term debt. This interest expense was not recorded inour consolidated statements of operations prior to the transition date as the trusts were not consolidated.
Prior to our adoption of the new accounting standards, we reported interest expense on debt issued both by usand by consolidated trusts as either “Interest expense on short-term debt” or “Interest expense on long-termdebt.” Effective at the transition date, we report interest expense as either “Interest expense on debt of FannieMae” or “Interest expense on debt of consolidated trusts.” Prior period amounts have been reclassified toconform to our current period presentation. “Interest expense on debt of Fannie Mae” is not impacted by ouradoption of the new accounting standards.
Provision for Loan Losses and Provision for Guaranty Losses
Since the majority of our MBS trusts were consolidated at the transition date, the provision for loan lossesrecorded in periods after the transition date reflects the increase in the mortgage loans reported in ourconsolidated balance sheets. The provision for guaranty losses recorded in periods after the transition datereflects the subsequent decrease in unconsolidated trusts. The portion of the reserve for guaranty lossesrelating to loans in previously unconsolidated MBS trusts that were consolidated at the transition date wasderecognized and we recognized an allowance for loan losses as the loans are now reflected in ourconsolidated balance sheet.
Guaranty Fee Income
We do not recognize the guaranty fee income earned from consolidated trusts. Guaranty fees fromconsolidated trusts are reported as a component of interest income on mortgage loans. As our guaranty-relatedassets and liabilities pertaining to consolidated trusts were also eliminated, we no longer record amortizationincome or fair value adjustments related to these trusts. The guaranty fee income that continues to berecognized in our consolidated statements of operations relates to guarantees to unconsolidated trusts and othercredit enhancements that we have provided.
Debt Extinguishment Gains (Losses)
Upon purchase of Fannie Mae MBS debt securities issued from a consolidated trust for our mortgageportfolio, we extinguish the related debt issued by the consolidated trust as we now own the debt securitiesinstead of a third party. We record debt extinguishment gains or losses related to debt of consolidated trusts tothe extent that the purchase price of the debt security does not equal the carrying value of the relatedconsolidated debt reported in our consolidated balance sheet at the time of purchase.
Trust Management Income
As master servicer, issuer, and trustee for Fannie Mae MBS, we earn a fee that reflects interest earned on cashflows from the date of remittance of mortgage and other payments to us by the servicers until the date ofdistribution of these payments to the MBS certificateholders. Previously, we reported this compensation as“Trust management income” in our consolidated statements of operations. Upon adoption of the newaccounting standards, we report the trust management income earned by consolidated trusts as a component ofnet interest income in our consolidated statements of operations. Trust management income earned by usrelating to unconsolidated trusts is now reported as a component of “Fee and other income.” Prior periodamounts have been reclassified to conform to our current period presentation.
F-44
FANNIE MAE(In conservatorship)
NOTES TO CONSOLIDATED FINANCIAL STATEMENTS—(Continued)
Impact on Segment Reporting
As a result of our adoption of the new accounting standards, we changed the presentation of segment financialinformation that is currently evaluated by management. With this change, the sum of the results for our threesegments does not equal our consolidated results of operations as we separate the activity related to ourconsolidated trusts from the results generated by our three segments.
Our three reportable segments continue to be: Single-Family, Multifamily (formerly “HCD”), and CapitalMarkets. We use these three segments to generate revenue and manage business risk, and each segment ismeasured based on the type of business activities it performs.
We have not restated prior period results nor have we presented current year results under the old presentationas we determined that it was impracticable to do so; therefore, our segment results reported in the currentperiod are not comparable with prior periods.
We present our segment results in “Note 15, Segment Reporting.”
3. Consolidations and Transfers of Financial Assets
We have interests in various entities that are considered to be VIEs. The primary types of entities aresecuritization trusts guaranteed by us via lender swap and portfolio securitization transactions, mortgage andasset-backed trusts that were not created by us, as well as housing partnerships that are established to financethe acquisition, construction, development or rehabilitation of affordable multifamily and single-familyhousing. These interests also include investments in securities issued by VIEs, such as Fannie Mae MBScreated pursuant to our securitization transactions and our guaranty to the entity. Our adoption of the newaccounting standards on the transfers of financial assets and consolidation of VIEs resulted in the majority ofour single-class securitization trusts being consolidated by us.
Types of VIEs
Securitization Trusts
Under our lender swap and portfolio securitization transactions, mortgage loans are transferred to a trustspecifically for the purpose of issuing a single class of guaranteed securities that are collateralized by theunderlying mortgage loans. The trust’s permitted activities include receiving the transferred assets, issuingbeneficial interests, establishing the guaranty and servicing the underlying mortgage loans. In our capacity asissuer, master servicer, trustee and guarantor, we earn fees for our obligations to each trust. Additionally, wemay retain or purchase a portion of the securities issued by each trust. We have securitized mortgage loanssince 1981.
In our structured securitization transactions, we earn fees for assisting lenders and dealers with the design andissuance of structured mortgage-related securities. The trusts created in these transactions have permittedactivities that are similar to those for our lender swap and portfolio securitization transactions. The assets ofthese trusts may include mortgage-related securities and/or mortgage loans. The trusts created for Fannie MaeMega securities issue single-class securities while the trusts created for REMIC, grantor trust and SMBSsecurities issue single-class and multi-class securities, the latter of which separate the cash flows fromunderlying assets into separately tradable interests. Our obligations and continued involvement in these trustsare similar to those described for lender swap and portfolio securitization transactions. We have securitizedmortgage assets in structured transactions since 1986.
We also invest in mortgage-backed and asset-backed securities that have been issued via private-label trusts.These trusts are structured to provide investors with a beneficial interest in a pool of receivables or otherfinancial assets, typically mortgage loans, credit card receivables, auto loans or student loans. The trusts act as
F-45
FANNIE MAE(In conservatorship)
NOTES TO CONSOLIDATED FINANCIAL STATEMENTS—(Continued)
vehicles to allow loan originators to securitize assets. Securities are structured from the underlying pool ofassets to provide for varying degrees of risk. The originators of the financial assets or the underwriters of thetransaction create the trusts and typically own the residual interest in the trusts’ assets. Our involvement inthese entities is typically limited to our recorded investment in the beneficial interests that we have purchased.We have invested in these vehicles since 1987.
Limited Partnerships
We have historically made equity investments in various limited partnerships that sponsor affordable housingprojects utilizing the low-income housing tax credit pursuant to Section 42 of the Internal Revenue Code. Thepurpose of these investments is to increase the supply of affordable housing in the United States and to servecommunities in need. In addition, our investments in LIHTC partnerships generate both tax credits and netoperating losses that may reduce our federal income tax liability. Our LIHTC investments primarily representlimited partnership interests in entities that have been organized by a fund manager who acts as the generalpartner. These fund investments seek out equity investments in LIHTC operating partnerships that have beenestablished to identify, develop and operate multifamily housing that is leased to qualifying residential tenants.
During 2009, we explored options to sell or otherwise transfer our LIHTC investments for value consistentwith our mission. On February 18, 2010, FHFA informed us that after consultation with Treasury, we were notauthorized to sell or transfer our LIHTC partnership interests. The carrying value of our LIHTC “Partnershipinvestments” was reduced to zero in the consolidated financial statements as of December 31, 2009, as we nolonger had both the intent and ability to sell or otherwise transfer our LIHTC investments for value.
We recognized $145 million, $5.9 billion and $795 million for the years ended December 31, 2010, 2009 and2008, respectively, of other-than-temporary impairment losses related to our limited partnerships in “Lossesfrom partnership investments” in our consolidated statements of operations. We no longer recognize netoperating losses or impairment on our LIHTC investments, since the carrying value was reduced to zero.
As of December 31, 2010, we have an obligation to fund $280 million in capital contributions. This obligationhas been recorded as a component of “Other liabilities” in our consolidated balance sheet. As a result of ourcurrent tax position, we did not make any LIHTC investments in 2010 other than pursuant to existing priorcommitments. We are not currently recognizing the tax benefits associated with the tax credits and netoperating losses in our consolidated financial statements.
Consolidated VIEs
Upon adoption of the new accounting standards, if an entity is a VIE, we consider whether our variableinterest in that entity causes us to be the primary beneficiary. The primary beneficiary of the VIE is requiredto consolidate and account for the assets, liabilities and noncontrolling interests of the VIE in its consolidatedfinancial statements. An enterprise is deemed to be the primary beneficiary when the enterprise has the powerto direct the activities of the VIE that most significantly impact the entity’s economic performance andexposure to benefits and/or losses could potentially be significant to the entity.
The following table displays the assets and liabilities of consolidated VIEs in our consolidated balance sheetsas of December 31, 2010 and 2009. The difference between total assets of consolidated VIEs and totalliabilities of consolidated VIEs is primarily due to our investment in the debt securities of consolidated VIEs.
F-46
FANNIE MAE(In conservatorship)
NOTES TO CONSOLIDATED FINANCIAL STATEMENTS—(Continued)

In general, the investors in the obligations of consolidated VIEs have recourse only to the assets of those VIEsand do not have recourse to us, except where we provide a guaranty to the VIE.
2010(1) 2009(1)As of December 31,
(Dollars in millions)
Assets:
Cash and cash equivalents . . . . . . . . . . . . . . . . . . . . . . . . . . . . . . . . . . . . . . . . . $ 348 $ 2,092
Restricted cash . . . . . . . . . . . . . . . . . . . . . . . . . . . . . . . . . . . . . . . . . . . . . . . . . 59,619 —
Trading securities . . . . . . . . . . . . . . . . . . . . . . . . . . . . . . . . . . . . . . . . . . . . . . . 21 5,599
Available-for-sale securities . . . . . . . . . . . . . . . . . . . . . . . . . . . . . . . . . . . . . . . . 1,055 10,513
Loans held for sale . . . . . . . . . . . . . . . . . . . . . . . . . . . . . . . . . . . . . . . . . . . . . . 661 11,646
Loans held for investment. . . . . . . . . . . . . . . . . . . . . . . . . . . . . . . . . . . . . . . . . . 2,577,133 129,590
Accrued interest receivable . . . . . . . . . . . . . . . . . . . . . . . . . . . . . . . . . . . . . . . . . 9,349 519
Servicer and MBS trust receivable . . . . . . . . . . . . . . . . . . . . . . . . . . . . . . . . . . . . 593 466
Other assets(2) . . . . . . . . . . . . . . . . . . . . . . . . . . . . . . . . . . . . . . . . . . . . . . . . . . — 451
Total assets of consolidated VIEs . . . . . . . . . . . . . . . . . . . . . . . . . . . . . . . . . . . . $2,648,779 $160,876
Liabilities:
Accrued interest payable . . . . . . . . . . . . . . . . . . . . . . . . . . . . . . . . . . . . . . . . . . $ 9,712 $ 29
Short-term debt . . . . . . . . . . . . . . . . . . . . . . . . . . . . . . . . . . . . . . . . . . . . . . . . . 5,359 —
Long-term debt . . . . . . . . . . . . . . . . . . . . . . . . . . . . . . . . . . . . . . . . . . . . . . . . . 2,411,597 6,167
Servicer and MBS trust payable . . . . . . . . . . . . . . . . . . . . . . . . . . . . . . . . . . . . . 562 850
Other liabilities(3) . . . . . . . . . . . . . . . . . . . . . . . . . . . . . . . . . . . . . . . . . . . . . . . 331 385
Total liabilities of consolidated VIEs . . . . . . . . . . . . . . . . . . . . . . . . . . . . . . . . . . $2,427,561 $ 7,431
(1) Includes VIEs created through lender swaps, private label wraps and portfolio securitization transactions.(2) Includes partnership investments of $430 million and cash, cash equivalents and restricted cash of $21 million in
limited partnerships as of December 31, 2009.(3) Includes partnership liabilities of $385 million as of December 31, 2009.
The adoption of the new accounting standards resulted in significant changes in the consolidation status ofVIEs. Refer to “Note 2, Adoption of the New Accounting Standards on the Transfers of Financial Assets andConsolidation of Variable Interest Entities” for additional information regarding the impact of transition.
In addition to the VIEs consolidated as a result of initially adopting the new accounting standards, weconsolidated VIEs as of December 31, 2010 that were not consolidated as of December 31, 2009. These VIEs areFannie Mae multi-class resecuritization trusts and were consolidated because we now hold in our portfolio asubstantial portion of the certificates. As a result of consolidating these multi-class resecuritization trusts, whichhad combined total assets of $3.9 billion in unpaid principal balance as of December 31, 2010, we derecognizedour investment in these trusts and recognized the assets and liabilities of the consolidated trusts at their fair value.
As of December 31, 2009, we consolidated VIEs that were no longer consolidated as of December 31, 2010,excluding the impact of adopting the new accounting standards. These VIEs were Fannie Mae multi-classresecuritization trusts and were deconsolidated because we no longer hold in our portfolio a substantial portionof the certificates. As a result of deconsolidating these multi-class resecuritization trusts, which had combinedtotal assets of $855 million in unpaid principal balance as of December 31, 2009, we derecognized the assetsand liabilities of the trusts and recognized at fair value our retained interests as securities in our consolidatedbalance sheet.
F-47
FANNIE MAE(In conservatorship)
NOTES TO CONSOLIDATED FINANCIAL STATEMENTS—(Continued)

For the years ended December 31, 2010 and 2009, we recognized a loss of $3 million and a gain of$171 million, respectively, upon deconsolidation of VIEs. We recognize these amounts as a component of“Investment gains (losses), net” in our consolidated statements of operations.
Unconsolidated VIEs
We also have investments in VIEs that we do not consolidate because we are not deemed to be the primarybeneficiary. These unconsolidated VIEs include securitization trusts, as well as other equity investments. Thefollowing table displays the total assets as of December 31, 2010 and 2009 of unconsolidated VIEs with whichwe are involved.
2010 2009As of December 31,
(Dollars in millions)
Mortgage-backed trusts . . . . . . . . . . . . . . . . . . . . . . . . . . . . . . . . . . . . . . . . . . . . $ 732,368 $3,044,516
Asset-backed trusts . . . . . . . . . . . . . . . . . . . . . . . . . . . . . . . . . . . . . . . . . . . . . . . 363,721 484,703
Limited partnership investments . . . . . . . . . . . . . . . . . . . . . . . . . . . . . . . . . . . . . . 13,102 13,085
Mortgage revenue bonds and other credit-enhanced bonds . . . . . . . . . . . . . . . . . . . . 8,019 8,061
Total assets of unconsolidated VIEs . . . . . . . . . . . . . . . . . . . . . . . . . . . . . . . . . $1,117,210 $3,550,365
The following table displays the carrying amount and classification of the assets and liabilities as ofDecember 31, 2010 and 2009 and the maximum exposure to loss as of December 31, 2010 related to ourvariable interests in unconsolidated VIEs with which we are involved.
CarryingAmount
MaximumExposure to Loss
CarryingAmount(1)
2010 2009As of December 31,
(Dollars in millions)
Assets:
Available-for-sale securities(2) . . . . . . . . . . . . . . . . . . . . . . . . . . $ 84,770 $67,367 $190,135
Trading securities(2) . . . . . . . . . . . . . . . . . . . . . . . . . . . . . . . . . 29,342 27,627 91,222
Guaranty assets . . . . . . . . . . . . . . . . . . . . . . . . . . . . . . . . . . . . 246 — 8,195
Partnership investments . . . . . . . . . . . . . . . . . . . . . . . . . . . . . . 94 319 144
Servicer and MBS trust receivable . . . . . . . . . . . . . . . . . . . . . . . 11 11 15,903
Other assets. . . . . . . . . . . . . . . . . . . . . . . . . . . . . . . . . . . . . . . — — 1,320
Total assets related to our interests in unconsolidated VIEs . . . . . . $114,463 $95,324 $306,919
Liabilities:
Reserve for guaranty losses . . . . . . . . . . . . . . . . . . . . . . . . . . . . $ 291 $ — $ 52,703
Guaranty obligations . . . . . . . . . . . . . . . . . . . . . . . . . . . . . . . . 469 21,318 13,504
Partnership liabilities . . . . . . . . . . . . . . . . . . . . . . . . . . . . . . . . 170 — 325
Servicer and MBS trust payable. . . . . . . . . . . . . . . . . . . . . . . . . 13 2 20,371
Other liabilities . . . . . . . . . . . . . . . . . . . . . . . . . . . . . . . . . . . . — — 818
Total liabilities related to our interest in unconsolidated VIEs . . . . $ 943 $21,320 $ 87,721
(1) Includes VIEs created through lender swaps and portfolio securitization transactions. Our total maximum exposure toloss relating to unconsolidated VIEs was $2.6 trillion as of December 31, 2009.
(2) Contains securities exposed through consolidation which may also represent an interest in other unconsolidated VIEs.
F-48
FANNIE MAE(In conservatorship)
NOTES TO CONSOLIDATED FINANCIAL STATEMENTS—(Continued)

Our maximum exposure to loss generally represents the greater of our recorded investment in the entity or theunpaid principal balance of the assets covered by our guaranty. However, our securities issued by Fannie Maemulti-class resecuritization trusts that are not consolidated do not give rise to any additional exposure to lossas we already consolidate the underlying collateral.
Transfers of Financial Assets
We issue Fannie Mae MBS through portfolio securitization transactions by transferring pools of mortgageloans or mortgage-related securities to one or more trusts or special purpose entities. We are considered to bethe transferor when we transfer assets from our own portfolio in a portfolio securitization transaction. For theyears ended December 31, 2010, 2009 and 2008 the unpaid principal balance of portfolio securitizations was$120.0 billion, $216.1 billion and $41.1 billion, respectively.
Upon adoption of the new accounting standards, the majority of our portfolio securitization transactions do notqualify for sale treatment. As a result, our continuing involvement in the form of guaranty assets and guarantyliabilities with assets that were transferred into unconsolidated trusts has been greatly reduced and is no longermaterial. We report the assets and liabilities of consolidated trusts created via portfolio securitizationtransactions that do not qualify as sales in our consolidated balance sheets and in the consolidated VIEs tableabove.
To determine the fair value of our securities created via portfolio securitizations, we utilize severalindependent pricing services. The prices we receive from pricing services are typically based on informationthey obtain on current trading activity, but may be based on models where trading activity is not observed. Weevaluate the reasonableness of fair value estimates obtained from pricing services through multiple means,including our internal price verification group which uses alternate forms of pricing information to validate theprices. Given that we do not base prices for the retained securities on internal models, but rather base them onobservable market inputs obtained by our pricing services, we believe it would not be meaningful to providesensitivities to changes in assumptions on the fair value of the retained securities.
The following table displays some key characteristics of the securities retained in unconsolidated portfoliosecuritization trusts.
Fannie MaeSingle-class
MBS & FannieMae Megas
REMICS &SMBS
(Dollars in millions)
As of December 31, 2010
Unpaid principal balance . . . . . . . . . . . . . . . . . . . . . . . . . . . . . . . . . . . . . . $ 63 $ 15,771
Fair value . . . . . . . . . . . . . . . . . . . . . . . . . . . . . . . . . . . . . . . . . . . . . . . . . 68 16,745
Weighted-average coupon . . . . . . . . . . . . . . . . . . . . . . . . . . . . . . . . . . . . . . 6.58% 6.28%
Weighted-average loan age . . . . . . . . . . . . . . . . . . . . . . . . . . . . . . . . . . . . . 4.2 years 4.4 years
Weighted-average maturity . . . . . . . . . . . . . . . . . . . . . . . . . . . . . . . . . . . . . 25.6 years 22.0 years
As of December 31, 2009
Unpaid principal balance . . . . . . . . . . . . . . . . . . . . . . . . . . . . . . . . . . . . . . $ 34,260 $ 19,472
Fair value . . . . . . . . . . . . . . . . . . . . . . . . . . . . . . . . . . . . . . . . . . . . . . . . . 35,455 20,224
Weighted-average coupon . . . . . . . . . . . . . . . . . . . . . . . . . . . . . . . . . . . . . . 5.62% 6.82%
Weighted-average loan age . . . . . . . . . . . . . . . . . . . . . . . . . . . . . . . . . . . . . 2.9 years 4.6 years
Weighted-average maturity . . . . . . . . . . . . . . . . . . . . . . . . . . . . . . . . . . . . . 24.2 years 26.1 years
For the years ended December 31, 2010, 2009 and 2008, the principal and interest received on retainedinterests was $3.5 billion, $9.7 billion and $7.9 billion, respectively.
F-49
FANNIE MAE(In conservatorship)
NOTES TO CONSOLIDATED FINANCIAL STATEMENTS—(Continued)
Managed Loans
We define “managed loans” as on-balance sheet mortgage loans as well as mortgage loans that we havesecuritized in unconsolidated portfolio securitization trusts. As noted above, our adoption of the newaccounting standards resulted in a significant increase in mortgage loans held for investment and a decrease inloans held for sale in our consolidated balance sheets, as well as a decrease in the amount of loans securitizedin unconsolidated portfolio securitization trusts. The following table displays the unpaid principal balances ofmanaged loans, including those managed loans that are delinquent as of December 31, 2010 and 2009.
UnpaidPrincipal Balance
Principal Amount ofDelinquent Loans
(Dollars in millions)
As of December 31, 2010
Loans held for investment
Of Fannie Mae . . . . . . . . . . . . . . . . . . . . . . . . . . . . . . . . . . . . . . $ 423,686 $141,342
Of consolidated trusts . . . . . . . . . . . . . . . . . . . . . . . . . . . . . . . . . 2,565,347 34,080
Loans held for sale . . . . . . . . . . . . . . . . . . . . . . . . . . . . . . . . . . . . . 964 127
Securitized loans . . . . . . . . . . . . . . . . . . . . . . . . . . . . . . . . . . . . . . 2,147 78
Total loans managed . . . . . . . . . . . . . . . . . . . . . . . . . . . . . . . . . . $2,992,144 $175,627
As of December 31, 2009
Loans held for investment . . . . . . . . . . . . . . . . . . . . . . . . . . . . . . . . $ 395,551 $ 51,051
Loans held for sale . . . . . . . . . . . . . . . . . . . . . . . . . . . . . . . . . . . . . 20,992 140
Securitized loans . . . . . . . . . . . . . . . . . . . . . . . . . . . . . . . . . . . . . . 187,922 5,161
Total loans managed . . . . . . . . . . . . . . . . . . . . . . . . . . . . . . . . . . $ 604,465 $ 56,352
Qualifying Sales of Portfolio Securitizations
The gain or loss on a portfolio securitization transaction that qualifies as a sale depends, in part, on thecarrying amount of the financial assets sold. Prior to January 1, 2010, we allocated the carrying amount of thefinancial assets sold between the assets sold and the interests retained, if any, based on their relative fair valueat the date of sale. Further, we recognized our recourse obligations at their full fair value at the date of sale,which serves as a reduction of sale proceeds in the gain or loss calculation.
Beginning January 1, 2010, we recognize all assets obtained and all liabilities incurred in a portfoliosecuritization at fair value. We recorded a net gain on portfolio securitizations of $26 million, $1.0 billion and$49 million for the years ended December 31, 2010, 2009 and 2008, respectively. We recognize these amountsas a component of “Investment gains (losses), net” in our consolidated statements of operations. Werecognized proceeds from the initial sale of securities from portfolio securitizations of $660 million,$85.7 billion and $30.1 billion for the years ended December 31, 2010, 2009 and 2008, respectively.
4. Mortgage Loans
We own both single-family mortgage loans, which are secured by four or fewer residential dwelling units, andmultifamily mortgage loans, which are secured by five or more residential dwelling units. We classify theseloans as either HFI or HFS. We report HFI loans at the unpaid principal balance, net of unamortizedpremiums and discounts, other cost basis adjustments, and an allowance for loan losses. We report HFS loansat the lower of cost or fair value determined on a pooled basis, and record valuation changes in ourconsolidated statements of operations. Our prospective adoption on December 31, 2010 of a new accounting
F-50
FANNIE MAE(In conservatorship)
NOTES TO CONSOLIDATED FINANCIAL STATEMENTS—(Continued)
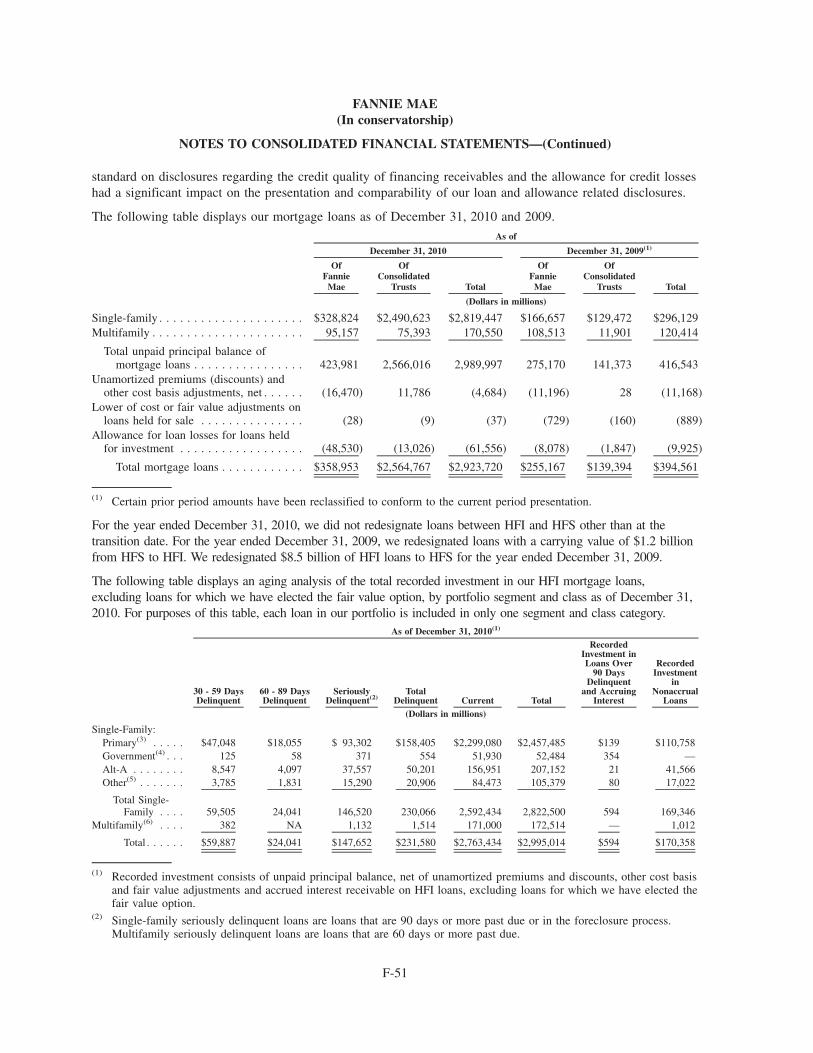
standard on disclosures regarding the credit quality of financing receivables and the allowance for credit losseshad a significant impact on the presentation and comparability of our loan and allowance related disclosures.
The following table displays our mortgage loans as of December 31, 2010 and 2009.
OfFannie
Mae
OfConsolidated
Trusts Total
OfFannie
Mae
OfConsolidated
Trusts Total
December 31, 2010 December 31, 2009(1)
As of
(Dollars in millions)
Single-family . . . . . . . . . . . . . . . . . . . . . $328,824 $2,490,623 $2,819,447 $166,657 $129,472 $296,129Multifamily . . . . . . . . . . . . . . . . . . . . . . 95,157 75,393 170,550 108,513 11,901 120,414
Total unpaid principal balance ofmortgage loans . . . . . . . . . . . . . . . . 423,981 2,566,016 2,989,997 275,170 141,373 416,543
Unamortized premiums (discounts) andother cost basis adjustments, net . . . . . . (16,470) 11,786 (4,684) (11,196) 28 (11,168)
Lower of cost or fair value adjustments onloans held for sale . . . . . . . . . . . . . . . (28) (9) (37) (729) (160) (889)
Allowance for loan losses for loans heldfor investment . . . . . . . . . . . . . . . . . . (48,530) (13,026) (61,556) (8,078) (1,847) (9,925)
Total mortgage loans . . . . . . . . . . . . $358,953 $2,564,767 $2,923,720 $255,167 $139,394 $394,561
(1) Certain prior period amounts have been reclassified to conform to the current period presentation.
For the year ended December 31, 2010, we did not redesignate loans between HFI and HFS other than at thetransition date. For the year ended December 31, 2009, we redesignated loans with a carrying value of $1.2 billionfrom HFS to HFI. We redesignated $8.5 billion of HFI loans to HFS for the year ended December 31, 2009.
The following table displays an aging analysis of the total recorded investment in our HFI mortgage loans,excluding loans for which we have elected the fair value option, by portfolio segment and class as of December 31,2010. For purposes of this table, each loan in our portfolio is included in only one segment and class category.
30 - 59 DaysDelinquent
60 - 89 DaysDelinquent
SeriouslyDelinquent(2)
TotalDelinquent Current Total
RecordedInvestment inLoans Over
90 DaysDelinquent
and AccruingInterest
RecordedInvestment
inNonaccrual
Loans
As of December 31, 2010(1)
(Dollars in millions)
Single-Family:Primary(3) . . . . . $47,048 $18,055 $ 93,302 $158,405 $2,299,080 $2,457,485 $139 $110,758Government(4) . . . 125 58 371 554 51,930 52,484 354 —Alt-A . . . . . . . . 8,547 4,097 37,557 50,201 156,951 207,152 21 41,566Other(5) . . . . . . . 3,785 1,831 15,290 20,906 84,473 105,379 80 17,022
Total Single-Family . . . . 59,505 24,041 146,520 230,066 2,592,434 2,822,500 594 169,346
Multifamily(6) . . . . 382 NA 1,132 1,514 171,000 172,514 — 1,012
Total . . . . . . $59,887 $24,041 $147,652 $231,580 $2,763,434 $2,995,014 $594 $170,358
(1) Recorded investment consists of unpaid principal balance, net of unamortized premiums and discounts, other cost basisand fair value adjustments and accrued interest receivable on HFI loans, excluding loans for which we have elected thefair value option.
(2) Single-family seriously delinquent loans are loans that are 90 days or more past due or in the foreclosure process.Multifamily seriously delinquent loans are loans that are 60 days or more past due.
F-51
FANNIE MAE(In conservatorship)
NOTES TO CONSOLIDATED FINANCIAL STATEMENTS—(Continued)

(3) Consists of mortgage loans that are not included in other loan classes.(4) Consists of mortgage loans guaranteed or insured, in whole or in part, by the U.S. government or one of its agencies
that are not Alt-A. Primarily consists of reverse mortgages which due to their nature are not aged and included in thecurrent column.
(5) Includes loans with higher-risk loan characteristics, such as interest-only loans and negative-amortizing loans that areneither government nor Alt-A.
(6) Multifamily loans 60-89 days delinquent are included in the seriously delinquent column.
The recorded investment in loans over 90 days delinquent and accruing interest was $612 million as ofDecember 31, 2009. The carrying value of all nonaccrual loans was $34.1 billion as of December 31, 2009.
Individually Impaired Loans
Individually impaired loans include TDRs, acquired credit-impaired loans, and other multifamily loansregardless of whether we are currently accruing interest. The following table displays the total recordedinvestment, unpaid principal balance, related allowance, average recorded investment and interest incomerecognized as of December 31, 2010 for individually impaired loans, excluding loans for which we haveelected the fair value option.
UnpaidPrincipalBalance
TotalRecorded
Investment(1)
RelatedAllowance forLoan Losses
RelatedAllowance for
AccruedInterest
Receivable
AverageRecorded
Investment
Total InterestIncome
Recognized(2)
InterestIncome
Recognized ona Cash Basis
As of December 31, 2010For the Year EndedDecember 31, 2010
(Dollars in millions)
Individually impaired loans:With related allowance recorded
Single-familyPrimary(3) . . . . . . . . . . . . . . $ 99,838 $ 93,024 $23,565 $ 772 $ 81,258 $3,314 $1,470Government(4) . . . . . . . . . . . 240 248 38 7 141 9 —Alt-A . . . . . . . . . . . . . . . . . 30,932 28,253 9,592 368 25,361 897 407Other(5) . . . . . . . . . . . . . . . . 14,429 13,689 4,479 137 12,094 384 204
Total single-family . . . . . . . 145,439 135,214 37,674 1,284 118,854 4,604 2,081Multifamily . . . . . . . . . . . . . . . 2,372 2,371 556 23 1,496 202 10
Total individually impaired loanswith related allowancerecorded . . . . . . . . . . . . . . . 147,811 137,585 38,230 1,307 120,350 4,806 2,091
With no related allowancerecorded(6)
Single-familyPrimary(3) . . . . . . . . . . . . . . 10,586 7,237 — — 7,860 336 55Government(4) . . . . . . . . . . . 19 13 — — 11 8 —Alt-A . . . . . . . . . . . . . . . . . 3,600 1,884 — — 2,091 121 20Other(5) . . . . . . . . . . . . . . . . 879 512 — — 589 36 7
Total single-family . . . . . . . 15,084 9,646 — — 10,551 501 82Multifamily . . . . . . . . . . . . . . . 789 811 — — 642 71 5
Total individually impaired loanswith no related allowancerecorded . . . . . . . . . . . . . . . 15,873 10,457 — — 11,193 572 87
Total individually impairedloans(7) . . . . . . . . . . . . . . . . . . $163,684 $148,042 $38,230 $1,307 $131,543 $5,378 $2,178
F-52
FANNIE MAE(In conservatorship)
NOTES TO CONSOLIDATED FINANCIAL STATEMENTS—(Continued)

(1) Consists of unpaid principal balance, net of unamortized premiums and discounts, other cost basis and fair valueadjustments and accrued interest receivable on HFI loans, excluding loans for which we have elected the fair valueoption.
(2) Total single-family interest income recognized of $5.1 billion consists of $3.9 billion of contractual interest and$1.3 billion of effective yield adjustments.
(3) Consists of mortgage loans that are not included in other loan classes.(4) Consists of mortgage loans guaranteed or insured, in whole or in part, by the U.S. government or one of its agencies
that are not Alt-A.(5) Includes loans with higher-risk characteristics, such as interest-only loans and negative-amortizing loans that are
neither government nor Alt-A.(6) The discounted cash flows, collateral value or fair value equals or exceeds the carrying value of the loan and, as such,
no valuation allowance is required.(7) Includes single-family loans restructured in a TDR with a recorded investment of $140.1 billion as of December 31,
2010. Includes multifamily loans restructured in a TDR with a recorded investment of $939 million as ofDecember 31, 2010.
The following table displays the recorded investment and corresponding specific loss allowance as ofDecember 31, 2009 for all impaired loans.
RecordedInvestment Allowance Net Investment
As of December 31, 2009
(Dollars in millions)
Impaired loans:(1)
With valuation allowance . . . . . . . . . . . . . . . . . . . . . . . . . . . . . . $27,050 $5,995 $21,055
Without valuation allowance(2) . . . . . . . . . . . . . . . . . . . . . . . . . . 8,420 — 8,420
Total . . . . . . . . . . . . . . . . . . . . . . . . . . . . . . . . . . . . . . . . . . . . . . $35,470 $5,995 $29,475
(1) Includes single-family loans restructured in a TDR with a recorded investment of $23.9 billion as of December 31,2009. Includes multifamily loans restructured in a TDR with a recorded investment of $51 million as of December 31,2009.
(2) The discounted cash flows, collateral value or fair value equals or exceeds the carrying value of the loan and, as such,no valuation allowance is required.
The average recorded investment in impaired loans was $13.3 billion and $4.8 billion for the years endedDecember 31, 2009 and 2008. Interest income recognized on impaired loans was $532 million and$251 million for the years ended December 31, 2009 and 2008, respectively.
F-53
FANNIE MAE(In conservatorship)
NOTES TO CONSOLIDATED FINANCIAL STATEMENTS—(Continued)

Loans Acquired in a Transfer
We acquired delinquent loans from unconsolidated trusts and long-term standby commitments with an unpaidprincipal balance plus accrued interest of $279 million, $36.4 billion and $4.5 billion for the years endedDecember 31, 2010, 2009 and 2008, respectively. The following table displays the outstanding balance andcarrying amount of acquired credit-impaired loans as of December 31, 2010 and 2009, excluding loans thatwere modified as TDRs subsequent to their acquisition from MBS trusts.
2010 2009As of December 31,
(Dollars in millions)
Outstanding contractual balance . . . . . . . . . . . . . . . . . . . . . . . . . . . . . . . . . . . . . . . $8,519 $24,106Carrying amount:
Loans on accrual status . . . . . . . . . . . . . . . . . . . . . . . . . . . . . . . . . . . . . . . . . . . 2,029 2,560Loans on nonaccrual status . . . . . . . . . . . . . . . . . . . . . . . . . . . . . . . . . . . . . . . . 2,449 8,952
Total carrying amount of loans . . . . . . . . . . . . . . . . . . . . . . . . . . . . . . . . . . . . . . . $4,478 $11,512
The following table displays details on acquired credit-impaired loans at their acquisition dates for the yearsended December 31, 2010, 2009 and 2008.
2010 2009 2008
For the Year EndedDecember 31,
(Dollars in millions)
Contractually required principal and interest payments at acquisition(1) . . . . . . . . . . $321 $39,197 $5,034
Nonaccretable difference . . . . . . . . . . . . . . . . . . . . . . . . . . . . . . . . . . . . . . . . . . 154 9,234 783
Cash flows expected to be collected at acquisition(1) . . . . . . . . . . . . . . . . . . . . . . . 167 29,963 4,251
Accretable yield . . . . . . . . . . . . . . . . . . . . . . . . . . . . . . . . . . . . . . . . . . . . . . . . 76 13,852 1,805
Initial investment in acquired credit-impaired loans at acquisition . . . . . . . . . . . . . . $ 91 $16,111 $2,446
(1) Contractually required principal and interest payments at acquisition and cash flows expected to be collected atacquisition are adjusted for the estimated timing and amount of prepayments.
The following table displays activity for the accretable yield of all outstanding acquired credit-impaired loansfor the years ended December 31, 2010, 2009 and 2008. Accreted effective interest is shown for only thoseloans that we were still accounting for as acquired credit-impaired loans for the respective periods.
2010 2009 2008For the Year Ended December 31,
(Dollars in millions)
Beginning balance, January 1 . . . . . . . . . . . . . . . . . . . . . . . . . . . . . . . . . . . $10,117 $ 1,559 $ 2,252
Additions . . . . . . . . . . . . . . . . . . . . . . . . . . . . . . . . . . . . . . . . . . . . . . . . . 76 13,852 1,805
Accretion . . . . . . . . . . . . . . . . . . . . . . . . . . . . . . . . . . . . . . . . . . . . . . . . . (314) (215) (279)
Reductions(1) . . . . . . . . . . . . . . . . . . . . . . . . . . . . . . . . . . . . . . . . . . . . . . . (6,067) (13,693) (2,294)
Changes in estimated cash flows(2) . . . . . . . . . . . . . . . . . . . . . . . . . . . . . . . . (1,163) 8,729 420
Reclassifications to nonaccretable difference(3) . . . . . . . . . . . . . . . . . . . . . . . (237) (115) (345)
Ending balance, December 31 . . . . . . . . . . . . . . . . . . . . . . . . . . . . . . . . . . . $ 2,412 $ 10,117 $ 1,559
(1) Reductions are the result of liquidations and loan modifications due to TDRs.(2) Represents changes in expected cash flows due to changes in prepayment and other assumptions.(3) Represents changes in expected cash flows due to changes in credit quality or credit assumptions.
F-54
FANNIE MAE(In conservatorship)
NOTES TO CONSOLIDATED FINANCIAL STATEMENTS—(Continued)

The following table displays interest income recognized and the impact to the “Provision for loan losses”related to loans that are still being accounted for as acquired credit-impaired loans, as well as loans that havebeen subsequently modified as a TDR, for the years ended December 31, 2010, 2009 and 2008. The accretionof fair value discount reported in the table below relates primarily to credit-impaired loans that were acquiredprior to the transition date. Subsequent to the transition date, our consolidated statements of operations nolonger reflect the recognition of fair value losses on the majority of acquisitions of credit-impaired loansbecause the loans are already recorded in our consolidated balance sheets at the time of purchase.
2010 2009 2008
For the Year EndedDecember 31,
(Dollars in millions)
Accretion of fair value discount(1) . . . . . . . . . . . . . . . . . . . . . . . . . . . . . . . . . . . . . . $1,024 $405 $158
Interest income on loans returned to accrual status or subsequently modified asTDRs . . . . . . . . . . . . . . . . . . . . . . . . . . . . . . . . . . . . . . . . . . . . . . . . . . . . . . . . 1,148 214 476
Total interest income recognized on acquired credit-impaired loans . . . . . . . . . . . $2,172 $619 $634
Increase in “Provision for loan losses” subsequent to the acquisition of credit-impairedloans . . . . . . . . . . . . . . . . . . . . . . . . . . . . . . . . . . . . . . . . . . . . . . . . . . . . . . . . $ 963 $691 $185
(1) Represents accretion of the fair value discount that was recorded on acquired credit-impaired loans.
5. Allowance for Loan Losses and Reserve for Guaranty Losses
We maintain an allowance for loan losses for loans held for investment in our mortgage portfolio and loansbacking Fannie Mae MBS issued from consolidated trusts and a reserve for guaranty losses related to loansbacking Fannie Mae MBS issued from unconsolidated trusts and loans that we have guaranteed under long-term standby commitments. We refer to our allowance for loan losses and reserve for guaranty lossescollectively as our combined loss reserves. When calculating our reserve for guaranty losses, we consider allcontractually past due interest income including payments expected to be missed between the balance sheetdate and the point of loan acquisition or foreclosure. When calculating our loan loss allowance, we consideronly our net recorded investment in the loan at the balance sheet date, which includes interest income onlywhile the loan was on accrual status. Determining the adequacy of our allowance for loan losses and reservefor guaranty losses is complex and requires judgment about the effect of matters that are inherently uncertain.
Upon recognition of the mortgage loans held by newly consolidated trusts and the associated accrued interestreceivable at the transition date of our adoption of the new accounting standards, we increased our “Allowancefor loan losses” by $43.6 billion, increased our “Allowance for accrued interest receivable” by $7.0 billion anddecreased our “Reserve for guaranty losses” by $54.1 billion. The net decrease of $3.5 billion reflects thedifference in the methodology used to estimate incurred losses for our allowance for loan losses and accruedinterest receivable versus our reserve for guaranty losses.
Although our loss models include extensive historical loan performance data, our loss reserve process issubject to risks and uncertainties, particularly in a rapidly changing credit environment. In response to thesechanges, our loss models were updated to reflect a change in our severity calculations to use mark-to-marketLTV ratios rather than LTV ratios at origination, which we believe better reflects the current values of theloans, as well as our methodology for estimating the benefit of payments from lenders to make us whole forlosses on loans due to a breach of representations and warranties.
Our prospective adoption on December 31, 2010 of a new accounting standard on disclosures regarding thecredit quality of financing receivables and allowance for credit losses had a significant impact on thepresentation of our loan and allowance related disclosures.
F-55
FANNIE MAE(In conservatorship)
NOTES TO CONSOLIDATED FINANCIAL STATEMENTS—(Continued)

Allowance for Loan Losses
The following table displays changes in both single-family and multifamily allowance for loan losses for theyear ended December 31, 2010 and total allowance for loan losses for the years ended December 31, 2010,2009 and 2008.
OfFannie
Mae
OfConsolidated
Trusts Total
2010 2009 2008For the Year Ended December 31,
(Dollars in millions)
Single-family allowance for loan losses:
Beginning balance, January 1(1) . . . . . . . . . . . . . $ 6,721 $ 1,749 $ 8,470
Adoption of new accounting standards . . . . . . . . — 43,170 43,170
Provision for loan losses . . . . . . . . . . . . . . . . . . 12,923 11,592 24,515
Charge-offs(2) . . . . . . . . . . . . . . . . . . . . . . . . . (15,438) (7,026) (22,464)
Recoveries . . . . . . . . . . . . . . . . . . . . . . . . . . . 1,913 1,164 3,077
Transfers(3) . . . . . . . . . . . . . . . . . . . . . . . . . . . 44,599 (44,599) —
Net reclassifications(4) . . . . . . . . . . . . . . . . . . . (3,341) 6,553 3,212
Ending balance, December 31 . . . . . . . . . . . . . . $ 47,377 $ 12,603 $ 59,980
Multifamily allowance for loan losses:
Beginning balance, January 1(1) . . . . . . . . . . . . . $ 1,357 $ 98 $ 1,455
Adoption of new accounting standards . . . . . . . . — 406 406
Provision for loan losses . . . . . . . . . . . . . . . . . . 144 43 187
Charge-offs(2) . . . . . . . . . . . . . . . . . . . . . . . . . (414) — (414)
Transfers(3) . . . . . . . . . . . . . . . . . . . . . . . . . . . 115 (115) —
Net reclassifications(4) . . . . . . . . . . . . . . . . . . . (49) (9) (58)
Ending balance, December 31 . . . . . . . . . . . . . . $ 1,153 $ 423 $ 1,576
Total allowance for loan losses:
Beginning balance, January 1(1) . . . . . . . . . . . . . $ 8,078 $ 1,847 $ 9,925 $ 2,772 $ 629
Adoption of new accounting standards . . . . . . . . — 43,576 43,576 — —
Provision for loan losses . . . . . . . . . . . . . . . . . . 13,067 11,635 24,702 9,569 4,022
Charge-offs(2) . . . . . . . . . . . . . . . . . . . . . . . . . (15,852) (7,026) (22,878) (2,245) (1,987)
Recoveries . . . . . . . . . . . . . . . . . . . . . . . . . . . 1,913 1,164 3,077 214 190
Transfers(3) . . . . . . . . . . . . . . . . . . . . . . . . . . . 44,714 (44,714) — — —
Net reclassifications(1)(4) . . . . . . . . . . . . . . . . . . (3,390) 6,544 3,154 (385) (82)
Ending balance, December 31(1)(5)(6) . . . . . . . . . $ 48,530 $ 13,026 $ 61,556 $ 9,925 $ 2,772
(1) Prior period amounts have been reclassified to conform to current year presentation. Current presentation excludes theallowance for accrued interest receivable from the beginning and ending balances.
(2) Total charge-offs includes accrued interest of $2.4 billion, $1.5 billion and $642 million for the years endedDecember 31, 2010, 2009 and 2008, respectively. Single-family charge-offs includes accrued interest of $2.3 billion forthe year ended December 31, 2010. Multifamily charge-offs includes accrued interest of $64 million for the year endedDecember 31, 2010.
(3) Includes transfers from trusts for delinquent loan purchases.
F-56
FANNIE MAE(In conservatorship)
NOTES TO CONSOLIDATED FINANCIAL STATEMENTS—(Continued)

(4) Represents reclassification of amounts recorded in provision for loan losses and charge-offs that relate to allowance foraccrued interest receivable and preforeclosure property taxes and insurance receivable from borrowers.
(5) Total allowance for loan losses includes $385 million, $726 million and $150 million as of December 31, 2010, 2009and 2008, respectively, for acquired credit-impaired loans.
(6) Total single-family allowance for loan losses was $8.5 billion and $2.7 billion as of December 31, 2009 and 2008,respectively. Total multifamily allowance for loan losses was $1.4 billion and $74 million as of December 31, 2009and 2008, respectively.
As of December 31, 2010, the allowance for accrued interest receivable for loans of Fannie Mae and loans ofconsolidated trusts was $3.0 billion and $439 million, respectively. The allowance for accrued interestreceivable was $536 million as of December 31, 2009.
The following table displays the allowance for loan losses and total recorded investment in our HFI loans,excluding loans for which we have elected the fair value option, by impairment or reserve methodology andportfolio segment as of December 31, 2010.
Single-Family Multifamily TotalAs of December 31, 2010
(Dollars in millions)
Allowance for loan losses by segment:
Individually impaired loans . . . . . . . . . . . . . . . . . . . . . . . . . . . . $ 37,296 $ 549 $ 37,845
Collectively reserved loans . . . . . . . . . . . . . . . . . . . . . . . . . . . . 22,306 1,020 23,326
Acquired credit impaired loans . . . . . . . . . . . . . . . . . . . . . . . . . 378 7 385
Recorded investment in loans by segment:(1)
Total loans . . . . . . . . . . . . . . . . . . . . . . . . . . . . . . . . . . . . . . . $2,822,500 $172,514 $2,995,014
Individually impaired loans . . . . . . . . . . . . . . . . . . . . . . . . . . . . 140,062 3,074 143,136
Collectively reserved loans . . . . . . . . . . . . . . . . . . . . . . . . . . . . 2,677,640 169,332 2,846,972
Acquired credit impaired loans . . . . . . . . . . . . . . . . . . . . . . . . . 4,798 108 4,906
(1) Consists of unpaid principal balance, net of unamortized premiums and discounts, other cost basis and fair valueadjustments and accrued interest receivable on HFI loans, excluding loans for which we have elected the fair valueoption.
On December 31, 2010, we entered into an agreement with Bank of America, N.A., and its affiliates, BACHome Loans Servicing, LP, and Countrywide Home Loans, Inc., to address outstanding repurchase requestsfor residential mortgage loans with an unpaid principal balance of $3.9 billion delivered to us by affiliates ofCountrywide Financial Corporation. Bank of America agreed, among other things, to a resolution amount of$1.5 billion, consisting of a cash payment of $1.3 billion and other payments recently made or to be made bythem. We recognized $930 million as a recovery of charge-offs resulting in a reduction to “Provision for loanlosses” and “Allowance for loan losses,” $266 million as a reduction to “Foreclosed property expense” and$142 million as receipt of amounts receivable due to the rescission of mortgage insurance coverage includedin “Other Assets.”
The agreement substantially resolves or addresses outstanding repurchase requests on loans sold to us byCountrywide and permits us to bring claims for any additional breaches of our representations and warrantiesthat are identified with respect to those loans. We continue to work with Bank of America to resolverepurchase requests that remain outstanding, including requests relating to loans delivered to us by Bank ofAmerica, N.A.
Our allowance for loan losses includes an estimate for the benefit of payments from lenders and servicers tomake us whole for losses on loans due to a breach of selling or servicing representations and warranties.
F-57
FANNIE MAE(In conservatorship)
NOTES TO CONSOLIDATED FINANCIAL STATEMENTS—(Continued)

Historically, this estimate was based significantly on historical cash collections. In the fourth quarter of 2010,the following factors impacted this estimate:
• we revised our methodology to take into account trends in management actions taken before cashcollections, which resulted in our allowance for loan losses being $1.1 billion higher than it would havebeen under the previous methodology; and
• agreements with seller/servicers that addressed their loan repurchase and other obligations to us impactedour expectation of future make-whole payments, resulting in a decrease in our allowance for loan lossesof approximately $700 million.
In the three month period ended June 30, 2010, we identified that for a portion of our delinquent loans we hadnot estimated and recorded our obligation to reimburse servicers for advances they made on our behalf forpreforeclosure property taxes and insurance. We previously recognized these expenses when we reimbursedservicers. We also did not record a receivable from borrowers for these payments or assess the collectibility ofthat receivable. As such, our allowance did not include an estimation of uncollectable amounts from thoseborrowers. We evaluated the effects of this misstatement, both quantitatively and qualitatively and concludedthat the misstatement is not material to our 2010 loss or any prior consolidated financial statements.
The year ended December 31, 2010 includes an out-of-period adjustment of $1.1 billion to our consolidatedstatement of operations reflecting our assessment of the collectibility of the receivable from the borrowers.
Reserve for Guaranty Losses
The following table displays changes in the reserve for guaranty losses for the years ended December 31,2010, 2009 and 2008.
2010 2009 2008For the Year Ended December 31,
(Dollars in millions)
Reserve for guaranty losses:
Beginning balance, January 1 . . . . . . . . . . . . . . . . . . . . . . . . . . . . . . $ 54,430 $ 21,830 $ 2,693
Adoption of new accounting standards . . . . . . . . . . . . . . . . . . . . . . . . (54,103) — —
Provision for guaranty losses . . . . . . . . . . . . . . . . . . . . . . . . . . . . . . 194 63,057 23,929
Charge-offs(1)(2) . . . . . . . . . . . . . . . . . . . . . . . . . . . . . . . . . . . . . . . . (203) (31,142) (4,986)
Recoveries . . . . . . . . . . . . . . . . . . . . . . . . . . . . . . . . . . . . . . . . . . . 5 685 194
Ending balance, December 31 . . . . . . . . . . . . . . . . . . . . . . . . . . . . . . $ 323 $ 54,430 $21,830
(1) Includes charges of $228 million and $333 million for the years ended December 31, 2009 and 2008, respectively,related to unsecured HomeSaver Advance loans. There were no charges related to unsecured HomeSaver Advanceloans for the year ended December 31, 2010.
(2) Includes charges recorded at the date of acquisition of $180 million, $20.3 billion and $2.1 billion for the years endedDecember 31, 2010, 2009 and 2008, respectively, for acquired credit-impaired loans where the acquisition costexceeded the fair value of the acquired loan.
F-58
FANNIE MAE(In conservatorship)
NOTES TO CONSOLIDATED FINANCIAL STATEMENTS—(Continued)

Credit Quality Indicators
The following table displays the total recorded investment in our HFI loans, excluding loans for which wehave elected the fair value option, by portfolio segment, class and credit quality indicators as of December 31,2010. The single-family credit quality indicator is updated quarterly and the multifamily credit qualityindicators are as of the origination date of each loan.
Primary(3) Alt-A Other(4)As of December 31, 2010(1)(2)
(Dollars in millions)
Single-family
Estimated mark-to-market LTV ratio:(5)
Less than or equal to 80% . . . . . . . . . . . . . . . . . . . . . . . . . . . . . . . $1,561,202 $ 79,305 $ 29,854
80.01% to 90% . . . . . . . . . . . . . . . . . . . . . . . . . . . . . . . . . . . . . . 376,414 27,472 13,394
90.01% to 100% . . . . . . . . . . . . . . . . . . . . . . . . . . . . . . . . . . . . . 217,193 24,392 12,935
100.01% to 110%. . . . . . . . . . . . . . . . . . . . . . . . . . . . . . . . . . . . . 112,376 18,022 11,400
110.01% to 120%. . . . . . . . . . . . . . . . . . . . . . . . . . . . . . . . . . . . . 62,283 12,718 8,967
120.01% to 125%. . . . . . . . . . . . . . . . . . . . . . . . . . . . . . . . . . . . . 21,729 5,083 3,733
Greater than 125% . . . . . . . . . . . . . . . . . . . . . . . . . . . . . . . . . . . . 106,288 40,160 25,096
Total . . . . . . . . . . . . . . . . . . . . . . . . . . . . . . . . . . . . . . . . . . . . $2,457,485 $207,152 $105,379
As of December 31, 2010(1)
(Dollars in millions)
Multifamily
Originating LTV ratio:
Less than or equal to 70%. . . . . . . . . . . . . . . . . . . . . . . . . . . . . . . . . . . . . . . $ 96,844
70.01% to 80% . . . . . . . . . . . . . . . . . . . . . . . . . . . . . . . . . . . . . . . . . . . . . . 71,560
Greater than 80% . . . . . . . . . . . . . . . . . . . . . . . . . . . . . . . . . . . . . . . . . . . . . 4,110
Total . . . . . . . . . . . . . . . . . . . . . . . . . . . . . . . . . . . . . . . . . . . . . . . . . . . . $172,514
Originating debt service coverage ratio:
Less than or equal to 1.10% . . . . . . . . . . . . . . . . . . . . . . . . . . . . . . . . . . . . . $ 15,034
1.11% to 1.25% . . . . . . . . . . . . . . . . . . . . . . . . . . . . . . . . . . . . . . . . . . . . . . 50,745
Greater than 1.25% . . . . . . . . . . . . . . . . . . . . . . . . . . . . . . . . . . . . . . . . . . . 106,735
Total . . . . . . . . . . . . . . . . . . . . . . . . . . . . . . . . . . . . . . . . . . . . . . . . . . . . $172,514
(1) Recorded investment consists of unpaid principal balance, net of unamortized premiums and discounts, other cost basisand fair value adjustments and accrued interest receivable on HFI loans, excluding loans for which we have elected thefair value option.
(2) Excludes $52.5 billion of mortgage loans guaranteed or insured, in whole or in part, by the U.S. government or one ofits agencies that are not Alt-A loans. The segment class is primarily reverse mortgages for which we do not calculatean estimated mark-to-market LTV.
(3) Consists of mortgage loans that are not included in other loan classes.(4) Includes loans with higher-risk loan characteristics, such as interest-only loans and negative-amortizing loans that are
neither government nor Alt-A.(5) The aggregate estimated mark-to-market LTV ratio is based on the unpaid principal balance of the loan as of the end
of each reported period divided by the estimated current value of the property, which we calculate using an internalvaluation model that estimates periodic changes in home value.
F-59
FANNIE MAE(In conservatorship)
NOTES TO CONSOLIDATED FINANCIAL STATEMENTS—(Continued)

6. Investments in Securities
Trading Securities
Trading securities are recorded at fair value with subsequent changes in fair value recorded as “Fair valuelosses, net” in our consolidated statements of operations. The following table displays our investments intrading securities and the cumulative amount of net losses recognized from holding these securities as ofDecember 31, 2010 and 2009.
2010 2009As of December 31,
(Dollars in millions)
Mortgage-related securities:
Fannie Mae . . . . . . . . . . . . . . . . . . . . . . . . . . . . . . . . . . . . . . . . . . . . . . . . . . . . . . $ 7,398 $ 74,750
Freddie Mac . . . . . . . . . . . . . . . . . . . . . . . . . . . . . . . . . . . . . . . . . . . . . . . . . . . . . 1,326 15,082
Ginnie Mae . . . . . . . . . . . . . . . . . . . . . . . . . . . . . . . . . . . . . . . . . . . . . . . . . . . . . . 590 1
Alt-A private-label securities . . . . . . . . . . . . . . . . . . . . . . . . . . . . . . . . . . . . . . . . . . 1,683 1,355
Subprime private-label securities . . . . . . . . . . . . . . . . . . . . . . . . . . . . . . . . . . . . . . . 1,581 1,780
CMBS . . . . . . . . . . . . . . . . . . . . . . . . . . . . . . . . . . . . . . . . . . . . . . . . . . . . . . . . . 10,764 9,335
Mortgage revenue bonds . . . . . . . . . . . . . . . . . . . . . . . . . . . . . . . . . . . . . . . . . . . . . 609 600
Other mortgage-related securities . . . . . . . . . . . . . . . . . . . . . . . . . . . . . . . . . . . . . . . 152 154
Total . . . . . . . . . . . . . . . . . . . . . . . . . . . . . . . . . . . . . . . . . . . . . . . . . . . . . . . . . 24,103 103,057
Non-mortgage-related securities:
U.S. Treasury securities . . . . . . . . . . . . . . . . . . . . . . . . . . . . . . . . . . . . . . . . . . . . . 27,432 3
Asset-backed securities . . . . . . . . . . . . . . . . . . . . . . . . . . . . . . . . . . . . . . . . . . . . . . 5,321 8,515
Corporate debt securities. . . . . . . . . . . . . . . . . . . . . . . . . . . . . . . . . . . . . . . . . . . . . — 364
Total . . . . . . . . . . . . . . . . . . . . . . . . . . . . . . . . . . . . . . . . . . . . . . . . . . . . . . . . . 32,753 8,882
Total trading securities . . . . . . . . . . . . . . . . . . . . . . . . . . . . . . . . . . . . . . . . . . . . . . . . $56,856 $111,939
Losses in trading securities held in our portfolio, net . . . . . . . . . . . . . . . . . . . . . . . . . . . $ 2,149 $ 2,685
As of December 31, 2010, we held U.S. Treasury securities and money market funds with fair values of$4.0 billion and $2.3 billion, respectively, which we elected to classify as “Cash and cash equivalents” in ourconsolidated balance sheets.
F-60
FANNIE MAE(In conservatorship)
NOTES TO CONSOLIDATED FINANCIAL STATEMENTS—(Continued)

The following table displays information about our net trading gains and losses for the years endedDecember 31, 2010, 2009 and 2008.
2010 2009 2008
For the Year EndedDecember 31,
(Dollars in millions)
Net trading gains (losses):
Mortgage-related securities . . . . . . . . . . . . . . . . . . . . . . . . . . . . . . . . . . . . . . $2,607 $2,457 $(4,297)
Non-mortgage-related securities . . . . . . . . . . . . . . . . . . . . . . . . . . . . . . . . . . 85 1,287 (2,743)
Total . . . . . . . . . . . . . . . . . . . . . . . . . . . . . . . . . . . . . . . . . . . . . . . . . . . $2,692 $3,744 $(7,040)
Net trading gains (losses) recorded in the year related to securities still held atyear end:
Mortgage-related securities . . . . . . . . . . . . . . . . . . . . . . . . . . . . . . . . . . . . . . $2,485 $1,974 $(4,464)
Non-mortgage-related securities . . . . . . . . . . . . . . . . . . . . . . . . . . . . . . . . . . 56 1,146 (2,418)
Total . . . . . . . . . . . . . . . . . . . . . . . . . . . . . . . . . . . . . . . . . . . . . . . . . . . $2,541 $3,120 $(6,882)
Available-for-Sale Securities
We measure AFS securities at fair value with unrealized gains and losses recorded as a component of AOCI,net of tax, in our consolidated balance sheets. We record realized gains and losses from the sale of AFSsecurities in “Investment gains (losses), net” in our consolidated statements of operations.
The following table displays the gross realized gains, losses and proceeds on sales of AFS securities for theyears ended December 31, 2010, 2009 and 2008.
2010 2009 2008For the Year Ended December 31,
(Dollars in millions)
Gross realized gains . . . . . . . . . . . . . . . . . . . . . . . . . . . . . . . . . . . . . . . . . $ 566 $ 4,521 $ 4,022
Gross realized losses . . . . . . . . . . . . . . . . . . . . . . . . . . . . . . . . . . . . . . . . . 293 3,080 3,635
Total proceeds(1) . . . . . . . . . . . . . . . . . . . . . . . . . . . . . . . . . . . . . . . . . . . . 7,207 226,664 130,991
(1) Excludes proceeds from the initial sale of securities from new portfolio securitizations included in “Note 3,Consolidations and Transfers of Financial Assets.”
F-61
FANNIE MAE(In conservatorship)
NOTES TO CONSOLIDATED FINANCIAL STATEMENTS—(Continued)

The following tables display the amortized cost, gross unrealized gains and losses and fair value by majorsecurity type for AFS securities we held as of December 31, 2010 and 2009.
TotalAmortized
Cost(1)
GrossUnrealized
Gains
GrossUnrealized
Losses -OTTI(2)
GrossUnrealized
Losses -Other(3)
TotalFair
Value
As of December 31, 2010
(Dollars in millions)
Fannie Mae . . . . . . . . . . . . . . . . . . . . . . . . . . $21,428 $1,453 $ (9) $ (44) $22,828
Freddie Mac . . . . . . . . . . . . . . . . . . . . . . . . . 15,986 1,010 — — 16,996
Ginnie Mae . . . . . . . . . . . . . . . . . . . . . . . . . . 909 130 — — 1,039
Alt-A private-label securities . . . . . . . . . . . . . . 15,789 177 (1,791) (285) 13,890
Subprime private-label securities . . . . . . . . . . . 11,323 54 (997) (448) 9,932
CMBS(4) . . . . . . . . . . . . . . . . . . . . . . . . . . . . 15,273 25 — (454) 14,844
Mortgage revenue bonds . . . . . . . . . . . . . . . . . 11,792 47 (64) (734) 11,041
Other mortgage-related securities . . . . . . . . . . . 4,098 106 (44) (338) 3,822
Total . . . . . . . . . . . . . . . . . . . . . . . . . . . . . . . $96,598 $3,002 $(2,905) $(2,303) $94,392
TotalAmortized
Cost(1)
GrossUnrealized
Gains
GrossUnrealized
Losses -OTTI(2)
GrossUnrealized
Losses -Other(3)
TotalFair
Value
As of December 31, 2009
(Dollars in millions)
Fannie Mae . . . . . . . . . . . . . . . . . . . . . . . . . $148,074 $6,413 $ (23) $ (45) $154,419
Freddie Mac . . . . . . . . . . . . . . . . . . . . . . . . 26,281 1,192 — (4) 27,469
Ginnie Mae . . . . . . . . . . . . . . . . . . . . . . . . . 1,253 102 — (2) 1,353
Alt-A private-label securities . . . . . . . . . . . . . 17,836 41 (2,738) (989) 14,150
Subprime private-label securities . . . . . . . . . . 13,232 33 (1,774) (745) 10,746
CMBS(4) . . . . . . . . . . . . . . . . . . . . . . . . . . . 15,797 — — (2,604) 13,193
Mortgage revenue bonds . . . . . . . . . . . . . . . . 13,679 71 (44) (860) 12,846
Other mortgage-related securities . . . . . . . . . . 4,225 29 (235) (467) 3,552
Total . . . . . . . . . . . . . . . . . . . . . . . . . . . . . . $240,377 $7,881 $(4,814) $(5,716) $237,728
(1) Amortized cost includes unamortized premiums, discounts and other cost basis adjustments as well as the creditcomponent of other-than-temporary impairments recognized in our consolidated statements of operations.
(2) Represents the noncredit component of other-than-temporary impairment losses recorded in other comprehensive lossas well as cumulative changes in fair value for securities for which we previously recognized the credit component ofan other-than-temporary impairment.
(3) Represents the gross unrealized losses on securities for which we have not recognized an other-than-temporaryimpairment.
(4) Amortized cost includes $848 million and $1.0 billion as of December 31, 2010 and 2009, respectively, of increase tothe carrying amount from fair value hedge accounting in 2008.
F-62
FANNIE MAE(In conservatorship)
NOTES TO CONSOLIDATED FINANCIAL STATEMENTS—(Continued)

The following tables display additional information regarding gross unrealized losses and fair value by majorsecurity type for AFS securities in an unrealized loss position that we held as of December 31, 2010 and2009.
GrossUnrealized
LossesFair
Value
GrossUnrealized
LossesFair
Value
Less Than 12Consecutive Months
12 ConsecutiveMonths or Longer
As of December 31, 2010
(Dollars in millions)
Fannie Mae . . . . . . . . . . . . . . . . . . . . . . . . . . . . . . . . . . . . . $ (35) $ 1,461 $ (18) $ 211
Freddie Mac . . . . . . . . . . . . . . . . . . . . . . . . . . . . . . . . . . . . — 11 — 7
Ginnie Mae . . . . . . . . . . . . . . . . . . . . . . . . . . . . . . . . . . . . . — 1 — —
Alt-A private-label securities . . . . . . . . . . . . . . . . . . . . . . . . . (104) 1,915 (1,972) 9,388
Subprime private-label securities . . . . . . . . . . . . . . . . . . . . . . (47) 627 (1,398) 8,493
CMBS . . . . . . . . . . . . . . . . . . . . . . . . . . . . . . . . . . . . . . . . (15) 1,774 (439) 10,396
Mortgage revenue bonds . . . . . . . . . . . . . . . . . . . . . . . . . . . . (206) 5,009 (592) 3,129
Other mortgage-related securities . . . . . . . . . . . . . . . . . . . . . . (2) 250 (380) 2,007
Total . . . . . . . . . . . . . . . . . . . . . . . . . . . . . . . . . . . . . . . . . . $(409) $11,048 $(4,799) $33,631
GrossUnrealized
LossesFair
Value
GrossUnrealized
LossesFair
Value
Less Than 12Consecutive Months
12 ConsecutiveMonths or Longer
As of December 31, 2009
(Dollars in millions)
Fannie Mae . . . . . . . . . . . . . . . . . . . . . . . . . . . . . . . . . . . . . $ (36) $ 1,461 $ (32) $ 544
Freddie Mac . . . . . . . . . . . . . . . . . . . . . . . . . . . . . . . . . . . . (2) 85 (2) 164
Ginnie Mae . . . . . . . . . . . . . . . . . . . . . . . . . . . . . . . . . . . . . (2) 139 — 26
Alt-A private-label securities . . . . . . . . . . . . . . . . . . . . . . . . . (2,439) 7,018 (1,288) 6,929
Subprime private-label securities . . . . . . . . . . . . . . . . . . . . . . (998) 4,595 (1,521) 5,860
CMBS . . . . . . . . . . . . . . . . . . . . . . . . . . . . . . . . . . . . . . . . — — (2,604) 13,193
Mortgage revenue bonds . . . . . . . . . . . . . . . . . . . . . . . . . . . . (54) 2,392 (850) 5,664
Other mortgage-related securities . . . . . . . . . . . . . . . . . . . . . . (96) 536 (606) 2,739
Total . . . . . . . . . . . . . . . . . . . . . . . . . . . . . . . . . . . . . . . . . . $(3,627) $16,226 $(6,903) $35,119
Other-Than-Temporary Impairments
We recognize the credit component of other-than-temporary impairments of our debt securities in ourconsolidated statements of operations and the noncredit component in “Other comprehensive loss” for thosesecurities that we do not intend to sell and for which it is not more likely than not that we will be required tosell before recovery.
The fair value of our securities varies from period to period due to changes in interest rates, in theperformance of the underlying collateral and in the credit performance of the underlying issuer, among otherfactors. $4.8 billion of the $5.2 billion of gross unrealized losses on AFS securities as of December 31, 2010have existed for a period of 12 consecutive months or longer. Gross unrealized losses on AFS securities as ofDecember 31, 2010 include unrealized losses on securities with other-than-temporary impairment in which a
F-63
FANNIE MAE(In conservatorship)
NOTES TO CONSOLIDATED FINANCIAL STATEMENTS—(Continued)

portion of the impairment remains in AOCI. The securities with unrealized losses for 12 consecutive monthsor longer, on average, had a fair value as of December 31, 2010 that was 88% of their amortized cost basis.Based on our review for impairments of AFS securities, which includes an evaluation of the collectibility ofcash flows and any intent or requirement to sell the securities, we have concluded that we do not have anintent to sell and we believe it is not more likely than not that we will be required to sell the securities.Additionally, our projections of cash flows indicate that we will recover these unrealized losses over the livesof the securities.
The following table displays our net other-than-temporary impairments by major security type recognized inour consolidated statements of operations for the years ended December 31, 2010, 2009 and 2008.
2010 2009 2008
For the Year EndedDecember 31,
(Dollars in millions)
Fannie Mae . . . . . . . . . . . . . . . . . . . . . . . . . . . . . . . . . . . . . . . . . . . . . . . . . . $ (3) $ (117) $ (7)
Alt-A private-label securities . . . . . . . . . . . . . . . . . . . . . . . . . . . . . . . . . . . . . . (327) (3,956) (4,820)
Subprime private-label securities . . . . . . . . . . . . . . . . . . . . . . . . . . . . . . . . . . . . (368) (5,660) (1,932)
Mortgage revenue bonds . . . . . . . . . . . . . . . . . . . . . . . . . . . . . . . . . . . . . . . . . (2) (22) (21)
Other . . . . . . . . . . . . . . . . . . . . . . . . . . . . . . . . . . . . . . . . . . . . . . . . . . . . . . . (22) (106) (194)
Net other-than-temporary impairments . . . . . . . . . . . . . . . . . . . . . . . . . . . . . . . . $(722) $(9,861) $(6,974)
For the year ended December 31, 2010, we recorded net other-than-temporary impairment of $722 million.The net other-than-temporary impairment charges recorded in 2010 were primarily driven by a net decline inforecasted home prices for certain geographic regions, which resulted in a decrease in the present value of ourcash flow projections on Alt-A and subprime securities.
The following table displays activity for the years ended December 31, 2010 and 2009 related to the creditcomponent recognized in earnings on debt securities held by us for which we recognized a portion ofother-than-temporary impairment in AOCI.
2010 2009
For the Year EndedDecember 31,
(Dollars in millions)
Balance, January 1 . . . . . . . . . . . . . . . . . . . . . . . . . . . . . . . . . . . . . . . . . . . . . . . . . . . $8,191 $ —
Credit component of other-than-temporary impairment not reclassified to AOCI inconjunction with the cumulative effect transition adjustment . . . . . . . . . . . . . . . . . . . . . — 4,265
Additions for the credit component on debt securities for which OTTI was not previouslyrecognized . . . . . . . . . . . . . . . . . . . . . . . . . . . . . . . . . . . . . . . . . . . . . . . . . . . . . . . 29 1,090
Additions for credit losses on debt securities for which OTTI was previously recognized. . . 693 3,118
Reductions for securities no longer in portfolio at period end(1) . . . . . . . . . . . . . . . . . . . . (154) —
Reductions for amortization resulting from increases in cash flows expected to be collectedover the remaining life of the security . . . . . . . . . . . . . . . . . . . . . . . . . . . . . . . . . . . . (544) (282)
Balance, December 31 . . . . . . . . . . . . . . . . . . . . . . . . . . . . . . . . . . . . . . . . . . . . . . . . . $8,215 $8,191
(1) Includes securities sold, matured, called or consolidated to loans.
As of December 31, 2010, those debt securities with other-than-temporary impairment for which werecognized in our consolidated statement of operations only the amount of loss related to credit consistedpredominantly of Alt-A and subprime securities. We evaluate Alt-A (including option adjustable rate mortgage
F-64
FANNIE MAE(In conservatorship)
NOTES TO CONSOLIDATED FINANCIAL STATEMENTS—(Continued)

(“ARM”)) and subprime private-label securities for other-than-temporary impairment by discounting theprojected cash flows from econometric models to estimate the portion of loss in value attributable to credit. Toreduce costs associated with maintaining our internal model and decrease the operational risk, in the fourthquarter of 2010, we ceased to use our internally developed model and began using a third-party model toproject cash flow estimates on our private-label securities. Separate components of the third-party modelproject regional home prices, unemployment and interest rates. The model combines these factors withavailable current information regarding attributes of loans in pools backing the private-label mortgage-relatedsecurities to project prepayment speeds, conditional default rates, loss severities and delinquency rates. Itincorporates detailed information on security-level subordination levels and cash flow priority of payments toproject security level cash flows. We model securities assuming the benefit of those external financialguarantees that are deemed creditworthy. We have recorded other-than-temporary impairments for the yearended December 31, 2010 based on this analysis, with amounts related to credit loss recognized in ourconsolidated statements of operations. For securities we determined were not other-than-temporarily impaired,we concluded that either the bond had no projected credit loss or if we projected a loss, that the present valueof expected cash flows was greater than the security’s cost basis.
The following table displays the modeled attributes, including default rates and severities, which are used todetermine whether our senior interests in certain non-agency mortgage-related securities will experience a cashshortfall. Assumption of voluntary prepayment rates are also an input to the present value of expected losses.
Subprime Option ARM Fixed Rate Variable Rate Hybrid RateAlt-A
As of December 31, 2010
(Dollars in millions)
Vintage Year
2004 & Prior:
Unpaid principal balance . . . . . . . . . . . . . . . . $ 2,216 $ 521 $3,862 $ 544 $2,521
Weighted average collateral default(1) . . . . . . . 40.5% 38.8% 11.2% 34.9% 19.5%
Weighted average collateral severities(2). . . . . . 61.9% 46.6% 43.4% 45.0% 38.0%
Weighted average voluntary prepaymentrates(3) . . . . . . . . . . . . . . . . . . . . . . . . . . . 4.0% 6.1% 8.5% 8.3% 10.6%
Average credit enhancement(4) . . . . . . . . . . . . 51.1% 19.5% 11.9% 21.6% 10.7%
2005
Unpaid principal balance . . . . . . . . . . . . . . . . $ 206 $1,401 $1,297 $ 585 $2,578
Weighted average collateral default(1) . . . . . . . 76.2% 59.8% 41.9% 57.9% 42.0%
Weighted average collateral severities(2). . . . . . 73.9% 55.5% 59.3% 60.2% 52.6%
Weighted average voluntary prepaymentrates(3) . . . . . . . . . . . . . . . . . . . . . . . . . . . 1.6% 3.9% 6.4% 7.0% 7.9%
Average credit enhancement(4) . . . . . . . . . . . . 63.5% 30.0% 2.4% 19.5% 7.1%
2006
Unpaid principal balance . . . . . . . . . . . . . . . . $12,565 $1,379 $ 626 $1,793 $1,965
Weighted average collateral default(1) . . . . . . . 78.9% 73.8% 45.9% 61.8% 34.4%
Weighted average collateral severities(2). . . . . . 74.1% 62.0% 64.1% 64.6% 49.5%
Weighted average voluntary prepaymentrates(3) . . . . . . . . . . . . . . . . . . . . . . . . . . . 1.7% 3.2% 5.8% 6.2% 9.3%
Average credit enhancement(4) . . . . . . . . . . . . 20.4% 22.8% 3.2% 2.2% 2.1%
F-65
FANNIE MAE(In conservatorship)
NOTES TO CONSOLIDATED FINANCIAL STATEMENTS—(Continued)

Subprime Option ARM Fixed Rate Variable Rate Hybrid RateAlt-A
As of December 31, 2010
(Dollars in millions)
2007 & After:
Unpaid principal balance . . . . . . . . . . . . . . . . $ 656 $ — $ — $ — $ 129
Weighted average collateral default(1) . . . . . . . 72.8% N/A N/A N/A 43.7%
Weighted average collateral severities(2). . . . . . 70.2% N/A N/A N/A 54.8%
Weighted average voluntary prepaymentrates(3) . . . . . . . . . . . . . . . . . . . . . . . . . . . 1.6% N/A N/A N/A 6.7%
Average credit enhancement(4) . . . . . . . . . . . . 34.5% N/A N/A N/A 25.3%
Total
Unpaid principal balance . . . . . . . . . . . . . . . . $15,643 $3,301 $5,785 $2,922 $7,193
Weighted average collateral default(1) . . . . . . . 73.2% 62.4% 21.9% 56.0% 32.1%
Weighted average collateral severities(2). . . . . . 72.2% 56.8% 49.2% 60.1% 46.7%
Weighted average voluntary prepaymentrates(3) . . . . . . . . . . . . . . . . . . . . . . . . . . . 2.0% 3.9% 7.7% 6.8% 9.2%
Average credit enhancement(4) . . . . . . . . . . . . 25.9% 25.3% 8.9% 9.3% 7.4%
(1) The expected remaining cumulative default rate of the collateral pool backing the securities, as a percentage of thecurrent collateral unpaid principal balance, weighted by security unpaid principal balance.
(2) The expected remaining loss given default of the collateral pool backing the securities, calculated as the ratio ofremaining cumulative loss divided by cumulative defaults, weighted by security unpaid principal balance.
(3) The average monthly voluntary prepayment rate, weighted by security unpaid principal balance.(4) The average percent current credit enhancement provided by subordination of other securities. Excludes excess interest
projections and monoline bond insurance.
For mortgage revenue bonds, where we cannot utilize credit-sensitized cash flows, we perform a qualitativeand quantitative analysis to assess whether a bond is other-than-temporarily impaired. If a bond is deemed tobe other-than-temporarily impaired, the projected contractual cash flows of the security are reduced by adefault loss amount based on the security’s lowest credit rating as provided by the major nationally recognizedstatistical rating organizations. The lower the security’s credit rating, the larger the amount by which thecontractual cash flows are reduced. These adjusted cash flows are then used in the present value calculation todetermine the credit portion of the other-than-temporary impairment. While we have recognizedother-than-temporary impairment on these bonds, we expect to realize no credit losses on the vast majority ofour holdings due to the inherent financial strength of the issuers, or in some cases, the amount of externalcredit support from mortgage collateral or financial guarantees. The fair values of these bonds are likewiseimpacted by the low levels of market liquidity and greater expected yield, which has led to unrealized lossesin the portfolio that we deem to be temporary.
Other mortgage-related securities include manufactured housing securities, some of which have beenother-than-temporarily impaired in 2010. For manufactured housing securities, we utilize models thatincorporate recent historical performance information and other relevant public data to run cash flows andassess for other-than-temporary impairment. Given the significant seasoning of these securities we expect thatthe future performance will be in line with how the securities are currently performing. We model securitiesassuming the benefit of those external financial guarantees that are deemed creditworthy. If we determinedthat securities were not other-than-temporarily impaired, we concluded that either the bond had no projectedcredit loss or, if a loss was projected, that present value of expected cash flows was greater than the security’scost basis.
F-66
FANNIE MAE(In conservatorship)
NOTES TO CONSOLIDATED FINANCIAL STATEMENTS—(Continued)

We analyzed commercial mortgage-backed securities (“CMBS”) using a CMBS loss forecast model thatincorporates a loan level loss forecast. This forecast takes into account loan performance, loan status, loanattributes, structures, metropolitan area, property type and macroeconomic expectations. Given the current highlevel of credit enhancement and collateral loss expectations, no single bond is expected to experience aprincipal write-down or interest shortfall. Our CMBS loss forecast expectations may change asmacroeconomic conditions and the commercial real estate market evolve. As of December 31, 2010, we hadno other-than-temporary impairments in our holdings of CMBS as we projected the remaining subordination tobe more than sufficient to absorb the level of projected losses. While downgrades have occurred in this sector,all of our holdings remained investment grade as of December 31, 2010.
Maturity Information
The following table displays the amortized cost and fair value of our AFS securities by major security typeand remaining maturity, assuming no principal prepayments, as of December 31, 2010. Contractual maturity ofmortgage-backed securities is not a reliable indicator of their expected life because borrowers generally havethe right to prepay their obligations at any time.
TotalAmortized
Cost
TotalFair
ValueAmortized
CostFair
ValueAmortized
CostFair
ValueAmortized
CostFair
ValueAmortized
CostFair
Value
One Year or LessAfter One Year
Through Five YearsAfter Five Years
Through Ten Years After Ten Years
As of December 31, 2010
(Dollars in millions)
Fannie Mae . . . . . . . . . . . . . . . . . . . . $21,428 $22,828 $ — $ — $ 2 $ 2 $ 3,876 $ 4,103 $17,550 $18,723Freddie Mac . . . . . . . . . . . . . . . . . . . 15,986 16,996 5 5 37 39 1,571 1,683 14,373 15,269Ginnie Mae. . . . . . . . . . . . . . . . . . . . 909 1,039 — — — — 5 5 904 1,034Alt-A private-label securities . . . . . . . . 15,789 13,890 — — 1 1 294 296 15,494 13,593Subprime private-label securities . . . . . . 11,323 9,932 — — — — — — 11,323 9,932CMBS . . . . . . . . . . . . . . . . . . . . . . . 15,273 14,844 308 308 275 276 14,342 13,953 348 307Mortgage revenue bonds . . . . . . . . . . . 11,792 11,041 61 62 374 385 818 819 10,539 9,775Other mortgage-related securities . . . . . . 4,098 3,822 — — — — — 16 4,098 3,806
Total . . . . . . . . . . . . . . . . . . . . . . . . $96,598 $94,392 $ 374 $375 $ 689 $703 $20,906 $20,875 $74,629 $72,439
Weighted average yield(1) . . . . . . . . . . . 4.32% 5.52% 5.55% 4.25% 4.32%
(1) Yields are determined by dividing interest income (including the amortization and accretion of premiums, discountsand other cost basis adjustments) by amortized cost balances as of year-end. Yields on tax exempt obligations havebeen computed on a tax equivalent basis.
Accumulated Other Comprehensive Loss
The following table displays our accumulated other comprehensive loss by major categories as ofDecember 31, 2010, 2009 and 2008.
2010(1) 2009 2008As of December 31,
(Dollars in millions)
Net unrealized gains (losses) on available-for-sale securities for which we havenot recorded other-than-temporary impairment . . . . . . . . . . . . . . . . . . . . . . . $ 304 $ 1,337 $(7,291)
Net unrealized losses on available-for-sale securities for which we have recordedother-than-temporary impairment . . . . . . . . . . . . . . . . . . . . . . . . . . . . . . . . (1,736) (3,059) —
Other . . . . . . . . . . . . . . . . . . . . . . . . . . . . . . . . . . . . . . . . . . . . . . . . . . . . . (250) (10) (382)
Accumulated other comprehensive loss . . . . . . . . . . . . . . . . . . . . . . . . . . . . $(1,682) $(1,732) $(7,673)
(1) Includes a net increase of $3.4 billion from the adoption of the new accounting standards.
F-67
FANNIE MAE(In conservatorship)
NOTES TO CONSOLIDATED FINANCIAL STATEMENTS—(Continued)

7. Financial Guarantees and Master Servicing
We generate revenue by absorbing the credit risk of mortgage loans in unconsolidated trusts in exchange for aguaranty fee. We also provide credit enhancements on taxable or tax-exempt mortgage revenue bonds issuedby state and local governmental entities to finance multifamily housing for low- and moderate-incomefamilies. Additionally, we issue long-term standby commitments that require us to purchase loans from lendersif the loans meet certain delinquency criteria.
As a result of adopting the new accounting standards, we derecognized the previously recognized guarantyassets, guaranty obligations, MSAs, and master servicing liabilities (“MSLs”) associated with the newlyconsolidated trusts from our consolidated balance sheets.
For our guarantees to unconsolidated trusts and other guaranty arrangements, we recognize a guarantyobligation for our obligation to stand ready to perform on these guarantees. For those guarantees recognized inour consolidated balance sheet, our maximum potential exposure under these guarantees is primarilycomprised of the unpaid principal balance of the underlying mortgage loans, which totaled $52.4 billion as ofDecember 31, 2010. The maximum amount we could recover through available credit enhancements andrecourse with third parties on guarantees recognized in our consolidated balance sheet was $12.6 billion as ofDecember 31, 2010. In addition, we had exposure of $10.3 billion for other guarantees not recognized in ourconsolidated balance sheet as of December 31, 2010, which primarily represents the unpaid principal balanceof loans underlying guarantees issued prior to the effective date of the current accounting standards onguaranty accounting. The maximum amount we could recover through available credit enhancements andrecourse with third parties on guarantees not recognized in our consolidated balance sheet was $3.9 billion asof December 31, 2010. Recoverability of such credit enhancements and recourse is subject to, among otherfactors, our mortgage insurers’ and financial guarantors’ ability to meet their obligations to us.
As of December 31, 2009, our maximum potential exposure for guarantees recognized in our consolidatedbalance sheet was primarily comprised of the unpaid principal balance of the underlying mortgage loans,which totaled $2.5 trillion. The maximum amount we could recover through available credit enhancements andrecourse with third parties for these guarantees was $113.4 billion. In addition, we had exposure of$135.7 billion for other guarantees not recognized in our consolidated balance sheet as of December 31, 2009.The maximum amount we could recover through available credit enhancements and recourse with third partieson guarantees not recognized in our consolidated balance sheet was $13.6 billion as of December 31, 2009.
Risk Characteristics of our Book of Business
We gauge our performance risk under our guaranty based on the delinquency status of the mortgage loans wehold in portfolio, or in the case of mortgage-backed securities, the underlying mortgage loans of the relatedsecurities. Management also monitors the serious delinquency rate, which is the percentage of single-familyloans three or more months past due or in the foreclosure process, and the percentage of multifamily loans60 days or more past due, of loans with certain higher risk characteristics, such as high mark-to-marketloan-to-value ratios and low originating debt service coverage ratios. We use this information, in conjunctionwith housing market and economic conditions, to structure our pricing and our eligibility and underwritingcriteria to accurately reflect the current risk of loans with these higher-risk characteristics, and in some caseswe decide to significantly reduce our participation in riskier loan product categories. Management also usesthis data together with other credit risk measures to identify key trends that guide the development of our lossmitigation strategies.
F-68
FANNIE MAE(In conservatorship)
NOTES TO CONSOLIDATED FINANCIAL STATEMENTS—(Continued)

The following tables display the current delinquency status and certain higher risk characteristics of oursingle-family conventional and total multifamily guaranty book of business as of December 31, 2010 and2009.
30 daysDelinquent
60 daysDelinquent
SeriouslyDelinquent(2)
30 daysDelinquent
60 daysDelinquent
SeriouslyDelinquent(2)
As of December 31, 2010(1) As of December 31, 2009(1)
Percentage of single-familyconventional guaranty book ofbusiness(3) . . . . . . . . . . . . . . . . . 2.19% 0.89% 5.37% 2.38% 1.15% 6.68%
Percentage of single-familyconventional loans(4) . . . . . . . . . . 2.32 0.87 4.48 2.46 1.07 5.38
Percentage ofSingle-FamilyConventional
Guaranty Bookof Business(3)
PercentageSeriously
Delinquent(2)(4)
Percentage ofSingle-FamilyConventional
Guaranty Bookof Business(3)
PercentageSeriously
Delinquent(2)(4)
As of December 31, 2010(1) As of December 31, 2009(1)
Estimated mark-to-market loan-to-valueratio:Less than 100% . . . . . . . . . . . . . . . . . 84% 2.62% 86% 3.36%100.01% to 110% . . . . . . . . . . . . . . . . 5 11.60 5 14.79110.01% to 120% . . . . . . . . . . . . . . . . 3 14.74 3 18.55120.01% to 125% . . . . . . . . . . . . . . . . 1 16.86 1 21.39Greater than 125% . . . . . . . . . . . . . . . 7 24.71 5 31.05
Geographical distribution:Arizona . . . . . . . . . . . . . . . . . . . . . . . 2 6.23 3 8.80California . . . . . . . . . . . . . . . . . . . . . . 18 3.89 17 5.73Florida . . . . . . . . . . . . . . . . . . . . . . . . 7 12.31 7 12.82Nevada . . . . . . . . . . . . . . . . . . . . . . . 1 10.66 1 13.00Select Midwest states(5) . . . . . . . . . . . . 11 4.80 11 5.62All other states . . . . . . . . . . . . . . . . . . 61 3.46 61 4.11
Product distribution (not mutuallyexclusive):(6)
Alt-A . . . . . . . . . . . . . . . . . . . . . . . . . 8 13.87 9 15.63Subprime . . . . . . . . . . . . . . . . . . . . . . * 28.20 * 30.68Negatively amortizing adjustable rate. . . * 9.02 1 10.29Interest only . . . . . . . . . . . . . . . . . . . . 6 17.85 7 20.17Investor property . . . . . . . . . . . . . . . . . 6 4.79 6 5.54Condo/Coop . . . . . . . . . . . . . . . . . . . . 9 5.37 9 5.99Original loan-to-value ratio H90%(7) . . . 10 10.04 9 13.05FICO credit score G620(7) . . . . . . . . . . 4 14.63 4 18.20Original loan-to-value ratio H90% and
FICO credit score G620(7) . . . . . . . . 1 21.41 1 27.96Vintages:
2005 . . . . . . . . . . . . . . . . . . . . . . . . . 9 7.20 10 7.272006 . . . . . . . . . . . . . . . . . . . . . . . . . 8 12.19 11 12.872007 . . . . . . . . . . . . . . . . . . . . . . . . . 12 13.24 15 14.062008 . . . . . . . . . . . . . . . . . . . . . . . . . 9 4.88 13 3.98All other vintages . . . . . . . . . . . . . . . . 62 1.73 51 2.19
* Represents less than 0.5% of the single-family conventional guaranty book of business.(1) Consists of the portion of our single-family conventional guaranty book of business for which we have detailed loan
level information, which constituted over 99% and 98% of our total single-family conventional guaranty book ofbusiness as of December 31, 2010 and 2009, respectively.
F-69
FANNIE MAE(In conservatorship)
NOTES TO CONSOLIDATED FINANCIAL STATEMENTS—(Continued)

(2) Consists of single-family conventional loans that were three months or more past due or in foreclosure as ofDecember 31, 2010 and 2009.
(3) Calculated based on the aggregate unpaid principal balance of delinquent single-family conventional loans divided bythe aggregate unpaid principal balance of loans in our single-family conventional guaranty book of business.
(4) Calculated based on the number of single-family conventional loans that were delinquent divided by the total numberof loans in our single-family conventional guaranty book of business.
(5) Consists of Illinois, Indiana, Michigan, and Ohio.(6) Categories are not mutually exclusive. Loans with multiple product features are included in all applicable categories.(7) Includes housing goals-oriented products such as MyCommunityMortgage» and Expanded Approval».
30 DaysDelinquent
SeriouslyDelinquent(3)
30 DaysDelinquent
SeriouslyDelinquent(3)
As of December 31, 2010(1)(2) As of December 31, 2009(1)(2)
Percentage of multifamily guaranty book of business. . . . . . . . . 0.21% 0.71% 0.28% 0.63%
Percentage ofMultifamilyGuaranty
Book of Business
PercentageSeriously
Delinquent
Percentage ofMultifamilyGuaranty
Book of Business
PercentageSeriously
Delinquent
As of December 31, 2010(1)(2) As of December 31, 2009(1)(2)
Originating loan-to-value ratio:Greater than 80% . . . . . . . . . . . . . . . . . . . . 5% 0.59% 5% 0.50%Less than or equal to 80%. . . . . . . . . . . . . . 95 0.71 95 0.63
Originating debt service coverage ratio:Less than or equal to 1.10 . . . . . . . . . . . . . . 9 0.27 10 0.17Greater than 1.10 . . . . . . . . . . . . . . . . . . . . 91 0.75 90 0.68
Acquisition loan size distribution:Less than or equal to $750,000 . . . . . . . . . . 2 1.61 3 1.27Greater than $750,000 and less than or equal
to $3 million . . . . . . . . . . . . . . . . . . . . . 12 1.17 13 1.01Greater than $3 million and less than or
equal to $5 million . . . . . . . . . . . . . . . . . 9 0.88 9 1.08Greater than $5 million and less than or
equal to $25 million . . . . . . . . . . . . . . . . 42 0.88 41 0.60Greater than $25 million . . . . . . . . . . . . . . . 35 0.24 34 0.34
Maturing dates:Maturing in 2011 . . . . . . . . . . . . . . . . . . . . 3 0.68 5 0.64Maturing in 2012 . . . . . . . . . . . . . . . . . . . . 7 0.42 10 1.13Maturing in 2013 . . . . . . . . . . . . . . . . . . . . 11 0.54 12 0.22Maturing in 2014 . . . . . . . . . . . . . . . . . . . . 8 0.67 9 0.62Maturing in 2015 . . . . . . . . . . . . . . . . . . . . 9 0.57
(1) Consists of the portion of our multifamily guaranty book of business for which we have detailed loan levelinformation, which constituted 99% our total multifamily guaranty book of business as of both December 31, 2010 and2009, excluding loans that have been defeased. Defeasance is a pre-payment of a loan through substitution ofcollateral.
(2) Calculated based on the aggregate unpaid principal balance of delinquent multifamily loans divided by the aggregateunpaid principal balance of loans in our multifamily guaranty book of business.
(3) Consists of multifamily loans that were 60 days or more past due as of December 31, 2010 and 2009.
F-70
FANNIE MAE(In conservatorship)
NOTES TO CONSOLIDATED FINANCIAL STATEMENTS—(Continued)
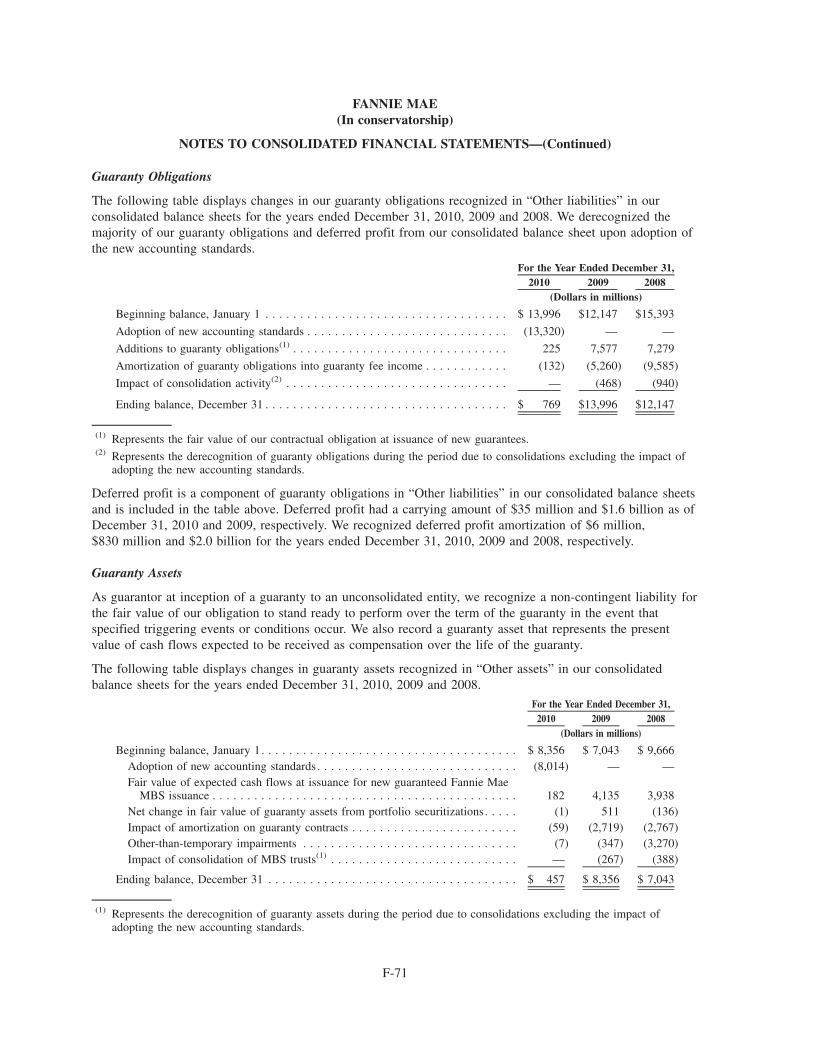
Guaranty Obligations
The following table displays changes in our guaranty obligations recognized in “Other liabilities” in ourconsolidated balance sheets for the years ended December 31, 2010, 2009 and 2008. We derecognized themajority of our guaranty obligations and deferred profit from our consolidated balance sheet upon adoption ofthe new accounting standards.
2010 2009 2008For the Year Ended December 31,
(Dollars in millions)
Beginning balance, January 1 . . . . . . . . . . . . . . . . . . . . . . . . . . . . . . . . . . . $ 13,996 $12,147 $15,393
Adoption of new accounting standards . . . . . . . . . . . . . . . . . . . . . . . . . . . . . (13,320) — —
Additions to guaranty obligations(1) . . . . . . . . . . . . . . . . . . . . . . . . . . . . . . . 225 7,577 7,279
Amortization of guaranty obligations into guaranty fee income . . . . . . . . . . . . (132) (5,260) (9,585)
Impact of consolidation activity(2) . . . . . . . . . . . . . . . . . . . . . . . . . . . . . . . . — (468) (940)
Ending balance, December 31 . . . . . . . . . . . . . . . . . . . . . . . . . . . . . . . . . . . $ 769 $13,996 $12,147
(1) Represents the fair value of our contractual obligation at issuance of new guarantees.(2) Represents the derecognition of guaranty obligations during the period due to consolidations excluding the impact of
adopting the new accounting standards.
Deferred profit is a component of guaranty obligations in “Other liabilities” in our consolidated balance sheetsand is included in the table above. Deferred profit had a carrying amount of $35 million and $1.6 billion as ofDecember 31, 2010 and 2009, respectively. We recognized deferred profit amortization of $6 million,$830 million and $2.0 billion for the years ended December 31, 2010, 2009 and 2008, respectively.
Guaranty Assets
As guarantor at inception of a guaranty to an unconsolidated entity, we recognize a non-contingent liability forthe fair value of our obligation to stand ready to perform over the term of the guaranty in the event thatspecified triggering events or conditions occur. We also record a guaranty asset that represents the presentvalue of cash flows expected to be received as compensation over the life of the guaranty.
The following table displays changes in guaranty assets recognized in “Other assets” in our consolidatedbalance sheets for the years ended December 31, 2010, 2009 and 2008.
2010 2009 2008For the Year Ended December 31,
(Dollars in millions)
Beginning balance, January 1. . . . . . . . . . . . . . . . . . . . . . . . . . . . . . . . . . . . . $ 8,356 $ 7,043 $ 9,666Adoption of new accounting standards . . . . . . . . . . . . . . . . . . . . . . . . . . . . . (8,014) — —Fair value of expected cash flows at issuance for new guaranteed Fannie Mae
MBS issuance . . . . . . . . . . . . . . . . . . . . . . . . . . . . . . . . . . . . . . . . . . . . 182 4,135 3,938Net change in fair value of guaranty assets from portfolio securitizations. . . . . (1) 511 (136)Impact of amortization on guaranty contracts . . . . . . . . . . . . . . . . . . . . . . . . (59) (2,719) (2,767)Other-than-temporary impairments . . . . . . . . . . . . . . . . . . . . . . . . . . . . . . . (7) (347) (3,270)Impact of consolidation of MBS trusts(1) . . . . . . . . . . . . . . . . . . . . . . . . . . . — (267) (388)
Ending balance, December 31 . . . . . . . . . . . . . . . . . . . . . . . . . . . . . . . . . . . . $ 457 $ 8,356 $ 7,043
(1) Represents the derecognition of guaranty assets during the period due to consolidations excluding the impact ofadopting the new accounting standards.
F-71
FANNIE MAE(In conservatorship)
NOTES TO CONSOLIDATED FINANCIAL STATEMENTS—(Continued)

Fannie Mae MBS Included in Investments in Securities
For Fannie Mae MBS included in “Investments in securities” in our consolidated balance sheets, we do noteliminate or extinguish the guaranty arrangement because it is a contractual arrangement with theunconsolidated MBS trusts. We determine the fair value of Fannie Mae MBS based on observable marketprices because most Fannie Mae MBS are actively traded. Fannie Mae MBS receive high credit quality ratingsprimarily because of our guaranty. Absent our guaranty, Fannie Mae MBS would be subject to the credit riskon the underlying loans. We continue to recognize a guaranty obligation and a reserve for guaranty lossesassociated with these securities because we carry these securities in our consolidated financial statements asguaranteed Fannie Mae MBS. The fair value of the guaranty obligation, net of deferred profit, associated withFannie Mae MBS included in “Investments in securities” approximates the fair value of the credit risk thatexists on these Fannie Mae MBS absent our guaranty. The fair value of our guaranty obligations associatedwith the Fannie Mae MBS included in “Investments in securities” was $2.0 billion and $4.8 billion as ofDecember 31, 2010 and 2009, respectively.
Master Servicing
We do not perform the day-to-day servicing of mortgage loans in a Fannie Mae MBS trust. We arecompensated, however, for carrying out administrative functions for the trust and overseeing the primaryservicer’s performance of the day-to-day servicing of the trust’s mortgage assets. For trusts that are notconsolidated by us, this arrangement gives rise to either an MSA or an MSL. However, upon consolidation ofthe majority of our MBS trusts on January 1, 2010, we eliminated the majority of our MSA and MSL.
The following table displays the carrying value and fair value of our MSA for the years ended December 31,2010, 2009 and 2008.
2010 2009 2008For the Year Ended December 31,
(Dollars in millions)
Cost basis:
Beginning balance, January 1 . . . . . . . . . . . . . . . . . . . . . . . . . . . . . . . . . . . . $ 196 $ 764 $1,171
Adoption of new accounting standards . . . . . . . . . . . . . . . . . . . . . . . . . . . . . . (195) — —
Additions . . . . . . . . . . . . . . . . . . . . . . . . . . . . . . . . . . . . . . . . . . . . . . . . . . — 56 302
Amortization . . . . . . . . . . . . . . . . . . . . . . . . . . . . . . . . . . . . . . . . . . . . . . . . — (44) (190)
Other-than-temporary impairments . . . . . . . . . . . . . . . . . . . . . . . . . . . . . . . . . — (579) (491)
Reductions for MBS trusts paid-off and impact of consolidation activity(1) . . . . . — (1) (28)
Ending balance, December 31 . . . . . . . . . . . . . . . . . . . . . . . . . . . . . . . . . . . . 1 196 764
Valuation allowance . . . . . . . . . . . . . . . . . . . . . . . . . . . . . . . . . . . . . . . . . . . . . 1 40 73
Carrying value . . . . . . . . . . . . . . . . . . . . . . . . . . . . . . . . . . . . . . . . . . . . . . . . $ — $ 156 $ 691
Fair value, beginning of period . . . . . . . . . . . . . . . . . . . . . . . . . . . . . . . . . . . . . $ 179 $ 855 $1,808
Fair value, end of period . . . . . . . . . . . . . . . . . . . . . . . . . . . . . . . . . . . . . . . . . $ — $ 179 $ 855
(1) Excluding impact of adopting the new accounting standards.
The carrying value of our MSL, which approximates its fair value, was $25 million and $481 million as ofDecember 31, 2010 and 2009, respectively.
Prior to January 1, 2010, we recognized servicing income, referred to as “Trust management income,” in ourconsolidated statements of operations. Upon implementation of the new accounting standards, we report the
F-72
FANNIE MAE(In conservatorship)
NOTES TO CONSOLIDATED FINANCIAL STATEMENTS—(Continued)

trust management income earned by consolidated trusts as a component of net interest income in ourconsolidated statements of operations. We recognized no servicing income for non-consolidated trusts in 2010.Trust management income of $40 million and $261 million relating to non-consolidated trusts for the yearsended December 31, 2009 and 2008, respectively, has been reclassified as a component of “Fee and otherincome” in our consolidated statements of operations.
8. Acquired Property, Net
Acquired property, net consists of held-for-sale foreclosed property received in full satisfaction of a loan net ofa valuation allowance for declines in the fair value of foreclosed properties after initial acquisition. We classifyas held for sale those properties that we intend to sell and are actively marketed for sale. The following tabledisplays the activity in acquired property and the related valuation allowance for the years endedDecember 31, 2010, 2009 and 2008.
AcquiredProperty
ValuationAllowance(1)
AcquiredProperty, Net
(Dollars in millions)
Balance, January 1, 2008 . . . . . . . . . . . . . . . . . . . . . . . . . . . . . . . . $ 3,853 $ (251) $ 3,602
Additions . . . . . . . . . . . . . . . . . . . . . . . . . . . . . . . . . . . . . . . . . . . 10,853 (75) 10,778
Disposals . . . . . . . . . . . . . . . . . . . . . . . . . . . . . . . . . . . . . . . . . . . (6,666) 664 (6,002)
Write-downs, net of recoveries . . . . . . . . . . . . . . . . . . . . . . . . . . . . — (1,460) (1,460)
Balance, December 31, 2008 . . . . . . . . . . . . . . . . . . . . . . . . . . . . . . 8,040 (1,122) 6,918
Additions . . . . . . . . . . . . . . . . . . . . . . . . . . . . . . . . . . . . . . . . . . . 14,165 (79) 14,086
Disposals . . . . . . . . . . . . . . . . . . . . . . . . . . . . . . . . . . . . . . . . . . . (12,489) 1,379 (11,110)
Write-downs, net of recoveries . . . . . . . . . . . . . . . . . . . . . . . . . . . . — (752) (752)
Balance, December 31, 2009 . . . . . . . . . . . . . . . . . . . . . . . . . . . . . . 9,716 (574) 9,142
Additions . . . . . . . . . . . . . . . . . . . . . . . . . . . . . . . . . . . . . . . . . . . 25,982 (783) 25,199
Disposals . . . . . . . . . . . . . . . . . . . . . . . . . . . . . . . . . . . . . . . . . . . (17,644) 1,407 (16,237)
Write-downs, net of recoveries . . . . . . . . . . . . . . . . . . . . . . . . . . . . — (1,931) (1,931)
Balance, December 31, 2010 . . . . . . . . . . . . . . . . . . . . . . . . . . . . . . $ 18,054 $(1,881) $ 16,173
(1) Reflects activities in the valuation allowance for acquired properties held primarily by our single-family segment.
We classify as held for use those properties that we do not intend to sell or that are not ready for immediatesale in their current condition and are reflected in “Other assets” in our consolidated balance sheets. Thefollowing table displays the activity and carrying amount of acquired properties held for use for the yearsended December 31, 2010, 2009 and 2008. The increase in held for use property is primarily from rentingproperties rather than actively marketing them.
2010 2009 2008
For the Year EndedDecember 31,
(Dollars in millions)
Beginning balance, January 1 . . . . . . . . . . . . . . . . . . . . . . . . . . . . . . . . . . . . . . . . . . $ 44 $ 11 $107
Transfers in from held for sale, net and additions . . . . . . . . . . . . . . . . . . . . . . . . . . . . . 977 45 1
Transfers to held for sale, net . . . . . . . . . . . . . . . . . . . . . . . . . . . . . . . . . . . . . . . . . . (64) (11) (93)
Depreciation and asset write-downs . . . . . . . . . . . . . . . . . . . . . . . . . . . . . . . . . . . . . . (68) (1) (4)
Ending balance, December 31 . . . . . . . . . . . . . . . . . . . . . . . . . . . . . . . . . . . . . . . . . . $889 $ 44 $ 11
F-73
FANNIE MAE(In conservatorship)
NOTES TO CONSOLIDATED FINANCIAL STATEMENTS—(Continued)

9. Short-Term Borrowings and Long-Term Debt
Our short-term borrowings and long-term debt increased significantly due to our adoption of the newaccounting standards on the transfers of financial assets and the consolidation of VIEs.
Short-Term Borrowings
Our short-term borrowings (borrowings with an original contractual maturity of one year or less) consist ofboth “Federal funds purchased and securities sold under agreements to repurchase” and “Short-term debt” inour consolidated balance sheets. The following table displays our outstanding short-term borrowings andweighted-average interest rates of these borrowings as of December 31, 2010 and 2009.
Outstanding
Weighted-AverageInterestRate(1) Outstanding
Weighted-AverageInterestRate(1)
2010 2009As of December 31,
(Dollars in millions)
Federal funds purchased and securities sold underagreements to repurchase. . . . . . . . . . . . . . . . . . . . . . $ 52 2.20% $ — —%
Fixed-rate short-term debt:
Discount notes . . . . . . . . . . . . . . . . . . . . . . . . . . . . . $151,500 0.32% $199,987 0.27%
Foreign exchange discount notes . . . . . . . . . . . . . . . . 384 2.43 300 1.50
Other short-term debt . . . . . . . . . . . . . . . . . . . . . . . . — — 100 0.53
Total fixed-rate short-term debt . . . . . . . . . . . . . . . . 151,884 0.32 200,387 0.27
Floating-rate short-term debt(2) . . . . . . . . . . . . . . . . . . . — — 50 0.02
Total short-term debt of Fannie Mae . . . . . . . . . . . . . . 151,884 0.32 200,437 0.27
Debt of consolidated trusts . . . . . . . . . . . . . . . . . . . . . . 5,359 0.23 — —
Total short-term debt . . . . . . . . . . . . . . . . . . . . . . . . $157,243 0.32% $200,437 0.27%
(1) Includes the effects of discounts, premiums, and other cost basis adjustments.(2) Includes a portion of structured debt instruments that is reported at fair value.
Our federal funds purchased and securities sold under agreements to repurchase represent agreements torepurchase securities from banks with excess reserves on a particular day for a specified price, with repaymentgenerally occurring on the following day. Our short-term debt includes discount notes and foreign exchangediscount notes, as well as other short-term debt. Our discount notes are unsecured general obligations and havematurities ranging from overnight to 360 days from the date of issuance.
Additionally, we issue foreign exchange discount notes in the Euro money market enabling investors to holdshort-term investments in different currencies. We have the ability to issue foreign exchange discount notes inmaturities ranging from 5 to 360 days.
F-74
FANNIE MAE(In conservatorship)
NOTES TO CONSOLIDATED FINANCIAL STATEMENTS—(Continued)

Long-Term Debt
Long-term debt represents borrowings with an original contractual maturity of greater than one year. Thefollowing table displays our outstanding long-term debt as of December 31, 2010 and 2009.
Maturities Outstanding
Weighted-AverageInterestRate(1) Maturities Outstanding
Weighted-AverageInterestRate(1)
2010 2009
As of December 31,
(Dollars in millions)
Senior fixed:
Benchmark notes and bonds . . . . . . . 2011 - 2030 $ 300,344 3.20% 2010 - 2030 $279,945 4.10%
Medium-term notes . . . . . . . . . . . . . 2011 - 2020 199,266 2.13 2010 - 2019 171,207 2.97
Foreign exchange notes and bonds . . . 2017 - 2028 1,177 6.21 2010 - 2028 1,239 5.64
Other long-term debt(2) . . . . . . . . . . . 2011 - 2040 44,893 5.64 2010 - 2039 62,783 5.80
Total senior fixed . . . . . . . . . . . . . 545,680 3.02 515,174 3.94
Senior floating:
Medium-term notes . . . . . . . . . . . . . 2011 - 2015 72,039 0.31 2010 - 2014 41,911 0.26
Other long-term debt(2) . . . . . . . . . . . 2020 - 2037 386 4.92 2020 - 2037 1,041 4.12
Total senior floating . . . . . . . . . . . 72,425 0.34 42,952 0.34
Subordinated fixed:
Qualifying subordinated(3) . . . . . . . . . 2011 - 2014 7,392 5.47 2011 - 2014 7,391 5.47
Subordinated debentures . . . . . . . . . . 2019 2,663 9.91 2019 2,433 9.89
Total subordinated fixed . . . . . . . . 10,055 6.65 9,824 6.57
Total long-term debt of FannieMae(4) . . . . . . . . . . . . . . . . . . . . . 628,160 2.77 567,950 3.71
Debt of consolidated trusts(2) . . . . . . . . 2011 - 2051 2,411,597 4.59 2010 - 2039 6,167 5.63
Total long-term debt . . . . . . . . . . . $3,039,757 4.22% $574,117 3.73%
(1) Includes the effects of discounts, premiums and other cost basis adjustments.(2) Includes a portion of structured debt instruments that is reported at fair value.(3) Consists of subordinated debt issued with an interest deferral feature.(4) Reported amounts include a net discount and other cost basis adjustments of $12.4 billion and $15.6 billion as of
December 31, 2010 and 2009, respectively.
Our long-term debt includes a variety of debt types. We issue both fixed and floating-rate medium-term noteswith maturities greater than one year that are issued through dealer banks. We also offer Benchmark Notes andother bonds in large, regularly-scheduled issuances that provide increased efficiency, liquidity and tradabilityto the market. Additionally, we have issued notes and bonds denominated in several foreign currencies and areable to issue debt in numerous other currencies. We effectively convert all foreign currency-denominatedtransactions into U.S. dollars through the use of foreign currency swaps for the purpose of funding ourmortgage assets.
Our other long-term debt includes callable and non-callable securities, which include all long-term non-Benchmark securities, such as zero-coupon bonds, fixed rate and other long-term securities, and are generallynegotiated underwritings with one or more dealers or dealer banks.
F-75
FANNIE MAE(In conservatorship)
NOTES TO CONSOLIDATED FINANCIAL STATEMENTS—(Continued)
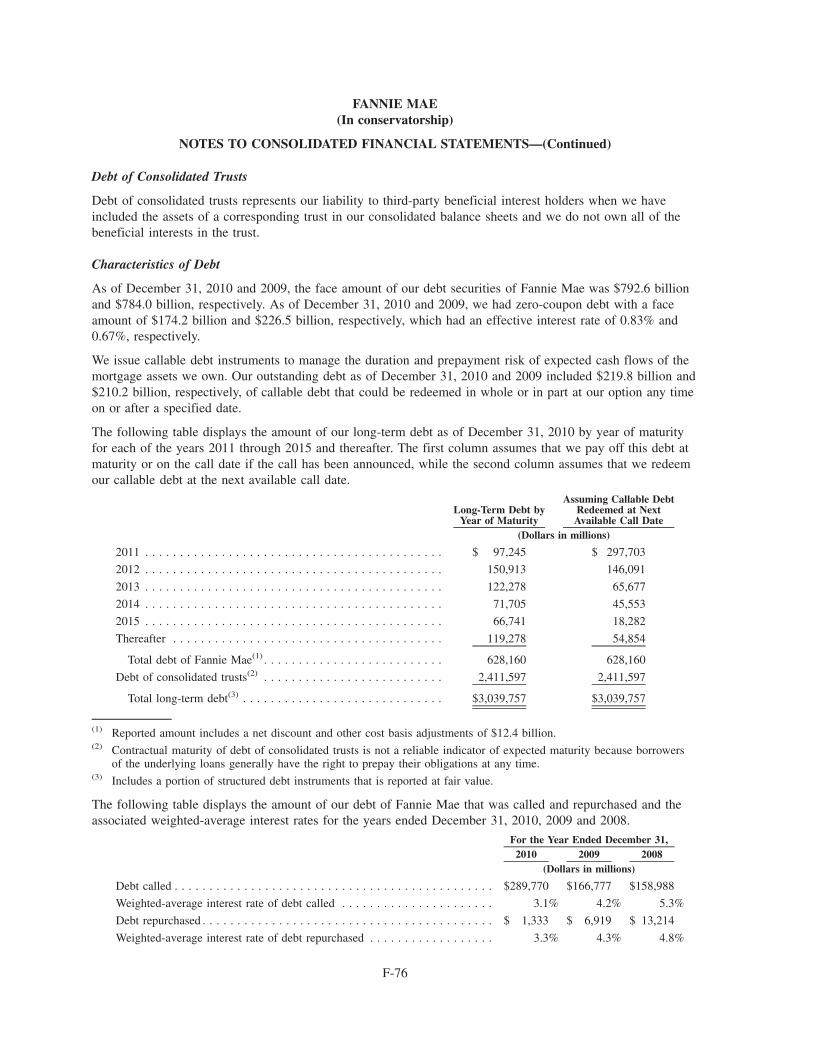
Debt of Consolidated Trusts
Debt of consolidated trusts represents our liability to third-party beneficial interest holders when we haveincluded the assets of a corresponding trust in our consolidated balance sheets and we do not own all of thebeneficial interests in the trust.
Characteristics of Debt
As of December 31, 2010 and 2009, the face amount of our debt securities of Fannie Mae was $792.6 billionand $784.0 billion, respectively. As of December 31, 2010 and 2009, we had zero-coupon debt with a faceamount of $174.2 billion and $226.5 billion, respectively, which had an effective interest rate of 0.83% and0.67%, respectively.
We issue callable debt instruments to manage the duration and prepayment risk of expected cash flows of themortgage assets we own. Our outstanding debt as of December 31, 2010 and 2009 included $219.8 billion and$210.2 billion, respectively, of callable debt that could be redeemed in whole or in part at our option any timeon or after a specified date.
The following table displays the amount of our long-term debt as of December 31, 2010 by year of maturityfor each of the years 2011 through 2015 and thereafter. The first column assumes that we pay off this debt atmaturity or on the call date if the call has been announced, while the second column assumes that we redeemour callable debt at the next available call date.
Long-Term Debt byYear of Maturity
Assuming Callable DebtRedeemed at NextAvailable Call Date
(Dollars in millions)
2011 . . . . . . . . . . . . . . . . . . . . . . . . . . . . . . . . . . . . . . . . . . . $ 97,245 $ 297,703
2012 . . . . . . . . . . . . . . . . . . . . . . . . . . . . . . . . . . . . . . . . . . . 150,913 146,091
2013 . . . . . . . . . . . . . . . . . . . . . . . . . . . . . . . . . . . . . . . . . . . 122,278 65,677
2014 . . . . . . . . . . . . . . . . . . . . . . . . . . . . . . . . . . . . . . . . . . . 71,705 45,553
2015 . . . . . . . . . . . . . . . . . . . . . . . . . . . . . . . . . . . . . . . . . . . 66,741 18,282
Thereafter . . . . . . . . . . . . . . . . . . . . . . . . . . . . . . . . . . . . . . . 119,278 54,854
Total debt of Fannie Mae(1) . . . . . . . . . . . . . . . . . . . . . . . . . . 628,160 628,160
Debt of consolidated trusts(2) . . . . . . . . . . . . . . . . . . . . . . . . . . 2,411,597 2,411,597
Total long-term debt(3) . . . . . . . . . . . . . . . . . . . . . . . . . . . . . $3,039,757 $3,039,757
(1) Reported amount includes a net discount and other cost basis adjustments of $12.4 billion.(2) Contractual maturity of debt of consolidated trusts is not a reliable indicator of expected maturity because borrowers
of the underlying loans generally have the right to prepay their obligations at any time.(3) Includes a portion of structured debt instruments that is reported at fair value.
The following table displays the amount of our debt of Fannie Mae that was called and repurchased and theassociated weighted-average interest rates for the years ended December 31, 2010, 2009 and 2008.
2010 2009 2008For the Year Ended December 31,
(Dollars in millions)
Debt called . . . . . . . . . . . . . . . . . . . . . . . . . . . . . . . . . . . . . . . . . . . . . . $289,770 $166,777 $158,988
Weighted-average interest rate of debt called . . . . . . . . . . . . . . . . . . . . . . 3.1% 4.2% 5.3%
Debt repurchased . . . . . . . . . . . . . . . . . . . . . . . . . . . . . . . . . . . . . . . . . . $ 1,333 $ 6,919 $ 13,214
Weighted-average interest rate of debt repurchased . . . . . . . . . . . . . . . . . . 3.3% 4.3% 4.8%
F-76
FANNIE MAE(In conservatorship)
NOTES TO CONSOLIDATED FINANCIAL STATEMENTS—(Continued)
Intraday Lines of Credit
We periodically use secured and unsecured intraday funding lines of credit provided by several large financialinstitutions. We post collateral which, in some circumstances, the secured party has the right to repledge tothird parties. As these lines of credit are uncommitted intraday loan facilities, we may be unable to draw onthem if and when needed. We had secured uncommitted lines of credit of $25.0 billion and unsecureduncommitted lines of credit of $500 million as of both December 31, 2010 and 2009. We had no borrowingsoutstanding from these lines of credit as of December 31, 2010.
10. Derivative Instruments and Hedging Activities
Derivative instruments are an integral part of our strategy in managing interest rate risk. Derivative instrumentsmay be privately negotiated contracts, which are often referred to as over-the-counter derivatives, or they maybe listed and traded on an exchange. When deciding whether to use derivatives, we consider a number offactors, such as cost, efficiency, the effect on our liquidity, results of operations, and our overall interest raterisk management strategy. We choose to use derivatives when we believe they will provide greater relativevalue or more efficient execution of our strategy than debt securities. We typically do not settle the notionalamount of our risk management derivatives; rather, notional amounts provide the basis for calculating actualpayments or settlement amounts. The derivatives we use for interest rate risk management purposes consistprimarily of contracts that fall into four broad categories:
• Interest rate swap contracts. An interest rate swap is a transaction between two parties in which each partyagrees to exchange payments tied to different interest rates or indices for a specified period of time,generally based on a notional amount of principal. The types of interest rate swaps we use include pay-fixedswaps, receive-fixed swaps and basis swaps.
• Interest rate option contracts. These contracts primarily include pay-fixed swaptions, receive-fixedswaptions, cancelable swaps and interest rate caps. A swaption is an option contract that allows us or acounterparty to enter into a pay-fixed or receive-fixed swap at some point in the future.
• Foreign currency swaps. These swaps convert debt that we issue in foreign-denominated currencies intoU.S. dollars. We enter into foreign currency swaps only to the extent that we issue foreign currency debt.
• Futures. These are standardized exchange-traded contracts that either obligate a buyer to buy an asset at apredetermined date and price or a seller to sell an asset at a predetermined date and price. The types offutures contracts we enter into include Eurodollar, U.S. Treasury and swaps.
We enter into forward purchase and sale commitments that lock in the future delivery of mortgage loans andmortgage-related securities at a fixed price or yield. Certain commitments to purchase mortgage loans andpurchase or sell mortgage-related securities meet the criteria of a derivative. We typically settle the notionalamount of our mortgage commitments that are accounted for as derivatives.
We account for our derivatives pursuant to the accounting standards on derivative instruments, and recognizeall derivatives as either assets or liabilities in our consolidated balance sheets at their fair value on a trade datebasis. Fair value amounts, which are netted at the counterparty level and are inclusive of cash collateral postedor received, are recorded in “Other assets” or “Other liabilities” in our consolidated balance sheets. We recordall derivative gains and losses, including accrued interest, in “Fair value losses, net” in our consolidatedstatements of operations.
F-77
FANNIE MAE(In conservatorship)
NOTES TO CONSOLIDATED FINANCIAL STATEMENTS—(Continued)

Notional and Fair Value Position of our Derivatives
The following table displays the notional amount and estimated fair value of our asset and liability derivativeinstruments on a gross basis, before the application of master netting agreements, as of December 31, 2010and 2009.
NotionalAmount
EstimatedFair Value
NotionalAmount
EstimatedFair Value
NotionalAmount
EstimatedFair Value
NotionalAmount
EstimatedFair Value
Asset Derivatives Liability Derivatives Asset Derivatives Liability Derivatives2010 2009
As of December 31,
(Dollars in millions)
Risk management derivatives:
Swaps:
Pay-fixed . . . . . . . . . . . . . . . . . . . . . $ 49,085 $ 1,812 $228,142 $(14,115) $ 68,099 $ 1,422 $314,501 $(17,758)
Receive-fixed . . . . . . . . . . . . . . . . . . 172,174 6,493 52,003 (578) 160,384 8,250 115,033 (2,832)
Basis . . . . . . . . . . . . . . . . . . . . . . . . 435 29 50 — 2,715 61 510 (4)
Foreign currency . . . . . . . . . . . . . . . . 1,274 164 286 (51) 727 107 810 (49)
Swaptions:
Pay-fixed . . . . . . . . . . . . . . . . . . . . . 66,200 482 30,950 (1,773) 97,100 2,012 2,200 (1)
Receive-fixed . . . . . . . . . . . . . . . . . . 48,340 4,992 30,275 (673) 75,380 4,043 — —
Interest rate caps . . . . . . . . . . . . . . . . . 7,000 24 — — 7,000 128 — —
Futures . . . . . . . . . . . . . . . . . . . . . . . . 220 3 25 (1) — — — —
Other(1) . . . . . . . . . . . . . . . . . . . . . . . . 689 72 — — 740 84 8 —
Total gross risk managementderivatives . . . . . . . . . . . . . . . . . . 345,417 14,071 341,731 (17,191) 412,145 16,107 433,062 (20,644)
Collateral receivable (payable)(2) . . . . . — 3,452 — (604) — 5,437 — (1,023)
Accrued interest receivable (payable) . . — 1,288 — (1,805) — 2,596 — (2,813)
Total net risk managementderivatives . . . . . . . . . . . . . . . . . $345,417 $18,811 $341,731 $(19,600) $412,145 $24,140 $433,062 $(24,480)
Mortgage commitment derivatives:
Mortgage commitments to purchasewhole loans . . . . . . . . . . . . . . . . . . $ 2,880 $ 19 $ 4,435 $ (105) $ 273 $ — $ 4,453 $ (66)
Forward contracts to purchasemortgage-related securities . . . . . . . 19,535 123 27,697 (468) 3,403 7 23,287 (283)
Forward contracts to sell mortgage-related securities . . . . . . . . . . . . . . 40,761 811 24,562 (169) 83,299 1,141 7,232 (14)
Total mortgage commitmentderivatives . . . . . . . . . . . . . . . . . $ 63,176 $ 953 $ 56,694 $ (742) $ 86,975 $ 1,148 $ 34,972 $ (363)
Derivatives at fair value . . . . . . . . . $408,593 $19,764 $398,425 $(20,342) $499,120 $25,288 $468,034 $(24,843)
(1) Includes swap credit enhancements and mortgage insurance contracts that we account for as derivatives. The mortgageinsurance contracts have payment provisions that are not based on a notional amount.
(2) Collateral receivable represents cash collateral posted by us for derivatives in a loss position. Collateral payablerepresents cash collateral posted by counterparties to reduce our exposure for derivatives in a gain position.
A majority of our derivative instruments contain provisions that require our senior unsecured debt to maintaina minimum credit rating from each of the major credit rating agencies. If our senior unsecured debt were tofall below established thresholds in our governing agreements, which range from A- to BBB+, we would be in
F-78
FANNIE MAE(In conservatorship)
NOTES TO CONSOLIDATED FINANCIAL STATEMENTS—(Continued)

violation of these provisions, and the counterparties to the derivative instruments could request immediatepayment or demand immediate collateralization on derivative instruments in net liability positions. Theaggregate fair value of all derivatives with credit-risk-related contingent features that were in a net liabilityposition as of December 31, 2010 was $4.4 billion for which we posted collateral of $3.5 billion in the normalcourse of business. If the credit-risk-related contingency features underlying these agreements were triggeredas of December 31, 2010, we would be required to post an additional $891 million of collateral to ourcounterparties.
The following table displays, by type of derivative instrument, the fair value gains and losses, net on ourderivatives for the years ended December 31, 2010, 2009 and 2008.
2010 2009 2008For the Year Ended December 31,
(Dollars in millions)
Risk management derivatives:
Swaps:
Pay-fixed . . . . . . . . . . . . . . . . . . . . . . . . . . . . . . . . . . . . . . . . . . . . . . $(17,573) $ 15,012 $(64,764)
Receive-fixed . . . . . . . . . . . . . . . . . . . . . . . . . . . . . . . . . . . . . . . . . . . 14,382 (11,737) 44,553
Basis . . . . . . . . . . . . . . . . . . . . . . . . . . . . . . . . . . . . . . . . . . . . . . . . . 17 96 (102)
Foreign currency(1) . . . . . . . . . . . . . . . . . . . . . . . . . . . . . . . . . . . . . . . . 157 166 (130)
Swaptions:
Pay-fixed . . . . . . . . . . . . . . . . . . . . . . . . . . . . . . . . . . . . . . . . . . . . . . (2,026) 453 (666)
Receive-fixed . . . . . . . . . . . . . . . . . . . . . . . . . . . . . . . . . . . . . . . . . . . 3,327 (8,706) 6,153
Interest rate caps . . . . . . . . . . . . . . . . . . . . . . . . . . . . . . . . . . . . . . . . . . . (104) 11 (1)
Futures. . . . . . . . . . . . . . . . . . . . . . . . . . . . . . . . . . . . . . . . . . . . . . . . . . 2 — —
Other(2) . . . . . . . . . . . . . . . . . . . . . . . . . . . . . . . . . . . . . . . . . . . . . . . . . 11 9 (6)
Total risk management derivatives fair value losses, net . . . . . . . . . . . . . . (1,807) (4,696) (14,963)
Mortgage commitment derivatives fair value losses, net . . . . . . . . . . . . . . . . (1,193) (1,654) (453)
Total derivatives fair value losses, net . . . . . . . . . . . . . . . . . . . . . . . . . . . $ (3,000) $ (6,350) $(15,416)
(1) Includes the effect of net contractual interest income of approximately $47 million, $38 million and $9 million for2010, 2009 and 2008, respectively.
(2) Includes swap credit enhancements and mortgage insurance contracts.
F-79
FANNIE MAE(In conservatorship)
NOTES TO CONSOLIDATED FINANCIAL STATEMENTS—(Continued)

Volume and Activity of our Derivatives
Risk Management Derivatives
The following table displays, by derivative instrument type, our risk management derivative activity for theyears ended December 31, 2010 and 2009.
Pay-Fixed
Receive-Fixed Basis
ForeignCurrency(1)
Pay-Fixed
Receive-Fixed
InterestRate Caps Futures Other(2) Total
Interest Rate SwapsInterest Rate
Swaptions
For the Year Ended December 31, 2010
(Dollars in millions)
Beginning notionalbalance . . . . . . . . . . $ 382,600 $ 275,417 $ 3,225 $1,537 $ 99,300 $ 75,380 $7,000 $ — $748 $ 845,207
Additions . . . . . . . . . 212,214 250,417 55 636 51,700 51,025 — 598 — 566,645
Terminations(3) . . . . . (317,587) (301,657) (2,795) (613) (53,850) (47,790) — (353) (59) (724,704)
Ending notionalbalance . . . . . . . . . . $ 277,227 $ 224,177 $ 485 $1,560 $ 97,150 $ 78,615 $7,000 $ 245 $689 $ 687,148
Pay-Fixed
Receive-Fixed Basis
ForeignCurrency(1)
Pay-Fixed
Receive-Fixed
InterestRate Caps Futures Other(2) Total
Interest Rate SwapsInterest Rate
Swaptions
For the Year Ended December 31, 2009
(Dollars in millions)
Beginning notionalbalance . . . . . . . . . $ 546,916 $ 451,081 $ 24,560 $1,652 $ 79,500 $ 93,560 $ 500 $— $827 $1,198,596
Additions . . . . . . . 297,379 279,854 2,765 577 32,825 19,175 6,500 — 13 639,088
Terminations(3) . . . . (461,695) (455,518) (24,100) (692) (13,025) (37,355) — — (92) (992,477)
Ending notionalbalance . . . . . . . . . $ 382,600 $ 275,417 $ 3,225 $1,537 $ 99,300 $ 75,380 $7,000 $— $748 $ 845,207
(1) Exchange rate adjustments to foreign currency swaps existing at both the beginning and the end of the period areincluded in terminations. Exchange rate adjustments to foreign currency swaps that are added or terminated during theperiod are reflected in the respective categories.
(2) Includes swap credit enhancements and mortgage insurance contracts.(3) Includes matured, called, exercised, assigned and terminated amounts.
F-80
FANNIE MAE(In conservatorship)
NOTES TO CONSOLIDATED FINANCIAL STATEMENTS—(Continued)

Mortgage Commitment Derivatives
The following table displays, by commitment type, our mortgage commitment derivative activity for the yearsended December 31, 2010 and 2009.
PurchaseCommitments
SaleCommitments
PurchaseCommitments
SaleCommitments
20092010For the Year Ended December 31,
(Dollars in millions)
Beginning of period notional balance . . . . . . . . $ 31,416 $ 90,531 $ 35,004 $ 36,232
Mortgage related securities:
Open commitments . . . . . . . . . . . . . . . . . . 660,037 841,997 833,221 1,089,500
Settled commitments . . . . . . . . . . . . . . . . . (639,495) (867,205) (832,279) (1,035,201)
Loans:
Open commitments . . . . . . . . . . . . . . . . . . 90,043 — 114,054 —
Settled commitments . . . . . . . . . . . . . . . . . (87,454) — (118,584) —
End of period notional balance . . . . . . . . . . . . $ 54,547 $ 65,323 $ 31,416 $ 90,531
Derivative Counterparty Credit Exposure
Our derivative counterparty credit exposure relates principally to interest rate and foreign currency derivativecontracts. We are exposed to the risk that a counterparty in a derivative transaction will default on paymentsdue to us. If there is a default, we may need to acquire a replacement derivative from a different counterpartyat a higher cost or may be unable to find a suitable replacement. Typically, we seek to manage credit exposureby contracting with experienced counterparties that are rated A- (or its equivalent) or better. We also manageour exposure by requiring counterparties to post collateral. The collateral includes cash, U.S. Treasurysecurities, agency debt and agency mortgage-related securities.
The table below displays our credit exposure on outstanding risk management derivative instruments in a gainposition by counterparty credit ratings, as well as the notional amount outstanding and the number ofcounterparties for all risk management derivatives as of December 31, 2010 and 2009.
AA+/AA/AA- A+/A Subtotal Other(2) TotalCredit Rating(1)
As of December 31, 2010
(Dollars in millions)
Credit loss exposure(3). . . . . . . . . . . . . . . . . . . . . $ 350 $ 325 $ 675 $ 75 $ 750
Less: Collateral held(4) . . . . . . . . . . . . . . . . . . . . 273 325 598 — 598
Exposure net of collateral . . . . . . . . . . . . . . . . . . $ 77 $ — $ 77 $ 75 $ 152
Additional information:
Notional amount(5) . . . . . . . . . . . . . . . . . . . . . $208,898 $476,766 $685,664 $1,484 $687,148
Number of counterparties(5) . . . . . . . . . . . . . . . 7 8 15
F-81
FANNIE MAE(In conservatorship)
NOTES TO CONSOLIDATED FINANCIAL STATEMENTS—(Continued)

AA+/AA/AA- A+/A Subtotal Other(2) TotalCredit Rating(1)
As of December 31, 2009
(Dollars in millions)
Credit loss exposure(3) . . . . . . . . . . . . . . . . . . . . . $ 658 $ 583 $ 1,241 $ 84 $ 1,325
Less: Collateral held(4) . . . . . . . . . . . . . . . . . . . . 580 507 1,087 — 1,087
Exposure net of collateral . . . . . . . . . . . . . . . . . . $ 78 $ 76 $ 154 $ 84 $ 238
Additional information:
Notional amount(5) . . . . . . . . . . . . . . . . . . . . . $220,791 $623,668 $844,459 $748 $845,207
Number of counterparties(5) . . . . . . . . . . . . . . . 7 9 16
(1) We manage collateral requirements based on the lower credit rating of the legal entity, as issued by Standard & Poor’sand Moody’s. The credit rating reflects the equivalent Standard & Poor’s rating for any ratings based on Moody’sscale.
(2) Includes defined benefit mortgage insurance contracts and swap credit enhancements accounted for as derivativeswhere the right of legal offset does not exist. Also includes exchange-traded derivatives, such as futures and interestrate swaps, which are settled daily through a clearinghouse.
(3) Represents the exposure to credit loss on derivative instruments, which we estimate using the fair value of alloutstanding derivative contracts in a gain position. We net derivative gains and losses with the same counterpartywhere a legal right of offset exists under an enforceable master netting agreement. This table excludes mortgagecommitments accounted for as derivatives.
(4) Represents both cash and non-cash collateral posted by our counterparties to us. Does not include collateral held inexcess of exposure. We reduce the value of non-cash collateral in accordance with the counterparty agreements to helpensure recovery of any loss through the disposition of the collateral. We posted cash collateral of $3.4 billion and$5.4 billion related to our counterparties’ credit exposure to us as of December 31, 2010 and 2009, respectively.
(5) We had exposure to 3 and 6 interest rate and foreign currency derivative counterparties in a net gain position as ofDecember 31, 2010 and 2009, respectively. Those interest rate and foreign currency derivatives had notional balancesof $106.5 billion and $310.0 billion as of December 31, 2010 and 2009, respectively.
Hedging Activities
In 2008, we began to employ fair value hedge accounting for some of our interest rate risk managementactivities by designating hedging relationships between certain of our interest rate derivatives and mortgageassets. We achieved hedge accounting by designating all or a fixed percentage of a pay-fixed receive variableinterest rate swap as a hedge of the changes in the fair value attributable to the changes in LIBOR for aspecific mortgage asset. Because we discontinued hedge accounting during 2008, we did not have anyderivatives designated as hedges during 2010 or 2009.
For the year ended December 31, 2008, we recorded a $2.2 billion increase in the carrying value of thehedged assets before related amortization due to hedge accounting. This gain on the hedged assets was offsetby fair value losses of $2.2 billion, which excluded valuation changes due to the passage of time, on the pay-fixed swaps designated as hedging instruments.
In addition, in 2008 we recorded a loss for the ineffective portion of our hedged assets of $94 million, whichexcluded a loss of $81 million that was not related to changes in the benchmark interest rate.
F-82
FANNIE MAE(In conservatorship)
NOTES TO CONSOLIDATED FINANCIAL STATEMENTS—(Continued)

11. Income Taxes
Provision (Benefit) for Income Taxes
We operate as a government-sponsored enterprise. We are subject to federal income tax, but we are exemptfrom state and local income taxes. The following table displays the components of our provision (benefit) forfederal income taxes for the years ended December 31, 2010, 2009 and 2008.
2010 2009 2008
For the Year EndedDecember 31,
(Dollars in millions)
Current income tax expense (benefit) . . . . . . . . . . . . . . . . . . . . . . . . . . . . . . . . . . $(82) $(999) $ 403
Deferred income tax expense(1) . . . . . . . . . . . . . . . . . . . . . . . . . . . . . . . . . . . . . . — 14 13,346
Provision (benefit) for federal income taxes . . . . . . . . . . . . . . . . . . . . . . . . . . . . . . $(82) $(985) $13,749
(1) Amount excludes the income tax effect of items recognized directly in “Fannie Mae stockholders’ equity (deficit)”where we did not establish a valuation allowance.
In January 2011, we received a refund of $1.1 billion from the IRS related to the carryback of our 2009operating loss to the 2008 and 2007 tax years.
The following table displays the difference between our effective tax rates and the statutory federal tax ratesfor the years ended December 31, 2010, 2009 and 2008, respectively.
2010 2009 2008
For the Year EndedDecember 31,
Statutory corporate tax rate . . . . . . . . . . . . . . . . . . . . . . . . . . . . . . . . . . . . . . . . . . . 35.0% 35.0% 35.0%
Tax-exempt interest and dividends-received deductions . . . . . . . . . . . . . . . . . . . . . . . . 1.3 0.3 0.5
Equity investments in affordable housing projects . . . . . . . . . . . . . . . . . . . . . . . . . . . . 6.3 1.3 2.1
Other . . . . . . . . . . . . . . . . . . . . . . . . . . . . . . . . . . . . . . . . . . . . . . . . . . . . . . . . . . 0.1 — —
Valuation allowance . . . . . . . . . . . . . . . . . . . . . . . . . . . . . . . . . . . . . . . . . . . . . . . . (42.1) (35.2) (68.2)
Effective tax rate . . . . . . . . . . . . . . . . . . . . . . . . . . . . . . . . . . . . . . . . . . . . . . . . . . 0.6% 1.4% (30.6)%
Our effective tax rate is the provision (benefit) for federal income taxes, excluding the tax effect ofextraordinary items, expressed as a percentage of income or loss before federal income taxes. Our effective taxrates were different from the federal statutory rate of 35% for the years ended December 31, 2010, 2009 and2008 due primarily to the increase to our valuation allowance for our net deferred tax assets that resulted inthe recognition of $5.9 billion, $25.7 billion and $30.8 billion, respectively, in our provision for income taxes.In addition, our effective tax rate for the year ended December 31, 2010, was also impacted by the reversal ofa portion of the valuation allowance for deferred tax assets resulting from a settlement agreement reached withthe IRS for our unrecognized tax benefits for the tax years 1999 through 2004. Our effective tax rates for theyears ended December 31, 2010, 2009 and 2008 were impacted by the benefits of our holdings of tax-exemptinvestments, investments in housing projects eligible for the low-income housing tax credit and other equityinvestments that provide tax credits.
F-83
FANNIE MAE(In conservatorship)
NOTES TO CONSOLIDATED FINANCIAL STATEMENTS—(Continued)

Deferred Tax Assets and Liabilities
The following table displays our deferred tax assets, deferred tax liabilities, and valuation allowance as ofDecember 31, 2010 and 2009.
2010 2009As of December 31,
(Dollars in millions)
Deferred tax assets:(1)
Allowance for loan losses and basis in acquired property, net . . . . . . . . . . . . . . . . . . . $ 27,063 $ 23,615
Mortgage and mortgage-related assets, including acquired credit-impaired loans . . . . . . 10,825 10,547
Debt and derivative instruments . . . . . . . . . . . . . . . . . . . . . . . . . . . . . . . . . . . . . . . 6,627 8,255
Partnership credits . . . . . . . . . . . . . . . . . . . . . . . . . . . . . . . . . . . . . . . . . . . . . . . . . 4,500 3,587
Partnership and other equity investments . . . . . . . . . . . . . . . . . . . . . . . . . . . . . . . . . 2,175 2,411
Unrealized losses on AFS securities. . . . . . . . . . . . . . . . . . . . . . . . . . . . . . . . . . . . . 772 927
Net operating loss and alternative minimum tax credit carryforwards . . . . . . . . . . . . . . 3,341 688
Other, net . . . . . . . . . . . . . . . . . . . . . . . . . . . . . . . . . . . . . . . . . . . . . . . . . . . . . . . 1,818 3,661
Total deferred tax assets . . . . . . . . . . . . . . . . . . . . . . . . . . . . . . . . . . . . . . . . . . . 57,121 53,691
Deferred tax liabilities:
Other, net . . . . . . . . . . . . . . . . . . . . . . . . . . . . . . . . . . . . . . . . . . . . . . . . . . . . . . . 53 45
Total deferred tax liabilities . . . . . . . . . . . . . . . . . . . . . . . . . . . . . . . . . . . . . . . . . 53 45
Valuation allowance . . . . . . . . . . . . . . . . . . . . . . . . . . . . . . . . . . . . . . . . . . . . . . . . . (56,314) (52,737)
Net deferred tax assets . . . . . . . . . . . . . . . . . . . . . . . . . . . . . . . . . . . . . . . . . . . . . . . $ 754 $ 909
(1) Certain prior year amounts have been reclassified to conform to the current year presentation.
We recognize deferred tax assets and liabilities for the future tax consequences related to differences betweenthe financial statement carrying amounts of existing assets and liabilities and their respective tax bases, and fornet operating loss and tax credit carryforwards. We recorded an increase in our valuation allowance in 2010that resulted in the recognition of $5.9 billion in our provision for income taxes. This amount represented thetax effect associated with a portion of our pre-tax loss. The change in our 2010 valuation allowance alsoincludes a $2.4 billion reduction primarily due to our adoption of the new accounting standards for amountsoriginally recognized in “Accumulated deficit.” Our deferred tax assets, net of a valuation allowance, totaled$754 million and $909 million as of December 31, 2010 and 2009, respectively. We evaluate our deferred taxassets for recoverability using a consistent approach which considers the relative impact of both negative andpositive evidence, including our historical profitability and projections of future taxable income. We arerequired to establish a valuation allowance for deferred tax assets and record a charge in our consolidatedstatements of operations or in “Fannie Mae stockholders’ deficit” if we determine, based on available evidenceat the time the determination is made, that it is more likely than not that some portion or all of the deferredtax assets will not be realized. In evaluating the need for a valuation allowance, we estimate future taxableincome or loss based on management-approved business plans and ongoing tax planning strategies. Thisprocess involves significant management judgment about assumptions that are subject to change from periodto period based on changes in tax laws or variances between our projected operating performance, our actualresults and other factors.
We are in a cumulative book taxable loss position and have been for more than a three-year period. Forpurposes of establishing a deferred tax valuation allowance, this cumulative book taxable loss position isconsidered significant, objective evidence that we may not be able to realize some portion of our deferred tax
F-84
FANNIE MAE(In conservatorship)
NOTES TO CONSOLIDATED FINANCIAL STATEMENTS—(Continued)

assets in the future. Our cumulative book taxable loss position was caused by the negative impact on ourresults from the weak housing and credit market conditions that deteriorated dramatically during 2008 andcontinued through 2009 and 2010. These conditions caused an increase in our pre-tax loss, due in part tocredit losses, and downward revisions to our projections of future results. Because of the volatile economicconditions, our projections of future credit losses are uncertain.
During 2008, we concluded that it was more likely than not that we would not generate sufficient futuretaxable income in the foreseeable future to realize all of our deferred tax assets. Our conclusion was based onour consideration of the relative weight of the available evidence, including the rapid deterioration of marketconditions discussed above, the uncertainty of future market conditions on our results of operations, andsignificant uncertainty surrounding our future business model as a result of the placement of the company intoconservatorship by FHFA. As a result, we recorded a valuation allowance on our net deferred tax asset for theportion of the future tax benefit that more likely than not will not be utilized in the future. We did not,however, establish a valuation allowance for the deferred tax asset amount that is related to unrealized lossesrecorded through AOCI for certain available-for-sale securities. We believe this deferred tax amount isrecoverable because we have the intent and ability to hold these securities until recovery of the unrealized lossamounts. There have been no changes to our conclusion as of December 31, 2010.
As a result of adopting the new accounting standard for assessing other-than-temporary impairments, werecorded a cumulative-effect adjustment at April 1, 2009 of $8.5 billion on a pre-tax basis ($5.6 billion aftertax) to reclassify the noncredit portion of previously recognized other-than-temporary impairments from“Accumulated deficit” to AOCI. We also reduced the “Accumulated deficit” and valuation allowance by$3.0 billion for the deferred tax asset related to the amounts previously recognized as other-than-temporaryimpairments in our consolidated statements of operations based upon the assertion of our intent and ability tohold certain AFS securities until recovery.
As of December 31, 2010, we had $11.3 billion of net operating loss carryforwards that expire in 2029 and2030, $1.4 billion of capital loss carryforwards that expire in 2013 through 2015, $4.5 billion of partnershiptax credit carryforwards that expire in various years through 2030, and $126 million of alternative minimumtax credit carryforwards that have an indefinite carryforward period.
Unrecognized Tax Benefits
We had $864 million, $911 million, and $1.7 billion of unrecognized tax benefits as of December 31, 2010,2009 and 2008, respectively. Of these amounts, we had $29 million as of December 31, 2009, which wasresolved favorably in 2010 and reduced our effective tax rate in 2010. There are no unrecognized tax benefitsas of December 31, 2010 that would reduce our effective tax rate in future periods. As of December 31, 2010and 2009, we had accrued interest payable related to unrecognized tax benefits of $5 million and $41 million,respectively, and did not recognize any tax penalty payable. For the years ended December 31, 2010, 2009 and2008, we had total interest expense related to unrecognized tax benefits of $2 million, $32 million and$223 million, respectively, and did not have any tax expense related to tax penalties.
During 2010, we and the IRS appeals division reached an agreement for all issues related to the tax years1999 through 2004, which resulted in a $99 million reduction in our gross balance of unrecognized taxbenefits for the tax years 1999 through 2004. Similarly, during 2009, we reached an agreement of $1.2 billion,net of tax credits, with the IRS on the audits of our 2005 and 2006 federal income tax returns. The decrease inour unrecognized tax benefits during the year ended December 31, 2009 is due to our settlement reached withthe IRS regarding certain tax positions related to fair market value losses and the settlement of tax years 2005through 2006. The decrease in our unrecognized tax benefits represents a temporary difference, and thereforedoes not result in a change to our effective tax rate, except to the extent of the reversal of a portion of thevaluation allowance for deferred tax assets resulting from an agreement reached with the IRS for our
F-85
FANNIE MAE(In conservatorship)
NOTES TO CONSOLIDATED FINANCIAL STATEMENTS—(Continued)

unrecognized tax benefits for the tax years 1999 through 2004. The IRS is currently examining our federalincome tax returns for the tax years 2007 and 2008. We expect to reach a settlement agreement with the IRSfor all issues related to the 2007 and 2008 tax years. As a result of this conclusion, it is reasonably possiblethat a $105 million reduction in our gross balance of unrecognized tax benefits may occur within the next12 months for the 2007 and 2008 tax years.
The following table displays the changes in our unrecognized tax benefits for the years ended December 31,2010, 2009 and 2008, respectively.
2010 2009 2008
For the Year EndedDecember 31,
(Dollars in millions)
Unrecognized tax benefits as of January 1 . . . . . . . . . . . . . . . . . . . . . . . . . . . . . . $911 $ 1,745 $ 124Gross increases—tax positions in prior years . . . . . . . . . . . . . . . . . . . . . . . . . . . . 83 38 49Gross decreases—tax positions in prior years . . . . . . . . . . . . . . . . . . . . . . . . . . . . (31) (1) (6)Gross increases—tax positions in current year . . . . . . . . . . . . . . . . . . . . . . . . . . . — 761 —Settlements . . . . . . . . . . . . . . . . . . . . . . . . . . . . . . . . . . . . . . . . . . . . . . . . . . . . . (99) (1,632) 1,578
Unrecognized tax benefits as of December 31(1) . . . . . . . . . . . . . . . . . . . . . . . . . . $864 $ 911 $1,745
(1) Amounts exclude tax credits of $804 million, $716 million and $456 million as of December 31, 2010, 2009 and2008, respectively.
12. Loss Per Share
The following table displays the computation of basic and diluted loss per share of common stock for theyears ended December 31, 2010, 2009 and 2008.
2010 2009 2008
For the Year EndedDecember 31,
(Dollars and shares in millions,except per share amounts)
Loss before extraordinary losses . . . . . . . . . . . . . . . . . . . . . . . . . . . . . . . . $(14,018) $(72,022) $(58,319)Extraordinary losses, net of tax effect . . . . . . . . . . . . . . . . . . . . . . . . . . . . — — (409)
Net loss . . . . . . . . . . . . . . . . . . . . . . . . . . . . . . . . . . . . . . . . . . . . . . . . . (14,018) (72,022) (58,728)Less: Net loss attributable to the noncontrolling interest . . . . . . . . . . . . . . 4 53 21
Net loss attributable to Fannie Mae . . . . . . . . . . . . . . . . . . . . . . . . . . . . . . (14,014) (71,969) (58,707)Preferred stock dividends and issuance costs at redemption . . . . . . . . . . . . . (7,704) (2,474) (1,069)
Net loss attributable to common stockholders-basic and diluted . . . . . . . . . . $(21,718) $(74,443) $(59,776)
Weighted-average common shares outstanding-basic and diluted(1) . . . . . . . . 5,694 5,680 2,487Basic and diluted loss per share:
Loss before extraordinary losses . . . . . . . . . . . . . . . . . . . . . . . . . . . . . . $ (3.81) $ (13.11) $ (23.88)Extraordinary losses, net of tax effect . . . . . . . . . . . . . . . . . . . . . . . . . . . — — (0.16)
Basic and diluted loss per share . . . . . . . . . . . . . . . . . . . . . . . . . . . . . . . $ (3.81) $ (13.11) $ (24.04)
(1) Amounts include 4.6 billion for both the years ended December 31, 2010 and 2009 and 1.4 billion for the year endedDecember 31, 2008 of weighted-average shares of common stock, that would be issued upon the full exercise of thewarrant issued to Treasury from the date the warrant was issued through December 31, 2010, 2009 and 2008,respectively.
F-86
FANNIE MAE(In conservatorship)
NOTES TO CONSOLIDATED FINANCIAL STATEMENTS—(Continued)

Weighted-average options and performance awards to purchase approximately 8 million, 14 million and22 million shares of common stock were outstanding for the years ended December 31, 2010, 2009 and 2008,respectively, and were excluded from the computation of diluted EPS in the table above as they would havebeen anti-dilutive.
13. Stock-Based Compensation
We have two stock-based compensation plans, the 1985 Employee Stock Purchase Plan and the StockCompensation Plan of 2003. Under these plans, we previously offered various stock-based compensationprograms where we provided employees an opportunity to purchase Fannie Mae common stock or periodicallymade stock awards to certain employees in the form of nonqualified stock options, performance share awards,restricted stock awards, restricted stock units or stock bonus awards. Under the senior preferred stock purchaseagreement with Treasury, we may not issue Fannie Mae equity securities without the consent of Treasury,other than the senior preferred stock, the Treasury warrant, common stock issuable upon exercise of thewarrant, or as required by the terms of any binding agreement in effect on the date of the senior preferredstock purchase agreement. As such, we currently do not intend to grant equity compensation to employeesunder these plans.
In connection with our stock-based compensation plans for shares or awards issued prior to conservatorship,we recorded compensation expense of $39 million, $52 million and $97 million for 2010, 2009 and 2008,respectively.
Stock-Based Compensation Plans
The 1985 Employee Stock Purchase Plan (the “1985 Purchase Plan”) provided employees an opportunity topurchase shares of Fannie Mae common stock at a discount to the fair market value of the stock duringspecified purchase periods. Our Board of Directors sets the terms and conditions of offerings under the 1985Purchase Plan, including the number of available shares and the size of the discount. There were no offeringsunder the 1985 Purchase Plan in any year presented. The aggregate maximum number of shares of commonstock available for employee purchase is 50 million. Since inception, we have made available38,039,742 shares for purchase by employees under this plan.
The Stock Compensation Plan of 2003 (the “2003 Plan”) is the successor to the Stock Compensation Plan of1993 (the “1993 Plan”). The 2003 Plan enabled us to make stock awards in various forms and combinations,including stock options, stock appreciation rights, restricted stock, restricted stock units, performance shareawards and stock bonus awards. The aggregate maximum number of shares of common stock available foraward to employees and non-management directors under the 2003 Plan is 40 million. Including the effects ofshare cancellations, we have awarded 10,970,345 shares under this plan since its inception. The sharesawarded under the 2003 Plan were authorized and unissued shares, treasury shares or shares purchased on theopen market.
Restricted Stock Program
Under the 1993 and 2003 Plans, prior to conservatorship, employees could have received restricted stockawards (“RSAs”) and, under the 2003 Plan, employees may have received restricted stock units (“RSUs”). Thetype of award employees received under the 2003 Plan generally depended upon years of service and age atthe time of grant. Each RSU represented the right to receive a share of common stock at the time of vesting.As a result, RSUs are generally similar to restricted stock, except that RSUs do not confer voting rights ontheir holders. By contrast, holders of the RSAs do have voting rights. Vesting of the grants is based oncontinued employment. In general, grants vest in equal annual installments over three or four years beginningon the first anniversary of the date of grant. Based on the fair value of our common stock on the respective
F-87
FANNIE MAE(In conservatorship)
NOTES TO CONSOLIDATED FINANCIAL STATEMENTS—(Continued)

grant dates, the fair value of restricted stock that vested in 2010, 2009 and 2008 was $51 million, $83 million,and $103 million, respectively. The compensation expense related to restricted stock is based on the grant datefair value of our common stock. We recorded compensation expense for these restricted stock grants of$39 million, $52 million, and $97 million for 2010, 2009 and 2008, respectively.
The following table displays restricted stock activity for 2010, 2009 and 2008.
Number ofShares
WeightedAverage
FairValue at
Grant DateNumber of
Shares
WeightedAverage
FairValue at
Grant DateNumber of
Shares
WeightedAverage
FairValue at
Grant Date
2010 2009 2008For the Year Ended December 31,
(Shares in thousands)
Nonvested as of January 1 . . . . . . . . . . 2,873 $39.53 5,934 $41.19 4,375 $57.67Granted . . . . . . . . . . . . . . . . . . . . . . . — — — — 4,518 31.96Vested . . . . . . . . . . . . . . . . . . . . . . . . (1,199) 42.58 (1,858) 44.78 (1,768) 58.25Forfeited . . . . . . . . . . . . . . . . . . . . . . (164) 37.34 (1,203) 39.61 (1,191) 41.58
Nonvested as of December 31 . . . . . . . 1,510 $37.34 2,873 $39.53 5,934 $41.19
The following table displays information related to unvested restricted stock as of December 31, 2010, 2009and 2008.
2010 2009 2008For the Year Ended December 31,
(Dollars in millions)
Unrecognized compensation cost . . . . . . . . . . . . . . . . . . . . . . . . . . $ 19 $ 56 $ 148
Expected weighted-average life of unvested restricted stock . . . . . . . 1.0 years 1.6 years 2.4 years
Nonqualified Stock Options
Under the 2003 Plan and prior to conservatorship, we could have granted stock options. Generally, theseoptions may not be exercised until at least one year subsequent to the grant date, and the options expire tenyears from the date of grant. Typically, options vest 25% per year beginning on the first anniversary of thedate of grant. The exercise price of each option is equal to the fair market value of our common stock on thedate we grant the option.
The following table displays nonqualified stock option activity for 2010, 2009 and 2008.
Options
Weighted-AverageExercise
Price
Weighted-Average
FairValue at
Grant Date Options
Weighted-AverageExercise
Price
Weighted-Average
FairValue at
Grant Date Options
Weighted-AverageExercise
Price
Weighted-Average
FairValue at
Grant Date
2010 2009 2008For the Year Ended December 31,
Beginning balance, January 1 . . . . . . 8,759 $72.39 $23.60 12,293 $72.12 $23.62 17,031 $71.90 $23.49
Forfeited and/or expired . . . . . . . . . . (3,960) 69.15 25.26 (3,534) 71.45 23.66 (4,738) 71.19 23.13
Ending balance, December 31(1) . . . . 4,799 $75.07 $23.01 8,759 $72.39 $23.60 12,293 $72.12 $23.62
Options exercisable, December 31 . . . 4,799 $75.07 $23.01 8,759 $72.39 $23.60 12,291 $72.12 $23.62
(1) All options outstanding are fully vested.
F-88
FANNIE MAE(In conservatorship)
NOTES TO CONSOLIDATED FINANCIAL STATEMENTS—(Continued)

14. Employee Retirement Benefits
We sponsor both defined benefit plans and defined contribution plans for our employees, as well as ahealthcare plan that provides certain health benefits for retired employees and their dependents. Net periodicbenefit costs for defined benefit and healthcare plans, which are determined on an actuarial basis, andexpenses for our defined contribution plans, are included in “Salaries and employee benefits expense” in ourconsolidated statements of operations. For the years ended December 31, 2010, 2009 and 2008, we recognizednet periodic benefit costs for our defined benefit and healthcare plans and expenses for our definedcontributions plans of $112 million, $131 million, and $95 million, respectively.
Defined Benefit Pension Plans and Postretirement Health Care Plan
Our defined benefit pension plans include qualified and nonqualified noncontributory plans. Pension planbenefits are based on years of credited service and a percentage of eligible compensation. In 2007, the definedbenefit pension plans were amended to cease benefits accruals for employees that did not meet certain criteriato be grandfathered under the plan and to vest those employees in their frozen accruals.
We fund our qualified pension plan through employer contributions to a qualified irrevocable trust that ismaintained for the sole benefit of plan participants and their beneficiaries. Contributions to our qualifiedpension plan are subject to a minimum funding requirement and a maximum funding limit under theEmployee Retirement Income Security Act of 1974 (“ERISA”) and IRS regulations.
Our nonqualified defined benefit pension plans consist of an Executive Pension Plan, Supplemental PensionPlan and the Supplemental Pension Plan of 2003, which is a bonus-based plan. These plans cover certainemployees and supplement the benefits payable under the qualified pension plan. The Executive Pension Planwas frozen in 2009. Benefits under the Executive Pension Plan are paid through a rabbi trust.
The Supplemental Pension Plan provides retirement benefits to employees who participate in our qualifiedpension plan and do not receive a benefit from the Executive Pension Plan, and whose salary exceeds thestatutory compensation cap applicable to the qualified plan or whose benefit is limited by the statutory benefitcap. Similarly, the Supplemental Pension Plan of 2003 provides additional benefits to our officers based oneligible incentive compensation, if any, received by an officer, but the amount of incentive compensationconsidered is limited to 50% of the officer’s base salary. We pay benefits for our unfunded defined benefitSupplemental Pension Plans from our cash and cash equivalents.
We also sponsor a contributory postretirement Health Care Plan that covers substantially all regular full-timeemployees who meet the applicable age and service requirements. We subsidize premium costs for medicalcoverage for some employees who meet the age and service requirements. Employees hired after 2007 receiveaccess to our retiree medical plan, when eligible, but they do not qualify for the subsidy. We accrue and paythe benefits for our unfunded postretirement Health Care Plan from our cash and cash equivalents.
F-89
FANNIE MAE(In conservatorship)
NOTES TO CONSOLIDATED FINANCIAL STATEMENTS—(Continued)

The following table displays components of our net periodic benefit cost for our qualified and nonqualifiedpension plans and other postretirement plan for the years ended December 31, 2010, 2009 and 2008. The netperiodic benefit cost for each period is calculated based on assumptions at the end of the prior year.
PensionPlans
Other Post-Retirement
PlanPensionPlans
Other Post-Retirement
PlanPensionPlans
Other Post-Retirement
Plan
2010 2009 2008For the Year Ended December 31,
(Dollars in millions)
Service cost. . . . . . . . . . . . . . . . . . . . . . . . . . $ 37 $ 6 $ 37 $ 5 $ 46 $ 5
Interest cost. . . . . . . . . . . . . . . . . . . . . . . . . . 66 9 62 9 58 9
Other . . . . . . . . . . . . . . . . . . . . . . . . . . . . . . (51) (2) (22) (2) (59) 1
Net periodic benefit cost . . . . . . . . . . . . . . . $ 52 $13 $ 77 $12 $ 45 $15
Prior service costs, which are changes in benefit obligations due to plan amendments, are amortized over theaverage remaining service period for active employees for our pension plans and prior to the full eligibilitydate for the other postretirement Health Care Plan.
The following table displays amounts recorded in AOCI that have not been recognized as a component of netperiodic benefit cost for the years ended December 31, 2010 and 2009.
PensionPlans
Other Post-Retirement
PlanPensionPlans
Other Post-Retirement
Plan
2010 2009As of December 31,
(Dollars in millions)
Net actuarial loss . . . . . . . . . . . . . . . . . . . . . . . . . . . . . . . . . . $218 $ 42 $162 $ 39
Net prior service cost (credit) . . . . . . . . . . . . . . . . . . . . . . . . . . 6 (56) 7 (61)
Net transition obligation . . . . . . . . . . . . . . . . . . . . . . . . . . . . . — 4 — 5
Pre-tax amount recorded in AOCI . . . . . . . . . . . . . . . . . . . . . . . $224 $(10) $169 $(17)
After-tax amount recorded in AOCI(1) . . . . . . . . . . . . . . . . . . . . $224 $(10) $169 $(17)
(1) During 2008, we established a valuation allowance for our deferred tax assets, which has resulted in the reversal of thetax benefit amounts recorded in AOCI for our pension and other postretirement plans. Refer to “Note 11, IncomeTaxes” for additional information.
F-90
FANNIE MAE(In conservatorship)
NOTES TO CONSOLIDATED FINANCIAL STATEMENTS—(Continued)

The following table displays the changes in the pre-tax amounts recognized in AOCI for the years endedDecember 31, 2010 and 2009.
PensionPlans
Other Post-Retirement
PlanPensionPlans
Other Post-Retirement
Plan
2010 2009For the Year Ended December 31,
(Dollars in millions)
Actuarial (Gain) Loss
Beginning balance, January 1. . . . . . . . . . . . . . . . . . . . . . . . . . . . . . $162 $ 39 $276 $ 32
Current year actuarial (gain) loss . . . . . . . . . . . . . . . . . . . . . . . . . . . 64 4 (92) 8
Actuarial gain due to curtailments . . . . . . . . . . . . . . . . . . . . . . . . . . — — (1) —
Amortization . . . . . . . . . . . . . . . . . . . . . . . . . . . . . . . . . . . . . . . . . (8) (1) (21) (1)
Ending balance, December 31 . . . . . . . . . . . . . . . . . . . . . . . . . . . . . $218 $ 42 $162 $ 39
Prior Service Cost (Credit)
Beginning balance, January 1. . . . . . . . . . . . . . . . . . . . . . . . . . . . . . $ 7 $(61) $ 10 $(66)
Prior service credit due to curtailments . . . . . . . . . . . . . . . . . . . . . . . — — (1) —
Amortization . . . . . . . . . . . . . . . . . . . . . . . . . . . . . . . . . . . . . . . . . (1) 5 (2) 5
Ending balance, December 31 . . . . . . . . . . . . . . . . . . . . . . . . . . . . . $ 6 $(56) $ 7 $(61)
The following table displays pre-tax amounts in AOCI as of December 31, 2010 that are expected to berecognized as components of net periodic benefit cost in 2011.
PensionPlans
Other Post-Retirement
Plan
As of December 31, 2010
(Dollars in millions)
Net actuarial loss . . . . . . . . . . . . . . . . . . . . . . . . . . . . . . . . . . . . . . . . . . . . . . . . . . $11 $ 2
Net prior service cost (credit) . . . . . . . . . . . . . . . . . . . . . . . . . . . . . . . . . . . . . . . . . 1 (5)
Net transition obligation . . . . . . . . . . . . . . . . . . . . . . . . . . . . . . . . . . . . . . . . . . . . . — 1
Total . . . . . . . . . . . . . . . . . . . . . . . . . . . . . . . . . . . . . . . . . . . . . . . . . . . . . . . . . . . $12 $(2)
F-91
FANNIE MAE(In conservatorship)
NOTES TO CONSOLIDATED FINANCIAL STATEMENTS—(Continued)

The following table displays the status of our pension and other postretirement plans as of December 31, 2010and 2009.
PensionPlans
Other Post-Retirement
PlanPensionPlans
Other Post-Retirement
Plan
2010 2009As of December 31,
(Dollars in millions)
Change in Benefit ObligationBenefit obligation at beginning of year. . . . . . . . . . . . . . . . . . . . . . . . . . $1,055 $ 166 $ 959 $ 151Service cost . . . . . . . . . . . . . . . . . . . . . . . . . . . . . . . . . . . . . . . . . . . . 37 6 37 5Interest cost . . . . . . . . . . . . . . . . . . . . . . . . . . . . . . . . . . . . . . . . . . . . 66 9 62 9Plan participants’ contributions . . . . . . . . . . . . . . . . . . . . . . . . . . . . . . . — 2 — 2Net actuarial loss . . . . . . . . . . . . . . . . . . . . . . . . . . . . . . . . . . . . . . . . . 130 4 29 8Curtailment gain . . . . . . . . . . . . . . . . . . . . . . . . . . . . . . . . . . . . . . . . . — — (4) —Benefits paid . . . . . . . . . . . . . . . . . . . . . . . . . . . . . . . . . . . . . . . . . . . . (31) (7) (28) (9)
Benefit obligation at end of year . . . . . . . . . . . . . . . . . . . . . . . . . . . . . . 1,257 180 1,055 166
Change in Plan AssetsFair value of plan assets at beginning of year . . . . . . . . . . . . . . . . . . . . . 799 — 579 —Actual return on plan assets . . . . . . . . . . . . . . . . . . . . . . . . . . . . . . . . . 125 — 166 —Employer contributions . . . . . . . . . . . . . . . . . . . . . . . . . . . . . . . . . . . . 49 6 82 8Plan participants’ contributions . . . . . . . . . . . . . . . . . . . . . . . . . . . . . . . — 2 — 2Benefits paid . . . . . . . . . . . . . . . . . . . . . . . . . . . . . . . . . . . . . . . . . . . . (31) (8) (28) (10)
Fair value of plan assets at end of year . . . . . . . . . . . . . . . . . . . . . . . . . 942 — 799 —
Funded status at end of year . . . . . . . . . . . . . . . . . . . . . . . . . . . . . . . . . $ (315) $(180) $ (256) $(166)
Amounts Recognized in our Consolidated Balance SheetsAccrued benefit cost . . . . . . . . . . . . . . . . . . . . . . . . . . . . . . . . . . . . . . . . $ (315) $(180) $ (256) $(166)Accumulated other comprehensive (income) loss . . . . . . . . . . . . . . . . . . . . 224 (10) 169 (17)
Net amount recognized . . . . . . . . . . . . . . . . . . . . . . . . . . . . . . . . . . . . . . $ (91) $(190) $ (87) $(183)
Actuarial gains or losses reflect annual changes in the amount of either the benefit obligation or the fair valueof plan assets that result from the difference between actual experience and projected amounts or fromchanges in assumptions.
The following table displays the amount of the projected benefit obligation, accumulated benefit obligationand fair value of plan assets for our pension plans as of December 31, 2010 and 2009.
2010 2009As of December 31,
(Dollars in millions)
Projected benefit obligation . . . . . . . . . . . . . . . . . . . . . . . . . . . . . . . . . . . . . . . . . . . . . . $1,257 $1,055
Accumulated benefit obligation . . . . . . . . . . . . . . . . . . . . . . . . . . . . . . . . . . . . . . . . . . . 1,111 926
Fair value of plan assets . . . . . . . . . . . . . . . . . . . . . . . . . . . . . . . . . . . . . . . . . . . . . . . . 942 799
Contributions
Contributions to the qualified pension plan increase the plan assets while contributions to the unfunded plansare made to fund current period benefit payments or to fulfill annual funding requirements. We were notrequired to make minimum contributions to our qualified pension plan for each of the years in the three-yearperiod ended December 31, 2010 since we met the minimum funding requirements as prescribed by ERISA.
F-92
FANNIE MAE(In conservatorship)
NOTES TO CONSOLIDATED FINANCIAL STATEMENTS—(Continued)

However, we did make a discretionary contribution to our qualified pension plan of $42 million, $76 millionand $80 million during 2010, 2009 and 2008, respectively.
During 2010, we contributed $42 million to our qualified pension plan, $7 million to our nonqualified pensionplans and $6 million to our other postretirement benefit plan. During 2011, we anticipate contributing$56 million to our benefit plans, consisting of $41 million to our qualified pension plan, $7 million to ournonqualified pension plans and $8 million to our other postretirement plan.
The fair value of plan assets of our funded qualified pension plan was less than our accumulated benefitobligation by $5 million as of December 31, 2010 and greater than our accumulated benefit obligation by$14 million as of December 31, 2009. There were no plan assets returned to us as of February 24, 2011 andwe do not expect any plan assets to be returned to us during the remainder of 2011.
Assumptions
Pension and other postretirement benefit amounts recognized in our consolidated financial statements aredetermined on an actuarial basis using several different assumptions that are measured as of December 31,2010, 2009 and 2008. The following table displays the actuarial assumptions for our plans used in determiningthe net periodic benefit costs and the projected accumulated benefit obligations as of December 31, 2010,2009 and 2008.
2010 2009 2008 2010 2009 2008Pension Benefits Postretirement Benefits
As of December 31,
Weighted-average assumptions used to determine net periodicbenefit costs:
Discount rate . . . . . . . . . . . . . . . . . . . . . . . . . . . . . . . . . . . . . . . . . 6.10% 6.15% 6.40% 5.75% 6.15% 6.40%
Average rate of increase in future compensation . . . . . . . . . . . . . . . . . 4.00 4.00 5.00
Expected long-term weighted-average rate of return on plan assets . . . . 7.50 7.50 7.50
Weighted-average assumptions used to determine benefit obligationat year-end:
Discount rate . . . . . . . . . . . . . . . . . . . . . . . . . . . . . . . . . . . . . . . . . 5.65% 6.10% 6.15% 5.40% 5.75% 6.15%
Average rate of increase in future compensation . . . . . . . . . . . . . . . . . 4.00 4.00 4.00
Health care cost trend rate assumed for next year:
Pre-65 . . . . . . . . . . . . . . . . . . . . . . . . . . . . . . . . . . . . . . . . . . . . . . 8.00% 8.00% 8.00%
Post-65 . . . . . . . . . . . . . . . . . . . . . . . . . . . . . . . . . . . . . . . . . . . . . 8.00 8.00 8.00
Rate that cost trend rate gradually declines to and remains at: . . . . 5.00 5.00 5.00
Year that rate reaches the ultimate trend rate . . . . . . . . . . . . . . . . . . . 2018 2018 2015
As of December 31, 2010, the effect of a 1% increase or decrease in the assumed health care cost trend ratewould change the accumulated postretirement benefit obligation by $1 million.
We review our pension and other postretirement benefit plan assumptions on an annual basis. We calculate thenet periodic benefit cost each year based on assumptions established at the end of the previous calendar year,unless we remeasure as a result of a curtailment. In determining our net periodic benefit costs, we assess thediscount rate to be used in the annual actuarial valuation of our pension and other postretirement benefitobligations at year-end. We consider the current yields on high-quality, corporate fixed-income debtinstruments with maturities corresponding to the expected duration of our benefit obligations and supported bycash flow matching analysis based on expected cash flows specific to the characteristics of our planparticipants, such as age and gender. As of December 31, 2010, the discount rate used to determine ourobligation decreased by 45 basis points for pension and 35 basis points for postretirement, reflecting a
F-93
FANNIE MAE(In conservatorship)
NOTES TO CONSOLIDATED FINANCIAL STATEMENTS—(Continued)

corresponding rate decrease in corporate-fixed income debt instruments during 2010. We also assess the long-term rate of return on plan assets for our qualified pension plan. The return on asset assumption reflects ourexpectations for plan-level returns over a term of approximately seven to ten years. Given the longer-termnature of the assumption and a stable investment policy, it may or may not change from year to year.However, if longer-term market cycles or other economic developments impact the global investmentenvironment, or asset allocation changes are made, we may adjust our assumption accordingly. The expectedlong-term weighted-average rate of return on plan assets for 2010 remained unchanged from the 2009 rate of7.5%. Changes in assumptions used in determining pension and other postretirement benefit plan expenseresulted in an increase in expense of $4 million for the years ended December 31, 2010 and a decrease inexpense of $4 million and $15 million in our consolidated statements of operations for the years endedDecember 31, 2009 and 2008, respectively.
Qualified Pension Plan Assets
The following table displays our qualified pension plan assets by asset category at their fair value as ofDecember 31, 2010 and 2009. The fair value of assets in Level 1 have been determined based on quotedprices of identical assets in active markets as of year end, while the fair value of assets in Level 2 have beendetermined based on the net asset value per share of the investments as of year end. None of the fair valuesfor plan assets were determined by using significant unobservable inputs, or Level 3.
QuotedPrices in
ActiveMarkets for
IdenticalAssets
(Level 1)
SignificantOther
ObservableInputs
(Level 2) Total
QuotedPrices in
ActiveMarkets for
IdenticalAssets
(Level 1)
SignificantOther
ObservableInputs
(Level 2) Total
2010 2009Fair Value Measurements as of December 31,
(Dollars in millions)
Cash equivalents . . . . . . . . . . . . . . . . . . . . . . . . . . . $ — $ 13 $ 13 $ — $ 14 $ 14
Equity securities:
U.S. large-cap(1) . . . . . . . . . . . . . . . . . . . . . . . . . . 329 — 329 408 — 408
U.S. mid/small cap(2) . . . . . . . . . . . . . . . . . . . . . . . 83 — 83 116 — 116
International(3) . . . . . . . . . . . . . . . . . . . . . . . . . . . — 255 255 — 115 115
Fixed income securities:
Investment grade credit(4) . . . . . . . . . . . . . . . . . . . . — 262 262 — 146 146
Total plan assets at fair value . . . . . . . . . . . . . . . . . . . $412 $530 $942 $524 $275 $799
(1) Consists of a publicly traded equity index fund that tracks the S&P 500.(2) Consists of a publicly traded equity index fund that tracks all regularly traded U.S. stocks except those in the S&P
500.(3) Consists of an international equity fund that tracks an index that consists of approximately 6,500 and 4,000 securities
for 2010 and 2009, respectively, across over 40 countries. Japan has the largest share with 15% in 2010.(4) Consists of a bond fund that tracks a broadly diversified investment grade index that consists of approximately 2,700
issuances of investment grade bonds from diverse industries. International markets represent 19% of the fund.
Our investment strategy is to diversify our plan assets in order to reduce our concentration risk, reflect theplan’s profile over time, and maintain an asset allocation that allows us to meet current and future benefitobligations. The assets of the qualified pension plan consist primarily of exchange-listed stocks, held inbroadly diversified index funds. We also invest in a broadly diversified indexed fixed income account. Inaddition, the plan holds liquid short-term investments that provide for monthly pension payments, plan
F-94
FANNIE MAE(In conservatorship)
NOTES TO CONSOLIDATED FINANCIAL STATEMENTS—(Continued)

expenses and, from time to time, may represent uninvested contributions or reallocation of plan assets. Thetarget allocations for plan assets are from 70% to 80% for equity securities, 25% to 30% for fixed incomesecurities and 0% to 5% for all other types of investments. The plan fiduciary periodically assesses our assetallocation to assure it is consistent with our plan objective.
Expected Benefit Payments
The following table displays the benefits we expect to pay in each of the next five years and in the aggregatefor the subsequent five years for our pension plans and other postretirement plan and are based on the sameassumptions used to measure our benefit obligation as of December 31, 2010.
PensionBenefits
Before MedicarePart D Subsidy
MedicarePart D Subsidy
Other Postretirement BenefitsExpected Retirement Plan Benefit Payments
(Dollars in millions)
2011 . . . . . . . . . . . . . . . . . . . . . . . . . . . . . . . . . . . . . . . . . . . $ 33 $ 9 $1
2012 . . . . . . . . . . . . . . . . . . . . . . . . . . . . . . . . . . . . . . . . . . . 36 9 1
2013 . . . . . . . . . . . . . . . . . . . . . . . . . . . . . . . . . . . . . . . . . . . 40 10 1
2014 . . . . . . . . . . . . . . . . . . . . . . . . . . . . . . . . . . . . . . . . . . . 44 11 1
2015 . . . . . . . . . . . . . . . . . . . . . . . . . . . . . . . . . . . . . . . . . . . 49 12 1
2016—2020 . . . . . . . . . . . . . . . . . . . . . . . . . . . . . . . . . . . . . . 348 73 8
Defined Contribution Plans
Retirement Savings Plan
The Retirement Savings Plan is a defined contribution plan that includes a 401(k) before-tax feature, a regularafter-tax feature and a Roth after-tax feature. Under the plan, eligible employees may allocate investmentbalances to a variety of investment options.
We match employee contributions in cash up to 6% of eligible compensation (base salary, overtime pay andeligible incentive compensation) for employees who are not active in our defined benefit pension plan and upto 3% of eligible compensation (base salary only) for employees who are active in our defined benefit pensionplan. Matching contributions for employees who are not active in our defined benefit pension plan are 100%vested and matching contributions for employees who are active in our defined benefit pension plan are fullyvested after five years of service.
All employees, with the exception of those who participated in the Executive Pension Plan, receive a 2%contribution regardless of employee contributions to this plan. Participants are fully vested in this 2%contribution after three years of service.
For the years ended December 31, 2010, 2009 and 2008, the maximum employee contribution as establishedby the IRS was $16,500, $16,500 and $15,500, respectively, with additional “catch- up” contributionspermitted for participants aged 50 and older of $5,500, $5,500 and $5,000, respectively.
There was no option to invest directly in our common stock for the years ended December 31, 2010, 2009 and2008. We recorded expense for this plan of $47 million, $42 million and $35 million for the years endedDecember 31, 2010, 2009 and 2008, respectively.
F-95
FANNIE MAE(In conservatorship)
NOTES TO CONSOLIDATED FINANCIAL STATEMENTS—(Continued)

Supplemental Retirement Savings Plan
The Supplemental Retirement Savings Plan is an unfunded, nonqualified defined contribution plan. This plansupplements our Retirement Savings Plan to provide benefits to employees who are not grandfathered underour defined benefit pension plan and whose annual eligible earnings exceed the IRS annual limit on eligiblecompensation for 401(k) plans.
We credit to the plan 8% of a participant’s eligible compensation that exceeds the IRS annual limit. Eligiblecompensation consists of base salary plus eligible incentive compensation earned, if any, up to a combinedmaximum of two times base salary. The 8% credit consists of (1) a 6% credit that vests immediately, and (2) a2% credit that vests after three years of service.
For the years ended December 31, 2010, 2009 and 2008, we recognized expense related to this plan of lessthan $1 million in each year.
Employee Stock Ownership Plan
During 2010, our Employee Stock Ownership Plan (“ESOP”) was terminated and amended to provide that alldistributions are to be made in cash. In addition, all Fannie Mae Common Stock in the ESOP was sold as partof the plan termination. The assets of the ESOP will be distributed to participants following receipt of an IRSdetermination letter regarding the tax qualification status of the ESOP.
15. Segment Reporting
Our three reportable segments are: Single-Family, Multifamily, and Capital Markets. In October 2010, webegan referring to our “HCD” business segment as our “Multifamily” business segment to better reflect thesegment’s focus on multifamily rental housing finance, especially affordable rentals, which is an increasinglyimportant part of our company’s mission. We use these three segments to generate revenue and managebusiness risk, and each segment is based on the type of business activities it performs.
Segment Reporting for 2010
Our prospective adoption of the new accounting standards had a significant impact on the presentation andcomparability of our consolidated financial statements due to the consolidation of the substantial majority ofour single-class securitization trusts and the elimination of previously recorded deferred revenue from ourguaranty arrangements. We continue to manage Fannie Mae based on the same three business segments.However, effective in 2010, we changed the presentation of segment financial information that is currentlyevaluated by management.
Under the current segment reporting, the sum of the results for our three business segments does not equal ourconsolidated statements of operations, as we separate the activity related to our consolidated trusts from theresults generated by our three segments. In addition, we include an eliminations/adjustments category toreconcile our business segment results and the activity related to our consolidated trusts to our consolidatedstatements of operations.
While some line items in our segment results were not impacted by either the change from the new accountingstandards or changes to our segment presentation, others were impacted significantly, which reduces thecomparability of our segment results with prior years. We have neither restated prior year results nor presentedcurrent year results under the old presentation as we determined that it was impracticable to do so; therefore,our segment results reported in the current period are not comparable with prior years.
F-96
FANNIE MAE(In conservatorship)
NOTES TO CONSOLIDATED FINANCIAL STATEMENTS—(Continued)
The section below provides a discussion of the three business segments and how each segment’s financialinformation reconciles to our consolidated financial statements for those line items that were impactedsignificantly as a result of changes to our segment presentation.
Single-Family
Revenue drivers for Single-Family did not change under our current method of segment reporting. Revenue forour Single-Family business is from the guaranty fees the segment receives as compensation for assuming thecredit risk on the mortgage loans underlying single-family Fannie Mae MBS, most of which are held withinconsolidated trusts, and on the single-family mortgage loans held in our mortgage portfolio. The primarysource of profit for the Single-Family segment is the difference between the guaranty fees earned and the costsof providing the guaranty, including credit-related losses.
Our current segment reporting presentation differs from our consolidated balance sheets and statements ofoperations in order to reflect the activities and results of the Single-Family segment. The significantdifferences from the consolidated statements of operations are as follows:
• Guaranty fee income—Guaranty fee income reflects (1) the cash guaranty fees paid by MBS trusts toSingle-Family, (2) the amortization of deferred cash fees (both the previously recorded deferred cash feesthat were eliminated from our consolidated balance sheets at transition and deferred guaranty feesreceived subsequent to transition that are currently recognized in our consolidated financial statementsthrough interest income), such as buy-ups, buy-downs, and risk-based pricing adjustments, and (3) theguaranty fees from the Capital Markets group on single-family loans in our mortgage portfolio. Toreconcile to our consolidated statements of operations, we eliminate guaranty fees and the amortization ofdeferred cash fees related to consolidated trusts as they are now reflected as a component of interestincome. However, such accounting continues to be reflected for the segment reporting presentation.
• Net interest income (expense)—Net interest expense within the Single-Family segment reflects interestexpense to reimburse Capital Markets and consolidated trusts for contractual interest not received onmortgage loans, when interest income is no longer recognized in accordance with our nonaccrualaccounting policy in our consolidated statements of operations. Net interest income (expense), alsoincludes an allocated cost of capital charge among the three segments that is not included in net interestincome in the consolidated statement of operations.
Multifamily
Revenue drivers for Multifamily did not change under our current method of segment reporting. The primarysources of revenue for our Multifamily business are (1) guaranty fees the segment receives as compensationfor assuming the credit risk on the mortgage loans underlying multifamily Fannie Mae MBS, most of whichare held within consolidated trusts, (2) guaranty fees on the multifamily mortgage loans held in our mortgageportfolio, (3) transaction fees associated with the multifamily business and (4) bond credit enhancement fees.Investments in rental and for-sale housing generate revenue and losses from operations and the eventual saleof the assets. In the fourth quarter of 2009, we reduced the carrying value of our LIHTC investments to zero.As a result, we no longer recognize net operating losses or other-than-temporary impairment on our LIHTCinvestments. While the Multifamily guaranty business is similar to our Single-Family business, neither theeconomic return nor the nature of the credit risk is similar to that of Single-Family.
F-97
FANNIE MAE(In conservatorship)
NOTES TO CONSOLIDATED FINANCIAL STATEMENTS—(Continued)
Our current segment reporting presentation differs from our consolidated balance sheets and statements ofoperations in order to reflect the activities and results of the Multifamily segment. The significant differencesfrom the consolidated statements of operations are as follows:
• Guaranty fee income—Guaranty fee income reflects the cash guaranty fees paid by MBS trusts toMultifamily and the guaranty fees from the Capital Markets group on multifamily loans in Fannie Mae’sportfolio. To reconcile to our consolidated statements of operations, we eliminate guaranty fees related toconsolidated trusts.
• Income (losses) from partnership investments—Income (losses) from partnership investments primarilyreflect losses on investments in affordable rental and for-sale housing partnerships measured under theequity method of accounting. To reconcile to our consolidated statements of operations, we adjust thelosses to reflect the consolidation of certain partnership investments.
Capital Markets Group
Revenue drivers for Capital Markets did not change under our current method of segment reporting. OurCapital Markets group generates most of its revenue from the difference, or spread, between the interest weearn on our mortgage assets and the interest we pay on the debt we issue to fund these assets. We refer to thisspread as our net interest yield. Changes in the fair value of the derivative instruments and trading securitieswe hold impact the net income or loss reported by the Capital Markets group. The net income or loss reportedby our Capital Markets group is also affected by the impairment of AFS securities.
Our current segment reporting presentation differs from our consolidated balance sheets and statements ofoperations in order to reflect the activities and results of the Capital Markets group. The significant differencesfrom the consolidated statements of operations are as follows:
• Net interest income—Net interest income reflects the interest income on mortgage loans and securitiesowned by Fannie Mae and interest expense on funding debt issued by Fannie Mae, including accretionand amortization of any cost basis adjustments. To reconcile to our consolidated statements of operations,we adjust for the impact of consolidated trusts and intercompany eliminations as follows:
• Interest income: Interest income consists of interest on the segment’s interest-earning assets, whichdiffers from interest-earning assets in our consolidated balance sheets. We exclude loans and securitiesthat underlie the consolidated trusts from our Capital Markets group balance sheets. The net interestincome reported by the Capital Markets group excludes the interest income earned on assets held byconsolidated trusts. As a result, we report interest income and amortization of cost basis adjustmentsonly on securities and loans that are held in our portfolio. For mortgage loans held in our portfolio,when interest income is no longer recognized in accordance with our nonaccrual accounting policy, theCapital Markets group recognizes interest income for reimbursement from Single-Family andMultifamily for the contractual interest due under the terms of our intracompany guaranty arrangement.
• Interest expense: Interest expense consists of contractual interest on the Capital Markets group’sinterest-bearing liabilities, including the accretion and amortization of any cost basis adjustments. Itexcludes interest expense on debt issued by consolidated trusts. Therefore, the interest expenserecognized on the Capital Markets group income statement is limited to our funding debt, which isreported as “Debt of Fannie Mae” in our consolidated balance sheets. Net interest expense also includesan allocated cost of capital charge among the three business segments that is not included in netinterest income in our consolidated statements of operations.
• Investment gains or losses, net—Investment gains or losses, net reflects the gains and losses onsecuritizations and sales of available-for-sale securities from our portfolio. To reconcile to our
F-98
FANNIE MAE(In conservatorship)
NOTES TO CONSOLIDATED FINANCIAL STATEMENTS—(Continued)

consolidated statements of operations, we eliminate gains and losses on securities that have beenconsolidated to loans.
• Fair value gains or losses, net—Fair value gains or losses, net for the Capital Markets group includesderivative gains and losses, foreign exchange gains and losses, and the fair value gains and losses oncertain debt securities in our portfolio. To reconcile to our consolidated statements of operations, weeliminate fair value gains or losses on Fannie Mae MBS that have been consolidated to loans.
• Other expenses, net—Debt extinguishment gains or losses recorded on the segment statements ofoperations relate exclusively to our funding debt, which is reported as “Debt of Fannie Mae” on ourconsolidated balance sheets. To reconcile to our consolidated statements of operations, we include debtextinguishment gains or losses related to consolidated trusts to arrive at our total recognized debtextinguishment gains or losses.
Segment Allocations and Results
Our segment financial results include directly attributable revenues and expenses. Additionally, we allocate toeach of our segments: (1) capital using FHFA minimum capital requirements adjusted for over- or under-capitalization; (2) indirect administrative costs; and (3) a provision or benefit for federal income taxes. Inaddition, we allocate intracompany guaranty fee income as a charge from the Single-Family and Multifamilysegments to Capital Markets for managing the credit risk on mortgage loans held by the Capital Marketsgroup.
With the adoption of the new accounting standards, we have prospectively revised the presentation of ourresults for these segments to better reflect how we operate and oversee these businesses.
F-99
FANNIE MAE(In conservatorship)
NOTES TO CONSOLIDATED FINANCIAL STATEMENTS—(Continued)
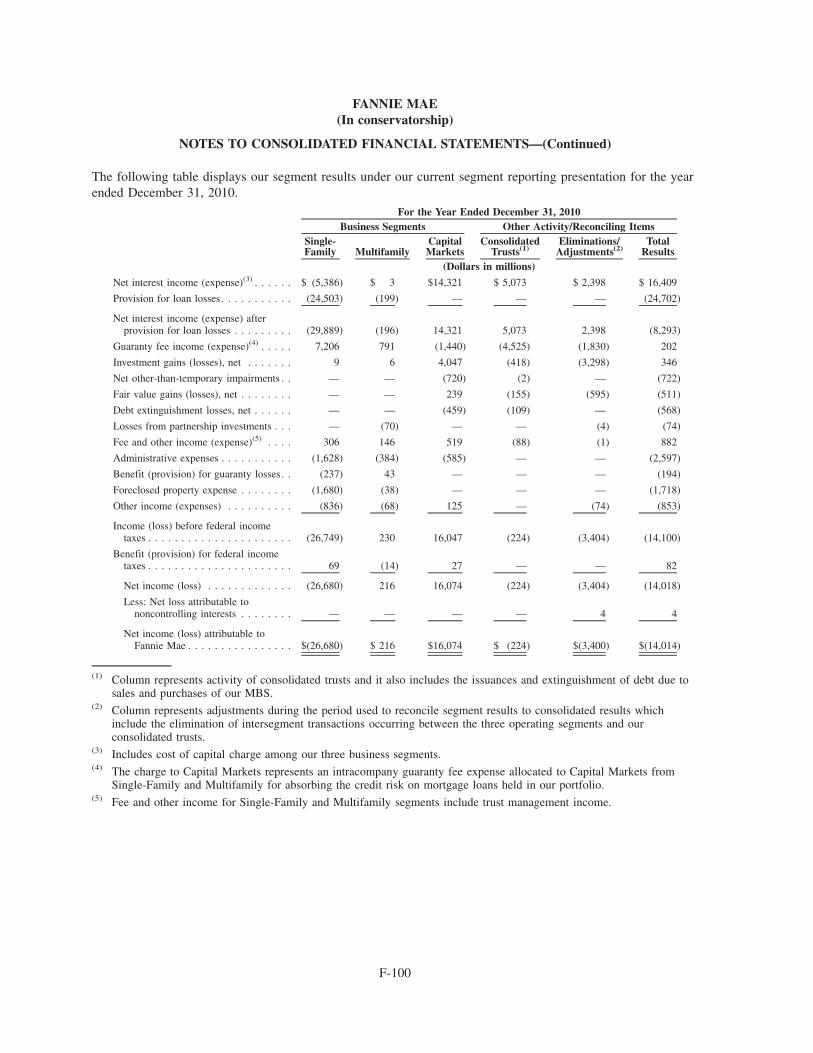
The following table displays our segment results under our current segment reporting presentation for the yearended December 31, 2010.
Single-Family Multifamily
CapitalMarkets
ConsolidatedTrusts(1)
Eliminations/Adjustments(2)
TotalResults
Business Segments Other Activity/Reconciling ItemsFor the Year Ended December 31, 2010
(Dollars in millions)
Net interest income (expense)(3) . . . . . . $ (5,386) $ 3 $14,321 $ 5,073 $ 2,398 $ 16,409
Provision for loan losses . . . . . . . . . . . (24,503) (199) — — — (24,702)
Net interest income (expense) afterprovision for loan losses . . . . . . . . . (29,889) (196) 14,321 5,073 2,398 (8,293)
Guaranty fee income (expense)(4) . . . . . 7,206 791 (1,440) (4,525) (1,830) 202
Investment gains (losses), net . . . . . . . 9 6 4,047 (418) (3,298) 346
Net other-than-temporary impairments . . — — (720) (2) — (722)
Fair value gains (losses), net . . . . . . . . — — 239 (155) (595) (511)
Debt extinguishment losses, net . . . . . . — — (459) (109) — (568)
Losses from partnership investments . . . — (70) — — (4) (74)
Fee and other income (expense)(5) . . . . 306 146 519 (88) (1) 882
Administrative expenses . . . . . . . . . . . (1,628) (384) (585) — — (2,597)
Benefit (provision) for guaranty losses. . (237) 43 — — — (194)
Foreclosed property expense . . . . . . . . (1,680) (38) — — — (1,718)
Other income (expenses) . . . . . . . . . . (836) (68) 125 — (74) (853)
Income (loss) before federal incometaxes . . . . . . . . . . . . . . . . . . . . . . (26,749) 230 16,047 (224) (3,404) (14,100)
Benefit (provision) for federal incometaxes . . . . . . . . . . . . . . . . . . . . . . 69 (14) 27 — — 82
Net income (loss) . . . . . . . . . . . . . (26,680) 216 16,074 (224) (3,404) (14,018)
Less: Net loss attributable tononcontrolling interests . . . . . . . . — — — — 4 4
Net income (loss) attributable toFannie Mae . . . . . . . . . . . . . . . . $(26,680) $ 216 $16,074 $ (224) $(3,400) $(14,014)
(1) Column represents activity of consolidated trusts and it also includes the issuances and extinguishment of debt due tosales and purchases of our MBS.
(2) Column represents adjustments during the period used to reconcile segment results to consolidated results whichinclude the elimination of intersegment transactions occurring between the three operating segments and ourconsolidated trusts.
(3) Includes cost of capital charge among our three business segments.(4) The charge to Capital Markets represents an intracompany guaranty fee expense allocated to Capital Markets from
Single-Family and Multifamily for absorbing the credit risk on mortgage loans held in our portfolio.(5) Fee and other income for Single-Family and Multifamily segments include trust management income.
F-100
FANNIE MAE(In conservatorship)
NOTES TO CONSOLIDATED FINANCIAL STATEMENTS—(Continued)

The following tables display our segment results under our previous segment reporting presentation for theyears ended December 31, 2009 and 2008.
Single-Family Multifamily
CapitalMarkets Total
For the Year Ended December 31, 2009
(Dollars in millions)
Net interest income (expense)(1) . . . . . . . . . . . . . . . . . . . . . . $ 428 $ (193) $14,275 $ 14,510
Guaranty fee income (expense)(2) . . . . . . . . . . . . . . . . . . . . . 8,002 675 (1,466) 7,211
Investment gains (losses), net . . . . . . . . . . . . . . . . . . . . . . . . (2) — 1,460 1,458
Net other-than-temporary impairments . . . . . . . . . . . . . . . . . . — — (9,861) (9,861)
Fair value losses, net . . . . . . . . . . . . . . . . . . . . . . . . . . . . . . — — (2,811) (2,811)
Debt extinguishment losses, net . . . . . . . . . . . . . . . . . . . . . . . — — (325) (325)
Losses from partnership investments . . . . . . . . . . . . . . . . . . . — (6,735) — (6,735)
Fee and other income(3) . . . . . . . . . . . . . . . . . . . . . . . . . . . . 354 100 319 773
Administrative expenses . . . . . . . . . . . . . . . . . . . . . . . . . . . . (1,419) (363) (425) (2,207)
Provision for credit losses . . . . . . . . . . . . . . . . . . . . . . . . . . . (70,463) (2,163) — (72,626)
Foreclosed property expense . . . . . . . . . . . . . . . . . . . . . . . . . (857) (53) — (910)
Other expenses . . . . . . . . . . . . . . . . . . . . . . . . . . . . . . . . . . (1,216) (38) (230) (1,484)
Income (loss) before federal income taxes . . . . . . . . . . . . . . . (65,173) (8,770) 936 (73,007)
Benefit (provision) for federal income taxes . . . . . . . . . . . . . . 1,375 (311) (79) 985
Net income (loss) . . . . . . . . . . . . . . . . . . . . . . . . . . . . . . . (63,798) (9,081) 857 (72,022)
Less: Net loss attributable to noncontrolling interest . . . . . . . — 53 — 53
Net income (loss) attributable to Fannie Mae . . . . . . . . . . . . $(63,798) $(9,028) $ 857 $(71,969)
(1) Includes cost of capital charge.(2) The charge to Capital Markets represents an intercompany guaranty fee expense allocated to Capital Markets from
Single-Family and Multifamily for absorbing the credit risk on mortgage loans held in our portfolio.(3) Certain prior period amounts have been reclassified to conform to the current period presentation.
F-101
FANNIE MAE(In conservatorship)
NOTES TO CONSOLIDATED FINANCIAL STATEMENTS—(Continued)

Single-Family Multifamily
CapitalMarkets Total
For the Year Ended December 31, 2008
(Dollars in millions)
Net interest income (expense) (1) . . . . . . . . . . . . . . . . . . . . . . . . . . . . . $ 461 $ (343) $ 8,664 $ 8,782
Guaranty fee income (expense)(2) . . . . . . . . . . . . . . . . . . . . . . . . . . . . . 8,390 633 (1,402) 7,621
Investment losses, net . . . . . . . . . . . . . . . . . . . . . . . . . . . . . . . . . . . . (72) — (174) (246)
Net other-than-temporary impairments . . . . . . . . . . . . . . . . . . . . . . . . . — — (6,974) (6,974)
Fair value losses, net . . . . . . . . . . . . . . . . . . . . . . . . . . . . . . . . . . . . . — — (20,129) (20,129)
Debt extinguishment losses, net . . . . . . . . . . . . . . . . . . . . . . . . . . . . . . — — (222) (222)
Losses from partnership investments . . . . . . . . . . . . . . . . . . . . . . . . . . . — (1,554) — (1,554)
Fee and other income (3) . . . . . . . . . . . . . . . . . . . . . . . . . . . . . . . . . . 583 186 264 1,033
Administrative expenses . . . . . . . . . . . . . . . . . . . . . . . . . . . . . . . . . . . (1,127) (404) (448) (1,979)
Provision for credit losses. . . . . . . . . . . . . . . . . . . . . . . . . . . . . . . . . . (27,881) (70) — (27,951)
Foreclosed property expense . . . . . . . . . . . . . . . . . . . . . . . . . . . . . . . . (1,844) (14) — (1,858)
Other expenses . . . . . . . . . . . . . . . . . . . . . . . . . . . . . . . . . . . . . . . . . (823) (133) (137) (1,093)
Loss before federal income taxes and extraordinary losses . . . . . . . . . . . . . (22,313) (1,699) (20,558) (44,570)
Provision for federal income taxes . . . . . . . . . . . . . . . . . . . . . . . . . . . . (4,788) (511) (8,450) (13,749)
Loss before extraordinary losses . . . . . . . . . . . . . . . . . . . . . . . . . . . . . (27,101) (2,210) (29,008) (58,319)
Extraordinary losses, net of tax effect . . . . . . . . . . . . . . . . . . . . . . . . . . — — (409) (409)
Net loss . . . . . . . . . . . . . . . . . . . . . . . . . . . . . . . . . . . . . . . . . . . . (27,101) (2,210) (29,417) (58,728)
Less: Net loss attributable to the noncontrolling interest . . . . . . . . . . . . — 21 — 21
Net loss attributable to Fannie Mae . . . . . . . . . . . . . . . . . . . . . . . . . . $(27,101) $(2,189) $(29,417) $(58,707)
(1) Includes cost of capital charge.(2) The charge to Capital Markets represents an intercompany guaranty fee expense allocated to Capital Markets from
Single-Family and Multifamily for absorbing the credit risk on mortgage loans held in our portfolio.(3) Certain prior period amounts have been reclassified to conform to the current period presentation.
The following table displays total assets by segment as of December 31, 2010 and 2009.
2010 2009As of December 31,
(Dollars in millions)
Single-Family(1) . . . . . . . . . . . . . . . . . . . . . . . . . . . . . . . . . . . . . . . . . . . . . . . . . . $ 14,843 $ 19,991
Multifamily(1) . . . . . . . . . . . . . . . . . . . . . . . . . . . . . . . . . . . . . . . . . . . . . . . . . . . . 4,881 5,698
Capital Markets . . . . . . . . . . . . . . . . . . . . . . . . . . . . . . . . . . . . . . . . . . . . . . . . . . 873,052 843,452
Consolidated trusts . . . . . . . . . . . . . . . . . . . . . . . . . . . . . . . . . . . . . . . . . . . . . . . . 2,673,937 —
Eliminations/adjustments(1). . . . . . . . . . . . . . . . . . . . . . . . . . . . . . . . . . . . . . . . . . . (344,741) —
Total assets . . . . . . . . . . . . . . . . . . . . . . . . . . . . . . . . . . . . . . . . . . . . . . . . . . . . $3,221,972 $869,141
(1) Beginning in 2010, the allowance for loan losses, allowance for accrued interest receivable and fair value lossespreviously recognized on acquired credit impaired loans are not treated as assets for Single-Family and Multifamilysegment reporting purposes because these allowances and losses relate to loan assets that are held by the CapitalMarkets segment and consolidated trusts.
We operate our business solely in the United States and its territories, and accordingly, we generate no revenuefrom and have no assets in geographic locations other than the United States and its territories.
F-102
FANNIE MAE(In conservatorship)
NOTES TO CONSOLIDATED FINANCIAL STATEMENTS—(Continued)

16. Equity (Deficit)
Common Stock
Shares of common stock outstanding, net of shares held as treasury stock, totaled 1.1 billion as of bothDecember 31, 2010 and 2009. In 2008, we received gross proceeds of $2.6 billion from the issuance of94 million new shares of no par value common stock with a stated value of $0.5250 per share.
During the conservatorship, the rights and powers of shareholders are suspended. Accordingly, our commonshareholders have no ability to elect directors or to vote on other matters during the conservatorship unlessFHFA elects to delegate this authority to them. The senior preferred stock purchase agreement with Treasuryprohibits the payment of dividends on common stock without the prior written consent of Treasury. Theconservator also has eliminated common stock dividends. In addition, we issued a warrant to Treasury thatprovides Treasury with the right to purchase for a nominal price shares of our common stock equal to 79.9%of the total number of shares of common stock outstanding on a fully diluted basis on the date of exercise,which would substantially dilute the ownership in Fannie Mae of our common stockholders at the time ofexercise. Refer to “Senior Preferred Stock and Common Stock Warrant” section below.
F-103
FANNIE MAE(In conservatorship)
NOTES TO CONSOLIDATED FINANCIAL STATEMENTS—(Continued)

Preferred Stock
The following table displays our senior preferred stock and preferred stock outstanding as of December 31,2010 and 2009.
Title Issue Date Shares Amount Shares Amount
StatedValue
per share
AnnualDividendRate as of
December 31,2010
Redeemable onor After
2010 2009
Issued and Outstanding as ofDecember 31,
(Dollars and shares in millions, except per share amounts)
Senior Preferred Stock
Series 2008-2 . . . . . . . . . . . . September 8, 2008 1 $88,600 1 $60,900 $ 88,600(1) 10.000%(2) (3)
Total . . . . . . . . . . . . . . . . . 1 $88,600 1 $60,900
Preferred Stock
Series D . . . . . . . . . . . . . . . September 30, 1998 3 $ 150 3 $ 150 $ 50 5.250% September 30, 1999
Series E . . . . . . . . . . . . . . . April 15, 1999 3 150 3 150 50 5.100 April 15, 2004
Series F . . . . . . . . . . . . . . . March 20, 2000 14 690 14 690 50 0.890(4) March 31, 2002(5)
Series G . . . . . . . . . . . . . . . August 8, 2000 6 288 6 288 50 0.270(6) September 30, 2002(5)
Series H . . . . . . . . . . . . . . . April 6, 2001 8 400 8 400 50 5.810 April 6, 2006
Series I . . . . . . . . . . . . . . . . October 28, 2002 6 300 6 300 50 5.375 October 28, 2007
Series L . . . . . . . . . . . . . . . April 29, 2003 7 345 7 345 50 5.125 April 29, 2008
Series M . . . . . . . . . . . . . . . June 10, 2003 9 460 9 460 50 4.750 June 10, 2008
Series N . . . . . . . . . . . . . . . September 25, 2003 5 225 5 225 50 5.500 September 25, 2008
Series O . . . . . . . . . . . . . . . December 30, 2004 50 2,500 50 2,500 50 7.000(7) December 31, 2007
Convertible
Series 2004-1(8) . . . . . . . . . December 30, 2004 — 2,492 — 2,492 100,000 5.375 January 5, 2008
Series P . . . . . . . . . . . . . . . September 28, 2007 40 1,000 40 1,000 25 4.500(9) September 30, 2012
Series Q . . . . . . . . . . . . . . . October 4, 2007 15 375 15 375 25 6.750 September 30, 2010
Series R(10) . . . . . . . . . . . . . November 21, 2007 21 530 21 530 25 7.625 November 21, 2012
Series S . . . . . . . . . . . . . . . December 11, 2007 280 7,000 280 7,000 25 7.750(11) December 31, 2010(12)
Mandatory
Convertible
Series 2008-1 . . . . . . . . . . May 14, 2008 21 1,074 24 1,218 50 8.750 N/A
Series T(13) . . . . . . . . . . . . . May 19, 2008 89 2,225 89 2,225 25 8.250 May 20, 2013
Total . . . . . . . . . . . . . . . . 577 $20,204 580 $20,348
(1) Initial Stated Value per share was $1,000. Based on our draws of funds under the Senior Preferred Stock VariableLiquidation Preference agreement with Treasury, the Stated Value per share on December 31, 2010 was $88,600.
(2) Rate effective September 9, 2008. If at any time we fail to pay cash dividends in a timely manner, then immediatelyfollowing such failure and for all dividend periods thereafter until the dividend period following the date on whichwe have paid in cash full cumulative dividends (including any unpaid dividends added to the liquidation preference),the dividend rate will be 12% per year.
(3) Any liquidation preference of our senior preferred stock in excess of $1.0 billion may be repaid through an issuanceof common or preferred stock. The initial $1.0 billion investment may be repaid only in conjunction with terminationof the senior preferred stock purchase agreement. The provisions for termination under the senior preferred stockpurchase agreement are very restrictive and cannot occur while we are in conservatorship.
(4) Rate effective March 31, 2010. Variable dividend rate resets every two years at a per annum rate equal to the two-year Maturity U.S. Treasury Rate (“CMT”) minus 0.16% with a cap of 11% per year. As of December 31, 2010, theannual dividend rate was 0.89%.
F-104
FANNIE MAE(In conservatorship)
NOTES TO CONSOLIDATED FINANCIAL STATEMENTS—(Continued)

(5) Represents initial call date. Redeemable every two years thereafter.(6) Rate effective September 30, 2010. Variable dividend rate resets every two years at a per annum rate equal to the
two-year CMT rate minus 0.18% with a cap of 11% per year. As of December 31, 2010, the annual dividend rate was0.27%.
(7) Rate effective December 31, 2010. Variable dividend rate resets quarterly thereafter at a per annum rate equal to thegreater of 7.00% and 10-year CMT rate plus 2.375%. As of December 31, 2010, the annual dividend rate was 7.00%.
(8) Issued and outstanding shares were 24,922 both as of December 31, 2010 and 2009, respectively.(9) Rate effective December 31, 2010. Variable dividend rate resets quarterly thereafter at a per annum rate equal to the
greater of 4.50% and 3-Month LIBOR plus 0.75%. As of December 31, 2010, the annual dividend rate was 4.50%.(10) On November 21, 2007, we issued 20 million shares of preferred stock in the amount of $500 million. Subsequent to
the initial issuance, we issued an additional 1.2 million shares in the amount of $30 million on December 14, 2007under the same terms as the initial issuance.
(11) Rate effective December 31, 2010. Variable dividend rate resets quarterly thereafter at a per annum rate equal to thegreater of 7.75% and 3-Month LIBOR plus 4.23%. As of December 31, 2010, the annual dividend rate was 7.75%.
(12) Represents initial call date. Redeemable every five years thereafter.(13) On May 19, 2008, we issued 80 million shares of preferred stock in the amount of $2.0 billion. Subsequent to the
initial issuance, we issued an additional 8 million shares in the amount of $200 million on May 22, 2008 and onemillion shares in the amount of $25 million on June 4, 2008 under the same terms as the initial issuance.
As described under “Senior Preferred Stock and Common Stock Warrant” we issued senior preferred stockthat ranks senior to all other series of preferred stock as to both dividends and distributions upon dissolution,liquidation or winding up of the company. During the conservatorship, the rights and powers of preferredstockholders (other than holders of senior preferred stock) are suspended. The senior preferred stock purchaseagreement with Treasury also prohibits the payment of dividends on preferred stock (other than the seniorpreferred stock) without the prior written consent of Treasury. The conservator also has eliminated preferredstock dividends, other than dividends on the senior preferred stock.
Each series of our preferred stock has no par value, is non-participating, is non-voting and has a liquidationpreference equal to the stated value per share. None of our preferred stock is convertible into or exchangeablefor any of our other stock or obligations, with the exception of the Convertible Series 2004-1 and Non-cumulative Mandatory Convertible Series 2008-1.
Shares of the Convertible Series 2004-1 Preferred Stock are convertible at any time, at the option of theholders, into shares of Fannie Mae common stock at a conversion price of $94.31 per share of common stock(equivalent to a conversion rate of 1,060.3329 shares of common stock for each share of Series 2004-1Preferred Stock). The conversion price is adjustable, as necessary, to maintain the stated conversion rate intocommon stock. Events which may trigger an adjustment to the conversion price include certain changes in ourcommon stock dividend rate, subdivisions of our outstanding common stock into a greater number of shares,combinations of our outstanding common stock into a smaller number of shares and issuances of any sharesby reclassification of our common stock. No such events have occurred.
Holders of preferred stock (other than the senior preferred stock are entitled to receive non-cumulative,quarterly dividends when, and if, declared by our Board of Directors, but have no right to require redemptionof any shares of preferred stock. Payment of dividends on preferred stock (other than the senior preferredstock) is not mandatory, but has priority over payment of dividends on common stock, which are also declaredby the Board of Directors. If dividends on the preferred stock are not paid or set aside for payment for a givendividend period, dividends may not be paid on our common stock for that period. For the year endedDecember 31, 2008, dividends declared on preferred stock (excluding the senior preferred stock) were$1.0 billion. There were no dividends declared or paid on preferred stock (other than the senior preferredstock) for the year ended December 31, 2010 or 2009.
F-105
FANNIE MAE(In conservatorship)
NOTES TO CONSOLIDATED FINANCIAL STATEMENTS—(Continued)

After a specified period, we have the option to redeem preferred stock (other than the senior preferred stock)at its redemption price plus the dividend (whether or not declared) for the then-current period accrued to, butexcluding, the date of redemption. The redemption price is equal to the stated value for all issues of preferredstock except Series O, which has a redemption price of $50 to $52.50 depending on the year of redemption,Convertible Series 2004-1, which has a redemption price of $105,000 per share, and Mandatory ConvertibleSeries 2008-1 which is not redeemable.
Our preferred stock is traded in the over-the-counter market.
Issuance of Preferred Stock
On May 14, 2008, we received gross proceeds of $2.6 billion from the issuance of 52 million shares of 8.75%Non-Cumulative Mandatory Convertible Preferred Stock, Series 2008-1, with a stated value of $50 per share.Each share has a liquidation preference equal to its stated value of $50 per share plus an amount equal to thedividend for the then-current quarterly dividend period. The Mandatory Convertible Series 2008-1 PreferredStock is not redeemable by us. On May 13, 2011, the mandatory conversion date, each share of the PreferredStock will automatically convert into between 1.5408 and 1.8182 shares of our common stock, subject to anti-dilution adjustments, depending on the average of the closing prices per share of our common stock for eachof the 20 consecutive trading days ending on the third trading day prior to such date. At any time prior to themandatory conversion date, holders may elect to convert each share of our Preferred Stock into a minimum of1.5408 shares of common stock, subject to anti-dilution adjustments. The Mandatory ConvertibleSeries 2008-1 shares are considered participating securities for purposes of calculating earnings per share.
On May 19, 2008, we received gross proceeds of $2.0 billion from the issuance of 80 million shares of 8.25%Non-Cumulative Preferred Stock, Series T, with a stated value of $25 per share. Subsequent to the initialissuance, we received gross proceeds of $200 million from the additional issuance of 8 million shares onMay 22, 2008 and $25 million from the additional issuance of one million shares on June 4, 2008. Each sharehas a liquidation preference equal to its stated value of $25 per share plus accrued dividends for the then-current quarterly dividend period. The Series T Preferred Stock may be redeemed, at our option, on or afterMay 20, 2013. Pursuant to the covenants set forth in the senior preferred stock purchase agreement describedbelow, we must obtain the prior written consent of Treasury in order to exercise our option to redeem theSeries T Preferred Stock.
Conversions of Preferred Stock to Common Stock
For the year ended December 31, 2010, 2,867,318 shares of Mandatory Convertible Series 2008-1 wereconverted to 4,417,947 shares of common stock. For the year ended December 31, 2009, 17,335,866 shares ofMandatory Convertible Series 2008-1 were converted to 26,711,068 shares of common stock. Also 78 sharesof Mandatory Convertible Series 2004-1 were converted to 82,705 shares of common stock. For the yearended December 31, 2008, 10,053,599 shares of Mandatory Convertible Series 2008-1 were converted to15,490,568 shares of common stock.
Senior Preferred Stock and Common Stock Warrant
On September 8, 2008, we issued one million shares of Variable Liquidation Preference Senior PreferredStock, Series 2008-2 (“senior preferred stock”), with an aggregate stated value and initial liquidationpreference of $1.0 billion. On September 7, 2008, we issued a warrant to purchase common stock to Treasury.The warrant gives Treasury the right to purchase shares of our common stock equal to 79.9% of the totalnumber of shares of common stock outstanding on a fully diluted basis on the date of exercise. The seniorpreferred stock and the warrant were issued in consideration for the initial commitment from Treasury toprovide up to $100.0 billion in cash to us under the terms set forth in the senior preferred stock purchase
F-106
FANNIE MAE(In conservatorship)
NOTES TO CONSOLIDATED FINANCIAL STATEMENTS—(Continued)

agreement prior to subsequent amendments. We did not receive any cash proceeds as a result of issuing theseshares or the warrant. We have assigned a value of $4.5 billion to Treasury’s commitment, which has beenrecorded as a reduction to additional paid-in-capital and was partially offset by the aggregate fair value of thewarrant. There was no impact to the total balance of stockholders’ equity (deficit) as a result of the issuanceas reported in our consolidated statement of changes in stockholders’ equity (deficit).
Variable Liquidation Preference Senior Preferred Stock, Series 2008-2
Shares of the senior preferred stock have no par value and have a stated value and initial liquidationpreference equal to $1,000 per share. The liquidation preference of the senior preferred stock is subject toadjustment. To the extent dividends are not paid in cash for any dividend period, the dividends will accrue andbe added to the liquidation preference of the senior preferred stock. In addition, any amounts paid by Treasuryto us pursuant to Treasury’s funding commitment provided in the senior preferred stock purchase agreementand any quarterly commitment fee payable under the senior preferred stock purchase agreement that is notpaid in cash to or waived by Treasury will be added to the liquidation preference of the senior preferred stock.As of February 24, 2011, we have received a total of $87.6 billion under Treasury’s funding commitment andthe Acting Director of FHFA has submitted a request for an additional $2.6 billion from Treasury to eliminateour net worth deficit as of December 31, 2010.
Holders of the senior preferred stock are entitled to receive when, as and if declared by our Board ofDirectors, out of legally available funds, cumulative quarterly cash dividends at an annual rate of 10% per yearbased on the then-current liquidation preference of the senior preferred stock. As conservator and under ourCharter, FHFA also has authority to declare dividends on the senior preferred stock. If at any time we fail topay cash dividends in a timely manner, then immediately following such failure and for all dividend periodsthereafter until the dividend period following the date on which we have paid in cash full cumulativedividends (including any unpaid dividends added to the liquidation preference), the dividend rate will be 12%per year. Dividends declared and paid on our senior preferred stock were $7.7 billion, $2.5 billion and$31 million for the years ended December 31, 2010, 2009 and 2008, respectively.
The senior preferred stock ranks prior to our common stock and all other outstanding series of our preferredstock as to both dividends and rights upon liquidation. We may not declare or pay dividends on, makedistributions with respect to, or redeem, purchase or acquire, or make a liquidation payment with respect to,any common stock or other securities ranking junior to the senior preferred stock without the prior writtenconsent of Treasury. Shares of the senior preferred stock are not convertible. Shares of the senior preferredstock have no general or special voting rights, other than those set forth in the certificate of designation for thesenior preferred stock or otherwise required by law. The consent of holders of at least two-thirds of alloutstanding shares of senior preferred stock is generally required to amend the terms of the senior preferredstock or to create any class or series of stock that ranks prior to or on parity with the senior preferred stock.
We are not permitted to redeem the senior preferred stock in full prior to the termination of Treasury’s fundingcommitment under the senior preferred stock purchase agreement. However, we are permitted to pay down theliquidation preference of the outstanding shares of senior preferred stock to the extent of (1) accrued andunpaid dividends previously added to the liquidation preference and not previously paid down; and(2) quarterly commitment fees previously added to the liquidation preference and not previously paid down. Inaddition, to the extent we issue any shares of capital stock for cash at any time the senior preferred stock isoutstanding (which requires Treasury’s approval), we are required to use the net proceeds of the issuance topay down the liquidation preference of the senior preferred stock; however, the liquidation preference of eachshare of senior preferred stock may not be paid down below $1,000 per share prior to the termination ofTreasury’s funding commitment. Following the termination of Treasury’s funding commitment, we may paydown the liquidation preference of all outstanding shares of senior preferred stock at any time, in whole or in
F-107
FANNIE MAE(In conservatorship)
NOTES TO CONSOLIDATED FINANCIAL STATEMENTS—(Continued)

part. If we pay down the liquidation preference of each outstanding share of senior preferred stock in full, theshares will be considered redeemed as of the payment date.
Common Stock Warrant
The warrant gives Treasury the right to purchase shares of our common stock equal to 79.9% of the totalnumber of shares of common stock outstanding on a fully diluted basis on the date of exercise. The warrantmay be exercised in whole or in part at any time on or before September 7, 2028, by delivery to Fannie Maeof: (a) a notice of exercise; (b) payment of the exercise price of $0.00001 per share; and (c) the warrant. If themarket price of one share of common stock is greater than the exercise price, in lieu of exercising the warrantby payment of the exercise price, Treasury may elect to receive shares equal to the value of the warrant (orportion thereof being canceled) pursuant to the formula specified in the warrant. Upon exercise of the warrant,Treasury may assign the right to receive the shares of common stock issuable upon exercise to any otherperson. We recorded the aggregate fair value of the warrant of $3.5 billion as a component of additionalpaid-in-capital upon issuance of the warrant. If the warrant is exercised, the stated value of the common stockissued will be reclassified as “Common stock” in our consolidated balance sheet. As of February 24, 2011,Treasury had not exercised the warrant.
Senior Preferred Stock Purchase Agreement with Treasury
Commitment Fee
We were scheduled to begin paying Treasury a quarterly commitment fee beginning on March 31, 2011. OnDecember 29, 2010, FHFA was notified by Treasury that Treasury was waiving the commitment fee for thefirst quarter of 2011 due to adverse conditions in the U.S. mortgage market and because Treasury believed thatimposing the commitment fee would not generate increased compensation for taxpayers. Treasury furthernoted that it would reevaluate matters in the next calendar quarter. We may elect to pay the periodiccommitment fee in cash or add the amount of the fee to the liquidation preference of the senior preferredstock.
Funding Commitment
Treasury’s funding commitment under the senior preferred stock purchase agreement is intended to ensure thatwe maintain a positive net worth. Treasury’s maximum funding commitment to us prior to a December 2009amendment of the senior preferred stock purchase agreement was $200 billion. The amendment to theagreement stipulates that the cap on Treasury’s funding commitment to us under the senior preferred stockpurchase agreement will increase as necessary to accommodate any net worth deficits for calendar quarters in2010 through 2012. For any net worth deficits as of December 31, 2012, Treasury’s remaining fundingcommitment will be $124.8 billion ($200 billion less $75.2 billion cumulatively drawn through March 31,2010) less the smaller of either (a) our positive net worth as of December 31, 2012 or (b) our cumulativedraws from Treasury for the calendar quarters in 2010 through 2012. The senior preferred stock purchaseagreement provides that the deficiency amount will be calculated differently if we become subject toreceivership or other liquidation process. The deficiency amount may be increased above the otherwiseapplicable amount upon our mutual written agreement with Treasury. In addition, if the Director of FHFAdetermines that the Director will be mandated by law to appoint a receiver for us unless our capital isincreased by receiving funds under the commitment in an amount up to the deficiency amount (subject to themaximum amount that may be funded under the agreement), then FHFA, in its capacity as our conservator,may request that Treasury provide funds to us in such amount. The senior preferred stock purchase agreementalso provides that, if we have a deficiency amount as of the date of completion of the liquidation of our assets,we may request funds from Treasury in an amount up to the deficiency amount (subject to the maximum
F-108
FANNIE MAE(In conservatorship)
NOTES TO CONSOLIDATED FINANCIAL STATEMENTS—(Continued)

amount that may be funded under the agreement). Any amounts that we draw under the senior preferred stockpurchase agreement will be added to the liquidation preference of the senior preferred stock. No additionalshares of senior preferred stock are required to be issued under the senior preferred stock purchase agreement.
Covenants
The senior preferred stock purchase agreement, as amended, provides that, until the senior preferred stock isrepaid or redeemed in full, we may not, without the prior written consent of Treasury:
• Declare or pay any dividend (preferred or otherwise) or make any other distribution with respect to anyFannie Mae equity securities (other than with respect to the senior preferred stock or warrant);
• Redeem, purchase, retire or otherwise acquire any Fannie Mae equity securities (other than the seniorpreferred stock or warrant);
• Sell or issue any Fannie Mae equity securities (other than the senior preferred stock, the warrant and thecommon stock issuable upon exercise of the warrant and other than as required by the terms of anybinding agreement in effect on the date of the senior preferred stock purchase agreement);
• Terminate the conservatorship (other than in connection with a receivership);
• Sell, transfer, lease or otherwise dispose of any assets, other than dispositions for fair market value: (a) toa limited life regulated entity (in the context of receivership); (b) of assets and properties in the ordinarycourse of business, consistent with past practice; (c) in connection with a liquidation of Fannie Mae by areceiver; (d) of cash or cash equivalents for cash or cash equivalents; or (e) to the extent necessary tocomply with the covenant described below relating to the reduction of our mortgage assets beginning in2010;
• Incur indebtedness that would result in our aggregate indebtedness exceeding $1,080 billion throughDecember 31, 2010. Beginning in 2011 and each year thereafter, our debt cap will equal 120% of theamount of mortgage assets we are allowed to hold on December 31 of the immediately precedingcalendar year;
• Issue any subordinated debt;
• Enter into a corporate reorganization, recapitalization, merger, acquisition or similar event; or
• Engage in transactions with affiliates unless the transaction is (a) pursuant to the senior preferred stockpurchase agreement, the senior preferred stock or the warrant, (b) upon arm’s-length terms or (c) atransaction undertaken in the ordinary course or pursuant to a contractual obligation or customaryemployment arrangement in existence on the date of the senior preferred stock purchase agreement.
The agreement also provides that we may not own mortgage assets in excess of $810 billion as ofDecember 31, 2010. We are also required to reduce our mortgage assets, beginning on December 31, 2010 andeach year thereafter, to 90% of the amount of the mortgage assets we were allowed to hold as of December 31of the immediately preceding calendar year, until the amount of our mortgage assets reaches $250 billion.
Under the agreement, the effect of changes in generally accepted accounting principles that occurredsubsequent to the date of the agreement and that require us to recognize additional mortgage assets on ourconsolidated balance sheets were not considered for purposes of evaluating our compliance with the limitationon the amount of mortgage assets we may own. In addition, the definition of indebtedness in the agreementwas revised to clarify that it also does not give effect to any change that may be made in respect of the FASBguidance on accounting for transfers of financial assets or any similar accounting standard.
F-109
FANNIE MAE(In conservatorship)
NOTES TO CONSOLIDATED FINANCIAL STATEMENTS—(Continued)
In addition, the agreement provides that we may not enter into any new compensation arrangements orincrease amounts or benefits payable under existing compensation arrangements with our named executiveofficers (as defined by SEC rules) without the consent of the Director of FHFA, in consultation with theSecretary of the Treasury. As of December 31, 2010, we were in compliance with the senior preferred stockpurchase agreement covenants.
Termination Provisions
The senior preferred stock purchase agreement provides that Treasury’s funding commitment will terminateunder any the following circumstances: (1) the completion of our liquidation and fulfillment of Treasury’sobligations under its funding commitment at that time, (2) the payment in full of, or reasonable provision for,all of our liabilities (whether or not contingent, including mortgage guaranty obligations), or (3) the fundingby Treasury of the maximum amount under the agreement. In addition, Treasury may terminate its fundingcommitment and declare the senior preferred stock purchase agreement null and void if a court vacates,modifies, amends, conditions, enjoins, stays or otherwise affects the appointment of the conservator orotherwise curtails the conservator’s powers. Treasury may not terminate its funding commitment solely byreason of our being in conservatorship, receivership or other insolvency proceeding, or due to our financialcondition or any adverse change in our financial condition.
Waivers and Amendments
The senior preferred stock purchase agreement provides that most provisions of the agreement may be waivedor amended by mutual written agreement of the parties. No waiver or amendment of the agreement, however,may decrease Treasury’s aggregate funding commitment or add conditions to Treasury’s funding commitmentif the waiver or amendment would adversely affect in any material respect the holders of our debt securities orguaranteed Fannie Mae MBS.
Third-party Enforcement Rights
If we default on payments with respect to our debt securities or guaranteed Fannie Mae MBS and Treasuryfails to perform its obligations under its funding commitment, and if we and/or the conservator are notdiligently pursuing remedies in respect of that failure, the holders of these debt securities or Fannie Mae MBSmay file a claim for relief in the United States Court of Federal Claims. The relief, if granted, would requireTreasury to fund to us the lesser of (1) the amount necessary to cure the payment defaults on our debt andFannie Mae MBS and (2) the lesser of (a) the deficiency amount and (b) the maximum amount availableunder the agreement less the aggregate amount of funding previously provided under the commitment. Anypayment that Treasury makes under those circumstances would be treated for all purposes as a draw under thesenior preferred stock purchase agreement that would increase the liquidation preference of the seniorpreferred stock.
17. Regulatory Capital Requirements
In 2008, FHFA announced that our existing statutory and FHFA-directed regulatory capital requirements willnot be binding during the conservatorship, and that FHFA will not issue quarterly capital classifications duringthe conservatorship. We submit capital reports to FHFA during the conservatorship and FHFA monitors ourcapital levels. FHFA has stated that it does not intend to report our critical capital, risk-based capital orsubordinated debt levels during the conservatorship. As of December 31, 2010 and 2009, we had a minimumcapital deficiency of $123.2 billion and $107.6 billion, respectively. Our minimum capital deficiency as ofDecember 31, 2010 was determined based on guidance from FHFA, in which FHFA (1) directed us, for loansbacking Fannie Mae MBS held by third parties, to continue reporting our minimum capital requirements based
F-110
FANNIE MAE(In conservatorship)
NOTES TO CONSOLIDATED FINANCIAL STATEMENTS—(Continued)

on 0.45% of the unpaid principal balance and critical capital based on 0.25% of the unpaid principal balance,notwithstanding our transition date adoption of the new accounting standards, and (2) issued a regulatoryinterpretation stating that our minimum capital requirements are not automatically affected by the newaccounting standards. Additionally, our minimum capital deficiency excludes the funds provided to us byTreasury pursuant to the senior preferred stock purchase agreement, as the senior preferred stock does notqualify as core capital due to its cumulative dividend provisions.
Pursuant to the GSE Act, if our total assets are less than our total obligations (a net worth deficit) for a periodof 60 days, FHFA is mandated by law to appoint a receiver for Fannie Mae. Treasury’s funding commitmentunder the senior preferred stock purchase agreement is intended to ensure that we avoid a net worth deficit, inorder to avoid this mandatory trigger of receivership. In order to avoid a net worth deficit, our conservatormay request funds on our behalf from Treasury under the senior preferred stock purchase agreement.
FHFA has directed us, during the time we are under conservatorship, to focus on managing to a positive networth. As of December 31, 2010 and 2009, we had a net worth deficit of $2.5 billion and $15.3 billion,respectively.
The following table displays our regulatory capital classification measures as of December 31, 2010 and 2009.
2010 (1) 2009 (1)As of December 31,
(Dollars in millions)
Core capital(2) . . . . . . . . . . . . . . . . . . . . . . . . . . . . . . . . . . . . . . . . . . . . . . . . . . . . $ (89,516) $ (74,540)
Statutory minimum capital requirement(3) . . . . . . . . . . . . . . . . . . . . . . . . . . . . . . . . . 33,676 33,057
Deficit of core capital over statutory minimum capital requirement . . . . . . . . . . . . . . . $(123,192) $(107,597)
Deficit of core capital percentage over statutory minimum capital requirement . . . . . . . (366)% (325)%
(1) Amounts as of December 31, 2010 and 2009 represent estimates that have been submitted to FHFA. As noted above,FHFA is not issuing capital classifications during conservatorship.
(2) The sum of (a) the stated value of our outstanding common stock (common stock less treasury stock); (b) the statedvalue of our outstanding non-cumulative perpetual preferred stock; (c) our paid-in capital; and (d) our retainedearnings (accumulated deficit). Core capital does not include: (a) accumulated other comprehensive income (loss) or(b) senior preferred stock.
(3) Generally, the sum of (a) 2.50% of on-balance sheet assets, except those underlying Fannie Mae MBS held by thirdparties; (b) 0.45% of the unpaid principal balance of outstanding Fannie Mae MBS held by third parties; and (c) up to0.45% of other off-balance sheet obligations, which may be adjusted by the Director of FHFA under certaincircumstances (See 12 CFR 1750.4 for existing adjustments made by the Director).
Our critical capital requirement is generally equal to the sum of: (1) 1.25% of on-balance sheet assets;(2) 0.25% of the unpaid principal balance of outstanding Fannie Mae MBS held by third parties; and(3) 0.25% of other off-balance sheet obligations, which may be adjusted by the Director of FHFA undercertain circumstances.
Restrictions on Capital Distributions and Dividends
Under the terms of the senior preferred stock purchase agreement, we are required to comply with certainrestrictions and covenants. Set forth below are additional restrictions related to our capital requirements:
Restrictions Under GSE Act. Under the GSE Act, FHFA has the authority to prohibit capital distributions,including payment of dividends, if we fail to meet our capital requirements. If FHFA classifies us assignificantly undercapitalized, we must obtain the approval of the Director of FHFA for any dividend payment.Under the GSE Act, we are not permitted to make a capital distribution if, after making the distribution, wewould be undercapitalized. The Director of FHFA, however, may permit us to repurchase shares if the
F-111
FANNIE MAE(In conservatorship)
NOTES TO CONSOLIDATED FINANCIAL STATEMENTS—(Continued)
repurchase is made in connection with the issuance of additional shares or obligations in at least an equivalentamount and will reduce our financial obligations or otherwise improve our financial condition.
Restrictions Relating to Subordinated Debt. During any period in which we defer payment of interest onqualifying subordinated debt, we may not declare or pay dividends on, or redeem, purchase or acquire, ourcommon stock or preferred stock. Our qualifying subordinated debt provides for the deferral of the payment ofinterest for up to five years if either: our core capital is below 125% of our critical capital requirement; or ourcore capital is below our statutory minimum capital requirement, and the U.S. Secretary of the Treasury,acting on our request, exercises his or her discretionary authority pursuant to Section 304(c) of the Charter Actto purchase our debt obligations. As of December 31, 2010 and 2009, our core capital was below 125% of ourcritical capital requirement; however, we have been directed by FHFA to continue paying principal andinterest on our outstanding subordinated debt during the conservatorship and thereafter until directedotherwise, regardless of our existing capital levels.
Prior to conservatorship, we were subject to certain regulatory capital requirements, including minimumcapital requirements, under the terms of various agreements and consent orders with OFHEO. We were incompliance with these regulatory capital requirements until they were suspended October 9, 2008 followingour entry into conservatorship.
18. Concentrations of Credit Risk
Concentrations of credit risk arise when a number of customers and counterparties engage in similar activitiesor have similar economic characteristics that make them susceptible to similar changes in industry conditions,which could affect their ability to meet their contractual obligations. Based on our assessment of businessconditions that could impact our financial results, including those conditions arising through February 24,2011, we have determined that concentrations of credit risk exist among single-family and multifamilyborrowers (including geographic concentrations and loans with certain non-traditional features), mortgageinsurers, mortgage servicers, financial guarantors, lenders with risk sharing, derivative counterparties andparties associated with our off-balance sheet transactions. Concentrations for each of these groups arediscussed below.
Single-Family Loan Borrowers
Regional economic conditions may affect a borrower’s ability to repay his or her mortgage loan and theproperty value underlying the loan. Geographic concentrations increase the exposure of our portfolio tochanges in credit risk. Single-family borrowers are primarily affected by home prices and interest rates. Thegeographic dispersion of our Single-Family business has been consistently diversified over both years endedDecember 31, 2010 and 2009, with our largest exposures in the Western region of the United States, whichrepresented 27% of our single-family conventional guaranty book of business as of December 31, 2010.Except for California, where 18% and 17% of the gross unpaid principal balance of our conventional single-family mortgage loans held or securitized in Fannie Mae MBS as of December 31, 2010 and 2009,respectively, were located, no other significant concentrations existed in any state.
To manage credit risk and comply with legal requirements, we typically require primary mortgage insuranceor other credit enhancements if the current LTV ratio (i.e., the ratio of the unpaid principal balance of a loanto the current value of the property that serves as collateral) of a single-family conventional mortgage loan isgreater than 80% when the loan is delivered to us. We may also require credit enhancements if the originalLTV ratio of a single-family conventional mortgage loan is less than 80%.
F-112
FANNIE MAE(In conservatorship)
NOTES TO CONSOLIDATED FINANCIAL STATEMENTS—(Continued)

Multifamily Loan Borrowers
Numerous factors affect a multifamily borrower’s ability to repay his or her loan and the value of the propertyunderlying the loan. The most significant factors affecting credit risk are rental vacancy rates andcapitalization rates for the mortgaged property. Vacancy rates vary among geographic regions of the UnitedStates. The average mortgage amounts for multifamily loans are significantly larger than those for single-family borrowers and, therefore, individual defaults for multifamily borrowers can be more significant to us.However, these loans, while individually large, represent a small percentage of our total loan portfolio. Ourmultifamily geographic concentrations have been consistently diversified over both years ended December 31,2010 and 2009, with our largest exposure in the Western region of the United States, which represented 34%of our multifamily guaranty book of business. Except for California and New York, no other significantconcentrations existed in any states as of December 31, 2010 and 2009. As of December 31, 2010, 27% and13% of the gross unpaid principal balance of our portfolio of multifamily mortgage loans held by us orsecuritized in Fannie Mae MBS was located in California and New York, respectively. As of December 31,2009, 27% and 14% of the gross unpaid principal balance of our portfolio of multifamily mortgage loans heldby us or securitized in Fannie Mae MBS was located in California and New York, respectively.
As part of our multifamily risk management activities, we perform detailed loan reviews that evaluateborrower and geographic concentrations, lender qualifications, counterparty risk, property performance andcontract compliance. We generally require servicers to submit periodic property operating information andcondition reviews, allowing us to monitor the performance of individual loans. We use this information toevaluate the credit quality of our portfolio, identify potential problem loans and initiate appropriate lossmitigation activities.
The following table displays the regional geographic concentration of single-family and multifamily loans inour mortgage portfolio and those loans held or securitized in Fannie Mae MBS as of December 31, 2010 and2009.
2010 2009 2010 2009As of December 31, As of December 31,
Percentage ofConventional
Single-Family GuarantyBook of Business(2)
Percentage ofMultifamily Guaranty
Book of Business(3)
Geographic Concentration(1)
Midwest . . . . . . . . . . . . . . . . . . . . . . . . . . . . . . . . . 15% 16% 8% 9%
Northeast . . . . . . . . . . . . . . . . . . . . . . . . . . . . . . . . 19 19 22 23
Southeast . . . . . . . . . . . . . . . . . . . . . . . . . . . . . . . . 24 24 20 19
Southwest . . . . . . . . . . . . . . . . . . . . . . . . . . . . . . . 15 15 16 15
West . . . . . . . . . . . . . . . . . . . . . . . . . . . . . . . . . . . 27 26 34 34
Total . . . . . . . . . . . . . . . . . . . . . . . . . . . . . . . . . 100% 100% 100% 100%
(1) Midwest includes IL, IN, IA, MI, MN, NE, ND, OH, SD, WI; Northeast includes CT, DE, ME, MA, NH, NJ, NY, PA,PR, RI, VT, VI; Southeast includes AL, DC, FL, GA, KY, MD, NC, MS, SC, TN, VA, WV; Southwest includes AZ,AR, CO, KS, LA, MO, NM, OK, TX, UT; West include AK, CA, GU, HI, ID, MT, NV, OR, WA and WY.
(2) Consists of the portion of our single-family conventional guaranty book of business for which we have detailed loanlevel information, which constituted over 99% and 98% of our total single-family conventional guaranty book ofbusiness as of December 31, 2010 and 2009, respectively.
(3) Consists of the portion of our multifamily guaranty book of business for which we have detailed loan levelinformation, which constituted 99% and 98% of our total multifamily guaranty book of business as of December 31,2010 and 2009, respectively.
F-113
FANNIE MAE(In conservatorship)
NOTES TO CONSOLIDATED FINANCIAL STATEMENTS—(Continued)

Non-traditional Loans; Alt-A and Subprime Loans and Securities
We own and guarantee loans with non-traditional features, such as interest-only loans and negative-amortizingloans. We also own and guarantee Alt-A and subprime mortgage loans and mortgage-related securities. AnAlt-A mortgage loan generally refers to a mortgage loan that has been underwritten with reduced oralternative documentation than that required for a full documentation mortgage loan but may also includeother alternative product features. As a result, Alt-A mortgage loans generally have a higher risk of defaultthan non-Alt-A mortgage loans. In reporting our Alt-A exposure, we have classified mortgage loans as Alt-Aif the lenders that deliver the mortgage loans to us have classified the loans as Alt-A based on documentationor other product features. We have classified private-label mortgage-related securities held in our investmentportfolio as Alt-A if the securities were labeled as such when issued. A subprime mortgage loan generallyrefers to a mortgage loan made to a borrower with a weaker credit profile than that of a prime borrower. As aresult of the weaker credit profile, subprime borrowers have a higher likelihood of default than primeborrowers. Subprime mortgage loans were typically originated by lenders specializing in this type of businessor by subprime divisions of large lenders, using processes unique to subprime loans. In reporting our subprimeexposure, we have classified mortgage loans as subprime if the mortgage loans were originated by one ofthese specialty lenders or a subprime division of a large lender. We exclude loans originated by these lendersif we acquired the loans in accordance with our standard underwriting criteria, which typically requirecompliance by the seller with our Selling Guide (including standard representations and warranties) and/orevaluation of the loans through our Desktop Underwriter system. We have classified private-label mortgage-related securities held in our investment portfolio as subprime if the securities were labeled as such whenissued. We reduce our risk associated with some of these loans through credit enhancements, as describedbelow under “Mortgage Insurers.”
The following table displays the percentage of our conventional single-family guaranty book of business thatconsists of interest-only loans, negative-amortizing ARMs and loans with an estimated mark-to-market LTVratios greater than 80% as of December 31, 2010 and 2009.
2010 2009
Percentage ofSingle-Family
Conventional GuarantyBook of Business
As of December 31,
Interest-only loans . . . . . . . . . . . . . . . . . . . . . . . . . . . . . . . . . . . . . . . . . . . . . . . . . 6% 7%
Negative-amortizing ARMs. . . . . . . . . . . . . . . . . . . . . . . . . . . . . . . . . . . . . . . . . . . * 1
80%+ mark-to-market LTV loans . . . . . . . . . . . . . . . . . . . . . . . . . . . . . . . . . . . . . . 40 37
* Represents less than 0.5% of our single-family conventional guaranty book of business
F-114
FANNIE MAE(In conservatorship)
NOTES TO CONSOLIDATED FINANCIAL STATEMENTS—(Continued)

The following table displays information regarding our Alt-A and subprime mortgage loans and mortgage-related securities in our single-family mortgage credit book of business as of December 31, 2010 and 2009.
UnpaidPrincipalBalance
Percent ofBook of
Business(1)
UnpaidPrincipalBalance
Percent ofBook of
Business(1)
2010 2009As of December 31,
(Dollars in millions)
Loans and Fannie Mae MBS:
Alt-A(2) . . . . . . . . . . . . . . . . . . . . . . . . . . . . . . . . . . . . . . . . . . . . . $213,597 7% $251,111 8%
Subprime(3) . . . . . . . . . . . . . . . . . . . . . . . . . . . . . . . . . . . . . . . . . . . 15,266 ** 16,268 **
Total . . . . . . . . . . . . . . . . . . . . . . . . . . . . . . . . . . . . . . . . . . . . . $228,863 8% $267,379 9%
Private-label securities:
Alt-A(4) . . . . . . . . . . . . . . . . . . . . . . . . . . . . . . . . . . . . . . . . . . . . . $ 22,283 ** $ 24,505 **
Subprime(5) . . . . . . . . . . . . . . . . . . . . . . . . . . . . . . . . . . . . . . . . . . . 18,410 ** 20,527 **
Total . . . . . . . . . . . . . . . . . . . . . . . . . . . . . . . . . . . . . . . . . . . . . $ 40,693 1% $ 45,032 2%
** Represent less than 1.0% of single-family mortgage credit book of business.(1) Calculated based on total unpaid principal balance of our single-family mortgage credit book of business.(2) Represents Alt-A mortgage loans held in our portfolio and Fannie Mae MBS backed by Alt-A mortgage loans.(3) Represents subprime mortgage loans held in our portfolio and Fannie Mae MBS backed by subprime mortgage loans.(4) Represents private-label mortgage-related securities backed by Alt-A mortgage loans.(5) Represents private-label mortgage-related securities backed by subprime mortgage loans.
Other Concentrations
Mortgage Seller/Servicers. Mortgage servicers collect mortgage and escrow payments from borrowers, paytaxes and insurance costs from escrow accounts, monitor and report delinquencies, and perform other requiredactivities on our behalf. Our business with mortgage servicers is concentrated. Our ten largest single-familymortgage servicers, including their affiliates, serviced 77% of our single-family guaranty book of business asof December 31, 2010, compared to 80% as of December 31, 2009. Our ten largest multifamily mortgageservicers, including their affiliates, serviced 70% of our multifamily guaranty book of business as ofDecember 31, 2010, compared with 75% as of December 31, 2009.
If one of our principal mortgage seller/servicers fails to meet its obligations to us, it could increase our credit-related expenses and credit losses, result in financial losses to us and have a material adverse effect on ourearnings, liquidity, financial condition and net worth.
Mortgage Insurers. Mortgage insurance “risk in force” represents our maximum potential loss recoveryunder the applicable mortgage insurance policies. We had total mortgage insurance coverage risk in force of$95.9 billion on the single-family mortgage loans in our guaranty book of business as of December 31, 2010,which represented approximately 3% of our single-family guaranty book of business. Our primary and poolmortgage insurance coverage risk in force on single-family mortgage loans in our guaranty book of businessrepresented $91.2 billion and $4.7 billion, respectively, as of December 31, 2010, compared with $99.6 billionand $6.9 billion, respectively, as of December 31, 2009. Eight mortgage insurance companies provided over99% of our mortgage insurance as of both December 31, 2010 and 2009.
Increases in mortgage insurance claims due to higher defaults and credit losses in recent periods haveadversely affected the financial results and financial condition of many mortgage insurers. The current
F-115
FANNIE MAE(In conservatorship)
NOTES TO CONSOLIDATED FINANCIAL STATEMENTS—(Continued)

weakened financial condition of our mortgage insurer counterparties creates an increased risk that thesecounterparties will fail to fulfill their obligations to reimburse us for claims under insurance policies. If wedetermine that it is probable that we will not collect all of our claims from one or more of these mortgageinsurer counterparties, it could result in an increase in our loss reserves, which could adversely affect ourearnings, liquidity, financial condition and net worth.
As of December 31, 2010, our allowance for loan losses of $61.6 billion, allowance for accrued interestreceivable of $3.4 billion and reserve for guaranty losses of $323 million incorporated an estimated recoveryamount of approximately $16.4 billion from mortgage insurance related both to loans that are individuallymeasured for impairment and those that are measured collectively for impairment. This amount is comprisedof the contractual recovery of approximately $17.5 billion as of December 31, 2010 and an adjustment of$1.2 billion which reduces the contractual recovery for our assessment of our mortgage insurer counterparties’inability to fully pay those claims.
We had outstanding receivables of $4.4 billion in “Other assets” in our consolidated balance sheet as ofDecember 31, 2010 and $2.5 billion as of December 31, 2009 related to amounts claimed on insured,defaulted loans that we have not yet received, of which $648 million as of December 31, 2010 and$301 million as of December 31, 2009 was due from our mortgage seller/servicers. We assessed thereceivables for collectibility, and they are recorded net of a valuation allowance of $317 million as ofDecember 31, 2010 and $51 million as of December 31, 2009 in “Other assets.” These mortgage insurancereceivables are short-term in nature, having a duration of approximately three to six months, and the valuationallowance reduces our claim receivable to the amount which is considered probable of collection as ofDecember 31, 2010 and 2009. We received proceeds under our primary and pool mortgage insurance policiesfor single-family loans of $6.4 billion for the year ended December 31, 2010 and $3.6 billion for the yearended December 31, 2009. We negotiated the cancellation and restructurings of some of our mortgageinsurance coverage in exchange for a fee. The cash fees received of $796 million and $668 million for theyears ended December 31, 2010 and 2009, respectively, are included in our total insurance proceeds amount.These fees represented an acceleration of, and discount on, claims to be paid pursuant to the coverage in orderto reduce future exposure to our mortgage insurers and were recorded as a reduction to our “Foreclosedproperty expense.”
Financial Guarantors. We were the beneficiary of financial guarantees totaling $8.8 billion and $9.6 billionas of December 31, 2010 and 2009, respectively, on securities held in our investment portfolio or on securitiesthat have been resecuritized to include a Fannie Mae guaranty and sold to third parties. The securities coveredby these guarantees consist primarily of private-label mortgage-related securities and mortgage revenue bonds.In addition, we are the beneficiary of financial guarantees totaling $25.7 billion and $51.3 billion as ofDecember 31, 2010 and 2009, respectively, obtained from Freddie Mac, the federal government, and itsagencies. These financial guaranty contracts assure the collectibility of timely interest and ultimate principalpayments on the guaranteed securities if the cash flows generated by the underlying collateral are notsufficient to fully support these payments.
If a financial guarantor fails to meet its obligations to us with respect to the securities for which we haveobtained financial guarantees, it could reduce the fair value of our mortgage-related securities and result infinancial losses to us, which could have a material adverse effect on our earnings, liquidity, financial conditionand net worth. We model our securities assuming the benefit of those external financial guarantees that aredeemed creditworthy.
Lenders with Risk Sharing. We enter into risk sharing agreements with lenders pursuant to which the lendersagree to bear all or some portion of the credit losses on the covered loans. Our maximum potential lossrecovery from lenders under these risk sharing agreements on single-family loans was $15.6 billion as ofDecember 31, 2010 and $18.3 billion as of December 31, 2009. As of December 31, 2010, 56% of our
F-116
FANNIE MAE(In conservatorship)
NOTES TO CONSOLIDATED FINANCIAL STATEMENTS—(Continued)

maximum potential loss recovery on single-family loans was from three lenders. As of December 31, 2009,53% of our maximum potential loss recovery on single-family loans was from three lenders. Our maximumpotential loss recovery from lenders under these risk sharing agreements on multifamily loans was$30.3 billion as of December 31, 2010 and $28.7 billion as of December 31, 2009. As of December 31, 2010,41% of our maximum potential loss recovery on multifamily loans was from three lenders. As ofDecember 31, 2009, 51% of our maximum potential loss recovery on multifamily loans was from threelenders.
Derivatives Counterparties. For information on credit risk associated with our derivatives transactions referto “Note 10, Derivative Instruments and Hedging Activities.”
Parties Associated with Our Off-Balance Sheet Transactions. We enter into financial instrument transactionsthat create off-balance sheet credit risk in the normal course of our business. These transactions are designedto meet the financial needs of our customers, and manage our credit, market or liquidity risks.
We have entered into guarantees for which we have not recognized a guaranty obligation in our consolidatedbalance sheets relating to periods prior to 2003, the effective date of accounting pronouncements related toguaranty accounting. Our maximum potential exposure under these guarantees is $10.3 billion as ofDecember 31, 2010 and $135.7 billion as of December 31, 2009. If we were required to make payments underthese guarantees, we would pursue recovery through our right to the collateral backing the underlying loans,available credit enhancements and recourse with third parties that provide a maximum coverage of $3.9 billionas of December 31, 2010 and $13.6 billion as of December 31, 2009.
The following table displays the contractual amount of off-balance sheet financial instruments as ofDecember 31, 2010 and 2009. Contractual or notional amounts do not necessarily represent the credit risk ofthe positions.
2010 2009As of December 31,
(Dollars in millions)
Fannie Mae MBS and other guarantees(1) . . . . . . . . . . . . . . . . . . . . . . . . . . . . . . . . . . . $10,299 $135,697Loan purchase commitments . . . . . . . . . . . . . . . . . . . . . . . . . . . . . . . . . . . . . . . . . . . . 311 486
(1) Represents maximum exposure on guarantees not reflected in our consolidated balance sheets.
19. Fair Value
We use fair value measurements for the initial recording of certain assets and liabilities and periodicremeasurement of certain assets and liabilities on a recurring or nonrecurring basis.
Fair Value Measurement
Fair value measurement guidance defines fair value, establishes a framework for measuring fair value andexpands disclosures around fair value measurements. This guidance applies whenever other accountingstandards require or permit assets or liabilities to be measured at fair value. The guidance establishes a three-level fair value hierarchy that prioritizes the inputs into the valuation techniques used to measure fair value.The fair value hierarchy gives the highest priority, Level 1, to measurements based on unadjusted quotedprices in active markets for identical assets or liabilities. The next highest priority, Level 2, is given tomeasurements of assets and liabilities based on limited observable inputs or observable inputs for similarassets and liabilities. The lowest priority, Level 3, is given to measurements based on unobservable inputs.Effective March 31, 2010, we prospectively adopted a new accounting standard that requires enhanced fairvalue measurement disclosures.
F-117
FANNIE MAE(In conservatorship)
NOTES TO CONSOLIDATED FINANCIAL STATEMENTS—(Continued)
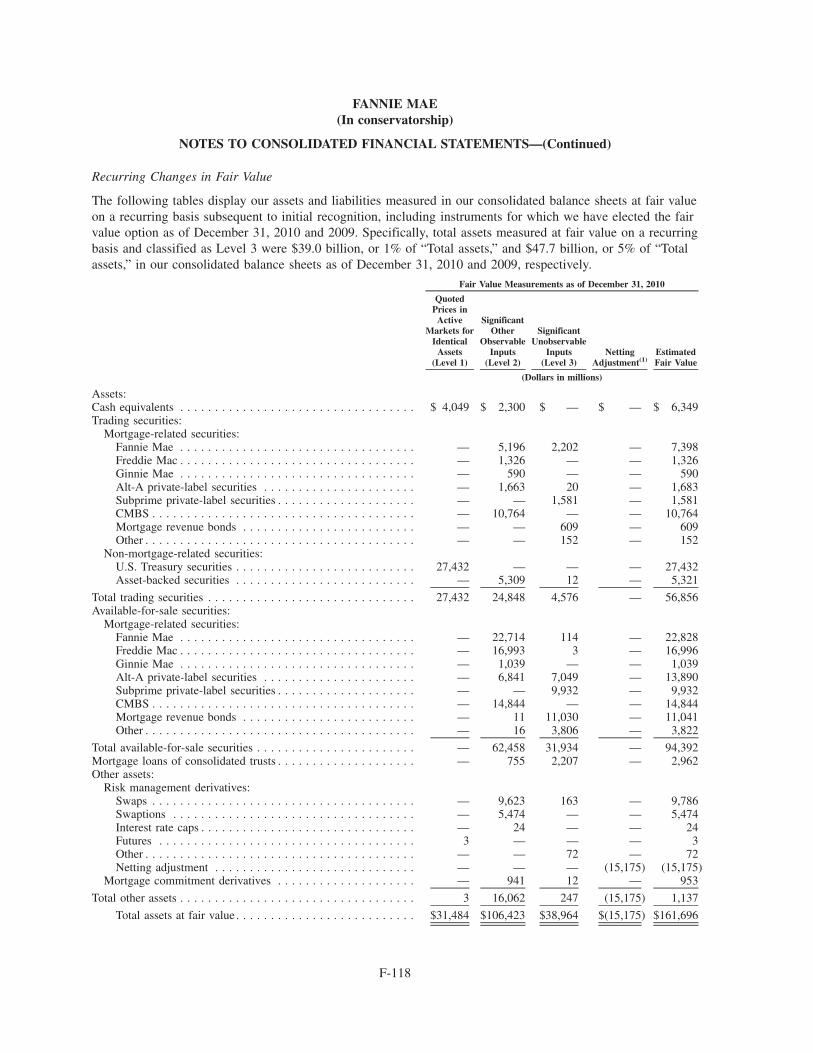
Recurring Changes in Fair Value
The following tables display our assets and liabilities measured in our consolidated balance sheets at fair valueon a recurring basis subsequent to initial recognition, including instruments for which we have elected the fairvalue option as of December 31, 2010 and 2009. Specifically, total assets measured at fair value on a recurringbasis and classified as Level 3 were $39.0 billion, or 1% of “Total assets,” and $47.7 billion, or 5% of “Totalassets,” in our consolidated balance sheets as of December 31, 2010 and 2009, respectively.
QuotedPrices in
ActiveMarkets for
IdenticalAssets
(Level 1)
SignificantOther
ObservableInputs
(Level 2)
SignificantUnobservable
Inputs(Level 3)
NettingAdjustment(1)
EstimatedFair Value
Fair Value Measurements as of December 31, 2010
(Dollars in millions)
Assets:Cash equivalents . . . . . . . . . . . . . . . . . . . . . . . . . . . . . . . . . . $ 4,049 $ 2,300 $ — $ — $ 6,349Trading securities:
Mortgage-related securities:Fannie Mae . . . . . . . . . . . . . . . . . . . . . . . . . . . . . . . . . . — 5,196 2,202 — 7,398Freddie Mac . . . . . . . . . . . . . . . . . . . . . . . . . . . . . . . . . . — 1,326 — — 1,326Ginnie Mae . . . . . . . . . . . . . . . . . . . . . . . . . . . . . . . . . . — 590 — — 590Alt-A private-label securities . . . . . . . . . . . . . . . . . . . . . . — 1,663 20 — 1,683Subprime private-label securities . . . . . . . . . . . . . . . . . . . . — — 1,581 — 1,581CMBS . . . . . . . . . . . . . . . . . . . . . . . . . . . . . . . . . . . . . . — 10,764 — — 10,764Mortgage revenue bonds . . . . . . . . . . . . . . . . . . . . . . . . . — — 609 — 609Other . . . . . . . . . . . . . . . . . . . . . . . . . . . . . . . . . . . . . . . — — 152 — 152
Non-mortgage-related securities:U.S. Treasury securities . . . . . . . . . . . . . . . . . . . . . . . . . . 27,432 — — — 27,432Asset-backed securities . . . . . . . . . . . . . . . . . . . . . . . . . . — 5,309 12 — 5,321
Total trading securities . . . . . . . . . . . . . . . . . . . . . . . . . . . . . . 27,432 24,848 4,576 — 56,856Available-for-sale securities:
Mortgage-related securities:Fannie Mae . . . . . . . . . . . . . . . . . . . . . . . . . . . . . . . . . . — 22,714 114 — 22,828Freddie Mac . . . . . . . . . . . . . . . . . . . . . . . . . . . . . . . . . . — 16,993 3 — 16,996Ginnie Mae . . . . . . . . . . . . . . . . . . . . . . . . . . . . . . . . . . — 1,039 — — 1,039Alt-A private-label securities . . . . . . . . . . . . . . . . . . . . . . — 6,841 7,049 — 13,890Subprime private-label securities . . . . . . . . . . . . . . . . . . . . — — 9,932 — 9,932CMBS . . . . . . . . . . . . . . . . . . . . . . . . . . . . . . . . . . . . . . — 14,844 — — 14,844Mortgage revenue bonds . . . . . . . . . . . . . . . . . . . . . . . . . — 11 11,030 — 11,041Other . . . . . . . . . . . . . . . . . . . . . . . . . . . . . . . . . . . . . . . — 16 3,806 — 3,822
Total available-for-sale securities . . . . . . . . . . . . . . . . . . . . . . . — 62,458 31,934 — 94,392Mortgage loans of consolidated trusts . . . . . . . . . . . . . . . . . . . . — 755 2,207 — 2,962Other assets:
Risk management derivatives:Swaps . . . . . . . . . . . . . . . . . . . . . . . . . . . . . . . . . . . . . . — 9,623 163 — 9,786Swaptions . . . . . . . . . . . . . . . . . . . . . . . . . . . . . . . . . . . — 5,474 — — 5,474Interest rate caps . . . . . . . . . . . . . . . . . . . . . . . . . . . . . . . — 24 — — 24Futures . . . . . . . . . . . . . . . . . . . . . . . . . . . . . . . . . . . . . 3 — — — 3Other . . . . . . . . . . . . . . . . . . . . . . . . . . . . . . . . . . . . . . . — — 72 — 72Netting adjustment . . . . . . . . . . . . . . . . . . . . . . . . . . . . . — — — (15,175) (15,175)
Mortgage commitment derivatives . . . . . . . . . . . . . . . . . . . . — 941 12 — 953
Total other assets . . . . . . . . . . . . . . . . . . . . . . . . . . . . . . . . . . 3 16,062 247 (15,175) 1,137
Total assets at fair value . . . . . . . . . . . . . . . . . . . . . . . . . . $31,484 $106,423 $38,964 $(15,175) $161,696
F-118
FANNIE MAE(In conservatorship)
NOTES TO CONSOLIDATED FINANCIAL STATEMENTS—(Continued)

QuotedPrices in
ActiveMarkets for
IdenticalAssets
(Level 1)
SignificantOther
ObservableInputs
(Level 2)
SignificantUnobservable
Inputs(Level 3)
NettingAdjustment(1)
EstimatedFair Value
Fair Value Measurements as of December 31, 2010
(Dollars in millions)
Liabilities:
Long-term debt:
Of Fannie Mae:
Senior fixed . . . . . . . . . . . . . . . . . . . . . . . . . . $— $ 472 $ — $ — $ 472
Senior floating . . . . . . . . . . . . . . . . . . . . . . . . — — 421 — 421
Total Fannie Mae . . . . . . . . . . . . . . . . . . . . . . . . — 472 421 — 893
Of consolidated trusts . . . . . . . . . . . . . . . . . . . . . — 1,644 627 — 2,271
Total long-term debt . . . . . . . . . . . . . . . . . . . . . . . . — 2,116 1,048 — 3,164
Other liabilities:
Risk management derivatives:
Swaps . . . . . . . . . . . . . . . . . . . . . . . . . . . . . . — 16,436 113 — 16,549
Swaptions . . . . . . . . . . . . . . . . . . . . . . . . . . . — 2,446 — — 2,446
Futures . . . . . . . . . . . . . . . . . . . . . . . . . . . . . 1 — — — 1
Netting adjustment . . . . . . . . . . . . . . . . . . . . . — — — (18,023) (18,023)
Mortgage commitment derivatives . . . . . . . . . . . . — 712 30 — 742
Total other liabilities . . . . . . . . . . . . . . . . . . . . . . . 1 19,594 143 (18,023) 1,715
Total liabilities at fair value . . . . . . . . . . . . . . . $ 1 $21,710 $1,191 $(18,023) $ 4,879
F-119
FANNIE MAE(In conservatorship)
NOTES TO CONSOLIDATED FINANCIAL STATEMENTS—(Continued)

QuotedPrices in
ActiveMarkets for
IdenticalAssets
(Level 1)
SignificantOther
ObservableInputs
(Level 2)
SignificantUnobservable
Inputs(Level 3)
NettingAdjustment(1)
EstimatedFair Value
Fair Value Measurements as of December 31, 2009
(Dollars in millions)
Assets:Trading securities:
Mortgage-related securities:Fannie Mae . . . . . . . . . . . . . . . . . . . . . . . . . . . . . . . . . . $— $ 69,094 $ 5,656 $ — $ 74,750Freddie Mac . . . . . . . . . . . . . . . . . . . . . . . . . . . . . . . . . . — 15,082 — — 15,082Ginnie Mae . . . . . . . . . . . . . . . . . . . . . . . . . . . . . . . . . . — 1 — — 1Alt-A private-label securities . . . . . . . . . . . . . . . . . . . . . . — 791 564 — 1,355Subprime private-label securities . . . . . . . . . . . . . . . . . . . . — — 1,780 — 1,780CMBS . . . . . . . . . . . . . . . . . . . . . . . . . . . . . . . . . . . . . . — 9,335 — — 9,335Mortgage revenue bonds . . . . . . . . . . . . . . . . . . . . . . . . . — — 600 — 600Other . . . . . . . . . . . . . . . . . . . . . . . . . . . . . . . . . . . . . . . — — 154 — 154
Non-mortgage-related securities:Asset-backed securities . . . . . . . . . . . . . . . . . . . . . . . . . . — 8,408 107 — 8,515Corporate debt securities . . . . . . . . . . . . . . . . . . . . . . . . . — 364 — — 364U.S. Treasury securities . . . . . . . . . . . . . . . . . . . . . . . . . . 3 — — — 3
Total trading securities . . . . . . . . . . . . . . . . . . . . . . . . . . . . . . 3 103,075 8,861 — 111,939Available-for-sale securities:
Mortgage-related securities:Fannie Mae . . . . . . . . . . . . . . . . . . . . . . . . . . . . . . . . . . — 153,823 596 — 154,419Freddie Mac . . . . . . . . . . . . . . . . . . . . . . . . . . . . . . . . . . — 27,442 27 — 27,469Ginnie Mae . . . . . . . . . . . . . . . . . . . . . . . . . . . . . . . . . . — 1,230 123 — 1,353Alt-A private-label securities . . . . . . . . . . . . . . . . . . . . . . — 5,838 8,312 — 14,150Subprime private-label securities . . . . . . . . . . . . . . . . . . . . — — 10,746 — 10,746CMBS . . . . . . . . . . . . . . . . . . . . . . . . . . . . . . . . . . . . . . — 13,193 — — 13,193Mortgage revenue bonds . . . . . . . . . . . . . . . . . . . . . . . . . — 26 12,820 — 12,846Other . . . . . . . . . . . . . . . . . . . . . . . . . . . . . . . . . . . . . . . — 22 3,530 — 3,552
Total available-for-sale securities . . . . . . . . . . . . . . . . . . . . . . . — 201,574 36,154 — 237,728Other assets:
Derivative assets . . . . . . . . . . . . . . . . . . . . . . . . . . . . . . . . . — 19,724 150 (18,400) 1,474Guaranty assets and buy-ups . . . . . . . . . . . . . . . . . . . . . . . . — — 2,577 — 2,577
Total other assets . . . . . . . . . . . . . . . . . . . . . . . . . . . . . . . . . . — 19,724 2,727 (18,400) 4,051
Total assets at fair value . . . . . . . . . . . . . . . . . . . . . . . . . . $ 3 $324,373 $47,742 $(18,400) $353,718
Liabilities:Long-term debt . . . . . . . . . . . . . . . . . . . . . . . . . . . . . . . . . . . $— $ 2,673 $ 601 $ — $ 3,274Other liabilities:
Derivative liabilities . . . . . . . . . . . . . . . . . . . . . . . . . . . . . . — 23,815 27 (22,813) 1,029Other liabilities . . . . . . . . . . . . . . . . . . . . . . . . . . . . . . . . . — 270 — — 270
Total other liabilities . . . . . . . . . . . . . . . . . . . . . . . . . . . . . . . — 24,085 27 (22,813) 1,299
Total liabilities at fair value . . . . . . . . . . . . . . . . . . . . . . . $— $ 26,758 $ 628 $(22,813) $ 4,573
(1) Derivative contracts are reported on a gross basis by level. The netting adjustment represents the effect of the legalright to offset under legally enforceable master netting agreements to settle with the same counterparty on a net basis,as well as cash collateral.
F-120
FANNIE MAE(In conservatorship)
NOTES TO CONSOLIDATED FINANCIAL STATEMENTS—(Continued)

The following tables display a reconciliation of all assets and liabilities measured at fair value on a recurringbasis using significant unobservable inputs (Level 3) for the years ended December 31, 2010, 2009 and 2008.The tables also display gains and losses due to changes in fair value, including both realized and unrealizedgains and losses, recorded in our consolidated statements of operations for Level 3 assets and liabilities for theyears ended December 31, 2010, 2009 and 2008. When assets and liabilities are transferred between levels, werecognize the transfer as of the end of the period transferred.
Balance,December 31,
2009
Impact ofNew
AccountingStandards
Includedin NetLoss
Includedin Other
ComprehensiveLoss
Purchases,Sales,
Issuances,and
Settlements,Net
TransfersOut of
Level 3(1)
Transfersinto
Level 3(1)
Balance,December 31,
2010
Net UnrealizedGains (Losses)Included in NetLoss Related to
Assets andLiabilities Still
Held as ofDecember 31,
2010(2)
Total Gains or (Losses)(Realized/Unrealized)
Fair Value Measurements Using Significant Unobservable Inputs (Level 3)For the Year Ended December 31, 2010
(Dollars in millions)
Trading securities:
Mortgage-related:
Fannie Mae . . . . . . . . . . . $ 5,656 $ (2) $ (1) $ — $ (223) $(5,551) $2,323 $ 2,202 $ 13
Freddie Mac . . . . . . . . . . — — — — (1) (3) 4 — —
Alt-A private-labelsecurities . . . . . . . . . . . 564 62 226 — (77) (1,069) 314 20 4
Subprime private-labelsecurities . . . . . . . . . . . 1,780 — 41 — (240) — — 1,581 41
Mortgage revenue bonds . . . 600 — 67 — (58) — — 609 66
Other . . . . . . . . . . . . . . . 154 — 6 — (8) — — 152 5
Non-mortgage-related:
Asset-backed securities . . . . 107 — 1 — (62) (47) 13 12 —
Total trading securities . . . . . . . 8,861 60 340 — (669) (6,670) 2,654 4,576 129
Available-for-sale securities:
Mortgage-related:
Fannie Mae . . . . . . . . . . . 596 (203) (1) 2 181 (580) 119 114 —
Freddie Mac . . . . . . . . . . 27 — — (1) (29) — 6 3 —
Ginnie Mae . . . . . . . . . . . 123 — — 2 (125) — — — —
Alt-A private-labelsecurities . . . . . . . . . . . 8,312 471 (54) 1,240 (1,322) (4,951) 3,353 7,049 —
Subprime private-labelsecurities . . . . . . . . . . . 10,746 (118) (70) 1,078 (1,704) — — 9,932 —
Mortgage revenue bonds . . . 12,820 21 11 82 (1,902) (2) — 11,030 —
Other . . . . . . . . . . . . . . . 3,530 366 (3) 402 (489) — — 3,806 —
Total available-for-salesecurities . . . . . . . . . . . . . . 36,154 537 (117) 2,805 (5,390) (5,533) 3,478 31,934 —
Mortgage loans of consolidatedtrusts . . . . . . . . . . . . . . . . . — — (29) — 2,188 (11) 59 2,207 (29)
Guaranty assets and buy-ups. . . . 2,577 (2,568) 1 1 (11) — — — —
Net derivatives . . . . . . . . . . . . 123 — 61 — (74) (1) (5) 104 (33)
Long-term debt:
Of Fannie Mae:
Senior floating . . . . . . . . . (601) — 20 — 160 — — (421) 24
Of consolidated trusts . . . . . . — (77) 19 — (631) 92 (30) (627) 2
Total long-term debt . . . . . . . . . $ (601) $ (77) $ 39 $ — $ (471) $ 92 $ (30) $ (1,048) $ 26
F-121
FANNIE MAE(In conservatorship)
NOTES TO CONSOLIDATED FINANCIAL STATEMENTS—(Continued)

Balance,January 1,
2009Included in
Net Loss
Included inOther
ComprehensiveLoss
Purchases,Sales,
Issuances,and
Settlements,Net
Transfersin/out ofLevel 3,
Net(3)
Balance,December 31,
2009
Net UnrealizedGains (Losses)Included in NetLoss Related to
Assets andLiabilities Still
Held as ofDecember 31,
2009(2)
Total Gains or (Losses)(Realized/Unrealized)
For the Year Ended December 31, 2009Fair Value Measurements Using Significant Unobservable Inputs (Level 3)
(Dollars in millions)
Trading securities:
Mortgage-related:
Fannie Mae . . . . . . . . . . . . . . . . $ 6,935 $ 278 $ — $(1,277) $ (280) $ 5,656 $274
Alt-A private-label securities. . . . . 1,118 57 — (154) (457) 564 (25)
Subprime private-label securities . . 2,318 (83) — (455) — 1,780 (74)
Mortgage revenue bonds . . . . . . . 695 (75) — (20) — 600 (75)
Other . . . . . . . . . . . . . . . . . . . . 167 (1) — (12) — 154 (1)
Non-mortgage-related:
Asset-backed securities . . . . . . . . 1,475 (38) — (108) (1,222) 107 2
Corporate debt securities . . . . . . . 57 3 — (116) 56 — —
Total trading securities . . . . . . . . . . . . $12,765 $ 141 $ — $(2,142) $(1,903) $ 8,861 $101
Available-for-sale securities:
Mortgage-related:
Fannie Mae . . . . . . . . . . . . . . . . $ 5,609 $ (47) $ 191 $ (569) $(4,588) $ 596 $ —
Freddie Mac . . . . . . . . . . . . . . . 80 3 (6) (21) (29) 27 —
Ginnie Mae . . . . . . . . . . . . . . . . 190 — 1 (7) (61) 123 —
Alt-A private-label securities. . . . . 11,675 (1,717) 2,192 (1,554) (2,284) 8,312 —
Subprime private-label securities . . 14,318 (5,290) 4,862 (3,144) — 10,746 —
Mortgage revenue bonds . . . . . . . 12,456 (16) 1,349 (969) — 12,820 —
Other . . . . . . . . . . . . . . . . . . . . 3,509 (81) 651 (549) — 3,530 —
Total available-for-sale securities . . . . . $47,837 $(7,148) $9,240 $(6,813) $(6,962) $36,154 $ —
Guaranty assets and buy-ups . . . . . . . . 1,083 466 243 785 — 2,577 783
Net derivatives . . . . . . . . . . . . . . . . . 310 (42) — (48) (97) 123 3
Long-term debt . . . . . . . . . . . . . . . . (2,898) (18) — 1,791 524 (601) (49)
F-122
FANNIE MAE(In conservatorship)
NOTES TO CONSOLIDATED FINANCIAL STATEMENTS—(Continued)

TradingSecurities
Available-for-saleSecurities
NetDerivatives
GuarantyAssets
andBuy-ups
Long-TermDebt
Fair Value Measurements Using SignificantUnobservable Inputs (Level 3)
For the Year Ended December 31, 2008
(Dollars in millions)
Beginning balance as of January 1, 2008 . . . . . . . $18,508 $20,920 $ 161 $1,568 $(7,888)
Realized/unrealized gains (losses) included in netloss. . . . . . . . . . . . . . . . . . . . . . . . . . . . . . . . (1,881) (3,152) 282 (512) (73)
Unrealized losses included in other comprehensiveloss. . . . . . . . . . . . . . . . . . . . . . . . . . . . . . . . — (4,136) — (342) —
Purchases, sales, issuances, and settlements, net . . (4,337) (3,640) (227) 369 5,396
Transfers in/out of Level 3, net(4). . . . . . . . . . . . . 475 37,845 94 — (333)
Ending balance as of December 31, 2008 . . . . . . . $12,765 $47,837 $ 310 $1,083 $(2,898)
Net unrealized gains (losses) included in net lossrelated to assets and liabilities still held as ofDecember 31, 2008(2) . . . . . . . . . . . . . . . . . . . $ (1,293) $ — $ 159 $ (26) $ (18)
(1) For the year ended December 31, 2010, the transfers out of Level 3 consisted primarily of Fannie Mae guaranteedmortgage-related securities and private-label mortgage-related securities backed by Alt-A loans. Prices for thesesecurities were obtained from multiple third-party vendors supported by market observable inputs. For the year endedDecember 31, 2010, the transfers into Level 3 consisted primarily of private-label mortgage-related securities backedby Alt-A loans as well as Fannie Mae guaranteed mortgage-related securities. Prices for these securities are based oninputs from a single source or inputs that were not readily observable.
(2) Amount represents temporary changes in fair value. Amortization, accretion and other-than-temporary impairments arenot considered unrealized and are not included in this amount.
(3) For the year ended December 31, 2009, the net transfers to Level 2 from Level 3 consisted primarily of Fannie Maeguaranteed mortgage-related securities, which include securities backed by jumbo conforming loans, and private-labelmortgage-related securities backed by non-fixed rate Alt-A loans. Price transparency improved as a result of increasedmarket activity, and we noted some convergence in prices obtained from third-party vendors. As a result, wedetermined that our fair value estimates for these securities did not rely on significant unobservable inputs.
(4) During the year ended December 31, 2008, transfers into Level 3 consisted primarily of private-label mortgage-relatedsecurities backed by Alt-A and subprime mortgage loans.
The following tables display unrealized gains and losses recorded in our consolidated statements of operationsfor the years ended December 31, 2010, 2009 and 2008 for assets and liabilities transferred into Level 3 andmeasured in our consolidated balance sheets at fair value on a recurring basis.
TradingSecurities
Available-For-SaleSecurities
Loans ofConsolidated
TrustsNet
DerivativesLong-Term
Debt
Fair Value Measurements Using SignificantUnobservable Inputs (Level 3)
For the Year Ended December 31, 2010
(Dollars in millions)
Realized and unrealized gains (losses)included in net loss . . . . . . . . . . . . . . . . . . $ 126 $ (36) $(33) $(32) $ (3)
Unrealized losses included in othercomprehensive loss . . . . . . . . . . . . . . . . . . — (151) — — —
Total gains (losses) . . . . . . . . . . . . . . . . . . . . $ 126 $ (187) $(33) $(32) $ (3)
Amount of Level 3 transfers in . . . . . . . . . . . $2,654 $3,478 $ 59 $ (5) $(30)
F-123
FANNIE MAE(In conservatorship)
NOTES TO CONSOLIDATED FINANCIAL STATEMENTS—(Continued)

TradingSecurities
Available-for-SaleSecurities
NetDerivatives
Long-termDebt
Fair Value Measurements Using SignificantUnobservable Inputs (Level 3)
For the Year Ended December 31, 2009
(Dollars in millions)
Realized and unrealized gains (losses) included in net loss . . . . $ (6) $ 62 $ (2) $—
Unrealized gains included in other comprehensive loss . . . . . . . — 174 — —
Total gains (losses) . . . . . . . . . . . . . . . . . . . . . . . . . . . . . . . $ (6) $ 236 $ (2) $—
Amount of Level 3 transfers in . . . . . . . . . . . . . . . . . . . . . . . $1,136 $7,877 $107 $—
TradingSecurities
Available-for-SaleSecurities
NetDerivatives
Long-termDebt
Fair Value Measurements Using SignificantUnobservable Inputs (Level 3)
For the Year Ended December 31, 2008
(Dollars in millions)
Realized and unrealized gains (losses) included in net loss . . . . $ (679) $ (2,014) $18 $ (35)
Unrealized losses included in other comprehensive loss . . . . . . — (2,261) — —
Total gains (losses) . . . . . . . . . . . . . . . . . . . . . . . . . . . . . . . $ (679) $ (4,275) $18 $ (35)
Amount of Level 3 transfers in . . . . . . . . . . . . . . . . . . . . . . . $10,189 $55,621 $18 $(531)
The following tables display realized and unrealized gains and losses included in our consolidated statementsof operations for the years ended December 31, 2010, 2009 and 2008, for our Level 3 assets and liabilitiesmeasured in our consolidated balance sheets at fair value on a recurring basis.
InterestIncome
Fair ValueGains
(Losses), net
NetOther-than-Temporary
Impairments Other Total
For the Year Ended December 31, 2010
(Dollars in millions)
Total realized and unrealized gains (losses) included in netloss . . . . . . . . . . . . . . . . . . . . . . . . . . . . . . . . . . . . . . . . . $319 $416 $(480) $40 $295
Net unrealized gains related to Level 3 assets and liabilities stillheld as of December 31, 2010 . . . . . . . . . . . . . . . . . . . . . . . $ — $ 93 $ — $— $ 93
InterestIncome
Investmentsin Securities
GuarantyFee
Income
Fair ValueGain
(Losses), net
NetOther-than-Temporary
Impairments Total
For the Year Ended December 31, 2009
(Dollars in millions)
Total realized and unrealized gains (losses) includedin net loss. . . . . . . . . . . . . . . . . . . . . . . . . . . . . . $545 $466 $94 $(7,706) $(6,601)
Net unrealized gains related to Level 3 assets andliabilities still held as of December 31, 2009 . . . . . $ — $783 $55 $ — $ 838
F-124
FANNIE MAE(In conservatorship)
NOTES TO CONSOLIDATED FINANCIAL STATEMENTS—(Continued)

InterestIncome
Investmentin Securities
GuarantyFee
Income
InvestmentGains
(Losses), Net
FairValue Gains
(Losses),net
Other thanTemporary
Impairments,net
ExtraordinaryLosses Total
For the Year Ended December 31, 2008
(Dollars in millions)
Total realized and unrealizedgains (losses) included innet loss . . . . . . . . . . . . . $90 $(915) $448 $(1,640) $(3,260) $(59) $(5,336)
Net unrealized losses relatedto level 3 assets andliabilities still held as ofDecember 31, 2008 . . . . . $— $ (26) $ — $(1,152) $ — $ — $(1,178)
We use valuation techniques that maximize the use of observable inputs and minimize the use of unobservableinputs. The following is a description of the valuation techniques we use for assets and liabilities measured atfair value on a recurring basis, as well as our basis for classifying these assets and liabilities as Level 1,Level 2 or Level 3. These valuation techniques are also used to estimate the fair value of financial instrumentsnot carried at fair value but disclosed as part of the fair value of financial instruments.
Cash Equivalents, Trading Securities and Available-for-Sale Securities—These securities are recorded in ourconsolidated balance sheets at fair value on a recurring basis. Fair value is measured using quoted marketprices in active markets for identical assets, when available. Securities, such as U.S. Treasuries, whose value isbased on quoted market prices in active markets for identical assets are classified as Level 1. If quoted marketprices in active markets for identical assets are not available, we use prices provided by up to four third-partypricing services that are calibrated to the quoted market prices in active markets for similar securities, andassets valued in this manner are classified as Level 2. In the absence of prices provided by third-party pricingservices supported by observable market data, fair values are estimated using quoted prices of securities withsimilar characteristics or discounted cash flow models that use inputs such as spread, prepayment speed, yield,and loss severity based on market assumptions where available. Such instruments are generally classified asLevel 2. Where there is limited activity or less transparency around inputs to the valuation, securities areclassified as Level 3.
Mortgage Loans Held for Investment “HFI”— The majority of HFI performing loans and nonperformingloans that are not individually impaired are reported in our consolidated balance sheets at the principal amountoutstanding, net of cost basis adjustments and an allowance for loan losses. At the transition date, we recordedconsolidated trusts’ loans as HFI at their unpaid principal balance net of an allowance for loan losses. Weelected the fair value option for certain loans containing embedded derivatives that would otherwise requirebifurcation and consolidated loans of senior-subordinate trust structures, which are recorded in ourconsolidated balance sheets at fair value on a recurring basis.
Fair value of performing loans represents an estimate of the prices we would receive if we were to securitizethose loans and is determined based on comparisons to Fannie Mae MBS with similar characteristics, either ona pool or loan level. We use the observable market values of our Fannie Mae MBS determined from third-party pricing services and other observable market data as a base value, from which we add or subtract thefair value of the associated guaranty asset, guaranty obligation and master servicing arrangement. We classifythese valuations primarily within Level 2 of the valuation hierarchy given that the market values of our FannieMae MBS are calibrated to the quoted market prices in active markets for similar securities. To the extent thatsignificant inputs are not observable or determined by extrapolation of observable points, the loans areclassified within Level 3. Certain loans that do not qualify for Fannie Mae MBS securitization are valuedusing market-based data including, for example, credit spreads, severities and prepayment speeds for similar
F-125
FANNIE MAE(In conservatorship)
NOTES TO CONSOLIDATED FINANCIAL STATEMENTS—(Continued)
loans, through third-party pricing services or through a model approach incorporating both interest rate andcredit risk simulating a loan sale via a synthetic structure.
Fair value of single-family nonperforming loans represents an estimate of the prices we would receive if wewere to sell these loans in the nonperforming whole-loan market. We calculate the fair value of nonperformingloans based on assumptions about key factors, including loan performance, collateral value, foreclosure relatedexpenses, disposition timeline, and mortgage insurance repayment. Using these assumptions, along withindicative bids for a representative sample of nonperforming loans, we compute a market calibrated fair value.The bids on sample loans are obtained from multiple active market participants. Fair value for loans that arefour or more months delinquent, in an open modification period, or in a closed modification and that haveperformed for nine or fewer months, is estimated directly from a model calibrated to these indicative bids. Fairvalue for loans that are one to three months delinquent is estimated by an interpolation method using threeinputs: (1) the fair value estimate as a performing loan; (2) the fair value estimate as a nonperforming loan;and (3) the delinquency transition rate corresponding to the loan’s current delinquency status.
Fair value of a portion of our single-family nonperforming loans is measured using the value of the underlyingcollateral. These valuations leverage our proprietary distressed home price model. The model assigns a valueusing comparable transaction data. In determining what comparables to use in the calculations, the modelmeasures three key characteristics relative to the target property: (1) distance from target property, (2) time ofthe transaction and (3) comparability of the nondistressed value. A portion of the nonperforming loans that areimpaired is measured at fair value in our consolidated balance sheets on a nonrecurring basis. These loans areclassified within Level 3 of the valuation hierarchy because significant inputs are unobservable.
Fair value of multifamily nonperforming loans is determined by external third-party valuations when available.If third-party valuations are unavailable, we determine the value of the collateral based on a derived propertyvalue estimation method using current net operating income of the property and capitalization rates.
Derivatives Assets and Liabilities (collectively “derivatives”)—Derivatives are recorded in our consolidatedbalance sheets at fair value on a recurring basis. The valuation process for the majority of our riskmanagement derivatives uses observable market data provided by third-party sources, resulting in Level 2classification. Interest rate swaps are valued by referencing yield curves derived from observable interest ratesand spreads to project and discount swap cash flows to present value. Option-based derivatives use a modelthat projects the probability of various levels of interest rates by referencing swaption and caplet volatilitiesprovided by market makers/dealers. The projected cash flows of the underlying swaps of these option-basedderivatives are discounted to present value using yield curves derived from observable interest rates andspreads. Exchange-traded futures are valued using market quoted prices, resulting in Level 1 classification.Certain highly complex structured derivatives use only a single external source of price information due tolack of transparency in the market and may be modeled using observable interest rates and volatility levels aswell as significant assumptions, resulting in Level 3 classification. Mortgage commitment derivatives useobservable market data, quotes and actual transaction price levels adjusted for market movement, and aretypically classified as Level 2. Adjustments for market movement based on internal model results that cannotbe corroborated by observable market data are classified as Level 3.
Guaranty Assets and Buy-ups—Guaranty assets related to our portfolio securitizations are recorded in ourconsolidated balance sheets at fair value on a recurring basis and are classified within Level 3 of the valuationhierarchy. Guaranty assets in lender swap transactions are recorded in our consolidated balance sheets at thelower of cost or fair value. These assets, which are measured at fair value on a nonrecurring basis, areclassified within Level 3 of the fair value hierarchy.
We estimate the fair value of guaranty assets based on the present value of expected future cash flows of theunderlying mortgage assets using management’s best estimate of certain key assumptions, which include
F-126
FANNIE MAE(In conservatorship)
NOTES TO CONSOLIDATED FINANCIAL STATEMENTS—(Continued)

prepayment speeds, forward yield curves, and discount rates commensurate with the risks involved. These cashflows are projected using proprietary prepayment, interest rate and credit risk models. Because guaranty assetsare like an interest-only income stream, the projected cash flows from our guaranty assets are discounted usingone-month LIBOR plus the option-adjusted spread (“OAS”) for interest-only trust securities. The interest-onlyOAS is calibrated using prices of a representative sample of interest-only trust securities. We believe theremitted fee income is less liquid than interest-only trust securities and more like an excess servicing strip. Wetake a further haircut of the present value for liquidity considerations. The haircut is based on market quotesfrom dealers.
The fair value of the guaranty assets include the fair value of any associated buy-ups, which is estimated inthe same manner as guaranty assets but is recorded separately as a component of “Other assets” in ourconsolidated balance sheets. While the fair value of the guaranty assets reflect all guaranty arrangements, thecarrying value primarily reflects only those arrangements entered into subsequent to our adoption of theaccounting standard on guarantor’s accounting and disclosure requirements for guarantees.
Short-Term Debt and Long-Term Debt (collectively “debt”)—The majority of debt of Fannie Mae is recordedin our consolidated balance sheets at the principal amount outstanding, net of cost basis adjustments. Weelected the fair value option for certain structured debt instruments, which are recorded in our consolidatedbalance sheets at fair value on a recurring basis.
We use third-party pricing services that reference observable market data such as interest rates and spreads tomeasure the fair value of debt, and thus classify that debt as Level 2. When third-party pricing is notavailable, we use a discounted cash flow approach based on a yield curve derived from market prices observedfor Fannie Mae Benchmark Notes and adjusted to reflect fair values at the offer side of the market.
For structured debt instruments that are not valued by third-party pricing services, cash flows are evaluatedtaking into consideration any structured derivatives through which we have swapped out of the structuredfeatures of the notes. The resulting cash flows are discounted to present value using a yield curve derived frommarket prices observed for Fannie Mae Benchmark Notes and adjusted to reflect fair values at the offer side ofthe market. Market swaption volatilities are also referenced for the valuation of callable structured debtinstruments. Given that the derivatives considered in the valuations of these structured debt instruments areclassified as Level 3, the valuations of the structured debt instruments result in a Level 3 classification.
At the transition date, we recognized consolidated trusts’ debt held by third parties at their unpaid principalbalance in our consolidated balance sheets. Consolidated MBS debt is traded in the market as MBS assets.Accordingly, we estimate the fair value of our consolidated MBS debt using quoted market prices in activemarkets for similar liabilities when traded as assets. The valuation methodology and inputs used in estimatingthe fair value of MBS assets are described under “Cash Equivalents, Trading Securities and Available-for-SaleSecurities.” Certain consolidated MBS debt with embedded derivatives is recorded in our consolidated balancesheets at fair value on a recurring basis.
Other Liabilities—Represents dollar roll repurchase transactions that reflect prices for similar securities in themarket. They are recorded in our consolidated balance sheets at fair value on a recurring basis. Fair value isbased on observable market-based inputs, quoted market prices and actual transaction price levels adjusted formarket movement, and these liabilities are typically classified as Level 2. Adjustments for market movementthat require internal model results that cannot be corroborated by observable market data results inclassification as Level 3.
Nonrecurring Changes in Fair Value
The following tables display assets and liabilities measured in our consolidated balance sheets at fair value ona nonrecurring basis; that is, the instruments are not measured at fair value on an ongoing basis but are subject
F-127
FANNIE MAE(In conservatorship)
NOTES TO CONSOLIDATED FINANCIAL STATEMENTS—(Continued)

to fair value adjustments in certain circumstances (for example, when we evaluate for impairment), and thegains or losses recognized for these assets and liabilities for the years ended December 31, 2010, 2009 and2008, as a result of fair value measurements.
QuotedPrices in
ActiveMarkets for
IdenticalAssets
(Level 1)
SignificantOther
ObservableInputs
(Level 2)
SignificantUnobservable
Inputs(Level 3)
EstimatedFair
ValueTotal
Losses
Fair Value MeasurementsFor the Year Ended December 31, 2010
For the YearEnded
December 31, 2010
(Dollars in millions)
Assets:
Mortgage loans held for sale, at lower of cost orfair value . . . . . . . . . . . . . . . . . . . . . . . . . . . . $— $6,776 $ 535 $7,311(1)(2) $ (91)(2)
Single-family mortgage loans held for investment,at amortized cost:
Of Fannie Mae . . . . . . . . . . . . . . . . . . . . . . . — — 38,150 38,150(3) (2,244)
Of consolidated trusts . . . . . . . . . . . . . . . . . . — — 1,294 1,294(3) (235)
Multifamily mortgage loans held for investment, atamortized cost:
Of Fannie Mae . . . . . . . . . . . . . . . . . . . . . . . — — 1,836 1,836(3) (481)
Acquired property, net:
Single-family . . . . . . . . . . . . . . . . . . . . . . . . . . — — 20,248 20,248(4) (2,617)
Multifamily . . . . . . . . . . . . . . . . . . . . . . . . . . . — — 206 206(4) (65)
Other assets
Guaranty assets . . . . . . . . . . . . . . . . . . . . . . . . — — 27 27 (6)
Partnership investments . . . . . . . . . . . . . . . . . . . — — 107 107 (145)(6)
Other assets . . . . . . . . . . . . . . . . . . . . . . . . . . . — — 597 597(5) (43)
Total assets at fair value . . . . . . . . . . . . . . . . . . $— $6,776 $63,000 $69,776 $(5,927)
F-128
FANNIE MAE(In conservatorship)
NOTES TO CONSOLIDATED FINANCIAL STATEMENTS—(Continued)

QuotedPrices in
ActiveMarkets for
IdenticalAssets
(Level 1)
SignificantOther
ObservableInputs
(Level 2)
SignificantUnobservable
Inputs(Level 3)
EstimatedFair
ValueTotal
Losses
Fair Value MeasurementsFor the Year Ended December 31, 2009
For the YearEnded
December 31, 2009
(Dollars in millions)
Assets:
Mortgage loans held for sale, at lower of cost orfair value . . . . . . . . . . . . . . . . . . . . . . . . . . . . $— $22,238 $ 3,557 $25,795(1) $(1,210)
Mortgage loans held for investment, at amortizedcost . . . . . . . . . . . . . . . . . . . . . . . . . . . . . . . . — 330 4,820 5,150(3) (1,173)
Acquired property, net . . . . . . . . . . . . . . . . . . . . . — — 10,132 10,132(4) (503)
Other assets:
Guaranty assets . . . . . . . . . . . . . . . . . . . . . . . . — — 2,327 2,327 (231)
Master servicing assets . . . . . . . . . . . . . . . . . . . — — 147 147 (546)
Partnership investments . . . . . . . . . . . . . . . . . . . — — 212 212 (5,943)(6)
Total assets at fair value . . . . . . . . . . . . . . . . . . $— $22,568 $21,195 $43,763 $(9,606)
Liabilities:
Master servicing liabilities . . . . . . . . . . . . . . . . . . $— $ — $ 254 $ 254 $ (200)
Total liabilities at fair value . . . . . . . . . . . . . . . . $— $ — $ 254 $ 254 $ (200)
F-129
FANNIE MAE(In conservatorship)
NOTES TO CONSOLIDATED FINANCIAL STATEMENTS—(Continued)

QuotedPrices in
ActiveMarkets for
IdenticalAssets
(Level 1)
SignificantOther
ObservableInputs
(Level 2)
SignificantUnobservable
Inputs(Level 3)
EstimatedFair
ValueTotal
Losses
Fair Value MeasurementsFor the Year Ended December 31, 2008
For the YearEnded
December 31, 2008
(Dollars in millions)
Assets:
Mortgage loans held for sale, at lower of cost orfair value . . . . . . . . . . . . . . . . . . . . . . . . . . . . $— $26,303 $ 1,294 $27,597(1) $ (433)
Mortgage loans held for investment, at amortizedcost . . . . . . . . . . . . . . . . . . . . . . . . . . . . . . . . — — 1,838 1,838(3) (107)
Acquired property, net . . . . . . . . . . . . . . . . . . . . . — — 9,624 9,624(4) (1,533)
Other assets:
Guaranty assets . . . . . . . . . . . . . . . . . . . . . . . . — — 5,473 5,473 (2,967)
Master servicing assets . . . . . . . . . . . . . . . . . . . — — 547 547 (553)
Partnership investments . . . . . . . . . . . . . . . . . . . — — 4,877 4,877 (764)(6)
Total assets at fair value . . . . . . . . . . . . . . . . . . $— $26,303 $23,653 $49,956 $(6,357)
Liabilities:
Master servicing liabilities . . . . . . . . . . . . . . . . . . $— $ — $ 22 $ 22 $ (12)
Total liabilities at fair value . . . . . . . . . . . . . . . . $— $ — $ 22 $ 22 $ (12)
(1) Includes $7.1 billion, $15.1 billion, and $25.2 billion of mortgage loans held for sale that were sold, retained as amortgage-related security or redesignated to mortgage loans held for investment as of December 31, 2010, 2009, and2008, respectively.
(2) Includes $7.1 billion of estimated fair value and $68 million in losses due to the adoption of the new accountingstandards.
(3) Includes $3.4 billion, $1.1 billion and $157 million of mortgage loans held for investment that were redesignated tomortgage loans held for sale, liquidated or transferred to foreclosed properties as of December 31, 2010, 2009, and2008, respectively.
(4) Includes $10.5 billion, $7.1 billion and $4.0 billion of acquired properties that were sold or transferred as ofDecember 31, 2010, 2009 and 2008, respectively.
(5) Includes $22 million of other assets that were sold or transferred as of December 31, 2010.(6) Represents impairment charges related to LIHTC partnerships and other equity investments in multifamily properties.
We recognized other than temporary impairment losses of $16 million, $5.5 billion and $506 million related to LIHTCpartnerships for the years ended December 31, 2010, 2009 and 2008, respectively.
The following is a description of the fair valuation techniques we use for assets and liabilities measured at fairvalue on a nonrecurring basis under the accounting standard for fair value measurements as well as our basisfor classifying these assets and liabilities as Level 1, Level 2 or Level 3. We also use these valuationtechniques to estimate the fair value of financial instruments not carried at fair value but disclosed as part ofthe fair value of financial instruments.
Mortgage Loans Held for Sale “HFS”—HFS loans are reported at the lower of cost or fair value in ourconsolidated balance sheets. At the transition date, we reclassified the majority of HFS loans to HFI, as thetrusts do not have the ability to sell mortgage loans and use of such loans is limited exclusively to thesettlement of obligations of the trust. The valuation methodology and inputs used in estimating the fair value
F-130
FANNIE MAE(In conservatorship)
NOTES TO CONSOLIDATED FINANCIAL STATEMENTS—(Continued)

of HFS loans are described under “Mortgage Loans Held for Investment” and these loans are generallyclassified as Level 2. To the extent that significant inputs are not observable or determined by extrapolation ofobservable points, the loans are classified within Level 3.
Acquired Property, Net and Other Assets—Acquired property, net mainly represents foreclosed propertyreceived in full satisfaction of a loan net of a valuation allowance. Acquired property is initially recorded inour consolidated balance sheets at its fair value less its estimated cost to sell. The initial fair value offoreclosed properties is determined using a hierarchy based on the reliability of available information. The fairvalue estimate is based on the best information available at the time of valuation. The hierarchy includesoffers accepted, third-party interior appraisals, independent broker opinions, proprietary home price modelvalues, and exterior broker price opinions. Estimated cost to sell is based upon historical sales cost at ageographic level.
Subsequent to initial measurement, the foreclosed properties that we intend to sell are reported at the lower ofthe carrying amount or fair value less estimated cost to sell. Foreclosed properties classified as held for use,included in other assets, are depreciated and are impaired when circumstances indicate that the carryingamount of the property is no longer recoverable. Acquired property held for use is included in other assets inour consolidated balance sheets. The fair value of our single-family foreclosed properties on an ongoing basisis determined using the same information hierarchy used at the point of initial fair value. The fair value of ourmultifamily properties is derived using third-party valuations. When third-party valuations are not available,we estimate the fair value using current net operating income of the property and capitalization rates.
Acquired property is classified within Level 3 of the valuation hierarchy because significant inputs areunobservable.
Master Servicing Assets and Liabilities—Master servicing assets and liabilities are reported at the lower ofcost or fair value in our consolidated balance sheets. We measure the fair value of master servicing assets andliabilities based on the present value of expected cash flows of the underlying mortgage assets usingmanagement’s best estimates of certain key assumptions, which include prepayment speeds, forward yieldcurves, adequate compensation, and discount rates commensurate with the risks involved. Changes inanticipated prepayment speeds, in particular, result in fluctuations in the estimated fair values of our masterservicing assets and liabilities. If actual prepayment experience differs from the anticipated rates used in ourmodel, this may result in a material change in the fair value. Master servicing assets and liabilities areclassified as Level 3.
Partnership Investments—Unconsolidated investments in limited partnerships are primarily accounted forunder the equity method of accounting. During 2009, we reduced the carrying value of our LIHTCinvestments to zero. We previously determined the fair value of our LIHTC investments using internal modelsthat estimated the present value of the expected future tax benefits (tax credits and tax deductions for netoperating losses) expected to be generated from the properties underlying these investments. Our estimateswere based on assumptions that other market participants would use in valuing these investments. The keyassumptions used in our models, which required significant management judgment, included discount ratesand projections related to the amount and timing of tax benefits. We compared our model results toindependent third-party valuations to validate the reasonableness of our assumptions and valuation results. Wealso compared our model results to the limited number of observed market transactions and made adjustmentsto reflect differences between the risk profile of the observed market transactions and our LIHTC investments.
For our other equity method investments, we use a net present value approach to estimate the fair value. Thekey assumptions used in our approach, which require significant management judgment, include discount ratesand projections related to the amount and timing of cash flows. Our equity investments in LIHTC limited
F-131
FANNIE MAE(In conservatorship)
NOTES TO CONSOLIDATED FINANCIAL STATEMENTS—(Continued)

partnerships and other equity investments are classified as Level 3 because they trade in a market with limitedobservable transactions.
Fair Value of Financial Instruments
The following table displays the carrying value and estimated fair value of our financial instruments as ofDecember 31, 2010 and 2009. The fair value of financial instruments we disclose, includes commitments topurchase multifamily mortgage and single-family mortgage loans, which are off-balance sheet financialinstruments that we do not record in our consolidated balance sheets. The fair values of these commitmentsare included as “Mortgage loans held for investment, net of allowance for loan losses.” The disclosureexcludes certain financial instruments, such as plan obligations for pension and postretirement health carebenefits, employee stock option and stock purchase plans, and also excludes all non-financial instruments. Asa result, the fair value of our financial assets and liabilities does not represent the underlying fair value of ourtotal consolidated assets and liabilities.
CarryingValue
EstimatedFair Value
CarryingValue
EstimatedFair Value
2010 2009(2)As of December 31,
(Dollars in millions)
Financial assets:Cash and cash equivalents(1) . . . . . . . . . . . . . . . . . . . . . . . . . . . . . $ 80,975 $ 80,975 $ 9,882 $ 9,882Federal funds sold and securities purchased under agreements to
resell or similar arrangements . . . . . . . . . . . . . . . . . . . . . . . . . . 11,751 11,751 53,684 53,656Trading securities . . . . . . . . . . . . . . . . . . . . . . . . . . . . . . . . . . . . 56,856 56,856 111,939 111,939Available-for-sale securities . . . . . . . . . . . . . . . . . . . . . . . . . . . . . 94,392 94,392 237,728 237,728Mortgage loans held for sale . . . . . . . . . . . . . . . . . . . . . . . . . . . . 915 915 18,462 18,615Mortgage loans held for investment, net of allowance for loan
losses:Of Fannie Mae . . . . . . . . . . . . . . . . . . . . . . . . . . . . . . . . . . . . 358,698 319,367 246,509 241,300Of consolidated trusts . . . . . . . . . . . . . . . . . . . . . . . . . . . . . . . . 2,564,107 2,610,145 129,590 129,545
Mortgage loans held for investment . . . . . . . . . . . . . . . . . . . . . . . . 2,922,805 2,929,512 376,099 370,845Advances to lenders . . . . . . . . . . . . . . . . . . . . . . . . . . . . . . . . . . 7,215 6,990 5,449 5,144Derivative assets at fair value . . . . . . . . . . . . . . . . . . . . . . . . . . . . 1,137 1,137 1,474 1,474Guaranty assets and buy-ups. . . . . . . . . . . . . . . . . . . . . . . . . . . . . 458 814 9,520 14,624
Total financial assets . . . . . . . . . . . . . . . . . . . . . . . . . . . . . . . . . . $3,176,504 $3,183,342 $824,237 $823,907
Financial liabilities:Federal funds purchased and securities sold under agreements to
repurchase . . . . . . . . . . . . . . . . . . . . . . . . . . . . . . . . . . . . . . . $ 52 $ 51 $ — $ —Short-term debt:
Of Fannie Mae . . . . . . . . . . . . . . . . . . . . . . . . . . . . . . . . . . . . 151,884 151,974 200,437 200,493Of consolidated trusts . . . . . . . . . . . . . . . . . . . . . . . . . . . . . . . . 5,359 5,359 — —
Long-term debt:Of Fannie Mae . . . . . . . . . . . . . . . . . . . . . . . . . . . . . . . . . . . . 628,160 649,684 567,950 587,423Of consolidated trusts . . . . . . . . . . . . . . . . . . . . . . . . . . . . . . . . 2,411,597 2,514,929 6,167 6,310
Derivative liabilities at fair value . . . . . . . . . . . . . . . . . . . . . . . . . 1,715 1,715 1,029 1,029Guaranty obligations . . . . . . . . . . . . . . . . . . . . . . . . . . . . . . . . . . 769 3,854 13,996 138,582
Total financial liabilities . . . . . . . . . . . . . . . . . . . . . . . . . . . . . . . . $3,199,536 $3,327,566 $789,579 $933,837
(1) Includes restricted cash of $63.7 billion and $3.1 billion as of December 31, 2010 and 2009, respectively.(2) Certain prior period amounts have been reclassified to conform to the current period presentation.
F-132
FANNIE MAE(In conservatorship)
NOTES TO CONSOLIDATED FINANCIAL STATEMENTS—(Continued)

The following are valuation techniques for items not subject to the fair value hierarchy either because they arenot measured at fair value other than for the purpose of the above table or because they are only measured atfair value at inception.
Financial Instruments for which fair value approximates carrying value—We hold certain financial instrumentsthat are not carried at fair value but for which the carrying value approximates fair value due to the short-termnature and negligible credit risk inherent in them. These financial instruments include cash and cashequivalents, federal funds and securities sold/purchased under agreements to repurchase/resell (exclusive ofdollar roll repurchase transactions) and the majority of advances to lenders.
Advances to Lenders—The carrying value for the majority of our advances to lenders approximates the fairvalue due to the short-term nature of the specific instruments. Other instruments include loans for which thecarrying value does not approximate fair value. These loans are valued using collateral values of similar loansas a proxy.
Guaranty Obligations—The fair value of all guaranty obligations (“GO”), measured subsequent to their initialrecognition, is our estimate of a hypothetical transaction price we would receive if we were to issue ourguaranty to an unrelated party in a standalone arm’s-length transaction at the measurement date. We estimatethe fair value of the GO using our internal GO valuation models, which calculate the present value ofexpected cash flows based on management’s best estimate of certain key assumptions such as currentmark-to-market LTV ratios, future house prices, default rates, severity rates and required rate of return. Wefurther adjust the model values based on our current market pricing when such transactions reflect creditcharacteristics that are similar to our outstanding GO. While the fair value of the GO reflects all guarantyarrangements, the carrying value primarily reflects only those arrangements entered into subsequent to ouradoption of the accounting standard on guarantor’s accounting and disclosure requirements for guarantees.
Fair Value Option
We elected the fair value option for certain consolidated loans and debt instruments recorded in ourconsolidated balance sheets as a result of consolidating VIEs. These instruments contain embedded derivativesthat would otherwise require bifurcation. Under the fair value option, we elected to carry these instruments atfair value instead of bifurcating the embedded derivative from the respective loan or debt instrument.
We elected the fair value option for all long-term structured debt instruments that are issued in response tospecific investor demand and have interest rates that are based on a calculated index or formula and areeconomically hedged with derivatives at the time of issuance. By electing the fair value option for theseinstruments, we are able to eliminate the volatility in our results of operations that would otherwise resultfrom the accounting asymmetry created by recording these structured debt instruments at cost while recordingthe related derivatives at fair value.
We elected the fair value option for the financial assets and liabilities of the senior-subordinate trust structureswe consolidated as a result of adopting the new consolidation accounting standard on January 1, 2010. Byelecting the fair value option for these instruments, we are able to eliminate the volatility in our results ofoperations that would otherwise result from different accounting treatment between loans at cost and debt atcost.
Interest income for the mortgage loans is recorded in “Mortgage loans interest income” and interest expensefor the debt instruments is recorded in “Long-term debt interest expense” in our consolidated statements ofoperations.
The following table displays the fair value and unpaid principal balance of the financial instruments for whichwe have made fair value elections as of December 31, 2010 and 2009. For information about the related fair
F-133
FANNIE MAE(In conservatorship)
NOTES TO CONSOLIDATED FINANCIAL STATEMENTS—(Continued)

value gains and losses associated with these instruments, refer to “Note 1, Summary of Significant AccountingPolicies.”
Loans ofConsolidated
Trusts(1)
Long-TermDebt of
Fannie Mae
Long-TermDebt of
ConsolidatedTrusts(2)
Long-TermDebt of
Fannie Mae
2010 2009As of December 31,
(Dollars in millions)
Fair value . . . . . . . . . . . . . . . . . . . . . . . . . . . . . . . . . . . . . . . . . $2,962 $(893) $(2,271) $(3,274)
Unpaid principal balance . . . . . . . . . . . . . . . . . . . . . . . . . . . . . . . . 3,456 (829) (2,572) (3,181)
(1) Includes nonaccrual loans with a fair value of $219 million and loans that are 90 or more days past due with a fairvalue of $369 million as of December 31, 2010.
(2) Includes interest-only debt instruments with no unpaid principal balance and a fair value of $151 million as ofDecember 31, 2010.
Changes in Fair Value under the Fair Value Option Election
The following table displays fair value gains and losses, net, including changes attributable to instrument-specific credit risk, for loans and debt for which the fair value election was made. Amounts are recorded as acomponent of “Fair value gains and losses, net” in our consolidated statements of operations for the yearsended December 31, 2010, 2009 and 2008.
Loans
Long-TermDebt
TotalLosses
Long-TermDebt
TotalGains
(Losses)
Short-TermDebt
Long-TermDebt
TotalGains
(Losses)
2010 2009 2008For the Year Ended December 31,
(Dollars in millions)
Changes in instrument-specific credit risk . . . . . . . . . . . . . . . $ (58) $ (9) $ (67) $ 33 $ 33 $ 6 $ 94 $ 100
Other changes in fair value . . . . . . . . . . . . . . . . . . . . . . . . (73) 14 (59) (64) (64) (6) (151) (157)
Fair value gains (losses), net . . . . . . . . . . . . . . . . . . . . . . $(131) $ 5 $(126) $(31) $(31) $— $ (57) $ (57)
In determining the instrument-specific risk, the changes in Fannie Mae debt spreads to LIBOR that occurredduring the period were taken into consideration with the overall change in the fair value of the debt for whichwe elected the fair value option for financial instruments. Specifically, cash flows are evaluated taking intoconsideration any derivatives through which Fannie Mae has swapped out of the structured features of thenotes and thus created a floating-rate LIBOR-based debt instrument. The change in value of these LIBOR-based cash flows based on the Fannie Mae yield curve at the beginning and end of the period represents theinstrument-specific risk.
20. Commitments and Contingencies
We are party to various types of legal actions and proceedings, including actions brought on behalf of variousclasses of claimants. We also are subject to regulatory examinations, inquiries and investigations and otherinformation gathering requests. Litigation claims and proceedings of all types are subject to many uncertainfactors that generally cannot be predicted with assurance. The following describes our material legalproceedings, investigations and other matters.
For certain legal actions and proceedings we have established a reserve against probable losses where we canreasonably estimate such losses or ranges of losses; based on our current knowledge and after consultationwith counsel, we do not believe that such losses or ranges of losses will have a material adverse effect on our
F-134
FANNIE MAE(In conservatorship)
NOTES TO CONSOLIDATED FINANCIAL STATEMENTS—(Continued)

financial condition. We note, however, that in light of the uncertainties involved in such actions andproceedings, there is no assurance that the ultimate resolution of these matters will not significantly exceed thereserves we have currently accrued. For certain other legal actions or proceedings, we cannot reasonablyestimate such losses or ranges of losses, particularly for proceedings that are in their early stages ofdevelopment, where plaintiffs seek substantial or indeterminate damages, or where there may be novel orunsettled legal questions relevant to the proceedings. For these matters, we have not established a reserve.Given the uncertainties involved in any action or proceeding, regardless of whether we have established areserve, the ultimate resolution of any matter may be material to our operating results for a particular period,depending on, among other factors, the size of the loss or liability imposed and the level of our net income orloss for that period. Based on our current knowledge with respect to the lawsuits described below, we believewe have valid defenses to the claims in these lawsuits and intend to defend these lawsuits vigorouslyregardless of whether or not we have recorded a loss reserve.
In addition to the matters specifically described below, we are involved in a number of legal and regulatoryproceedings that arise in the ordinary course of business that we do not expect will have a material impact onour business. We have advanced fees and expenses of certain current and former officers and directors inconnection with various legal proceedings pursuant to indemnification agreements.
In re Fannie Mae Securities Litigation
Fannie Mae is a defendant in a consolidated class action lawsuit initially filed in 2004 and currently pendingin the U.S. District Court for the District of Columbia. In the consolidated complaint filed on March 4, 2005,lead plaintiffs Ohio Public Employees Retirement System and the State Teachers Retirement System of Ohioallege that we and certain former officers, as well as our former outside auditor, made materially false andmisleading statements in violation of Sections 10(b) and 20(a) of the Securities Exchange Act of 1934, andSEC Rule 10b-5 promulgated thereunder. Plaintiffs contend that Fannie Mae’s accounting statements wereinconsistent with GAAP requirements relating to hedge accounting and the amortization of premiums anddiscounts, and seek unspecified compensatory damages, attorneys’ fees, and other fees and costs. OnJanuary 7, 2008, the court defined the class as all purchasers of Fannie Mae common stock and call optionsand all sellers of publicly traded Fannie Mae put options during the period from April 17, 2001 throughDecember 22, 2004. On October 17, 2008, FHFA, as conservator for Fannie Mae, intervened in this case.
2008 Class Action Lawsuits
Fannie Mae is a defendant in two consolidated class actions filed in 2008 and currently pending in theU.S. District Court for the Southern District of New York—In re Fannie Mae 2008 Securities Litigation and Inre 2008 Fannie Mae ERISA Litigation. On February 11, 2009, the Judicial Panel on Multidistrict Litigationordered that the cases be coordinated for pretrial proceedings. On October 13, 2009, the Court entered anorder allowing FHFA to intervene in—In re Fannie Mae 2008 Securities Litigation.
In re Fannie Mae 2008 Securities Litigation
In a consolidated complaint filed on June 22, 2009, lead plaintiffs Massachusetts Pension Reserves InvestmentManagement Board and Boston Retirement Board (for common shareholders) and Tennessee ConsolidatedRetirement System (for preferred shareholders) allege that we, certain of our former officers, and certain ofour underwriters violated Sections 12(a)(2) and 15 of the Securities Act of 1933. Lead plaintiffs also allegethat we, certain of our former officers, and our outside auditor, violated Sections 10(b) (and Rule 10b-5promulgated thereunder) and 20(a) of the Securities Exchange Act of 1934. Lead plaintiffs purport to representa class of persons who, between November 8, 2006 and September 5, 2008, inclusive, purchased or acquired(a) Fannie Mae common stock and options or (b) Fannie Mae preferred stock. Lead plaintiffs seek various
F-135
FANNIE MAE(In conservatorship)
NOTES TO CONSOLIDATED FINANCIAL STATEMENTS—(Continued)

forms of relief, including rescission, damages, interest, costs, attorneys’ and experts’ fees, and other equitableand injunctive relief.
On November 24, 2009, the Court granted the defendants’ motion to dismiss the Securities Act claims as toall defendants. On September 30, 2010, the Court granted in part and denied in part the defendants’ motionsto dismiss the Securities Exchange Act claims. As a result of the partial denial, some of the SecuritiesExchange Act claims remain pending against us and certain of our former officers. On October 14, 2010, weand certain other defendants filed motions for reconsideration of those portions of the Court’s September 30,2010 order denying in part the defendants’ motions to dismiss. These motions are fully briefed and remainpending. Fannie Mae filed its answer to the consolidated complaint on December 31, 2010.
In re 2008 Fannie Mae ERISA Litigation
In a consolidated complaint filed on September 11, 2009, plaintiffs allege that certain of our current andformer officers and directors, including former members of Fannie Mae’s Benefit Plans Committee and theCompensation Committee of Fannie Mae’s Board of Directors, as fiduciaries of Fannie Mae’s Employee StockOwnership Plan (“ESOP”), breached their duties to ESOP participants and beneficiaries by investing ESOPfunds in Fannie Mae common stock when it was no longer prudent to continue to do so. Plaintiffs purport torepresent a class of participants and beneficiaries of the ESOP whose accounts invested in Fannie Maecommon stock beginning April 17, 2007. The plaintiffs seek unspecified damages, attorneys’ fees and otherfees and costs and injunctive and other equitable relief. On November 2, 2009, defendants filed motions todismiss these claims, which are now fully briefed and remain pending.
Comprehensive Investment Services v. Mudd, et al.
On May 13, 2009, Comprehensive Investment Services, Inc. filed an individual securities action against certainof our former officers and directors, and certain of our underwriters in the Southern District of Texas. Plaintiffalleges violations of Section 12(a)(2) of the Securities Act of 1933; violation of § 10(b) of the SecuritiesExchange Act of 1934 and Rule 10b-5 promulgated thereunder; violation of § 20(a) of the SecuritiesExchange Act of 1934; and violations of the Texas Business and Commerce Code, common law fraud, andnegligent misrepresentation in connection with Fannie Mae’s May 2008 $2.0 billion offering of 8.25% non-cumulative preferred Series T stock. The complaint seeks various forms of relief, including rescission,damages, interest, costs, attorneys’ and experts’ fees, and other equitable and injunctive relief. On July 7,2009, this case was transferred to the Southern District of New York for coordination with In re Fannie Mae2008 Securities Litigation and In re 2008 Fannie Mae ERISA Litigation.
Smith v. Fannie Mae, et al.
On February 25, 2010, plaintiff Edward Smith filed an individual complaint against Fannie Mae and certain ofits former officers as well as several underwriters in the U.S. District Court for the Southern District ofCalifornia. Plaintiff alleges violation of § 10(b) of the Securities Exchange Act of 1934 and Rule 10b-5promulgated thereunder; violation of § 20(a) of the Securities Exchange Act of 1934; common law fraud andnegligence claims in connection with Fannie Mae’s December 2007 $7.0 billion offering of 7.75%fixed-to-floating rate non-cumulative preferred Series S stock. Plaintiff seeks relief in the form of rescission,actual damages (including interest), and exemplary and punitive damages. On March 26, 2010, this case wastransferred to the Southern District of New York for coordination with In re Fannie Mae 2008 SecuritiesLitigation.
F-136
FANNIE MAE(In conservatorship)
NOTES TO CONSOLIDATED FINANCIAL STATEMENTS—(Continued)

Investigation by the Securities and Exchange Commission
On September 26, 2008, we received notice of an ongoing investigation into Fannie Mae by the SECregarding certain accounting and disclosure matters. On January 8, 2009, the SEC issued a formal order ofinvestigation. We are cooperating with this investigation.
Investigation by the Department of Justice
On September 26, 2008, we received notice of an ongoing federal investigation by the U.S. Attorney for theSouthern District of New York into certain accounting, disclosure and corporate governance matters. Inconnection with that investigation, Fannie Mae received a Grand Jury subpoena for documents. That subpoenawas subsequently withdrawn. However, we were informed that the Department of Justice was continuing aninvestigation and on March 15, 2010, we received another Grand Jury subpoena for documents. We arecooperating with this investigation.
Escrow Litigation
Casa Orlando Apartments, Ltd., et al. v. Federal National Mortgage Association (formerly known as MedlockSouthwest Management Corp., et al. v. Federal National Mortgage Association)
A complaint was filed against us in the U.S. District Court for the Eastern District of Texas (TexarkanaDivision) on June 2, 2004, in which plaintiffs purport to represent a class of multifamily borrowers whosemortgages are insured under Sections 221(d)(3), 236 and other sections of the National Housing Act and areheld or serviced by us. The complaint identified as a proposed class low- and moderate-income apartmentbuilding developers who maintained uninvested escrow accounts with us or our servicer. Plaintiffs CasaOrlando Apartments, Ltd., Jasper Housing Development Company and the Porkolab Family Trust No. 1 allegethat we violated fiduciary obligations that they contend we owed to borrowers with respect to certain escrowaccounts and that we were unjustly enriched. In particular, plaintiffs contend that, starting in 1969, we misusedthese escrow funds and are therefore liable for any economic benefit we received from the use of these funds.The plaintiffs seek a return of any profits, with accrued interest, earned by us related to the escrow accounts atissue, as well as attorneys’ fees and costs. Our motions to dismiss and for summary judgment with respect tothe statute of limitations were denied. Plaintiffs filed an amended complaint on December 16, 2005. OnJuly 13, 2009, the Court denied plaintiffs’ motion for class certification. On October 14, 2010, the U.S. Courtof Appeals for the Fifth Circuit affirmed the District Court’s denial of class certification.
Unconditional Purchase and Lease Commitments
We have unconditional commitments related to the purchase of loans and mortgage-related securities. Theseinclude both on- and off-balance sheet commitments wherein a portion of these have been recorded asderivatives in our consolidated balance sheets. Unfunded lending represents off-balance sheet commitments forthe unutilized portion of lending agreements entered into with multifamily borrowers.
We lease certain premises and equipment under agreements that expire at various dates through 2029. Some ofthese leases provide for payment by the lessee of property taxes, insurance premiums, cost of maintenance andother costs. Rental expenses for operating leases were $35 million, $62 million and $50 million for the yearsended December 31, 2010, 2009 and 2008, respectively.
F-137
FANNIE MAE(In conservatorship)
NOTES TO CONSOLIDATED FINANCIAL STATEMENTS—(Continued)

The following table summarizes by remaining maturity, non cancelable future commitments related to loanand mortgage purchases, unfunded lending, operating leases, and other agreements as of December 31, 2010.
Loans and Mortgage-Related Securities(1) Unfunded Lending Operating Leases Other(2)
As of December 31, 2010
(Dollars in millions)
2011 . . . . . . . . . . . . . . . . . . . . . . . . . . . . . . . . . . $54,837 $ 72 $ 40 $34
2012 . . . . . . . . . . . . . . . . . . . . . . . . . . . . . . . . . . 10 92 36 19
2013 . . . . . . . . . . . . . . . . . . . . . . . . . . . . . . . . . . 11 42 25 10
2014 . . . . . . . . . . . . . . . . . . . . . . . . . . . . . . . . . . — — 17 2
2015 . . . . . . . . . . . . . . . . . . . . . . . . . . . . . . . . . . — 3 14 —
Thereafter . . . . . . . . . . . . . . . . . . . . . . . . . . . . . . — — 26 —
Total . . . . . . . . . . . . . . . . . . . . . . . . . . . . . . . . $54,858 $209 $158 $65
(1) Includes $54.5 billion, which have been accounted for as mortgage commitment derivatives.
(2) Includes purchase commitments for certain telecom services, computer software and services, and other agreements.
21. Selected Quarterly Financial Information (Unaudited)
The condensed consolidated statements of operations for the quarterly periods in 2010 and 2009 are unauditedand in the opinion of management include all adjustments, consisting of normal recurring adjustments,necessary for a fair presentation of our condensed consolidated statements of operations. The operating resultsfor the interim periods are not necessarily indicative of the operating results to be expected for a full year orfor other interim periods.
F-138
FANNIE MAE(In conservatorship)
NOTES TO CONSOLIDATED FINANCIAL STATEMENTS—(Continued)

March 31 June 30(1) September 30 December 31(2)
For the 2010 Quarter Ended
(Dollars and shares in millions, except per share amounts)
Interest income: . . . . . . . . . . . . . . . . . . . . . . . . . . . . . . . . . . . . . . .Trading securities . . . . . . . . . . . . . . . . . . . . . . . . . . . . . . . . . . . . $ 315 $ 330 $ 310 $ 296Available-for-sale securities . . . . . . . . . . . . . . . . . . . . . . . . . . . . . . 1,473 1,389 1,313 1,115Mortgage loans:
Of Fannie Mae . . . . . . . . . . . . . . . . . . . . . . . . . . . . . . . . . . . . 3,298 3,950 3,859 3,885Of consolidated trusts . . . . . . . . . . . . . . . . . . . . . . . . . . . . . . . . 34,321 33,682 32,807 31,781
Other . . . . . . . . . . . . . . . . . . . . . . . . . . . . . . . . . . . . . . . . . . . . 39 41 31 35Total interest income . . . . . . . . . . . . . . . . . . . . . . . . . . . . . . . 39,446 39,392 38,320 37,112
Interest expense:Short-term debt:
Of Fannie Mae . . . . . . . . . . . . . . . . . . . . . . . . . . . . . . . . . . . . 116 164 190 149Of consolidated trusts . . . . . . . . . . . . . . . . . . . . . . . . . . . . . . . . 2 3 4 3
Long-term debt:Of Fannie Mae . . . . . . . . . . . . . . . . . . . . . . . . . . . . . . . . . . . . 5,081 4,975 4,472 4,329Of consolidated trusts . . . . . . . . . . . . . . . . . . . . . . . . . . . . . . . . 31,458 30,043 28,878 27,994
Total interest expense . . . . . . . . . . . . . . . . . . . . . . . . . . . . . . 36,657 35,185 33,544 32,475Net interest income. . . . . . . . . . . . . . . . . . . . . . . . . . . . . . . . . . . . . 2,789 4,207 4,776 4,637Provision for loan losses . . . . . . . . . . . . . . . . . . . . . . . . . . . . . . . . . (11,939) (4,295) (4,696) (3,772)Net interest income (loss) after provision for loan losses . . . . . . . . . . . . (9,150) (88) 80 865Guaranty fee income . . . . . . . . . . . . . . . . . . . . . . . . . . . . . . . . . . . . 54 52 51 45Investment gains, net . . . . . . . . . . . . . . . . . . . . . . . . . . . . . . . . . . . 166 23 82 75Other-than-temporary impairments . . . . . . . . . . . . . . . . . . . . . . . . . . . (186) (48) (366) (94)Noncredit portion of other-than-temporary impairments recognized in
other comprehensive loss . . . . . . . . . . . . . . . . . . . . . . . . . . . . . . . (50) (89) 40 71Net other-than-temporary impairments . . . . . . . . . . . . . . . . . . . . . . . . (236) (137) (326) (23)Fair value gains (losses), net . . . . . . . . . . . . . . . . . . . . . . . . . . . . . . . (1,705) 303 525 366Debt extinguishment losses, net . . . . . . . . . . . . . . . . . . . . . . . . . . . . . (124) (159) (214) (71)Income (losses) from partnership investments. . . . . . . . . . . . . . . . . . . . (58) (26) 47 (37)Fee and other income . . . . . . . . . . . . . . . . . . . . . . . . . . . . . . . . . . . 179 242 253 208
Non-interest income (loss) . . . . . . . . . . . . . . . . . . . . . . . . . . . . . . (1,724) 298 418 563Administrative expenses: . . . . . . . . . . . . . . . . . . . . . . . . . . . . . . . . .
Salaries and employee benefits . . . . . . . . . . . . . . . . . . . . . . . . . . . 324 324 325 304Professional services . . . . . . . . . . . . . . . . . . . . . . . . . . . . . . . . . . 194 260 305 183Occupancy expenses . . . . . . . . . . . . . . . . . . . . . . . . . . . . . . . . . . 41 40 43 46Other administrative expenses . . . . . . . . . . . . . . . . . . . . . . . . . . . . 46 46 57 59
Total administrative expenses . . . . . . . . . . . . . . . . . . . . . . . . . . . 605 670 730 592Provision (benefit) for guaranty losses . . . . . . . . . . . . . . . . . . . . . . . . (36) 69 78 83Foreclosed property expense (income) . . . . . . . . . . . . . . . . . . . . . . . . (19) 487 787 463Other expenses . . . . . . . . . . . . . . . . . . . . . . . . . . . . . . . . . . . . . . . 172 198 243 240
Total expenses . . . . . . . . . . . . . . . . . . . . . . . . . . . . . . . . . . . . . . 722 1,424 1,838 1,378Income (loss) before federal income taxes . . . . . . . . . . . . . . . . . . . . . . (11,596) (1,214) (1,340) 50Provision (benefit) for federal income taxes . . . . . . . . . . . . . . . . . . . . . (67) 9 (9) (15)Net income (loss) . . . . . . . . . . . . . . . . . . . . . . . . . . . . . . . . . . . . . . (11,529) (1,223) (1,331) 65
Less: Net (income) loss attributable to the noncontrolling interest . . . . . (1) 5 (8) 8Net income (loss) attributable to Fannie Mae . . . . . . . . . . . . . . . . . . . . (11,530) (1,218) (1,339) 73Preferred stock dividends . . . . . . . . . . . . . . . . . . . . . . . . . . . . . . . . . (1,527) (1,907) (2,116) (2,154)Net loss attributable to common stockholders . . . . . . . . . . . . . . . . . . . . $(13,057) $ (3,125) $ (3,455) $ (2,081)
Loss per share—Basic and Diluted . . . . . . . . . . . . . . . . . . . . . . . . . . $ (2.29) $ (0.55) $ (0.61) $ (0.37)Weighted-average common shares outstanding—Basic and Diluted. . . . . . 5,692 5,694 5,695 5,696
(1) Includes out-of-period adjustment of $1.1 billion to provision for loan losses, reflecting our assessment of thecollectibility of the receivable from the borrowers for preforeclosure property taxes and insurance.
(2) Includes settlement from Bank of America Inc. related to repurchase requests for residential mortgage loans of$1.3 billion.
F-139
FANNIE MAE(In conservatorship)
NOTES TO CONSOLIDATED FINANCIAL STATEMENTS—(Continued)

March 31 June 30 September 30 December 31For the 2009 Quarter Ended
(Dollars and shares in millions, except per share amounts)
Interest income:Trading securities . . . . . . . . . . . . . . . . . . . . . . . . . . . . . . . . $ 990 $ 923 $ 862 $ 1,084Available-for-sale securities . . . . . . . . . . . . . . . . . . . . . . . . . 3,721 3,307 3,475 3,115Mortgage loans:
Of Fannie Mae . . . . . . . . . . . . . . . . . . . . . . . . . . . . . . . . 4,707 4,392 3,229 3,050Of consolidated trusts . . . . . . . . . . . . . . . . . . . . . . . . . . . 891 1,219 2,061 1,972
Other . . . . . . . . . . . . . . . . . . . . . . . . . . . . . . . . . . . . . . . . 127 139 48 43Total interest income . . . . . . . . . . . . . . . . . . . . . . . . . . 10,436 9,980 9,675 9,264
Interest expense:Short-term debt:
Of Fannie Mae . . . . . . . . . . . . . . . . . . . . . . . . . . . . . . . . 1,107 600 390 209Long-term debt:
Of Fannie Mae . . . . . . . . . . . . . . . . . . . . . . . . . . . . . . . . 5,992 5,560 5,370 5,273Of consolidated trusts . . . . . . . . . . . . . . . . . . . . . . . . . . . 89 85 85 85
Total interest expense . . . . . . . . . . . . . . . . . . . . . . . . . 7,188 6,245 5,845 5,567Net interest income . . . . . . . . . . . . . . . . . . . . . . . . . . . . . . . . 3,248 3,735 3,830 3,697Provision for loan losses . . . . . . . . . . . . . . . . . . . . . . . . . . . . (2,509) (2,615) (2,546) (1,899)Net interest income after provision for loan losses . . . . . . . . . . . 739 1,120 1,284 1,798Guaranty fee income . . . . . . . . . . . . . . . . . . . . . . . . . . . . . . . 1,752 1,659 1,923 1,877Investment gains (losses), net . . . . . . . . . . . . . . . . . . . . . . . . . 223 (45) 785 495Other-than-temporary impairments . . . . . . . . . . . . . . . . . . . . . (5,653) (1,097) (1,018) (1,289)Noncredit portion of other-than-temporary impairments
recognized in other comprehensive loss . . . . . . . . . . . . . . . . — 344 79 (1,227)Net other-than-temporary impairments . . . . . . . . . . . . . . . . . . . (5,653) (753) (939) (2,516)Fair value gains (losses), net . . . . . . . . . . . . . . . . . . . . . . . . . . (1,460) 823 (1,536) (638)Debt extinguishment losses, net. . . . . . . . . . . . . . . . . . . . . . . . (79) (190) (11) (45)Losses from partnership investments . . . . . . . . . . . . . . . . . . . . (357) (571) (520) (5,287)Fee and other income. . . . . . . . . . . . . . . . . . . . . . . . . . . . . . . 192 197 194 190
Non-interest income (loss) . . . . . . . . . . . . . . . . . . . . . . . . . (5,382) 1,120 (104) (5,924)Administrative expenses:
Salaries and employee benefits . . . . . . . . . . . . . . . . . . . . . . 293 245 293 302Professional services . . . . . . . . . . . . . . . . . . . . . . . . . . . . . 143 180 178 183Occupancy expenses. . . . . . . . . . . . . . . . . . . . . . . . . . . . . . 48 46 47 64Other administrative expenses . . . . . . . . . . . . . . . . . . . . . . . 39 39 44 63
Total administrative expenses . . . . . . . . . . . . . . . . . . . . 523 510 562 612Provision for guaranty losses . . . . . . . . . . . . . . . . . . . . . . . . . 17,825 15,610 19,350 10,272Foreclosed property expense (income) . . . . . . . . . . . . . . . . . . . 538 559 64 (251)Other expenses . . . . . . . . . . . . . . . . . . . . . . . . . . . . . . . . . . . 279 318 231 656
Total expenses . . . . . . . . . . . . . . . . . . . . . . . . . . . . . . 19,165 16,997 20,207 11,289Loss before federal income taxes and extraordinary losses . . . . . (23,808) (14,757) (19,027) (15,415)Provision (benefit) for federal income taxes . . . . . . . . . . . . . . . (623) 23 (143) (242)Net loss . . . . . . . . . . . . . . . . . . . . . . . . . . . . . . . . . . . . . . . . (23,185) (14,780) (18,884) (15,173)
Less: Net (income) loss attributable to the noncontrollinginterest . . . . . . . . . . . . . . . . . . . . . . . . . . . . . . . . . . . . . 17 26 12 (2)
Net loss attributable to Fannie Mae . . . . . . . . . . . . . . . . . . . . . (23,168) (14,754) (18,872) (15,175)Preferred stock dividends . . . . . . . . . . . . . . . . . . . . . . . . . . . . (29) (411) (883) (1,151)Net loss attributable to common stockholders . . . . . . . . . . . . . . $(23,197) $(15,165) $(19,755) $(16,326)
Loss per share—Basic and Diluted . . . . . . . . . . . . . . . . . . . . . $ (4.09) $ (2.67) $ (3.47) $ (2.87)Weighted-average common shares outstanding—Basic and
Diluted . . . . . . . . . . . . . . . . . . . . . . . . . . . . . . . . . . . . . . . 5,666 5,681 5,685 5,687
F-140
FANNIE MAE(In conservatorship)
NOTES TO CONSOLIDATED FINANCIAL STATEMENTS—(Continued)

Exhibit 31.1
CERTIFICATION
PURSUANT TO SECURITIES EXCHANGE ACT RULE 13a-14(a)
I, Michael J. Williams, certify that:
1. I have reviewed this Annual Report on Form 10-K for the year ended December 31, 2010 of Fannie Mae(formally, the Federal National Mortgage Association);
2. Based on my knowledge, this report does not contain any untrue statement of a material fact or omit tostate a material fact necessary to make the statements made, in light of the circumstances under which suchstatements were made, not misleading with respect to the period covered by this report;
3. Based on my knowledge, the financial statements, and other financial information included in this report,fairly present in all material respects the financial condition, results of operations and cash flows of theregistrant as of, and for, the periods presented in this report;
4. The registrant’s other certifying officer(s) and I are responsible for establishing and maintaining disclosurecontrols and procedures (as defined in Exchange Act Rules 13a-15(e) and 15d-15(e)) and internal controlover financial reporting (as defined in Exchange Act Rules 13a-15(f) and 15d-15(f)) for the registrant andhave:
a. Designed such disclosure controls and procedures, or caused such disclosure controls andprocedures to be designed under our supervision, to ensure that material information relating to theregistrant, including its consolidated subsidiaries, is made known to us by others within those entities,particularly during the period in which this report is being prepared;
b. Designed such internal control over financial reporting, or caused such internal control overfinancial reporting to be designed under our supervision, to provide reasonable assurance regarding thereliability of financial reporting and the preparation of financial statements for external purposes inaccordance with generally accepted accounting principles;
c. Evaluated the effectiveness of the registrant’s disclosure controls and procedures and presented inthis report our conclusions about the effectiveness of the disclosure controls and procedures, as of the endof the period covered by this report based on such evaluation; and
d. Disclosed in this report any change in the registrant’s internal control over financial reporting thatoccurred during the registrant’s most recent fiscal quarter (the registrant’s fourth fiscal quarter in the caseof an annual report) that has materially affected, or is reasonably likely to materially affect, theregistrant’s internal control over financial reporting; and
5. The registrant’s other certifying officer(s) and I have disclosed, based on our most recent evaluation ofinternal control over financial reporting, to the registrant’s auditors and the audit committee of theregistrant’s board of directors (or persons performing the equivalent functions):
a. All significant deficiencies and material weaknesses in the design or operation of internal controlover financial reporting which are reasonably likely to adversely affect the registrant’s ability to record,process, summarize and report financial information; and
b. Any fraud, whether or not material, that involves management or other employees who have asignificant role in the registrant’s internal control over financial reporting.
Date: February 24, 2011
/s/ Michael J. Williams
Michael J. WilliamsPresident and Chief Executive Officer

Exhibit 31.2
CERTIFICATION
PURSUANT TO SECURITIES EXCHANGE ACT RULE 13a-14(a)
I, David C. Hisey, certify that:
1. I have reviewed this Annual Report on Form 10-K for the year ended December 31, 2010 of Fannie Mae(formally, the Federal National Mortgage Association);
2. Based on my knowledge, this report does not contain any untrue statement of a material fact or omit tostate a material fact necessary to make the statements made, in light of the circumstances under which suchstatements were made, not misleading with respect to the period covered by this report;
3. Based on my knowledge, the financial statements, and other financial information included in this report,fairly present in all material respects the financial condition, results of operations and cash flows of theregistrant as of, and for, the periods presented in this report;
4. The registrant’s other certifying officer(s) and I are responsible for establishing and maintaining disclosurecontrols and procedures (as defined in Exchange Act Rules 13a-15(e) and 15d-15(e)) and internal controlover financial reporting (as defined in Exchange Act Rules 13a-15(f) and 15d-15(f)) for the registrant andhave:
a. Designed such disclosure controls and procedures, or caused such disclosure controls andprocedures to be designed under our supervision, to ensure that material information relating to theregistrant, including its consolidated subsidiaries, is made known to us by others within those entities,particularly during the period in which this report is being prepared;
b. Designed such internal control over financial reporting, or caused such internal control overfinancial reporting to be designed under our supervision, to provide reasonable assurance regarding thereliability of financial reporting and the preparation of financial statements for external purposes inaccordance with generally accepted accounting principles;
c. Evaluated the effectiveness of the registrant’s disclosure controls and procedures and presented inthis report our conclusions about the effectiveness of the disclosure controls and procedures, as of the endof the period covered by this report based on such evaluation; and
d. Disclosed in this report any change in the registrant’s internal control over financial reporting thatoccurred during the registrant’s most recent fiscal quarter (the registrant’s fourth fiscal quarter in the caseof an annual report) that has materially affected, or is reasonably likely to materially affect, theregistrant’s internal control over financial reporting; and
5. The registrant’s other certifying officer(s) and I have disclosed, based on our most recent evaluation ofinternal control over financial reporting, to the registrant’s auditors and the audit committee of theregistrant’s board of directors (or persons performing the equivalent functions):
a. All significant deficiencies and material weaknesses in the design or operation of internal controlover financial reporting which are reasonably likely to adversely affect the registrant’s ability to record,process, summarize and report financial information; and
b. Any fraud, whether or not material, that involves management or other employees who have asignificant role in the registrant’s internal control over financial reporting.
Date: February 24, 2011
/s/ David C. Hisey
David C. HiseyExecutive Vice President andDeputy Chief Financial Officer

Exhibit 32.1
CERTIFICATION
In connection with the Annual Report on Form 10-K of Fannie Mae (formally, the Federal National MortgageAssociation) for the year ended December 31, 2010, as filed with the Securities and Exchange Commission onthe date hereof (the “Report”), I, Michael J. Williams, President and Chief Executive Officer of Fannie Mae,certify, pursuant to 18 U.S.C. Section 1350 that to my knowledge:
1. The Report fully complies with the requirements of Section 13(a) or 15(d), as applicable, of the SecuritiesExchange Act of 1934; and
2. The information contained in the Report fairly presents, in all material respects, the financial condition andresults of operations of Fannie Mae.
/s/ Michael J. Williams
Michael J. WilliamsPresident and Chief Executive Officer
Dated: February 24, 2011
The foregoing certification is being furnished solely pursuant to 18 U.S.C. Section 1350 and is not being filedas part of the Report or as a separate disclosure document.

Exhibit 32.2
CERTIFICATION
In connection with the Annual Report on Form 10-K of Fannie Mae (formally, the Federal National MortgageAssociation) for the year ended December 31, 2010, as filed with the Securities and Exchange Commission onthe date hereof (the “Report”), I, David C. Hisey, Executive Vice President and Deputy Chief Financial Officerof Fannie Mae, certify, pursuant to 18 U.S.C. Section 1350, that to my knowledge:
1. The Report fully complies with the requirements of Section 13(a) or 15(d), as applicable, of the SecuritiesExchange Act of 1934; and
2. The information contained in the Report fairly presents, in all material respects, the financial condition andresults of operations of Fannie Mae.
/s/ David C. Hisey
David C. HiseyExecutive Vice President andDeputy Chief Financial Officer
Dated: February 24, 2011
The foregoing certification is being furnished solely pursuant to 18 U.S.C. Section 1350 and is not being filedas part of the Report or as a separate disclosure document.

FR005