Commercial Bus Services in Ireland – 2016 Statistics · • Commercial Fleet Age Commercial Bus...
24
Statistical Bulletin Number: 03/2017 August 2017 Bulletin Topics: Overview of Commercial Bus Services • Number of Operators and Licences • Total Number of Passenger Journeys • Scheduled Vehicle Kilometres • Commercial Services Revenue and Ticketing • Free Travel Scheme Revenue and Passenger Journeys • Commercial Operator Fleet Size • Commercial Operating Fleet Accessibility and Scheduled Kilometres Operated by Accessible Vehicles • Automated Vehicle Location (AVL) Systems • Commercial Fleet Age Commercial Bus Services in Ireland (2016 statistics)
Transcript of Commercial Bus Services in Ireland – 2016 Statistics · • Commercial Fleet Age Commercial Bus...

Commercial Bus Statistics for Ireland | 1
Statistical Bulletin Number: 03/2017August 2017
Bulletin Topics:
Overview of Commercial Bus Services
•NumberofOperatorsand Licences
•TotalNumberofPassengerJourneys
•ScheduledVehicleKilometres
•CommercialServicesRevenueandTicketing
•FreeTravelSchemeRevenueandPassengerJourneys
•CommercialOperatorFleetSize
•CommercialOperatingFleetAccessibilityandScheduledKilometresOperatedbyAccessibleVehicles
•AutomatedVehicleLocation(AVL) Systems
•CommercialFleetAge
Commercial Bus Services in Ireland(2016 statistics)

2 | Commercial Bus Statistics for Ireland
Introduction ThisstatisticalbulletinisapublicationoftheNationalTransportAuthorityofIreland(“the Authority”).Itfocuseson bus statistics for licensed public bus passenger services operating to a regularschedulein Ireland.Licensedpublicbuspassengerservicesareoftencalled“commercial” bus services because they are operatedwithoutanypublicsubsidyfromthe Authority.Manyofthe services, however,receiveFreeTravelpaymentsfromthe Department of Social Protection in compensationfor the revenue foregone fromcarrying those entitledtoFree Travel.
These bus services are individually licensed bythe Authority. Under section 73 (Information, dataand statistics) of the Dublin Transport AuthorityAct 2008,amendedbysection75 oftheTaxiRegulationAct 2013,theAuthorityisrequiredto“collect, compile,analyse and prepare information, data or statistics”regardingpublictransportservicesin Ireland.
The bus services covered by this bulletin includeany licensed regular bus service with an origin,intermediate point, or adestinationwithin Ireland (i.e.essentially any service travelling through any part ofthe State).Busservicessubjecttoanauthorisationthataretravelling to,fromorthroughNorthernIrelandandthen into this State are also included in the bulletin.The licensed and authorised services in this bulletinare collectively refered to as regular commercial busservices.
Referencestocommercialbusservicesthereforeincludelicensed services operating wholly within the StateandbusserviceswhichcrosstheborderintoNorthernIrelandandaresubjecttoanauthorisation.
The Authority did not include information on certaincategories of licences such as Event or Venue licences,Temporary services, Demand Responsive services orSpecificTargetedservices(suchas tours,socialclub events,et cetera)becauseoftheadhocandirregularnatureofthesemainlyancillary services.
The data in this bulletin covers statistical informationfor all operators providing regular commercial services acrosstheStatefortheyears2013 to2016 andtheGreaterDublinArea(the“GDA”)1fortheyears2012 to2016 forcomparative purposes.HighlevelinformationonPublicServiceObligation(“PSO”) services,whicharesubsidisedservicesprovidedundercontract tothe Authority,hasalsobeenincludedforcomparative purposes.
Thiswillbethefourthyearthatdatahasbeenprovidedbyalllicensedoperatorsrunningserviceswithan origin,intermediate point, or destination in the State. ForoperatorswhohaveserviceswithintheGDAthiswillbe
1 TheGreaterDublinAreacomprisesthecityofDublinandthecountycouncilareasofSouth Dublin, Fingal,Dún Laoghaire-Rathdown, Kildare,WicklowandMeath
the fifth year that they have supplied data. Followingcomparisonofthedatasome figures,previously provided,havebeenrevisedby operators.Thedataexpressedinthisbulletinutilisesthemostuptodateinformationandsupercedestheprevious years’ bulletins.
Please note that the references to services as‘GDA Services’ refers to any service traveling to, fromor throughanyof theGDAcountiesof Dublin, Meath,Wicklow or Kildare. This includes services that travelwholly within the GDA as well as services that traveloutsidetheGDAcountiesbutwhichprovideevenpartof the service within the GDA. GDA Services includelicensedandauthorised services.
The services travelling wholly outside of the GDAcounties are referred to as ‘Non-GDA Services’ and,‘Nationally’referstothecombinedtotalofGDAandNon-GDAServicesrunning to,fromorthroughthe State,andthesearethemeaningsassignedtothemthroughoutthedocumentunlessotherwise stated.Againtheseservicesincludelicensedandauthorised services.
Readers should be aware that the two principalcontracted State funded bus operators, Bus Éireannand Dublin Bus, also provide licensed commercialbus services.TheseincludetheBusÉireannExpresswayServices and the Dublin Bus Airlink services and so,when relevant,theirlicensedfiguresareincludedinthelicensedcommercialbusservices data.
TheAuthorityhasproducedaseparatebulletinonStatefunded services covering bus services provided byDublin Bus, Bus Éireann, M&ACoaches Ltd,AndrewWhartonCoach Hire,BernardKavanagh&SonsLtdandthe Rural Transport Programme, as well State fundedrailservicesprovidedbyIarnródÉireannandLightRailservices provided by Transdev. This can be found onthe Authority’swebsite www.nationaltransport.ieundertheheadingPublications& Statistics.
Statistical Qualification - it is important to note thatthe figures used in this bulletin are provided by the operators and are intended to illustrate general features for licensed commercial public bus passenger services including patronage, passenger revenues and thecharacteristicsofthefleetandtheyarenotmeanttobereadasprecise calculations.Roundinghasbeingusedandthiscouldaffectoverall percentages.Itshouldalsobe noted that some figures from previous years havebeenrevisedbytheoperatorsthis year.Thishasbeenreflectedinthefiguresstatedinthis bulletin.
In publishing data theAuthority has been fully awareof its obligations regarding commercially sensitiveinformationandhas thereforeensured thatpatronageand revenues have been presented in a consolidatedandanonymised fashion.
AcknowledgementTheAuthoritywould like toextend itsappreciation tothe licensedandauthorisedcommercialbusoperatorsfor their co-operation and assistance in contributingto this bulletin.A 100% return was achieved from alloperators with active licences for every year save for2014 wherea 99%returnwas achieved.

Commercial Bus Statistics for Ireland | 3
Total Ticket Revenue
2016 Figures for Licensed Regular Bus Services
Total Scheduled Vehicle Kilometres
Total Passenger Journeys
22.74million
25.24million
11%
2015 2016
143.19million
155.62million
9%
2015 2016
86.28million
92.08million
7%
2015 2016

Table of Contents
Introduction 2
Overview Of Commercial Bus Services 5
1. Number Of Operators And Licences 6
2. Total Number Of Passenger Journeys 9
3. Scheduled Vehicle Kilometres 12
4. Commercial Bus Services Revenue And Ticketing 14
5. Free Travel Passenger Journeys 16
6. Commercial Operator Fleet Size 18
7. Commercial Operating Fleet Accessibility And Scheduled Kilometres
Operated By Accessible Vehicles 19
8. Automated Vehicle Location (AVL) Systems 22
9. Commercial Fleet Age 23
4 | Commercial Bus Statistics for Ireland
Commercial BusStatisticsforIreland|5
Overview of Commercial Bus Services
Thecommercialpublicbuspassengersectorforregularpassengerserviceshasseensignificantgrowthoverthefouryearsforwhichdatahasbeen collected.Theamountof passenger journeys made on these commercialserviceshasincreasedbyoveraquartersince2013 andin2016 representedjustunder 10%ofallpublictransportjourneys intheState2.Thevehiclekilometresprovidedbythesectorisalwaysahighratioofallpublictransport
2 ExcludingSchoolsservicesandTaxi journeys.
vehiclekilometresprovidedduetothelargevariationinservicetypesincludinghighfrequencyurbanservicestothelongdistance intercity,commuterandrural services.The vehicle kilometres operated have increased 15%since2013 andrepresented 45%ofallvehiclekilometrestravelled by public transport including rail and busservicesin 2016.
In2016 15%oftheoperatorsaccountedfor 90%ofallthecommercialpassengerjourneys made.
Table A: Overview of Commercial Bus Passenger Services Sector (millions)
Year AllPassengerJourneys
EstimatedFreeTravelPassengers
ScheduledKilometres
FreeTravelSchemePayments
AllRevenue (Ticket&
Free Travel)
2013 20.1 4.79 80.1 €20.06 €135.94
2016 25.24 5.29 92.08 €20.49 €176.11
Change 2013-2016
26% 10% 15% 2% 30%
1
Number of Operators andLicences
Itisimportanttohighlightthatthereisalargevariabilityinthe scale,frequencyandtypeofservicesprovidedby operators.Operatorsprovide diverse services including largescale inter-cityandinterurbanservicesthatprovideconnectionstoandfromthe country’smain towns,citiesand airports;commuterservicesthatbringpassengerstoandfromemploymentand education;urbanandsuburban services;aswellasruralservicesthatgenerallylinksmall towns,villagesandrural areas.Thefrequencyofservicescanvaryfrommonthlyservicestoseveralservicesper hour.There were 122 operators in 2016 actively providingregularpublicbuspassengerservicesonanational basis.The total number of operators is down slightly onprevious years’ figureof 126 operators. (SeeTable 1A).In a number of instances, where operators left themarket in 2016, the licenceswere transferred tootherexisting operators.
Therewere4 newentrants3 to theregularcommercialbuspassengerservicesmarketin2016.
The 122 operators held a total of 3444 licences and authorisationstoprovideregularpublicbuspassenger
3 New entrants include instances where licences weretransferred from sole traders to limited companies and from existing operators to sub-contractors, as well as operatorsentering the regular service market who were not in themarket in the previous year or were previously active inthe non-regularbuspassengerservices market, suchas thetouristmarketorprivatehire market.
4 WhereaLicenceandAuthorisationareoperatedinconjunctionwitheachotherthishasbeencountedasone service.
serviceswithin the State.Therewere235 new regular service licences granted in 2016, ofwhich 12 were forNon-GDAServices.Of the 23 new licencesgranted 17commencedin2016 andareaccountedforwithinthis bulletin. This is down from 35 new regular licencesgrantedin2015,33ofwhichcommencedwithinthat year.
52%ofthenewlicencesgrantedin2016 wereforNon-GDA Services, this is down on 57% in 2015 and 78%in 2014.Betweentheyears2014 and2016 approximately2 out of every 3 licences granted were for Non-GDAServices. (SeeTables 1B to 1D). In2016 thenumberofoperatorsoutsideoftheGDAwhohadonlyonelicenceincreased from 55% to 59% but reduced from 42%to 38%forthoseoperatorsprovidingserviceswhichdostopwithinthe GDA.Toidentifytrendsdatafrom2014hasbeenincludedinTables1Cand1D.
Itshouldbenotedthata 100%returnwasachievedfromalloperatorswithactive licences.
Table 1A:NumberofOperatorswithActiveRegularServices
Year Number of Operators withActiveLicences
2013 124
2014 127
2015 126
2016 122
5 Three Additional Licences were granted and commencedin2016however thesewere forexisting licenceswhichhadlapsedandwerere-appliedfor.
6
Commercial Bus Statistics for Ireland | 7
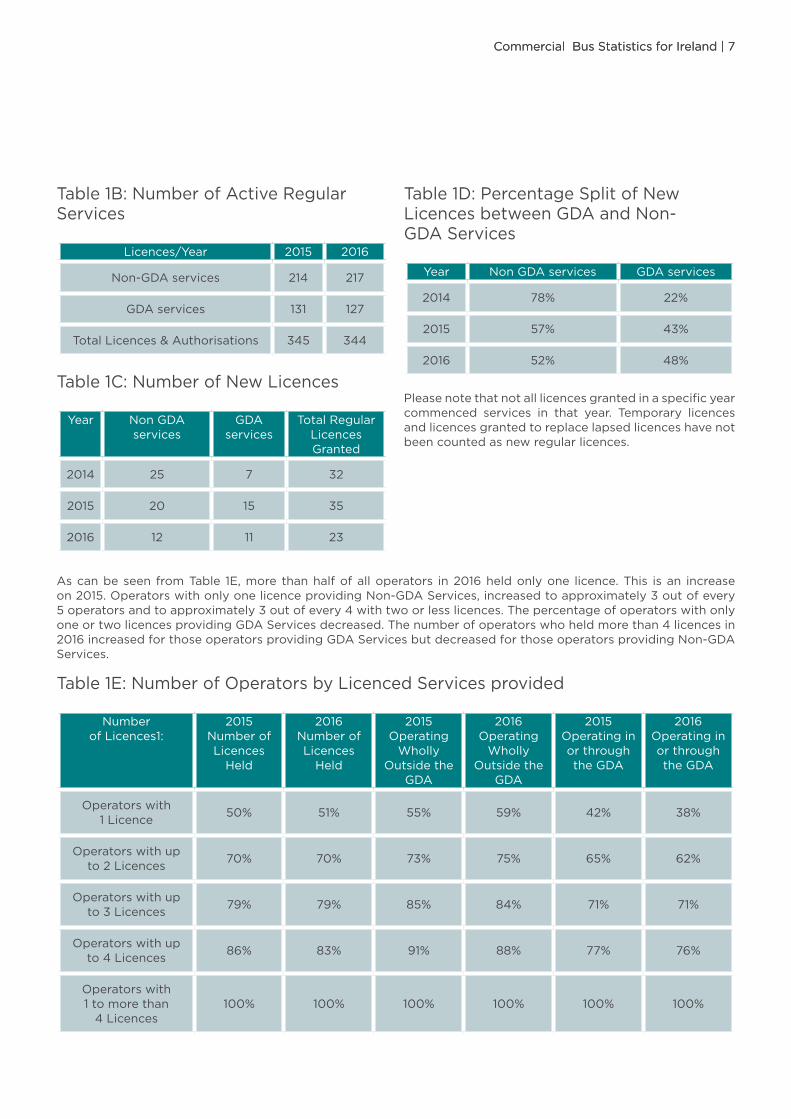
Table 1B:NumberofActiveRegularServices
Licences/Year 2015 2016
Non-GDAservices 214 217
GDAservices 131 127
TotalLicences&Authorisations 345 344
Table 1C:NumberofNewLicences
Year NonGDAservices
GDAservices
TotalRegular LicencesGranted
2014 25 7 32
2015 20 15 35
2016 12 11 23
Table 1D:PercentageSplitofNewLicencesbetweenGDAand Non-GDA Services
Year NonGDAservices GDAservices
2014 78% 22%
2015 57% 43%
2016 52% 48%
Pleasenotethatnotalllicencesgrantedinaspecificyearcommenced services in that year. Temporary licencesandlicencesgrantedtoreplacelapsedlicenceshavenotbeencountedasnewregular licences.
Table 1E:NumberofOperatorsbyLicencedServicesprovided
Number of Licences1:
2015 Number of Licences
Held
2016 Number of Licences
Held
2015Operating Wholly
OutsidetheGDA
2016Operating Wholly
OutsidetheGDA
2015Operating in orthroughtheGDA
2016Operating in orthroughtheGDA
Operatorswith1 Licence
50% 51% 55% 59% 42% 38%
Operatorswithupto2 Licences
70% 70% 73% 75% 65% 62%
Operatorswithupto3 Licences
79% 79% 85% 84% 71% 71%
Operatorswithupto4 Licences
86% 83% 91% 88% 77% 76%
Operatorswith1tomorethan4 Licences
100% 100% 100% 100% 100% 100%
Ascanbeseen fromTable 1E,morethanhalfofalloperators in2016 heldonlyone licence.This isan increaseon 2015.OperatorswithonlyonelicenceprovidingNon-GDAServices,increasedtoapproximately3 outofevery5 operatorsandtoapproximately3 outofevery4 withtwoorless licences.ThepercentageofoperatorswithonlyoneortwolicencesprovidingGDAServices decreased.Thenumberofoperatorswhoheldmorethan4 licencesin2016 increasedforthoseoperatorsprovidingGDAServicesbutdecreasedforthoseoperatorsprovidingNon-GDAServices.
Commercial Bus Statistics for Ireland | 7

8|Commercial Bus Statistics for Ireland
Figure 1.1:PercentageofOperatorsProvidingRegularServicesbyNumberofLicencesheld
Operators with 5 or more LicencesOperators with 4 LicencesOperators with 3 LicencesOperators with 2 LicencesOperators with 1 Licence
51%
17%
4%
9%
19%
Figure 1.2:PercentageofAllPassengerJourneysin2016byNumberofLicencesheld
Operators with 5 or more LicencesOperators with 4 LicencesOperators with 3 LicencesOperators with 2 LicencesOperators with 1 Licence
6%
68%
5%
3%
18%
Operatorswithonlyonelicenceaccountedfor6%ofallthepassengertripsnationallyin2016.Figures 1.1 and 1.2 givethepercentagebreakdownin2016 ofoperatorsbythenumberoflicencesheldandbypercentageofpassengertripsbynumberof licences.
ofAllPassengerJourneys
2
Total Number ofPassengerJourneys
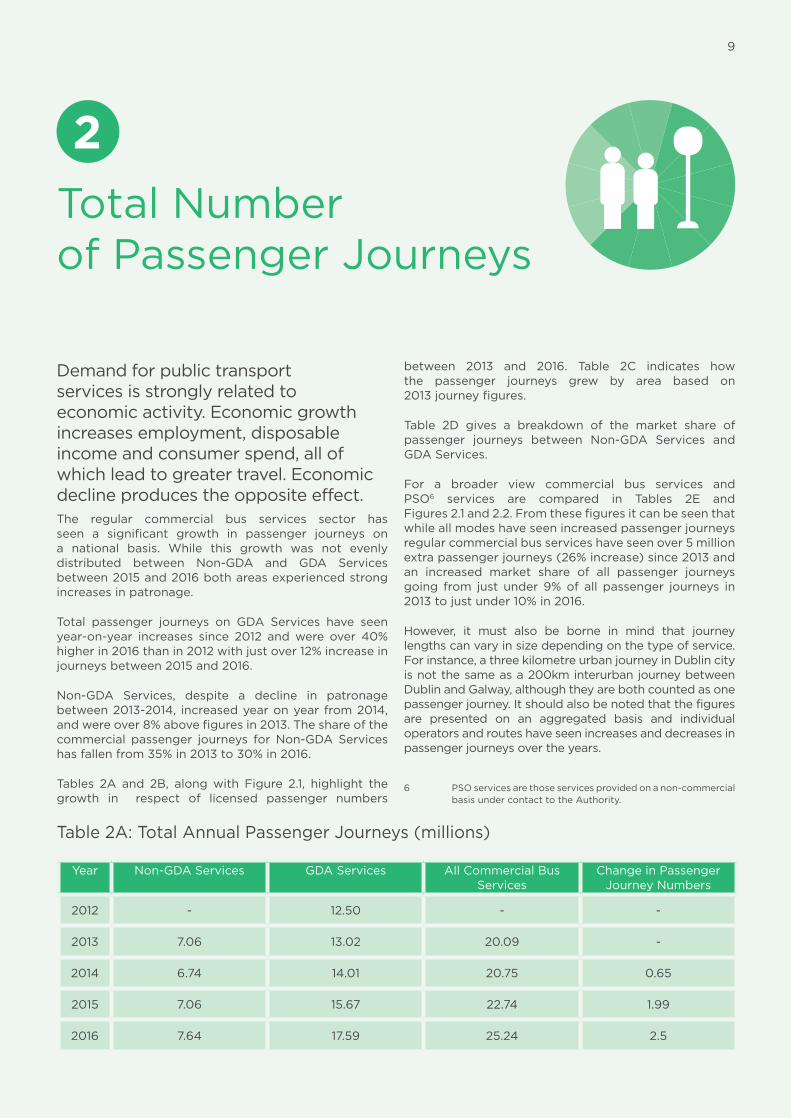
Demandforpublictransportservicesisstronglyrelatedtoeconomic activity.Economicgrowthincreases employment,disposableincomeandconsumer spend,allofwhichleadtogreater travel.Economicdeclineproducestheopposite effect.The regular commercial bus services sector hasseen a significant growth in passenger journeys ona national basis. While this growth was not evenlydistributed between Non-GDA and GDA Servicesbetween2015 and2016 bothareasexperiencedstrongincreasesin patronage.
Total passenger journeys on GDA Services have seenyear-on-year increases since 2012 andwere over 40%higherin2016 thanin2012 withjustover12%increaseinjourneysbetween2015 and 2016.
Non-GDA Services, despite a decline in patronagebetween 2013-2014, increasedyearonyearfrom2014,andwereover 8%abovefiguresin 2013.Theshareofthecommercial passenger journeys for Non-GDAServiceshasfallenfrom 35%in2013 to 30%in 2016.
Tables 2A and 2B, alongwith Figure 2.1, highlight thegrowth in respect of licensed passenger numbers
between 2013 and 2016. Table 2C indicates howthe passenger journeys grew by area based on2013 journey figures.
Table 2D gives a breakdown of the market share ofpassenger journeys between Non-GDA Services andGDA Services.
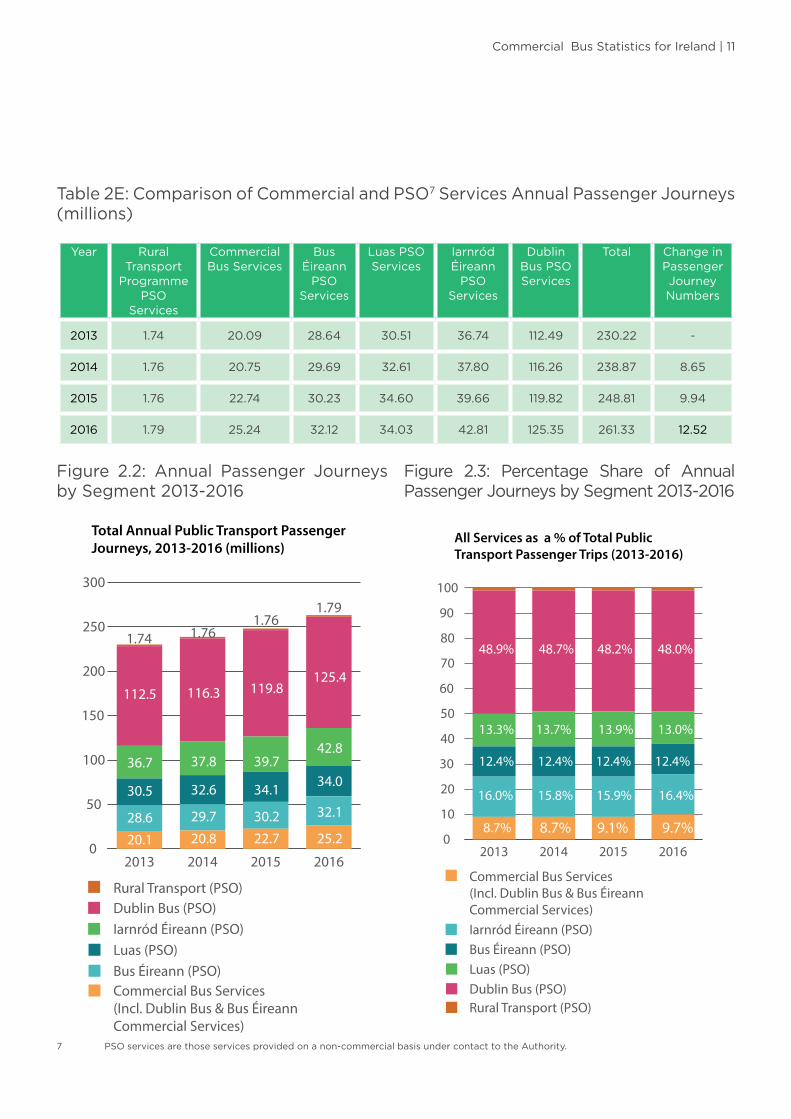
For a broader view commercial bus services andPSO6 services are compared in Tables 2E andFigures 2.1 and 2.2.Fromthesefiguresitcanbeseenthatwhileallmodeshaveseenincreasedpassengerjourneysregularcommercialbusserviceshaveseenover5 millionextrapassengerjourneys(26% increase)since2013 andan increased market share of all passenger journeysgoing from just under 9%of all passenger journeys in2013 tojustunder 10%in 2016.
However, it must also be borne in mind that journeylengthscanvaryinsizedependingonthetypeof service.For instance,athreekilometreurbanjourneyinDublincityisnotthesameasa200kminterurbanjourneybetweenDublinand Galway,althoughtheyarebothcountedasonepassenger journey.Itshouldalsobenotedthatthefiguresare presented on an aggregated basis and individual operatorsandrouteshaveseenincreasesanddecreasesinpassengerjourneysoverthe years.
6 PSOservicesarethoseservicesprovidedona non-commercialbasisundercontacttothe Authority.
Table 2A:TotalAnnualPassenger Journeys(millions)
Year Non-GDAServices GDAServices All Commercial Bus Services
ChangeinPassengerJourneyNumbers
2012 - 12.50 - -
2013 7.06 13.02 20.09 -
2014 6.74 14.01 20.75 0.65
2015 7.06 15.67 22.74 1.99
2016 7.64 17.59 25.24 2.5
9

10 | Commercial Bus Statistics for Ireland
Figure 2.1:ComparisonofTotalPassengerJourneysbyYear(millions)
Table 2B:PercentageChangeperYearinAnnualPassengerJourneys
Changefromprevious Year
Non-GDA
Services
GDAServices
All Commercial Bus Services
2014 -4.6% 7.6% 3.3%
2015 4.8% 11.9% 9.6%
2016 8.2% 12.2% 11.0%
Table 2C:PercentageChangefrom2013inAnnualPassengerJourneys
Changefrom 2013
Non-GDAServices
GDAServices
All Commercial Bus Services
2014 -4.6% 7.6% 3.3%
2015 0.0% 20.4% 13.2%
2016 8.2% 35.0% 25.6%
Table 2D:PercentageBreakdownintheStateofAnnualPassengerJourneys
Year Non-GDAServices GDAServices
2013 35% 65%
2014 32% 68%
2015 31% 69%
2016 30% 70%
All Commercial Bus Services GDA Services Non-GDA Services
0
5
10
15
20
25
30
2016201520142013
7.06
13.02
20.09
6.74
14.01
20.75
7.06 7.64
17.59
25.24
15.67
22.74
Total Annual Passenger Trips on Commercial Bus Services (millions)
Commercial Bus Statistics for Ireland | 11
Table 2E:ComparisonofCommercialandPSO7 Services Annual Passenger Journeys(millions)
Year RuralTransport
ProgrammePSO
Services
Commercial Bus Services
Bus ÉireannPSO
Services
LuasPSOServices
IarnródÉireannPSO
Services
DublinBusPSOServices
Total ChangeinPassengerJourneyNumbers
2013 1.74 20.09 28.64 30.51 36.74 112.49 230.22 -
2014 1.76 20.75 29.69 32.61 37.80 116.26 238.87 8.65
2015 1.76 22.74 30.23 34.60 39.66 119.82 248.81 9.94
2016 1.79 25.24 32.12 34.03 42.81 125.35 261.33 12.52
Figure 2.2: Annual Passenger Journeys bySegment 2013-2016
Figure 2.3: Percentage Share of AnnualPassengerJourneysbySegment2013-2016
Bus Éireann (PSO)Iarnród Éireann (PSO)
Commercial Bus Services (Incl. Dublin Bus & Bus Éireann Commercial Services)
Dublin Bus (PSO)Luas (PSO)
Rural Transport (PSO)
0
10
20
30
40
50
60
70
80
90
100
2016201520142013
48.9%
13.3%
12.4%
16.0%
8.7% 8.7% 9.1% 9.7%
48.7%
13.7%
12.4% 12.4% 12.4%
15.8%
48.2%
13.9%
15.9%
48.0%
13.0%
16.4%
All Services as a % of Total Public Transport Passenger Trips (2013-2016)
Iarnród Éireann (PSO)Dublin Bus (PSO)Rural Transport (PSO)
Bus Éireann (PSO)Luas (PSO)
Commercial Bus Services (Incl. Dublin Bus & Bus Éireann Commercial Services)
0
50
100
150
200
250
300
2016201520142013
112.5
1.74
36.7
30.5
28.620.1
116.3
1.76
37.8
32.6
29.720.8
119.8
1.761.79
39.7
34.1
30.222.7
125.4
42.8
34.0
32.1
25.2
Total Annual Public Transport Passenger Journeys, 2013-2016 (millions)
7 PSOservicesarethoseservicesprovidedona non-commercialbasisundercontacttothe Authority.

ScheduledVehicle Kilometres
‘ScheduledVehicleKilometres’indicatethenumberofvehiclekilometresthatabuscompanyplannedtooperateaspertheircumulative timetables.This measure has not increased significantly for Non-GDAservices.ForGDAServicestheincreasehasbeenpronounced, with 30% more kilometres scheduled in2016 than in 2012. Between 2013 and 2016 scheduledvehicle kilometres for GDA-Services have increased19%,whilepassenger journeyshave increasedby35%.Scheduled vehicle kilometres for Non-GDA Serviceshave increased by 3%, while passenger journeys haveincreasedby8.2%.
Table 3A provides the figures and Tables 3B-3Cshow the changes as a percentage. Tables 3D-3Eshow vehicle kilometres by each PSO operator andcommercial services.
Table 3A:AnnualScheduledVehicleKilometres(millions)
Year NonGDAServices
GDAServices All Commercial
Services
2012 - 55.10 -
2013 19.82 60.29 80.10
2014 19.32 62.83 82.15
2015 20.75 65.53 86.28
2016 20.40 71.68 92.08
Table 3B:PercentageBreakdownintheStateofTotalScheduledVehicleKilometres
Year NonGDAServices GDAServices
2013 25% 75%
2014 24% 76%
2015 24% 76%
2016 22% 78%
Table 3C:PercentageChangeinScheduledVehicleKilometresbyYear
Year NonGDAServices
GDAServices
All Commercial Bus Services On National Basis
2014 -2% 4% 3%
2015 7% 4% 5%
2016 -2% 9% 7%
2013-2016
3% 19% 15%
3
12

Commercial Bus Statistics for Ireland | 13
Table 3DOperated Vehicle Kilometres for PSO Services and Scheduled VehicleKilometresforCommercialBusServices(millions)
Year Luas IarnródÉireann BusÉireannPSO DublinBusPSO
All Commercial Bus Services Total
2013 3.54 15.97 33.34 50.30 80.10 183.25
2014 3.67 15.97 32.94 54.73 82.15 189.46
2015 3.66 15.97 33.76 55.34 86.28 195.01
2016 3.49 15.96 35.74 55.32 92.08 202.59
Table 3D shows scheduled vehicle kilometres forregular commercial bus services and compares thisto the operated vehicle kilometres for PSO Bus andRailservices. ‘Operatedvehiclekilometres’refertotheactual amount of vehicle kilometres that a bus or rail
companyhasoperatedforagivenperiod,asopposedtothe‘scheduledvehiclekilometres’whichwouldindicatethenumberofvehiclekilometresthattheyintendedtooperate.
Table 3E:PercentageChangeVehicleKilometresbyServiceType
Year Luas IarnródÉireann BusÉireannPSO DublinBusPSO All Commercial Bus Services
2013 2% 9% 18% 27% 44%
2014 2% 8% 17% 29% 43%
2015 2% 8% 17% 28% 44%
2016 2% 8% 18% 27% 45%
4
Commercial Bus ServicesRevenue andTicketing
Thevastmajorityoftheoveralllicensed commercial bus services revenueisfromticketrevenue(over 88%in 2016). FreeTravelSchemepaymentsaccountedforjustover 11%ofthetotalrevenuein 2016.Thisislowerthanin2013, whenFreeTravelSchemepaymentsrepresentedjustover 14%of revenue.TaxSaverTicketingwasofferedby 23%ofOperatorsin 2016.Regular commercial bus service revenue consists ofall revenue fromticket sales (including cash, TaxSaver,Leap Card, online&prepaid tickets) andpayments tooperators participating in the Department of SocialProtection’s Free Travel Scheme. Regular commercialbus services include licensed bus services operating wholly within the State and bus services which crosstheborder intoNorthern Irelandandaresubjecttoanauthorisation.
TaxSaverTicketing
The TaxSaver Commuter Ticket Scheme allowsemployees purchase annual/monthly public transportcommuterticketsiftheyaretravellingtoorfromworkby public transport. The scheme involves employersproviding employees with the facility to pay for theticketsover themonth/yearwhile savingonemployerPRSIpayments.Thescheme isgenerallyknownastheTaxSaver Scheme but other names can be used byindividualpublictransport operators.
SmartCardTicketing
Smartcards are the technological successor to magnetictickets. Smart cards contain a microchip that stores andtransmitsdataenablingthemtocommunicatewithasmart
card reading device without actually touching it. Periodticketssuchas Annual,MonthlyandWeeklyTickets,aswellas Pay-As-You-Gocreditcanbestoredonthe cards.ThetwomainsmartcardsaretheLeapCardandtheSmartlink card.TheLeapCard is theonly inter-operablepublic transportsmartcardwithinthe State.TheSmartlinkCardisavailablefrom Ulsterbus, who operate a number of cross-borderservices.
LeapCard
TheLeapCardwas first introduced in late2011 and isan integrated smart card which is available for bothpubliclysubsidisedandcommerciallylicensed services.In2014 theschemewasextendedtotheGreaterCorkArea and in 2016 includes services in Galway City,Limerick City, Waterford City and Wexford. TaxSaverTicketsarenowavailableontheLeapCard.In November 2016 the2 millionthLeapCardwas sold.
Therewere12operatorsin2016withLeapCardontheirregularcommercialbusservices.ThesewereSt.Kevin’sBus,AshbourneConnect,DualwayCoaches,CityDirectGalway,Citylink,CollinsCoaches,ExpressBus,MatthewsCoaches, Swords Express, Wexford Bus, Dublin BusandBusÉireann.(DublinBusandBusÉireannrunbothcommercialandPSOservices).
FreeTravelRevenue
Anumber of commercial bus services are part of theDepartmentofSocial Protection’sFreeTravel Scheme.OperatorsthatarepartoftheschemereceivepaymentsforthefareforgoneforcarryingpassengersentitledtoFree Travel.OverallFreeTravelPayments(listedas“FTPayments”inthetables)tocommercialoperatorsaresetoutbelowandincludepaymentsforFreeTravelwithinthestateforbothIrishandNorthernIrishpassengers,aswellaspaymentsforcrossborderFreeTravel.TheTotalAnnualFTPaymentsintheTablesincludepaymentsforBusÉireann’sExpresswayServices.
14

Commercial BusStatisticsforIreland|15
Table 4A shows the total ticket revenue and free travelschemepaymentsfortheregularcommercialbusservicessectorbetween2013 and 2016. This includes figures forthe licensed Bus Éireann Expressway and Dublin BusAirlink services.Thefreetravelpaymentsareinclusiveofpaymentsforcrossbordertravelandinternationalforeignfree travel payments. Table 4B shows the percentagechangeinrevenueperyearandTable4Cshowsthechange
between revenue, passenger journeys, and scheduledvehiclekilometresbetween2015 and 2016.
In 2016 of all operators providing regular commercialbusservices, 23%offeredoneormoretypesofTaxSaverTicket.
Table4DshowsthenumberandpercentageofoperatorsofferingTaxSaverTicketing.
Table 4A:AnnualPassengerRevenue(millions)
Year Total Annual TicketRevenue
TotalAnnualFTPayments
TotalRevenue FTPaymentsasaPercentofAllRevenue
2013 €115.889 €20.055 €135.944 14.8%
2014 €129.546 €20.101 €149.646 13.4%
2015 €143.187 €20.425 €163.612 12.5%
2016 €155.623 €20.487 €176.110 11.6%
Table 4B:PercentageChangeinRevenuebyYear
Year ChangeinAnnualTicket
Revenue
ChangeinAnnualFTPayments
Changein Total Revenue
2014 12% 0% 10%
2015 11% 2% 9%
2016 9% 0% 8%
Table 4C:PercentageChangeinTicketRevenue,VehicleKilometresandPassengerJourneys(millions)
Year TicketRevenue(Excl.FT Payments)
VehicleKilometres
PassengerJourneys
2016 9% 7% 11%
Table 4D:NumberofOperatorsofferingTaxSaverTicketing
Year Operators Offering 1 orMoreTaxSaver
Tickets
PercentofAllOperators Offering TaxSaverTickets
2013 17 14%
2014 27 21%
2015 25 20%
2016 28 23%

5
FreeTravel PassengerJourneys
TheDepartmentofSocial Protection’sFreeTravelSchemeisavailabletoallpersonsaged66 andoverlivingpermanentlyinthe State.Somepeopleunder66 mayalsoqualifysuchascarersinreceiptofa Carer’sAllowanceandcertainotherpersonsinreceiptofaDisabilityAllowanceorInvalidity Pension.Free travelwasavailableonState fundedbusand railtransport including Dublin Bus, Bus Éireann, IarnródÉireannandLuas services.Free travel isalsoavailableon a number of licensed commercial services operated by private bus companies and Bus Éireann. Since1995 Northern Ireland Senior Citizens aged 65+ havebeen eligible for limited cross border free travel from anypoint inNorthern Irelandtoanydestination intheRepublicof Ireland.
The provisionwas further expanded in 2007, to alloweligibleNorthernIreland65+SeniorSmartPass holders,to travel for free not only to a destination across theborder but also on internal public transport services whentheyarriveintheRepublicof Ireland.
AspartoftheAnnualBusOperatorReturnsoperatorsestimatethenumberofFreeTravelPassengerJourneysas a percentage of all journeys for each licenceand authorisation.TheestimatedtotalnumberofFreeTravel Passenger Journeys has risen between 2013 and2016 by 10%onanational basis,(SeeTable 5A).However,duetotheoverallgrowthlevelsinpassengerjourneysinthesameperiod(25.6%)thepercentageofallpassengerjourneyswhichwereFreeTravelPassengerJourneyshasdecreasedfrom 24%ofallcommercialbuspassengerjourneysin2013 to 21%in 2016.
These changes are not evenly distributed acrossthe State. In fact onNon-GDAServices,while overallpassengerjourneyshaveincreased 8.2%between2013 and2016 theestimatednumberofFreeTravelPassengerJourneyshasrisenbyanestimated 27%goingfrom 36%ofalljourneysin2013 to 43%in 2016.Thesameisnottrue
ofGDAServiceswhichhaveanestimated 9%decreaseinFreeTravelPassengerJourneysoverthesameperiodwiththepercentageofsuchjourneysreducingfrom 17%ofallcommercialbuspassengerjourneysin2013 to 12%in 2016. These reported changes mean that Non-GDA Services increased the percent share of all FreeTravelPassengerJourneys from 54%ofallFreeTravelPassengerJourneysonregularcommercialbusservicesin2013 to 62%in 2016.
Table 5A shows the estimated Free Travel PassengerJourney figures while Table 5B and 5C give thepercentages.
Table 5A:EstimatedNumberofFreeTravelPassengerJourneys(millions)
Year LicensedServices Nationally
Licensed Non-GDAServices
LicensedGDAServices
2013 4.79 2.57 2.22
2014 4.73 2.84 1.89
2015 4.92 2.94 1.98
2016 5.29 3.26 2.03
16

Commercial Bus Statistics for Ireland | 17
Table 5B:EstimatedFreeTravelPassengerJourneysasaPercentageofAllPassengerJourneys
Year LicensedServicesNationally Licensed Non-GDAServices
LicensedGDAServices
2013 24% 36% 17%
2014 23% 42% 13%
2015 22% 42% 13%
2016 21% 43% 12%
Table 5C:PercentageshareofEstimatedFreeTravelPassengerJourneys
Year Licensed Non-GDAServices LicensedGDAServices
2013 54% 46%
2014 60% 40%
2015 60% 40%
2016 62% 38%
Itshouldbenotedthatthesefigureshavebeencalculatedbymultiplyingthetotalnumberofpassengerjourneyswiththeestimatedpercentageoffreetravelpassengerjourneysprovidedbyoperators.Thefiguresshouldthereforebetakenasindicativeonlyratherthanprecise calculations.

6
Commercial OperatorFleetSize
Thenumberofvehiclesthatwereusedin2016 toprovideregularcommercialbusservicesintheStatewas 1371.TheAuthorityalsoaskedlicensedoperatorswhethertheirvehicleswerealsousedforotheractivitiesas well,toshownotonlyhowmanyvehiclesoperatorsusedtoprovidetheirregularcommercialbusservices,butalsohowmuchthesevehicleswereusedsolelyforrunningtheirregularcommercialbusservices services.For example,ifanoperatorhadjustonebusandthisbuswasused 70%ofthetimeforregularlicencedservicesand 30%ofthetimeforprivatehire services,thentheoperator would count that as 0.7 of a vehicle whenreportingtheirexactnumberofbuses used.
Usingthismethodofcalculationtherewere1125 busesusedonafulltimebasistoprovideregularpassenger services.Thisisup16%since2013.
Table 6A:NumberofVehiclesUsedtoProvideRegularCommercialBusServices
Number of Vehicles/Year
2013 2014 2015 2016
Number of vehiclesusedonfull time basis:
969 1,037 994 1,125
Number of vehiclesCounted:
1,062 1,227 1,223 1,371
Figure 6.1:PercentageofOperatorsbyNumberofVehiclesUsedtoProvideRegularCommercialBusServices
Operators using more than 10 vehiclesOperators Using 6 -10 vehiclesOperators using 3 -5 vehicles Operators Using 1-2 vehicles
11%
68%
13%
7%
Percentage of Operators by vehicles used
Vehiclesreferredtointhetablesincludeabroadvarietyof vehicles,suchas inter-city coaches, low-floorurbandouble and single decker buses, as well as midi andmini buses. These vehicles have a range of differentdesigns and passenger seat capacities. The vehiclesusedaregenerallytosuitthetypeofroutebeing served.
18

7
Commercial Operating FleetAccessibilityandScheduleKilometresOperatedbyAccessibleVehicles
Thepercentageofvehicleswhichare accessible is one measure of accessibilityofthefleet,howeveranotherkeyindicatoristheamountofscheduledvehiclekilometrestheseaccessiblevehiclesareusedtoprovide.Since2013thereportednumberofwheelchairaccessiblevehicles used on regular commercial services hasremainedatapproximately 2vehiclesforevery5vehiclesused. The number of vehicles which are reported asbeing low-floor suitable for wheelchair access hasincreasedfrom 13%in2013 to 16%in2016, butascanbeseen,remainslowasapercentageoftheoverall fleet.
WheelchairAccessibility
It is important to highlight that a vehicle can beeither low-floor wheelchair accessible or wheelchairaccessible through theuseofa lift.Thereareasmallnumberofvehicleswithinthisfleetthatareaccessibletowheelchairsbybeingboth low-floorandhavingtheuseofa lift,althoughthisisless common.Suchvehicleshavebeencountedasoneaccessible vehicle.
CommercialOperatingfleetthatarelowfloor vehicles suitable for wheelchairaccess
Low-floor wheelchair accessible vehicles are vehicleswhere access from the bus stop to part or all of thepassengerareaisdirectfromthebusstop apron.Therearenostepsinvolvedandawheelchair lift isnot used.Optionally, the vehicle may lower to kerb level andtheremaybeanentryandexitaccess ramp forquick
andsafewheelchair access.Thisenableseasieraccessfor wheelchair users and thosewith limited mobility.Accessing low-floor vehicles can also require thatappropriatebus stop infrastructure, for instance kerbsofaspecific height,arein place.
Commercial Operating fleet that haveliftssuitableforwheelchairaccess
Vehicles with wheelchair lifts raise the individual andtheirwheelchairabovethestepsofthebusandintothevehiclecorridorarea.Thisfeaturerequiresadeepspaceatthefootpathwhichisnotalwaysavailable.Theuseofwheelchairliftsincreasesthedwelltimeatbusstopsandmaynotbeaspreferableforthepassengerasthelow-floor, roll-on/roll-off option. Vehicles with wheelchairlifts are often only able to carry one passenger usingawheelchairatanygiventimeasonlyonedesignatedwheelchairspacemaybeavailable.
It can also be the case that the customer using awheelchairmayneedtoinformtheoperatorinadvancethat they wish to use the service because seatingmayneed tobe removed toprovide for a designatedwheelchair space.
ScheduledVehicleKilometresoperatedbywheelchairaccessiblevehicles
Estimatesofthescheduledvehiclekilometresoperatedbywheelchairaccessiblevehicleshavebeenset outinTables7Cand7D.ForbothGDAandNon-GDAServicesthere has been a trend of increased provision of theservices by accessible vehicles. On a National basisthefigures indicateanoverallchangefrom 39%ofallscheduledvehiclekilometresin2013beingprovidedbyaccessiblevehiclesto 61%in2016.
19

20 | Commercial Bus Statistics for Ireland
Thefiguressetoutbelowarederivedfromestimationsby operators. They are intended to be read as guidefigures to indicate trends as opposed to being exact calculations.
Forexample,ifanoperatorhadthreevehiclesandonewas wheelchair accessible (being either low floor orhavingawheelchair lift)thenyouwouldexpectthat 33%ofthetotalscheduledkilometreswouldbeoperatedwithaccessible vehicles. However,ifthewheelchairaccessiblevehiclewasregularlyusedforlicensed services,whereastheothervehicleswereusedlessoftenorusedas spares,
then you would expect the percentage to be muchhigherbecausemostoftheirserviceswouldbeprovidedwiththewheelchairaccessible vehicles.
Thepercentagesarearrivedatbymultiplyingtheoverallscheduled kilometres by the percentage of accessiblevehicles used. The percentage of accessible vehiclesusediscalculatedbasedonthetotalnumberofvehiclescountedbyan operator,ratherthanasapercentageofthenumberofvehiclesusedonafulltime basis,asdatahasbeenprovidedonthebasisofthetotalnumberofaccessiblevehicles available.
Table 7A:NumberofAccessibleVehicles
Year VehiclesthatareLow-FloorWheelchair
Accessible
VehicleswithliftssuitableforWheelchair
access
Total Accessible Vehicles
Total Number of Vehiclesused
2013 137 308 445 1062
2014 148 279 428 1227
2015 176 321 497 1223
2016 217 382 599 1371
Table 7B:PercentageofAllVehiclesusedwhichareAccessibleVehicles
Year VehiclesthatareLow-FloorWheelchairAccessible
VehicleswithliftssuitableforWheelchairaccess
TotalAccessibleVehicles
2013 13% 29% 42%
2014 12% 23% 35%
2015 14% 26% 41%
2016 16% 28% 44%
Table 7C: Estimation of Scheduled Vehicle Kilometres provided by AccessibleVehiclesbasedonDataprovidedbyOperators(millions)
Year AllNon-GDA
ServicesKM
AccessibleNon-GDAServicesKM
AllGDAServices
KM
AccessibleGDAServicesKM
NationallyAllScheduledKM
Accessible ScheduledKM
Nationally
2013 19.8 7.1 60.3 24.3 80.1 31.4
2014 19.3 7.6 62.8 28.3 82.2 35.9
2015 20.7 11.1 65.5 36.4 86.3 47.4
2016 20.4 11.9 71.7 44.0 92.1 55.8

Commercial Bus Statistics for Ireland | 21
Table 7D:PercentageofAllScheduledVehicleKilometresprovidedbyAccessibleVehiclesbasedonEstimations
Year AccessibleNon-GDAServicesScheduledKM
AccessibleGDAServicesScheduledKM
AccessibleScheduledKMNationally
2013 36% 40% 39%
2014 39% 45% 44%
2015 53% 55% 55%
2016 58% 61% 61%

8
Commercial Operating FleetwithAutomatic VehicleLocation(AVL) Systems
AutomaticVehicleLocation(AVL)isthetermusedforautomaticallydeterminingthegeographiclocationofavehicle.Vehiclesaregenerallytrackedbyplacingaglobalpositioningsystem(GPS)electronicdeviceinoronthevehicle.ThenumberofvehicleswithAVLisnowatapproximately70%ofallvehiclesusedtoprovideregularcommercialbusservices.(SeeTables8aand8B).
There are a number of benefits to AVL, especiallyin a public transport context. It allows an operator tomanagetheirfleetbetter,knowwherethevehiclesareatanygiventime,anditfacilitatestheprovisionofrealtimepassengerinformation(RTPI).
ItshouldbenotedthatalthoughmanyAVLsystemsmaybeofbenefittoanindividualoperator,onlyspecificAVLsystemsarecompatibletotheState’sRTPIfacilitythatis available throughon-streetdisplays,websites, apps,orSMSservice.ThereforehavingvehicleswithAVLonboard would not be a sufficient guide as to whethertheseservicescouldparticipateintheRTPIfacility.
Table8A:NumberofVehicleswithAVL
Year Number of Vehicleswith
AVL
TotalNumberofVehiclesused
2013 639 1062
2014 812 1227
2015 807 1223
2016 960 1371
Table8B:PercentageofAllVehiclesusedwhichhaveAVL
Year VehicleswithAVL
NumberofvehiclesusedtoprovideRegularServicesonaFulltime
basis
2013 60% 1062
2014 66% 1227
2015 66% 1223
2016 70% 1371
22

9
CommercialFleetAge
Theaverageageofafleetisanimportantmeasure,astheageofavehiclecaninfluenceaccessibilitystandards,vehicleemissionlevels,fuelefficiency,vehiclesafetyfeatures,maintenancerequirements,andreliability.Maintainingandattractingpassengers,whocanhavea preference for travelling on newer buseswithenhancedfeaturesanddesigns,mustalsobeconsidered.
Theaveragevehicleagehaschangedfrom6.8yearsto7yearsbetween2013and2016.Duringthesameperiodthe total number of vehicles used to provide regularcommercialbusservicesonafulltimebasisincreasedby156vehiclesfrom969vehiclesin2013to1,125vehiclesin2016.Thesefiguresdemonstratethatthereisinvestmentin the commercial fleet, which maintains an averagevehicleage.(SeeTable9A).
Table9A:AverageAgeofVehiclesusedto provide services
Year 2013 2014 2015 2016
AverageVehicleAge(Years)
6.8 6.6 6.8 7.0
23

Further information
Media enquiries: Statistical enquiries:
Dermot O’Gara Ciaran O’Gorman
T.+353 (0)18798346 T.+353 (0)1 8798363