COMISION NACIONAL DEL MERCADO DE … · Valores proforma, incluyendo la consolidación total de...
109
Alcobendas, 30 de noviembre de 2017 COMISION NACIONAL DEL MERCADO DE VALORES De conformidad con lo previsto en el artículo 228 del texto refundido de la Ley del Mercado de Valores y normativa de desarrollo, por la presente Indra comunica y hace público el siguiente: HECHO RELEVANTE En el marco de la presentación a analistas e inversores del Plan Estratégico 2020 que se celebrará hoy en la sede de la Compañía en Alcobendas a partir de las 10h00 am se harán públicos los siguientes objetivos: 1. Valores proforma, incluyendo la consolidación total de Tecnocom 2. Crecimiento orgánico. Tipos de cambio constantes con base 2016 (promedio de tipo de cambio de 2016) 3. Incluye la estimación de caja generada en el periodo 2015-2017E, excluyendo el impacto estimado asociado a la salida de caja de la adquisición de Tecnocom (191M€), los planes de reestructuración (129M€), los proyectos onerosos (~145M€) y el CAPEX acumulado en el periodo 4. CAPEX acumulado en el periodo 2015-2017E y 2018-2020E, respectivamente 5. Los usos de la caja generada en el periodo 2018-2020 están condicionados al cumplimiento del Plan Estratégico 6. Incluye el Flujo de Caja Libre según la definición de Indra generado en el periodo, excluyendo el CAPEX y la última parte de la salida de caja asociada al plan de reestructuración en España (~40M€) PRESENTACIONES DEL PLAN ESTRATEGICO Se adjunta la documentación que se distribuirá en la presentación del Plan Estratégico 2020 y que estará disponible tanto en la página web de la Compañía (www.indracompany.com ) como en la de la CNMV (www.cnmv.es ). El evento se podrá seguir además de forma remota a través de un acceso electrónico situado en la página web de la Compañía (www.indracompany.com). Todo lo cual ponemos en su conocimiento a los efectos oportunos.
Transcript of COMISION NACIONAL DEL MERCADO DE … · Valores proforma, incluyendo la consolidación total de...

Alcobendas, 30 de noviembre de 2017
COMISION NACIONAL DEL MERCADO DE VALORES
De conformidad con lo previsto en el artículo 228 del texto refundido de la Ley del Mercado
de Valores y normativa de desarrollo, por la presente Indra comunica y hace público el
siguiente:
HECHO RELEVANTE
En el marco de la presentación a analistas e inversores del Plan Estratégico 2020 que se
celebrará hoy en la sede de la Compañía en Alcobendas a partir de las 10h00 am se harán
públicos los siguientes objetivos:
1. Valores proforma, incluyendo la consolidación total de Tecnocom
2. Crecimiento orgánico. Tipos de cambio constantes con base 2016 (promedio de tipo de cambio de 2016)
3. Incluye la estimación de caja generada en el periodo 2015-2017E, excluyendo el impacto estimado asociado a la
salida de caja de la adquisición de Tecnocom (191M€), los planes de reestructuración (129M€), los proyectos
onerosos (~145M€) y el CAPEX acumulado en el periodo
4. CAPEX acumulado en el periodo 2015-2017E y 2018-2020E, respectivamente
5. Los usos de la caja generada en el periodo 2018-2020 están condicionados al cumplimiento del Plan Estratégico
6. Incluye el Flujo de Caja Libre según la definición de Indra generado en el periodo, excluyendo el CAPEX y la
última parte de la salida de caja asociada al plan de reestructuración en España (~40M€)
PRESENTACIONES DEL PLAN ESTRATEGICO
Se adjunta la documentación que se distribuirá en la presentación del Plan Estratégico 2020 y
que estará disponible tanto en la página web de la Compañía (www.indracompany.com) como
en la de la CNMV (www.cnmv.es).
El evento se podrá seguir además de forma remota a través de un acceso electrónico situado
en la página web de la Compañía (www.indracompany.com).
Todo lo cual ponemos en su conocimiento a los efectos oportunos.
Atentamente,
Javier Lázaro Rodríguez
Director General Económico Financiero
Información importante: Los datos anteriores son estimaciones o proyecciones que no constituyen
una garantía de futuro cumplimiento y se encuentran condicionados por múltiples factores que podrían
determinar que el resultado final difiera de estas proyecciones.
30 November 2017

1
Agenda
10:00-10:40 1. Vision, Strategy and Targets FERNANDO ABRIL-MARTORELL
3. IT Introduction and General Overview CRISTINA RUIZ
5. Closing Remarks FERNANDO ABRIL-MARTORELL
4. Financial Overview JAVIER LÁZARO
2.1 Defence & Security MANUEL ESCALANTE
2.2 ATM GONZALO GAVÍN
2.3 Transport BERTA BARRERO
2. T&D Introduction and General Overview JAVIER DE ANDRÉS
Coffee break
Lunch
6. Q&A
10:40-11:00
11:00-11:20
11:20-11:40
11:40-12:00
12:00-12:30
12:30-12:50
13:35-14:35
14:35-15:00
15:00-15:10
15:10-16:00
3.1 Product Portfolio Evolution SERGIO MARTÍN
3.2 Segmented Commercial Processes BORJA OCHOA
3.3 Ongoing Productivity Upgrades LUIS ABRIL
12:50-13:05
13:05-13:20
13:20-13:35
T&D
IT
2
Vision, Strategy and Targets
Fernando Abril-Martorell
1

3
Indra Evolution 2015-2017Since 1st Investor Day

4
When we started to work on our first Strategic Plan in April 2015, Indra was in a very challenging situation
Resulting in high financial stress
Cash flow draining
High debt generating difficulties on external financing
-164€M1H15
accumulated
FCF
5.9x1H15
Net Debt /
EBITDA
825€M1H15
Net Debt
Ongoing deep operational issues
Non reliable analytical accounting and lack of control of onerous projects
• 718€M write-offs in 2015
• Difficulties to understand root causes and underlying issues
Profitability de-prioritisation
• Growth driven by low value added services
• Cost overruns in some contracts resulting from aggressive growth
• Expensive delivery model
Lack of focus on cost efficiency
• Heavy corporate structure
• Non optimal production pyramid management
Cash management decoupled from business activities
• Excessive working capital requirements
Excessive risk assumption in commercial bids
• Some products at too early stage, generating onerous projects
• Contractual and legal conditions without enough self-protection

5
Therefore, there were increasing market concerns including a potential need for a capital increase
"The removal of the dividend is a first step here but is probably not enough to stop investors worrying about the risk of further capital raising"
Analyst 4, 2015
"We believe the targets are ambitious, while there is greater risk of a potential capital increase, in our view"
Analyst 5, 2015
"However, we believe we cannot totally rule out the possibility of a capital increase at some point depending on additional write-offs and project execution"
Analyst 6, 2015
"Market concerns could linger over continued weakness and write-downs, FCF and balance sheet leverage"
Analyst 1, 2015
…and of a potential need for a capital increaseMarket concerns of Indra's financial stress…
"There are still balance sheet issues that need to unwind (or at least stop deteriorating) in the future"
Analyst 2, 2015
"Until Indra starts booking revenues that are backed by cash flow, we think Indra will continue to struggle with cash generation”
Analyst 3, 2015
6
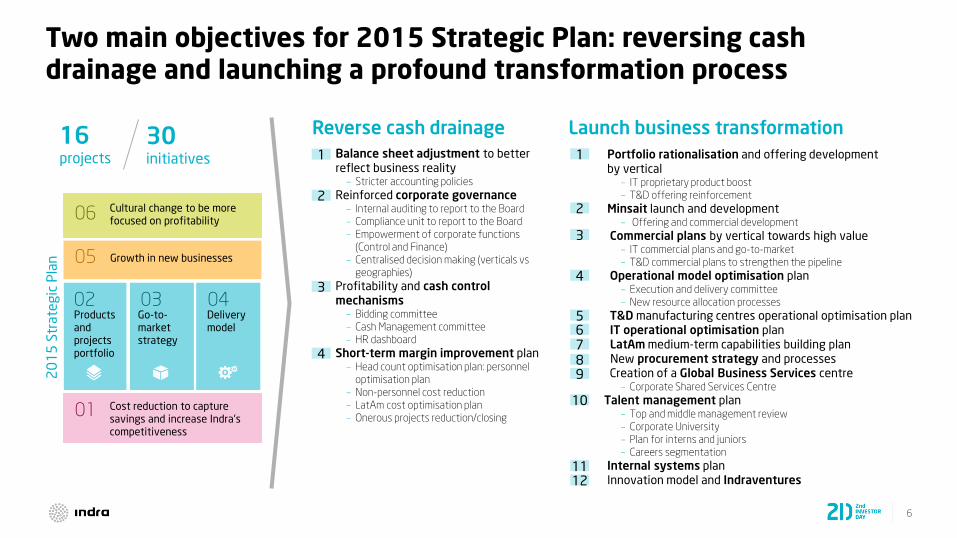
Two main objectives for 2015 Strategic Plan: reversing cash drainage and launching a profound transformation process
Launch business transformationReverse cash drainage
Balance sheet adjustment to better reflect business reality
– Stricter accounting policies
Reinforced corporate governance– Internal auditing to report to the Board
– Compliance unit to report to the Board
– Empowerment of corporate functions
(Control and Finance)
– Centralised decision making (verticals vs
geographies)
Profitability and cash control mechanisms
– Bidding committee
– Cash Management committee
– HR dashboard
Short-term margin improvement plan– Head count optimisation plan: personnel
optimisation plan
– Non-personnel cost reduction
– LatAm cost optimisation plan
– Onerous projects reduction/closing
Portfolio rationalisation and offering development by vertical
– IT proprietary product boost
– T&D offering reinforcement
Minsait launch and development– Offering and commercial development
Commercial plans by vertical towards high value– IT commercial plans and go-to-market
– T&D commercial plans to strengthen the pipeline
Operational model optimisation plan– Execution and delivery committee
– New resource allocation processes
T&D manufacturing centres operational optimisation planIT operational optimisation planLatAm medium-term capabilities building planNew procurement strategy and processesCreation of a Global Business Services centre
– Corporate Shared Services Centre
Talent management plan– Top and middle management review
– Corporate University
– Plan for interns and juniors
– Careers segmentation
Internal systems planInnovation model and Indraventures
4
5
4789
11
6
10
Cultural change to be more focused on profitability 06
Growth in new businesses05
Products and projects portfolio
02Go-to-market strategy
03Deliverymodel
04
Cost reduction to capture savings and increase Indra'scompetitiveness
01
20
15
Str
ate
gic
Pla
n
1
2
3
1
2
3
12
16projects
30initiatives

7
Much more reliable balance sheet after write-offs
Sep17
2.5x3
Jun16
Dec15
6.6x
Jun15
1.9x
Jun17
Dec16
By implementing our 2015 Strategic Plan, we have achieved significant structural improvements in Indra's financials…
Sustainable cash generation
FCF accumulated LTM (€M)
1. Displayed data includes Tecnocom consolidation since April 18th, 2017; 2. Indra + Tecnocom 6.3% ; 3. This ratio includes LTM EBITDA Indra & LTM EBITDA Tecnocom (part of this data is considered as if Tecnocom would have been managed by the former Management)
Net debt on the lowest point since 2015 peak
Net Debt / EBITDA LTM (Times)
Healthy P&L and balance sheet
Recurring EBIT LTM (€M)
17645
Sep 17
181
Dec 15
Indra + Tecnocom1
Indra Excluding Tecnocom Indra Excluding Tecnocom
Indra + Tecnocom
Indra Excluding Tecnocom
Indra + Tecnocom1
1.6% 6.5%2
222
184181163
104
-136
132132 184
Sep17
Jun17
113
Jun15
Jun16
-50
Dec16
76
-114
Dec15
Includes 78€M cash cost from
personnel optimisation plan in
2015, and 51€M in 2016
8
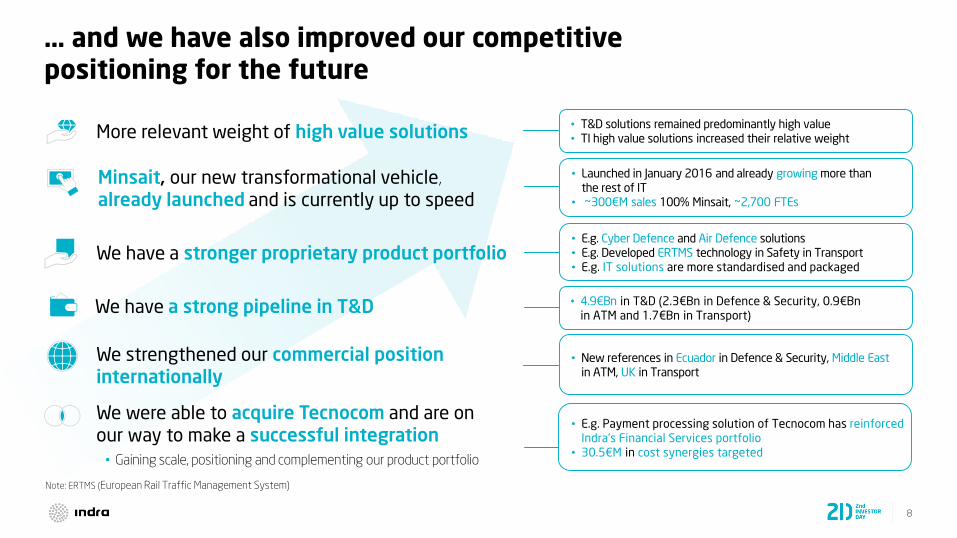
… and we have also improved our competitive positioning for the future
We have a stronger proprietary product portfolio
More relevant weight of high value solutions• T&D solutions remained predominantly high value• TI high value solutions increased their relative weight
Minsait, our new transformational vehicle,
already launched and is currently up to speed
We have a strong pipeline in T&D
• New references in Ecuador in Defence & Security, Middle Eastin ATM, UK in Transport
We strengthened our commercial position internationally
• Launched in January 2016 and already growing more than the rest of IT
• ~300€M sales 100% Minsait, ~2,700 FTEs
• E.g. Cyber Defence and Air Defence solutions• E.g. Developed ERTMS technology in Safety in Transport• E.g. IT solutions are more standardised and packaged
• 4.9€Bn in T&D (2.3€Bn in Defence & Security, 0.9€Bn in ATM and 1.7€Bn in Transport)
We were able to acquire Tecnocom and are on our way to make a successful integration
• Gaining scale, positioning and complementing our product portfolio
• E.g. Payment processing solution of Tecnocom has reinforced
Indra's Financial Services portfolio• 30.5€M in cost synergies targeted
Note: ERTMS (European Rail Traffic Management System)
9
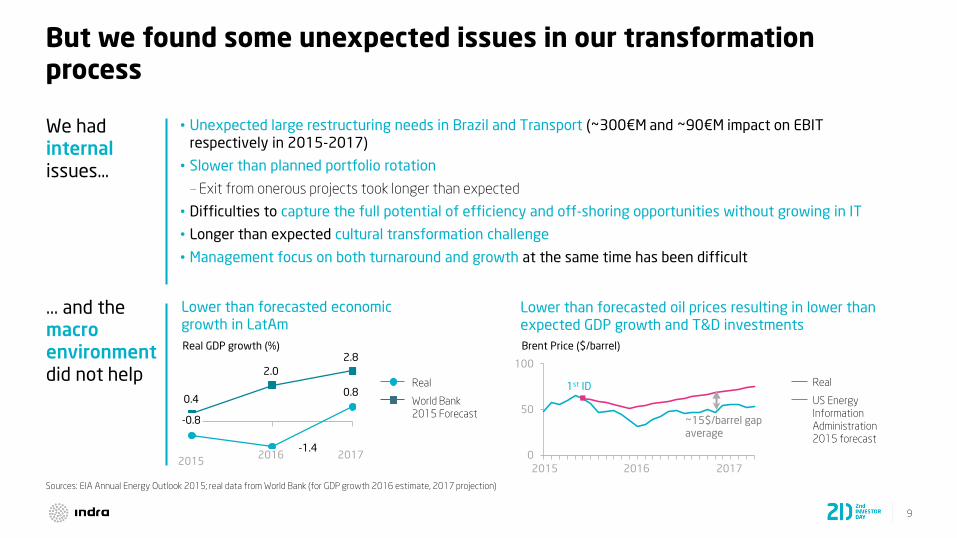
But we found some unexpected issues in our transformation process
Sources: EIA Annual Energy Outlook 2015; real data from World Bank (for GDP growth 2016 estimate, 2017 projection)
We had internalissues…
• Unexpected large restructuring needs in Brazil and Transport (~300€M and ~90€M impact on EBIT respectively in 2015-2017)
• Slower than planned portfolio rotation
– Exit from onerous projects took longer than expected
• Difficulties to capture the full potential of efficiency and off-shoring opportunities without growing in IT
• Longer than expected cultural transformation challenge
• Management focus on both turnaround and growth at the same time has been difficult
Lower than forecasted economic growth in LatAm
201720162015
2.0
0.80.4
-1.4
-0.8
2.8
Real
World Bank
2015 Forecast
Lower than forecasted oil prices resulting in lower than expected GDP growth and T&D investments
0
50
100
2015 20172016
Real
US Energy
Information
Administration
2015 forecast
1st ID
~15$/barrel gap average
Brent Price ($/barrel)Real GDP growth (%)
... and the macro environment did not help
10
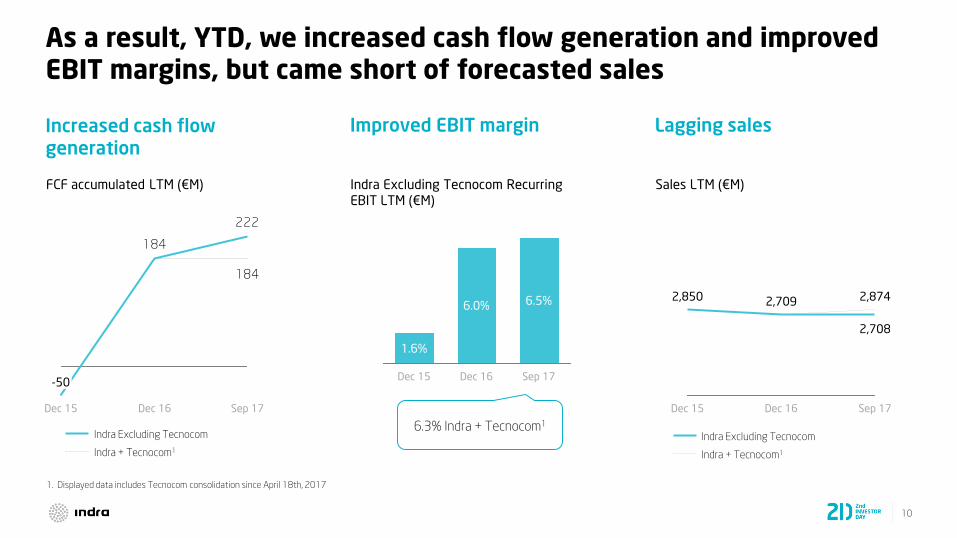
As a result, YTD, we increased cash flow generation and improved EBIT margins, but came short of forecasted sales
Lagging salesImproved EBIT marginIncreased cash flow generation
184
184
222
Sep 17Dec 16Dec 15
-50
Sep 17
2,874
2,708
Dec 16
2,709
Dec 15
2,850
Indra + Tecnocom1
Indra Excluding Tecnocom
Sep 17
6.5%
Dec 16
6.0%
Dec 15
1.6%
1. Displayed data includes Tecnocom consolidation since April 18th, 2017
Indra Excluding Tecnocom Recurring
EBIT LTM (€M)
FCF accumulated LTM (€M) Sales LTM (€M)
Indra + Tecnocom1
Indra Excluding Tecnocom6.3% Indra + Tecnocom1

11
Shortfall in sales prevented us from capitalising our operating leverage, consequently falling short of our margin expectations
4,000
2,000
0
3,144
173173
436
2,708
Sales LTM (€M)
3,317
176
70
246
0
100
200
300
Simulated total sales with 1ID guidance
274
28
Impact of additional sales on higher range of the 1 ID guidance (4.5% CAGR)
EBIT LTM (€M)
28
Impact of additional sales on lower range of the 1
ID guidance (2.5% CAGR)
Sep 17
6.5% 7.8% 8.2%
EBIT at
+16%
EBIT at
+16%
EBIT
2,000
0
1,000
4,000
3,000
Sep 17 (Estimated
with 1ID guidance)
3,317
3,144
Dec 14
2,938
Sales LTM (€M)
1ID guidance simulation
Low range
2.5% CAGR
High range
4.5% CAGR
Note: Figures excluding Tecnocom
Between LTM Dec 14 and Sep 17, Brazil sales fell
~70M, and Transport sales fell ~100M

12
In conclusion: Indra has already accomplished a significant part of the turnaround, but we still need to capture its full potential
We already accomplished significant changes...
Improved operations, processes and culture
Solid financial footing after having deep operational issues and having been on the edge of capital increase
Relevant additional achievements that improved our competitive positioning for the future
... but we still need to complete the transformation and focus on profitable growth
Continue specialising our operating model to increase focus, agility and flexibility
Further evolve our product portfolio to complete migration towards high value
Boost commercial transformation to capture growth
Carry on with ongoing productivity improvement to increase competitiveness and margins
13
Market Outlook and Strategic Guidelines
2018-2020
14
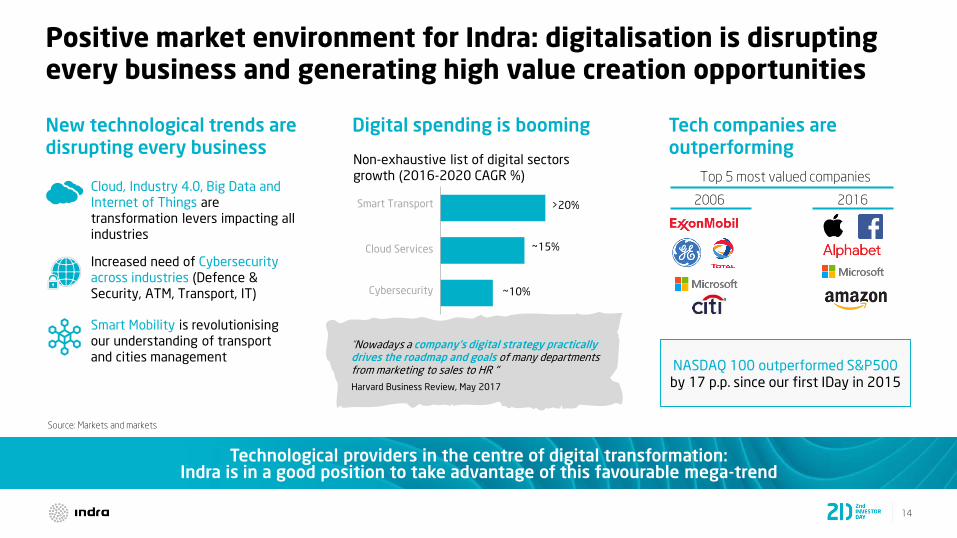
Positive market environment for Indra: digitalisation is disrupting every business and generating high value creation opportunities
Tech companies are outperforming
Digital spending is boomingNew technological trends are disrupting every business
Technological providers in the centre of digital transformation:Indra is in a good position to take advantage of this favourable mega-trend
"Nowadays a company's digital strategy practically drives the roadmap and goals of many departments from marketing to sales to HR " .
Harvard Business Review, May 2017
NASDAQ 100 outperformed S&P500by 17 p.p. since our first IDay in 2015
Top 5 most valued companies
2006 2016
Cybersecurity
Smart Transport >20%
Cloud Services ~15%
~10%
Non-exhaustive list of digital sectors
growth (2016-2020 CAGR %)Cloud, Industry 4.0, Big Data and
Internet of Things are
transformation levers impacting all
industries
Smart Mobility is revolutionising
our understanding of transport
and cities management
Increased need of Cybersecurity
across industries (Defence &
Security, ATM, Transport, IT)
Source: Markets and markets
15
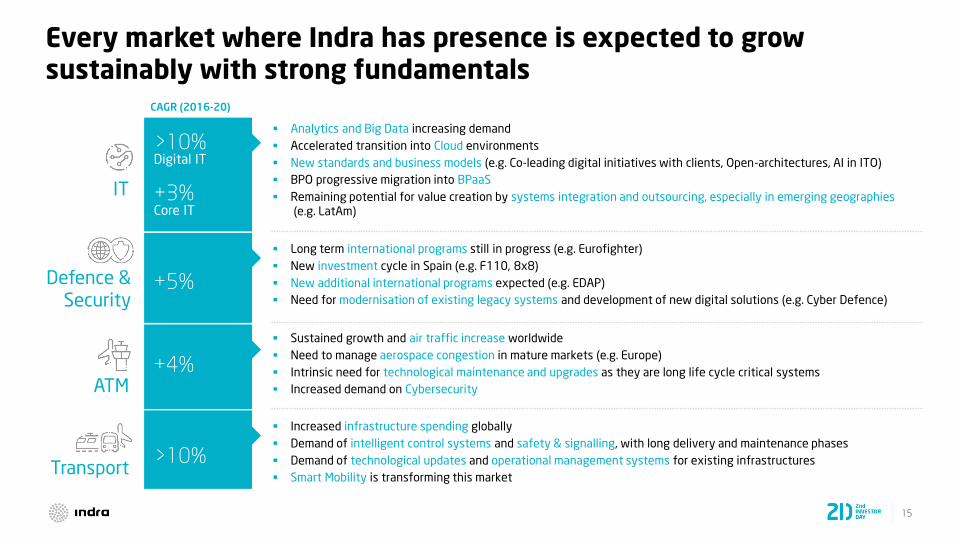
Every market where Indra has presence is expected to grow sustainably with strong fundamentals
Long term international programs still in progress (e.g. Eurofighter)
New investment cycle in Spain (e.g. F110, 8x8)
New additional international programs expected (e.g. EDAP)
Need for modernisation of existing legacy systems and development of new digital solutions (e.g. Cyber Defence)
Analytics and Big Data increasing demand
Accelerated transition into Cloud environments
New standards and business models (e.g. Co-leading digital initiatives with clients, Open-architectures, AI in ITO)
BPO progressive migration into BPaaS
Remaining potential for value creation by systems integration and outsourcing, especially in emerging geographies(e.g. LatAm)
Sustained growth and air traffic increase worldwide
Need to manage aerospace congestion in mature markets (e.g. Europe)
Intrinsic need for technological maintenance and upgrades as they are long life cycle critical systems
Increased demand on Cybersecurity
Increased infrastructure spending globally
Demand of intelligent control systems and safety & signalling, with long delivery and maintenance phases
Demand of technological updates and operational management systems for existing infrastructures
Smart Mobility is transforming this market
IT
Defence &Security
ATM
Transport
>10%Digital IT
+3%Core IT
+5%
+4%
>10%
CAGR (2016-20)

16
In order to ensure Indra's profitable growth under this positive environment we have defined our 2018-2020 Strategic Plan
Greater focus, accountability,agility and flexibility
Healthy sales growth
Marginenhancement
New Specialised Operating Model
Ongoing Productivity Upgrades
Product
Portfolio
Evolution
Segmented
Commercial
Processes
02 03
04
01
17
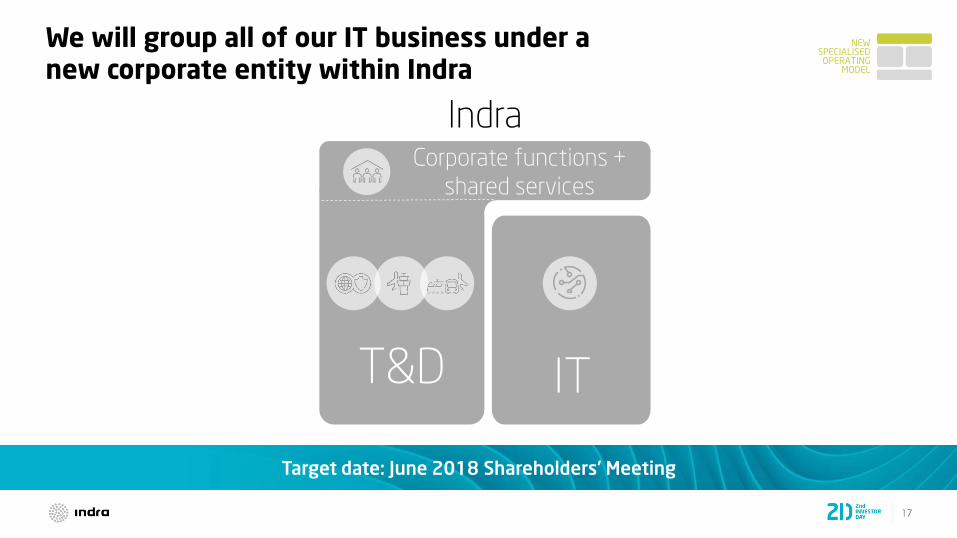
We will group all of our IT business under a new corporate entity within Indra
Target date: June 2018 Shareholders' Meeting
NEW SPECIALISED OPERATING
MODEL
Indra
T&D
Corporate functions +
shared services
IT

18
Within our portfolio, IT and T&D businesses have different competitive dynamics
T&DIT
IT and T&Dmarkets have different dynamics
Indra has a different positioning in IT and T&D
Many IT services, room to keep strengthening
proprietary products
Leading proprietary products, room to
develop services offering
Room to reinforce international awareness Strong global brand in our niche
marketsBrand positioning
International presence focused on LatAm Diversified global footprintGeographic footprint
Still needs transformation Priority is global growthNeed for transformation
Consulting firms and IT specialists Equipment manufacturers
Lower entry barriers Higher entry barriers
Core competition
High relevance of private clients Public clients are criticalClient profile
Accelerated transformation with digitalisation Increasing speed of change due to
digitalisation, but still slower than in
IT
Speed of change
NEW SPECIALISED OPERATING
MODEL
Offering

19
By incorporating our IT business into a fully-owned subsidiary we intend to gain focus, accountability, agility and flexibility
Operational synergies Corporate services will continue to be shared to leverage the
scale effect and without losing synergies
Economies of scale within the T&D and the IT business (in
Offering Development, Cross-Selling and Production) will be
totally captured
Improved strategic flexibility Easier potential alliances, joint-ventures and M&A
Increased management focus and accountability Businesses split facilitates specialisation (e.g. more focused
international commercial activity)
Split allows for clearer accountabilities
Increased agility and time-to-market Simplified management structure within the new division
Decision-making and execution processes will be faster and
better suited to each single business needs
~
NEW SPECIALISED OPERATING
MODEL
Indra
T&D
Corporate functions +
shared services
IT

20
As well as our clients transform themselves, there are other areas we will work on to better support our businesses growth
Talent and Culture
New compensation models, development plans and career paths
Intensified screening and recruiting efforts (e.g. reinforce capabilities in digital and specific verticals, increase juniors base and their affiliation)
Internal HR processes automation and enhanced analytics for people management
Internal IT Systems
Enhanced employees' digital environment
More agile self-service approach within a new data ecosystem
Evolved Back Office platforms facilitating their integration with the different business applications
Innovation
Foster both external and intra-corporate entrepreneurship through our Corporate Venture Capital
Reinforce our University collaboration network
R&D increase within the EU Framework Program for Research and Innovation
Control and Risk Management
New technologies to maximise predictability, using advanced data analytics in forecasts, continuous monitoring mechanisms and preventive alerts
Reinforced risk management, optimising risk-control trade-off and introducing preventive control
Marketing Increase awareness of our Minsait brand as our high value IT vehicle
accelerates growth out of our home market
Consolidation of the already globally recognised Indra brand for T&D
NEW SPECIALISED OPERATING
MODEL
Reduced rotation
Stronger accountability
Reinforced talent
Increased telecommuting
Data-driven management
More agile decision making
Higher predictability
Earlier warnings
Increased digital growth
Higher sales in proprietary-products based solutions
Advantaged position to incorporate new capabilities and offering

21
• Deploy Lean manufacturing, Lean IT production and apply Automation
• Extend scope of our Global Business Services and rationalise our indirect costs base
• Intensify our Pyramid management and Delayering
• Optimise procurement
Product Portfolio Evolution, Segmented Commercial Processes and Ongoing Productivity Upgrades will produce profitable growth
Ongoing Productivity UpgradesProduct
Portfolio EvolutionSegmented Commercial
Processes
• Invest to reinforce those productswhere we already have a leading position
• Apply digital technologies to further position our offering in the smart ecosystem
• Complement selectively our proprietary products portfolio to sell complete end-to-end solutions
• Increase commercial intensity with strong incentives and systematic tools
• Apply a segmented commercial approach with new more specialised profiles
• Establish alliances / JVs for commercial acceleration in selected geographies
22
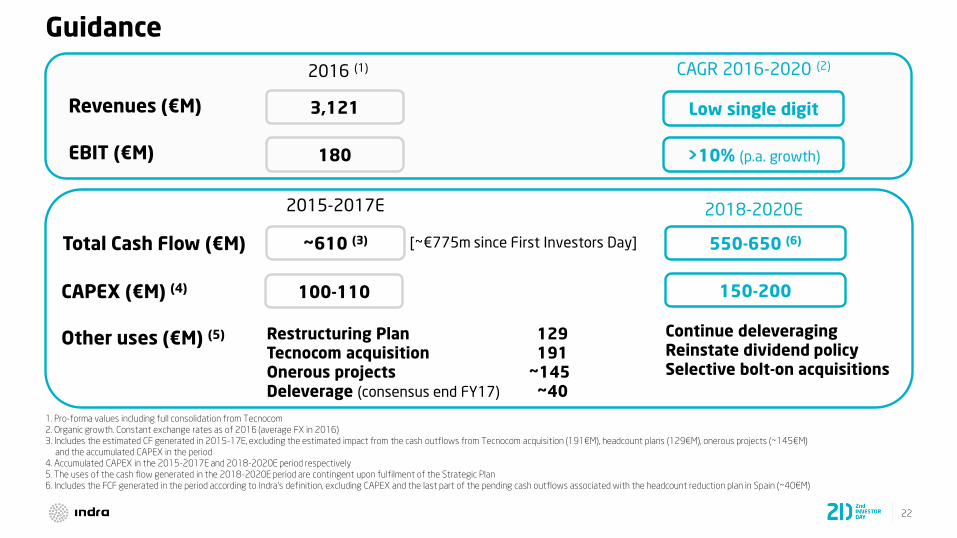
Guidance
Other uses (€M) (5)
2015-2017E
CAPEX (€M) (4)
1. Pro-forma values including full consolidation from Tecnocom
2. Organic growth. Constant exchange rates as of 2016 (average FX in 2016)
3. Includes the estimated CF generated in 2015-17E, excluding the estimated impact from the cash outflows from Tecnocom acquisition (191€M), headcount plans (129€M), onerous projects (~145€M)
and the accumulated CAPEX in the period
4. Accumulated CAPEX in the 2015-2017E and 2018-2020E period respectively
5. The uses of the cash flow generated in the 2018-2020E period are contingent upon fulfilment of the Strategic Plan
6. Includes the FCF generated in the period according to Indra’s definition, excluding CAPEX and the last part of the pending cash outflows associated with the headcount reduction plan in Spain (~40€M)
~610 (3)
100-110
550-650 (6)
150-200
Restructuring Plan 129Tecnocom acquisition 191Onerous projects ~145Deleverage (consensus end FY17) ~40
2018-2020E
Continue deleveragingReinstate dividend policySelective bolt-on acquisitions
Revenues (€M)
EBIT (€M)
CAGR 2016-2020 (2)
3,121
180
Low single digit
>10% (p.a. growth)
2016 (1)
Total Cash Flow (€M) [~€775m since First Investors Day]
23
T&D: Introduction and General Overview
Javier de Andrés
2

24
Indra has a portfolio of leading proprietary solutions in T&D
Revenue Collection Control & Enforcement Safety & Signalling
Transport
281
(24%)
1,188
Defence &Security
302
(25%)
ATM
LTM Sep 2017
606
(51%)
Transport
Defence & Security
Air Defence & Border Surveillance
Electronic Warfare SimulationSatellite
Communications
ATM
ATM systems Communications Navigation Surveillance
Indra is a global reference in many of these technological niche markets
Operational systems

25
Since 2014 Defence & Security and ATM outperformed while Transport underperformed
526606
271
281
399302
2014
1,196
ATM
Transport
LTM Sep 17
1,188
Defence & Security
Defence & Security
• Grew above expectations with healthy margins throughout the period
• Solid pipeline identified (quality pipeline 3Q2017 +20% vs 2015) with ~2.3€Bn opportunities
Transport• Did not perform as expected due to a number of onerous projects and
management issues
• ~90M€ impact on EBIT 2015-2017 due to restructuring needs and expected ~1/5 of sales 0% margin in 2017
• Sales decrease stabilising
• Solid pipeline identified (~1.7€Bn)
• Grew with healthy margins throughout the period
• Good performance expected in full year 2017
• Solid pipeline identified with ~0.9€Bn opportunities
ATM
Sales, €M
+1% CAGR
+5%CAGR
-10% CAGR
26
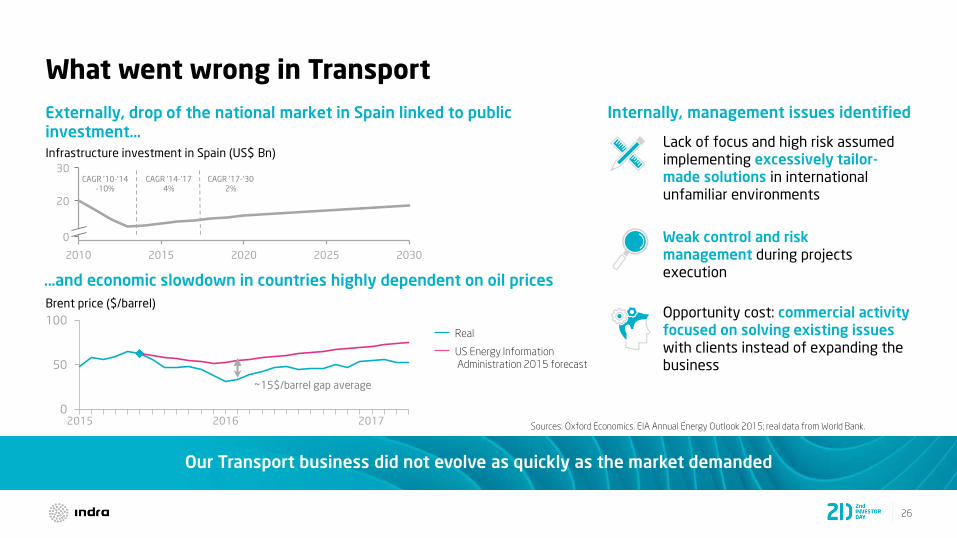
Our Transport business did not evolve as quickly as the market demanded
0
50
100
20172015 2016
Lack of focus and high risk assumed implementing excessively tailor-made solutions in international unfamiliar environments
Weak control and risk management during projects execution
Opportunity cost: commercial activity focused on solving existing issues with clients instead of expanding the business
2010 2015 2020 2025 2030
0
20
30
Real
US Energy Information
Administration 2015 forecast
Internally, management issues identifiedExternally, drop of the national market in Spain linked to public investment…
Infrastructure investment in Spain (US$ Bn)
Brent price ($/barrel)
…and economic slowdown in countries highly dependent on oil prices
Sources: Oxford Economics. EIA Annual Energy Outlook 2015; real data from World Bank.
CAGR '10-'14-10%
CAGR '14-'174%
CAGR '17-'302%
~15$/barrel gap average
What went wrong in Transport
27
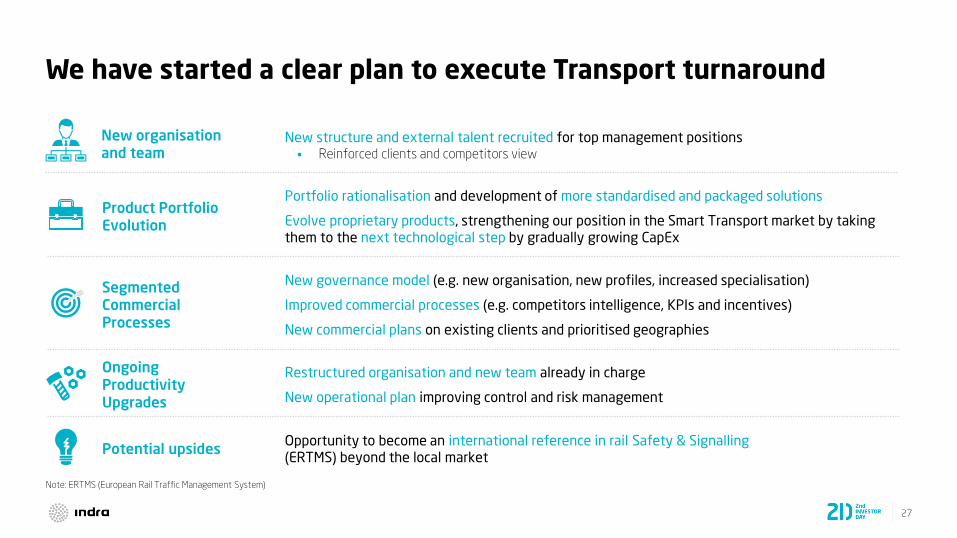
We have started a clear plan to execute Transport turnaround
Portfolio rationalisation and development of more standardised and packaged solutions
Evolve proprietary products, strengthening our position in the Smart Transport market by taking them to the next technological step by gradually growing CapEx
Product Portfolio Evolution
New organisation and team
New governance model (e.g. new organisation, new profiles, increased specialisation)
Improved commercial processes (e.g. competitors intelligence, KPIs and incentives)
New commercial plans on existing clients and prioritised geographies
Segmented Commercial Processes
Opportunity to become an international reference in rail Safety & Signalling (ERTMS) beyond the local market
Potential upsides
Restructured organisation and new team already in charge
New operational plan improving control and risk management
Ongoing Productivity Upgrades
New structure and external talent recruited for top management positions• Reinforced clients and competitors view
Note: ERTMS (European Rail Traffic Management System)
28
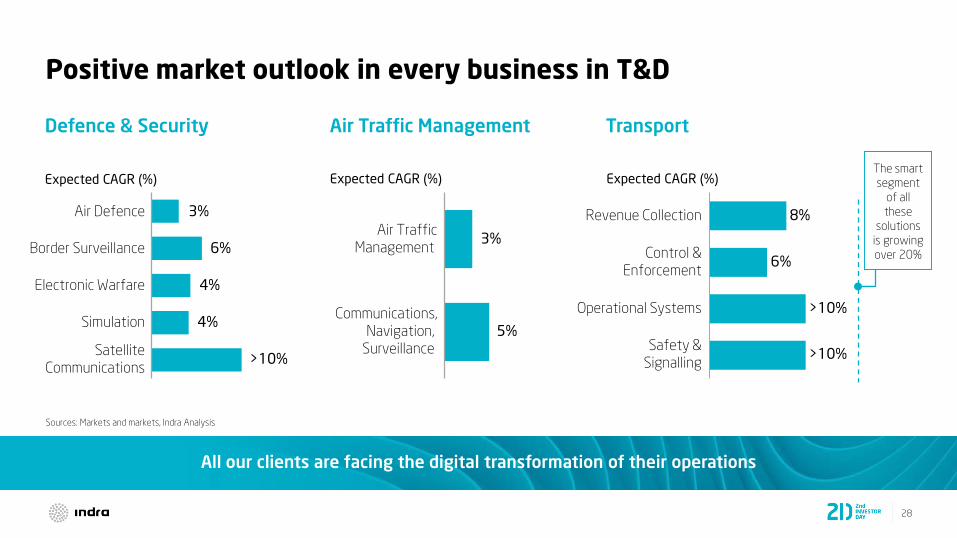
All our clients are facing the digital transformation of their operations
Positive market outlook in every business in T&D
Satellite
Communications>10%
Simulation 4%
Electronic Warfare 4%
Border Surveillance 6%
Air Defence 3%
Safety &
Signalling>10%
Operational Systems >10%
Control &
Enforcement6%
Revenue Collection 8%
Sources: Markets and markets, Indra Analysis
TransportAir Traffic ManagementDefence & Security
Communications,
Navigation,
Surveillance
5%
Air Traffic
Management 3%
The smart
segment
of all
these
solutions
is growing
over 20%
Expected CAGR (%)Expected CAGR (%) Expected CAGR (%)
29
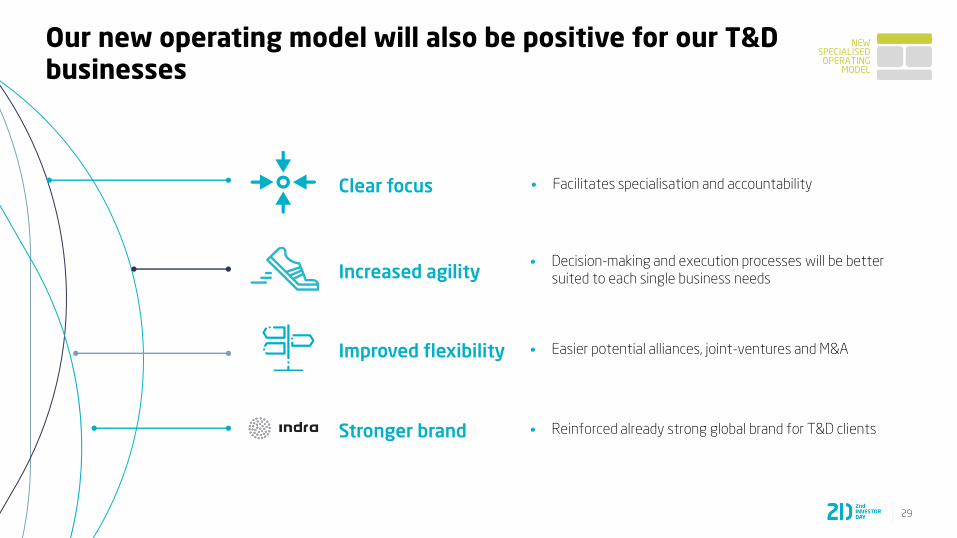
Our new operating model will also be positive for our T&Dbusinesses
• Reinforced already strong global brand for T&D clientsStronger brand
• Easier potential alliances, joint-ventures and M&AImproved flexibility
• Facilitates specialisation and accountabilityClear focus
• Decision-making and execution processes will be better
suited to each single business needsIncreased agility
NEW SPECIALISED OPERATING
MODEL
30
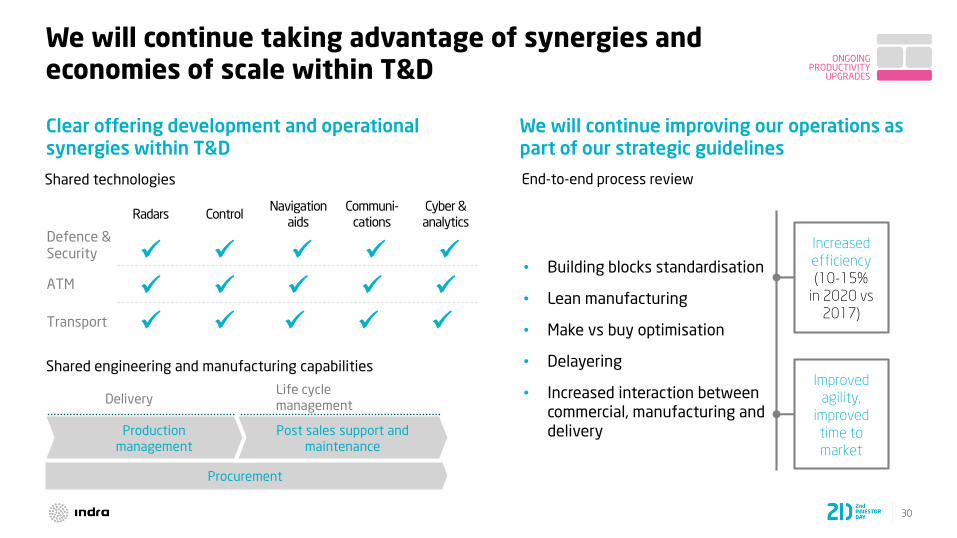
Shared engineering and manufacturing capabilities
Shared technologies
We will continue taking advantage of synergies and economies of scale within T&D
Clear offering development and operational synergies within T&D
Radars ControlNavigation
aids
Communi-
cations
Cyber &
analytics
Procurement
Production
management
Post sales support and
maintenance
DeliveryLife cycle
management
Defence & Security
ATM
Transport
We will continue improving our operations as part of our strategic guidelines
Increased
efficiency
(10-15%
in 2020 vs
2017)
• Building blocks standardisation
• Lean manufacturing
• Make vs buy optimisation
• Delayering
• Increased interaction between commercial, manufacturing and delivery
End-to-end process review
Improved
agility,
improved
time to
market
ONGOING PRODUCTIVITY
UPGRADES
31
Defence & Security
Manuel Escalante
2.1
32
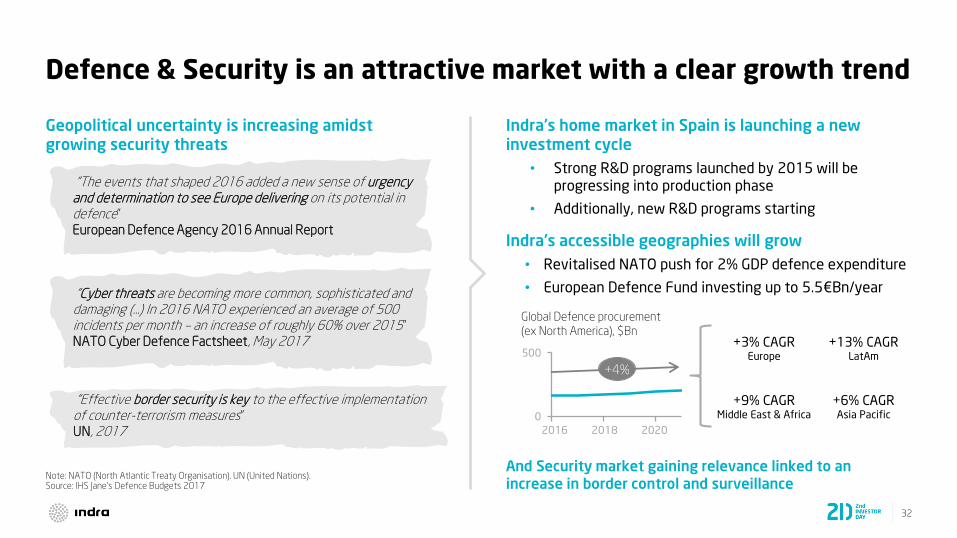
Defence & Security is an attractive market with a clear growth trend
Indra's accessible geographies will grow
• Revitalised NATO push for 2% GDP defence expenditure
• European Defence Fund investing up to 5.5€Bn/year
Geopolitical uncertainty is increasing amidst growing security threats
"Cyber threats are becoming more common, sophisticated and damaging (…) In 2016 NATO experienced an average of 500 incidents per month – an increase of roughly 60% over 2015"
NATO Cyber Defence Factsheet, May 2017
"The events that shaped 2016 added a new sense of urgency and determination to see Europe delivering on its potential in defence"
European Defence Agency 2016 Annual Report
0
500
20202016 2018
Global Defence procurement
(ex North America), $Bn
+4%
Indra's home market in Spain is launching a new investment cycle
• Strong R&D programs launched by 2015 will be progressing into production phase
• Additionally, new R&D programs starting
+3% CAGREurope
+13% CAGRLatAm
+9% CAGRMiddle East & Africa
+6% CAGRAsia Pacific
Note: NATO (North Atlantic Treaty Organisation). UN (United Nations). Source: IHS Jane's Defence Budgets 2017
"Effective border security is key to the effective implementation of counter-terrorism measures"
UN, 2017
And Security market gaining relevance linked to an increase in border control and surveillance

33
Defence & Security is a long maturity market, with still ongoing high volume programs and local programs entering into production
A400M
2003-2024
NH90
1992-2024
Tiger
1988-…
Eurofighter
1986-…
There have been significant developments linked with the new Spanish investment cycle
Existing long-term high volume programs are still in progress
SST
2003-2024
Note: DASS (Defensive Aids Sub-System). DIRCM (Directional Infrared Counter Measures). CAS (Close Air Support).
SST (Space Surveillance & Tracking)
Integrated
frigate mast
• 90€M in R&D phase
• ~350€M in
production phase
Electronic
warfare system
• ~350€M project,
not including
associated
platforms
Space surveillance
radar
• 15€M R&D
• ~340€M
production
project, with EU
funding
Vehicle systems
• 28€M in R&D
phase
• ~500€M in
production phase
Sustainment, sales and export opportunities
Future upgrades of main subsystems (e.g. radar, DASS)
Systems (e.g. DIRCM) and simulation
Systems (e.g. CAS)
and aftermarket
+8x8
2015-2026
F110
2014-2026
Santiago
2015-…

34
Indra is a significant European player with a proven track record, and with an already relevant international business
Air Defense Electronic Warfare
Airborne
Platforms
•BPE
•BAC
•BAM
•FFG
•F122
•K130
•Eurofighter
•A400M
•C-295
•F/A-18
•F1
•NH90
•P3
•B707
Naval
Platforms
•Chinook
•CH53
•Tigre
•Cougar
•U212/214
•T-209
•OPV
•F100
•F105
•S70
Land based
Air Defence Electronic Warfare
Border Surveillance
Border Surveillance
Naval
Land
based
•BPE
•BAC
•BAM
•F100
•F105
•FFG
•S70
•S80
•F122
•K130
•U212
•U214
•T-204
•AWD
•ASW
•OPV
Satellite Communications
•Eurofighter
•A400M
•A330 MRTT
•F-18
•AV-8B
•Tiger
•Seahawk
•NH90
•Wildcat
Simulation
•Chinook
•Cougar
•H135
•H225
•H175
•H145
•A320
•B737…
Military Simulation
35
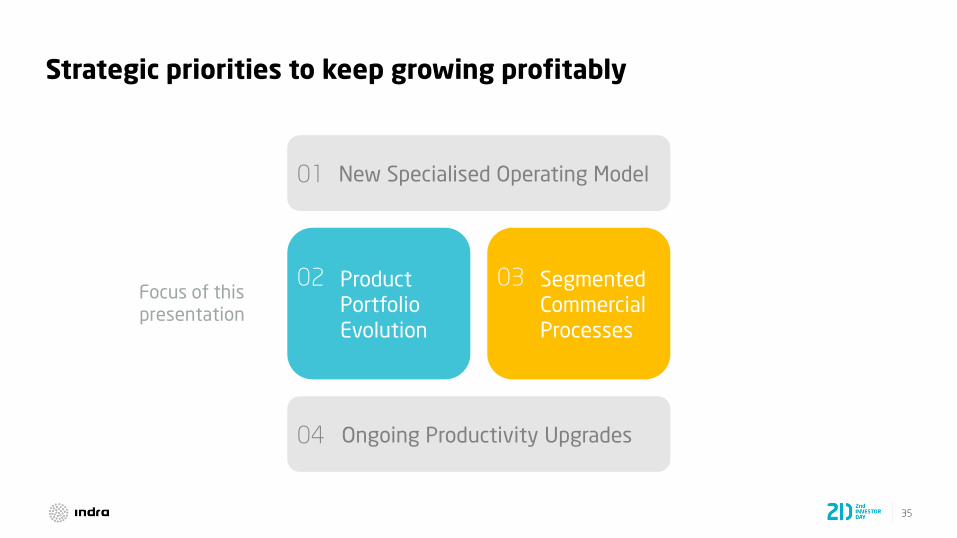
Strategic priorities to keep growing profitably
New Specialised Operating Model
Ongoing Productivity Upgrades
Product
Portfolio
Evolution
Segmented
Commercial
Processes
02 03
04
01
Focus of this presentation

36
We are evolving our offering and applying disruptive digital technology
Enhance existing offering applying disruptive digital technologies, with analytics, IoT… (e.g. Big Data in Border Control)
Extend our as-a-service offering adopting more flexible per-use pricing models (e.g. flying hours training in
Simulation) and offering alternative financing structures
Prospect new emerging segments (e.g. anti-UAV systems or UAV/USV platforms)
Further develop our Cyber Defence solution strengthening its positioning (e.g. reinforcing our Cyber Range)
Leverage our advanced existing offering, adapting it to modernise 3rd party legacy systems (e.g. T54 Optronics)
Further standardise our solutions applying a product-based approach, instead of a tailor-made approach
Complete current offering to sell end-to-end solutions and integrated suites leveraging proprietary products
(e.g. SIMBA Suite)
Adopt a sustainment approach positioning our offering along the whole life cycle and leveraging existing
installed assets base
Tier 1 position in attractive segments
Increased value added to the client Accelerated growth
StrongerSolutions…
…with extended applications…
…while positioning in new products and
service models
We will gradually grow our CapEx in our product portfolio in 3 years
PRODUCT PORTFOLIO EVOLUTION
Note: USV (Unmanned Surface Vehicle)

37
We will grow our international sales selectively
Specific commercial action plans per solution and strengthened alliances with platform integrators
Specific action plans
(e.g. Borders, Simulation)
END USER
Naval LandAir
Special focus on markets with high potential
• Europe, as extended home market
• Specific LatAm countries (e.g. Colombia, Ecuador)
• Asia, Middle East and Oceania
Develop strategic alliances with local partners
• Offering our full portfolio
• Gaining recurrence
Approach Aftermarket where local installed base and recurrence have enough scale for a sustainable business
Strengthened commercial action in target geographies
We already identified a solid pipeline (~2.3€Bn) to sustain future growth
Strengthen existing +
new alliances with
platform integrators
SEGMENTED COMMERCIAL
PROCESSES

38
1. Organic growth. Constant exchange rates as of 2016 (average FX in 2016) Source: Indra
Guidance: our strategic guidelines will support our profitable growth
Mid to high single
digit
599€MRevenues 2016
CAGR1 (16-20)
Already identified ~2.3€Bn pipeline
and our expected strong backlog in 2020 (~1.6€Bn)
pave the way for sustained future growth
New Specialised Operating Model
Ongoing Productivity Upgrades
Product
Portfolio
Evolution
Segmented
Commercial
Processes
02 03
04
01
Excluding
2018
Eurofighter
revenues fall
39
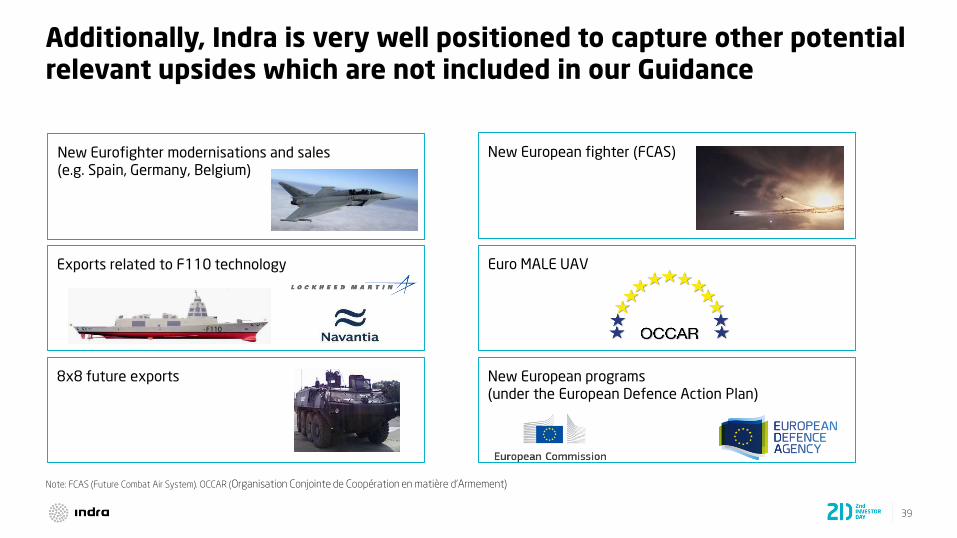
Additionally, Indra is very well positioned to capture other potential relevant upsides which are not included in our Guidance
New European fighter (FCAS)New Eurofighter modernisations and sales (e.g. Spain, Germany, Belgium)
8x8 future exports New European programs (under the European Defence Action Plan)
Exports related to F110 technology
F110
Euro MALE UAV
Note: FCAS (Future Combat Air System). OCCAR (Organisation Conjointe de Coopération en matière d'Armement)
40
ATM
Gonzalo Gavín
2.2

41
ATM is a growing market with very strong fundamentals
Expected stable ~4% growth in the ATM market
10
20
30
0
7
17
2016
Passenger traffic (RPKs Bn)
4.7%
2036
Note: RPKs (Revenue per kilometre). Source: Boeing Market Outlook 2017-2036; Markets and markets; Global airport construction review, CAPA
Maintenance and replacementof legacy systems
• Very long development cycles,
high client loyalty
Potential new ATM systems operators
• Already ~400 airports under
construction or planned for
Innovative technology to solve aerospace congestion (e.g. Europe)
Increase of air passenger traffic worldwide
Increase of flying aircrafts worldwide
3 drivers of sustained demand for ATM systems
80
0
20
60
40
23
Aircrafts in service worldwide (k)
2016
47
3.5%
2036

42
Indra provides its clients with a complete technological roadmap of critical ATM systems
Indra provides reliable end-to-end solutions to operators in the ATM market
Being a leading reference as a supplier providing end-to-end solutions
Providing reliable technology for the key critical systems of the ATM business
• Highly sophisticated and reliable technology
• Increased demand of cyber-secure technology
Developing long lasting relationships with international reference clients
• Enaire in Spain 35 years
• DFS in Germany 20 years
• NATS in the UK 10 years
Indra has a leading position globally in Control Centres, Navigation and Surveillance
Control Centres with Advanced Automation Systems (iTEC and managAir)
ATM
CNS
Surveillance with Secondary Radars (MSSR)
Navigation with Instrument Landing Systems (ILS)

43
Indra is the leading player in the Single European Sky with the iTEC system...
Europe has a challenge in air traffic management due to air traffic congestion and the fragmentation of aerospace
Note: SESAR (Single European Sky ATM Research)
iTEC by Indra
Coflight
Coopans
Other potential
iTEC partners
In 2004 Eurocontrol, the European Commission and a selection of industrial partners took the lead to solve this issue and increase interoperability
Indra is one of the key industrial partners of SESAR
7 European countries have already joined the iTEC Alliance along with Indra to fulfil present and future SESARrequirements, and +20 countries still pending to adopt a decision
44
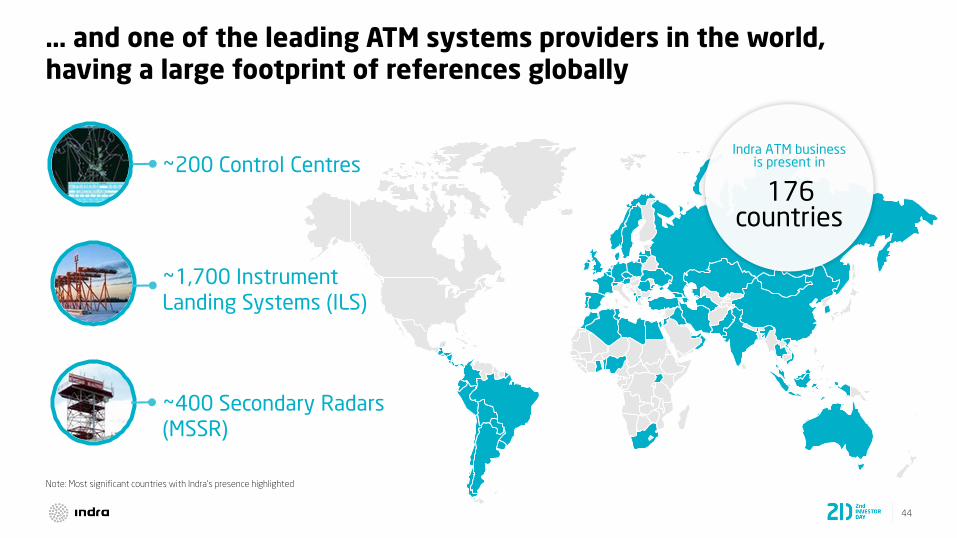
… and one of the leading ATM systems providers in the world, having a large footprint of references globally
~200 Control Centres
~1,700 Instrument
Landing Systems (ILS)
~400 Secondary Radars
(MSSR)
Note: Most significant countries with Indra's presence highlighted
Indra ATM businessis present in
176 countries

45
Strategic priorities to keep growing profitably
Focus of this presentation
New Specialised Operating Model
Ongoing Productivity Upgrades
Product
Portfolio
Evolution
Segmented
Commercial
Processes
02 03
04
01

46
We are evolving and expanding our offering into new segments
Further develop remote
towers to be a reference
supplier, leveraging SESAR
Indra already has leading
technology installed
(e.g. Norway)
Grow on aftermarket
leveraging our
significant asset base of
~200 control centres,
~1700 ILS and ~400
radars installed
Develop leading
Cybersecurity
technology,
fulfilling latent
demand
Successfully evolve iTEC
with the future
requirements of the Single
European Sky, leading the
SESAR interoperability
Evolve CNS products
and service model (e.g.
GBAS) to maintain the
technological and
commercial leading
position
Expanding into new segments to complement Indra's offering
Keep evolving leading products in current segments with technological updates
Note: ILS (Instrument Landing System). GBAS (Ground Based Augmentation Systems). ADS–B (Automatic dependent surveillance – broadcast). SESAR (Single European Sky ATM Research)
We will gradually grow our CapEx in our product portfolio in 3 years
PRODUCT PORTFOLIO EVOLUTION
47
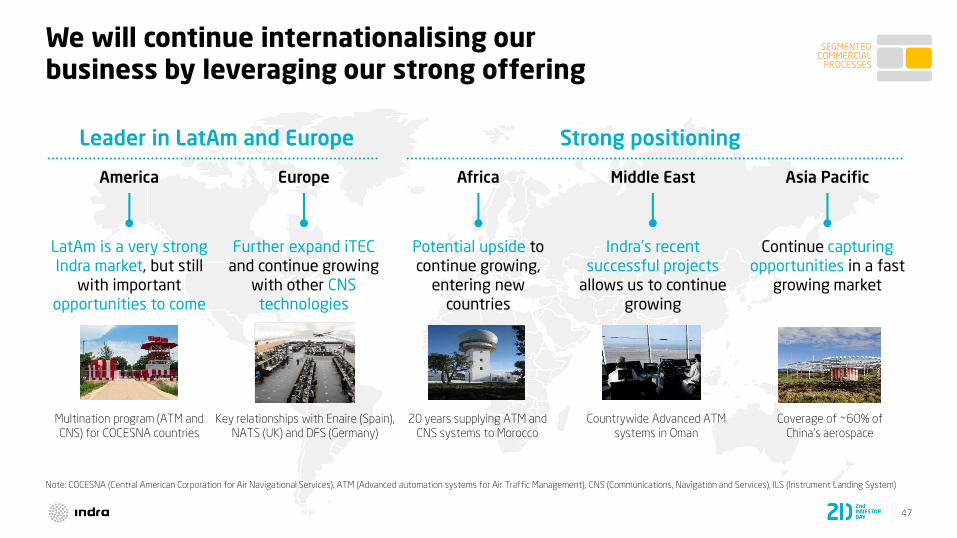
We will continue internationalising our business by leveraging our strong offering
LatAm is a very strong
Indra market, but still with important
opportunities to come
America
Further expand iTEC
and continue growing with other CNS technologies
Europe
Potential upside to
continue growing, entering new
countries
Africa
Indra's recent
successful projectsallows us to continue
growing
Middle East
Continue capturing
opportunities in a fast growing market
Asia Pacific
Strong positioningLeader in LatAm and Europe
SEGMENTED COMMERCIAL
PROCESSES
Multination program (ATM and
CNS) for COCESNA countries
20 years supplying ATM and
CNS systems to Morocco
Countrywide Advanced ATM
systems in Oman
Coverage of ~60% of
China's aerospace
Note: COCESNA (Central American Corporation for Air Navigational Services). ATM (Advanced automation systems for Air Traffic Management), CNS (Communications, Navigation and Services), ILS (Instrument Landing System)
Key relationships with Enaire (Spain),
NATS (UK) and DFS (Germany)

48
Guidance: our strategic guidelines will support our profitable growth
Mid single digit
270€MRevenues 2016
CAGR1 (16-20)
1. Organic growth. Constant exchange rates as of 2016 (average FX in 2016). Source: Indra
New Specialised Operating Model
Ongoing Productivity Upgrades
Product
Portfolio
Evolution
Segmented
Commercial
Processes
02 03
04
01
49
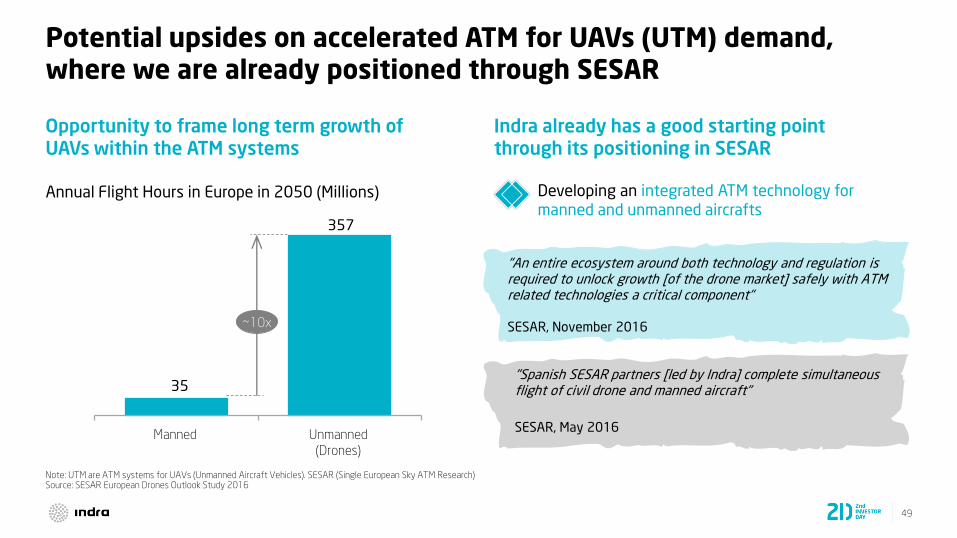
Potential upsides on accelerated ATM for UAVs (UTM) demand, where we are already positioned through SESAR
"An entire ecosystem around both technology and regulation is required to unlock growth [of the drone market] safely with ATM related technologies a critical component"
SESAR, November 2016
35
357
Manned Unmanned
(Drones)
~10x
Opportunity to frame long term growth of UAVs within the ATM systems
Indra already has a good starting point through its positioning in SESAR
Annual Flight Hours in Europe in 2050 (Millions)
Note: UTM are ATM systems for UAVs (Unmanned Aircraft Vehicles). SESAR (Single European Sky ATM Research) Source: SESAR European Drones Outlook Study 2016
"Spanish SESAR partners [led by Indra] complete simultaneous flight of civil drone and manned aircraft"
SESAR, May 2016
Developing an integrated ATM technology for manned and unmanned aircrafts

50
Transport
Berta Barrero
2.3

51
Change in infrastructure operating models are generating additional opportunities
Increased demand for intelligent systems adapting to the coming trend of Smart Transport
• Requiring mobility, interconnectivity and real time
steering
More flexible asset management demand is requiring new systems
• More efficient and scalable
New opportunities for private players, as public administrations are externalising their operations and sharing risks (PPPs)
Change of cycle in infrastructure investment and therefore increased technology demand
+5% growth in global
investment
for Transport
infrastructure
expected until 2025
Changed trend in
Spanish infrastructure
investment
• -4% growth 2010-2014
• +2% growth 2015-2025
Indra has the perfect mix: transport business
know-how, proprietary products and digital capabilities
+10% expected growth
(+20% for Smart Transport)
Transport infrastructure technology demand increased by
• New investment cycle
• Need for maintenance and upgrade of already existing
infrastructure
+
Very attractive technology Transport market, entering into a phase of expansion
Source: Oxford Economics, Assessing the global transport infrastructure market

52
Indra's solutions
Safety & Signalling
Control & Enforcement
Revenue Collection
Operational Systems
Indra's positioning
• 1 of 3 incumbents in ASFA-D
• ERTMS
Transport segments for Indra's solutions
Rail
Urban
Inter-urban
Airports
Ports
Leading position
Leading position
Leading position
Indra has a complete portfolio consisting on 4 key solutions with relevant positioning...
Solid portfolio leveraging Indra's digital capabilitiesNote: ASFA-Digital (Safety & Signalling System), ERTMS (European Rail Traffic Management System)

53
Revenue Collection
Control & Enforcement
OperationalSystems
Safety & Signalling
T-Mobilitat, Spain
• Biggest integration
fare & contactless
project
Nation-wide Road Traffic
Control Centre, Spain
• Spanish traffic
management
Port Community
System, Portugal
• National port
network installation
High Speed, Spain
• Rail communications
& surveillance
Riyadh Ticketing
• Biggest greenfield
contactless ticketing
worldwide
Urban Tunnels Control
Centre, UK
• Iconic and complex due
to London constraints
High Speed
Mecca – Medina, Arabia
• Most complex project
in Middle East
Sydney Trains, Australia
• Advanced security
system
Ticketing, The
Netherlands
• Innovative AFC
machines
Tunnel Control Centre,
UK
• New smart trends in
traffic management
High Speed Rail Control
Centre, Spain
• Worldwide showroom
ASFA-D, Spain
• High end solution for
traditional rail safety in
Spain
... with strong references in the most innovative projects globally
Note: ASFA-Digital (Safety & Signalling System)

54
Strategic priorities to keep growing profitably
Focus of this presentation
New Specialised Operating Model
Ongoing Productivity Upgrades
Product
Portfolio
Evolution
Segmented
Commercial
Processes
02 03
04
01
55
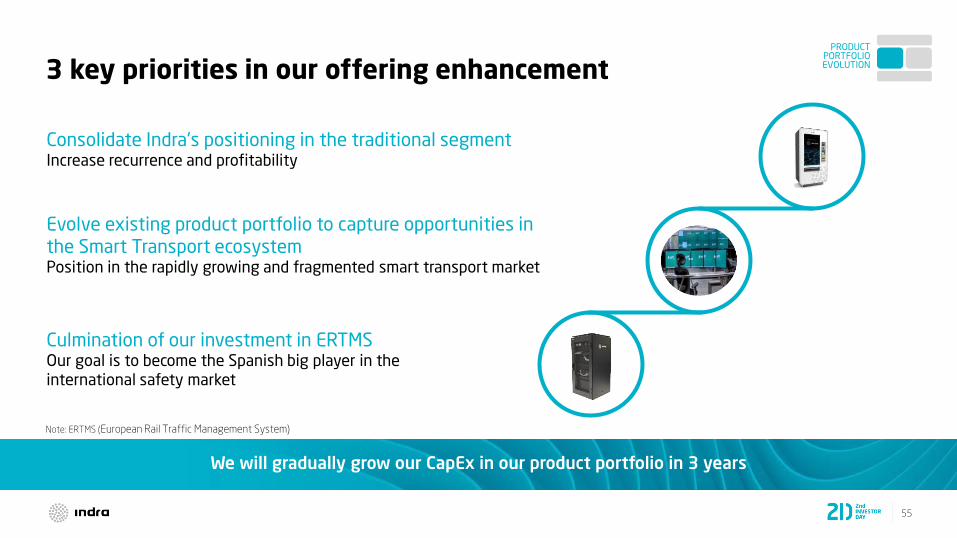
We will gradually grow our CapEx in our product portfolio in 3 years
Consolidate Indra's positioning in the traditional segmentIncrease recurrence and profitability
Evolve existing product portfolio to capture opportunities in the Smart Transport ecosystemPosition in the rapidly growing and fragmented smart transport market
Culmination of our investment in ERTMSOur goal is to become the Spanish big player in the
international safety market
3 key priorities in our offering enhancementPRODUCT
PORTFOLIO EVOLUTION
Note: ERTMS (European Rail Traffic Management System)
56
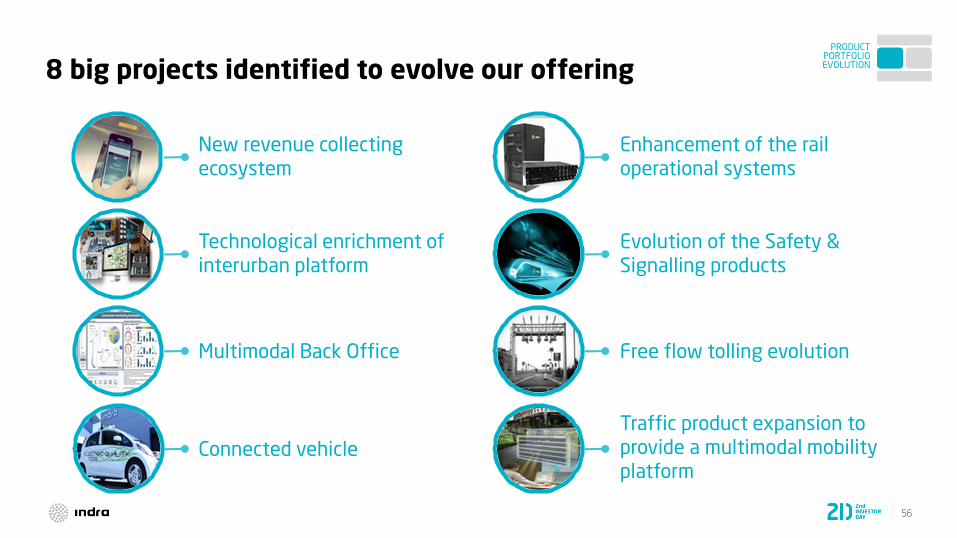
New revenue collecting ecosystem
Enhancement of the rail operational systems
Evolution of the Safety & Signalling products
Technological enrichment of interurban platform
Multimodal Back Office Free flow tolling evolution
Traffic product expansion to provide a multimodal mobility
platform Connected vehicle
8 big projects identified to evolve our offeringPRODUCT
PORTFOLIO EVOLUTION
57
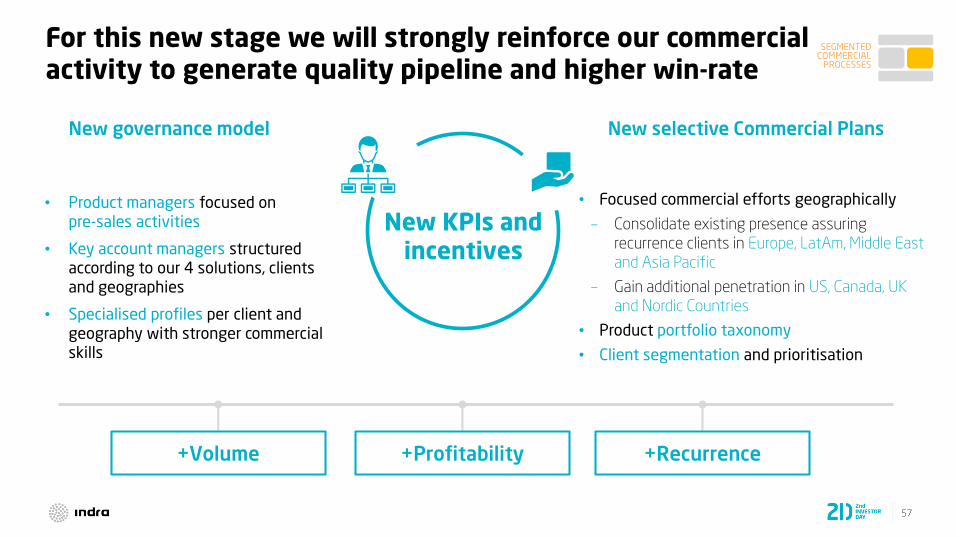
For this new stage we will strongly reinforce our commercial activity to generate quality pipeline and higher win-rate
New governance model New selective Commercial Plans
+Volume +Profitability +Recurrence
• Product managers focused on
pre-sales activities
• Key account managers structured according to our 4 solutions, clients and geographies
• Specialised profiles per client and geography with stronger commercial skills
• Focused commercial efforts geographically
– Consolidate existing presence assuring
recurrence clients in Europe, LatAm, Middle East
and Asia Pacific
– Gain additional penetration in US, Canada, UK
and Nordic Countries
• Product portfolio taxonomy
• Client segmentation and prioritisation
New KPIs and incentives
SEGMENTED COMMERCIAL
PROCESSES
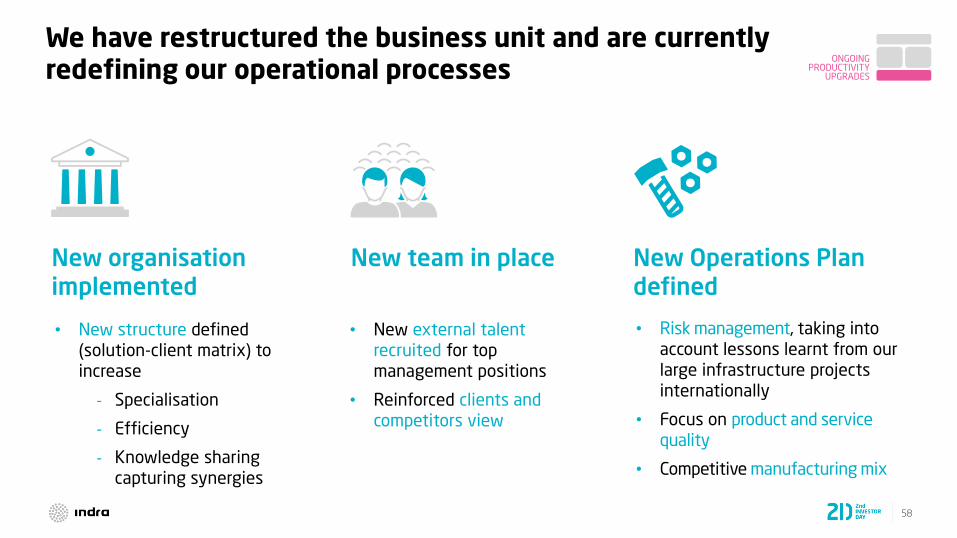
58
New team in place New Operations Plan defined
New organisationimplemented
• New structure defined
(solution-client matrix) to
increase
- Specialisation
- Efficiency
- Knowledge sharing
capturing synergies
• New external talent
recruited for top
management positions
• Reinforced clients and
competitors view
• Risk management, taking into
account lessons learnt from our
large infrastructure projects
internationally
• Focus on product and service
quality
• Competitive manufacturing mix
We have restructured the business unit and are currently redefining our operational processes
ONGOING PRODUCTIVITY
UPGRADES
59
Leveraging the following positive factors:
Strong international references and innovative projects
Indra's strong brand for T&D globally
Spanish brand internationally recognised in the infrastructure sector
A renewed business vision, with clear focus and enhanced digital capabilities
We aim to be a main player globally in the Transport business

60
Guidance: our strategic guidelines will support our growth without additional drawbacks
Mid to highsingle digit
355€MRevenues 2016
CAGR1 (16-20)
Already identified ~1.7€Bn
opportunities on pipeline
1. Organic growth. Constant exchange rates as of 2016 (average FX in 2016). Note: ERTMS (European Rail Traffic Management System). Source: Indra
Potential upside of becoming
international reference on
ERTMS beyond the local market
New Specialised Operating Model
Ongoing Productivity Upgrades
Product
Portfolio
Evolution
Segmented
Commercial
Processes
02 03
04
01
61
IT
Cristina Ruiz
3

62
In the last three years, we have performed a successful turnaround of our IT business
-67€MEBIT
+17€MEBIT*
Pending write-offs
Brazil´s losses
Heavy cost structure
Limited standardisation of
proprietary products and disperse portfolio
Lack of control and proliferation of onerous projects
No additional significant write-offs
Brazil´s business under control with expected positive EBIT at the end of 2017
Leaner cost structure
Rationalised portfolio and structured product offering
Increased control and tracking due to an improved analytical accounting and reduction of onerous projects
2015 LTM Sep 2017
(*) Sep 17 displayed data includes Tecnocom consolidation since April 18th, 2017
63
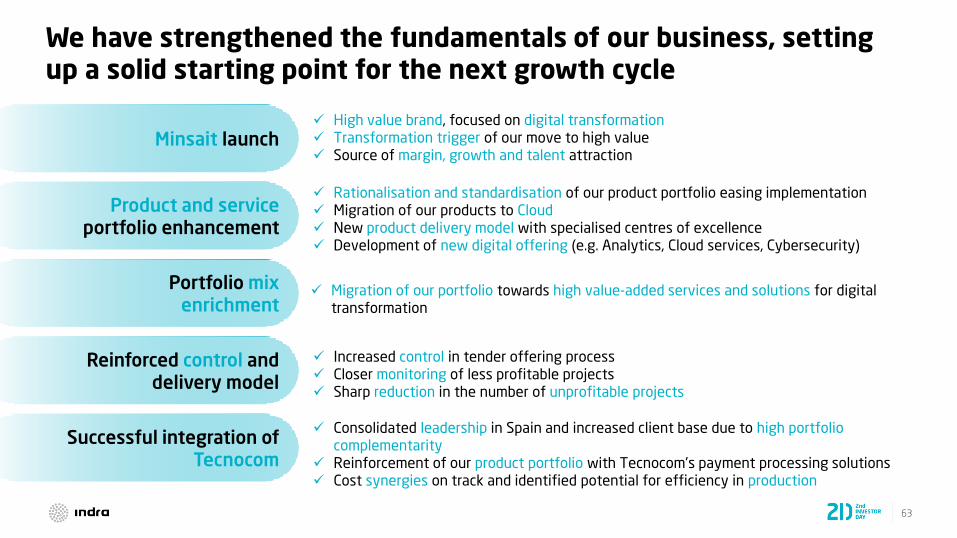
We have strengthened the fundamentals of our business, setting up a solid starting point for the next growth cycle
Minsait launch High value brand, focused on digital transformation Transformation trigger of our move to high value Source of margin, growth and talent attraction
Product and service portfolio enhancement
Rationalisation and standardisation of our product portfolio easing implementation Migration of our products to Cloud New product delivery model with specialised centres of excellence Development of new digital offering (e.g. Analytics, Cloud services, Cybersecurity)
Portfolio mix enrichment
Migration of our portfolio towards high value-added services and solutions for digital transformation
Successful integration of Tecnocom
Consolidated leadership in Spain and increased client base due to high portfolio complementarity
Reinforcement of our product portfolio with Tecnocom's payment processing solutions Cost synergies on track and identified potential for efficiency in production
Reinforced control and delivery model
Increased control in tender offering process Closer monitoring of less profitable projects Sharp reduction in the number of unprofitable projects

64
However, our focus on building a healthy business had an impact on the overall sales volume
2,500
1,500
500
0
1,702
IT revenues (€M)
LTM Sep
2017*
1,686
LTM Sep
2015
Lower growth in Latin America where Indra has
high exposure
Delayed public contracts due to lack of government
during several quarters in
Spain
Low commodity prices and oil crisis limiting GDP growth
in key markets
... resulting in lower sales than expected
... in a difficult macro context...Despite of our progress, we faced challenges...
Harder restructuring, needing greater focus and efforts than expected
Longer and more difficult transition to exit from onerous projects• High impact of non profitable sales
lost (Brazil)
• Focus on healthy growth, instead of
growth at any cost
Slower mix change towards high value • Market evolved from generating digital
needs for our clients…
• ..to be the highly demanded topic
Cultural change is not immediate
(*) Sep 17 displayed data includes Tecnocom consolidation since April 18th, 2017
65
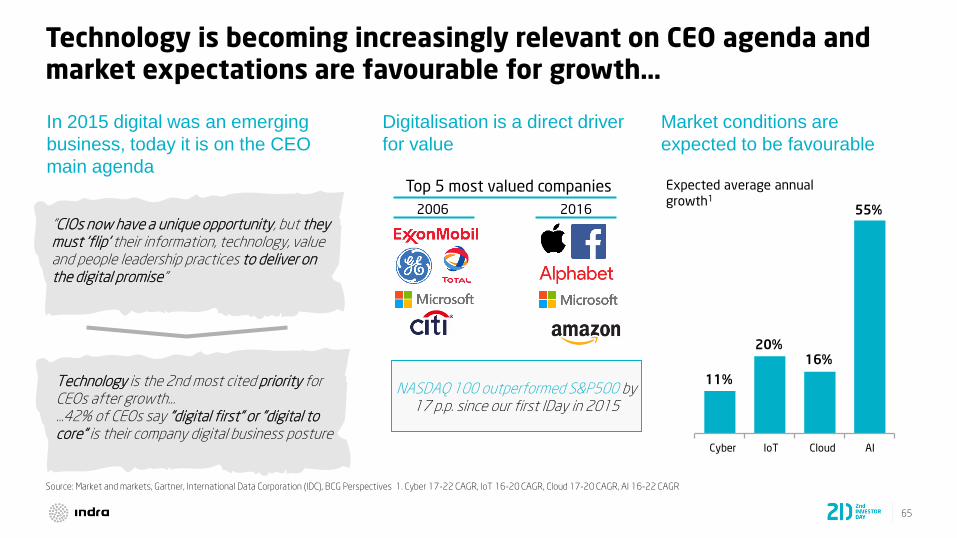
Technology is becoming increasingly relevant on CEO agenda and market expectations are favourable for growth…
Digitalisation is a direct driver
for value
In 2015 digital was an emerging
business, today it is on the CEO
main agenda
Market conditions are
expected to be favourable
NASDAQ 100 outperformed S&P500 by 17 p.p. since our first IDay in 2015
Top 5 most valued companies
2006 2016
Source: Market and markets, Gartner, International Data Corporation (IDC), BCG Perspectives 1. Cyber 17-22 CAGR, IoT 16-20 CAGR, Cloud 17-20 CAGR, AI 16-22 CAGR
16%
Cloud
55%
11%
20%
Cyber IoT AI
Expected average annual
growth1
Technology is the 2nd most cited priority for CEOs after growth……42% of CEOs say "digital first" or "digital to core" is their company digital business posture
"CIOs now have a unique opportunity, but they must 'flip' their information, technology, value and people leadership practices to deliver on the digital promise"
66
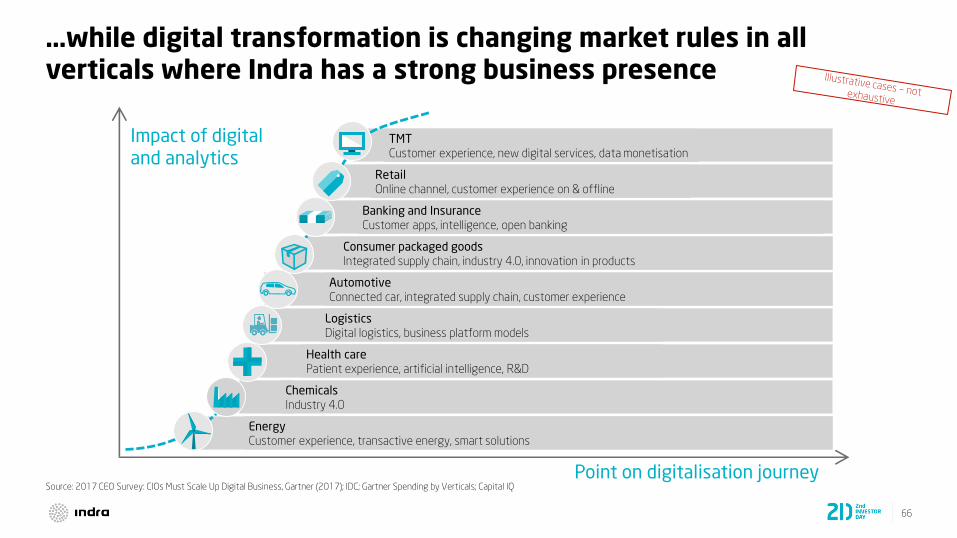
…while digital transformation is changing market rules in all verticals where Indra has a strong business presence
Source: 2017 CEO Survey: CIOs Must Scale Up Digital Business, Gartner (2017); IDC; Gartner Spending by Verticals; Capital IQ
G
Point on digitalisation journey
Impact of digital and analytics
TMT
Customer experience, new digital services, data monetisation
Retail Online channel, customer experience on & offline
Banking and InsuranceCustomer apps, intelligence, open banking
Consumer packaged goods Integrated supply chain, industry 4.0, innovation in products
AutomotiveConnected car, integrated supply chain, customer experience
LogisticsDigital logistics, business platform models
Health carePatient experience, artificial intelligence, R&D
EnergyCustomer experience, transactive energy, smart solutions
ChemicalsIndustry 4.0
67
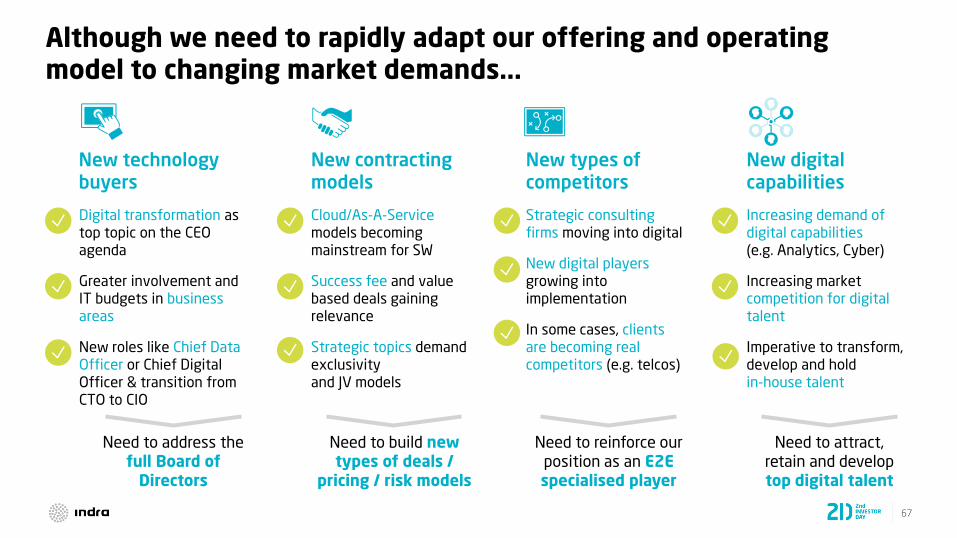
Although we need to rapidly adapt our offering and operating model to changing market demands...
Need to address thefull Board of
Directors
Need to build new types of deals /
pricing / risk models
Need to reinforce our position as an E2E specialised player
Need to attract, retain and develop
top digital talent
New technologybuyers
New digital capabilities
New contracting models
New types of competitors
Digital transformation as top topic on the CEO agenda
Greater involvement and IT budgets in business areas
New roles like Chief Data Officer or Chief Digital Officer & transition from CTO to CIO
Increasing demand of digital capabilities (e.g. Analytics, Cyber)
Increasing market competition for digital talent
Imperative to transform, develop and hold in-house talent
Cloud/As-A-Service models becoming mainstream for SW
Success fee and value based deals gaining relevance
Strategic topics demand exclusivityand JV models
Strategic consulting firms moving into digital
New digital players growing into implementation
In some cases, clients are becoming real competitors (e.g. telcos)
68
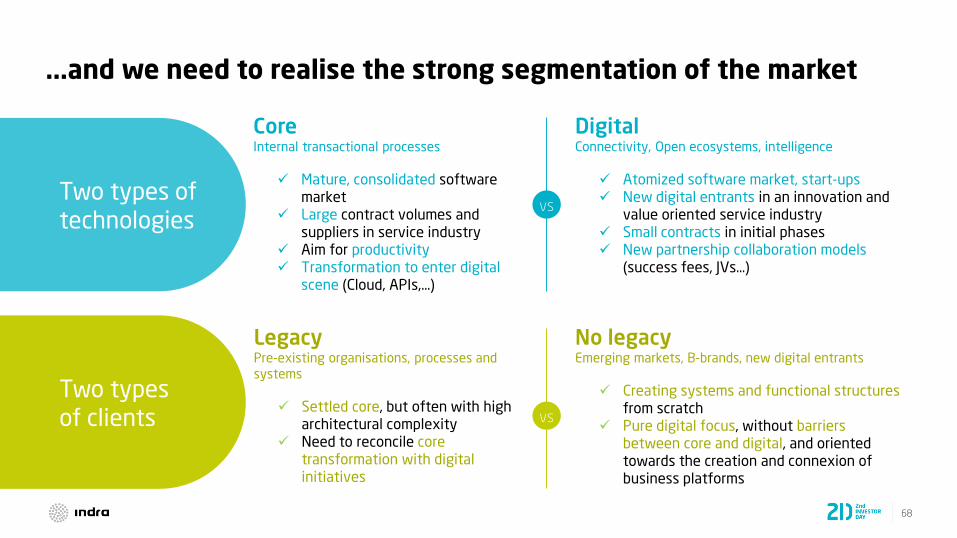
...and we need to realise the strong segmentation of the market
CoreInternal transactional processes
Mature, consolidated software market
Large contract volumes and suppliers in service industry
Aim for productivity Transformation to enter digital
scene (Cloud, APIs,…)
DigitalConnectivity, Open ecosystems, intelligence
Atomized software market, start-ups New digital entrants in an innovation and
value oriented service industry Small contracts in initial phases New partnership collaboration models
(success fees, JVs…)
LegacyPre-existing organisations, processes and
systems
Settled core, but often with high architectural complexity
Need to reconcile core transformation with digital initiatives
No legacyEmerging markets, B-brands, new digital entrants
Creating systems and functional structuresfrom scratch
Pure digital focus, without barriers between core and digital, and oriented towards the creation and connexion of business platforms
Two types of technologies
Two types of clients
vs
vs
69
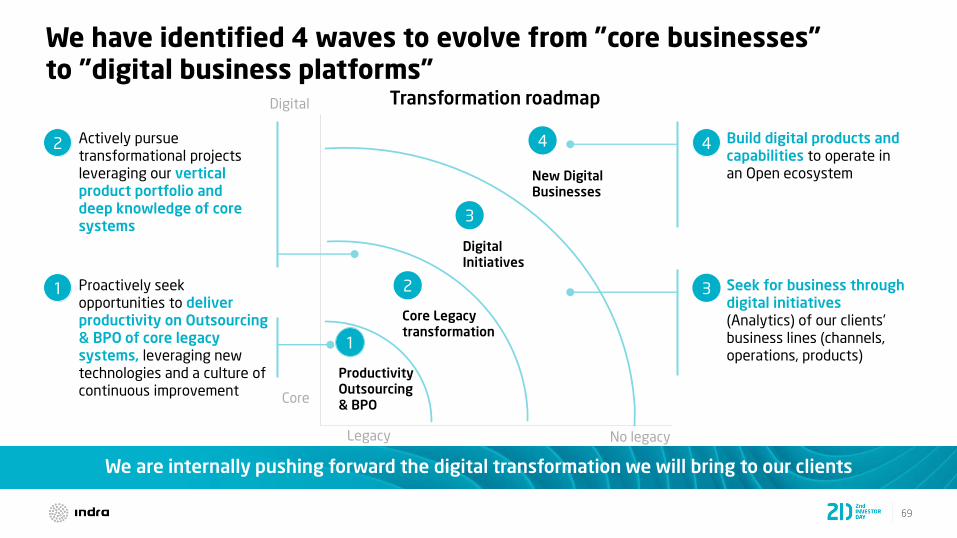
We have identified 4 waves to evolve from "core businesses" to "digital business platforms"
Build digital products and capabilities to operate in an Open ecosystem
Seek for business through digital initiatives (Analytics) of our clients' business lines (channels, operations, products)
Actively pursue transformational projects leveraging our vertical product portfolio and deep knowledge of core systems
Legacy No legacy
Digital
Core
ProductivityOutsourcing& BPO
Core Legacytransformation
DigitalInitiatives
New Digital Businesses
4
1
2
3
4
3 Proactively seek opportunities to deliver productivity on Outsourcing & BPO of core legacy systems, leveraging new technologies and a culture of continuous improvement
We are internally pushing forward the digital transformation we will bring to our clients
1
2
Transformation roadmap
70
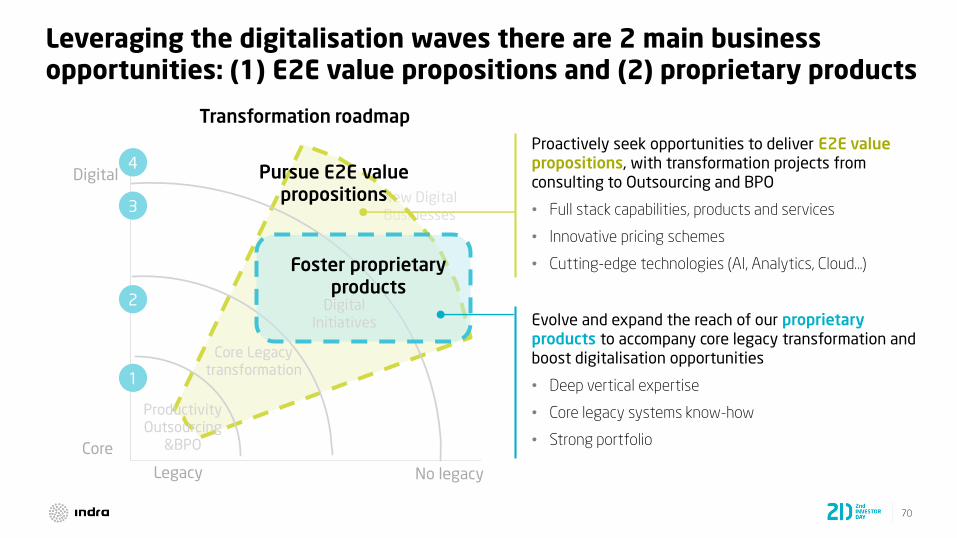
Leveraging the digitalisation waves there are 2 main business opportunities: (1) E2E value propositions and (2) proprietary products
Legacy No legacy
Digital
Core
ProductivityOutsourcing
&BPO
Core Legacytransformation
Pursue E2E value propositions
Proactively seek opportunities to deliver E2E value propositions, with transformation projects from consulting to Outsourcing and BPO
• Full stack capabilities, products and services
• Innovative pricing schemes
• Cutting-edge technologies (AI, Analytics, Cloud…)
Evolve and expand the reach of our proprietary products to accompany core legacy transformation and boost digitalisation opportunities
• Deep vertical expertise
• Core legacy systems know-how
• Strong portfolio
DigitalInitiatives
Transformation roadmap
1
2
3
4
Foster proprietary products

71
New Specialised Operating Model
Ongoing Productivity Upgrades
Product
Portfolio
Evolution
Segmented
Commercial
Processes
02 03
04
01
Strategic priorities to foster profitable growth in IT
Talent management will be a critical success factor for digital transformation

72
3.1IT: Product Portfolio Evolution
Sergio Martín

73
We have already started our digital transformation journey with successful references
New digitalbusinesses
Digitalinitiatives
Improve internal productivity and offering of multiclient ITO maintenance with Lean
• Automation of low complexity
tasks
• Implement predictable
mechanism to reduce lead
times (AI)
• New ways of working
• Process streamlining: reduce
bouncing
Transform Indra payment platform to create a high performance multi-client
service
• Redefinition of the
architecture to work on open
environments
• Omnichannel client experience
• SaaS models of delivery
• Operating on Cloud
environments
Transform patient - doctor interaction offering new digital services following a
mobile-only strategy
• Definition of new business
model
• Definition of digital customer
journey
• Integration with customer'
personal health folder
• Orchestration of an ecosystem
of functionality providers
Co-create, together with our client, a circular economy platform delivered to cities on Cloud
• Business platform approach
• Country-wide intelligence,
enabling best practices
adoption
• Innovation through geo-
analytics, IoT and Artificial
Intelligence
Core legacytransformation
ProductivityOutsourcing & BPO
1 2 3 4
PRODUCTPORTFOLIOEVOLUTION
Multi-clientITO
Tecnocom's Payment Processing Solution
Leading healthcare firm
Leading recycling company
74
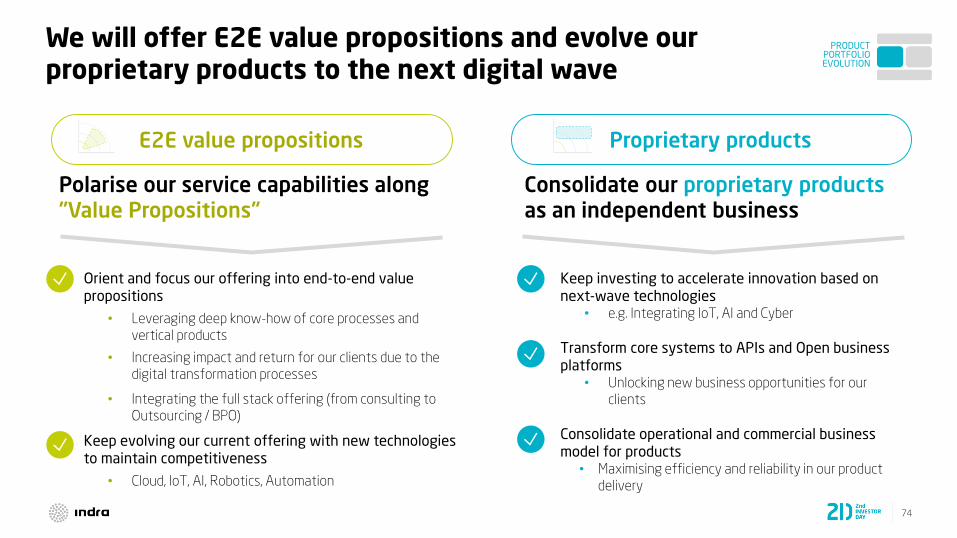
Proprietary productsE2E value propositions
Consolidate our proprietary products as an independent business
Polarise our service capabilities along "Value Propositions"
Orient and focus our offering into end-to-end value propositions
• Leveraging deep know-how of core processes and
vertical products
• Increasing impact and return for our clients due to the
digital transformation processes
• Integrating the full stack offering (from consulting to
Outsourcing / BPO)
Keep evolving our current offering with new technologies to maintain competitiveness
• Cloud, IoT, AI, Robotics, Automation
Keep investing to accelerate innovation based on next-wave technologies
• e.g. Integrating IoT, AI and Cyber
Transform core systems to APIs and Open business platforms
• Unlocking new business opportunities for our
clients
Consolidate operational and commercial business model for products
• Maximising efficiency and reliability in our product
delivery
PRODUCTPORTFOLIOEVOLUTION
We will offer E2E value propositions and evolve ourproprietary products to the next digital wave

75
The change to "Value Propositions" is a structural effort to increasingly compete on "value"
• Selling capabilities / services
• High % of RFP answers
• Relevance of cost-based competition
• Branding and portfolio structure aligned to services
• Service-based practice development
• Low thought leadership relevance
• Cost-plus pricing
• Supporting infrastructure management tasks
• Offering IoT technology for physical stores
Structural company-wide
aspiration…
…Based on a combination of
ongoing initiatives…
…That is becoming a reality in recent
projects
• Selling "impact" enabled by a combination of capabilities
• Increasing % of proactive idea generation• Higher relevance of value–based
competition
• Branding and portfolio structure aligned with value and industry needs
• Company-wide practices and knowledge management
• Intensified thought leadership activity• Mechanisms for value-based pricing
• Improving SLAs (quality and cost) through transformational outsourcing
• Providing an integrated approach (business and tech) to improve operations and sales (e.g. European Telco)
…ToFrom…
PRODUCTPORTFOLIOEVOLUTION
E2E value propositions

76
We will intensify investments to evolve our digital products to capture the next digital wave
Improved governance and standardisation– Rationalisation and prioritisation of
valuable assets
– Improve investment and roadmap
governance
– Legal and IP protection
– Common SW delivery model
– Product packaging to maximise
commercial impact
Digital readiness– Architecture readiness for Cloud
– Modularisation
– New family of IoT-based solutions
Intensification of selective investments to
capture the next digital wave
– Leveraging Open ecosystems to accelerate growth
Common vision driving both business and technical approaches (detailed next)
Reinforced central governance to maximise value synergies:
– Simplify/homogenise architectures and maximise
reutilisation
– Multiply our branding relevance
– Leverage operational synergies
Strong differentiation factor for our services
Evolved and mature SW business
…and now we will intensify our investments and efforts along a clear vision
In the last 2 years we have established solid basis for our SW business…
PRODUCTPORTFOLIOEVOLUTION
Proprietary products
77
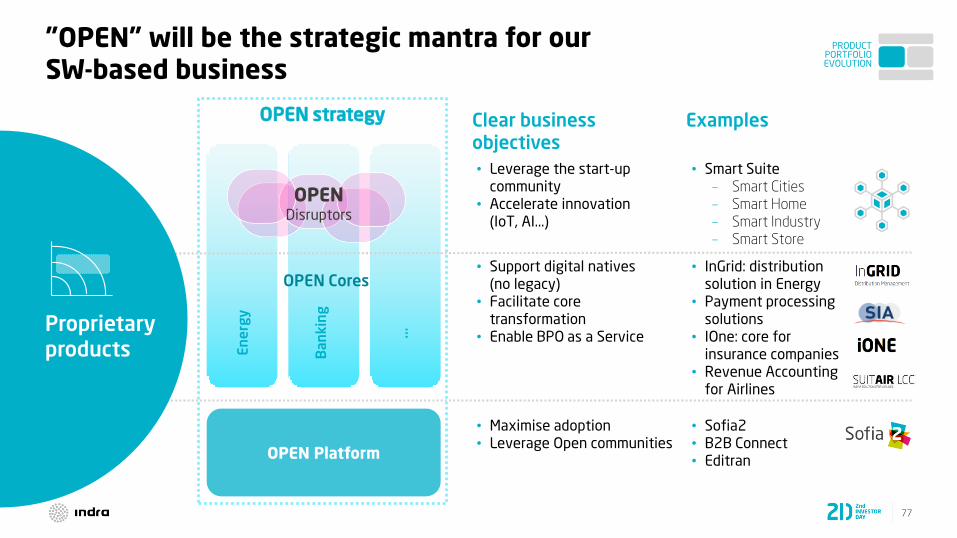
"OPEN" will be the strategic mantra for our SW-based business
OPEN strategy
OPEN Platform
OPEN Cores
OPENDisruptors
En
erg
y
Ba
nk
ing
...
Clear business objectives
• Leverage the start-up community
• Accelerate innovation (IoT, AI...)
• Support digital natives (no legacy)
• Facilitate core transformation
• Enable BPO as a Service
• Maximise adoption• Leverage Open communities
• Smart Suite– Smart Cities
– Smart Home
– Smart Industry
– Smart Store
• InGrid: distribution solution in Energy
• Payment processing solutions
• IOne: core for insurance companies
• Revenue Accounting for Airlines
• Sofia2• B2B Connect• Editran
Examples
PRODUCTPORTFOLIOEVOLUTION
Proprietary products
78
3.2IT: Segmented Commercial Processes
Borja Ochoa
79
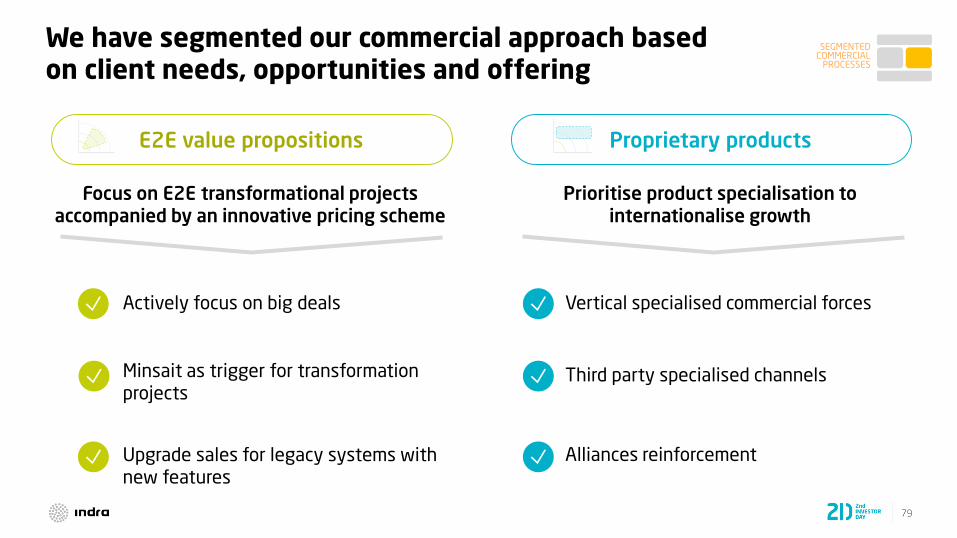
We have segmented our commercial approach based on client needs, opportunities and offering
SEGMENTED COMMERCIAL
PROCESSES
Actively focus on big deals
Minsait as trigger for transformation projects
Upgrade sales for legacy systems with new features
Alliances reinforcement
Third party specialised channels
Vertical specialised commercial forces
Focus on E2E transformational projects accompanied by an innovative pricing scheme
Prioritise product specialisation to internationalise growth
Proprietary productsE2E value propositions
80
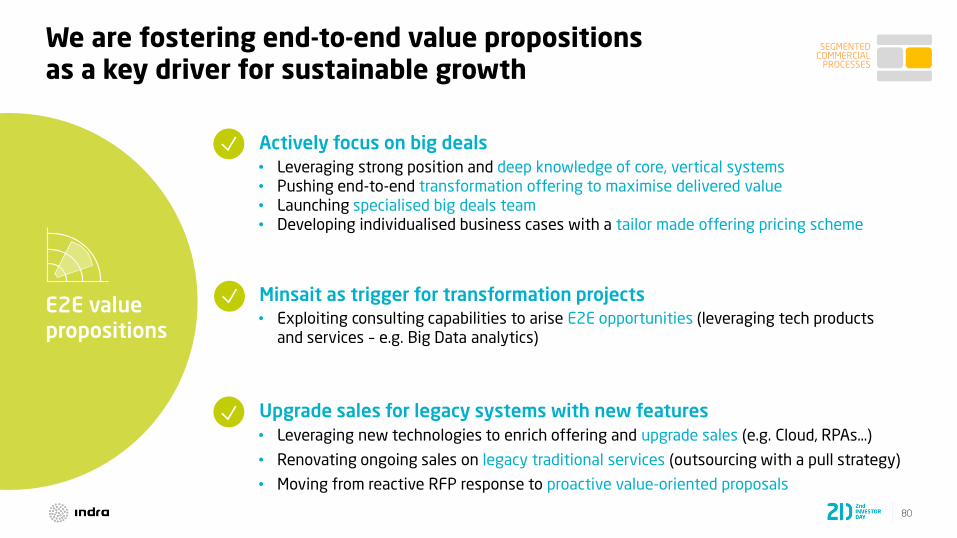
We are fostering end-to-end value propositions as a key driver for sustainable growth
E2E value propositions
Actively focus on big deals
• Leveraging strong position and deep knowledge of core, vertical systems • Pushing end-to-end transformation offering to maximise delivered value
• Launching specialised big deals team• Developing individualised business cases with a tailor made offering pricing scheme
Minsait as trigger for transformation projects
Upgrade sales for legacy systems with new features
• Exploiting consulting capabilities to arise E2E opportunities (leveraging tech products and services – e.g. Big Data analytics)
• Leveraging new technologies to enrich offering and upgrade sales (e.g. Cloud, RPAs…)
• Renovating ongoing sales on legacy traditional services (outsourcing with a pull strategy)
• Moving from reactive RFP response to proactive value-oriented proposals
SEGMENTED COMMERCIAL
PROCESSES
81
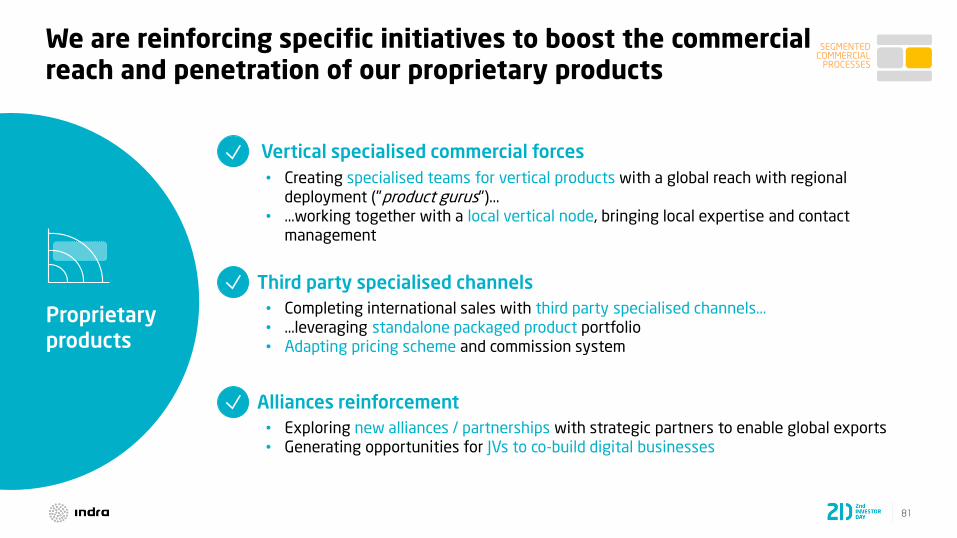
We are reinforcing specific initiatives to boost the commercial reach and penetration of our proprietary products
Proprietary products
Alliances reinforcement
Third party specialised channels
Vertical specialised commercial forces
• Creating specialised teams for vertical products with a global reach with regional deployment ("product gurus")...
• ...working together with a local vertical node, bringing local expertise and contact management
• Completing international sales with third party specialised channels...• ...leveraging standalone packaged product portfolio• Adapting pricing scheme and commission system
• Exploring new alliances / partnerships with strategic partners to enable global exports• Generating opportunities for JVs to co-build digital businesses
SEGMENTED COMMERCIAL
PROCESSES
82
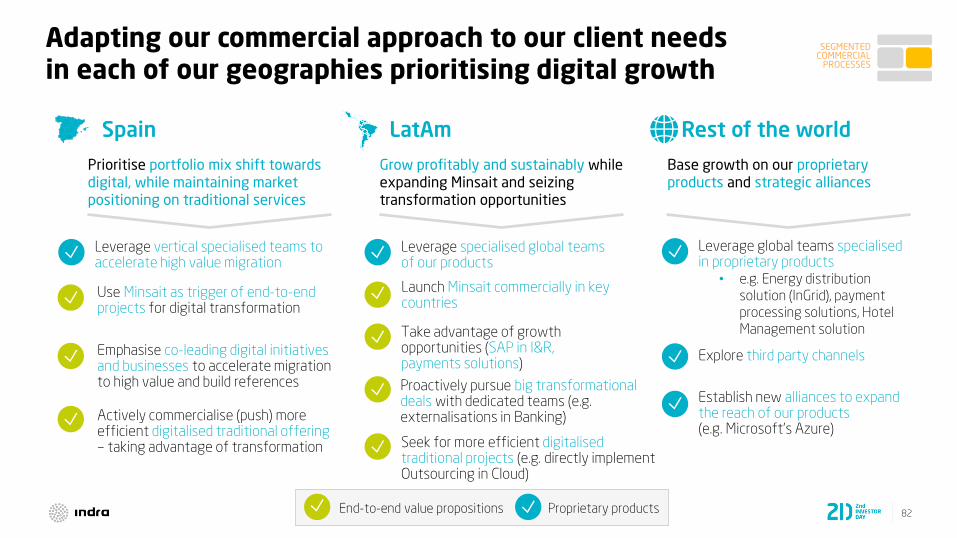
Adapting our commercial approach to our client needs in each of our geographies prioritising digital growth
Rest of the worldLatAmSpain
Use Minsait as trigger of end-to-end projects for digital transformation
Emphasise co-leading digital initiatives and businesses to accelerate migration to high value and build references
Prioritise portfolio mix shift towards digital, while maintaining market positioning on traditional services
Leverage specialised global teams of our products
Launch Minsait commercially in key countries
Take advantage of growth opportunities (SAP in I&R, payments solutions)
Establish new alliances to expand the reach of our products (e.g. Microsoft's Azure)
Actively commercialise (push) more efficient digitalised traditional offering – taking advantage of transformation
Grow profitably and sustainably while expanding Minsait and seizing transformation opportunities
Base growth on our proprietary products and strategic alliances
Proactively pursue big transformational deals with dedicated teams (e.g. externalisations in Banking)
Leverage global teams specialised in proprietary products
• e.g. Energy distribution
solution (InGrid), payment
processing solutions, Hotel
Management solution
Seek for more efficient digitalised traditional projects (e.g. directly implement Outsourcing in Cloud)
Explore third party channels
End-to-end value propositions Proprietary products
Leverage vertical specialised teams to accelerate high value migration
SEGMENTED COMMERCIAL
PROCESSES
83
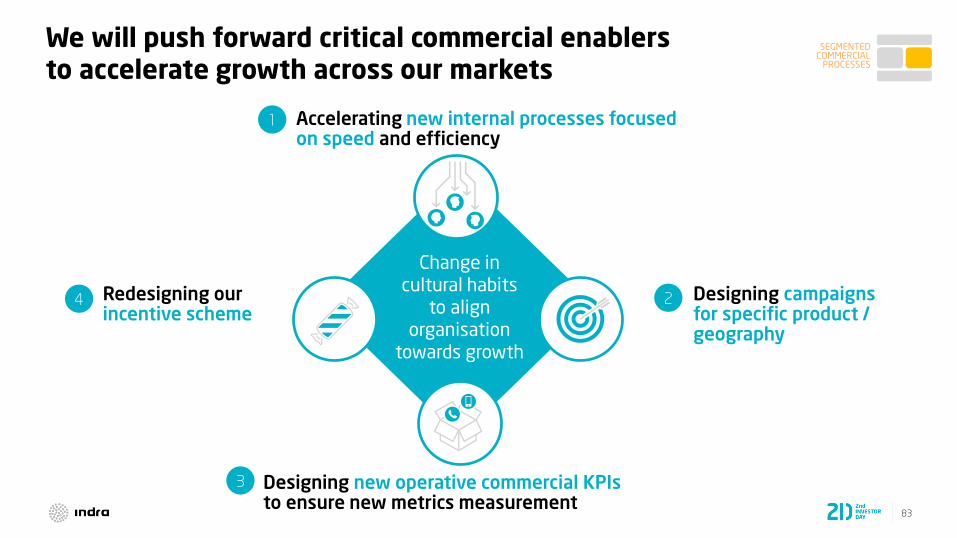
We will push forward critical commercial enablers to accelerate growth across our markets
Accelerating new internal processes focused on speed and efficiency
Designing campaigns for specific product / geography
Designing new operative commercial KPIs to ensure new metrics measurement
Redesigning ourincentive scheme
Change in cultural habits
to align organisation
towards growth
1
2
3
4
SEGMENTED COMMERCIAL
PROCESSES
84
3.3IT: Ongoing Productivity Upgrades
Luis Abril
85
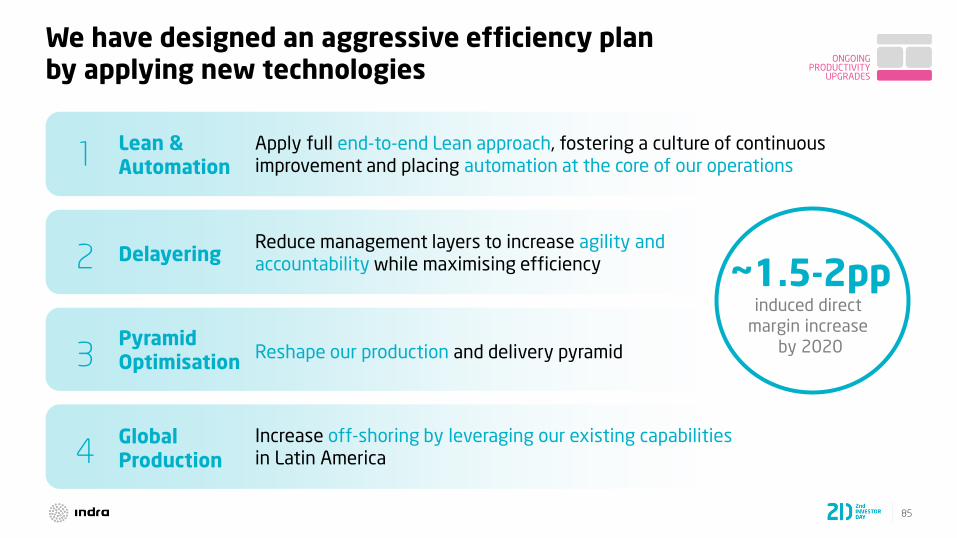
We have designed an aggressive efficiency plan by applying new technologies
4Global Production
3Pyramid Optimisation
2 Delayering
1 Lean & Automation
Apply full end-to-end Lean approach, fostering a culture of continuous improvement and placing automation at the core of our operations
Reduce management layers to increase agility and accountability while maximising efficiency
Reshape our production and delivery pyramid
Increase off-shoring by leveraging our existing capabilities in Latin America
~1.5-2ppinduced direct
margin increase
by 2020
ONGOING PRODUCTIVITY
UPGRADES

86
We are implementing Lean to establish a culture of continuous quality and efficiency improvement
We have identified clear initiatives with proven impact
We plan to keep increasing our competitiveness with Lean
We implemented Lean based pilots with successful results in 2017, improving substantially
efficiency (cost, lead time, culture) while improving delivery quality
• Improve and automate testing for Software development (e.g. common testing libraries)
• Automate repetitive and low complexity tasks(e.g. elimination of automatic alarms in servers)
• Adopt a continuous improvement approach in our way of working (e.g. reduction of presence in committees)
• Homogenise / standardise ticket categorisation (e.g. we reduced >2.000 root causes to ~150 to facilitate decision-making)
• Standardise contract conditions to delimitate their perimeter and facilitate the payment of on-top additional activities
• Optimise delivery pyramids (e.g. migrate low value-added activities to a more junior pool of technicians)
ONGOING PRODUCTIVITY
UPGRADES
87
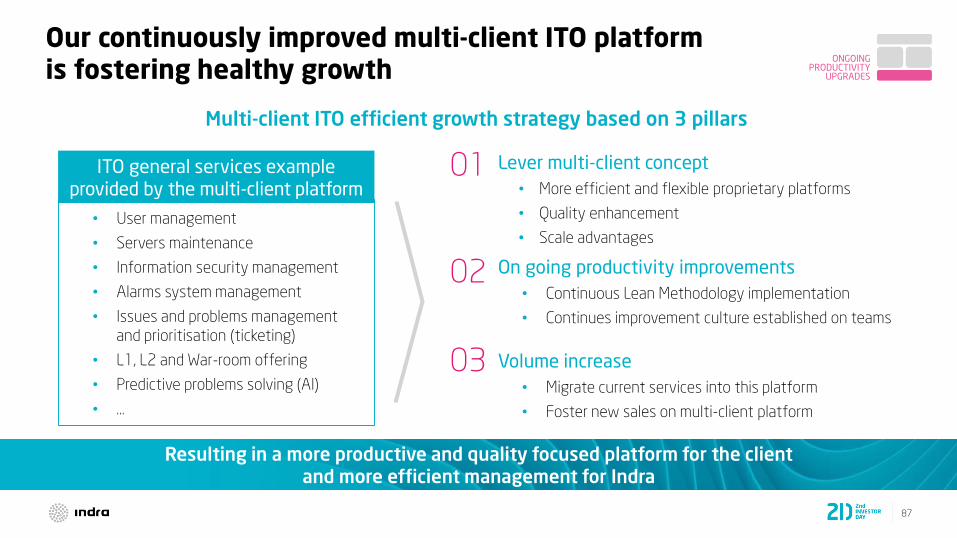
Our continuously improved multi-client ITO platform is fostering healthy growth
ITO general services example provided by the multi-client platform
• User management
• Servers maintenance
• Information security management
• Alarms system management
• Issues and problems management
and prioritisation (ticketing)
• L1, L2 and War-room offering
• Predictive problems solving (AI)
• …
01
02
Lever multi-client concept
• More efficient and flexible proprietary platforms
• Quality enhancement
• Scale advantages
Multi-client ITO efficient growth strategy based on 3 pillars
On going productivity improvements
• Continuous Lean Methodology implementation
• Continues improvement culture established on teams
Resulting in a more productive and quality focused platform for the client and more efficient management for Indra
03 Volume increase
• Migrate current services into this platform
• Foster new sales on multi-client platform
ONGOING PRODUCTIVITY
UPGRADES
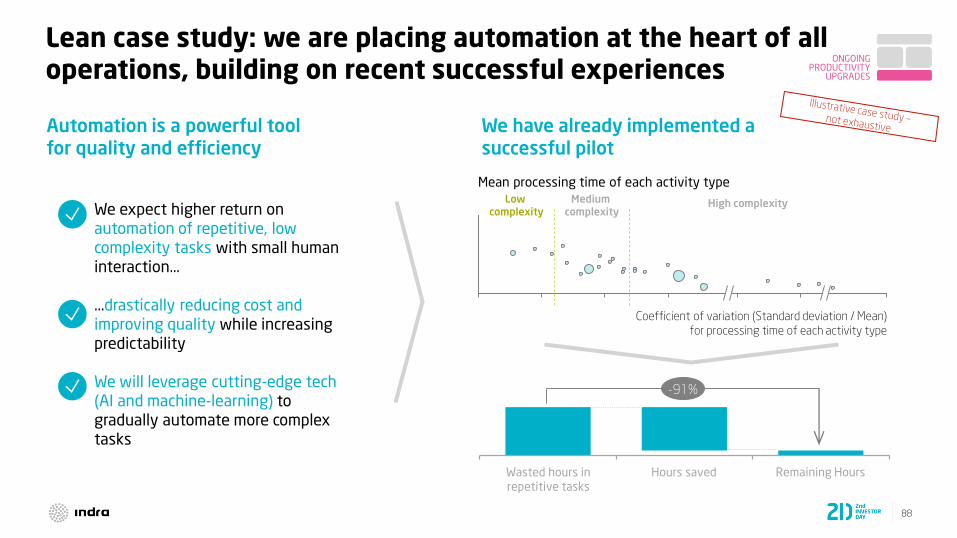
88
Lean case study: we are placing automation at the heart of all operations, building on recent successful experiences
We have already implemented a successful pilot
Automation is a powerful tool for quality and efficiency
We expect higher return on
automation of repetitive, low complexity tasks with small human interaction...
...drastically reducing cost and
improving quality while increasingpredictability
We will leverage cutting-edge tech (AI and machine-learning) to gradually automate more complex tasks
Mean processing time of each activity type
Coefficient of variation (Standard deviation / Mean)
for processing time of each activity type
Low complexity
Medium complexity
High complexity
-91%
Hours saved Remaining HoursWasted hours in repetitive tasks
ONGOING PRODUCTIVITY
UPGRADES
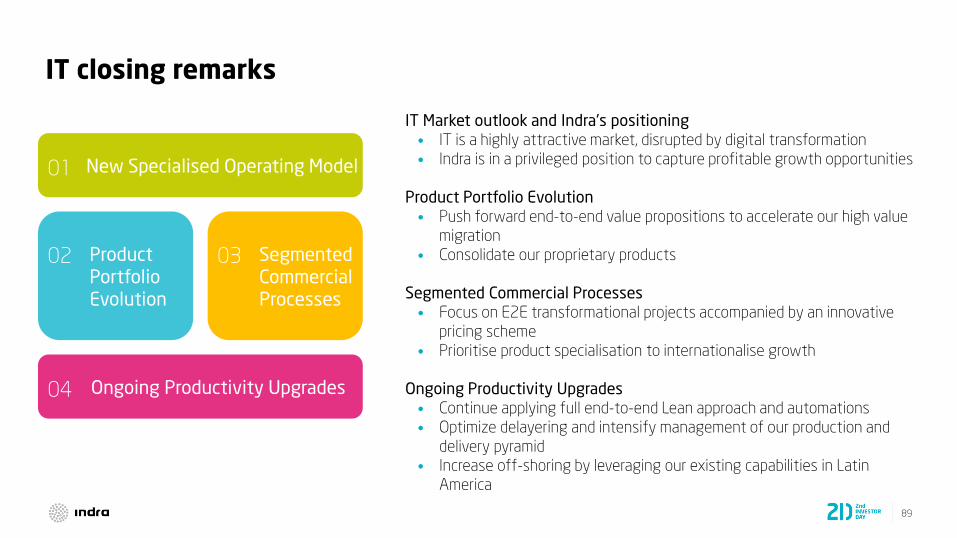
89
IT closing remarks
New Specialised Operating Model
Ongoing Productivity Upgrades
ProductPortfolio Evolution
Segmented Commercial Processes
02 03
04
01
IT Market outlook and Indra's positioning• IT is a highly attractive market, disrupted by digital transformation
• Indra is in a privileged position to capture profitable growth opportunities
Product Portfolio Evolution• Push forward end-to-end value propositions to accelerate our high value
migration
• Consolidate our proprietary products
Segmented Commercial Processes• Focus on E2E transformational projects accompanied by an innovative
pricing scheme
• Prioritise product specialisation to internationalise growth
Ongoing Productivity Upgrades• Continue applying full end-to-end Lean approach and automations
• Optimize delayering and intensify management of our production and
delivery pyramid
• Increase off-shoring by leveraging our existing capabilities in Latin
America

90
1. Proforma including full 2016 revenues from Tecnocom. 2.Organic growth. Constant exchange rates as of 2016 (average FX in 2016). Source: Indra
Guidance: our strategic guidelines will help us to keep growing
Revenues 20161
CAGR2 (16-20) Low single digit
1,897€M
New Specialised Operating Model
Ongoing Productivity Upgrades
Product
Portfolio
Evolution
Segmented
Commercial
Processes
02 03
04
01
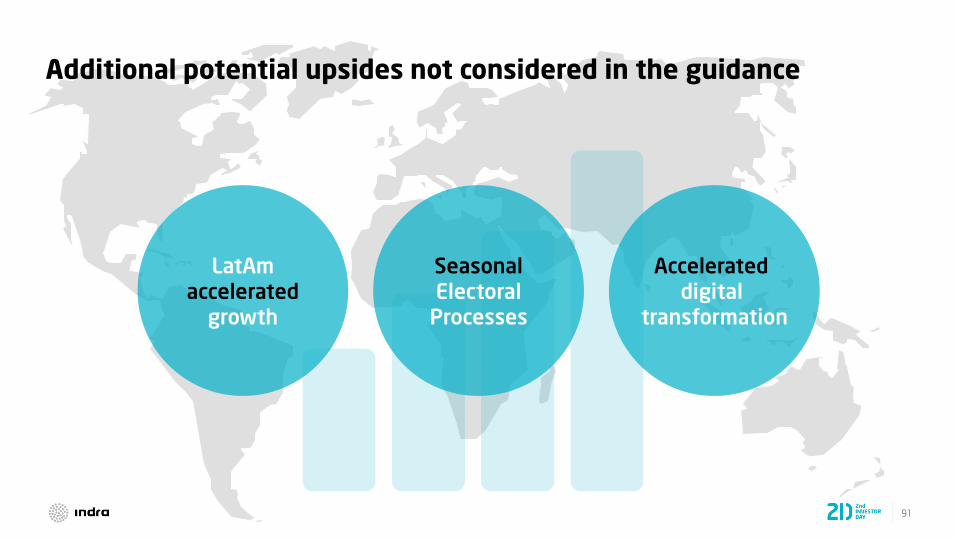
91
Additional potential upsides not considered in the guidance
LatAmaccelerated
growth
Seasonal Electoral
Processes
Accelerated digital
transformation
92
Financial Overview
Javier Lázaro
4

93
When we started to work on our first Strategic Plan in April 2015, Indra was in a very challenging situation
Resulting in high financial stress
Cash flow draining
High debt generating difficulties on external financing
-164€M1H15
accumulated
FCF
5.9x1H15
Net Debt /
EBITDA
825€M1H15
Net Debt
Ongoing deep operational issues
Non reliable analytical accounting and lack of control of onerous projects
• 718€M write-offs in 2015
• Difficulties to understand root causes and underlying issues
Profitability de-prioritisation
• Growth driven by low value added services
• Cost overruns in some contracts resulting from aggressive growth
• Expensive delivery model
Lack of focus on cost efficiency
• Heavy corporate structure
• Non optimal production pyramid management
Cash management decoupled from business activities
• Excessive working capital requirements
Excessive risk assumption in commercial bids
• Some products at too early stage, generating onerous projects
• Contractual and legal conditions without enough self-protection
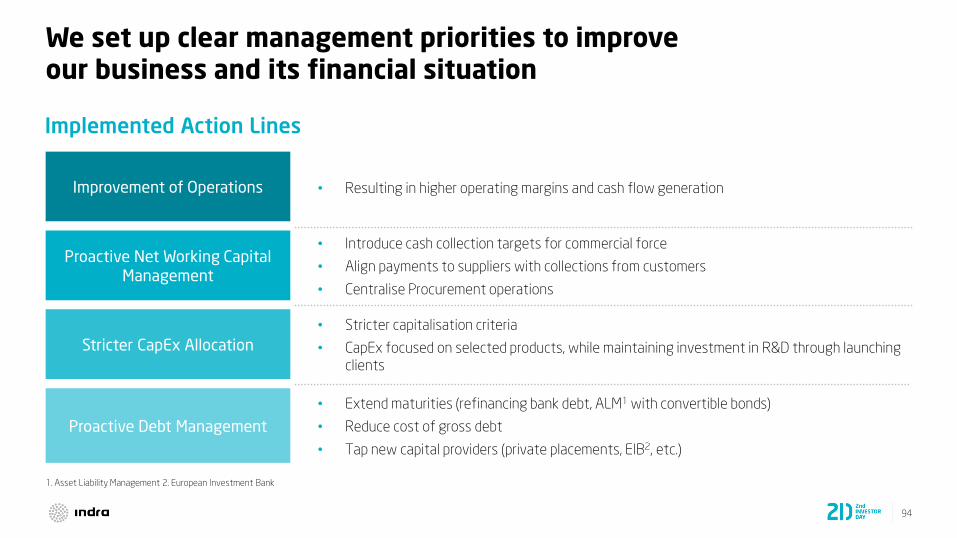
94
We set up clear management priorities to improve our business and its financial situation
Implemented Action Lines
Proactive Net Working Capital Management
Stricter CapEx Allocation
Proactive Debt Management
• Stricter capitalisation criteria
• CapEx focused on selected products, while maintaining investment in R&D through launching
clients
• Extend maturities (refinancing bank debt, ALM1 with convertible bonds)
• Reduce cost of gross debt
• Tap new capital providers (private placements, EIB2, etc.)
• Introduce cash collection targets for commercial force
• Align payments to suppliers with collections from customers
• Centralise Procurement operations
Improvement of Operations • Resulting in higher operating margins and cash flow generation
1. Asset Liability Management 2. European Investment Bank
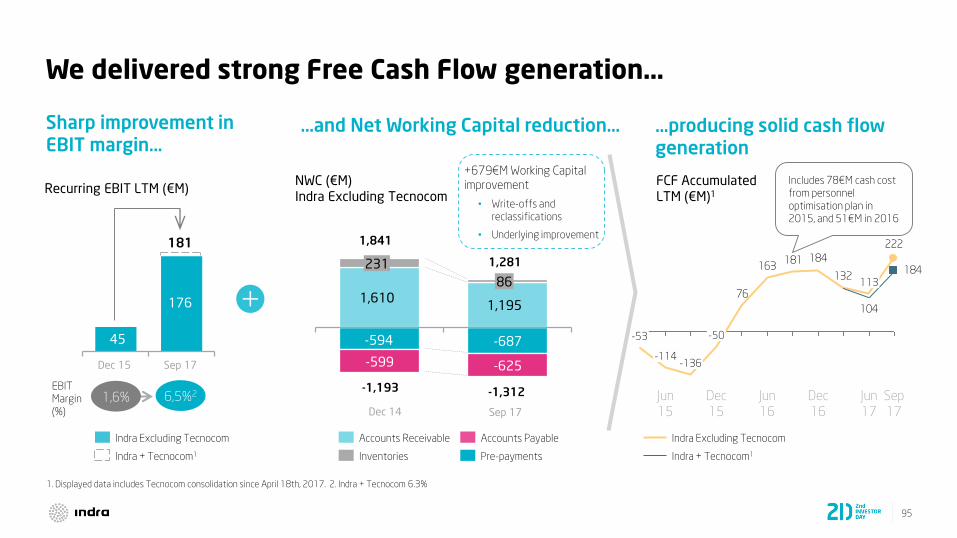
95
We delivered strong Free Cash Flow generation…
222
132
184181163
76
184
104
Jun
17
113
Dec
16
Jun
16
Dec
15
-50
-136
Jun
15
-114
-53
Sep
17
1. Displayed data includes Tecnocom consolidation since April 18th, 2017. 2. Indra + Tecnocom 6.3%
…and Net Working Capital reduction…Sharp improvement in EBIT margin…
…producing solid cash flow generation
NWC (€M)
Indra Excluding Tecnocom
FCF Accumulated
LTM (€M)1
-594 -687
-599 -625
231
1,610
86
1,195
Pre-payments
Accounts Receivable
Inventories
Accounts Payable
+679€M Working Capital
improvement
• Write-offs and
reclassifications
• Underlying improvement
Includes 78€M cash cost
from personnel
optimisation plan in
2015, and 51€M in 2016
Indra Excluding Tecnocom
Indra + Tecnocom1
45
176
Sep 17
181
Dec 15
1,6% 6,5%2
Recurring EBIT LTM (€M)
EBIT
Margin
(%)
Indra Excluding Tecnocom
Indra + Tecnocom1
-1,193 -1,312
1,841
1,281
Sep 17Dec 14
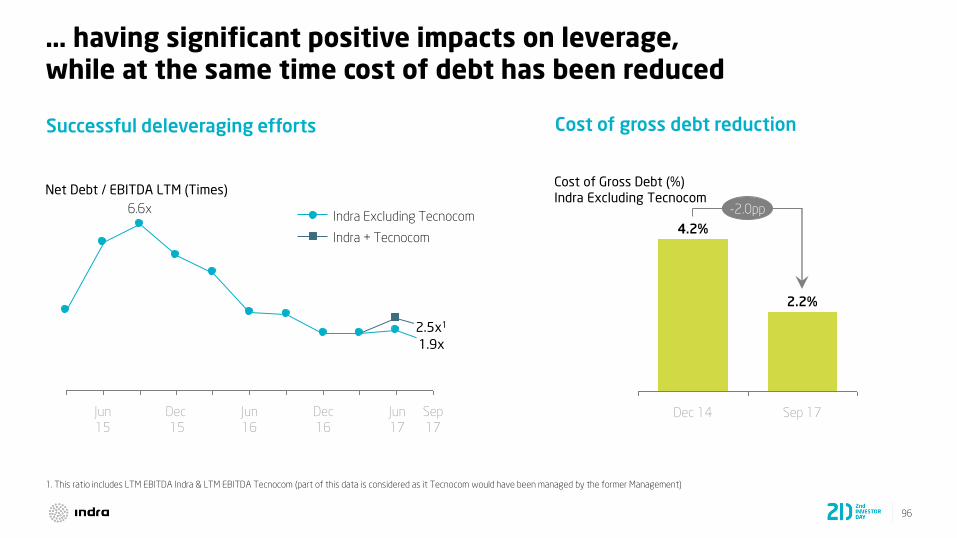
96
… having significant positive impacts on leverage, while at the same time cost of debt has been reduced
1. This ratio includes LTM EBITDA Indra & LTM EBITDA Tecnocom (part of this data is considered as it Tecnocom would have been managed by the former Management)
Successful deleveraging efforts
Net Debt / EBITDA LTM (Times) Cost of Gross Debt (%)
Indra Excluding Tecnocom
2.5x1
Dec
16
Jun
16
Dec
15
6.6x
Jun
15
Sep
17
1.9x
Cost of gross debt reduction
2.2%
Dec 14
4.2%
-2.0pp
Sep 17
Indra + Tecnocom
Indra Excluding Tecnocom
Jun
17
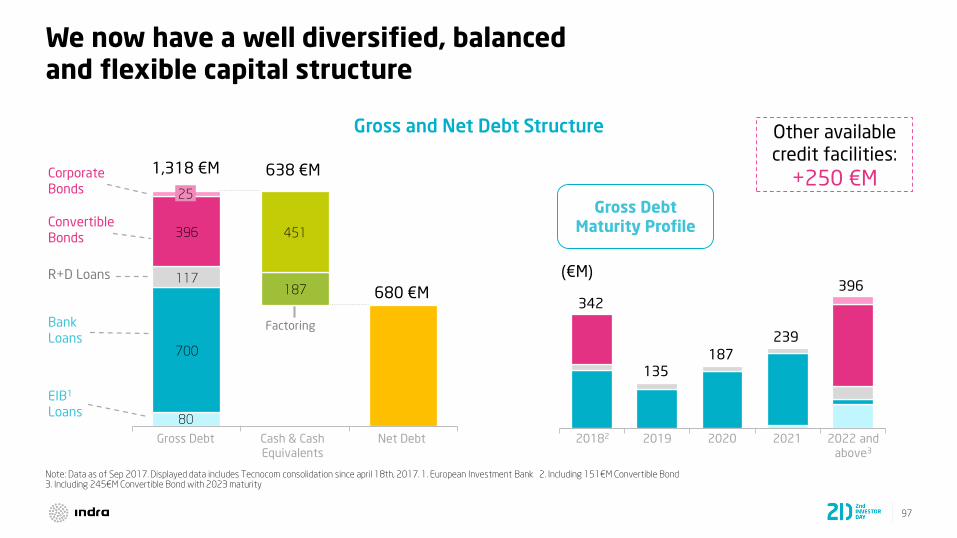
97
We now have a well diversified, balanced and flexible capital structure
Gross and Net Debt Structure
Note: Data as of Sep 2017. Displayed data includes Tecnocom consolidation since april 18th, 2017. 1. European Investment Bank 2. Including 151€M Convertible Bond 3. Including 245€M Convertible Bond with 2023 maturity
80
187
700
451
117
396
1,318 €M
25
680 €M
187
396
239
135
342
Gross Debt Maturity Profile
Bank
Loans
Convertible
Bonds
R+D Loans (€M)
Factoring
638 €M
Other available credit facilities:
+250 €MCorporate
Bonds
EIB1
Loans
20182 2022 and above3
20202019 2021Net DebtCash & Cash Equivalents
Gross Debt
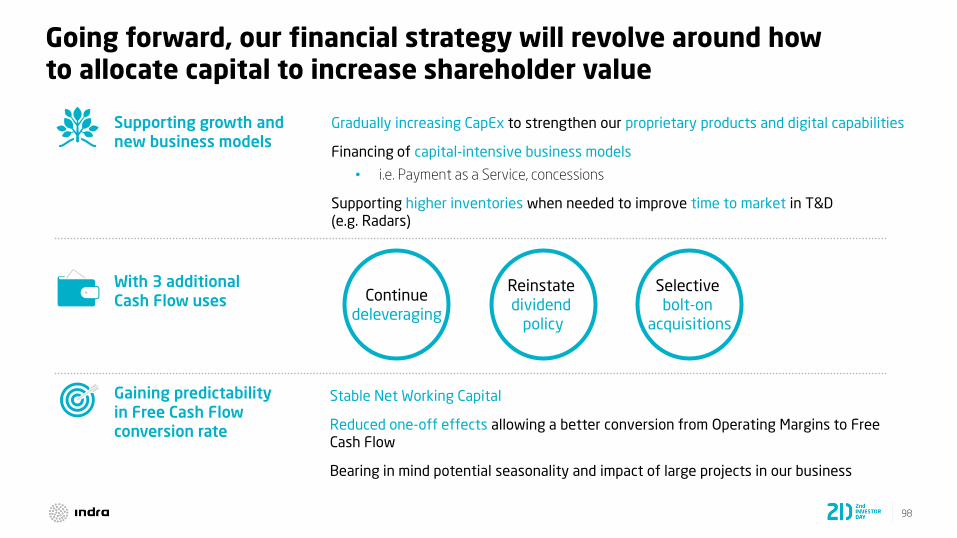
98
Going forward, our financial strategy will revolve around how to allocate capital to increase shareholder value
Gradually increasing CapEx to strengthen our proprietary products and digital capabilities
Financing of capital-intensive business models
• i.e. Payment as a Service, concessions
Supporting higher inventories when needed to improve time to market in T&D (e.g. Radars)
Stable Net Working Capital
Reduced one-off effects allowing a better conversion from Operating Margins to Free Cash Flow
Bearing in mind potential seasonality and impact of large projects in our business
Gaining predictability in Free Cash Flow conversion rate
With 3 additional Cash Flow uses
Supporting growth and new business models
Continuedeleveraging
Reinstatedividend
policy
Selective bolt-on
acquisitions
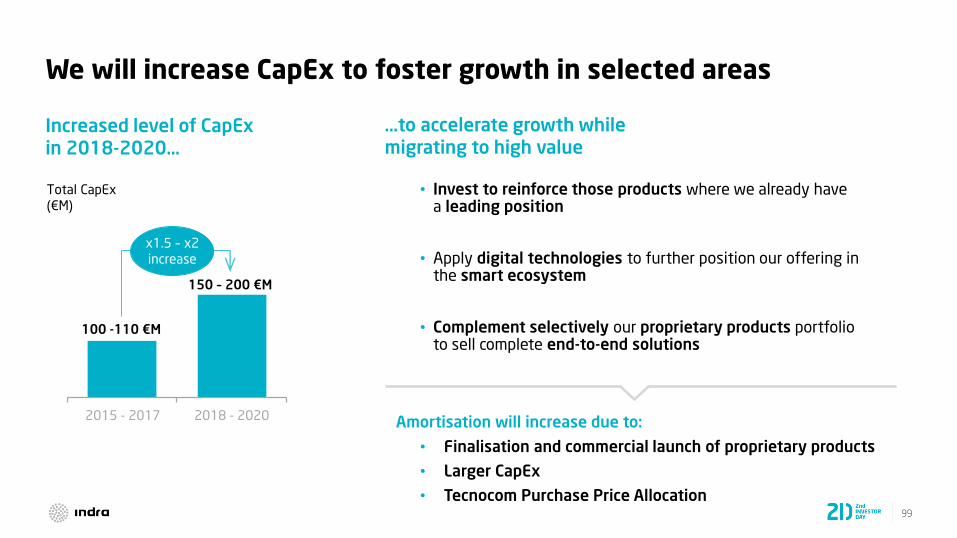
99
We will increase CapEx to foster growth in selected areas
Amortisation will increase due to:
• Finalisation and commercial launch of proprietary products
• Larger CapEx
• Tecnocom Purchase Price Allocation
Increased level of CapExin 2018-2020…
Total CapEx
(€M)• Invest to reinforce those products where we already have
a leading position
• Apply digital technologies to further position our offering in the smart ecosystem
• Complement selectively our proprietary products portfolioto sell complete end-to-end solutions
…to accelerate growth while migrating to high value
2015 - 2017
100 -110 €M
2018 - 2020
150 – 200 €M
x1.5 – x2
increase
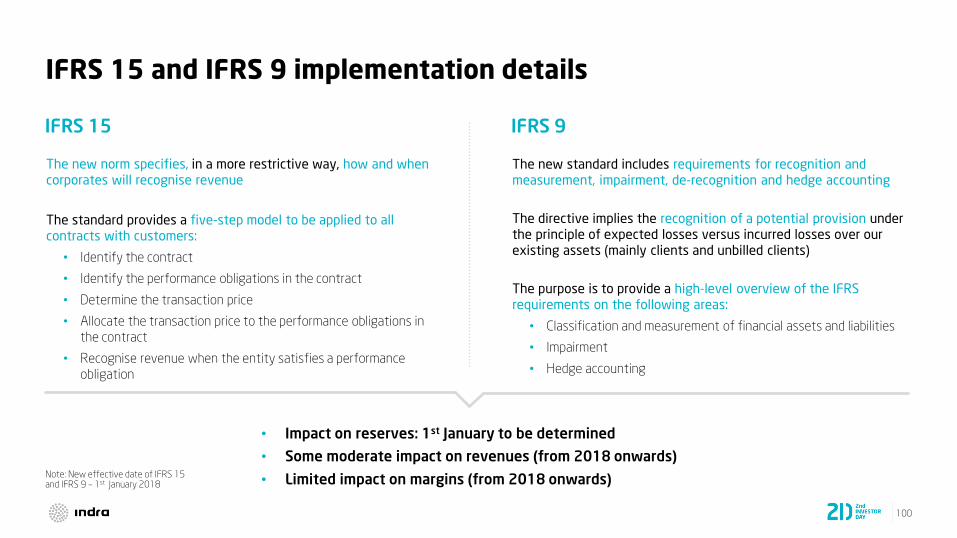
100
IFRS 15 and IFRS 9 implementation details
The new norm specifies, in a more restrictive way, how and when
corporates will recognise revenue
The standard provides a five-step model to be applied to all
contracts with customers:
• Identify the contract
• Identify the performance obligations in the contract
• Determine the transaction price
• Allocate the transaction price to the performance obligations in
the contract
• Recognise revenue when the entity satisfies a performance
obligation
The new standard includes requirements for recognition and
measurement, impairment, de-recognition and hedge accounting
The directive implies the recognition of a potential provision under
the principle of expected losses versus incurred losses over our
existing assets (mainly clients and unbilled clients)
The purpose is to provide a high-level overview of the IFRS
requirements on the following areas:
• Classification and measurement of financial assets and liabilities
• Impairment
• Hedge accounting
IFRS 15 IFRS 9
Note: New effective date of IFRS 15 and IFRS 9 – 1st January 2018
• Impact on reserves: 1st January to be determined
• Some moderate impact on revenues (from 2018 onwards)
• Limited impact on margins (from 2018 onwards)

101
Guidance
Other uses (€M) (5)
2015-2017E
CAPEX (€M) (4)
~610 (3)
100-110
550-650 (6)
150-200
Restructuring Plan 129Tecnocom acquisition 191Onerous projects ~145Deleverage (consensus end FY17) ~40
2018-2020E
Continue deleveragingReinstate dividend policySelective bolt-on acquisitions
Revenues (€M)
EBIT (€M)
CAGR 2016-2020 (2)
3,121
180
Low single digit
>10% (p.a. growth)
2016 (1)
Total Cash Flow (€M) [~€775m since First Investors Day]
1. Pro-forma values including full consolidation from Tecnocom
2. Organic growth. Constant exchange rates as of 2016 (average FX in 2016)
3. Includes the estimated CF generated in 2015-17E, excluding the estimated impact from the cash outflows from Tecnocom acquisition (191€M), headcount plans (129€M), onerous projects (~145€M)
and the accumulated CAPEX in the period
4. Accumulated CAPEX in the 2015-2017E and 2018-2020E period respectively
5. The uses of the cash flow generated in the 2018-2020E period are contingent upon fulfilment of the Strategic Plan
6. Includes the FCF generated in the period according to Indra’s definition, excluding CAPEX and the last part of the pending cash outflows associated with the headcount reduction plan in Spain (~40€M)
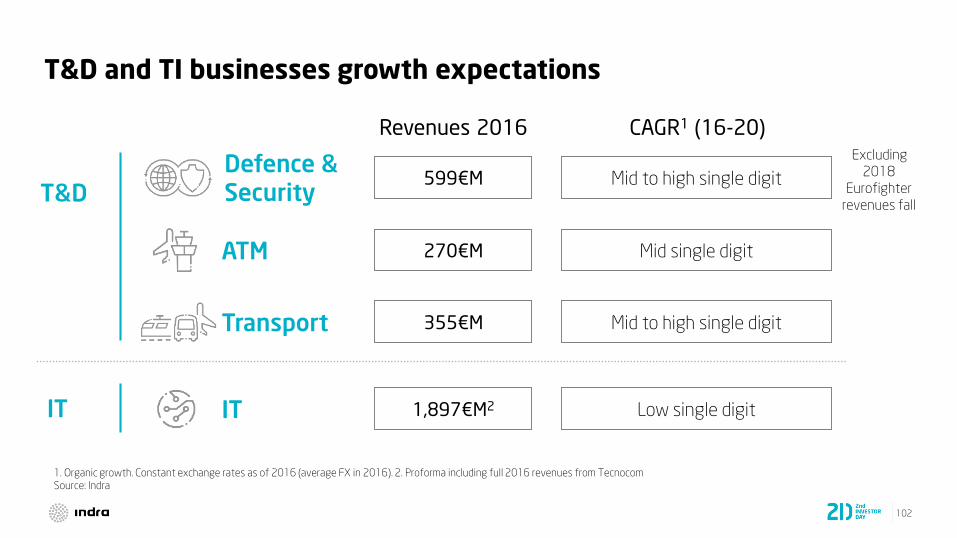
102
T&D and TI businesses growth expectations
T&D
Transport Mid to high single digit
ATM Mid single digit
Defence & Security
Mid to high single digit
IT Low single digitIT
1. Organic growth. Constant exchange rates as of 2016 (average FX in 2016). 2. Proforma including full 2016 revenues from Tecnocom
Source: Indra
CAGR1 (16-20)Excluding
2018
Eurofighter
revenues fall
355€M
270€M
599€M
1,897€M2
Revenues 2016
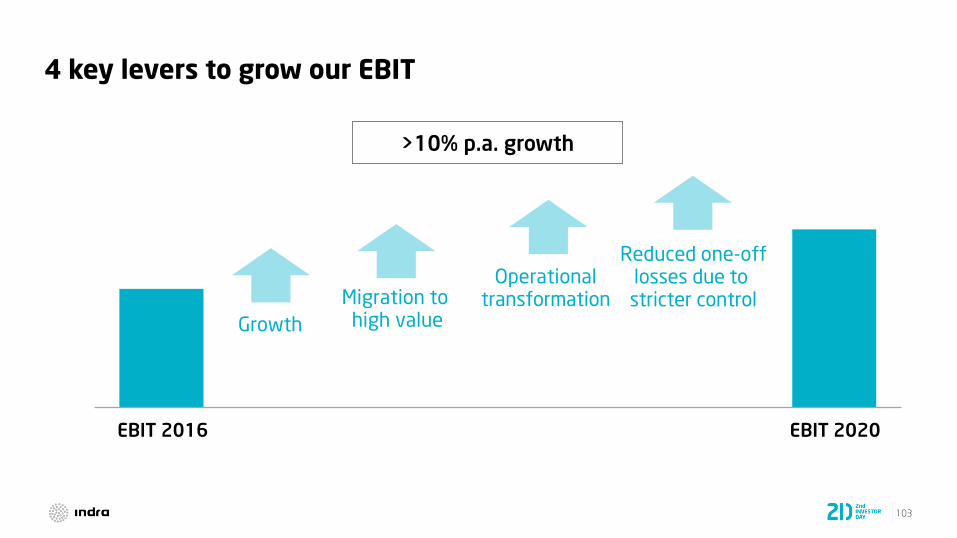
103
4 key levers to grow our EBIT
EBIT 2016 EBIT 2020
>10% p.a. growth
Growth
Migration to high value
Operationaltransformation
Reduced one-offlosses due to stricter control
104
Closing Remarks
Fernando Abril-Martorell
5
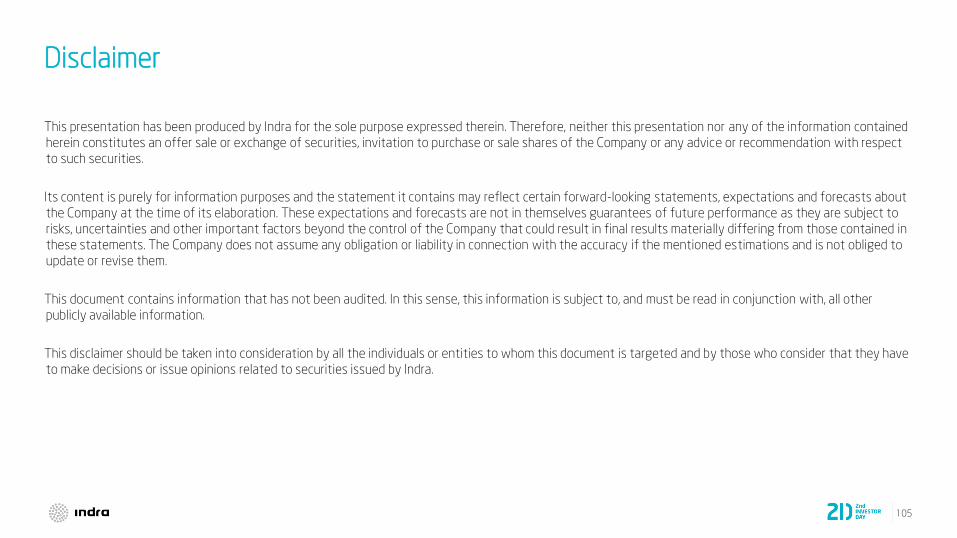
105
This presentation has been produced by Indra for the sole purpose expressed therein. Therefore, neither this presentation nor any of the information contained
herein constitutes an offer sale or exchange of securities, invitation to purchase or sale shares of the Company or any advice or recommendation with respect
to such securities.
Its content is purely for information purposes and the statement it contains may reflect certain forward-looking statements, expectations and forecasts about
the Company at the time of its elaboration. These expectations and forecasts are not in themselves guarantees of future performance as they are subject to
risks, uncertainties and other important factors beyond the control of the Company that could result in final results materially differing from those contained in
these statements. The Company does not assume any obligation or liability in connection with the accuracy if the mentioned estimations and is not obliged to
update or revise them.
This document contains information that has not been audited. In this sense, this information is subject to, and must be read in conjunction with, all other
publicly available information.
This disclaimer should be taken into consideration by all the individuals or entities to whom this document is targeted and by those who consider that they have
to make decisions or issue opinions related to securities issued by Indra.
Disclaimer

106
Thank you