Cometh the hour… 81
119
ESG
Transcript of Cometh the hour… 81

ESG

Investment summary 1 Country views 8
2018 – Nowhere to hide 14
Why such a bad 2018? 17
Could 2019 be better? 19
ESG 34
ESG – Introduction 36
What is ESG? 37
A brief history of ESG 38
Is ESG integration actually 40
that new? 40
ESG assets under management 41
Where does ESG data come from? 43
The ESG debate 45
Does (or should) ESG outperform? 48
Putting ESG to the test, pt. 1 51
Putting ESG to the test, pt. 2 54
ESG appendix A 64
ESG appendix B – ESG providers 66
ESG appendix C – Detailed country scores 68
ESG appendix D – Full ESG breakdown for top/bottom EM companies 69
ESG appendix E – Full ESG breakdown for top/bottom EM EMEA companies 70
Take five 71
Cometh the hour… 81
ESG appendix F 85
EM fund flows: Allocations 91
EM fund flows: Allocations 92
EM fund flows: Allocations 93
EM fund flows: Allocations 94
EM fund flows: Net overweight 95
EM fund flows: Net overweight 96
EM fund flows: Net overweight 97
EM fund flows: Net overweight 98
EM fund flows: Allocations 99
EM fund Flows: Allocations 100
Market watch 101
Disclosures appendix 102
Contents
Daniel Salter +44 (207) 005-7824 [email protected] Vikram Lopez +44 (207) 005-7974 [email protected] Charles Robertson +44 (207) 005-7835 [email protected] Yvonne Mhango +27 (11) 750-1488 [email protected] Oleg Kouzmin +7 (495)258-7770 x4506 [email protected] Research analysts

1
Renaissance Capital 14 January 2019
ESG
ESG
ESG (environmental, social and governance) investing is becoming increasingly important right along the investment chain – from asset owners to asset managers to corporates. We started to look at ESG from a top-down perspective in Global Chief Economist Charles Robertson’s ESG note, Reclaiming ESG in EM & FM. Here we look at some more bottom-up issues.
The Global Sustainable Investment Alliance estimates some $23trn of assets globally are managed under some form of ESG. Morningstar’s database contains $1.05trn of publicly-available ESG funds, and in EM, we have identified $21bn of publicly-available ESG equity funds, up from just $5bn at the start of 2016. Adding non-public funds would boost this figure significantly, and there are more and more mainstream funds (i.e. not specifically labelled as ESG) investing with at least one eye on ESG.
ESG covers a broad scope of strategies including traditional negative screens (e.g. not owning tobacco or weapons manufacturers), positive screens and best-in-class strategies (e.g. portfolios focused on the best ESG-scoring names), norms-based screens (excluding companies breaching international norms), thematic investing (e.g. focused on alternate energy) and impact investing (to have a measurable impact, e.g. on carbon emissions). ESG integration, where ESG is integrated throughout the investment process with the aim of improving risk-adjusted returns (key for ESG to go mainstream) is where the focus has been lately.
As ESG assets grow, and with it, corporate disclosure, companies which score well on ESG metrics should find themselves better positioned to attract a wider pool of capital and thus achieve higher valuations.
What metrics should corporates target? The list is ever growing, but we have developed a model focusing on: greenhouse gas emissions per sales; social factors such as women in the workforce and in management roles, worker safety and conditions; governance issues such as board independence and size, state ownership, and responsibilities to shareholders. Companies with lower government ownership, smaller boards and a higher representation of women in management tend to outperform.
The broader debate surrounding corporate citizenship is ongoing, and the neoclassical view (espoused most famously by Milton Friedman) that companies should focus solely on the pursuit of (legal) profits is being increasingly challenged. This analyst would suggest that any well-run business should be keen to understand the (changing) expectations put on it by broader society in addition to a focus on near-term profits, as taking care of the former should help make the latter more sustainable.
Strategy
2018 saw five overlapping waves of negativity overwhelm EM: 1) rising US rates (both bond yields and Fed funds); 2) a strong dollar; 3) escalating trade tensions; 4) global/Chinese growth concerns; and 5) the 4Q18 sell-off in US equities. Combined, these were enough to push EM equities into bear market territory, with MSCI EM ending 2018 down 17% for the year, 24% off its January peak. MSCI FM ended 2018 down 19% for the year, 25% off its January peak.
Our base case is that the US avoids recession in 2019 (which, this summer, will make the current expansion the longest since records began in the 1850s), but we expect growth to slow as the sugar rush of stimulus fades and given the lagged effects of higher borrowing costs, the stronger dollar, weaker external demand (accompanied by rising protectionism) and the partial government shutdown on the US economy. China, the eurozone and Japan are also likely to grow more slowly in 2019 vs 2018.
Investment summary

2
Renaissance Capital 14 January 2019
ESG
The good news for EM is that we enter 2019 with: 1) much lower US bond yields (10-year Treasuries yield of 2.67% vs 3.24% in early November); 2) a more flexible Fed, with Fed futures now suggesting that the Fed might not hike at all in 2019 (sharp falls in interest rate expectations can precede an EM equity rally, as we show in Figure 1); 3) China stimulating its economy via reserve requirement ratios (RRR) cuts and big sign-offs for new railways (and we expect further announcements to come) in order to be able to report the required 6.2% annual growth rate in 2019 and 2020 to double the economy over 2010-2020; 4) some easing of the strong upward pressure on the dollar that we saw in 2018; 5) oil $30/bl lower – bringing down inflation expectations and helping current accounts (C/A) for the 89% index weight of MSCI EM (and 64% of FM) that imports fuel; 6) many EM currencies trading slightly cheap vs their long-run real effective exchange rate (REER) averages; and 7) the potential for a US-China trade agreement (as trade talks in Beijing are extended) to add to risk appetite – we think recent equity market declines and softening lead indicators should help catalyse such an agreement, particularly as 2019 is a pre-election year for US President Donald Trump1.
We look at all these factors in this note and conclude that while plenty depends on policymakers and politicians taking the right actions, on balance, we think the 2019 EM equity pain trade is likely to be on the upside, and recommend investors take more risk in EM in 2019. EM equities are currently trading on a 12-month forward P/E of 10.6x, 6% below the 10-year average of 11.2x, and a 21% discount to DM on 13.4x; on 1.47x P/B, 9% below the 10-year average of 1.62x and a 31% discount to DM on 2.12x; and on 3.0% trailing dividend yield, 12% above the 10-year average of 2.66%, and a 10% premium to DM on 2.73%.
Given the potential for sharp falls in interest rate expectations to precede an EM equity rally we think investors should be prepared to take more EM risk in 2019. We do not expect a large rebound in oil or commodity prices, and while this should help the global inflation (and thus rates) picture, it skews our bias away from the oil exporters (which outperformed last year) in favour of oil importers.
Figure 1: Sharp falls in interest rate expectations can precede an EM equity rally
Source: Bloomberg, Renaissance Capital
Our base-case MSCI EM target price for end-2019 is 1,081, implying 12.0% price return and 15.2% total return from end-2018 levels.
In EM, we are overweight South Africa, Egypt and Turkey. Neutral Russia, Pakistan, Saudi Arabia and Greece. Underweight CE3, UAE and Qatar.
1 But equally a recovery in the S&P and/or lead indicators might make Trump more inclined to push harder on trade
600
700
800
900
1,000
1,100
1,200
1,300
-0.3
-0.2
-0.1
0.0
0.1
0.2
0.3
0.4
0.5
0.6
0.7
0.8
2010
2011
2012
2013
2014
2015
2016
2017
2018
2019
Amount of Fed tightening priced in to US OIS curve for next 12m (lhs) MSCI EM (rhs)

3
Renaissance Capital 14 January 2019
ESG
In FM, we are overweight Vietnam, Kazakhstan, Georgia, Argentina and Egypt. Neutral Romania, Kenya, Nigeria, Sri Lanka and Morocco. Underweight Bangladesh and Kuwait.
Our five-factor asset allocation model looks for countries with improving growth, faster bank lending, cheap currencies, scope for credit ratings to be upgraded and/or rate cuts (see page 69).
Emerging Markets
In EM, we are overweight South Africa, Egypt and Turkey. Neutral Russia, Pakistan, Saudi Arabia and Greece. Underweight CE3, UAE and Qatar.
Overweight
For the first time in recent years, our model is suggesting investors take a look at South Africa. The market was the fourth-worst performer in MSCI EM in 2018 as optimism over Cyril Ramaphosa’s presidency diminished in light of the lacklustre economy (and as index heavyweight Naspers sold off). It may be that the pre-election rhetoric remains tricky, but we don’t expect South Africa’s credit rating to be downgraded pre-election, and the economy should rebound gradually in 2019, and we expect bank lending to accelerate. We still see the ZAR as cheap on an REER basis and see the currency-rebound since the September-lows combined with the decline in oil prices as taking pressure off the South African Reserve Bank (SARB) to raise rates. We expect the market to look through populist pre-election statements, and see scope for a Ramaphosa 2.0 pre-election rally on the back of polls pointing to fading support for the Democratic Alliance (DA) and Economic Freedom Fighters (EFF) and a sizeable potential majority for the Africa National Congress (ANC), thus delivering a platform for the president to pursue reform. Coincidence or not, but the MSCI South Africa has had positive dollar returns in each of the last five election years going back to 1994.
Egyptian equities sold off sharply in 2018: the MSCI Egypt Investible Markets Index (which we tend to use in preference to the overly narrow, three constituent MSCI Egypt Index) closed the year 29% off its April peak and down 17% over the year as investors pushed out their rate cut forecasts from 2018 to 2019 given persistent inflation. The IMF expects the economy to accelerate in 2019, and for the C/A deficit to fall sub-2.5%. The decline in oil prices should help the story in 2019, and inflation has already fallen from 17.7% in October to 12.0% in December 2018. We see headline inflation in a 12-14% range from January to May 2019, before plunging to 8% by October 2019 (food price base effects) then picking back up to 11-13% until June 2020 (before falling back into single digits after the last subsidy removal falls out of the numbers in mid-2020). This means the Central Bank of Egypt (CBE): 1) should not need to hike interest rates now (we believe the CBE is forward looking); and 2) can start considering rate cuts in mid-2019. The currency is still cheap on our REER model, but inflation is eroding the undervaluation, and we hope the authorities will prioritise introducing greater exchange rate flexibility before the EGP reaches fair value (around end-2019) and then starts to get overvalued.
Turkey announced a record C/A surplus in October, and November’s was a fourth month of surplus – confirming: 1) how cheap the TRY has become (the cheapest in EM on our REER measure); and 2) the extent of the domestic slowdown (new passenger car sales, for example, were down 43% YoY in November). We expect the government to support the banking sector if required. In 2019, we expect growth of just 0.8%, but see upside risks to this (consensus and the IMF are more bearish). An environment of fewer Fed hikes and lower oil would benefit Turkey and allow rates to fall faster from the current 24%

4
Renaissance Capital 14 January 2019
ESG
level. One risk for the market could be economic populism ahead of March’s local elections, including renewed pressure on the central bank to cut rates. The shifting of VW production capacity from Central Europe to Turkey we see as demonstrating Turkey’s ability to gain manufacturing investment given full employment and poor demographics in Central Europe. Turkey was the worst-performing market in MSCI EM in 2018, down 43.6%. The market has de-rated by 30% vs its long-run average 12-month forward P/E: 6.3x v 8.9x (making Turkey the second-cheapest market in EM after Russia).
Neutral
Pakistan is starting to look interesting to us. The currency is now cheap on our REER model, and Pakistan was the second worst-performing market in MSCI EM in 2018, down 37.8%. Though IMF negotiations are complex, we expect them to continue – and an agreement would increase our enthusiasm for the market: the market is trading on a 12-month forward P/E of 7x down from a 2017 peak of 11.5x as FM investors have sold down and EM investors failed to engage.
Our lacklustre outlook on oil leads us to downgrade oil exporters.
Russia we take back to neutral. The equity market was the fourth-best performer in EMEA last year (declining just 5.6%) as Russia was seen as resilient to higher US rates and trade wars. Russia has strong valuation support, companies are paying higher dividends and the geopolitical backdrop has helped catalyse economic reforms designed to make the economy bullet-proof. However, we see headwinds to the consumer story in 2019 given the increase in VAT and higher inflation/rates. The lower oil price is not positive, but is not destabilising in our opinion given the flexible exchange rate, low oil-price breakeven and external deleveraging – our long-term regression suggests the market is currently pricing in $61/bl oil, and is thus trading around fair value. However, with Brent at $60/bl, well below the Bloomberg consensus of $70/bl, downgrades to consensus earnings may be necessary. On a relative basis, given our expectation of no major rebound in oil, we would expect Russia to lag an EM recovery in 2019. We still find it a challenge to find marginal investors given EM investors are already overweight Russia, and the risk of further sanctions on Russia in 2019 is likely to deter crossover investors – even if the momentum of new sanctions appears to have slowed (e.g. potential Congressional sanctions on US investors buying newly issued sovereign debt appear to have been pushed back).
Saudi Arabia we also cut to neutral. The oil price drop takes oil below Saudi Arabia’s fiscal breakeven of $83/bl in 2018 ($73/bl in 2019) according to the IMF, hampering the authorities’ ability to stimulate the economy. MSCI Saudi Arabia was up 15.1% in 2018, which would have made it the second-best performer in MSCI EM had it already been included in the index (inclusion is due in two tranches in May and August 2019) on the back of fiscal stimulus, ahead of the MSCI EM index inclusion, and with the authorities reportedly using government-linked funds to help support the market. We would trim into strength in the run-up to MSCI inclusion at these levels.
Greece scores well on our top-down screen. But this was the case in both 2017 and 2018 and in both years MSCI Greece underperformed MSCI EM. We have to concede that our model can’t capture the nuances of Greece’s banks, but with Greece having underperformed EM for five years in a row, at some point we should expect a rebound: 2019 will be a third consecutive year of growth for the Greek economy. Legislative elections due by October could be a potential trigger, given the lead enjoyed by New Democracy over Syriza in opinion polls.

5
Renaissance Capital 14 January 2019
ESG
Underweight
GCC markets we have reduced our enthusiasm on given strong performance in 2018 – we had liked their pegged currencies, oil exposure, rebounding economies and the positive margin impact on the banks of higher rates. Qatar was the top-performing market in EM (up 23.9%) in 2018 and Saudi Arabia (up 15.1%) would have been the second if it was already included in the MSCI EM index. Kuwait (up 11.1%) was the top-performing market in MSCI FM. The oil price dip tempers our enthusiasm, and if the dollar rally fades or reverses, the defensiveness of pegged currencies could prove less valuable. We move from overweight to underweight in aggregate, given the strong 2018 performance, decline in oil prices and continued declines in Dubai property prices. We are underweight Qatar, UAE and Kuwait, and neutral Saudi Arabia, which we would trim into MSCI inclusion related strength.
CE3 ought to be a relative safe haven in a major sell-off given a lack of macro-imbalances and EU membership (indeed, the three CE3 countries all outperformed MSCI EM in 2018) but we would expect them to lag a rebound in EM given their exposure to slowing eurozone growth (and the auto sector) as well as relatively full valuations. Labour market shortages are leading to more rapid wage increases, underpinning the consumer story.
Frontier Markets
In FM, we are overweight Vietnam, Kazakhstan, Georgia, Argentina and Egypt. Neutral Romania, Kenya, Nigeria, Sri Lanka and Morocco. Underweight Bangladesh and Kuwait.
Overweight
Vietnam – The market has de-rated significantly, from a 12-month forward P/E of 24.9x in March to 15.7x. Planned increases in foreign investor limits could attract additional foreign interest, particularly as Argentina (currently 17% of MSCI FM) transitions from MSCI Frontier to MSCI EM in May. Vietnam could be a winner in offshoring of production from China seeking to reduce the C/A surplus with the US. A more stable CNY could ease pressure to weaken the VND.
Kazakhstan – Though oil has fallen, the equity market is very cheap (MSCI Kazakhstan trades on a 12-month forward P/E of just 5x). Volume growth in hydrocarbons provides underpin for the economy and together with stronger demographics provides a better growth story than Russia (without sanction risk). The reform agenda, such as floating the currency, progress on resolving bad loans in the banking sector, financial market reforms and much needed privatisations (given the narrow stock market) make Kazakhstan one of our favoured oil producers.
Georgia – Share price declines have brought Georgia’s highly profitable banks back to attractive valuations (c. 1.4x trailing book value). Seasonal weakness for the GEL is possible during the low season for tourism. The authorities are trying to de-risk the economy (e.g. keeping a lid on consumer credit) as part of their aim to achieve an investment-grade sovereign credit rating.
Argentina – After heavy losses in 1H (Argentina was by far the worst performing in MSCI Frontier in 2018, declining 51.7%), the market has flatlined as the government perseveres with its austerity programme. The central bank’s ultra-tight monetary policy has kept a lid on equities, with the market trading on a 12-month forward P/E of 10x vs a peak of 16x in October 2017, but progress on bringing down inflation expectations has allowed the central bank to remove the 60% floor for rates. Argentina now has the second-cheapest

6
Renaissance Capital 14 January 2019
ESG
currency on our REER model in EM (we use ‘shadow’ inflation data for Argentina). The finance ministry has been guiding for a return to growth in 1H19, which would be a positive for President Mauricio Macri heading into October’s elections, though political risks remain.
Egypt – see above
Neutral
Romania – We had been worried about the economy overheating. We’re less worried about this now, as the economy has slowed and the government seems keen to bring the budget deficit sub-3% of GDP. Good for bonds, but less so for equities given the new bank and other sectoral taxes. Romania’s minimum wage has grown at the fastest rate in the EU over the past decade and is converging with Hungarian levels, which suggests that industrial competitiveness could be at threat.
Sri Lanka – The political crisis that prompted Moody’s, S&P and Fitch to cut the country’s credit rating appears to have been resolved peacefully for now with President Maithripala Sirisena reinstating Prime Minister Ranil Wickremesinghe, this could help equity markets provided political tensions do not return. Early elections are possible in 2019.
Kenya – The decline in the oil price is a positive for Kenya, for both inflation and the C/A deficit. The debate on the rate cap is ongoing, but provides growth optionality for the banks which already generate high RoEs and have de-rated from an average 12-month forward P/B of 1.6x for the three largest banks in April to 1.2x currently for 18% return on equity. Much depends on the government’s ability to cut the budget deficit without overly penalising the corporate sector.
Nigeria – With a lower oil price and the NGN already trading above fair value on our REER model, the concern is that the Nigerian story becomes increasingly reliant on foreign flows. The growth recovery is lacklustre, with real GDP growth likely to lag working age population growth in 2019 (for a fifth year), resulting in a recessionary economic backdrop. The 16 February general election needs to pass for us to become more certain on the 2019 equity market story, and we’d like to see greater flexibility for the naira. Cheap valuations in the banks suggest maintaining some exposure though.
Morocco – Under-owned by foreign investors, with a currency trading in line with its long-run REER, low interest rates and a stock market closely held by local pension funds we see Morocco as a long-term industrialisation beneficiary in North Africa. However, on a 12-month forward P/E of 17.5x we fail to find value.
Underweight
Bangladesh – Bangladesh has the most expensive currency in Frontier on our REER model (though the strengthening INR may help ease devaluation pressure). Although the market has de-rated from a 12-month forward P/E of 17x in January 2018 to 14x, the market is still expensive vs 9x for MSCI FM, given limited transparency of many companies. Though the election seems to have passed relatively peacefully, tightening of bank loan to deposit ratio targets post-election could slow bank lending and/or the economy. A potential longer-term beneficiary of Asian firms reallocating low wage production from China.
Kuwait – As with other GCC countries, our lower oil price outlook diminishes our enthusiasm. The market has been the top performer in MSCI Frontier over 2018, up 11.1%, with low foreign ownership and pegged currency keeping the market defensive. We expect Kuwait to underperform a more positive EM/FM backdrop, particularly if oil

7
Renaissance Capital 14 January 2019
ESG
stays subdued and given friction between the legislature and executive. As a large market, Kuwait might find itself a beneficiary of Frontier funds reallocating out of Argentina (currently 17% of MSCI Frontier) as it transitions from MSCI Frontier to MSCI EM. Kuwait itself is under review by MSCI for a potential transition to EM in 2020.

Renaissance Capital 14 January 2019
ESG
8
Figure 2: Strategy views
Country Rating Bull case Bear case
EM
South Africa OW
We expect the economy to rebound albeit modestly after a weak 2018; the economy has exited a technical recession and growth should firm up from here, albeit modestly.
Oil price declines and the rebound in the ZAR should ease the pressure on the central bank to raise rates; despite the rebound, the currency still appears cheap on our REER measure.
Some pick-up in economic growth and hopefully more political certainty post-election should benefit bank lending and fee revenue streams, although a gradual acceleration is likely at best. Growth in lending should head toward mid-late single digits on corporate loan growth.
We expect the market to look through populist pre-election statements, and see scope for a Ramaphosa 2.0 pre-election rally on the back of polls pointing to fading support for the DA and EFF and a sizeable potential majority for the ANC, thus providing a platform for the president to accelerate reform. Coincidence or not, but MSCI South Africa has had positive dollar returns in each of the last five election years going back to 1994.
SA has the second-highest projected EPS growth in EM according to Bloomberg consensus for 2019 at 17.6% and the highest in EMEA.
SA was the fourth worst-performing market in EM over 2018; investors are marginally UW.
Exiting the low-growth high-unemployment trap in which South Africa resides currently might require more radical reforms than are realistic even post-election. Though the currency appears cheap on our REER model, persistent C/A deficits and high unemployment suggests that one solution could be a weaker ZAR whilst longer-term structural reforms are delivered.
The February budget will be a key issue for rating agencies; we note that a loss of investment-grade rating from Moody’s could trigger a sell-off of government bonds.
South Africa is trading on a 12M fwd P/E of 12.9x from a 2018 peak of 16.9x in January, and now trades below its long-term average of 13.2x; the market offers a 12M fwd dividend yield of 3.6%.
Turkey OW
Normalising relations with the US following the release of the US pastor plus a bold interest rate hike in September have led to a rebound in the TRY; so far, the central bank has avoided cutting rates despite market fears of premature action.
Turkey was the worst-performing market in EM over 2018; most active EM funds are now UW (and the asset-weighted OW has come down significantly).
Valuations are potentially interesting: Turkey is trading on a 12M fwd P/E of 6.2x, the second lowest in EM, and 30% below its long-term average of 8.9x; the market offers a 12M fwd dividend yield of 6.0%, the third highest in EM. Banks are trading substantially below book value (c. 40% lower than their five-year average).
Turkey recorded its highest ever C/A surplus of $2.77bn for October (and November showed a fourth-consecutive monthly surplus). The 12M rolling deficit is now down to just over $39bn; it had been well over $50bn earlier in the year.
The lower oil price helps Turkish inflation and the C/A: modest interest rate cuts are possible in 1H19.
Turkey suffers from large external financing needs but limited FX reserves; stubbornly high inflation; open FX positions of corporates make Turkish companies’ balance sheets vulnerable to $-strength. (Geo)political flareups are always a risk; Turkey has been led by President Recep Tayyip Erdogan (as prime minister then president) for 15 years.
There are concerns over banking system capital adequacy if bad debts rise sharply, though we expect the authorities to provide support if required.
The run-up to local elections in March 2019 could test the credibility of the central bank and finance ministry. We still believe Turkey needs to adopt a new (export-led) growth model to replace the consumption-lending model of the past decade. This may require the currency to stay cheap.
Turkey screens neutral-to-negative on our model. The IMF’s expected slowdown in GDP growth is the worst in EM (from 3.5% in 2018 to 0.4% in 2019E, while lending growth should also slump to 3% vs 10% in 2018 (on an FX-adjusted basis)). We also see credit rating downgrades as possible in 2019. On the positive side, the currency remains very cheap – 30% below fair value, the cheapest in EM – and assuming inflation is brought under control, there may be room for rate cuts from the central bank as the economy adjusts; however, premature action could be a risk.
Egypt OW
Egypt performed in line with EM (using the MSCI Egypt Investible Markets Index, which we tend to use in preference to the overly narrow, three constituent MSCI Egypt Index) down 17% over 2018. On an asset-weighted basis, active EM funds appear OW, but three-quarters of funds have no exposure.
The decline in oil prices should help the story in 2019, and inflation has already fallen from 17.7% in October to 12.0% in December 2018. We see headline inflation in a 12-14% range from January to May 2019, before plunging to 8% by October 2019 (food price base effects) then picking back up to 11-13% until June 2020 (before falling back into single digits after the last subsidy removal falls out of the numbers in mid-2020). This means the CBE: 1) should not need to hike interest rates now (we believe the CBE is forward looking); and 2) can start considering rate cuts in mid-2019. The currency is still cheap (by c. 15% vs its long-run average) on our REER model.
The IPO pipeline looks strong when market conditions allow.
Egypt screens positively on our model. This is driven by GDP growth accelerating to 5.5% over 2019E and lending growth accelerating to 16% (from 12% in 2018), both of which would be helped by rate cuts (which we only expect in 2H19). We see scope for credit rating upgrades as the government’s reforms are recognised by agencies.
Currency undervaluation is gradually eroding thanks to high inflation, and we would like to see more currency flexibility introduced before the currency reaches fair value (around end-2019 on our model) and then starts gradually to become overvalued.
Rate cuts are necessary to boost the economy and bank lending, but need inflation to come down, making them a 2H19 story.
The market is very small at 0.1% of MSCI EM – easily ignored by GEM investors.
Egypt is trading on a 12M fwd P/E of 8.3x, the fifth lowest in EM, and 15% below its long-term average of 9.7x; the market offers a 12M fwd dividend yield of 3.9%.
Source: IMF, Bruegel, MSCI, Bloomberg, Renaissance Capital
Country views

Renaissance Capital 14 January 2019
ESG
9
Figure 2: Strategy views (continued)
Country Rating Bull case Bear case
EM
Russia N
The valuation underpin is strong, and Russian companies are returning cash to shareholders via dividends and buybacks. Russia is trading on a 12M fwd P/E of 5.5x, the lowest in EM, and 8% below its long-term average of 6.0x; the market offers a 12M fwd dividend yield of 7.2%, the second highest in EM on consensus figures.
After the August sell-off, the currency is slightly cheap on our REER model.
Our long-term regression suggests the market is currently pricing in $61/bl oil, and is thus trading around fair value.
Manufacturing PMI of 51.7 in December, up from 48.1 in July (albeit down from 52.6 in November).
Russia’s economic reaction function to geopolitics has been to strengthen macro resilience via a floating RUB, inflation targeting, twin surpluses and FX reserve accumulation. Market-sentiment damaging reactions to sanctions have been avoided.
A slowing economy, rising inflation and higher rates in 2019, combined with ongoing sanctions risk, are likely to keep crossover investors on the sidelines despite attractive valuations; EM investors already OW (Russia is currently the biggest OW of the benchmark countries).
We soften our growth outlook for 2019 by 0.5 ppt (1.4%). The year-average rate is RUB67/$ We see 1) inflation picking up to 4.7% at YE19 given the VAT hike, 2) a weaker RUB and 3) normalising harvest at end-2019 and with it rates at 8.0% at end-2019.
Russia was the fourth best-performing market in EM over 2018. A lack of new stocks being listed on the market has resulted in investor lethargy. Radical reforms are unlikely.
Russia screens neutral on our model. Our Russia/CIS economist Oleg Kouzmin sees growth at 1.4% over 2019 (vs 1.9% in 2018), while we see lending growth flat at 9%. The currency is close to fair value on our REER measure. On the positive side, we see a strong possibility of further credit rating upgrades over 2019; against that, the CBR surprised the market with a 25bp hike in the policy rate to 7.75% in December (though potentially the last hike of the cycle). While Russia may not screen so well for 2019, we believe 2020 could be substantially better, assuming no further sanctions.
The fall in the oil price to c. $60/bl for Brent takes it well below the Bloomberg consensus of $70/bl for 2019, suggesting that EPS downgrades may be necessary
Pakistan N
Pakistan was the second-worst performer in EM over 2018.
The currency has devalued to PKR140/$ (from PKR105/$ in December 2017) making it 9% undervalued relative to its long-term average REER on our model.
The falling oil price could help the C/A deficit.
Valuations are looking interesting: Pakistan is trading on a 12M fwd P/E of 6.9x, the third lowest in EM, and 12% below its long-term average of 7.9x; the market offers a 12M fwd dividend yield of 7.7%, the highest in EM.
Active EM funds have yet to engage: only 19% have any exposure (but Pakistan is just 0.04% of MSCI EM).
If an IMF support package can be agreed we would be more positive on reform implementation.
The central bank raised rates 150 bpts to 10% in December 2018, which is impacting growth; consensus sees inflation reaching 9.4% in 1H19, suggesting the hiking cycle may not be over.
The Trump administration has voiced concerns about potential IMF loans being used to repay debts to China; the IMF is proceeding slowly amid plans for greater diligence into debt sustainability.
Pakistan screens as the worst market in EM. The growth slowdown is the second worst in EM, from 5.8% in 2018 to 4.0% in 2019E; we also forecast lending growth to halve to 8%. We expect interest to continue to rise over 2019, and also forecast a downgrade to its credit rating. One comparative bright spot is the currency, which is currently 9% below fair value on our REER model.
Greece N
New Democracy is leading opinion polls ahead of the October 2019 elections.
Strong manufacturing PMI of 54.
Greek banks still trade at distressed valuations, given the high NPL burden (c. 40% NPLs).
Greece is unlikely to escape from a low-growth trap given continued austerity.
At 0.2% of MSCI, Greece is easily ignored.
Though Greece scores well on our top-down model, a lack of visibility on the banks remains an issue: we don’t believe top down models capture the nuances of Greek banks’ bad debt/capitalisation dynamics.
Lack of consensus within the Eurozone on burden sharing / debt forgiveness
GCC N/UW
Improved fiscal oil price break evens for 2019, according to the IMF: UAE ($67.4/bl), Qatar ($44/bl), Saudi Arabia ($73.3/bl); Kuwait breakeven remains unchanged ($47.4/bl).
The MSCI EM index inclusion story for Saudi Arabia in 2019 (taking place in two tranches in May and August) and potentially Kuwait (in 2020) should drive activity and interest.
IMF forecasts suggest a pick-up in growth, driven by the World Cup in Qatar, increased government spending in Saudi Arabia and fading fiscal headwinds in UAE (including Dubai Expo 2020 spending, though the ongoing real estate slump in Dubai continues to cause concern).
The $ peg, which should provide some protection if the $ strengthens and EM FX sells off.
Active EM funds are UW Qatar, UAE (in EM), so there is scope for re-engagement.
In 2018, Gulf countries benefitted from pegged currencies, banks’ positive margin exposure to higher US rates and oil. Gulf countries outperformed significantly over 2018: Qatar was been the top-performing market in EM, Saudi Arabia would have been the second-best market in EM had it been included, while Kuwait was the top-performing market in Frontier. Only UAE stands out for having underperformed, driven by the weakness in the property sector.
UAE has de-rated from 12x fwd earnings in early 2017 to 8.9x currently. Qatar has recovered the valuation drop seen in 2017 as the economy been resilient to the breakdown of relations with neighbouring countries.
Media reports suggest that Saudi Arabia’s Public Investment Fund may have been supporting the market.
Source: IMF, Bruegel, MSCI, Bloomberg, Renaissance Capital

Renaissance Capital 14 January 2019
ESG
10
Figure 2: Strategy views (continued)
Country Rating Bull case Bear case
EM
CE3 UW
Strong wage growth across the region (given labour shortages) is driving the consumer story and potentially lending growth.
A gradual normalisation of interest rates could support bank margins.
We like the refining sector in Poland and Hungary; of the banking sectors, Polish banks are expected to have the highest EPS growth over 2019, according to Bloomberg consensus.
There are no significant macro imbalances. Bank lending growth has been steady, and could have room to expand. We believe the region would be defensive in a global sell-off.
PMIs have been coming off their recent highs across the region, driven by weaker eurozone activity, particularly in the important automotive sector.
The IMF expects growth to slow given the slower eurozone economy accompanied by lower EU fund transfers for Poland and Hungary.
Political risks continue. In Poland, the PiS looks likely to retain power in the general election due by November 2019: local election results showed narrow gains, but against a headwind of a loss of support in cities and flagging momentum in rural areas. The results of the confidence vote on 12 December suggest the PiS still has a mandate for its programme. Brexit diminishes the risk of a tough EU response to Hungary and Poland.
Poland is trading on a 12M fwd P/E of 11.7x, and 1% below its long-term average of 11.9x; the market offers a 12M fwd dividend yield of 3.2%. Hungary is trading on a 12M fwd P/E of 10.0x, 7% below its long-term average of 10.8x; the market offers a 12M fwd dividend yield of 2.7%, the third lowest in EM. Czech Republic is trading on a 12M fwd P/E of 13.8x, 8% above its long-term average of 12.7x; the market offers a 12M fwd dividend yield of 5.7%, the fifth highest in EM.
Frontier
Vietnam OW
Vietnam could be a beneficiary of production reorienting away from China, though its exposure to global trade may see the economy slow slightly from 2018’s high level. An end to $ strength / CNY weakness would be a positive. Reported levels of bad debts in the banking system are falling: 1.9% at end-2018 (vs 2.0% end-2017, 2.5% end-2016) according to the central bank.
The stock exchange is targeting an upgrade to MSCI EM, and is aiming to pass reforms on foreign ownership limits for listed companies and SoEs, as well as banks and airlines by the end of 2019.
Still one of the best long-term growth/investment stories in Frontier.
As a relatively large frontier market, a likely beneficiary of Argentina’s May 2019 transition to from MSCI FM to MSCI EM (Argentina is currently 17% of MSCI FM)
There are risks of tighter monetary policy which could slow credit growth further (the central bank targets flat credit growth of 14% in 2019). The banking sector has improved its NPL ratio, but asset risks are still relevant.
Vietnam screens neutral on our five-factor model. Real GDP growth should remain robust in 2019E at 6.4%, but slightly slower than 2018’s 6.5%; lending growth will also fall slightly to 14% vs 15% in 2018 on our numbers. The currency is 23% overvalued on an REER basis; however, given Vietnam’s strong external position and economic transformation, this is less of a concern. Interest rates are expected to be raised slightly, according to Bloomberg consensus, while we do not see any changes to the country’s credit rating as likely.
Argentina OW
The government is sticking to its reform programme.
Progress in bringing down inflation expectations has allowed the central bank to remove the 60% floor on interest rates (end-2019 inflation is expected at 28.7% according to the central bank’s December survey).
The currency has fully adjusted to 22% below its long-term average on an REER basis.
Argentina’s May 2019 transition to MSCI EM from MSCI FM could prompt renewed interest from GEM investors.
Argentina was the worst-performing market in Frontier over 2018, falling 51% in $ terms.
The economy is in a severe contraction; industrial production fell 13.3% in November, while the IMF sees 2018 growth at -2.6% and 2019 growth at -1.6%.
Provincial elections start in March, presidential primaries begin in August, the first round of elections are on 27 October, while the run-off is scheduled for 24 November. Support for President Mauricio Macri will depend on the country’s economic performance over the coming quarters: a victory for Cristina Fernandez, Macri’s populist predecessor would bring with it substantial risks to the current market-oriented policy.
Argentina screens neutral to positive over 2019. While real GDP growth is forecast by the IMF to be negative at -1.6% in 2019E, this is still an improvement on 2018’s -2.6% figure. Lending growth is forecast to fall to 20% vs 25% in 2018. Rating agencies are likely to downgrade the country going forward, in our view.
Source: IMF, Bruegel, MSCI, Bloomberg, Renaissance Capital

Renaissance Capital 14 January 2019
ESG
11
Figure 2: Strategy views (continued)
Country Rating Bull case Bear case
Frontier
Kazakhstan OW
We believe Kazakhstan delivers one of the best macro stories in the region with high growth (3.9%/3.5% in 2018/19E) supported by new oil fields and production.
The macro story is supported by a floating currency, declining inflation and inflation targeting (from 6% at end-2018E to c. 4% target effective 2020). Potential for rate cuts (from 9.25% now to 8.75% by end-2020).
Budget discipline improved with budget rules, while sovereign sustainability looks very strong with total reserves covering 30M of imports.
Banking sector ready for growth after progress on NPL recognition after a decade of slow progress.
Ambitious reform programme including several major privatisations and relaunch of domestic capital markets could be a positive surprise.
Kazakhstan is trading on a 12M fwd P/E of 4.9x, the lowest in Frontier, and 24% below its long-term average of 6.4x; the market offers a 12M fwd dividend yield of 9.0%, the second highest in Frontier.
Kazakhstan screens positively on our model and ranks the second-best market in Frontier. The currency is the second cheapest in Frontier at 20% below fair-value on an REER basis.
The KZT is still linked to the RUB given trade links.
Oil dependence remains and is unlikely to change in the near term.
Bank credit growth is driven by consumers as corporates either don't borrow or have mega projects funded internationally.
Very limited stock market in terms of liquid stocks.
Second best-performing Frontier market in 2018 as higher oil combined with very resistant macro backdrop.
Georgia OW
We believe Georgia delivers the best macro story in the region with high growth (5.2/4.8% in 2018E/2019E), a floating currency, inflation under control (c. 3%) and the potential for rate cuts (25 bpts this year to 6.75%). Other strengths include: 1) flourishing tourism (the number of tourists in Georgia will exceed the population by c. 1/3 this year, putting Georgia in between Switzerland and Spain on this metric; with the total amount of tourist receipts at 20% of GDP); 2) strong interactions with the IMF under the EFF framework; 3) improving budget discipline (deficit at below 3% of GDP every year); as well as signs that the economy is becoming fundamentally stronger and is generating more added value – i.e. an improving C/A deficit despite accelerating growth and net exports contributing positively to growth despite recovering domestic demand.
Share price declines (in part on the back of reduced loan growth assumptions) have brought Georgia’s highly profitable banks back to attractive valuations (c1.4x trailing book value).
Due to unfavourable seasonality, the currency could weaken during the seasonally weaker winter season for tourism. Also, Georgia is exposed to contagion effects from Turkey and Russia, though to a limited extent. During times of financial market stress, Georgia’s large C/A deficit stands out.
Georgia screens somewhat negatively on our model. GDP growth is set to fall to 4.8% in 2019E (from 5.2% in 2018), while lending growth is also likely to moderate to 13% vs 18% in 2018. With only modest rate cuts (our CIS economist Oleg Kouzmin is looking for 25 bpts over the year) expected, we do not consider this as a significant enough change, and there is unlikely to be much movement on credit ratings; moreover, the currency is fairly valued according to our REER model.
Kenya N
The lower oil price projected for 2019 is positive for inflation. It will help keep inflation within its inflation target band of 2.5-7.5%. And it will help contain the import bill, and by implication the C/A deficit.
Kenya is still relatively under-owned, with Frontier funds largely UW.
Any easing of the interest rate cap could provide upside for the banks.
Although the economy has rebounded more than anticipated, concerns remain over Kenya’s twin deficits. It may be a challenge to fully lift the rate caps on the banks while they are important purchasers of government debt. Kenya suffers from a macro vs micro disconnect: feedback on the ground suggests businesses (particularly SMEs) and individuals are constrained. The corporate sector is being used as a source of revenue to help address the budget deficit via new levies such as the 8% VAT on fuel and the higher excise duty on mobile telephone and data services. The KES is expensive on our REER model.
The vulnerable part of the economy is the fiscal side. The government needs to demonstrate that it can bring down the budget deficit, to restore debt sustainability. Kenya’s rising cost of debt reflects the market’s view that that the government needs to slow borrowing.
The rate cap continues to dampen credit growth and undermine the conduct of monetary policy.
Kenya is trading on a 12M fwd P/E of 7.9x, and 25% below its long-term average of 10.6x; the market offers a 12M fwd dividend yield of 6.9%.
Source: IMF, Bruegel, MSCI, Bloomberg, Renaissance Capital

Renaissance Capital 14 January 2019
ESG
12
Figure 2: Strategy views (continued)
Country Rating Bull case Bear case
Frontier
Morocco N
Morocco has been a safe-haven in times of EM volatility thanks to sizable domestic pension funds and lack of significant imbalances.
Moroccan companies can act as a gateway to high-growth francophone Africa. Strong mid-term industrialisation story given educational levels, high investment, strong infrastructure and geographical proximity to the EU and poor demographics in central Europe.
Lower oil prices should help the economy through improved external balance and lower inflation.
EUR-linked currency trading around fair value. Reserves more than cover short-term debt.
Planned increases in government spending on subsidies and social programmes to quell social unrest may put pressure on the budget deficit as well as on the credit rating. Protests against high living costs led the King to replace the finance minister in August, and the 2019 budget sees the deficit falling only slightly (from 3.8% of GDP to 3.7% of GDP, though privatisation proceeds are hoped to shrink the deficit further, to 3.3% of GDP).
Fiscal slippage on subsidies of 1.7% of GDP (vs budgeted 1.2%) saw S&P put its BBB- rating on negative outlook in October.
While the market has de-rated, Morocco is trading on a 12M fwd P/E of 16.4x, the highest in Frontier, and 11% above its long-term average of 14.9x; the market offers a 12M fwd dividend yield of 3.6%, the fifth lowest in Frontier.
Morocco screens neutral on our model. A modest GDP growth acceleration (to 3.2% in 2019E) is offset by a modest lending growth acceleration (to 4%). The currency is around fair value, and we see little change on monetary policy or credit ratings.
Romania N
Overheating fears should ease as the economy slows from its above-potential growth to normal levels and as the central bank raises rates.
Romania is trading on a 12M fwd P/E of 7.1x, the fifth lowest in Frontier, and 18% below its long-term average of 8.7x; the market offers a 12M fwd dividend yield of 8.7%, the fourth highest in Frontier.
The budget deficit remains a concern, bringing with it risks that the European Commission opens Excessive Deficit procedures; the surprise announcement of a bank tax and other sector-specific taxes undermines the attractiveness of the market; but shows the government may be serious about tackling the deficit.
FX reserves declined between February and August 2018 and should be monitored. Fiscal deterioration could add pressure to the exchange rate and force even more tightening.
Real interest rates are still negative raising the prospect of rate increases in 2019.
Romania screens somewhat negatively on our model. Real GDP growth should decelerate over 2019E to 3.4% (vs 3.9% in 2018); on the positive side, lending growth should accelerate to 9% from c. 7% (though the bank tax could impact this). The currency is slightly over-valued (7% higher than its long-term average on an REER basis).
Sri Lanka N
Sri Lanka is trading on a 12M fwd P/E of 12.2x, and 6% below its long-term average of 13.1x; the market offers a 12M fwd dividend yield of 4.5%.
Sri Lanka screens neutral on our model. While GDP growth should accelerate to 4.3% over 2019E (from 3.7% in 2018), lending growth should fall to 11% (from c. 15%). The currency is a little over fair value, though it is the second cheapest in the region, while consensus expects rates to stay roughly unchanged over 2019. Credit ratings are also likely to be unchanged following recent downgrades.
Ongoing political turmoil has already seen Sri Lanka’s credit rating downgraded. The prime minister has been reinstated, but there are still political tensions, and the potential for early elections in 2019.
Political turmoil has already forced the IMF to put discussions relating to the release of funds on hold, adding to funding woes: the government has large funding requirements over 2019, including a $4.2bn expected repayment.
The currency is a little over fair value, and could be at risk of further depreciation, particularly if a political resolution is not found, given the country’s large external funding requirements.
Source: IMF, Bruegel, MSCI, Bloomberg, Renaissance Capital

Renaissance Capital 14 January 2019
ESG
13
Figure 2: Strategy views (continued)
Country Rating Bull case Bear case
Frontier
Nigeria N
The run-up to the February elections appears peaceful. Potential for renewed reform momentum post-election.
Banks are attractively valued, trading on FY19E P/B of 0.5x – the cheapest in our SSA coverage universe, on our estimates. The average NPL ratio of our Nigerian coverage universe (ex – FBNH) improved marginally to 6.4% in 9M18 from 6.9% in 1H18, and 7.2% in FY17. With oil prices above the $35-$40/bl region at which banks restructured their exposures, asset quality becomes less of a key risk. However, we note that if oil prices continue to decline, it poses a threat to the asset quality of the banks.
Nigeria is trading on a 12M fwd P/E of 5.9x, the second lowest in Frontier, and 31% below its long-term average of 8.5x; the market offers a 12M fwd dividend yield of 7.4%, the fifth highest in Frontier.
Nigeria screens positively on our model, scoring the best among the Frontier countries (though in absolute terms, the score is not particularly high). The main positive factors are accelerating GDP growth (to 2.5% from 2.0% in 2018) and the possibility of rate cuts according to forecasts from our SSA economist Yvonne Mhango. Lending growth, however, is likely to remain flat, while the currency is a little overvalued (8% above its long-term average, on an REER basis). We do not see any change likely in credit ratings.
2018 was disappointing in terms of growth despite the improvement in the oil price. We expect 2% growth for 2018 and a modest pick-up to 2.5% in 2019, still below the rate of population growth. The recessionary environment continues on a per-capita basis.
At the NGN365/$ exchange rate used by investors, the currency is a little overvalued compared with its long-term average; we would hope to see some flexibility introduced, though with a C/A surplus and FX reserves exceeding $42bn, we do not expect to see any change until after the elections.
Big UW of Frontier investors has almost closed (in part because Nigeria has seen a large number of deletions from the MSCI FM index).
Pre-election period has so far been calm, but we believe investors will await the election results before reallocating.
Bangladesh UW
Elections appear to have passed relatively peacefully, resulting in the expected re-election of the incumbent. Assuming no post-election incidents (garment workers are striking for higher wages), policy-makers can focus on delivering their ambitious goals on industrialisation and development.
Growth is expected by the IMF to come in at 7% over 2019, similar to 2018.
Valuations have come down: Bangladesh is trading on a 12M fwd P/E of 14.0x, the fourth highest in Frontier, and 6% above its long-term average of 13.2x – a substantial derating from its recent highs of 17x; the market offers a 12M fwd dividend yield of 2.6%, the third lowest in Frontier.
The premier is seeking a third term in office and highly likely to win the election since the main opposition leader was declared ineligible to run. The 2014 elections saw serious protests with measurable economic disruption.
Garment workers have been striking for higher wages which if achieved could increase labour costs for corporates.
The 83.5% loan/deposit ratio target for banks must be met by 31 March 2019. 12 banks still exceeded this level as of September.
There is a possibility of currency devaluation after the elections, given currency adjustments that have taken place in India, Sri Lanka and Pakistan; interest rates may also have to increase. The recent rebound in the INR might help.
Bangladesh screens as the worst market in Frontier. GDP growth is slowing gently to 7.1% in 2019E; lending growth should fall to 13% from 19%. The currency remains substantially overvalued: 26% above its long-term average REER, ahead of its regional peers and the most expensive currency in Frontier. We also expect interest rates to rise from their current low levels, given the general direction of tighter rates across the region.
Kuwait UW
As a large market, Kuwait might find itself a beneficiary of Frontier funds reallocating out of Argentina (currently 17% of MSCI Frontier) as it transitions from MSCI Frontier to MSCI EM. Kuwait itself is under review by MSCI for a potential transition to EM in 2020.
Under owned by Frontier investors.
As with other GCC countries, our lower oil price outlook diminishes our enthusiasm. The market has been the top performer in MSCI Frontier over 2018, up 11.1%, with low foreign ownership and pegged currency keeping the market defensive. We expect Kuwait to underperform a more positive EM/FM backdrop, particularly if oil stays subdued and given friction between the legislature and executive.
Source: IMF, Bruegel, MSCI, Bloomberg, Renaissance Capital

Renaissance Capital XX January 2019
ESG
Renaissance Capital 14 January 2019
ESG
14
You can run but you can’t hide
2018 was a challenging year for global markets to put it mildly. Of the 40 major asset classes2 we show below in Figure 3, only JPY cash provided investors with positive real dollar returns in 2018. No wonder macro hedge funds have been throwing in the towel.
Figure 3: Nowhere to hide; total returns 2018 ($) by asset class capped at -25%
Note: We do not see Bitcoin as an asset
Source: MSCI, Bloomberg
Of the 69 countries making up the three major MSCI global indices (World, Emerging and Frontier Markets), 66 declined in dollar terms – a 96% hit rate, representing a post-GFC high.
▪ DMs declined by 10.4%, with no country index in MSCI World ending the year in positive territory.
▪ EMs declined by 16.6%, with only tiny Qatar (+23.9%), which represents just 1% of the MSCI EM Index, as the sole positive performer. Only 169 of 770 full-year index constituents ended the year in positive territory.
▪ FMs declined by 19.1%, with only Kuwait (+11.1%) and Tunisia (+9.8%) in positive territory. Only 23 of 99 full-year index constituents ended the year in positive territory.
▪ Honourable mentions go to standalone countries such as Saudi Arabia (+15.1%) which performed well heading in to its MSCI EM Index inclusion (in two tranches, in May and August 2019). Zimbabwe3 (+119.4%), Jamaica (+23.4%) and Trinidad and Tobago (+9.5%) also showed positive performances.
EM portfolio managers can seek solace that over the course of 2018, EM performed in line with non-US global equities (MSCI World ex-US declined by 16.4%). But nevertheless, a challenging decade for EM equities, which have now suffered declines in five of the last ten years, and where the MSCI EM Index is trading back at April 2007 levels.
2 We don’t consider Bitcoin an asset class but included it for completeness. 3 In Zimbabwe, equities have acted as a currency substitute/real asset. Given currency shortages, and the widening differential between Zimbabwe’s electronic dollars and freely tradeable US dollars, international investors would not have been able to realise/repatriate this return.
-25
-20
-15
-10
-5
0
5
JPY
cas
h
Dol
lar
cash
US
Tre
asur
ies
DM
RE
IT
Glo
bal b
onds
Eur
o co
rpor
ate
cred
it
US
RE
IT
US
TIP
S
EM
US
D C
orpo
rate
cre
dit
US
HY
Cor
pora
te c
redi
t
DM
RE
IT
US
IG C
orpo
rate
cre
dit
Gol
d
Glo
bal c
redi
t
EM
Loc
al C
urnc
y G
ov b
onds
Glo
bal T
IPS
EM
Sov
erei
gn U
SD
bon
ds
US
equ
ities
Pre
ciou
s m
etal
s
EM
FX
EU
R c
ash
GB
P c
ash
Latin
Am
eric
a eq
uitie
s
DM
equ
ities
US
sm
all c
ap e
quiti
es
Com
mod
ities
Japa
n E
quiti
es
Asi
a P
acifi
c eq
uitie
s
DM
sm
all c
ap e
quiti
es
DM
ex-
US
equ
ities
Eur
opea
n eq
uitie
s
EM
Equ
ities
Bre
nt c
rude
Em
ergi
ng A
sia
equi
ties
EM
EA
equ
ities
Fro
ntie
r eq
uitie
s
Indu
stria
l met
als
EM
sm
all c
ap e
quiti
es
Sof
t com
mod
ities
Bitc
oin
(-77
.9%
)
2018 – Nowhere to hide
Renaissance Capital XX January 2019
ESG
Renaissance Capital 14 January 2019
ESG
15
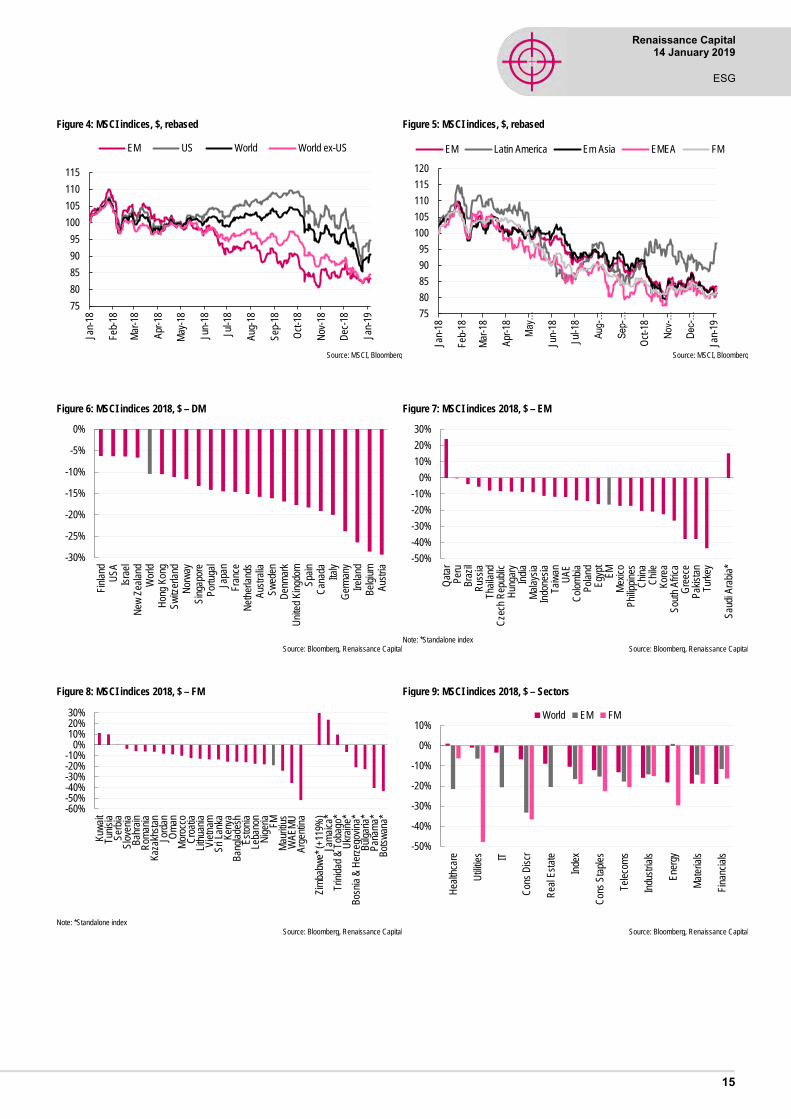
Figure 4: MSCI indices, $, rebased
Source: MSCI, Bloomberg
Figure 5: MSCI indices, $, rebased
Source: MSCI, Bloomberg
Figure 6: MSCI indices 2018, $ – DM
Source: Bloomberg, Renaissance Capital
Figure 7: MSCI indices 2018, $ – EM
Note: *Standalone index
Source: Bloomberg, Renaissance Capital
Figure 8: MSCI indices 2018, $ – FM
Note: *Standalone index
Source: Bloomberg, Renaissance Capital
Figure 9: MSCI indices 2018, $ – Sectors
Source: Bloomberg, Renaissance Capital
75
80
85
90
95
100
105
110
115
Jan-
18
Feb
-18
Mar
-18
Apr
-18
May
-18
Jun-
18
Jul-1
8
Aug
-18
Sep
-18
Oct
-18
Nov
-18
Dec
-18
Jan-
19
EM US World World ex-US
75
80
85
90
95
100
105
110
115
120
Jan-
18
Feb
-18
Mar
-18
Apr
-18
May
…
Jun-
18
Jul-1
8
Aug
-…
Sep
-…
Oct
-18
Nov
-…
Dec
-…
Jan-
19
EM Latin America Em Asia EMEA FM
-30%
-25%
-20%
-15%
-10%
-5%
0%
Fin
land
US
AIs
rael
New
Zea
land
Wor
ldH
ong
Kon
gS
witz
erla
ndN
orw
ayS
inga
pore
Por
tuga
lJa
pan
Fra
nce
Net
herla
nds
Aus
tral
iaS
wed
enD
enm
ark
Uni
ted
Kin
gdom
Spa
inC
anad
aIta
lyG
erm
any
Irel
and
Bel
gium
Aus
tria
-50%
-40%
-30%
-20%
-10%
0%
10%
20%
30%
Qat
arP
eru
Bra
zil
Rus
sia
Tha
iland
Cze
ch R
epub
licH
unga
ryIn
dia
Mal
aysi
aIn
done
sia
Tai
wan
UA
EC
olom
bia
Pol
and
Egy
ptE
MM
exic
oP
hilip
pine
sC
hina
Chi
leK
orea
Sou
th A
fric
aG
reec
eP
akis
tan
Tur
key
Sau
di A
rabi
a*
-60%-50%-40%-30%-20%-10%
0%10%20%30%
Kuw
ait
Tun
isia
Ser
bia
Slo
veni
aB
ahra
inR
oman
iaK
azak
hsta
nJo
rdan
Om
anM
oroc
coC
roat
iaLi
thua
nia
Vie
tnam
Sri
Lank
aK
enya
Ban
glad
esh
Est
onia
Leba
non
Nig
eria
FM
Mau
ritiu
sW
AE
MU
Arg
entin
a
Zim
babw
e* (
+11
9%)
Jam
aica
*T
rinid
ad &
Tob
ago*
Ukr
aine
*B
osni
a &
Her
zego
vina
*B
ulga
ria*
Pan
ama*
Bot
swan
a*
-50%
-40%
-30%
-20%
-10%
0%
10%
Hea
lthca
re
Util
ities IT
Con
s D
iscr
Rea
l Est
ate
Inde
x
Con
s S
tapl
es
Tel
ecom
s
Indu
stria
ls
Ene
rgy
Mat
eria
ls
Fin
anci
als
World EM FM

Renaissance Capital XX January 2019
ESG
Renaissance Capital 14 January 2019
ESG
16
▪ In DMs, the top-performing markets in 2018 were Finland (-6.2%), the US (-6.3%), Israel (-6.3%), New Zealand (-6.6%) and Hong Kong (-10.5%). The worst performers were Austria (-29.3%), Belgium (-28.6%), Ireland (-26.4%), Germany (-23.9%) and Italy (-20.0%).
▪ In EMs, the top-performing markets in 2018 were Qatar (+24%), Peru (-0.3%), Brazil (-3.9%), Russia (-5.6%) and Thailand (-8.0%). The worst performers were Turkey (-43.6%), Pakistan (-37.8%), Greece (-37.8%), South Africa (-26.5%) and Korea (-22.6%). Standalone Saudi Arabia (+15.1%) is due to join the index in mid-2019.
▪ In FMs, the top-performing markets in 2018 were Kuwait (+11.1%), Tunisia (+9.8%), Serbia (-0.1%), Slovenia (-3.7%) and Bahrain (-5.8%). The worst performers were Argentina (-51.7%), the West African Economic and Monetary Union (WAEMU) (-35.8%), Mauritius (-24.2%), Nigeria (-18.2%) and Lebanon (-17.8%).
▪ Sector-wise, the only EM sector in positive territory over 2018 on a total return basis was energy (+0.8%). All other sectors fell: consumer discretionary (-33.3%), healthcare (-21.5%), IT (-20.6%), real estate (-20.5%), communication services (-17.9%), consumer staples (-15.3%), materials (-14.4%), industrials (-14.2%), financials (-11.7%), and utilities (-6.4%).

Renaissance Capital XX January 2019
ESG
Renaissance Capital 14 January 2019
ESG
17
The EM consensus has been wrongfooted for two years in a row.
Entering 2017, the concern was that newly-elected US President Trump would undermine the EM equity story by erecting trade barriers and adding late-cycle inflationary fiscal stimulus, paving the way to a potentially toxic mix of lower EM trade accompanied by higher US interest rates, bond yields and a stronger dollar. However tax cuts took until December to be passed and the feared trade war failed to materialise. The dollar had its worst performance in 13 years, while EM equities rebounded from the 2015-2016 China-slowdown related sell-off and a pre-US election dip to have their best year since 2009’s post-GFC rebound, rallying 34% over the year.
In the run-up to 2018, many hoped for more of the same: more rhetoric than action from the White House. Instead, policy started to be delivered. The sizeable fiscal stimulus pushed US growth up through 3% and lead to concerns that the Fed would be obliged to accelerate hikes as inflation moved up to 2.9% in July (3.0% inflation has been a strong warning signal for EM equities). US treasury yields rose from 2.0% in September 2017 to 3.2% in August 2018 in response to the recovering economy, increasing issuance to fund the fiscal stimulus and the Fed’s balance sheet unwind. From mid-April, the dollar started rallying, with the dollar index rising 9% by December as an increased interest rate differential between the US and other major currencies converged with US exporters taking advantages of tax cuts to repatriate overseas cash balances, as well as fears that rising trade tensions could lead to competitive devaluations as the US threatened to impose tariffs on nearly all Chinese exports to the US (the renminbi weakened from CNY6.3/$ to CNY6.9/$ from April to August).
Figure 10: PMIs weakening
Source; Bloomberg, Renaissance Capital
Figure 11: PMIs – latest vs YtD peak
*Whole Economy PMI. Source; Bloomberg, Renaissance Capital
Lately, the focus has moved on to the slowing global economy, where manufacturing PMI readings have been falling globally, with the global manufacturing PMI Index falling from 54.5 at end-2017 to 51.5 at end-2018. The Eurozone Index fell from 60.6 at end-2017 to 51.4 at end-2018. In the US, it fell from 56.5 in April 2018 to 53.8 in December 2018 (the ISM Manufacturing PMI index fell from 61.3 in August 2018 to 54.1 in December 2018). EM has seen similar declines, where the index is just barely in positive territory, at 50.3 at end-2018, down from 52.2 in at end-2017. China’s official National Bureau of Statistics manufacturing PMI fell to 49.4 at end-2018 (from 52.4 in September 2017), a level not seen since January 2016, and the worst December figure since 2008, while new orders have declined for seven successive months. The inversion of the part of the US yield curve (five-year yields fell below two-year yields) in December added to investors’ slowdown concerns.
474849505152535455565758596061
Jan-
16
Mar
-16
May
-16
Jul-1
6
Sep
-16
Nov
-16
Jan-
17
Mar
-17
May
-17
Jul-1
7
Sep
-17
Nov
-17
Jan-
18
Mar
-18
May
-18
Jul-1
8
Sep
-18
Nov
-18
Japan China EM Eurozone US World
40
45
50
55
60
65
US
ISM
Vie
tnam
Nig
eria
*U
SG
reec
eIn
dia
Hun
gary
Ken
ya*
Bra
zil
Rus
sia
Japa
nW
orld
Cze
chE
uro
area EM
Indo
nesi
aC
hina
Chi
na O
ff.M
exic
oP
olan
dS
A B
ER
Kor
eaT
aiw
anT
urke
y
Latest reading YtD peak
Why such a bad 2018?

Renaissance Capital XX January 2019
ESG
Renaissance Capital 14 January 2019
ESG
18
Signs of tensions in the credit markets began to emerge in 4Q18. High yield spreads rose from 360 in October to 582 by December (albeit still well below peaks of 924 in 2016, 870 in 2011 and 1908 in 2008). Similarly, the JPMorgan EMBI Global Spread widened gradually over the course of the year, from 310 at the start of 2018 to 441 in early 2019 (vs peaks of 538 in 2016, 490 in 2011 and 891 in 2008). Reports of US high yield credit markets drying up caused investors to further shun risk assets during the illiquid year-end period.
4Q18 saw US equities, which had been unscathed by declines elsewhere, join the sell-off. The S&P Index declined 20.2% peak to trough over October-December on an intraday basis, leading to headlines about bear markets (though close-to-close the maximum decline was just shy of a bear market, at 19.8%). Nevertheless, December’s 9.2% decline was the worst monthly performance for the S&P Index since 2009 and the worst December performance since the great depression. US investors were spooked by fears of a worsening outlook for corporate earnings (given headwinds of a slower economy in 2019, trade tariffs and the stronger dollar), accompanied by fears that a continuation of hiking/quantitative tightening by the Fed could prove excessive given the expected slowdown of the US, eurozone and China in 2019 vs 2018. 10-year Treasury yields fell back from 3.2% in November 2018 to 2.55% by early January 2019.
In summary, 2018 saw EM hit over the course of the year by: 1) rising in US rates (bond yields/Fed funds); 2) a strong dollar/EM currency weakness; 3) escalating trade tensions; 4) global/Chinese growth concerns; and 5) a sell-off in US equities. Combined, these were enough to push EM into bear market territory, with MSCI EM down 27% from its January peak by late October. Putting the decline into context, MSCI EM fell 35% during the April 2015-January 2016 China slowdown-related scare; 31% during the 2011 eurozone-related sell-off; and 18% during the 2013 taper tantrum related sell-off. The global financial crisis saw MSCI EM decline by 66%.
Figure 12: EMBI and HY spreads
Source: Bloomberg, Renaissance Capital
Figure 13: US 10yr treasury yield (lhs), USD TWI (rhs), CNY TWI (rhs), EM FX (rhs)
Source: Bloomberg, Renaissance Capital
0
200
400
600
800
1,000
1,200
1,400
1,600
1,800
2,000
2006
2007
2008
2009
2010
2011
2012
2013
2014
2015
2016
2017
2018
JPMorgan EMBI Global spread High yield spread
80
90
100
110
120
130
140
150
160
1.0
1.5
2.0
2.5
3.0
3.5
4.0
4.5
5.0
5.5
2006
2007
2008
2009
2010
2011
2012
2013
2014
2015
2016
2017
2018
US 10yr USD TWI EM FX CNY TWI

Renaissance Capital
XX January 2019
ESG
Renaissance Capital 14 January 2019
ESG
19
2018 saw five overlapping waves of negativity overwhelm EM: 1) rising US rates (bond yields and Fed funds); 2) a strong dollar; 3) escalating trade tensions; 4) global/Chinese growth concerns; and 5) the 4Q18 sell-off in US equities. Combined, these were enough to push EM equities into bear market territory, with MSCI EM closing 2018 down 17% for the year, 24% off its January peak. The bad news for bottom-up investors is that top-down themes are again likely to dominate in 2019. The good – and little noticed – news is that EM equities bottomed in (and have started to outperform DM since) early October.
Our base case is that the US avoids recession in 2019 (which this summer will make the current expansion the longest since records began in the 1850s), but that growth slows as the sugar rush of stimulus fades and given the lagged effects of higher borrowing costs, the stronger dollar, weaker external demand (accompanied by rising protectionism) and the partial US government shutdown.
The positive story for EM is that we enter 2019 with: 1) much lower US bond yields (10-year Treasuries yield of 2.67 vs 3.24 in early November); 2) the Fed indicating greater flexibility, with Fed futures now suggesting that the Fed might not hike at all in 2019 (sharp falls in interest rate expectations can precede an EM equity rally, see Figure 14); 3) China stimulating its economy via RRR cuts and big sign-offs for new railways (with more stimulus likely to be unveiled during 1H19) in order to report the required 6.2%annual growth rate in 2019 and 2020 to double the economy over 2010-2020; 4) some easing of the strong upwards dollar pressure of 2018; 5) oil $30/bl lower – bringing down inflation expectations and helping C/As for the 89% index weight of MSCI EM (and 64% of FM) that imports oil; 6) many EM currencies trading slightly cheap vs their long-run REER averages; and 7) the potential for a US-China trade agreement to add to risk appetite – we think recent equity market declines and softening lead indicators make such an agreement more likely, with President Trump in a pre-election year.
We examine these factors below and conclude that while plenty depends on policymakers and politicians taking the right actions, on balance, we think the 2019 EM equity pain trade is likely to be on the upside, and recommend investors take more risk in EM in 2019. But couldn’t 2019 just be a continuation of 2018’s poor performance? Yes, if financial market declines become a self-fulfilling prophecy and bring with them the next global recession, we can expect further declines.
1. The Fed and US bond yields
Trump’s $1.5trn of tax cuts helped push US growth above 3% during 2Q-3Q18. Democrat control of the House of Representatives makes a repeat fiscal stimulus unlikely, and the sugar rush for the economy should fade over the course of 2019. Together with the lagged effects of higher borrowing costs, the stronger dollar and weaker external demand (accompanied by rising protectionism) and the partial US government shutdown, the US economy should slow in 2019 vs 2018. A slower economy accompanied by the recent $30/bl decline in oil prices should in turn help keep inflationary pressure under control despite the tightening labour market (five-year inflation swaps have been coming down with the oil price, see Figure 19).
December’s ’dovish hike’ by the Fed (a 25-bpt hike, accompanied by a shift down in the dot plot for 2019 from three 25-bpt hikes to two) was perceived by the market as offering insufficient flexibility, and triggered sharp falls in US equities in December. January saw Fed Chairman Jerome Powell clarify that “there is no pre-set path for policy” and that the Fed is “prepared to shift economic policy and shift it significantly”, with flexibility including both the path of interest rates and the size of the Fed’s balance sheet size; several other senior Federal Reserve policymakers have counselled a wait-and-see approach to rates.
Could 2019 be better?

Renaissance Capital XX January 2019
ESG
Renaissance Capital 14 January 2019
ESG
20
Powell specifically referenced the Fed’s policy shift under then Chairman Janet Yellen in early 2016 when markets feared a Chinese hard landing. The Fed had raised rates in December 2015 (to 0.5%), and the accompanying “dot plot” suggested four 25-bpts of hikes during 2016. By February 2016, however, Yellen was suggesting the Fed may delay hikes and in the end, the Fed paused for a year, raising rates to 0.75% only in December 2016. That Fed pause prompted a 27% rally in MSCI EM over 12months.
The Fed futures market no longer expects the Fed to tighten at all during 2019. As we show below, sharp falls in US interest rate expectations can precede an EM equity rally.
Figure 14: Sharp falls in interest rate expectations can precede an EM equity rally
Source: Bloomberg, Renaissance Capital
The increase in US 10-year bond yields from 2.04% in September 2017 to 3.24% in November 2018 was a significant repricing of dollar assets. Previous sharp upwards moves in bond yields have triggered bull market corrections in EM, as we saw in 2005, 2006, 2007 and 2013. Given the 120-bpt increase in yields, we should not have been surprised to see MSCI EM fall by 21%. In fact, trade tensions saw that the decline was larger, 27% from top to bottom, taking EM into a bear market. Since then, US 10-year bond yields have reset downwards as growth and inflation expectations have come down.
Figure 15: Recent EM bond market-driven corrections
Source: MSCI, Bloomberg
2. Inflation is back well below the 3% ‘danger’ level
US headline inflation hitting 3% has historically acted as a warning sign for EM equities (coming as it did ahead of 30%+ sell-offs for EM in 1994, 1997, 2000, 2007 and 2011).
600
700
800
900
1,000
1,100
1,200
1,300
-0.3
-0.2
-0.1
0.0
0.1
0.2
0.3
0.4
0.5
0.6
0.7
0.8
2010
2011
2012
2013
2014
2015
2016
2017
2018
2019
Amount of Fed tightening priced in to US OIS curve for next 12m (lhs) MSCI EM (rhs)
2004
2005
2006
2007
2018
2013Average
-30%
-25%
-20%
-15%
-10%
-5%
60 70 80 90 100 110 120 130 140
EM
cor
rect
ion
Increase in US 10yr yields (%)

Renaissance CapitalXX January 2019
ESG
Renaissance Capital 14 January 2019
ESG
21
Our rationale for that is that 3% inflation brings with it fears of a behind-the-curve Fed (even if the Fed’s preferred inflation measure is the core personal consumption expenditures price index). US inflation almost reached 3% in the summer (hitting 2.9% in July), but subsequent falls have brought it back in to safer territory: November CPI was 2.2% and together with falling oil prices, inflation break-evens have declined.
Figure 16: EM, US CPI and the Fed – 1994-2002
Source: Bloomberg, Renaissance Capital
Figure 17: EM, US CPI and the Fed – 2003-present
Source: Bloomberg, Renaissance Capital
Figure 18: Major MSCI EM downturns following US headline CPI hitting 3%
MSCI EM index MSCI EM US CPI CPI>=3% - MSCI EM peak peak decline (%) >=3% (months)
Sep-94 -33 Sep-94 0 Oct-97 -59 Sep-96 13 Feb-00 -54 Feb-00 0 Oct-07 -66 Oct-07 0 May-11 -31 Apr-11 1
Source: Bloomberg
Figure 19: 5Y Inflation swaps, CPI, core PCE, the Fed and oil
Source: Bloomberg, Renaissance Capital
3. Watch the US yield curve, but don’t panic
The flattening US yield curve has caused concern, as an inverted curve (10-year yields falling below three-month yields) has been seen ahead of the last five US recessions (1980, 1981-1982, 1990-1991, 2001 and 2007-2009).
0
1
2
3
4
5
6
7
8
200
250
300
350
400
450
500
550
600
Jan-
94
Jan-
95
Jan-
96
Jan-
97
Jan-
98
Jan-
99
Jan-
00
Jan-
01
Jan-
02
MSCI EM Fed funds rate (%, rhs)
US CPI 3%
US 10yr yield (%)
-4
-2
0
2
4
6
8
10
200
400
600
800
1,000
1,200
1,400
Jan-
03
Jan-
04
Jan-
05
Jan-
06
Jan-
07
Jan-
08
Jan-
09
Jan-
10
Jan-
11
Jan-
12
Jan-
13
Jan-
14
Jan-
15
Jan-
16
Jan-
17
Jan-
18
MSCI EM Fed funds rate (%, rhs)
US CPI 3%
US 10yr yield (%)
20
30
40
50
60
70
80
90
0.5
1.0
1.5
2.0
2.5
3.0
Jan-
16
Jul-1
6
Jan-
17
Jul-1
7
Jan-
18
Jul-1
8
Jan-
19
5y5y inflation swap CPI Core PCE Fed target Brent ($/bbl, rhs)

Renaissance Capital XX January 2019
ESG
Renaissance Capital 14 January 2019
ESG
22
For now (despite a small inversion in the middle of the curve, where five-year yields are lower than two-year yields) the spread between 10-year yields (2.67%) and three-month yields (2.41%) is still 26 bpts.
In the run-up to the global financial crisis, such a level was reached in January 2006, but EM equities would continue to rally for almost two years (and by 90%) before peaking in October 2007. DM equities would rally another 34% before peaking (also in October 2007).
Figure 20: Fed December 2019 meeting expectations
Source: Bloomberg
Figure 21: US yield curve slope, bpts
Source: Bloomberg
4. Dollar strength
42 years of EM history tells us that EM equities tend to struggle when the dollar rallies. 2018 has proven to be no exception. We think several factors could slow or even reverse the dollar rally during 2019.
Figure 22: EM equities vs the dollar
Source: IFC, MSCI, Bloomberg
0%
20%
40%
60%
80%
100%
Jun-
18
Jul-1
8
Aug
-18
Sep
-18
Oct
-18
Nov
-18
Dec
-18
Jan-
19
1.25-1.5 1.5-1.75 1.75-2 2-2.25 2.25-2.5 2.5-2.75
2.75-3 3-3.25 3.25-3.5 3.5-3.75 3.75-4
-1.0
-0.5
0.0
0.5
1.0
1.5
2.0
2.5
3.0
3.5
4.0
1983
1985
1987
1989
1991
1993
1995
1997
1999
2001
2003
2005
2007
2009
2011
2013
2015
2017
2019
10Y3M 5Y2Y
60
70
80
90
100
110
120
130
140
150
30
50
70
90
110
130
150
170
190
210
Jan-
76
Jan-
77
Jan-
78
Jan-
79
Jan-
80
Jan-
81
Jan-
82
Jan-
83
Jan-
84
Jan-
85
Jan-
86
Jan-
87
Jan-
88
Jan-
89
Jan-
90
Jan-
91
Jan-
92
Jan-
93
Jan-
94
Jan-
95
Jan-
96
Jan-
97
Jan-
98
Jan-
99
Jan-
00
Jan-
01
Jan-
02
Jan-
03
Jan-
04
Jan-
05
Jan-
06
Jan-
07
Jan-
08
Jan-
09
Jan-
10
Jan-
11
Jan-
12
Jan-
13
Jan-
14
Jan-
15
Jan-
16
Jan-
17
Jan-
18
Jan-
19
EM - IFC Composite/MSCI EM (from 1987) relative to DM, TR Dollar Index (RHS)
Dollarweakness
1. Credit Bubble
2. Debt crisis
3. RediscoveryDollar
strength
4. Rolling crises
5. Boom time
6. End of the affair

Renaissance Capital XX January 2019
ESG
Renaissance Capital 14 January 2019
ESG
23
Fed less of a stand-out. 2018 saw the Fed stand out as being alone among the ‘Big Four’ central banks (US, Japan, eurozone, UK) in implementing a regular series of quarterly rate hikes. With the Fed now closer to its terminal rate, we don’t expect a repeat of 2018’s hikes, and an on-pause Fed is likely at some point in 2019. Meanwhile the European Central Bank (ECB) has confirmed that it will end new asset purchases in December 2018. A first rate hike from the ECB is possible late in 2019.
US corporate repatriation slowing rapidly. US corporate repatriations appear to be slowing significantly. The Commerce Department reported that corporates repatriated $295bn in 1Q18, $170bn in 2Q18 and $93bn in 3Q18.
Dollar no longer cheap, verbal intervention more likely. The US dollar has moved to the expensive side vs its 25-year average (taking data back to 1994). While only 6% above its long-term average, a further rally could prompt concern from US policymakers. Trump has already been tweeting that he sees the dollar as very strong, raising the prospect of more verbal intervention should the dollar rally further.
Chinese renminbi. We would expect Chines authorities to aim to avoid sudden depreciation of the renminbi to provide a more positive backdrop for trade talks with the US ahead of the 1 March deadline, thus reducing the tendency for competitive EM devaluations.
A widening US fiscal deficit has previously coincided with dollar weakness (see Figure 23). Why didn’t it work in 2018? The Fed’s reaction function is important here, given the threat of the economy overheating in 2018 given fiscal stimulus.
Figure 23: US fiscal balance vs trade-weighted dollar
Source: MSCI; Bloomberg; Renaissance Capital
5. Trade war
The ‘truce’ announced following the meeting of President Trump and Chinese President Xi Jinping at the G20 meeting in Buenos Aires on 1 December provides breathing room until 1 March for both parties to agree a deal to prevent the US imposing a further 15% on the $200bn of Chinese goods that are already subject to a 10% tariff, and to avoid tariffs on the remaining $267bn of Chinese exports to the US.
President Trump’s sensitivity to the performance of the US equity market (and the wider economy) is well known. In a pre-election year, Trump is likely to wish to avoid further falls in the stock market and the impact on employment caused by a trade war, which we think makes such a deal more likely. For China, lead indicators are already pointing to a manufacturing slowdown. The fiscal and monetary stimulus to offset this risks
60
70
80
90
100
110
120
130
140
150
-12
-10
-8
-6
-4
-2
0
2
4
6
8
10
12
Jan-
72
Jan-
74
Jan-
76
Jan-
78
Jan-
80
Jan-
82
Jan-
84
Jan-
86
Jan-
88
Jan-
90
Jan-
92
Jan-
94
Jan-
96
Jan-
98
Jan-
00
Jan-
02
Jan-
04
Jan-
06
Jan-
08
Jan-
10
Jan-
12
Jan-
14
Jan-
16
Jan-
18
Jan-
20
Jan-
22
US fiscal balance (lhs) CBO projection USD Trade Weighted Index (rhs)

Renaissance Capital XX January 2019
ESG
Renaissance Capital 14 January 2019
ESG
24
compromising the authorities’ desired shift to higher quality of growth, which should also encourage an agreement to be made.
But the questions remain. Trump has been espousing protectionism for over three decades, suggesting a deal might only provide respite. And the trade war may not actually be a trade war, but more a clash of opposing value systems. Such a shift in US attitudes towards could be long-lasting and destabilising, not just for EM (where China accounts for over 30% of the MSCI EM Index).
Figure 24: ‘Death spiral’ of world trade during the Great Depression, $mn
Source: League of Nations’ World Economic Survey, 1932-33
Figure 25: EM exports to GDP
Source: IMF, Taiwan Ministry of Finance
Figure 26: Frontier exports to GDP
Source: IMF, Taiwan Ministry of Finance
Figure 27: EM exports to US, % of GDP
Source: IMF, Taiwan Ministry of Finance
Figure 28: Frontier exports to US, % of GDP
Source: IMF, Taiwan Ministry of Finance
0
1000
2000
3000
4000January
February
March
April
May
June
July
August
September
October
November
December
1929
1930
1931
1932
1933
0%
10%
20%
30%
40%
50%
60%
70%
80%
90%
Cze
ch R
epub
licH
unga
ryM
alay
sia
UA
ET
aiw
anT
haila
ndP
olan
dQ
atar
Kor
eaM
exic
oS
outh
Afr
ica
Chi
leR
ussi
aP
eru
Phi
lippi
nes
Chi
naT
urke
yIn
done
sia
Gre
ece
Col
ombi
aIn
dia
Bra
zil
Egy
ptP
akis
tan
Exports to GDP, 2017
0%
20%
40%
60%
80%
100%
120%
Vie
tnam
Slo
veni
aLi
thua
nia
Est
onia
Bah
rain
Om
anK
uwai
tS
erbi
aT
unis
iaR
oman
iaIv
ory
Coa
stK
azak
hsta
nC
roat
iaM
oroc
coM
aurit
ius
Jord
anS
eneg
alS
ri La
nka
Nig
eria
Ban
glad
esh
Arg
entin
aLe
bano
nK
enya
Ukr
aine
Zam
bia
Sau
di A
rabi
aG
hana
Geo
rgia
Iran
Uga
nda
Zim
babw
eR
wan
daT
anza
nia
Exports to GDP, 2017
0%
5%
10%
15%
20%
25%
30%
Mex
ico
Tai
wan
Mal
aysi
aT
haila
ndK
orea
Chi
naC
hile
Col
ombi
aP
eru
Phi
lippi
nes
Sou
th A
fric
aC
zech
Rep
ublic
Indi
aIn
done
sia
Hun
gary
Bra
zil
Pol
and
Pak
ista
nU
AE
Tur
key
Egy
ptR
ussi
aG
reec
eQ
atar
Exports to US, % GDP
0%
5%
10%
15%
20%
25%
Vie
tnam
Bah
rain
Jord
anS
ri La
nka
Lith
uani
aIv
ory
Coa
stK
uwai
tM
aurit
ius
Est
onia
Nig
eria
Ban
glad
esh
Slo
veni
aC
roat
iaM
oroc
coT
unis
iaA
rgen
tina
Ser
bia
Rom
ania
Ken
yaO
man
Kaz
akhs
tan
Sen
egal
Leba
non
Sau
di A
rabi
aG
hana
Geo
rgia
Ukr
aine
Rw
anda
Uga
nda
Tan
zani
aZ
imba
bwe
Zam
bia
Iran
Exports to US, % GDP

Renaissance Capital XX January 2019
ESG
Renaissance Capital 14 January 2019
ESG
25
Figure 29: EM exports to US, % of exports
Source: IMF, Taiwan Ministry of Finance
Figure 30: Frontier exports to US, % of exports
Source: IMF, Taiwan Ministry of Finance
6. Growth concerns
2019 is likely to see slower GDP growth in the US (as stimulus fades), the eurozone, Japan and China.
For the US, given the shift in language from the Fed, this likely means the Fed on hold at some point in 2019, perhaps for all of 1H19 (positive for EM). For the eurozone it means no rate hike is likely until late 2019. The current US expansion – assuming it continues – will this summer become the longest since records began in the 1850s. That in itself is causing some nervousness about the timing of the next recession. Investors are asking whether this is the end of the cycle and whether it makes sense to ‘pick up pennies in front of a steam roller’. While previous Fed Chair Janet Yellen maintained that expansions don’t die of old age, long expansions, in our view, can lead to a build-up of excesses making the economy more vulnerable to shocks. However, as the current expansion saw two mid-cycle dips (mid-2011 and late-2015) which saw the economy slow and high-yield spreads spike above 750 bpts this could have acted as a restraint to a build-up of excesses, which in turn could support arguments for an extended cycle. And the expansion has been relatively shallow, and is only now approaching the average increase in real GDP of the last 10 expansions.
Figure 31: US expansion could still have room to run…
Source: NBER, Bloomberg, Renaissance Capital
0%
10%
20%
30%
40%
50%
60%
70%
80%
90%
Mex
ico
Col
ombi
aC
hina
Pak
ista
nIn
dia
Per
uP
hilip
pine
sC
hile
Bra
zil
Tai
wan
Kor
eaT
haila
ndIn
done
sia
Mal
aysi
aS
outh
Afr
ica
Egy
ptT
urke
yG
reec
eR
ussi
aP
olan
dH
unga
ryC
zech
Rep
ublic
UA
EQ
atar
Exports to US, % of total exports
0%
5%
10%
15%
20%
25%
30%
Sri
Lank
aJo
rdan
Vie
tnam
Mau
ritiu
sN
iger
iaB
angl
ades
hB
ahra
inK
enya
Arg
entin
aIv
ory
Coa
stK
uwai
tLi
thua
nia
Mor
occo
Cro
atia
Est
onia
Tun
isia
Leba
non
Rom
ania
Slo
veni
aS
erbi
aS
eneg
alO
man
Kaz
akhs
tan
Sau
di A
rabi
aR
wan
daG
eorg
iaG
hana
Uga
nda
Ukr
aine
Tan
zani
aZ
imba
bwe
Iran
Zam
bia
Exports to US, % of total exports
0%
10%
20%
30%
40%
50%
60%
0 2 4 6 8 10 12 14 16 18 20 22 24 26 28 30 32 34 36 38 40 42
Cum
ulat
ive
GD
P g
row
th (
%)
Quarters
1949
1954
1958
1960
1970
1975
1980
1982
1991
2001
2009
2.5% growth
Avg growth
Avg duration

Renaissance Capital XX January 2019
ESG
Renaissance Capital 14 January 2019
ESG
26
For China, recent PMI readings, particularly on new orders, suggest a slowing Chinese economy in 2019, with an escalation of the trade dispute the key downside risk. But sizeable fiscal stimulus (including new railway lines) and easing of financial conditions (RRR cuts and potentially interest rates), as well as the lifting of restrictions on the housing market, are likely to cushion the slowdown in order to reach a reported 6.2% growth rate required over the next two years to deliver on the promise that 2020 GDP would be double that of 2010. However postponing deleveraging and increasing fiscal spending delays China’s transition to a more sustainable economic growth model, and there are some suggestions that the growth rate might already be much lower.
7. EM vs global markets
Can EM perform when US/global equities decline? It seems so: MSCI EM actually bottomed on 29 October, and has since risen albeit modestly despite declines for US and global equities. And during the S&P 500’s sharp 19.8% sell-off in October-December, MSCI EM fell by only 8.1%.
8. Lower oil prices
Oil exporters make up only 11% of MSCI EM (36% of MSCI FM). A lower oil price should be positive for C/A positions of oil importers and reduce inflationary pressures. Rising oil prices can result in political pressures in fuel importers (not just in France).
The decline in oil prices, with Brent falling from $86/bl in October to c. $60/bl has helped drive US inflation break-evens lower, easing pressure on the Fed. As our oil team writes, US sanctions on Iran have proved less severe than we feared, as six-month waivers granted have reduced the expected negative effect on global crude supplies. Elsewhere, strong OPEC and non-OPEC production growth over 2018 are contrasted with slightly reduced demand expectations, with the OPEC+ agreement necessary to keep markets in balance until at least 2H19. We expect OPEC+ compliance will be high, supporting a 2019 Brent oil price around our unchanged $65/bl estimate. While supply risks are still abundant (Iran post-waivers, Venezuela), we believe there is sufficient global capacity for stronger production growth elsewhere. In particular, the surge in US oil production continues with a significant 3mnb/d YoY increase recorded in August 2018, according to the IEA; there are also many other growth spots in the world, notably a recovery in Libyan production, Canada, Russia, Kazakhstan and Brazil, as well as the reversal of Venezuela’s and Iran’s oil production declines at some point. We therefore retain our somewhat lower $60/bl Brent oil price (real) assumption for 2020 and beyond.
While a headwind for oil producers, low oil prices should reduce inflationary pressures globally and help oil importers, as well as making energy subsidies in EM less costly and easier to remove.

Renaissance CapitalXX January 2019
ESG
Renaissance Capital 14 January 2019
ESG
27
Figure 32: EM net fuel exports to GDP, 2017 (index weight in brackets)
Source: IMF, Renaissance Capital
Figure 33: FM net fuel exports to GDP, 2017 (index weight in brackets)
Source: IMF, Renaissance Capital
9. EM currencies cheap
The sell-off in EM currencies has taken the EM (ex-China) REER measure to 4% below its long-term (24-year) average, suggesting that EM currencies are cheap. The same is not true for FM, which is 5% above its long-term average.
Figure 34: EM and FM REER indices
Source: MSCI; Bloomberg; Renaissance Capital
10. EM equities cheap
EM equities have had a tough year, and markets have de-rated. However, EM’s P/E discount to DM has not changed significantly.
EM’s 12-month forward P/E has decreased from a peak of 13.3x in January 2018 to 10.9x currently, but the discount to DM moved only from 22% to 21% as DM also de-rated from 17.1x to 13.9x over the same period (the discount to the US is currently 28%, or roughly where it was in January as the US has de-rated as well). The 10-year average discount of EM to DM is 18%, while the 10-year average discount to the US is 24%.
-10%-5%0%5%
10%15%20%25%30%35%
Qat
ar (
1.1%
)U
AE
(0.
7%)
Rus
sia
(3.7
%)
Col
ombi
a (0
.4%
)M
alay
sia
(2.4
%)
Indo
nesi
a (2
.2%
)B
razi
l (7.
5%)
Sou
th A
fric
a (6
.3%
)P
eru
(0.4
%)
Mex
ico
(2.6
%)
Chi
na (
31.1
%)
Gre
ece
(0.3
%)
Pol
and
(1.2
%)
Cze
ch R
epub
lic (
0.2%
)E
gypt
(0.
1%)
Chi
le (
1.1%
)P
hilip
pine
s (1
.0%
)In
dia
(9.0
%)
Tur
key
(0.7
%)
Hun
gary
(0.
3%)
Pak
ista
n (0
.1%
)K
orea
(14
.0%
)T
haila
nd (
2.4%
)T
aiw
an (
11.3
%)
-20%
-10%
0%
10%
20%
30%
40%
50%
Kuw
ait (
22.0
%)
Om
an (
1.6%
)B
ahra
in (
4.2%
)K
azak
hsta
n (0
.8%
)N
iger
ia (
6.7%
)Iv
ory
Coa
st (
0.1%
)A
rgen
tina
(16.
3%)
Est
onia
(0.
3%)
Rom
ania
(4.
6%)
Ban
glad
esh
(2.8
%)
Vie
tnam
(16
.1%
)S
love
nia
(1.1
%)
Cro
atia
(1.
6%)
Ken
ya (
4.9%
)S
ri La
nka
(0.2
%)
Lith
uani
a (0
.2%
)S
erbi
a (1
.6%
)T
unis
ia (
0.7%
)S
eneg
al (
0.7%
)M
oroc
co (
8.0%
)M
aurit
ius
(2.1
%)
Leba
non
(1.9
%)
Jord
an (
1.2%
)80
85
90
95
100
105
110
115
120
125
130
Jan-
95
Jan-
96
Jan-
97
Jan-
98
Jan-
99
Jan-
00
Jan-
01
Jan-
02
Jan-
03
Jan-
04
Jan-
05
Jan-
06
Jan-
07
Jan-
08
Jan-
09
Jan-
10
Jan-
11
Jan-
12
Jan-
13
Jan-
14
Jan-
15
Jan-
16
Jan-
17
Jan-
18
EM and FM REER and long-term averages
EM ex-ChinaaggregateREER
EM aggregateREER
FM AggregateREER
STRONGER
WEAKER

Renaissance Capital XX January 2019
ESG
Renaissance Capital 14 January 2019
ESG
28
EM equities appear cheap on a P/B basis: 1.5x vs 2.2x for DM (and 3.1x for the US). EM’s 31% P/B discount to DM is much wider than the 10-year average of 17%. EM’s 52% P/B discount to the US is much wider than the 20-year average of 34%.
Figure 35: MSCI EM and DM 12M fwd P/E and long-term average
Source: MSCI, Bloomberg
Figure 36: MSCI EM 12M fwd P/E (x) premium/discount to DM (%)
Source: MSCI, Bloomberg
Figure 37: MSCI EM and DM 12M fwd dividend yield and long-term average
Source: MSCI, Bloomberg
Figure 38: MSCI EM and DM trailing P/B
Source: MSCI, Bloomberg
11. EM vs DM growth outlook could improve
In its October 2018 outlook, the IMF expects the US, eurozone, Japan, Australia and Canada all to slow in 2019, with DM growth falling from 2.4% in 2018 to 2.1% in 2019 vs a more stable 4.7% growth outlook for EM in both years (the IMF assumes China slows from 6.6% in 2018 to 6.2% in 2019). The World Bank’s more recent January 2019 outlook sees DM growth falling from 2.2% to 2.0% and EM growth stable at 4.2%. Historically, widening EM vs DM growth outperformance has been relatively bullish for EM equities. 2018 has seen the EM vs DM growth differential narrowing and EM equities underperform.
4
6
8
10
12
14
16
18
Jan-
06Ju
l-06
Jan-
07Ju
l-07
Jan-
08Ju
l-08
Jan-
09Ju
l-09
Jan-
10Ju
l-10
Jan-
11Ju
l-11
Jan-
12Ju
l-12
Jan-
13Ju
l-13
Jan-
14Ju
l-14
Jan-
15Ju
l-15
Jan-
16Ju
l-16
Jan-
17Ju
l-17
Jan-
18Ju
l-18
Jan-
19
MSCI EM 12M fwd P/E (x) MSCI DM 12M fwd P/E (x)
-35%
-30%
-25%
-20%
-15%
-10%
-5%
0%
5%
10%
Jan-
06Ju
l-06
Jan-
07Ju
l-07
Jan-
08Ju
l-08
Jan-
09Ju
l-09
Jan-
10Ju
l-10
Jan-
11Ju
l-11
Jan-
12Ju
l-12
Jan-
13Ju
l-13
Jan-
14Ju
l-14
Jan-
15Ju
l-15
Jan-
16Ju
l-16
Jan-
17Ju
l-17
Jan-
18Ju
l-18
Jan-
19
MSCI EM 12M fwd P/E premium/discount to DM (%)LT. avg.+/-1SD
2.0
2.5
3.0
3.5
4.0
4.5
5.0
5.5
Jan-
06Ju
l-06
Jan-
07Ju
l-07
Jan-
08Ju
l-08
Jan-
09Ju
l-09
Jan-
10Ju
l-10
Jan-
11Ju
l-11
Jan-
12Ju
l-12
Jan-
13Ju
l-13
Jan-
14Ju
l-14
Jan-
15Ju
l-15
Jan-
16Ju
l-16
Jan-
17Ju
l-17
Jan-
18Ju
l-18
Jan-
19
MSCI EM 12M fwd Div yld (%) MSCI DM 12M fwd Div wld (%)
0.5
1.0
1.5
2.0
2.5
3.0
3.5
Jan-
06Ju
l-06
Jan-
07Ju
l-07
Jan-
08Ju
l-08
Jan-
09Ju
l-09
Jan-
10Ju
l-10
Jan-
11Ju
l-11
Jan-
12Ju
l-12
Jan-
13Ju
l-13
Jan-
14Ju
l-14
Jan-
15Ju
l-15
Jan-
16Ju
l-16
Jan-
17Ju
l-17
Jan-
18Ju
l-18
Jan-
19
MSCI EM Trailing P/B (x) MSCI DM Trailing P/B (x)

Renaissance Capital XX January 2019
ESG
Renaissance Capital 14 January 2019
ESG
29
Figure 39: MSCI EM relative to DM vs EM-DM relative growth acceleration
Source: MSCI; Bloomberg; Renaissance Capital
0
1
2
3
4
5
6
7
50
100
150
200
250
300
2000
2001
2002
2003
2004
2005
2006
2007
2008
2009
2010
2011
2012
2013
2014
2015
2016
2017
2018
2019
2020
2021
2022
2023
MSCI EM relative to DM ($) EM-DM growth (RHS) EM-DM growth (forecast)

Renaissance Capital XX January 2019
ESG
Renaissance Capital 14 January 2019
ESG
30
12. EM C/As under control
In EM, the IMF expects South Africa and Pakistan to have a 2019 C/A deficit in excess of 3%. FM looks less impressive on this front. Oil importers’ C/As should benefit from the recent decline in oil prices: the IMF’s forecasts assume $72.3/bl for Brent in 2019.
Figure 40: EM C/A and budget balances (brackets = weight in index), 2019E
Source: IMF, Renaissance Capital
Figure 41: ‘Fragile five’ C/A balances
Source: IMF, Renaissance Capital
Figure 42: FM C/A and budget balances (brackets = weight in index)
Source: IMF, Renaissance Capital
Figure 43: BF C/A and budget balances
Source: IMF, Renaissance Capital
End-2019 MSCI EM Index target
Figure 44: MSCI EM Index ($)
Source: Bloomberg, Renaissance Capital
-10
-5
0
5
10
15
Tai
wan
(11
.3%
)T
haila
nd (
2.4%
)U
AE
(0.
7%)
Qat
ar (
1.1%
)R
ussi
a (3
.7%
)K
orea
(14
.0%
)M
alay
sia
(2.4
%)
Hun
gary
(0.
3%)
Chi
na (
31.1
%)
Gre
ece
(0.3
%)
Cze
ch R
epub
lic (
0.2%
)M
exic
o (2
.6%
)P
olan
d (1
.2%
)T
urke
y (0
.7%
)P
hilip
pine
s (1
.0%
)B
razi
l (7.
5%)
Per
u (0
.4%
)C
olom
bia
(0.4
%)
Indo
nesi
a (2
.2%
)E
gypt
(0.
1%)
Indi
a (9
.0%
)C
hile
(1.
1%)
Sou
th A
fric
a (6
.3%
)P
akis
tan
(0.1
%)
Current account balance (% GDP) Budget
-8
-7
-6
-5
-4
-3
-2
-1
0
Turkey South Africa India Brazil Indonesia
Largest 12M pre/post-taper 2018E 2019E 3%
-10
-5
0
5
10
15
Kuw
ait (
22.0
%)
Sau
di A
rabi
aS
love
nia
(1.1
%)
Cro
atia
(1.
6%)
Vie
tnam
(16
.1%
)E
ston
ia (
0.3%
)N
iger
ia (
6.7%
)K
azak
hsta
n (0
.8%
)Li
thua
nia
(0.2
%)
Om
an (
1.6%
)B
ahra
in (
4.2%
)B
angl
ades
h (2
.8%
)S
ri La
nka
(0.2
%)
Arg
entin
a (1
6.3%
)R
oman
ia (
4.6%
)Iv
ory
Coa
st (
0.1%
)M
oroc
co (
8.0%
)K
enya
(4.
9%)
Ser
bia
(1.6
%)
Sen
egal
(0.
7%)
Tun
isia
(0.
7%)
Jord
an (
1.2%
)M
aurit
ius
(2.1
%)
Leba
non
(1.9
%)
Current account balance (%GDP) Budget
-10
-8
-6
-4
-2
0
2
4
6
8
10
Aze
rbai
jan
Iran
Uzb
ekis
tan
Zam
bia
Arm
enia
Ukr
aine
Gha
na
Bel
arus
Taj
ikis
tan
Tan
zani
a
Zim
babw
e
Uga
nda
Rw
anda
Geo
rgia
Current account balance (%GDP) Budget
Base1,081
Bull1,167
Bear771
Ultra Bear455400
500
600
700
800
900
1,000
1,100
1,200
1,300
1,400
Jan-
06
Aug
-06
Mar
-07
Oct
-07
May
-08
Dec
-08
Jul-0
9
Feb
-10
Sep
-10
Apr
-11
Nov
-11
Jun-
12
Jan-
13
Aug
-13
Mar
-14
Oct
-14
May
-15
Dec
-15
Jul-1
6
Feb
-17
Sep
-17
Apr
-18
Nov
-18
Jun-
19
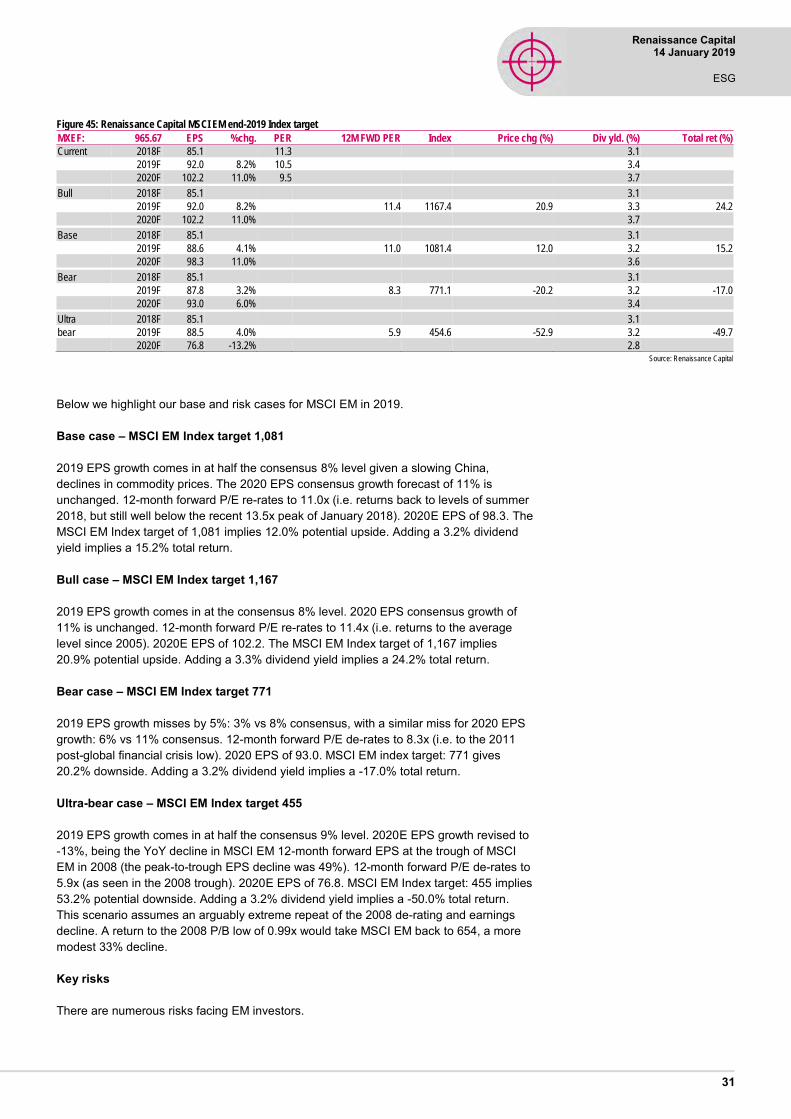
Renaissance Capital XX January 2019
ESG
Renaissance Capital 14 January 2019
ESG
31
Figure 45: Renaissance Capital MSCI EM end-2019 Index target
MXEF: 965.67 EPS %chg. PER 12M FWD PER Index Price chg (%) Div yld. (%) Total ret (%)
Current 2018F 85.1 11.3 3.1
2019F 92.0 8.2% 10.5 3.4 2020F 102.2 11.0% 9.5 3.7 Bull 2018F 85.1 3.1
2019F 92.0 8.2% 11.4 1167.4 20.9 3.3 24.2
2020F 102.2 11.0% 3.7 Base 2018F 85.1 3.1
2019F 88.6 4.1% 11.0 1081.4 12.0 3.2 15.2
2020F 98.3 11.0% 3.6 Bear 2018F 85.1 3.1
2019F 87.8 3.2% 8.3 771.1 -20.2 3.2 -17.0
2020F 93.0 6.0% 3.4 Ultra 2018F 85.1 3.1
bear 2019F 88.5 4.0% 5.9 454.6 -52.9 3.2 -49.7
2020F 76.8 -13.2% 2.8
Source: Renaissance Capital
Below we highlight our base and risk cases for MSCI EM in 2019.
Base case – MSCI EM Index target 1,081
2019 EPS growth comes in at half the consensus 8% level given a slowing China, declines in commodity prices. The 2020 EPS consensus growth forecast of 11% is unchanged. 12-month forward P/E re-rates to 11.0x (i.e. returns back to levels of summer 2018, but still well below the recent 13.5x peak of January 2018). 2020E EPS of 98.3. The MSCI EM Index target of 1,081 implies 12.0% potential upside. Adding a 3.2% dividend yield implies a 15.2% total return.
Bull case – MSCI EM Index target 1,167
2019 EPS growth comes in at the consensus 8% level. 2020 EPS consensus growth of 11% is unchanged. 12-month forward P/E re-rates to 11.4x (i.e. returns to the average level since 2005). 2020E EPS of 102.2. The MSCI EM Index target of 1,167 implies 20.9% potential upside. Adding a 3.3% dividend yield implies a 24.2% total return.
Bear case – MSCI EM Index target 771
2019 EPS growth misses by 5%: 3% vs 8% consensus, with a similar miss for 2020 EPS growth: 6% vs 11% consensus. 12-month forward P/E de-rates to 8.3x (i.e. to the 2011 post-global financial crisis low). 2020 EPS of 93.0. MSCI EM index target: 771 gives 20.2% downside. Adding a 3.2% dividend yield implies a -17.0% total return.
Ultra-bear case – MSCI EM Index target 455
2019 EPS growth comes in at half the consensus 9% level. 2020E EPS growth revised to -13%, being the YoY decline in MSCI EM 12-month forward EPS at the trough of MSCI EM in 2008 (the peak-to-trough EPS decline was 49%). 12-month forward P/E de-rates to 5.9x (as seen in the 2008 trough). 2020E EPS of 76.8. MSCI EM Index target: 455 implies 53.2% potential downside. Adding a 3.2% dividend yield implies a -50.0% total return. This scenario assumes an arguably extreme repeat of the 2008 de-rating and earnings decline. A return to the 2008 P/B low of 0.99x would take MSCI EM back to 654, a more modest 33% decline.
Key risks
There are numerous risks facing EM investors.

Renaissance Capital XX January 2019
ESG
Renaissance Capital 14 January 2019
ESG
32
Late-cycle US economy. August 2018 saw the US bull market become the longest ever. Next summer will see the current US expansion become the longest on record since records began in the 1850s. Previous Fed Chair Janet Yellen said that she thought “it’s a myth that expansions die of old age”, but in our opinion late-cycle economies can bring with them: 1) less slack (and therefore greater risk of inflation); and 2) greater imbalances (and/or sensitivity to shocks and/or higher rates). At 2.5%, we would hope that US rates aren’t enough to destabilise things. Global debt may have tripled to $247trn over the past two decades, but at the same time, the global economy has grown almost as much (1.7x larger) and interest rates much lower (US 10-year bond yields were 7% back in 1998).
China-US relations. President Trump’s sensitivity to the performance of US equities (and the economy) is well known: recent equity market declines could make it more likely, in our opinion, that some trade agreement can be found by the 1 March deadline, leading to a relief rally for markets, but a superficial agreement may not last: Trump has been espousing protectionism for over three decades, and there may be a more profound (and bipartisan) shift emerging in US attitudes towards China’s potential rise as a geopolitical rival. If so, the implications could be long-lasting and destabilising, not just for EM (where China accounts for nearly one-third of the MSCI Emerging Markets Index).
China economy. Economists have worried about a potential for a hard landing in China for at least a decade. China’s economy has long been being forecast increase in debt levels in China is a longstanding concern, and renewed stimulus of the economy to sustain growth given trade related head winds risks postponing progress on corporate deleveraging and improving the quality of growth in China.
Global politics shifting from the centre. We cannot ignore rising nationalism/patriotism/populism/balkanisation/protectionism in the world at the expense of multi-lateralism. Symptoms include Brexit, the Trump presidency, the Gilets Jaunes protests in France, Italian politics, the emergence of populist parties in Europe, as well as in the politics of a whole host of EM leaders (including Xi, Putin, Modi, Erdogan, Orban, Bolsonaro, AMLO, Duterte, etc). Blame it on inequality, social media or whatever, but the trend appears to be moving away from the Washington consensus and the liberal centre.
EM equities in a bear market, despite inflows. At their peak, EM equity outflows this year were 1.7% of AuM. After recent inflows, full year data shows that this was fully recovered, with cumulative inflows ending 2018 above the prior peak, causing investors to wonder how EM equities would cope with more sizeable outflows; however, this does fit with anecdotal feedback we have heard from fund managers that asset owners may be allocating fresh cash to EM on weakness to reduce their underexposure to the asset class.
The tech gap. Within EM, it can be argued that EMEA and Latin America are not leaders in the global tech revolution. Mega trends such as AI taking over low-end jobs (e.g. call centres, data processing, making automation more flexible) and as the price of robotics/3D printing declines and as big ticket items become shared (e.g. car/bike/scooter sharing) or simplified (the Chevrolet Bolt has 24 moving parts vs 149 in a VW Golf) the demand for EM labour may suffer. Bulls would argue has always been with us, and the world currently has record employment: 3.3bn in 2018 vs 2.8bn in 2014.
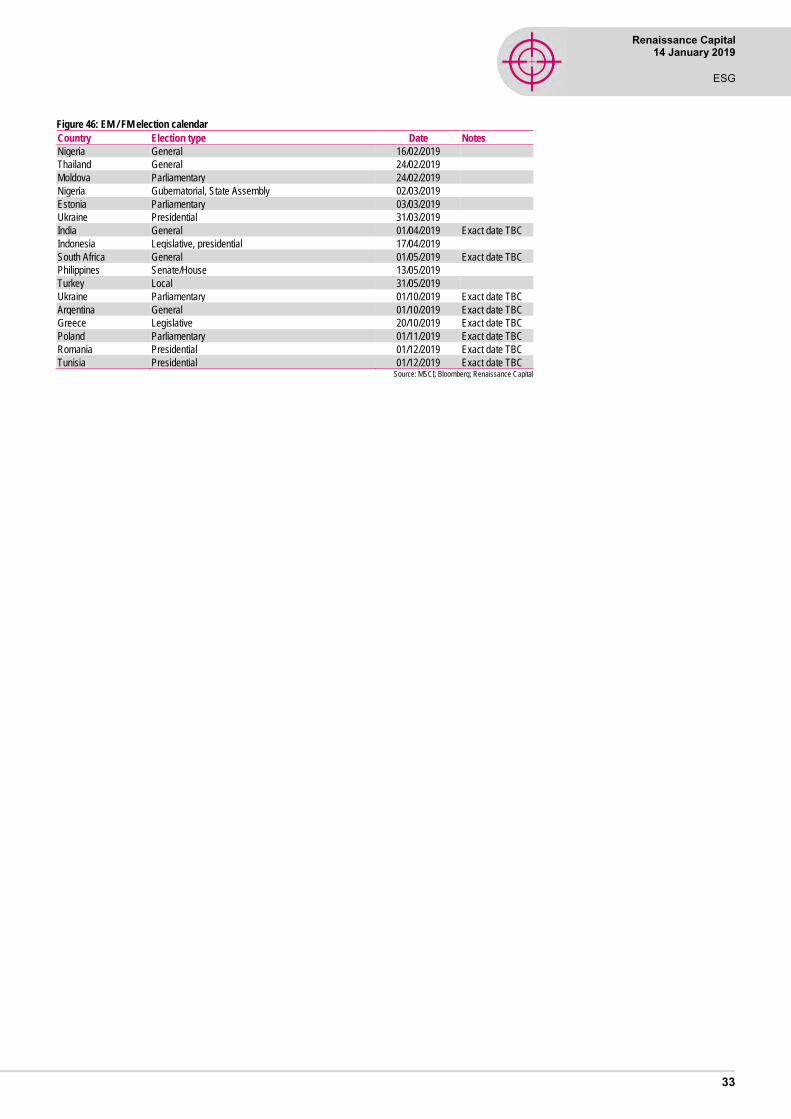
Renaissance Capital XX January 2019
ESG
Renaissance Capital 14 January 2019
ESG
33
Figure 46: EM / FM election calendar
Country Election type Date Notes
Nigeria General 16/02/2019 Thailand General 24/02/2019
Moldova Parliamentary 24/02/2019 Nigeria Gubernatorial, State Assembly 02/03/2019
Estonia Parliamentary 03/03/2019 Ukraine Presidential 31/03/2019
India General 01/04/2019 Exact date TBC
Indonesia Legislative, presidential 17/04/2019
South Africa General 01/05/2019 Exact date TBC
Philippines Senate/House 13/05/2019
Turkey Local 31/05/2019 Ukraine Parliamentary 01/10/2019 Exact date TBC
Argentina General 01/10/2019 Exact date TBC
Greece Legislative 20/10/2019 Exact date TBC
Poland Parliamentary 01/11/2019 Exact date TBC
Romania Presidential 01/12/2019 Exact date TBC
Tunisia Presidential 01/12/2019 Exact date TBC
Source: MSCI; Bloomberg; Renaissance Capital

Renaissance Capital XX January 2019
ESG
Renaissance Capital 14 January 2019
ESG
34
La crise climatique est une guerre contre les pauvres4
Summary
▪ ESG investing is becoming increasingly important right along the investment value chain – from asset owners to asset managers to corporates.
▪ The Global Sustainable Investment Alliance estimates some $23trn of assets globally are managed under some form of ESG. Morningstar’s database contains $1.05trn of publicly-available ESG funds, and in EM, we have identified $21bn of publicly-available ESG equity funds, up from just $5bn at the start of 2016. Including non-public funds and non-ESG designated funds which have incorporated ESG in to their investment processes would certainly boost this figure.
▪ ESG covers a broad scope of strategies including traditional negative screens (e.g. not owning tobacco or weapons manufacturers), positive screens and best-in-class strategies (e.g. portfolios focused on the best ESG-scoring names), norms-based screens (excluding companies which breach international norms), thematic investing (e.g. portfolios focused on alternate energy) and impact investing (where there is a measurable impact expected, for example, on carbon emissions). ESG integration has been introduced more recently, and is where much of the focus is at present.
▪ The aim of ESG integration is to integrate ESG throughout the investment process with the aim of improving risk-adjusted returns – this is an important factor in ESG going mainstream as many pension funds, insurance companies and the like have a fiduciary duty to maximise risk-adjusted returns.
▪ ESG is not without its challenges. The field is still a new one, and the tsunami of data (of varying quality) risks overwhelming fund managers. Materiality of different factors to investment returns is still unclear, with ESG data providers boasting of tracking thousands of metrics. Many of the reports purporting to demonstrate outperformance use back-tested data rather than real-life portfolios.
▪ There is an ongoing debate as to whether ESG should be ‘just’ another investment tool alongside more orthodox financial modelling and valuation metrics – or whether ESG portfolios individually or in aggregate should somehow be able to demonstrate contribution to a measurable environmental or societal improvement. In the end, asset managers will provide whatever solutions asset owners demand, but as Bloomberg pointed out, one ESG ETF holds 400 of the 500 stocks in the S&P index, another has Exxon Mobil as its largest holding and also owns Philip Morris and at least three defence contractors.
▪ As ESG assets grow, and with it, corporate disclosure, companies which score well on ESG metrics should find themselves better positioned to attract a wider pool of capital and thus achieve a lower cost of capital and higher valuations.
▪ What metrics should corporates target? There are thousands of ESG parameters being collected and the list is ever growing. We have developed a model focusing on: greenhouse gas emissions per unit of sales; social factors such as women in the workforce and in management roles, worker safety and conditions; governance issues such as board independence and size, state ownership, and responsibilities to shareholders. We found that companies with
4 ‘The climate crisis is a war against the poor’, Graffiti, Gilets Jaunes protests, Paris, December 2018
ESG

Renaissance Capital XX January 2019
ESG
Renaissance Capital 14 January 2019
ESG
35
lower government ownership, smaller boards and a higher representation of women in management tended to outperform.
▪ Do high-scoring stocks outperform? MSCI’s ESG Leaders indices have outperformed in EM, but not in DM; and the bulk of EM’s outperformance comes from the fact that China’s ESG Leaders index outperformed its parent. Examining baskets of ESG funds with a long history, we find no real evidence of outperformance over the long term; in EM, ESG funds managed to roughly equal the return on the standard MSCI EM Index, but lagged the EM ESG Index. Our ESG model shows some evidence for outperformance, particularly when focusing on governance; our model also suggests that companies that improved their environmental scores outperformed companies that did not.
▪ Using our ESG-scoring model, we can aggregate our results to determine which countries are relatively better on ESG metrics. Finland, the Netherlands and Israel top the list for overall ESG, while India, China and Indonesia score worst. The best EM countries for ESG are Korea, Brazil and South Africa. By sector, healthcare, IT and communications score best, while utilities, energy and materials score worst. Our ESG scores show Natura Cosmeticos, the Brazilian cosmetics giant famed for its sustainable practices, as the top ESG company in EM, followed by Lojas Renner and China State Construction and Engineering. At the other end of the spectrum, we find China Airlines, Gail India and Ambuja Cement. We also look at the best-in-class in EM on a sector basis.
▪ We examined financial and valuation characteristics of high-scoring ESG stocks. High-scoring non-financial ESG stocks tend to have higher RoE, higher revenue growth, higher margins, lower leverage (on debt/equity and net debt/EBITDA), and higher valuations on a 12-month forward P/E and EV to 12-month forward EBITDA basis. For financial stocks, top-scoring companies show higher RoE, higher valuations on 12-month forward P/E and trailing P/B, and higher dividend yields; they also tend to be larger in market cap. The higher returns and valuations of high-scoring ESG companies is a powerful argument for corporates to focus on ESG in opinion, but the higher valuations issue could mean that the market has already noticed this – and that outperformance of such companies is not necessarily a given.

Renaissance Capital XX January 2019
ESG
Renaissance Capital 14 January 2019
ESG
36
ESG ought to be of interest to anyone who has choked on Beijing’s smog, found themselves caught up in a French gilets jaunes fuel price protest, been shocked by the unconstrained ‘wild east’ capitalism of Russia in the 1990s, been impacted by a corporate collapse, felt dismayed at gender pay gaps in the UK, disappointed by EU car producers gaming emissions standards, wondered why multinationals’ aggressive tax optimisation is tolerated, or simply felt a sense of foreboding about the Orwellian future promised by social scoring in China. There is no requirement to be a “lentil-munching, sandal-wearing watermelon” to consider such issues important.
ESG does not seem to be going away any time soon – if anything the shift towards ESG investing appears to be gaining momentum as issues such as climate change, corruption, tax transparency, data privacy, corporate governance, mass migration, urban pollution, demographics, #metoo and deforestation continue to hit the headlines. Social media is playing a role in exposing issues and there growing pressure on companies to act responsibly, together with a trend towards society ‘repricing’ of ESG costs via: 1) carbon, pollution and water pricing; 2) increased taxes on diesel and accelerating the adoption of low/zero emissions vehicles; 3) taxes on unhealthy goods (tobacco, sugar); 4) fines for data breaches; 5) opposition to aggressive tax optimisation (and taxes on tech companies); and 6) legislation and regulation against corruption, bribery, modern slavery, etc.
Demographics too is playing a role: a 2018 survey by the Defined Contribution Investment Forum found that (among defined contribution savers), 41% of 55-65 year olds are interested in responsible investing, but this almost doubles to 80% of 22-34 year olds, so there may well be a generational shift at work.
As ESG-managed assets continue to grow, the carrot of accessing a wider pool of capital and potentially a lower cost of funding is likely to be a powerful drive for corporates. Social media, too, has a role, with ESG ‘underperformers’ subject to greater exposure, potentially affecting customer sales and staff morale alike, as well as putting pressure on shareholders to act (via engagement or divestment) potentially impacting share prices. With demand for ESG solutions clearly increasing from underlying asset owners (sovereign wealth funds and corporate and self-invested pension funds alike) we believe there is certainly a business case to be had for fund managers to provide ESG solutions. Such strategies may be higher margin and could help protect active managers from the onslaught of passive investing. ESG ETFs tend to rely on indices constructed using inconsistent third-party ESG scores and in general lack the ability to engage with corporate management) make it tricky for passive funds to incorporate ESG, though there is plenty of work being done in the space.
We hear plenty of debate about how ESG should be used. Some argue that ESG should be used as an active tool to achieve a measurable reduction in pollution, carbon emissions and the like, and to help improve social issues such as the quality of jobs created. At the other extreme is the neoclassical view (espoused most famously by Milton Friedman) that companies should focus solely on the pursuit of (legal) profits. The middle ground emerging is those who seek to use ESG to help maximise risk-adjusted returns, by using data to understand risks facing a company’s business model from ESG issues now and in the future, and to help improve engagement with management. This is important for ESG going mainstream as many asset owners (pension funds, insurance companies and the like) have a fiduciary duty to maximise risk-adjusted returns.
Such strategies tend to prioritise governance above environmental and social factors – research, including ours, typically suggests that over short time frames companies with strong governance have tended to outperform those with high social or environmental scores.
ESG – Introduction

Renaissance Capital XX January 2019
ESG
Renaissance Capital 14 January 2019
ESG
37
ESG can be broadly defined as the incorporating of environmental, social and governance metrics in to the investment process.
A list of typical ESG factors is shown in the table below, but ESG data providers are collecting thousands of much more granular ESG datapoints (we show MSCI’s ESG matrix in Appendix A).
Figure 47: Typical ESG factors
Source: Principles for Responsible Investment
There are many ways ESG can be incorporated by investors. The Global Sustainable Investment Alliance outlines seven major ESG methodologies (some of which can be used in combination):
Figure 48: Types of ESG investing
Negative/exclusionary screening
The exclusion from a fund or portfolio of certain sectors, companies or practices based on specific ESG criteria
Positive/best-in-class screening
Investment in sectors, companies or projects selected for positive ESG performance relative to industry peers
Norms-based screening Screening of investments against minimum standards of business practice based on international norms
ESG integration The systematic and explicit inclusion by investment managers of environmental, social and governance factors into financial analysis
Sustainability themed investing
Investment in themes or assets specifically related to sustainability (for example clean energy, green technology or sustainable agriculture)
Impact/community investing
Targeted investments, typically made in private markets, aimed at solving social or environmental problems, and including community investing, where capital is specifically directed to traditionally under-served individuals or communities, as well as financing that is provided to businesses with a clear social or environmental purpose
Corporate engagement and shareholder action
The use of shareholder power to influence corporate behaviour, including through direct corporate engagement (i.e., communicating with senior management and/or boards of companies), filing or co-filing shareholder proposals, and proxy voting that is guided by comprehensive ESG guidelines
Source: Global Sustainable Investment Alliance
Environmental Climate change – including physical risk and transition risk
Resource depletion, including water
Waste and pollution
Deforestation
Social Working conditions, including slavery and child labour
Local communities, including indigenous communities
Conflict
Health and safety
Employee relations and diversity
Governance Executive pay
Bribery and corruption
Political lobbying and donations
Board diversity and structure
Tax strategy
What is ESG?

Renaissance Capital XX January 2019
ESG
Renaissance Capital 14 January 2019
ESG
38
ESG in one form or another has been with us for at least 3,500 years. Jewish law saw that ownership brought with it not only rights but responsibilities as an owner. Later, the Koran established guidelines to prevent exploitative gains – or usury – and ruled out investment in alcohol, pork, gambling and gold. By the eighteenth century, Methodists and Quakers were rejecting the slave trade, as well as investment in liquor, tobacco and gambling.
The 1960s saw campaigners opposed to the Vietnam War putting pressure on university endowments to divest from investments in the defence sector. The 1980s saw companies exposed to apartheid South Africa come under pressure to exit, while ecological disasters such as Bho Pal, Chernobyl and Exxon Valdez triggered greater environmental awareness. By the 1990s onwards, corporate scandals such as Polly Peck, BCCI International, Enron, Tyco, WorldCom, Satyam, Olympus and Tesco added greater focus on corporate governance. In the 2000s, the gig economy, data protection, inequality and the impact of globalisation (as well as the aftershocks of the global financial crisis) have been added to the mix, and social media has become an important tool.
Early forms of ESG investing introduced in the 1970s (as socially responsible, values-based or ethical investments) were generally negative screens, that is to say, excluding companies which failed to meet certain criteria (e.g. companies involved in tobacco, fur or controversial weapons). Restricting the investment universe had its constraints on performance over time (MSCI World Tobacco has significantly outperformed MSCI World over the past 15 years for example), and one response to this challenge was to introduce positive- or best-in-class screening strategies (these are often used to create the ESG indices tracked by ETFs). Impact and thematic investing focuses holdings on a specific objective (e.g. reducing carbon emissions, financial inclusion, alternate energy).
More recently, the fastest-growing segment has been ESG integration, which gives active managers greater freedom to invest across the investment universe, but where ESG is integrated in to every part of their investment process, with the aim of using ESG data to maximise risk-adjusted returns via better informed investment decisions, and giving a dashboard of ‘early warning’ signs for risks that could become apparent, and allowing more comprehensive engagement with corporations in meetings and proxy-voting.
Figure 49: ESG integration adds ESG assessment to every part of the investment cycle
Source: Principles for Responsible Investment
One significant boost for ESG integration came after a 2015 Harvard Business School analysis, showed that “firms with good performance on material
sustainability issues significantly outperform firms with poor performance on these issues, suggesting that investments in sustainability issues are shareholder-value enhancing”. In other words, there was a way to incorporate ESG without sacrificing
A brief history of ESG

Renaissance Capital XX January 2019
ESG
Renaissance Capital 14 January 2019
ESG
39
returns. This was followed by a 2015 study of 2,200 pieces of research which concluded that 90% found a non-negative relationship between ESG and corporate financial performance. We still believe that the performance ‘proof’ for ESG integration is still very much in its early days, with a body of real-world evidence yet to be created (we look in more detail at performance of ESG strategies later in this report).
Figure 50: Assets under management by strategy, $bn
Source: GSIA Global Sustainable Investment Alliance
0
2,000
4,000
6,000
8,000
10,000
12,000
14,000
16,000
Neg
ativ
e sc
reen
ES
G in
tegr
atio
n
Cor
pora
teen
gage
men
t /
shar
ehol
der
actio
n
Nor
ms
base
d
Pos
itive
scr
een
Sus
tain
abili
ty th
emes
Impa
ct/c
omm
unity

Renaissance Capital XX January 2019
ESG
Renaissance Capital 14 January 2019
ESG
40
Negative screening (particularly for religious and ethical reasons) and impact investing have been around for decades, albeit as a relatively small and specialised part of the asset management world. The space has continued to involve, albeit with more sophisticated data collection and the use of algorithms, sector overlays, and derivatives to minimise tracking errors and progress in measuring a portfolio’s impact.
The recent surge in interest, with the potential for much more scalable ESG, comes from ESG integration. One of the pushbacks we hear from investors is that non-ESG managers have already been doing much of this work as part of their regular investment process for decades. Any professional investor will want to understand (and if possible quantify) the risks – be they regulatory, reputational, financial, societal, governance, market or other – as they invest their clients’ money, and to assess how these risks may change over time and how they are being addressed by corporate managements. Indeed, this analyst remembers as a young fund manager in the nineties taking time to analyse 50-year projections for the nuclear industry in the Czech Republic to better understand clean-up costs; assessing whether interests were aligned (or not) between majority and minority shareholders in family-owned companies in Greece and Turkey; doing detailed work on corporate structures, disclosure and transfer pricing in Russia, and concluding that the very low taxes being paid by major Russian corporates risked ultimately undermining Russia’s macro stability (as indeed happened 1998), or potentially backfire on the companies themselves (as we saw in 2003).
So what has changed? Three main things, really.
First, demand for ESG-managed assets from asset owners (sovereign wealth funds, pension funds and self-invested pension plans) is increasing for reasons discussed earlier, and this is creating a sizeable demand for ESG asset-management services, potentially with higher fees (or at least more resilient to competition from ETFs).
Second, the data revolution. Thousands of ESG data points are now being collected from thousands of listed companies. Big Data techniques and AI are increasingly being used to process this data and provide a more rounded ESG picture (though EM and in particular Frontier data can still patchy). The use of specialist ESG data providers makes it much easier for fund managers to examine a company’s ESG profile in a structured manner to assess potential risks now and in the future.
Third, societal pressure. Growing pressure in many countries for corporates to bear the full costs of carbon emissions, pollution, water table damage, data breaches, and for multinationals to pay more taxes in the countries they operate in and for ‘gig economy’ companies to provide better protection for workers. Social media is increasing pressure on companies to adapt more quickly to societal norms.
Is ESG integration actually that new?

Renaissance Capital XX January 2019
ESG
Renaissance Capital 14 January 2019
ESG
41
Estimates vary substantially: the definition of ESG assets is pretty fluid, ranging from funds that exclude certain stocks/sectors through to those with an integrated ESG investment process. Starting from the largest numbers, and working down, we find that:
▪ The Principles for Responsible Investment (PRI), the world’s leading proponent of responsible investment, has 1,961 signatories, including more than 1,300 investment managers, and represents $81.7trn of assets under management. Signatories commit to incorporate ESG issues into investment analysis and decision-making processes.
Figure 51: PRI signatories
Source: PRI
▪ The Global Sustainable Investment Alliance estimates that sustainable investments in the US, Canada, the EU, Australia, New Zealand, Japan and Asia reached $23tn in 2016 (or approximately 26% of total managed assets), almost double the $13trn of 2012. That is a surprisingly large figure, representing 26% of professionally-managed assets. Our guess here is that these numbers are something of a catch-all with a very wide net of strategies being captured.
Figure 52: ESG assets by region
Source: GSIA Global Sustainable Investment Review
Half of assets managed are in Europe (53%) followed by the US (38%), Canada (5%), Australia/NZ (2%), Asia ex-Japan (0.2%) and Japan 2%. The US has been lagging Europe so far given the requirement for ERISA fiduciaries “not to sacrifice investment returns or assume greater investment risks as a means of promoting collateral social policy goals” – although recent updates have sought to clarify this.
0
500
1,000
1,500
2,000
2,500
0
10
20
30
40
50
60
70
80
90
Jan-
06
Jan-
07
Jan-
08
Jan-
09
Jan-
10
Jan-
11
Jan-
12
Jan-
13
Jan-
14
Jan-
15
Jan-
16
Jan-
17
Jan-
18
Assets under management Asset owner assets
Number of asset owners Number of signatories
Europe 53%
United States 38%
Canada 5%
Australia/NZ 2%
Asia ex-Japan %
Japan 2%
ESG assets under management

Renaissance Capital XX January 2019
ESG
Renaissance Capital 14 January 2019
ESG
42
By far the most popular strategy, used by two-thirds of sustainable investments, is negative/exclusionary screening (66%) followed by the faster-growing ESG integration (45%), corporate engagement/shareholder action (36%) and norm-based screening (27%). Note that some funds have multiple strategies, which is why the total adds up to more than 100%. True impact investing is largely the realm of billionaires or specialist segments of foundations and/or sovereign wealth funds.
▪ Some of the world’s largest pools of capital, including the $1.5trn Government Pension Investment Fund of Japan, the $1trn Norway Government Pension Fund, the $490bn Dutch ABP and the $350bn California Public Employees Retirement System (CalPERS) are invested within an ESG framework.
▪ If we look bottom up, Morningstar’s database captures assets under management in ESG funds of $1.05trn in October 2018, a 60% increase from $655bn in 2012.
▪ Our screening of the Bloomberg funds database reveals 3,153 funds, with $606bn of assets.
▪ In EM, we estimate $21bn of ESG equity fund assets under management (AuM) across 98 funds, of which $14.0bn is active (57 funds) and $7.4bn is passive (41 funds). This is just 1.5% of the total equity fund AuM in EM of $1.4trn, but has grown rapidly from just $5bn in 2016.
Figure 53: EMG equity fund AuM, $mn
Source: EPFR, Bloomberg, Renaissance Capital
Why such a huge difference? Definitions matter. PRI data capture the entire assets of signatories (regardless of how much ESG is applied); the Global Sustainable Investment Alliance data include a broad definition of ESG being applied within the investment process, whereas the Morningstar and Bloomberg data refer to funds that are available to the public and marketed with some form of ESG branding. Of course, there are additional segregated mandates, insurance company assets, private equity and direct investments of sovereign wealth funds, IFIs, pension funds and the like.
0
5,000
10,000
15,000
20,000
25,000
2008
2009
2010
2011
2012
2013
2014
2015
2016
2017
2018
EM ESG AuM, $mn

Renaissance Capital XX January 2019
ESG
Renaissance Capital 14 January 2019
ESG
43
ESG data can be collected from numerous sources. Many companies, particularly in developed markets issue ESG reports alongside annual reports. Media reports can be used to fill in the gaps, companies can be asked to fill in questionnaires, and reports from third party agencies, regulators, independent researchers and (sometimes) pressure groups can also be used. The boom in ESG data has resulted in a blossoming of ESG research firms, collecting and organising extensive amounts of ESG data that most asset managers do not have the resources to collect/organise. There are over 150 such firms in total, collecting 10,000 ESG KPI indicators via corporate reports, proprietary surveys sent to companies and other third parties, including media sources. Larger ESG providers often provide aggregate scores using proprietary algorithms.
Four of the most popular providers are MSCI, Sustainalytics, Bloomberg and ISS. Other popular providers include RobecoSAM, Refinitiv, FTSE, CDP, RepRisk, Vigeo-Eiris and Glass Lewis; Truvalue and Trucost are also popular. Expert networks such as the Gerson Lehrman Group and employee feedback sites such as Glassdoor can also be used for ESG checks. Some larger fund managers ask companies to fill in proprietary questionnaires, but alongside the use of expert networks, care must be taken to avoid data being selectively disclosed.
Some of these providers boast of collecting thousands of data points per company, with the largest providers employing hundreds of ESG analysts and using sophisticated internet and media scraping tools to collate and organise the data. Much is still subjective: even supposedly straightforward topics can be subject to debate, and the ESG focus may shift over time as norms change and/or more companies conform with best practice. Recent months, for example, have seen environmentalists debating whether hydroelectric dams are 'sustainable' or not. And we have all seen the debate over the gig economy – has it created jobs that wouldn't otherwise have existed, or is it taking advantage of workers? And what about reducing the power of the unions in countries which have suffered from militant unionism? Palm oil is used in bio-fuels, but at the same time is responsible for wide-scale deforestation in Malaysia and Indonesia. Diesel was once promoted by European governments as more environmentally friendly than petrol, a strategy that is now being reversed. At the end of the day, issues are bound to shift (just as sector and economic trends develop over time), something that fund managers are well used to adapting to.
ESG data are often patchy, inconsistently reported and unaudited, and often obtained from multiple sources (companies, regulators, media, advocacy groups, etc). As a result there is: 1) precious little agreement among ESG providers about how companies should rank; and 2) a risk of data overload (one study suggested that incorporating) immaterial factors can detract from performance.
Whereas the leading credit rating agencies have a 0.9 correlation between them for corporate credit, for ESG providers it is typically more like 0.3 as different providers rank various factors differently. While this lack of consensus might provide greater ‘ESG alpha’, given the lack of consensus, it highlights the risks of buying an index fund which might be blindly reliant on one or other provider. By combining huge data sets in to a single score, we think ESG providers are almost certainly oversimplifying matters and active managers will need to drill down in to the underlying data to fully understand the picture.
Work is still in progress to standardise ESG reporting – the most widely used reporting framework is provided by the Global Reporting Initiative (GRI), with another provided by the International Integrated Reporting Council (IIRC), but companies are free to follow all or part of a standard or no standard at all in their ESG reporting, and data are typically unaudited. The Sustainability Accounting Standards Board has taken the GRI and IRC frameworks to develop a new reporting standard with a focus on materiality across 79 industries.
Where does ESG data come from?

Renaissance Capital XX January 2019
ESG
Renaissance Capital 14 January 2019
ESG
44
Figure 54: MSCI ESG parameters, $mn
Environment pillar Social pillar Governance pillar
Climate change
Natural capital
Pollution & waste
Environment opportunities
Human capital
Product liability
Stakeholder opposition
Social opportunities
Corporate governance
Corporate behaviour
Carbon emissions
Water stress Toxic
emissions & waste
Clean tech Labour
management Product safety &
quality Controversial
Sourcing Access to
Communication Board Business ethics
Product carbon footprint
Biodiversity & land use
Packaging material &
waste Green building Health & safety Chemical safety
Access to finance Pay
Anti-competitive practices
Financing environmental
impact
Raw material sourcing
Electronic waste
Renewable energy
Human capital development
Financial product safety
Access to healthcare
Ownership Corruption &
instability
Climate change vulnerability
Supply chain labour
standards
Privacy & data security
Opportunities in nutrition & health
Accounting Financial system
instability
Responsible investment
Tax transparency
Insuring health & demographic
risk Source: MSCI

Renaissance Capital XX January 2019
ESG
Renaissance Capital 14 January 2019
ESG
45
ESG is a sector undergoing rapid development. ESG integration in seeking to enhance the understanding of risks associated with the environment, social factors and governance, without artificially constraining the investment universe aims to improve (or at the very least equal) competitive risk-adjusted returns – to meet the fiduciary requirements of many of the world’s largest pools of capital (pension funds, insurance companies, etc).
Though ESG integration should normally result in portfolios prioritising companies doing well on these issues, it is not the same as true impact investment, where investments are made with a specific outcome in mind (e.g. raising financial inclusion, targeting poverty, etc) and where lower returns could often be tolerated. Impact investing tends to be much less liquid for now and is largely restricted to billionaires, family offices, foundations and sovereign wealth funds.
This is still a young industry, with its teething issues. One study, by fund managers Schroders revealed that 77% of investors find incorporating ESG either very or somewhat challenging, with the key issues being performance concerns, data availability and quality and risk management.
Figure 55: How challenging do you find sustainable investments?
Source: Schroders Institutional Investor Study 2018
Figure 56: Which factors do you consider a challenge in sustainable investing
Source: Schroders Institutional Investor Study 2018
The ESG debate in bullet points – some of the challenges:
1. Lack of standardised reporting. Companies have a wide range of reporting methodologies and there is limited comparability with numbers produced between companies. Sustainability accounting standards are being developed.
2. Lack of auditing. Such disclosure is often voluntary and not part of annually-audited disclosures.
3. Selective reporting. Companies tend voluntarily to disclose positive metrics and may be inclined not to disclose too much negative data, which can skew results.
4. Small companies tend to lag. Large companies often have the ability to produce comprehensive ESG reports, which their smaller peers struggle to produce. Some scoring methodologies penalise missing data, boosting the scores of companies with high disclosure.
5. Geographical bias. Regulations in Europe favour more in-depth ESG reporting and hence greater data availability.
6. Sector bias. Carbon emissions matter for steel and oil companies. It shouldn’t really matter (at least in order of magnitude) for advertising agencies. Water table issues may be relevant to beverage producers but irrelevant to banks,
0%
10%
20%
30%
40%
50%
60%
70%
80%
90%
100%
Overall N America Europe Latin America Asia
Very challenging Somewhat challenging Not challenging
0
10
20
30
40
50
60P
erfo
rman
ce c
once
rns
Dat
a co
ncer
ns
Man
agin
g ris
k
Cos
t
Inve
stm
ent c
omm
ittee
not
com
fort
able
Do
not b
elie
ve in
con
cept
No
chal
leng
es
Oth
er
Overall N America Europe Latin America Asia
The ESG debate

Renaissance Capital XX January 2019
ESG
Renaissance Capital 14 January 2019
ESG
46
though banks’ lending policies might come in to play. This tends to make managers compare companies within their sector group silos, with sometimes less of a focus on which sectors (or countries) in aggregate are challenging from an ESG perspective.
7. How far to go? How far down a company’s supply chain should analysis go to identify polluting or socially irresponsible suppliers? Global multinationals may have multiple industries in many markets requiring extensive and costly (particularly in terms of time) ESG due diligence. There is also a challenge in finding appropriate peers for some companies.
8. What is material? The Sustainable Accounting Standards Board (SASB) differentiates between materiality of ESG factors by sector in its materiality map covering 77 industries within 11 sectors. One study found that across industries, on average, only about 20% of ESG issues could be classified as ‘material’, and that firms with strong ratings on material sustainability issues have better future performance than firms with inferior ratings on the same issues. In contrast, firms with strong ratings on immaterial issues do not outperform firms with poor ratings on these issues. And firms with strong ratings on material issues but poor ratings on immaterial issues have the best future performance. In other words, incorporating non-material issues in to ESG analysis has tended to detract from performance, a potentially important takeaway for ESG managers. However, which factors may be important in the future is a key unknown.
9. Weighting difficult-to-compare results. Should social issues be considered more or less important than environmental or governance issues? Should a highly-polluting company be able to offset that by having great governance and treating workers well? Is having unions good or bad (reducing the power of militant unions was seen as a great success in many countries)? How should societal norms in less wealthy countries, or in countries with different social traditions be treated?
10. Consistency. Lack of standardised analysis. As the Wall Street Journal pointed out in September 2018 (see Figure 52), Tesla was ranked by MSCI at the top of the industry, and by FTSE as the worst carmaker globally on ESG issues. Sustainalytics put it in the middle. One study showed only a 14% correlation between MSCI's ESG score and Fortune magazine's Corporate Social Performance (CSP) ranking, and found very little correlation between providers even on detailed metrics such as palm oil. CSRHub found only a 0.32 correlation between MSCI and Sustainalytics ESG scores. Schroders similarly found on average just a 0.4 correlation between scores of different leading ESG providers. By contrast, our work (which took us over our monthly Bloomberg data allowance) shows that at the sovereign level, there is a 0.98 r-square correlation between S&P and Moody’s, and at the corporate level, 0.88. It is possible to argue that this lack of consensus leaves more ESG ‘alpha’ on the table for portfolio managers, but it invariably makes investing in passive funds challenging and means that active managers need to actively process the underlying data rather than aggregate score.
11. Missing data. Should companies be given the benefit of the doubt and be given sector average scores for missing data, or should scorers assume the worst?
12. Reporting delays. Real time disclosure, or even quarterly disclosure is limited, with data tending to be disclosed only annually, and even then, often with some deals.
13. Restatement/infilling of back data. Companies are free to restate data without penalty. Companies can also provide back data at will, potentially changing future and current ranks.

Renaissance Capital XX January 2019
ESG
Renaissance Capital 14 January 2019
ESG
47
14. Source transparency. Some ESG raters use only company-disclosed information, others use proprietary questionnaires to seek more. Some scrape information from media sources, or even from action groups. There is little transparency in data sources, reliability and interpretation. Excessive use of proprietary questionnaires or expert sources can increase the risk of selective disclosure.
15. Are the raters also advisors? Some ESG providers are also providing ESG compliance advice to corporates.
16. Morphing data. Fund managers are not only being overwhelmed with data, but are faced with new metrics being introduced: for example, palm oil controversies, tax optimisation and data security measures are relatively new. Such newly-introduced metrics tend to come without the ability to back-test.
17. Coverage. Many EM stocks have only limited coverage by the main ESG providers. Frontier stocks are barely covered.
18. Will ESG integration be enough? The aim of incorporating ESG risks and opportunities in to the investment process without compromising risk-adjusted returns is a laudable one, but is it enough? If over time, a measurable societal outcome is not achieved, then perhaps ESG will be seen as having fallen short of its potential.
Figure 57: Tesla according to different providers
Source: FTSE Russell, MSCI Sustainalystics, Wall Street Journal

Renaissance Capital XX January 2019
ESG
Renaissance Capital 14 January 2019
ESG
48
Investing for good purpose while accepting potentially lower returns could be a very worthy pursuit for those who can afford it. The pot of gold for ESG managers however – which would allow ESG to move much more in to the mainstream – is to ‘prove’ that ESG can be incorporated in to investment strategies without compromising risk-adjusted returns. The reason for this is that many of the largest pools of capital in the world (pension funds, insurance companies, etc) with an eye on future liabilities have a duty to maximise risk-adjusted returns.
What does the literature tell us?
First it is important to differentiate between types of ESG.
Impact and thematic investing is usually considered to be more tolerant of non-market returns in order to provide a particular ESG impact or provide focused exposure on a particular industry or theme. Impact and thematic AuM are relatively small.
Screening is where the longest ESG history lies, in the form of Socially Responsible Investment (SRI). Much of the concern about ESG performance comes from screening. The argument is that if an investment universe is artificially constrained, for example by stripping out tobacco companies, then the constrained fund manager will be unable to replicate the optimal portfolio constructed by an unconstrained manager. The unconstrained manager always has the investment option not to hold tobacco stocks if they don’t provide attractive risk-adjusted returns, but has the option to own them when they are attractive. The constrained manager does not have that choice. Investor surveys suggest that screening strategies tend to be driven more by product strategy and ethical considerations and less so by economic considerations. There is little to suggest there is much market inefficiency to be exploited: it is usually no secret that a company is involved in tobacco, gambling or alcohol.
Probably the longest ‘live’ ESG screening experience is that of Norway's Sovereign Wealth fund (at $1trn, the world’s largest, owning 1.4% of listed companies globally) which has calculated that over the past 12 years, ESG exclusions have cost the fund 1.6% in performance (excluding companies that produce tobacco or weapons that violate humanitarian principles cost the fund 2.4% in performance, only partly offset by a 0.9% improvement in returns by excluding companies with an unacceptable risk of human rights violations, serious environmental damage, gross corruption or serious violations of ethical norms). Although the numbers are small, it is a clear shortfall in performance.
One study shows that over the long term (1965-2006), ‘sin stock’ portfolios have tended to outperform their peers. Another shows that screening constraints can be costly, with the scale depending on the extent of constraints (ranging from a few basis points for index fund up to 30 bpts per month for active funds). One more study shows that SRI funds in the UK and US show similar performance to conventional funds, whereas those in Europe and Asia-Pacific strongly underperform. Another has shown that studies are inconclusive when it comes to out/under performance of SRI screening. One study showed that portfolios with positive screens outperformed those with negative screens. Others have shown little difference in performance of SRI and non-SRI funds by studying the results of multiple other studies. The skew is probably weakly towards the risk of underperformance, which is why the focus of ESG investing appears to have shifted towards ESG integration.
Does (or should) ESG outperform?

Renaissance Capital XX January 2019
ESG
Renaissance Capital 14 January 2019
ESG
49
ESG integration
ESG integration has a shorter track record to assess and is less clearly defined than SRI screening. Implementing ESG can include using ESG as a risk analysis tool, as a corporate engagement and proxy-voting tool, as a tool for analysts to understand potential future investment costs, as a tool for adjusting a company’s cost of capital in traditional discounted cash-flow models and as an overlay tool to tilt overweights and underweights. As a result, there is no overwhelming consensus in studies.
Surveys suggest that investors believe full ESG integration is likely to provide the strongest impact on returns (followed by engagement/active ownership, positive screening and then risk factor-based screening).
The theory is that companies scoring well on ESG metrics are likely to be those achieving strong financial results over the cycle, and thus with a potential to outperform. Arguments for this include that such companies typically have better internal processes, information flow, are more forward looking and have the management information systems, risk management focus and strategies to position the business not only for current but potential future regulation and changes in societal norms. Such companies also tend to have better control over their supply chains, and stronger alignment between remuneration and performance, in addition to well-developed and operationally independent risk management and internal audit systems. But as one study importantly showed, outperformance would need to assume that these factors are being incorrectly understood by the market in order to provide a pricing inefficiency, and to be sure that excessive focus on ESG metrics does not compromise long-run financial returns vs peers. Another study showed that buying the top-performing stocks on eco-efficiency metrics could add to performance.
That said, there is plenty of work being done to promote ESG and plenty of studies attempting to show that investments can incorporate ESG without sacrificing returns, although much of the work done so far is back-testing of how strategies would have worked, with relatively few longer-term real-life demonstrations of out- or under-performance.
One major positive turning point for ESG integration came after a 2015 Harvard Business School analysis, which found that “firms with good performance on material sustainability issues significantly outperform firms with poor performance on these issues, suggesting that investments in sustainability issues are shareholder-value enhancing”. In other words, there was a way to incorporate ESG without sacrificing returns. This was followed by a 2015 study of 2,200 pieces of research which concluded that 90% found a non-negative relationship between ESG and corporate financial performance. We still believe that the performance ‘proof’ for ESG integration is still very much in its early days, with a body of real-world evidence yet to be created.
It is clear from surveys (see Figure 53) that investors are prioritising governance issues when it comes to ESG. Arguments for this include ease of measurement, strong disclosure, ease of engagement and low barriers to improvement within a reasonably short investment timeframe. By contrast, bringing about change in carbon emissions can take decades and considerable investment.

Renaissance Capital XX January 2019
ESG
Renaissance Capital 14 January 2019
ESG
50
Figure 58: How would the following disclosures about a prospective investment affect your investment decision?
Source: EY Climate Change and Sustainability Services 2017 investor survey
Our conclusion is that we do not know for sure whether ESG strategies will outperform or not over the long term in the real world, though we can see good arguments for it: we can envisage that: 1) a better understanding of a company’s ESG risks and strategies can help give investors better all-round understanding of a company; 2) there may be an increasing trend globally to reprice ESG underperformance, e.g. social media exposing companies with poor ESG performance, carbon and pollution pricing, tougher requirements on recycling/recyclability, increasing penalties on companies that fail to protect personal data, greater pressure on companies to eliminate gender pay gaps and provide greater protection to workers in the gig economy, and from governments on global corporates’ tax optimisation strategies, as well as higher penalties for breaching money laundering or sanctions legislation; and 3) growing ESG AuM can help push up the stock prices of companies doing well on such metrics via weight of money.
In the following section, we look at the data on ESG performance (with the caveat that our sample is necessarily limited) and shed more light on this question.
0 10 20 30 40 50 60 70 80 90 100
Risk or history of poor governance
Human rights risk from operations
Limited verification of data and claims
ESG risks in supply chain unmanaged
Risk or history of poor environmental performance
Risk from resource scarcity - e.g. water
Absence of a direct link between ESG initiatives and business strategy tocreate value in the short, medium and long term
Risk from climate change
Rule out investment immediately Reconside investment No change in investment plan

Renaissance Capital XX January 2019
ESG
Renaissance Capital 14 January 2019
ESG
51
ESG and performance: The evidence
Does ESG outperform ‘traditional’ investing? If we look at the performance of the MSCI World ESG Leaders Index vs the MSCI World Index, we see almost no difference between them in terms of performance. This is not indicative of much – by design, the MSCI ESG Leaders indices are supposed to match the factor exposures of their parent index.
However, an often-quoted result in EMs is that the EM ESG Leaders Index has outperformed the EM Index substantially since inception, with a relative outperformance of 48% since 30 September 2007.
Figure 59: MSCI World ESG Leaders vs MSCI World, $
Source: MSCI, Bloomberg, Renaissance Capital
Figure 60: MSCI EM ESG Leaders vs MSCI EM, $
Source: MSCI, Bloomberg, Renaissance Capital
Looking at a sample of 15 country and aggregate indices with ESG counterparts, we see that ESG beat the standard index in South Africa, Taiwan, India, Brazil, China, EM, Mexico, Canada, the Eurozone and Japan; it was flat against the US, Australia and the overall DM index, and it lagged for Korea and the UK.
Figure 61: MSCI ESG Leaders indices vs standard indices, 10yr annualised net total returns
Source: MSCI, Bloomberg, Renaissance Capital
On the face of it, this suggests that ESG strategies work much better in EM than in DM. However, there are a few nuances here. First, while the index starts from September 2007, the actual launch date was July 2013 – data prior to this date are back filled. For the EM index, annualised outperformance drops by around two-fifths after the index went ‘live’. Of the sample considered, Canada, the eurozone, and Korea saw the ESG index’s
30405060708090
100110120130140150
Sep
-07
Apr
-08
Nov
-08
Jun-
09
Jan-
10
Aug
-10
Mar
-11
Oct
-11
May
-12
Dec
-12
Jul-1
3
Feb
-14
Sep
-14
Apr
-15
Nov
-15
Jun-
16
Jan-
17
Aug
-17
Mar
-18
Oct
-18
MSCI World ESG Leaders MSCI World
30405060708090
100110120130140150160170
Sep
-07
Apr
-08
Nov
-08
Jun-
09
Jan-
10
Aug
-10
Mar
-11
Oct
-11
May
-12
Dec
-12
Jul-1
3
Feb
-14
Sep
-14
Apr
-15
Nov
-15
Jun-
16
Jan-
17
Aug
-17
Mar
-18
Oct
-18
MSCI EM ESG Leaders MSCI EM
-2.0
-1.0
0.0
1.0
2.0
3.0
4.0
5.0
Sou
th A
fric
a
Tai
wan
Indi
a
Bra
zil
Chi
na EM
Mex
ico
Can
ada
Eur
ozon
e
Japa
n
US
Aus
tral
ia
Wor
ld
Kor
ea UK
ESG outperformance vs parent index (10yr annualised net $ total returns), ppts
Putting ESG to the test, pt. 1

Renaissance Capital XX January 2019
ESG
Renaissance Capital 14 January 2019
ESG
52
outperformance improve once ‘live’ data was used. Mexico saw the most dramatic change, as ESG went from outperforming in the backtest to underperforming after the launch.
Figure 62: MSCI ESG Leaders indices vs standard indices, annualised performance pre- and post-launch ($)
Source: MSCI, Bloomberg, Renaissance Capital
China saw the highest ESG outperformance post-launch, followed by Taiwan and India; indeed, ESG’s outperformance in China, India and Taiwan has been a main factor in the overall index performance, given their weights.
With our sample of ESG and standard indices, we attempted to test whether there was a statistically significant alpha in favour of the ESG Index. Our results showed that alphas were significant (at the 5% level) for the EM index, and for China, South Africa, Taiwan and Canada.
Figure 63: MSCI EM ESG indices – alpha estimates and t-stats
World EM China India Brazil South Africa Korea Japan Taiwan Mexico Australia Canada Eurozone UK US
Estd. alpha -0.1% 3.5% 5.9% 3.2% 3.9% 4.2% -1.2% 0.3% 5.0% 4.5% 0.4% 2.3% 1.1% -0.6% -0.3%
T-stat -0.25 3.37 2.81 1.69 1.87 2.56 -0.55 0.59 2.89 1.69 0.29 2.34 1.69 -0.43 -0.52 Source: MSCI, Bloomberg, Renaissance Capital
What about ESG funds?
As we pointed out earlier, ESG investing is by no means a new thing. That said, the bulk of the asset growth in EM ESG/SRI funds has come in the past three years, with AuM rising from $2.9bn in January 2014 to $21.4bn as of October 2018. Using a sample of 24 EM ESG/SRI funds from 2013, we see that while the EM ESG Index outperformed the EM Index, our sample of funds underperformed both the EM ESG Index and the MSCI EM Index as a whole.
Figure 64: EM ESG fund average vs MSCI EM and MSCI EM ESG (total return, $)
Source: MSCI, Bloomberg, Renaissance Capital
-6%
-4%
-2%
0%
2%
4%
6%
8%
10%
12%
14%
16%
Mex
ico
Bra
zil
Tai
wan
Chi
na
Sou
th A
fric
a
EM
Indi
a
Can
ada
Japa
n
Aus
tral
ia
UK
Eur
ozon
e
Kor
ea
Outperformance prior to launch Outperformance post-launch
60
80
100
120
140
160
180
Jan-
13
Apr
-13
Jul-1
3
Oct
-13
Jan-
14
Apr
-14
Jul-1
4
Oct
-14
Jan-
15
Apr
-15
Jul-1
5
Oct
-15
Jan-
16
Apr
-16
Jul-1
6
Oct
-16
Jan-
17
Apr
-17
Jul-1
7
Oct
-17
Jan-
18
Apr
-18
Jul-1
8
Oct
-18
ESG fund average (total return) MSCI EM total return ($) MSCI EM ESG total return ($)
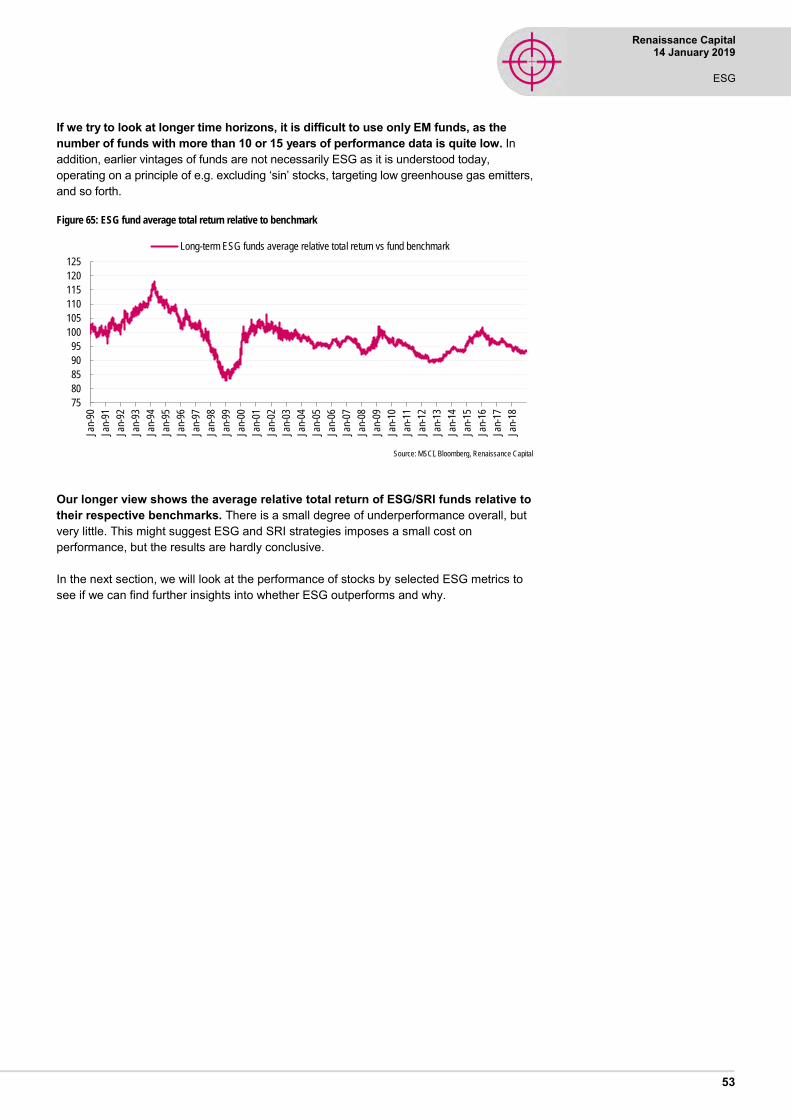
Renaissance Capital XX January 2019
ESG
Renaissance Capital 14 January 2019
ESG
53
If we try to look at longer time horizons, it is difficult to use only EM funds, as the number of funds with more than 10 or 15 years of performance data is quite low. In addition, earlier vintages of funds are not necessarily ESG as it is understood today, operating on a principle of e.g. excluding ‘sin’ stocks, targeting low greenhouse gas emitters, and so forth.
Figure 65: ESG fund average total return relative to benchmark
Source: MSCI, Bloomberg, Renaissance Capital
Our longer view shows the average relative total return of ESG/SRI funds relative to their respective benchmarks. There is a small degree of underperformance overall, but very little. This might suggest ESG and SRI strategies imposes a small cost on performance, but the results are hardly conclusive.
In the next section, we will look at the performance of stocks by selected ESG metrics to see if we can find further insights into whether ESG outperforms and why.
75
80
85
90
95
100
105
110
115
120
125
Jan-
90
Jan-
91
Jan-
92
Jan-
93
Jan-
94
Jan-
95
Jan-
96
Jan-
97
Jan-
98
Jan-
99
Jan-
00
Jan-
01
Jan-
02
Jan-
03
Jan-
04
Jan-
05
Jan-
06
Jan-
07
Jan-
08
Jan-
09
Jan-
10
Jan-
11
Jan-
12
Jan-
13
Jan-
14
Jan-
15
Jan-
16
Jan-
17
Jan-
18
Long-term ESG funds average relative total return vs fund benchmark

Renaissance Capital XX January 2019
ESG
Renaissance Capital 14 January 2019
ESG
54
An ESG experiment – the results
Using a database of c. 3,000 EM and DM stocks, covering c. 150,000 ESG datapoints, we find that ‘good’ ESG stocks tend to outperform ‘bad’ ones by around 5 ppts pa (total return, $ terms), supporting the theory that ESG can help managers outperform. However, breaking this down further, we see that the bulk of this has come from the outperformance of better-governed companies vs their less well-governed peers. Using just environmental or social scores, there is some (albeit statistically insignificant5) outperformance.
Figure 66: ESG performance across MSCI ACWI, $
Note: Equal-weighted total return of portfolios formed by ranking stocks by score and taking the average of each quintile, then comparing the top quintile with the bottom quintile
Source: MSCI, Bloomberg, Renaissance Capital
5 At 5% significance level
0
5
10
15
20
25
30
35
RenCap ESG Score RenCap E RenCap S RenCap G
Performance: Top quintile vs bottom quintile (2014-date, Total Return, $)
Putting ESG to the test, pt. 2

Renaissance Capital XX January 2019
ESG
Renaissance Capital 14 January 2019
ESG
55
What else did we learn?
Finland, the Netherlands and Israel top the rankings for overall ESG, while India, China, and Indonesia perform worst. On average, DM outperforms EM, particularly on environmental scores; for governance, DM is some way ahead, while for social both are equal. By sector, healthcare, IT and communications score best, while utilities, energy and materials score worst.
Figure 67: ESG scores by country
Environmental Social Governance Overall
Netherlands 90% 72% 98% 87%
Finland 72% 84% 95% 84%
Israel 70% 91% 70% 77%
UK 90% 49% 74% 71%
Norway 64% 99% 47% 70%
Sweden 91% 46% 64% 67%
Korea 64% 87% 48% 66%
Switzerland 83% 29% 84% 65%
Australia 54% 49% 92% 65%
Brazil 63% 78% 52% 64%
South Africa 71% 65% 56% 64%
Spain 72% 81% 36% 63%
Singapore 68% 38% 81% 62%
US 66% 35% 81% 61%
Germany 77% 59% 41% 59%
Italy 78% 62% 33% 58%
France 88% 62% 23% 57%
Denmark 92% 16% 64% 57%
Belgium 64% 66% 20% 50%
Canada 46% 23% 77% 49%
Taiwan 29% 96% 18% 48%
Ireland 59% 0% 74% 44%
Greece 11% 91% 14% 39%
Chile 49% 6% 58% 38%
Malaysia 23% 78% 9% 37%
Russia 25% 73% 11% 37%
Turkey 48% 31% 31% 36%
Mexico 34% 10% 61% 35%
Japan 68% 24% 7% 33%
Philippines 4% 34% 51% 30%
Thailand 12% 53% 3% 23%
Hong Kong 20% 21% 27% 22%
Indonesia 16% 10% 39% 22%
China 14% 31% 16% 20%
India 17% 3% 25% 15%
DM 71% 50% 59% 60%
EM 32% 50% 33% 38%
Health Care 78% 55% 62% 65%
Information Technology 79% 49% 63% 64%
Communication Services 81% 47% 56% 62%
Consumer Staples 74% 53% 57% 62%
Consumer Discretionary 78% 49% 57% 61%
Real Estate 70% 54% 60% 61%
Financials 93% 36% 54% 61%
Industrials 74% 52% 55% 60%
Materials 57% 56% 59% 57%
Energy 59% 54% 58% 57%
Utilities 55% 54% 52% 54% Source: MSCI, Bloomberg, Renaissance Capital
For environmental, Denmark, Sweden and the Netherlands score best, with the Philippines, Greece and Thailand scoring worst. South Africa is the best country in EM for environmental, while Hong Kong is the worst country in DM. One reason South Africa performs well is that it has very few energy and utility companies in the index – adjusted

Renaissance Capital XX January 2019
ESG
Renaissance Capital 14 January 2019
ESG
56
for sector composition, South Africa is merely middling (contrast this with Brazil, where while the index is tilted towards high-emissions sectors, the companies are generally better on average than their industry peers). Hong Kong suffers from a high proportion of utility and land development companies with high levels of emissions per sales, which drags down its score.
For social, Norway, Taiwan and Greece score best, while Ireland, India and Chile score worst. Some interesting points here are:
▪ Taiwan, Greece and Korea do best in EM, as their companies show a strong presence of women in management roles and in the workforce more widely, high rates of unionisation and relatively low rates of time lost to injury; moreover, their companies tend to be ahead of industry peers on these metrics.
▪ India, Ireland and Chile are the polar opposite – women are underrepresented in both management and in the workforce, unionisation is low and lost time to worker injuries are high both on absolute and relative levels.
For governance, the Netherlands, Finland and Australia score best, while Thailand, Japan and Malaysia score worst. Some interesting points:
▪ It is perhaps unsurprising, given the number of corporate scandals in Thailand, Japan and Malaysia, that these countries screen worst on our governance scores. Low proportions of independent directors, over-sized boards, low ratings from Institutional Shareholder Services (ISS) on corporate governance and a high proportion of state-owned corporations are features these three countries share; with Russia, Greece and China not far behind.
ESG top-down vs ESG bottom-up
Comparing our ‘bottom-up’ scores to our ‘top-down’ scores (Thoughts from a Renaissance man – Reclaiming ESG in EM and FM, published 19 October 2018) we find that top-down factors account for roughly 40% of the variation of bottom-up scores. By category, governance scores show the closest relationship, with a correlation of 51%; social scores have a correlation of 21% and environmental scores are almost unrelated, with a correlation of just 2%.
Figure 68: ESG bottom-up vs ESG top-down
Source: MSCI, Bloomberg, Renaissance Capital
Figure 69: Environmental bottom-up vs environmental top-down
Source: MSCI, Bloomberg, Renaissance Capital
NetherlandsFinland
Israel
UKNorwaySwedenKorea SwitzerlandAustraliaBrazil
South Africa
SpainSingaporeUS GermanyItaly France Denmark
BelgiumCanadaTaiwanIreland
Greece ChileMalaysiaRussiaTurkey MexicoJapan
Philippines
Thailand Hong KongIndonesiaChina
India
0%
10%
20%
30%
40%
50%
60%
70%
80%
90%
100%
20% 30% 40% 50% 60% 70% 80% 90% 100%
RenCap ESG Bottom-Up (y-axis) vs ESG Top-Down (x-axis)
Netherlands
FinlandIsrael
UK
Norway
Sweden
Korea
Switzerland
Australia
Brazil
South Africa SpainSingapore
US
Germany Italy
FranceDenmark
Belgium
Canada
Taiwan
Ireland
Greece
Chile
MalaysiaRussia
Turkey
Mexico
Japan
Philippines
Thailand
Hong KongIndonesia
ChinaIndia
0%
10%
20%
30%
40%
50%
60%
70%
80%
90%
100%
40% 50% 60% 70% 80% 90% 100% 110%
RenCap Environmental bottom-up (y-axis) vs Environmental top-down (x-axis)

Renaissance Capital XX January 2019
ESG
Renaissance Capital 14 January 2019
ESG
57
Why is there such a large difference between our environmental scores? The main reason would be that in measuring emissions on a per-person basis, less-developed economies would tend to look better than more developed economies, as they lack the industrial base and technology that leads to high emissions. However, just because they are not large polluters does not mean their industries cannot improve in terms of emissions – indeed, one would hope that new investments made in low-income countries would use the latest technologies to ensure lower emissions than their high-income peers had at the same level of development.
Figure 70: Social bottom-up vs social top-down
Source: MSCI, Bloomberg, Renaissance Capital
Figure 71: Governance bottom-up vs governance top-down
Source: MSCI, Bloomberg, Renaissance Capital
The difference between the top-down and bottom-up social and governance scores is also interesting and suggests that there may be companies which are lagging the developments in the economy as a whole, or conversely, that some countries – e.g. South Africa, Israel and Brazil – have companies that are more socially responsible and better-governed than the country in aggregate.
Netherlands
Finland
Israel
UK
Norway
Sweden
Korea
Switzerland
Australia
Brazil
South Africa
Spain
SingaporeUS
GermanyItalyFrance
Denmark
Belgium
Canada
Taiwan
Ireland
Greece
Chile
MalaysiaRussia
Turkey
Mexico
Japan
Philippines
Thailand
Hong Kong
Indonesia
China
India0%
10%
20%
30%
40%
50%
60%
70%
80%
90%
100%
20% 30% 40% 50% 60% 70% 80% 90% 100%
RenCap Social bottom-up (y-axis) vs Social top-down (x-axis)
NetherlandsFinland
IsraelUK
Norway
Sweden
Korea
Switzerland
Australia
BrazilSouth Africa
Spain
SingaporeUS
Germany
Italy
France
Denmark
Belgium
Canada
Taiwan
Ireland
Greece
Chile
MalaysiaRussia
Turkey
Mexico
Japan
Philippines
Thailand
Hong Kong
Indonesia
China
India
0%
10%
20%
30%
40%
50%
60%
70%
80%
90%
100%
0% 20% 40% 60% 80% 100%
RenCap Governance bottom-up (y-axis) vs Governance top-down (x-axis)

Renaissance Capital XX January 2019
ESG
Renaissance Capital 14 January 2019
ESG
58
Top of the charts
Our ESG scores shows Natura Cosmeticos, the Brazilian cosmetics giant famed for its sustainable practices, as the top ESG company in EM, followed by Lojas Renner and China State Construction and Engineering.
Figure 72: Top/bottom 10 EM stocks by ESG scores
Ticker Name Country Sector MktCap, $mn Overall ESG score
NATU3 BS Natura Cosmeticos Sa Brazil Consumer Staples 4,708 80.1
LREN3 BS Lojas Renner S.A. Brazil Consumer Discretionary 7,212 78.3
601668 C1 China State Construction -A China Industrials 36,012 77.0
032830 KP Samsung Life Insurance Co Lt South Korea Financials 15,170 76.4
ISA CX Interconexion Electrica Sa Colombia Utilities 4,777 76.0
BSAN CC Banco Santander Chile Chile Financials 14,473 75.7
SANB11 BS Banco Santander Brasil-Unit Brazil Financials 41,991 73.8
8299 TT Phison Electronics Corp Taiwan Information Technology 1,495 72.0
LPPF IJ Matahari Department Store Tb Indonesia Consumer Discretionary 1,036 71.9
DELTA TB Delta Electronics Thai Pcl Thailand Information Technology 2,629 71.8
817 HK China Jinmao Holdings Group China Real Estate 5,056 32.4
SMGR IJ Semen Indonesia Persero Tbk Indonesia Materials 4,862 32.2
TITK GA Titan Cement Co. S.A. Greece Materials 1,890 31.8
002380 KP Kcc Corp South Korea Industrials 2,655 31.1
SIME MK Sime Darby Berhad Malaysia Industrials 3,738 30.3
2002 TT China Steel Corp Taiwan Materials 12,119 30.1
ACEM IS Ambuja Cements Ltd India Materials 5,695 29.7
GAIL IS Gail India Ltd India Utilities 10,481 29.3
2610 TT China Airlines Ltd Taiwan Industrials 1,859 27.2 Source: MSCI, Bloomberg, Renaissance Capital
On the other end of the spectrum, we find China Airlines, Gail India and Ambuja Cement.
Looking by sector, we find the following in EM:
Figure 73: Top/bottom EM ESG scores by sector
Ticker Name Country Sector MktCap, $mn Overall ESG score
TIMP3 BS Tim Participacoes Sa Brazil Communication Services 7,324 64.5
LREN3 BS Lojas Renner S.A. Brazil Consumer Discretionary 7,195 78.3
NATU3 BS Natura Cosmeticos Sa Brazil Consumer Staples 4,697 80.1
010950 KP S-Oil Corp South Korea Energy 10,630 57.3
032830 KP Samsung Life Insurance Co Lt South Korea Financials 15,176 76.4
LHC SJ Life Healthcare Group Holdin South Africa Health Care 2,655 51.1
601668 C1 China State Construction -A China Industrials 36,018 77.0
8299 TT Phison Electronics Corp Taiwan Information Technology 1,496 72.0
CMPC CC Empresas Cmpc Sa Chile Materials 8,324 58.0
RDF SJ Redefine Properties Ltd South Africa Real Estate 3,896 65.6
ISA CX Interconexion Electrica Sa Colombia Utilities 4,836 76.0
MAXIS MK Maxis Bhd Malaysia Communication Services 10,049 34.3
MM IS Mahindra & Mahindra Ltd India Consumer Discretionary 12,190 47.5
600887 C1 Inner Mongolia Yili Indus-A China Consumer Staples 19,856 33.7
ROSN RX Rosneft Oil Co Pjsc Russia Energy 67,904 32.6
DHBK QD Doha Bank Qpsc Qatar Financials 1,918 35.0
2196 HK Shanghai Fosun Pharmaceuti-H China Health Care 9,197 42.8
2610 TT China Airlines Ltd Taiwan Industrials 1,860 27.2
2337 TT Macronix International Taiwan Information Technology 1,153 36.2
UTCEM IS Ultratech Cement Ltd India Materials 14,312 26.1
817 HK China Jinmao Holdings Group China Real Estate 5,056 32.4
GAIL IS Gail India Ltd India Utilities 10,439 29.3 Source: MSCI, Bloomberg, Renaissance Capital
Brazil manages to have three companies at the top of their sectors with Tim Participacoes, Lojas Renner and Natura Cosmeticos. South Africa boasts two companies at the top of their respective sectors (Life Healthcare and Redefine Properties), as does Korea.

Renaissance Capital XX January 2019
ESG
Renaissance Capital 14 January 2019
ESG
59
Armed with our ESG scores, we can also look at selected financial and valuation characteristics of high-scoring ESG stocks:
Figure 74: Top/bottom EM ESG scores by sector
Top quintile 2nd quintile 3rd quintile 4th quintile Bottom quintile Sample median Top vs bottom
quintile
Non-financials
RoE (5yr average) 17.4 14.8 12.1 11.9 9.8 12.9 7.6
Debt to equity (5yr average) 61.8 69.0 65.1 72.8 69.0 69.0 -7.2
Assets to equity (5yr average) 2.4 2.5 2.3 2.4 2.3 2.4 0.1
EBITDA margin (5yr average) 21.2 21.2 22.7 23.6 19.7 21.6 1.5
Revenue growth (5yr average) 4.5 2.6 3.0 2.5 2.8 3.2 1.7
Debt to EBITDA (5yr average) 1.1 1.4 1.3 1.9 2.0 1.5 -0.9
12M fwd P/E (current) 15.4 14.7 15.4 13.1 12.4 13.8 3.1
12M fwd div yield (current) 2.9 3.6 3.4 3.6 4.1 3.6 -1.3
EV/EBITDA (current) 11.0 9.3 7.7 7.4 7.3 8.4 3.7
MktCap, $bn (current) 9.6 15.6 11.9 10.5 11.1 11.5 -1.5
Financials
RoE (5yr average) 10.4 9.6 11.2 12.2 9.8 11.4 0.7
12M fwd P/E (current) 10.0 8.6 9.2 9.2 9.1 9.9 0.9
12M fwd div yield (current) 5.8 4.6 4.9 4.3 5.4 5.2 0.4
P/B (current) 1.2 0.9 1.0 1.1 0.8 1.3 0.4
MktCap, $bn (current) 16.7 14.4 10.2 11.4 7.9 21.7 8.8 Source: MSCI, Bloomberg, Renaissance Capital
High-scoring non-financial ESG stocks tend to have higher RoE, higher revenue growth, higher margins, lower leverage (on debt/equity and net debt/EBITDA), and higher valuations on 12-month forward P/E and EV to 12-month forward EBITDA basis; they also tend to be smaller in market cap (with the caveat that the variation in the top quintile is considerable). For financial stocks, top-scoring companies show higher RoE, higher valuations on 12M forward P/E and trailing P/B, and higher dividend yields; they also tend to be larger in market cap.
What about the change?
Our first test of ESG’s ability to outperform relied on taking ESG scores based on data from 2013-2014, using these data to create composite scores and portfolios, then comparing the performance of top and bottom quintiles for each factor. We can also look at the performance of companies that improved their ESG rating.
Figure 75: Change in ESG performance across MSCI ACWI, $
Note: Equal-weighted total return of portfolios formed by ranking stocks by the change in score and taking the average of each quintile, then comparing the top quintile with the bottom quintile
Source: MSCI, Bloomberg, Renaissance Capital
-20
-15
-10
-5
0
5
10
15
20
25
RenCap ESG Score RenCap E RenCap S RenCap G
Performance: Top quintile vs bottom quintile (2014-date, total return, $)

Renaissance Capital XX January 2019
ESG
Renaissance Capital 14 January 2019
ESG
60
Overall, companies that improved their ESG rating outperformed only marginally. Breaking things down further, we find that companies that improved their environmental ratings outperformed, while companies that improved their governance ratings underperformed.
What could explain this pattern? For the underperformance of changes in governance, a big part of this could be our relatively short window – changes in the structure of the board, or executive compensation, or ownership structure may not have an immediately positive outcome on the share price, as investors need time to understand the new system; furthermore, there could also be an adverse selection problem, as companies are more likely to change governance structures as part of a larger restructuring or in response to regulatory or legal problems (which are not usually positive for shareholder returns).
As for why companies with improving environmental scores should outperform, perhaps this should be expected, given the attention that has been placed on reducing emissions in recent years. A closer investigation shows that the companies that saw the least amount of emissions reduction per dollar of sales were in energy sectors – this is perhaps unsurprising given the fall in energy prices since 2014. Assuming a constant relationship between volume of output and emissions, a halving of the price would lead to a doubling of emissions per sales (of course, the reality is more complicated than this, so the relationship may be weaker), so perhaps the outperformance of companies with improving environmental scores could also reflects the underperformance of energy vs financials, IT and healthcare (which have seen the most improvement in emissions per dollar of sales).
What metrics were most important?
There are almost as many ESG metrics to choose from as there are providers. For our analysis, we chose 10 indicators that are simple, measurable and unambiguous, allowing them to be applicable across a wide variety of sectors and markets.
For environmental, we focused on greenhouse gas emissions per dollar of revenues. For social, we looked at the percentage of women in the workforce, the ratio of women in management to women employees (the insight being that if a company could employ women as the majority of its workforce but have no female managers), employee turnover, employee unionisation (while unions are not an unambiguously positive force, companies which employ union members would be more likely to take issues of worker compensation and safety more seriously than otherwise), and lost time incident rate (reflecting the frequency of worker safety incidents). For governance, we chose state ownership (as many companies with a high degree of state ownership have historically been associated with corruption and the pursuit of political goals), board size (with the idea being that large boards are often associated with cronyism, while a smaller board can more effectively supervise and safeguard shareholder rights), the percentage of independent directors on the board, and ISS governance scores.
Carrying out a similar procedure for testing the overall ESG scores, we looked at portfolios formed by ranking each of these metrics, and compared the performance of the top-scoring quintile to the bottom-scoring quintile.

Renaissance Capital XX January 2019
ESG
Renaissance Capital 14 January 2019
ESG
61
Figure 76: Performance of top quintile minus bottom quintile, $
Note: Equal-weighted total return of portfolios formed by ranking stocks by each variable and taking the average of each quintile, then comparing the top quintile with the bottom quintile
Source: MSCI, Bloomberg, Renaissance Capital
The best-performing variable (in terms of the largest gap between the top and bottom quintile) was government ownership: companies with low degrees of government ownership significantly outperformed companies with high shares owned by the state. Almost as effective were companies with small boards vs companies with large boards, followed by the ratio of women managers to employees, suggesting that focus on these areas is key for investors. Unionisation of employees did not result in outperformance – this is partly to be expected, as a greater share of company profits going to labour would tend to mean a lower return to capital, while simply focusing on the percentage of women employees did not, in and of itself, outperform.
Of course, this is only one approach. The SASB highlights the following issues as ones that companies should focus on, and have developed a ‘materiality map’ (see Appendix A) highlighting which issues are likely to be material for which sectors.
Figure 77: SASB sustainability topics and issues
Source: SASB
-20
-10
0
10
20
30
40
Gov
enrm
ent
owne
rshi
p
Boa
rd S
ize
Wom
enem
ploy
ees
tom
anag
emen
t rat
io
Inde
pend
ent
dire
ctor
s, %
ISS
sco
re
GH
G/r
even
ue
Em
ploy
eetu
rnov
er, %
Lost
tim
ein
cide
nt r
ate
Wom
enem
ploy
ees
%
Em
ploy
ees
unio
nise
d %
Performance, top quintile - bottom quintile

Renaissance Capital XX January 2019
ESG
Renaissance Capital 14 January 2019
ESG
62
The ‘science’ behind the scores
Perhaps a better title for this would be ‘the method behind the madness’. To construct our ESG scores, we took an initial sample of 2,791 stocks across MSCI DM and MSCI EM, then collected data on 24 separate metrics from 2013 to date. From there, we pared the database down to our chosen 10 metrics. In choosing our metrics, we went for the most widely available metrics that exhibited high correlation to the metrics that were less comprehensive – e.g. for environmental, GHG emissions to sales had a high correlation to other measures of environmental performance, but covered vastly more companies. Where possible, we dealt with missing values through a combination of imputation using regressions with sub-industry level dummies. We then normalised the variables to transform to lie on the interval (0-100).
With our final set of metrics obtained, we constructed two scores: the first to gauge the absolute performance of a company, the second to judge the performance of a company against its sector peers. We then combined these into a single score, then further aggregated the scores on each metric into a composite score, giving us a final ESG ranking. To construct the country scores, we took the average for each metric then applied the same normalisation as for stocks, the idea being that the country’s score is proxied by the average performance of its companies. To avoid issues of small sample bias, we calculated country averages only for countries with at least five companies with data per category.
To measure the performance of each factor, we first sorted all the stocks that had data into quintiles, then took the average performance of each quintile. Finally, we measured the difference between the top quintile’s performance and that of the bottom quintile, the idea being to capture the outperformance of stocks that score ‘well’ on our metrics vs stocks that score ‘poorly’.
Full quintile performance for each variable is available below:
Figure 78: Metric performance by quintile, $
Variable Type Top
quintile 2nd
quintile 3rd
quintile 4th
quintile Bottom quintile
Performance, top quintile -
bottom quintile
Government ownership (lower = "better") G 73.1 86.2 91.3 43.9 37.1 36.0
Board Size (lower = better) G 72.8 54.9 57.9 46.4 39.0 33.8
Women Employees to Management Ratio (higher = better) S 58.2 37.0 34.2 49.7 32.1 26.2
Independent Directors, % (higher = "better") G 67.6 49.3 46.3 53.6 58.5 9.1
ISS (lower = "better") G 49.1 53.4 49.3 47.5 44.0 5.1
GHG/Revenue (lower = "better") E 48.7 49.5 41.2 38.8 44.1 4.6
Employee Turnover, % (lower = "better") S 33.5 42.6 29.7 29.7 30.7 2.8
Lost Time Incident Rate (lower = "better") S 41.2 46.5 36.4 39.1 47.0 -5.7
Women Employees % (higher = "better") S 41.8 51.0 40.0 40.7 48.6 -6.8
Employees Unionized % (higher = "better") S 51.3 29.8 33.0 57.3 62.4 -11.0 Source: MSCI, Bloomberg, Renaissance Capital
How do our scores compare with those of other providers? Not well. Our score has a 16% correlation with Robeco ESG scores, and a 12% correlation with Sustainalytics ESG scores.

Renaissance Capital XX January 2019
ESG
Renaissance Capital 14 January 2019
ESG
63
Figure 79: RenCap ESG score vs Robeco ESG score
Source: Bloomberg, Robeco, Renaissance Capital
That said, this is perhaps not a real surprise. According to the Government Pension Investment Fund of Japan, two of the largest ESG rating and index providers, MSCI and FTSE, exhibit very low correlation between their scores:
Figure 80: FTSE ESG ranking vs MSCI ESG ranking, Japanese rated universe
Source: GPIF
0
10
20
30
40
50
60
70
80
90
100
0 10 20 30 40 50 60 70 80 90 100
RenCap ESG vs Robeco ESG

Renaissance Capital XX January 2019
ESG
Renaissance Capital 14 January 2019
ESG
64
History of ESG
ESG in one form or another has been with us for at least 3,500 years. Jewish law saw that ownership brought with it not only rights but responsibilities as an owner. Later, the Koran established guidelines to prevent exploitative gains – or usury – and ruled out investment in alcohol, pork, gambling and gold. By the eighteenth century, Methodists and Quakers were rejecting the slave trade, as well as investment in liquor, tobacco and gambling.
The 1960s saw campaigners opposed to the Vietnam war putting pressure on university endowments to divest from investments in the defence sector. The 1980s saw companies exposed to apartheid South Africa come under pressure to exit, while ecological disasters such as Bho Pal, Chernobyl and Exxon Valdez triggered greater environmental awareness. By the nineties onwards, corporate scandals such as Polly Peck, BCCI International, Enron, Tyco, WorldCom, Satyam, Olympus and Tesco added greater focus on corporate governance. In the 2000s, the gig economy, data protection, the impact of globalisation (as well as the aftershocks of the global financial crisis) have been added to the mix.
The first public offering of a socially-screened investment fund was the Pioneer fund, launched in Boston in 1928, which avoided investments in alcohol, tobacco and gambling companies on religious criteria. Political developments during the sixties led to the first modern 'ethical' fund, the PAX fund, launched in 1971 to exclude investments related to the Vietnam War (including manufacturers of Agent Orange). The Dreyfus Third Century Fund opened a year later, in 1972, to invest in companies that “show evidence in the conduct of their business, relative to other companies in the same industry or industries, of contributing to the enhancement of the quality of life in America.” Still by 1985, it was estimated that only $55mn of AuM in the US were invested under SRI. In the UK, Charles Jacob, an investment manager for the Methodist Church, tried to launch the UK's first ethical unit trust in 1973, which he named 'Stewardship'. Regulatory approval was refused several times, but the fund was finally launched by Friends Provident in 1984. By 2000, all UK pension funds were required to disclose their policies on social, environmental and ethical investing, and from October 2019, trustees who choose to disregard ESG will have to explain why this does not jeopardise investment returns. EU law requires all companies with over 500 companies to report on their policies in relation to environmental protection, social responsibility and treatment of employees, respect for human rights, anti-corruption and bribery, as well as diversity on company boards (in terms of age, gender, educational and professional background). In the US, 85% of S&P 500 companies are now providing ESG disclosure, up from just 20% in 2011. Some of the world’s largest pools of capital, including the $1.5trn Government Pension Investment Fund of Japan, the $1trn Norway Government Pension Fund, the $490bn Dutch ABP and the $350bn California Public Employees Retirement System (CalPERS) are now invested within an ESG framework.
Globally, the 2004 publication of Who Cares Wins by the UN Global Compact acted as a springboard for ESG: in 2005, former UN Secretary General Kofi Annan, wrote to over 50 CEOs of major financial institutions to create an initiative, launched in 2006 as the UN Principles for Responsible Investment (UN PRI). PRI now has over 1,900 signatories representing $82trn of assets. Signatories undertake to incorporate ESG in to their investment processes, be active owners, seek ESG disclosure from companies in which they invest, promote ESG, boost the effectiveness of ESG and report on ESG principles.
More lately, there have been moves to institutionalise and form standards and best practices around ESG. GRI was set up in 1997 and pioneered sustainable reporting standards, claiming that of the 92% of the world’s largest corporates that report their sustainability performance, 74% use GRI standards. The International Integrated Reporting Council (IIRC) is a global coalition of regulators, investors, companies,
ESG appendix A

Renaissance Capital XX January 2019
ESG
Renaissance Capital 14 January 2019
ESG
65
standard setters, the accounting profession and NGOs setting standards for integrated reporting (a concise communication about how an organisation’s strategy, governance, performance and prospects, in the context of its external environment, lead to the creation of value in the short, medium and long term). The SASB was set up in 2011 and maintains sustainability accounting standards for 79 industries in 10 sectors (on average there are five topics and 13 metrics per sector, based on the definition of ‘materiality’ outlined by US securities law).
Figure 81: SASB Summary Materiality Map
Dimension General issue category
Co
nsu
mer
go
od
s
Ext
ract
ives
& m
iner
als
pro
cess
ing
Fin
anci
als
Fo
od
& b
ever
age
Hea
lth
car
e
Infr
astr
uct
ure
Ren
ewab
le r
eso
urc
es &
al
tern
ativ
e en
erg
y
Res
ou
rce
tran
sfo
rmat
ion
Ser
vice
s
Tec
hn
olo
gy
&
com
mu
nic
atio
ns
Tra
nsp
ort
atio
n
Environment GHG emissions Air quality Energy management Water & wastewater management Waste & hazardous materials management Ecological impacts
Social capital Human rights & community relations Customer privacy Data security Access & affordability Product quality & safety Customer welfare Selling practices & product labelling
Human capital Labour practices Employee health & safety Employee engagement, diversity & inclusion
Business model & innovation Product design & lifecycle management Business model resilience Supply chain management Materials sourcing & efficiency Physical impacts of climate change
Leadership & governance Business ethics Competitive behaviour Management of the legal & regulatory environment Critical incident risk management Systemic risk management Issue unlikely to be material
Issue likely to be material for < 50% of companies
Issue likely to be material for >50% of companies
For the detailed map covering 79 industries click here Source: Sustainable Accounting Standards Board

Renaissance Capital XX January 2019
ESG
Renaissance Capital 14 January 2019
ESG
66
MSCI
▪ MSCI ESG research was launched in 2010, via MSCI's acquisition of RiskMetrics, which included sustainability pioneers KLD, Innovest and IRRC.
▪ MSCI has over 170 research analysts rating over 6,400 companies (11,800 total issuers including subsidiaries) and more than 400,000 fixed-income securities globally.
▪ 37 data points are assessed using thousands of data points, focused on the intersection between a company’s core business and the industry issues that can create significant financial risks and opportunities for the company.
▪ Companies are rated on a AAA-CCC scale relative to the standards and performance of their industry peers.
▪ MSCI ESG Research is used by 46 of the top 50 asset managers and over 1,200 investors worldwide and forms the basis of MSCI's 1,000 Equity and Fixed Income ESG indices.
Sustainalytics
▪ Sustainalytics was formed in 2008 from the consolidation of DSR, Scores and AIS
▪ Sustainalytics’ ESG Risk Ratings universe covers 9,000 public and private companies and will expand to over 10,000 companies in early 2019. Morningstar acquired a 40% stake in 2017.
▪ ESG ratings are categorised across five risk levels: negligible, low, medium, high and severe. Ratings scale is from 0-100, with 100 being the most severe. Nearly 40 industry-specific indicators are designed to give investors a stronger signal into company performance.
ISS
▪ ISS was founded in 1985 to provide informed proxy voting and governance advisory services.
▪ In addition to ISS's governance service, February 2018 saw the launch of the Environmental & Social QualityScore, a new component of its analysis, initially covering 1,500 companies most exposed to ESG lists, with 3,500 additional companies. E&S QualityScore encompasses 380 environmental and social factors (of which at least 240 apply to each industry group).
▪ Scoring ranges from 10 (highest) to 0 (lowest) for aggregate Environment and Social, as well as sub-issues.
Bloomberg
▪ Bloomberg collects ESG data for almost 9,500 companies in 83 countries (and executive compensation data for 5,600 companies in 69 countries).
▪ Integration into Bloomberg terminal provides ease of access, terminal also provides access to RobecoSAM rank, ISS QualityScore, Sustainalytics Rank and CDP climate score.
▪ Scoring 1-100, with 900 ESG indicators in total, 15,000 subscribers
ESG appendix B – ESG providers

Renaissance Capital XX January 2019
ESG
Renaissance Capital 14 January 2019
ESG
67
Figure 82: Responsible and ethical investment spectrum
Source: Responsible Investment Association Australia

Renaissance Capital XX January 2019
ESG
Renaissance Capital 14 January 2019
ESG
68
RenCap’s ESG country scores consist of both absolute and sector adjusted scores. Below, we show both of these scores for each ESG category:
Figure 83: ESG scores by country
Environmental Social Governance Overall
Absolute Sector-relative Absolute Sector-relative Absolute Sector-relative Overall
Netherlands 91% 89% 74% 71% 98% 98% 87%
Finland 48% 96% 88% 79% 95% 95% 84%
Israel 93% 46% 91% 91% 70% 70% 77%
UK 89% 91% 47% 50% 73% 75% 71%
Norway 52% 76% 97% 100% 45% 48% 70%
Sweden 100% 83% 38% 53% 61% 66% 67%
Korea 74% 54% 79% 94% 50% 45% 66%
Switzerland 72% 93% 29% 29% 84% 84% 65%
Australia 46% 63% 53% 44% 93% 91% 65%
Brazil 54% 72% 82% 74% 52% 52% 64%
South Africa 83% 59% 65% 65% 55% 57% 64%
Spain 65% 78% 85% 76% 36% 36% 63%
Singapore 87% 50% 41% 35% 80% 82% 62%
US 59% 74% 32% 38% 82% 80% 61%
Germany 67% 87% 59% 59% 41% 41% 59%
Italy 76% 80% 76% 47% 32% 34% 58%
France 78% 98% 56% 68% 23% 23% 57%
Denmark 85% 100% 18% 15% 66% 61% 57%
Belgium 80% 48% 71% 62% 20% 20% 50%
Canada 35% 57% 26% 21% 77% 77% 49%
Taiwan 43% 15% 94% 97% 18% 18% 48%
Ireland 57% 61% 0% 0% 75% 73% 44%
Greece 15% 7% 100% 82% 14% 14% 39%
Chile 28% 70% 6% 6% 57% 59% 38%
Malaysia 33% 13% 68% 88% 9% 9% 37%
Russia 20% 30% 62% 85% 11% 11% 37%
Turkey 61% 35% 21% 41% 30% 32% 36%
Mexico 41% 26% 9% 12% 59% 64% 35%
Japan 70% 67% 15% 32% 7% 7% 33%
Philippines 9% 0% 44% 24% 48% 55% 30%
Thailand 2% 22% 50% 56% 5% 2% 23%
Hong Kong 0% 39% 24% 18% 27% 27% 22%
Indonesia 13% 20% 12% 9% 39% 39% 22%
China 4% 24% 35% 26% 16% 16% 20%
India 17% 17% 3% 3% 25% 25% 15% Source: MSCI, Bloomberg, Renaissance Capital
ESG appendix C – Detailed country scores

Renaissance Capital XX January 2019
ESG
Renaissance Capital 14 January 2019
ESG
69
Figure 84: Top/bottom 10 EM stocks by ESG scores
Ticker Name Country Sector MktCap, $mn Top/Bottom 10 EM
stocks on RenCap ESG E score S score G score
NATU3 BS Natura Cosmeticos Sa Brazil Consumer Staples 4,708 80.1 97.0 61.5 81.7
LREN3 BS Lojas Renner S.A. Brazil Consumer Discretionary 7,212 78.3 83.5 62.8 88.5
601668 C1 China State Construction -A China Industrials 36,012 77.0 97.5 68.3 65.3
032830 KP Samsung Life Insurance Co Lt South Korea Financials 15,170 76.4 74.7 65.4 89.0
ISA CX Interconexion Electrica Sa Colombia Utilities 4,777 76.0 97.2 76.4 54.4
BSAN CC Banco Santander Chile Chile Financials 14,473 75.7 72.3 64.5 90.4
SANB11 BS Banco Santander Brasil-Unit Brazil Financials 41,991 73.8 92.7 55.4 73.2
8299 TT Phison Electronics Corp Taiwan Information Technology 1,495 72.0 88.7 59.0 68.3
LPPF IJ Matahari Department Store Tb Indonesia Consumer Discretionary 1,036 71.9 83.5 68.1 64.0
DELTA TB Delta Electronics Thai Pcl Thailand Information Technology 2,629 71.8 60.2 85.9 69.3
817 HK China Jinmao Holdings Group China Real Estate 5,056 32.4 0.8 68.0 28.5
SMGR IJ Semen Indonesia Persero Tbk Indonesia Materials 4,862 32.2 0.7 59.3 36.4
TITK GA Titan Cement Co. S.A. Greece Materials 1,890 31.8 1.1 49.3 44.9
002380 KP Kcc Corp South Korea Industrials 2,655 31.1 12.4 31.4 49.4
SIME MK Sime Darby Berhad Malaysia Industrials 3,738 30.3 17.3 39.8 33.7
2002 TT China Steel Corp Taiwan Materials 12,119 30.1 11.4 53.8 25.0
ACEM IS Ambuja Cements Ltd India Materials 5,695 29.7 3.2 41.3 44.5
GAIL IS Gail India Ltd India Utilities 10,481 29.3 45.5 8.8 33.6
2610 TT China Airlines Ltd Taiwan Industrials 1,859 27.2 4.0 62.9 14.6 Source: MSCI, Bloomberg, Renaissance Capital
Figure 85: Top/bottom EM ESG scores by sector
Ticker Name Country Sector MktCap, $mn Top/Bottom 10 EM
stocks on RenCap ESG E score S score G score
TIMP3 BS Tim Participacoes Sa Brazil Communication Services 7,324 64.5 72.4 62.0 59.2
LREN3 BS Lojas Renner S.A. Brazil Consumer Discretionary 7,195 78.3 83.5 62.8 88.5
NATU3 BS Natura Cosmeticos Sa Brazil Consumer Staples 4,697 80.1 97.0 61.5 81.7
010950 KP S-Oil Corp South Korea Energy 10,630 57.3 36.8 61.7 73.5
032830 KP Samsung Life Insurance Co Lt South Korea Financials 15,176 76.4 74.7 65.4 89.0
LHC SJ Life Healthcare Group Holdin South Africa Health Care 2,655 51.1 26.8 48.6 77.9
601668 C1 China State Construction -A China Industrials 36,018 77.0 97.5 68.3 65.3
8299 TT Phison Electronics Corp Taiwan Information Technology 1,496 72.0 88.7 59.0 68.3
CMPC CC Empresas Cmpc Sa Chile Materials 8,324 58.0 55.9 30.0 88.1
RDF SJ Redefine Properties Ltd South Africa Real Estate 3,896 65.6 51.9 82.3 62.7
ISA CX Interconexion Electrica Sa Colombia Utilities 4,836 76.0 97.2 76.4 54.4
MAXIS MK Maxis Bhd Malaysia Communication Services 10,049 34.3 17.0 59.4 26.5
MM IS Mahindra & Mahindra Ltd India Consumer Discretionary 12,190 47.5 40.9 31.1 70.4
600887 C1 Inner Mongolia Yili Indus-A China Consumer Staples 19,856 33.7 23.2 33.8 44.1
ROSN RX Rosneft Oil Co Pjsc Russia Energy 67,904 32.6 23.3 50.8 23.8
DHBK QD Doha Bank Qpsc Qatar Financials 1,918 35.0 55.0 20.1 29.8
2196 HK Shanghai Fosun Pharmaceuti-H China Health Care 9,197 42.8 13.6 60.2 54.5
2610 TT China Airlines Ltd Taiwan Industrials 1,860 27.2 4.0 62.9 14.6
2337 TT Macronix International Taiwan Information Technology 1,153 36.2 11.3 59.6 37.9
UTCEM IS Ultratech Cement Ltd India Materials 14,312 26.1 2.2 29.6 46.6
817 HK China Jinmao Holdings Group China Real Estate 5,056 32.4 0.8 68.0 28.5
GAIL IS Gail India Ltd India Utilities 10,439 29.3 45.5 8.8 33.6 Source: MSCI, Bloomberg, Renaissance Capital
ESG appendix D – Full ESG breakdown for top/bottom EM companies

Renaissance Capital XX January 2019
ESG
Renaissance Capital 14 January 2019
ESG
70
Figure 86: Top/bottom 10 EM stocks by ESG scores
Ticker Name Country Sector MktCap, $mn Top/Bottom 10 EM
stocks on RenCap ESG E score S score G score
CLS SJ Clicks Group Ltd South Africa Consumer Staples 3,424 66.3 57.9 59.8 81.4
RDF SJ Redefine Properties Ltd South Africa Real Estate 4,042 65.6 51.9 82.3 62.7
AKBNK TI Akbank T.A.S. Turkey Financials 5,412 62.4 67.0 56.0 64.2
MIL PW Bank Millennium Sa Poland Financials 2,969 61.8 61.2 70.4 53.8
LBH SJ Liberty Holdings Ltd South Africa Financials 2,217 61.7 89.5 46.7 49.0
SLM SJ Sanlam Ltd South Africa Financials 13,031 56.8 89.5 30.3 50.6
GARAN TI Turkiye Garanti Bankasi Turkey Financials 6,127 56.7 59.1 52.8 58.3
ATT PW Grupa Azoty Sa Poland Materials 949 56.1 51.5 74.7 42.0
MRP SJ Mr Price Group Ltd South Africa Consumer Discretionary 4,822 54.6 38.2 65.6 60.2
TBS SJ Tiger Brands Ltd South Africa Consumer Staples 3,624 54.5 37.6 60.7 65.2
FAB DH First Abu Dhabi Bank Pjsc UAE Financials 42,545 39.8 61.2 30.4 28.0
LTS PW Grupa Lotos Sa Poland Energy 4,583 39.3 35.7 34.3 48.0
VTBR RX Vtb Bank Pjsc Russia Financials 6,796 37.6 61.2 37.9 13.6
TKG SJ Telkom Sa Soc Ltd South Africa Communication Services 2,420 37.1 17.1 57.9 36.2
SAHOL TI Haci Omer Sabanci Holding Turkey Financials 2,723 36.9 3.1 43.7 63.9
KGH PW Kghm Polska Miedz Sa Poland Materials 4,933 36.5 32.1 26.5 50.9
DHBK QD Doha Bank Qpsc Qatar Financials 1,833 35.0 55.0 20.1 29.8
KCHOL TI Koc Holding As Turkey Industrials 6,732 33.5 17.3 44.2 39.0
ROSN RX Rosneft Oil Co Pjsc Russia Energy 67,906 32.6 23.3 50.8 23.8 Source: MSCI, Bloomberg, Renaissance Capital
ESG appendix E – Full ESG breakdown for top/bottom EM EMEA companies

Renaissance Capital XX January 2019
ESG
Renaissance Capital 14 January 2019
ESG
71
Using our five-factor framework, we look at which markets screen best and worst over 2019. In EM, Egypt, Greece, Mexico, South Africa and Brazil screen best, while Pakistan, Chile, Indonesia, Korea and Thailand screen worst. In Frontier, Nigeria and Kazakhstan screen best, while Pakistan and Bangladesh screen worst.
Figure 87: Model scores – EM
Source: IMF, Bruegel, MSCI, Bloomberg, Renaissance Capital
Figure 88: Model scores – Frontier
Source: IMF, Bruegel, MSCI, Bloomberg, Renaissance Capital
Renaissance Capital’s five-factor framework looks at: 1) growth acceleration; 2) lending acceleration; 3) currency valuation; 4) interest rate changes; and 5) credit rating changes. These factors have been associated with outperformance over the past 23 years. Below, we look at each factor to see where countries rank on each component.
Where is the growth (accelerating)?
Figure 89: EM 2019-2018 real GDP growth differential, ppts
Source: IMF, Bruegel, MSCI, Bloomberg, Renaissance Capital
Figure 90: FM 2019-2018 real GDP growth differential, ppts
Source: IMF, Bruegel, MSCI, Bloomberg, Renaissance Capital
In EM, Brazil is set to see the strongest growth acceleration over 2019 with real GDP growth rising to 2.4% from 1.4% (according to the IMF) over 2018; Colombia and the UAE are also forecast to have strong accelerations, with Colombia growing at 3.6% (vs 2.8%) and the UAE’s growth at 3.7% (vs 2.9%). Turkey, Pakistan and Poland are forecast to have the worst growth slowdowns: for Turkey 2019 growth is expected to be 0.4% (vs estimated 2018 growth of 3.5%); Pakistan will see growth fall to 4.0% (vs 5.8%); while Poland will see growth of 3.5% (vs 4.4%).
In Frontier, Oman, Kuwait and Argentina show the strongest growth accelerations: Oman is forecast to grow at 5.0% over 2019 (vs 1.9% over 2018); Kuwait is expected to grow at
-4
-3
-2
-1
0
1
2
3
4
5
Egy
ptM
exic
oG
reec
eS
outh
Afr
ica
Bra
zil
Cze
ch R
epub
licR
ussi
aU
AE
Sau
di A
rabi
aP
hilip
pine
sC
olom
bia
Mal
aysi
aP
eru
Qat
arP
olan
dT
aiw
anIn
dia
Tur
key
Hun
gary
Chi
naT
haila
ndK
orea
Indo
nesi
aC
hile
Pak
ista
n
2019 score (ex-EMEA) 2019 score (EMEA+Pakistan)
-4
-3
-2
-1
0
1
2
Nig
eria
Kaz
akhs
tan
Kuw
ait
Arg
entin
a
Mor
occo
Sri
Lank
a
Ken
ya
Om
an
Vie
tnam
Rom
ania
Jord
an
Geo
rgia
Pak
ista
n
Ban
glad
esh
2019 score (Frontier+Pakistan)
-3.5
-3.0
-2.5
-2.0
-1.5
-1.0
-0.5
0.0
0.5
1.0
1.5
Bra
zil
Col
ombi
aU
AE
Sou
th A
fric
aM
exic
oG
reec
eS
audi
Ara
bia
Egy
ptIn
dia
Qat
arP
hilip
pine
sP
eru
Cze
ch R
epub
licIn
done
sia
Mal
aysi
aK
orea
Tai
wan
Chi
naR
ussi
aC
hile
Hun
gary
Tha
iland
Pol
and
Pak
ista
nT
urke
y
2019 - 2018 real GDP growth differential, ppts
-3.0
-2.0
-1.0
0.0
1.0
2.0
3.0
4.0
Om
an
Kuw
ait
Arg
entin
a
Sri
Lank
a
Nig
eria
Jord
an
Sau
di A
rabi
a
Ken
ya
Mor
occo
Kaz
akhs
tan
Vie
tnam
Ban
glad
esh
Geo
rgia
Rom
ania
Pak
ista
n
2019 - 2018 real GDP growth differential, ppts
Take five

Renaissance Capital XX January 2019
ESG
Renaissance Capital 14 January 2019
ESG
72
4.1% (vs 2.3%); while Argentina sees a relative acceleration, with 2019’s contraction expected to be just 1.6% vs the 2.6% contraction estimated for 2018. On the other end of the spectrum, Pakistan is set to see the worst slowdown among the expanded Frontier countries – i.e. MSCI Frontier plus Georgia and Pakistan – with growth of 4.0% vs 5.8%. Romania will see growth fall to 3.4% (from 3.9%) while Georgia will see growth fall to 4.8% from 5.2%.
Where is the lending (accelerating)?
Figure 91: EM lending growth differential, ppts
Source: IMF, Bruegel, MSCI, Bloomberg, Renaissance Capital
Figure 92: FM lending growth differential, ppts
Source: IMF, Bruegel, MSCI, Bloomberg, Renaissance Capital
Turning to lending growth, Brazil, Egypt and Greece are forecast to see the largest lending accelerations over 2019 in EM. Lower interest rates and a recovering economy are the main drivers of the lending acceleration in Brazil, while Egypt should benefit from disinflation; for Greece, while lending is still contracting, the relative movement is upwards, giving a positive credit impulse. On the other end of the spectrum, Pakistan, Turkey and India are set to see the greatest slowdowns in lending as interest rate hikes, currency weakness and issues around banking sector NPLs take their toll.
In Frontier, Kenya, Kuwait and Romania should see lending growth pick up over 2018, while Pakistan, Bangladesh, Argentina and Georgia Senegal will see lending growth slow.
What about the currency?
Figure 93: EM REERs vs long-term averages (high = overvalued)
Source: IMF, Bruegel, MSCI, Bloomberg, Renaissance Capital
Figure 94: EM REERs vs long-term averages (high = overvalued)
Source: IMF, Bruegel, MSCI, Bloomberg, Renaissance Capital
-10%
-8%
-6%
-4%
-2%
0%
2%
4%
6%
8%
Bra
zil
Egy
ptG
reec
eP
eru
Cze
ch R
epub
licS
audi
Ara
bia
UA
EP
olan
dS
outh
Afr
ica
Col
ombi
aT
haila
ndM
alay
sia
Kor
eaQ
atar
Hun
gary
Rus
sia
Mex
ico
Phi
lippi
nes
Tai
wan
Indo
nesi
aC
hina
Chi
leIn
dia
Tur
key
Pak
ista
n
2019 - 2018 lending growth differential, ppts
-10%
-8%
-6%
-4%
-2%
0%
2%
4%
6%
Ken
ya
Kuw
ait
Rom
ania
Mor
occo
Kaz
akhs
tan
Om
an
Nig
eria
Vie
tnam
Jord
an
Sri
Lank
a
Geo
rgia
Arg
entin
a
Ban
glad
esh
Pak
ista
n
2019 - 2018 lending growth differential, ppts
0.6
0.7
0.8
0.9
1.0
1.1
1.2
Indi
aP
hilip
pine
sP
eru
Col
ombi
aC
hile
Hun
gary
Indo
nesi
aP
olan
dR
ussi
aP
akis
tan
Bra
zil
Gre
ece
Tai
wan
Mal
aysi
aS
outh
Afr
ica
Egy
ptM
exic
oT
urke
yC
hina
Cze
ch r
epub
licU
AE
Qat
arT
haila
ndS
audi
Ara
bia
Kor
ea
These countries have large externalsurpluses/high levels of reserves, so REER
valuation less important
0.6
0.7
0.8
0.9
1.0
1.1
1.2
1.3
Ban
glad
esh
Jord
an
Ken
ya
Om
an
Nig
eria
Rom
ania
Sri
Lank
a
Geo
rgia
Mor
occo
Pak
ista
n
Arg
entin
a
Kaz
akhs
tan
Vie
tnam
Kuw
ait
Sau
di A
rabi
a
These countries have large externalsurpluses/high levels of reserves, so
REER valuation less important

Renaissance Capital XX January 2019
ESG
Renaissance Capital 14 January 2019
ESG
73
Focusing on currency valuation, we see that India, the Philippines and Peru have the most expensive currencies in EM, while Turkey, Mexico and Egypt have the cheapest. For this measure, we tend to exclude countries which have large C/A surpluses and/or high levels of reserves (e.g. China, the Gulf countries), as REERs can be significantly above long-term averages in these countries for very long periods of time without any adjustment taking place on the exchange rate.
In Frontier, Bangladesh, Jordan and Kenya screen worst on currency valuation, while Kazakhstan, Argentina and Pakistan and Nigeria screen best. For Kenya, we note that this partly reflects issues in inflation calculation before 2010; using just the post-2010 data, the Kenyan shilling closer to fair value (though this is an admittedly short window).
Where might rates be falling?
Figure 95: EM Interest rate changes: 1 = 50 bpts or more of rate cuts, -1 = 50 bpts or more of rate hikes
Source: IMF, Bruegel, MSCI, Bloomberg, Renaissance Capital
Figure 96: EM Interest rate changes: 1 = 50 bpts or more of rate cuts, -1 = 50 bpts or more of rate hikes
Source: IMF, Bruegel, MSCI, Bloomberg, Renaissance Capital
Our work on interest rate cuts showed that both direction and magnitude are important: small hikes or cuts (i.e. less than 50 bpts) do not show a substantial link with market performance, while large movements do. With this in mind, Egypt, Turkey and Mexico should see the largest interest rate cuts (i.e. 50 bpts or more) over 2019; Brazil and Pakistan are expected to have the largest rate hikes (more than 150 bpts), and a further 10 EM countries (Colombia, Chile, Peru, Thailand, Saudi Arabia, Korea, Indonesia, UAE, Hungary and Qatar) are expected to hike rates by more than 50 bpts over the year. The rest of EM is expected to see moderate interest rate changes.
In Frontier, Argentina, Kazakhstan, and Nigeria are expected to see rate cuts over 2019; while Pakistan, Bangladesh, Romania, and Jordan are expected to see the steepest rate increases.
-1
0
1
Egy
ptT
urke
yM
exic
oC
zech
Rep
ublic
Pol
and
Sou
th A
fric
aG
reec
eC
hina
Indi
aM
alay
sia
Phi
lippi
nes
Tai
wan
Rus
sia
Qat
arH
unga
ryU
AE
Indo
nesi
aK
orea
Sau
di A
rabi
aT
haila
ndP
eru
Chi
leC
olom
bia
Pak
ista
nB
razi
l
2019
-1
0
1A
rgen
tina
Kaz
akhs
tan
Nig
eria
Mor
occo
Ken
ya
Vie
tnam
Sri
Lank
a
Geo
rgia
Kuw
ait
Om
an
Jord
an
Rom
ania
Pak
ista
n
Ban
glad
esh
2019

Renaissance Capital XX January 2019
ESG
Renaissance Capital 14 January 2019
ESG
74
Who’s getting a (credit) upgrade?
(This section is adapted from Thoughts from a Renaissance man – Reclaiming ESG in EM and FM, 19 October 2018)
Figure 97: EM credit rating changes (1 = upgrade, -1 = downgrade)
Source: IMF, Bruegel, MSCI, Bloomberg, Renaissance Capital
Figure 98: Frontier credit rating changes (1 = upgrade, -1 = downgrade)
Source: IMF, Bruegel, MSCI, Bloomberg, Renaissance Capital
We have seen upgrades for Poland (reversing that slightly surprising downgrade in January 2016), Greece and the Czechia this year. We expect no further change in Poland, but expect upgrades for Greece, Hungary and the Czech Republic by the end of 2019. Russia has been upgraded in 2018 and given the two positive outlooks on the rating, and the determination to run twin surpluses to make it bulletproof to sanctions risk, we assume another upgrade is likely by end-2019. We also expect another upgrade in Egypt too.
Qatar we wrongly expected to be downgraded in 2018. Instead two of its three negative outlooks have been taken off. We assume no change, albeit with downside risk. We assume no change in the UAE.
SA is where we are particularly uncertain. Weak growth is clearly a negative, but the effort to get corruption under control particularly in the SoEs is a positive. We assume the rating agencies will wait until after the 2019 elections to make a call on this, and providing President Cyril Ramaphosa can deliver reform, the country should keep its investment grade rating.
The negative story in Emerging Europe is obviously Turkey, which has been downgraded by all agencies this year, and where two negative outlooks and high contingent liabilities mean we expect at least one other downgrade by end-2019.
We expect at least one downgrade in Pakistan, even if it does a deal with the IMF.
FM sovereign ratings
We are pretty unadventurous going into 2019. We assume upgrades in Croatia and Lithuania, after upgrades to Slovenia and Estonia in 2018. We assume a downgrade from S&P for Argentina.
We are more ambitious in the CIS. Aside from Russia, we think upgrades are possible in Georgia and Ukraine (by Moody’s, but elections may delay this).
We assume Saudi support and high oil prices has stopped the downgrade cycle in the Gulf.
-1
0
1
Egy
ptR
ussi
aC
zech
Rep
ublic
Hun
gary
Gre
ece
Pol
and
Sou
th A
fric
aQ
atar
UA
EC
hina
Indi
aIn
done
sia
Kor
eaM
alay
sia
Phi
lippi
nes
Tai
wan
Tha
iland
Bra
zil
Chi
leC
olom
bia
Mex
ico
Per
uS
audi
Ara
bia
Tur
key
Credit rating changes (1 = upgrade, -1 = downgrade)
-1
0
1
Kaz
akhs
tan
Mor
occo
Ken
ya
Kuw
ait
Om
an
Vie
tnam
Jord
an
Nig
eria
Rom
ania
Ban
glad
esh
Sri
Lank
a
Geo
rgia
Arg
entin
a
Pak
ista
n
Credit rating changes (1 = upgrade, -1 = downgrade)

Renaissance Capital XX January 2019
ESG
Renaissance Capital 14 January 2019
ESG
75
What might be priced in?
Plotting the model score vs 2018 YtD performance, we can get a sense of what may already be priced in. Ideally we would want to find high-scoring markets that have fared badly this year, while avoiding low scoring markets that have done well. Greece, South Africa and Mexico screen best for this in EM, while Qatar screens worst.
Figure 99: EM performance vs scores
Source: IMF, Bruegel, MSCI, Bloomberg, Renaissance Capital
In Frontier, Argentina screens best on this measure, while Romania screens worst.
Figure 100: FM performance vs scores
Source: IMF, Bruegel, MSCI, Bloomberg, Renaissance Capital
EgyptMexico
Greece
South Africa
Brazil
Czech RepublicRussia
UAE
Saudi Arabia
PhilippinesColombia
Malaysia
Peru
Qatar
PolandTaiwan
India
Turkey
Hungary
China
Thailand
Korea
Indonesia
Chile
Pakistan
-50
-40
-30
-20
-10
0
10
20
30
-4 -3 -2 -1 0 1 2 3 4 5
YtD performance ($) vs Model score - EM
Nigeria
Kazakhstan
Kuwait
Argentina
Morocco
Sri Lanka
Kenya
Oman
Vietnam
RomaniaJordan
Pakistan
Bangladesh
-60
-50
-40
-30
-20
-10
0
10
20
-4 -3 -2 -1 0 1 2
YtD performance ($) vs Model score - Frontier

Renaissance Capital XX January 2019
ESG
Renaissance Capital 14 January 2019
ESG
76
Conclusion – EMEA to see a good year?
Figure 101: EM regional scores
Source: IMF, Bruegel, MSCI, Bloomberg, Renaissance Capital
Aggregating the scores by region, we see EMEA scores best in 2019, followed by LatAm, with Asia screening worst. Our last iteration of the model suggested LatAm would outperform; since then, LatAm has beaten MSCI EM by 15.8% while EMEA and Asia have both underperformed. We look forward to seeing if the model’s success holds out into 2019.
The scores from the model are one component of our country recommendations, which also look at less quantitative issues.
Looking for the risks
Of course, it’s not just about the good news. Using Renaissance Capitals’s risk score – which combines several vulnerability metrics: C/A, budget balance, FX overvaluation (for those countries with a C/A deficit), short-term debt to FX reserves, external debt to GDP and recent real credit growth – we can screen which countries investors might want to avoid if the market environment goes sour.
Figure 102: RenCap ‘risk score’ – EM (high = more risky)
Source: IMF, Renaissance Capital
Figure 103: RenCap ‘risk score’ – FM (high = more risky)
Source: IMF, Renaissance Capital
Overleaf, we present the components of the overall score (which we calculate by normalising each variable and summing them to get an overall score. Scores are measured within a universe – e.g. the EM risk score measures risk relative to other EM countries, while for Frontier it is measured relative to other Frontier countries).
-2.0
-1.5
-1.0
-0.5
0.0
0.5
1.0
1.5
2.0
EM
EA
LatA
M
Asi
a
Regional scores - 2018 data
0.0
0.5
1.0
1.5
2.0
2.5
3.0
3.5
4.0
4.5
Pak
ista
nIn
dia
Indo
nesi
aS
outh
Afr
ica
Col
ombi
aM
alay
sia
Chi
leH
unga
ryP
olan
dT
urke
yP
hilip
pine
sE
gypt
Qat
arM
exic
oG
reec
eB
razi
lP
eru
Cze
ch R
epub
licC
hina
UA
ET
aiw
anT
haila
ndK
orea
Rus
sia 0.0
0.5
1.0
1.5
2.0
2.5
3.0
3.5
4.0
Arg
entin
a
Mau
ritiu
s
Ken
ya
Tun
isia
Sri
Lank
a
Jord
an
Leba
non
Om
an
Sen
egal
Ivor
y C
oast
Ban
glad
esh
Rom
ania
Lith
uani
a
Mor
occo
Ser
bia
Vie
tnam
Kaz
akhs
tan
Nig
eria
Est
onia
Slo
veni
a
Cro
atia
Sau
di A
rabi
a
Kuw
ait

Renaissance Capital XX January 2019
ESG
Renaissance Capital 14 January 2019
ESG
77
Figure 104: RenCap risk score – underlying data
C/A balance,
2019E Budget balance,
2019E FX valuation,
current ST debt to
reserves, latest External debt to
GDP, latest Real credit growth,
% YoY, latest Score*
Pakistan -5.3 -6.9 0.95 73% 31% 12% 4.3 India -2.5 -6.5 1.14 26% 19% 8% 3.8 Indonesia -2.4 -1.8 1.01 41% 35% 7% 3.6 South Africa -3.5 -4.5 0.88 75% 45% 1% 3.6 Colombia -2.4 -2.1 0.98 29% 37% 5% 3.4 Malaysia 2.3 -2.6 0.91 107% 67% 6% 3.3 Chile -2.7 -1.9 1.02 45% 59% 5% 3.3 Hungary 2.1 -2.0 0.99 56% 95% 6% 3.1 Poland -1.3 -1.5 0.98 45% 66% 3% 3.1 Turkey -1.4 -5.1 0.71 158% 64% -17% 3.0 Philippines -1.5 -1.4 1.11 17% 22% 9% 2.9 Egypt -2.4 -7.9 0.86 30% 37% -4% 2.9 Qatar 6.6 10.5 1.11 173% 66% 13% 2.8 Mexico -1.3 -2.5 0.79 28% 37% 7% 2.7 Greece -0.4 0.0 0.94 na 211% -6% 2.7 Brazil -1.6 -8.0 0.93 16% 34% -3% 2.6 Peru -2.2 -2.4 1.07 16% 29% 2% 2.6 Czech Republic -0.9 1.1 1.15 66% 80% 4% 2.6 China 0.7 -4.4 1.16 36% 14% 10% 2.4 UAE 7.5 1.3 1.12 138% 83% 2% 2.2 Taiwan 13.6 -1.9 0.94 42% 34% 4% 1.7 Thailand 8.1 -0.5 1.11 28% 31% 5% 1.3 Korea 4.7 1.5 1.05 32% 27% 5% 1.3 Russia 5.2 1.8 0.97 14% 31% 5% 0.9 Bahrain -2.3 -8.2 1.04 697% 144% 9% 4.7 Jordan -8.6 -3.5 1.19 96% 69% 6% 4.6 Georgia -10.2 -1.6 0.99 76% 104% 19% 4.2 Mauritius -10.4 -3.5 1.10 80% 1434% -12% 4.1 Tunisia -8.5 -3.7 0.68 142% 79% 6% 4.0 Lebanon -25.5 -10.5 1.17 26% 81% -1% 4.0 Sri Lanka -2.7 -3.6 1.01 86% 58% 14% 3.9 Kenya -5.3 -5.8 1.19 58% 27% -2% 3.5 Bangladesh -2.7 -4.5 1.27 38% 19% 9% 3.4 Romania -3.4 -3.5 1.06 44% 48% 2% 3.0 Vietnam 2.0 -4.7 1.23 55% 36% 12% 2.9 Ivory Coast -4.2 -3.0 1.00 na 28% 8% 2.8 Serbia -5.6 -0.2 0.95 64% 35% 6% 2.8 Oman -0.5 0.8 1.09 43% 71% 6% 2.6 Argentina -3.2 -2.6 0.78 101% 55% -11% 2.5 Senegal -7.1 -3.0 0.93 na 48% 0% 2.5 Morocco -4.5 -3.0 0.98 31% 43% 1% 2.3 Lithuania 0.0 0.8 1.15 na 78% 4% 2.0 Nigeria 1.0 -4.5 1.09 36% 12% -10% 2.0 Slovenia 5.5 -0.1 0.98 na 92% 0% 1.9 Kazakhstan 0.2 1.4 0.79 47% 89% -13% 1.8 Estonia 1.1 -0.3 1.15 na 78% -3% 1.7 Croatia 2.3 0.2 0.99 23% 78% 0% 1.3 Kuwait 11.0 12.1 1.18 43% 34% 2% 1.0 Saudi Arabia 8.8 -1.7 1.09 12% 25% -3% 0.7
Note: Score is relative to peer group Source: Bloomberg
Twin-deficit countries pose the worst risks, according to our score. Pakistan screens as the riskiest market in EM, thanks to high twin deficits – its C/A deficit is the worst in EM – and still-high real credit growth. India’s C/A is in better shape than Pakistan’s, but its budget deficit is still high and the exchange rate is overvalued on an REER basis (and unlike China, it does not have a C/A surplus or high levels of reserves). Indonesia, South Africa and Colombia also screen poorly. On the other end of the scale, Russia screens best thanks to its twin surpluses, low levels of short-term debt to reserves, modest real credit growth and a fairly low external debt burden; Korea has a similar profile, though with a slightly expensive currency. Thailand, Taiwan and the UAE also screen well. Back in May, Turkey screened as the most-risky country; the currency correction and C/A rebalancing now put it on a middling level of risk, though we remain wary of the high level of short-term debt relative to reserves. Egypt has also de-risked substantially, thanks to a narrowing of its twin deficits.

Renaissance Capital XX January 2019
ESG
Renaissance Capital 14 January 2019
ESG
78
In Frontier, Bahrain screens as the riskiest country, with short-term debt standing at almost seven times reserves (though we note that Bahrain could probably count on support from some of its GCC partners if reserves proved insufficient), high budget deficit and high external debt burden. Jordan’s twin deficits and overvalued currency make it the second-riskiest country on our score, while Georgia comes third, thanks to its high C/A deficit and external debt (though we note that financial centres, such as Georgia and Mauritius and Lebanon, can often maintain C/A deficits and debt levels that above what would normally be considered risky). On the other end of the spectrum, Saudi Arabia, Kuwait and Croatia screen as least risky, thanks to C/A surpluses and modest levels of short-term debt to reserves.
Comparing our five-factor model with our risk score, we can get a sense of which countries look best on a risk-adjusted basis:
Figure 105: Model scores vs risk scores
Source: IMF, Bruegel, MSCI, Bloomberg, Renaissance Capital
If EM does get a dose of the jitters, these graphs may prove useful:
Figure 106: EM external debt to GDP, latest (capped at 200%)
Source: JEDH, IMF, Renaissance Capital
Figure 107: Frontier external debt to GDP, latest (capped at 200%)
Source: JEDH, IMF, Renaissance Capital
Egypt
Greece Mexico
South AfricaBrazil
Czech RepublicUAE
ColombiaSaudi ArabiaMalaysiaPhilippinesPeru Qatar Poland
Russia
TaiwanIndiaTurkey
HungaryChinaThailand
KoreaIndonesia
Chile
Pakistan
NigeriaKazakhstan
Kenya
ArgentinaKuwait
Sri LankaMorocco
OmanVietnam
JordanRomania Georgia
BangladeshPakistan
-4
-3
-2
-1
0
1
2
3
4
5
0.0 0.5 1.0 1.5 2.0 2.5 3.0 3.5 4.0 4.5 5.0
Fiv
e-fa
ctor
sco
re
Risk score
Five-factor score vs risk score
0%
20%
40%
60%
80%
100%
120%
140%
160%
180%
200%
Gre
ece
Hun
gary
UA
EC
zech
Rep
ublic
Mal
aysi
aP
olan
dQ
atar
Tur
key
Chi
leS
outh
Afr
ica
Col
ombi
aM
exic
oE
gypt
Indo
nesi
aB
razi
lT
aiw
anT
haila
ndR
ussi
aP
akis
tan
Per
uK
orea
Phi
lippi
nes
Indi
aC
hina 0%
20%
40%
60%
80%
100%
120%
140%
160%
180%
200%
Mau
ritiu
sB
ahra
inS
love
nia
Kaz
akhs
tan
Leba
non
Tun
isia
Est
onia
Lith
uani
aC
roat
iaO
man
Jord
anS
ri La
nka
Arg
entin
aS
eneg
alR
oman
iaM
oroc
coV
ietn
amS
erbi
aK
uwai
tIv
ory
Coa
stK
enya
Ban
glad
esh
Nig
eria
Geo
rgia
Ukr
aine
Gha
naU
gand
aR
wan
daZ
ambi
aT
anza
nia
Sau
di A
rabi
aZ
imba
bwe

Renaissance Capital XX January 2019
ESG
Renaissance Capital 14 January 2019
ESG
79
Figure 108: EM private credit to GDP (%) and 5yr chg (ppts)
Source: IMF, Renaissance Capital
Figure 109: FM private credit to GDP (%) and 5yr chg (ppts)
Source: IMF, Renaissance Capital
Figure 110: Foreign ownership of government debt and bonds, selected EM and Frontier
Source: IMF; Renaissance Capital
Figure 111: EM C/A and budget balances (brackets = weight in index), 19E
Source: IMF, Renaissance Capital
Figure 112: ‘Fragile five’ C/A balances
Source: IMF, Renaissance Capital
-40%
-30%
-20%
-10%
0%
10%
20%
30%
40%
0%
20%
40%
60%
80%
100%
120%
140%
160%
180%
200%
Tai
wan
Kor
eaC
hina
Mal
aysi
aT
haila
ndQ
atar
Gre
ece
UA
EC
hile
Sou
th A
fric
aR
ussi
aT
urke
yC
zech
Rep
ublic
Phi
lippi
nes
Bra
zil
Pol
and
Col
ombi
aIn
dia
Hun
gary
Per
uIn
done
sia
Egy
ptM
exic
oP
akis
tan
Private credit to GDP (%) 5yr change (ppts) (RHS)
-50%
-40%
-30%
-20%
-10%
0%
10%
20%
30%
40%
50%
0%
20%
40%
60%
80%
100%
120%
140%
160%
180%
200%
Vie
tnam
Leba
non
Mau
ritiu
sM
oroc
coB
ahra
inK
uwai
tT
unis
iaJo
rdan
Om
anE
ston
iaC
roat
iaS
ri La
nka
Slo
veni
aB
angl
ades
hLi
thua
nia
Ser
bia
Sen
egal
Ivor
y C
oast
Kaz
akhs
tan
Rom
ania
Ken
yaN
iger
iaA
rgen
tina
Geo
rgia
Sau
di A
rabi
aU
krai
neG
hana
Rw
anda
Uga
nda
Tan
zani
aZ
ambi
a
Private credit to GDP (%) 5yr change (ppts) (RHS)
0%
10%
20%
30%
40%
50%
60%
70%
80%
90%
Lith
uani
a
Latv
ia
Indo
nesi
a
Per
u
Ukr
aine
Uru
guay
Col
ombi
a
Rom
ania
Mex
ico
Arg
entin
a
Pol
and
Bul
garia
Tur
key
Sou
th A
fric
a
Phi
lippi
nes
Hun
gary
Chi
le
Egy
pt
Mal
aysi
a
Rus
sia
Tha
iland
Bra
zil
Indi
a
Chi
na
Percent of total debt Percent of total LC securities
-10
-5
0
5
10
15
Tai
wan
(11
.3%
)T
haila
nd (
2.4%
)U
AE
(0.
7%)
Qat
ar (
1.1%
)R
ussi
a (3
.7%
)K
orea
(14
.0%
)M
alay
sia
(2.4
%)
Hun
gary
(0.
3%)
Chi
na (
31.1
%)
Gre
ece
(0.3
%)
Cze
ch R
epub
lic (
0.2%
)M
exic
o (2
.6%
)P
olan
d (1
.2%
)T
urke
y (0
.7%
)P
hilip
pine
s (1
.0%
)B
razi
l (7.
5%)
Per
u (0
.4%
)C
olom
bia
(0.4
%)
Indo
nesi
a (2
.2%
)E
gypt
(0.
1%)
Indi
a (9
.0%
)C
hile
(1.
1%)
Sou
th A
fric
a (6
.3%
)P
akis
tan
(0.1
%)
Current account balance (%GDP) Budget
-8
-6
-4
-2
0
Tur
key
Sou
th A
fric
a
Indi
a
Bra
zil
Indo
nesi
a
Largest 12M pre/post-taper 2018E
2019E 3%

Renaissance Capital XX January 2019
ESG
Renaissance Capital 14 January 2019
ESG
80
Figure 113: FM C/A and budget balances (brackets = weight in index)
Source: IMF, Renaissance Capital
Figure 114: BF C/A and budget balances
Source: IMF, Renaissance Capital
Figure 115: EM net fuel exports to GDP, 2017 (index weight in brackets)
Source: IMF, Renaissance Capital
Figure 116: FM net fuel exports to GDP, 2017 (index weight in brackets)
Source: IMF, Renaissance Capital
-10
-5
0
5
10
15
Kuw
ait (
22.0
%)
Sau
di A
rabi
aS
love
nia
(1.1
%)
Cro
atia
(1.
6%)
Vie
tnam
(16
.1%
)E
ston
ia (
0.3%
)N
iger
ia (
6.7%
)K
azak
hsta
n (0
.8%
)Li
thua
nia
(0.2
%)
Om
an (
1.6%
)B
ahra
in (
4.2%
)B
angl
ades
h (2
.8%
)S
ri La
nka
(0.2
%)
Arg
entin
a (1
6.3%
)R
oman
ia (
4.6%
)Iv
ory
Coa
st (
0.1%
)M
oroc
co (
8.0%
)K
enya
(4.
9%)
Ser
bia
(1.6
%)
Sen
egal
(0.
7%)
Tun
isia
(0.
7%)
Jord
an (
1.2%
)M
aurit
ius
(2.1
%)
Leba
non
(1.9
%)
Current account balance (%GDP) Budget
-10
-8
-6
-4
-2
0
2
4
6
8
10
Aze
rbai
jan
Iran
Uzb
ekis
tan
Zam
bia
Arm
enia
Ukr
aine
Gha
na
Bel
arus
Taj
ikis
tan
Tan
zani
a
Zim
babw
e
Uga
nda
Rw
anda
Geo
rgia
Current account balance (%GDP) Budget
-10%-5%0%5%
10%15%20%25%30%35%
Qat
ar (
1.1%
)U
AE
(0.
7%)
Rus
sia
(3.7
%)
Col
ombi
a (0
.4%
)M
alay
sia
(2.4
%)
Indo
nesi
a (2
.2%
)B
razi
l (7.
5%)
Sou
th A
fric
a (6
.3%
)P
eru
(0.4
%)
Mex
ico
(2.6
%)
Chi
na (
31.1
%)
Gre
ece
(0.3
%)
Pol
and
(1.2
%)
Cze
ch R
epub
lic (
0.2%
)E
gypt
(0.
1%)
Chi
le (
1.1%
)P
hilip
pine
s (1
.0%
)In
dia
(9.0
%)
Tur
key
(0.7
%)
Hun
gary
(0.
3%)
Pak
ista
n (0
.1%
)K
orea
(14
.0%
)T
haila
nd (
2.4%
)T
aiw
an (
11.3
%)
-20%
-10%
0%
10%
20%
30%
40%
50%
Kuw
ait (
22.0
%)
Om
an (
1.6%
)B
ahra
in (
4.2%
)K
azak
hsta
n (0
.8%
)N
iger
ia (
6.7%
)Iv
ory
Coa
st (
0.1%
)A
rgen
tina
(16.
3%)
Est
onia
(0.
3%)
Rom
ania
(4.
6%)
Ban
glad
esh
(2.8
%)
Vie
tnam
(16
.1%
)S
love
nia
(1.1
%)
Cro
atia
(1.
6%)
Ken
ya (
4.9%
)S
ri La
nka
(0.2
%)
Lith
uani
a (0
.2%
)S
erbi
a (1
.6%
)T
unis
ia (
0.7%
)S
eneg
al (
0.7%
)M
oroc
co (
8.0%
)M
aurit
ius
(2.1
%)
Leba
non
(1.9
%)
Jord
an (
1.2%
)

Renaissance Capital XX January 2019
ESG
Renaissance Capital 14 January 2019
ESG
81
Renaissance Capital’s investment clock shows that we are in a phase of rising inflation and falling activity – phase two of our investment clock, which began in October. Phase two has historically been an intermediate phase, on average lasting six months, though it has occasionally been as short as three months.
In this phase, EM typically underperforms DM, while risks of corrections increase with 5% of months seeing falls of more than 10%, compared to 1% in phase one. Consumer staples, industrials and energy stocks have tended to outperform in this phase, while materials, energy and financials have tended to underperform. By country, Hungary, Pakistan, Czech Republic, the Philippines and Indonesia have tended to outperform EM in this phase, while Korea, Taiwan, Malaysia and Thailand have tended to underperform.
Figure 117: EM and DM in different phases
Source: Bloomberg, Renaissance Capital
Where might we go from here?
The most likely next stop will be phase three – the red phase in Figure 110, which would be triggered if inflation expectations start falling while activity is still slowing. Phase three is particularly bad for EM stocks, and most of the big EM crashes have taken place during phase three. With inflation swap data showing signs of falling (though this is an imperfect indicator of market beliefs about inflation owing to measurement problems around inflation volatility), we should be on the lookout for signs that expectations of future inflation are heading downwards.
0
1
2
3
4
5
6
7
0
50
100
150
200
250
300
350
400
Jan-
95
Jul-9
5
Jan-
96
Jul-9
6
Jan-
97
Jul-9
7
Jan-
98
Jul-9
8
Jan-
99
Jul-9
9
Jan-
00
Jul-0
0
Jan-
01
Jul-0
1
Jan-
02
Jul-0
2
Jan-
03
Jul-0
3
Jan-
04
Jul-0
4
Jan-
05
Jul-0
5
Jan-
06
Jul-0
6
Jan-
07
Jul-0
7
Jan-
08
Jul-0
8
Jan-
09
Jul-0
9
Jan-
10
Jul-1
0
Jan-
11
Jul-1
1
Jan-
12
Jul-1
2
Jan-
13
Jul-1
3
Jan-
14
Jul-1
4
Jan-
15
Jul-1
5
Jan-
16
Jul-1
6
Jan-
17
Jul-1
7
Jan-
18
Jul-1
8
Phase 1 (A ↑, I ↑) Phase 2 (A ↓, I ↑) Phase 3 (A ↓, I ↓) Phase 4 (A ↑, I ↓)MSCI EM MSCI DM Rising dollar Falling dollarYield curve: bull steepen Yield curve: bull flatten Yield curve: bear steepen Yield curve: bear flatten
Cometh the hour…

Renaissance Capital XX January 2019
ESG
Renaissance Capital 14 January 2019
ESG
82
A quick guide on telling the time – RenCap’s investment clock explained
RenCap’s investment clock uses an activity vs inflation approach. We use US inflation expectations data (from the Cleveland Fed) for the inflation component and the US ISM PMI for the activity component; these were chosen as they have a long history, they are forward looking, and released with a short lag relative to the month of interest. Ideally, we would use an EM-focused measure of activity and inflation expectations; however, EM PMI indicators do not have a great deal of history, while reliable measurements of inflation expectations across EM are a relatively new phenomenon (and their reliability is debateable given how thinly traded inflation-linked assets are in most EM markets); moreover, US data are highly correlated with global measures (global cycles tend to move in tandem), so it serves as a reasonable proxy.
Figure 118: The investment clock
Source: Renaissance Capital
Figure 115 shows the ‘times’ of the clock and their interpretation. Starting in phase one, we see activity rising, but little spare capacity in the economy, leading to inflationary pressures; at the same time, rising growth increases demand for inputs, leading to higher commodity prices. Higher inflation leads to rising interest rates as central banks respond, which then causes growth to falter; however, stickiness in inflation keeps it high. Eventually, falling activity leads to contraction and unemployment, with the resulting drop in demand causing prices to fall. Central banks loosen monetary policy and governments spend liberally to stimulate the economy, and thanks to the contraction, there is now plenty of slack to use up, allowing activity to rise without sparking inflationary pressures.
Who does better in each phase?
The table below shows how frequently EM outperforms DM in each phase. We also show how frequently sectors and countries outperform EM in each phase. We also show how frequently we see falls of more than 10% and 20% in a given month, to give some sense of when large drops in EM are most likely.
Figure 119: Correction frequency for EM
Frequency of >10% fall Frequency of >20% fall
Phase 1 1% 0% Phase 2 6% 0% Phase 3 12% 2% Phase 4 4% 0%
Source: MSCI, Bloomberg, Renaissance Capital
Phase 1: rising
inflation, rising activity
Phase 2: rising
inflation, falling activity
Phase 3: falling
inflation, falling activity
Phase 4: falling
inflation, rising activity
Investment clock

Renaissance Capital XX January 2019
ESG
Renaissance Capital 14 January 2019
ESG
83
Some findings:
▪ Overall, EM tends to outperform DM in phases one and four, while underperforming in phases two and three. Corrections of more than 10% are most likely during phases two and three, while falls of more than 20% only occur in phase three.
Figure 120: Performance during different phases
Phase 1 Phase 2 Phase 3 Phase 4
Observations 79 31 83 53 % of time EM outperforms DM 63% 48% 45% 64% % of time Cons. Disc. outperforms EM 53% 56% 48% 59% % of time Cons. Staples outperforms EM 40% 59% 65% 58% % of time Energy outperforms EM 59% 56% 48% 44% % of time Financials outperforms EM 43% 44% 52% 49% % of time Healthcare outperforms EM 52% 44% 66% 51% % of time Industrials outperforms EM 32% 56% 45% 44% % of time IT outperforms EM 59% 44% 52% 51% % of time Materials outperforms EM 45% 38% 47% 56% % of time Real Estate outperforms EM 36% 44% 48% 47% % of time Telecoms outperforms EM 45% 44% 55% 31% % of time Utilities outperforms EM 46% 41% 51% 49%
% of time Brazil outperforms EM 52% 53% 41% 46% % of time Chile outperforms EM 45% 50% 52% 42% % of time China outperforms EM 45% 53% 52% 42% % of time Colombia outperforms EM 54% 47% 50% 59% % of time Czech Republic outperforms EM 49% 59% 57% 37% % of time Egypt outperforms EM 58% 53% 53% 37% % of time Greece outperforms EM 43% 47% 46% 46% % of time Hungary outperforms EM 54% 62% 54% 53% % of time India outperforms EM 51% 50% 46% 51% % of time Indonesia outperforms EM 46% 56% 55% 51% % of time Korea outperforms EM 53% 38% 43% 61% % of time Malaysia outperforms EM 48% 41% 45% 49% % of time Mexico outperforms EM 51% 53% 56% 53% % of time Pakistan outperforms EM 46% 59% 48% 47% % of time Peru outperforms EM 49% 47% 57% 58% % of time Philippines outperforms EM 37% 56% 53% 54% % of time Poland outperforms EM 58% 47% 44% 41% % of time Russia outperforms EM 59% 50% 47% 56% % of time South Africa outperforms EM 46% 50% 54% 49% % of time Taiwan outperforms EM 48% 38% 43% 53% % of time Thailand outperforms EM 49% 44% 52% 61% % of time Turkey outperforms EM 51% 50% 49% 54%
Source: MSCI, Bloomberg, Renaissance Capital
▪ In phase one, activity and inflation expectations are rising, a positive environment for commodities and high-growth sectors. IT and energy tend to outperform, while industrials and real estate lag. By country, Russia, Poland, and Egypt are more often outperformers, while the Philippines, Greece, Chile and China are less frequent outperformers.
▪ In phase two, activity is slowing while inflation expectations are rising; part of this is high commodity prices pushing up input costs and forcing firms to raise prices, hurting demand. Low-margin or highly commodity-dependent sectors suffer while less elastic sectors tend to do better; hence consumer staples, industrials and energy tend to outperform, while materials lag. Hungary, Pakistan and Czech Republic are the most frequent outperformers, with Hungary outperforming over 60% of the time. Korea, Taiwan and Malaysia are the least frequent outperformers – indeed, Korea and Taiwan underperform over 60% of the time.
▪ In phase 3, inflation expectations fall while activity falls. This typically coincides with a slowdown or a recession, meaning defensive sectors such as healthcare and consumer staples outperform – healthcare beats EM two-thirds of the time. Industrials and materials tend to underperform. Peru, Czech Republic and
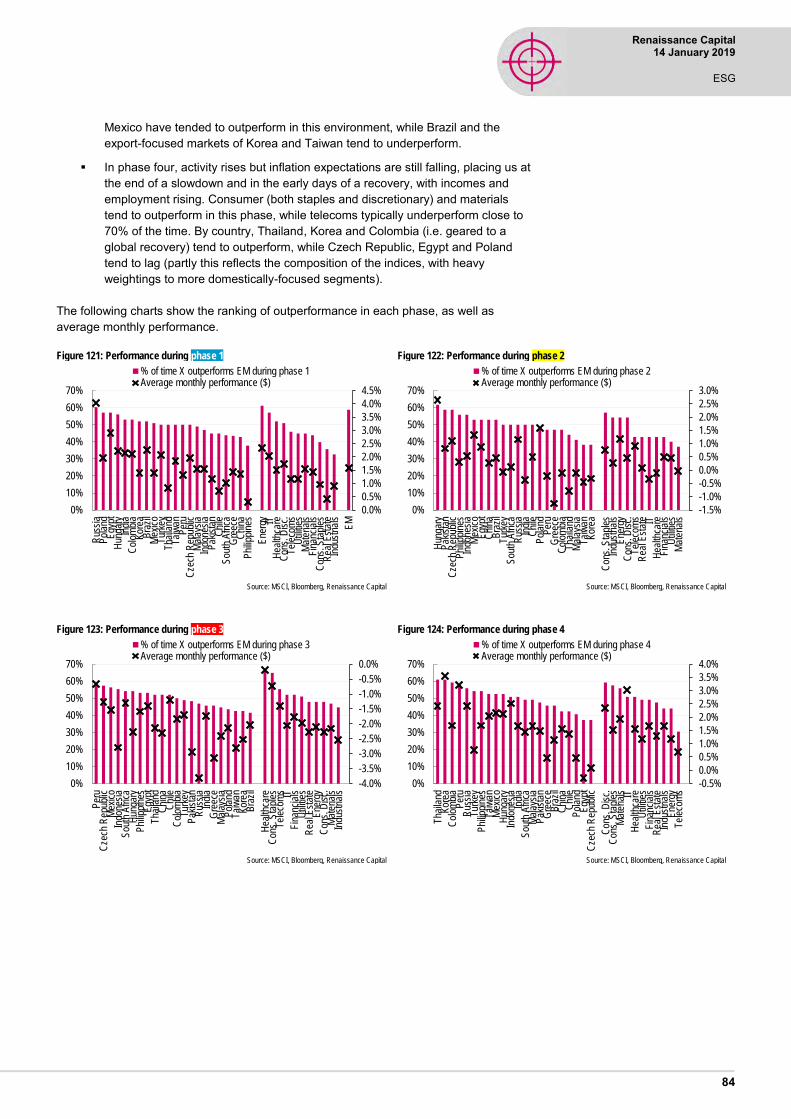
Renaissance Capital XX January 2019
ESG
Renaissance Capital 14 January 2019
ESG
84
Mexico have tended to outperform in this environment, while Brazil and the export-focused markets of Korea and Taiwan tend to underperform.
▪ In phase four, activity rises but inflation expectations are still falling, placing us at the end of a slowdown and in the early days of a recovery, with incomes and employment rising. Consumer (both staples and discretionary) and materials tend to outperform in this phase, while telecoms typically underperform close to 70% of the time. By country, Thailand, Korea and Colombia (i.e. geared to a global recovery) tend to outperform, while Czech Republic, Egypt and Poland tend to lag (partly this reflects the composition of the indices, with heavy weightings to more domestically-focused segments).
The following charts show the ranking of outperformance in each phase, as well as average monthly performance.
Figure 121: Performance during phase 1
Source: MSCI, Bloomberg, Renaissance Capital
Figure 122: Performance during phase 2
Source: MSCI, Bloomberg, Renaissance Capital
Figure 123: Performance during phase 3
Source: MSCI, Bloomberg, Renaissance Capital
Figure 124: Performance during phase 4
Source: MSCI, Bloomberg, Renaissance Capital
0.0%
0.5%
1.0%
1.5%
2.0%
2.5%
3.0%
3.5%
4.0%
4.5%
0%
10%
20%
30%
40%
50%
60%
70%
Rus
sia
Pol
and
Egy
ptH
unga
ryIn
dia
Col
ombi
aK
orea
Bra
zil
Mex
ico
Tur
key
Tha
iland
Tai
wan
Per
uC
zech
Rep
ublic
Mal
aysi
aIn
done
sia
Pak
ista
nC
hile
Sou
th A
fric
aG
reec
eC
hina
Phi
lippi
nes
Ene
rgy IT
Hea
lthca
reC
ons.
Dis
c.T
elec
oms
Util
ities
Mat
eria
lsF
inan
cial
sC
ons.
Sta
ples
Rea
l Est
ate
Indu
stria
ls
EM
% of time X outperforms EM during phase 1Average monthly performance ($)
-1.5%
-1.0%
-0.5%
0.0%
0.5%
1.0%
1.5%
2.0%
2.5%
3.0%
0%
10%
20%
30%
40%
50%
60%
70%
Hun
gary
Pak
ista
nC
zech
Rep
ublic
Phi
lippi
nes
Indo
nesi
aM
exic
oE
gypt
Chi
naB
razi
lT
urke
yS
outh
Afr
ica
Rus
sia
Indi
aC
hile
Pol
and
Per
uG
reec
eC
olom
bia
Tha
iland
Mal
aysi
aT
aiw
anK
orea
Con
s. S
tapl
esIn
dust
rials
Ene
rgy
Con
s. D
isc.
Tel
ecom
sR
eal E
stat
e ITH
ealth
care
Fin
anci
als
Util
ities
Mat
eria
ls
% of time X outperforms EM during phase 2Average monthly performance ($)
-4.0%
-3.5%
-3.0%
-2.5%
-2.0%
-1.5%
-1.0%
-0.5%
0.0%
0%
10%
20%
30%
40%
50%
60%
70%
Per
uC
zech
Rep
ublic
Mex
ico
Indo
nesi
aS
outh
Afr
ica
Hun
gary
Phi
lippi
nes
Egy
ptT
haila
ndC
hina
Chi
leC
olom
bia
Tur
key
Pak
ista
nR
ussi
aIn
dia
Gre
ece
Mal
aysi
aP
olan
dT
aiw
anK
orea
Bra
zil
Hea
lthca
reC
ons.
Sta
ples
Tel
ecom
s ITF
inan
cial
sU
tiliti
esR
eal E
stat
eE
nerg
yC
ons.
Dis
c.M
ater
ials
Indu
stria
ls
% of time X outperforms EM during phase 3Average monthly performance ($)
-0.5%
0.0%
0.5%
1.0%
1.5%
2.0%
2.5%
3.0%
3.5%
4.0%
0%
10%
20%
30%
40%
50%
60%
70%
Tha
iland
Kor
eaC
olom
bia
Per
uR
ussi
aT
urke
yP
hilip
pine
sT
aiw
anM
exic
oH
unga
ryIn
done
sia
Indi
aS
outh
Afr
ica
Mal
aysi
aP
akis
tan
Gre
ece
Bra
zil
Chi
naC
hile
Pol
and
Egy
ptC
zech
Rep
ublic
Con
s. D
isc.
Con
s. S
tapl
esM
ater
ials IT
Hea
lthca
reU
tiliti
esF
inan
cial
sR
eal E
stat
eIn
dust
rials
Ene
rgy
Tel
ecom
s
% of time X outperforms EM during phase 4Average monthly performance ($)
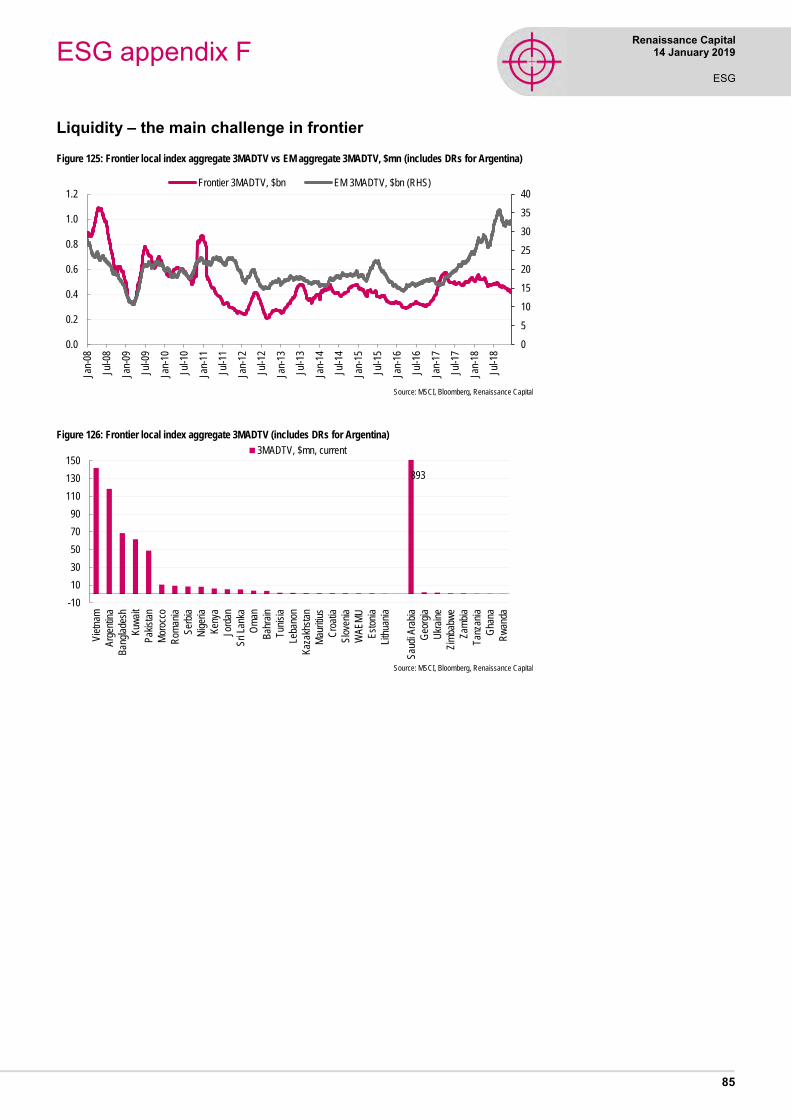
Renaissance Capital XX January 2019
ESG
Renaissance Capital 14 January 2019
ESG
85
Liquidity – the main challenge in frontier
Figure 125: Frontier local index aggregate 3MADTV vs EM aggregate 3MADTV, $mn (includes DRs for Argentina)
Source: MSCI, Bloomberg, Renaissance Capital
Figure 126: Frontier local index aggregate 3MADTV (includes DRs for Argentina)
Source: MSCI, Bloomberg, Renaissance Capital
0
5
10
15
20
25
30
35
40
0.0
0.2
0.4
0.6
0.8
1.0
1.2
Jan-
08
Jul-0
8
Jan-
09
Jul-0
9
Jan-
10
Jul-1
0
Jan-
11
Jul-1
1
Jan-
12
Jul-1
2
Jan-
13
Jul-1
3
Jan-
14
Jul-1
4
Jan-
15
Jul-1
5
Jan-
16
Jul-1
6
Jan-
17
Jul-1
7
Jan-
18
Jul-1
8
Frontier 3MADTV, $bn EM 3MADTV, $bn (RHS)
-10
10
30
50
70
90
110
130
150
Vie
tnam
Arg
entin
a
Ban
glad
esh
Kuw
ait
Pak
ista
n
Mor
occo
Rom
ania
Ser
bia
Nig
eria
Ken
ya
Jord
an
Sri
Lank
a
Om
an
Bah
rain
Tun
isia
Leba
non
Kaz
akhs
tan
Mau
ritiu
s
Cro
atia
Slo
veni
a
WA
EM
U
Est
onia
Lith
uani
a
Sau
di A
rabi
a
Geo
rgia
Ukr
aine
Zim
babw
e
Zam
bia
Tan
zani
a
Gha
na
Rw
anda
3MADTV, $mn, current
893
ESG appendix F

Renaissance Capital XX January 2019
ESG
Renaissance Capital 14 January 2019
ESG
86
Figure 127: Frontier liquidity cascade
Avg. vol ($mn) > 0.1 Avg. vol ($mn) > 0.2 Avg vol ($mn) > 0.5 Avg vol ($mn) > 1 Avg vol ($mn) > 2 Avg vol ($mn) > 5 Avg vol ($mn) > 10
TOTAL 658 TOTAL 534 TOTAL 380 TOTAL 274 TOTAL 150 TOTAL 51 TOTAL 18
Saudi Arabia 166 Saudi Arabia 165 Saudi Arabia 155 Saudi Arabia 124 Saudi Arabia 80 Saudi Arabia 38 Saudi Arabia 12
Pakistan 151 Pakistan 113 Pakistan 66 Vietnam 50 Vietnam 31 Argentina 7 Argentina 5
Vietnam 94 Vietnam 85 Vietnam 65 Pakistan 43 Argentina 12 Vietnam 3 Kuwait 1
Bangladesh 48 Bangladesh 31 Argentina 20 Argentina 15 Pakistan 11 Kuwait 2
Kuwait 40 Kuwait 26 Kuwait 19 Kuwait 12 Kuwait 6 Bahrain 1
Argentina 27 Argentina 24 Bangladesh 13 Bangladesh 7 Bahrain 3
Morocco 20 Romania 16 Romania 10 Romania 4 Romania 2
Romania 17 Morocco 16 Morocco 6 Oman 3 Bangladesh 2
Oman 17 Nigeria 10 Oman 5 Morocco 3 Oman 1
Nigeria 13 Oman 8 Nigeria 4 Bahrain 3 Kenya 1
Bahrain 10 Lebanon 6 Kenya 4 Nigeria 2 Kazakhstan 1
Jordan 9 Jordan 6 Bahrain 4 Kenya 2
Sri Lanka 8 Sri Lanka 5 Mauritius 2 Sri Lanka 1
Lebanon 7 Kenya 5 Lebanon 2 Mauritius 1
Kenya 6 Bahrain 5 Jordan 2 Lebanon 1
Slovenia 4 Kazakhstan 3 Sri Lanka 1 Kazakhstan 1
Croatia 4 Mauritius 2 Kazakhstan 1 Jordan 1
Tunisia 3 Georgia 2 Georgia 1 Georgia 1
Mauritius 3 Croatia 2
Kazakhstan 3 Zambia 1
Zambia 2 Slovenia 1
Georgia 2 Rwanda 1
Tanzania 1 WAEMU 1
Rwanda 1
Estonia 1
WAEMU 1 Source: MSCI, Bloomberg, Renaissance Capital

Renaissance Capital XX January 2019
ESG
Renaissance Capital 14 January 2019
ESG
87
Correlation and Beta
Figure 128: MSCI index rolling 52-week correlations
Source: MSCI, Bloomberg, Renaissance Capital
Figure 129: MSCI EM and Frontier Betas to parent index
Note: Beta to MSCI EM for EM countries and to MSCI Frontier for FM countries. Adjusted Betas winsorised to 2 standard deviations used to filter outliers
Source: MSCI, Bloomberg, Renaissance Capital
-40%
-20%
0%
20%
40%
60%
80%
100%
Jan-
05
Jul-0
5
Jan-
06
Jul-0
6
Jan-
07
Jul-0
7
Jan-
08
Jul-0
8
Jan-
09
Jul-0
9
Jan-
10
Jul-1
0
Jan-
11
Jul-1
1
Jan-
12
Jul-1
2
Jan-
13
Jul-1
3
Jan-
14
Jul-1
4
Jan-
15
Jul-1
5
Jan-
16
Jul-1
6
Jan-
17
Jul-1
7
Jan-
18
Jul-1
8
FM to EM FM to DM EM to DM
0.00.20.40.60.81.01.21.41.61.82.0
Sou
th A
fric
aC
hina
Sou
th K
orea
Pol
and
Tai
wan
Col
ombi
aIn
done
sia
Per
uR
ussi
aG
reec
eT
urke
yB
razi
lC
hile
Hun
gary
Tha
iland
Mex
ico
Indi
aC
zech
Phi
lippi
nes
Mal
aysi
aQ
atar
Egy
ptU
AE
Arg
entin
aN
iger
iaV
ietn
amP
akis
tan
Rom
ania
Kaz
akhs
tan
Mor
occo
Sau
di A
rabi
aLi
thua
nia
Kuw
ait
Bah
rain
Sri
Lank
aS
love
nia
Ken
yaB
angl
ades
hW
AE
MU
Jord
anLe
bano
nE
ston
iaC
roat
iaS
erbi
aT
unis
iaO
man
Mau
ritiu
s
EM
(to
DM
)F
ront
ier
(to
EM
)
52-week Beta 5yr Beta

Renaissance Capital XX January 2019
ESG
Renaissance Capital 14 January 2019
ESG
88
Figure 130: EM correlations
EM DM EMBI spread Brent crude Commodities (ex-Oil) DXY
EM 100% 76% -63% 36% 44% -26%
Brazil 63% 39% -52% 26% 37% -21%
Chile 67% 50% -48% 24% 32% -19%
China 92% 73% -52% 31% 37% -15%
Colombia 62% 47% -53% 54% 49% -21%
Czech 48% 43% -40% 23% 23% -5%
Egypt 15% 21% -15% 16% 17% 2%
Greece 35% 47% -33% 19% 21% 12%
Hungary 42% 43% -32% 6% 8% -2%
India 69% 54% -41% 13% 18% -4%
Indonesia 52% 22% -25% 13% 12% -20%
Malaysia 63% 47% -41% 26% 28% -11%
Mexico 65% 49% -55% 38% 36% -22%
Pakistan 26% 14% -22% 10% 9% -10%
Peru 58% 48% -42% 26% 38% -31%
Philippines 59% 38% -30% 19% 22% -11%
Poland 66% 61% -51% 13% 17% -5%
Qatar 36% 29% -27% 36% 31% -6%
Russia 61% 48% -56% 48% 50% -11%
South Africa 77% 60% -43% 32% 40% -21%
South Korea 82% 73% -54% 27% 33% -16%
Taiwan 82% 67% -50% 26% 32% -9%
Thailand 58% 57% -44% 26% 27% -5%
Turkey 53% 38% -38% 17% 27% -23%
UAE 47% 33% -37% 19% 18% -7% Source: MSCI, Bloomberg, Renaissance Capital
Figure 131: Frontier correlations
Frontier EM EMBI spread Brent crude Commodities (ex-Oil) DXY
Frontier 53% 48% -45% 23% 28% -33%
Argentina 46% 40% -45% 7% 15% -11%
Bahrain 20% 15% -13% 6% 9% -5%
Bangladesh 6% 7% -4% 4% 10% -11%
Croatia 10% 11% -5% -4% -3% 0%
Estonia 18% 12% -9% 0% 11% -14%
Jordan 6% 9% 1% 2% 6% 5%
Kazakhstan 30% 26% -27% 12% 18% -4%
Kenya 8% -3% 9% 5% 2% -25%
Kuwait 22% 25% -23% 20% 14% -3%
Lebanon 11% 12% -15% -6% -7% 16%
Lithuania 27% 27% -19% 3% 5% -14%
Mauritius -2% -2% 7% 4% 3% 1%
Morocco 12% 15% -12% 6% 9% -9%
Nigeria 11% 10% -12% 22% 23% -6%
Oman 9% 8% -18% 23% 21% 1%
Romania 39% 43% -27% 19% 18% -9%
Saudi Arabia 35% 41% -30% 36% 29% 4%
Slovenia 24% 26% -18% 1% 10% -13%
Sri Lanka 18% 11% -4% 9% 4% 3%
Serbia 24% 15% -16% 27% 32% -1%
Tunisia 2% -2% -6% 4% 4% 0%
WAEMU -2% 2% 0% 11% 12% -3%
Vietnam 34% 36% -29% 22% 30% -21% Source: MSCI, Bloomberg, Renaissance Capital

Renaissance Capital XX January 2019
ESG
Renaissance Capital 14 January 2019
ESG
89
Flows and positioning
Figure 132: EM equity fund inflows, $mn
Source: EPFR, Renaissance Capital
Figure 133: Frontier equity fund inflows, $mn (monthly, to 30 November 2018)
Source: EPFR, Renaissance Capital
Figure 134: EM equity fund inflows by fund type (past 52 weeks), $mn
Source: EPFR, Renaissance Capital
Figure 135: Frontier equity fund inflows (past 52 weeks), $mn
Source: EPFR, Renaissance Capital
Figure 136: Frontier AuM, $mn
Source: EPFR, Renaissance Capital
Figure 137: FM fund assets, November 2018
Source: EPFR, Renaissance Capital
-100,000
-80,000
-60,000
-40,000
-20,000
0
20,000
40,000
60,000
80,000
Jan
Feb
Mar
Apr
May Jun
Jul
Aug
Sep Oct
Nov
Dec
2014 2015 2016 2017 2018
-2,500
-2,000
-1,500
-1,000
-500
0
500
1,000
1,500
2,000
2,500
Jan
Feb
Mar
Apr
May Jun
Jul
Aug
Sep Oct
Nov
Dec
2014 2015 2016 2017 2018
-6,000
-4,000
-2,000
0
2,000
4,000
6,000
8,000
10,000
3-Ja
n-18
17-J
an-1
831
-Jan
-18
14-F
eb-1
828
-Feb
-18
14-M
ar-1
828
-Mar
-18
11-A
pr-1
825
-Apr
-18
9-M
ay-1
823
-May
-18
6-Ju
n-18
20-J
un-1
84-
Jul-1
818
-Jul
-18
1-A
ug-1
815
-Aug
-18
29-A
ug-1
812
-Sep
-18
26-S
ep-1
810
-Oct
-18
24-O
ct-1
87-
Nov
-18
21-N
ov-1
85-
Dec
-18
19-D
ec-1
82-
Jan-
19
Non-ETF ETF Total
-1.5
-1.0
-0.5
0.0
0.5
1.0
-150
-100
-50
0
50
100
150
3-Ja
n-18
17-J
an-1
831
-Jan
-18
14-F
eb-1
828
-Feb
-18
14-M
ar-1
828
-Mar
-18
11-A
pr-1
825
-Apr
-18
9-M
ay-1
823
-May
-18
6-Ju
n-18
20-J
un-1
84-
Jul-1
818
-Jul
-18
1-A
ug-1
815
-Aug
-18
29-A
ug-1
812
-Sep
-18
26-S
ep-1
810
-Oct
-18
24-O
ct-1
87-
Nov
-18
21-N
ov-1
85-
Dec
-18
19-D
ec-1
82-
Jan-
19
FM Weekly flows, $mn FM Weekly flows, % of AuM (RHS)
0
5,000
10,000
15,000
20,000
25,000
2003
2004
2005
2006
2007
2008
2009
2010
2011
2012
2013
2014
2015
2016
2017
2018
Global Frontier Regional Frontier in mainstream GEM funds
Global Frontier
47%
Asia25%
Frontier in mainstream GEM funds
15%
EMEA12%
LatAm1%

Renaissance Capital XX January 2019
ESG
Renaissance Capital 14 January 2019
ESG
90
Figure 138: FM funds country OW/UW, November 2018
Note: Based on sample of non-ETF funds benchmarked to MSCI FM.
Source: EPFR, Renaissance Capital
Figure 139: GEM funds country OW/UW, November 2018
Source: EPFR, Renaissance Capital
Figure 140: GEM funds sector OW/UW, November 2018
Note: Based on sample of Non-ETF funds benchmarked to MSCI Emerging Markets Index.
Source: EPFR, Renaissance Capital
Figure 141: Cyclicals vs defensives positioning in active GEM funds, ppts
Note: Based on sample of Non-ETF funds benchmarked to MSCI Emerging Markets Index. Positioning is defined as (weight of sector in fund) – (weight of sector in benchmark index). Cyclicals = Cons. Disc., Financials, Industrials, IT, Materials, Real Estate. Defensives = Cons. Staples, Healthcare, Energy, Telecoms, Utilities.
Source: EPFR, Renaissance Capital
0
5
10
15
20
Kuw
ait
Arg
entin
a
Vie
tnam
Egy
pt
Nig
eria
UA
E
Rom
ania
Kaz
akhs
tan
Ken
ya
Sau
di A
rabi
a
Ban
glad
esh
Mor
occo
Sri
Lank
a
Geo
rgia
Slo
veni
a
Ukr
aine
Pak
ista
n
Leba
non
Bah
rain
Om
an
Tan
zani
a
Zim
babw
e
Cro
atia
Lith
uani
a
Jord
an
Tun
isia
Ser
bia
Sen
egal
Mau
ritiu
s
Ivor
y C
oast
Est
onia
RoW
Cas
h
Underweights (Nov-18) Overweights (Nov-18) Index weights (Nov-18)
0
5
10
15
20
25
30
35
Chi
na
Sou
th K
orea
Indi
a
Bra
zil
Tai
wan
Sou
th A
fric
a
Rus
sia
Indo
nesi
a
Mex
ico
Tha
iland
Oth
er E
quity
Mal
aysi
a
Tur
key
Phi
lippi
nes
Pol
and
Hun
gary
Oth
er E
urop
e
Chi
le
Per
u
Arg
entin
a
UK
UA
E
Egy
pt
Col
ombi
a
Vie
tnam
Gre
ece
Nig
eria
Oth
er A
sia
Qat
ar
Pak
ista
n
Sau
di A
rabi
a
US
A
Cze
ch
Nor
way
Sin
gapo
re
Ken
ya
Pan
ama
Aus
tral
ia
Por
tuga
l
Spa
in
Can
ada
Rom
ania
Aus
tria
Cam
bodi
a
Bel
arus
Ger
man
y
RoW
Cas
h
Underweights (Nov-18) Overweights (Nov-18) Index weights (Nov-18)
0%
5%
10%
15%
20%
25%
30%
Fin
anci
als IT
Con
s. D
isc.
Con
s. S
tapl
es
Mat
eria
ls
Ene
rgy
Indu
stria
ls
Tel
ecom
s
Rea
l Est
ate
Hea
lthca
re
Util
ities
Overweight (Nov-18) Underweight (Nov-18) Index weight (Nov-18)
-5%
-4%
-3%
-2%
-1%
0%
1%
2%
3%
4%
5%
Jan-
07Ju
l-07
Jan-
08Ju
l-08
Jan-
09Ju
l-09
Jan-
10Ju
l-10
Jan-
11Ju
l-11
Jan-
12Ju
l-12
Jan-
13Ju
l-13
Jan-
14Ju
l-14
Jan-
15Ju
l-15
Jan-
16Ju
l-16
Jan-
17Ju
l-17
Jan-
18Ju
l-18
Cyclicals Defensives
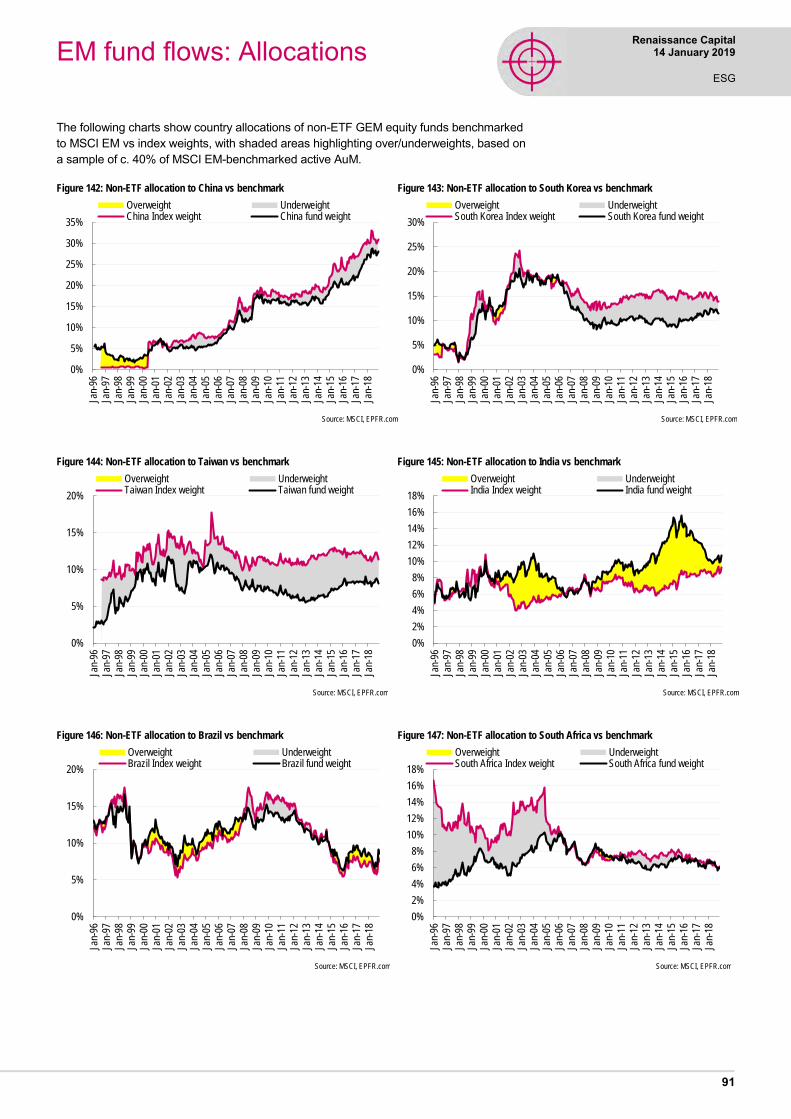
Renaissance Capital XX January 2019
ESG
Renaissance Capital 14 January 2019
ESG
91
The following charts show country allocations of non-ETF GEM equity funds benchmarked to MSCI EM vs index weights, with shaded areas highlighting over/underweights, based on a sample of c. 40% of MSCI EM-benchmarked active AuM.
Figure 142: Non-ETF allocation to China vs benchmark
Source: MSCI, EPFR.com
Figure 143: Non-ETF allocation to South Korea vs benchmark
Source: MSCI, EPFR.com
Figure 144: Non-ETF allocation to Taiwan vs benchmark
Source: MSCI, EPFR.com
Figure 145: Non-ETF allocation to India vs benchmark
Source: MSCI, EPFR.com
Figure 146: Non-ETF allocation to Brazil vs benchmark
Source: MSCI, EPFR.com
Figure 147: Non-ETF allocation to South Africa vs benchmark
Source: MSCI, EPFR.com
0%
5%
10%
15%
20%
25%
30%
35%
Jan-
96Ja
n-97
Jan-
98Ja
n-99
Jan-
00Ja
n-01
Jan-
02Ja
n-03
Jan-
04Ja
n-05
Jan-
06Ja
n-07
Jan-
08Ja
n-09
Jan-
10Ja
n-11
Jan-
12Ja
n-13
Jan-
14Ja
n-15
Jan-
16Ja
n-17
Jan-
18
Overweight UnderweightChina Index weight China fund weight
0%
5%
10%
15%
20%
25%
30%
Jan-
96Ja
n-97
Jan-
98Ja
n-99
Jan-
00Ja
n-01
Jan-
02Ja
n-03
Jan-
04Ja
n-05
Jan-
06Ja
n-07
Jan-
08Ja
n-09
Jan-
10Ja
n-11
Jan-
12Ja
n-13
Jan-
14Ja
n-15
Jan-
16Ja
n-17
Jan-
18
Overweight UnderweightSouth Korea Index weight South Korea fund weight
0%
5%
10%
15%
20%
Jan-
96Ja
n-97
Jan-
98Ja
n-99
Jan-
00Ja
n-01
Jan-
02Ja
n-03
Jan-
04Ja
n-05
Jan-
06Ja
n-07
Jan-
08Ja
n-09
Jan-
10Ja
n-11
Jan-
12Ja
n-13
Jan-
14Ja
n-15
Jan-
16Ja
n-17
Jan-
18
Overweight UnderweightTaiwan Index weight Taiwan fund weight
0%
2%
4%
6%
8%
10%
12%
14%
16%
18%
Jan-
96
Jan-
97
Jan-
98
Jan-
99
Jan-
00
Jan-
01
Jan-
02
Jan-
03
Jan-
04
Jan-
05
Jan-
06
Jan-
07
Jan-
08
Jan-
09
Jan-
10
Jan-
11
Jan-
12
Jan-
13
Jan-
14
Jan-
15
Jan-
16
Jan-
17
Jan-
18
Overweight UnderweightIndia Index weight India fund weight
0%
5%
10%
15%
20%
Jan-
96Ja
n-97
Jan-
98Ja
n-99
Jan-
00Ja
n-01
Jan-
02Ja
n-03
Jan-
04Ja
n-05
Jan-
06Ja
n-07
Jan-
08Ja
n-09
Jan-
10Ja
n-11
Jan-
12Ja
n-13
Jan-
14Ja
n-15
Jan-
16Ja
n-17
Jan-
18
Overweight UnderweightBrazil Index weight Brazil fund weight
0%
2%
4%
6%
8%
10%
12%
14%
16%
18%
Jan-
96Ja
n-97
Jan-
98Ja
n-99
Jan-
00Ja
n-01
Jan-
02Ja
n-03
Jan-
04Ja
n-05
Jan-
06Ja
n-07
Jan-
08Ja
n-09
Jan-
10Ja
n-11
Jan-
12Ja
n-13
Jan-
14Ja
n-15
Jan-
16Ja
n-17
Jan-
18
Overweight UnderweightSouth Africa Index weight South Africa fund weight
EM fund flows: Allocations

Renaissance Capital XX January 2019
ESG
Renaissance Capital 14 January 2019
ESG
92
Figure 148: Non-ETF allocation to Russia vs benchmark
Source: MSCI, EPFR.com
Figure 149: Non-ETF allocation to Mexico vs benchmark
Source: MSCI, EPFR.com
Figure 150: Non-ETF allocation to Thailand
Source: MSCI, EPFR.com
Figure 151: Non-ETF allocation to Malaysia
Source: MSCI, EPFR.com
Figure 152: Non-ETF allocation to Indonesia vs benchmark
Source: MSCI, EPFR.com
Figure 153: Non-ETF allocation to Poland vs benchmark
Source: MSCI, EPFR.com
0%
2%
4%
6%
8%
10%
12%
14%
Jan-
96Ja
n-97
Jan-
98Ja
n-99
Jan-
00Ja
n-01
Jan-
02Ja
n-03
Jan-
04Ja
n-05
Jan-
06Ja
n-07
Jan-
08Ja
n-09
Jan-
10Ja
n-11
Jan-
12Ja
n-13
Jan-
14Ja
n-15
Jan-
16Ja
n-17
Jan-
18
Overweight UnderweightRussia Index weight Russia fund weight
0%
2%
4%
6%
8%
10%
12%
14%
16%
18%
Jan-
96Ja
n-97
Jan-
98Ja
n-99
Jan-
00Ja
n-01
Jan-
02Ja
n-03
Jan-
04Ja
n-05
Jan-
06Ja
n-07
Jan-
08Ja
n-09
Jan-
10Ja
n-11
Jan-
12Ja
n-13
Jan-
14Ja
n-15
Jan-
16Ja
n-17
Jan-
18
Overweight UnderweightMexico Index weight Mexico fund weight
0%
2%
4%
6%
8%
10%
12%
Jan-
96Ja
n-97
Jan-
98Ja
n-99
Jan-
00Ja
n-01
Jan-
02Ja
n-03
Jan-
04Ja
n-05
Jan-
06Ja
n-07
Jan-
08Ja
n-09
Jan-
10Ja
n-11
Jan-
12Ja
n-13
Jan-
14Ja
n-15
Jan-
16Ja
n-17
Jan-
18
Overweight UnderweightThailand Index weight Thailand fund weight
0%
5%
10%
15%
20%Ja
n-96
Jan-
97Ja
n-98
Jan-
99Ja
n-00
Jan-
01Ja
n-02
Jan-
03Ja
n-04
Jan-
05Ja
n-06
Jan-
07Ja
n-08
Jan-
09Ja
n-10
Jan-
11Ja
n-12
Jan-
13Ja
n-14
Jan-
15Ja
n-16
Jan-
17Ja
n-18
Overweight UnderweightMalaysia Index weight Malaysia fund weight
0%
1%
2%
3%
4%
5%
6%
7%
Jan-
96Ja
n-97
Jan-
98Ja
n-99
Jan-
00Ja
n-01
Jan-
02Ja
n-03
Jan-
04Ja
n-05
Jan-
06Ja
n-07
Jan-
08Ja
n-09
Jan-
10Ja
n-11
Jan-
12Ja
n-13
Jan-
14Ja
n-15
Jan-
16Ja
n-17
Jan-
18
Overweight UnderweightIndonesia Index weight Indonesia fund weight
0%
1%
1%
2%
2%
3%
3%
Jan-
96Ja
n-97
Jan-
98Ja
n-99
Jan-
00Ja
n-01
Jan-
02Ja
n-03
Jan-
04Ja
n-05
Jan-
06Ja
n-07
Jan-
08Ja
n-09
Jan-
10Ja
n-11
Jan-
12Ja
n-13
Jan-
14Ja
n-15
Jan-
16Ja
n-17
Jan-
18
Overweight UnderweightPoland Index weight Poland fund weight
EM fund flows: Allocations

Renaissance Capital XX January 2019
ESG
Renaissance Capital 14 January 2019
ESG
93
Figure 154: Non-ETF allocation to Chile vs benchmark
Source: MSCI, EPFR.com
Figure 155: Non-ETF allocation to Qatar vs benchmark (from Jan 2008)
Source: MSCI, EPFR.com
Figure 156: Non-ETF allocation to the Philippines vs benchmark
Source: MSCI, EPFR.com
Figure 157: Non-ETF allocation to Turkey vs benchmark
Source: MSCI, EPFR.com
Figure 158: Non-ETF allocation to UAE vs benchmark (from Jan 2008)
Source: MSCI, EPFR.com
Figure 159: Non-ETF allocation to Colombia vs benchmark
Source: MSCI, EPFR.com
0.0%
1.0%
2.0%
3.0%
4.0%
5.0%
6.0%
Jan-
96Ja
n-97
Jan-
98Ja
n-99
Jan-
00Ja
n-01
Jan-
02Ja
n-03
Jan-
04Ja
n-05
Jan-
06Ja
n-07
Jan-
08Ja
n-09
Jan-
10Ja
n-11
Jan-
12Ja
n-13
Jan-
14Ja
n-15
Jan-
16Ja
n-17
Jan-
18
Overweight UnderweightChile Index weight Chile fund weight
0.0%
0.2%
0.4%
0.6%
0.8%
1.0%
1.2%
Jan-
08
Jan-
09
Jan-
10
Jan-
11
Jan-
12
Jan-
13
Jan-
14
Jan-
15
Jan-
16
Jan-
17
Jan-
18
Overweight UnderweightQatar Index weight Qatar fund weight
0.0%
1.0%
2.0%
3.0%
4.0%
5.0%
6.0%
7.0%
Jan-
96Ja
n-97
Jan-
98Ja
n-99
Jan-
00Ja
n-01
Jan-
02Ja
n-03
Jan-
04Ja
n-05
Jan-
06Ja
n-07
Jan-
08Ja
n-09
Jan-
10Ja
n-11
Jan-
12Ja
n-13
Jan-
14Ja
n-15
Jan-
16Ja
n-17
Jan-
18
Overweight UnderweightPhilippines Index weight Philippines fund weight
0.0%
1.0%
2.0%
3.0%
4.0%
5.0%
6.0%
7.0%
8.0%
9.0%Ja
n-96
Jan-
97Ja
n-98
Jan-
99Ja
n-00
Jan-
01Ja
n-02
Jan-
03Ja
n-04
Jan-
05Ja
n-06
Jan-
07Ja
n-08
Jan-
09Ja
n-10
Jan-
11Ja
n-12
Jan-
13Ja
n-14
Jan-
15Ja
n-16
Jan-
17Ja
n-18
Overweight UnderweightTurkey Index weight Turkey fund weight
0.0%
0.2%
0.4%
0.6%
0.8%
1.0%
1.2%
Jan-
08
Jan-
09
Jan-
10
Jan-
11
Jan-
12
Jan-
13
Jan-
14
Jan-
15
Jan-
16
Jan-
17
Jan-
18
Overweight UnderweightUAE Index weight UAE fund weight
0.0%
0.2%
0.4%
0.6%
0.8%
1.0%
1.2%
1.4%
Jan-
96Ja
n-97
Jan-
98Ja
n-99
Jan-
00Ja
n-01
Jan-
02Ja
n-03
Jan-
04Ja
n-05
Jan-
06Ja
n-07
Jan-
08Ja
n-09
Jan-
10Ja
n-11
Jan-
12Ja
n-13
Jan-
14Ja
n-15
Jan-
16Ja
n-17
Jan-
18
Overweight UnderweightColombia Index weight Colombia fund weight
EM fund flows: Allocations

Renaissance Capital XX January 2019
ESG
Renaissance Capital 14 January 2019
ESG
94
Figure 160: Non-ETF allocation to Peru vs benchmark
Source: MSCI, EPFR.com
Figure 161: Non-ETF allocation to Hungary vs benchmark
Source: MSCI, EPFR.com
Figure 162: Non-ETF allocation to Greece vs benchmark
Source: MSCI, EPFR.com
Figure 163: Non-ETF allocation to the Czech Republic vs benchmark
Source: MSCI, EPFR.com
Figure 164: Non-ETF allocation to Egypt vs benchmark
Source: MSCI, EPFR.com
Figure 165: Non-ETF allocation to Pakistan vs benchmark
Source: MSCI, EPFR.com
0.0%
0.2%
0.4%
0.6%
0.8%
1.0%
1.2%
1.4%
1.6%
Jan-
96Ja
n-97
Jan-
98Ja
n-99
Jan-
00Ja
n-01
Jan-
02Ja
n-03
Jan-
04Ja
n-05
Jan-
06Ja
n-07
Jan-
08Ja
n-09
Jan-
10Ja
n-11
Jan-
12Ja
n-13
Jan-
14Ja
n-15
Jan-
16Ja
n-17
Jan-
18
Overweight UnderweightPeru Index weight Peru fund weight
0.0%
0.5%
1.0%
1.5%
2.0%
2.5%
3.0%
Jan-
96Ja
n-97
Jan-
98Ja
n-99
Jan-
00Ja
n-01
Jan-
02Ja
n-03
Jan-
04Ja
n-05
Jan-
06Ja
n-07
Jan-
08Ja
n-09
Jan-
10Ja
n-11
Jan-
12Ja
n-13
Jan-
14Ja
n-15
Jan-
16Ja
n-17
Jan-
18
Overweight UnderweightHungary Index weight Hungary fund weight
0%
2%
4%
6%
8%
Jan-
96Ja
n-97
Jan-
98Ja
n-99
Jan-
00Ja
n-01
Jan-
02Ja
n-03
Jan-
04Ja
n-05
Jan-
06Ja
n-07
Jan-
08Ja
n-09
Jan-
10Ja
n-11
Jan-
12Ja
n-13
Jan-
14Ja
n-15
Jan-
16Ja
n-17
Jan-
18
Overweight UnderweightGreece Index weight Greece fund weight
0.0%
0.2%
0.4%
0.6%
0.8%
1.0%
1.2%
1.4%
1.6%Ja
n-96
Jan-
97Ja
n-98
Jan-
99Ja
n-00
Jan-
01Ja
n-02
Jan-
03Ja
n-04
Jan-
05Ja
n-06
Jan-
07Ja
n-08
Jan-
09Ja
n-10
Jan-
11Ja
n-12
Jan-
13Ja
n-14
Jan-
15Ja
n-16
Jan-
17Ja
n-18
Overweight UnderweightCzech Index weight Czech fund weight
0.0%
0.5%
1.0%
1.5%
2.0%
2.5%
Jan-
96Ja
n-97
Jan-
98Ja
n-99
Jan-
00Ja
n-01
Jan-
02Ja
n-03
Jan-
04Ja
n-05
Jan-
06Ja
n-07
Jan-
08Ja
n-09
Jan-
10Ja
n-11
Jan-
12Ja
n-13
Jan-
14Ja
n-15
Jan-
16Ja
n-17
Jan-
18
Overweight UnderweightEgypt Index weight Egypt fund weight
0.0%
0.2%
0.4%
0.6%
0.8%
1.0%
1.2%
Jan-
96Ja
n-97
Jan-
98Ja
n-99
Jan-
00Ja
n-01
Jan-
02Ja
n-03
Jan-
04Ja
n-05
Jan-
06Ja
n-07
Jan-
08Ja
n-09
Jan-
10Ja
n-11
Jan-
12Ja
n-13
Jan-
14Ja
n-15
Jan-
16Ja
n-17
Jan-
18
Overweight UnderweightPakistan Index weight Pakistan fund weight
EM fund flows: Allocations
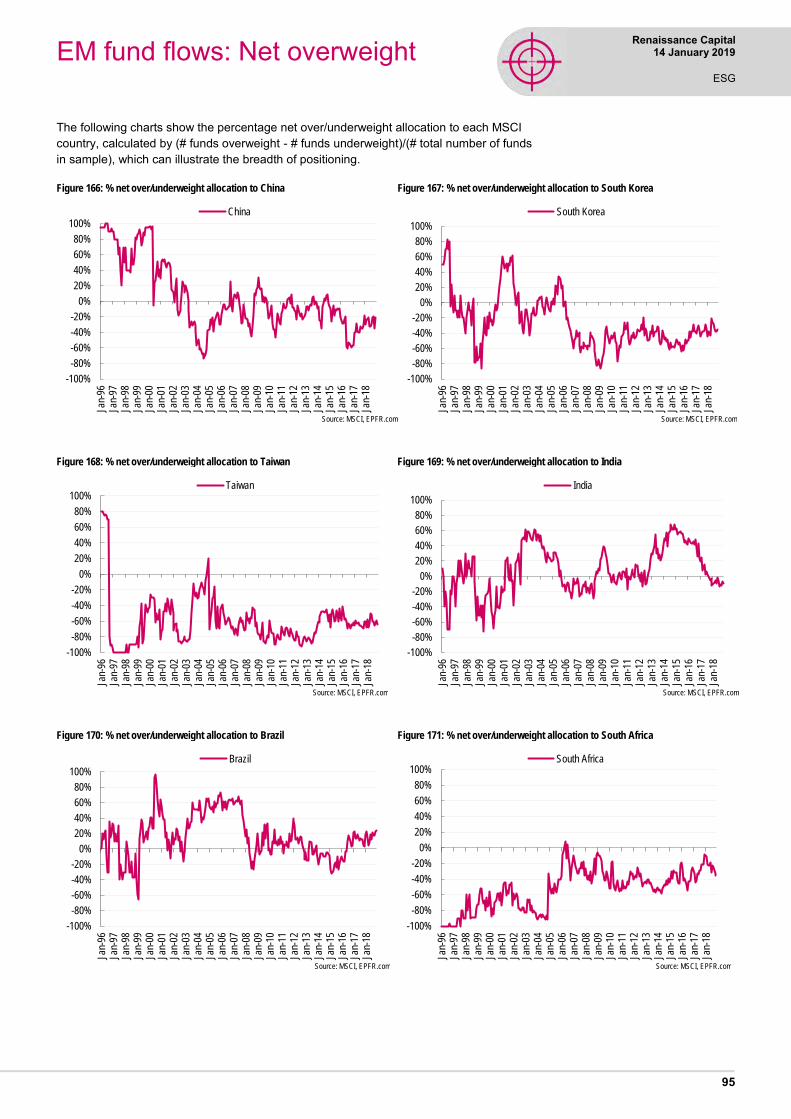
Renaissance Capital XX January 2019
ESG
Renaissance Capital 14 January 2019
ESG
95
The following charts show the percentage net over/underweight allocation to each MSCI country, calculated by (# funds overweight - # funds underweight)/(# total number of funds in sample), which can illustrate the breadth of positioning.
Figure 166: % net over/underweight allocation to China
Source: MSCI, EPFR.com
Figure 167: % net over/underweight allocation to South Korea
Source: MSCI, EPFR.com
Figure 168: % net over/underweight allocation to Taiwan
Source: MSCI, EPFR.com
Figure 169: % net over/underweight allocation to India
Source: MSCI, EPFR.com
Figure 170: % net over/underweight allocation to Brazil
Source: MSCI, EPFR.com
Figure 171: % net over/underweight allocation to South Africa
Source: MSCI, EPFR.com
-100%
-80%
-60%
-40%
-20%
0%
20%
40%
60%
80%
100%
Jan-
96Ja
n-97
Jan-
98Ja
n-99
Jan-
00Ja
n-01
Jan-
02Ja
n-03
Jan-
04Ja
n-05
Jan-
06Ja
n-07
Jan-
08Ja
n-09
Jan-
10Ja
n-11
Jan-
12Ja
n-13
Jan-
14Ja
n-15
Jan-
16Ja
n-17
Jan-
18
China
-100%
-80%
-60%
-40%
-20%
0%
20%
40%
60%
80%
100%
Jan-
96Ja
n-97
Jan-
98Ja
n-99
Jan-
00Ja
n-01
Jan-
02Ja
n-03
Jan-
04Ja
n-05
Jan-
06Ja
n-07
Jan-
08Ja
n-09
Jan-
10Ja
n-11
Jan-
12Ja
n-13
Jan-
14Ja
n-15
Jan-
16Ja
n-17
Jan-
18
South Korea
-100%
-80%
-60%
-40%
-20%
0%
20%
40%
60%
80%
100%
Jan-
96Ja
n-97
Jan-
98Ja
n-99
Jan-
00Ja
n-01
Jan-
02Ja
n-03
Jan-
04Ja
n-05
Jan-
06Ja
n-07
Jan-
08Ja
n-09
Jan-
10Ja
n-11
Jan-
12Ja
n-13
Jan-
14Ja
n-15
Jan-
16Ja
n-17
Jan-
18
Taiwan
-100%
-80%
-60%
-40%
-20%
0%
20%
40%
60%
80%
100%
Jan-
96Ja
n-97
Jan-
98Ja
n-99
Jan-
00Ja
n-01
Jan-
02Ja
n-03
Jan-
04Ja
n-05
Jan-
06Ja
n-07
Jan-
08Ja
n-09
Jan-
10Ja
n-11
Jan-
12Ja
n-13
Jan-
14Ja
n-15
Jan-
16Ja
n-17
Jan-
18
India
-100%
-80%
-60%
-40%
-20%
0%
20%
40%
60%
80%
100%
Jan-
96Ja
n-97
Jan-
98Ja
n-99
Jan-
00Ja
n-01
Jan-
02Ja
n-03
Jan-
04Ja
n-05
Jan-
06Ja
n-07
Jan-
08Ja
n-09
Jan-
10Ja
n-11
Jan-
12Ja
n-13
Jan-
14Ja
n-15
Jan-
16Ja
n-17
Jan-
18
Brazil
-100%
-80%
-60%
-40%
-20%
0%
20%
40%
60%
80%
100%
Jan-
96Ja
n-97
Jan-
98Ja
n-99
Jan-
00Ja
n-01
Jan-
02Ja
n-03
Jan-
04Ja
n-05
Jan-
06Ja
n-07
Jan-
08Ja
n-09
Jan-
10Ja
n-11
Jan-
12Ja
n-13
Jan-
14Ja
n-15
Jan-
16Ja
n-17
Jan-
18
South Africa
EM fund flows: Net overweight

Renaissance Capital XX January 2019
ESG
Renaissance Capital 14 January 2019
ESG
96
Figure 172: % net over/underweight allocation to Russia
Source: MSCI, EPFR.com
Figure 173: % net over/underweight allocation to Mexico
Source: MSCI, EPFR.com
Figure 174: % net over/underweight allocation to Thailand
Source: MSCI, EPFR.com
Figure 175: % net over/underweight allocation to Malaysia
Source: MSCI, EPFR.com
Figure 176: % net over/underweight allocation to Indonesia
Source: MSCI, EPFR.com
Figure 177: % net over/underweight allocation to Poland
Source: MSCI, EPFR.com
-100%
-80%
-60%
-40%
-20%
0%
20%
40%
60%
80%
100%
Jan-
96Ja
n-97
Jan-
98Ja
n-99
Jan-
00Ja
n-01
Jan-
02Ja
n-03
Jan-
04Ja
n-05
Jan-
06Ja
n-07
Jan-
08Ja
n-09
Jan-
10Ja
n-11
Jan-
12Ja
n-13
Jan-
14Ja
n-15
Jan-
16Ja
n-17
Jan-
18
Russia
-100%
-80%
-60%
-40%
-20%
0%
20%
40%
60%
80%
100%
Jan-
96Ja
n-97
Jan-
98Ja
n-99
Jan-
00Ja
n-01
Jan-
02Ja
n-03
Jan-
04Ja
n-05
Jan-
06Ja
n-07
Jan-
08Ja
n-09
Jan-
10Ja
n-11
Jan-
12Ja
n-13
Jan-
14Ja
n-15
Jan-
16Ja
n-17
Jan-
18
Mexico
-100%
-80%
-60%
-40%
-20%
0%
20%
40%
60%
80%
100%
Jan-
96Ja
n-97
Jan-
98Ja
n-99
Jan-
00Ja
n-01
Jan-
02Ja
n-03
Jan-
04Ja
n-05
Jan-
06Ja
n-07
Jan-
08Ja
n-09
Jan-
10Ja
n-11
Jan-
12Ja
n-13
Jan-
14Ja
n-15
Jan-
16Ja
n-17
Jan-
18
Thailand
-100%
-80%
-60%
-40%
-20%
0%
20%
40%
60%
80%
100%Ja
n-96
Jan-
97Ja
n-98
Jan-
99Ja
n-00
Jan-
01Ja
n-02
Jan-
03Ja
n-04
Jan-
05Ja
n-06
Jan-
07Ja
n-08
Jan-
09Ja
n-10
Jan-
11Ja
n-12
Jan-
13Ja
n-14
Jan-
15Ja
n-16
Jan-
17Ja
n-18
Malaysia
-100%
-80%
-60%
-40%
-20%
0%
20%
40%
60%
80%
100%
Jan-
96Ja
n-97
Jan-
98Ja
n-99
Jan-
00Ja
n-01
Jan-
02Ja
n-03
Jan-
04Ja
n-05
Jan-
06Ja
n-07
Jan-
08Ja
n-09
Jan-
10Ja
n-11
Jan-
12Ja
n-13
Jan-
14Ja
n-15
Jan-
16Ja
n-17
Jan-
18
Indonesia
-100%
-80%
-60%
-40%
-20%
0%
20%
40%
60%
80%
100%
Jan-
96Ja
n-97
Jan-
98Ja
n-99
Jan-
00Ja
n-01
Jan-
02Ja
n-03
Jan-
04Ja
n-05
Jan-
06Ja
n-07
Jan-
08Ja
n-09
Jan-
10Ja
n-11
Jan-
12Ja
n-13
Jan-
14Ja
n-15
Jan-
16Ja
n-17
Jan-
18Poland
EM fund flows: Net overweight

Renaissance Capital XX January 2019
ESG
Renaissance Capital 14 January 2019
ESG
97
Figure 178: % net over/underweight allocation to Chile
Source: MSCI, EPFR.com
Figure 179: % net over/underweight allocation to Qatar (from Jan 2008)
Source: MSCI, EPFR.com
Figure 180: % net over/underweight allocation to the Philippines
Source: MSCI, EPFR.com
Figure 181: % net over/underweight allocation to Turkey
Source: MSCI, EPFR.com
Figure 182: % net over/underweight allocation to UAE (from Jan 2008)
Source: MSCI, EPFR.com
Figure 183: % net over/underweight allocation to Colombia
Source: MSCI, EPFR.com
-100%
-80%
-60%
-40%
-20%
0%
20%
40%
60%
80%
100%
Jan-
96Ja
n-97
Jan-
98Ja
n-99
Jan-
00Ja
n-01
Jan-
02Ja
n-03
Jan-
04Ja
n-05
Jan-
06Ja
n-07
Jan-
08Ja
n-09
Jan-
10Ja
n-11
Jan-
12Ja
n-13
Jan-
14Ja
n-15
Jan-
16Ja
n-17
Jan-
18
Chile
-100%
-80%
-60%
-40%
-20%
0%
20%
40%
60%
80%
100%
Jan-
08
Jan-
09
Jan-
10
Jan-
11
Jan-
12
Jan-
13
Jan-
14
Jan-
15
Jan-
16
Jan-
17
Jan-
18
Qatar
-100%
-80%
-60%
-40%
-20%
0%
20%
40%
60%
80%
100%
Jan-
96Ja
n-97
Jan-
98Ja
n-99
Jan-
00Ja
n-01
Jan-
02Ja
n-03
Jan-
04Ja
n-05
Jan-
06Ja
n-07
Jan-
08Ja
n-09
Jan-
10Ja
n-11
Jan-
12Ja
n-13
Jan-
14Ja
n-15
Jan-
16Ja
n-17
Jan-
18
Philippines
-100%
-80%
-60%
-40%
-20%
0%
20%
40%
60%
80%
100%Ja
n-08
Jul-0
8
Jan-
09
Jul-0
9
Jan-
10
Jul-1
0
Jan-
11
Jul-1
1
Jan-
12
Jul-1
2
Jan-
13
Jul-1
3
Jan-
14
Jul-1
4
Jan-
15
Jul-1
5
Jan-
16
Jul-1
6
Jan-
17
Jul-1
7
Jan-
18
Jul-1
8
Turkey
-100%
-80%
-60%
-40%
-20%
0%
20%
40%
60%
80%
100%
Jan-
96Ja
n-97
Jan-
98Ja
n-99
Jan-
00Ja
n-01
Jan-
02Ja
n-03
Jan-
04Ja
n-05
Jan-
06Ja
n-07
Jan-
08Ja
n-09
Jan-
10Ja
n-11
Jan-
12Ja
n-13
Jan-
14Ja
n-15
Jan-
16Ja
n-17
Jan-
18
UAE
-100%
-80%
-60%
-40%
-20%
0%
20%
40%
60%
80%
100%
Jan-
96Ja
n-97
Jan-
98Ja
n-99
Jan-
00Ja
n-01
Jan-
02Ja
n-03
Jan-
04Ja
n-05
Jan-
06Ja
n-07
Jan-
08Ja
n-09
Jan-
10Ja
n-11
Jan-
12Ja
n-13
Jan-
14Ja
n-15
Jan-
16Ja
n-17
Jan-
18Colombia
EM fund flows: Net overweight

Renaissance Capital XX January 2019
ESG
Renaissance Capital 14 January 2019
ESG
98
Figure 184: % net over/underweight allocation to Colombia
Source: MSCI, EPFR.com
Figure 185: % net over/underweight allocation to Hungary
Source: MSCI, EPFR.com
Figure 186: % net over/underweight allocation to Greece
Source: MSCI, EPFR.com
Figure 187: % net over/underweight allocation to the Czech Republic
Source: MSCI, EPFR.com
Figure 188: % net over/underweight allocation to Egypt
Source: MSCI, EPFR.com
Figure 189: % net over/underweight allocation to Pakistan
Source: MSCI, EPFR.com
-100%
-80%
-60%
-40%
-20%
0%
20%
40%
60%
80%
100%
Jan-
96Ja
n-97
Jan-
98Ja
n-99
Jan-
00Ja
n-01
Jan-
02Ja
n-03
Jan-
04Ja
n-05
Jan-
06Ja
n-07
Jan-
08Ja
n-09
Jan-
10Ja
n-11
Jan-
12Ja
n-13
Jan-
14Ja
n-15
Jan-
16Ja
n-17
Jan-
18
Peru
-100%
-80%
-60%
-40%
-20%
0%
20%
40%
60%
80%
100%
Jan-
96Ja
n-97
Jan-
98Ja
n-99
Jan-
00Ja
n-01
Jan-
02Ja
n-03
Jan-
04Ja
n-05
Jan-
06Ja
n-07
Jan-
08Ja
n-09
Jan-
10Ja
n-11
Jan-
12Ja
n-13
Jan-
14Ja
n-15
Jan-
16Ja
n-17
Jan-
18
Hungary
-100%
-80%
-60%
-40%
-20%
0%
20%
40%
60%
80%
100%
Jan-
96Ja
n-97
Jan-
98Ja
n-99
Jan-
00Ja
n-01
Jan-
02Ja
n-03
Jan-
04Ja
n-05
Jan-
06Ja
n-07
Jan-
08Ja
n-09
Jan-
10Ja
n-11
Jan-
12Ja
n-13
Jan-
14Ja
n-15
Jan-
16Ja
n-17
Jan-
18
Greece
-100%
-80%
-60%
-40%
-20%
0%
20%
40%
60%
80%
100%Ja
n-96
Jan-
97Ja
n-98
Jan-
99Ja
n-00
Jan-
01Ja
n-02
Jan-
03Ja
n-04
Jan-
05Ja
n-06
Jan-
07Ja
n-08
Jan-
09Ja
n-10
Jan-
11Ja
n-12
Jan-
13Ja
n-14
Jan-
15Ja
n-16
Jan-
17Ja
n-18
Czech Rep
-100%
-80%
-60%
-40%
-20%
0%
20%
40%
60%
80%
100%
Jan-
96Ja
n-97
Jan-
98Ja
n-99
Jan-
00Ja
n-01
Jan-
02Ja
n-03
Jan-
04Ja
n-05
Jan-
06Ja
n-07
Jan-
08Ja
n-09
Jan-
10Ja
n-11
Jan-
12Ja
n-13
Jan-
14Ja
n-15
Jan-
16Ja
n-17
Jan-
18
Egypt
-100%
-80%
-60%
-40%
-20%
0%
20%
40%
60%
80%
100%
Jan-
96Ja
n-97
Jan-
98Ja
n-99
Jan-
00Ja
n-01
Jan-
02Ja
n-03
Jan-
04Ja
n-05
Jan-
06Ja
n-07
Jan-
08Ja
n-09
Jan-
10Ja
n-11
Jan-
12Ja
n-13
Jan-
14Ja
n-15
Jan-
16Ja
n-17
Jan-
18Pakistan
EM fund flows: Net overweight

Renaissance Capital
XX January 2019
ESG
Renaissance Capital 14 January 2019
ESG
99
The following charts show sector allocations of non-ETF GEM funds benchmarked to MSCI EM vs index weights, with shaded areas highlighting over/underweights, based on a sample of c. 40% of MSCI EM-benchmarked active AuM.
Figure 190: Non-ETF allocation to IT vs benchmark
Source: MSCI, EPFR.com
Figure 191: Non-ETF allocation to Financials vs benchmark
Source: MSCI, EPFR.com
Figure 192: Non-ETF allocation to Consumer Discretionary vs benchmark
Source: MSCI, EPFR.com
Figure 193: Non-ETF allocation to Energy vs benchmark
Source: MSCI, EPFR.com
Figure 194: Non-ETF allocation to Materials vs benchmark
Source: MSCI, EPFR.com
Figure 195: Non-ETF allocation to Consumer Staples vs benchmark
Source: MSCI, EPFR.com
0%
5%
10%
15%
20%
25%
30%
Aug
-06
Feb
-07
Aug
-07
Feb
-08
Aug
-08
Feb
-09
Aug
-09
Feb
-10
Aug
-10
Feb
-11
Aug
-11
Feb
-12
Aug
-12
Feb
-13
Aug
-13
Feb
-14
Aug
-14
Feb
-15
Aug
-15
Feb
-16
Aug
-16
Feb
-17
Aug
-17
Feb
-18
Aug
-18
Overweight UnderweightIT, Fund weight IT, Index weight
0%
5%
10%
15%
20%
25%
30%
35%
Aug
-06
Feb
-07
Aug
-07
Feb
-08
Aug
-08
Feb
-09
Aug
-09
Feb
-10
Aug
-10
Feb
-11
Aug
-11
Feb
-12
Aug
-12
Feb
-13
Aug
-13
Feb
-14
Aug
-14
Feb
-15
Aug
-15
Feb
-16
Aug
-16
Feb
-17
Aug
-17
Feb
-18
Aug
-18
Overweight Underweight
Financials, Fund weight Financials, Index weight
0%
2%
4%
6%
8%
10%
12%
14%
16%
Aug
-06
Feb
-07
Aug
-07
Feb
-08
Aug
-08
Feb
-09
Aug
-09
Feb
-10
Aug
-10
Feb
-11
Aug
-11
Feb
-12
Aug
-12
Feb
-13
Aug
-13
Feb
-14
Aug
-14
Feb
-15
Aug
-15
Feb
-16
Aug
-16
Feb
-17
Aug
-17
Feb
-18
Aug
-18
Overweight Underweight
Cons. Disc., Fund weight Cons. Disc., Index weight
0%
5%
10%
15%
20%
25%
Aug
-06
Feb
-07
Aug
-07
Feb
-08
Aug
-08
Feb
-09
Aug
-09
Feb
-10
Aug
-10
Feb
-11
Aug
-11
Feb
-12
Aug
-12
Feb
-13
Aug
-13
Feb
-14
Aug
-14
Feb
-15
Aug
-15
Feb
-16
Aug
-16
Feb
-17
Aug
-17
Feb
-18
Aug
-18
Overweight UnderweightEnergy, Fund weight Energy, Index weight
0%
5%
10%
15%
20%
Aug
-06
Feb
-07
Aug
-07
Feb
-08
Aug
-08
Feb
-09
Aug
-09
Feb
-10
Aug
-10
Feb
-11
Aug
-11
Feb
-12
Aug
-12
Feb
-13
Aug
-13
Feb
-14
Aug
-14
Feb
-15
Aug
-15
Feb
-16
Aug
-16
Feb
-17
Aug
-17
Feb
-18
Aug
-18
Overweight UnderweightMaterials, Fund weight Materials, Index weight
0%
2%
4%
6%
8%
10%
12%
14%
16%
Aug
-06
Feb
-07
Aug
-07
Feb
-08
Aug
-08
Feb
-09
Aug
-09
Feb
-10
Aug
-10
Feb
-11
Aug
-11
Feb
-12
Aug
-12
Feb
-13
Aug
-13
Feb
-14
Aug
-14
Feb
-15
Aug
-15
Feb
-16
Aug
-16
Feb
-17
Aug
-17
Feb
-18
Aug
-18
Overweight UnderweightCons. Staples, Fund weight Cons. Staples, Index weight
EM fund flows: Allocations

Renaissance Capital
XX January 2019
ESG
Renaissance Capital 14 January 2019
ESG
100
Figure 196: Non-ETF allocation to Industrials vs benchmark
Source: MSCI, EPFR.com
Figure 197: Non-ETF allocation to Telecoms vs benchmark
Source: MSCI, EPFR.com
Figure 198: Non-ETF allocation to Real Estate vs benchmark
Source: MSCI, EPFR.com
Figure 199: Non-ETF allocation to Healthcare vs benchmark
Source: MSCI, EPFR.com
Figure 200: Non-ETF allocation to Utilities vs benchmark
Source: MSCI, EPFR.com
Figure 201: Non-ETF allocation to Cash
Source: MSCI, EPFR.com
0%
2%
4%
6%
8%
10%
12%
14%
Aug
-06
Feb
-07
Aug
-07
Feb
-08
Aug
-08
Feb
-09
Aug
-09
Feb
-10
Aug
-10
Feb
-11
Aug
-11
Feb
-12
Aug
-12
Feb
-13
Aug
-13
Feb
-14
Aug
-14
Feb
-15
Aug
-15
Feb
-16
Aug
-16
Feb
-17
Aug
-17
Feb
-18
Aug
-18
Overweight Underweight
Industrials, Fund weight Industrials, Index weight
0%
2%
4%
6%
8%
10%
12%
14%
16%
18%
Aug
-06
Feb
-07
Aug
-07
Feb
-08
Aug
-08
Feb
-09
Aug
-09
Feb
-10
Aug
-10
Feb
-11
Aug
-11
Feb
-12
Aug
-12
Feb
-13
Aug
-13
Feb
-14
Aug
-14
Feb
-15
Aug
-15
Feb
-16
Aug
-16
Feb
-17
Aug
-17
Feb
-18
Aug
-18
Overweight Underweight
Telecoms, Fund weight Telecoms, Index weight
0.0%
0.5%
1.0%
1.5%
2.0%
2.5%
3.0%
3.5%
4.0%
4.5%
Apr
-13
Oct
-13
Apr
-14
Oct
-14
Apr
-15
Oct
-15
Apr
-16
Oct
-16
Apr
-17
Oct
-17
Apr
-18
Oct
-18
Overweight Underweight
Real Estate, Fund weight Real Estate, Index weight
0.0%
0.5%
1.0%
1.5%
2.0%
2.5%
3.0%
3.5%A
ug-0
6F
eb-0
7A
ug-0
7F
eb-0
8A
ug-0
8F
eb-0
9A
ug-0
9F
eb-1
0A
ug-1
0F
eb-1
1A
ug-1
1F
eb-1
2A
ug-1
2F
eb-1
3A
ug-1
3F
eb-1
4A
ug-1
4F
eb-1
5A
ug-1
5F
eb-1
6A
ug-1
6F
eb-1
7A
ug-1
7F
eb-1
8A
ug-1
8
Overweight UnderweightHealthcare, Fund weight Healthcare, Index weight
0.0%
0.5%
1.0%
1.5%
2.0%
2.5%
3.0%
3.5%
4.0%
4.5%
Aug
-06
Feb
-07
Aug
-07
Feb
-08
Aug
-08
Feb
-09
Aug
-09
Feb
-10
Aug
-10
Feb
-11
Aug
-11
Feb
-12
Aug
-12
Feb
-13
Aug
-13
Feb
-14
Aug
-14
Feb
-15
Aug
-15
Feb
-16
Aug
-16
Feb
-17
Aug
-17
Feb
-18
Aug
-18
Overweight UnderweightUtilities, Fund weight Utilities, Index weight
0%
2%
4%
6%
8%
10%
12%
14%
Jan-
96Ja
n-97
Jan-
98Ja
n-99
Jan-
00Ja
n-01
Jan-
02Ja
n-03
Jan-
04Ja
n-05
Jan-
06Ja
n-07
Jan-
08Ja
n-09
Jan-
10Ja
n-11
Jan-
12Ja
n-13
Jan-
14Ja
n-15
Jan-
16Ja
n-17
Jan-
18Cash Average Cash
EM fund Flows: Allocations

Month to 31 December
aa 1m 3m 6m 12m 2018 2017 2016 2015 2014 2013 MSCI Index performance ($)EM -2.9 -7.8 -9.7 -16.6 -16.6 34.3 8.6 -17.0 -4.6 -5.0Frontier -3.0 -4.5 -6.9 -19.1 -19.1 27.7 -1.3 -17.3 2.9 21.4DM -7.7 -13.7 -9.8 -10.4 -10.4 20.1 5.3 -2.7 2.9 24.1
LatAm -1.3 -0.4 3.6 -9.3 -9.3 20.8 27.9 -32.9 -14.8 -15.7EMEA -1.8 -4.6 -7.2 -18.8 -18.8 21.0 16.4 -22.4 -17.5 -8.0EM Asia -3.4 -9.6 -12.1 -17.3 -17.3 40.1 3.8 -11.8 2.5 -0.2
EM Value -2.6 -7.2 -5.4 -13.7 -13.7 24.3 11.4 -21.2 -7.1 -8.0EM Growth -3.3 -8.5 -13.8 -19.5 -19.5 44.9 5.8 -12.8 -2.2 -2.1
Iron ore 11.9 4.2 11.7 -2.4 -2.4 -7.6 85.1 -36.5 -49.3 -6.9Gold 5.1 7.7 2.4 -1.6 -1.6 13.5 8.1 -10.4 -1.4 -28.3Copper -3.8 -4.7 -10.0 -17.7 -17.7 30.9 17.7 -25.3 -14.4 -7.2Oil -9.0 -35.9 -32.4 -20.4 -20.4 20.6 55.0 -35.9 -49.7 -1.0
MSCI EM Asia vs EMEA vs LatAm ($)Mexico 3.2 -19.4 -14.2 -17.4 -17.4 13.6 -10.7 -16.0 -10.2 -2.0Peru 1.5 -3.1 -5.3 -0.3 -0.3 33.5 53.8 -32.5 9.2 -31.0Philippines 1.5 5.2 6.0 -17.4 -17.4 23.3 -7.7 -8.1 23.7 -4.3Malaysia 1.4 -6.2 -3.7 -8.9 -8.9 21.1 -6.7 -22.4 -13.4 4.2Indonesia 0.8 9.4 11.4 -11.2 -11.2 22.0 14.8 -21.0 24.1 -25.0UAE 0.2 -5.6 -3.2 -11.9 -11.9 -1.3 9.0 -20.6 11.5 84.7Poland 0.2 -3.0 5.6 -14.5 -14.5 52.2 -2.2 -27.2 -16.8 -1.7Hungary -0.1 5.9 10.8 -8.5 -8.5 36.9 32.3 33.1 -29.6 -9.0India -0.2 2.2 -0.5 -8.8 -8.8 36.8 -2.8 -7.4 21.9 -5.3S Africa -0.7 -4.1 -12.0 -26.5 -26.5 33.1 15.1 -27.2 2.5 -8.8Qatar -1.0 8.4 22.3 23.9 23.9 -14.4 2.3 -22.7 11.7 23.9Egypt -1.0 -10.1 -16.2 -16.3 -16.3 4.5 -12.8 -24.8 26.2 6.2Taiwan -1.4 -13.7 -10.0 -11.8 -11.8 23.8 14.8 -14.4 6.9 6.6Brazil -2.5 12.4 18.0 -3.9 -3.9 21.0 61.3 -43.4 -17.4 -18.7Czech -3.0 -8.7 -5.1 -8.4 -8.4 29.4 -9.6 -21.9 -7.9 -14.9Thailand -3.0 -10.5 1.0 -8.0 -8.0 30.9 23.0 -25.5 13.3 -16.9 MSCI EM performance, last month and YtD ($)Korea -3.1 -14.2 -13.8 -22.6 -22.6 45.5 7.0 -7.9 -12.6 3.1Chile -3.8 -8.9 -10.8 -21.0 -21.0 39.8 13.2 -18.9 -14.5 -23.0Russia -4.0 -10.1 -6.7 -5.6 -5.6 0.3 48.9 0.0 -48.5 -2.6Colombia -4.1 -19.5 -21.9 -13.9 -13.9 13.8 23.9 -43.9 -22.3 -23.7Turkey -5.3 4.4 -17.2 -43.6 -43.6 34.3 -10.5 -33.6 16.7 -28.1Greece -5.7 -16.4 -31.1 -37.8 -37.8 27.1 -13.2 -62.1 -40.3 46.2China -6.1 -10.8 -18.3 -20.4 -20.4 51.1 -1.4 -10.0 4.7 0.4Pakistan -12.4 -23.7 -28.1 -37.8 -37.8 -28.0 32.7 -18.3 7.6 26.5
Jordan 4.5 -4.0 -12.2 -8.4 -8.4 4.3 -4.7 -4.3 -5.3 -9.5Serbia 4.4 3.4 1.4 -0.1 -0.1 28.2 9.7 -30.7 -24.7 19.5Slovenia 3.9 3.4 -2.0 -3.7 -3.7 26.3 -19.2 -9.3 -10.8 19.8Saudi Arabia 2.1 -2.2 -5.1 14.7 14.7 3.7 5.9 -15.4 -5.8 26.6Morocco 1.0 -0.6 -3.4 -10.2 -10.2 7.2 29.9 -17.3 -4.1 -7.1Nigeria 0.6 -3.4 -17.5 -18.2 -18.2 30.7 -39.2 -23.5 -29.6 24.3Croatia 0.4 -3.5 -5.2 -12.4 -12.4 12.9 17.6 -10.0 -17.3 -4.7 MSCI FM performance, last month and YtD ($)Lebanon 0.3 6.6 -8.8 -17.6 -17.6 -8.3 4.6 0.9 1.5 -9.0Kuwait -0.2 -0.9 7.6 11.1 11.1 14.2 -0.9 -19.4 -7.3 2.1Bangladesh -1.8 -0.5 -7.1 -15.9 -15.9 15.7 8.2 -18.8 47.4 0.9Mauritius -2.3 0.8 1.1 -24.2 -24.2 36.9 4.8 -21.1 -9.3 21.9Tunisia -2.3 -12.4 -18.6 9.8 9.8 7.0 -3.2 -17.7 2.2 -8.7Sri Lanka -2.6 5.6 -8.9 -13.8 -13.8 -1.0 -7.7 -24.8 16.7 8.3Oman -2.9 -2.7 7.0 -9.0 -9.0 -14.9 2.8 -13.9 -3.9 10.4WAEMU -4.0 -15.7 -31.7 -35.8 6.4 6.7 na na na naBahrain -4.4 -8.9 0.8 -5.8 -5.8 5.4 -4.0 -25.2 -35.0 -8.3Argentina -4.8 -1.4 -10.6 -51.7 -51.7 72.3 3.9 -1.2 17.3 63.7Vietnam -5.8 -6.7 -10.9 -13.5 2.1 61.2 -8.5 -6.4 2.9 3.7Lithuania -5.8 -15.4 -16.1 -12.9 -12.9 10.8 -7.4 -9.8 -13.3 13.6Kazakhstan -6.1 -0.9 -9.1 -6.5 -6.5 68.1 6.7 -49.3 -16.1 0.7Kenya -6.9 -10.0 -23.8 -15.8 -15.8 29.8 -4.6 -20.9 19.9 43.4Estonia -7.0 5.6 -4.4 -16.4 -16.4 43.9 6.2 7.9 -32.9 6.4Romania -16.5 -15.2 -12.1 -6.2 -6.2 21.7 3.2 -1.4 -5.4 29.8Note: $ performance of MSCI country indices, sorted by last month's returns
Source: Bloomberg
12M Trend
Performance: EM and Frontier ($)
60
80
100
120
140
160
180
200
Jan-
10Ju
l-10
Jan-
11Ju
l-11
Jan-
12Ju
l-12
Jan-
13Ju
l-13
Jan-
14Ju
l-14
Jan-
15Ju
l-15
Jan-
16Ju
l-16
Jan-
17Ju
l-17
Jan-
18Ju
l-18
Jan-
19
EM Frontier DM
40
60
80
100
120
140
160
180
Jan-
10Ju
l-10
Jan-
11Ju
l-11
Jan-
12Ju
l-12
Jan-
13Ju
l-13
Jan-
14Ju
l-14
Jan-
15Ju
l-15
Jan-
16Ju
l-16
Jan-
17Ju
l-17
Jan-
18Ju
l-18
Jan-
19
EM Asia EMEA LatAm
-50
-40
-30
-20
-10
0
10
20
30
Mex
ico
Peru
Philip
pine
sM
alay
sia
Indo
nesi
aU
AE
Pola
ndHu
ngar
yIn
dia
S Af
rica
Qat
arEg
ypt
Taiw
anBr
azil
EMC
zech
Thai
land
Kore
aC
hile
Rus
sia
Colo
mbi
aTu
rkey
Gre
ece
Chi
naPa
kist
an
EM performance, 1m ($) EM performance, YtD ($)
-60
-50
-40
-30
-20
-10
0
10
20
Jord
anSe
rbia
Slov
enia
Saud
i Ara
bia
Mor
occo
Nig
eria
Cro
atia
Leba
non
Kuw
ait
Bang
lade
shM
aurit
ius
Tuni
sia
Sri L
anka
Om
anFr
ontie
rBa
hrai
nVi
etna
mAr
gent
ina
Lith
uani
aKa
zakh
stan
Keny
aEs
toni
aW
AEM
URo
man
ia
FM performance, 1m ($) FM performance, YtD ($)
Renaissance Capital 14 January 2019
ESG
101
Market watch

Weight 1m 3m 6m 12m 2018 2017 2016 2015 2014 2013 MSCI EM Sector Index performance ($)EM SectorsUtilities 3.6% 0.5 3.3 0.6 -6.4 -6.4 13.2 -0.5 -22.9 -1.1 -5.9Cons. Staples 7.2% -0.1 -5.1 -8.3 -15.3 -15.3 23.3 -1.6 -10.8 -6.8 -5.5Industrials 17.2% -0.5 -4.1 -1.7 -14.2 -14.2 24.0 -3.7 -18.0 -4.4 -2.8Real Estate 6.0% -0.9 1.1 -6.5 -20.5 -20.5 45.1 -6.3 -9.6 -6.8 -18.3Materials 7.8% -1.1 -11.3 -9.1 -14.4 -14.4 30.2 28.7 -23.7 -21.8 -19.1Communications 9.3% -1.6 -4.1 -4.1 -17.9 -17.9 12.3 -1.1 -22.3 -4.9 -5.3Financials 18.4% -2.1 -1.3 -1.4 -11.7 -11.7 28.8 9.2 -21.1 2.1 -7.0IT 10.5% -4.1 -13.0 -17.4 -20.6 -20.6 58.6 15.0 -8.7 8.1 12.2Energy 5.0% -5.6 -11.4 0.0 0.8 0.8 17.2 32.5 -19.7 -29.4 -13.6Cons. Disc. 10.4% -7.1 -13.8 -23.1 -33.3 -33.3 38.5 -0.4 -12.6 -3.1 4.3Healthcare 4.5% -7.9 -16.3 -22.5 -21.5 -21.5 31.4 -8.3 -6.0 18.2 8.0FM SectorsHealthcare 3.2% 0.3 2.4 -4.5 -6.4 -6.4 22.6 -9.9 2.5 na naMaterials 5.7% -0.3 -9.0 -14.5 -18.9 -18.9 13.9 9.7 -8.2 na naFinancials 44.4% -1.8 -2.3 -4.3 -16.3 -16.3 29.2 -1.1 -1.4 na na MSCI FM Sector Index performance ($)Cons. Staples 9.3% -2.1 -7.2 -12.1 -22.6 -22.6 34.4 -33.4 -2.3 na naIndustrials 4.5% -2.8 -4.1 -4.5 -15.1 -15.1 29.8 6.7 -3.9 na naCommunications 12.2% -3.6 -6.8 -8.5 -20.6 -20.6 18.0 13.0 -2.2 na naCons. Disc. 1.5% -4.6 -16.4 -27.9 -36.6 -36.6 -50.7 19.5 -2.0 na naReal Estate 8.3% -5.3 -5.3 -9.4 -8.3 -8.3 20.7 7.3 na na naUtilities 3.9% -6.4 -2.1 -9.6 -47.9 -47.9 60.3 15.6 -4.3 na naEnergy 5.4% -9.5 -10.5 -2.8 -29.6 -29.6 38.7 4.1 -9.5 na naEM largest 10 country sectorsMalaysia Communications 4.3% 5.9 -9.9 -0.8 -24.5 -24.5 18.5 -19.3 -24.8 1.9 -5.9Korea Industrials 4.6% -0.6 -9.0 -1.2 -10.3 -10.3 15.2 -3.6 -18.6 -23.4 -4.2Taiwan IT 6.5% -0.7 -15.3 -11.0 -16.2 -16.2 29.1 18.4 -15.1 18.4 2.9China Real Estate 2.8% -0.9 1.1 -10.3 -14.9 -14.9 97.1 -14.6 na na naS Africa Financials 2.6% -2.2 -1.7 -2.0 -20.7 -20.7 33.1 24.1 -32.0 10.7 -11.1China Industrials 7.6% -3.9 -8.6 -6.9 -16.8 -16.8 16.3 -11.6 -8.5 6.9 5.2China Financials 3.8% -4.4 -7.0 -9.1 -16.4 -16.4 28.8 -3.5 -12.6 14.1 -3.6Czech Financials 1.9% -4.9 -10.6 -8.9 -14.1 -14.1 23.0 -15.2 -3.8 -6.6 5.5China Materials 1.8% -6.6 -15.8 -18.5 -21.6 -21.6 50.0 17.5 -21.0 -0.5 -16.0China Cons. Disc. 2.6% -11.3 -20.6 -35.1 -39.6 -39.6 61.6 -9.7 -4.9 -9.4 -1.2EMEA largest country-sectors (weight in MSCI EMEA >1%)S Africa Materials 6.4% 7.1 -9.5 -7.8 -13.5 -13.5 16.4 35.3 -44.3 -24.4 -46.4Qatar Real Estate 2.0% 3.0 20.1 44.8 10.3 10.3 -15.3 -15.8 na na naPoland Energy 1.3% 2.4 6.4 29.8 1.1 1.1 48.6 14.4 16.2 -11.7 -9.3Poland Communications 4.1% 2.3 -5.0 -15.6 -39.1 -39.1 18.3 -21.5 -28.8 -27.5 -17.9Poland Materials 2.5% 0.7 -1.6 -5.0 -32.2 -32.2 46.0 5.4 -31.4 -27.7 -29.7Poland Financials 9.2% 0.1 -4.0 4.2 -16.4 -16.4 59.5 -7.9 -33.6 -16.5 14.0Qatar Financials 1.6% -1.5 8.3 22.8 32.8 32.8 -12.6 3.7 -17.3 24.4 20.3S Africa Real Estate 2.6% -2.1 -4.9 -9.0 -35.6 -35.6 14.3 -1.7 na na naS Africa Financials 15.0% -2.2 -1.7 -2.0 -20.7 -20.7 33.1 24.1 -32.0 10.7 -11.1Russia Materials 1.8% -2.5 -2.9 -0.8 -3.4 -3.4 3.3 49.2 -8.6 -30.9 -23.3S Africa Cons. Staples 2.5% -2.7 -2.0 -11.9 -28.6 -28.6 28.3 21.2 -33.7 4.7 -32.5Russia Energy 3.9% -3.2 -10.4 1.8 16.1 16.1 -3.9 47.1 -3.3 -45.0 -5.3S Africa Cons. Disc. 3.8% -3.9 -9.7 -22.2 -31.3 -31.3 50.7 5.0 -3.5 18.9 21.2Turkey Cons. Disc. 5.6% -4.6 4.2 -24.0 -49.1 -49.1 22.2 8.7 -20.2 17.2 -8.6Czech Financials 10.8% -4.9 -10.6 -8.9 -14.1 -14.1 23.0 -15.2 -3.8 -6.6 5.5Turkey Industrials 2.9% -5.6 -2.3 -5.4 -35.5 -35.5 55.8 -15.4 -29.4 23.1 -5.9S Africa Healthcare 2.6% -5.8 -8.0 -31.6 -41.2 -41.2 3.1 9.7 -35.0 24.4 12.8Greece Cons. Disc. 1.2% -6.0 -11.0 -21.7 -36.5 -36.5 31.3 21.1 -18.8 -19.2 82.8Turkey Financials 2.1% -6.1 15.8 -23.7 -51.1 -51.1 22.1 -9.6 -38.6 19.3 -37.7UAE Real Estate 2.9% -7.3 -15.2 -17.8 -35.2 -35.2 -6.0 -1.7 na na naNote: $ performance of MSCI sector indices, sorted by last month's returns
Source: Bloomberg
Performance: Sectors ($)
12M Trend
-40-35-30-25-20-15-10-505
Utilit
ies
Con
s. S
tapl
es
Indu
stria
ls
Rea
l Est
ate
Mat
eria
ls
Com
mun
icat
ions
Fina
ncia
ls IT
Ener
gy
Con
s. D
isc.
Hea
lthca
re
EM sector performance, 1m ($)EM sector performance, YtD ($)
-60
-50
-40
-30
-20
-10
0
10
Hea
lthca
re
Mat
eria
ls
Fina
ncia
ls
Con
s. S
tapl
es
Indu
stria
ls
Com
mun
icat
ions
Con
s. D
isc.
Rea
l Est
ate
Utilit
ies
Ener
gy
FM sector performance, 1m ($)FM sector performance, YtD ($)
Renaissance Capital 14 January 2019
ESG
102

Price/Earnings (x) Dividend yield Price/Book (x) Return on Equity EPS GrowthCountry T12M 12MF 17 18E 19E T12M 18E 19E T12M 12MF T12M 18E 19E 16 17 18E 19EEM 12.0 11.0 12.2 11.2 10.0 2.8% 3.2% 3.6% 1.5 1.4 13% 12% 13% 17% 25% 10% 7%Brazil 17.0 11.8 19.1 14.6 11.9 3.5% 3.4% 4.1% 2.0 1.8 12% 14% 16% -3% 6% 16% 15%Chile 17.2 15.4 21.1 15.8 14.4 3.0% 2.9% 3.0% 1.8 1.7 10% 10% 11% 13% 16% 23% 9%China 11.5 10.3 13.4 11.9 10.4 3.3% 2.7% 3.0% 1.5 1.3 13% 15% 13% 3% 26% 12% 14%Colombia 12.7 11.3 15.6 11.4 11.2 3.0% 3.5% 4.1% 1.3 1.2 10% 12% 13% 55% 10% 44% 3%Czech 14.0 13.5 13.1 14.2 13.7 6.8% 5.5% 5.7% 1.4 1.3 10% 10% 10% -13% -1% -8% 4%Egypt 7.7 8.3 10.4 10.1 8.7 2.4% 3.3% 4% 1.3 2.2 17% 31% 29% 42% 40% 4% 16%Greece 17.4 13.8 15.2 14.9 12.4 4.1% 4.6% 5.0% 0.8 0.8 5% 5% 6% 28% -14% 14% 9%Hungary 10.5 10.0 10.8 10.8 10.7 2.3% 2.4% 2.7% 1.5 1.3 14% 15% 14% 86% 27% 0% 1%India 20.2 17.3 22.2 19.2 16.1 1.6% 1.6% 1.8% 2.9 2.5 14% 16% 16% 9% 14% 12% 17%Indonesia 16.9 15.1 18.8 16.5 14.7 2.5% 2.5% 2.8% 2.8 2.4 16% 17% 17% 1% 18% 14% 12%Malaysia 17.2 15.7 17.3 17.4 15.6 3.5% 3.4% 3.4% 1.7 1.5 10% 10% 10% 6% 4% -1% 11%Mexico 18.0 13.6 20.6 16.4 14.0 2.9% 2.8% 3.1% 2.1 1.8 12% 14% 15% 30% 13% 24% 18%Pakistan 9.2 7.1 8.9 9.3 7.0 6.3% 6.5% 7.6% 1.2 1.1 13% 12% 16% -12% -6% -4% 32%Peru 16.4 13.8 16.9 15.8 13.7 2.0% 2.6% 3.0% 2.4 2.1 15% 15% 16% 14% 21% 3% 12%Philippines 19.5 16.9 20.3 18.3 16.2 1.6% 1.6% 1.7% 2.1 1.9 11% 12% 12% 5% 7% 11% 13%Poland 12.6 11.8 12.0 12.3 11.6 2.9% 2.8% 3.2% 1.4 1.2 11% 11% 11% -7% 26% -3% 8%Qatar 15.0 13.4 16.1 14.4 13.2 3.5% 3.7% 3.9% 2.0 2.0 13% 16% 16% -1% 3% 11% 6%Russia 5.7 5.6 8.1 5.3 5.1 6.2% 6.8% 7.4% 0.8 0.8 15% 16% 15% 18% 4% 48% 5%S Africa 16.6 13.2 18.7 15.3 13.1 3.3% 3.3% 3.6% 2.0 1.8 12% 15% 15% -11% 11% 22% 17%Korea 7.3 8.5 7.8 6.9 7.7 2.3% 2.7% 2.9% 0.9 0.8 12% 13% 11% 8% 51% 13% -10%Taiwan 11.7 12.9 13.3 12.4 12.3 4.8% 4.7% 4.9% 1.6 1.5 13% 13% 12% 4% 8% 10% 2%Thailand 14.1 13.8 15.0 14.7 13.8 3.1% 3.1% 3.2% 2.0 1.8 14% 14% 13% 3% 14% 1% 7%Turkey 6.3 6.2 7.4 6.6 6.3 5.5% 5.1% 6.0% 1.0 0.8 15% 16% 13% 18% 42% 4% 3%UAE 9.9 9.0 10.2 9.5 8.8 6.2% 5.5% 5.8% 1.3 1.2 14% 14% 13% 6% 4% 8% 7%
Frontier 11.3 9.5 11.9 9.7 8.1 3.8% 4.9% 5.0% 1.8 1.3 16% 17% 17% -20% 18% 3% 16%Argentina 10.9 11.6 26.3 11.1 10.8 3.9% 1.9% 2.4% 2.3 2.2 21% 21% 15% 29% 44% 118% 1%Bahrain 9.6 8.6 8.8 8.8 8.0 6.8% 6.8% 7.0% 1.2 1.3 13% 9% 10% 5% 12% -5% 9%Bangladesh 17.7 14.4 17.9 15.7 13.3 2.4% 2.0% 2.6% 3.7 3.1 21% 24% 24% 33% 24% 14% 18%Croatia 10.7 13.6 14.0 13.6 13.5 3.8% 3.6% 3.6% 0.8 1.1 8% 8% 8% 24% -13% 2% 0%Estonia 18.9 14.8 15.8 18.4 14.1 2.9% 8.4% 5.2% 1.0 1.0 5% 5% 7% -18% -6% -14% 30%Ivory Coast 6.1 6.4 7.5% 1.6 26%Jordan 10.7 7.2 11.4 8.2 7.3 5.0% 5.4% 5.7% 0.9 0.6 9% 7% 8% -31% 7% 29% 13%Kazakhstan 7.5 5.0 8.6 6.5 5.7 6.5% 5.5% 8.8% 1.5 1.2 20% 24% 24% -17% 30% 33% 14%Kenya 7.8 8.4 10.3 9.4 8.5 5.6% 6.1% 6.6% 2.8 2.2 36% 29% 30% 3% 11% 10% 11%Kuwait 15.9 7.5 14.3 15.1 13.0 3.4% 7.8% 9.7% 1.7 0.9 11% 11% 12% 9% 4% -5% 16%Lebanon 4.8 3.9 5.6 3.9 11.6% 0.0% 0.0% 0.6 0.5 14% 13% -1% 16% 4%Lithuania 6.0 7.0 9.5 5.4 6.9 3.0% 2.4% 3.7% 1.0 0.8 17% 19% 13% 83% -32% 52% -21%Mauritius 8.4 7.3 9.4 8.2 7.3 3.7% 3.8% 4.3% 1.3 1.1 15% 15% 15% 15% 1% 14% 13%Morocco 18.8 16.4 18.1 18.2 17.2 3.8% 3.9% 4.0% 3.4 2.5 18% 17% 17% 11% 10% 2% 6%Nigeria 6.0 5.7 6.7 6.3 5.6 6.8% 7.0% 7.5% 1.2 0.5 20% 19% 20% 13% 32% 13% 8%Oman 7.5 6.2 7.1 7.4 6.5 7.0% 6.7% 7.1% 0.8 0.6 11% 10% 11% -7% -10% -4% 14%Romania 6.8 6.6 7.2 6.6 6.7 10.4% 9.2% 9.0% 1.0 0.9 15% 15% 14% -35% 35% 9% -1%Saudi Arabia 15.0 14.1 16.3 14.9 13.8 4.0% 3.2% 4.0% 1.9 1.8 13% 11% 12% -1% 11% 9% 8%Senegal 12.3 10.7 9.4 8.8 9.8% 9.7% 10.3% 3.1 2.2 25% 26% 26% -4% -15% 13% 7%Serbia 14.0 2.7 6.0 3.8 3.4 6.3% 1.9 14%Slovenia 10.8 10.2 11.5 11.1 10.4 5.6% 5.7% 6.0% 1.2 1.1 11% 10% 11% -21% 30% 4% 7%Sri Lanka 10.3 12.1 14.0 11.1 12.3 4.0% 4.3% 4.5% 1.1 1.0 11% 9% 9% 7% 2% 26% -10%Tunisia 15.7 15.8 14.9 13.5 3.0% 3.0% 3.1% 3.6 23% 21% 21% 31% 14% 2% 9%Vietnam 21.8 16.4 25.3 19.0 16.1 2.9% 2.0% 2.2% 3.6 3.3 17% 22% 22% 48% 21% 11% 19%Note: excludes companies with negative earnings, except 12M fwd P/E, which are Bloomberg convention. EM and Frontier aggregate EPS growth is Bloomberg convention
EM 12M fwd P/E vs 10yr average FM 12M fwd P/E vs 10yr average
Source: Bloomberg
Valuation watch - key metrics
0
24
6
8
10
12
14
16
18
20
Indi
aPh
ilippi
nes
Mal
aysi
aC
hile
Indo
nesi
aG
reec
eTh
aila
ndPe
ruM
exic
oC
zech
Qat
arS
Afric
aTa
iwan
Braz
ilPo
land
Col
ombi
aEM
Chi
naH
unga
ryU
AEKo
rea
Egyp
tPa
kist
anTu
rkey
Rus
sia
12M fwd P/E 10 yr avg
0
2
4
6
8
10
12
14
16
18
Viet
nam
Mor
occo
Esto
nia
Bang
lade
shSa
udi A
rabi
aC
roat
iaSr
i Lan
kaAr
gent
ina
Slov
enia
Fron
tier
Bahr
ain
Keny
aKu
wai
tM
aurit
ius
Jord
anLi
thua
nia
Rom
ania
Om
anN
iger
iaKa
zakh
stan
12M fwd P/E 10 yr avg
Renaissance Capital 14 January 2019
ESG
103

Country MSCI EM vs DM 12M fwd P/E (x)EM 16.5 21.6 8.5 7.6 22.1 11.2 10.2 9.4 6.6 19.8 11.4 11.0 11.6 11.2 11.0India 18.0 40.8 17.3 11.1 20.5 20.0 16.7 13.3 10.2 17.3 16.7 15.6 17.4Philippines 38.0 26.5 14.1 16.2 21.5 12.6 14.9 16.9 18.1 16.8 15.4Malaysia 12.2 27.3 12.5 28.2 33.2 14.8 15.7 13.8 23.0 13.6 15.7 15.7 15.1 15.8Chile 22.4 17.7 15.7 14.5 21.1 15.3 28.6 11.5 15.4 15.6 15.7 17.5Indonesia 13.6 25.0 14.4 8.1 29.0 17.3 12.2 12.2 16.8 15.1 15.1 15.0 14.1 14.0Greece 11.5 36.3 15.8 15.8 13.8 19.8 15.1 18.6Thailand 25.0 24.1 10.1 10.4 30.6 34.1 13.7 9.2 20.6 19.0 18.4 13.8 13.9 12.5 14.1Peru 13.2 15.7 13.8 13.2 12.8 17.1Mexico 20.1 21.2 8.6 14.7 9.4 10.0 15.0 13.6 13.6 17.2 16.2 11.3Czech 11.1 17.9 13.5 13.8 12.1 14.3Qatar 12.9 17.0 12.1 12.8 13.4 12.6 11.6 13.1S Africa 15.1 18.1 10.9 5.2 11.3 13.9 10.0 10.2 19.2 13.2 14.9 13.2 11.2Taiwan 15.4 23.8 10.2 16.6 235.2 14.3 12.9 12.3 22.6 12.9 13.2 14.2 13.9 MSCI EM 12M fwd P/E (x) prem/disc. to DMBrazil 23.6 20.0 12.0 8.6 16.0 21.4 9.6 8.4 20.2 13.6 12.6 11.8 11.7 11.2 12.5Poland 20.5 25.2 12.2 10.3 7.0 26.2 11.8 12.3 11.9 13.5Colombia 10.1 10.2 31.7 10.3 11.3 12.5 14.8 14.6China 19.3 19.0 6.0 8.8 16.9 7.8 13.2 5.9 5.1 20.5 10.4 10.3 10.8 10.8 9.3Hungary 9.9 8.4 14.6 10.0 10.8 9.8 12.2UAE 10.2 11.3 5.0 16.2 9.0 12.2 10.9 11.4Korea 9.0 16.4 5.9 7.6 65.0 10.4 7.1 8.3 17.6 16.1 8.5 9.5 9.5 8.4Egypt 8.2 8.3 8.4 8.3 10.3 9.3 9.1Pakistan 7.9 6.0 7.1 8.8 7.9 9.7Turkey 9.0 18.0 4.5 6.1 6.2 5.3 8.2 6.2 8.4 8.9 6.1Russia 12.7 4.8 5.2 8.3 8.3 4.8 5.6 5.8 6.0 6.3
Frontier 16.6 20.7 9.9 9.8 13.1 11.4 27.5 9.7 18.2 14.0 10.6 9.5 10.6 9.8 9.5Vietnam 21.8 15.6 9.3 5.8 19.4 14.3 16.4 16.4 14.0 15.2 MSCI FM vs EM 12M fwd P/E (x)Morocco 8.9 15.5 14.9 20.3 20.0 16.4 16.5 14.9 17.3Estonia 14.0 14.8 10.7 9.1 11.8Bangladesh 13.1 14.6 14.3 14.4 13.7 13.2 16.1Saudi Arabia 15.6 23.0 12.5 13.7 20.1 11.7 13.8 23.7 18.0 15.0 14.1 13.4 12.7 14.9Croatia 14.4 13.1 13.6 12.1 11.2 11.6Sri Lanka 16.2 11.8 12.1 12.1 13.1 11.5Argentina 22.5 8.6 13.9 8.9 27.5 18.6 12.4 8.7 11.6 10.0 8.4 11.3Slovenia 9.4 10.3 10.2 10.8 11.6 12.7Bahrain 8.8 6.3 8.6 8.7 8.6 11.3Kenya 14.6 5.0 13.0 8.4 11.1 10.6 7.1Kuwait 10.8 1.1 10.2 12.6 7.5 11.7 11.6 7.3Mauritius 7.3 7.3 10.2 9.2 10.1Jordan 7.2 7.2 8.3 8.7 10.0Lithuania 6.8 7.0 7.7 14.4 9.4 MSCI FM 12M fwd P/E (x) prem/disc. to EMRomania 7.2 5.8 12.0 6.6 9.4 8.7 9.4Oman 6.5 5.7 6.2 8.5 8.8 7.8Nigeria 19.4 3.8 7.3 10.9 5.7 8.1 8.5 5.7Kazakhstan 4.1 15.0 5.0 6.7 6.4 6.0*Sector Neutral P/E
EM Sector neutral 12M fwd P/E vs actual 12M fwd P/E FM Sector neutral 12M fwd P/E vs actual 12M fwd P/E
Source: Bloomberg
S.N
P/E
*
Ove
rall
10yr
avg
5yr a
vg
Valuation watch - 12M fwd P/E focus
Con
s. D
isc.
Con
s. S
tple
s
Fina
ncia
ls
Ener
gy
Tele
com
s
Util
ities
Hea
lthca
re
Indu
stria
ls
IT Mat
eria
ls
Rea
l Est
ate
0
2
4
6
8
10
12
14
16
18
20
Gre
ece
Chi
leIn
dia
Peru
Mal
aysi
aPh
ilippi
nes
Col
ombi
aC
zech
Thai
land
Indo
nesi
aTa
iwan
Pola
ndQ
atar
Braz
ilH
unga
ryU
AEM
exic
oS
Afric
aEM
Paki
stan
Chi
naEg
ypt
Kore
aR
ussi
aTu
rkey
Sector neutral 12M fwd P/E 12M fwd P/E
02468
101214161820
Mor
occo
Bang
lade
shVi
etna
mSa
udi A
rabi
aSl
oven
iaEs
toni
aC
roat
iaSr
i Lan
kaBa
hrai
nAr
gent
ina
Mau
ritiu
sJo
rdan
Fron
tier
Rom
ania
Lith
uani
aO
man
Kuw
ait
Keny
aKa
zakh
stan
Nig
eria
Sector neutral 12M fwd P/E 12M fwd P/E
4
6
8
10
12
14
16
18
Jan-
06
Jan-
08
Jan-
10
Jan-
12
Jan-
14
Jan-
16
Jan-
18
EM 12M fwd P/E (x)DM 12M fwd P/E (x)
-40%
-30%
-20%
-10%
0%
10%
Jan-
06Ja
n-07
Jan-
08Ja
n-09
Jan-
10Ja
n-11
Jan-
12Ja
n-13
Jan-
14Ja
n-15
Jan-
16Ja
n-17
Jan-
18Ja
n-19
EM premium/discount to DM
-1 SD
+1 SD
avg
4
6
8
10
12
14
Jan-
10
Jan-
11
Jan-
12
Jan-
13
Jan-
14
Jan-
15
Jan-
16
Jan-
17
Jan-
18
Jan-
19
FM 12M fwd P/E (x)EM 12M fwd P/E (x)
-30%
-20%
-10%
0%
10%
20%
30%
Jan-
10
Jan-
11
Jan-
12
Jan-
13
Jan-
14
Jan-
15
Jan-
16
Jan-
17
Jan-
18
Jan-
19
FM premium/discount to EM
-1 SD
+1 SD
avg
Renaissance Capital 14 January 2019
ESG
104

Best/Worst 12MF Best/Worst 12MFName Ticker Country Sector -1m P/E (x) Name Ticker Country Sector 2018 P/E (x)Viromed 084990 KQ Korea Healthcare 29.4 Tjiwi Kimia TKIM IJ Indonesia Materials 255.7 7.0China Tower Co-H 788 HK China Communications 27.5 40.8 Fila Korea Ltd 081660 KP Korea Cons. Disc. 214.9 14.0Anglogold Ashanti ANG SJ S Africa Materials 26.4 15.1 Yihai Internatio 1579 HK China Cons. Staples 154.2 28.2Rural Electrification RECL IS India Financials 22.4 China Ding Yi Fe 612 HK China Financials 144.4Amorepacific 090430 KP Korea Cons. Staples 22.0 24.7 Daewoo Shipbldg 042660 KP Korea Industrials 136.0 15.3CP Indonesia CPIN IJ Indonesia Cons. Staples 19.8 26.8 CP Indonesia CPIN IJ Indonesia Cons. Staples 125.4 26.8Indiabulls Housing Fin. IHFL IS India Financials 19.4 7.1 Irb Brasil Resse IRBR3 BS Brazil Financials 109.6 17.3Gold Fields GFI SJ S Africa Materials 18.3 19.7 Indah Kiat Pulp INKP IJ Indonesia Materials 100.1 6.9Alfa ALFAA MM Mexico Industrials 18.3 10.7 Jiayuan Internat 2768 HK China Real Estate 98.9Samsung Biologics 207940 KP Korea Healthcare 17.5 Hlb Inc 028300 KQ Korea Cons. Disc. 98.6GAP Airports GAPB MM Mexico Industrials 17.2 17.8 Magazine Luiza S MGLU3 BS Brazil Cons. Disc. 92.7 44.5Amplats AMS SJ S Africa Materials 17.0 16.1 B2W Cia Digital BTOW3 BS Brazil Cons. Disc. 75.0China First Capi 1269 HK China Cons. Disc. 17.0 Suzano Papel SUZB3 BS Brazil Materials 73.9 7.2Perfect World -A 002624 C2 China Communications 16.8 15.3 Cemig (P) CMIG4 BS Brazil Utilities 72.2 10.1Telekom Malaysia T MK Malaysia Communications 15.4 17.4 Bukit Asam Tbk P PTBA IJ Indonesia Energy 63.6 9.1Hdc Hyundai Deve 294870 KP Korea Industrials 15.3 Alibaba Health 241 HK China Healthcare 60.4 225.3JG Summit JGS PM Philippines Industrials 15.3 16.9 Qatar Islamic Bk. QIBK QD Qatar Financials 57.1 14.5Buenaventura BVN UN Peru Materials 14.7 18.0 Kingdee Intl Sft 268 HK China IT 56.9 38.4Tsingtao Brew-A 600600 C1 China Cons. Staples 14.4 26.1 Qatar National Bk. QNBK QD Qatar Financials 55.2 12.7Amorepacific (P) 090435 KP Korea Cons. Staples 14.3 Ql Resources Bhd QLG MK Malaysia Cons. Staples 53.8 43.6Shandong Gold-A 600547 C1 China Materials 13.1 35.5 Posco Chemtech 003670 KQ Korea Materials 53.7 19.8Amorepacific Grp. 002790 KP Korea Cons. Staples 12.6 25.4 Viromed 084990 KQ Korea Healthcare 49.4Ultrapar UGPA3 BS Brazil Energy 12.5 19.7 Gs E&C 006360 KP Korea Industrials 48.5 6.5Interglobe Aviat INDIGO IS India Industrials 12.3 19.8 China First Capi 1269 HK China Cons. Disc. 47.0ASUR ASURB MM Mexico Industrials 12.1 16.9 Hyundai E&C 000720 KP Korea Industrials 44.5 12.1Elswedy Electri SWDY EC Egypt Industrials 12.1 8.4 Guangdong Investment 270 HK China Utilities 44.4 18.4KEPCO 015760 KP Korea Utilities 12.0 19.9 Walsin Tech 2492 TT Taiwan IT 42.5China Yangtze-A 600900 C1 China Utilities 12.0 15.4 Novatek NVTK LI Russia Energy 42.3 13.0Bharat Petroleum BPCL IS India Energy 11.9 8.2 Grupa Lotos LTS PW Poland Energy 41.6 11.0Sise Cam SISE TI Turkey Industrials 11.6 6.2 Nestle Malaysia NESZ MK Malaysia Cons. Staples 40.3 45.2China Galaxy Securities 6881 HK China Financials -15.8 10.2 Wuhu Shunrong-A 002555 C2 China Communications -56.5 11.0Brilliance China 1114 HK China Cons. Disc. -15.8 3.7 China Literature 772 HK China Communications -56.6 21.5Sinopec 386 HK China Energy -16.0 8.7 Kingsoft 3888 HK China IT -56.7 17.3Shenzhen Salub-A 002294 C2 China Healthcare -16.6 12.1 Boe Technology-A 000725 C2 China IT -57.0 13.9Walsin Tech 2492 TT Taiwan IT -17.0 360 Security T-A 601360 C1 China IT -57.7 30.4China Taiping 966 HK China Financials -17.1 6.5 Focus Media In-A 002027 C2 China IT -57.8 11.0Baozun Inc-Adr BZUN UW China Cons. Disc. -17.2 20.5 O-Film Tech Co-A 002456 C2 China IT -57.8 9.0Sina Corp SINA UW China Communications -17.2 16.6 Sanan Optoelec-A 600703 C1 China IT -57.9 11.1Shanghai Pharma 2607 HK China Healthcare -17.6 8.4 Aspen Pharmacare APN SJ S Africa Healthcare -58.1 8.2AAC Tech 2018 HK China IT -18.1 10.2 Tus-Sound Envi-A 000826 C2 China Industrials -58.3 8.0Jiangsu Hengru-A 600276 C1 China Healthcare -18.5 40.1 Telekom Malaysia T MK Malaysia Communications -58.5 17.4O-Film Tech Co-A 002456 C2 China IT -19.0 9.0 Kroton Educacional KROT3 BS Brazil Cons. Disc. -58.8 9.0Damac DAMAC DB UAE Real Estate -19.2 5.9 Win Semiconductors 3105 TT Taiwan IT -59.5 17.7Sanan Optoelec-A 600703 C1 China IT -19.8 11.1 Baic Motor-H 1958 HK China Cons. Disc. -59.5 4.6Wuhu Shunrong-A 002555 C2 China Communications -20.1 11.0 China Medical 867 HK China Healthcare -60.1 7.1Sihuan Pharma 460 HK China Healthcare -21.3 7.5 Hangzhou Robam-A 002508 C2 China Cons. Disc. -60.3 11.7Huadong Medici-A 000963 C2 China Healthcare -21.6 13.3 Kangmei Pharma-A 600518 C1 China Healthcare -61.0 6.1Gds Hldgs - Adr GDS UQ China IT -21.7 China Huarong 2799 HK China Financials -61.3 4.2Zhongan Online-H 6060 HK China Financials -21.9 Anxin Trust Co-A 600816 C1 China Financials -62.1 13.3Genscript Biotec 1548 HK China Healthcare -22.4 69.8 Goertek Inc -A 002241 C2 China IT -62.5 12.7Globalwafers 6488 TT Taiwan IT -22.6 7.9 Tata Motors TTMT IS India Cons. Disc. -63.4 9.1Wuxi Biologics C 2269 HK China Healthcare -23.6 61.5 Resilient RES SJ S Africa Real Estate -63.8Momo MOMO UW China Communications -24.2 9.5 Zhongan Online-H 6060 HK China Financials -63.9Sino Biopharm 1177 HK China Healthcare -27.8 17.4 Citic Guoan-A 000839 C2 China Communications -66.8Ssy Group Ltd 2005 HK China Healthcare -27.8 14.9 AAC Tech 2018 HK China IT -67.5 10.2CSPC Pharma 1093 HK China Healthcare -28.7 16.2 Cielo CIEL3 BS Brazil IT -67.7 9.7Meitu 1357 HK China IT -32.7 Idea Cellular IDEA IS India Communications -68.0Hutchison Ch-Adr HCM UW China Healthcare -33.0 Fortress Income B FFB SJ S Africa Real Estate -70.4 7.8Tatung 2371 TT Taiwan Cons. Disc. -35.4 Brilliance China 1114 HK China Cons. Disc. -72.2Fullshare Holdings 607 HK China Industrials -39.2 Meitu 1357 HK China IT -79.9
Source: Bloomberg
Top and bottom 30 - EM ($)
Renaissance Capital 14 January 2019
ESG
105
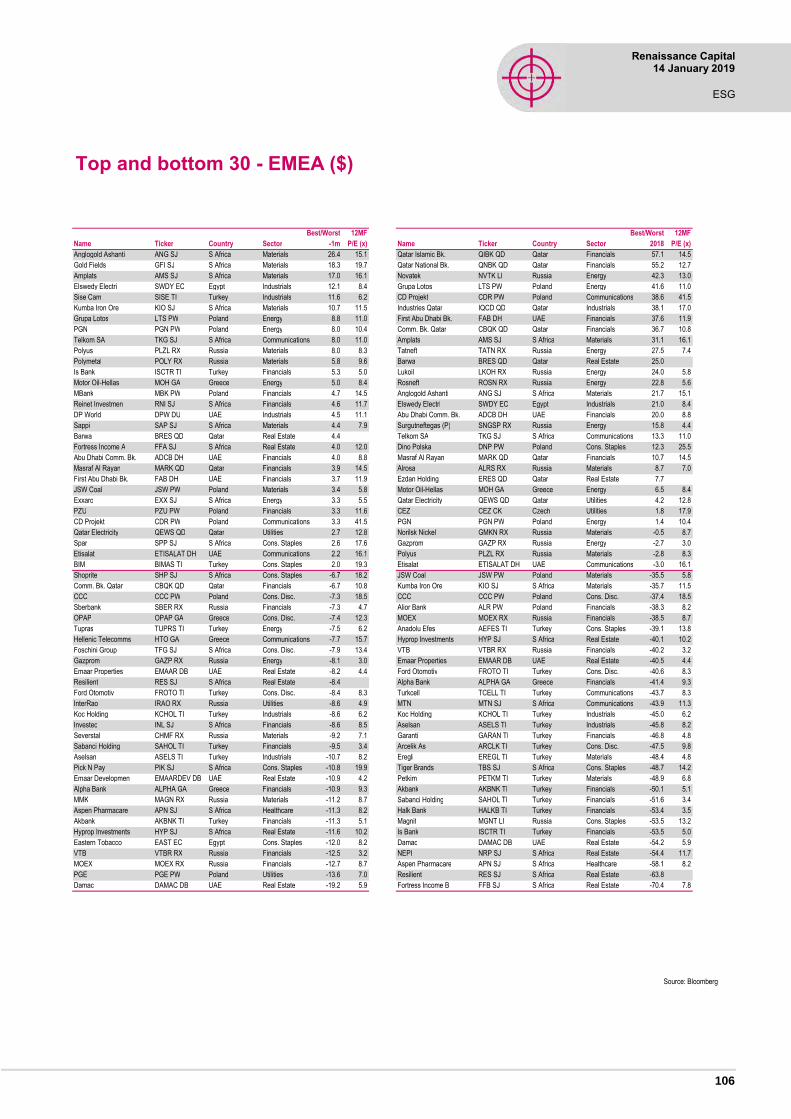
Best/Worst 12MF Best/Worst 12MFName Ticker Country Sector -1m P/E (x) Name Ticker Country Sector 2018 P/E (x)Anglogold Ashanti ANG SJ S Africa Materials 26.4 15.1 Qatar Islamic Bk. QIBK QD Qatar Financials 57.1 14.5Gold Fields GFI SJ S Africa Materials 18.3 19.7 Qatar National Bk. QNBK QD Qatar Financials 55.2 12.7Amplats AMS SJ S Africa Materials 17.0 16.1 Novatek NVTK LI Russia Energy 42.3 13.0Elswedy Electri SWDY EC Egypt Industrials 12.1 8.4 Grupa Lotos LTS PW Poland Energy 41.6 11.0Sise Cam SISE TI Turkey Industrials 11.6 6.2 CD Projekt CDR PW Poland Communications 38.6 41.5Kumba Iron Ore KIO SJ S Africa Materials 10.7 11.5 Industries Qatar IQCD QD Qatar Industrials 38.1 17.0Grupa Lotos LTS PW Poland Energy 8.8 11.0 First Abu Dhabi Bk. FAB DH UAE Financials 37.6 11.9PGN PGN PW Poland Energy 8.0 10.4 Comm. Bk. Qatar CBQK QD Qatar Financials 36.7 10.8Telkom SA TKG SJ S Africa Communications 8.0 11.0 Amplats AMS SJ S Africa Materials 31.1 16.1Polyus PLZL RX Russia Materials 8.0 8.3 Tatneft TATN RX Russia Energy 27.5 7.4Polymetal POLY RX Russia Materials 5.8 9.6 Barwa BRES QD Qatar Real Estate 25.0Is Bank ISCTR TI Turkey Financials 5.3 5.0 Lukoil LKOH RX Russia Energy 24.0 5.8Motor Oil-Hellas MOH GA Greece Energy 5.0 8.4 Rosneft ROSN RX Russia Energy 22.8 5.6MBank MBK PW Poland Financials 4.7 14.5 Anglogold Ashanti ANG SJ S Africa Materials 21.7 15.1Reinet Investmen RNI SJ S Africa Financials 4.6 11.7 Elswedy Electri SWDY EC Egypt Industrials 21.0 8.4DP World DPW DU UAE Industrials 4.5 11.1 Abu Dhabi Comm. Bk. ADCB DH UAE Financials 20.0 8.8Sappi SAP SJ S Africa Materials 4.4 7.9 Surgutneftegas (P) SNGSP RX Russia Energy 15.8 4.4Barwa BRES QD Qatar Real Estate 4.4 Telkom SA TKG SJ S Africa Communications 13.3 11.0Fortress Income A FFA SJ S Africa Real Estate 4.0 12.0 Dino Polska DNP PW Poland Cons. Staples 12.3 25.5Abu Dhabi Comm. Bk. ADCB DH UAE Financials 4.0 8.8 Masraf Al Rayan MARK QD Qatar Financials 10.7 14.5Masraf Al Rayan MARK QD Qatar Financials 3.9 14.5 Alrosa ALRS RX Russia Materials 8.7 7.0First Abu Dhabi Bk. FAB DH UAE Financials 3.7 11.9 Ezdan Holding ERES QD Qatar Real Estate 7.7JSW Coal JSW PW Poland Materials 3.4 5.8 Motor Oil-Hellas MOH GA Greece Energy 6.5 8.4Exxaro EXX SJ S Africa Energy 3.3 5.5 Qatar Electricity QEWS QD Qatar Utilities 4.2 12.8PZU PZU PW Poland Financials 3.3 11.6 CEZ CEZ CK Czech Utilities 1.8 17.9CD Projekt CDR PW Poland Communications 3.3 41.5 PGN PGN PW Poland Energy 1.4 10.4Qatar Electricity QEWS QD Qatar Utilities 2.7 12.8 Norilsk Nickel GMKN RX Russia Materials -0.5 8.7Spar SPP SJ S Africa Cons. Staples 2.6 17.6 Gazprom GAZP RX Russia Energy -2.7 3.0Etisalat ETISALAT DH UAE Communications 2.2 16.1 Polyus PLZL RX Russia Materials -2.8 8.3BIM BIMAS TI Turkey Cons. Staples 2.0 19.3 Etisalat ETISALAT DH UAE Communications -3.0 16.1Shoprite SHP SJ S Africa Cons. Staples -6.7 18.2 JSW Coal JSW PW Poland Materials -35.5 5.8Comm. Bk. Qatar CBQK QD Qatar Financials -6.7 10.8 Kumba Iron Ore KIO SJ S Africa Materials -35.7 11.5CCC CCC PW Poland Cons. Disc. -7.3 18.5 CCC CCC PW Poland Cons. Disc. -37.4 18.5Sberbank SBER RX Russia Financials -7.3 4.7 Alior Bank ALR PW Poland Financials -38.3 8.2OPAP OPAP GA Greece Cons. Disc. -7.4 12.3 MOEX MOEX RX Russia Financials -38.5 8.7Tupras TUPRS TI Turkey Energy -7.5 6.2 Anadolu Efes AEFES TI Turkey Cons. Staples -39.1 13.8Hellenic Telecomms HTO GA Greece Communications -7.7 15.7 Hyprop Investments HYP SJ S Africa Real Estate -40.1 10.2Foschini Group TFG SJ S Africa Cons. Disc. -7.9 13.4 VTB VTBR RX Russia Financials -40.2 3.2Gazprom GAZP RX Russia Energy -8.1 3.0 Emaar Properties EMAAR DB UAE Real Estate -40.5 4.4Emaar Properties EMAAR DB UAE Real Estate -8.2 4.4 Ford Otomotiv FROTO TI Turkey Cons. Disc. -40.6 8.3Resilient RES SJ S Africa Real Estate -8.4 Alpha Bank ALPHA GA Greece Financials -41.4 9.3Ford Otomotiv FROTO TI Turkey Cons. Disc. -8.4 8.3 Turkcell TCELL TI Turkey Communications -43.7 8.3InterRao IRAO RX Russia Utilities -8.6 4.9 MTN MTN SJ S Africa Communications -43.9 11.3Koc Holding KCHOL TI Turkey Industrials -8.6 6.2 Koc Holding KCHOL TI Turkey Industrials -45.0 6.2Investec INL SJ S Africa Financials -8.6 8.5 Aselsan ASELS TI Turkey Industrials -45.8 8.2Severstal CHMF RX Russia Materials -9.2 7.1 Garanti GARAN TI Turkey Financials -46.8 4.8Sabanci Holding SAHOL TI Turkey Financials -9.5 3.4 Arcelik As ARCLK TI Turkey Cons. Disc. -47.5 9.8Aselsan ASELS TI Turkey Industrials -10.7 8.2 Eregli EREGL TI Turkey Materials -48.4 4.8Pick N Pay PIK SJ S Africa Cons. Staples -10.8 19.9 Tiger Brands TBS SJ S Africa Cons. Staples -48.7 14.2Emaar Developmen EMAARDEV DB UAE Real Estate -10.9 4.2 Petkim PETKM TI Turkey Materials -48.9 6.8Alpha Bank ALPHA GA Greece Financials -10.9 9.3 Akbank AKBNK TI Turkey Financials -50.1 5.1MMK MAGN RX Russia Materials -11.2 8.7 Sabanci Holding SAHOL TI Turkey Financials -51.6 3.4Aspen Pharmacare APN SJ S Africa Healthcare -11.3 8.2 Halk Bank HALKB TI Turkey Financials -53.4 3.5Akbank AKBNK TI Turkey Financials -11.3 5.1 Magnit MGNT LI Russia Cons. Staples -53.5 13.2Hyprop Investments HYP SJ S Africa Real Estate -11.6 10.2 Is Bank ISCTR TI Turkey Financials -53.5 5.0Eastern Tobacco EAST EC Egypt Cons. Staples -12.0 8.2 Damac DAMAC DB UAE Real Estate -54.2 5.9VTB VTBR RX Russia Financials -12.5 3.2 NEPI NRP SJ S Africa Real Estate -54.4 11.7MOEX MOEX RX Russia Financials -12.7 8.7 Aspen Pharmacare APN SJ S Africa Healthcare -58.1 8.2PGE PGE PW Poland Utilities -13.6 7.0 Resilient RES SJ S Africa Real Estate -63.8Damac DAMAC DB UAE Real Estate -19.2 5.9 Fortress Income B FFB SJ S Africa Real Estate -70.4 7.8
Source: Bloomberg
Top and bottom 30 - EMEA ($)
Renaissance Capital 14 January 2019
ESG
106

Best/Worst 12MF Best/Worst 12MFName Ticker Country Sector -1m P/E (x) Name Ticker Country Sector 2018 P/E (x)Bupa Arabia BUPA AB Saudi Arabia Financials 14.9 15.3 United Power Gen UPGO BD Bangladesh Utilities 108.3Riyad Bank RIBL AB Saudi Arabia Financials 13.3 12.0 Riyad Bank RIBL AB Saudi Arabia Financials 58.5 12.0FBN Holdings FBNH NL Nigeria Financials 12.1 3.7 Vingroup VIC VM Vietnam Real Estate 46.1 31.8Ciments Du Maroc CMA MC Morocco Materials 12.0 Boubyan Petroch BPCC KK Kuwait Materials 44.7 1.1Valamar Riviera RIVPRA ZA Croatia Cons. Disc. 10.7 14.3 Jarir Marketing JARIR AB Saudi Arabia Cons. Disc. 38.1 18.1Saudi Telecom STC AB Saudi Arabia Communications 10.6 18.6 Bahrain Telecom BATELCO BI Bahrain Communications 37.3Alinma Bank ALINMA AB Saudi Arabia Financials 10.3 13.6 Al Rajhi Bank RJHI AB Saudi Arabia Financials 35.4 14.0BIDV BID VM Vietnam Financials 10.2 16.3 Boubyan Bank BOUBYAN KK Kuwait Financials 34.1 28.4Bank Albilad ALBI AB Saudi Arabia Financials 9.4 14.2 Saudi Telecom STC AB Saudi Arabia Communications 33.8 18.6Seplat SEPLAT NL Nigeria Energy 8.7 6.0 Samba Financial Group SAMBA AB Saudi Arabia Financials 33.6 12.1FLC Faros Const. ROS VM Vietnam Industrials 8.1 Bao Viet Holdings BVH VM Vietnam Financials 33.5 32.7Saigon Beer SAB VM Vietnam Cons. Staples 7.6 28.2 Bank Albilad ALBI AB Saudi Arabia Financials 33.0 14.2Mouwasat Medical MOUWASAT AB Saudi Arabia Healthcare 7.3 20.1 BIDV BID VM Vietnam Financials 32.1 16.3Arab National Bank ARNB AB Saudi Arabia Financials 7.1 9.2 National Petrochem PETROCH AB Saudi Arabia Materials 31.1 10.7Soc Gen Cote d'Ivoire SGBC BC Ivory Coast Financials 7.0 Bupa Arabia BUPA AB Saudi Arabia Financials 30.6 15.3Bahrain Telecom BATELCO BI Bahrain Communications 6.9 Nat'l Comm. Bank NCB AB Saudi Arabia Financials 30.3 12.4Nat'l Comm. Bank NCB AB Saudi Arabia Financials 6.3 12.4 Arab National Bank ARNB AB Saudi Arabia Financials 29.1 9.2Aerodrom Nikola Tesla AERO SG Serbia Industrials 6.0 Alawwal Bank ALAWWAL AB Saudi Arabia Financials 27.5 14.0Solidere - B SOLB LB Lebanon Real Estate 5.6 No Va Land NVL VM Vietnam Real Estate 26.5Saudi Cement SACCO AB Saudi Arabia Materials 5.6 19.1 Saudi Kayan Petchem KAYAN AB Saudi Arabia Materials 23.6 11.6Al Eqbal EICO JR Jordan Cons. Staples 5.4 Bank Al-Jazira BJAZ AB Saudi Arabia Financials 23.1 12.3Arab Bank ARBK JR Jordan Financials 5.4 7.2 Globant GLOB UN Argentina IT 21.2 29.3Saudi Arabian Mining MAADEN AB Saudi Arabia Materials 5.4 29.3 Saudi British Bank SABB AB Saudi Arabia Financials 20.9 11.0LafargeHolcim Maroc LHM MC Morocco Materials 5.2 Alinma Bank ALINMA AB Saudi Arabia Financials 20.1 13.6Emp Distrib-Adr EDN UN Argentina Utilities 5.1 7.4 Nat'l Bank of Kuwait NBK KK Kuwait Financials 19.6 12.3Krka KRKG SV Slovenia Healthcare 4.7 10.5 Saudi Industrial SIIG AB Saudi Arabia Materials 19.4 8.2Loma Negra C-Adr LOMA UN Argentina Materials 4.6 17.1 Saudi Arabian Fertilizer SAFCO AB Saudi Arabia Materials 18.4 16.6Kcell Jsc KCEL LI Kazakhstan Communications 4.4 15.5 Ceylon Tobacco CTC SL Sri Lanka Cons. Staples 18.2 15.9Consumar CSR MC Morocco Cons. Staples 3.8 15.1 Kuwait Finance House KFH KK Kuwait Financials 16.1 15.4Boubyan Bank BOUBYAN KK Kuwait Financials 3.8 28.4 Rabigh Refining PETROR AB Saudi Arabia Energy 16.0 14.7Hoa Phat Group HPG VM Vietnam Materials -6.3 5.9 EABL EABL KN Kenya Cons. Staples -25.6 14.5Bao Viet Holdings BVH VM Vietnam Financials -6.6 32.7 UBA UBA NL Nigeria Financials -26.0 2.8Rabigh Refining PETROR AB Saudi Arabia Energy -6.6 14.7 Al Tayyar ALTAYYAR AB Saudi Arabia Cons. Disc. -26.0 11.0EABL EABL KN Kenya Cons. Staples -6.9 14.5 Saudi Electricity SECO AB Saudi Arabia Utilities -28.1 15.0Unilever Nigeria UNILEVER NL Nigeria Cons. Staples -7.1 16.7 Vincom Retail VRE VM Vietnam Real Estate -29.0 18.0Vietjet VJC VM Vietnam Industrials -7.9 9.5 Petrolimex PLX VM Vietnam Energy -30.8Petrolimex PLX VM Vietnam Energy -8.1 Savola SAVOLA AB Saudi Arabia Cons. Staples -32.2 26.1Saudi Industrial SIIG AB Saudi Arabia Materials -8.5 8.2 Vietnam Dairy VNM VM Vietnam Cons. Staples -32.4 23.9Vincom Retail VRE VM Vietnam Real Estate -8.6 18.0 Transportador Gas TGS UN Argentina Energy -32.5 10.3Siauliu Bankas SAB1L LH Lithuania Financials -8.9 6.8 Oman Telecom OTEL OM Oman Communications -34.7 5.0Halyk Savings Bank HSBK LI Kazakhstan Financials -9.2 4.1 Sonatel SNTS BC Senegal Communications -35.1 9.1Telecom Argentina TEO UN Argentina Communications -9.4 13.3 Access Bank ACCESS NL Nigeria Financials -35.5 2.0Pampa Energia PAM UN Argentina Utilities -9.5 9.1 Tawuniya TAWUNIYA AB Saudi Arabia Financials -36.1 20.8Tallink Grupp TAL1T ET Estonia Industrials -9.6 16.1 Nigerian Breweries NB NL Nigeria Cons. Staples -37.2 18.0Sonatel SNTS BC Senegal Communications -10.1 9.1 Dar Al Arkan ALARKAN AB Saudi Arabia Real Estate -37.4 23.7YPF YPF UN Argentina Energy -10.6 16.4 Soc Gen Cote d'Ivoire SGBC BC Ivory Coast Financials -38.9Tasnee NIC AB Saudi Arabia Materials -11.0 9.5 GFH Financial GFH DB Bahrain Financials -39.9Equity Group EQBNK KN Kenya Financials -11.2 5.8 Emaar Economic City EMAAR AB Saudi Arabia Real Estate -41.4Ecobank ETI NL Nigeria Financials -12.1 3.1 YPF YPF UN Argentina Energy -41.6 16.4Access Bank ACCESS NL Nigeria Financials -12.1 2.0 Emp Distrib-Adr EDN UN Argentina Utilities -45.6 7.4Managem MNG MC Morocco Materials -12.5 20.3 Managem MNG MC Morocco Materials -47.3 20.3Total Maroc Sa TMA MC Morocco Cons. Disc. -13.3 9.1 Total Maroc Sa TMA MC Morocco Cons. Disc. -50.3 9.1Electrica EL RE Romania Utilities -14.2 11.9 Loma Negra C-Adr LOMA UN Argentina Materials -51.7 17.1Banca Transilvania TLV RE Romania Financials -15.1 6.7 Pampa Energia PAM UN Argentina Utilities -52.7 9.1Corp America Air CAAP UN Argentina Industrials -16.9 9.0 Despegar.Com Cor DESP UN Argentina Cons. Disc. -54.8 66.6Despegar.Com Cor DESP UN Argentina Cons. Disc. -16.9 66.6 Banco Frances BFR UN Argentina Financials -55.0 9.5BRD BRD RE Romania Financials -18.3 7.1 Telecom Argentina TEO UN Argentina Communications -57.5 13.3OMV SNP RE Romania Energy -18.9 5.1 Grupo Galicia GGAL UR Argentina Financials -58.1 11.1GFH Financial GFH DB Bahrain Financials -20.2 Banco Macro BMA UN Argentina Financials -61.8 7.1SNG SNG RE Romania Energy -22.2 6.8 FLC Faros Const. ROS VM Vietnam Industrials -75.0Note: Universe is MSCI Frontier and Saudi Arabia
Source: Bloomberg
Top and bottom 30 - FM ($)
Renaissance Capital 14 January 2019
ESG
107

China 3MADTV, $mn
3MADTV, $mnCurrent -1m % chg -12m % chg
China 19,241 19,705 -2% 31,706 -39%Korea 7,454 8,007 -7% 11,134 -33%India 4,038 4,454 -9% 4,273 -5%Taiwan 3,880 4,259 -9% 5,212 -26%Brazil 3,091 2,999 3% 2,028 52%S Africa 1,338 1,521 -12% 1,741 -23%Turkey 1,236 1,422 -13% 1,917 -36%Thailand 1,111 1,318 -16% 1,608 -31%Russia 920 1,046 -12% 1,087 -15%Indonesia 429 405 6% 405 6% EM Asia ex-China 3MADTV, $mnMexico 363 385 -6% 376 -3%Poland 220 236 -7% 265 -17%Malaysia 209 235 -11% 260 -20%Chile 137 139 -1% 174 -21%UAE 96 96 0% 123 -22%Philippines 86 77 11% 97 -12%Qatar 54 55 -2% 48 12%Greece 52 59 -12% 66 -21%Pakistan 48 49 -3% 56 -15%Hungary 45 45 -1% 43 6%Peru 41 35 17% 49 -15%Colombia 40 44 -10% 42 -5%Egypt 32 34 -5% 43 -25%Czech 25 28 -8% 24 7%
Saudi Arabia 863 889 -3% 954 -10% EM EMEA and LatAm 3MADTV, $mnVietnam 116 143 -19% 200 -42%Argentina 81 100 -19% 135 -40%Kuwait 68 62 11% 43 57%Bangladesh 66 71 -7% 75 -12%Morocco 23 10 121% 15 56%Jordan 16 5 213% 6 172%Serbia 12 8 41% 14 -18%Romania 12 9 23% 9 30%Nigeria 9 8 6% 15 -43%Sri Lanka 6 5 7% 5 8%Kenya 5 6 -11% 6 -12%Oman 4 4 -10% 7 -53%Bahrain 3 4 -17% 2 41%Tunisia 2 1 8% 1 14%Lebanon 1 1 12% 1 12%Kazakhstan 1 1 34% 6 -79% Frontier 3MADTV, $mnSlovenia 1 1 24% 1 -17%Croatia 1 1 2% 1 18%WAEMU 1 1 13% 2 -55%Mauritius 1 1 -14% 2 -53%Estonia 1 1 5% 1 13%Lithuania 0 0 15% 0 1%Note: local market turnover. Peru, Russia, Kazakhstan and Argentina include DRs
Source: Bloomberg
Liquidity watch
12M Trend
0
20,000
40,000
60,000
80,000
100,000
120,000
140,000
160,000
Jan-
11
Jul-1
1
Jan-
12
Jul-1
2
Jan-
13
Jul-1
3
Jan-
14
Jul-1
4
Jan-
15
Jul-1
5
Jan-
16
Jul-1
6
Jan-
17
Jul-1
7
Jan-
18
China 3MADTV, $mn
10,00012,00014,00016,00018,00020,00022,00024,00026,00028,000
Jan-
11
Jul-1
1
Jan-
12
Jul-1
2
Jan-
13
Jul-1
3
Jan-
14
Jul-1
4
Jan-
15
Jul-1
5
Jan-
16
Jul-1
6
Jan-
17
Jul-1
7
Jan-
18
EM Asia ex-China 3MADTV, $mn
1,0002,0003,0004,0005,0006,0007,0008,0009,000
10,000
Jan-
11
Jul-1
1
Jan-
12
Jul-1
2
Jan-
13
Jul-1
3
Jan-
14
Jul-1
4
Jan-
15
Jul-1
5
Jan-
16
Jul-1
6
Jan-
17
Jul-1
7
Jan-
18
EM EMEA 3MADTV, $mn EM LatAm 3MADTV, $mn
0
200
400
600
800
1,000
Jan-
11
Jul-1
1
Jan-
12
Jul-1
2
Jan-
13
Jul-1
3
Jan-
14
Jul-1
4
Jan-
15
Jul-1
5
Jan-
16
Jul-1
6
Jan-
17
Jul-1
7
Jan-
18
Frontier 3MADTV, $mn
Renaissance Capital 14 January 2019
ESG
108

Consensus Real GDP Growth forecast Central Bank Watch CPI Watch 10yr bond yields 5yr Credit ratings*2018 Change 2019 Change Change Latest Change Change CDS Moody's S&P Fitch
Latest -1m YtD Latest -1m YtD Current -1m YtD Print Date -1m YtD YtM -1m -12m spread Rating Rating Rating
US 2.9 0.4 2.6 0.4 2.50 0.25 1.9 Dec-18 -0.3 -0.2 2.70 -0.18 0.16 23.7 Aaa/= AA+u/= AAA/=Japan 0.8 -0.2 -0.4 0.9 -0.1 -0.1 -0.10 0.8 Nov-18 -0.6 -0.2 0.02 -0.03 -0.06 24.9 A1/= A+u/+ A/=UK 1.3 -0.1 1.5 0.1 0.75 2.3 Nov-18 -0.1 -0.7 1.28 0.09 -0.03 41.7 Aa2/= AAu/- AA/-Germany 1.6 -0.1 -0.6 1.6 -0.1 -0.2 0.00 1.7 Dec-18 -0.6 0.0 0.24 0.00 -0.35 15.7 Aaa/= AAAu/= AAA/=France 1.6 -0.2 1.6 -0.1 0.00 1.6 Dec-18 -0.3 0.4 0.66 -0.06 -0.21 41.9 Aa2/+ AAu/= AA/=
Brazil 1.3 -1.2 2.5 0.1 6.50 3.8 Dec-18 -0.3 0.8 9.24 -0.90 -0.67 188.3 Ba2/= BB-/= BB-/=Chile 4.0 1.3 3.4 -0.1 0.4 2.75 2.6 Dec-18 -0.2 0.3 4.48 1.91 1.13 56.6 A1/= A+/= A/=China 6.6 0.2 6.2 4.35 1.9 Dec-18 -0.3 0.1 3.12 -0.18 -0.84 65.2 A1/= A+/= A+/=Colombia 2.6 3.2 0.2 4.25 3.2 Dec-18 -0.1 -0.9 6.68 -0.22 0.34 139.9 Baa2/- BBB-/= BBB/=Czech 3.0 -0.1 -0.4 3.0 0.1 1.75 2.0 Dec-18 0.0 -0.4 1.86 -0.17 -0.02 45.3 A1/+ AA-/= AA-/=Egypt 5.3 0.1 0.8 5.5 0.1 0.4 17.75 12.0 Dec-18 -3.7 -9.9 14.18 0.00 -1.82 401.6 B3/+ B/= B/+Greece 2.0 -0.1 1.9 -0.2 0.00 0.6 Dec-18 -0.4 -0.1 4.28 0.02 0.41 490.0 B3/+ B+/+ BB-/=Hungary 4.5 0.1 0.9 3.4 0.1 0.2 0.90 3.1 Nov-18 -0.7 1.0 2.87 -0.27 0.92 92.3 Baa3/= BBB-/+ BBB-/+India 7.3 0 0.8 7.3 -0.1 6.25 2.3 Nov-18 -1.1 -2.9 7.59 0.06 0.32 113.0 Baa2/= BBB-u/= BBB-/=Indonesia 5.2 -0.1 5.1 -0.4 6.00 3.1 Dec-18 -0.1 -0.5 7.98 -0.30 1.73 134.2 Baa2/= BBB-/= BBB/=Korea 2.6 -0.4 2.5 -0.3 1.75 1.3 Dec-18 -0.7 -0.1 2.00 0.01 -0.60 39.8 Aa2/= AA/= AA-/=Malaysia 4.7 -0.6 4.6 -0.7 3.25 0.2 Nov-18 -0.4 -3.3 4.06 -0.03 0.18 106.3 A3/= A-/= A-/=Mexico 2.1 -0.1 2.0 -0.4 8.25 0.25 4.8 Dec-18 0.1 -1.9 8.63 -0.44 1.01 139.1 A3/= BBB+/= BBB+/-Pakistan 5.4 0.3 4.4 -0.1 -1.5 10.50 6.2 Dec-18 -0.3 1.6 13.15 0.40 4.75 478.4 B3/- B/= B-/=Peru 3.8 -0.2 0.1 3.9 -0.1 2.75 2.2 Dec-18 0.0 0.8 5.56 -0.27 0.56 88.4 A3/= BBB+/= BBB+/=Philippines 6.3 -0.3 6.4 -0.2 4.75 5.1 Dec-18 -0.9 2.2 6.53 -0.68 1.60 87.6 Baa2/= BBB/+ BBB/=Poland 5.0 0.2 1.2 3.7 0.1 0.3 1.50 1.1 Dec-18 -0.2 -1.0 2.81 -0.21 -0.55 69.9 A2/= A-/= A-/=Qatar 2.5 0.2 -0.2 2.9 0.3 0.6 2.50 -0.2 Nov-18 0.0 -0.8 4.07 0.00 -0.51 83.5 Aa3/= AA-/= AA-/=Russia 1.7 -0.2 1.5 -0.3 7.75 0.25 4.3 Dec-18 0.5 1.8 8.48 -0.28 0.91 147.5 Ba1/+ BBB-/= BBB-/+S Africa 0.7 -0.6 1.5 -0.1 -0.2 6.75 5.2 Nov-18 0.1 0.5 4.06 -0.06 0.33 213.7 Baa3/= BB/= BB+/=Taiwan 2.7 0.2 2.3 1.38 -0.1 Dec-18 -0.4 -1.3 0.87 -0.02 -0.16 - Aa3/= AA-u/= AA-/=Thailand 4.2 0.5 3.9 0.4 1.75 0.25 0.4 Dec-18 -0.6 -0.4 2.49 -0.15 0.20 46.2 Baa1/= BBB+/= BBB+/=Turkey 3.3 -0.2 -0.6 0.4 -0.2 -3.4 24.00 -0.06 20.3 Dec-18 -1.3 8.4 16.67 -0.87 4.86 361.6 Ba3/ B+u/= BB/-UAE 2.8 0.3 -0.5 3.4 2.75 0.25 1.3 Nov-18 -0.3 -1.4 4.16 0.01 0.49 70.6 Aa2/= AA/= AA/=
Argentina -2.4 -0.1 -5.6 -1.0 -4.2 58.46 -0.51 29.71 46.8 Nov-18 2.2 20.6 17.81 -1.99 2.52 729.4 B2/= B/ B/-Bahrain 3.1 -0.1 0.5 2.8 -0.1 0.4 4.50 0.25 0.7 Nov-18 0.2 -0.7 328.8 B2u/= B+/= BB-/=Bangladesh 7.8 1.0 7.3 0.3 6.00 -0.75 5.3 Dec-18 0.0 -0.5 - Ba3/= BB-/= BB-/=Croatia 2.7 -0.1 2.6 -0.2 3.00 1.3 Nov-18 -0.3 0.1 2.44 -0.04 -0.07 101.7 Ba2/= BB+/+ BB+/+Estonia 3.8 0.1 0.5 3.4 0.5 0.00 3.4 Dec-18 0.0 0.0 67.0 A1/= AA-/= AA-/=Jordan 2.2 -0.1 -0.6 2.5 -0.3 4.75 0.25 4.7 Nov-18 0.7 1.5 - B1/= B+/=Kazakhstan 3.8 0.7 3.4 -0.1 0.1 9.25 6.0 Dec-18 0.7 -1.1 81.8 Baa3/= BBB-/= BBB/=Kenya 5.9 0.1 0.3 5.8 0.1 -0.1 9.00 5.7 Dec-18 0.1 1.2 512.6 B2/= B+/= B+/=Kuwait 2.6 0.5 3.1 0.1 0.4 3.00 0.1 Nov-18 -0.1 -1.0 68.3 Aa2/= AA/= AA/=Lebanon 1.3 -0.6 -0.5 1.7 -0.6 -0.9 10.00 5.8 Nov-18 -0.4 0.8 10.95 -0.10 3.83 812.3 B3/- B-/= B-/-Lithuania 3.5 0.1 0.3 3.0 0.2 0.1 0.00 1.9 Dec-18 -0.6 -2.0 1.15 0.04 0.08 68.2 A3/= A/= A-/+Morocco 3.3 3.4 -0.1 -0.4 2.25 1.3 Nov-18 0.2 -0.6 122.1 Ba1/= BBB-/- BBB-/=Nigeria 1.9 -0.1 -0.6 2.5 -0.3 -0.8 14.00 11.3 Nov-18 0.0 -4.1 15.39 1.91 -11.28 448.0 B2/= B/= B+/=Oman 2.6 -0.4 0.2 3.3 0.2 1.0 3.00 0.08 0.00 1.1 Nov-18 0.1 -0.6 355.3 Baa3/- BB/= BB+/=Romania 4.0 0.1 3.5 -0.1 2.50 3.4 Nov-18 -0.8 0.1 4.59 -0.14 0.36 113.0 Baa3/= BBB-/= BBB-/=Serbia 4.0 1.0 3.5 0.1 0.4 3.00 2.0 Dec-18 0.1 -1.0 119.5 Ba3/= BB/+ BB/=Slovenia 4.2 0.9 3.5 0.9 0.00 1.4 Dec-18 -0.6 -0.3 0.93 -0.14 -0.08 85.6 Baa1/= A+/+ A-/=Sri Lanka 3.5 -0.3 -1.2 4.0 -0.3 -1.2 8.00 2.8 Dec-18 -0.5 -4.3 11.80 -0.21 2.09 - B2/= B/= B/=Tunisia 2.5 0.1 2.5 -0.3 -0.5 6.75 7.6 Dec-18 0.2 1.2 409.2 B2/- B+/-Vietnam 6.9 0.3 6.6 -0.1 4.25 3.0 Dec-18 -0.5 0.4 5.15 -0.05 -0.15 176.6 Ba3/= BB-/= BB/=
Saudi Arabia 2.2 0.7 2.4 -0.2 0.5 3.00 0.25 2.8 Nov-18 0.4 3.9 4.06 -0.06 0.33 104.2 A1/= A-u/= A+/=Ukraine 3.2 0.2 2.9 -0.1 -0.2 18.00 9.8 Dec-18 -0.2 -3.9 9.71 -0.03 0.01 711.3 Caa1/= B-/= B-/=Georgia 5.2 -0.1 1.2 4.8 0.1 -0.1 7.00 1.5 Dec-18 -0.4 -5.2 - Ba2/= BB-/= BB-/+Ghana 6.3 -0.1 -0.1 6.4 -0.2 0.5 17.00 9.4 Dec-18 0.1 -2.4 - B3/= B/= B/=Note: Rating followed by outlook after slash - e.g. A+/= indicates a rating of A+ and a stable outlook; * indicates rating under reviewNote: Central bank rate for Turkey shows weighted average cost of CBRT funds
Source: Bloomberg
Economic forecasts, yields, inflation and ratings
Renaissance Capital 14 January 2019
ESG
109

EM
2018 EPS forecast chg. Revisions* 2019 EPS forecast chg. Revisions*1m 3m YtD Ratio (4wks) 1m 3m YtD Ratio (4wks)
Colombia 7.5% 8.4% 15.1% -3.8% 5.5% 6.8% 11.3% -16.7%Russia 3.8% 5.7% 38.1% 6.0% 0.1% 3.6% 33.2% 3.5%Hungary 2.0% 7.9% 6.9% 3.8% -0.8% 2.3% 0.3% 3.8%S Africa 1.0% -0.8% 0.2% -2.7% 1.1% -3.9% -1.3% -1.1%Turkey 0.5% -0.3% 0.4% -1.4% -0.3% -11.3% -5.6% 2.9%Czech 0.2% 1.3% 5.2% 0.0% -0.8% 1.0% 6.3% 0.0% EM AsiaPoland 0.2% -1.0% -2.3% -2.4% -1.3% -2.7% -5.4% -0.9%Indonesia 0.1% -0.2% -3.9% 0.6% 0.3% 0.1% -3.8% 1.0%Philippines 0.1% -0.9% -5.3% 4.4% 0.1% -1.3% -5.2% 3.5%Brazil 0.1% -2.8% 11.2% -2.9% -1.2% -1.3% 13.2% -3.9%Malaysia 0.0% -0.9% -4.2% -2.7% -0.5% -4.5% -6.3% -3.3%Pakistan -0.2% -8.8% -25.8% -16.3% 3.4% -1.2% -13.1% -4.2%Chile -0.2% -3.3% 7.7% -3.9% -0.5% -2.2% 7.4% -1.2%Taiwan -0.2% -1.9% -5.4% -8.4% -1.1% -6.2% -10.9% -13.3%Egypt -0.3% 0.6% -7.3% -4.7% 0.3% 1.9% -3.7% -7.7%Thailand -0.4% 0.0% 0.3% -4.3% -0.9% -1.3% -1.5% -5.3%China -0.4% -1.4% -0.9% -2.8% -0.9% -2.4% -2.6% -4.4%Qatar -0.5% -1.0% -0.2% -2.2% -0.9% -2.0% -0.8% -6.5%Korea -1.3% -2.9% 1.4% -13.6% -4.4% -10.0% -10.7% -12.9%EM -1.4% -2.4% -8.6% -4.4% -2.4% -4.8% -11.2% -5.6% EM EMEAUAE -1.5% -2.2% -5.7% -12.6% -0.9% -3.4% -3.0% -10.3%Mexico -1.8% -3.4% -6.0% -3.3% -2.2% -2.3% -3.2% -3.3%Peru -2.1% -5.1% -8.9% -12.9% -1.6% -4.0% -3.6% -12.1%Greece -2.6% -1.8% -28.2% -2.0% -1.3% -7.7% -27.2% -3.4%India -3.3% 2.9% 0.4% -3.9% -1.4% 1.9% -2.0% -9.2%
Croatia 22.0% 22.0% 19.4% 0% 22.8% 22.8% 13.7% 0%Frontier 15.4% 13.6% -7.2% -0.7% 13.2% 11.1% -6.4% -7%Oman 14.8% 14.6% 3.0% 16.7% 22.5% 24.1% 18.3% 7.7%Argentina 5.1% -18.1% -12.7% 2.6% -0.9% -5.5% 31.9% -2.5%Sri Lanka 1.4% 2.7% -8.5% -16.7% 0.1% -0.2% -5.3% 7.7%Kuwait 1.3% -1.1% -1.4% 3.9% 0.3% -4.3% -2.5% 0.0%Romania 0.9% 5.3% 29.2% 6% 0.8% 8.5% 19.7% -17.6%Kazakhstan 0.6% -3.5% 11.8% 20.0% 4.1% 9.6% 12.1% 20.0% EM LatAmNigeria 0.2% -1.0% -1.4% -3.0% 0.4% -2.7% -3.0% -4.7%Morocco 0.1% -1.6% 0.1% 6.3% 0.0% -1.4% -1.5% 0.0%Slovenia 0.0% -0.2% 0.2% -16.7% 0.0% 0.1% 2.1% -16.7%Senegal 0.0% -1.6% -14.1% -20.0% 0.0% -3.1% -15.2% -20.0%Lithuania 0.0% 9.9% 36.4% 0.0% 0.0% 1.1% 3.8% 0.0%Lebanon 0.0% 0.0% 10.7% 0.0% 0.0% 0.0% 15.5% 0.0%Estonia 0.0% -2.5% -26.3% -12.5% 0.0% -12.2% -32.5% -12.5%Bangladesh 0.0% -0.4% -9.1% 0.0% 0.0% -3.8% -6.1% 0.0%Kenya -0.2% 1.4% -2.3% -1.3% 0.0% 1.5% -3.5% -2.2%Saudi Arabia -1.1% -1.7% 3.8% -1.8% -0.7% -1.9% 0.8% -8.4%Vietnam -1.5% -3.2% 0.2% -7.2% -3.0% -4.8% 0.7% -11.1%Bahrain -11.9% -31.3% 0.3% 0.0% -28.7% -29.9% 21.6% 0.0%* Number of upgrades minus downgrades over total forecastsLocal currency changes, excpet for aggregates in $ Frontier† Frontier's increase in EPS is from an increase in the number of companies with forecasts rather than organic change
Source: Bloomberg
EPS forecast revisions
80
85
90
95
100
105
110
115
Jan-
18
Feb-
18
Mar
-18
Apr-1
8
May
-18
Jun-
18
Jul-1
8
Aug-
18
Sep-
18
Oct
-18
Nov
-18
Dec
-18
18E 19E
80
85
90
95
100
105
110
115
Jan-
18
Feb-
18
Mar
-18
Apr-1
8
May
-18
Jun-
18
Jul-1
8
Aug-
18
Sep-
18
Oct
-18
Nov
-18
Dec
-18
18E 19E
80
85
90
95
100
105
110
115
Jan-
18
Feb-
18
Mar
-18
Apr-1
8
May
-18
Jun-
18
Jul-1
8
Aug-
18
Sep-
18
Oct
-18
Nov
-18
Dec
-18
18E 19E
80
90
100
110
120
Jan-
18
Feb-
18
Mar
-18
Apr-1
8
May
-18
Jun-
18
Jul-1
8
Aug-
18
Sep-
18
Oct
-18
Nov
-18
Dec
-18
18E 19E
70
80
90
100110
120
130
Jan-
18
Feb-
18
Mar
-18
Apr-1
8
May
-18
Jun-
18
Jul-1
8
Aug-
18
Sep-
18
Oct
-18
Nov
-18
Dec
-18
18E 19E
Renaissance Capital 14 January 2019
ESG
110

Brazil Chile China
Colombia Czech Egypt
Greece Hungary India
Indonesia Malaysia Mexico
Source: Bloomberg
EM EPS forecast changes, past 12 months
80
90
100
110
120
130
140
150
Jan-
18
Feb-
18
Mar
-18
Apr-1
8
May
-18
Jun-
18
Jul-1
8
Aug-
18
Sep-
18
Oct
-18
Nov
-18
Dec
-18
18E 19E
80859095
100105110115120125130
Jan-
18
Feb-
18
Mar
-18
Apr-1
8
May
-18
Jun-
18
Jul-1
8
Aug-
18
Sep-
18
Oct
-18
Nov
-18
Dec
-18
18E 19E
80
85
90
95
100
105
110
115
120
Jan-
18
Feb-
18
Mar
-18
Apr-1
8
May
-18
Jun-
18
Jul-1
8
Aug-
18
Sep-
18
Oct
-18
Nov
-18
Dec
-18
18E 19E
80
90
100
110
120
130
140
Jan-
18
Feb-
18
Mar
-18
Apr-1
8
May
-18
Jun-
18
Jul-1
8
Aug-
18
Sep-
18
Oct
-18
Nov
-18
Dec
-18
18E 19E
90
95
100
105
110
115
Jan-
18
Feb-
18
Mar
-18
Apr-1
8
May
-18
Jun-
18
Jul-1
8
Aug-
18
Sep-
18
Oct
-18
Nov
-18
Dec
-18
18E 19E
90
95
100
105
110
115
Jan-
18
Feb-
18
Mar
-18
Apr-1
8
May
-18
Jun-
18
Jul-1
8
Aug-
18
Sep-
18
Oct
-18
Nov
-18
Dec
-18
18E 19E
50
60
70
80
90
100
110
120
130
Jan-
18
Feb-
18
Mar
-18
Apr-1
8
May
-18
Jun-
18
Jul-1
8
Aug-
18
Sep-
18
Oct
-18
Nov
-18
Dec
-18
18E 19E
90
95
100
105
110
115
Jan-
18
Feb-
18
Mar
-18
Apr-1
8
May
-18
Jun-
18
Jul-1
8
Aug-
18
Sep-
18
Oct
-18
Nov
-18
Dec
-18
18E 19E
707580859095
100105110115120
Jan-
18
Feb-
18
Mar
-18
Apr-1
8
May
-18
Jun-
18
Jul-1
8
Aug-
18
Sep-
18
Oct
-18
Nov
-18
Dec
-18
18E 19E
80
85
90
95
100
105
110
115
Jan-
18
Feb-
18
Mar
-18
Apr-1
8
May
-18
Jun-
18
Jul-1
8
Aug-
18
Sep-
18
Oct
-18
Nov
-18
Dec
-18
18E 19E
80
85
90
95
100
105
110
Jan-
18
Feb-
18
Mar
-18
Apr-1
8
May
-18
Jun-
18
Jul-1
8
Aug-
18
Sep-
18
Oct
-18
Nov
-18
Dec
-18
18E 19E
80
85
90
95
100
105
110
115
120
Jan-
18
Feb-
18
Mar
-18
Apr-1
8
May
-18
Jun-
18
Jul-1
8
Aug-
18
Sep-
18
Oct
-18
Nov
-18
Dec
-18
18E 19E
Renaissance Capital 14 January 2019
ESG
111
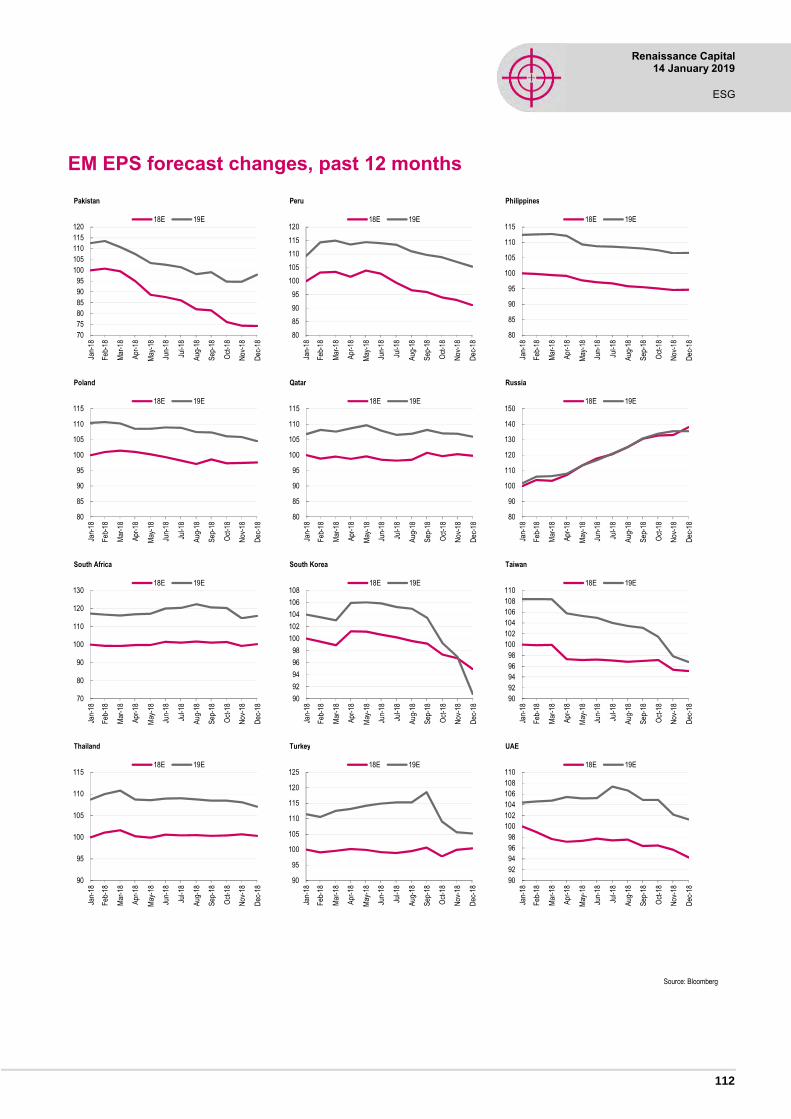
Pakistan Peru Philippines
Poland Qatar Russia
South Africa South Korea Taiwan
Thailand Turkey UAE
Source: Bloomberg
EM EPS forecast changes, past 12 months
80
85
90
95
100
105
110
115
120
Jan-
18
Feb-
18
Mar
-18
Apr-1
8
May
-18
Jun-
18
Jul-1
8
Aug-
18
Sep-
18
Oct
-18
Nov
-18
Dec
-18
18E 19E
80
85
90
95
100
105
110
115
Jan-
18
Feb-
18
Mar
-18
Apr-1
8
May
-18
Jun-
18
Jul-1
8
Aug-
18
Sep-
18
Oct
-18
Nov
-18
Dec
-18
18E 19E
80
85
90
95
100
105
110
115
Jan-
18
Feb-
18
Mar
-18
Apr-1
8
May
-18
Jun-
18
Jul-1
8
Aug-
18
Sep-
18
Oct
-18
Nov
-18
Dec
-18
18E 19E
80
90
100
110
120
130
140
150
Jan-
18
Feb-
18
Mar
-18
Apr-1
8
May
-18
Jun-
18
Jul-1
8
Aug-
18
Sep-
18
Oct
-18
Nov
-18
Dec
-18
18E 19E
90
92
94
96
98
100
102
104
106
108
Jan-
18
Feb-
18
Mar
-18
Apr-1
8
May
-18
Jun-
18
Jul-1
8
Aug-
18
Sep-
18
Oct
-18
Nov
-18
Dec
-18
18E 19E
9092949698
100102104106108110
Jan-
18
Feb-
18
Mar
-18
Apr-1
8
May
-18
Jun-
18
Jul-1
8
Aug-
18
Sep-
18
Oct
-18
Nov
-18
Dec
-18
18E 19E
90
95
100
105
110
115
120
125
Jan-
18
Feb-
18
Mar
-18
Apr-1
8
May
-18
Jun-
18
Jul-1
8
Aug-
18
Sep-
18
Oct
-18
Nov
-18
Dec
-18
18E 19E
9092949698
100102104106108110
Jan-
18
Feb-
18
Mar
-18
Apr-1
8
May
-18
Jun-
18
Jul-1
8
Aug-
18
Sep-
18
Oct
-18
Nov
-18
Dec
-18
18E 19E
707580859095
100105110115120
Jan-
18
Feb-
18
Mar
-18
Apr-1
8
May
-18
Jun-
18
Jul-1
8
Aug-
18
Sep-
18
Oct
-18
Nov
-18
Dec
-18
18E 19E
90
95
100
105
110
115
Jan-
18
Feb-
18
Mar
-18
Apr-1
8
May
-18
Jun-
18
Jul-1
8
Aug-
18
Sep-
18
Oct
-18
Nov
-18
Dec
-18
18E 19E
70
80
90
100
110
120
130
Jan-
18
Feb-
18
Mar
-18
Apr-1
8
May
-18
Jun-
18
Jul-1
8
Aug-
18
Sep-
18
Oct
-18
Nov
-18
Dec
-18
18E 19E
80
85
90
95
100
105
110
115
Jan-
18
Feb-
18
Mar
-18
Apr-1
8
May
-18
Jun-
18
Jul-1
8
Aug-
18
Sep-
18
Oct
-18
Nov
-18
Dec
-18
18E 19E
Renaissance Capital 14 January 2019
ESG
112

Consumer Discretionary Consumer Staples Energy
Financials Healthcare Industrials
IT Materials Real Estate
Telecoms Utilities EM
Source: Bloomberg
EM sector EPS forecast changes, past 12 months
70
80
90
100
110
120
130
Jan-
18
Feb-
18
Mar
-18
Apr-1
8
May
-18
Jun-
18
Jul-1
8
Aug-
18
Sep-
18
Oct
-18
Nov
-18
Dec
-18
18E 19E
75
80
85
90
95
100
105
110
115
120
Jan-
18
Feb-
18
Mar
-18
Apr-1
8
May
-18
Jun-
18
Jul-1
8
Aug-
18
Sep-
18
Oct
-18
Nov
-18
Dec
-18
18E 19E
80859095
100105110115120125130
Jan-
18
Feb-
18
Mar
-18
Apr-1
8
May
-18
Jun-
18
Jul-1
8
Aug-
18
Sep-
18
Oct
-18
Nov
-18
Dec
-18
18E 19E
80
85
90
95
100
105
110
115
Jan-
18
Feb-
18
Mar
-18
Apr-1
8
May
-18
Jun-
18
Jul-1
8
Aug-
18
Sep-
18
Oct
-18
Nov
-18
Dec
-18
18E 19E
80
85
90
95
100
105
110
115
120
Jan-
18
Feb-
18
Mar
-18
Apr-1
8
May
-18
Jun-
18
Jul-1
8
Aug-
18
Sep-
18
Oct
-18
Nov
-18
Dec
-18
18E 19E
80
85
90
95
100
105
110
115
120
Jan-
18
Feb-
18
Mar
-18
Apr-1
8
May
-18
Jun-
18
Jul-1
8
Aug-
18
Sep-
18
Oct
-18
Nov
-18
Dec
-18
18E 19E
80
85
90
95
100
105
110
Jan-
18
Feb-
18
Mar
-18
Apr-1
8
May
-18
Jun-
18
Jul-1
8
Aug-
18
Sep-
18
Oct
-18
Nov
-18
Dec
-18
18E 19E
90
95
100
105
110
115
Jan-
18
Feb-
18
Mar
-18
Apr-1
8
May
-18
Jun-
18
Jul-1
8
Aug-
18
Sep-
18
Oct
-18
Nov
-18
Dec
-18
18E 19E
70
80
90
100
110
120
130
Jan-
18
Feb-
18
Mar
-18
Apr-1
8
May
-18
Jun-
18
Jul-1
8
Aug-
18
Sep-
18
Oct
-18
Nov
-18
Dec
-18
18E 19E
80
85
90
95
100
105
110
115
120
125
Jan-
18
Feb-
18
Mar
-18
Apr-1
8
May
-18
Jun-
18
Jul-1
8
Aug-
18
Sep-
18
Oct
-18
Nov
-18
Dec
-18
18E 19E
60
70
80
90
100
110
120
Jan-
18
Feb-
18
Mar
-18
Apr-1
8
May
-18
Jun-
18
Jul-1
8
Aug-
18
Sep-
18
Oct
-18
Nov
-18
Dec
-18
18E 19E
80
85
90
95
100
105
110
115
Jan-
18
Feb-
18
Mar
-18
Apr-1
8
May
-18
Jun-
18
Jul-1
8
Aug-
18
Sep-
18
Oct
-18
Nov
-18
Dec
-18
18E 19E
Renaissance Capital 14 January 2019
ESG
113

Argentina Bangladesh Kazakhstan
Kenya Kuwait Morocco
Nigeria Oman Romania
Sri Lanka Vietnam Saudi Arabia
Source: Bloomberg
Frontier EPS forecast changes, past 12 months
70
80
90
100
110
120
130
140
Jan-
18
Feb-
18
Mar
-18
Apr-1
8
May
-18
Jun-
18
Jul-1
8
Aug-
18
Sep-
18
Oct
-18
Nov
-18
Dec
-18
18E 19E
70
80
90
100
110
120
130
Jan-
18
Feb-
18
Mar
-18
Apr-1
8
May
-18
Jun-
18
Jul-1
8
Aug-
18
Sep-
18
Oct
-18
Nov
-18
Dec
-18
18E 19E
70
80
90
100
110
120
130
Jan-
18
Feb-
18
Mar
-18
Apr-1
8
May
-18
Jun-
18
Jul-1
8
Aug-
18
Sep-
18
Oct
-18
Nov
-18
Dec
-18
18E 19E
90
92
94
96
98
100
102
104
106
108
Jan-
18
Feb-
18
Mar
-18
Apr-1
8
May
-18
Jun-
18
Jul-1
8
Aug-
18
Sep-
18
Oct
-18
Nov
-18
Dec
-18
18E 19E
80
85
90
95
100
105
110
115
120
Jan-
18
Feb-
18
Mar
-18
Apr-1
8
May
-18
Jun-
18
Jul-1
8
Aug-
18
Sep-
18
Oct
-18
Nov
-18
Dec
-18
18E 19E
70
80
90
100
110
120
130
140
Jan-
18
Feb-
18
Mar
-18
Apr-1
8
May
-18
Jun-
18
Jul-1
8
Aug-
18
Sep-
18
Oct
-18
Nov
-18
Dec
-18
18E 19E
70
90
110
130
150
170
190
Jan-
18
Feb-
18
Mar
-18
Apr-1
8
May
-18
Jun-
18
Jul-1
8
Aug-
18
Sep-
18
Oct
-18
Nov
-18
Dec
-18
18E 19E
707580859095
100105110115120
Jan-
18
Feb-
18
Mar
-18
Apr-1
8
May
-18
Jun-
18
Jul-1
8
Aug-
18
Sep-
18
Oct
-18
Nov
-18
Dec
-18
18E 19E
70
80
90
100
110
120
130
Jan-
18
Feb-
18
Mar
-18
Apr-1
8
May
-18
Jun-
18
Jul-1
8
Aug-
18
Sep-
18
Oct
-18
Nov
-18
Dec
-18
18E 19E
90
95
100
105
110
115
120
Jan-
18
Feb-
18
Mar
-18
Apr-1
8
May
-18
Jun-
18
Jul-1
8
Aug-
18
Sep-
18
Oct
-18
Nov
-18
Dec
-18
18E 19E
70
80
90
100
110
120
130
Jan-
18
Feb-
18
Mar
-18
Apr-1
8
May
-18
Jun-
18
Jul-1
8
Aug-
18
Sep-
18
Oct
-18
Nov
-18
Dec
-18
18E 19E
707580859095
100105110115120
Jan-
18
Feb-
18
Mar
-18
Apr-1
8
May
-18
Jun-
18
Jul-1
8
Aug-
18
Sep-
18
Oct
-18
Nov
-18
Dec
-18
18E 19E
Renaissance Capital 14 January 2019
ESG
114

Renaissance Capital
XX January 2019
ESG
Renaissance Capital 14 January 2019
ESG
115
Analysts certification
This research report has been prepared by the research analyst(s), whose name(s) appear(s) on the front page of this document, to provide background information about the issuer or issuers (collectively, the “Issuer”) and the securities and markets that are the subject matter of this report. Each research analyst hereby certifies that with respect to the Issuer and such securities and markets, this document has been produced independently of the Issuer and all the views expressed in this document accurately reflect his or her personal views about the Issuer and any and all of such securities and markets. Each research analyst and/or persons connected with any research analyst may have interacted with sales and trading personnel, or similar, for the purpose of gathering, synthesizing and interpreting market information. If the date of this report is not current, the views and contents may not reflect the research analysts’ current thinking.
Each research analyst also certifies that no part of his or her compensation was, or will be, directly or indirectly related to the specific ratings, forecasts, estimates, opinions or views in this research report. Research analysts’ compensation is determined based upon activities and services intended to benefit the investor clients of Renaissance Securities (Cyprus) Limited and any of its affiliates (“Renaissance Capital”). Like all of Renaissance Capital’s employees, research analysts receive compensation that is impacted by overall Renaissance Capital profitability, which includes revenues from other business units within Renaissance Capital.
Important issuer disclosures
Important issuer disclosures outline currently known conflicts of interest that may unknowingly bias or affect the objectivity of the analyst(s) with respect to an issuer that is the subject matter of this report. Disclosure(s) apply to Renaissance Securities (Cyprus) Limited or any of its direct or indirect subsidiaries or affiliates (which are individually or collectively referred to as “Renaissance Capital”) with respect to any issuer or the issuer’s securities.
A complete set of disclosure statements associated with the issuers discussed in this Report is available using the ‘Stock Finder’ or ‘Bond Finder’ for individual issuers on the Renaissance Capital Research Portal at: http://research.rencap.com/eng/default.asp
Investment ratings
Investment ratings may be determined by the following standard ranges: Buy (expected total return of 15% or more); Hold (expected total return of 0-15%); and Sell (expected negative total return). Standard ranges do not always apply to emerging markets securities and ratings may be assigned on the basis of the research analyst’s knowledge of the securities.
Investment ratings are a function of the research analyst’s expectation of total return on equity (forecast price appreciation and dividend yield within the next 12 months, unless stated otherwise in the report). Investment ratings are determined at the time of initiation of coverage of an issuer of equity securities or a change in target price of any of the issuer’s equity securities. At other times, the expected total returns may fall outside of the range used at the time of setting a rating because of price movement and/or volatility. Such interim deviations will be permitted but will be subject to review by Renaissance Capital’s Research Management.
Where the relevant issuer has a significant material event with further information pending or to be announced, it may be necessary to temporarily place the investment rating Under Review. This does not revise the previously published rating, but indicates that the analyst is actively reviewing the investment rating or waiting for sufficient information to re-evaluate the analyst’s expectation of total return on equity.
Where coverage of the relevant issuer is due to be maintained by a new analyst, on a temporary basis the relevant issuer will be rated as Coverage in Transition. Previously published investment ratings should not be relied upon as they may not reflect the new analysts’ current expectations of total return. While rated as Coverage in Transition, Renaissance Capital may not always be able to keep you informed of events or provide background information relating to the issuer.
If issuing of research is restricted due to legal, regulatory or contractual obligations publishing investment ratings will be Restricted. Previously published investment ratings should not be relied upon as they may no longer reflect the analysts’ current expectations of total return. While restricted, the analyst may not always be able to keep you informed of events or provide background information relating to the issuer.
Where Renaissance Capital has neither reviewed nor revised its investment ratings on the relevant issuer for a period of 180 calendar days, coverage shall be discontinued.
Where Renaissance Capital has not provided coverage of an issuer for a period of 365 calendar days, coverage shall be discontinued.
Where Renaissance Capital has not expressed a commitment to provide continuous coverage and/or an expectation of total return, to keep you informed, analysts may prepare reports covering significant events or background information without an investment rating (Not Covered).
Your decision to buy or sell a security should be based upon your personal investment objectives and should be made only after evaluating the security’s expected performance and risk.
Renaissance Capital reserves the right to update or amend its investment ratings in any way and at any time it determines.
Disclosures appendix
Renaissance Capital research team Head of Research – Eurasia Daniel Salter +44 (207) 005-7824 [email protected] Head of Research – Africa Johann Pretorius +27 (11) 750-1450 [email protected]
Head of Research – Sub-Saharan Africa Yvonne Mhango +27 (11) 750-1488 [email protected] Head of Research – MENA Ahmed Hafez +20 (122) 774-4911 [email protected]
Name Telephone number Coverage Name Telephone number Coverage Macro Oil & Gas Charles Robertson +44 (207) 005-7835 Global Alexander Burgansky +44 (207) 005-7982 Russia/CIS, Africa Yvonne Mhango +27 (11) 750-1488 Sub-Saharan Africa Temilade Aduroja +234 (1) 448-5300 x5363 Sub-Saharan Africa Oleg Kouzmin +7 (495) 258-7770 x4506 Russia/CIS Oleg Chistyukhin +7 (495) 258-7770 x4073 Russia/CIS
Richard Wisentaner +44 (207) 005-7954 x8954 Russia/CIS, Africa Equity Strategy Daniel Salter +44 (207) 005-7824 Global Metals & Mining Charles Robertson +44 (207) 005-7835 Global Johann Pretorius +27 (11) 750-1450 South Africa Vikram Lopez +44 (207) 005-7974 Global Steven Friedman +27 (11) 750-1481 South Africa
Kabelo Moshesha +27 (11) 750-1472 South Africa Fixed Income Strategy Siphelele Mhlongo +27 (11) 750-1420 South Africa Gregory Smith +44 (207) 005-7761 Frontier/Emerging Markets Derick Deale +27 (11) 750-1458 South Africa Oleg Kouzmin +7 (495) 258-7770 x4506 Russia/CIS
Consumer/Retail/Agriculture Financials David Ferguson +7 (495) 641-4189 Russia/CIS, Africa Ilan Stermer +27 (11) 750-1482 South Africa Kirill Panarin +7 (495) 258-7770 x4009 Russia/CIS, Africa Phago Rakale +27 (11) 750-1498 South Africa Zaheer Joosub +27 (11) 750-1427 South Africa Olamipo Ogunsanya +234 (1) 448-5300 x5368 Sub-Saharan Africa Adedayo Ayeni +234 (1) 448-5390 Sub-Saharan Africa Metin Esendal +44 (207) 005-7925 Europe/Georgia Robyn Collins +27 (11) 750-1480 South Africa Oluwatoyosi Oni +234 (1) 448-5300 x5356 Sub-Saharan Africa Metin Esendal +44 (207) 005-7925 Turkey Ivan Kachkovski +44 (207) 005-7862 Russia Hadeel El Masry +01(00) 388-0822 MENA
Telecoms/Transportation Healthcare Alexander Kazbegi +41 (78) 883-4527 Global Robyn Collins +27 (11) 750-1480 South Africa Artem Yamschikov +7 (495) 258-7770 x7511 Russia/CIS Alexander Kazbegi +41 (78) 883-4527 Georgia/Russia Mikhail Arbuzov +7 (495) 258-7770 x4594 Russia/CIS Metin Esendal +44 (207) 005-7925 Turkey Metin Esendal +44 (207) 005-7925 Pakistan
Diversified/Industrials Real Estate Brent Madel +27 (11) 750-1160 South Africa David Ferguson +7 (495) 641-4189 Russia/CIS, Africa Metin Esendal +44 (207) 005-7925 Turkey Kirill Panarin +7 (495) 258-7770 x4009 Russia/CIS, Africa Phago Rakale +27 (11) 750-1498 South Africa Materials
Temilade Aduroja +234 (1) 448-5300 x5363 Sub-Saharan Africa Media/Technology David Ferguson +7 (495) 641-4189 Russia/CIS, Africa Utilities Kirill Panarin +7 (495) 258-7770 x4009 Russia/CIS, Africa Ahmed Hafez +20 (122) 774-4911 Egypt
Sergey Beiden +7 (495) 258-7770 x4205 Russia
Renaissance Capital research is available via the following platforms: Renaissance research portal: research.rencap.com Bloomberg: RENA <GO> Capital IQ: www.capitaliq.com
Thomson Reuters: thomsonreuters.com/financial Factset: www.factset.com

Renaissance Capital Moscow T + 7 (495) 258-7777
Renaissance Capital Ltd. London T + 44 (203) 379-7777
Renaissance Capital Johannesburg T +27 (11) 750-1400
Renaissance Securities (Nigeria) Ltd. Lagos T +234 (1) 448-5300
Renaissance Capital Nairobi T +254 (20) 368-2000
Renaissance Capital Cape Town T +27 (11) 750-1164
Renaissance Securities (Cyprus) Ltd. Nicosia T + 357 (22) 505-800
Renaissance Capital Egypt for Promoting and Underwriting of Securities S.A.E. Cairo
© 2019 Renaissance Securities (Cyprus) Limited, a subsidiary of Renaissance Financial Holdings Limited ("Renaissance Capital"), which together with other subsidiaries operates outside of the USA under the brand name of Renaissance Capital, for contact details see Bloomberg page RENA, or contact the relevant office. All rights reserved. This document and/or information has been prepared by and, except as otherwise specified herein, is communicated by Renaissance Securities (Cyprus) Limited, regulated by the Cyprus Securities and Exchange Commission (License No: KEPEY 053/04). This document is for information purposes only. The information presented herein does not comprise a prospectus of securities for the purposes of EU Directive 2003/71/EC or Federal Law No. 39-FZ of 22 April 1994 (as amended) of the Russian Federation "On the Securities Market". Any decision to purchase securities in any proposed offering should be made solely on the basis of the information to be contained in the final prospectus published in relation to such offering. This document does not form a fiduciary relationship or constitute advice and is not and should not be construed as an offer, or a solicitation of an offer, or an invitation or inducement to engage in investment activity, and cannot be relied upon as a representation that any particular transaction necessarily could have been or can be effected at the stated price. This document is not an advertisement of securities. Opinions expressed herein may differ or be contrary to opinions expressed by other business areas or groups of Renaissance Capital as a result of using different assumptions and criteria. All such information and opinions are subject to change without notice, and neither Renaissance Capital nor any of its subsidiaries or affiliates is under any obligation to update or keep current the information contained herein or in any other medium. Descriptions of any company or companies or their securities or the markets or developments mentioned herein are not intended to be complete. This document and/or information should not be regarded by recipients as a substitute for the exercise of their own judgment as the information has no regard to the specific investment objectives, financial situation or particular needs of any specific recipient. The application of taxation laws depends on an investor’s individual circumstances and, accordingly, each investor should seek independent professional advice on taxation implications before making any investment decision. The information and opinions herein have been compiled or arrived at based on information obtained from sources believed to be reliable and in good faith. Such information has not been independently verified, is provided on an ‘as is’ basis and no representation or warranty, either expressed or implied, is provided in relation to the accuracy, completeness, reliability, merchantability or fitness for a particular purpose of such information and opinions, except with respect to information concerning Renaissance Capital, its subsidiaries and affiliates. All statements of opinion and all projections, forecasts, or statements relating to expectations regarding future events or the possible future performance of investments represent Renaissance Capital’s own assessment and interpretation of information available to them currently. The securities described herein may not be eligible for sale in all jurisdictions or to certain categories of investors. Options, derivative products and futures are not suitable for all investors and trading in these instruments is considered risky. Past performance is not necessarily indicative of future results. The value of investments may fall as well as rise and the investor may not get back the amount initially invested. Some investments may not be readily realisable since the market in the securities is illiquid or there is no secondary market for the investor’s interest and therefore valuing the investment and identifying the risk to which the investor is exposed may be difficult to quantify. Investments in illiquid securities involve a high degree of risk and are suitable only for sophisticated investors who can tolerate such risk and do not require an investment easily and quickly converted into cash. Foreign-currency-denominated securities are subject to fluctuations in exchange rates that could have an adverse effect on the value or the price of, or income derived from, the investment. Other risk factors affecting the price, value or income of an investment include but are not necessarily limited to political risks, economic risks, credit risks, and market risks. Investing in emerging markets such as Russia, other CIS, African or Asian countries and emerging markets securities involves a high degree of risk and investors should perform their own due diligence before investing. Excluding significant beneficial ownership of securities where Renaissance Capital has expressed a commitment to provide continuous coverage in relation to an issuer or an issuer’s securities, Renaissance Capital and its affiliates, their directors, representatives, employees (excluding the US broker-dealer unless specifically disclosed), or clients may have or have had interests in the securities of issuers described in the Investment Research or long or short positions in any of the securities mentioned in the Investment Research or other related financial instruments at any time and may make a purchase and/or sale, or offer to make a purchase and/or sale, of any such securities or other financial instruments from time to t ime in the open market or otherwise, in each case as principals or as agents. Where Renaissance Capital has not expressed a commitment to provide continuous coverage in relation to an issuer or an issuer’s securities, Renaissance Capital and its affiliates (excluding the US broker-dealer unless specifically disclosed) may act or have acted as market maker in the securities or other financial instruments described in the Investment Research, or in securities underlying or related to such securities. Employees of Renaissance Capital or its
affiliates may serve or have served as officers or directors of the relevant companies. Renaissance Capital and its affiliates may have or have had a relationship with or provide or have provided investment banking, capital markets, advisory, investment management, and/or other financial services to the relevant companies, and have established and maintain information barriers, such as ‘Chinese Walls’, to control the flow of information contained in one or more areas of Renaissance Capital, into other areas, units, groups or affiliates of the Firm. The information herein is not intended for distribution to the public and may not be reproduced, redistributed or published, in whole or in part, for any purpose without the written permission of Renaissance Capital, and neither Renaissance Capital nor any of its affiliates accepts any liability whatsoever for the actions of third parties in this respect. This information may not be used to create any financial instruments or products or any indices. Neither Renaissance Capital and its affiliates, nor their directors, representatives, or employees accept any liability for any direct or consequential loss or damage arising out of the use of all or any part of the information herein Bermuda: Neither the Bermuda Monetary Authority nor the Registrar of Companies of Bermuda has approved the contents of this document and any statement to the contrary, express or otherwise, would constitute a material misstatement and an offence. EEA States: Distributed by Renaissance Securities (Cyprus) Limited, regulated by Cyprus Securities and Exchange Commission, or Renaissance Capital Limited, member of the London Stock Exchange and regulated in the UK by the Financial Conduct Authority (“FCA”) in relation to designated investment business (as detailed in the FCA rules). Cyprus: Except as otherwise specified herein the information herein is not intended for, and should not be relied upon by, retail clients of Renaissance Securities (Cyprus) Limited. The Cyprus Securities and Exchange Commission Investor Compensation Fund is available where Renaissance Securities (Cyprus) Limited is unable to meet its liabilities to its retail clients, as specified in the Customer Documents Pack. United Kingdom: Approved and distributed by Renaissance Capital Limited only to persons who are eligible counterparties or professional clients (as detailed in the FCA Rules). The information herein does not apply to, and should not be relied upon by, retail clients; neither the FCA’s protection rules nor compensation scheme may be applied. Kenya: Distributed by Renaissance Capital (Kenya) Limited, regulated by the Capital Markets Authority. Nigeria: Distributed by RenCap Securities (Nigeria) Limited, authorised dealing member of The Nigerian Stock Exchange, or Renaissance Securities (Nigeria) Limited, entities regulated by the Securities and Exchange Commission. Russia: Distributed by Renaissance Broker Limited regulated by the Central Bank of Russia. South Africa: Distributed by Rencap Securities (Proprietary) Limited, an authorised Financial Services Provider and member of the JSE Limited. The information contained herein is intended for Institutional investors only. United States: Distributed in the United States by RenCap Securities, Inc., member of FINRA and SIPC, or by a non-US subsidiary or affiliate of Renaissance Financial Holdings Limited that is not registered as a US broker-dealer (a "non-US affiliate"), to major US institutional investors only. RenCap Securities, Inc. accepts responsibility for the content of a research report prepared by another non-US affiliate when distributed to US persons by RenCap Securities, Inc. Although it has accepted responsibility for the content of this research report when distributed to US investors, RenCap Securities, Inc. did not contribute to the preparation of this report and the analysts authoring this are not employed by, and are not associated persons of, RenCap Securities, Inc. Among other things, this means that the entity issuing this report and the analysts authoring this report are not subject to all the disclosures and other US regulatory requirements to which RenCap Securities, Inc. and its employees and associated persons are subject. Any US person receiving this report who wishes to effect transactions in any securities referred to herein should contact RenCap Securities, Inc., not its non-US affiliate. RenCap Securities, Inc. is a subsidiary of Renaissance Financial Holdings Limited and forms a part of a group of companies operating outside of the United States as "Renaissance Capital.". Contact: RenCap Securities, Inc., 780 Third Avenue, 20th Floor, New York, New York 10017, Telephone: +1 (212) 824-1099. Other distribution: The distribution of this document in other jurisdictions may be restricted by law and persons into whose possession this document comes should inform themselves about, and observe, any such restriction. Renaissance Capital equity research disclosures (Stocks)


![Cometh - A DeFi powered game1 Cometh A DeFi powered Blockchain game with yield generating NFT Cometh Whitepaper v1.0.8 - Jan. 17th, 2021 [typos] Comet 2020 F3 (NEOWISE) on Jul. 14th,](https://static.fdocuments.net/doc/165x107/613604080ad5d2067647bf2a/cometh-a-defi-powered-game-1-cometh-a-defi-powered-blockchain-game-with-yield.jpg)