COMENIUS PROJECT BE A EURO-ECO-CITIZEN 2009 - 2011 S.M.S. BALUARDO PARTIGIANI - ITALY.
52
COMENIUS PROJECT BE A EURO-ECO-CITIZEN 2009 - 2011 S.M.S. BALUARDO PARTIGIANI - ITALY
-
date post
20-Dec-2015 -
Category
Documents
-
view
217 -
download
0
Transcript of COMENIUS PROJECT BE A EURO-ECO-CITIZEN 2009 - 2011 S.M.S. BALUARDO PARTIGIANI - ITALY.

COMENIUS PROJECT
BE A EURO-ECO-CITIZEN
2009 - 2011
S.M.S. BALUARDO PARTIGIANI - ITALY

ENERGY SAVING
• The energy saving is the best alternative source
• But to save something it is necessary to know it

NON-RENEWABLE ENERGY
It is exhaustible and not unlimited. It needs a very long time to reform itself (some whole geologic era). Hurrier it runs out, bigger will be its exploitation.
Its burning produces harmful emissions to the environment.

NON-RENEWABLE ENERGY
The principal primary non-renewable sources are:
a) chemical energy stored in fossil fuels (petrol, etc.);
b) nuclear energy stored in radioactive materials
ENERGY PRODUCTION TABLE >

RENEWABLE ENERGY
It is inexhaustible and unlimited in nature.
It produces “clean” energy and it doesn’t produces pollutants for humans and the environments

RENEWABLE ENERGY
The principal primary renewable sources are:
a) solar energy; b) hydraulic energy; c) wind energy; d) wave energy; e) tidal energy; f) chemical energy from
organic substances (biomass);
g) geothermal energy.
ENERGY PRODUCTION TABLE>

ACCESS TO ENERGY TODAY
• The actual organization and distribution of energy give, to the earth inhabitants, the following accesses:– 50 % no access– 30 % insufficient access– 20 % easy access

ELECTRIC ENERGY
It is the energy produced by an electric central (with the use of a machine called “alternator”) using mechanical energy or heat.
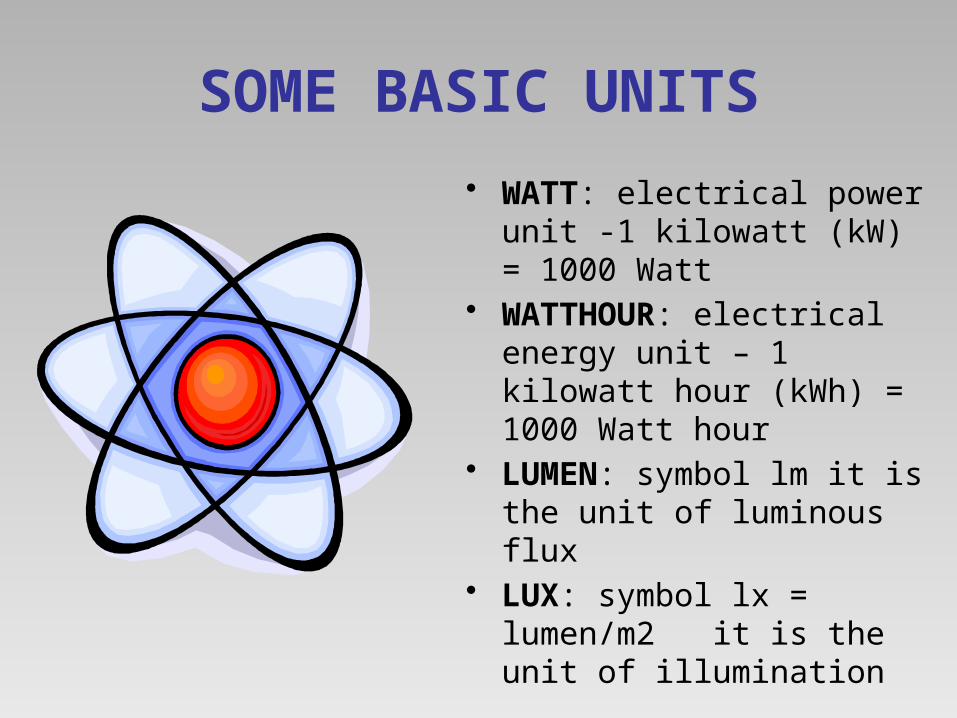
SOME BASIC UNITS
• WATT: electrical power unit -1 kilowatt (kW) = 1000 Watt
• WATTHOUR: electrical energy unit – 1 kilowatt hour (kWh) = 1000 Watt hour
• LUMEN: symbol lm it is the unit of luminous flux
• LUX: symbol lx = lumen/m2 it is the unit of illumination

INCANDESCENT LAMPS
It produces the light by an incandescent filament of tungsten. The glass bulb of the lamp is filled with a gas mixture (inert gas and nitrogen) that make the filament does non burn.
COMPARISION TABLE LAMPS >

FLUORESCENT LAMPS
This lamp is filled with a gas (mercury vapor) that excited by electricity, emits radiations. These are changed in visible light by a layer of a fluorescent dust that is in the internal side of the glass tube.
COMPARISON TABLE LAMPS >

CARBON DIOXIDE (CO2) Symbol CO2 – The carbon
dioxide is a gas dangerous for humans produced during the burning. If we burn methane we put in the air 242 g of CO2 every 1 kWh of energy produced.
The carbon dioxide is fixed by the trees and through the phenomenon of “photosynthesis” is transformed into oxigen (symbol O) that is necessary for human life.
In 1 year a tree is able to transform about 2,5 Kg of CO2
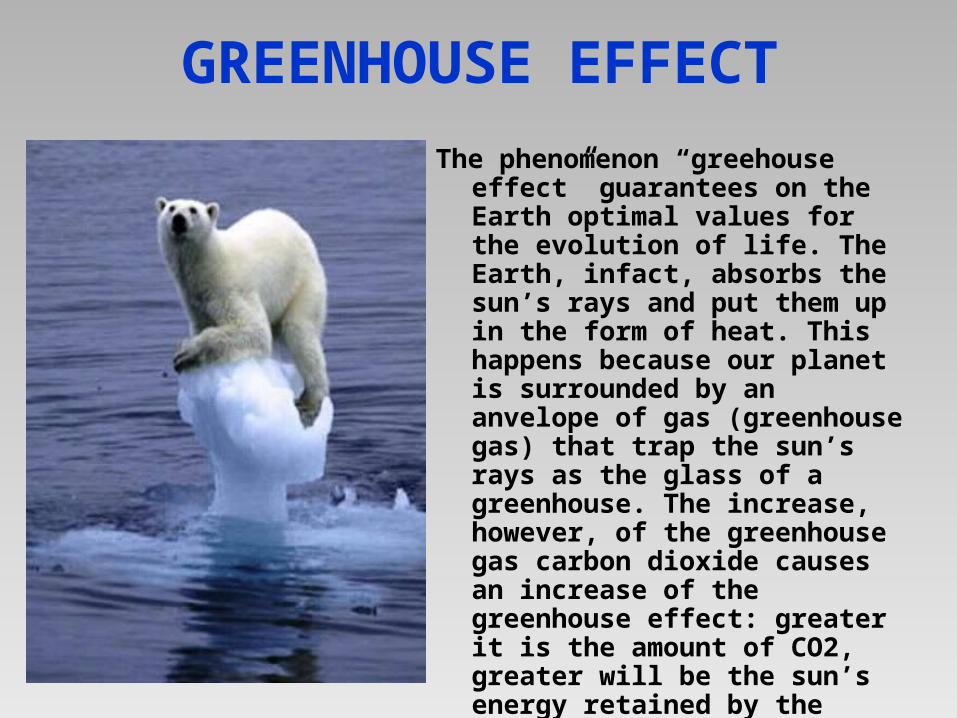
GREENHOUSE EFFECT
The phenomenon “greehouse effect” guarantees on the Earth optimal values for the evolution of life. The Earth, infact, absorbs the sun’s rays and put them up in the form of heat. This happens because our planet is surrounded by an anvelope of gas (greenhouse gas) that trap the sun’s rays as the glass of a greenhouse. The increase, however, of the greenhouse gas carbon dioxide causes an increase of the greenhouse effect: greater it is the amount of CO2, greater will be the sun’s energy retained by the atmosphere, causing a rise in the global temperature on the Earth.

GREENHOUSE EFFECT• This phenomenon involves
a change of climate with the following consequences:
• a) Instability of artic ice; • b) ice melting; • c) rising of sea levels; • d) intensification of the
weather phenomenon; • e) advancement of the
desert areas; • f) reduction of water
resources; • g) effect on migration
flows.

THE ELECTRIC ENERGY SAVING• Buy household appliance belonging
to the classes A++, A+ and A:they guarantee a low power consumption. TABLE
• Use washing machines and dishwashers only with full load. Prefer washing programs at low temperature
• Put the fridge at 10 cm from the wall in the less hot area in the kitchen, away from the stove. Don’t introduce hot food inside: frost forms and consuption increase
• For lighting the home, choose fluorescent bubs: they consume up to 70% cheaper than traditional bulbs and they last up to 8 times higher TABLE
• After use, do not leave electrical equipment (TV, HI-FI, PC, etc.) in stand-by: if you turn off them, you save about 10% of energy. TABLE

WORSHOPS
Electrical consumption 1°
Electrical consumption 2°
Electricity prices in Europe
Energy sources in Italy
Access to energy in the world
Comparision of incandescent and fluorescent lamps
Annual consumption, cost and CO2 emission by a freezer
Analysis of lighting in the school
Power consumption of LCD TVs

WS 1° - ELECTRICAL CONSUMPTION
Appliance Power(Watt)
Average use(hours)
Annual use(hours)
Annual consumption
(kWh)
Emission of CO2
0,242 Kg/kWh
Click on TABLE choose 5 appliances and fill the following table
GO BACK TO THE LISTGO TO THE CALCULATED EXAMPLE

WS 1° - ELECTRICAL CONSUMPTION
Appliance Power(Watt)
Average use(hours)
Annual use(hours)
Annual consumption
(kWh)
Emission of CO2
0,242 Kg/kWh
HI-FI 20 2 730 14,6 3,5
Electric cooker
3000 3 1095 3285 795
Grill 1000 1 365 365 88,33
Polisher 300 0,5 182,5 54,75 13,25
Mixer 150 0,15 54,75 8,21 1,98
Calculated example
GO BACK

ELECTRICAL CONSUPTIONAppliance Power
(watt)
Slicer 50
Hair curling 50
Tumble 3000
Hair dryer 1000
Vacuum cleaner 1000
Boiler 1200
Freezer 300
Hood 100
Electric knife 100
Electric cooker 3000
Iron 1000
Oven 2000
Fryer 2000
Fridge 250
Mixer 150
HI-FI 20
Grill 1000
Lighting 720
Dish washer 3000
Appliance Power(watt)
Polisher 300
Sewing machine 100
Coffee grinder 20
Personal computer 200
Radiator 2000
Radio 10
Radio alarm 10
Recorder 20
Electric heating 15000
Answering machine 5
Squeezer 70
Mover 1000
Television 100
Toaster 1000
Trepan 500
Mincer 200
Humidifier 20
Video recorder 100
Yoghurt machine 20
Go back

WS 2° - ELECTRICAL CONSUMPTION
Appliance Power(Watt)
Average use(hours)
Annual use(hours)
Annual consuption
(kWh)
Cost of energy
0,24€/kWh
Click on TABLE choose 5 appliances and fill the following table
GO BACK TO THE LISTGO TO THE CALCULATED EXAMPLE

WS 2° - ELECTRICAL CONSUMPTION
Appliance Power(Watt)
Average use(hours)
Annual use(hours)
Annual consumption
(kWh)
Cost of energy in
Italy0,24€/kWh
HI-FI 20 2 730 14,6 3,50
Electric cooker
3000 3 1095 3285 788,40
Grill 1000 1 365 365 87,60
Polisher 300 0,5 182,5 54,75 13,12
Mixer 150 0,15 54,75 8,21 1,97
Calculated example
Go back to the list

ELECTRICAL CONSUMPTIONApparecchio Potenza
(watt)
Slicer 50
Hair curling 50
Tumble 3000
Hair dryer 1000
Vacuum cleaner 1000
Boiler 1200
Freezer 300
Hood 100
Electric knife 100
Electric cooker 3000
Iron 1000
Oven 2000
Fryer 2000
Fridge 250
Mixer 150
HI-FI 20
Grill 1000
Lighting 720
Dish washer 3000
Apparecchio Potenza(watt)
Polisher 300
Sewing machine 100
Coffee grinder 20
Personal computer 200
Radiator 2000
Radio 10
Radio alarm 10
Recorder 20
Electric heating 15000
Answering machine 5
Squeezer 70
Mover 1000
Television 100
Toaster 1000
Trepan 500
Mincer 200
Humidifier 20
Video recorder 100
Yoghurt machine 20
Go back

WS 3° - ELECTRICITY PRICES IN EUROPE
Paese 0 5 10 15 20 25 30 c€
Portugal
Poland
Bulgaria
Italy
Romania
Greece
Spain
Latvia
Click on TABLE and fill with color the rows of the following graph
GO BACK TO THE LISTGO TO THE CALCULATED EXAMPLE

WS 3° - ELECTRICITY PRICES IN EUROPE
Country 0 5 10 15 20 25 30 c€Portugal
Poland
Bulgaria
Italy
Romania
Greece
Spain
Latvia
Calculated example: price in Europe with the same purchasing power
Go back
Country 0 5 10 15 20 25 30 c€Portugal
Poland
Bulgaria
Italy
Romania
Greece
Spain
Latvia
Calculated example: price in Europe

ELECTRICITY PRICES IN EUROPE
Country price in cent of € (2007)
Price in cent of € with the
same purchasing
power (2007)
Slovakia 15.37 24.31
Italy 23.29 21.71
Poland 11.84 20.27
Malta 9.87 19.34
Germany 19.49 18.24
Denmark 25.79 18.18
Romania 10.17 17.30
Portugal 15.00 17.12
Czech Republic 10.67 17.04
Bulgaria 6.60 16.66
Cyprus 13.76 15.28
Belgium 15.81 14.76
Austria 15.45 14.49
Luxembourg 16.84 14.32
Hungary 12.22 14.32
Country price in cent of € (2007)
Price in cent of € with the
same purchasing
power (2007)
Slovene 10.64 14.11
Lithuania 7.76 14.04
Netherlands 21.80 13.62
Sweden 17.14 13.61
Irelan 16.62 13.20
Spain 12.25 12.58
Estonia 7.50 11.76
Latvia 6.88 11.76
United Kingdom 13.16 11.27
France 12.11 10.86
Finland 11.60 9.77
Greece 7.20 8.13
Croatia 9.23 13.94
Norway 18.56 13.46
EU 27 15.38 14.64
Go back
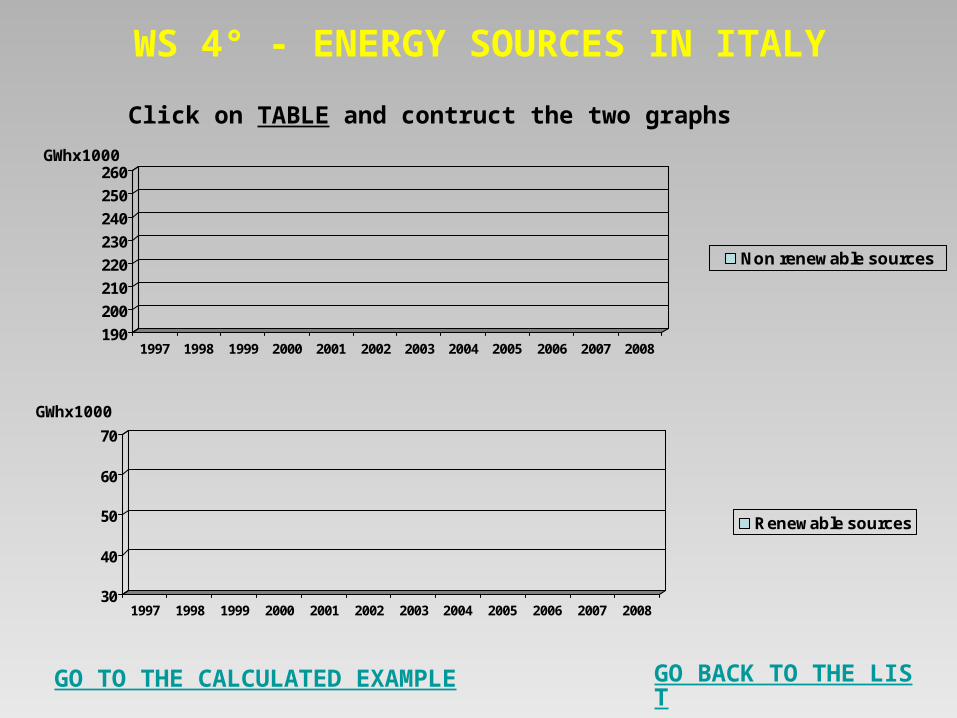
WS 4° - ENERGY SOURCES IN ITALY
190
200
210
220
230
240
250
260
1997 1998 1999 2000 2001 2002 2003 2004 2005 2006 2007 2008
Non renewable sources
30
40
50
60
70
1997 1998 1999 2000 2001 2002 2003 2004 2005 2006 2007 2008
Renewable sources
Click on TABLE and contruct the two graphs
GWhx1000
GWhx1000
GO BACK TO THE LISTGO TO THE CALCULATED EXAMPLE

WS 4° - ENERGY SOURCES IN ITALY
Calculated example
GWhx1000
GWhx1000
GO BACK

ENERGY SOURCES IN ITALY
Source 1997 1998 1999 2000 2001 2002 2003 2004 2005 2006 2007 2008
Solid 20.518 23.311 23.812 26.272 31.730 35.447 38.813 45.518 43.606 44.207 44.112 43.074
Natural gas 60.649 70.213 86.217 97.608 95.906 99.414 117.301 129.772 149.259 158.079 172.646 172.697
Petroleum products 111.226 105.123 91.286 85.878 75.009 76.997 65.771 47.253 35.846 33.830 22.865 19.195
Others 7.668 8.094 5.931 8.791 14.147 15.788 16.406 17.945 18.207 19.304 19.187 18.840
Total thermoelectric (A) 200.061 206.741 207.246 218.549 216.792 227.646 238.291 240.488 246.918 255.420 258.811 253.806
Hydroelectric fron pumping (B) 4.953 6.151 6.419 6.695 7.115 7.743 7.603 7.164 6.860 6.431 5.666 5.604
Hydroelectric natural 41.600 41.214 45.358 44.205 46.810 39.519 36.674 42.744 36.067 36.994 32.815 41.623
Eolic 118 232 403 563 1.179 1.404 1.458 1.847 2.343 2.971 4.034 4.861
Photo-voltaic 6 6 6 6 5 4 5 4 4 2 39 193
Geothermal 3.905 4.214 4.403 4.705 4.506 4.662 5.341 5.347 5.325 5.527 5.569 5.520
Biomass and waste 820 1.229 1.822 1.906 2.587 3.423 4.493 5.637 6.155 6.745 6.954 7.523
Total renewable ( C ) 46.449 46.894 51.992 51.386 55.087 49.012 47.971 55.669 49.893 52.239 49.411 59.720
Total A+B+C 251.463 259.786 265.657 276.629 278.994 284.401 293.865 303.321 303.672 314.090 313.888 319.129
Go back

WS 5° ACCESS TO ENERGY
• The actual organization and distribution of energy, permits to the Earth’s inhabitants, the following access:
• 50% no access• 30% insufficient access• 20% easy access• Use the previous values to color
the pie graph.
• As you know that the Earth’s inhabitants are about 7 miliards, calculate how many people correspond to the percentages listed above:
• 50% = milion people• 30% = milion people• 20% = milion people
GO BACK TO THE LISTGO TO THE CALCULATED EXAMPLE

WS 5° ACCESS TO ENERGY
• The actual organization and distribution of energy, permits to the Earth’s inhabitants, the following access:
• 50% no access• 30% insufficient access• 20% easy access
• As you know that the Earth’s inhabitants are about 7 miliards:
• 50% = 3500 milion people• 30% = 2100 milion people• 20% = 1400 milion people
GO BACK
Calculated example

WS 6° – COMPARISON OF INCANDESCENT AND FLUORESCENT LAMPS
Rooms Lamp type Cost of lamp
Cost of electric energy
Total cost Saving Emission of CO2
1° room N.2 lampsInc. 100W
N. 2 lampsFluo. 20W
2° room N.1 lampInc. 60W
N. 1 lampFluo. 12W
Kitchen N.1 lampInc. 100W
N. 1 lampFluo. 20W
Bathroom N.2 lampsInc. 60W
N. 2 lampsFluo. 12W
Click on TABLE to take data and complete the following table that calculates how much is the energy saving in a little flat if we replace
the incandescent lamps with fluorescent ones
GO BACK TO THE LISTI GO TO THE CALCULATED EXAMPLE
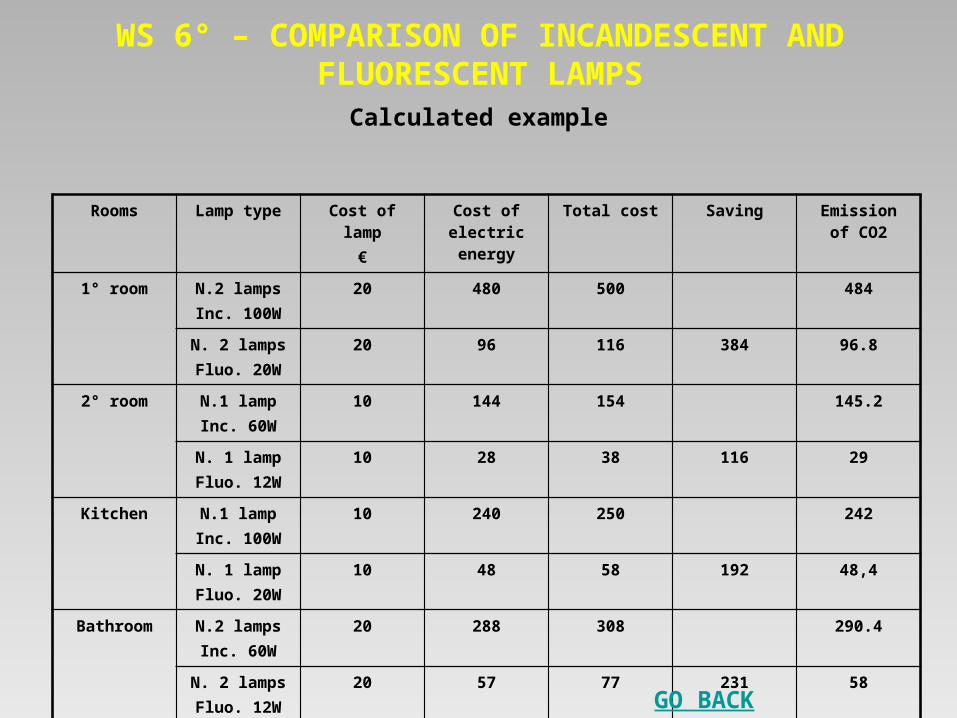
WS 6° – COMPARISON OF INCANDESCENT AND FLUORESCENT LAMPS
Rooms Lamp type Cost of lamp
€
Cost of electric energy
Total cost Saving Emission of CO2
1° room N.2 lampsInc. 100W
20 480 500 484
N. 2 lampsFluo. 20W
20 96 116 384 96.8
2° room N.1 lampInc. 60W
10 144 154 145.2
N. 1 lampFluo. 12W
10 28 38 116 29
Kitchen N.1 lampInc. 100W
10 240 250 242
N. 1 lampFluo. 20W
10 48 58 192 48,4
Bathroom N.2 lampsInc. 60W
20 288 308 290.4
N. 2 lampsFluo. 12W
20 57 77 231 58
Calculated example
GO BACK

COMPARISON OF INCANDESCENT AND FLUORESCENT LAMPS
Example of use: 2000 hours/year for 5 years
Lamp type
Cost of lamps (*)
Cost of electric energy (**) (€)
Total cost (€)
Total saving (€)
Emission of CO2
(kg)
Incand.100W
1€ x 10 lamps= 10€
240 250 --- 510
Fluor. 20W
10€ x 1 lamp= 10€
48 58 192 102
(*) 1 incandescent lamp costs 1€ and last 1000 hours 1 fluorescent lamp costs 10 € and last 10000 hours(**) 1 kWh costs about 0,24 € in Italy
Go back >

WS 7° - ANNUAL CONSUMPTION, COST AND CO2 EMISSION BY A FREEZER IN RELATION TO VARIOUS ENERGY EFFICIENCY
CLASSES
Complete the bas chart. You can find the data you need, clicking on TABLE
Consumption in relation to the energy efficiency classes
GO BACK TO THE LISTGO TO THE CALCULATED EXAMPLE

WS 7° - ANNUAL CONSUMPTION, COST AND CO2 EMISSION BY A FREEZER IN RELATION TO VARIOUS ENERGY EFFICIENCY
CLASSES
Calculated example
Consumption in relation to the energy efficiency classes
GO BACK

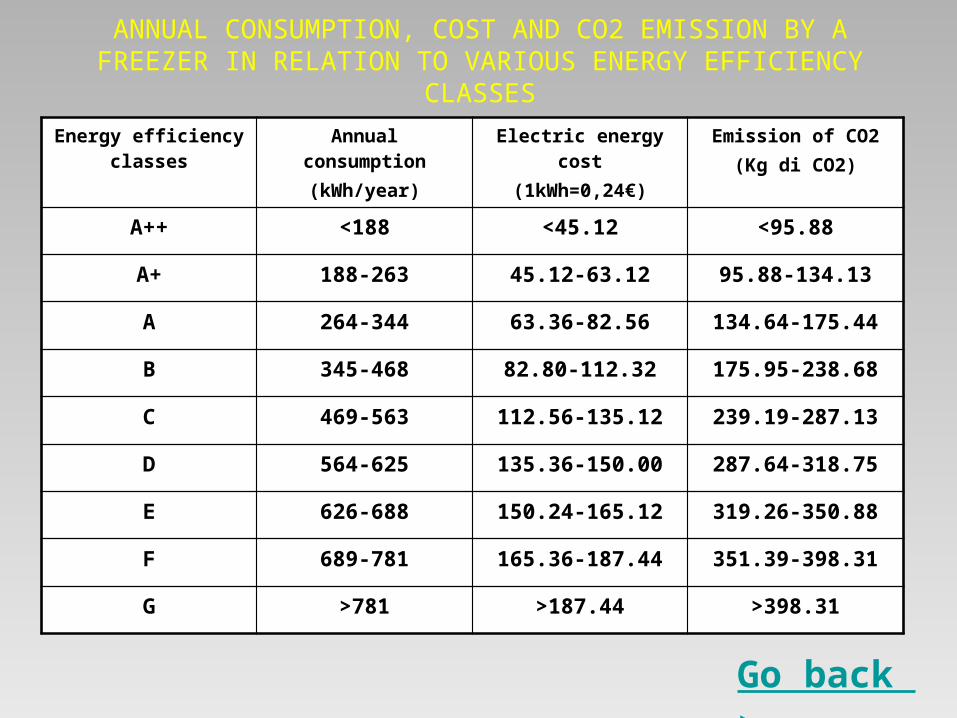
ANNUAL CONSUMPTION, COST AND CO2 EMISSION BY A FREEZER IN RELATION TO VARIOUS ENERGY EFFICIENCY
CLASSESEnergy efficiency
classesAnnual
consumption(kWh/year)
Electric energy cost
(1kWh=0,24€)
Emission of CO2(Kg di CO2)
A++ <188 <45.12 <95.88
A+ 188-263 45.12-63.12 95.88-134.13
A 264-344 63.36-82.56 134.64-175.44
B 345-468 82.80-112.32 175.95-238.68
C 469-563 112.56-135.12 239.19-287.13
D 564-625 135.36-150.00 287.64-318.75
E 626-688 150.24-165.12 319.26-350.88
F 689-781 165.36-187.44 351.39-398.31
G >781 >187.44 >398.31
Go back >

WS 8° - ANALYSIS OF LIGHTING IN THE SCHOOL
LAMP POWER
Power of 1 pipe
Nr. Of pipes
Total power of 1 lamp
CLASSROOM POWER
1 lamp power
Nr. Of lamps
Total power of a classroom
CONSUPTION FOR LIGHTING THE SCHOOL
Units Classroom Nr. of classrooms
School
Lighting power kW=W/1000
Period of lighting: 100 scool days in the winter period x 6 hours/day
Hours
Consuption of electric energy WxHours =WhWh/1000==kWWh
Cost of consuption of electric energy kWhx€=€
Emission of CO2242 g of CO2 for 1 kWh
kWhx242/1000=Kg
Number of trees useful to fix the emission of CO2 2,5 Kg for1 tree in a year
kG/2,5Kg=Nr. f trees
You will find the data that you need clicking on TABLE
GO BACK TO THE LISTGO TO THE CALCULATED EXAMPLE

WS 8° - ANALYSIS OF LIGHTING IN THE SCHOOL
LAMP POWER
Power of 1 pipe 30
Nr. Of pipes 2
Total power of 1 lamp 60
CLASSROOM POWER
1 lamp power 60
Nr. Of lamps 8
Total power of a classroom 480
CONSUPTION FOR LIGHTING THE SCHOOL
Units Classroom Nr. of classrooms
School
Lighting power kW=W/1000 480 15 7.2
Period of lighting: 100 scool days in the winter period x 6 hours/day
Hours 600 15 9000
Consumption of electric energy WxHours =WhWh/1000==kWWh
288 15 4320
Cost of consumption of electric energy kWhx€=€ 69,12 15 1036
Emission of CO2242 g of CO2 for 1 kWh
kWhx242/1000=Kg 69.69 15 1045,44
Number of trees useful to fix the emission of CO2 2,5 Kg for1 tree in a year
kG/2,5Kg=Nr. f trees 27.87 15 418,14
Calculated example
GO BACK

POWER OF NEON PIPES
Pipe 100 cm = 30 WPipe 120 cm = 36 WPipe 150 cm = 58 W
Go back >

WS 9° - ANNUAL CONSUMPTION AND COST OF USING OF AN LCD TV
TV model Power (W)
Hours of use in 1 day
Days of use in 1
year
Hours of use in 1
year
Consumption of
energy in 1 year(kWh)
Cost1kWh=0,2
4€ (in Italy)
On
Stand-by
TOTAL
Clicking on TABLE take the data of 1 TV model and fill the following table:
GO BACK TO THE LISTGO TO THE CALCULATED EXAMPLE

WS 9° - ANNUAL CONSUMPTION AND COST OF USING OF AN LCD TV
TV model Power (W)
Hours of use in 1 day
Days of use in 1
year
Hours of use in 1
year
Consumption of
energy in 1 year(kWh)
Cost1kWh=0,2
4€ (in Italy)
LG32LB75 LCD 32” On 137 5 365 1825 250 60
LG32LB75 LCD 32” Stand-by 1 19 365 6935 6.9 1.65
TOTAL 61.68
Calculated example
GO BACK

TV CONSUMPTION TABLE(1° PART)
Producer and model TecnologyNr. Of
thumbsi
Consuption in stand-by
(W)
Consuption when in
operation W
Acer AT4220 LCD 42 3 190
Fujitsu-Siemens SE32 LCD 32 2 136
LG 32LB1R LCD 32 3 100
LG 32LB75 LCD 32 <1 137
LG 37LB1R LCD 37 4 163
LG 37LC3R LCD 37 2 185
LG 42PC3LA PLASMA 42 3 283
LG 47LB2RF LCD 47 2 269
Panasonic 42PZ700 PLASMA 42 <1 348
Panasonic TH42PV70 PLASMA 42 <1 324
Panasonic TH50PX700 PLASMA 50 <1 488
Panasonic TH50PX70E PLASMA 50 <1 465
Panasonic TX32LEDF7 LCD 32 <1 120
Philips 32PF9641 LCD 32 2 172
Philips 32PFL7602 LCD 32 2 78
Philips 37PF5321 LCD 37 2 157
Philips 47PFL9632D LCD 47 <1 306
Go back > Go to the 2° part >

TV CONSUMPTION TABLE(2° PART)
Pioneer PDP4270XD PLASMA 42 <1 280
Samsung LE32R86WD LCD 32 <1 71
Samsung LE37R72B LCD 37 2 168
Samsung LE40M71 LCD 40 <1 217
Samsung LE46S86BD LCD 46 <1 228
Sharp 32ADSE LCD 32 <1 120
Sharp LC32WD1E LCD 32 <1 138
Sharp LC42RD1E LCD 42 2 226
Sharp LC42SA1E LCD 42 <1 212
Sharp LC42WD1E LCD 42 <1 153
Sharp LC46XL1E LCD 46 4 279
Sony KDL32D3000 LCD 32 <1 153
Sony KDL40D3000 LCD 40 <1 179
Sony KDL40T3500 LCD 40 2 183
Sony KDL40X2000 LCD 40 2 197
Sony KDL46W3000 LCD 46 2 270
Toshiba 32C3030D LCD 32 <1 122
Toshiba 32WL68 LCD 32 <1 144
Toshiba 47WLG66 LCD 47 <1 259
Mitsubishi TV a tubo catodico CRT 25 9 72
Go back >

TV CONSUMPTION TABLE(1° PART)
Producer and model TecnologyNr. Of
thumbsi
Consuption in stand-by
(W)
Consuption when in
operation W
Acer AT4220 LCD 42 3 190
Fujitsu-Siemens SE32 LCD 32 2 136
LG 32LB1R LCD 32 3 100
LG 32LB75 LCD 32 <1 137
LG 37LB1R LCD 37 4 163
LG 37LC3R LCD 37 2 185
LG 42PC3LA PLASMA 42 3 283
LG 47LB2RF LCD 47 2 269
Panasonic 42PZ700 PLASMA 42 <1 348
Panasonic TH42PV70 PLASMA 42 <1 324
Panasonic TH50PX700 PLASMA 50 <1 488
Panasonic TH50PX70E PLASMA 50 <1 465
Panasonic TX32LEDF7 LCD 32 <1 120
Philips 32PF9641 LCD 32 2 172
Philips 32PFL7602 LCD 32 2 78
Philips 37PF5321 LCD 37 2 157
Philips 47PFL9632D LCD 47 <1 306
Go back > Go to the 2° part
>

TV CONSUMPTION TABLE(2° PART)
Pioneer PDP4270XD PLASMA 42 <1 280
Samsung LE32R86WD LCD 32 <1 71
Samsung LE37R72B LCD 37 2 168
Samsung LE40M71 LCD 40 <1 217
Samsung LE46S86BD LCD 46 <1 228
Sharp 32ADSE LCD 32 <1 120
Sharp LC32WD1E LCD 32 <1 138
Sharp LC42RD1E LCD 42 2 226
Sharp LC42SA1E LCD 42 <1 212
Sharp LC42WD1E LCD 42 <1 153
Sharp LC46XL1E LCD 46 4 279
Sony KDL32D3000 LCD 32 <1 153
Sony KDL40D3000 LCD 40 <1 179
Sony KDL40T3500 LCD 40 2 183
Sony KDL40X2000 LCD 40 2 197
Sony KDL46W3000 LCD 46 2 270
Toshiba 32C3030D LCD 32 <1 122
Toshiba 32WL68 LCD 32 <1 144
Toshiba 47WLG66 LCD 47 <1 259
Mitsubishi TV a tubo catodico CRT 25 9 72
Go back >

ENERGY SOURCES IN ITALY
Source 1997 1998 1999 2000 2001 2002 2003 2004 2005 2006 2007 2008
Solid 20.518 23.311 23.812 26.272 31.730 35.447 38.813 45.518 43.606 44.207 44.112 43.074
Natural gas 60.649 70.213 86.217 97.608 95.906 99.414 117.301 129.772 149.259 158.079 172.646 172.697
Petroleum products 111.226 105.123 91.286 85.878 75.009 76.997 65.771 47.253 35.846 33.830 22.865 19.195
Others 7.668 8.094 5.931 8.791 14.147 15.788 16.406 17.945 18.207 19.304 19.187 18.840
Total thermoelectric (A) 200.061 206.741 207.246 218.549 216.792 227.646 238.291 240.488 246.918 255.420 258.811 253.806
Hydroelectric fron pumping (B) 4.953 6.151 6.419 6.695 7.115 7.743 7.603 7.164 6.860 6.431 5.666 5.604
Hydroelectric natural 41.600 41.214 45.358 44.205 46.810 39.519 36.674 42.744 36.067 36.994 32.815 41.623
Eolic 118 232 403 563 1.179 1.404 1.458 1.847 2.343 2.971 4.034 4.861
Photo-voltaic 6 6 6 6 5 4 5 4 4 2 39 193
Geothermal 3.905 4.214 4.403 4.705 4.506 4.662 5.341 5.347 5.325 5.527 5.569 5.520
Biomass and waste 820 1.229 1.822 1.906 2.587 3.423 4.493 5.637 6.155 6.745 6.954 7.523
Total renewable ( C ) 46.449 46.894 51.992 51.386 55.087 49.012 47.971 55.669 49.893 52.239 49.411 59.720
Total A+B+C 251.463 259.786 265.657 276.629 278.994 284.401 293.865 303.321 303.672 314.090 313.888 319.129
Go back

Comparison of incandescent and fluorescent lamps
Example of use: 2000 hours/year for 5 years
Lamp typeCost of
lamps (*)
Cost of electric energy (**) (€)
Total cost (€)
Total saving (€)
Emission of CO2
(kg)
Incand.100W
1€ x 10 lamps= 10€
240 250 --- 510
Fluor. 20W
10€ x 1 lamp= 10€
48 58 192 102
(*) 1 incandescent lamp costs 1€ and last 1000 hours 1 fluorescent lamp costs 10 € and last 10000 hours(**) 1 kWh costs about 0,24 € in Italy
Go back >

COMPARISON OF INCANDESCENT AND FLUORESCENT LAMPS
Example of use: 2000 hours/year for 5 years
Lamp typeCost of
lamps (*)
Cost of electric energy (**) (€)
Total cost (€)
Total saving (€)
Emission of CO2
(kg)
Incand.100W
1€ x 10 lamps= 10€
240 250 --- 510
Fluor. 20W
10€ x 1 lamp= 10€
48 58 192 102
(*) 1 lampada ad incandescenza costa 1€ e dura 1000 ore 1 lampada a fluorescenza costa 10 € e dura 10000 ore(**) 1 kWh costa mediamente, in Italia, 0,24 €
Go back >

THE END


![Index [] · 2018. 6. 10. · Partigiani sovietici… p. 3 Isaia Mensi Introduzione In Italia hanno combattuto con la resistenza antinazifascista circa 5000 partigiani di origine russa,](https://static.fdocuments.net/doc/165x107/60c323486afd32384070fb12/index-2018-6-10-partigiani-sovietici-p-3-isaia-mensi-introduzione-in-italia.jpg)