COMBINING THE SUITABILITY-FEASIBILITY- ACCEPTABILITY …
22
FACTA UNIVERSITATIS Series: Mechanical Engineering Vol. 19, N o 3, Special Issue, 2021, pp. 579 - 600 https://doi.org/10.22190/FUME210711062Z © 2021 by University of Niš, Serbia | Creative Commons License: CC BY-NC-ND Original scientific paperCOMBINING THE SUITABILITY-FEASIBILITY- ACCEPTABILITY (SFA) STRATEGY WITH THE MCDM APPROACH Sarfaraz Hashemkhani Zolfani 1 , Ramin Bazrafshan 2 , Parnian Akaberi 2 , Morteza Yazdani 3 , Fatih Ecer 4 1 School of Engineering, Catholic University of the North, Larrondo, Coquimbo, Chile 2 Department of Industrial Engineering and Management Systems, Amirkabir University of Technology (Tehran Polytechnic), Tehran, Iran 3 ESIC University, Madrid, Spain 4 Department of Business Administration, Afyon Kocatepe University, Afyonkarahisar, Turkey Abstract. Suitability-Feasibility-Acceptability (SFA) is a fundamental tool for the development and selection of strategy. Any type of decision-making problem can be resolved by Multiple Criteria Decision Making (MCDM) methods. In this research, we explore the complexity of determining the proper goal market for the Chilean fish market. This study proposed a combined approach of SFA with MCDM methods in a real case study. The proposed structure helps to assign the best market for Chilean export fish to West Asia. Three countries (Saudi Arabia, the United Arab Emirates, and Oman) are selected as a target market in this region, and then related criteria are obtained from various sources. In order to develop a new market for the Chilean fishery industry, five major criteria, including the potential of a target market, region's economic attractiveness, consumption of the seafood, location, cost of transportation, and country risks, were selected based on the SFA framework. Calculating the criteria weights is performed by the Best-Worst (BWM) method, and ordering the alternatives is operated by Measurement Alternatives and Ranking according to compromise Solution (MARCOS) methods. The results showed that Oman is the best destination (importer) for the Chilean fish market (Salmon fish as the case). Key Words: International Markets, Multiple Criteria Decision Making (MCDM), Suitability-Feasibility-Acceptability (SFA) Method, Export Received July 11, 2021 / Accepted September 23, 2021 Corresponding author: Morteza Yazdani ESIC University, Cam. Valdenigriales, S/N, 28223 Pozuelo de Alarcón, Madrid, Spain E-mail: [email protected]
Transcript of COMBINING THE SUITABILITY-FEASIBILITY- ACCEPTABILITY …

FACTA UNIVERSITATIS Series: Mechanical Engineering Vol. 19, No 3, Special Issue, 2021, pp. 579 - 600
https://doi.org/10.22190/FUME210711062Z
© 2021 by University of Niš, Serbia | Creative Commons License: CC BY-NC-ND
Original scientific paper
COMBINING THE SUITABILITY-FEASIBILITY-
ACCEPTABILITY (SFA) STRATEGY
WITH THE MCDM APPROACH
Sarfaraz Hashemkhani Zolfani1, Ramin Bazrafshan2,
Parnian Akaberi2, Morteza Yazdani3, Fatih Ecer4
1School of Engineering, Catholic University of the North, Larrondo, Coquimbo, Chile 2Department of Industrial Engineering and Management Systems,
Amirkabir University of Technology (Tehran Polytechnic), Tehran, Iran 3ESIC University, Madrid, Spain
4Department of Business Administration, Afyon Kocatepe University,
Afyonkarahisar, Turkey
Abstract. Suitability-Feasibility-Acceptability (SFA) is a fundamental tool for the
development and selection of strategy. Any type of decision-making problem can be
resolved by Multiple Criteria Decision Making (MCDM) methods. In this research, we
explore the complexity of determining the proper goal market for the Chilean fish
market. This study proposed a combined approach of SFA with MCDM methods in a
real case study. The proposed structure helps to assign the best market for Chilean
export fish to West Asia. Three countries (Saudi Arabia, the United Arab Emirates, and
Oman) are selected as a target market in this region, and then related criteria are
obtained from various sources. In order to develop a new market for the Chilean
fishery industry, five major criteria, including the potential of a target market, region's
economic attractiveness, consumption of the seafood, location, cost of transportation,
and country risks, were selected based on the SFA framework. Calculating the criteria
weights is performed by the Best-Worst (BWM) method, and ordering the alternatives is
operated by Measurement Alternatives and Ranking according to compromise Solution
(MARCOS) methods. The results showed that Oman is the best destination (importer)
for the Chilean fish market (Salmon fish as the case).
Key Words: International Markets, Multiple Criteria Decision Making (MCDM),
Suitability-Feasibility-Acceptability (SFA) Method, Export
Received July 11, 2021 / Accepted September 23, 2021
Corresponding author: Morteza Yazdani ESIC University, Cam. Valdenigriales, S/N, 28223 Pozuelo de Alarcón, Madrid, Spain
E-mail: [email protected]

580 S. H. ZOLFANI, R. BAZRAFSHAN, P. AKABERI, M. YAZDANI, F. ECER
1. INTRODUCTION
In recent years, worldwide, some concepts such as globalization, fast technological
changes, the appearance of new markets, and changing customer expectations cause
fierce emerging competition. This phenomenon forced stakeholders to think strategically
and make strategic plans for their business [1]. Strategic planning is the art of creating
strategies and aligning a business’s vision for the future of industries or markets. In order
to select the proper strategy, many strategic options should be surveyed. The strategic
planning process usually consists of three critical steps [2]: (i) strategy formulation,
(ii) strategy implementation, and (iii) strategy evaluation. In strategy formulation, managers
survey markets and make decisions that concentrate on their plan or generally ignore it. By
choosing suitable strategies or plans, the company implements them in order to achieve the
desired results. In the final step, the performance of the selected strategy is evaluated. In
addition to the strategic planning process, some tools are introduced to analyze strategic
possibilities. Strategic analysis is a process of seeking the operating environment of a
company to formulate a strategy. This analysis consists of three main factors [3]:
(i) Identification and evaluation of data relevant to strategy formulation, (ii) analyzing the
internal and external environments, and (iii) use of the analytic method. There are various
analytic methods in literature like SWOT analysis, PEST analysis, Porter’s five forces
analysis, four corner’s analysis, value chain analysis, early warning scans, war gaming. These
methods are used in various fields. Lee et al. used SWOT analysis to measure the limitations
and strengths of the Korean space and satellite industry. Sometimes researchers combined
them with other methods [4]. Sahani combined SWOT with the MCDM method like AHP
and Fuzzy_AHP to formulate and prioritize ecotourism strategies in Western Himalaya, India
[5]. Johnson et al. developed a matrix named SFA to evaluate and analyze the strategies [6].
This method consists of three main sections such as suitability, feasibility, and acceptability.
The criteria that the managers take into consideration for comparison purposes should
categorize in these three sections. The strategies are listed as options in this method, and
each criterion gets scores basis on the experts' or managers' verdict. Then, the options are
compared by these scores. The SFA covers a varied range of criteria and items. This is an
excellent characteristic that helps the managers to compare the strategies from various aspects.
However, this is a plausible method but has some constraints for real problems or complicated
issues. It has not a distinct method for assigning a weight of criteria. This is one of the
problems that make the managers less ready to use this analytic method.
The SFA method structure is very similar to the MCDM methods, both of them
distinguish the priorities of alternatives by evaluating the criteria. This similarity caused the
researchers to decide to utilize the MCDM methods, assign weight to criteria, and evaluate the
strategies' options. The SFA strategy first selects some criteria and then evaluates them, most
likely the MCDM methods. This study attempts to combine the SFA framework with the
MCDM methods. Showing the efficiency of this combined methodology, the researchers
propose a practical case study and implement this new method on it.
Section 2 reviews literature about SFA and MCDM methods and explains this study's
objective. Section 3 describes the methodology of the SFA and MCDM methods. Section 4
addresses the application of this method to exporting Chilean fish and its implementation as
well as the research gap and discussion. Finally, section 5 provides conclusions.

Combining the Suitability-Feasibility-Acceptability (SFA) Strategy with the MCDM Approach 581
2. LITERATURE REVIEW
2.1. A summary of SFA background
Nowadays, using MCDM methods in strategic planning is vital because these
methods can be combined with the strategic method and can promote their outcome and
accuracy. The MCDM methods with mathematical formulation could help the managers
to select the optimum option or the best strategy with the highest degree of satisfaction in
the board of managers [7]. In the following, several works that used the MCDM methods
in the strategic fields are mentioned. Mehrjerdi used the MCDM method for selecting the
strategic system with linguistic preference and gray information. They proposed a method
for selecting alternatives in the presence of uncertainty and determined optimal choice
among seven possible alternatives. They compared the obtained results with quantitative
strategic planning matrix (QSPM), Technique for Order of Preference by Similarity to
Ideal Solution (TOPSIS), and simple additive weighting (SAW) methods and gathered a
similar ranking with TOPSIS and SAW. Their results also validate that the ranking
obtained by the QSPM is inferior in the comparison methods [8]. Selecting an appropriate
vendor is often a non-trivial task, in which multiple criteria need to be carefully examined.
However, many decision-makers or experts select vendors based on their experience and
intuition. Shyur and Shih used a hybrid MCDM model for strategic vendor selection. They
proposed a five-step hybrid process, which incorporates an analytic network process (ANP)
technique. More clearly, the ANP method is used to obtain the relative weights of criteria.
Then, the modified TOPSIS is adopted to rank competing products in terms of their overall
performance. They reported that the proposed method is practical for ranking competing
vendors regarding their overall performance concerning multiple interdependence criteria.
They declared that the consideration of relationships between criteria provides the
organization with a way to devise and refine adequate criteria and alleviate the risk of
selecting sub-optimal solutions [9]. Banihabib et al. examined the strategies to tackle water
shortage for sustainable development in Shahrood, Iran. In their paper, a contentious plan has
been proposed to transfer water from the Caspian Sea north of Iran to this region. They used
Strengths, Weaknesses, Opportunities, and Threats (SWOT) analysis. Due to the SWOT
model's inability to rank the alternatives, the developed strategies are ranked using MCDM
models based on specified sustainable development criteria. The ranking model was
programmed by using the compensatory models of SAW and analytical hierarchy process
(AHP) and the non-compensatory model of Elimination and Choice Translating Reality III
(ELECTRE III). All MCDM models' results introduced water transfer as the worst strategy
for a region [10]. Hashemkhani Zolfani et al. presented a new strategic hybrid model for
international market selection based on Market Attractiveness and Business Attractiveness
(MABA) analysis and the EDAS method (one of the latest MCDM methods). They worked
on a case in Iran's food industry and could develop the primary model of the MABA analysis
in the MCDM outline. Using this model leads to selecting the most suitable and profitable
market, considering several quantitative and qualitative factors [11]. As noted, one essential
strategic planning, which has three assessment criteria, is the SFA strategy. It has been utilized
as a powerful marketing method since the researchers received valuable strategic planning
results while using that in a real problem. The following paragraphs review some research
projects which used SFA in their studies. In order to get incremental improvement, companies
and organizations try to attain an effective strategy. Georgise & Mindaye examined the
suitability, acceptability, and feasibility of Kaizen – A Japanese concept used for continuous

582 S. H. ZOLFANI, R. BAZRAFSHAN, P. AKABERI, M. YAZDANI, F. ECER
improvement- among SMEs in Ethiopia. Since organizations were eager to use this strategy,
the researchers decided to evaluate Kaizen's feasibility, suitability, and acceptability for these
organizations. The study results showed that although some enterprises think it is a confusing
strategy, most of them are willing to implement Kaizen in their companies (acceptability). The
study also found that the feasibility of Kaizen practices is possible, despite being a bit
challenging. As a result, the study showed that Kaizen as an effective strategy is accepted in
Southern Region, Ethiopia organizations and can improve their performance. However, still,
its feasibility seems challenging [12]. Čirjevskis & Novikova investigated the commercial
viability of green energy business to make an investment choice for Latvian hydropower
producer and seller LLC “Green Energy Solutions”. They investigated the theoretical and
practical application of such concept of the commercial viability of a strategy as an SFA,
explored the latest trends of Green Energy Business in EU and Latvia, and defined strategic
suitability. The research team calculated equivalent annual annuities of each alternative
investment project and discussed financial feasibility to confirm disproving investments in a
hydropower station or wind turbine [13].
Alimardani et al. presented a new-hybrid strategic model based on the SWARA method
and Yin-Yang balance theory to design products with both international and local perspectives
[14]. Dalic et al presented a new hybrid MCDM model applied in SWOT strategic tool for
decision-making in a transportation company. They applied Fuzzy PIPRECIA, FUCOM,
SWOT, and MARCOS methods in their study [15]. Amoozad Mehrjerdi et al. presented a
hybrid MCDM model based on BWM and interval-valued intuitionistic fuzzy TODIM for
evaluating strategies for implementing industry 4.0 [16]. Ullah et al. reviewed tourism
resources in ecologically sensitive coastal areas of Baluchistan to assess their potential for
establishing community-based ecotourism following the SFA framework. The collected
information about the coastal regions was analyzed through SWOT analysis and fuzzy logic
analysis. The results showed that the introduction of CBE within the selected localities
without any investment in basic infrastructure and capacity building of communities would
inevitably negatively impact the natural environment because the infrastructure and
communities’ knowledge for developing the desired services were below the required
standards [17]. Puška et al. used multi-criteria analysis methods for ranking project
management programs. They perform the MARCOS method for evaluating. Since there are
many software solutions for the project manager, selecting the best one is critical. So, the
researchers choose four softwares: Smart sheet, Asana, Microsoft Project, and Basecamp.
They evaluate them by seven scenarios and conclude that the Smart sheet is the best [18].
Pamučar & Savin choose the off-road vehicle for transportation activities in the Serbian
Armed Forces because selecting the proper vehicle increases the safety, quality, and efficiency
of load carried out. They used the hybrid method BWM-COPRAS for this selection. Seven
criteria are introduced by them with each of them having seven sub-criteria. For verification of
the results, they used BWM-MABAC and BWM-MARCA models [19]. Hashemkhani
Zolfani et al. have proposed a vision-based weighting system (VIEWS) for the managers to
consider time vision in their decision-making. They used a hybrid method EDAS-PMADM
for this study. The three-time concept is analyzed (Current, 2025, and 2030) and shows that
the ranking of alternatives is changed by time. The policymakers by this method can make
good decisions for the future of their company [20]. Hasheminasab et al. implement the
Circular Economic (CE) for minimizing the harmful effect of using fossil fuel. They consider
three different fossil fuels (oil, gas, and coil) for selecting the most sustainable fuels. The
EXTENDED-SWARA method is used for evaluating the CE criteria. Then they used the

Combining the Suitability-Feasibility-Acceptability (SFA) Strategy with the MCDM Approach 583
MARCOS method for ranking, and they showed that gas is the most sustainable fuel of the
two others [21]. Hashemkhani Zolfani, et al. developed a novel integrated decision-making
tool for selecting the most profitable market. They consider multiple factors like: social,
political, economic, and ecological. The hybrid model of Market Attractiveness and Business
Attractiveness (MABA) with EDAS proposed and evaluated several international markets by
this method [11]. Behzad et al studied the waste management system. They introduced seven
criteria: waste generation, composting waste, recycling waste, and landfilling waste, recycling
rate, waste to the energy rate, and greenhouse gas emissions from waste. They used the hybrid
method BWM-EDAS for weighting and evaluating the criteria and ranking them. The five
countries are considered as alternatives: Denmark, Finland, Iceland, Norway, and Sweden.
The result showed that Sweden has the best waste management profile (0.9748) [22].
Hashemi et al. used the MCDM method for feature selection. They applied the TOPSIS
method for evaluating multi-label data. The ridge regression algorithm is used for
constructing a decision matrix; for calculating the weight of this matrix, they implement the
entropy method. They ranked the features and said the user could select a desired number of
features [23]. Table 1 represents some recent studies about the SFA strategy mentioned above.
Table 1 Studies related to SFA strategy
Goal Author/s
1 Evaluating Kaizen strategy usage among SMEs Bete Georgise & Mindaye [12]
2 Evaluating strategic options of KAIZEN
(a business management concept)
Bwemelo [10]
3 Assessing community-based ecotourism potentials of
coastal areas of Baluchistan
Ullah et al. [17]
4 Evaluating the potential success or failure of a project Abu Hassan & Moshdzir [24]
5 Making an investment choice for corporations Čirjevskis & Novikova [13]
According to the above research, it has been recognized that the SFA is a valuable and
productive method. The scientist and stakeholder intend to use it more than before if the
degree of conformity is improved. Combining the MCDM method with strategic planning
gives a significant result. Therefore, this study tries to boost the accuracy of the SFA by using
an MCDM method. In general, the research question concerns the main benefits of combining
the MCDM approach in the SFA concept to improve strategy development.
2.2. Research objective and novelty
According to the research question, below are the main aims to reach:
▪ Improve the SFA strategy for complex problems and increase its accuracy. The
SFA is used just for nominal value criteria, but this combination could use the
criteria with no nominal value, and,
▪ Calculate the weight of criteria by a distinct method.
The SFA method allocates criteria weights based on their importance. In other words, the
more critical the criterion is, the more amount of weight it will be given during evaluations.
However, this method has not introduced a specified way of calculating weights.
Section 3 explains the SFA strategy and the MCDM method, which is used in this
strategy. In Section 4, a case study is analyzed with these new criteria and, based on this
process, concluded consequences in the last quarter.

584 S. H. ZOLFANI, R. BAZRAFSHAN, P. AKABERI, M. YAZDANI, F. ECER
The proposed model has novelty due to these reasons:
▪ It reveals a new perspective for strategy formulation that improves in several
aspects. This enables experts and strategists to incur.
▪ There is no study in the history of strategy planning and decision-making with
multiple attributes to measure the performance of strategies.
▪ Application of the combined evaluation structure leads to an improved and
reliable process that experts can comprehend.
3. METHODOLOGY
This section firstly introduces the SFA strategy processes and then describes the Best-
worst MCDM steps.
3.1. SFA strategy processes
Child was one of the significant authors who discussed strategic choice amongst
organizational theorists [24]. Čirjevskis and Novikova claimed that the concept of strategic
choice initially originated from the perception that its operational strengths and opportunities
define its direction [13]. Johnson et al. had a similar approach to strategic choice. They were
the major contributors to the strategy choice viability by applying a clear model SFA of
examining strategic opportunity through three assessment criteria: suitability, feasibility, and
acceptability [25].
Strategic choices involve the options for strategy in terms of both the directions in which
strategy might move and the methods by which strategy might be pursued. Once a set of
strategic options has been established, it is time to evaluate their relative merits. The SFA
framework suggests three criteria (see Table 2). Suitability asks whether a strategy addresses
the key issues relating to the opportunities and constraints an organization faces. Acceptability
asks whether a strategy meets the expectations of the stakeholders. Last, feasibility invites an
explicit consideration of whether a strategy could work in practice. In other words, suitability
is related to its strategic position and whether its strategic choice matches the external
environment and company resources and capabilities. Feasibility is concerned with assessing
the company’s internal capabilities in terms of financial resources. Finally, acceptability
relates to evaluating whether the chosen strategies can meet stakeholders’ expectations in
terms of outcomes. According to this model, strategic options should be evaluated before
implementing them in a new context. Three ‘strategic option evaluation tests’ are suggested,
which helps us evaluate this nature's strategic choice before applying it to a particular
environment. These are the suitability test, acceptability test, and feasibility test. The
suitability test considers whether the option is the right one in given circumstances. The
acceptability test considers whether the strategic option will gain crucial support from the
corresponding parties or lead to opposition or criticism. Further, the feasibility test considers
whether a company can successfully carry out the strategic option [25].

Combining the Suitability-Feasibility-Acceptability (SFA) Strategy with the MCDM Approach 585
Table 2 The SAF criteria and techniques of evaluation
The SAF criteria Scope
Suitability
(focused on external factors)
▪ Does a proposed strategy address the key opportunities and
constraints an organization faces?
Acceptability (focused on the
internal factor)
▪ Does a proposed strategy meet the expectations of stakeholders?
▪ Is the level of risk acceptable?
▪ Is the likely return acceptable?
▪ Will stakeholders accept the strategy?
Feasibility ▪ Would a proposed strategy work in practice?
▪ Can the strategy be financed?
▪ Do people and their skills exist, or can they be obtained?
▪ Can the required resources be obtained and integrated?
3.2. Best-worst method (BWM)
Rezaei proposed a new MCDM method called the best-worst method (BWM). The
BWM method has made substantial advancements in weight determination. According to
BWM, the decision-maker identifies the best (e.g. most desirable, most important) and
the worst (e.g. least desirable, least important) criteria. Pairwise comparisons are then
conducted between these two criteria (best and worst) and the other ones. A max-min
problem is then formulated and solved to determine the weights of different criteria. The
weights of the alternatives concerning different criteria are obtained using the same
process. The alternatives' final scores are derived by aggregating the weights from
different criteria and alternatives, based on the best alternative which is selected [26].
BWM has been successfully applied in many areas. Torkayesh et al. applied it for the
assessment of healthcare sectors in Eastern European countries [27]. Pamucar et al.
addressed BWM to select the most preferred renewable energy source for a developing
country [28]. Ecer performed it for the sustainability evaluation of wind plants [29]. For
sustainable supplier evaluation, Ecer and Pamucar utilized the BWM technique [30].
Hashemkhani Zolfani et al. handled it for selecting the best location for a newcomer in
Chile [31]. Besides, some researchers performed it successfully in various fields [32-35].
The steps of the BWM method for calculating the weights of criteria are defined below.
Step 1: In this step, decision-makers determine a set of decision criteria.
Step 2: After selecting decision criteria, they should separate the best and the worst
criteria.
Step 3: The preference of the best criterion over all the other criteria should be
determined, for this we could use a number between 1 and 9. The resulting Best-to-Others
vector would be:
1 2
( , ,..., )B B B Bn
A a a a= ,
where aBj indicates the preference of best criterion B over criterion j and aBB =1.
Step 4: The preference of all the criteria over the worst criterion is determined, and for
this we could use a number between 1 and 9. The resulting Others-to-Worst vector would be:
1 2( , ,..., )T
w w w nwA a a a=
where ajw indicates the preference of criterion j over worst criterion W and aww =1.

586 S. H. ZOLFANI, R. BAZRAFSHAN, P. AKABERI, M. YAZDANI, F. ECER
Step 5: Find the optimal weights * * *
1 2( , ,..., )nw w w .The optimal weight for the criteria is
the one where, for each pair of wB/wj and wj/ww, wB/wj=aBj and wj/ww=ajw. To satisfy
these conditions for all j should find a solution where the maximum absolute differences
B
Bj
j
wa
w− and
j
jw
w
wa
w− for all j is minimized. Considering the non-negativity and sum
condition for the weights, the following problem emerges:
min max ,j
jB
Bj jw
j w
wwa a
w w
− −
(1)
s.t. 1j
j
w = (2)
0,j for allw j (3)
The above formulation could be transferred to the following formulation:
Min (4)
s.t. , − B
Bj
j
forw
aw
all j (5)
, − j
jw
w
forw
aw
all j (6)
1= j
j
w (7)
0,j for allw j (8)
By solving the above formulation, the optimal weights * * *
1 2( , ,..., )nw w w and * are
obtained [26].
3.3. Measurement alternatives and ranking according to compromise solution
(MARCOS)
This method determines ideal and anti-ideal alternatives as reference values and then
defines the relationship – represented as a utility function in the MARCOS method - between
them and other alternatives. Though it has been introduced very recently, it attracted
considerable attention from researcher communities [27], [36-41]. The following are the steps
of the MARCOS method [42].
Step 1: Formation of decision-making matrix. In this step, a matrix with n criteria and
m alternatives is defined.
Step 2: Determination of ideal (AI) and anti-ideal solution (AAI) and extended decision
matrix.
min x if j beneficial and max x if j non- beneficial= ij ijAAI (9)

Combining the Suitability-Feasibility-Acceptability (SFA) Strategy with the MCDM Approach 587
max x if j non-beneficial and min x if j beneficial= ij ijAI
(10)
Step 3: Normalization of the extended decision matrix.
if j non-beneficial= ai
ij
ij
xn
x (11)
if j beneficial=ij
ij
ai
xn
x (12)
Step 4: Determination of the weighted matrix:
v =n *ij ij jw
(13)
Step 5: Calculation of the Utility degree of alternatives Ki.
−
−
= i
i
anti ideal
SK
S (14)
+ = i
i
ideal
SK
S (15)
i
1
S ==
n
ij
i
v (16)
Step 6: Determination of the utility function of alternatives f(Ki).
( )1 ( ) 1 ( )
1( ) ( )
+ −
+ −
+ −
+=
− −+ +
i i
i
i i
i i
K Kf K
f K f K
f K f K
(17)
Utility function in relation to the anti-ideal solution:
( ) +
−
+ −=
+
i
i
i i
Kf K
K K (18)
Utility function in relation to the anti-ideal solution:
( ) −
+
+ −=
+
i
i
i i
Kf K
K K (19)
Step 7: Ranking the alternatives. All alternatives are ranked as per their values of
utility functions.
The advantages of the MARCOS method are: it considers an anti-ideal and ideal solution
at the very beginning of the formation of an initial matrix, it proposes a new way of
determining utility functions and their aggregation, and the possibility to consider a large set
of criteria and alternatives while maintaining the stability of the method [40]. The MARCOS
method is also used in various fields like sustainable supplier selection in the healthcare
industry [40], iron and steel industry [38], assessment of battery electricity [43], and integrated
to other MCDM method like FUCOM [40], ITARA [39], and used as Fuzzy MARCOS [44].

588 S. H. ZOLFANI, R. BAZRAFSHAN, P. AKABERI, M. YAZDANI, F. ECER
As mentioned, the MARCOS method is proper for solving real-world business problems,
helping decision-makers in multifaceted problems, and contributing to the Prospective
Multiple Attribute Decision Making.
4. APPLICATION AND IMPLEMENTATION
In the last decades, the farmed Atlantic salmon production was increased all over the
world. Chile and Norway are recognized as the top producers by a 6% and 2% growth ratio in
their production, respectively. For instance, during the first six months of 2020, Chile has
produced 246,806 tons of Atlantic salmon, worth $ 1,731 million, indicating a 2.62% increase
compared with the year before [45].
The greatest amount of this Chilean Salmon is exported to the US market. However, Chile
could not find an acceptable market share in the European markets because of the powerful
presence of its European competitor. Norway is exporting salmon not only over Europe but
also over Asian countries like China and South Korea. Understandably, they would plan to
increase their share of the Asian markets. Should Chile intend to capture the Asian market, it
seems that the west of Asia is the best target market due to the below listed reasons:
First, as a major competitor, Norway has not done any activity for exporting salmon in this
region until now. Second, the region enjoys considerable potential strategic benefits like the
Arabian Sea and the Indian Ocean's availability. The target countries such as Iran, Saudi
Arabia, and Turkey can also play as a hub for Chile to export its salmon to other countries.
Considering all the above mentioned, this study's focus is on “the export of the Atlantic
Salmon of Chile to the west of Asia’s region”, using the SFA strategy. The first step of this
process is to define criteria for each category of the SFA.
One of the essential criteria that significantly affect foreign markets' investment is our
products' "potential of the target market". Based on the FAO report in 2011, the main
aquaculture producers in the west of Asia are Saudi Arabia and Iran [46]. These countries are
the major producers in this region, but they cannot supply all their demands. This provides an
investment opportunity for neighboring countries like Egypt to export their fishery products to
the west of Asia. "Region's economic attractiveness" can be another factor to export. For
example, the Emirates have the most prominent international airline in the world. Dubai
International Airport had 88,242,099.000 passengers in 2017 [47]. The Emirates Group also
announced that their revenue from the first six months of 2020-21 had been US$ 3.7 billion
[48].Saudi Arabia is one of the places where approximately 2 million Muslims travel to this
country for Hajj. Many tourists travel to Turkey and Iran annually because of their historical
sites and cultural heritage. It’s figured out that West Asia is a critical and strategic location,
with the potential of millions of passengers travelling to these lands.
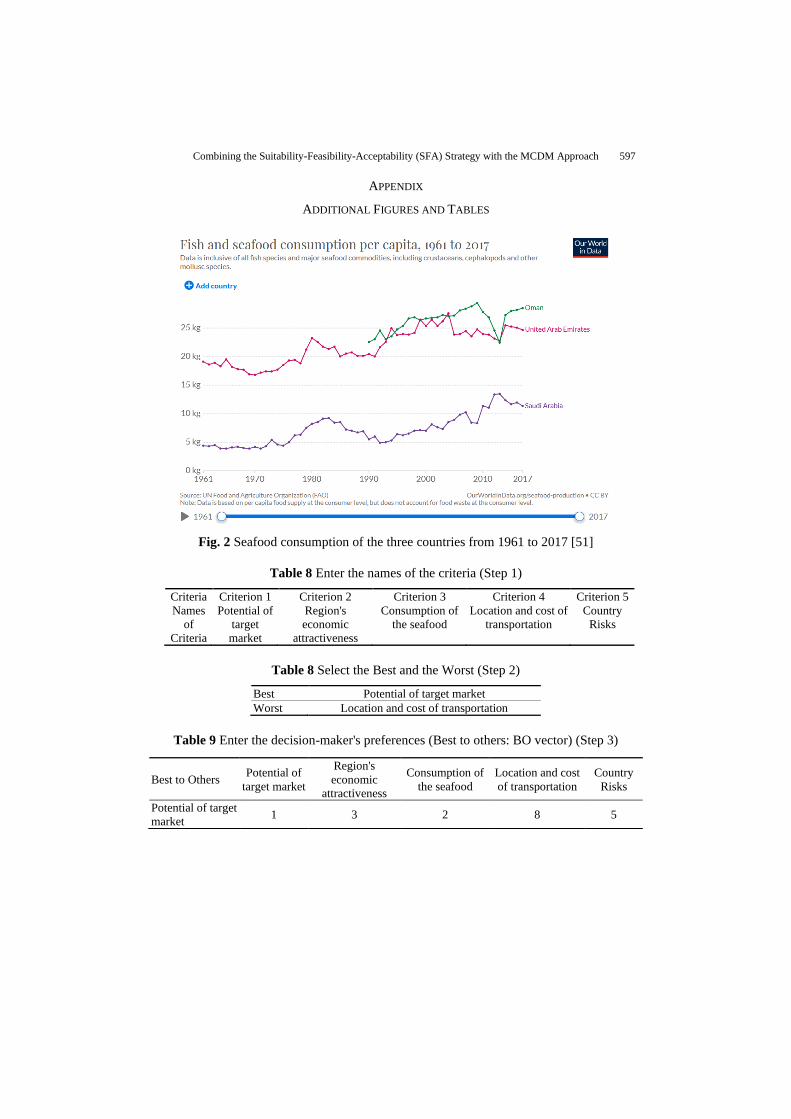
Seafood consumption is an essential issue for investors to measure and estimate
people's preferences in these countries. The United Arab Emirates (UAE) and Oman are
the largest seafood consumers in the region by consuming about 28.6 kg per year. The
other critical criteria are the "Country Risks" like economic risk, business environment risk,
political risk, commercial risk, and financing risk. One of the criteria that significantly affect
the target country's selection is the "Location and cost of transportation". As the distance
between the two countries (as the exporter and the importer) increases, transportation costs
are seriously growing.

Combining the Suitability-Feasibility-Acceptability (SFA) Strategy with the MCDM Approach 589
Hence, as shown in Table 3 and Fig. 2, this research considers three countries (Saudi Arabia, the UAE, and Oman) as the Chilean Salmon fish export destination. From the countries mentioned above, Iran and Turkey are omitted. Due to international sanctions and unstable economic situations, Iran would not be a great option. Also, since maritime transportation has been one of the consideration criteria to select the target market, Turkey does not seem to be an optimal option for this purpose.
Iran and Turkey have been omitted according to the latest Trend-Economy site statistics. In 2018, Saudi Arabia, the UAE, and Oman imported fishery products $4, $5, and $15 million, respectively, and $19, $4, and $19 million 2019 [49]. Fishery importation to Saudi Arabia increased for nearly 5-times in one year. It can be concluded that Saudi Arabia has a remarkable potential for exporting fish. Economic attractiveness could be GDP growth, average inflation rate, macroeconomic stability, financial structure and development, and the target country's business environment.
Table 3 The sub-criteria of the Region's economic attractiveness
Sub-criteria Country
Saudi Arabia UAE Oman
GDP Growth volatility 78.5 86 80.4
Average inflation rate 100 100 100
Macroeconomic stability 79 71 68.9
Financial structure and development 51 46.3 36.9
Business environment 81.3 88.7 68.2
Source: Global Foreign Direct Investment Country Attractiveness [50]
The annual consumption of seafood in Saudi Arabia, THE UEA, and Oman is 11.3,
24.71, and 28.54 kg/person, respectively [51]. The trend of seafood consumption per
capita from 1961 to 2017 is attached in the Appendix.
Transportation cost is another critical criterion that the investors should consider
because they determine the direct influence on export policy. They are transporting Fishery
products while noticing that the live fish should be controlled under certain conditions. A
more common way of transport is via sealed containers [52]. These containers should be
insulated from heat, and it is necessary to provide adequate oxygen for fish during transport.
The wholesalers usually use pure bottled oxygen for oxygenating water [53]. Airplanes or
ships are usually preferred for Intra-continental transportation. Although ship Freightage is
less expensive than airplanes, the boat's transit time is much longer than that of the
airplanes. However, as mentioned before, the fish transport system needs some other types
of elements and variables. When the transition time exceeds, maintenance costs and losses
of fish will increase, too. For example, the ship freighted transit time from Chile to THE
UEA is about 25 to 31 days and airplane Freighted is about 1 to 3 days. In order to
investigate distances, consider just the distance from the target location to Chile. The
shorter length is an advantage for the target location. Table 4 shows these distances.
Table 4 Distance from Chile to the target location
Distance (miles) Saudi Arabia UAE Oman
From Chile to Flight Ship Flight Ship Flight Ship
8551 7430 9060 7873 9166 7965
Source: [54]

590 S. H. ZOLFANI, R. BAZRAFSHAN, P. AKABERI, M. YAZDANI, F. ECER
Based on Euler Hermes global study [55], the country risk consists of five parts
(economic risk, business environment risk, political risk, commercial risk, and financing
risk). This study uses five linguistic concepts as excellent, very good, good, bad, and
worst for determining the value of these sub-criteria. Table 5 shows these values.
Table 5 Linguistic assessments of country risk sub-criteria
Economic
Risk
Business
environment Risk
Political
Risk
Commercial
Risk
Financing
Risk
Saudi Arabia Good Good Bad Worst Very good
UAE Good Very good Good Worst Good
Oman Bad Good Good Worst Bad
Source: [56]
4.1. Research gap
The first step in the SFA method is to determine the criteria. Suitability is related to
opportunities and constraints that an organization faces. The five criteria, the target
market’s potential, and the region’s economic attractiveness, are involved in this group. The
feasibility factors examine the strategy and scan its financial capability. The consumption
of seafood of the target market and the cost of transportation are relevant to this group.
Finally, the acceptability usually surveys the risk of strategy, so the country risk is placed in
this group. Three countries, Saudi Arabia, the UAE, and Oman are considered Option 1,
Option 2, and Option 3. Table 6 shows the SFA strategy and the criteria.
Table 6 The SFA strategy framework by related criteria
Weight
Suitability
▪ The potential of target market
▪ Region's economic attractiveness
W1
W2
Feasibility
▪ Consumption of the seafood
▪ Location and cost of transportation
W3
W4
Acceptability
▪ Country Risks
W5
All of the criteria can be measured by nominal values, except one of them that is linguistic.
The SFA strategy has not proposed a procedure for transmuting this linguistic value to
nominal. One of the challenges is that the deals are not balanced, and calculating these values
results in the wrong answers because data should be normalized for the measurement. SFA
strategy table has a column that determines the weight of criteria. The gap is to determine the
weights of each criterion, the function that MCDM methods will deliver.
The MCDM method normalization steps can convert linguistic concepts to nominal ones.
Some of these methods help the researchers to determine criteria weights. According to these
benefits of the MCDM methods, combining these methods with the SFA strategy is
considered in this study.

Combining the Suitability-Feasibility-Acceptability (SFA) Strategy with the MCDM Approach 591
4.2. Calculation with the proposed MCDM model
This study uses the BWM method as an MCDM method because it requires fewer
comparisons and gives more trustworthy outcomes than the other weighting tools [73].
This method works by pairwise comparison of the criteria. Based on the BWM algorithm,
the best and worst criteria among these five should be determined. The potential of the
target market is rated as the best, and the location and transportation cost as the worst
criterion. Considering Appendix from Table 8 to 22, we obtain these weights as Wpotential
of target market = 0.4219, WRegion's economic attractiveness = 0.1734, WConsumption of the sea-food = 0.2601,
WLocation and cost of transportation = 0.0404, and WCountry Risks= 0.104. The weights are achieved by
the BWM excel file solver, which can be found in www.bestworstmethod.com.
The ranking of options in the SFA method is realized by the MARCOS method. Firstly,
the decision matrix is defined. The decision matrix contains the values of the alternatives
according to the criteria. The criteria consist of some sub-criteria. The decision matrix is given
in Table 7. The MCDM method provides the possibility to convert linguistic values to
nominal. As country risk values are linguistic, it is possible to convert them to nominal values.
Risk is a negative criterion that means the lower values are better preferred. The linguistic
values are excellent, good, bad, and worst transmitting to numbers 1 to 5, respectively
(excellent count as 1). It has to be mentioned that commercial risk is omitted from the sub-
criteria of country risk because three options have the same value. The average inflation rate is
also neglected from the region’s economic attractiveness for the same values.
In this study, the researchers used www.mcdm.app and extracted the results. The
obtained values by MARCOS are (Saudi Arabia= 0.7281, UAE= 0.5281 and Oman=
0.8287). It turns out that Oman is the best destination for the Chilean fish market, while
the UAE is the worst item based on our study.
Table 7 Decision matrix table
Alternatives
Criteria Sub-criteria Saudi
Arabia UAE Oman
Potential of target market 19 4 19
Region's economic
attractiveness
GDP Growth volatility 78.5 86 80.4
Macroeconomic stability 79 71 68.9
financial structure and development 51 46.3 36.9
business environment 81.3 88.7 68.2
Consumption of the seafood 11.3 24.71 28.54
Location and cost of
transportation
Flight 8551 9060 9166
Ship 7430 7873 7969
Country Risks Economic Risk 3 3 4
Business environment Risk 3 2 3
Political Risk 4 3 3
Financing Risk 2 3 4
4.3. Discussion
To specify which country has a good potential for the fishery products market, this
paper attempts to find the answer by utilizing the SFA strategy – as a strategic choice
method- through MCDM methods.

592 S. H. ZOLFANI, R. BAZRAFSHAN, P. AKABERI, M. YAZDANI, F. ECER
Since the SFA strategy does not seem very efficient for the abovementioned situation, the
researchers extended it by an integrated BWM-MARCOS methodology. This combination
has also increased the capability of the SFA strategy to solve complex problems. According to
the SFA framework, some related criteria and options should be defined. The evaluation
criteria considered are ranked from the most significant to the least important as the potential
of the target market, consumption of the seafood, region's economic attractiveness, country
risks, location, and transportation cost, respectively. The Selected options are the names of
three countries (Saudi Arabia, Oman, and the UAE). One country should be selected among
these options as the best country to export Chilean fish to. Then, the criteria and alternatives
are evaluated and ranked.
The results show that Oman is the most acceptable market for the Chilean fish market.
Put it differently, by placing in first ranking, Oman best meets the criteria considered for
the fish market.
Saudi Arabia is also considered one of the top leading countries for salmon export. Among
the reforms that have started in Saudi Arabia, there are projects to encourage healthy living.
They comprise the goals of increasing fish consumption. Therefore, importing salmon from
Chile to this country is of critical importance. In the UAE, the aquaculture imports are
approaching $ 100 million and they are mostly imported from Norway, Oman, India, and
Turkey. Therefore, the UAE may have a substantial potential for Chile. Fig. 1 shows the
structure of this combined method for the case study.
Fig. 1 The process and phases of the model

Combining the Suitability-Feasibility-Acceptability (SFA) Strategy with the MCDM Approach 593
In order to verify the results, we have performed a sensitivity analysis by substituting the
weights; we have noticed that the results are stable and confidential. Table 24 shows the
random tests organized for analysis and Table 25 shows the ranking of the alternatives. In
total, we observe that, based on 10 tests, Oman is still the best option while the UAE is judged
to be the last choice.
5. CONCLUSIONS
The SFA strategy is the primary research method, which introduces some criteria and
options and evaluates them. By increasing the complexity of a problem, the efficiency of
this strategy decreases. SFA does not consider sub-criteria, a particular way of determining
the weight, and a precise structure to prioritize the options. The deficiency of SFA bears
in mind the idea of developing this method by using the MCDM methods, for instance,
by applying the BWM method for determining the weight of criteria and by the MARCOS
method for ranking alternatives or options. In addition, the combination of the MCDM
methods with the SFA increases the accuracy of the selection process. A case study has
been surveyed to implement the developed SFA approach. The case study was about
exporting Chilean fish to West Asia. Three countries are considered as the alternatives,
including Saudi Arabia, the UAE, and Oman. The target market's potential, region's economic
attractiveness, consumption of the seafood, location and cost of transportation, and country
risks were five criteria selected in this study.
The main challenge occurs in the process of resolving; the problem was that some
criteria have nominal values and should be converted to a numeric value. This conversion
in the MCDM methods is routine, but SFA does not propose a specific solution.
Determining the weight of criteria in SFA has no straightforward, systematic approach.
However, the BWM method calculates these weights clearly. Another problem with SFA
was the absence of a normalization system. Using MCDM methods covers all of these
problems. The proposed method can be used as a great tool for managers to choose the
best strategy for complex and challenging problems of their company. This principle,
which suggests selecting the best strategy, can be used by different sized entities from
start-up teams to holding companies. This study suggests a framework by combining the
advantages of BWM and MARCOS methods with the SFA strategy to identify the most
appropriate target market for the Chilean fishery industry. The results showed that the
best target market for Chilean fishery industry in Oman.
In the future studies, the researchers can develop the SFA method with other MCDM
methods like SECA, EDAS, AHP, etc. Also, it is possible to integrate various weighting
methods such as FUCOM, LBWA, MABAC, MAIRCA, etc. It is suggested to use fuzzy
logic-based methods in order to model human judgments.
Acknowledgements: Authors of this work are very thankful to anonymous reviewers and editors
for their comments and guidelines.

594 S. H. ZOLFANI, R. BAZRAFSHAN, P. AKABERI, M. YAZDANI, F. ECER
REFERENCES
1. Durmaz, Y., Düşün, Z., 2016, Importance of Strategic Management in Business, Expert Journal of Business and Management, 4(1), pp. 38-45.
2. FMVA, 2021, https://corporatefinanceinstitute.com/resources/knowledge/strategy/strategic-planning/ [Last access: 11. July 2020]
3. Downey, J. Cimaglobal, https://www.cimaglobal.com/. [Last access: 13 February 2008].
4. Lee, T., Shin, J., Kim J., Singh, V., 2020, Stochastic simulation on reproducing long-term memory of hydroclimatological variables using deep learning model, Journal of Hydrology, 582, pp. 124-540.
5. Sahani, N., 2021, Application of hybrid SWOT-AHP-FuzzyAHP model for formulation and prioritization of ecotourism strategies in Western Himalaya, India, International Journal of Geoheritage and Parks, doi:
10.1016/j.ijgeop.2021.08.001.
6. Johnson, G., Scholes, K., Whittington, R., 1998, Exploring corporate Strategy, Fifth ed., London: the Prentice Hall imprint of pearson education.
7. Zavadskas, E., Antucheviciene, J., Chatterjee, P., 2019, Multiple Criteria Decision Making (MCDM) Techniques for Business Processes Information Management, MDPI Books, p. 320.
8. Mehrjerdi, Z., 2014, Strategic system selection with linguistic preferences and grey information using
MCDM, Applied Soft Computing, 18, pp. 323-337. 9. Shyur, H., Shih, H., 2006, A hybrid MCDM model for strategic vendor selection, Mathematical and
Computer Modelling, 44(7-8), pp. 749-761. 10. Banihabib, M.E., Hashemi-Madani, F.-S, Forghani, A., 2017, Comparison of Compensatory and non-
Compensatory Multi Criteria Decision Making Models in Water Resources Strategic Management,
European Water Resources Association (EWRA), 31(12), pp. 3745-3759. 11. Hashemkhani Zolfani, S., Ebadi Torkayesh, A., Ecer, F., Turskis, Z., Šaparauskas, J., 2021, International
market selection: a MABA based EDAS analysis framework, Oeconomia Copernicana, 12(1), pp. 99-124. 12. Georgise, F., Mindaye, A., 2020, Kaizen implementation in industries of Southern Ethiopia: Challenges
and feasibility, Cogent Engineering, 7, 1823157.
13. Čirjevskis, A., Novikova, J., 2012, Commercial Viability of Strategic Choice on Green Business: Hydro Power versus Wind Power (Latvian case), AASRI Procedia, 2, pp. 44-49.
14. Alimardani, M., Hashemkhani Zolfani, S., Aghdaie, M., Tamošaitienė, J., 2013, A novel hybrid SWARA and VIKOR methodology for supplier selection in an agile environment, Technological and Economic
Development of Economy, 19(3), pp. 533-548.
15. Broniewicz, E., Ogrodnik, K., 2012, A Comparative Evaluation of Multi-Criteria Analysis Methods for Sustainable Transport, Energies, 14, 5100.
16. Mehrjerdi, Z., 2014, Strategic system selection with linguistic preferences and grey information using MCDM, Applied Soft Computing, 18, pp. 323-337.
17. Ullah, Z., Jehangir, M., Iqbal, J., 2016, Potential for Community Based Ecotourism (CBE) along
Balochistan Coast, Pakistan, Global Regional Review, 1, pp. 178-192. 18. Puška, A., Stojanovic, I., Maksimović, A., Osmanovic, N., 2020, Project meanagment software evaluation by
using the measurement of alternatives and ranking according to compromise solution (MARCOS) method, Operational Research in Engineering Sciences: Theory and Applications, 3(1), pp. 89-102.
19. Pamučar, D., Savin, L., 2020, Multiple-criteria model for optimal off-road vehicle selection for passenger
transportation: BWM-COPRAS model, Vojnotehnički glasnik/Military Technical Courier, 68(1), pp. 28-64. 20. Hashemkhani Zolfani, S., Torkayesh, A., Bazrafshan, R., 2021, Vision-based weighting system (VIWES) in
prospective MADM, Operational Research in Engineering Sciences: Theory and Applications, 4(2), pp. 140-150.
21. Hasheminasab, H., Hashemkhani Zolfani, S., Zavadskas, E., Kharrazi, M., Skare, M., 2021,. A circular
economy model for fossil fuel sustainable decisions based on MADM techniques, EconomicResearch-EkonomskaIstraživanja, doi: 10.1080/1331677X.2021.1926305.
22. Behzad, M., Hashemkhani Zolfani, S., Pamucar, D., Behzad, M., A comparative assessment of solid waste management performance in the Nordic countries based on BWM-EDAS, Journal of Cleaner
Production, 266, 122008.
23. Hashemi, A., Dowlatshahi, M., Nezamabadi-pour, H., 2020, MFS-MCDM: Multi-label feature selection using multi-criteria decision making, Knowledge-Based Systems, 206, 106365.
24. Child, J., 1972, Organizational Structure, Environment and Performance: The Role of Strategic Choice, Sociology, 6(1), pp. 1-22.
25. Johnson, G., Whittington, R., Scholes, K., 2011, Exploring Strategy, 9th ed., Pearson, London.
26. Rezaei, J., 2015, Best-worst multi-criteria decision-making method, Omega, 53, pp. 49-57.

Combining the Suitability-Feasibility-Acceptability (SFA) Strategy with the MCDM Approach 595
27. Torkayesh, A., Zolfani, S.H., Khavand, M., Khazaelpour, P., 2021, Landfill location selection for healthcare waste of urban areas using hybrid BWM-grey MARCOS model based on GIS, Sustainable
Cities and Society, 67, 102712. 28. Pamučar, D., Ecer, F., Cirovic, G., Arlasheedi, M., 2020, Application of improved best worst method
(BWM) in real-world problems, Mathematics, 8(8), pp. 13-42.
29. Ecer, F., 2021, Sustainability assessment of existing onshore wind plants in the context of triple bottom line: a best-worst method (BWM) based MCDM framework, Environmental Science and Pollution
Research, 28, pp. 19677–19693. 30. Ecer, F., Pamucar, D., 2020, Sustainable supplier selection: A novel integrated fuzzy best worst method
(F-BWM) and fuzzy CoCoSo with Bonferroni (CoCoSo’B) multi-criteria model, Journal of Cleaner
Production, 266, 121981.
31. Hashemkhani Zolfani, S., Mosharafiandehkordi, S.. Kutut, V., 2019, A pre-planning for hotel locating
according to the sustainability perspective based on BWM-WASPAS approach, International Journal of Strategic Property Management, 23(6), pp. 405-419.
32. Gupta, H., Barua, M., 2017, Supplier selection among SMEs on the basis of their green innovation ability
using BWM and fuzzy TOPSIS, Journal of Clear Production, 152, pp. 242-258. 33. Rahimi, S., Hafezalkotob, A., Monavari, S.M., Hafezalkotob, A., Rahimi, R., 2020, Sustainable landfill
site selection for municipal solid waste based on a hybrid decision-making approach: Fuzzy group
BWM-MULTIMOORA-GIS, Cleaner Production, 248, pp. 119-186. 34. Yadav, G., Mangla, S.K., Luthra, S., Jakhar, S., 2018, Hybrid BWM-ELECTRE-based decision framework for
effective offshore outsourcing adoption: a case study, International Journal of Production Research, 56(18), pp. 6259-6278.
35. Moslem, S., Farooq, D., Ghorbanzadeh, O., Blaschke, T., 2020, Application of the AHP-BWM model for
evaluating driver behavior factors related to road safety: A case study for Budapest, Symmetry, 12(2), 243. 36. Stević, Ž., Brković, N., 2020, A novel integrated FUCOM-MARCOS model for evaluation of human
resources in a transport company, Logistics, 4(1), 4. 37. Ecer, F., Pamucar, D., 2021, MARCOS technique under intuitionistic fuzzy environment for determining
the COVID-19 pandemic performance of insurance companies in terms of healthcare services, Applied
Soft Computing, 104, 107199.
38. Chakraborty, S., Chattopadhyay, R., Chakraborty, S., 2020, An integrated D-MARCOS method for
supplier selection in an iron and steel industry, Decision Making: Applications in Management and Engineering, 3(2), pp. 49-69.
39. Uluts, A., Karabasecic, D., Popovic, G., Stanujkic, D., Nguyen, P.T., Karakoy, C., 2020. Development of
a novel integrated CCSD-ITARA-MARCOS decision-making approach for stackers selection in a logistics system, Mathematics, 8(10), 1672.
40. Stevic, Z., Brkovic, N., 2020, A novel integrated FUCOM-MARCOS model for evaluation of human resources in a transport company, Logistics, 4(1), 4.
41. Stankovic, M., Stevic, Z., Das, D.K., Pamucar, D., 2020, A new fuzzy MARCOS method for road traffic
risk analysis, Mathematics, 8(3), 457. 42. Stević, Z., Pamučar, D., Puška, A., Chatterjee, P., 2019, Sustainable supplier selection in healthcare
industries using a new MCDM method: Measurement Alternatives and Ranking according to COmpromise Solution (MARCOS), Computers & Industrial Engineering,140, pp. 106-231.
43. Ecer, F., 2021, A consolidated MCDM framework for performance assessment of battery electric vehicles
based on ranking strategies, Renewable and Sustainable Energy Reviews, 143, 110916. 44. Boral, S., Chaturvedi, S., Howard, I., McKee, K., Naikan, V., 2020, An Integrated Approach for Fuzzy
Failure Mode and Effect Analysis Using Fuzzy AHP and Fuzzy MARCOS, 2020 IEEE International Conference on Industrial Engineering and Engineering Management (IEEM), Singapore, doi:
10.1109/IEEM45057.2020.9309790.
45. FAO, 2021, Optimism persists in farmed salmon sector despite price lull, http://www.fao.org/in-action/globefish/market-reports/resource-detail/en/c/1263849/, USA (last access: 15. June 2021).
46. FAO, 2011, Fisheries balance, 2011, Available: http://www.fao.org/in-action/globefish/fishery-information/ resource-detail/zh/c/338542/, (last access: 15. January 2012)
47. Department of Civil Aviation_Dubai, 2017, United Arab Emirates Passenger Traffic: Dubai International
Airport: Annual,. [Online]. https://www.ceicdata.com/en/united-arab-emirates/air-transport-passenger-traffic/ passenger-traffic-dubai-international-airport-annual (last access: 15. June 2021)
48. The Emirates Group, 2021, https://www.emirates.com/media-centre/emirates-group-announces-half-year-performance-for-2020-21/. (last access: 15. June 2021)
49. Annual International Trade Statistics by Country, 2021, https://trendeconomy.com. (last access: 15. June 2021)
50. Riadh, B., fdiattractiveness, 2020, http://www.fdiattractiveness.com/ranking-2020/. (last access: 15. June 2021)

596 S. H. ZOLFANI, R. BAZRAFSHAN, P. AKABERI, M. YAZDANI, F. ECER
51. Ourworldindata, Fish and seafood consumption per capita, 1961 to 2017, 2017, https://ourworldindata. org/grapher/fish-and-seafood-consumption-percapita?tab=chart&time=1961..latest®ion=
Asia&country=SAU~ARE~OMN, (last access: 15. June 2021) 52. FAO, 1980, Available: http://www.fao.org/3/af000e/AF000E03.htm, (last access: 15. June 2021)
53. The Fish site, Transporting Fish, 2006, https://thefishsite.com/articles/transporting-fish, (last access: 15.
June 2021) 54. Travel_math, 2021, https://www.travelmath.com/distance/from/Chile/to/, (last access: 15. June 2021)
55. Hermese, E., 2019 Global Business Monitor, 2019, https://www.eulerhermes.com/en_global/news-insights/economic-insights/2019-Global-Business-Monitor.html, (last access: 15. June 2021)
56. Euler Hermes global, Economic research, Country Risk, 2019, https://www.eulerhermes.com, (last
access: 15. June 2021)
57. Li, T., Li, A., Guo, X., 2020, The sustainable development-oriented development and utilization of
renewable energy industry - a comprehensive analysis of MCDM methods, Energy, 212, 118694. 58. Li, H., Horan, P., Luther, M., Ahmed, T., 2019, Informed decision making of battery storage for solar-
PV homes using smart meter data, Energy & Buildings, 198, pp. 491-502.
59. Li, X., Tian, P., Leung, S., 2010, Vehicle routing problems with time windows and stochastic travel and service times: Models and algorithm, International Journal of Production Economics, 125(1), pp. 137-145.
60. Zavadskas, E., Turskis, Z., 2010, A new additive ratio assessment (ARAS) method in multicriteria
decision‐making, Technological and economic development OF ECONOMY, 16(2), pp. 159-172.
61. Zavadskas, E., Kaklauskas, A., 1996, Determination of an efficient contractor by using the new method of multicriteria assessment, in Langford, D.A., Retik, A. (Eds.), Managing the Construction Project and
Managing Risk, vol. 65, London, UK, Weinheim, Germany; New York, NY, USA; Tokyo, Japan; Melbourne, Australia; Madras, India; E and FN SPON: London, UK, In International Symposium for
“The Organisation and Management of Construction”, Shaping Theory and Practice 2, pp. 94-104.
62. Zavadskas, E., Turskis, Z., Vilutiene, T., 2010, Multiple criteria analysis of foundation instalment alternatives by applying additive ratio assessment (ARAS) method, Arch. Civ. Mech. Eng, 10(3), pp. 123-141.
63. Zavadskas, E., Turskis, Z., Antucheviciene, J., Zakarevicius, A., 2012, Optimization of weighted aggregated sum product assessment, Electron. Electr. Eng, 122(6), pp. 3-6.
64. Hashemkhani, S., Zavadskas, E., Khazaelpour, P., Cavallaro, F., 2018, The Multi-Aspect Criterion in the
PMADM Outline and Its Possible Application to Sustainability Assessment, Sustainability, 10(12), 4451. 65. Hashemkhani Zolfani, S., Masaeli, R., 2020, From Past to Present and into the Sustainable Future.
PMADM Approach in Shaping Regulatory Policies of the Medical Device Industry in the New Sanction Period, Sustainability Modeling in Engineering, 2019, pp. 73-95.
66. Hashemkhani Zolfani, S., Derakhti, A., 2020, Synergies of Text Mining and Multiple Attribute Decision
Making: A Criteria Selection and Weighting System in a Prospective MADM Outline, Symmetry, 12(5), 868. 67. Hashemkhani Zolfani, S., Maknoon, R., Zavadskas, E., 2016, An introduction to prospective multiple
attribute decision making (PMADM), Technological and Economic Development of Economy, 22(2), pp. 309-326.
68. Johnson, D., McGeoch, L., Glover, F., Rego, C., 2000, The Traveling Salesman Problem, in 8th DIMACS
Implementation Challenge, http://dimacs.rutgers.edu/archive/Challenges/TSP/about.html. 69. Torkayesh, S.E., Amiri, A., Iranizad, A., Torkayesh, A.E., Entropy based EDAS decision making model
for neighborhood selection: A case study in Istanbul, Journal of Industrial Engineering and Decision Making, 1(1), pp. 1-11, 2020.
70. Pamucar, D., Ćirović, G., 2015, The selection of transport and handling resources in logistics centers
using Multi-Attributive Border Approximation area Comparison (MABAC), Expert Systems with Applications, 42(6), pp. 3016-3028.
71. Ecer, F., 2018, Third-party logistics (3PLs) provider selection via Fuzzy AHP and EDAS integrated
model, Technological and Economic Development of Economy, 24(2), pp. 615-634.
72. Yadav, S., Bajpai, U., 2018, Performance evaluation of a rooftop solar photovoltaic power plant in
Northern India, Energy for Sustainable Development, 43, pp. 130-138. 73. Sotoudeh-Anvari, A., Sadjadi, S., Molana, S., & Sadi-Nezhad, S. 2018, A new MCDM-based approach
using BWM and SAW for optimal search model. Decision Science Letters, 7(4), pp. 395-404.
Combining the Suitability-Feasibility-Acceptability (SFA) Strategy with the MCDM Approach 597
APPENDIX
ADDITIONAL FIGURES AND TABLES
Fig. 2 Seafood consumption of the three countries from 1961 to 2017 [51]
Table 8 Enter the names of the criteria (Step 1)
Criteria Criterion 1 Criterion 2 Criterion 3 Criterion 4 Criterion 5
Names
of
Criteria
Potential of
target
market
Region's
economic
attractiveness
Consumption of
the seafood
Location and cost of
transportation
Country
Risks
Table 8 Select the Best and the Worst (Step 2)
Best Potential of target market
Worst Location and cost of transportation
Table 9 Enter the decision-maker's preferences (Best to others: BO vector) (Step 3)
Best to Others Potential of
target market
Region's
economic
attractiveness
Consumption of
the seafood
Location and cost
of transportation
Country
Risks
Potential of target
market 1 3 2 8 5

598 S. H. ZOLFANI, R. BAZRAFSHAN, P. AKABERI, M. YAZDANI, F. ECER
Table 10 Enter the decision-maker's preferences (Others to Worst: OW vector) (Step 4)
Others to the Worst Location and cost of transportation
Potential of target market
Region's economic attractiveness
Consumption of the seafood
Location and cost of transportation
Country Risks
8
6
7
1
5
Table 11 The weights of criteria
Weights
Potential of
target market
Region's economic
attractiveness
Consumption of
the seafood
Location and cost of
transportation
Country
Risks
0.4219 0.1734 0.2601 0.0404 0.1040
Calculating Sub-criteria weights of the Region's economic attractiveness by the
BWM method:
Table 12 Enter the names of the sub-criteria of Region's economic attractiveness (Step 1)
Criteria Criterion 1 Criterion 2 Criterion 3 Criterion 4
Sub-Criteria GDP Growth
volatility
Macroeconomic
stability
Financial structure and
development
Business
environment
Table 13 Select the Best and the Worst (Step 2)
Best Macroeconomic stability
Worst Financial structure and development
Table 14 Enter the decision-maker's preferences (Best to others: BO vector) (Step 3)
GDP growth
volatility
Macroeconomic
stability
Financial structure
and development
Business
environment
Macroeconomic stability 4 1 8 3
Table 15 Enter the decision-maker's preferences (Others to Worst: OW vector) (Step 4)
Others to the Worst Financial structure and development
GDP Growth volatility
Macroeconomic stability
Financial structure and development
Business environment
7
8
1
6
Table 16 The weights of sub-criteria of Region's economic attractiveness
Weights
GDP Growth
volatility
Macroeconomic
stability
Financial structure and
development
Business
environment
0.1755 0.5425 0.0478 0.2340

Combining the Suitability-Feasibility-Acceptability (SFA) Strategy with the MCDM Approach 599
Table 17 Sub-criteria of country risks (Step 1)
Criterion 1 Criterion 2 Criterion 3 Criterion 4
Economic risk Business environment risk Political risk Financing risk
Table 18 Select the Best and the Worst (Step 2)
Best Financing Risk
Worst Political Risk
Table 19 Enter the decision-maker's preferences (Best to others: BO vector) (Step 3)
Best to others Economic
risk Business
environment risk Political
risk Financing
risk
Financing risk 2 2 6 1
Table 20 Enter the decision-maker's preferences (Others to Worst: OW vector) (Step 4)
Others to the Worst Political Risk
Economic Risk Business environment Risk Political Risk Financing Risk
5 5 1 6
Table 21 The weights of sub- criteria of economy Risk attractiveness
Weights
Economic Risk Business environment risk Political risk Financing risk
0.25 0.25 0.0625 0.4375
Table 22 Ranking of Alternatives
Weight 0.42 0.02 0.091 0.007 0.039 0.26 0.01 0.025 0.025 0.025 0.006 0.04
Beneficial (B) or Non- Beneficial (NB) Criteria Alternative 1 Alternative 2 Alternative 3
B C1 19 4
19
B
C2 78.5 86 80.4
B
C3 79 71
68.9
B
C4 51
46.3 36.9
B
C5 81.3 88.7 68.2
B
C6 11.3 24.7
28.54
NB
C7 8551 9060 9166
NB
C8 7430 7873 7969
NB
C9 3 3 4
NB
C10 3 2 3
NB
C11 4 3 3
NB
C12 2 3 4
Table 23 Sensitivity analysis tests
C1 C2 C3 C4 C5 C6 C7 C8 C9 C10 C11 C12
Original weights
0.42 0.02 0.091 0.007 0.039 0.26 0.01 0.025 0.025 0.025 0.006 0.04
T1 0.42 0.02 0.091 0.006 0.039 0.26 0.01 0.025 0.025 0.025 0.007 0.04 T2 0.42 0.02 0.091 0.007 0.039 0.26 0.025 0.01 0.025 0.025 0.006 0.04 T3 0.42 0.02 0.091 0.006 0.04 0.26 0.025 0.01 0.025 0.025 0.006 0.039 T4 0.42 0.02 0.01 0.007 0.039 0.26 0.091 0.025 0.025 0.025 0.006 0.039 T5 0.42 0.02 0.091 0.007 0.039 0.26 0.01 0.025 0.025 0.025 0.04 0.006 T6 0.42 0.02 0.025 0.025 0.039 0.26 0.01 0.091 0.007 0.025 0.04 0.006 T7 0.26 0.02 0.091 0.007 0.039 0.42 0.01 0.025 0.025 0.025 0.006 0.04 T8 0.26 0.091 0.02 0.006 0.039 0.42 0.01 0.025 0.025 0.025 0.006 0.04 T9 0.26 0.02 0.091 0.006 0.039 0.42 0.01 0.04 0.006 0.025 0.025 0.025
T10 0.091 0.02 0.42 0.006 0.039 0.26 0.01 0.025 0.025 0.025 0.006 0.04

600 S. H. ZOLFANI, R. BAZRAFSHAN, P. AKABERI, M. YAZDANI, F. ECER
Table 24 Ranking results of sensitivity analysis
Original
rank
score
Test 1 Test 2 Test 3 Test 4 Test 5 Test 6 Test 7 Test 8 Test 9 Test 10
Alt-1 0.7281 0.7279 0.7281 0.7279 0.7263 0.7175 0.7163 0.6308 0.6242 0.6244 0.6529
Alt-2 0.5272 0.5272 0.5272 0.5272 0.5292 0.5354 0.5357 0.6144 0.6199 0.6161 0.6585
Alt-3 0.8297 0.83 0.8297 0.8302 0.8327 0.8419 0.8437 0.8181 0.8213 0.8260 0.7098
Ran
kin
g
Alt-1 2 2 2 2 2 2 2 2 2 2 3
Alt-2 3 3 3 3 3 3 3 3 3 3 2
Alt-3 1 1 1 1 1 1 1 1 1 1 1