![COMBINING MOLECULAR DYNAMICS AND MACHINE …Molecular Dynamics Simulations: Using software suit GROMACS version 3.3.1 [20], we set up two simulation systems – one for each structure.](https://static.fdocuments.net/doc/165x107/5e785f90d20dd5279458b833/combining-molecular-dynamics-and-machine-molecular-dynamics-simulations-using-software.jpg)
Combining Hydrology and Economics in a Systems Dynamics ...
14
Combining Hydrology and Economics in a Systems Dynamics Approach: Modeling Water Resources for the San Juan Basin Mary E. Ewers University of New Mexico Department of Economics MSC 05 3060, 1 University of New Mexico Albuquerque, NM 87131-0001 (505) 310-1835 [email protected] ABSTRACT: Water supply is a hydrologic phenomenon, whereas water demand is largely driven by human wants and needs. The combination of these two systems, hydrology and economics, is necessary for accurate modeling of our water resources. Moreover, in times of drought or water scarcity it is the human behavioral component that will determine whether a region’s water supply can be sustained. The stakeholders of the San Juan Basin are many and varied, from Indian tribes, agriculture interests, and municipalities, to recreational fisherman, power generators and conservationists. Stakeholders must make policy decisions regarding allocation and prioritization of water among competing uses. A system dynamics simulation model for the San Juan watershed (located in the states of New Mexico and Colorado) is developed. The model can be used to quantify the economic tradeoffs between competing uses and gauge the effects of climate change on river flows in the San Juan watershed. 1.0 Background Study Area: The San Juan Basin Watershed is located in the northwestern portion of New Mexico with extensions into Colorado, Utah and Arizona. The basin can be divided into 14 sub watersheds (figure 1). - 1 -
Transcript of Combining Hydrology and Economics in a Systems Dynamics ...

Combining Hydrology and Economics in a Systems Dynamics Approach: Modeling Water Resources for the San Juan Basin Mary E. Ewers University of New Mexico Department of Economics MSC 05 3060, 1 University of New Mexico Albuquerque, NM 87131-0001 (505) 310-1835 [email protected]
ABSTRACT: Water supply is a hydrologic phenomenon, whereas water demand is largely driven by human wants and needs. The combination of these two systems, hydrology and economics, is necessary for accurate modeling of our water resources. Moreover, in times of drought or water scarcity it is the human behavioral component that will determine whether a region’s water supply can be sustained. The stakeholders of the San Juan Basin are many and varied, from Indian tribes, agriculture interests, and municipalities, to recreational fisherman, power generators and conservationists. Stakeholders must make policy decisions regarding allocation and prioritization of water among competing uses. A system dynamics simulation model for the San Juan watershed (located in the states of New Mexico and Colorado) is developed. The model can be used to quantify the economic tradeoffs between competing uses and gauge the effects of climate change on river flows in the San Juan watershed. 1.0 Background Study Area: The San Juan Basin Watershed is located in the northwestern portion of New Mexico with extensions into Colorado, Utah and Arizona. The basin can be divided into 14 sub watersheds (figure 1).
- 1 -

Figure 1: San Juan Basin sub watersheds
The majority of the water coming into the basin originates in the southern Colorado Mountains in the form of snow pack. When snow melts, runoff is collected in the Piedra, Animas, and La Plata tributaries, all of which eventually feed the San Juan River. The basin is home to the Navajo Reservoir, which holds 1,200,000 acre-feet of water and brings recreational benefits as well as drought management benefits to the area. Total surface water rights in the San Juan Watershed amount to 1,701,397 acre-feet per year.1 In addition, there are un-quantified Indian Tribe water rights estimated to be 500,000 acre-feet of water per year. These rights are in the process of being adjudicated. Stakeholders in the San Juan Basin include the following:
• Municipalities of Farmington, Aztec, Bloomfield, Durango and many other smaller towns
• San Juan Water Commission, ISC & OSE • Navajo Agricultural Products Industry which farms the land for the Navajo Indian
Irrigation Project • Indian Tribes: Navajo Nation, Jicarilla Apache Nation • Colorado Tribes: Southern Ute, Ute Mountain Ute, Animas-La Plata Project • Non-Indian agriculture uses in the Animas and La Plata sub watersheds • Power Industry, which operates two large power generation stations
1 See the San Juan Hydrologic Unit Regional Water Plan prepared by the San Juan Water Commission, September 2003. Available at http://www.seo.state.nm.us/water-info/NMWaterPlanning/regions/SanJuan/sanjuan-menu.html last accessed 03-13-2005
- 2 -

• Recreational uses which include Fly Fisherman • Endangered Species: Colorado Pike Minnow, Razorback Sucker • Federal Agencies: USBR, USFWS, BIA, USFS, BLM
The Problem: The U.S. Southwest just experienced five years of severe drought during which reservoir levels continually dropped. Stakeholders have been faced with the very real situation of dwindling supplies and with decisions regarding the use of their water. Efforts to mitigate drought impacts involved the creation of a “shortage sharing” group, in which stakeholders voluntarily agreed to curtail withdrawals by an set percentage. The shortage sharing agreement also allows for any stakeholder to compensate another stakeholder to forego the use of allocated water. According with economic equilibrium theory, the most efficient reallocation of water use takes place at the pareto efficient point where compensation exactly equals willingness-to-accept to forego usage. Overview: A comprehensive analysis of drought and its impact in the basin is needed to support the decision making efforts of diverse stakeholders, as well as a model to simulate the reallocation of water and its impacts on the basin. This study addresses the development of a system dynamics model to simulate surface water inflows and diversions in order for stakeholders to ask “what if” questions regarding reallocation of water uses in the basin. Policy objectives for drought mitigation include improving the efficiency of water distribution among the San Juan River users, and keeping a minimum elevation of 5990 feet in the Navajo reservoir (necessary for the operation of irrigation canals). Efficiency in water use comprises two concepts: 1) allowing water to be reallocated to its highest valued use and 2) achieving more with less water through technological advances. Technological efficiencies vary in each sector. In agriculture, center pivots are more efficient than flood irrigation and in the Energy sector, the use of wet surface air cooling technology or the use of produced water (from gas and oil production) saves water. The system dynamics model includes the calculated savings from choosing each technology. 2. Methodological Approach 2.1 ZeroNet
The planning process began with the ZeroNet project, a collaboration between Los Alamos National Laboratory (LANL), Public Service Company of New Mexico (PNM) and Electric Power Research Institute (EPRI). ZeroNet is a water for energy initiative with the overall goal of meeting increased energy demands with “zero net” withdraws of fresh water by 2010. The ZeroNet initiative has three primary goals:
• reduce overall freshwater use in power generation cooling processes; • augment freshwater with degraded and saline water for power generation cooling; • use the best available data, models, and analysis tools to plan for responsible
water management
- 3 -

Stakeholder meetings began in October 2004 with the purpose of identifying all stakeholders, quantifying their water usage in the San Juan Basin, and characterizing their methods of water management. Data for inflows and outflows were collected and input into the Watershed Analysis Risk Management Framework (WARMF) model and a System Dynamics model dubbed the Quick Scenario Tool (QST). The completed models will be demonstrated to the stakeholder groups for additional feedback. This study focuses on the QST development.
2.2 Model Development (QST) Model development follows three main steps (Ford 1999; Richardson and Pugh 1989, Sterman 2000). First the problem you are attempting to solve must be defined. Second, the system and subsystems are described with causal loop diagrams. Third, the model is developed and calibrated. As with most problem solving techniques, it is an iterative process. For previous studies in system dynamics watershed modeling and stakeholder decision support models see Stave (2003), Tidwell (2004), Huerta (2004), and Rich et. al (2005). The San Juan Basin model development began in December 2004 and working versions are planned for distribution by August 2005. The QST is based in the VenSimTM system dynamics software, which enables higher level integration of models, and linking of processes based on stocks, flows and feedbacks (positive and negative) that reproduces, as accurately as possible, the interactions between the natural hydrologic system and human economic demands on the system. The QST examines scenarios based on user controlled input variables for the San Juan Basin as follows:
• Water supply and climate • Energy water use • Municipal water use • Agricultural water use
2.3 Role of Model The San Juan Watershed Model should be viewed as a decision support model to aid stakeholders in making decisions concerning the water management. It is meant to ask “what-if” questions for conservation alternatives and represents an important tool for learning about watershed processes and making water management decisions. Initial implementation of the QST focuses on the ability to analyze scenarios based on assumptions concerning climate and water supply, reservoir balance, and surface water diversion. 3. Model Description 3.1 Subsystems Diagram
- 4 -

The model employs a monthly time step, and encompasses a time horizon from 1976-2045. The relatively long time horizon is necessary to test effects of a 10-year or longer drought cycle and trends of ongoing warming. The hydrology-economic systems are represented in a limited fashion. The majority of the variables are endogenous with the hydrologic cycle being exogenous. For simplicity, many features have been omitted from the model. Groundwater is not modeled, nor is the interaction between surface water and groundwater because the majority of the water usage in the San Juan Basin is surface water. The model is divided into seven subsystems (Figure 2).
Supply
Consumption
Consumption ConsumptionIn-stream Flows
Drought
Agriculture Production
Reservoir Evaporation
Climate
Recreation &Endangered
Energy Production
Population Per Capita Use
Growth
Water
Figure 2: Subsystem Diagram
The system can be described by its negative feedback loops (Figure 2). Population drives water demands but as water supply is drawn down, further growth in population cannot be sustained. Energy Production consumes the water supply and the water supply constrains the energy production. The same relationship is true for Agriculture production and Reservoir Evaporation. As the reservoir supply and surface area increases, the evaporation increases, thus decreasing the reservoir supply. 3.2 Inflows (Supply) Surface water inflows to the San Juan Basin are gauged at five strategic locations:
• San Juan river near Carracas, CO • Piedra river near Arboles, CO
- 5 -

• Animas river near Cedar Hill, CO • La Plata river at the Colorado-New Mexico state line • Spring Creek at La Boca
Tributary inflows can be modeled either historically, by importing time series data based on historic gauged readings, or stochastically based on simulations derived from the monthly distribution of flows. For example, all January inflows for the years 1976 to 2002 were examined and a distribution curve was fit to the historic data. Simulations can then be run using statistical sampling (Table 1), by randomly picking an inflow from the monthly fitted distribution. Table 1: Sample Statistics for Stochastic Inflows, Animas, Spring Creek, La Plata, SJ, Piedra
(acft) Animas Inflows Spring Creek La Plata Inflows San Juan Inflows Piedra Inflows
month mean standard deviation mean
standard deviation mean
standard deviation mean
standard deviation mean
standard deviation
Jan 15903 2910 330 212 798 428 9787 3415 4679 1827Feb 16995 4459 637 669 1080 601 11960 5418 5981 3273Mar 29483 15022 1336 1299 2919 2337 35869 21314 21419 14160Apr 63981 31608 768 587 6605 6637 63695 34045 56346 30778May 148958 60792 2422 767 6519 5668 102005 41603 78615 37412Jun 136910 77894 3592 745 4284 3274 103420 61962 63717 38497Jul 75689 43936 4182 1261 1296 964 36798 31284 19783 15776Aug 42528 26702 4292 1458 651 640 21459 12912 14369 11249Sep 36155 19703 3596 1085 611 526 18357 12066 13107 9971Oct 28957 12744 1885 735 654 787 17467 11785 10693 7190Nov 22169 8806 542 383 829 938 14690 10604 8072 5755Dec 17807 4535 355 217 837 645 10838 4935 5498 2991
Entering lookup distribution functions for 12 months for each tributary is not trivial but benefits the modeling by turning an exogenous (historical time series data) inflow variable into an endogenous variable that is not constrained by time limits. However, the tradeoff a stochastic model is a higher level of difficulty in programming correlations both between time (month to month correlation of inflows) and space (stream to stream correlations of inflows). Complete correlation matrices are not yet included in this model. Climate, in the form of wet periods, dry periods and normal periods, is modeled as a variation in water supply. Climate is a control variable in the simple form of ‘percentage of inflows.’ The user selects drought severity and length. Reservoir data was downloaded from the USBR website for the Navajo Reservoir at (http://www.usbr.gov/uc/crsp/GetSiteInfo). The data includes daily estimated reservoir inflow, reservoir release, storage, and surface elevation. Records were downloaded for 1990 through October 2004. Evaporation is modeled as the residual difference in storage after accounting for inflows and releases: Evaporation = storage(t-1) - release(t) + inflows(t) - storage(t). This produced an evaporation time series that was then converted into a stochastic process by fitting monthly distribution curves to the evaporation
- 6 -

variable. Elevation of the Navajo reservoir is modeled through a lookup table based on the volume of the reservoir. 3.3 Outflows (Demand)
Municipal Demand for water is modeled as a constant elasticity demand curve as follows:
tet tQ ap=
where p is the price of residential water at time t, e is the elasticity of residential water demand, Q is the quantity of water demanded and a is total population served by the municipal water system. In addition, municipal water demands grow with increasing population. The dynamics of population are modeled based on increase with time:
1 (1 )t tpop pop h+ = + where popt is the population at time t, and h is the population growth rate. Population estimates for the San Juan Basin sub watersheds were obtained from the San Juan Basin Hydrologic Unit Regional Water Plan. Average per-capita water usage was also obtained from the Regional Water Plan as 212 gallons per person per day. Price Elasticities, e, which gage the consumers response to a change in the price of water, were taken from residential water use studies of Espey et al. and Brown et al.
Table 2: Population Estimates for Sub Watersheds in the San Juan Basin. (Source: San Juan Water Commission 2003). Year Animas
Watershed La Plata Watershed
Middle San Juan Watershed
Upper San Juan Watershed
2005 46696 15757 12312 28554 2010 50137 16919 13219 30668 2015 53579 18080 14127 32772 2020 57020 19241 15034 34877
Agriculture Demand for water is modeled based on profit functions. Water is an input into the agricultural production function. Irrigators maximize profits (π ) according to the following:
- 7 -

s.t. 1 1
( )M N
t it it itt i
a p y cπ= =
= −∑ ∑ itit
itit
wNIR
=a
where p is the price of crop i, y is the yield produced per acre of crop i, a is the land allocated to crop i, c is the cost to produce 1 acre of crop i, w is the total amount of water allocated to crop i, and NIR is the water requirement to grow one
acre of crop i. The average value of agricultural water used at any time t is then simply:
t
twπ which is equivalent to the marginal value of water t
t
ddwπ
where is the sum of water diverted for each crop at time t: tw1
N
ii
w=∑
Crop Acreages for the watershed were obtained from the San Juan Basin Hydrologic Unit Regional Water Plan. Significant agricultural production takes place in the Animas, La Plata, Middle San Juan and Upper San Juan sub watersheds. Crop types for each sub watershed include alfalfa, corn, vegetables, orchard, pasture, grain, sod, and gpa. Table 3 lists the acreage amounts used in each sub watershed.
Table 3: Crop Acreagesa for the sub watersheds of the San Juan Basin for the year 2000 (Source: San Juan Water Commission 2003). Crop Animas
Acres La Plata Acres
Middle San Juan Acres
Upper San Juan Acres
Navajo Nation NIIP Acres
Alfalfa 1018 560 2300 2569 Corn 125 2 111 62 Vegetables 37 1 2 23 Orchard 70 0 30 64 Pasture 2903 2075 479 2998 Grain 81 65 25 139 Sod 151 28 8 260 GPAc 73 50 51 303 110630b
TOTAL 4458 2781 1784 6418 110630 a The New Mexico Interstate Stream Commission (NMISC) provided original acreage data in GIS format. b Maximum amount of acreage once NIIP is fully developed. cGrass, Pasture, or Alfalfa. This designation is applied to plowed lands.
Crop Production statistics for San Juan County were obtained from the National Agricultural Statistics Service (USDA 2005) website at http://www.usda.gov/nass/pubs/histdata.htm for the years 1976 to 2004. The statistics also included crop yields per acre, and crop production.
- 8 -

Energy Demand for water is modeled as follows. Water use in the energy sector is an input into the production function. The energy profit function is as follows:
1(
M
t t tt
k p cπ=
= −∑ )t s.t. tt
t
wNIR
=k
where k is the amount of electricity delivered, p is the price of electricity, c is the cost to produce one unit of electricity, w is the total amount of water allocated to the generating station in acre-feet and NIR is the water required to produce one
unit of electricity. The average value of power generation water used at any time t is then simply:
t
twπ which is equivalent to the marginal value of power generating water t
t
ddwπ .
Power Generation in the San Juan Basin uses a significant amount of surface water for cooling the coal fired generation plants. Two large generating plants, the San Juan Generating Station (SJGS) and the Four Corners Power Plant (FCPP), are located in the San Juan Basin. The combined total generating capacity is 3838 Megawatts (MW). The combined surface water use in power generation is 54,200 acre-feet per year. Both plants operate at maximum capacity leaving no variation in generation through time. However, an interesting question for the model to consider is: “What would be the impact of adding extra generating capacity to the region?” For these purposes, the model will include the ability to test the economic & hydrologic effects of increased generating capacity in the basin.
When power plants are not operating at maximum capacity, the demand for water use in the power generation sector will depend on the overall demand for power generation. Data for electric power demand in the form of prices and quantities produced were collected. The Dow Jones Palo Verde Electric Price Index was used to proxy wholesale energy prices and production in the model, and was obtained through the Public Service Company of New Mexico. Historical prices were also obtained from the Electric Power Monthly Report of the Energy Information Administration website at http://www.eia.doe.gov/cneaf/electricity/epm/epm_sum.html.
Endangered Species Demand for water is set at the minimum streamflow required for species survival as determined by federal agencies. Currently we do not have a valuation attached to ESA, however, once a water habitat species is declared endangered, the water used for the species has the highest priority and therefore the reallocation does not depend on the valuation. The endangered
- 9 -

species in the San Juan River are the Colorado Pikeminow and the Razorback Sucker. It has been determined that a minimum of 500cfs is required for these species to survive.
3.4 Causal Loop Diagram
WaterSupply
ReservoirEvaporation
Population
Energy Production
AgricultureProduction
EndangeredSpecies
Climate+
-
+
--
+
+
- +-
Figure 3: Water supply Causal Loop Diagram
3.5 Model Diagram
- 10 -

AnimasStochastic 1
PiedraStochastic 1
San JuanStochastic 1
La PlataStochastic 1
seed 1monthtime 1
time units peryear 1
<Time><seed 1><monthtime 1>
<seed 1>
<monthtime 1>Nav Res 2
NavResInflowsNavResOutflows
SJRiv
SJRivInflowsSJRivOutflows
AnimasRivAnimasRivInflowsAnimasRiv
OutflowsLaPlatRivLaPlatRivInflowsLaPlatRivOutflows
<AnimasAgriculture>
AnouttoSJ
<La Plata Ag>
LPouttoSJ
NavouttoSJ
Napi Ag 2
NIIP fractiondeveloped
Energy Div
ProductionMW
EnergyNIR
reservoir capacity
SAN JUAN BASIN Criteria
2. 14876 acre-feet permonth from Nav Res to
Farmington
1. 5990 feet inNavajo Res
3. 29755 acre-feet permonth below Farmington
elevationsurface area
NIIP return flows
Nav evaporation
minimum streamflow 504cfs
citizens div
hammond div
fruitland divjewett div
hogback div<monthtime 1>
SJ AG
LPmuni
LPprice LPelasticityLPpop
Amuni
Apop Aprice Aelasticity
Ag shortagesharing
out to CO
climate factor
<climate factor>
nav evap2
drought duration drought severity
4. Model Use 4.1 Conservation Analysis The stakeholder can control variables for water supply, and variables for the water demand in each sector: Agriculture use, Energy use, and Municipal use. Table 4: Sub Models and Control Variables
Sub Model Control
Water Supply Drought Severity (% of normal flows) Drought Duration (months)
Agriculture Acres Planted, by crop type Efficiency of water use - NIR
Energy Energy Production Efficiency of water use - NIR
Municipal Population Price Elasticity Per capita water use
The control variables allow the stakeholder to examine various conservation techniques to determine the economic effect of unmet demand in each sector as well as the water saved through technology and conservation efforts.
- 11 -
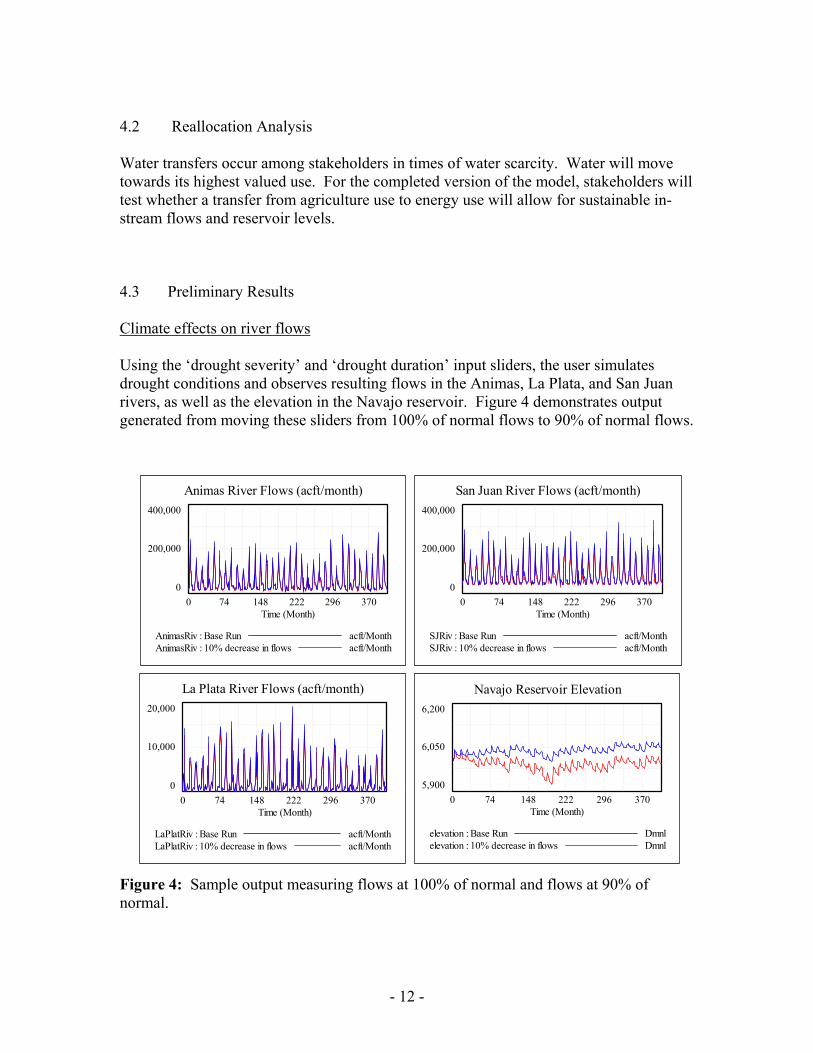
4.2 Reallocation Analysis Water transfers occur among stakeholders in times of water scarcity. Water will move towards its highest valued use. For the completed version of the model, stakeholders will test whether a transfer from agriculture use to energy use will allow for sustainable in-stream flows and reservoir levels. 4.3 Preliminary Results Climate effects on river flows Using the ‘drought severity’ and ‘drought duration’ input sliders, the user simulates drought conditions and observes resulting flows in the Animas, La Plata, and San Juan rivers, as well as the elevation in the Navajo reservoir. Figure 4 demonstrates output generated from moving these sliders from 100% of normal flows to 90% of normal flows.
Animas River Flows (acft/month)400,000
200,000
00 74 148 222 296 370
Time (Month)
AnimasRiv : Base Run acft/MonthAnimasRiv : 10% decrease in flows acft/Month
La Plata River Flows (acft/month)20,000
10,000
00 74 148 222 296 370
Time (Month)
LaPlatRiv : Base Run acft/MonthLaPlatRiv : 10% decrease in flows acft/Month
San Juan River Flows (acft/month)400,000
200,000
00 74 148 222 296 370
Time (Month)
SJRiv : Base Run acft/MonthSJRiv : 10% decrease in flows acft/Month
Navajo Reservoir Elevation6,200
6,050
5,9000 74 148 222 296 370
Time (Month)
elevation : Base Run Dmnlelevation : 10% decrease in flows Dmnl
Figure 4: Sample output measuring flows at 100% of normal and flows at 90% of normal.
- 12 -

Increased energy production effects on river flows Using the ‘ProductionMW’ input slider, which represents total MegaWatt production in the San Juan Basin, the user can test the effects of adding generating capacity and production to the region. Initial results show the San Juan river can sustain, under full water supply conditions, a total megawatt production of 15,500MW without violating minimum stream flows for endangered species and keeping all other diversions constant. Figure 5 demonstrates resulting effects on the San Juan river flows generated from moving the ‘ProductionMW’ slider from 3820MW (current production level) to 15,500MW.
San Juan River Flows400,000
200,000
00 74 148 222 296 370
Time (Month)
SJRiv : Base Run acft/MonthSJRiv : Increased MW production to 15,500MW acft/Month
Figure 5: Sample output showing the effect of increased production on the San Juan River flows. Remaining Tasks for Development of Quick Scenario Tool The following tasks remain for the development of the QST:
• Historical Stream Flows. Continue development of QST model based on historical stream flows and calibration to gauge data. This model will also need the historical time series to be modified to test multi-year periods of drought as is done in the WARMF model. QST can then calibrate and validate based on the WARMF results.
• User Interface. Develop the User Interface to include variables of interest to stakeholders so that they can perform “what if” analysis for changes in water allocation and water efficiencies.
• Riparian Losses and River Leakage. Collect data and parameterize riparian losses and river leakage. Build these components into the model.
- 13 -

• Energy Water Use Scenarios. Develop specific scenarios for the energy sector that include conservation techniques for produced water usage, wet surface air cooling technology, and purchased water.
Acknowledgements This work was supported by the Department of Energy National Energy Technology Laboratory (DOE NETL), the Los Alamos National Laboratory Earth and Environmental Science Division (LANL EES), the Public Service Company of New Mexico (PNM), and the Electric Power Research Institute (EPRI). Thanks to members of the San Juan Shortage Sharing group for input concerning stakeholder needs. Thanks to Shawn Williams for assistance in compiling San Juan basin data. Thanks to Joel Herr and Limin Chen for assistance with enhancements to WARMF. Thanks to Thomas Shumaker, Amy Miller, and Anthony Mancino for preparing the initial ZeroNet website and background brochures. And thanks to Marc Witkowski, Gordon Keating, and members of the ZeroNet team for valuable input on the ZeroNet DSS design, and for providing editorial comments to improve this publication. References Huerta, Juan M. Serra, 2004. A Systems Dynamics approach to conflict resolution in
water resources: the model of the Lerma-Chapala watershed. Rich, P.M., L.H.Z. Weintraub, M.E. Ewers, T.L. Riggs, and C.J. Wilson. 2005. Decision
support for water planning: the ZeroNet water-energy initiative. Proceedings of the American Society of Civil Engineers - Environmental & Water Resources Institute (ASCE-EWRI) "World Water and Environmental Resources Congress 2005: Impacts of Global Climate Change", May 15-19, Anchorage, AK. LA-UR-05-1068.
Richardson, G.P., Pugh, A.L., 1989. Introduction to System Dynamics Modeling,
Pegasus Communications, Inc, Waltham, MA, P.413 Stave, Krystyna A. 2003. A system dynamics model to facilitate public understanding of
water management options in Las Vegas, Nevada. Journal of Environmental Management. 67:303-313
Sterman, J., 2000. Business Dynamics: Systems Thinking and Modeling for a Complex
World, McGraw-Hill, Boston, p.982 Tidwell, V.C., H.D. Passell, S.H. Conrad, R.P Thomas. 2004. System dynamics modeling
for community-based water planning: an application to the Middle Rio Grande. Journal of Aquatic Sciences, 66,357-372,2004.
- 14 -