Combining Compensatory and Redistributive Benefits: The ... · Combining Compensatory and...
33
Combining Compensatory and Redistributive Benefits: The Challenge of Social Policies in Brazil by Lena Lavinas* with the collaboration of: Daniele Manão Eduardo H. Garcia Mariana Bittar Mônica Bahia Renata A. Bezerra International Labour Office, Geneva March 2001 *Lena Lavinas is Senior Economist in the InFocus Programme on Socio-Economic Security, at the ILO. For more information on the InFocus Programme on Socio -Economic Security, please see the related web page http://www.ilo.org/ses or contact the Secretariat at Tel: +41.22.799.8893, Fax: +41.22.799.7123 or E-mail: [email protected]
Transcript of Combining Compensatory and Redistributive Benefits: The ... · Combining Compensatory and...

Combining Compensatory and Redistributive Benefits: The Challenge of Social Policies in Brazil
by Lena Lavinas*
with the collaboration of: Daniele Manão
Eduardo H. Garcia Mariana Bittar Mônica Bahia
Renata A. Bezerra
International Labour Office, Geneva
March 2001
*Lena Lavinas is Senior Economist in the InFocus Programme on Socio-Economic Security, at the ILO.
For more information on the InFocus Programme on Socio -Economic Security, please see the related web page http://www.ilo.org/ses or contact the Secretariat at Tel: +41.22.799.8893, Fax: +41.22.799.7123 or E-mail: [email protected]

ii
Copyright © International Labour Organization 2001 Publications of the International Labour Office enjoy copyright under Protocol 2 of the Universal Copyright Convention. Nevertheless, short excerpts from them may be reproduced without authorization, on condition that the source is indicated. For rights of reproduction or translation, application should be made to the ILO Publications Bureau (Rights and Permissions), International Labour Office, CH-1211 Geneva 22, Switzerland. The International Labour Office welcomes such applications. Libraries, institutions and other users registered in the United Kingdom with the Copyright Licensing Agency, 90 Tottenham Court Road, London W1P 9HE (Fax: +44 171436 3986), in the United States with the Copyright Clearance Center, 222 Rosewood Drive, Danvers, MA 01923 (Fax: +1 508 750 4470), or in other countries with associated Reproduction Rights Organizations, may make photocopies in accordance with the licences issued to them for this purpose. ________________________________________________________________________ ISBN 92-2-112412-6 First published 2001 The designations employed in ILO publications, which are in conformity with United Nations practice, and the presentation of material therein do not imply the expression of any opinion whatsoever on the part of the International Labour Office concerning the legal status of any country, area or territory or of its authorities, or concerning the delimitation of its frontiers. The responsibility for opinions expressed in signed articles, studies and other contributions rests solely with their authors, and publication does not constitute an endorsement by the International Labour Office of the opinions expressed in them. Reference to names of firms and commercial products and processes does not imply their endorsement by the International Labour Office, and any failure to mention a particular firm, commercial product or process is not a sign of disapproval. ILO publications can be obtained through major booksellers or ILO local offices in many countries, or direct from ILO Publications, International Labour Office, CH-1211 Geneva 22, Switzerland. Catalogues or lists of new publications are available free of charge from the above address. Printed by the International Labour Office. Geneva, Switzerland

iii
Contents
Abstract ................................ ................................ ................................ ................................ iv
1. Introduction................................ ................................ ................................ ..................1
2. Compensatory programmes and their interpretation in the field of food security................ 3
3. Scope of a programme to combat food deficiency ................................ ...........................6
4. The Brazilian experience with hunger eradication programmes: the case of PRODEA ................................ ................................ ................................ ...................14
5. Comparing the advantages of different compensatory food security programmes ............ 21
6. PRODEA versus the retail market ................................ ................................ ................ 23
7. Conclusion ................................ ................................ ................................ .................26
References ................................ ................................ ................................ ...........................28

iv
Abstract
The purpose of this article is to analyse several compensatory food security programmes implemented in Brazil and to discuss their design and results. The programmes analysed are the federal programme entitled PRODEA and a highly capillary state programme called Cesta do Povo (“People’s Foodbasket”). The underlying conclusion is that current programme designs are ineffective and inefficient and that a direct income transfer to the poor would have a greater redistributive impact, in addition to fostering higher levels of economic efficiency.

1
1. Introduction
Social policies involve income transfers, whether in monetary form or through the provision of services, and are independent of individual or socio-occupational group bargaining power. One can thus see the welfare state as a specific system of tax-based social transfers whose objective is to promote individual welfare through redistribution of income and wealth (assets), with a commitment to the idea of justice.1 According to Van Parijs (1991, ch. 10), the issue of justice emerges because resources2 are scarce3 and principles of altruism and homogeneity do not prevail in our societies to orient people’s behaviour.
Again according to Van Parijs (1995), there are three welfare models in Western history: the first, of Bismarckian inspiration, is based on an obligatory social security system, functioning ex-post in favour of those who have paid into a fund as workers over the course of their working life and who can draw on this fund if circumstances should make it necessary. It is a model in which personal interest prevails, with the goal of reducing risk and from which the notions of solidarity and equity are absent. A second, Beveridge-type model is based on the idea of ex-ante transfers (for example for health, education, etc.) and thus hinges on a stronger notion of solidarity than the previous model. In this case, the collective interest prevails over the individual, and the idea of security is extended to all, not by virtue of paying in, but as a right of citizenship. Finally, Parijs identifies a third model inspired by Thomas Paine4 and therefore referred to as Painean, where a standard basic income or citizen’s wage is transferred unconditionally to all individuals, regardless of their social condition or whether they have paid into a social protection system. Here, the idea of equity sustains the argument. The goal is to “attribute equal purchasing power to all to be used in a competitive market” (Van Parijs, idem., p. 70).
This different idea of equity has now led to the formulation of a new conceptual framework for social policies at the turn of this century, as an alternative to the welfare state system. Many contemporary thinkers, especially those in favour of adopting a minimum income or a negative income tax,5 and also policy-makers, have included on the social agenda the guarantee of citizens’ economic rights regardless of one’s work or any other form of pay-in to the system. These rights refer not only to guaranteed
1 dos Santos (1987, p. 37) defines social policies as follows: “A social policy is any policy that orders dramatic choices according to a consistent and coherent principle of justice”.
2 The reference here is not limited to material resources, an example cited is the issue of power.
3 Scarcity alone is insufficient to explain the emergence of the issue of justice. Other “circumstances” are necessary for this issue to emerge, like egotism and pluralism
4 Thomas Paine wrote Agrarian Justice in 1796, defending the notion that each individual, from birth onwards, should receive an unconditional income derived from his lack of access to assets like land, etc.
5 John Friedmann, Eduardo Suplicy, and Antonio Maria, are some of the authors who explore negative income tax as a way of combating poverty and redistributing income. For the debate on this theme, see Lavinas and Varsano (1997). Amongst other reasons, the work-based society is shrinking day by day.
2
income, but to the assurance of accessing an initial endowment common to all, as illustrated by recent proposals, including that drafted by Ackerman and Alstott (1999).6
The notion of social protection - whatever the models - has nonetheless been heavily challenged since the mid-1980s, when both growing fiscal and demographic pressures and the expansion of guaranteed coverage for the potential target public fuelled challenges of the principle of justice as the cornerstone for redistributive models. A distinct philosophical focus has developed, where the issue is no longer the right to social protection coinciding with that of citizenship, but the necessary relationship between social benefits and citizens’ responsibilities. According to Gilbert (1995), the question was the following: to what extent do the social rights granted by the Welfare State entail individual responsibilities? Thus reshaped, the debate shifts from the field of rights to that of individual responsibilities,7 while the concept of morals is juxtaposed to that of justice, i.e., a morality imbuing rights with responsibilities. In short, the beneficiaries of transfers are expected to honour the social commitments required of them, or else suffer sanctions. Rights are now conditioned. Hence, the issue is no longer that of unconditional citizens’ rights.
The debate over the best system for social transfers, the basis of which is the principle of justice, centers on another underlying principle, that of market logic. Rather than focusing only on the notion of redistribution, attempting to minimize its tradeoffs with welfare, this approach introduces the notion of efficiency - efficient redistribution - thus forging a new paradigm capable of dealing with the challenges raised by scarce resources in capitalist societies. Bowles and Gintis (1998) recall that the success of political movements and ideologies like socialism, radical democracy, social democracy, and others committed to the idea of equality, stems from the fact that they have translated “demands for redistributive justice into economic strategies”. “Expenditures on land distribution, social protection, equal wage policies, central planning, and investment in human capital become attractive because they suggest that it is possible to link redistribution of economic advantages to improved performance by the economic system as a whole” (idem., p. 3). It is presumed that these two types of value - equity and efficiency - may be compatible or contradictory depending on the mechanisms used to generate more equity, i.e., as a function of the institutional design fostering more or fewer redistributive values. “To move towards a more equitable distribution of assets not only provides more equality in the welfare of individuals, but also, by increasing productivity, it increases the pie to be divided” (op. cit., p. 86).
6 The authors propose to allot an endowment of US$ 80,000 (transferred over the course of 4 years) to every individual who has completed secondary school, thereby guaranteeing truly equal opportunities within a context of free trade and economic opening. The underlying principle in this transfer is that of individual and collective responsibility in an environment of free choice (each beneficiary may “use the money as he or she wishes: open a business, invest in more education, purchase a house, or educate a family or save for the future.” p. 5).
7 Note that the concept of “employability” is also based on this. It is the responsibility of individual workers to increase their employability, i.e., to increase their individual aptitude for the labour market.

3
2. Compensatory programmes and their interpretation in the field of food security
Compensatory programmes are part of the institutional framework of social policies. They derive from social relief as practised originally by the Church. They are based on values of solidarity, indispensable in modern, heavily differentiated, and unequal societies,8 since they allow for the mitigation of poverty by providing an increase in common welfare. But such programmes do not necessarily incorporate the values of equity. For this very reason, they tend to be selective and not universal. They stand out from among social policies committed to the quest for greater equity in that they serve a specific clientele, the poor. According to the classification proposed by Abranches (1992), this selectiveness, based on the criteria of need, is a form of positive discrimination. Such policies are generally specific and of limited duration, having a complementary and residual nature. Even so, they are absolutely essential to the target group, a needy population, whatever the need may be, an aspect which itself challenges the residual nature of the benefit allotted to them.
Compensatory programmes focusing on the struggle against hunger and malnutrition have a long-standing tradition in Brazil. Based on studies by Draibe, Castro, and Azeredo cited by Valladares (1999) identifies an important set of federal programmes established in the 1940s (the so-called Workers’ Food Programme) and renewed for several decades, the goal of which was to reduce the risks of hunger and malnutrition.
Distribution of foodbaskets to the most needy has without doubt been the most commonplace institutional form of the compensatory approach to food security in Brazil, aimed at guaranteeing greater access to food by those whose income is insufficient to purchase an adequate diet in terms of calorie and protein intake.9 In addition to this programme which was intended to be of limited duration but whose scale denotes both the persistence of the problem and the lack of efficacy in the approach to it, there have been other forms of public intervention in this area since the late 1990s, of a more structural type - like the school lunch programme and provision of foodstuffs to the health and social assistance network - or through subsidized marketing of foodstuffs and meals.10
Although persistent in their designs and modalities, compensatory programmes are acknowledged to be less than effective and/or efficient, adding little to the welfare of social groups suffering from food security risks and extreme poverty. Such
8 The classic text by T. Marshall, Social Class and Citizenship, is one of the first to explain the link between social policy and citizenship.
9 According to the CONAB (Brazilian National Council of Supply) website, PRODEA’s balance sheet is positive, since the number of foodbaskets distributed by the government’s Comunidade Solidária (Community Solidarity) programme increased from 3.1 million 1995 to 7.5 million in 1996 and 14.8 million in 1997, reaching a total of 29.8 million in 1998. The figure is surprising, since the programme is intended as an emergency relief intervention.
10 Compensatory programmes are classified as structural, emergency, or subsidized-marketing (Lavinas, 1998) ch. III.

4
ineffectiveness ends up discrediting this type of intervention, increasingly viewed as futile by society at large. However, the scope of the destitution still jeopardizing Brazil’s development today forbids one from ruling out compensatory measures that might truly alleviate poverty and guarantee a basic standard of living. On the contrary, it is crucial to provide such measures with consistency and to devise a new framework for them to gain in effectiveness.
In Western democracies, compensatory policies remain current and extensive, unquestionably indispensable, and taking the form of direct income transfers to families or individuals. Minimum or subsistence income and housing subsidy policies, and even those aimed at ensuring access to food, like the US Food Stamps Program,11 all focus on covering income deficits. The vast majority12 do not consist of the free provision of a service13 or products in kind, but of a monthly monetary stipend, which may or may not be tied to the explicit purpose of granting the benefit (Rossi, 1998).
The opposite occurs in Brazil, since monetary income supplements are limited to a very few programmes such as that of lifetime monthly income - with broad coverage, true, but with a high degree of vertical inefficiency - and other negligible benefits distributed by the Federal Social Assistance Act (LOAS), in addition to some local scholarship programmes. Food supplement programmes for social groups at risk almost invariably use distribution of the benefit in kind (food commodities or in the form of meals).
The debate over the best modality for benefits - whether in kind or tickets14 or through some income allotment - involves two opposing arguments, as noted by Ohls and Beebout (1993). The first emphasizes the advantage of the benefit in kind or in the form of tickets or stamps as opposed to a monetary stipend, since it leads the beneficiary families to consume larger amounts of food, the ultimate goal of such a relief policy. Several studies conducted in the United States conclude that Food Stamps lead to increased food consumption (Rossi, 1998, Fraker, 1990, Fraker, Martini and Ohls, 1995). This aspect is positive in that taxpayers and citizens view it favourably in general, who would not appreciate fostering consumption of other less essential goods, generating risk of leakage, and also because when families eat more food they probably improve their standard of living. The emphasis on this line of argument stems from the taxpayer’s preference for the efficient use of public funds. In-kind benefits also tend to be supported by the farm lobby.
11 Note that the Food Stamps Programme replaced a direct food commodities distribution programme.
12 In the United States, the FSP (Food Stamps Programme) and the WIC (Special Supplemental Nutrition Programme for Women, Infants, and Children) provide a direct guarantee of stamps for beneficiary families, strictly tied to the acquisition of food in order to increase daily consumption. Still in force is the Emergency Food Assistance Programme, also based on subsidized food purchases. Meanwhile, the NSLP (National School Lunch Programme), SBP (School Breakfast Programme), and CCFP (Child Care Food Programme) transfer funds preferentially to participating schools and secondarily to low-income families selected as beneficiaries.
13 For example, providing free housing in a government-owned building.
14 Whether they are stamps, coupons, credit cards, or some similar modality.
5
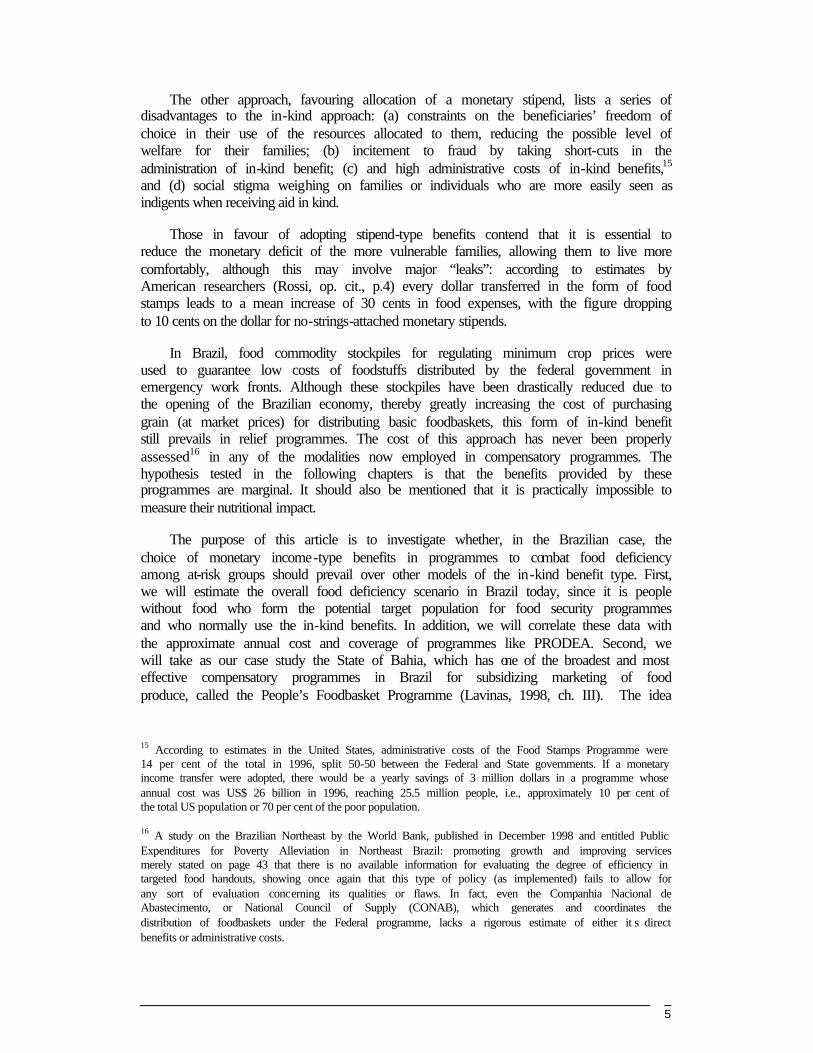
The other approach, favouring allocation of a monetary stipend, lists a series of disadvantages to the in-kind approach: (a) constraints on the beneficiaries’ freedom of choice in their use of the resources allocated to them, reducing the possible level of welfare for their families; (b) incitement to fraud by taking short-cuts in the administration of in-kind benefit; (c) and high administrative costs of in-kind benefits,15 and (d) social stigma weighing on families or individuals who are more easily seen as indigents when receiving aid in kind.
Those in favour of adopting stipend-type benefits contend that it is essential to reduce the monetary deficit of the more vulnerable families, allowing them to live more comfortably, although this may involve major “leaks”: according to estimates by American researchers (Rossi, op. cit., p.4) every dollar transferred in the form of food stamps leads to a mean increase of 30 cents in food expenses, with the figure dropping to 10 cents on the dollar for no-strings-attached monetary stipends.
In Brazil, food commodity stockpiles for regulating minimum crop prices were used to guarantee low costs of foodstuffs distributed by the federal government in emergency work fronts. Although these stockpiles have been drastically reduced due to the opening of the Brazilian economy, thereby greatly increasing the cost of purchasing grain (at market prices) for distributing basic foodbaskets, this form of in-kind benefit still prevails in relief programmes. The cost of this approach has never been properly assessed16 in any of the modalities now employed in compensatory programmes. The hypothesis tested in the following chapters is that the benefits provided by these programmes are marginal. It should also be mentioned that it is practically impossible to measure their nutritional impact.
The purpose of this article is to investigate whether, in the Brazilian case, the choice of monetary income-type benefits in programmes to combat food deficiency among at-risk groups should prevail over other models of the in-kind benefit type. First, we will estimate the overall food deficiency scenario in Brazil today, since it is people without food who form the potential target population for food security programmes and who normally use the in-kind benefits. In addition, we will correlate these data with the approximate annual cost and coverage of programmes like PRODEA. Second, we will take as our case study the State of Bahia, which has one of the broadest and most effective compensatory programmes in Brazil for subsidizing marketing of food produce, called the People’s Foodbasket Programme (Lavinas, 1998, ch. III). The idea
15 According to estimates in the United States, administrative costs of the Food Stamps Programme were 14 per cent of the total in 1996, split 50-50 between the Federal and State governments. If a monetary income transfer were adopted, there would be a yearly savings of 3 million dollars in a programme whose annual cost was US$ 26 billion in 1996, reaching 25.5 million people, i.e., approximately 10 per cent of the total US population or 70 per cent of the poor population.
16 A study on the Brazilian Northeast by the World Bank, published in December 1998 and entitled Public Expenditures for Poverty Alleviation in Northeast Brazil: promoting growth and improving services merely stated on page 43 that there is no available information for evaluating the degree of efficiency in targeted food handouts, showing once again that this type of policy (as implemented) fails to allow for any sort of evaluation concerning its qualities or flaws. In fact, even the Companhia Nacional de Abastecimento, or National Council of Supply (CONAB), which generates and coordinates the distribution of foodbaskets under the Federal programme, lacks a rigorous estimate of either it s direct benefits or administrative costs.

6
is to assess the contribution of these programmes to reducing poverty in the target group, as compared to the argument according to which direct monetary income transfers are more effective. Finally, we will compare the cost of distributing a foodbasket under PRODEA with its retail equivalent in three major Brazilian cities for which we have the appropriate available data.
3. Scope of a programme to combat food deficiency
The degree of food deficiency depends essentially on the family or individual income deficit, thus varying considerably as a function of the gap between disposable income and the minimum amount necessary for acquiring a given set of foodstuffs. Acute degrees of food deficiency can be a synonym for hunger, but does not necessarily take this form.
To estimate the number of families suffering some degree of food deficiency in Brazil, one needs to choose a cut-off line as the selection criterion for this group. There are various ways to draw such a line, depending on the variables to be aggregated (income, individual consumption, etc.).
In this study, we took the required 2,200 kcal daily intake recommended by the Food and Agricultural Organisation (FAO) as the minimum nutritional standard. To define the food deficiency cut-off line we calculated the cost of this intake based on the price of the 13 food products making up the official staple foodbasket under Brazilian Federal Act No. 399 of 1938, a price survey of which is performed monthly by the Joint Trade Union Department of Statistics (DIEESE) for 16 Brazilian cities.17 We extrapolated these values to the urban areas of the Brazilian states, using as estimates the values for their respective capital cities, and in the absence of which, ascribing the value for the capital city closest to that state. To calculate values for rural areas, we subtracted 30 per cent18 (Rocha, 2000) from the values for urban areas. Table 1 shows that as expected, the rural Northeast is the area which has the lowest cut-off line for poverty defined as food deficiency, while the urban South and Southeast have the highest lines. We should stress that the total estimate for Brazil was based on differences in regional prices (broken down by state and by rural versus urban areas). It is thus a regionally weighted total.
17 The 13 products surveyed by the DIEESE are: sugar, coffee, boneless beef, rice, bread, bananas, tomatoes, beans, vegetable oil, margarine, milk and from these, the DIEESE surveyed the prices of products in the following cities: Florianópolis, Belo Horizonte, João Pessoa, Curitiba, Porto Alegre, Rio de Janeiro, Salvador, São Paulo, Brasília, Goiânia, Fortaleza, Recife, Belém, Vitória, Natal and Aracaju.
18 This procedure is justified to the extent that we observed in other surveys that rural poverty is on average 30 per cent below that of urban poverty.

7
Table 1. Monthly cost of purchasing 2,200 kcalories a day at basic foodbasket prices, based on DIEESE survey prices
Region State
Rural Urban
Central-West
Distrito Federal 40.05 57.22Goiás 35.81 51.15
Mato Grosso 35.81 51.15Mato Grosso do Sul 35.81 51.15
Northeast
Alagoas 35.12 50.18
Bahia 34.23 48.90Ceará 33.01 47.15
Maranhão 33.01 47.15Paraíba 33.35 47.65
Pernambuco 35.28 50.41Piauí 33.01 47.15
Rio Grande do Norte 35.50 50.72Sergipe 35.12 50.18
North
Acre 53.27
Amapá 53.27Amazonas 53.27Pará 53.27
Rondônia 53.27Roraima 53.27
Tocantins 37.29 53.27Southeast
Espírito Santo 36.55 52.21Minas Gerais 41.12 58.74
Rio de Janeiro 40.77 58.24São Paulo 44.56 63.65
South
Paraná 43.03 61.47
Rio Grande do Sul 41.82 59.74Santa Catarina 36.82 52.60
Source: National Sample Household Survey (PNAD), 1997
Notes1. Basic foodbasket according to Federal Act 399/1938, including, for the Northeast, 3kg sugar,
0,3kg coffee, 4,5kg boneless beef, 3,6kg rice, 6kg bread, 7,5kg bananas, 12kg tomatoes, 4,5kg beans,0,9lkg vegetable oil, 0,75kg margarine, 6 liters milk, and 3kg manioc flour, and for the other regions
of Brazil, 3kg sugar, 0,6kg coffee, 6kg boneless beef, 3kg rice, 6kg bread, 7,5kg bananas, 9kg tomatoes4,5kg beans, 0,9lkd vegetable oil, 0,75kg margarine, 6liters milk, 1,5kg wheat flour, and 6kg potatoes.
2. Prices surveyed for the capital cities in 1997 current values.3. 1 US$ = R$ 1.09 in September 1997.
Montly cost ofconsuming Kcal / R$

8
Based on the calculations of cut-off lines for food deficiency, we estimated the proportion of poor families, the mean gap per capita (i.e., the gap between the poverty line and the food deficiency cut-off line), the mean number of members in these families, the number of families, the total number of individuals, and the potential target public for a hunger eradication programme. For Brazil as a whole, some 21 per cent of the total population lack the necessary income to acquire their minimum daily calorie intake, as shown in Graph 1.
Table 2 shows that, the Northeast is the most critical region of Brazil, i.e., with the largest proportion of families suffering food deficiency, together with the State of Tocantins. According to the above criteria, over 7 million families would be included in the target group. A total of approximately 32 million individuals would benefit from such a programme.
Having estimated the target group for a national programme to combat food deficiency, it is necessary to calculate the monthly cost. We estimated the benefit to be allotted per family, since we contend that an income distribution programme should be conceived of in the family rather than in an individual context. Thus, we initially estimated the per capita gap, based on the mean number of family member (column 2 of Table 2). As shown in Table 3, for a mean benefit of R$95.60, the programme would cost about R$712 million a month, or some R$8.5 billion a year.
Graph 1
Population distribution by per capita family income (PCFI) in daily calories based on foodbasket surveyed by DIEESE
0
10 000
20 000
30 000
40 000
50 000
60 000
70 000
80 000
0 10 20 30 40 50 60 70 80 90 100
% of the population
PCFI
in k
cal/d
ay
PCFI In kcal/day
2.200 kcal/day per capita

9
Table 2. Target population of a national food deficiency eradication programme (2,200 Kcal)
Region State Percentage Mean Mean number Number Approximate
of all per capita members of target
poor families GAP (R$) in poor families poor families population
Brazil 17.20% 4.36 7 447 535 32 474 575 Center-West Distrito Federal 9.42% 33.98 3.90 48 676 189 597 Goiás 13.41% 23.19 3.89 181 759 707 521 Mato Grosso 13.63% 21.74 4.37 86 635 378 778 Mato Grosso do Sul 13.25% 24.59 4.14 74 547 308 704
Northeast Alagoas 28.19% 22.28 4.62 194 505 899 502 Bahia 27.18% 19.25 4.73 903 310 4 269 070 Ceará 30.39% 20.06 4.80 532 040 2 553 755 Maranhão 39.23% 19.81 4.83 500 208 2 417 150 Paraíba 27.39% 19.36 4.51 240 559 1 086 054 Pernambuco 28.74% 21.63 4.49 554 786 2 489 946 Piauí 37.82% 20.55 4.61 252 774 1 165 490 Rio Grande do Norte 26.09% 22.19 4.51 171 051 771 213 Sergipe 29.11% 22.14 4.34 120 184 521 109
North Acre 24.21% 32.07 3.96 21 488 85 019 Amazonas 22.80% 26.42 5.13 98 511 505 406 Amapá 25.88% 31.60 4.55 21 941 99 728 Pará 27.56% 26.44 4.55 209 217 951 318 Rondônia 13.07% 25.63 4.29 27 113 116 296 Roraima 8.67% 26.67 4.46 3 778 16 852 Tocantins 30.64% 23.53 4.66 148 192 690 178
Southeast Espírito Santo 15.89% 23.77 4.21 127 692 537 797 Minas Gerais 16.72% 24.95 4.49 779 152 3 499 327 Rio de Janeiro 9.19% 29.84 3.83 383 989 1 471 715 São Paulo 9.10% 33.98 3.65 901 569 3 286 228
South Paraná 16.09% 22.65 3.99 421 337 1 680 233 Rio Grande do Sul 11.45% 27.95 4.00 341 223 1 364 599 Santa Catarina 7.22% 24.53 4.07 101 299 411 991 Source: National Sample Household Survey (PNAD 1997) Notes: 1. Prices surveyed for the capital cities in 1997 current values 2. 1 US$= R$ 1.09 in September 1997 3."Poor" families are those below the food deficiency cut-off line 4. Figures for target population calculated on more detailed information than shown in this table

10
Table 3. Estimated cost of a national food deficiency programme (2,200 kcal)
Region State Number Mean Benefit/ Estimated
of benefit minimum wage monthly cost
poor families per family (R$) ratio 2 by State (R$)
Brazil 7 447 535 95.6 0.8 711 701 294 Center-West
Distrito Federal 48 676 113.5 1.0 5 524 142 Goiás 181 759 81.3 0.7 14 778 461
Mato Grosso 86 635 82.8 0.7 7 169 826
Mato Grosso do Sul 74 547 91.5 0.8 6 823 436 Northeast
Alagoas 194 505 93.5 0.8 18 176 298
Bahia 903 310 84.3 0.7 76 103 868 Ceará 532 040 91.7 0.8 48 789 132
Maranhão 500 208 92.5 0.8 46 262 237
Paraíba 240 559 84.2 0.7 20 243 521 Pernambuco 554 786 90.1 0.8 49 995 650
Piauí 252 774 91.7 0.8 23 184 431
Rio Grande do Norte 171 051 89.0 0.7 15 227 473 Sergipe 120 184 90.7 0.8 10 900 689
North
Acre 21 488 113.9 1.0 2 446 989
Amazonas 98 511 120.0 1.0 11 821 320 Amapá 21 941 120.0 1.0 2 632 920
Pará 209 217 107.1 0.9 22 409 442
Rondônia 27 113 100.6 0.8 2 728 571 Roraima 3 778 92.5 0.8 349 265
Toc antins 148 192 98.3 0.8 14 561 198
Southeast Espírito Santo 127 692 90.3 0.8 11 524 714
Minas Gerais 779 152 103.3 0.9 80 501 985
Rio de Janeiro 383 989 97.8 0.8 37 566 796 São Paulo 901 569 113.1 0.9 101 958 438
South Paraná 421 337 87.5 0.7 36 858 561 Rio Grande do Sul 341 223 101.6 0.9 34 664 162 Santa Catarina 101 299 83.9 0.7 8 497 771 Total annual cost, Brazil 8 540 415 523 Source: National Sample Household Survey (PNAD 1997) Notes: 1. Prices surveyed for the capital cities in 1997 current values. 2. The value of the monthly minimum wage in September 1997 was R$ 120,00. 3. When the value of the monthly benefit is more than the minimum wage, the benefit is set at one minimum wage. 4. 1 US$= R$ 1.09 in September 1997 5.Figures for target population calculated on more detailed information than shown in this table

11
Since full relief for the poor entails an enormous cost, we performed several simulations to illustrate various scenarios of the degree of satisfaction of calorie requirements, in order to establish the optimum cost-benefit relationship. Graph 2 illustrates the distribution of the target groups in the various food deficiency brackets: 4 per cent of the Brazilian population fail to consume even 550 kcal/day, i.e., they fail to meet even 25 per cent of the minimum daily requirement. The figure increases to 8 per cent for 50 per cent of the minimum daily calorie requirement and 14.5 per cent for 75 per cent of the required daily intake.
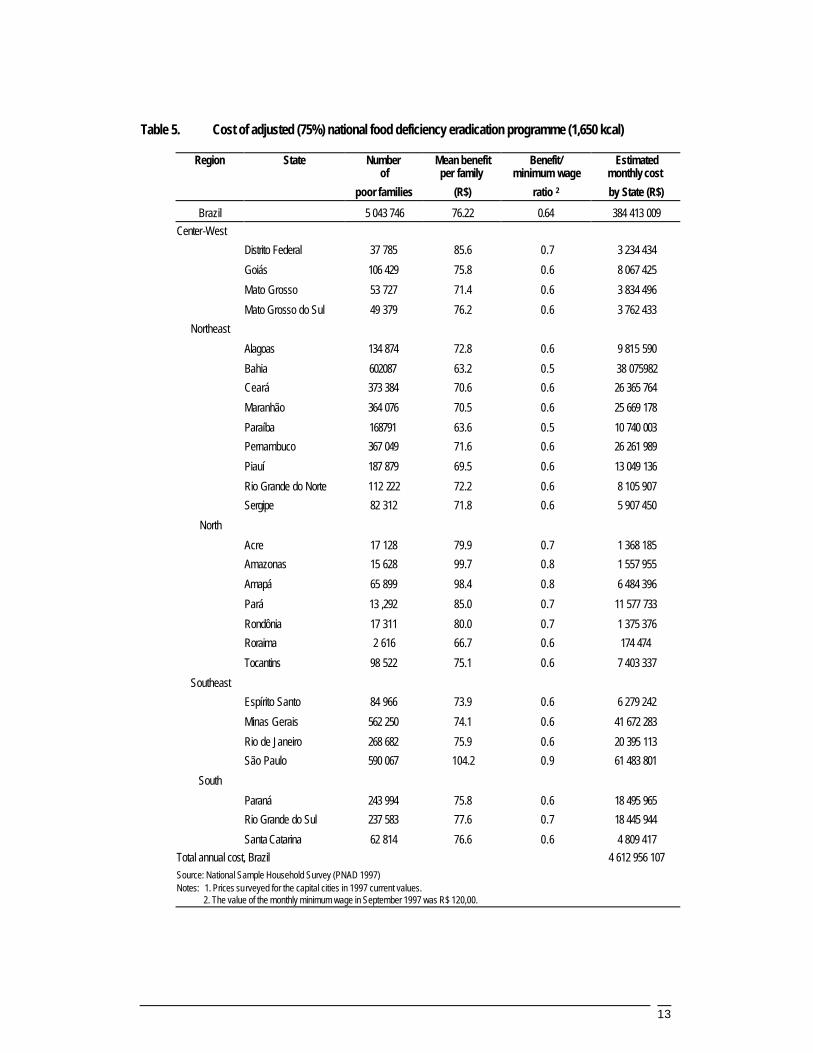
Tables 4 and 5 repeat the calculations shown in Tables 2 and 3, but are based in meeting only 75 per cent of the required intake of calories. Based on this option, we calculated the target population and cost of programme adjusted to the 1,650 kcal cut-off line. The proportion of poor/needy families thereby drops to 11 per cent. The target group, in turn, drops from 32 million to 21 million. In relation to the mean monthly benefit transferred to families, there is a reduction of almost 20 per cent, from R$95.56 to R$76.22. The overall cost of the programme is reduced to R$384 million a month or R$4.6 billion a year. In other words, 68 per cent of the demand would be met with a little over 54 per cent of the funds needed for full coverage. (Tables 3 and 5). The difference between the 100 per cent scenario and the 75 per cent scenario is summarised in Table 6. This table leads one to conclude that coverage of 75 per cent of the FAO-defined minimum daily calorie intake would be quite reasonable, since the degree of coverage would be high (virtually 70 per cent of the target population under the full programme, or 5 million families), while the cost would be half that of a programme targeting full satisfaction of the minimum daily calorie intake.
Graph 2
Population distribution by per capita family income (PCFI) in daily calories based on foodbaskets surveyed by DIEESE
0 200
400
600
800
1.000
1.200
1.400
1.600
1.800
2.000
2.200
2.400
0 2 4 6 8 10 12 14 16 18 20 22
% of the population
PCFI
in k
cal/d
ay
PCFI in kcal/day
2.200 kcal/day per capita
1,650 kcal/day per capita
1.100 kcal/Day per capita
550 kcal/Day per capita
25% of ofofofdo requeriment
50% of requeriment
75% of requirement
100 % of requirement

Table 4. Adjusted* target population for a national food deficiency eradication programme (1,650 kcal)
Region State Percentage Mean Mean number Number Approximate
of all per capita members of target
poor families GAP (R$) in poor families poor families population
Brazil 11.7% 4.3 5 043 746 21 815 917 Center-West Distrito Federal 7.3% 27.71 3.58 37 785 135 353 Goiás 7.9% 23.08 3.76 106 429 400 413 Mato Grosso 8.5% 20.21 4.22 53 727 226 996 Mato Grosso do Sul 8.8% 21.73 4.03 49 379 198 787
Northeast Alagoas 19.6% 18.4 4.6 134 874 619 189 Bahia 18.1% 15.3 4.7 602 087 2 864315 Ceará 21.3% 16.0 4.9 373 384 1 821 371 Maranhão 28.6% 15.4 4.9 364 076 1 796 639 Paraíba 19.2% 15.0 4.6 168 791 783 303 Pernambuco 19.0% 18.1 4.6 367 049 1 670 469 Piauí 28.1% 15.9 4.6 187 879 869 269 Rio Grande do Norte 17.1% 19.4 4.5 112 222 503 272 Sergipe 19.9% 18.3 4.4 82 312 360 544
North Acre 19.3% 24.3 4.0 17 128 68 195 Amazonas 15.3% 22.6 5.1 15 628 78 852 Amapá 18.4% 27.7 4.3 65 899 281 787 Pará 18.0% 22.7 4.4 136 292 599 580 Rondônia 8.4% 21.9 4.4 17 311 76 763 Roraima 6.0% 22.6 4.0 2 616 10 462 Tocantins 20.4% 19.4 4.6 98 522 448 873
Southeast Espírito Santo 10.6% 20.7 4.1 84 966 351 174 Minas Gerais 12.1% 18.9 4.4 562 250 2 489 013 Rio de Janeiro 6.4% 25.4 3.5 268 682 942109 São Paulo 6.0% 33.0 3.5 590067 2 077 077
South Paraná 9.3% 20.8 4.1 243 994 993 165 Rio Grande do Sul 8.0% 22.8 3.8 237 583 911 271 Santa Catarina 4.5% 24.5 3.8 62 814 237 676 Source: National Sample Household Survey (PNAD 1997) Notes: 1. Prices surveyed for the capital cities in 1997 current values. 2. 1 US$= R$ 1.09 in September 1997 * 1.650 kcal=75% of calorie requirement
13
Table 5. Cost of adjusted (75%) national food deficiency eradication programme (1,650 kcal)
Region State Number Mean benefit Benefit/ Estimated of per family minimum wage monthly cost
poor families (R$) ratio 2 by State (R$)
Brazil 5 043 746 76.22 0.64 384 413 009 Center-West Distrito Federal 37 785 85.6 0.7 3 234 434 Goiás 106 429 75.8 0.6 8 067 425 Mato Grosso 53 727 71.4 0.6 3 834 496 Mato Grosso do Sul 49 379 76.2 0.6 3 762 433
Northeast Alagoas 134 874 72.8 0.6 9 815 590 Bahia 602087 63.2 0.5 38 075982 Ceará 373 384 70.6 0.6 26 365 764 Maranhão 364 076 70.5 0.6 25 669 178 Paraíba 168791 63.6 0.5 10 740 003 Pernambuco 367 049 71.6 0.6 26 261 989 Piauí 187 879 69.5 0.6 13 049 136 Rio Grande do Norte 112 222 72.2 0.6 8 105 907 Sergipe 82 312 71.8 0.6 5 907 450
North Acre 17 128 79.9 0.7 1 368 185 Amazonas 15 628 99.7 0.8 1 557 955 Amapá 65 899 98.4 0.8 6 484 396 Pará 13 ,292 85.0 0.7 11 577 733 Rondônia 17 311 80.0 0.7 1 375 376 Roraima 2 616 66.7 0.6 174 474 Tocantins 98 522 75.1 0.6 7 403 337
Southeast Espírito Santo 84 966 73.9 0.6 6 279 242 Minas Gerais 562 250 74.1 0.6 41 672 283 Rio de Janeiro 268 682 75.9 0.6 20 395 113 São Paulo 590 067 104.2 0.9 61 483 801
South Paraná 243 994 75.8 0.6 18 495 965 Rio Grande do Sul 237 583 77.6 0.7 18 445 944 Santa Catarina 62 814 76.6 0.6 4 809 417
Total annual cost, Brazil 4 612 956 107 Source: National Sample Household Survey (PNAD 1997) Notes: 1. Prices surveyed for the capital cities in 1997 current values. 2. The value of the monthly minimum wage in September 1997 was R$ 120,00.

14
Table 6. Comparison of the cost of two calorie intake scenarios
% of FAO requirement Calorie Number Annual
intake of Families Cost (R$) 75% 1 650 Kcal 5 043 746 4 612 956 107
100% 2 200 Kcal 7 447 535 8 540 415 523 Note: 1US$ = 1.09 in September 1997
What remains to be determined is the impact of such a programme on the public deficit, considering its possible implementation before deactivation of other similar (but highly inefficient and less effective) programmes, whose funds could be reallocated (perhaps to a fund) with a view towards a direct monetary income transfer to the target group.
Table 7. Estimated impact of the income distribution programme on the expected public budgetary deficit – Brazil 1999
Estimated GDP, 1999 R$ 1 trilhão Expected 1999 public deficit as % of GDP 8.0% Expected 1999 public deficit in reals (R$) R$ 80 bilhões Cost of implementing the income distribution programme to meet 75% of required kcal intake1 R$ 5 bilhões 2 Impact of the income distribution programme as % increase in public budgetary deficit 0.5% Sources: GDP market analysts; deficit - market analysts; income distribution programme - Lavinas, L. and staff. IPEA.
Notes:
1.The required daily calorie intake is determined by FAO.
2. Figures updated to June 1999 according to General Prices Index (Getulio Vargas Foundation)
As shown in Table 7, implementation of the programme, whose current cost in 1999 reals would be R$5 billion a year, would represent 6 per cent of Brazil’s predicted R$ 80 billion 1999 deficit and increase the public deficit from 8 per cent to 8.5 per cent of GDP.
4. The Brazilian experience with hunger eradication programmes: the case of PRODEA
Several programmes exist in Brazil aimed at reducing food deficiency among vulnerable social groups, with an emergency relief design. One of these is the so-called Federal Emergency Food Distribution Programme, or PRODEA.
PRODEA was created in 1993 as an emergency measure to provide relief for the low-income population hit by a drought in northern Minas Gerais State and the Northeast region of Brazil. Later, the list of counties was expanded based on the Hunger Map drafted by IPEA (1993). In 1995, PRODEA became part of the Community Solidarity programme, which has since been responsible for PRODEA’s administration, in conjunction with CONAB.

15
CONAB is in charge of implementing the programme. Its roles include: defining the locations for warehouses used to distribute food commodities to the counties; logistical support, ranging from purchasing the commodities to distributing them to the counties; and quality control. CONAB also monitors and implements decisions by CONEX, the top agency in charge of monitoring PRODEA, with representatives from the Federal government.
In CONAB, the Programme includes participation by local governments and civil society, the latter represented by a committee in each county. It is usually the county committee that selects and enrols families, in addition to drafting monthly reports for CONEX. The committee is in charge of organizing foodbasket distribution. As for the local governments, their main responsibilities are to set up the county committees and transport the food commodities from the CONAB warehouses to the sites where the food is distributed in the county.
The conditions for enrolment in the programme usually involve education (for example, participating in literacy training programmes, enrolling children in school, etc.), health (showing the children’s vaccination cards, etc.), or community work projects, among others.
The PRODEA approach is a compensatory, distribution of foodbaskets. It has undergone structural changes since it first began operations, due primarily to difficulties in obtaining food commodities from government stockpiles. As shown in Table 8, between 1995 and 1997 two more commodities were added to the foodbasket (manioc flour and macaroni), but there has still been a decrease in the total amount of food provided and especially in the calorie content, with a drop of 20% from 1995 to 1996 and virtually levelling off from 1996 to 1997.19
Table 8. Contents of PRODEA monthly foodbasket per person
1995 1996 1997 Kg Kcal Kg Kcal Kg Kcal
Rice 10 35 686 10 35 686 10 35 686 Beans 5 16 359 5 16 359 5 16 359
Manioc flour - - 5 17 700 2 7 080 Corn flakes 15 53 100 5 17 700 5 17 700 Macaroni - - - 3 11 070
Total foodbasket 30 10 5145 25 87 445 25 87 895 Sources: CONAB and Multicenter Study, UNICAMP (1) - In force as in April 1997 Table prepared by L. Lavinas and staff, IPEA
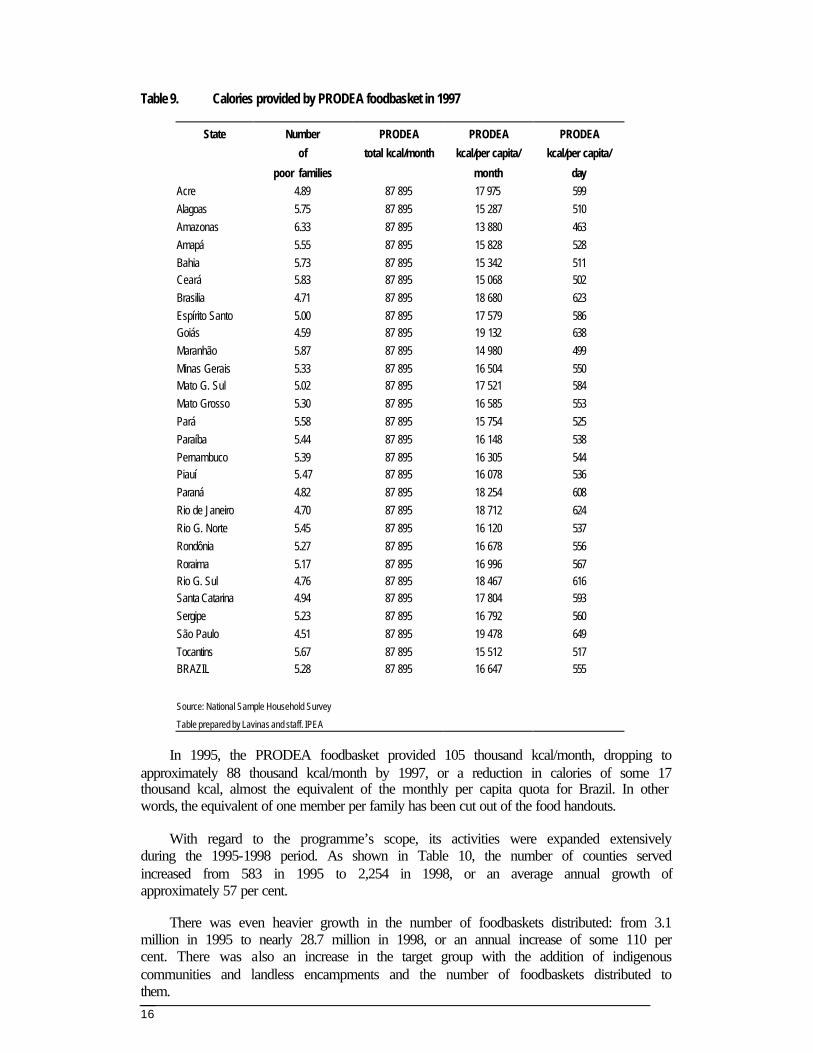
Table 9 shows the PRODEA foodbasket’s mean per capita calorie content state-by-state in 1997, based on the number of members in poor families, according to data from the National Sample Household Survey (PNAD/97). Note that the calorie content is lower in Maranhâo (14.9 mil kcal/month) as compared to São Paulo, for example (19 mil kval/month). The overall figure for Brazil is 16.647 kcal/month.
19 In 1998 there was a change in the foodbasket content. The new menu included 5kg of rice, 5kg of beans, 5kg of corn flakes, 3kg of macaroni, 1 kg of manioc flour, 1kg of sugar, and 2 liters of vegetable oil. The new calorie content was in the order of 84,000 kcal.
16
Table 9. Calories provided by PRODEA foodbasket in 1997
State Number PRODEA PRODEA PRODEA
of total kcal/month kcal/per capita/ kcal/per capita/
poor families month day Acre 4.89 87 895 17 975 599 Alagoas 5.75 87 895 15 287 510 Amazonas 6.33 87 895 13 880 463 Amapá 5.55 87 895 15 828 528 Bahia 5.73 87 895 15 342 511 Ceará 5.83 87 895 15 068 502 Brasilia 4.71 87 895 18 680 623 Espírito Santo 5.00 87 895 17 579 586 Goiás 4.59 87 895 19 132 638 Maranhão 5.87 87 895 14 980 499 Minas Gerais 5.33 87 895 16 504 550 Mato G. Sul 5.02 87 895 17 521 584 Mato Grosso 5.30 87 895 16 585 553 Pará 5.58 87 895 15 754 525 Paraíba 5.44 87 895 16 148 538 Pernambuco 5.39 87 895 16 305 544 Piauí 5.47 87 895 16 078 536 Paraná 4.82 87 895 18 254 608 Rio de Janeiro 4.70 87 895 18 712 624 Rio G. Norte 5.45 87 895 16 120 537 Rondônia 5.27 87 895 16 678 556 Roraima 5.17 87 895 16 996 567 Rio G. Sul 4.76 87 895 18 467 616 Santa Catarina 4.94 87 895 17 804 593 Sergipe 5.23 87 895 16 792 560 São Paulo 4.51 87 895 19 478 649 Tocantins 5.67 87 895 15 512 517 BRAZIL 5.28 87 895 16 647 555
Source: National Sample Household Survey Table prepared by Lavinas and staff. IPEA
In 1995, the PRODEA foodbasket provided 105 thousand kcal/month, dropping to approximately 88 thousand kcal/month by 1997, or a reduction in calories of some 17 thousand kcal, almost the equivalent of the monthly per capita quota for Brazil. In other words, the equivalent of one member per family has been cut out of the food handouts.
With regard to the programme’s scope, its activities were expanded extensively during the 1995-1998 period. As shown in Table 10, the number of counties served increased from 583 in 1995 to 2,254 in 1998, or an average annual growth of approximately 57 per cent.
There was even heavier growth in the number of foodbaskets distributed: from 3.1 million in 1995 to nearly 28.7 million in 1998, or an annual increase of some 110 per cent. There was also an increase in the target group with the addition of indigenous communities and landless encampments and the number of foodbaskets distributed to them.

17
The question remains as to what extent the programme has succeeded in reaching its target population.
Table 10. Relief interventions, PRODEA
No. Interventions Annual
95 96 97 98 growth rate
Municipalities 583 1 094 1 344 2 254 57% Indigenous communities 200 386 705 88% Landless encampments 283 903 824 71% Rubber tappers/Amazonian Solidarity
Others 1
TOTAL 583 1,577 2,633 3,783 87%
No. Foodbaskets distributed Annual
95 96 97 98 growth rate
Municipalities 3 073 365 7 240 227 14 236 551 28 660 563 110% Indigenous communities 4 075 100 703 180 291 284 999 312% Landless encampments 25 086 252 945 416 433 797 744 217% Rubber tappers/Amazonian Solidarity 7 418 31 218 321% Others 1 28 510
TOTAL 3 102 526 7 593 875 14 840 693 29 803 034 113% Notes: 1. Special interventions for families affected by forest fires in Roraima , acid spill from ship Bahamas in São José do Norte, Rio Grande do Sul, Source: GEPRE/SUPRI/DIPRI-CONAB and L. Lavinas, IPEA, 1999.
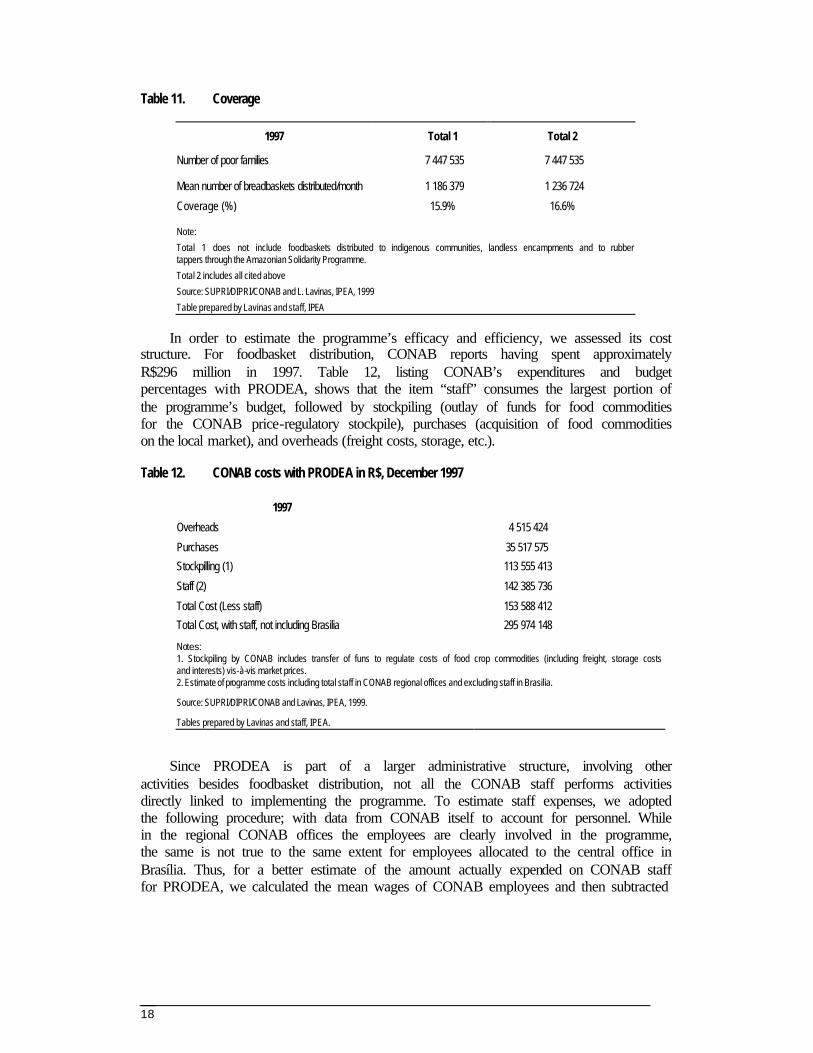
Table 11 shows the nationwide figures for the programme’s coverage.20 Taking as its focus the number of families which (according to the National Sample Household Survey-PNAD/97) lacked the income needed to acquire 2,200 kcal per capita per day, the coverage (total 1) for PRODEA is 15.9 per cent (the ratio between the mean number of foodbaskets distributed per month and the number of families at risk of food deficiency). Not counting the provision to indigenous communities and landless settlements, Amazonian Solidarity, and other special handouts, this percentage increases to 16.6 per cent (total 2) which is still far short of the potential demand.21
20 We chose to estimate two totals based on the mean number of poor families, estimated from the National Sample Household Survey (PNAD), which does not collect data from the Northern Region of the country.
21 However, since we also know that PRODEA does not have a nationwide scope and only works in some counties, we estimated its coverage considering only the counties where the foodbaskets are actually distributed. To do this, we constructed a coverage index with the following approximation: we considered the total number of families benefitted per county for the last year with available data (1998) as compared to the number of families with a per capita family income below the cost of 2200 Kcal in 1991. We lack data more recent than 1991 (when the last National Census was held in Brazil) to calculate per capita family income by county. To estimate coverage for the 1353 counties benefitted in 1998 we only considered 1042, due to county reapportionment (hampering subsequent geographic comparison) between 1991 and 1998. The programme’s coverage increased to some 50 per cent in these counties. Given the incompatibilities in the reference data, we opted to discard this approximation, since it proved impossible to estimate it more rigorously.
18
Table 11. Coverage
1997 Total 1 Total 2
Number of poor families 7 447 535 7 447 535 Mean number of breadbaskets distributed/month 1 186 379 1 236 724 Coverage (%) 15.9% 16.6%
Note: Total 1 does not include foodbaskets distributed to indigenous communities, landless encampments and to rubber tappers through the Amazonian Solidarity Programme. Total 2 includes all cited above Source: SUPRI/DIPRI/CONAB and L. Lavinas, IPEA, 1999 Table prepared by Lavinas and staff, IPEA
In order to estimate the programme’s efficacy and efficiency, we assessed its cost structure. For foodbasket distribution, CONAB reports having spent approximately R$296 million in 1997. Table 12, listing CONAB’s expenditures and budget percentages with PRODEA, shows that the item “staff” consumes the largest portion of the programme’s budget, followed by stockpiling (outlay of funds for food commodities for the CONAB price-regulatory stockpile), purchases (acquisition of food commodities on the local market), and overheads (freight costs, storage, etc.).
Table 12. CONAB costs with PRODEA in R$, December 1997
1997 Overheads 4 515 424 Purchases 35 517 575 Stockpilling (1) 113 555 413 Staff (2) 142 385 736 Total Cost (Less staff) 153 588 412 Total Cost, with staff, not including Brasilia 295 974 148 Notes: 1. Stockpiling by CONAB includes transfer of funs to regulate costs of food crop commodities (including freight, storage costs and interests) vis-à-vis market prices. 2. Estimate of programme costs including total staff in CONAB regional offices and excluding staff in Brasilia.
Source: SUPRI/DIPRI/CONAB and Lavinas, IPEA, 1999. Tables prepared by Lavinas and staff, IPEA.
Since PRODEA is part of a larger administrative structure, involving other activities besides foodbasket distribution, not all the CONAB staff performs activities directly linked to implementing the programme. To estimate staff expenses, we adopted the following procedure; with data from CONAB itself to account for personnel. While in the regional CONAB offices the employees are clearly involved in the programme, the same is not true to the same extent for employees allocated to the central office in Brasília. Thus, for a better estimate of the amount actually expended on CONAB staff for PRODEA, we calculated the mean wages of CONAB employees and then subtracted

19
from the item “staff expenditures” the amount corresponding to the central office in Brasília.22
Based on estimated total costs, we calculated the unit cost per foodbasket distributed in the year 1997. Table 13 shows that without including the overall cost of staff expenditure in 1997, the Federal government spent R$10.35 per foodbasket distributed. Adding on the staff item, the unit cost almost doubles, to R$19.94.
Table 13. Cost per foodbasket distributed in R$, December 1997
1997
Total PRODEA cost (less staff) 153 588 412 Total PRODEA cost (with staff) (1) 295 974 148 Number of foodbaskets distributed 14 840 693
Cost of foodbasket (without staff) 10.35
Cost of foodbasket (with staff) 19.94
1. Estimate of Programme cost including total staff in CONAB regional offices and excluding Brasilia
Source: SUPRI/DIPRI/CONAB and Lavinas, IPEA, 1999. Table prepared by Lavinas and staff, IPEA.
In addition to Federal expenditures on the programme, according to our field research in the State of Bahia under the Food Safety and Decentralization project (Lavinas, 1998), there were expenditures at the local level involving transportation of food commodities from the CONAB warehouses and the distribution points. The amounts found in Table 14 show an increase on the previously estimated figure by only 0.2 per cent.
Table 14. Cost per foodbasket distributed pluc local costs in R$, December 1997
Total PRODEA cost (less staff) 153 588 412 Total PRODEA cost (with staff) (1) 295 974 148 Total local costs (2) 524 500 No. of foodbaskets distributed 14 840 693 Costs of foodbaskets (without staff) 10.38 Costs of foodbasket (with staff) 19.98 Notes: 1 - Estimate of Programme costs including total staff in CONAB regional offices and excluding staff in Brasilia. 2 - Estimated expenditures by all municipalities on distribution of PRODEA foodbaskets. The value was estimated based on a field survey in Bahian municipalities under the research project "Food Security and Decentralization", carried out by Lena Lavinas and all, at IPEA
Source: SUPRI/DIPRI/CONAB and Lavinas, IPEA, 1999.
Table prepared by Lavinas and staff, IPEA.
22 This approximation is not ideal, but it serves the purposes of this methodology.

20
According to these data, the final cost estimate for distribution of a foodbasket by the Brazilian Federal Government through PRODEA in 1997 was R$19.98. Thus, almost twice the value of the food commodities (R$9.60) was spent on their distribution with staff revealing extremely high inefficiency costs.
Still, what is PRODEA’s degree of efficacy in relation to reducing the food gap for beneficiary families?
It is difficult to estimate the degree of efficacy, especially since we lack a specific evaluation of the programme’s approaches to targeting, which vary from one county to another. Therefore, one cannot assume that the programme actually serves those at greatest risk of hunger, nor can one identify the place occupied by each beneficiary family on the distribution curve (according to income) for the potential target group. With this constraint in mind, we decided nevertheless to estimate the impact of ideal targeting in increasing the calorie intake provided to families, i.e., 555 kcal/day/per capita for Brazil, on average.
Graph 3 shows the per capita family income (PCFI) converted into kcal/day, in addition to the calorie supplement provided by PRODEA. Assuming that the 21 per cent target group benefited by PRODEA (see graph 1) are really concentrated in the lower one-fifth (vertical) of the income distribution curve, the mean gap between the individuals and the 2,200kcal/day line would decrease from 45 per cent to 39 per cent, a reduction of some 13 per cent in this population’s degree of food deficiency.
However, we know that such an estimate is not realistic, since targeting is rarely fully accurate. In addition, one should consider the possibility of food commodities not reaching the beneficiaries, and waste in the consumption of the donated grain, thus further reducing the calorie supplement. In fact, there has been criticism over the quality
Graph 3
Ideal food gap reduction provided by PRODEA based on per capita family income (PCFI) in kcal/day, according to foodbasket
as surveyed by DIEESE
0200400600800
1.000 1.200 1.400 1.600 1.800 2.000 2.200 2.400 2.600
0 2 4 6 8 10 12 14 16 18 20 22
% of the population
PCFI
in k
cal/d
ay
PCFI in kcal/day (Dieese)
2.200 kcal/day per capita
PCFI in kcal/day + Prodea
21
of the food handouts (rice and beans), which are difficult to cook, leading to waste.23 More probably, the PRODEA beneficiary population is scattered along the entire distribution (lower) curve in Graph 3, so that the Programme has different (less effective) results than those presented here.
In short, this exercise revealed major distribution inefficiencies, low efficacy, and limited coverage, indicators of the Programme’s ineffectiveness in combating poverty.
5. Comparing the advantages of different compensatory food security programmes
To reflect on PRODEA’s degree of efficiency, we compare the food commodities distributed by PRODEA with that established under Federal Act 399/1938.
We will take the case of Bahia, where there is a compensatory food security programme based on the subsidized sale of food commodities, known as the Cesta do Povo (“The People’s Foodbasket”). Although this programme is neither free nor targeted, it does have a major regulatory effect on the retail food market in the State, in addition to its compensatory impact.
The government of the State of Bahia, as part of its line of compensatory policies, with a statewide network of outlets for subsidized sales of food commodities, cleaning materials and personal hygiene products, runs the People’s Foodbasket. The programme was established in 1979, with the purpose of serving the low-income population through direct marketing of the above-mentioned products. The idea is that they be sold below the respective market prices.
There are currently 409 fixed People’s Foodbasket stores in operation, 64 of which are located in the Greater Salvador Metropolitan Area and 345 in the interior of the State, thus covering the vast majority of the counties in Bahia (341 out of a total of 415). With this large number of points of sale and geographic scope, the programme guarantees a highly capillary food supply network. It is estimated that the People’s Foodbasket reaches some one million families, or approximately one-third of the State’s population.
Although created to serve the low-income population, the programme dispensed with targeted distribution and is thus open to the public at large. In practice, the characteristics of the stores’ infrastructure, the lack of “convenience”,24 and the limited product mix have acted as a targeting mechanism. In some towns in the interior, the People’s Foodbasket is even more important than in Salvador, since it is virtually the only large retail option for purchasing foodstuffs and cleaning and hygiene products. What prevails in these rural counties is a poorly diversified marketing structure, with
23 These comments are based on field research for the project Segurança Alimentar e Descentralização: novos rumos para as políticas públicas conducted in various counties in the State of Bahia.
24 The products are not packaged. Some 93 products are sold, including 57 food products, with the rest divided among personal hygiene and cleaning products and kitchen utensils.

22
small grocery stores selling on credit, with high profit margins, often including interest rates.25
Table 2 shows how it is possible to characterize a potential target group for a Bahian food deficiency eradication programme. Some 27 per cent of the overall Bahian population experience some degree of food deficiency, generating a potential target group of 4.3 million individuals or 903,310 families, based on the National Sample Household Survey (PNAD) estimate for 1997. According to 1997 data, PRODEA served 220,238 families in 98 Bahian counties, or some 30 per cent of the food deficient population.
How much would it cost to purchase the foodstuffs distributed by PRODEA in the People’s Foodbasket network?
Table 15 compares the costs of the PRODEA foodbasket with the same commodities through the People’s Foodbasket. It is R$3.83 cheaper to purchase the same foodbasket through the People’s Foodbasket. Calorie-wise, in December 1997, spending R$19.98 in a People’s Foodbasket store, a family would obtain 24 per cent more calories than from the mix distributed by PRODEA.
In daily per capita terms, this represents an additional 123 calories for the target population of the Bahian programme. The PRODEA benefit provides 511 kcal/day per capita, considering the mean number of family members in the state of Bahia. If the same foodbasket were purchased in the People’s Foodbasket chain, this supplement would increase to 634 calories.
Table 15. PRODEA calories at people’s foodbasket prices
Cost of PRODEA foodbasket R$19.98 Cost of PRODE A foodbasket at People's Foodbasket prices R$16.15 Calories provided by PRODEA 87,895.43 Calories from PRODEA foodbasket if R$ 19,98 were spent at People's Foodbasket 108,739.99 Extra-calories provided in People's Foodbasket values compared to PRODEA 24% Source: CONAB and EBAL
Thus, if the PRODEA food distribution were replaced by its equivalent in monetary income, the Federal government would be providing a greater benefit in terms of food access for families who would spend such a stipend in the People’s Foodbasket. Using the required 2200 kcal/day intake as the cut-off line, the proportion of people with food deficiency would remain unaltered, but the intensity of the deficit would drop from 42 per cent to 36 per cent. Adding the calorie supplement provided by the People’s Foodbasket, this figure would be 35 per cent, showing a slight improvement.
25 According to the survey, the programme’s compensatory side had become depleted, because the gap had decreased between prices in the People’s Foodbasket network and the retail market, making the former less attractive. The People’s Foodbasket gradually failed to guarantee greater access to food for its clientele, especially for staples. What actually led to this distortion was the inadequate targeting of the subsidy transferred by the State government to the People’s Foodbasket network, i.e., the subsidy was increasingly channelled towards products used less frequently by the needy population. In January 1999 the programme’s administration corrected this distortion and improved its performance from the standpoint of the benefit transferred to the target population.

23
This difference between the calorie supplements from the People’s Foodbasket and PRODEA is indeed slight. However, there are other advantages to the People’s Foodbasket as compared to PRODEA:
§ There is a reduction in the degree of inefficiency, since PRODEA’s expenditures involve a high administrative cost (practically 100 per cent of the food commodity purchase price), unlike the People’s Foodbasket.
§ Allocation of the benefit through purchases in the People’s Foodbasket tends to be better, due to the beneficiaries’ greater degree of freedom in choosing the food products most appropriate for them, thus reducing waste and increasing well being.
Table 16. Effect of distribution of PRODEA foodbaskets on the reduction of calorie deficit to the poor population in the State of Bahia
% of individuals Per capita Vis à vis 2.200 kcal line below the 2.200 kcal/day income
line (P0) gap (P1)
PCFI in kcal/day 0.35 0.42
PCFI in kcal/day + PRODEA calories 0.35 0.36
PCFI in kcal/day + PRODEA calories + People's Foodbasket differential 0.35 0.35
Source: National Sample Household Survey (PNAD, 1997)
Notes:
1. Prices surveyed for the capital cities in 1997 current values. 2. Converted per capita family income based on prices of foodbasket surveyed by DIEESE 3. Per capita family income in kcal/day, plus calories provided by PRODEA foodbasket 4. Per capita family income in kcal/day, plus calories provided by PRODEA foodbasket and calorie differential through purchase at Peoples’Foodbasket
As for the disadvantages, without a doubt the most relevant one is the use of two subsidies, one with the People’s Foodbasket itself and the other with an income transfer. The final purpose of the two benefits is virtually identical, and would lead to an even greater increase in social expenditures. The question is thus whether it would be appropriate to maintain both subsidies. It may be possible to keep both in Bahia, given the characteristics of the People’s Foodbasket, which in fact recently re-targeted the public subsidy for basic food commodities, thus increasing the benefit transferred to the population. But the Bahian case cannot be extended to the country as a whole. It remains to be seen if, in case PRODEA is deactivated and replaced by a direct income transfer, access would be guaranteed in the general retail market or if there would be a loss of the benefit due to increased prices.
6. PRODEA versus the retail m arket
In this section we compare the estimated cost of the PRODEA foodbasket with the market prices surveyed in three Brazilian state capitals, in order to determine whether a monetary stipend rather than foodbaskets would succeed in ensuring the same degree of access to food. This would be possible since economic stabilization has led to a heavy

24
reduction in price differentials between the retail market and subsidized public programmes.
Table 17 shows retail prices in three state capitals (Curitiba, Belo Horizonte, and Salvador) for the same products as those distributed in the PRODEA foodbaskets. For each capital, we calculated the total expenditure by individuals in their hypothetical attempt to obtain the same calories as in the products provided by the PRODEA foodbasket.
In these three state capitals, it is obvious that the retail market offers prices similar to the cost of the same calories through PRODEA. In Belo Horizonte, where we found the greatest differential as compared to the PRODEA foodbasket, the retail price of these food commodities was R$1.68 more, while in Curitiba one can purchase the same calories as in the PRODEA foodbasket for R$1.08 less on the local retail market. The difference in the large-scale retail market in Bahia was virtually negligible.
Table 17. Price of PRODEA foodbasket at retail markets in selected Brazilian areas.
Quantity Curitiba Belo Horizonte Salvador
Rice 10kg R$8.30 R$9.20 R$9.50 Beans 5kg R$3.25 R$3.95 R$3.40 Macaroni 2kg R$3.12 R$3.24 R$3.16 Manioc flour 5kg R$3.00 R$4.10 R$2.95 Corn flakes 3kg R$1.23 R$1.17 R$1.20 Total 25kg R$18.90 R$21.66 R$20.21 Differential PRODEA foodbasket. -R$1.08 R$1.68 R$0.23 Sources: Curitiba - Disque Economia / SMAB.
Belo Horizonte - Departamento de Acompanhamento/SMAB.
Salvador - EBAL/People's Foodbasket.
(1) Mean prices from September 1996 to September 1997, adjusted to September 1997
Table prepared by Lavinas and staff, IPEA, 1999.
There is thus an evident advantage to the direct monetary stipend, since it would allow families to acquire the same food without generating inefficiencies in the programme’s administration. The stipend further allows individuals and families to prioritize and exercise free choice in supplying their food needs, which would certainly increase their welfare and decrease their food costs, since it would be possible to optimize the use of resources by identifying foodstuffs on sale or with seasonal price drops.
However, we are aware that upon transferring income to a family or individual without placing constraints on its allocation, the benefit may not be fully committed to meeting food needs (although we have assumed otherwise thus far for methodological reasons), since there are other immediate needs to be met, especially among poor families. The question thus arises as to what percentage of income families suffering food deficiency normally allocate to food. According to the 1996 Family Budget

25
Survey26 for the Greater Salvador Metropolitan Area, families under the minimum calorie intake (2200 kcal/day) spend some 43 per cent of their income on food.
In order to measure the real income shift for target families in a hunger eradication programme, we assumed an income transfer of some R$78.00 and factored in 43 per cent of this transfer, for the reasons given above.
Graphs 4a and 4b shows, for rural and urban areas in Bahia State,27 the per capita family income distribution (lower curve), the income distribution plus the benefit provided to the families referring to 75 per cent of the 2200 kcal/day, or some R$78.0028 per family (top curve) - and the per capita family income plus the amount that would be spent on food assuming that people commit only 43 per cent of their income to food (dotted curve).
Graph 4a. Distribution of the poorest 35 per cent of the urban population of the State of Bahai by per capita family income (PCFI), and per capita stipend expenditure on food
26 Observing the household budget for families with monthly family income up to twice the official minimum wage for Greater Salvador Metropolitan Area according to the POF/96, we note that they spend 39.4 per cent on food, 22.4 per cent on housing, 10.1 per cent on transportation, 5.7 per cent on clothing, 5.3 per cent on health care, 1.6 per cent on education, and 15.5 per cent on other items.
27 Note that the State of Bahia has 4,269,278 inhabitants living below the 2200kcal/day line. The figure is 35 per cent of the State’s overall population, or 43 per cent in rural areas and 57 per cent in urban areas.
28 Note that we opted for the same benefit for the entire State, to avoid encouraging people to move from one county to another.
0
10
20
30
40
50
60
0 10 20 30 40 50 60 70 80 90 100 % of Target Population
PCFI
PCFI
PCFI + stipend
PCFI + spending on FoodGasto com on food
2.200 kcal/day line
26
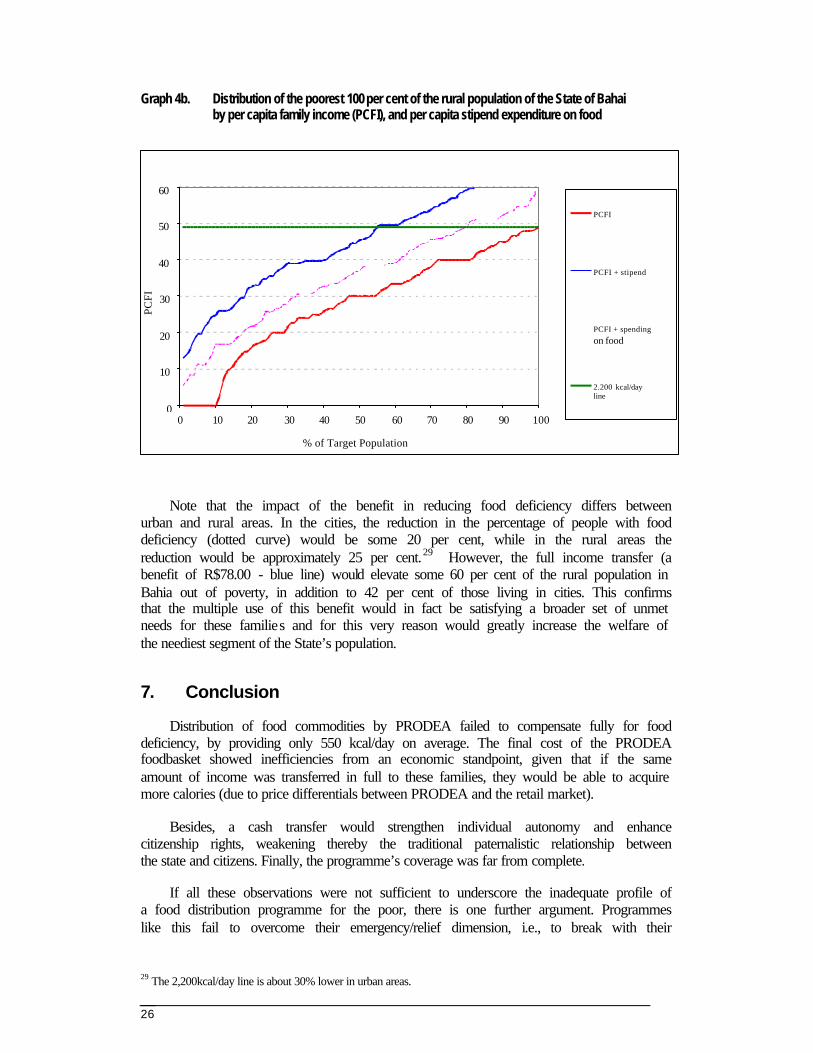
Graph 4b. Distribution of the poorest 100 per cent of the rural population of the State of Bahai by per capita family income (PCFI), and per capita stipend expenditure on food
Note that the impact of the benefit in reducing food deficiency differs between urban and rural areas. In the cities, the reduction in the percentage of people with food deficiency (dotted curve) would be some 20 per cent, while in the rural areas the reduction would be approximately 25 per cent.29 However, the full income transfer (a benefit of R$78.00 - blue line) would elevate some 60 per cent of the rural population in Bahia out of poverty, in addition to 42 per cent of those living in cities. This confirms that the multiple use of this benefit would in fact be satisfying a broader set of unmet needs for these families and for this very reason would greatly increase the welfare of the neediest segment of the State’s population.
7. Conclusion
Distribution of food commodities by PRODEA failed to compensate fully for food deficiency, by providing only 550 kcal/day on average. The final cost of the PRODEA foodbasket showed inefficiencies from an economic standpoint, given that if the same amount of income was transferred in full to these families, they would be able to acquire more calories (due to price differentials between PRODEA and the retail market).
Besides, a cash transfer would strengthen individual autonomy and enhance citizenship rights, weakening thereby the traditional paternalistic relationship between the state and citizens. Finally, the programme’s coverage was far from complete.
If all these observations were not sufficient to underscore the inadequate profile of a food distribution programme for the poor, there is one further argument. Programmes like this fail to overcome their emergency/relief dimension, i.e., to break with their
29 The 2,200kcal/day line is about 30% lower in urban areas.
0
10
20
30
40
50
60
0 10 20 30 40 50 60 70 80 90 100
% of Target Population
PCFI
PCFI
PCFI + stipend
PCFI + spending on food
2.200 kcal/day line

27
marginal effect and to act in a broader sense through distribution of assets, that is efficiently promoting equity. Such aspects oriented the first part of this study, in which we attempted to emphasize the changes underway in the understanding of the role of compensatory policies in times of growing vulnerability and instability. To grant an income benefit rather than food is a less costly and more effective way to apply compensatory social policies in order for them to act efficiently, not only in the short-term fight against poverty, but also against inequality, ultimately the main cause of destitution in Brazil. To redistribute income in decent amounts, consistent with tackling the extremely precarious conditions in which a major portion of the Brazilian people live, is the best and quickest way to achieve a true social reform based on reducing the country’s gross inequality. This means recognizing the central role of policies for directly transferring income to needy families in achieving this goal. It means adding something more to solidarity than merely one isolated measure. It expands the notion of citizenship, meaning that no strings can be attached for beneficiaries beyond their normal legal responsibilities.30 To transfer income does not mean that Brazil is fated to create a “workfare” system, which would lead her back to the ideology prevailing in the early 20th century, viewing the poor as being resistant to the work ethic, loafers to be blamed for their own poverty.
Solidarity is unconditional. And the poor of Brazil, who have generally been excluded from their rights to social benefits (most of which target workers, especially those from the formal sector) expect the renewal of the Brazilian social protection system to finally achieve principles of equity, from the point of view both of policy design and strengthening institutions. Without this prerequisite, the commitment to eradicate hunger will remain a dead letter.
30 For example, the requirement that all the children finish primary school.

28
References
Abranches, S. 1992. "Política Social e Combate à Pobreza. A teoria da Prática", in Política Social e Combate à Pobreza, Rio de Janeiro, Paz e Terra.
Ackerman, B and Alstott, A. 1999. The Stakeholder Society (New Haven and London, Yale University Press).
Bowles, S and Gintis, H. 1998. “Efficient Redistribution: new rules for markets, States and communities” in Wright, E. (ed). Recasting Egalitarianism (London and New York).
dos Santos, Wanderley G. 1987. in Zahar, J. (ed). A Trágica Condição da Política Social, Política Social e Combate à Pobreza (Rio de Janeiro) p. 37.
Fraker, T. 1990. The Effects of Food Stamps on Food Consumption: a review of the literature (Alexandria, US Dep. of Agriculture, Food, and Nutrition Service).
Fraker, M. and Ohls, J.C. 1995. “The Effect of Food Stamp Cashout on Food Expenditures: an assessment of the findings from four demonstrations”, in Journal of Human Resources 30(4) pp. 633-649.
Gilbert, N. 1995. Welfare Justice: Restoring Social Equity (New Haven and London Yale University Press, p. 66).
Lavinas, L and Varsano, R. 1997. Renda Mínima: integrar e universalizar, in Novos Estudos (CEBRAP, 49, November).
Lavinas, L. 1998 (forthcoming). Projeto Segurança Alimentar e Descentralização: os novos rumos das políticas públicas (IPEA. IPEA/FINEP/CEDEPLAR), Ch. III.
Ohls, J. C and Beebout, H. 1993. The Food Stamps Program - Design, Tradeoffs, Policy, and Impacts (Washington, Mathematics Policy Research Institute, The Urban Institute Press).
Rocha, S. 2000. Opço�s metodológicas para a estimacão de linhas de Indigêncie e de Pobreza no Brasil (Rio de Janerio ,IPEA).
Rossi, P. 1998. Feeding the Poor - Assessing Federal Food Aid (Washington, The AEI Press).
Valladares, L. 1999. Programas Sociales para los Pobres en Brasil, in Políticas Sociales para Los Pobres en America Latina (Buenos Aires, Schteingart, M.) pp. 159-197.
Van Parijs, P. 1991. Qu’est-ce qu’une société juste? (Paris: Editions du Seuil, ch. 10).
- (1995). ‘Más alla de la solidariedad. Los fundamentos éticos del Estado de Bienestar y de su superación’ in R. Lo Vuolo (comp.) Contra la Exclusión. La Propuesta del Ingreso Ciudadano (Buenos Aires, CIEPP, Miño y Dávila editores) pp. 55-82.

29