Aerobic and Anaerobic Metabolism of Trimethylamine, Dimethylamine

Ryerson UniversityDigital Commons @ Ryerson
Theses and dissertations
1-1-2012
Combined anaerobic-aerobic and UV/H2O2processes for the treatment of syntheticslaughterhouse wastewaterCiro F. LecompteRyerson University
Follow this and additional works at: http://digitalcommons.ryerson.ca/dissertationsPart of the Environmental Sciences Commons
This Thesis is brought to you for free and open access by Digital Commons @ Ryerson. It has been accepted for inclusion in Theses and dissertations byan authorized administrator of Digital Commons @ Ryerson. For more information, please contact [email protected].
Recommended CitationLecompte, Ciro F., "Combined anaerobic-aerobic and UV/H2O2 processes for the treatment of synthetic slaughterhouse wastewater"(2012). Theses and dissertations. Paper 1276.

COMBINED ANAEROBIC-AEROBIC AND UV/H2O2 PROCESSES FOR THE
TREATMENT OF SYNTHETIC SLAUGHTERHOUSE WASTEWATER
by
CIRO FERNANDO BUSTILLO LECOMPTE
B.Eng. in Civil Engineering
University of Cartagena, Cartagena, Colombia, 2008
A Thesis
presented to Ryerson University
in partial fulfilment of the requirements
for the degree of
Master of Applied Science
in the Program of
Environmental Applied Science and Management
Toronto, Ontario, Canada, 2012
© Ciro Fernando Bustillo Lecompte, 2012
ii
AUTHOR’S DECLARATION FOR ELECTRONIC SUBMISSION OF A THESIS
I hereby declare that I am the sole author of this thesis. This is a true copy of the thesis, including any
required final revisions, as accepted by my examiners.
I authorize Ryerson University to lend this thesis to other institutions or individuals for the purpose of
scholarly research.
I further authorize Ryerson University to reproduce this thesis by photocopying or by other means, in
total or in part, at the request of other institutions or individuals for the purpose of scholarly research.
I understand that my thesis may be made electronically available to the public.

iii
ABSTRACT
Combined Anaerobic-Aerobic and UV/H2O2 Processes for the Treatment of Synthetic Slaughterhouse
Wastewater
Ciro Fernando Bustillo Lecompte
Master of Applied Science
Environmental Applied Science and Management
Ryerson University
2012
The biological treatment of a synthetic slaughterhouse wastewater (SSWW) was studied using an anaerobic
baffled reactor (ABR) and an aerobic activated sludge (AS) at a laboratory scale, with total organic carbon
(TOC) loading rates of 0.03–1.01 g/(L.day), total nitrogen (TN) loading rates of 0.01–0.19 g/(L.day), and a
flow rate of 2.93 to 11.70 mL/min in continuous mode. Results revealed that combined anaerobic-aerobic
processes had higher efficiency to treat SSWW than a single process. Up to 96.36% TOC, 80.53% TN, and
99.38% 5-day carbonaceous biochemical oxygen demand (CBOD5) removal from an influent concentration of
1,008.85 mgTOC/L, 419.77 mgTN/L, and 640 mgCBOD5/L at the hydraulic retention time (HRT) of 6.24 days
and a flow rate of 3.75 mL/min was achieved. The UV/H2O2 process was studied to treat a secondary effluent
of SSWW with TOC loadings of 64.88–349.84 mg/L. Up to 75.22% TOC and 84.38% CBOD5 removal were
obtained for an influent concentration of 64.88 mgTOC/L at the HRT of 3 h with H2O2 concentration of 900
mg/L. An optimum molar ratio dosage of 13.87 mgH2O2/mgTOCin was also obtained. Combined anaerobic-
aerobic and UV/H2O2 processes enhanced the biodegradability of the TOC, TN, and CBOD5 present in the
SSWW. Up to 99.98% TOC, 82.84% TN, and 99.69% CBOD5 overall removals were obtained for an influent
concentration of 1,004.88 mgTOC/L, 200.03 mgTN/L, and 640 mgCBOD5/L at the HRT of 4 days and a flow
rate of 5.90 mL/min. A cost-effectiveness analysis (CEA) was performed for the optimum conditions for the
SSWW treatment by optimizing total electricity cost and HRT, in which the combined anaerobic-aerobic and
UV/H2O2 processes had an optimal TOC removal of 92.46% at an HRT of 41 h, a cost of $1.25/kg of TOC
removed, and $11.60/m3 of treated SSWW. This process reaches a maximum TOC removal of 99% in 76.5 h
with an estimated cost of $2.19/kg TOC removed and $21.65/m3 treated SSWW.
Keywords: Synthetic slaughterhouse wastewater (SSWW); anaerobic baffled reactor (ABR); aerobic activated
sludge (AS); UV/H2O2; TOC; TN; CBOD5; combined processes.

iv
ACKNOWLEDGMENTS
I would like to express my sincere gratitude to my supervisor, Dr. Mehrab Mehrvar, of the
Department of Chemical Engineering at Ryerson University, for his guidance, assistance, and
financial support throughout the successful completion of this research.
I would also like to acknowledge Dr. Lynda McCarthy and Dr. Ronald Pushchak, whose
comments, advices and suggestions immensely benefitted this research; Dr. Michael Bardecki, Elias
Chu, Isabella Fernandes, and Alison MacLeod, Ryerson University staff, for their support and
guidance during my studies; Ali Hemmati, Daniel Boothe, and Tondar Tajrobehkar, Engineering
Technologists of the Department of Chemical Engineering, for their technical support and assistance
on my experimental setup and further experiments; Ashbridges Bay Wastewater Treatment Plant for
providing the anaerobic and aerobic activated sludge essential for the processes used in this research;
Adriana Gaona, Dinesh Patel, Masroor Mohajerani, Samira Ghafoori, Mauricio Barrera, and Weihua
Cao for many times of enlightenment and entertainment, as well as their help in troubleshooting,
support and advice.
The financial support of Natural Sciences and Engineering Research Council of Canada
(NSERC) and Ryerson University is greatly appreciated.
Finally yet importantly, I would like to thank the professors of the University of Cartagena as
follows: Dr. Edgar Quiñones, for his unconditional help and guidance; Monica Eljaiek, Dalia Moreno,
Raul Guerrero Torres, Dr. Alfonso Arrieta and Dr. Javier Mouthon, whose advice and encouragement
helped me to become a better person and professional. I would also like to show appreciation to my
friends, mainly to Daisy, Juan Felipe, Maria Clara, Sylvia, Eder, Andrea, and Cinthia; my cousins
Gustavo, Lucila, Lucy and David; my aunts and uncles; and my beloved mother, Candelaria, and my
brother, Carlos, for their love, guidance, patience, understanding, sacrifice and invaluable support
throughout my graduate studies. I also offer regards and greetings to all those who supported me in
any way during the completion of this research and whose names were not mentioned.

v
TABLE OF CONTENTS
Page
AUTHOR’S DECLARATION FOR ELECTRONIC SUBMISSION OF A THESIS .......................... ii
ABSTRACT .......................................................................................................................................... iii
ACKNOWLEDGMENTS ..................................................................................................................... iv
TABLE OF CONTENTS ........................................................................................................................v
LIST OF TABLES ................................................................................................................................. ix
LIST OF FIGURES ............................................................................................................................... xi
NOMENCLATURE ........................................................................................................................... xvii
CHAPTER 1 INTRODUCTION .............................................................................................................1
Objectives ............................................................................................................................................3
CHAPTER 2 LITERATURE REVIEW ..................................................................................................4
2.1. Introduction ...................................................................................................................................4
2.2. Slaughterhouse wastewater characteristics ...................................................................................4
2.2.1. Slaughterhouse wastewater occurrence ..................................................................................5
2.2.2. Slaughterhouse wastewater guidelines and regulations .......................................................14
2.2.3. Environmental impacts .........................................................................................................16
2.2.4. Health effects ........................................................................................................................20
2.3. Slaughterhouse wastewater treatment technologies ....................................................................22
2.3.1. Anaerobic biological treatment ............................................................................................25
2.3.2. Aerobic biological treatment ................................................................................................26
2.3.3. Combined anaerobic-aerobic biological treatment ..............................................................26
2.3.4. Biological modeling .............................................................................................................28
2.3.5. Nitrification and denitrification ............................................................................................33
2.3.6. Advanced oxidation processes (AOPs) ................................................................................35
2.3.7. UV/H2O2 process ..................................................................................................................38

vi
2.4. Need for combined biological treatment and advanced oxidation processes .............................45
2.5. Concluding remarks ....................................................................................................................52
CHAPTER 3 MATERIALS AND METHODS ....................................................................................53
3.1. Introduction .................................................................................................................................53
3.2. Materials .....................................................................................................................................53
3.2.1. Synthetic slaughterhouse wastewater (SSWW) ...................................................................53
3.2.2. Anaerobic and aerobic inoculum ..........................................................................................54
3.3. Experimental setup ......................................................................................................................55
3.4. Experimental procedure ..............................................................................................................58
3.4.1. Acclimatization of the inoculum ..........................................................................................58
3.4.2. ABR process .........................................................................................................................67
3.4.3. Aerobic AS process ..............................................................................................................67
3.4.3. UV/H2O2 process ..................................................................................................................68
3.4.4. Combined anaerobic-aerobic processes ...............................................................................69
3.4.5. Combined aerobic-anaerobic processes ...............................................................................69
3.4.6. Combined anaerobic-aerobic and UV/H2O2 processes ........................................................71
3.5. Analytical techniques ..................................................................................................................72
3.5.1. Dissolved oxygen (DO) ........................................................................................................72
3.5.2. Temperature and pH .............................................................................................................72
3.5.3. Total suspended solids (TSS), volatile suspended solids (VSS), mixed liquor suspended
solids (MLSS), and mixed liquor volatile suspended solids (MLVSS) .........................................73
3.5.4. Total organic carbon (TOC) and total nitrogen (TN) ...........................................................74
3.5.5. 5-day carbonaceous biochemical oxygen demand (CBOD5) ...............................................77
CHAPTER 4 RESULTS AND DISCUSSION .....................................................................................79
4.1. Introduction .................................................................................................................................79
4.2. Common characteristics of the synthetic slaughterhouse wastewater (SSWW) ........................79
4.2.1. Reynolds number ..................................................................................................................79

vii
4.2.2. Dissolved oxygen (DO) ........................................................................................................79
4.2.3. Temperature and pH .............................................................................................................81
4.2.4. TSS and VSS concentrations of the anaerobic sludge and MLSS and MLVSS
concentrations of the aerobic sludge ..............................................................................................84
4.2.5. TSS and VSS concentrations of the SSWW ........................................................................85
4.3. TOC and TN removal in SSWW using individual anaerobic and aerobic processes .................90
4.4. TOC and TN removal in SSWW using combined anaerobic-aerobic systems ..........................91
4.4.1. TOC and TN removal in SSWW using combined anaerobic-aerobic processes .................91
4.4.2. TOC and TN removal in SSWW using combined aerobic-anaerobic processes .................98
4.4.3. TOC and TN removal in SSWW using combined anaerobic-aerobic processes with
recycling .........................................................................................................................................98
4.5. TOC and TN removal in SSWW using UV/H2O2 process alone ..............................................103
4.5.1. Dark experiments ...............................................................................................................112
4.5.2. Optimal H2O2 dosage and molar ratio of [H2O2]/[TOC] for the UV/H2O2 process ...........112
4.6. TOC and TN removal in SSWW using combined anaerobic-aerobic and UV/H2O2 processes
..........................................................................................................................................................115
4.7. CBOD5 removal in SSWW using ABR alone, aerobic AS alone, UV/H2O2 alone, and
combined processes .........................................................................................................................126
4.8. Cost-effectiveness analysis (CEA) to determine the best alternative on SSWW treatment by
optimizing total electricity cost and HRT ........................................................................................130
4.8.1. Kinetic modeling for the ABR alone ..................................................................................130
4.8.2. Kinetic modeling for the aerobic AS alone ........................................................................133
4.8.3. Kinetic modeling for the combined anaerobic-aerobic processes ......................................135
4.8.3. Kinetic modeling for the UV/H2O2 process alone .............................................................138
4.8.4. Kinetic modeling for the combined anaerobic-aerobic and UV/H2O2 processes ...............142
4.8.5. Optimization of the total electricity cost and HRT to determine the best alternative on
SSWW treatment ..........................................................................................................................145
CHAPTER 5 CONCLUSIONS AND RECOMMENDATIONS ........................................................162
viii
5.1. Conclusions ...............................................................................................................................162
5.2. Recommendations .....................................................................................................................165
APPENDICES .....................................................................................................................................166
Appendix A. Determination of theoretical TOC and TN of the SSWW .............................................166
Appendix B. Determination of the Reynolds number .........................................................................168
Appendix C. Determination of TSS and VSS .....................................................................................170
Appendix D. Sample standard deviation and relative error analysis ...................................................170
Appendix E. Raw data .........................................................................................................................172
REFERENCES ....................................................................................................................................218

ix
LIST OF TABLES
Page
Table 2.1. Characteristics of slaughterhouse wastewater. .......................................................................5
Table 2.2. Fresh water consumption in different sectors of the US food and beverage manufacturing..6
Table 2.3. Provincially licensed meat plants in Ontario. .........................................................................8
Table 2.4. Comparison of different standards for slaughterhouse wastewater discharge. ....................15
Table 2.5. Methods used for analyzing various slaughterhouse wastewater parameters. .....................16
Table 2.6. US EPA effluent limitations for the meat and poultry products. .........................................17
Table 2.7. Effluent levels for meat processing. .....................................................................................20
Table 2.8. Recommendations for wastewater discharges from federal facilities. .................................21
Table 2.9. Summary of current technologies used in MPP facilities for the treatment of the
slaughterhouse wastewater. ..........................................................................................................24
Table 2.10. Comparison of anaerobic and aerobic wastewater treatment technologies. .......................26
Table 2.11. Main parameters for biological treatment. .........................................................................28
Table 2.12. Standard electrode potential of selected oxidant species. ..................................................36
Table 2.13. Electromagnetic spectrum of ultraviolet light. ...................................................................38
Table 2.14. Common reaction mechanisms in UV/H2O2 processes. .....................................................39
Table 2.15. Anaerobic–aerobic and UV/H2O2 systems for the treatment of wastewater. .....................47
Table 3.1. Synthetic slaughterhouse wastewater recipe. .......................................................................54
Table 3.2. Components of the meat extract powder provided by the manufacturer (Oxoid Ltd.) ........54
Table 4.1. Maximum and minimum of SSWW pH values during acclimatization of sludge and
experiments. .................................................................................................................................81
Table 4.2. Maximum and minimum SSWW temperature values. .........................................................84
Table 4.3. TSS profiles of the SSWW in the ABR and the aerobic AS. ...............................................85
Table 4.4. VSS profiles of the SSWW in the ABR and the aerobic AS. ...............................................90
Table 4.5. TOC and TN values during dark experiments using different UV/H2O2 concentrations. ..112
Table 4.6. Technical conditions of the processes for the economic study ..........................................145
Table 4.7. Electric power and costs of electricity and H2O2. ..............................................................146
Table 4.8. Calculated values of the electricity cost per mass TOC removed for the ABR process alone.
....................................................................................................................................................147

x
Table 4.9. Calculated values of the electricity cost per mass TOC removed for the aerobic AS process
alone. ..........................................................................................................................................148
Table 4.10. Calculated values of the electricity cost per mass TOC removed for the UV/H2O2 process
alone. ..........................................................................................................................................150
Table 4.11. Calculated values of the electricity cost per mass TOC removed for the combined
anaerobic-aerobic processes. ......................................................................................................151
Table 4.12. Calculated values of the electricity cost per mass TOC removed for the combined aerobic-
anaerobic processes. ...................................................................................................................153
Table 4.13. Calculated values of the electricity cost per mass TOC removed for the combined
anaerobic-aerobic and UV/H2O2 processes. ...............................................................................154
Table A.1. Calculations of TOC and TN concentrations of the meat extract based on the information
provided by the manufacturer (Oxoid Ltd.). ..............................................................................167
Table B.1. Reynolds number for different flow rates in the ABR, AS, UV/H2O2, and their
combination. ...............................................................................................................................169
Table C.1. Calculation of the concentration of TSS and VSS of sludge in compartment 4 of the ABR
process. .......................................................................................................................................170
Table E.1. TSS and VSS values of the sludge in the ABR and aerobic AS. .......................................172
Table E.2. TSS and VSS values of the sludge in the ABR. .................................................................191
Table E.3. TSS and VSS values of the sludge in the aerobic AS. .......................................................191
Table E.4. pH values of the different processes studied. .....................................................................192
Table E.5. Temperature values of the different processes studied. .....................................................193
Table E.6. Calculation of the CBOD5 for the different processes studied. .........................................194
Table E.7. Calculation of the TOC and TN removal for the different processes studied. ...................194
Table E.8. Maximum values of TOC and TN removal for the different processes studied. ...............201
Table E.9. TOC and TN values from the UV/H2O2 process alone for the calculation of the optimal
H2O2 dosage. ..............................................................................................................................202
Table E.10. Kinetic modeling for the different processes. ..................................................................209
Table E.11. Maximum TOC and TN removals using UV/H2O2 process alone. ..................................214

xi
LIST OF FIGURES
Page
Figure 2.1. Wastewater treatment methods used by slaughterhouses. ..................................................13
Figure 2.2. Chemical structures for different classes of tannins............................................................19
Figure 2.3. A typical curve for the microbial growth. ...........................................................................29
Figure 3.1. Schematic diagram of the combined processes of ABR and UV/H2O2 photoreactor. ........56
Figure 3.2. Schematic diagram of the individual UV photoreactor (Siemens, Barrier® SL-1S),
V=1.35L. ......................................................................................................................................57
Figure 3.3. Schematic diagram of the experimental set up for the treatment of synthetic
slaughterhouse wastewater by combined anaerobic-aerobic and UV/H2O2 processes. ...............59
Figure 3.4. Laboratory view of the experimental setup. ........................................................................60
Figure 3.5. Schematic diagram of the experimental set up for the treatment of synthetic
slaughterhouse wastewater by anaerobic process alone. The blue color indicates the flow
direction of wastewater. ...............................................................................................................61
Figure 3.6. Schematic diagram of the experimental set up for the treatment of synthetic
slaughterhouse wastewater by aerobic process alone. The blue color indicates the flow direction
of wastewater. ..............................................................................................................................62
Figure 3.7. Schematic diagram of the experimental set up for the treatment of synthetic
slaughterhouse wastewater by UV/H2O2 process alone. The blue color indicates the flow
direction of wastewater. ...............................................................................................................63
Figure 3.8. Schematic diagram of the experimental set up for the treatment of synthetic
slaughterhouse wastewater by combined anaerobic-aerobic processes. The blue color indicates
the flow direction of wastewater. .................................................................................................64
Figure 3.9. Schematic diagram of the experimental set up for the treatment of synthetic
slaughterhouse wastewater by combined aerobic-anaerobic processes. The blue color indicates
the flow direction of wastewater. .................................................................................................65
Figure 3.10. Schematic diagram of the experimental set up for the treatment of synthetic
slaughterhouse wastewater by combined anaerobic-aerobic and UV/H2O2 processes. The blue
color indicates the flow direction of wastewater. .........................................................................66
Figure 3.11. Experimental setup of the batch recirculation UV/H2O2 process. ....................................70

xii
Figure 3.12. TN calibration curve for the range of 1–20 mgTN/L. .......................................................75
Figure 3.13. TOC calibration curve for the range of 1–400 mgTOC/L. ...............................................76
Figure 4.1. DO profile of the SSWW in the ABR chambers, aerobic AS and UV photoreactor. Error
bars represent standard deviations. ..............................................................................................80
Figure 4.2. SSWW pH evolution with time in the ABR, the aerobic AS and UV/H2O2 reactors. ........82
Figure 4.3. SSWW temperature evolution with time in the ABR, the aerobic AS and UV/H2O2
reactors. ........................................................................................................................................83
Figure 4.4. TSS profile and evolution with time of the anaerobic sludge within the ABR process. .....86
Figure 4.5. VSS profile and evolution with time of the anaerobic sludge within the ABR process. ....87
Figure 4.6. MLSS profile and evolution with time of the anaerobic sludge within the aerobic AS
process. Error bars represent standard deviations. .......................................................................88
Figure 4.7. MLVSS profile and evolution with time of the anaerobic sludge within the aerobic AS
process. Error bars represent standard deviations. .......................................................................89
Figure 4.8. TOC removal for different wastewater concentrations using biological treatment at the
HRT of 7 days and a flow rate of 3.34 mL/min in continuous mode without recycling. ............92
Figure 4.9. TN removal for different wastewater concentrations using biological treatment at the HRT
of 7 days and a flow rate of 3.34 mL/min in continuous mode without recycling. .....................93
Figure 4.10. Effects of HRT on TOC removal using biological treatment with TOC concentration in
the inlet of 639.44 mg/L (60% of SWW) in continuous mode without recycling. ......................94
Figure 4.11. Effects of HRT on TN removal using biological treatment with TN concentration in the
inlet of 144.40 mg/L (60% of SWW) in continuous mode without recycling. ............................95
Figure 4.12. Effects of HRT on TOC removal by combined anaerobic-aerobic processes with TOC
concentration in the inlet of 1,008.85 mg/L (100% of SWW) in continuous mode without
recycling. ......................................................................................................................................96
Figure 4.13. Effects of HRT on TN removal by combined anaerobic-aerobic processes with TN
concentration in the inlet of 419.77 mg/L (100% of SWW) in continuous mode without
recycling. ......................................................................................................................................97
Figure 4.14. Effects of HRT on TOC removal by combined aerobic-anaerobic processes with TOC
concentration in the inlet of 1,008.85 mg/L (100% of SWW) in continuous mode without
recycling. ......................................................................................................................................99
Figure 4.15. Effects of HRT on TN removal by combined aerobic-anaerobic processes with TN
concentration in the inlet of 425.54 mg/L (100% of SWW) in continuous mode without
recycling. ....................................................................................................................................100

xiii
Figure 4.16. Comparison of TOC removal by means of combined anaerobic-aerobic processes with
and without recycling, by using TOC concentration in the inlet of 639.44 mg/L and flow rate of
7.50 mL/min in continuous mode. .............................................................................................101
Figure 4.17. Comparison of TN removal by means of combined anaerobic-aerobic processes with and
without recycling, by using TN concentration in the inlet of 144.40 mg/L and flow rate of 7.50
mL/min in continuous mode. .....................................................................................................102
Figure 4.18. TOC removal in untreated SSWW using different H2O2 concentrations with TOC
concentration in the inlet of 64.88 mg/L (5% of SSWW) in the UV/H2O2 process alone. ........104
Figure 4.19. TOC removal in untreated SSWW using different H2O2 concentrations with TOC
concentration in the inlet of 163.69 mg/L (10% of SSWW) in the UV/H2O2 process alone. ....105
Figure 4.20. TOC removal in untreated SSWW using different H2O2 concentrations with TOC
concentration in the inlet of 348.84 mg/L (25% of SSWW) in the UV/H2O2 process alone in
continuous mode without recycling. ..........................................................................................106
Figure 4.21. Maximum TOC removal for different raw SSWW concentrations using UV/H2O2
process alone (HRT = 3 h) in continuous mode without recycling. ...........................................107
Figure 4.22. TN removal in raw SSWW using different H2O2 concentrations with TN concentration in
the inlet of 18.10 mg/L (5% of SSWW) in the UV/H2O2 process alone in continuous mode
without recycling. .......................................................................................................................108
Figure 4.23. TN removal in raw SSWW using different H2O2 concentrations with TN concentration in
the inlet of 40.02 mg/L (5% of SSWW) in the UV/H2O2 process alone in continuous mode
without recycling. .......................................................................................................................109
Figure 4.24. TN removal in raw SSWW using different H2O2 concentrations with TN concentration in
the inlet of 93.94 mg/L (25% of SSWW) in the UV/H2O2 process alone in continuous mode
without recycling. .......................................................................................................................110
Figure 4.25. TN removal for different raw SSWW concentrations using UV/H2O2 process alone in
continuous mode without recycling. ..........................................................................................111
Figure 4.26. Dark experiments for TOC removal in raw SSWW for H2O2 concentrations of 0, 600,
and 1200 mg/L (TOCin = 64.88 mg/L) in the UV/H2O2 process alone in continuous mode
without recycling. .......................................................................................................................113
Figure 4.27. Dark experiments for TN removal in raw SSWW for H2O2 concentrations of 0, 600, and
1200 mg/L (TNin = 18.10 mg/L) in the UV/H2O2 process alone in continuous mode without
recycling. ....................................................................................................................................114

xiv
Figure 4.28. Optimal concentration of H2O2 for TOC removal in different SSWW concentrations,
within the UV/H2O2 process in batch recirculation mode. ........................................................116
Figure 4.29. Relation of molar ratio of [H2O2]/[TOC] for different SSWW concentrations within the
UV/H2O2 process in batch recirculation mode. ..........................................................................117
Figure 4.30. Relation of molar ratio of [H2O2]/[TOCin×HRT] for different TOC removals within the
UV/H2O2 process in batch recirculation mode ...........................................................................118
Figure 4.31. TOC removal in SSWW using combined anaerobic-aerobic-UV/H2O2 processes at
different HRTs in continuous mode without recycling. Error bars represent standard deviations.
....................................................................................................................................................120
Figure 4.32. TN removal in SSWW using combined anaerobic-aerobic-UV/H2O2 processes at
different HRTs in continuous mode without recycling. Error bars represent standard deviations.
....................................................................................................................................................121
Figure 4.33. Maximum values on TOC removal in SSWW using combined anaerobic-aerobic-
UV/H2O2 processes in continuous mode without recycling. .....................................................122
Figure 4.34. Maximum values on TN removal in SSWW using combined anaerobic-aerobic-UV/H2O2
processes in continuous mode without recycling. ......................................................................123
Figure 4.35. Comparison of TOC removal using different alternatives in continuous mode without
recycling, including UV/H2O2 process alone, ABR process alone, aerobic AS process alone,
combined anaerobic-aerobic processes, combined aerobic-anaerobic processes, and combined
anaerobic-aerobic and UV/H2O2. ...............................................................................................124
Figure 4.36. Comparison of TN removal using different alternatives in continuous mode without
recycling, including UV/H2O2 process alone, ABR process alone, aerobic AS process alone,
combined anaerobic-aerobic processes, combined aerobic-anaerobic processes, and combined
anaerobic-aerobic and UV/H2O2. ...............................................................................................125
Figure 4.37. CBOD5 concentration profile for different SSWW effluents from different processes in
continuous mode without recycling, including UV/H2O2 process alone, ABR process alone,
aerobic AS process alone, combined anaerobic-aerobic processes, combined aerobic-anaerobic
processes, and combined anaerobic-aerobic and UV/H2O2. Error bars represent standard
deviations. ..................................................................................................................................127
Figure 4.38. CBOD5 removal in SSWW using different alternatives in continuous mode without
recycling, including UV/H2O2 process alone, ABR process alone, aerobic AS process alone,
combined anaerobic-aerobic processes, combined aerobic-anaerobic processes, and combined
anaerobic-aerobic and UV/H2O2. ...............................................................................................128
xv
Figure 4.39. Correlation between CBOD5 and TOC in SSWW using different alternatives in
continuous mode without recycling, including UV/H2O2 process alone, ABR process alone,
aerobic AS process alone, combined anaerobic-aerobic processes, combined aerobic-anaerobic
processes, and combined anaerobic-aerobic and UV/H2O2. ......................................................129
Figure 4.40. TOC removal comparison of the predicted values using Equation (4.7) and the
experimental data of the SSWW treatment using ABR process alone in continuous mode
without recycling. .......................................................................................................................132
Figure 4.41. TOC removal comparison of the predicted values using Equation (4.12) and the
experimental data of the SSWW treatment using aerobic AS process alone in continuous mode
without recycling. .......................................................................................................................134
Figure 4.42. TOC removal comparison of the predicted values using Equation (4.14) and the
experimental data of the SSWW treatment using combined anaerobic-aerobic processes in
continuous mode without recycling. ..........................................................................................136
Figure 4.43. TOC removal comparison of the predicted values using Equation (4.16) and the
experimental data of the SSWW treatment using combined aerobic-anaerobic processes in
continuous mode without recycling. ..........................................................................................137
Figure 4.44. TOC removal comparison of the predicted values using Equation (4.29) and the
experimental data of the SSWW treatment using UV/H2O2 process alone in continuous mode
without recycling. .......................................................................................................................143
Figure 4.45. TOC removal comparison of the predicted values using Equation (4.30) and the
experimental data of the SSWW treatment using combined anaerobic-aerobic and UV/H2O2
processes in continuous mode without recycling. ......................................................................144
Figure 4.46. Mineralization under different processes, ABR process alone, aerobic AS process alone,
UV/H2O2 process alone, combined anaerobic-aerobic processes, combined aerobic-anaerobic
processes, and combined anaerobic-aerobic and UV/H2O2 processes. ......................................158
Figure 4.47. Operation costs per kilogram of TOC removed for each process as a function of TOC
removal. (a) ABR process alone, aerobic AS process alone, combined anaerobic-aerobic
processes, combined aerobic-anaerobic processes, and combined anaerobic-aerobic and
UV/H2O2 processes; (b) UV/H2O2 process alone. .....................................................................159
Figure 4.48. Absolute operation costs compared with TOC removed for each process, ABR process
alone, aerobic AS process alone, UV/H2O2 process alone, combined anaerobic-aerobic
processes, combined aerobic-anaerobic processes, and combined anaerobic-aerobic and
UV/H2O2 processes. ...................................................................................................................160
xvi
Figure 4.49. Operational costs per m3 of treated water compared with mineralization degree:
comparison between the (a) ABR process alone, aerobic AS process alone, combined anaerobic-
aerobic processes, combined aerobic-anaerobic processes, combined anaerobic-aerobic and
UV/H2O2 processes, and (b) UV/H2O2 process alone. ...............................................................161
Figure E.1. Optimum TOC removal by using UV/H2O2 process alone. .............................................214
Figure E.2. Optimal Concentration of H2O2 for TOC removal of an influent concentration of
64.88mg/L. .................................................................................................................................215
Figure E.3. Relation of molar ratio of [H2O2]/[TOC] for an influent concentration of 64.88mg/L. ...215
Figure E.4. Optimal Concentration of H2O2 for TOC removal of an influent concentration of
163.69mg/L. ...............................................................................................................................216
Figure E.5. Relation of molar ratio of [H2O2]/[TOC] for an influent concentration of 163.69mg/L. .216
Figure E.6. Optimal Concentration of H2O2 for TOC removal of an influent concentration of
349.84mg/L. ...............................................................................................................................217
Figure E.7. Relation of molar ratio of [H2O2]/[TOC] for an influent concentration of 349.84mg/L. .217
xvii
NOMENCLATURE
A pipe cross-sectional area (m2)
Ae aerobic
Ana anaerobic
Anox anoxic
c speed of light (2.998×10⁸ m/s)
CBOD5,in CBOD5 concentration of influent wastewater sample (mg/L)
CBOD5,out CBOD5 concentration of effluent wastewater sample (mg/L)
dn denitrification
DO0 dissolved oxygen of a diluted sample immediately taken after preparation (mg/L)
DOf dissolved oxygen of the sample after 5 days of incubation at 20C (mg/L)
dw distilled water
E Einstein unit, one mole (6.022×10²³
) of photons, regardless of their frequency
Eo standard electrode potential (V)
F feed
f ratio of the volume of Polyseed solution in glucose-glutamic acid (GGA)
G biogas production (L/h)
g growth
h Planck’s constant (6.626×10⁻³⁴
J.s)
hv quantum of radiation
HRTABR hydraulic retention time of the ABR process (h)
HRTAS hydraulic retention time of the aerobic AS process (h)
HRTUV hydraulic retention time of the UV/H2O2 process (h)
k reaction rate constant (1/M.s)
kC1 first order rate coefficient of substrate in compartment 1 of the ABR
kCi first order rate coefficient of substrate in compartment i of the ABR
ks(λ) specific rate of light absorption by TOC (E/mol.s)
KTOC half saturation constant
L length that the flow is going through or around (diameter of the pipe or tube) (m)

xviii
met methanogenic
n nitrification
N sample size
NA Avogadro’s number (6.023×10²³
)
NLRAe local nitrogen load in the aerobic zone (mgTN/L.h)
Q flow rate of influent (L/h) (m3/s)
q0 incident photon irradiance (E/cm2.s)
r nominal radius of the photoreactor (cm)
Re Reynolds number
Ri inner radius of the photoreactor (cm)
rNdn denitrification rate (mgN/L.h)
rNn nitrification rate (mgN/L.h)
rr recycle rate in the ABR, which is a percent of the flow rate of the influent (%)
rTOC overall total organic carbon removal rate (mgTOC/L.h)
rTOCAe aerobic total organic carbon removal rate (mgTOC/L.h)
rTOCAnox total organic carbon removal rate by denitrification (mgTOC/L.h)
rTOCmet methanogenic total organic carbon removal rate (mgTOC/L.h)
s sample standard deviation
So concentration of the substrate in the influent (mg/L)
S1 concentration of the substrate in compartment 1 of the ABR (mg/L)
Sf concentration of the substrate in the effluent (mg/L)
Si concentration of the substrate in compartment i of the ABR (mg/L)
Si – 1 concentration of the substrate in compartment i-1 of the ABR (mg/L)
SC1 dissolved oxygen of seed control before incubation (mg/L)
SC2 dissolved oxygen of seed control after incubation (mg/L)
t hydraulic retention time (s)
TNo initial concentration of total nitrogen (mg/L)
TOCo initial concentration of total organic carbon (mg/L)
TOCin TOC concentration of influent wastewater sample (mg/L)
TOCout TOC concentration of effluent wastewater sample (mg/L)
V volume of the sample or reactor (L)
v fluid velocity (m/s)
V1 volume of the compartment 1 of the ABR (L)

xix
VABR volume of the ABR (L)
VAe aerobic volume 1/5, 2/5 or 3/5 times Vr (L)
VAS volume of the aerobic AS reactor (L)
VBOD volume of a BOD bottle (mL)
Vi volume of the compartment i of the ABR (L)
Vr effective volume (L)
VSSo initial concentration of volatile suspended solids (mg/L)
VUV volume of the UV photoreactor (L)
W1 sum of the weights of the dried filter paper, dish and solids of the sample (mg)
W2 weight of the dried filter paper (mg)
W3 weight of the dried dish (mg)
W4 sum of the weights of the solids of the sample and the dish after burning (mg)
X specific growth rate of microorganisms
X1 biomass concentration of substrate in compartment 1 of the ABR (mg/L)
XCH4 methane molar fraction in biogas
XN2 nitrogen molar fraction in biogas
Xi biomass concentration of substrate in compartment i of the ABR (mg/L)
χi observed values of the sample items (χ1, χ2, …, χn)
Xmax maximum specific growth rate of microorganisms
mean value of the sample observations
%Nn nitrification efficiency
%TN overall total nitrogen removal efficiency
%TOC overall total organic carbon removal efficiency
Greek Letters
αλ absorption coefficient (1/cm)
ελ molar absorption coefficient of TOC (1/M.cm)
μ dynamic viscosity of the fluid (for water at 25°C, μ = 8.98×10⁻⁴
kg/m.s)
ρ density of the fluid (1000 kg/m3 for water at 25°C)
ϕ quantum yield for TOC removal (mol/E)
ϒ cells yield coefficient
xx
Acronyms
AAGBR anaerobic-aerobic granular biofilm reactor
AAIBR anaerobic-aerobic integrative baffled reactor
AASBR anaerobic-anoxic sequencing batch reactor
ABFR aerobic biofilm reactor
ACOT aerobic contact oxidation tank
ABR anaerobic baffled reactor
AdNR anaerobic denitrifying reactor
AF anaerobic filter
AFB aerobic fluidized bed
AFFFBR anaerobic fixed film fixed bed reactor
ALSR airlift suspension reactor
AnaF anaerobic filter
AnaFB anaerobic fluidized bed
AOPs advanced oxidation processes
ARB aged-refuse biological reactor
ARSBFB anaerobic reactor with sludge blanket and filter bed
AS activated sludge
ASCS aerobic solid contact system
BABS batch aerobic biological system
BAC biological activated carbon
BASR biofilm airlift suspension reactor
BAT best available technology economically achievable
BC MOE British Columbia Ministry of Environment
BCDT bubble column with a draught tube
BCR bubble column reactor
BCT best conventional pollutant control technology
BOCs biodegradable organic compounds
BOD biochemical oxygen demand
BOD5 5-day biochemical oxygen demand
BPT best practicable control technology available
CBOD5 5-day carbonaceous biochemical oxygen demand

xxi
CC/EO chemical coagulation/electrochemical oxidation
CDI capacitive deionization
CEA cost-effectiveness analysis
CEC Council of the European Communities
CFU colony-forming unit
COCs chlorinated organic compounds
COD chemical oxygen demand
CSOs combined sewer overflows
CSSs combined sewer systems
CSTRs continuous stirred tank reactors
DAF dissolved air flotation
DBPs disinfection by-products
DI deionization
DO dissolved oxygen
ECO Environmental Commissioner of Ontario
EEA European Environment Agency
EGSB expanded granular sludge bed
EHS Environmental Health and Safety
EO electrochemical oxidation
EOP electrical oxidation potential
EU European Union
EUV extreme ultraviolet light; range from 121 nm to 10 nm
FBR fixed bed biological reactor
FFB fixed film bioreactor
FBNR fixed bed nitrification reactor
FBP fluidized biofilm process
FUV far ultraviolet light; range from 200 nm to 122 nm
GRABBR granular-bed anaerobic baffled reactor
HAD heterotrophic-autotrophic denitrification
HB hybrid bioreactor
HRT hydraulic retention time
IAAFBR integrated anaerobic-aerobic fluidized bed reactor
IAAFFR integrated anaerobic-aerobic fixed film reactor
xxii
IBR immobilised biomass reactor
IJC International Joint Commission
LUV low ultraviolet light; range from 100 nm to 88 nm
MBR membrane bioreactor
MLSS mixed liquor suspended solids (mg/L)
MLVSS mixed liquor volatile suspended solids (mg/L)
MMHR methanogenic-methanotrophic hybrid reactor
MPN most probable number
MPP meat and poultry products
MPPs meat processing plants
MTE mechanical thermal expression
MUV middle ultraviolet light; range from 300 nm to 200 nm
NLR nitrogen loading rate (mgTN/L.h)
NOM natural organic matter
NSPS new source performance standards
NUV near ultraviolet light; range from 400 nm to 300 nm
OEB Ontario Energy Board
OLR organic loading rate (mgTOC/L.h)
O&M operating and maintenance costs ($)
PAHs polycyclic aromatic hydrocarbons
PC packed column
PCE tetrachloroethylene
PCP personal care products
PCR photochemical reactor
POME palm oil mill effluent
PSES pre-treatment standards for existing sources
PTA purified terephthalic acid
RAAIBB radial anaerobic-aerobic immobilized biomass bioreactor
RBC rotating biological contactors
RO reverse osmosis
SAAB simultaneous aerobic and anaerobic bioreactor
SAAMB staged anaerobic-aerobic membrane bioreactor
SBBR sequencing biofilm batch reactor

xxiii
SBR sequencing batch reactors
SCF seed correction factor (mg/L)
SFABR split fed anaerobic baffled reactor
SSWW synthetic slaughterhouse wastewater
SUV super ultraviolet light; range from 150 nm to 10 nm
TAT thermophilic aerobic treatment
TCE trichloroethylene
THMs trihalomethanes
TN total nitrogen
TOC total organic carbon
TSS total suspended solids
UAAFBIR upflow anaerobic-aerobic fixed bed integrated reactor
UASB upflow anaerobic sludge bed-blankets
UBF upflow bed filter
UN FAO Food and Agriculture Organization of the United Nations
US United States
US EPA United States Environmental Protection Agency
UV ultraviolet light
UVA ultraviolet light of long wave (black light); range from 400 nm to 315 nm
UVB ultraviolet light of medium wave; range from 315 nm to 280 nm
UVC ultraviolet light of short wave or germicidal; range from 280 nm to 100 nm
VIS visible light before UV spectrum
VSS volatile suspended solids
VUV vacuum ultraviolet light; range from 200 nm to 100 nm
WL wetland

1
CHAPTER 1
INTRODUCTION
The increasing growth of the world’s population has increased the pollution of freshwater due
to the discharge of inadequately treated industrial and municipal wastewater. Along with industrial
development, the problem increases daily, especially in developing countries (Amit and Rupali, 2004;
Leitao et al., 2006; Krishna et al., 2009; Feng et al., 2009). For this reason, water and wastewater
treatment has become very important for the continuing development of current society. Moreover,
the progressively stricter standards for effluent discharge in North America and the European Union
(EU) have made the developing of advanced wastewater treatment technologies necessary
(Environment Canada, 2000; US EPA, 2004; World Bank Group, 2007). In addition, the continuing
decreasing availability of freshwater resources has rearranged the objectives in the wastewater
treatment field from disposal to reuse and recycling. As a result, a high level of treatment efficiency
has to be achieved. Given the differences in location, economic resources, and living standards of
different countries and characteristics of water and its pollutants, many nations adopt diverse
techniques for water and wastewater treatment.
Slaughterhouses produce large amounts of wastewater during the slaughtering process and
periodic cleaning of residual particles. Although composition of slaughterhouse wastewaters varies
based on the industrial process and water demand, these wastes usually contain high levels of
organics with a large biochemical oxygen demand (BOD), chemical oxygen demand (COD), total
suspended solids (TSS), and nitrogen and phosphorus from organic materials, including pieces of fat,
grease, proteins, flesh, manure, grit, undigested feed, blood, hair and feathers (Camin, 1970; Bull et
al., 1982; Sachon, 1982; Sachon, 1986; Sayed et al., 1988; Tritt and Schuchardt, 1992; Johns, 1995;
Ruiz et al., 1997; Masse and Masse, 2000b; Sirianuntapiboon and Manoonpong, 2001; Matsumura
and Mierzwa, 2008; Debik and Coskun, 2009).
Slaughterhouse wastewaters are typically treated in anaerobic reactors because of the high
level of COD, which is used to measure the amount of organic compounds in water indirectly.

2
Nevertheless, anaerobic treatment methods have process instabilities including a low settling rate and
the need for post-treatment of the noxious anaerobic effluent, which usually contains ammonium ions
(NH4+), and hydrogen sulphide (HS
−) (Heijnen et al., 1991; Cao and Mehrvar, 2011). Although
anaerobic treatment is efficient, complete stabilization of the organic matter is not possible by
anaerobic treatment alone as the effluent produced by anaerobic treatment contains solubilised
organic matters, which are more suited for treatment using aerobic processes or anaerobic–aerobic
systems (Gray, 2005). For that reason, later post-treatment using aerobic treatment is necessary to
meet the standards (Chan et al., 2009). Moreover, for the biological removal of nutrients (N and P), an
adequate combination of anaerobic and aerobic processes is essential (Del Pozo and Diez, 2005).
According to Aggelis et al. (2001), neither anaerobic nor aerobic processes should be
employed alone for efficient treatment, since aerobic or anaerobic treatment alone does not produce
effluents that comply with effluent discharge limits when treating high organic strength wastewaters.
The use of combined anaerobic-aerobic processes can also lead to a reduction in operating costs when
compared with aerobic treatment alone (Vera et al., 1999), while simultaneously resulting in high
organic matter removal efficiency and a smaller amount of aerobic sludge without pH correction.
Benefits of the combined anaerobic-aerobic processes include potential resource recovery as
anaerobic pre-treatment removes most of the organic pollutants and converts them into biogas and
high overall treatment efficiency due to aerobic post-treatment (Frostell, 1983; Cervantes et al.,
2006).
Biological treatment of wastewater is usually the most cost-effective technology (Pittier and
Chudoba, 1990; Ruiz et al., 1997; Barber and Stuckey, 1999; Pulgarín et al., 1999; Masse and Masse,
2000b; Sarria et al., 2003; Al-Mutairi et al., 2008; Edalatmanesh et al., 2008; Krishna et al., 2009;
Chan et al., 2009; Oller et al., 2011). However, industrial effluents and slaughterhouse wastewaters
contain toxic and non-biodegradable organic substances, which make biological treatment alone
insufficient (Steber and Wierich, 1986; Bowers et al., 1989; Adams et al., 1996; Pulgarín and Kiwi,
1996; García et al., 2001; Muñoz and Guieysee, 2006; Lapertot et al., 2006; Oller et al., 2011). As a
result, advanced oxidation processes (AOPs) have been used to improve the biotreatability of
wastewaters containing non-biodegradable organics, which are toxic to common microorganisms.
AOPs are related to the production of hydroxyl radicals (•OH) (Balcioglu et al., 2001; Bhatkhande et
al., 2002; Neyens and Baeyens, 2003; Gonze et al., 2003; Sarria et al., 2003; García-Montaño et al.,
2006; Sarria et al., 2009), which have a very high oxidation potential and are able to oxidize almost

3
all organic pollutants (Gogate and Pandit, 2004a; Gogate and Pandit, 2004b; Devipriyas and
Yesodharan, 2005; Pignatello et al., 2006; Pera-Titus et al., 2007; Comninellis et al., 2008; Shannon
et al., 2008). Although these methods are very effective in wastewater treatment, they are expensive if
applied alone. Therefore, a good alternative is to combine biological treatment and AOPs.
Objectives
The objectives of this study are to determine the efficiency of the combined anaerobic-aerobic
and UV/H2O2 processes for the treatment of slaughterhouse wastewater; to evaluate the performance
of a complementary aerobic treatment for biological nutrient removal by nitrification and
denitrification; to evaluate the effectiveness and performance of different configurations of the
combined processes, varying the number of phases and their order as a system; and to analyze the
factors affecting its performance, the characteristics of slaughterhouse wastewater including its
impacts on the environment and health effects, and the current standards and regulations for its
discharge. In summary the objectives of the present study are:
1. To determine the performance and the treatment ability of the ABR, the aerobic AS, and the
UV/H2O2 processes, as well as their combination in the removal of TOC, TN, and BOD from
SSWW.
2. To evaluate the effects of hydraulic retention time (HRT) and influent concentrations of SSWW to
the reactors on their performance.
3. To determine the optimal concentration of H2O2 and the optimum molar ratio dosage for TOC
removal in a secondary effluent of SSWW.
4. To use a cost-effectiveness analysis (CEA) in order to determine the best alternative, by
evaluating the total electricity cost, the effects of the HRT, the cost of H2O2 consumption, and the
percentage of removal of TOC.

4
CHAPTER 2
LITERATURE REVIEW
2.1. Introduction
This chapter provides a comprehensive review of slaughterhouse wastewater treatment
processes including anaerobic baffled reactors (ABR), aerobic activated sludge (AS), and UV/H2O2 as
well as the factors affecting their performance and a description of their mechanisms. This chapter
also reviews the characteristics, environmental impacts, health effects, and regulatory framework,
including the current technologies, relevant to slaughterhouse wastewater.
2.2. Slaughterhouse wastewater characteristics
The treatment and disposal of wastewater from slaughterhouses and meat processing plants
(MPPs) are an economic and public health necessity. The main source of slaughterhouse wastewater
are the feces, urine, blood, lint, fat, carcasses, non-digested food in the intestines, the leftovers, the
slop from the floors, utensils, the removal of bristles, storage of skins, the cleaning of bowels, guts
room and laundry produced when slaughtering animals (Muñoz, 2005).
Slaughterhouse wastewater is considered detrimental worldwide due to its composition,
characterized mostly by a complex mixture of fats, proteins and fibres (Camin, 1970; Bull et al.,
1982; Sachon, 1982; Sachon, 1986; Sayed et al., 1988; Tritt and Schuchardt, 1992; Johns, 1995).
Wastewaters from slaughterhouses and MPPs have been considered as an industrial waste in the
category of agricultural and food industries and classified as one of the most harmful to the
environment by the United States Environmental Protection Agency (US EPA) (Walter et al., 1974).
Effluent discharge from slaughterhouses causes deoxygenation of rivers (Quinn and McFarlane,
1989) and contamination of groundwater (Sangodoyin and Agbawhe, 1992; Masse and Masse,
2000b). The organic matter concentration is medium to high and the residues are moderately
solubilised, leading to a highly polluting effect (Ruiz et al., 1997). They usually contain high levels of
organics, pathogenic and non-pathogenic viruses and bacteria, and detergents and disinfectants used
for cleaning activities (Bull et al., 1982; Ruiz et al., 1997; Masse and Masse, 2000b; Debik and

5
Coskun, 2009). High concentrations of BOD, COD and TSS in slaughterhouse wastewater containing
flesh and blood have been reported to be 200,000, 375,000 and 2,800 mg/L or more, respectively
(Tritt and Schuchardt, 1992; Masse and Masse, 2000a).
Several studies have described the common characteristics of slaughterhouse wastewater
(Gariepy et al., 1989; Masse and Masse, 2000a; Seif and Moursy, 2001; Debik and Coskun, 2009;
Cao, 2009; Cao and Mehrvar, 2011; Barrera, 2011; Barrera et al., 2011). These characteristics are
summarized in Table 2.1, in which their common ranges and averages for slaughterhouse wastewater,
including COD, TOC, BOD, TSS, TN, and pH among others are presented.
Table 2.1. Characteristics of slaughterhouse wastewater.
(Adapted from Debik and Coskun, 2009; Cao, 2009; Rajakumar et al., 2011; Barrera, 2011).
Parameter Range Average
TSS (mg/L) 300–2800 1164
COD (mg/L) 1250–15900 4221
BOD (mg/L) 610–1905 1209
N-NH4 (mg/L) 14–169 41
P-PO4 (mg/L) 1.30–80 19
Proteins (mg/L) 444–10000 2503
N-NH3 (mg/L) 50–475 180
Oils and Greases (mg/L) 25–170 92
NOx (mg/L) 0.30–0.96 0.63
TN (mg/L) 50–785 427
Alkalinity (mg/L) 50–2100 450
TOC (mg/L) 100–1200 546
S-Sulphate/Sulphur (mg/L) 21–970 505
Temperature (°C) n/a 35
pH 4.90–8.10 6.95
C/N 6.00–15 10
2.2.1. Slaughterhouse wastewater occurrence
Slaughterhouses are MPPs, where a variety of animals including cattle, hogs and poultry are
slaughtered for human consumption and animal feeding operations (Wang et al., 2010). The meat
processing industry is one of the major consumers of fresh water among industrial food processing
facilities, as shown in Table 2.2, which makes it a significant producer of wastewater effluents. The
World Bank classifies a slaughterhouse plant as a meat processing facility that may consume between
2.5 and 40 m3 of water per metric tonnes of beef produced (World Bank, 1999).

6
Table 2.2. Fresh water consumption in different sectors of the US food and beverage
manufacturing.
(Adapted from Wang et al., 2010).
Food Industry %Water Consumption
Meat Processing 23.9
Beverages 12.7
Dairy 12.1
Other Food 10.9
Fruits and Vegetables 10.1
Bakery and Tortilla Products 9.6
Grain and Oilseeds 9.0
Sugar and Confectionary 5.2
Animal Food 4.9
Seafood 1.6
The production of beef has been growing steadily in recent years mostly in India and China
due to income increases and the shift toward a western-like diet rich in proteins (Halweil, 2008).
From 2002 to 2007, the global annual production of beef increased 14.7 million tonnes, representing
an increase of 29% over 8 years (UN FAO, 2010). As a result, it can be inferred that the number of
slaughterhouse facilities will get bigger, resulting in a greater volume of high-strength wastewater to
be treated. Therefore, this growing industry will require reliable and effective technologies to treat
these effluents properly before being discharged into source waters to minimize negative
environmental impacts. Moreover, there is an additional problem specifically related to aging
infrastructure, which may add to the potential risk of untreated wastewater reaching receiving waters.
According to the International Joint Commission (IJC) (2009), the collection systems responsible for
transporting wastewater to sewage treatment plants in some parts of North America were constructed
back in the 19th
century and many of them have not been upgraded and are beyond the capacity for
which they were originally designed. These collection systems have been designed to work as
combined sewer systems (CSSs); therefore, domestic, commercial, industrial and storm-water are all
transported through the same pipe connected to the water treatment facility.
The main problem of the CSSs is the overflow due to the wet-weather periods of heavy
rainfall and snowmelt, when the pipes cannot handle the large volumes of water being driven into the
system thereby exceeding its capacity, and resulting in a direct dumping of the combined raw sewage
and storm-water into the receiving water bodies. As a result, massive loads of organic matter,

7
microorganisms and pathogens, chemicals, pharmaceuticals, and personal care products, as well as
toxic and hazardous compounds from industrial sources could reach water bodies without proper
treatment (Nemerow, 2007). Most of the remaining CSSs in North America are located in the
Northeast part of the continent, particularly within the Great Lakes region. About 70% of the CSSs
located in the US territory are found surrounding the Great Lakes. Meanwhile, in Canada, 20% of
Ontario municipalities have CSSs representing a potential risk for overflow events to occur (IJC,
2009). According to the International Joint Commission (IJC) (2009), several Combined Sewer
Overflow (CSO) events have been reported in the last decade near Great Lakes communities in
Ontario. For instance, 107 confirmed CSOs with 1,544 releases of raw or partially treated sewage
were reported in 2006. A recent report on pollutant sources affecting the Great Lakes stated that the
CSO events are a major problem for the Saint Clair River water quality due to the constant discharges
of raw sewage from the Sarnia sewer system during CSO events (USACE, 2004).
There are approximately 142 slaughterhouses in Ontario that can process a certain number of
animals per day (Table 2.3). On-site treatment would be the best option to treat and disinfect the
effluents, so they could then be discharged safely into receiving waters. Thus, the transportation of the
water through the sewer system into the municipal wastewater treatment facilities would be avoided,
minimizing the risk of raw water releases during overflow events. According to Wu and Mittal
(2011), 53% of Ontario’s slaughterhouses did not treat their wastewater prior to disposal (Figure 2.1).
Only 16% of Ontario’s slaughterhouses used dissolved air floatation (DAF) or aeration. The
remaining 31% of slaughterhouses utilized passive systems such as storage tank or lagoon to settle
solids. 6% of the slaughterhouses did not store the wastewater, and the drainage of these
slaughterhouses was directly connected to the sewage treatment plant (STP). 80% of the
slaughterhouses stored the wastewater in a retention tank prior to disposal and the remaining
slaughterhouses stored the wastewater in lagoons or ponds. The sizes of these tanks varied from 3,000
to 750,000 L. 15% of the slaughterhouses disposed the wastewater at the STP. 9% of the
slaughterhouses were directly connected to the STP and 6% of them used a hauler to haul the
wastewater to the STP. 11% of the slaughterhouses used leaching bed for the disposal of the
wastewater. An additional 21% used both the leaching bed and haulers to dispose of the wastewater.
43% of the slaughterhouses land applied the wastewater. Of the 43% that land applied, 33% of them
used hauler to land apply the wastewater. 53% of them land applied the wastewater on premises and
the remaining 14% land applied elsewhere.

8
Table 2.3. Provincially licensed meat plants in Ontario.
(Adapted from OMAFRA, 2011).
Plant Name Address City Postal Code Latitude Longitude
Alvinston Custom Butchering Ltd. 3099 Broadway Street, PO Box 416 Alvinston N0N1A0 42.8129 -81.8648
Brennan Poultry 7109 Mosside Line Alvinston N0N1A0 42.7330 -81.9368
Barron Poultry Limited 7470 Essex County Road 18 Amherstburg N9V2Y7 42.0972 -83.0097
Domingos Meat Packers Ltd. 7396 W Garafraxa 3rd Line Arthur N0G1A0 43.8301 -80.4740
Abate Packers 7597 Jones Baseline Arthur N0G1A0 43.8231 -80.5240
Wellington Poultry Ltd. 7514 Wellington Road 109, RR 4 Arthur N0G1A0 43.8358 -80.6158
Athens Meat Packers 63 Addison Road Athens K0E1B0 44.6448 -75.9105
Johnson Meats RR 4, 49801 Glen Colin Line Aylmer N5H2R3 42.7925 -80.9691
Springwater Packers RR 5, 9040 Springwater Rd. Aylmer N5H2R4 42.7665 -81.0311
Louro Bros. Meats Ltd. RR 1, 1142 Reidsville Rd Ayr N0B1E0 43.2806 -80.4261
Beeton Meats 233 Patterson Street North, PO Box 208 Beeton L0G1A0 44.0880 -79.7827
Belle Vallé Meats and Abattoir 982125 Belle Valle Road Belle Valle P0J1M0 47.6542 -79.6058
Valley Poultry Packers 3134 Main Street Blezard Valley P0M1E0 46.6095 -81.0688
Al Madina Halal Meat Packers 3944 County Road #1, RR 1 Brinston K0E1C0 44.9285 -75.4208
Northern Quality Meats Ltd 290 Deplonty Road Bruce Mines P0R1C0 46.3331 -83.8539
The Chicken Coup 1302 Garage Road Burk's Falls P0A1C0 45.6358 -79.3083
Hay's Custom Cutting 2958 4th Line, RR 5 Campbellford K0L1L0 44.3064 -77.6740
Ranchland Meats Ltd. 2021 Bruce Road #3, RR 1 Cargill N0G1J0 44.1987 -81.2239
Hanson Meats 4643 Highway #3, RR 4 Cayuga N0A1E0 42.9422 -79.8938
Tom Henderson Custom Meat Cutting RR 2, 13200 McKenzie Rd. Chesterville K0C1H0 45.0279 -75.2063
Valtoudis Meat Packers 600 Concession 9, RR 6 Claremont L1Y1A3 43.9602 -79.1860
Bilal Farms Inc. 1924 Landry Clarence Creek K0A1N0 45.4972 -75.2146
Whitmore Meat Packers Ltd. 3765 Line 12 N, RR 2 Coldwater L0K1E0 44.6196 -79.5530
Desormeaux Meats Incorporated 1 Queen Street, PO Box 112 Crysler K0A1R0 45.2187 -75.1536
Zehr's Country Market 70963 Bronson Line Dashwood N0M1N0 43.3351 -81.6341
Peel Sausage Inc. RR 2 Drayton N0G1P0 43.7008 -80.6812
Dresden Meat Packers Limited R.R. #2, 78 Hwy, 10210 McCreary Line Dresden N0P1M0 42.6010 -82.1853
Hiview Packers RR 1 Dundalk N0C1B0 44.1262 -80.6028
Dundalk Poultry Processing 126815 Southgate Road 12 Dundalk N0C1B0 44.1119 -80.3944
Hunters Dressed Meats RR 8, 1834 Hutchinson Road Dunnville N1A2W7 42.9576 -79.5593
ENS Poultry Inc. 6424 8th Line Pilkington Elora N0B1S0 43.6385 -80.4673
Miedema's Meat Market Ltd. 129 Huron Street Embro N0J1J0 43.1550 -80.9014
Abattoir Brisson Ltd. 1100 St. André Embrun K0A1W0 45.2661 -75.3090
Rainy River District Regional Abattoir Inc. Box 299, 26 Byng Street Emo P0W1E0 48.6362 -93.8371

9
Plant Name Address City Postal Code Latitude Longitude
Miedema's Country Meats 41130 Thames Road East Exeter N0M1S5 43.3624 -81.4774
Rua Meats Ltd. 275 Frankford Road, RR 1 Foxboro K0K2B0 44.2336 -77.4452
J.R. Meats 275 Frankford Road, RR 1 Foxboro K0K2B0 44.2340 -77.4451
Agram 2005 Meats Inc. 10676 Trafalgar Road Georgetown L7G4S5 43.6191 -79.9142
L & M Meat Distributing 2487 14th Line Gilford L0L1R0 44.1965 -79.6001
Metheral Meats RR 1, 9093 6/7 Nottawasaga Side Rd. Glen Huron L0M1L0 44.2954 -80.1874
The Burt Farm 1295 Tenth Line Gore Bay P0P1H0 45.9146 -82.3677
Schefter Poultry Processing 44783 Harriston Road Gorrie N0G1X0 43.8803 -81.0675
Sheik Halal Farms Inc. 193064 Amaranth East Luther Townline Grand Valley L0N1G0 43.8835 -80.2995
Wayne's Meat Products Inc. RR 1, 8794 Indian Line Hagersville N0A1H0 42.9770 -80.0934
Lowbank Farms Ltd. 4510 Hwy 6 Hagersville N0A1H0 42.9968 -80.0195
Bentinck Packers Limited 381488 Concession 4 NDR, RR 3 Hanover N4N3B9 44.1957 -80.9812
Harriston Packing Co. Ltd. 142 Arthur Street Harriston N0G1Z0 43.9088 -80.8765
Metzger Meat Products 180 Brock Avenue Hensall N0M1X0 43.4365 -81.5115
Highgate Tender Meats Ltd. 14680 Hastings Line Highgate N0P1T0 42.5109 -81.8233
Town And Country Farms 13018 Steeles Avenue Hornby L0P1E0 43.5680 -79.8405
Everspring Farms Ltd. 22370 Adelaide Street North, RR 3 Ilderton N0M2A0 43.0928 -81.2841
Miky's Smoke House 32 Hamann Road Joques P0L1R0 49.5974 -83.7449
Wallace Beef Inc. 3766 Hwy. 15 Joyceville K0H1S0 44.3577 -76.3483
The Beef Way (1997) RR 2, 2034 Hwy 21 Kincardine N2Z2X4 44.2022 -81.5935
Lynch's Slaughterhouse 32 Holland Road, RR 1 Lansdowne K0E1L0 44.4047 -75.9595
Gord's Abattoir Ltd. 643 Hwy 77, RR 5 Leamington N8H3V8 42.1035 -82.6028
Abattoir LeFaivre 122 County Rd 15 Lefaivre K0B1J0 45.6368 -74.8987
Len & Patti Butcher Block 2133 Little Britain Road Lindsay K9V4R2 44.3250 -78.7492
Cornell Meats 7086 Pack Road London N6P1M1 42.9256 -81.3181
Buchler Farms And Abattoir 186 Horner Rd. Magnetawan P0A1P0 45.4002 -79.3567
Weston Abattoir Ltd. 5409 North Talbot Road Maidstone N0R1K0 42.2303 -82.9382
Grey County Meats RR 1 Maxwell N0C1J0 44.3047 -80.4237
Elora Road Meats RR 1 Mildmay N0G2J0 44.0760 -81.1821
Ontario Halal Meat Packers 5593 Highway #25 Milton L9T2X5 43.4826 -79.8266
Sargent Farms Ltd. 61 Garden Lane Milton L9T2P7 43.5134 -79.8854
Laplante Poultry Farms Ltd/Ferme Avicole Laplante Ltée 17141 Rombough Road Monkland
45.1781 -74.8850
Mount Brydges Abattoir Ltd. 21618 Adelaide Road Mount Brydges N0L1W0 42.9036 -81.4381
Berube Poultry 10135 McIntyre Road Mountain K0E1S0 44.9916 -75.5033
Thunder Bay Meat Processing Company (1986) Limited 4754 Oliver Road Murillo P0T2G0 48.4212 -89.4712
Bearbrook Farm Abattoir 8411 Russell Road, RR 3 Navan K4B1J1 45.3824 -75.3536
Clement Poultry & Sons 85 Lovekin Road, RR 8 Newcastle L1B1L9 43.9097 -78.6153

10
Plant Name Address City Postal Code Latitude Longitude
Newmarket Meat Packers Ltd. 15452 Warden Avenue Newmarket L3Y9E5 44.0262 -79.3716
Norwich Packers Limited 11 Robson Street Norwich N0J1P0 42.9775 -80.5983
Hilts Butcher Shop Ltd. 1948 7th Line, Asphodel, RR 3 Norwood K0L2V0 44.3479 -77.9986
Manilla Halal Meats 18619 Simcoe St. Oakwood K0M2M0 44.3269 -78.9957
Gerald Gemus & Sons Ltd. 6130 Snake Lane Oldcastle N0R1L0 42.2106 -82.9411
Morrison Custom Poultry Processing Ltd. 3711 Lindsay Highway, RR 3 Omemee K0L2W0 44.2925 -78.5882
Matar Meats 2690 Stagecoach Rd., RR 1 Osgoode K0A2W0 45.1916 -75.5683
Hafiz Halal Poultry Inc. 116 Bloor Street East Oshawa L1H3M2 43.8815 -78.8516
Country Meadow Meats 122242 Sideroad 12, RR 3 Owen Sound N4K5N5 44.5323 -80.9885
Ideal Meat Packers Ltd. RR 4 Owen Sound N4K5N6 44.5650 -80.9273
Griffiths Country Meats 60 Griffiths Road Oxdrift P0V2J0 49.8059 -93.0041
Wall's Pork Shop 178 Wall Street Oxdrift P0V2J0 49.7557 -92.9929
Mr. Beef 223 McWatty Road Pakenham K0A2X0 45.1919 -76.1749
Mcgarroch Of Micksburg Custom Butchering 2749 Micksburg Rd., RR 3 Pembroke K8A6W4 45.6768 -77.0548
Reiche Meat Products Ltd. 555 Reiche Rd., RR 3 Pembroke K8A6W4 45.6689 -77.1038
Smokey Joe's 7949 Hwy #7 Peterborough K9J6X3 44.3114 -78.4334
Otonabee Meat Packers Ltd. RR 7, 2043 Drummond Line Peterborough K9J6X4 44.2906 -78.2413
Weiland Meats Ltd. 340 Centre Street Petrolia N0N1R0 42.8855 -82.1483
Cole Bros. Meat Processing 134 Old Milford Rd, RR 9 Picton K0K2T0 43.9986 -77.1093
Hank Dekoning Limited RR 1, 1768 Hwy #6 Port Dover N0A1N3 42.8191 -80.1497
Prime Cut Meats 4311 Mastwood Road Port Hope L1A3V7 43.9841 -78.3897
Windcrest Meat Packers 1350 Scugog - 3rd Line Port Perry L9L1B3 44.0520 -78.9590
Bill's Turkey Farm Ltd. 2978 Holborn Rd. Queensville L0G1R0 44.1698 -79.4067
Bennett Abattoir 1984 Hwy, 572 Ramore P0K1R0 48.4655 -80.3179
Town and Country Meats and Abattoir 19950 Hill Road Ridgetown N0P2C0 42.4259 -81.8702
Taylor's Custom Meats 11544 Northumberland Rd. 29, RR 4 Roseneath K0K2X0 44.1406 -78.0581
Russell Slaughter House 424 Castor Street Russell K4R1E5 45.2643 -75.3398
Doug's Meats RR 3 Schomberg L0G1T0 43.9643 -79.6924
J J Meat Distributing Inc. 14600 10th Concession, RR 3 Schomberg L0G1T0 43.9339 -79.6859
Fiore Game Farm 7255 Highway #9, RR 1 Schomberg L0G1T0 44.0009 -79.7194
Pine Ridge Packers (2003) Lot 6, Conc 5, Durham Region Scugog Twp L0B1B0 44.1094 -78.8643
King Capon Ltd. 18347 Warden Avenue Sharon L0G1V0 44.0980 -79.3850
Horizon Meat Packers Inc. Con 7 E Pt Lot 27, Farm #335424 Shelburne L0N1S5 44.0450 -80.2690
V. G. Packers Limited RR 5, 966 Woollen Mill Rd Simcoe N3Y4K4 42.8460 -80.2210
Townsend Butchers Inc. RR 4, 419 Conc. 14 Simcoe N3Y4K3 42.8636 -80.2755
Rideau Meats 12090 Highway 15, RR 6 Smith Falls K7A4S7 44.9271 -76.0281
Sanabil Halal Meat Farm 5309 Spring Creek Road Smithville L0R2A0 43.1036 -79.4882

11
Plant Name Address City Postal Code Latitude Longitude
A.S. Poultry 7611 Kimbo Road Smithville L0R2A0 43.1245 -79.6085
Sprucedale Quality Meats Inc. RR 1, 438 Fourth Avenue Sprucedale P0A1Y0 45.4378 -79.4377
Julius Meat Packers Inc. 2340 Patterson Road, RR 1 St. Ann's L0R1Y0 43.0776 -79.5256
Kingma Meat Products Limited 1150 Regional Road 27 - RR 2 St. Ann's L0R1Y0 43.0221 -79.5014
CRO Quail Farms Inc. 3625 Sixteen Road St. Ann's L0R1Y0 43.0787 -79.5256
Reist & Weber Butchering Custom Killing & Whole Sales Pork RR 1 St. Jacobs N0B2N0 43.5447 -80.5730
Norfolk Packers RR 2, 4051 Lakeshore Road St. Williams N0E1P0 42.6599 -80.4340
Joe Savage & Fils Abattoir Inc. C.P. 28 - 113 Rue Principale St-Albert K0A3C0 45.2546 -75.1242
Stayner Meat Packers Ltd. 352 Warrington Road Stayner L0M1S0 44.4062 -80.0600
Hastings County Meat Packers Inc. 570 Moira Rd, RR 2 Stirling K0K3E0 44.3441 -77.4531
Highland Packers Ltd. 432 Highland Road East Stoney Creek L8J3G4 43.1348 -79.7538
King Cole Ducks Ltd. 15336 Warden Avenue Stouffville L4G3H3 44.0251 -79.3712
Ralph Bos Meats Ltd. 3742 Egremont Drive Strathroy N7G3H6 43.0052 -81.6178
Lindsay Zabiha Meat Packer S1255 Durham Road #13 Sunderland L0C1H0 44.2290 -79.0423
Blackwater Halal meat Ltd. S1255 Durham Road 13 Sunderland L0C1H0 44.2290 -79.0423
Mogk's Butcher Shop RR 2, 516702 East Zorra Tavistock N0B2R0 43.2702 -80.8482
Tilbury Abattoir 4049 Bonneau Line Tilbury N0P2L0 42.2708 -82.3887
Cargill Foods Toronto 71 Rexdale Blvd Toronto M9W1P1 43.7131 -79.5611
St Ann's Foods Inc. 145 Bethridge Rd Toronto M9W1N4 43.7073 -79.5819
Cmp Meats 2255 St Clair Ave W Toronto M6N1K8 43.6703 -79.4777
Quality Meat Packers Limited 2 Tecumseth St, Suite 1 Toronto M5V2R5 43.6408 -79.4044
Corsetti Meat Packer Limited 2255 St Clair Ave W Toronto M6N1K8 43.6703 -79.4777
Meat Express 328 Passmore Ave, Unit 2 Toronto M1V3N8 43.82.81 -79.2627
Maple Leaf Foods Inc. 550 Kipling Ave Toronto M8Z5E9 43.6144 -79.5242
N & H Food Co Limited 125 Union St, Unit 2 Toronto M6N3N4 43.6796 -79.4683
Maple Leaf Foods Inc. 30 St Clair Ave W, Suite 1500 Toronto M4V3A1 43.6879 -79.3951
Elbee Meat Packers Limited 1 Glen Scarlett Rd Toronto M6N1P4 43.6747 -79.4730
Kam Li Food Co Ltd 229 Broadview Ave Toronto M4M2G7 43.6621 -79.3512
International Food Centre Ltd 1415 Bloor St W Toronto M6P3L4 43.6572 -79.4476
1243275 Ontario Inc. 33 Terry Dr Toronto M6N3T4 43.6732 -79.4832
Genesis Meat Packers Inc. 70 Glen Scarlett Rd Toronto M6N1P4 43.6746 -79.4740
Dean Butcher Shop 30 Dean Park Rd Toronto M1B5S6 43.8039 -79.1696
Northern Meat Packers and Abattoir Ltd. 266 McFadden Line, Box 175 Trout Creek P0H2L0 45.9610 -79.3787
Willie's Meats Ltd. 2387 4th Conc. West, RR 1 Troy L0R2B0 43.2789 -80.2013
Palmateer's Abattoir Ltd. 2553 River Street West Tweed K0K3K0 44.4697 -77.3302
Vanessa Meats & Deli Inc. RR 3, 1728 Reg. Rd. #19 Vanessa N0E1V0 42.9684 -80.3873
Walkerton Meat Market 963 Old Durham Road Walkerton N0G2V0 44.1363 -81.1349

12
Plant Name Address City Postal Code Latitude Longitude
Country Poultry Processing RR 2 Wallenstein N0B2S0 43.6718 -80.6733
Bachert Meats Inc. (2006) RR 1, 43181 Blyth Road Walton N0K1Z0 43.6667 -81.2795
Creative Meats RR 1 Warren P0H2N0 46.4513 -80.3995
Millgrove Packers Limited RR 2, 549 Conc. 5 W. Waterdown L0R2H2 43.3333 -79.9816
Lloyd Miedema & Sons RR 5, 1812 Thompson Road East Waterford N0E1Y0 42.9428 -80.1709
Niagara Sausage & Meat Products Limited RR 4, Ridge Road Welland L3B5N7 42.9753 -79.2184
Aman's Abattoir 286 Main Street, PO Box 177 Wellington K0K3L0 43.9520 -77.3516
Charles Quality Meats RR 1 Wilmot N0B2L0 43.4487 -80.6247
Green's Meat Market And Abattoir Ltd. 237 Arthur Street Wingham N0G2W0 43.8973 -81.3130
Ewedell Farms 1282 Oriole Park Drive Woodslee N0R1V0 42.2318 -82.7367
Lambton Meat Products 5814 Minielly Road Wyoming N0N1T0 42.9808 -82.0934
Brian Quinn's Meats Ltd. 3987 County Rd. #1, RR 2 Yarker K0K3N0 44.3620 -76.7770

13
Figure 2.1. Wastewater treatment methods used by slaughterhouses.
(Adapted from Wu and Mittal, 2011).
53%
22%
14%
7%
2% 2%
No treatment
Lagoon
Dissolved Air Floatation
(DAF)
Storage
Aeration Treatment
Storage and lagoon

14
2.2.2. Slaughterhouse wastewater guidelines and regulations
Regulations and guidelines are essential components in dealing with the environmental impact
of slaughterhouse industries. The treatment systems developed by industry are frequently regarded as
a regulatory obligation, increasing capital and running costs, and yielding negative economic returns.
Compliance with environmental legislation should not necessarily lead to the creation of additional
costs, but can instead provide a secondary source of income. The standards and regulations governing
slaughterhouses vary considerably around the world. In many countries, the slaughter of animals is
regulated by custom and tradition rather than by law. Two main kinds of meat processing systems are
available, one that is produced in modern mechanized slaughterhouses and the other from local
butcher shops.
The selection of a particular treatment depends on the characteristics of the wastewater, the
available technology, and the compliance with current regulations. For instance, some MPPs are
allowed to discharge their effluent into the municipal sewer system after demonstrating an adequate
reduction of BOD loads by preliminary treatment (Tchobanoglous et al., 2003). The main factors
determining whether a plant can discharge into the municipal sewer or not are related to the plant size
as well as the volume and organic concentration of the wastewater produced (US EPA, 2004).
A major concern with MPP’ effluent is related to the discharge of oxygen-demanding
constituents into receiving water bodies. Regulatory agencies in North America such as the U.S. EPA,
Environment Canada and Provincial Ministries of Environment as well as the European Environment
Agency (EEA) are directing efforts at outlining standards to limit maximum concentrations of
oxygen-demanding compounds, especially concentrations of BOD and COD, being discharged
directly or indirectly into water bodies (CEC, 1991; US EPA, 2004). Table 2.4 describes the standard
levels and concentration limits of organic constituents to be discharged into water bodies as
recommended by different worldwide agencies, including Environment Canada, the US EPA, the
Council of the European Communities (CEC) among others.

15
Table 2.4. Comparison of different standards for slaughterhouse wastewater discharge.
Parameter
World Bank
Standards1
EU
Standards2
US
Standards3
Canadian
Standards4
Ontario
Standards5
British Columbia
Standards6
BOD5 (mg/L) 50 25 26 Freshwater lakes, slow-
flowing streams: 5.
Rivers, streams and
estuaries: 20.
Shoreline 30.
25 45
COD (mg/L) 250 125 n/a n/a n/a n/a
TSS (mg/L) 50 35 30 Freshwater lakes, slow-
flowing streams: 5.
Rivers, streams and
estuaries: 20.
Shoreline 30.
25 60
TN (mg/L) 10 10 8 1 1.25 n/a 1 World Bank Group 2007;
2 CEC 1991;
3 US EPA 2004;
4 Environment Canada 2000;
5 ECO 2010;
6 BC MOE 2010.
Although, it can be seen that Canadian standards are very strict in comparison with other
international regulations, such as the Council of the European Communities and the US EPA, Canada
does not have a specific regulation for the meat and poultry processing industry. Nevertheless, some
provinces, such as British Columbia, have been trying to develop a set of guidelines to specifically
address MPP effluents by creating a code of practices that has been incorporated into the provincial
Environmental Management Act, brought into force in 2004 (BC MOE, 2010). Moreover, the US
EPA has been incorporating an integrated approach for the regulation of the MPP, where industry and
regulatory sectors are working together in order to achieve a common goal of reducing the threats
caused by the hazardous and high strength wastewaters produced in slaughterhouses. This approach
includes different concepts, such as the Best Practicable Control Technology Available (BPT), Best
Conventional Pollutant Control Technology (BCT), Best Available Technology Economically
Achievable (BAT), New Source Performance Standards (NSPS), and Pre-treatment Standards for
Existing Sources (PSES), for the better understanding of the procedures and regulations to follow
under any situation; and thus, efficiency and cost-reduction without affecting quality.
Table 2.5 lists all methods for the analysis of different parameters of the slaughterhouse
wastewater specified in the Ontario regulations (OMOE, 1996), including COD, BOD5, total solids
(TS), total Kjeldahl nitrogen (TKN), ammonia and ammonium nitrogen, nitrite and nitrate nitrogen,
total phosphorus (TP), total potassium (TK), total sodium, pH, the 11 metals specified in the Ontario
regulations (OMOE, 1996), and fat oil and grease (FOG).

16
Table 2.5. Methods used for analyzing various slaughterhouse wastewater parameters.
(Adapted from Wu and Mittal, 2011).
Method
number
Equivalent APHA
number Parameters
MOE-E3091 3114 Arsenic, selenium
MOE-E3181 3030F
Calcium, chromium, cobalt, copper, lead, molybdenum,
nickel, zinc
MOE-E3182 5010B BOD5
MOE-E3188 2540B Total solids
MOE-E3218 2510B Electrical conductivity, pH
MOE-E3246 5220 COD
MOE-E3301 3112B Mercury
MOE-E3217 3111B Calcium, magnesium, sodium, potassium
MOE-E3366 4500
Ammonia nitrogen, nitrite nitrogen, nitrite, nitrate
nitrogen, phosphorus
MOE-E3368 4500Norg D Total Kjeldahl nitrogen, total phosphorus
MOE* 5520D Fats, oils and greases
* No method number assigned to this method; MOE (Ministry of Environment); APHA (American Public Health
Association); Unit for all except EC and pH is mg/L.
2.2.3. Environmental impacts
The commercialization of animal products for consumption leads without doubt to the
production of high waste volumes. The environment is able to handle certain amounts of pollutants
through several natural degradation processes. Nevertheless, as the concentration of waste increases,
nature’s mechanisms come to be overburdened and contamination problems commence. Therefore,
new treatment methods have to be developed for a more efficient management of waste products.
In the slaughtering process, animals are reared, fattened, and transported. After processing, the
meat is stored before it is transported to retail outlets; these activities produce manure. Storage and
transport activities, where cooling facilities are needed, require large amounts of energy sources.
Hides produced at slaughterhouses must be stored. To prevent spoilage, they should be pickled and
preservatives are added. The methods used to process hides will determine the durability of the
produced leather. The production of more durable leather leads to smaller quantities of leather waste.
Chrome-tanned leather and leather products contain about 2–3% of dry weight chromium (Verheijen
et al., 1996). Exhausted leather products, such as shoes and jackets, are frequently dumped at
municipal dumping sites. Before its collection and transportation to a processing plant, milk is

17
produced and stored at the farm. This requires energy and leads to spoilage of milk and production of
wastewater by cleaning activities. The most important environmental impact of the animal processing
industry results from the discharge of wastewater. Most processes in slaughterhouses require the use
of water, which produce wastewater. The strength and composition of pollutants in the wastewater
evidently depend on the nature of the processes involved (Verheijen et al., 1996).
Biodegradable organic compounds (BOCs) from slaughterhouse activities have the greatest
environmental impact (Masse and Masse, 2000b). Parameters used to determine BOCs are BOD,
COD, and TSS. The BOD and COD are overall parameters that give an indication of the
concentration of organic compounds in wastewater. The concentration of suspended solids represents
the amount of insoluble organic and inorganic particles in the wastewater (Verheijen et al., 1996;
Rajakumar et al., 2011).
On February 26, 2004, the EPA established new wastewater discharge limits (Table 2.6) for
the meat and poultry products (MPP) industry, which also set effluent limits for poultry processors for
the first time that causes a reduction in discharges of conventional pollutants, ammonia, and nitrogen
to rivers, lakes, and streams (US EPA, 2004).
Table 2.6. US EPA effluent limitations for the meat and poultry products.
(Adapted from US EPA, 2004).
Regulated Parameter Maximum Daily (mg/L) Maximum Monthly (mg/L)
BOD5 26 16
TSS 30 20
NH3-N 8 4
TN 147–194 103–134
The discharge of raw slaughterhouse wastewater to water bodies can affect the quality of
water in three main ways as follows:
1. The discharge of BOCs may cause a strong reduction of DO, which in turn may lead to reduced
levels of activity or even death of aquatic life (Quinn and McFarlane, 1989; Sangodoyin and
Agbawhe, 1992; Verheijen et al., 1996; Masse and Masse, 2000b; Torkian et al., 2003).

18
2. Macronutrients (N and P) may cause eutrophication of the receiving water bodies; while
phosphates (PO42–) are the primary source of eutrophication; nitrogenous wastes contribute
significantly to this water pollution problem. These nutrients cause an excessive algae growth and
subsequent dying off. The mineralization of these algae may lead to the death of aquatic life
because of oxygen depletion (Masse and Masse, 2000b; Belsky et al., 1999).
3. Finally, slaughterhouse wastewater effluents may contain compounds, such as chromium and
unionized ammonia, which are directly toxic to aquatic life, as well as tannin, which is an
astringent, bitter plant polyphenolic compound (Figure 2.2) that binds to and precipitates proteins
and various other organic compounds including amino acids and alkaloids (Verheijen et al.,
1996).
On the other hand, several studies show the impact of wastewater effluents loaded with high
amounts of organic constituents on recipient water bodies. For example, the Ikpoba River in Nigeria
is an example of water quality decrease. The river has being affected by high coliform concentrations
stemming from discharged slaughterhouse wastewater. As described by Benka-Coker and Ojior
(1995), the pathogenic bacteria concentration, including species such as Escherichia coli, Salmonella,
Shigella, Klebsiella, Streptococcus and Staphylococcus, was increased from 104 to 107 CFU/100mL
due to an untreated slaughterhouse effluent being discharged in upstream. The concentrations of TSS,
BOD, nitrates, and phosphates were increased leading to a reduction of the concentration of DO from
7.2 to 2.4 mg/L. Therefore, the water quality of the receiving water was severely affected by not
having a proper treatment technology for the reduction of the organic content from the slaughterhouse
plant.
Likewise, the Bogota River flowing through Bogota, the capital city of Colombia, receives
approximately 93,853 tonnes of total suspended solids and 75,016 tonnes of BOD5 on an annual basis
(Kingsley, 2011). Different sources, including slaughterhouses, upstream municipalities, horticultural
facilities and coal yards, are responsible for the production of this high-strength wastewater. As a
result, the Bogota River has several sections in which aquatic life no longer exists along with a
putrefied odour derived from the abundant hydrogen sulphide in the river produced by the anaerobic
biodegradation processes.

19
3D Model
Structure
Base Unit Gallic acid Flavone Phloroglucinol
Class/Polymer Hydrolyzable tannins Non-Hydrolyzable tannins Phlorotannins
Sources Plants Plants Brown algae
Figure 2.2. Chemical structures for different classes of tannins.

20
2.2.4. Health effects
The Environmental Health and Safety (EHS) guidelines (Table 2.7) for meat processing,
according to the World Bank Group include information relevant to meat processing, focusing on
bovine and porcine slaughtering and processing from reception of the animals until the carcasses are
ready for sale or further processing (World Bank Group, 2007). These guidelines are achievable under
normal operating conditions in appropriately designed and operated facilities through the application
of pollution prevention and control techniques.
Table 2.7. Effluent levels for meat processing.
(Adapted from World Bank Group, 2007).
Pollutants Guidelines Value
pH 6–9
BOD (mg/L) 50
COD (mg/L) 250
TN (mg/L) 10
Oil and Grease (mg/L) 10
TSS (mg/L) 50
Temperature Increase (mg/L) < 3**
Total Coliform Bacteria (MPN*/100ml) 400
Active Ingredients/Antibiotics To be determined on a case specific basis
* MPN: Most Probable Number;
** At the edge of a scientifically established mixing zone that takes into account ambient water quality, receiving water
use, potential receptors, and assimilative capacity.
Table 2.8 shows the standard levels recommended for slaughterhouse wastewater discharge in
Canada (Environment Canada, 2000). These levels should be achieved without dilution for at least
95% of the plant or unit operation time. They are applicable to direct discharges of treated effluents to
surface water for general use.
The impact of slaughterhouse wastewater on the soil and groundwater is characterized by
pollution via nitrate and chloric anions, and many pathogenic microorganisms, which persist in the
soil and reproduce continuously. Pathogenic microorganisms from cattle wastes can be also
transmitted to humans who are exposed to the water body, making those areas non-suitable for
drinking or irrigation purposes (Sangodoyin and Agbawhe, 1992; Benka-Coker and Ojior, 1995;
Fang, 2000).

21
People from developing countries in South America and Africa have experienced serious
gastrointestinal diseases, bloody diarrhoea, liver malfunctions, and in some cases, death associated
with the presence of viruses, protozoa, helminthic eggs and bacteria in slaughterhouse wastewaters
due to the poor management of the slaughterhouse wastewater (Prando and Gambogi, 2009; Krishna
et al., 2009; Feng et al., 2009). In short, slaughterhouse wastewater must be treated efficiently before
discharge into water bodies in order to avoid environmental pollution and human health effects
(Belsky et al., 1999; Salminen and Rintala, 2002). On the other hand, wastewater workers in
Cincinnati, Ohio; Anchorage, Alaska; and Ontario, Canada; have contracted hepatitis A. The Ontario
workers worked in a primary purging station, grit chambers, and maintenance on sewer cleaning
machines (Brown, 1997).
Table 2.8. Recommendations for wastewater discharges from federal facilities.
(Adapted from Environment Canada, 2000).
Parameters Water Bodies of Disposal Disposal
Recommendation
BOD (mg/L) Freshwater lakes, slow-flowing
streams
5
Rivers, streams and estuaries 20
Shoreline 30
Fecal Coliforms (MPN*/100mL) 100
Total Coliform Count
(MPN*/100mL)
1000
TSS (mg/L) Freshwater lakes, slow-flowing
streams
5
Rivers, streams and estuaries 20
Shoreline 30
Reactive Chlorine (mg/L) 0.01*
pH 6–9
Phenols (mg/L) 0.02
Oils and Grease (mg/L) 5
Temperature (°C) >= 1
Ammonia (mg/L) 1
Nitrates (mg/L) 1
Phosphorus (mg/L) 1
Sulphurs (mg/L) 0.5
Chromium (mg/L) 0.05 * MPN: Most Probable Number or current detection limit.

22
2.3. Slaughterhouse wastewater treatment technologies
In natural water, there are two main routes for destroying toxic compounds, photodegradation,
and biodegradation. Photodegradation is an important mechanism for degrading aromatic
hydrocarbons, chlorinated aromatic hydrocarbons, chlorinated phenols, and many pesticides by direct
or indirect photolysis, where a photosensitizer absorbs light and transfers the energy to pollutants.
Biodegradation refers to the elimination of the pollutant by the metabolic activity of living organisms,
usually microorganisms particularly bacteria and fungi that live in natural water and soil (Oller et al.,
2011).
SSWW treatment technologies are similar to those used in municipal wastewater systems and
may include primary, secondary, and even tertiary treatment for some cases (Wang et al., 2010).
Physical, chemical, and biological treatment systems can be used in slaughterhouse wastewater
decontamination. Each system has unique treatment advantages and disadvantages (Rajakumar et al.,
2011). The feasibility of using many individual or combined reactor types to treat SSWW biologically
has been examined in the past. Difficulties relating to fats and particulates have been mainly solved in
the digestion processes (Debik and Coskun, 2009)
Physical processes are widely used in water and wastewater treatment plants. These physical
techniques are based on the separation of one or more compounds from the waste stream. Because of
the separation, the pollutant is transferred from one phase to another. Therefore, further treatment is
required for the degradation of the contaminants in the second phase. Physical methods are employed
mainly to separate large settleable and floating matter, clarify turbid solutions, recover, and recycle
valuable substances utilized in the main processes and in separating inorganic materials. The
conventional and advanced physical techniques include filtration, adsorption, gas stripping, and
others.
Land application of slaughterhouse wastewater by spray irrigation has been used in the USA
(Bull et al., 1982). Presently, in Ontario, land application of wastewater generated from
slaughterhouse falls under the Environmental Protection Act (OMOE, 1996) and the determining
factors for suitability are the same factors used for sewage, and pulp and paper biosolids (Wu and
Mittal, 2011). Simplicity and low cost are its main advantages. Disadvantages include probable
surface and ground water contamination, odours, production of greenhouse gases, and soil pore

23
obstruction from fat loads. Application on constructed wetlands could be also used as a polishing
treatment for biologically treated wastewater (Johns, 1995). The land application, however, is not
convenient at low temperatures (Masse and Masse, 2000b).
Grit chambers, screens, settling tanks, and dissolved air flotation (DAF) units are widely used
for the removal of TSS, colloidal, and fats from slaughterhouse wastewater. In DAF units, aeration
from the bottom of the tank move light solids, fat and grease to the surface where scum is periodically
skimmed off.
Camin (1970) surveyed wastewater treatment in over 200 meatpacking plants in the USA and
concluded that air flotation was the least efficient treatment in terms of dollars per weight of BOD
removed in comparison to aerobic and anaerobic systems. Blood coagulants like aluminum sulphate
and ferric chloride or flocculants like polymers are sometimes added to the wastewater in the DAF
unit to increase protein flocculation and precipitation as well as fat flotation.
Chemical DAF units can reach COD reductions of between 32 and 90%, and are able to
remove large amounts of nutrients. However, operational problems like the production of large
volumes of rotten sludge that require special handling and further treatment have been reported
(Johns, 1995).
Secondary treatment is aimed at reducing BOD concentration by removing the soluble organic
compounds in either solution or suspension, which remain after primary treatment (Tchobanoglous et
al., 2003). Biological treatment may include different combinations of various processes, including
anaerobic, aerobic and facultative lagoons, activated sludge, and trickling filters among others (US
EPA, 2004). These combined processes are capable of obtaining organic matter removal up to 90–
95% at typical retention times of approximately 20 days (Tchobanoglous et al., 2003; Del Pozo and
Diez, 2005; Wang, 2005).
Biological treatment is often the most applied process in slaughterhouse plants as secondary
treatment, comprised of aerobic and anaerobic digestion that are used alone or combined depending
on the characteristics of the wastewater being treated (Baruth, 2005).

24
Nevertheless, anaerobic digestion is the preferred biological treatment that is applied in
slaughterhouse wastewater treatment due to its effectiveness in treating high-strength wastewater
(Verheijen et al., 1996; Tchobanoglous et al., 2003; US EPA, 2004; Cao, 2009; Cao and Mehrvar,
2011). Table 2.9 shows a summary of the current SSWW treatment technologies that have been
successfully applied to deal with the environmental impacts and health effects caused by these high-
strength wastewaters.
Table 2.9. Summary of current technologies used in MPP facilities for the treatment of the
slaughterhouse wastewater.
(Adapted from US-EPA, 2002; Mittal, 2006; Cao, 2009).
Category Regulatory
Level
Technology Description
Simple abattoir BPT1 Equalization, DAF
2, Secondary
Biological Treatment with nitrification
Complex abattoir BPT Equalization, DAF, Secondary
Biological Treatment with nitrification
and denitrification
Low-processing packaging BAT3; NSPS
4 Equalization, DAF, Secondary
Biological Treatment with nitrification
and denitrification
High-processing packaging BAT; NSPS Equalization, DAF, Secondary
Biological Treatment with nitrification
Meat cutter BPT
Equalization, DAF, Secondary
Biological Treatment with nitrification
Sausage and luncheon meats processor BPT Equalization, DAF, Secondary
Biological Treatment with nitrification
and denitrification
Ham processor BAT; NSPS Equalization, DAF, Secondary
Biological Treatment with nitrification
and denitrification
Canned meat processor BAT; NSPS Equalization, DAF, Secondary
Biological Treatment with nitrification
Renderer BPT; BCT5;
BAT; NSPS
Equalization, DAF, Secondary
Biological Treatment with nitrification
Poultry first processing (facilities which
slaughter up to 5000 tonnes/year)
BPT; BCT Equalization, DAF, Secondary
Biological Treatment with nitrification
and denitrification
Poultry further processing (facilities which
produce up to 3.5 tonnes/year or finished
product)
BAT; NSPS Equalization, DAF, Secondary
Biological Treatment with nitrification
and denitrification 1 BPT: Best practicable control technology currently available;
2 DAF: Dissolved Air Flotation;
3 BAT: Best available
technology economically achievable; 4 NSPS: New source performance standards;
5 BCT: Best control technology for
conventional pollutants.

25
2.3.1. Anaerobic biological treatment
During anaerobic digestion, organics are degraded by a diversity of bacteria into methane in
the absence of oxygen. Anaerobic systems have several advantages such as high efficiency in
reducing COD in soluble and insoluble form; a low sludge production of only 5 to 20% of that
generated by aerobic systems (Masse and Masse, 2000b); the recovery of usable energy in the form of
methane; no aeration energy requirement; and no chemical handling. In addition, the biomass can
remain unfed for a long period without deteriorating.
Microorganisms are the main parameter in terms of organic matter digestion in biological
treatment of water and wastewater. During anaerobic digestion, microbes convert organic compounds
into oxidized substances, new cells, energy for their life processes, and some gaseous products, such
as methane and carbon dioxide (Reynolds and Richards, 1996) as shown in Reaction (2.1).
( ) → (2.1)
The advantages of anaerobic treatment outweigh the advantages of aerobic treatment when
treating influents in higher concentrations, and generally, anaerobic treatment requires less energy
with potential bioenergy and nutrient recovery. Although anaerobic treatment possesses great
advantages, it hardly produces effluents that comply with usual discharge standards established by
environmental agencies. In most applications, despite the high efficiency of the anaerobic process, the
complete stabilization of the organic matter is impossible anaerobically due to the high organic
strength of the wastewater. Thus, the effluents from anaerobic reactors usually need a post-treatment
step, in which the removal of organic matter and other constituents, slightly affected by the anaerobic
treatment such as nutrients (N/P) and pathogenic organisms, is completed (Chernicharo, 2006). The
final effluent produced by the anaerobic treatment usually contains solubilised organic matter,
suitable for aerobic treatment, indicating the potential of using anaerobic–aerobic systems (Gray,
2005), where subsequent post-treatment using aerobic treatment is required to meet the effluent
discharge standard.

26
2.3.2. Aerobic biological treatment
In aerobic digestion, microorganisms degrade organics in the presence of oxygen. One
disadvantage of aerobic systems is the generation of large quantities of biological sludge that must be
treated before disposal (Bull et al., 1982). High BOD removals have been reported, but effluent TSS
concentrations are often elevated due to poor sludge settleability (Johns, 1995). In addition, oxygen
requirements and treatment time increase suddenly with wastewater strength. Aerobic treatment could
be used for final decontamination and nutrient removal following physicochemical or anaerobic
techniques (Van Lier et al., 2001; Chernicharo, 2006). Compared to anaerobic systems, aerobic
systems achieve higher removal of soluble biodegradable organic matter and the produced biomass is
generally well flocculated, resulting in a lower concentration of suspended solids in the effluent
(Grady et al., 1999). As a result, the effluent quality from aerobic systems is generally higher than
that of anaerobic systems.
2.3.3. Combined anaerobic-aerobic biological treatment
Both anaerobic and aerobic systems are capable of achieving high organic removal
efficiencies as shown in Table 2.10. In general, aerobic systems are suitable for the treatment of low
strength wastewaters (biodegradable COD concentrations less than 1000 mg/L) while anaerobic
systems are suitable for the treatment of high strength wastewaters (biodegradable COD
concentrations over 4,000 mg/L).
Table 2.10. Comparison of anaerobic and aerobic wastewater treatment technologies.
(Adapted from Yeoh, 1995; Grady et al., 1999; Chan et al., 2009).
Feature Aerobic Anaerobic
Organic removal efficiency High High
Effluent quality (aesthetics) Excellent Moderate to poor
Organic loading rate Moderate High
Sludge waste production High Low
Nutrient requirement High Low
Alkalinity requirement Low High for certain industrial
waste
Energy requirement High Low to moderate
Temperature sensitivity Low High
Start-up time 2–4 weeks 2–4 months
Odour Less opportunity for odours Potential odour problems
Bioenergy and nutrient
recovery
No Yes
Mode of treatment Total (depending on feedstock
characteristics)
Essentially pre-treatment

27
Aggelis et al. (2001) found that neither anaerobic nor aerobic processes could be employed
alone for efficient treatment. When treating high organic strength industrial wastewaters, the aerobic
or anaerobic treatment alone does not produce effluents that comply with the effluent discharge limit.
The use of combined anaerobic-aerobic processes can also lead to a reduction in operating costs when
compared with aerobic treatment alone (Vera et al., 1999), while simultaneously resulting in high
organic matter removal efficiency and smaller amounts of aerobic sludge without pH correction.
Benefits of the combined anaerobic–aerobic processes include a great potential for resource recovery
as anaerobic pre-treatment removes most of the organic pollutants and converts them into biogas and
a high overall treatment efficiency as aerobic post-treatment polishes the anaerobic effluent and
results in very high overall treatment efficiency (Frostell, 1983; Cervantes et al., 2006).
Combined anaerobic-aerobic systems have been also found to perform well for several
processes such as biodegradation of chlorinated aromatic hydrocarbons including anaerobic de-
chlorination and aerobic ring cleavage (Supaka et al., 2004); sequential nitrogen removal including
aerobic nitrification and anaerobic denitrification (Liu et al., 2008); and anaerobic reduction of Fe
(III) and micro-acrophilic oxidation of Fe (II) with production of fine particles of iron hydroxide for
adsorption of organic acids, phenols ammonium, cyanide, radionuclides, and heavy metals (Wang,
2005). Combined anaerobic-aerobic systems using high-rate bioreactors, such as upflow anaerobic
sludge blankets (UASB), filter bioreactors, fluidized bed reactors and membrane bioreactors, are
adopted in order to provide a treatment process that is both technologically and economically viable
with the dual goals of resource recovery and compliance with current legislation for effluent
discharge. A more intensive form of biodegradation can be also achieved by integrating anaerobic and
aerobic zones within a single bioreactor. Essentially, there are four types of integrated anaerobic-
aerobic bioreactors, which are explained as follows:
1. Integrated bioreactors with physical separation of anaerobic-aerobic zone;
2. Integrated bioreactors without physical separation of anaerobic-aerobic zone;
3. Sequencing batch reactors (SBR) based on temporal separation of the anaerobic and the aerobic
phase; and
4. Combined anaerobic–aerobic systems based on the principle of limited oxygen diffusion in
microbial biofilms.

28
In recent years, substantial attention has been paid to compact high-rate bioreactors for
wastewater treatment to meet the strict constraints with respect to space, odour, and biosolids
production (Chan et al., 2009). Thus, integrated bioreactors, which combine aerobic and anaerobic
processes in a single reactor, have been seen as a viable alternative. This combination is capable of
enhancing the overall degradation efficiency (Tartakovsky et al., 2005). The integrated bioreactors are
cost-effective, efficient, and have smaller footprints as compared to other anaerobic–aerobic systems.
Nonetheless, the design, operation, and process development of integrated anaerobic–aerobic
bioreactors are still emerging (Chan et al., 2009).
2.3.4. Biological modeling
Theoretically, the growth of microorganisms is represented by five stages, including the lag phase,
exponential growth phase, deceleration phase, stationary phase, and death phase (Reynolds and
Richards, 1996). Figure 2.3 shows a typical microbial growth based on biomass concentration.
Organic matter in slaughterhouse wastewater can be represented by TOC and TN due to the
multiple organic compounds in the wastewater. Table 2.11 shows the main parameters of the
biological treatment together with their calculation methods.
Table 2.11. Main parameters for biological treatment.
(Adapted from Del Pozo and Diez, 2005).
Parameter Calculation Definition
OLR (mgTOC/L.h) TOCo(F)/Vr Organic loading rate
rTOC (mgTOC/L.h) F(TOCo – TOC)/Vr Overall TOC removal rate
rTOCmet (mgTOC/L.h) G(XCH4)/(0.38Vr) Methanogenic TOC removal rate
rTOCAnox (mgTOC/L.h) 2.9G(XN2)/(0.87Vr) TOC removal rate by denitrification
rTOCAe (mgTOC/L.h) rTOC – rTOCanox – rTOCmet Aerobic TOC removal rate
%TOC 100(TOCo – TOC)/Vr Overall TOC removal efficiency
NLR (mgTN/L.h) TNo(F)//Vr Nitrogen loading rate
NLRAe (mgTN/L.h) TNo(F)//VAe* Local nitrogen load in the aerobic zone
rNdn (mgN/L.h) G(XN2)/(0.87Vr) Denitrification rate
rNn (mgN/L.h) F(NO-N)/Vr + rNdn Nitrification rate
%TN 100(TNo – (NH-N + NO-N))/TNo Overall nitrogen removal efficiency
%Nn 100(TNo – NH-N)/TNo Nitrification efficiency Notes: Ae, aerobic; met, methanogenic; Ana, anaerobic; Anox, anoxic; n, nitrification; dn, denitrification; g, growth; F,
feed; G, biogas production (L/h); XCH4, methane molar fraction in biogas; XN2, nitrogen molar fraction in biogas. *VAe =
1/5, 2/5 or 3/5Vr.

29
Figure 2.3. A typical curve for the microbial growth.
log (
Bio
mass
con
cen
trati
on
)
Time
Lag phase
Exponencial
growth phase
Desaceleration
phase
Stationary
phase
Death phase
30
The loading rates have been expressed on a volumetric basis (mg/L.h) instead of an
attachment surface basis because there is an important bed of suspended biomass that can stand at the
bottom of the reactors, where Vr is the effective volume. Removal of organic matter from
methanogenic and anoxic processes has to be calculated from biogas production and concentration of
methane and nitrogen, respectively.
Overall nitrogen removal efficiency (%TN) should be calculated from the difference between
the feed TN and the nitrogen as ammonia (NH-N) or nitrite and nitrate (NO-N) in the effluent. The
nitrification efficiency (%Nn) should be estimated from the TN removal where the nitrogen employed
in biomass growth and the released amount in biomass lysis can be ignored.
In cases in which nutrient removal is required to meet the quality standards of the receiving
water bodies, the use of anaerobic processes preceding a complementary aerobic treatment for
biological nutrient removal should be analyzed. Anaerobic systems present good biodegradable
organic matter removal, but not necessarily removal efficiency. This certainly causes a negative effect
on biological treatment systems aiming at good nutrient removal. When the purpose of the treatment
is also good nitrogen removal, the anaerobic reactor should be used to treat initially only a part of the
influent raw sewage (possibly no more than 50–70%), and the remaining part (30–50%) should be
directed to the complementary biological treatment, aiming at nitrification and denitrification, so that
there is enough organic matter for the denitrification step. In this case, the great advantage in using
the anaerobic reactor is to receive and stabilize the sludge generated in the complementary treatment,
eliminating the need for an anaerobic sludge digester (Chernicharo, 2006).
Usually biological reactions are modeled by Monod (Edalatmanesh et al., 2008; Mohajerani et
al., 2009; Cao, 2009; Cao and Mehrvar, 2011), Haldane (Edalatmanesh et al., 2008; Mohajerani et al.,
2009), two-step Haldane (Edalatmanesh et al., 2008; Mohajerani et al., 2009), Contois (Mohajerani et
al., 2009), and Grau (Mohajerani et al., 2009). The Monod equation has been found as an acceptable
and powerful mathematical expression fitted to experimental data described as follows (Edalatmanesh
et al., 2008; Mohajerani et al., 2009):
(2.2)

31
Where X and Xmax are the specific and maximum specific growth rates of microorganisms,
KTOC is the half-saturation constant, and TOC is the total organic carbon concentration standing for
any limiting organic source. In case of KTOC << TOC, applicable to no inhibition, the Monod equation
can be simplified as follows (Edalatmanesh et al., 2008; Mohajerani et al., 2009):
(2.3)
A cell yield coefficient can be defined based on the TOC consumption and volatile suspended
solids (VSS) production during aerobic biochemical degradation and it can be defined as follows
(Edalatmanesh et al., 2008; Mohajerani et al., 2009):
⁄
(2.4)
Where VSSo and VSS are initial and final concentrations of volatile suspended solids in the
bioreactor, and TOCo – TOC is the organic consumption during the biological treatment. Equation
(2.4) can be also employed based on the utilization of the biodegradable TOC fraction (Mohajerani et
al., 2009). The Monod expression can be employed for modeling as shown in Equation (2.5).
Consequently, Equation (2.7) can be obtained by considering KTOC << TOC.
⁄ ( )
0
1 (2.5)
( )( )( )
( )( ) ( )( )
( ) (2.6)
( )( )
( ) ( )( )
( ) (2.7)
Finally, assuming two variables a and b, as shown in Equation (2.8), the final simplified
Equation (2.9) can be obtained; where, a plot of the left side of the final equation versus t should give
a straight line to find the parameters of interest.
( )( )
( )
( )
( ) (2.8)

32
, ( )-
, ( )- (2.9)
Kennedy and Barriault (2007) developed a first order model to describe the substrate
concentration driving force within different compartments of an ABR. This model has three major
assumptions as follows:
1. The soluble component in an n-compartment ABR as whole is the representative of n-continuous
stirred tank reactors (CSTRs) in series;
2. The system would act as one large CSTR where the recycle rate is high compared to the influent
flow; and
3. The methane production is the rate-limiting step.
The first order rate constant could be calculated from operational treatment data knowing the
substrate concentrations and biomass in each compartment. The mass balance in the first
compartment and subsequent i compartments of an n-compartment ABR are presented in Equations
(2.10) and (2.11), respectively.
Under steady-state conditions, dS1/dt and dSi/dt = 0, then Equations (2.10) and (2.11) are
reduced to Equations (2.12) and (2.13), respectively, which are used to estimate the values of the first
order rate coefficient of each compartment. In case of no recycle, rr = 0; thus, Equations (2.12) and
(2.13) can be reduced to Equation (2.14):
( ) (2.10)
( ) ( ) (2.11)
( ⁄ ) (2.12)
( )
( ⁄ ) (for i ≥ 2) (2.13)

33
( ⁄ ) (for i ≥ 1) (2.14)
where,
So = concentration of the substrate in the influent (mg/L);
Sf = concentration of the substrate in the effluent (mg/L);
Si-1 = concentration of the substrate in compartment i-1 of the ABR (mg/L);
Si = concentration of the substrate in compartment i of the ABR (mg/L);
S1 = concentration of the substrate in compartment 1 of the ABR (mg/L);
rr = recycle rate in the ABR, which is a percent of the flow rate of the influent (%);
kCi = first order rate coefficient of substrate in compartment i of the ABR;
kC1 = first order rate coefficient of substrate in compartment 1 of the ABR;
Xi = biomass concentration of substrate in compartment i of the ABR (mg/L);
X1 = biomass concentration of substrate in compartment 1 of the ABR (mg/L);
Vi = volume of the compartment i of the ABR (L);
V1 = volume of the compartment 1 of the ABR (L); and
Q = flow rate of influent (L/h).
2.3.5. Nitrification and denitrification
Bacteria remove nitrogen from wastewater by two-step biological processes, nitrification
followed by denitrification. Technically, it is a three-step process, since ammonification precedes
nitrification and denitrification. During ammonification, the majority of the nitrogen contained in raw
sewage is converted from organic-nitrogen to ammonia (NH3) through a process called hydrolysis; in
common situations, more ammonium (NH4+) than ammonia is created during ammonification, and the
actual ratio is influenced by pH and temperature.
The biological conversion of ammonium (NH4+) to nitrate nitrogen (NO3
–) is called
nitrification, which is a two-step process. First, Nitrosomonas bacteria convert ammonia (NH3) and
ammonium (NH4+) into nitrite (NO2
–). Next, Nitrobacter bacteria finish the conversion of nitrite
(NO2–) to nitrate (NO3
–). These bacteria, known as nitrifiers, are commonly aerobes, meaning they
must have free dissolved oxygen (DO) to perform their work (Zhang et al., 2009). Nitrification occurs
only under aerobic conditions at dissolved oxygen levels of 1.0 mg/L or more. At dissolved oxygen
concentrations of less than 0.5 mg/L, the growth rate is minimal. The reactions are generally coupled

34
and go rapidly to the nitrate (NO3–) form; therefore, nitrite (NO2
–) levels at any given time are usually
low (Ward, 1996). The following reactions describe the nitrification process:
(2.15)
(2.16)
Although ammonium ions are used as an energy source by nitrifying bacteria, not all of the
ammonium ions taken inside the bacterial cells are nitrified. Some of the ammonium ions are used as
a nutrient source for nitrogen and are assimilated into new cellular material (C5H7O2N). The growth
of new cells in the activated sludge process is referred to as an increase in the mixed liquor volatile
suspended solids (MLVSS) (Gerardi, 2002):
(2.17)
Carbon dioxide (CO2) serves as the carbon source for the synthesis of cellular material, and is
available to nitrifying bacteria as bicarbonate alkalinity. This alkalinity is produced when carbon
dioxide dissolves in wastewater (Gerardi, 2002).
The biological reduction of nitrate (NO3–) to nitrogen gas (N2) by facultative heterotrophic
bacteria is called denitrification. Heterotrophic bacteria need a carbon source as food to live.
Facultative bacteria can get their oxygen by taking dissolved oxygen out of the water or by taking it
off nitrate molecules (Ward, 1996).
Denitrification occurs when oxygen levels are depleted and nitrate becomes the primary
oxygen source for microorganisms. The process is performed under anoxic conditions, when the
dissolved oxygen concentration is less than 0.5 mg/L, ideally less than 0.2 mg/L (Chen and Lin,
1993). When bacteria break apart nitrate (NO3–) to gain oxygen (O2), the nitrate is reduced to nitrous
oxide (N2O), and in turn, to nitrogen gas (N2). Nitrogen gas has low water solubility; therefore, it
escapes into the atmosphere as gas bubbles (Zumft, 1997). Free nitrogen is the major component of
air; thus, its release does not cause any environmental concern. The reaction pathway of the
denitrification generally proceeds through some combination of the intermediates as shown below:

35
( ) (2.18)
Moreover, the complete denitrification process can be expressed as a redox reaction as shown
in Reaction (2.19), and generally speaking, the denitrification reaction can be described as shown in
Reaction (2.20), where a carbon source (CH3OH) is often required for denitrification to occur.
(2.19)
(2.20)
Since denitrifying bacteria are facultative organisms, they can use either dissolved oxygen or
nitrate as an oxygen source for metabolism and oxidation of organic matter. If dissolved oxygen and
nitrate are present, bacteria will use the dissolved oxygen first (Zumft, 1997).
2.3.6. Advanced oxidation processes (AOPs)
The use of advanced oxidation processes (AOPs) can also become an interesting alternative
for post-treatment of biologically treated effluents. In this context, conventional biological processes
do not always provide satisfactory results, especially for industrial and high-concentrated wastewater
since many of the organic substances produced by various industries are toxic or resistant to
biological treatment (Steber and Wierich, 1986; Bowers et al., 1989; Adams et al., 1996; Pulgarín and
Kiwi, 1996; García et al., 2001; Muñoz and Guieysee, 2006; Lapertot et al., 2006). Therefore, one
feasible option for such biologically persistent wastewater is the use of advanced oxidation
technologies based on chemical oxidation widely recognized as a highly efficient treatment
alternative for recalcitrant wastewater.
AOPs degrade organic pollutants by forming hydroxyl radicals (•OH) (Balcioglu et al., 2001;
Bhatkhande et al., 2002; Neyens and Baeyens, 2003; Gonze et al., 2003; Sarria et al., 2003; García-
Montaño et al., 2006), which are highly reactive and non-selective (Gogate and Pandit, 2004a; Gogate
and Pandit, 2004b; Pera-Titus et al., 2007; Devipriyas and Yesodharan, 2005; Pignatello et al., 2006;
Comninellis et al., 2008; Shannon et al., 2008). This species can degrade organic matter rapidly in
comparison with ordinary chemical oxidation processes that may take months and even years to
accomplish this. The fast oxidation, in terms of seconds, of the organic matter by the •OH species

36
allows the use of the term “advanced” (Bolton and Cotton, 2008) for this kind of process. AOPs
include photochemical degradation processes, such as UV/H2O2, UV/O3, and UV/O3/H2O2, in which
UV radiation plays a secondary role by initiating the photoreaction in the presence of an auxiliary
oxidant to produce •OH radicals; photocatalytic processes, such as TiO2/UV and photo-Fenton
reactors, in which a catalyst plays a secondary role by absorbing UV radiation to produce •OH
radicals; and chemical oxidation, such as O3, O3/H2O2 and H2O2/Fe2+
among others (Tchobanoglous
et al., 2003; Oppenländer, 2003).
AOPs are also governed by the same principles as the common chemical processes associated
with redox reactions, which involve the exchange of electrons between chemical species, leading to a
change in the oxidation state of different compounds taking place in the process (Sawyer et al., 2002).
In redox reactions, the compounds gaining electrons are known as oxidizing agents, while compounds
losing electrons are known as reducing agents. Thus, •OH radicals, produced from AOPs, are strong
oxidizing agents, which are highly reactive to organic matter.
As McMurray and Fay (2003) show, the exchange of electrons between an oxidant and a
reducer is spearheaded by the difference in their standard electrode potential (Eo).
•OH intermediates
have one of the highest electrical oxidation potentials (EOP) (2.80V) among all typical chemical
oxidizing agents used in water and wastewater treatment technologies as shown in Table 2.12 (Tarr,
2003; Asano et al., 2007; Black and Veatch, 2010).
Table 2.12. Standard electrode potential of selected oxidant species.
(Adapted from Tarr, 2003 and Barrera, 2011).
Oxidant EOP (V)
Fluorine (F) 3.03
Hydroxyl radical (•OH) 2.80
Atomic oxygen (O) 2.42
Ozone (O3) 2.07
Hydrogen peroxide (H2O2) 1.77
Permanganate ion (MnO42–
) 1.67
Hypochlorous acid (HClO) 1.49
Chlorine (Cl) 1.36
Chlorine dioxide (ClO2) 1.27
Bromine (Br) 1.09

37
Furthermore, hydroxyl radicals (•OH), which have a high oxidation potential, attack organic
molecules by either abstracting or adding a hydrogen atom to double bonds, thus allowing their
mineralization to non-toxic forms such carbon dioxide or water. Studies carried out by Sigge et al.
(2002) demonstrated the feasibility of this process in further reducing the TOC contents of anaerobic
effluents, when using ozone and ozone/hydrogen peroxide in combination with a granular activated
carbon contacting column. In one study, colour and COD reductions ranged from 66 to 90% and from
27 to 55%, respectively (Chernicharo, 2006). In some cases, the mineralization of an organic
compound cannot be reached, but the toxicity of the parent compound is reduced and eventually it can
be treated by cheaper methods such as biological treatment (Tarr, 2003; Tchobanoglous et al., 2003).
Chemical oxidation for complete mineralization is generally expensive because the oxidation
intermediates, formed during treatment, tend to be more and more resistant to their complete chemical
degradation. Moreover, they all consume energy (e.g. UV radiation, ozone) and chemical reagents
like catalysts and oxidizers, which increase with treatment time (Muñoz et al., 2005). Appropriate
techniques must be combined to provide technically and economically feasible options.
In combined chemical and biological wastewater treatment, it is very important to keep in
mind how the characteristics of each individual treatment, such as the chemical oxidant to be used
(i.e. photo-Fenton or Fenton reagent, O3/H2O2, UV/O3, UV/H2O2, UV/TiO2, etc.) can improve the
destruction of a persistent contaminant (Liu et al., 2008; Comninellis et al., 2008; Klavarioti et al.,
2009).
The rest of the aspects to be considered are also widely known: the chemical oxidation
capacity (Jones et al., 1985; Lee and Carberry, 1992), its potential for forming toxic intermediates
(Trgovcich et al., 1983; Bowers et al., 1989; Wang, 1992), a change in pollutant behaviour (Miller et
al., 1988; Eckstein, 1994), the choice of biological agent, the comparison of different cultures (Lee
and Carberry, 1992), the comparison of acclimated and non-acclimated cultures (Bowers et al., 1989;
Hu and Yu, 1994), and the use of monospecific cultures and anaerobic cultures (Koyama et al., 1994;
Adams et al., 1994). Measurement of the combined process efficiency depends on the purpose of the
treatment, but normally requires the independent optimization of each chemical and biological step
(Oller et al., 2011).

38
2.3.7. UV/H2O2 process
H2O2 and O3 are chemical compounds that can be considered as auxiliary oxidants when
coupled with UV radiation, usually under the UVC region of the electromagnetic spectrum between
200 to 280 nm as shown in Table 2.13 in order to produce •OH species. The UV/H2O2 process, one of
the most widely AOPs, is an effective technology for industrial wastewater treatment (Tabrizi and
Mehrvar, 2004; Aye et al., 2004; Edalatmanesh et al., 2008; Mohajerani et al., 2009). The degradation
and detoxification of pollutants in the UV/H2O2 process rely on highly reactive species, where •OH
are produced from the reaction of the H2O2 with the UV light (Glaze, 1987; Zhou and Smith, 2002;
Edalatmanesh et al., 2008; Mohajerani et al., 2009).
The UV/H2O2 process uses ultraviolet radiation to cleave the O–O bond in hydrogen peroxide
(H2O2) and generate hydroxyl radicals. The •OH can be then scavenged by an organic compound to
initiate a radical chain degradation of H2O2 in the series of reactions shown below (Clarke and
Knowles, 1982; Glaze, 1987).
→ (2.21)
(2.22)
(2.23)
(2.24)
(2.25)
Table 2.13. Electromagnetic spectrum of ultraviolet light.
Name Abbreviation
Wavelength range
(nm)
Energy per photon
(eV)
Before UV spectrum; visible light VIS above 400 below 3.10
Ultraviolet A, long wave, or black light UVA 400–315 3.10–3.94
Near NUV 400–300 3.10–4.13
Ultraviolet B or medium wave UVB 315–280 3.94–4.43
Middle MUV 300–200 4.13–6.20
Ultraviolet C, short wave, or germicidal UVC 280–100 4.43–12.4
Far FUV 200–122 6.20–10.2
Vacuum VUV 200–100 6.20–12.4
Low LUV 100–88 12.4–14.1
Super SUV 150–10 8.28–124
Extreme EUV 121–10 10.2–124
Beyond UV range X-rays below 10 above 124

39
The •OH produced in either way described above may attack organic molecules by abstracting
a hydrogen atom from the molecule (Clarke and Knowles, 1982). Carey (1990) described a common
pathway for the degradation of organics by the •OH. As seen in Reaction (2.21), 2 moles of
•OH are
produced per quantum of radiation (hv) absorbed; however, there are other reactions to be considered
such as the radical-radical recombination as shown in Reaction (2.26), which takes place when the
H2O2 concentration is high during the oxidation process, which is responsible for the overall
reduction of the efficiency of the process.
(2.26)
A recombination may be avoided by finding the optimum H2O2 concentration inherent to the
specific contaminant and system configuration (Oppenländer, 2003). The major photochemical and
chemical reactions taking place in the UV/H2O2 process can be described as shown in Table 2.14.
Table 2.14. Common reaction mechanisms in UV/H2O2 processes.
Reaction
No. Reaction
Quantum
Yield, ϕ
(mol/E)
Reaction rate
constant, k
(1/M.s) Reference
(2.27) → 0.500
Buxton et al. (1988)
(2.28) → 0.032
Barrera (2011)
0.027 This study
(2.29)
k1 = 2.7×10⁷ Christensen et al. (1982)
(2.30) k2 = 5.0×10
9 Staehelin et al. (1984)
(2.31)
k3 = 6.0×10⁹ Staehelin et al. (1984)
(2.32) k4 = 8.3×10
5 Bielski et al. (1985)
(2.33)
k5 = 1.5×10⁶ Buxton et al. (1988)
(2.34)
k6 = 6.6×10⁹ Buxton et al. (1988)
(2.35) k7 = 3.0±0.6 Koppenol et al. (1978)
(2.36)
k8 = 7.1×10
9 Sehested et al. (1968)
(2.37)
k9 = 8.5×10⁶ Buxton et al. (1988)
(2.38)
→
k10 = 3.9×10⁸ Buxton et al. (1988)
(2.39)
→
k11 = 4.3×10
5 Crittenden et al. (1999)
(2.40)
k12 = 7.0×10⁵ Barrera (2011)
k13 = 1.1×10² This study

40
The quantum yield (ϕ) of a radiation-induced process is the number of times that a defined
event occurs per photon absorbed by the system. This event may represent a chemical reaction and be
calculable by Equations (2.41) and (2.42) (Shemer et al., 2006). In addition to radical recombination,
the UVC/H2O2 process effectiveness is also delayed by the H2O2 low molar absorption coefficient,
18.6/M.cm at 254nm, which is responsible for large amounts of H2O2 being added to produce
significant concentrations of •OH radicals within the system. Moreover, any post-treatment surplus of
the H2O2 concentration should be removed from the effluent; otherwise, it could enter source waters,
causing negative effects on fish and other living communities (Oppenländer, 2003; Black and Veatch,
2010).
, - , -
( ) (2.41)
( ) 0
( )1
( ) (2.42)
where,
ϕ = quantum yield for TOC removal (mol/E);
t = time (s);
ks(λ) = specific rate of light absorption by TOC (E/mol.s);
q0 = incident photon irradiance (E/cm2.s);
ελ = molar absorption coefficient of TOC (1/M.cm);
αλ = absorption coefficient (1/cm);
r = nominal radius of the photoreactor (cm); and
Ri = inner radius of the photoreactor (cm).
Bovine catalase is the most common compound used to remove excess H2O2, which converts
H2O2 into water and oxygen, as shown in Reaction (2.43) (Chelikani et al., 2004). In particular, the
low molar absorption coefficient and the use of compounds to control the H2O2 concentration in the
effluent have a significant impact on the total cost of this AOP process.
→ (2.43)

41
For a UV/H2O2 process to be efficient, the H2O2 concentration has to be at an optimal level to
maximize the absorption of the incident photons, while the presence of other water compounds that
may compete for the absorption of radiation must be minimized. The optimum H2O2 concentration
also helps to minimize the recombination mechanisms as well as H2O2 effluent concentration surplus
(Barrera, 2011).
The advantages of the UV/H2O2 process include a large range of applications, enhancing the
degradation of pollutants, accelerating the rate of oxidation with great potentials for disinfection, and
thorough mineralization of pollutants in wastewater (Stefan et al., 1996; Aye et al., 2004; Tabrizi and
Mehrvar, 2004; De Morais and Zamora, 2005; Toor and Mohseni, 2007; Cao, 2009; Cao and
Mehrvar, 2011; Barrera, 2011; Barrera et al., 2011). The successful applications of the UV/H2O2
process are shown in various wastewater treatment systems such as textile dye wastewater, with an
optimum H2O2 concentration of 15 mM (Aye et al., 2003); atrazine wastewater, with 99%
degradation in less than 15 min (Beltrán et al., 1993); linear alkyl benzene sulfonate (LAS)
wastewater, with an optimum H2O2 concentration of 5,000 mg/L (Venhuis and Mehrvar, 2005); LAS
wastewater in a pilot-plant photoreactor, with an optimum H2O2 concentration of 720 mg/L (Tabrizi
and Mehrvar, 2006); cotton dyeing wastewater containing C.I. Direct Blue 199, with 80% of TOC
removal in 2 h (Shu, 2006); and 99.99% of bacteria inactivation in 27.6 seconds (Barrera, 2011;
Barrera et al., 2011). Important points should be considered while using the combination technique of
UV photolysis with H2O2 for the wastewater treatment as recommended by Gogate and Pandit
(2004b), including:
1. The synergism between UV photolysis and H2O2 is beneficial only for the contaminants that
require a relatively higher level of oxidation conditions. It should be also noted that though the
substrate removal rates are marginally affected, the overall degradation mechanism might be
affected to a higher degree. An analysis in terms of COD and/or TOC removal should provide a
better picture for the comparison of the efficacy of the hybrid technique as to against the
individual technique.
2. The kinetic rate constants for the degradation process are observed to be inversely proportional to
the initial concentration of the pollutant and hence dilution of the effluent stream should be done
at an optimum level. It should be also noted that the net removal of the pollutant will be also
dependent on the driving force available for the reaction and hence the exact dependency should
be established with laboratory scale studies. On the other hand, it may even be observed at times

42
that absolutely no reduction in TOC is detected even for the combination technique. In such cases,
a dilution factor of 10–15 may be also required before obtaining any appreciable degree of
mineralization. For such cases, this method should only be used as a pre-treatment stage followed
by biological oxidation or new hybrid methods consisting of additional oxidants, e.g. Fenton’s
reagent should be devised.
3. The concentration of H2O2 also needs to be properly selected. Usually, there is an optimum
concentration, beyond which the presence of H2O2 is detrimental to the degradation reaction due
to the scavenging action. Tanaka et al. (1989a; 1989b) reported that an optimum concentration of
H2O2 is 0.01 M for the degradation of various organohalide compounds. Beltrán et al. (1993) have
also reported an optimum concentration of H2O2 as 0.01 M for the degradation of atrazine. Wang
and Hong (1999) reported that the photocatalytic degradation of 2-chlorobiphenyl in the presence
of H2O2 is strongly inhibited above a particular concentration of H2O2 (0.1 M). The magnitude of
the optimum H2O2 concentration depends on the level and type of the pollutants in the effluent
stream, i.e., on the kinetic rate constant for the reaction between the free radicals and the pollutant
and the rate constant for the recombination reaction. The optimum concentration of the H2O2 may
be established using laboratory studies for the pollutant in question unless data are available in the
literature with similar operating conditions.
4. A lower operating pH (in the range 2.5–3.5) is usually preferred for the combination technique of
UV photolysis coupled with H2O2 and the exact value is dependent on the pH values for the
contaminants in question. It should be noted here that the intrinsic rates of the UV/H2O2 process
may not be affected much, but at a lower operating pH, the effect of the radical scavengers,
especially ionic ones such as carbonate and bicarbonate ions, would be nullified leading to higher
overall rates of degradation. Thus, it is better to have a lower operating pH. Mehrvar et al. (2001)
explained the effect of •OH scavenging, where the presence of some inorganic impurities may
affect the photocatalytic destruction of organics in water and wastewater, since these anions
scavenge hydroxyl radicals, which are responsible for attacking organics. Carbonate and
bicarbonate ions are well known as hydroxyl radical scavengers, while phosphates, sulphates, and
nitrates may also be present in the wastewater. Carbonate and bicarbonate ions react with
hydroxyl radicals to produce carbonate radical ions as shown in Reaction (2.44) and (2.45).
Moreover, decay of these carbonate radical ions might occur through Reaction (2.46) or (2.47).
→ (2.44)

43
→ (2.45)
(2.46)
(2.47)
5. The presence of radical scavengers is a crucial factor in deciding the overall efficiency of the
process. Usually, there is an optimum concentration of the radical scavengers, below which the
reduction in the rates of degradation is marginal. Cater (2000) reported that the optimum
concentration of radical scavengers such as benzene, toluene, and xylene is 2 mg/L for the
degradation of methyl tert-butyl ether; whereas, Ku et al. (1998) reported that humic acid strongly
inhibits the degradation reaction only above the concentration of 8 mg/L. On the other hand,
carbonate and bicarbonate ions inhibit the reaction even at lower concentrations (1–2 mg/L).
Therefore, the optimum value of the concentration of radical scavengers is dependent on the
pollutant-radical scavenger system, more specifically on the rate constant for the reactions
between the pollutant-free radicals and scavenger-free radicals.
6. The presence of compounds such as humic acid, which results in strong absorption of incident UV
light, is another factor that needs to be considered while adjusting the dose of H2O2. If these
chemicals are present in the effluent stream, a higher dosage of H2O2 is required to achieve the
synergistic effect.
7. Kinetic modeling of the degradation process is the key point in the effective design of
photoreactors. A most realistic reaction model should consider all the chemical and
photochemical reactions, the number may be even above 50–100, including the effects of the
presence of radical scavengers and should be as rigorous as possible due to the observed major
influence of other minor components.
The work of Crittenden et al. (1999) should serve as a useful guideline in developing realistic
models for the prediction of overall rates in the degradation process. They have developed a kinetic
model considering 44 different reactions using the reported kinetic rate constants and they have
reported that the model fits the experimental results of 1,2-dibromo, 3-chloropropane degradation
better as compared to the earlier model by Glaze et al. (1995) based on the pseudo-steady state

44
assumption, where net accumulation of free radicals is zero. According to Gogate and Pandit (2004b),
the most realistic point in the developed model is the consideration of changing pH with time,
considered for the first time. Usually operating pH is important in deciding the rates of reaction and it
changes as the reaction proceeds.
Therefore, future work should be directed in developing realistic kinetic models and in
establishing the optimum conditions for an H2O2 dose, the concentration of radical scavengers, and
the pH for a variety of contaminants and mixtures. If the pertinent information is not available in the
existing literature, laboratory scale studies with near identical geometric and operating conditions are
recommended with the real effluents in question.
According to Bolton et al. (2001), the overall kinetics in terms of the rate of removal of a
specific component, including TOC, can often be described by simple rate expressions that are either
zero-order or first-order. In general, most processes involved in AOPs, such as UV/H2O2, can be
modeled by the following simple mechanisms:
(2.48)
, -, - (2.49)
, -, - (2.50)
where,
R1 = reaction rate of •OH (mg/L.h);
R2 = reaction rate of •OH with TOC (mg/L.h);
R3 = reaction rate of •OH with a scavenger (Si) (mg/L.h);
ξ = constant that depends on the type of AOP (mg/h.W)
p = power rating for the system (W);
VT = treated SSWW volume (L);
Si = a scavenger for the •OH, where i = a, b, …, n (mg/L); and
kTOC and kSi = second-order rate constants (L/mg.h).

45
A steady-state analysis of this general mechanism yields the following overall rate kinetic for
the UV/H2O2 process as shown in Equation (2.51). This simple mechanism is either zero- or first-
order for TOC, if the concentration of TOC is high, ( , - ∑ , - ), the reaction rate will
be zero-order in TOC as shown in Equation (2.52). On the other hand, if the concentration of TOC is
low, ( , - ∑ , - ), the reaction rate will be first-order in TOC as shown in Equation
(2.53). The difference between “high” and “low” concentration varies considerably with the system
but is often approximately 100 mg/L (Bolton et al., 2001).
, -
, -
, - ∑ , -
(2.51)
, -
(2.52)
, -
∑ , -
(2.53)
2.4. Need for combined biological treatment and advanced oxidation processes
AOPs are becoming more appealing to serve as complementary treatment in either pre-
treatment or post-treatment for current biological processes. Additionally, AOPs may inactivate
bacteria without adding any additional chemicals to the wastewater in comparison to other techniques
such as chlorination or ozonation processes that are commonly used in disinfection of water streams;
thus, avoiding the possible formation of hazardous by-products (Tchobanoglous et al., 2003; Wang et
al., 2006).
Meat processing industry effluents are included as a part of food industry wastewaters, and
they constitute one of the greatest concerns of the agro-industrial sector due to the high amounts of
water used in the process of slaughtering and further cleaning of the facility, approximately 62×106
m3/year of water is consumed worldwide (de Sena et al., 2009; Oller et al., 2011). Nevertheless, only
a small amount becomes a component of the final effluent; the remaining part has high biological and
chemical oxygen demands, high fat content and high concentrations of dry waste, sediments and total
suspended matter as well as nutrients (Masse and Masse, 2000b; Sroka et al., 2004; Debik and
Coskun, 2009). AOPs have recently come into use for elimination and degradation, water reuse and

46
pollution control issues showing excellent overall results (Cao, 2009; de Sena et al., 2009; Cao and
Mehrvar, 2011; Barrera, 2011; Barrera et al., 2011).
Further chemical oxidation in combined oxidation followed by biodegradation systems may
not lead to any significant change in the molecular weight distribution. Hence, it is reasonable for pre-
oxidation to be as short as possible and remove the biodegradable portion by cost-effective biological
processes. Nonetheless, the amount of COD removable with this strategy may be limited, making use
of longer oxidation necessary and the following biological process redundant (Poole, 2004). Internal
recycling between the oxidation and biological stage has been recommended for reducing the
chemical dose in such circumstances (Libra and Sosath, 2003).
If the original wastewater contains considerable amounts of biodegradable compounds, the
pre-oxidation step obviously will not lead to a significant improvement of biodegradability; rather, it
will only cause unnecessary consumption of chemicals (Oller et al., 2011). In such cases, a biological
pre-treatment, removing biodegradable compounds, followed by an AOP, converting the non-
biodegradable portion into biodegradable compounds with less chemical consumption is called for
(Hörsch et al., 2003; Vidal et al., 2004). Such combined systems are particularly favourable for
effluents such as olive mill wastewater or landfill leachates, which initially contain some
biodegradable fractions (i.e. sugars and proteins) which could easily be removed first and so, not
compete for the chemical oxidant.
A recent study by Cao (2009) found that the combined processes of ABR and UV/H2O2
photoreactor are highly efficient for the treatment of SSWW at a laboratory scale, with maximum
TOC, COD, and CBOD5 removal efficiencies of 89.9, 97.7, and 96.6%, respectively, for an influent
TOC concentration of 973.3 mg/L at a HRT of 3.8 days in the ABR compartments (Cao 2009; Cao
and Mehrvar, 2011). However, the results showed that the TN concentrations in the combined
processes had no significant changes (no more than 6% change); thus, the combined processes were
not able to remove TN from the wastewater effectively. Furthermore, there was no evidence to show
sequential nitrogen removal including aerobic nitrification and anaerobic denitrification. In summary,
for the biological removal of nutrients (N and P), an adequate combination of anaerobic and aerobic
processes is essential. An overview of the most frequently applied technologies and combined
reactors is outlined in Table 2.15, with specific attention to the evaluation of their treatment
efficiencies in terms of organic removal.

47
Table 2.15. Anaerobic–aerobic and UV/H2O2 systems for the treatment of wastewater.
Reactor Type1 Processes
2 Type of wastewater
3 HRT
4 (h) TOCin*
(mg/L)
BODin
(mg/L)
TNin
(mg/L)
TOC* removal
(%)
BOD removal
(%)
TN removal
(%)
Reference
RBC + SBR Ana-Ae Screened dairy manure 24-96 28300-40100 390-2045 110-313 86.1-98 88.5-92.5 54.7-95.5 Lo and Liao (1986)
UASB Ana Slaughterhouse 1.7-10 1500-2200 490-650 120-180 40-91 - - Sayed et al. (1987)
AnFB Ana Slaughterhouse, dairy
and brewery
8 430-850 - 4.8 50-80 - - Toldrá et al. (1987)
UASB Ana Slaughterhouse 12-40 1925-11118 490-650 110-240 68.4-82.3 85-90 24 Sayed and Zeeuw
(1988)
TAT Ae Slaughterhouse 6-30 3015 1905 14.3 69-95.5 90 2.1-52.2 Gariepy et al. (1989)
RBC + SBR Ana-Ae Mixture of cheese
whey and dairy
manure
48-120 36000-65700 282-470 28-38.2 99 80-95 26-99 Lo and Liao (1989)
AnaFB + ALSR Ana-Ae Complex Industrial 72-1176 3600-3900 - 140 60-65 - 96-98 Heijnen et al. (1991)
BCDT Ana-Ae Synthetic 3-11 - - 20 - - 90 Hano et al. (1992)
ABR Ana Slaughterhouse 2.5-26 450-730 - - 75-90 - 20-27 Polprasert et al.
(1992)
AnaFB Ana Slaughterhouse 36-96 7500 - - 27-85 - - Tritt (1992)
IAAFBR Ana-Ae Municipal 24 350 - - 80 - - Fdez-Polanco et al.
(1994)
VUV AOPs Atrazine effluent 6.7 10 - - 65-90 - - Gonzalez and Braun
(1994)
UASB + AF Ana-Ae Slaughterhouse 2-12 2450 1550 150 96 - - Borja et al. (1995a)
AnaFB Ana Slaughterhouse 0.5-8 250-4500 3120 310 75-98.9 - - Borja et al. (1995b)
HB + AS Ana-Ae Oil shale ash dump
leachate
211.2 2000-4600 810-2700 27-45 67-74 99 75-78.6 Kettunen and Rintala
(1995)
ABR Ana Palm oil mill 60 15103-65100 8200-35400 12-126 33.1-84.6 41.7-86 7.6-30.3 Setiadi et al. (1996)
AAGBR Ana-Ae Synthetic 48 3030-3650 - - 95-98 - - Shen and Guiot
(1996)
ABR Ana Slaughterhouse 20 4000 - - 75-95 - - Nachaiyasit and
Stuckey (1997)
UASB + AF Ana Slaughterhouse 28.8-156 5200-11400 - 19-74 44.9-97 - 95-98.4 Ruiz et al. (1997)
ABR Ana Swine waste 336-1008 59400 - 1682 70-78 - 48-55 Boopathy (1998)
ARSBFB Ana Slaughterhouse 0.5-1.5 10410 6600 230 90.2-96.2 - - Borja et al. (1998)
UASB + RBC Ana-Ae Domestic sewage 3-9 363-666 240-333 - 82.4-98.9 88.9-97.4 - Castillo et al. (1999)
ABR Ana Pulp and paper mill
black liquors
48 32000-40000 12000-16000 750-
1000
54-70 - - Grover et al. (1999)
MMHR Ana-Ae Degradation of PCE
and TCE
12-72 - - - - - - Miguez et al. (1999)
EGSB Ana Slaughterhouse - 1440-4200 1100-2400 - 65-80 - - Núñez et al. (1999)
GRABBR Ana Whiskey distillery 48-240 9500 3755 - 80-92.3 90.6-96.1 - Akunna and Clark
(2000)
AFFFBR Ana Slaughterhouse 3.5-31 1100-11300 600-1700 100-300 85-95 - - Del Pozo et al.
(2000)
ABR Ana Diluted, soluble and
colloidal
1.3-80 500 - - 40-95 - - Langenhoff et al.
(2000)

48
Reactor Type1 Processes
2 Type of wastewater
3 HRT
4 (h) TOCin*
(mg/L)
BODin
(mg/L)
TNin
(mg/L)
TOC* removal
(%)
BOD removal
(%)
TN removal
(%)
Reference
SBR Ana Slaughterhouse - 6908-11500 - - 90-96 - - Masse and Masse
(2000a)
DAF + UASB Ae-Ana Slaughterhouse 4-10 1100-7250 600-3900 90-150 70-90 - - Manjunath (2000)
UASB + AFBR Ana-Ae Synthetic textile 20 2700 - - 75 - - Yu et al. (2000)
BPCR + O3 Ae-AOPs PAHs 0.83 436 - - 91.7 - - Zeng et al. (2000)
CSTR + AS Ana-Ae Green olive debittering 1320 16500-23500 - 500-750 83.5 - - Aggelis et al. (2001)
UV/H2O2/Fe(II) + AS AOPs-Ae Semi-conductor
industry
12-72 145-2760 - - 90 - - Park et al. (2001)
UV/H2O2/Fe(III)/TiO2
+ FBR
AOPs-Ae Industrial 3.5 - - - 80.3 - - Sarria et al. (2001)
UASB + AS Ana-Ae Municipal 6.8 386-958 - - 85-93 - - Sperling et al. (2001)
AAGBR Ana-Ae Degradation of
Aroclor 1242
50.4 - - - - - - Tartakovsky et al.
(2001)
UASB + CSTR Ana-Ae Pulp and paper
industry effluent
11.54 5500-6600 900-1650 - 91 50-94 - Tezel et al. (2001)
O3 + SBBR AOPs-Ae Tannery 8 3500-4000 2000-2400 200-300 97 - 98 Di Iaconi et al.
(2002)
FBP + CC/EO Ae-AOPs Textile 3 800-1000 - - 95.4 - - Kim et al. (2002)
UV/H2O2/Fe(II) + AS AOPs-Ae PAHs 216 - - - 80-85 - - Nadarajah et al.
(2002)
ABR Ana Ice-cream 10.3-240 6200 3450 25 99 - - Uyanik et al. (2002)
ABR Ana Textile 20 4000 - - 90 - - Bell and Buckley
(2003)
AS + O3 Ae-AOPs Cork processing
industry
24-72 10000-40000 - - 31-85 - - Benitez et al. (2003a)
AS + O3 + SBR Ae-AOPs-Ae Cork processing
industry
3-72 10000-40000 - - 25-91 - - Benitez et al. (2003b)
ABR + AS Ana-Ae Municipal 13.5-15.2 300 162 38.4 78.6-83 92.5-94 46.4-87.3 Bodík et al. (2003)
FFB + FFB Ana-Ae Slaughterhouse 112.8-
175.2
400-1600 200-650 105-320 92 99 95 Del Pozo and Diez
(2003)
ABR Ana Slaughterhouse 112.8-
175.2
7230 3180 690 92 99 - Del Pozo et al.
(2003)
MBR Ana Synthetic, Vegetables
and Slaughterhouse
1.2 5800-64600 2200-24200 301-
1580
97 - - Fuchs et al. (2003)
Ultrasound + AS AOPs-Ae Raw paper mill 24-168 600-15000 220 - 73-83 93.2-99 - Gonze et al. (2003)
UV/H2O2/Fe(III) + FBR AOPs-Ae Industrial 2-5 - - 90 - - Sarria et al. (2003)
UASB + AS Ana-Ae Starch Industry 120 20000 - 1000 77-93 - 90 Sklyar et al. (2003)
UASB Ana Slaughterhouse 2-7 3265-14285 914-1917 35-104 75-90 - - Torkian et al. (2003)
EO + FBR AOPs-Ae Industrial 3-24 14350 136 6.8 94 - - Torres et al. (2003)
SFABR Ana Brewery 48 85000 - 411.6 90 - - Uyanik (2003)
ABR Ana Synthetic 24 3000 - - 86 - - Vossoughi et al.
(2003)
UASB + AFBR Ana-Ae Synthetic textile 2.7-32.7 2000-3000 - - - - - Chen (2004)
ABR Ana Sanitation on-site 22 564 - - 58 - - Foxon et al. (2004)

49
Reactor Type1 Processes
2 Type of wastewater
3 HRT
4 (h) TOCin*
(mg/L)
BODin
(mg/L)
TNin
(mg/L)
TOC* removal
(%)
BOD removal
(%)
TN removal
(%)
Reference
UASB + CSTR Ana-Ae Cotton textile mill 138 604-1038 - - 40-85 - - Isik and Sponza
(2004)
BCR + UV/H2O2/Fe(II) Ae-AOPs Food industry 48 300-16200 100-6600 - 69.3 - - Kotsou et al. (2004)
UAAFBIR Ana-Ae Synthetic 9 365-3500 - 245.5 95-98 - - Moosavi et al. (2004)
SBR + MBR Ae-RO Slaughterhouse 12 2780-6720 1200-3000 49-287 98.1 99.6 98.2 Sroka et al. (2004)
UASB + CSTR Ana-Ae Food solid waste
leachate
138 5400-20000 405-841 258-679 96-98 92.9-93.8 99.6 Agdag and Sponza
(2005)
O3 + BABS AOPs-Ae Paper mill - 1586.3 282.2 - 50 50 - Bijan and Mohseni
(2005)
SBR Ae Slaughterhouse 72 7685 - 1057 98.6 - 97.4 Cassidy and Belia
(2005)
IAAFFR Ana-Ae Slaughterhouse 22.56-91.2 1190-2800 610-1150 150-260 93 97 69 Del Pozo and Diez
(2005)
RAAIBB Ana-Ae Sewage 1.2-15.5 345 - 41 84 - 96 Garbossa et al.
(2005)
ABR + CSTR Ana-Ae Synthetic 249.1 3000 - - 92 - - Kuşçu and Sponza
(2005)
AASBR + FBNR Ana-Ae Slaughterhouse 15 7780 - 88 99 - 85 Merzouki et al.
(2005)
PC + AS Ana-Ae Textile 22-82 800-1200 - 7-21 50-85 - - Kapdan and
Alparslan (2005)
SBR + EO Ae-AOPs Food industry 168 8000-35000 3500-20000 1000-
2000
98 - - Kyriacou et al.
(2005)
AdNR Ana Slaughterhouse - 614.5 - 163.7 - - 95 Reginatto et al.
(2005)
AS + EO Ae-AOPs Tannery 0.25 2386-3000 - 292-426 99 - 99.7 Szpyrkowicz et al.
(2005)
AAGBR Ana-Ae TCE effluent 17-20 800 - - - - - Tartakovsky et al.
(2005)
SAAMB Ana-Ae Synthetic 72.7 1300-10500 - 110-
1220
97-99 - 26-99 Zhang et al. (2005)
O3 + SBR AOPs-Ae Paper mill 24 455-1145 109.2-194.7 - 37-90 - - Balcioǧlu et al.
(2006)
AS + O3 Ae-AOPs Tannery 7.8 2420 - 140 15-38 - - Dogruel et al. (2006)
UASB + AS Ana-Ae Olive mill + municipal 28.3 1800-4400 - - 75-95 - - Gizgis et al. (2006)
UV/H2O2 AOPs NOM in groundwater 0.25 17.5 - - 85-94 - - Goslan et al. (2006)
UASB + CSTR Ana-Ae Wool acid dying 79.2 499-2000 - - 83-97 - - Isik and Sponza
(2006)
ABR + CSTR Ana-Ae Synthetic 249.1 3000 - 133 80-99 - 77.4 Kuşçu and Sponza
(2006)
AS + MBR Ana-Ae Municipal 5.8-7.9 356-371 171-209 60.7-
62.3
55.3-91.6 98.1-99.9 83.9 Mouthon-Bello and
Zhou (2006)
ABR + BASR Ana-Ae Pharmaceutical 5-60 9736-19862 350-8600 - 85.3-91.2 - - Zhou (2006)
UBF + MBR Ana-Ae Synthetic 24 6000-14500 - 300-
1000
99 - 46 Ahn et al. (2007)

50
Reactor Type1 Processes
2 Type of wastewater
3 HRT
4 (h) TOCin*
(mg/L)
BODin
(mg/L)
TNin
(mg/L)
TOC* removal
(%)
BOD removal
(%)
TN removal
(%)
Reference
UV/H2O2 + AS AOPs-Ae Textile 1-2 500 - - 86.4-99 - - Arslan-Alaton et al.
(2007)
UV/H2O2/Fe(II) + AS AOPs-Ae COCs 168-1344 126 - - 80 - - Kastanek et al.
(2007)
UASB + ASCS Ana-Ae Municipal 3.53-6.2 341 - - 82.7-88.3 - - La Motta et al.
(2007)
ARB + EO Ana-AOPs Landfill leachate 3 16271 9100 1860 98.5 99.9 64.2-99.9 Lei et al. (2007)
UV/H2O2 AOPs Trichloroethene 0.5 - - - 70 - - Li et al. (2007)
AFFFBR + AS Ana-Ae PTA effluent 23-27.2 5000 - - 96.4 - - Pophali et al. (2007)
UASB + CSTR Ana-Ae Pharmaceutical - 3000 120-400 - 97 - - Sponza and
Demirden (2007)
UV/H2O2 + BAC AOPs-Ae DBPs - - - - 52-99 - - Toor and Mohseni
(2007)
UASB + UV/TiO2 Ana-AOPs Dairy 6 5000 2800 16.5 95 - - Banu et al. (2008)
ABR +
O3/UV/H2O2/Fe(II)
Ana-AOPs Textile 72 250-3135 - - 92-97 - - García-Montaño et
al. (2008)
UASB + CSTR Ana-Ae Simulated textile 19.2-29.3 4214 3120 - 91-97 - - Isik and Sponza
(2008)
AS + UV/TiO2 Ae-AOPs High salinity 25 200 - - 98 - - L'Amour et al. (2008)
MBR + O3 Ae-AOPs Paper mill 72 326 158 - 70 - - Mänttäri et al. (2008)
HAD + UV/TiO2 Ana-AOPs NOM 288 1.85 - 100 - - 96 Rizzo et al. (2008)
UV/H2O2/Fe(II) + IBR AOP-Ae Surfactant 5-20 1500-1533 332-367 - 94 - - Wang et al. (2008)
SAAB Ana-Ae Diluted landfill
leachate
- 1000-3300 - 80-230 94 - 95 Yang and Zhou
(2008)
EGSB + ABFR Ana-Ae POME 72 32520 - 644 95.6 - 99.3 Zhang et al. (2008)
ABR + O3 Ana-AOPs MTE 336.5 958 290 - 97 92.7 - Artanto et al. (2009)
AS + O3 Ae-AOPs Paper mill 6-20 1500-22500 - - 75.5-80 - - Assalin et al. (2009)
AS + UV/TiO2 Ae-AOPs Industrial 72 1599 - - 62 - - Barreto-Rodrigues et
al. (2009)
SBR + UV/H2O2/Fe(II) Ae-AOPs Swine 24 5417 - 1130 97.3 - 96.5 Ben et al. (2009)
UV/H2O2/Fe(II) + FBR AOPs-Ae Plastic products 1 - - - 72-73.6 33.9 - Chen et al. (2009)
DAF + UV/H2O2/Fe(II) Ae-AOPs Slaughterhouse 0.5 2800-3000 1400-1600 - 80.3-97.6 70.3-95.7 - de Sena et al. (2009)
WL + UV/H2O2/TiO2 Ae-AOPs Biologically pre-
treated grey-water
0.2 5.5 - - 63.6 - - Gulyas et al. (2009)
Fungi +
UV/H2O2/Fe(II)
Ana-AOPs Olive Oil Mill
wastewater
1 220 - - 77 - - Justino et al. (2009)
UV + UV/H2O2 AOPs Pharmaceutical - - - - 86-99 - - Kim et al. (2009a)
UV + UV/H2O2 AOPs Pharmaceutical and
PCP
- - - - 90 - - Kim et al. (2009b)
O3 + BAC + CDI AOPs-Ae-DI RO brine 0.33 15.6-44.2 5.4 - 31.5-88.7 - - Lee et al. (2009)
UV/H2O2 AOPs Slaughterhouse - - - - 95 - - Luiz et al. (2009)
UV/H2O2/Fe(II) + AS AOPs-Ae PAHs 12 - - - 25 - - Rafin et al. (2009)

51
Reactor Type1 Processes
2 Type of wastewater
3 HRT
4 (h) TOCin*
(mg/L)
BODin
(mg/L)
TNin
(mg/L)
TOC* removal
(%)
BOD removal
(%)
TN removal
(%)
Reference
IBR + UV/H2O2/Fe(II) Ae-AOPs Pharmaceutical 26 3400 - 0.1 90 - 90 Sirtori et al. (2009)
MBR/BAC + UV/O3 Ae-AOPs Drinking water 1.3 - - - 40-60 - - Treguer et al. (2009)
AAIBR Ana-Ae Potato starch 6-24 1100-4500 - - 88.4-98.7 - - Wang et al. (2009a)
AnaF + ACOT + PChR Ana-Ae-AOPs Landfill leachate 48 2000-10000 230-700 720-
4500
90.5-94.8 - 89-90.6 Wang et al. (2009b)
UV/H2O2 AOPs Insecticide 2 - - - 97 - - Abramović et al.
(2010)
VUV + UV + UV/H2O2 AOPs Neurotoxins effluent 6.63 6.63 - - 50-88 - - Afzal et al. (2010)
UV + UV/H2O2 AOPs Tetracycline’s effluent 2 67.1 - - 88.9 - - López-Peñalver et al.
(2010)
MBR + O3 Ae-AOPs Pharmaceutical 1 10900 - 420 99 - - Mascolo et al. (2010)
UV/H2O2 AOPs Per-fluorinated
Surfactants
2-960 100 - - 60 - - Quinete et al. (2010)
ABR + O3 Ana-AOPs Pharmaceutical 27 22 - - 90 - - Reungoat et al.
(2010)
AS + O3 Ae-AOPs Municipal - 269 42 14.7 78.1 81.4 42.2 Rosal et al. (2010)
UV/H2O2 AOPs Pharmaceutical - 6.6-10.3 - 0.2-14.8 90 - - Rosario-Ortiz et al.
(2010)
AS + O3 Ae-AOPs Pharmaceutical 2-22 139 49 33 75.5 91.8 70.3 Schaar et al. (2010)
O3 + BAC AOPs-Ae THMs and NOM 168-240 3.8-4.5 - - 51 - - Yan et al. (2010)
ABR + UV/H2O2 Ana-AOPs Synthetic
Slaughterhouse
76.3-91.2 2110-2305 1020-1143 80-334 97.7 96.6 1-6 Cao 2009; Cao and
Mehrvar (2011)
UV + VUV + H2O2 AOPs Synthetic
Slaughterhouse
2.5 1000 - - 57.6 - - Barrera (2011);
Barrera et al. (2011)
O3 + UV/H2O2 AOPs Pharmaceutical and
PCP
- - - - 90 - - Kim et al. (2011)
ABR + AS + UV/H2O2 Ana-Ae-AOPs Synthetic
Slaughterhouse
74.9-168 941-1009 640 254-428 89.5-99.9 99.7 76.4-81.6 This study
1 Reactor Type: AAGBR, anaerobic-aerobic granular biofilm reactor; AAIBR, anaerobic-aerobic integrative baffled reactor; AASBR, anaerobic-anoxic sequencing batch reactor; ABFR, aerobic biofilm reactor;
ABR, anaerobic baffled reactor; ACOT, aerobic contact oxidation tank; AdNR, anaerobic denitrifying reactor; ARSBFB, anaerobic reactor with sludge blanket and filter bed; AS, activated sludge; AF, anaerobic
filter; AFBR, anaerobic fluidized bed reactor; AFFFBR, anaerobic fixed film fixed bed reactor; ALSR, air lift suspension reactor; AnF, anaerobic filter; AnFB, anaerobic fluidized bed; ARB, aged-refuse
biological reactor; ASCS, aerobic solid contact system; BABS, batch aerobic biological system; BAC, biological activated carbon; BASR, biofilm airlift suspension reactor; BCDT, bubble column with a draught
tube; CDI, capacitive deionization; CSTR, continuously stirred tank reactor; DAF, dissolved air flotation; EGSB, expanded granular sludge bed; EO, electrochemical oxidation; FBNR, fixed bed nitrification
reactor; FBR, fixed bed biological reactor; FFB, fixed film bioreactor; GRABBR, granular-bed anaerobic bed reactor; HAD, heterotrophic-autotrophic denitrification; HB, hybrid bioreactor; IAAFBR, integrated
anaerobic-aerobic fluidized bed reactor; IAAFFR, integrated anaerobic-aerobic fixed film reactor; IBR, immobilised biomass reactor; MBR, membrane bioreactor; MMHR, methanogenic-methanotrophic hybrid
reactor; PCR, packed column reactor; PChR, photochemical reactor; RAAIBB, radial anaerobic/aerobic immobilized biomass bioreactor; RBC, rotating biological contactors; SAAB, simultaneous aerobic and
anaerobic bioreactor; SAAMB, staged anaerobic-aerobic membrane bioreactor; SBR, sequencing batch reactor; SBBR, sequencing biofilm batch reactor; SFABR, split fed anaerobic baffled reactor; TAT,
thermophilic aerobic treatment; UAAFBIR, upflow anaerobic/aerobic fixed bed integrated reactor; UASB, upflow anaerobic sludge bed; UBF, upflow bed filter; WL, wetland; BCR, bubble column reactor; IBR,
immobilised biomass reactor; FBP, fluidized biofilm process; CC/EO, chemical coagulation/electrochemical oxidation; EO, electrochemical oxidation. 2 Process Type: Ae, aerobic; Ana, anaerobic; AOP, advanced oxidation process; DI, deionization; RO, reverse osmosis.
3 Type of waste water: COCs, chlorinated organic compounds; DBPs, disinfection by-products; MTE, mechanical thermal expression; NOM, natural organic matter; PAHs, polycyclic aromatic hydrocarbons;
PCE, tetrachloroethylene; PCP, personal care products; POME, palm oil mill effluent; PTA, purified terephthalic acid; TCE, trichloroethylene; THMs, trihalomethanes. 4 HRT, Hydraulic retention time.
* COD was analysed in some cases instead of TOC.

52
2.5. Concluding remarks
It may be stated that it is operationally and economically advantageous to adopt anaerobic–
aerobic processes in the treatment of high strength industrial wastewaters since it couples the benefit
of anaerobic digestion in high-strength wastewater with the benefits of aerobic digestion with better
COD and VSS removal (Ros and Zupancic, 2004), as well as using AOPs such as UV/H2O2 as a post-
treatment alternative.
This chapter has shown several examples of combined biological and photochemical
treatment, including the studies by Cao (2009), Wang et al. (2009b) and Cao and Mehrvar (2011),
who investigated the treatment of industrial wastewater using a combined photo-oxidation and
biological treatment with a higher rate of TOC removal as compared with other processes, reaching
removal rates of COD, TOC, BOD, and TN up to 95, 96, 99 and 80%, respectively, as well as the
complete disinfection and bacterial inactivation completed by the photochemical process as a post-
treatment stage (Barrera, 2011; Barrera et al., 2011). Therefore, a combined anaerobic-aerobic and
UV/H2O2 system was chosen for the treatment of SSWW in this study. Results obtained from this
work will help to extend the information on the combined biological and AOPs process, its
performance and effectiveness in removing TOC, TN, and BOD from slaughterhouse wastewater.

53
CHAPTER 3
MATERIALS AND METHODS
3.1. Introduction
This study is focused on determining the performance and the treatment ability of the ABR,
the aerobic AS, and the UV/H2O2 processes, as well as their combination for the removal of TOC,
TN, and BOD from synthetic SSWW. To that end, experiments were conducted in order to assess the
efficiencies and performance of such processes. The study consists of different configurations of the
combined anaerobic-aerobic and UV/H2O2 processes for the treatment of SSWW, interchanging their
order for obtaining more information that is accurate about the behaviour of each configuration in the
treatment of SSWW. In this chapter, an overall description of the research approach, materials, and
procedures is presented.
3.2. Materials
3.2.1. Synthetic slaughterhouse wastewater (SSWW)
The wastewater in this study was the SSWW, prepared in accordance with the previous studies
(Cao, 2009; Cao and Mehrvar, 2011; Barrera, 2011; Barrera et al., 2011), and based on the recipe
developed by Stephenson and Lester (1986) in order to compare the main differences between the
results found in the new configurations and those of the previous studies. The SSWW contains (Table
3.1) commercial meat extract powder (Oxoid Lab Lemco L0029, Oxoid Ltd.), whose components are
listed in Table 3.2; glycerol (C3H8O3); ammonium chloride (NH4Cl); sodium chloride (NaCl);
potassium dihydrogen orthophosphate (KH2PO4); calcium chloride (CaCl2); and magnesium sulphate
heptahydrate (MgSO4•7H2O). The pH values and the concentrations of TOC, TN, and CBOD5 were
measured to investigate the characteristics of the SSWW and these were compared against the results
found in the open literature. A hydrogen peroxide solution (1,110 g/L density) containing 30%w/w of
H2O2 was used in the UV/H2O2 process.

54
Table 3.1. Synthetic slaughterhouse wastewater recipe.
(Adapted from Stephenson and Lester 1986).
Component Concentration (mg/L dw*)
Commercial meat extract powder (Oxoid Lab Lemco L0029, Oxoid Ltd.) 1950
Glycerol (C3H8O3) 200
Ammonium chloride (NH4Cl) 360
Sodium chloride (NaCl) 50
Potassium dihydrogen orthophosphate (KH2PO4) 30
Calcium chloride (CaCl2) 24
Magnesium sulphate (MgSO4•7H2O) 7.5
* dw, distilled water.
Table 3.2. Components of the meat extract powder provided by the manufacturer (Oxoid Ltd.)
Symbol Amino acid %w/w
Ala Alanine (C3H7NO2) 5.85
Arg Arginine (C6H14N4O2) 7.10
Asp Aspartic acid (C4H7NO4) 5.10
Cys Cysteine (C3H7NO2S) 0.68
Glu Glutamic acid (C5H9NO4) 10.71
Gly Glycine (C2H5NO2) 10.85
Ile Isoleucine (C6H13NO2) 3.17
Leu Leucine (C6H13NO2) 3.15
Lys Lysine (C6H14N2O2) 4.78
Met Methionine (C5H11NO2S) 2.61
Phe Phenylalanine (C9H11NO2) 2.34
Pro Proline (C5H9NO2) 7.79
Ser Serine (C3H7NO3) 1.87
Thr Threonine (C4H9NO3) 2.54
Trp Tryptophan (C11H12N2O2) 0.34
Tyr Tyrosine (C9H11NO3) 0.66
Val Valine (C5H11NO2) 3.06
Total 72.60
3.2.2. Anaerobic and aerobic inoculum
The anaerobic and aerobic sludge seeds (37,500 mgSS/L) were obtained from the Ashbridges
Bay Wastewater Treatment Plant, a municipal wastewater treatment plant in Toronto, Ontario,

55
Canada. A total of 10 L of the anaerobic sludge seed was loaded into the ABR (about 2 L in each
compartment) whereas, 5 L of the aerobic sludge seed were loaded into the aerobic AS reactor. The
inoculum (2.5 gVSS/L) in the compartments was acclimatized to the SSWW by feeding the
wastewater continuously into the reactors. Excess of the supply of sludge was stored in a closed
container and fed by SSWW periodically at room temperature for future usage.
3.3. Experimental setup
Combined processes consisted of two stages: a biological process using an ABR and a
UV/H2O2 process developed by Cao and Mehrvar (2009, 2011) as shown in Figure 3.1. Considering
the relatively high biodegradability of the SSWW, the ABR is placed before the UV photoreactor.
The ABR consists of 5 equal-volume compartments with individual gas headspaces. Each
compartment is further divided into two small chambers (2 and 8 cm in width, respectively) by a 45°
slanted edge baffle leading to downflow and upflow of the wastewater, which provided effective
mixing and contact time between the wastewater and the biomass within each compartment (Kuşçu
and Sponza, 2006; Uyanik et al., 2002). No additional mixing was supplied in all compartments. The
total working volume of the ABR was 33.7 L (total of 50, 15, and 50 cm of length, width, and height,
respectively). The wastewater sampling ports were located 40 cm from the bottom of each
compartment and 4 cm from the side of its slanted edge baffle, while the sludge sampling ports were
located at 10 cm from the bottom of each compartment and 4 cm from the side of its slanted edge
baffle.
The stainless steel UV photoreactor (Siemens – Wallace & Tiernan® UV Disinfection
Systems, Barrier® SL-1S) had a total working volume of 1.35 L (8 cm external diameter and 34 cm
length). A UV lamp (output power: 6 W, wavelength: 254 nm, and diameter: 2.5 cm) was inserted
into the center of the cylindrical photoreactor. The UV lamp was covered by a quartz sleeve in order
to protect the lamp from fouling that may interfere with the UV radiation emission. Figure 3.2 shows
the schematic diagram of the UV photoreactor.

56
Figure 3.1. Schematic diagram of the combined processes of ABR and UV/H2O2 photoreactor.
(Adapted from Cao, 2009; Cao and Mehrvar, 2011).

57
Figure 3.2. Schematic diagram of the individual UV photoreactor (Siemens, Barrier® SL-1S), V=1.35L.

58
In order to optimize the combined ABR and UV/H2O2 process for wastewater treatment in
previous studies (Cao, 2009; Cao and Mehrvar, 2011), it was proposed that an aerobic stage be
located after the anaerobic process and before the post-treatment by UV/H2O2 as shown in Figures 3.3
and 3.4. An aerobic reactor was proposed to operate at a constant flow rate of 10.51 mL/min under
HRT of 7 days. The aerobic reactor had an effective volume of 12 L. For the easy build-up of
nitrifying bacteria in the bioreactor, no sludge should be discharged and a DO concentration must be
maintained over 2.0 mg/L. The internal recycle ratio was recommended to be in the range of 100–
300% of influent flow rate for the denitrification of oxidized nitrogen as suggested by Ahn et al.
(2007). Different configurations were also designed in order to observe the performance of the system
by varying the number of stages and their order, and thus determine the most effective alternative for
the treatment of slaughterhouse wastewater by means of a cost-effective method as shown in Figures
3.5 to 3.10; where, the blue color indicates the flow direction of wastewater, the red color indicates
the anaerobic process, the green color indicates the aerobic process, and the purple color indicates the
photochemical process.
3.4. Experimental procedure
3.4.1. Acclimatization of the inoculum
The ABR was filled with 10 L of an anaerobic sludge seed (37,500 mgSS/L), using 2 L of the
inoculum for each of the 5 compartments, approximately 1/3 of the total working volume of each
compartment; whereas, 5 L of an aerobic sludge seed was loaded into the aerobic AS reactor. The
inoculum (2.5 gVSS/L) was acclimatized by feeding the SSWW continuously into the reactors at a
constant flow rate of 5.25 mL/min. During the 60-day acclimatization, the influent concentration was
gradually increased from 20, 40, 60, and 80 to 100% of the raw SSWW, and then the system was
inoculated with 10 – 20 gVSS/L. The concentration of SSWW was increased from 20 to 40%, from
40 to 60%, from 60 to 80%, and from 80 to 100% on the 16th
, 24th
, 30th
, and 42nd
day, respectively.
Samples were collected from every compartment during the acclimatization to measure their
TSS and VSS concentrations. These parameters were used to observe the growth of microorganisms
and to confirm the acclimatization process. On the other hand, if any washout was observed in the
effluent of the reactors, the sludge should be removed in order to prevent an increase of TSS in the
wastewater, which can result in a reduction of the efficiency and will require further post-treatment.

59
Figure 3.3. Schematic diagram of the experimental set up for the treatment of synthetic slaughterhouse wastewater by combined
anaerobic-aerobic and UV/H2O2 processes.

60
Figure 3.4. Laboratory view of the experimental setup.
Anaerobic Baffled
Reactor
Peristaltic Pump 1
Peristaltic Pump 2
Mini-Peristaltic Pump
Aerobic AS Reactor
UV/H2O
2
Photoreactor
Feed Tank Collection Tank
Peristaltic Pump 3
H2O
2 Container

61
Figure 3.5. Schematic diagram of the experimental set up for the treatment of synthetic slaughterhouse wastewater by anaerobic
process alone. The blue color indicates the flow direction of wastewater.

62
Figure 3.6. Schematic diagram of the experimental set up for the treatment of synthetic slaughterhouse wastewater by aerobic
process alone. The blue color indicates the flow direction of wastewater.

63
Figure 3.7. Schematic diagram of the experimental set up for the treatment of synthetic slaughterhouse wastewater by UV/H2O2
process alone. The blue color indicates the flow direction of wastewater.

64
Figure 3.8. Schematic diagram of the experimental set up for the treatment of synthetic slaughterhouse wastewater by combined
anaerobic-aerobic processes. The blue color indicates the flow direction of wastewater.

65
Figure 3.9. Schematic diagram of the experimental set up for the treatment of synthetic slaughterhouse wastewater by combined
aerobic-anaerobic processes. The blue color indicates the flow direction of wastewater.

66
Figure 3.10. Schematic diagram of the experimental set up for the treatment of synthetic slaughterhouse wastewater by combined
anaerobic-aerobic and UV/H2O2 processes. The blue color indicates the flow direction of wastewater.

67
3.4.2. ABR process
After 60 days of acclimatization period, the ABR was run alone (Figure 3.5) using 5 different
influent concentrations of the SSWW at various flow rates in the range of 2.93 to 11.70 mL/min, HRT
of 2 to 8 days, TOC loading rates of 0.03–1.01 g/(L.day), and TN loading rates of 0.01–0.19
g/(L.day).
As shown in Figure 3.5, the SSWW was homogenized by a recirculating pump (18). The ABR
(5) was fed continuously from a feed tank (1) using the peristaltic pump (Blue-White Industries Ltd.
Flexflo A-100NV) (2). The SSWW was passed through an acrylic flow meter (Omega FL-2018) (3)
in order to measure the flow rate. The flow was then directed to the ABR using the 3-way valve (4)
and flowed downwards and upwards within the five compartments of the ABR. Those compartments
contained an anaerobic sludge layer (9) where the biological degradation occurs. Each compartment
had a sludge sampling port (7), located 10 cm from the base of the ABR and 4 cm from the side of the
45° slanted edge baffle, to measure TSS and VSS. SSWW sampling ports (8) were located 40 cm
from the base of the ABR and 4 cm from the side of the 45° slanted edge baffle. SSWW treated in the
ABR was either discharged into a collection tank (14) or flowed into another reactor for post-
treatment by means of the 3-way valve (10).
SSWW samples were taken by gravity from every compartment. When collecting samples, the
first 10 mL were eliminated to avoid the effect of the sampling ports; then, volumes of 30 mL were
collected from each SSWW sampling port and were diluted to reach 1/3 of their concentrations in
order to measure temperature, pH, DO, TOC, TN, CBOD5, TSS, and VSS. Sludge samples were also
collected from the sludge sampling ports in order to measure TSS and VSS.
3.4.3. Aerobic AS process
The aerobic AS process was run alone (Figure 3.6) using five different influent concentrations
of the SSWW at various flow rates in the range of 2.93 to 11.70 mL/min, HRT of 2 to 8 days, TOC
loading rates of 0.03–1.01 g/(L.day), and TN loading rates of 0.01–0.19 g/(L.day). As shown in
Figure 3.6, the SSWW was homogenized by a recirculating pump (18). The aerobic AS reactor (21)
was fed continuously from a feed tank (1) using the peristaltic pump (2). The SSWW was passed
through an acrylic flow meter (3). The flow was directed to the aerobic AS reactor using the 3-way

68
valve (4) and flowed into the aeration tank, where oxygen was introduced by a diffuser at a constant
flow rate of 500 mL/min (23) followed by a clarifier. The SSWW treated in the aerobic AS reactor
was either discharged into a collection tank (14) or flowed into another reactor for post-treatment due
by means of the 2-way valves (33) and (24).
SSWW samples were taken from the aeration tank and the clarifier. Volumes of 30 mL were
collected from each stage and diluted to reach 1/3 of their concentrations in order to measure
temperature, pH, DO, TOC, TN, CBOD5, TSS, and VSS.
3.4.3. UV/H2O2 process
The UV/H2O2 process was run alone (Figure 3.7), using 3 different influent concentrations (5,
10 and 25%) of the SSWW at various flow rates in the range of 2.93 to 11.70 mL/min, HRT in the
range from 30 to 180 min, TOC concentrations of 57.59–140.91 mg/L, and H2O2 concentrations of 0,
100, 300, 600, 900, 1200, 1500 and 2000 mg/L.
As shown in Figure 3.7, the SSWW was homogenized by a recirculating pump (18). The UV
photoreactor (12) was fed continuously from a feed tank (1) using the peristaltic pump (2). The
SSWW was passed through an acrylic flow meter (3). The flow was directed to the UV photoreactor
using the 3-way valve (4) and flowed into the UV photoreactor, where H2O2 was introduced from a
H2O2 solution container (15) using a flow rate control valve (16). The SSWW treated in the UV
photoreactor was either discharged into a collection tank (14) or flowed into another reactor for post-
treatment due to the 2-way valve (25).
An experiment without UV irradiation, called the dark experiment, was also conducted to
evaluate the possible adsorption of organic compounds on the UV photoreactor walls using H2O2
concentrations of 0, 600, and 1200 mg/L. SSWW samples were taken from the UV photoreactor
effluent. Volumes of 30 mL were collected from each stage and were diluted to reach 1/3 of its
concentrations and to measure temperature, pH, DO, TOC, TN, and CBOD5. Two replicates were
made for every analytical measurement. Catalase was required to eliminate H2O2 from the samples
during CBOD5 measurement for accurate results. It catalyzes the decomposition of H2O2 to water and
oxygen as expressed in Section 2.3.7. Experiments using a batch recirculation mode (Figure 3.11)
were also conducted in order to evaluate the optimum H2O2 dosage and the molar ratio of

69
[H2O2]/[TOC]. Different inlet concentrations of H2O2 (0, 100, 300, 600, 900, 1200, 1500, and 2000
mg/L), SSWW (64.88, 163.69, and 349.84 mgTOC/L), and HRT (30, 60, 90, 120, 150, and 180 min)
were studied.
3.4.4. Combined anaerobic-aerobic processes
Combined processes of the ABR and the aerobic AS (Figure 3.8) were run using various flow
rates of 3.75 to 7.50 mL/min, HRT of 3.12 to 6.24 days, TOC loading rates of 0.16–0.32g/(L.day),
and TN loading rates of 0.07–0.14 g/(L.day). As shown in Figure 3.8, the SSWW was homogenized
by a recirculating pump (18). The ABR (5) was fed continuously from a feed tank (1) using the
peristaltic pump (2). The SSWW was passed through an acrylic flow meter (3). The flow was then
directed to the ABR using the 3-way valve (4) and flowed downwards and upwards within the 5
compartments of the ABR. Those compartments contained an anaerobic sludge layer (9) where the
biological degradation occurs. Each compartment had a sludge sampling port (7), located 10 cm from
the base of the ABR and 4 cm from the side of the 45° slanted edge baffle, to measure TSS and VSS.
The SSWW sampling ports (8) were located 40 cm from the base of the ABR and 4 cm from the side
of the 45° slanted edge baffle. The treated SSWW in the ABR was flowed into the aerobic AS reactor
for post-treatment using a 3-way valve (10) and flowed into the aeration tank, where oxygen was
introduced by a diffuser at a constant flow rate of 500 mL/min (23) followed by a clarifier. The
treated SSWW was then discharged into a collection tank (14). SSWW samples were taken similarly
to the previous processes. In addition, an experiment was conducted with recycling mode, in which
the SSWW treated in the aerobic AS reactor was recycled into the ABR using the 2-way valve (33).
3.4.5. Combined aerobic-anaerobic processes
Experiments for the aerobic AS and ABR combined processes (Figure 3.9) were conducted
using similar operating conditions as other processes. As shown in Figure 3.9, the SSWW was
homogenized by a recirculating pump (18). The ABR (5) was fed continuously from a feed tank (1)
using the peristaltic pump (2). The SSWW was passed through an acrylic flow meter (3). The flow
was then directed to the aerobic AS reactor using the 3-way valve (4) and flowed into the aeration
tank, where oxygen was introduced by a diffuser at a constant flow rate of 500 mL/min (23) followed
by a clarifier. The treated SSWW was then directed into the ABR for post-treatment using the 3-way
valve (33) and flowed downwards and upwards within the compartments of the ABR.

70
Figure 3.11. Experimental setup of the batch recirculation UV/H2O2 process.

71
Those compartments contained an anaerobic sludge layer (9) where the biological degradation
occurs and each compartment had a sludge sampling port (7), located 10 cm from the base of the
ABR and 4 cm from the side of the 45° slanted edge baffle, to measure TSS and VSS. SSWW
sampling ports (8) were located 40 cm from the base of the ABR and 4 cm from the side of the 45°
slanted edge baffle. The treated SSWW was discharged into a collection tank (14). SSWW samples
were taken similarly to the previous processes.
3.4.6. Combined anaerobic-aerobic and UV/H2O2 processes
Experiments for combined processes of the ABR, the aerobic AS, and UV/H2O2 (Figure 3.10)
were conducted at various flow rates of 5.90 to 7.50 mL/min, HRT of 3.15 to 4.00 days, TOC of
941.19–1,006.90 mg/L, and TN of 200.03–214.08 mg/L.
As shown in Figure 3.10, the SSWW was homogenized by a recirculating pump (18). The
ABR (5) was fed continuously from a feed tank (1) using the peristaltic pump (2). The SSWW was
passed through an acrylic flow meter (3) in order to measure the flow rate. The flow was then directed
to the ABR using the 3-way valve (4) and flowed downwards and upwards within the compartments
of the ABR. Those compartments contained an anaerobic sludge layer (9) where the biological
degradation occurs. Each compartment had a sludge sampling port (7), located 10 cm from the base of
the ABR and 4 cm from the side of the 45° slanted edge baffle, to measure TSS and VSS. SSWW
sampling ports (8) were located 40 cm from the base of the ABR and 4 cm from the side of the 45°
slanted edge baffle. The treated SSWW in the ABR flowed into the aerobic AS reactor for post-
treatment by means of the 3-way valve (10) and flowed into the aeration tank, where oxygen was
introduced by a diffuser at a constant flow rate of 500 mL/min (23) followed by a clarifier. The
treated SSWW was directed to the UV photoreactor using the 3-way valve (24) and flowed into the
UV photoreactor, where H2O2 was introduced from a H2O2 solution container (15) using a flow rate
control valve (16). SSWW treated in the UV photoreactor was discharged into a collection tank (14).
SSWW samples were taken similarly to the previous processes.
In combined processes, there is a relationship between the HRT and the volume of each
reactor. Considering the flow rate of the H2O2 negligible, this relationship can be represented by
Equation (3.1).
72
(3.1)
where,
VABR = volume of the ABR (L);
VAS = volume of the aerobic AS reactor (L);
VUV = volume of the UV photoreactor (L);
HRTABR = hydraulic retention time of the ABR process (h);
HRTAS = hydraulic retention time of the aerobic AS process (h); and
HRTUV = hydraulic retention time of the UV/H2O2 process (h).
3.5. Analytical techniques
Different parameters of the SSWW were measured, including temperature, pH, DO, TSS,
VSS, TOC, TN, and CBOD5 according to the Standard Methods (APHA, 1998). The details of each
analytical technique are explained in the following sections.
3.5.1. Dissolved oxygen (DO)
DO of influent and effluent samples of the SSWW was measured by a dissolved oxygen meter
(YSI 58 Dissolved Oxygen Meter) equipped with a BOD bottle probe (YSI 5905 BOD Probe), where
the DO was displayed in mg/L (1 mg/L = 1 ppm) or in percent air saturation. The DO meter was
calibrated using air-saturated water, obtained by aerating water for at least 15 min at a constant
temperature, using the calibration by temperature measurement function of the DO meter.
3.5.2. Temperature and pH
Temperature and pH of influent and effluent samples of the slaughterhouse wastewater were
measured by a portable pH and pH/ISE meter (Thermo Orion 230A+). This instrument has a pH
resolution of 0.01, a pH accuracy of ±0.02, a temperature range of -5.0 to 105.0°C, a temperature
resolution of 0.1°C, and a temperature accuracy of ±1.0°C. The pH meter was calibrated using either
a pH 4.01 and 7.00 buffer solution or a 7.00 and 10.01 buffer solution, depending on the expected
sample range, at room temperature.

73
3.5.3. Total suspended solids (TSS), volatile suspended solids (VSS), mixed liquor suspended solids
(MLSS), and mixed liquor volatile suspended solids (MLVSS)
TSS and VSS of the anaerobic sludge, MLSS and MLVSS of the aerobic sludge, and the
SSWW effluent of each reactor were measured according to sections 2540D and 2540E of Standard
Methods (APHA, 1998) to observe the growth of microorganisms in the reactors or to assess whether
the effluent solids concentrations reached a disposal level as shown in Table 2.8.
For TSS and MLSS, filter papers and aluminum weighing dishes were dried in an oven
(Binder Oven FED 53) at 105°C for 1 h. 5 to 10 mL of well-mixed sludge samples were separately
filtered by weighed filter papers using a Buchner funnel connected to a vacuum system. Then, each of
the filter papers were transferred to one weighed and dried aluminum-weighing dish. Combinations of
dishes, sludge samples, and filter papers were heated in the oven at 105°C for 1 h. After cooling in a
desiccator, they were weighed again. The TSS and the MLSS could be determined by Equation (3.2).
( )
(3.2)
where,
W1 = sum of the weights of the dried filter paper, dish and solids of the sample (mg);
W2 = weight of the dried filter paper (mg);
W3 = weight of the dried dish (mg); and
V = volume of the sample (L).
To determine the VSS and the MLVSS concentrations, the combinations of dishes, sludge
samples, and filter papers (after drying in the oven) were burned in a furnace (Thermo Scientific
Lindberg® Blue M® Muffle Furnace) at 550°C for 15 min. After cooling in a desiccator, they were
also weighed. VSS and MLVSS could be determined by Equation (3.3), where W4 is the sum of the
weights of the solids of the sample and the dish after burning (mg).
( ) ( )
( )
(3.3)
74
3.5.4. Total organic carbon (TOC) and total nitrogen (TN)
TOC and TN were measured by a Teledyne Tekmar Apollo 9000 Combustion TOC/TN
Analyzer equipped with an automated sampler. Before sample analyses, the TOC/TN analyzer was
calibrated, samples were diluted to reach 1/3 of their concentration, and they were centrifuged at
5,000 rpm for 10 min (Thermo Scientific Heraeus Multifuge X1). Standards were prepared by adding
a carbon source or a nitrogen source to distilled water to achieve determined levels of carbon or
nitrogen. The reagent solutions were prepared as follows:
1. Potassium nitrate (KNO3) was used as a nitrogen source for TN calibration. The KNO3 was dried
in the oven at 80°C and cooled in the desiccator; then, 7.22 g of it was dissolved in distilled water
and diluted to 1 L in order to prepare 1,000 mg/L of stock standard solution. A series of working
standard solutions covering the expected range of sample concentrations, such as 1–20 mg/L,
were prepared by accurately diluting the 1,000 mg/L of stock standard solution with distilled
water. Through running TN standard calibration analysis, a TN calibration curve for the range 1–
20 mg/L was obtained for analyzing TN concentrations (Figure 3.12).
2. Potassium hydrogen phthalate (KHP) was used as an organic carbon source for TOC calibration.
The KHP was dried in an oven at 105°C for 2 h prior to the preparation of stock standard solution
and stored in a desiccator. For preparation of a 1,000 mg/L of KHP stock standard solution, an
accurate 2,125 mg of KHP was dissolved in distilled water and diluted to 1 L. A series of standard
solutions, covering the expected range of sample concentrations, such as 1–400 mg/L, was
prepared by accurately diluting the 1,000 mg/L of stock standard solution with distilled water.
Through running TOC standard calibration analysis, a TOC calibration curve for the range 1–400
mg/L was obtained for analyzing TOC concentrations (Figure 3.13). Thus, TOC removal
efficiency was determined by Equation (3.4).
( )
(3.4)
where,
TOCin = TOC concentration of influent wastewater sample (mg/L); and
TOCout = TOC concentration of effluent wastewater sample (mg/L).

75
Figure 3.12. TN calibration curve for the range of 1–20 mgTN/L.
y = 3000000x
R² = 0.9999
0
2000000
4000000
6000000
8000000
10000000
12000000
14000000
0 0.5 1 1.5 2 2.5 3 3.5 4 4.5
Raw
Data
N (µg)
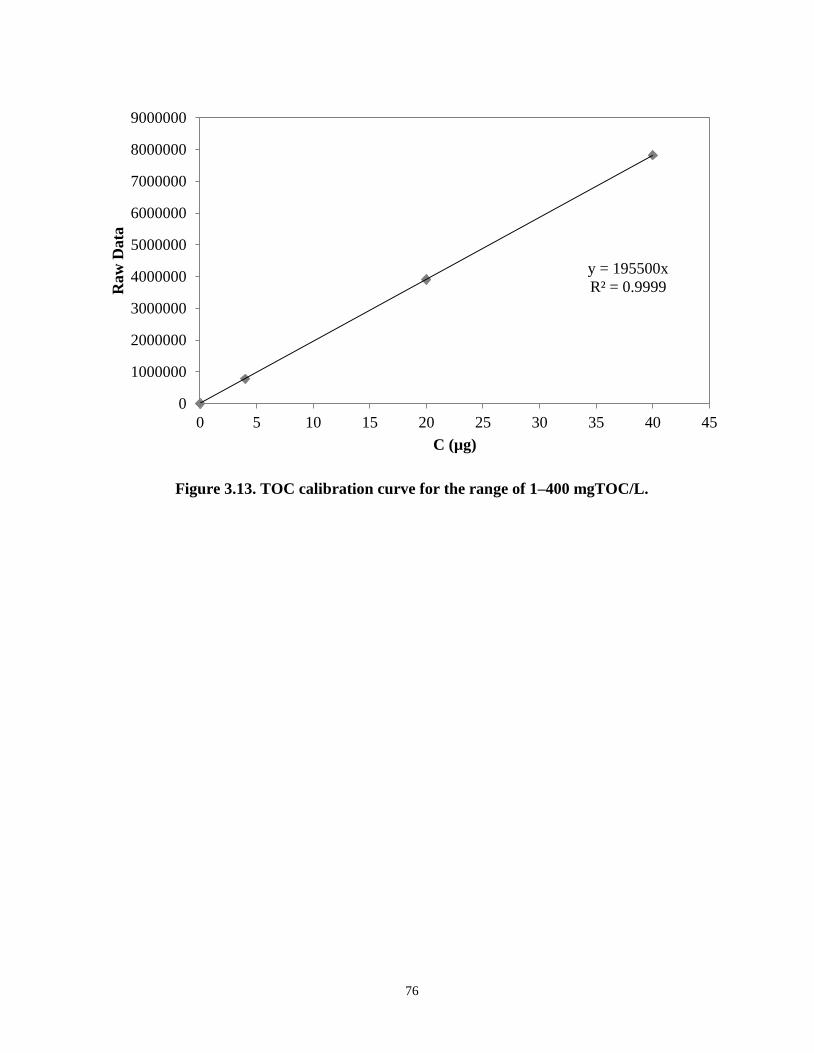
76
Figure 3.13. TOC calibration curve for the range of 1–400 mgTOC/L.
y = 195500x
R² = 0.9999
0
1000000
2000000
3000000
4000000
5000000
6000000
7000000
8000000
9000000
0 5 10 15 20 25 30 35 40 45
Ra
w D
ata
C (µg)
77
3.5.5. 5-day carbonaceous biochemical oxygen demand (CBOD5)
The analysis of the CBOD5 was carried out according to Section 5210B of Standard Methods
(APHA, 1998). A solution, which is called a dilution solution in Standard Methods 5210B, contains
the reagents of phosphate buffer solution, magnesium sulphate solution, calcium chloride solution,
and ferric chloride solution. Other reagents used for CBOD5 testing include acid and alkali solutions,
nitrification inhibitor, and glucose-glutamic acid solution. All solutions, including phosphate buffer,
magnesium sulphate, calcium chloride, and ferric chloride were prepared as follows and stored in a
refrigerator at 4°C after preparation. Phosphate buffer: 8.5 g KH2PO4, 21.75 g K2HPO4, 33.4 g
Na2HPO4•7H2O, and 1.7 g NH4Cl were dissolved in 500 mL of distilled water and diluted to 1 L. The
pH was adjusted to 7.2 using 1 N sulphuric acid or 1 N sodium hydroxide solution. Magnesium
sulphate heptahydrate solution (22.5 g MgSO4·7H2O) was dissolved in distilled water and diluted to 1
L. Calcium chloride solution (27.5 g CaCl2) was dissolved in distilled water and diluted to 1 L. Ferric
chloride solution (0.25 g FeC13•6H2O) was dissolved in distilled water and diluted to 1 L. 0.16 g of
nitrification inhibitor (2-chloro-6-trichloromethyl pyridine; Hach Co., Formula 2533) was added to
each BOD bottle.
For the glucose-glutamic acid (GGA) solution, reagent grade glucose and reagent grade
glutamic acid were dried at 103°C for 1 h. 150 mg glucose and 150 mg glutamic acid were dissolved
in distilled water and diluted to 1 L. Because the BOD test is a bioassay, its results may be greatly
influenced by the presence of toxicants when using of a poor seeding material. Distilled waters
frequently are contaminated with copper. Therefore, it is necessary to check dilution water quality,
seed effectiveness, and analytical techniques periodically. Glucose-glutamic acid standard (GGA) was
used to achieve this work. The GGA solution was prepared fresh immediately before use. For the
dilution water, ten liters of solution were prepared each time as follows: 1 mL of each phosphate
buffer, magnesium sulphate, calcium chloride, and ferric chloride per liter of distilled water were
added in a 20 L container. Then, dilution water was placed in an incubator for at least 24 h at 20°C
and was aerated by oxygen or pure air for 1 h before use. One capsule of commercial Polyseed® was
added into 500 mL distilled water to prepare Polyseed® solution, which must be aerated by pure air
for 30 min and then settled for 15 min before use. Three to 6 mL of one sample of the SSWW, 2 mL
aerated Polyseed® solution, and 0.16 g nitrification inhibitor were added into one well-cleaned 300
mL BOD bottle.

78
Two blanks were prepared by filling with aerated dilution water to check the quality of un-
seeded dilution water and the cleanliness of the BOD bottles roughly. Three seed controls had to be
prepared by adding 10, 15, and 20 mL of Polyseed® solution into separate 300 mL BOD bottles. Two
GGA standards were prepared by adding 6 mL GGA solution and 4 mL aerated Polyseed® solution
into each BOD bottle. A magnetic stirrer bar, which is used to stir the solution in the BOD bottle to
make it homogenous during BODs measurement, was placed in each bottle and then all BOD bottles
were filled with the aerated dilution water up to the middle of the bottle's neck.
Initial DOs of all samples including wastewater samples, the blanks, the seed controls, and the
GGA standards were first measured by a BOD bottle probe connected to an YSI 58 DO meter with
sample agitation before incubating. All BOD bottles were incubated in the incubator at 20°C for 5
days. The 5-day DOs of all samples were measured and their CBOD5 calculated by Equations (3.5)
and (3.6). %CBOD5 removal efficiency was determined by Equation (3.7).
( )
⁄ (3.5)
( ) (3.6)
( )
(3.7)
where,
DO0 = dissolved oxygen of the sample immediately taken after preparation (mg/L);
DOf = dissolved oxygen of the sample after 5 days of incubation at 20C (mg/L);
SCF = seed correction factor, mg/L;
SC1 = dissolved oxygen of seed control before incubation (mg/L);
SC2 = dissolved oxygen of seed control after incubation (mg/L);
f = ratio of the volume of Polyseed solution in glucose-glutamic acid (GGA);
V = volume of the sample (mL);
VBOD = volume of a BOD bottle (mL);
CBOD5,in = CBOD5 concentration of influent wastewater sample (mg/L); and
CBOD5,out = CBOD5 concentration of effluent wastewater sample (mg/L).

79
CHAPTER 4
RESULTS AND DISCUSSION
4.1. Introduction
This chapter presents the results of the experimental work, the characteristics of the SSWW,
the performance and the treatment ability of the ABR, the aerobic AS, and the UV/H2O2 processes, as
well as their combination in the removal of TOC, TN, and BOD from SSWW. This is followed by the
discussion of the optimum H2O2 dosage and the molar ratio of [H2O2]/[TOC] for the UV/H2O2
process obtained under specific operating conditions discussed in the material and methods chapter,
as well as a cost-effectiveness analysis to present the best alternative among the different
configurations evaluated during this study.
4.2. Common characteristics of the synthetic slaughterhouse wastewater (SSWW)
General characteristics, which remained without significant changes, of the SSWW used
during the experiments are shown in this section, including Reynolds number, temperature, pH, DO,
TSS, and VSS.
4.2.1. Reynolds number
The Reynolds number for all the processes, including the ABR, the aerobic AS, the UV/H2O2,
and their combination, remained lower than 2,000; thus, laminar flow was the common regime.
4.2.2. Dissolved oxygen (DO)
The DO concentration of the untreated SSWW remained in the range of 8.48 to 8.50 mg/L. In
the enclosed feed tank, the DO concentration decreased to 0.5–1.3mg/L. After acclimatization, the
DO values within each compartment (1 to 5) of the ABR were in the ranges of 0.2–1.1, 0.3–1.0, 0.4–
1.2, 0.2–1.0, and 0.2–1.0 mg/L, respectively. Inside the aeration tank, DO values were in the range of
0.4–3.2 mg/L; and within the UV/H2O2, DO values were in the range of 1.4–4.1 mg/L. DO values in
the reactors are illustrated in Figure 4.1; error bars represent standard deviations.

80
Figure 4.1. DO profile of the SSWW in the ABR chambers, aerobic AS and UV photoreactor.
Error bars represent standard deviations.
0
0.5
1
1.5
2
2.5
3
3.5
4
4.5
ABR
Chamber 1
ABR
Chamber 2
ABR
Chamber 3
ABR
Chamber 4
ABR
Chamber 5
Aerobic AS UV/H2O2
DO
(m
g/L
)

81
4.2.3. Temperature and pH
Figure 4.2 shows the profile of the pH evolution of the SSWW in the ABR, aerobic AS, and
UV/H2O2 reactors. The SSWW influent pH values were in the range of 6.82 to 6.92. During the
acclimatization of the sludge, pH values for the biological reactors were fluctuating drastically. This
may be attributed to the growth and metabolism of the microorganisms, where pH values within the
ABR chambers (1 to 5) were in the ranges of 6.46–7.00, 6.05–6.97, 6.01–7.06, 6.52–7.21, 6.50–7.21,
5.78–7.85, and 6.18–6.20, respectively; and pH values in the aerobic AS aeration tank were in the
range of 5.78–7.85.
In contrast, pH values during experiments within the 5 chambers of the ABR were in the
ranges of 6.70–6.82, 6.51–6.57, 6.80–6.81, 6.79–6.81, and 6.91–6.95; likewise, pH values in the
aeration tank were in the range of 6.92–6.97. Moreover, from the effluent of the UV/H2O2 process,
pH values were in the range of 6.18 to 6.20. A summary of the maximum and minimum SSWW pH
values is depicted in Table 4.1.
Table 4.1. Maximum and minimum of SSWW pH values during acclimatization of sludge and
experiments.
pH values during acclimatization pH values during experiments
Reactor Minimum Maximum Minimum Maximum
ABR Chamber 1 6.46 7.00 6.70 6.82
ABR Chamber 2 6.05 6.97 6.51 6.57
ABR Chamber 3 6.01 7.06 6.80 6.81
ABR Chamber 4 6.52 7.21 6.79 6.81
ABR Chamber 5 6.50 7.21 6.91 6.95
Aeration Tank 5.78 7.85 6.92 6.97
UV/H2O2 - - 6.18 6.20
Figure 4.3 shows the profile of the SSWW temperature evolution in the ABR, aerobic AS, and
UV/H2O2 reactors. The SSWW influent temperature values were in the range of 24.7 to 24.9°C.
During the acclimatization of the sludge, temperature values for the biological reactors were
fluctuating drastically. This may be attributed to the growth and metabolism of the microorganisms,
where temperature values within the ABR chambers (1 to 5) were in the ranges of 24.0–25.5, 24.3–
25.7, 24.1–25.6, 24.4–25.4, and 24.1–25.5°C, respectively. Temperature values in the aerobic AS
aeration tank were in the range of 24.1–25.6°C.

82
Figure 4.2. SSWW pH evolution with time in the ABR, the aerobic AS and UV/H2O2 reactors.
5.00
5.50
6.00
6.50
7.00
7.50
8.00
0 20 40 60 80 100 120 140 160 180 200
pH
Time (days)
SSWW ABR Chamber 1
ABR Chamber 2 ABR Chamber 3
ABR Chamber 4 ABR Chamber 5
Aeration Tank UV/H2O2
Acclimatization Experiments

83
Figure 4.3. SSWW temperature evolution with time in the ABR, the aerobic AS and UV/H2O2
reactors.
23
24
25
26
27
0 20 40 60 80 100 120 140 160 180 200
Tem
per
atu
re (
°C)
Time (days)
SSWW ABR Chamber 1
ABR Chamber 2 ABR Chamber 3
ABR Chamber 4 ABR Chamber 5
Aeration Tank UV/H2O2
Acclimatization Experiments
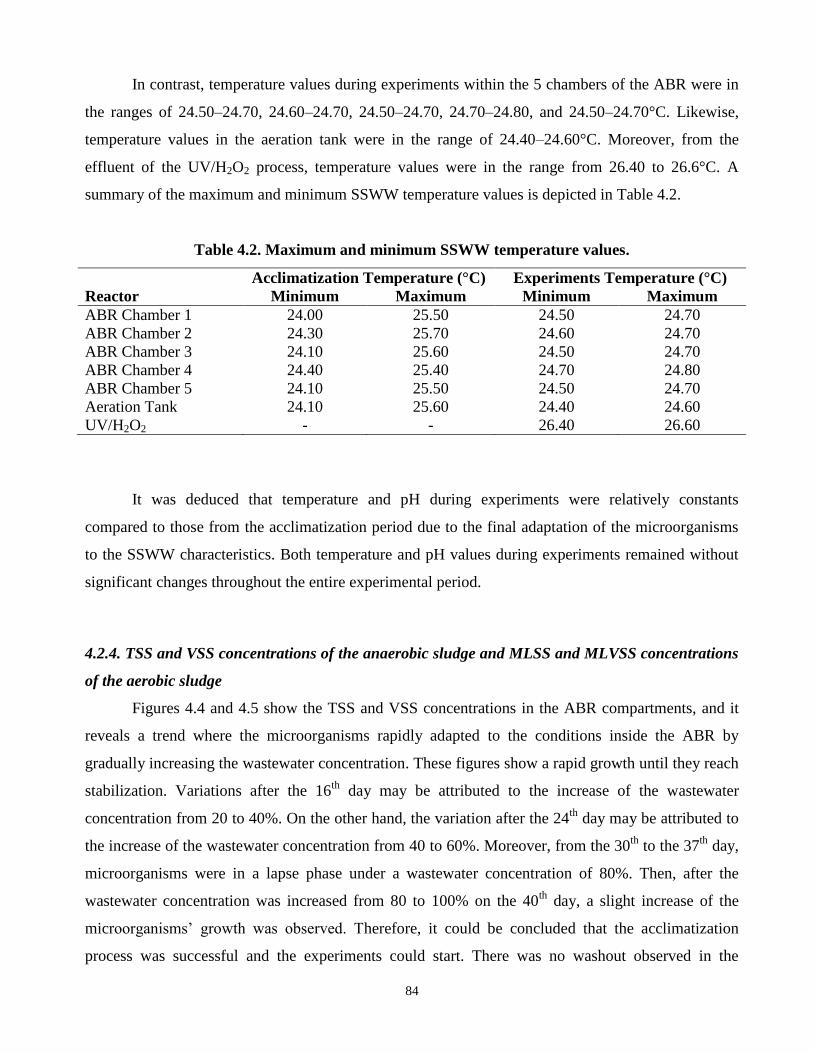
84
In contrast, temperature values during experiments within the 5 chambers of the ABR were in
the ranges of 24.50–24.70, 24.60–24.70, 24.50–24.70, 24.70–24.80, and 24.50–24.70°C. Likewise,
temperature values in the aeration tank were in the range of 24.40–24.60°C. Moreover, from the
effluent of the UV/H2O2 process, temperature values were in the range from 26.40 to 26.6°C. A
summary of the maximum and minimum SSWW temperature values is depicted in Table 4.2.
Table 4.2. Maximum and minimum SSWW temperature values.
Acclimatization Temperature (°C) Experiments Temperature (°C)
Reactor Minimum Maximum Minimum Maximum
ABR Chamber 1 24.00 25.50 24.50 24.70
ABR Chamber 2 24.30 25.70 24.60 24.70
ABR Chamber 3 24.10 25.60 24.50 24.70
ABR Chamber 4 24.40 25.40 24.70 24.80
ABR Chamber 5 24.10 25.50 24.50 24.70
Aeration Tank 24.10 25.60 24.40 24.60
UV/H2O2 - - 26.40 26.60
It was deduced that temperature and pH during experiments were relatively constants
compared to those from the acclimatization period due to the final adaptation of the microorganisms
to the SSWW characteristics. Both temperature and pH values during experiments remained without
significant changes throughout the entire experimental period.
4.2.4. TSS and VSS concentrations of the anaerobic sludge and MLSS and MLVSS concentrations
of the aerobic sludge
Figures 4.4 and 4.5 show the TSS and VSS concentrations in the ABR compartments, and it
reveals a trend where the microorganisms rapidly adapted to the conditions inside the ABR by
gradually increasing the wastewater concentration. These figures show a rapid growth until they reach
stabilization. Variations after the 16th
day may be attributed to the increase of the wastewater
concentration from 20 to 40%. On the other hand, the variation after the 24th
day may be attributed to
the increase of the wastewater concentration from 40 to 60%. Moreover, from the 30th
to the 37th
day,
microorganisms were in a lapse phase under a wastewater concentration of 80%. Then, after the
wastewater concentration was increased from 80 to 100% on the 40th
day, a slight increase of the
microorganisms’ growth was observed. Therefore, it could be concluded that the acclimatization
process was successful and the experiments could start. There was no washout observed in the

85
effluent of the reactors; thus, no sludge was removed. After 60 days of acclimatization, the TSS and
VSS concentrations of the inoculum were reached in the ranges of 12,750-21,600 mg/L and 10,600-
16,150 mg/L, respectively.
Figures 4.6 and 4.7 show the MLSS and MLVSS concentrations in the aerobic AS reactor,
where it is shown a trend where the microorganisms rapidly adapted to the conditions inside the
aeration tank, while gradually increasing the wastewater concentration (20, 40, 60, 80, and 100%) for
a period of 30 days. These figures also show a rapid growth until they reach stabilization; therefore, it
could be concluded that the acclimatization process was successful and the experiments could start.
After 30 days of acclimatization, the concentrations of MLSS and MLVSS were reached
approximately to 3,718 and 2,399 mg/L, respectively. These results are similar to those observed in
previous studies (Cao, 2009; Cao and Mehrvar, 2011).
4.2.5. TSS and VSS concentrations of the SSWW
The TSS and VSS values of the SSWW in the effluents of the ABR and the aerobic AS for the
flow rates in the range from 2.93 to 11.70 mL/min are shown in Tables 4.3 and 4.4; where in both
anaerobic and aerobic effluents, at higher flow rates, TSS values increased. It was also determined
that flow rates greater than 7.80 mL/min exceeded the disposal level according to the Canadian
standards for rivers, streams and estuaries (Environment Canada, 2000) and the Ontario standards
(ECO, 2010) as depicted in Tables 2.4, 2.5 and 2.6. Therefore, for the combined processes, flow rates
of 7.50 mL/min or less were used. On the other hand, it is shown that effluent TSS concentrations of
the ABR are higher than those observed using aerobic AS, and this may be attributed to poor sludge
settleability in the ABR.
Table 4.3. TSS profiles of the SSWW in the ABR and the aerobic AS.
Q (mL/min) TSS of SSWW in the ABR (mg/L) TSS of SSWW in the aerobic AS (mg/L)
2.93 4.69 2.98
3.34 5.09 3.88
3.75 5.23 4.13
4.50 8.01 5.85
4.68 9.35 7.19
7.50 18.68 16.73
7.80 26.11 25.23
11.70 156.39 124.97

86
Figure 4.4. TSS profile and evolution with time of the anaerobic sludge within the ABR process.
0
5000
10000
15000
20000
25000
30000
35000
40000
0 10 20 30 40 50 60
TS
S (
mg/L
)
Time (days)
ABR Chamber 1
ABR Chamber 2
ABR Chamber 3
ABR Chamber 4
ABR Chamber 5

87
Figure 4.5. VSS profile and evolution with time of the anaerobic sludge within the ABR process.
0
5000
10000
15000
20000
25000
0 10 20 30 40 50 60
VS
S (
mg/L
)
Time (days)
ABR Chamber 1
ABR Chamber 2
ABR Chamber 3
ABR Chamber 4
ABR Chamber 5

88
Figure 4.6. MLSS profile and evolution with time of the anaerobic sludge within the aerobic AS
process. Error bars represent standard deviations.
0
2000
4000
6000
8000
10000
12000
0 5 10 15 20 25 30
ML
SS
(m
g/L
)
Time (days)

89
Figure 4.7. MLVSS profile and evolution with time of the anaerobic sludge within the aerobic
AS process. Error bars represent standard deviations.
0
1000
2000
3000
4000
5000
6000
0 5 10 15 20 25 30
ML
VS
S (
mg/L
)
Time (days)

90
Table 4.4. VSS profiles of the SSWW in the ABR and the aerobic AS.
Q (mL/min) VSS of SSWW in the ABR (mg/L) VSS of SSWW in the aerobic AS (mg/L)
2.93 3.75 2.38
3.34 4.07 3.10
3.75 4.18 3.30
4.50 6.41 4.68
4.68 7.48 5.75
7.50 14.94 13.38
7.80 20.89 20.18
11.70 125.11 99.98
4.3. TOC and TN removal in SSWW using individual anaerobic and aerobic processes
Biological treatment using an ABR and aerobic AS at a laboratory scale were studied to treat
SSWW with TOC loadings of 0.03–1.01 g/(L day), TN loadings of 0.01–0.19 g/(L day), and flow
rates of 2.93 to 11.70 mL/min. The results shown in Figure 4.8 revealed that both processes achieve a
good efficiency to treat the SSWW for TOC removal in a range of 84.06 to 95.03%. Likewise, Figure
4.9 shows the results of TN removal, in the range of 31.32 to 73.46% for both processes. The lower
performance was obtained with the ABR for an influent concentration of 183.35 mgTOC/L and 63.38
mgTN/L at the HRT of 7 days and a flow rate of 3.34mL/min with up to 84.06% TOC removal and
31.32% TN removal. Likewise, the best performance was obtained with the aerobic AS for an influent
concentration of 1,008.85 mgTOC/L and 254.23 mgTN/L with up to 95.03% TOC removal and
73.46% TN removal. These results are comparable to those found in previous studies (Cao, 2009; Cao
and Mehrvar, 2011). Furthermore, it is also deduced that at higher influent TOC and TN
concentrations, the TOC and TN removal rates are higher (5% and 15%, respectively), whereas the
performance of the first three chambers of the ABR is decreased by approximately 30%, which may
be attributed to the bioavailability of the organic matter and the acetogenesis.
Moreover, Figures 4.10 and 4.11 show the effects of HRT on TOC and TN removal using
biological treatment for an influent concentration of 639.44.85 mgTOC/L and 144.40 mgTN/L; where
at a HRT of 5 days, the TOC removal rate was reached to 83.64 and 89.66% on the ABR and the
aerobic AS processes, respectively. Likewise, at a HRT of 8 days, the TOC removal rate was reached
to 88.88 and 94.26% in the ABR and the aerobic AS processes, respectively. Similarly, at a HRT of 5
days, the TN removal was reached to 36.49 and 43.19% in the ABR and the aerobic AS processes,
respectively. In contrast, at a HRT of 8 days, the TN removal rate reached 51.52 and 75.15% in the

91
ABR and the aerobic AS processes, respectively. Thus, it is perceived that the TOC and TN removal
were significantly higher by prolonging the HRT.
In spite of the results from previous studies (Cao, 2009; Cao and Mehrvar, 2011), a good
removal of TN, in the range from 31.32 to 73.46%, was achieved by varying the flow rate and
influent concentration of the SSWW; this may be attributed to the well maintained conditions in the
systems, where DO concentrations were in the ranges of 0.2–1.2 mg/L and 0.4–3.2 mg/L for the ABR
and the aerobic AS, respectively. Therefore, DO concentrations of above 1.0 mg/L permitted
nitrification, whereas DO concentrations of below 0.5 mg/L permitted denitrification.
4.4. TOC and TN removal in SSWW using combined anaerobic-aerobic systems
Although individual processes of both anaerobic and aerobic processes are significantly
efficient to treat the SSWW as shown in the previous section, combined anaerobic and aerobic
systems performed higher efficiencies as discussed in the following sections.
4.4.1. TOC and TN removal in SSWW using combined anaerobic-aerobic processes
As depicted in Figures 4.12 and 4.13, up to 96.36% TOC and 80.53% TN removal rates were
obtained for influent concentrations of 1,008.85 mgTOC/L and 419.77 mgTN/L, HRT of 6.24 days,
and a flow rate of 3.75mL/min, while 93.15% TOC and 33.21% TN removal rates were obtained for
influent concentrations of 1,008.85 mgTOC/L and 419.77 mgTN/L, HRT of 3.12 days, and a flow
rate of 7.50mL/min using combined ABR and aerobic AS.

92
Figure 4.8. TOC removal for different wastewater concentrations using biological treatment at
the HRT of 7 days and a flow rate of 3.34 mL/min in continuous mode without recycling.
0.00%
10.00%
20.00%
30.00%
40.00%
50.00%
60.00%
70.00%
80.00%
90.00%
100.00%T
OC
Rem
oval
(%)
TOCin = 183.35mg/L (20% of SWW)
TOCin = 366.71mg/L (40% of SWW)
TOCin = 639.44mg/L (60% of SWW)
TOCin = 733.42mg/L (80% of SWW)
TOCin = 1008.85mg/L (100% of SWW)
Anaerobic Treatment Aerobic Treatment

93
Figure 4.9. TN removal for different wastewater concentrations using biological treatment at
the HRT of 7 days and a flow rate of 3.34 mL/min in continuous mode without recycling.
0.00%
10.00%
20.00%
30.00%
40.00%
50.00%
60.00%
70.00%
80.00%
90.00%
100.00%T
N R
emoval
(%)
TNin = 63.38mg/L (20% of SWW)TNin = 119.30mg/L (40% of SWW)TNin = 144.40mg/L (60% of SWW)TNin = 182.00mg/L (80% of SWW)TNin = 254.23mg/L (100% of SWW)
Anaerobic Treatment Aerobic Treatment

94
Figure 4.10. Effects of HRT on TOC removal using biological treatment with TOC
concentration in the inlet of 639.44 mg/L (60% of SWW) in continuous mode without recycling.
0.00%
10.00%
20.00%
30.00%
40.00%
50.00%
60.00%
70.00%
80.00%
90.00%
100.00%T
OC
Rem
oval
(%)
HRT - 5 days
HRT - 7 days
HRT - 8 daysAnaerobic Treatment Aerobic Treatment

95
Figure 4.11. Effects of HRT on TN removal using biological treatment with TN concentration in
the inlet of 144.40 mg/L (60% of SWW) in continuous mode without recycling.
0.00%
10.00%
20.00%
30.00%
40.00%
50.00%
60.00%
70.00%
80.00%
90.00%
100.00%
TN
Rem
oval
(%)
HRT - 5 days
HRT - 7 days
HRT - 8 days
Anaerobic Treatment Aerobic Treatment

96
Figure 4.12. Effects of HRT on TOC removal by combined anaerobic-aerobic processes with
TOC concentration in the inlet of 1,008.85 mg/L (100% of SWW) in continuous mode without
recycling.
0.00%
10.00%
20.00%
30.00%
40.00%
50.00%
60.00%
70.00%
80.00%
90.00%
100.00%T
OC
Rem
oval
(%)
HRT - 3.12 days
HRT - 6.24 days Anaerobic Reactor Aerobic Reactor
Combined Anaerobic-Aerobic Treatment

97
Figure 4.13. Effects of HRT on TN removal by combined anaerobic-aerobic processes with TN
concentration in the inlet of 419.77 mg/L (100% of SWW) in continuous mode without
recycling.
0.00%
10.00%
20.00%
30.00%
40.00%
50.00%
60.00%
70.00%
80.00%
90.00%
100.00%T
N R
emoval
(%) HRT - 3.12 days
HRT - 6.24 days
Anaerobic Reactor Aerobic Reactor
Combined Anaerobic-Aerobic Treatment

98
4.4.2. TOC and TN removal in SSWW using combined aerobic-anaerobic processes
By making the aerobic stage the first step of the combined processes, higher TOC and TN
removal rates were also reached compared to those of individual processes, as shown in Figures 4.14
and 4.15, respectively. In the case of aerobic-anaerobic processes, up to 96.10% TOC and 76.44% TN
removal rates were obtained for influent concentrations of 1,008.85 mgTOC/L and 425.54 mgTN/L,
at a HRT of 6.24 days, and a flow-rate of 3.75mL/min, while 86.04% TOC and 29.41% TN removal
rates were obtained for influent concentrations of 1,008.85 mgTOC/L and 425.54 mgTN/L, HRT of
3.12 days, and a flow-rate of 7.50mL/min.
Both combined biological processes achieved good results in treating SSWW, with TOC and
TN removal rates of above 95 and 75%, respectively. Up to 96.36% TOC and 80.53% TN removal
rates were reached by combined anaerobic-aerobic processes, while, up to 96.10% TOC and 76.44%
TN removal rates were attained by combined aerobic-anaerobic processes. Thus, it was determined
that combined anaerobic-aerobic processes have a considerable advantage in combined aerobic-
anaerobic processes of approximately 0.26% TOC and 4.09% TN removal rates. Therefore, it was
recommended to use combined anaerobic-aerobic processes for following experiments. Accordingly,
an adequate combination of anaerobic and aerobic processes is essential for the biological removal of
nutrients (N and P), as depicted in the obtained TN removal by combining anaerobic-aerobic systems
(Del Pozo and Diez, 2003; Ahn et al., 2007; Liu et al., 2008; Chan et al., 2009).
4.4.3. TOC and TN removal in SSWW using combined anaerobic-aerobic processes with recycling
An experiment was conducted with the recycling mode, in which the SSWW treated in the
aerobic AS reactor was recycled into the ABR, in order to evaluate the performance of the combined
anaerobic-aerobic processes and to analyze the impact on TN removal. For this experiment, an
influent concentration of 639.44 mgTOC/L and 144.40 mgTN/L and a flow-rate of 7.50mL/min were
used.
Results shows that recycling the flow from the aerobic AS into the ABR did not significantly
decrease either TOC or TN concentrations. As depicted in Figures 4.16 and 4.17, a minimum
variation of 0.02 and 0.05% was observed for TOC and TN removal rates, whereas the HRT of the
recycling mode system doubles that of the combined anaerobic-aerobic processes; thus, making the
combined system with recycling less efficient than without recirculating the flow.

99
Figure 4.14. Effects of HRT on TOC removal by combined aerobic-anaerobic processes with
TOC concentration in the inlet of 1,008.85 mg/L (100% of SWW) in continuous mode without
recycling.
0.00%
10.00%
20.00%
30.00%
40.00%
50.00%
60.00%
70.00%
80.00%
90.00%
100.00%T
OC
Rem
oval
(%)
HRT - 3.12 days
HRT - 6.24 days
Anaerobic Reactor Aerobic Reactor
Combined Aerobic-Anaerobic Treatment

100
Figure 4.15. Effects of HRT on TN removal by combined aerobic-anaerobic processes with TN
concentration in the inlet of 425.54 mg/L (100% of SWW) in continuous mode without
recycling.
0.00%
10.00%
20.00%
30.00%
40.00%
50.00%
60.00%
70.00%
80.00%
90.00%
100.00%
TN
Rem
oval
(%)
HRT - 3.12 days
HRT - 6.24 days
Anaerobic Reactor Aerobic Reactor
Combined Aerobic-Anaerobic Treatment

101
Figure 4.16. Comparison of TOC removal by means of combined anaerobic-aerobic processes
with and without recycling, by using TOC concentration in the inlet of 639.44 mg/L and flow
rate of 7.50 mL/min in continuous mode.
93.15% 93.24%
0.00%
10.00%
20.00%
30.00%
40.00%
50.00%
60.00%
70.00%
80.00%
90.00%
100.00%T
OC
Rem
oval
(%)
Without Recycling
With Recycling
without recycling with recycling
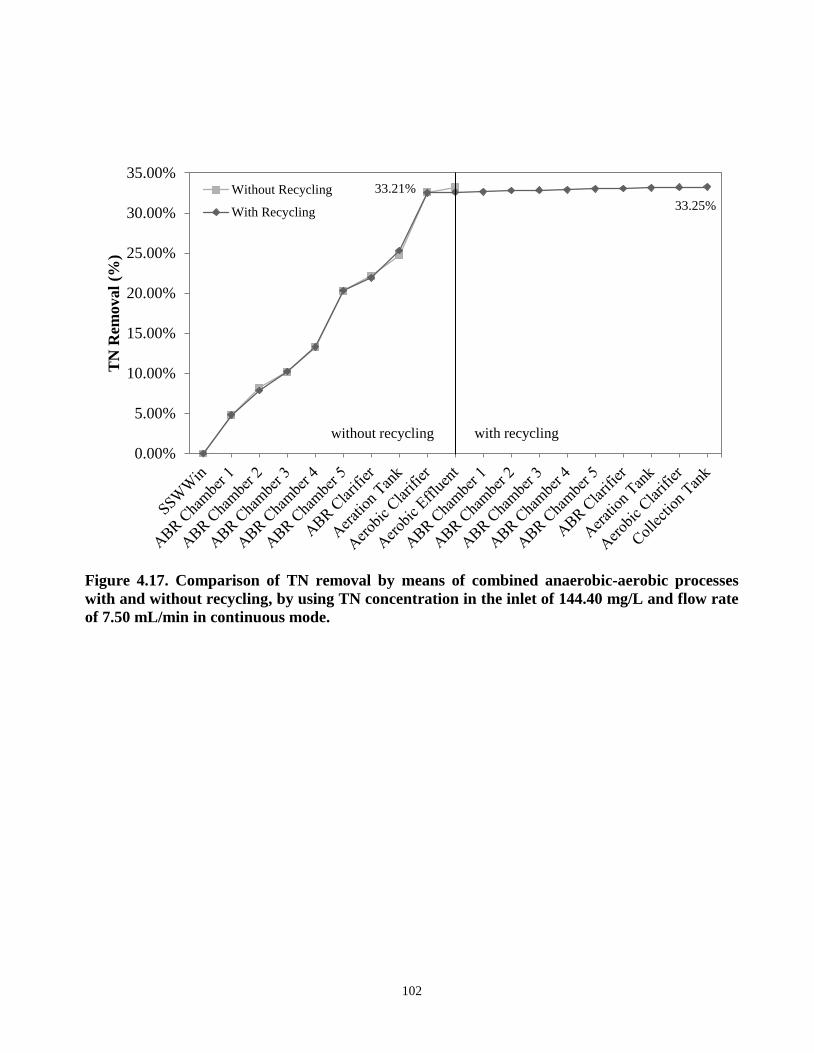
102
Figure 4.17. Comparison of TN removal by means of combined anaerobic-aerobic processes
with and without recycling, by using TN concentration in the inlet of 144.40 mg/L and flow rate
of 7.50 mL/min in continuous mode.
33.21%
33.25%
0.00%
5.00%
10.00%
15.00%
20.00%
25.00%
30.00%
35.00%
TN
Rem
oval
(%)
Without Recycling
With Recycling
without recycling with recycling

103
4.5. TOC and TN removal in SSWW using UV/H2O2 process alone
The UV/H2O2 process alone was studied to treat SSWW with TOC and TN loadings of 64.88–
349.84, and 18.10–111.43 mg/L, respectively. Temperature and pH remained constant in the range of
26.40–26.60°C and 6.18–6.20, respectively, except in the dark experiments, where temperature was in
the ranges of 21.10–21.50°C. There was no analysis of different intermediates that may be formed
during the UV/H2O2 treatment.
Figures 4.18, 4.19, and 4.20 show the TOC removal of the raw SSWW being treated by the
UV/H2O2 process alone using different H2O2 concentrations (0, 100, 300, 600, 900, 1200, 1500, and
2000 mg/L) at the initial TOC concentrations of 64.88, 163.69, and 348.84 mg/L in continuous mode
without recycling. It was determined that by using UV light solely there was no significant TOC
removal, the maximum value was 6.96% at HRT of 180 min and TOCin of 64.88 mg/L. On the other
hand, it was shown that an optimum H2O2 dosage should be determined since an overdose of H2O2
will negatively affect the organic removal by •OH recombination, as shown in Reaction (2.26).
Figure 4.21 shows the maximum TOC removal for different SSWW concentrations using
UV/H2O2 treatment at a HRT of 3 h in continuous mode without recycling. This figure illustrates a
trend, where it may be stated that by increasing the SSWW concentration, the TOC removal capacity
decreases due to the presence of more organic matter ready to compete for •OH and the production of
intermediates, which tends to lower the efficiency of the UV/H2O2 process. The results revealed a
reasonable efficiency; up to 75.22% TOC removal was obtained for an influent concentration of 64.88
mgTOC/L at the HRT of 180 min with H2O2 concentration of 900 mg/L. These results are in
accordance with the previous studies of Cao (2009), Cao and Mehrvar (2011), Barrera (2011), and
Barrera et al. (2011).
In contrast, Figures 4.22, 4.23, and 4.24 show the possible TN removal of the SSWW being
treated by the UV/H2O2 using different H2O2 concentrations (0, 100, 300, 600, 900, 1200, 1500 and
2000 mg/L) at the initial TN concentrations of 18.10, 40.02 and 93.94 mg/L. It was determined that
there was no significant removal of TN using UV/H2O2 process for the treatment of SSWW. Figure
4.25 confirms that the UV/H2O2 process is not able to remove TN from SSWW, showing a maximum
variation of 5.99%. Therefore, this section is focused on TOC removal using the UV/H2O2 process.

104
Figure 4.18. TOC removal in untreated SSWW using different H2O2 concentrations with TOC
concentration in the inlet of 64.88 mg/L (5% of SSWW) in the UV/H2O2 process alone.
0.00
0.20
0.40
0.60
0.80
1.00
0 30 60 90 120 150 180
TO
C/T
OC
o
Time (minutes)
[H2O2] = 0 mg/L [H2O2] = 100 mg/L [H2O2] = 300 mg/L [H2O2] = 600 mg/L
[H2O2] = 900 mg/L [H2O2] = 1200 mg/L [H2O2] = 1500 mg/L [H2O2] = 2000 mg/L

105
Figure 4.19. TOC removal in untreated SSWW using different H2O2 concentrations with TOC
concentration in the inlet of 163.69 mg/L (10% of SSWW) in the UV/H2O2 process alone.
0.00
0.20
0.40
0.60
0.80
1.00
0 30 60 90 120 150 180
TO
C/T
OC
o
Time (minutes)
[H2O2] = 0 mg/L [H2O2] = 100 mg/L [H2O2] = 300 mg/L [H2O2] = 600 mg/L
[H2O2] = 900 mg/L [H2O2] = 1200 mg/L [H2O2] = 1500 mg/L [H2O2] = 2000 mg/L

106
Figure 4.20. TOC removal in untreated SSWW using different H2O2 concentrations with TOC
concentration in the inlet of 348.84 mg/L (25% of SSWW) in the UV/H2O2 process alone in
continuous mode without recycling.
0.00
0.20
0.40
0.60
0.80
1.00
0 30 60 90 120 150 180
TO
C/T
OC
o
Time (minutes)
[H2O2] = 0 mg/L [H2O2] = 100 mg/L [H2O2] = 300 mg/L [H2O2] = 600 mg/L
[H2O2] = 900 mg/L [H2O2] = 1200 mg/L [H2O2] = 1500 mg/L [H2O2] = 2000 mg/L

107
Figure 4.21. Maximum TOC removal for different raw SSWW concentrations using UV/H2O2
process alone (HRT = 3 h) in continuous mode without recycling.
0.00%
10.00%
20.00%
30.00%
40.00%
50.00%
60.00%
70.00%
80.00%
TOCin = 64.88mg/L (5%) TOCin = 163.69mg/L (10%) TOCin = 349.84mg/L (25%)
TO
C R
emoval
(%)
Slaughterhouse Wastewater Concentration (%)

108
Figure 4.22. TN removal in raw SSWW using different H2O2 concentrations with TN
concentration in the inlet of 18.10 mg/L (5% of SSWW) in the UV/H2O2 process alone in
continuous mode without recycling.
0.00
0.20
0.40
0.60
0.80
1.00
0 30 60 90 120 150 180
TN
/TN
o
Time (minutes)
[H2O2] = 0 mg/L [H2O2] = 100 mg/L [H2O2] = 300 mg/L [H2O2] = 600 mg/L
[H2O2] = 900 mg/L [H2O2] = 1200 mg/L [H2O2] = 1500 mg/L [H2O2] = 2000 mg/L

109
Figure 4.23. TN removal in raw SSWW using different H2O2 concentrations with TN
concentration in the inlet of 40.02 mg/L (5% of SSWW) in the UV/H2O2 process alone in
continuous mode without recycling.
0.00
0.20
0.40
0.60
0.80
1.00
0 30 60 90 120 150 180
TN
/TN
o
Time (minutes)
[H2O2] = 0 mg/L [H2O2] = 100 mg/L [H2O2] = 300 mg/L [H2O2] = 600 mg/L
[H2O2] = 900 mg/L [H2O2] = 1200 mg/L [H2O2] = 1500 mg/L [H2O2] = 2000 mg/L

110
Figure 4.24. TN removal in raw SSWW using different H2O2 concentrations with TN
concentration in the inlet of 93.94 mg/L (25% of SSWW) in the UV/H2O2 process alone in
continuous mode without recycling.
0.00
0.20
0.40
0.60
0.80
1.00
0 30 60 90 120 150 180
TN
/TN
o
Time (minutes)
[H2O2] = 0 mg/L [H2O2] = 100 mg/L [H2O2] = 300 mg/L [H2O2] = 600 mg/L
[H2O2] = 900 mg/L [H2O2] = 1200 mg/L [H2O2] = 1500 mg/L [H2O2] = 2000 mg/L

111
Figure 4.25. TN removal for different raw SSWW concentrations using UV/H2O2 process alone
in continuous mode without recycling.
0.00%
10.00%
20.00%
30.00%
40.00%
50.00%
60.00%
70.00%
80.00%
90.00%
100.00%
0 100 300 600 900 1200 1500 2000
TN
Rem
oval
(%)
[H2O2] (mg/L)
TNin = 18.10 mg/L (SWW at 5%)
TNin = 40.02 mg/L (SWW at 10%)
TNin = 93.94 mg/L (SWW at 25%)

112
4.5.1. Dark experiments
Dark experiments were conducted to analyze the possible loss of organic matter through
adsorption on the walls of the photoreactor or by volatilization. The SSWW was pumped into the
system with the UV lamps off. Figures 4.26 and 4.27 show TOC and TN removal rates for the dark
experiments with no UV radiation present by varying H2O2 concentration (0, 900 and 2000 mg/L). It
was determined that TOC and TN concentrations remained constant with only a maximum variation
of 1.87 and 0.86% for TOC and TN decrease, respectively. It was affirmed that there was no
significant organic matter adsorption to the reactor walls or material losses due to volatilization;
subsequently any degradation can be attributed to the action of the UV/H2O2 process itself. Table 4.5
shows a summary of the results of the dark experiments at a HRT of 180 min.
Table 4.5. TOC and TN values during dark experiments using different UV/H2O2
concentrations.
[H2O2] (mg/L) Parameter (mg/L) Influent Effluent* % removal
0 TOC 64.8821 63.8854 1.54%
TN 18.1044 17.9811 0.68%
900 TOC 64.8848 63.6693 1.87%
TN 18.1049 17.9501 0.86%
2000 TOC 64.8842 63.7693 1.72%
TN 18.1042 17.9716 0.73% * after a HRT of 3 h
4.5.2. Optimal H2O2 dosage and molar ratio of [H2O2]/[TOC] for the UV/H2O2 process
It is well known that H2O2 produces hydroxyl radicals in the presence of UV radiation.
However, it is important to determine an optimum dosage to be added to the process, since an
overdose of the oxidant can lead to negative effects in organics removal due to the recombination of
hydroxyl radicals (•OH), as shown in Reaction (2.26), whereas a low dosage will reduce the
•OH
production; and thus, lower efficiency of the process for both cases.
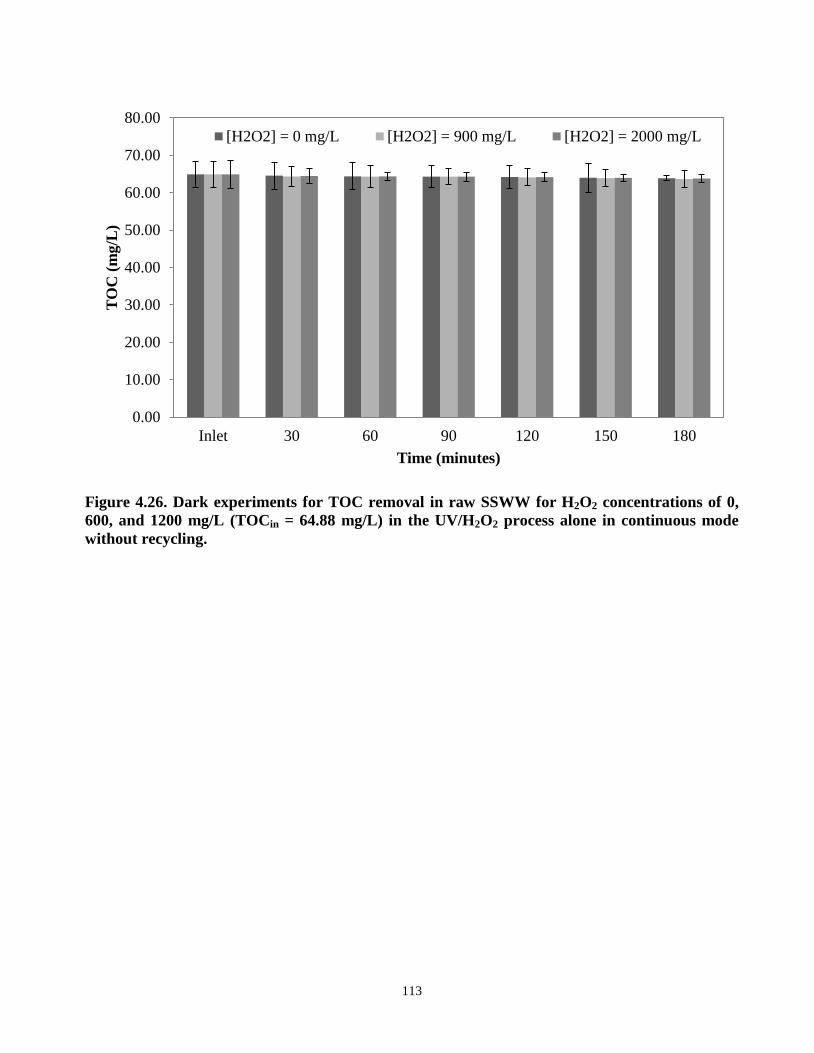
113
Figure 4.26. Dark experiments for TOC removal in raw SSWW for H2O2 concentrations of 0,
600, and 1200 mg/L (TOCin = 64.88 mg/L) in the UV/H2O2 process alone in continuous mode
without recycling.
0.00
10.00
20.00
30.00
40.00
50.00
60.00
70.00
80.00
Inlet 30 60 90 120 150 180
TO
C (
mg/L
)
Time (minutes)
[H2O2] = 0 mg/L [H2O2] = 900 mg/L [H2O2] = 2000 mg/L

114
Figure 4.27. Dark experiments for TN removal in raw SSWW for H2O2 concentrations of 0, 600,
and 1200 mg/L (TNin = 18.10 mg/L) in the UV/H2O2 process alone in continuous mode without
recycling.
0.00
5.00
10.00
15.00
20.00
25.00
Inlet 30 60 90 120 150 180
TN
(m
g/L
)
Time (minutes)
[H2O2] = 0 mg/L [H2O2] = 900 mg/L [H2O2] = 2000 mg/L

115
In order to determine the optimum dosage of H2O2, different H2O2 concentrations were used
(0, 100, 600, 900, 1200, 1500 and 2000 mg/L), and TOC concentrations varied from 64.88 to 349.84
mg/L for the experiments in batch recirculation mode. The results revealed a reasonable efficiency, up
to 75.22% TOC removal rate, was obtained for an influent concentration of 64.88 mgTOC/L, HRT of
180 min, and H2O2 concentration of 900 mg/L, as depicted in Figure 4.28. Therefore, further
experiments were conducted using 900 mg/L as the optimal dose for the treatment of SSWW.
Besides, Figure 4.28 also confirms that at a higher slaughterhouse wastewater concentration, the TOC
removal capacity decreased due to the presence of more organic matter ready to compete for hydroxyl
radicals (•OH).
It is highly recommended to determine an optimal ratio of [H2O2]/[TOC] (Tabrizi and
Mehrvar, 2004; Cao, 2009; Cao and Mehrvar, 2011; Barrera, 2011; Barrera et al., 2011), which is a
critical parameter for optimization of the wastewater treatment by adjusting the concentration of H2O2
to specific organic matter concentrations present at any time while the treatment is in progress. This
factor helps to maximize the efficiency and reduce chemical and electrical costs. Furthermore, Figure
4.29 illustrates an optimum molar ratio dosage of 13.87 mgH2O2/mgTOCin for the UV/H2O2 process.
These results are in accordance with the previous studies that propose optimum molar ratios in the
range of 0-100 mgH2O2/mgTOCin (Baeza et al., 2003; Torrades et al., 2003; Tabrizi and Mehrvar,
2004; Pagano et al., 2008; Cao, 2009; Cao and Mehrvar, 2011; Barrera, 2011; Barrera et al., 2011).
Likewise, the ratios of H2O2 concentration by influent TOC concentration and HRTs within
the UV/H2O2 process in batch recirculation mode are depicted in Figure 4.30, where an optimum ratio
of 4.62 mgH2O2/mgTOCin.h was found to result a maximum TOC removal of 75.22%.
4.6. TOC and TN removal in SSWW using combined anaerobic-aerobic and UV/H2O2 processes
Previous sections have shown the high efficiency of different alternatives for treating
slaughterhouse wastewater (SSWW). However, the performance of the combination of all those
processes in order to get complete mineralization of the organic matter was studied.

116
Figure 4.28. Optimal concentration of H2O2 for TOC removal in different SSWW
concentrations, within the UV/H2O2 process in batch recirculation mode.
0.00%
10.00%
20.00%
30.00%
40.00%
50.00%
60.00%
70.00%
80.00%
90.00%
100.00%
0 250 500 750 1000 1250 1500 1750 2000 2250
TO
C R
emoval
(%)
[H2O2] (mg/L)
TOCin = 64.88mg/L (5% of SWW)
TOCin = 163.69mg/L (10% of SWW)
TOCin = 349.84mg/L (25% of SWW)

117
Figure 4.29. Relation of molar ratio of [H2O2]/[TOC] for different SSWW concentrations within
the UV/H2O2 process in batch recirculation mode.
0.00%
10.00%
20.00%
30.00%
40.00%
50.00%
60.00%
70.00%
80.00%
0.00 5.00 10.00 15.00 20.00 25.00 30.00 35.00
TO
C R
emoval
(%)
[H2O2]/[TOC]
TOCin = 64.88mg/L (5% of SWW)
TOCin = 163.69mg/L (10% of SWW)
TOCin = 349.84mg/L (25% of SWW)

118
Figure 4.30. Relation of molar ratio of [H2O2]/[TOCin×HRT] for different TOC removals within
the UV/H2O2 process in batch recirculation mode
0.00%
10.00%
20.00%
30.00%
40.00%
50.00%
60.00%
70.00%
80.00%
0.00 10.00 20.00 30.00 40.00 50.00 60.00 70.00
TO
C R
emoval
(%)
[H2O2]/(TOCin×HRT)

119
Figures 4.31 and 4.32 show the TOC and TN concentrations of the SSWW during different
stages of combined ABR-aerobic AS-UV/H2O2 processes at HRTs of 3.15 to 4 days and flow rates of
5.90 to 7.50 mL/min with influent TOC and TN concentrations of 941.19–1006.90 and 200.03–
214.08 mg/L, respectively. Up to 99.98% TOC removal and 82.84% TN removal rates were obtained
for influent concentrations of 1,004.88 mgTOC/L and 200.03 mgTN/L, HRT of 4.00 days, and a flow
rate of 5.90 mL/min (Figures 4.33 and 4.34). Other experiments show 99.13% TOC and 82.51% TN
removal rates, obtained for an influent concentration of 1,006.90 mgTOC/L and 203.84 mgTN/L,
HRT of 3.50 days, and flow rate of 6.75mL/min. Likewise, up to 98.91% TOC and 81.03% TN
removal rates were obtained for an influent concentration of 941.19 mgTOC/L and 214.08 mgTN/L,
HRT of 3.15 days, and flow rate of 7.50mL/min as depicted in Figures 4.33 and 4.34.
These results confirm that an adequate combination of anaerobic and aerobic processes is
essential for the nitrogen removal in order to obtain removal rates of more than 70% (up to 82.84% of
TN removed) and they also confirm that using advanced oxidation processes as post-treatment
guarantees the complete mineralization of the organic matter and disinfection of SSWW, with up to
99.98% of TOC removed as depicted in Figure 4.33 (Del Pozo and Diez, 2003; Ahn et al., 2007; Liu
et al., 2008; Cao, 2009; Chan et al., 2009; Cao and Mehrvar, 2011; Barrera, 2011; Barrera et al.,
2011).
Figures 4.35 and 4.36 show a comparison of all processes used in this study, with maximum
TOC and TN removals reached by the different alternatives, including the UV/H2O2 process alone
(75.22% for TOC and 5.99% for TN), the ABR process alone (89.47% for TOC and 49.68% for TN),
the aerobic AS process alone (94.53% for TOC and 73.46% for TN), combined aerobic-anaerobic
processes (96.10% for TOC and 76.44% for TN), combined anaerobic-aerobic processes (96.36% for
TOC and 80.53% for TN), and combined anaerobic-aerobic and UV/H2O2 (99.98% for TOC and
82.84% for TN).

120
Figure 4.31. TOC removal in SSWW using combined anaerobic-aerobic-UV/H2O2 processes at
different HRTs in continuous mode without recycling. Error bars represent standard
deviations.
0.00
200.00
400.00
600.00
800.00
1000.00
1200.00T
OC
(m
g/L
)
HRT - 3.15 days
HRT - 3.50 days
HRT - 4.00 days
Combined Anaerobic-Aerobic-UV/H2O2 processes
UV/H2O2 Aerobic AS ABR

121
Figure 4.32. TN removal in SSWW using combined anaerobic-aerobic-UV/H2O2 processes at
different HRTs in continuous mode without recycling. Error bars represent standard
deviations.
0.00
50.00
100.00
150.00
200.00
250.00T
N (
mg/L
)
HRT - 3.15 days
HRT - 3.50 days
HRT - 4.00 days
Combined Anaerobic-Aerobic-UV/H2O2 processes
UV/H2O2 Aerobic AS ABR
122
Figure 4.33. Maximum values on TOC removal in SSWW using combined anaerobic-aerobic-
UV/H2O2 processes in continuous mode without recycling.
0.00%
20.00%
40.00%
60.00%
80.00%
100.00%
TO
C r
emoval
(%)
% TOC removal
Combined Anaerobic-Aerobic-UV/H2O2 processes UV/H2O2
Aerobic AS ABR

123
Figure 4.34. Maximum values on TN removal in SSWW using combined anaerobic-aerobic-
UV/H2O2 processes in continuous mode without recycling.
0.00%
20.00%
40.00%
60.00%
80.00%
100.00%
TN
rem
oval
(%)
% TN removal
Combined Anaerobic-Aerobic-UV/H2O2 processes
UV/H2O2 Aerobic AS ABR

124
Figure 4.35. Comparison of TOC removal using different alternatives in continuous mode
without recycling, including UV/H2O2 process alone, ABR process alone, aerobic AS process
alone, combined anaerobic-aerobic processes, combined aerobic-anaerobic processes, and
combined anaerobic-aerobic and UV/H2O2.
0.00%
10.00%
20.00%
30.00%
40.00%
50.00%
60.00%
70.00%
80.00%
90.00%
100.00%T
OC
rem
oval
(%)
%TOC Removal

125
Figure 4.36. Comparison of TN removal using different alternatives in continuous mode without
recycling, including UV/H2O2 process alone, ABR process alone, aerobic AS process alone,
combined anaerobic-aerobic processes, combined aerobic-anaerobic processes, and combined
anaerobic-aerobic and UV/H2O2.
0.00%
10.00%
20.00%
30.00%
40.00%
50.00%
60.00%
70.00%
80.00%
90.00%
100.00%T
N r
emoval
(%)
%TN Removal

126
4.7. CBOD5 removal in SSWW using ABR alone, aerobic AS alone, UV/H2O2 alone, and
combined processes
Figures 4.37 and 4.38 show there was a significant reduction in CBOD5 using ABR alone,
aerobic AS alone, UV/H2O2 alone, and combined processes. Figure 4.37 shows the maximum inlet
concentration of CBOD5 from the SSWW to be 640 mg/L. It also illustrates the CBOD5 concentration
of every effluent of the different processes used for the treatment of SSWW, including UV/H2O2
alone (100mg/L); aerobic AS alone (50 mg/L); ABR alone (31 mg/L); combined anaerobic-aerobic
processes (4 mg/L); combined aerobic-anaerobic processes (3 mg/L); and combined anaerobic-
aerobic and UV/H2O2 (2 mg/L), where error bars represent standard deviations. In addition, Figure
4.38 illustrates that the maximum removal efficiency of CBOD5 was reached using combined
anaerobic-aerobic and UV/H2O2 processes; up to 99.69%. Comparatively, the maximum CBOD5
removal efficiencies for other methods, including UV/H2O2 alone, aerobic AS alone, ABR alone,
combined anaerobic-aerobic processes, and combined aerobic-anaerobic processes, reached 84.38,
92.19, 95.16, 99.38 and 99.53% of removal, respectively. It was deduced that only by using biological
treatment the CBOD5 concentration could be reduced more than 90% since maximum CBOD5
removal by using UV/H2O2 alone merely was reached to 84.38% at a H2O2 concentration of 900 mg/L
and a HRT of 3 h.
As depicted in Figure 4.39, TOC is directly proportional to CBOD5. This confirms that TOC
analysis provides an accurate appraisal of the total organic compounds present in a wastewater sample
in comparison to BOD or COD. TOC can be quantified by measuring the CO2 generated when the
organic compounds are oxidized. Thus, TOC analysis excludes the inorganic carbon compounds in
order to obtain accurate results of the organic contamination in source water. As the American Public
Health Association (APHA) described, TOC method may be more suitable for determining organic
matter content since it takes into account all of its different oxidation states (APHA, 1998). Moreover,
COD and BOD tests may take from 3 h to 5 days to produce any result, whereas TOC analysis can
provide results in 15 min.

127
Figure 4.37. CBOD5 concentration profile for different SSWW effluents from different
processes in continuous mode without recycling, including UV/H2O2 process alone, ABR process
alone, aerobic AS process alone, combined anaerobic-aerobic processes, combined aerobic-
anaerobic processes, and combined anaerobic-aerobic and UV/H2O2. Error bars represent
standard deviations.
0.00
100.00
200.00
300.00
400.00
500.00
600.00
700.00
SSWWin UV/H2O2 Aerobic AS ABR Combined
Ana-Ae
Combined
Ae-Ana
Combined
Ana-Ae-UV
CB
OD
5 (
mg
/L)

128
Figure 4.38. CBOD5 removal in SSWW using different alternatives in continuous mode without
recycling, including UV/H2O2 process alone, ABR process alone, aerobic AS process alone,
combined anaerobic-aerobic processes, combined aerobic-anaerobic processes, and combined
anaerobic-aerobic and UV/H2O2.
75.00%
80.00%
85.00%
90.00%
95.00%
100.00%
UV/H2O2 Aerobic AS ABR Combined
Ana-Ae
Combined
Ae-Ana
Combined
Ana-Ae-UV
CB
OD
5 R
emoval
(%)

129
Figure 4.39. Correlation between CBOD5 and TOC in SSWW using different alternatives in
continuous mode without recycling, including UV/H2O2 process alone, ABR process alone,
aerobic AS process alone, combined anaerobic-aerobic processes, combined aerobic-anaerobic
processes, and combined anaerobic-aerobic and UV/H2O2.
y = 1.5438x + 30.0296
R² = 0.9900
0.0000
200.0000
400.0000
600.0000
800.0000
1000.0000
1200.0000
0 100 200 300 400 500 600 700
TO
C (
mg
/L)
CBOD5 (mg/L)

130
4.8. Cost-effectiveness analysis (CEA) to determine the best alternative on SSWW treatment by
optimizing total electricity cost and HRT
As described above, several processes were examined in order to determine their efficiencies
in the treatment of SSWW, to evaluate the performance of the different configurations of the
combined processes, and to analyze the factors affecting their effectiveness.
Several parameters are important for a wastewater treatment system, such as HRT, which will
affect the final removal efficiency of organic pollutants in wastewater and the operating and
maintenance (O&M) costs of the system; that is the reason why this parameter is necessary to be
optimized. Therefore, at a laboratory scale, factors that affect the efficiency of the system are
electricity consumption and the usage of chemicals such as H2O2 as fundamental parts of the total
cost. Thus, these factors (electricity and H2O2 consumption) were considered for the CEA in this
study in order to optimize the combined processes.
4.8.1. Kinetic modeling for the ABR alone
The kinetic model Equation (2.14) developed by Kennedy and Barriault (2007) describe the
substrate concentration driving force within different compartments of an ABR without recycling.
The first order rate constant could be calculated from operational treatment data knowing the
substrate concentrations and biomass in each compartment. The mass balance in the first
compartment and subsequent i compartments of an n-compartment ABR are shown as follows:
( ⁄ )
( ⁄ ) (for i ≥ 1) (2.14)
where,
Si = concentration of the substrate in compartment i of the ABR (mg/L);
Si – 1 = concentration of the substrate in compartment i – 1 of the ABR, when i – 1 = 0 then
Si – 1 = So (mg/L);
So = concentration of the substrate in the influent (mg/L);
Si = concentration of the substrate in compartment i of the ABR (mg/L);
rr = recycle rate in the ABR, which is a percent of the flow rate of the influent (%);
kCi = first order rate coefficient of substrate in compartment i of the ABR;

131
kC1 = first order rate coefficient of substrate in compartment 1 of the ABR;
Xi = biomass concentration of substrate in compartment i of the ABR (mg/L);
Vi = volume of the compartment i of the ABR (L);
Q = flow rate of influent = V/t (L/d);
V = total volume of the reactor (L); and
t = HRT (d).
( ⁄ )
( ( )( )( ) ⁄ )
( ) (4.1)
( ⁄ )
( ( )( )( ) ⁄ )
( ) (4.2)
( ⁄ )
( ( )( )( ) ⁄ )
( ) (4.3)
( ⁄ )
( ( )( )( ) ⁄ )
( ) (4.4)
( ⁄ )
( ( )( )( ) ⁄ )
( ) (4.5)
Since there is no recycling, S5 = Sf, and Equations (4.1) to (4.5) are reduced to Equations (4.6)
and (4.7), which are used to predict the effluent concentrations of TOC in the ABR.
[({[ (
)⁄ ] ( )⁄ } ( )⁄ ) ( )⁄ ]
( ) (4.6)
,(*, ( )⁄ - ( )⁄ + ( )⁄ ) ( )⁄ -
( ) (4.7)
The comparison between predicted values and the experimental data is presented in Figure
4.40, which shows an agreement between the predicted model values and the experimental data.
Therefore, Equation (4.7) could be used to predict the effluent TOC concentration at a specific HRT
for the ABR process alone.

132
Figure 4.40. TOC removal comparison of the predicted values using Equation (4.7) and the
experimental data of the SSWW treatment using ABR process alone in continuous mode
without recycling.
50.00%
55.00%
60.00%
65.00%
70.00%
75.00%
80.00%
85.00%
90.00%
95.00%
100.00%
0 1 2 3 4 5 6 7 8 9
% T
OC
rem
oval
HRT (d)
% TOC removal Experiments
% TOC removal Model

133
4.8.2. Kinetic modeling for the aerobic AS alone
The kinetic model Equation (4.8) developed by Reynolds and Yang (1966) for the completely
mixed activated sludge process is based on growth relationships and material balances on the
substrate and. biological cell mass. This equation was used to predict the effluent concentrations of
TOC in the aerobic AS reactor.
(4.8)
where,
t = HRT (d);
So = concentration of the substrate in the influent (mg/L);
Sf = concentration of the substrate in the effluent (mg/L);
K = first order rate coefficient of substrate; and
= biomass concentration of substrate (mg/L).
Equation (4.8) may be rearranged as follows (Reynolds and Richards, 1996):
(4.9)
( ) (4.10)
then,
( ) (4.11)
( ( )( ) )
( ) (4.12)
The comparison between predicted values and the experimental data is presented in Figure
4.41, which shows an agreement between the predicted model values and the experimental data.
Therefore, Equation (4.12) could be used to predict the effluent TOC concentration at a specific HRT
for the aerobic AS process alone.

134
Figure 4.41. TOC removal comparison of the predicted values using Equation (4.12) and the
experimental data of the SSWW treatment using aerobic AS process alone in continuous mode
without recycling.
75.00%
80.00%
85.00%
90.00%
95.00%
100.00%
0 1 2 3 4 5 6 7 8 9
% T
OC
rem
oval
HRT (d)
% TOC removal Experiments
% TOC removal Model

135
4.8.3. Kinetic modeling for the combined anaerobic-aerobic processes
For the combined biological processes, two equations were developed by combining
Equations (4.6) and (4.11) as shown below. For combined anaerobic-aerobic processes, Equation
(4.6) is substituted in Equation (4.11) because the effluent of the ABR process becomes the influent
of the aerobic AS process.
([({[ ( )⁄ ] ( )⁄ } ( )⁄ ) ( )⁄ ]
( ))
( ) (4.13)
then,
,(*, ( )⁄ - ( )⁄ + ( )⁄ ) ( )⁄ - ( )⁄
( ) (4.14)
For combined aerobic-anaerobic processes, Equation (4.11) is substituted into Equation (4.6),
because the effluent of the aerobic AS process becomes the influent of the ABR process.
[({[* ( )⁄ + ( )⁄ ] ( )⁄ } ( )⁄ ) ( )⁄ ]
( ) (4.15)
then,
,(*,* ( )⁄ + ( )⁄ - ( )⁄ + ( )⁄ ) ( )⁄ -
( ) (4.16)
Thus, Equation (4.14) was used to predict the effluent concentrations of TOC for the
combined anaerobic-aerobic system and Equation (4.16) for the combined aerobic-anaerobic system.
The comparison between predicted values and the experimental data for the combined
anaerobic-aerobic processes and combined aerobic-anaerobic processes are presented in Figures 4.42
and 4.43, respectively. These figures show an agreement between the predicted model values and the
experimental data. Therefore, Equations (4.14) and (4.16) could be used to predict the effluent TOC
concentrations at a specific HRT for the combined anaerobic-aerobic processes and combined
aerobic-anaerobic processes, respectively.

136
Figure 4.42. TOC removal comparison of the predicted values using Equation (4.14) and the
experimental data of the SSWW treatment using combined anaerobic-aerobic processes in
continuous mode without recycling.
70.00%
75.00%
80.00%
85.00%
90.00%
95.00%
100.00%
0 2 4 6 8 10
% T
OC
rem
ov
al
HRT (d)
% TOC removal Experiments
% TOC removal Model

137
Figure 4.43. TOC removal comparison of the predicted values using Equation (4.16) and the
experimental data of the SSWW treatment using combined aerobic-anaerobic processes in
continuous mode without recycling.
75.00%
80.00%
85.00%
90.00%
95.00%
100.00%
0 2 4 6 8 10
% T
OC
rem
ov
al
HRT (d)
% TOC removal Experiments
% TOC removal Model
138
4.8.3. Kinetic modeling for the UV/H2O2 process alone
According to Shemer et al. (2006), the quantum yield (ϕ) can be calculated by Equation (4.17)
as shown below.
, - , - ⁄
( ) (4.17)
where,
( ) = specific rate of light absorption by TOC at 254 nm (E/mol.s).
( ) can be calculated by Equation (4.18) as follows:
( ) ( ) ( )[
( )( )]
( )( ) (4.18)
where,
qo(254 nm) = incident photon irradiance at 254 nm (E/cm2.s);
( ) = molar absorption coefficient of TOC at 254 nm (1/M.cm);
( ) = absorption coefficient at 254 nm (1/cm);
r = photoreactor nominal radius (cm); and
Ri = photoreactor inner radius (cm).
Equation (4.17) can be rearranged and integrated as follows:
( ) , -
, - (4.18)
∫ ( )
∫ , -
, -
(4.19)
( ) (, -
[ ]) (4.20)

139
(
, -
0 1)
( ) (4.21)
Molar concentrations for TOCo and TOCf are calculated as follows:
, - ( ) (
)
[ ] ( ) (
)
According to Oppenländer (2003), the energy (En) of a single photon at 254 nm is calculated
by Equation (4.22) as follows:
( )
(4.22)
where,
h = Planck’s constant (6.626×10⁻³⁴
J.s);
c = speed of light (2.998×10⁸ m/s); and
λ = 254×10-9
m.
then,
( ) ( )( )
Energy of one mole of photons can be calculated by using Avogadro’s number (NA):
( ) ( )
The energy (En) is used to calculate the incident light flux (qo) by dividing the power of the
UV lamp (14 W) by the surface area of the quartz sleeve (S) as follows:
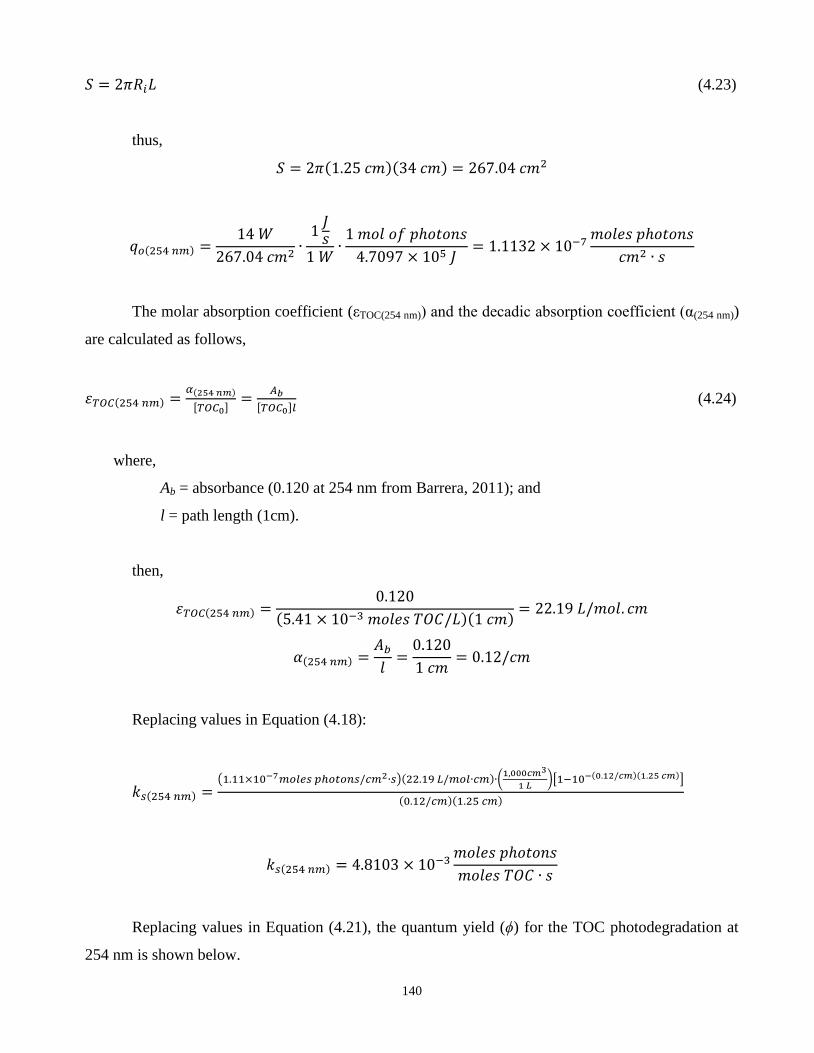
140
(4.23)
thus,
( )( )
( )
The molar absorption coefficient (εTOC(254 nm)) and the decadic absorption coefficient (α(254 nm))
are calculated as follows,
( ) ( )
, -
, - (4.24)
where,
Ab = absorbance (0.120 at 254 nm from Barrera, 2011); and
l = path length (1cm).
then,
( )
( )( )
( )
Replacing values in Equation (4.18):
( ) ( )( ) (
)[ ( )( )]
( )( )
( )
Replacing values in Equation (4.21), the quantum yield (ϕ) for the TOC photodegradation at
254 nm is shown below.

141
(, -
[ ])
( )
(
)
.
/ ( )
The kinetic model Equation (2.53) developed by Bolton et al. (2001), as the overall rate
kinetic for TOC concentrations of less than 100 mg/L, was used to predict the effluent concentrations
of TOC for the UV/H2O2 process.
, -
∑ , -
(2.53)
, -
, - (4.25)
Equation (4.25) can be rearranged and integrated as follows:
∫ , -
, -∫
(4.26)
.[ ]
, -/ (
, -) (4.27)
[ ]
, -
(
, -
) (4.28)
where,
VT = volume of the treated SSWW equal to the volume of the photoreactor (1.35 L);
p = power rating of the system (14 W); and
ξ = G.Ab.ϕ/p (moles/s.W), where G = total absolute photon flow (E/s) emitted from the lamp in
all directions at 254 nm, Ab = fraction photons absorbed (0.12), p = power output of the
lamp, and ϕ = 2.6852×10⁻²
(moles/E).
Thus, Equation (4.29) was obtained from a parameter estimation method, by giving different
values to kTOC/kH2O2 until reaching an absolute relative error of less than 10% between the model

142
prediction and any experimental data. The initial value for kTOC/kH2O2 was 7.0×10⁵ 1/(M.s) (Barrera,
2011) divided by 2.7×10⁷ 1/(M.s) (Christensen et al., 1982). When kTOC/kH2O2 values substituted into
the model overestimated the TOC removal rate, the value was reduced, while the kTOC/kH2O2 values
were substituted into the model underestimated the TOC removal rate, the value was increased. As a
result, Equation (4.29) was used to predict the effluent concentrations of TOC from the UV/H2O2
process alone.
[ ]
, - (
, -⁄ ) (4.29)
The comparison between predicted values and the experimental data for the UV/H2O2 process
alone is presented in Figure 4.44. This figure shows an agreement between the predicted model values
and the experimental data. Therefore, Equation (4.29) could be used to predict the effluent TOC
concentration at a specific HRT for the treatment of SSWW by UV/H2O2 process alone.
4.8.4. Kinetic modeling for the combined anaerobic-aerobic and UV/H2O2 processes
For the combined anaerobic-aerobic and UV/H2O2 processes, Equations (4.6), (4.11), and
(4.28) were combined. As a result, Equation (4.30) was used to predict the effluent concentrations of
TOC for the combined anaerobic-aerobic and UV/H2O2 processes.
.,(*, ( )⁄ - ( )⁄ + ( )⁄ ) ( )⁄ - ( )⁄
( )/ ( , -⁄ ) (4.30)
The comparison between predicted values and the experimental data for the combined
anaerobic-aerobic and UV/H2O2 processes is presented in Figure 4.45. This figure shows an
agreement between the predicted model values and the experimental data. Therefore, Equation (4.30)
could be used to predict the effluent TOC concentration at a specific HRT for the treatment of SSWW
using combined anaerobic-aerobic and UV/H2O2 processes.

143
Figure 4.44. TOC removal comparison of the predicted values using Equation (4.29) and the
experimental data of the SSWW treatment using UV/H2O2 process alone in continuous mode
without recycling.
0.00%
10.00%
20.00%
30.00%
40.00%
50.00%
60.00%
70.00%
80.00%
90.00%
100.00%
0 2000 4000 6000 8000 10000 12000
% T
OC
rem
oval
HRT (s)
% TOC removal Experiments
% TOC removal Model

144
Figure 4.45. TOC removal comparison of the predicted values using Equation (4.30) and the
experimental data of the SSWW treatment using combined anaerobic-aerobic and UV/H2O2
processes in continuous mode without recycling.
95.00%
96.00%
97.00%
98.00%
99.00%
100.00%
0.00 1.00 2.00 3.00 4.00 5.00 6.00 7.00 8.00
% T
OC
rem
oval
HRT (s)
% TOC removal Experiments
% TOC removal Model

145
4.8.5. Optimization of the total electricity cost and HRT to determine the best alternative on SSWW
treatment
Durán et al. (2012) presented an operational cost study to evaluate three different processes for
the treatment of an industrial effluent. The operational costs due to the consumption of electrical
energy, reagents, and catalysts were calculated from the optimal conditions of each process, and
allowed to determine the most economically feasible system. This section will be based on the
procedure suggested by Durán et al. (2012) in order to determine the best alternative of this study.
Table 4.6 summarizes the technical conditions and performance of different processes
evaluated in this study, including UV/H2O2 alone; aerobic AS alone; ABR alone; combined
anaerobic-aerobic processes; combined aerobic-anaerobic processes; and combined aerobic-anaerobic
and UV/H2O2 processes. Table 4.6 also summarizes the amount of H2O2 consumed in each of the
processes involved in the economic study.
Table 4.6. Technical conditions of the processes for the economic study
Process
Volume
(L)
No. of
Pumps
HRT
(h)
H2O2 consumed
(L)
%TOC
removal
UV/H2O2 1.35 1 3 0.0940 75.22%
ABR 33.70 1 168 n/a 89.47%
Aerobic AS 12.00 1 168 n/a 94.53%
Combined Ae-Ana 45.70 2 150 n/a 96.10%
Combined Ana-Ae 45.70 2 150 n/a 96.36%
Combined Ana-Ae-UV 47.05 3 96 0.2814 99.98% Note: Ana, anaerobic; Ae, Aerobic; UV, UV/H2O2
The economic analysis was carried out by analyzing the degradation of TOC in the SSWW.
According to Bolton et al. (2001), the cost of electricity per mass of TOC removed can be estimated
by Equation (4.31), which was defined for high TOC influent concentration because the reaction rate
of TOC is directly proportional to the rate of electricity used (Bolton et al., 2001; Cao 2009).
According to the Ontario Energy Board (OEB, 2011), the market price of electricity based on tiered
prices is $0.071/KWh. The prices of H2O2 and the electrical consumptions of the different devices
used for calculating the costs are shown in Table 4.7 with the assumption of a common TOC
concentration in the SSWW influent of 1,000 mg/L.

146
[
( )] (4.31)
where,
J = electricity cost ($/kg);
Er = energy rate ($/kWh);
P = power rating of the system (W);
t = hydraulic retention time (h);
V = volume of the reactor (L);
TOC0 = total organic carbon concentration in the influent (mg/L); and
TOCf = total organic carbon concentration in the influent (mg/L);
Table 4.7. Electric power and costs of electricity and H2O2.
Item Electric Power (kW)
UV/H2O2
Lamp 0.125
Pump 0.080
Mini-pump for H2O2 dosage 0.007
Power Rating 0.212
ABR
Pump 0.080
Power Rating 0.080
Aerobic AS
Pump 0.080
Diffuser 0.120
Power Rating 0.200
Combined Anaerobic-Aerobic
Pumps 0.150
Diffuser 0.100
Power Rating 0.250
Combined Aerobic-Anaerobic
Pumps 0.120
Diffuser 0.100
Power Rating 0.220
Combined Aerobic-Anaerobic-UV/H2O2
Lamp 0.125
Pumps 0.200
Diffuser 0.120
mini-pump for H2O2 dosage 0.005
Power Rating 0.450
Energy Cost (Ontario Energy Board 2011: $0.071/KWh
Hydrogen peroxide (H2O2) cost = $2.50/L

147
Equation (4.31) was used to calculate the electricity costs per mass of TOC removed with the
assumption of an influent concentration of 1,000 mgTOC/L. A summary of the obtained values is
presented in Tables 4.8 to 4.13, including ABR process alone, aerobic AS process alone, UV/H2O2
process alone, combined anaerobic-aerobic processes, combined aerobic-anaerobic processes, and
combined anaerobic-aerobic and UV/H2O2. Equations (4.6), (4.11), (4.14), (4.16), (4.28), and (4.30),
were used for each process, respectively.
Table 4.8. Calculated values of the electricity cost per mass TOC removed for the ABR process
alone.
ABR Process Alone
HRT
(h)
TOC0
(mg/L)
V
(L)
TOCf
(mg/L)
TOC removed
(g)
% TOC
removal
J
($/kg)
AOC*
($)
OCV** of SSWW
($/m3)
0.5 1000 33.7 990.66 3.15 0.93% 0.38 0.00 0.04
1.0 1000 33.7 981.43 6.26 1.86% 0.38 0.00 0.07
2.0 1000 33.7 963.31 12.37 3.67% 0.38 0.00 0.14
3.0 1000 33.7 945.63 18.32 5.44% 0.39 0.01 0.21
4.0 1000 33.7 928.37 24.14 7.16% 0.39 0.01 0.28
5.0 1000 33.7 911.53 29.82 8.85% 0.40 0.01 0.35
6.0 1000 33.7 895.08 35.36 10.49% 0.40 0.01 0.42
7.0 1000 33.7 879.03 40.77 12.10% 0.41 0.02 0.49
8.0 1000 33.7 863.35 46.05 13.67% 0.41 0.02 0.56
9.0 1000 33.7 848.03 51.21 15.20% 0.42 0.02 0.63
10.0 1000 33.7 833.07 56.25 16.69% 0.42 0.02 0.70
11.0 1000 33.7 818.46 61.18 18.15% 0.43 0.03 0.77
12.0 1000 33.7 804.18 65.99 19.58% 0.43 0.03 0.84
13.0 1000 33.7 790.22 70.70 20.98% 0.44 0.03 0.91
14.0 1000 33.7 776.58 75.29 22.34% 0.44 0.03 0.98
15.0 1000 33.7 763.24 79.79 23.68% 0.44 0.04 1.05
16.0 1000 33.7 750.20 84.18 24.98% 0.45 0.04 1.12
17.0 1000 33.7 737.46 88.48 26.25% 0.45 0.04 1.19
18.0 1000 33.7 724.99 92.68 27.50% 0.46 0.04 1.26
19.0 1000 33.7 712.79 96.79 28.72% 0.46 0.04 1.33
20.0 1000 33.7 700.87 100.81 29.91% 0.47 0.05 1.40
21.0 1000 33.7 689.20 104.74 31.08% 0.47 0.05 1.47
22.0 1000 33.7 677.78 108.59 32.22% 0.48 0.05 1.55
23.0 1000 33.7 666.60 112.35 33.34% 0.48 0.05 1.62
24.0 1000 33.7 655.67 116.04 34.43% 0.49 0.06 1.69
25.0 1000 33.7 644.97 119.65 35.50% 0.49 0.06 1.76
26.0 1000 33.7 634.49 123.18 36.55% 0.50 0.06 1.83
27.0 1000 33.7 624.23 126.63 37.58% 0.50 0.06 1.90
28.0 1000 33.7 614.19 130.02 38.58% 0.51 0.07 1.97
29.0 1000 33.7 604.35 133.33 39.56% 0.51 0.07 2.04
30.0 1000 33.7 594.72 136.58 40.53% 0.52 0.07 2.11
31.0 1000 33.7 585.28 139.76 41.47% 0.52 0.07 2.18
32.0 1000 33.7 576.04 142.87 42.40% 0.53 0.08 2.25
33.0 1000 33.7 566.99 145.92 43.30% 0.54 0.08 2.32
34.0 1000 33.7 558.12 148.91 44.19% 0.54 0.08 2.39
35.0 1000 33.7 549.42 151.84 45.06% 0.55 0.08 2.46
36.0 1000 33.7 540.91 154.71 45.91% 0.55 0.09 2.53
37.0 1000 33.7 532.56 157.53 46.74% 0.56 0.09 2.60
38.0 1000 33.7 524.37 160.29 47.56% 0.56 0.09 2.67

148
ABR Process Alone
HRT
(h)
TOC0
(mg/L)
V
(L)
TOCf
(mg/L)
TOC removed
(g)
% TOC
removal
J
($/kg)
AOC*
($)
OCV** of SSWW
($/m3)
39.0 1000 33.7 516.35 162.99 48.36% 0.57 0.09 2.74
40.0 1000 33.7 508.49 165.64 49.15% 0.57 0.09 2.81
41.0 1000 33.7 500.78 168.24 49.92% 0.58 0.10 2.88
42.0 1000 33.7 493.22 170.79 50.68% 0.58 0.10 2.95
43.0 1000 33.7 485.80 173.29 51.42% 0.59 0.10 3.02
44.0 1000 33.7 478.53 175.74 52.15% 0.59 0.10 3.09
45.0 1000 33.7 471.40 178.14 52.86% 0.60 0.11 3.16
46.0 1000 33.7 464.40 180.50 53.56% 0.60 0.11 3.23
47.0 1000 33.7 457.53 182.81 54.25% 0.61 0.11 3.30
48.0 1000 33.7 450.80 185.08 54.92% 0.61 0.11 3.37
49.0 1000 33.7 444.19 187.31 55.58% 0.62 0.12 3.44
50.0 1000 33.7 437.71 189.49 56.23% 0.62 0.12 3.51
51.0 1000 33.7 431.34 191.64 56.87% 0.63 0.12 3.58
52.0 1000 33.7 425.10 193.74 57.49% 0.64 0.12 3.65
53.0 1000 33.7 418.97 195.81 58.10% 0.64 0.13 3.72
54.0 1000 33.7 412.95 197.84 58.70% 0.65 0.13 3.79
55.0 1000 33.7 407.04 199.83 59.30% 0.65 0.13 3.86
56.0 1000 33.7 401.24 201.78 59.88% 0.66 0.13 3.93
57.0 1000 33.7 395.55 203.70 60.44% 0.66 0.13 4.00
58.0 1000 33.7 389.96 205.58 61.00% 0.67 0.14 4.07
59.0 1000 33.7 384.47 207.43 61.55% 0.67 0.14 4.14
60.0 1000 33.7 379.08 209.25 62.09% 0.68 0.14 4.21
61.0 1000 33.7 373.78 211.04 62.62% 0.68 0.14 4.28
62.0 1000 33.7 368.58 212.79 63.14% 0.69 0.15 4.35
63.0 1000 33.7 363.47 214.51 63.65% 0.70 0.15 4.42
64.0 1000 33.7 358.45 216.20 64.16% 0.70 0.15 4.49
65.0 1000 33.7 353.51 217.87 64.65% 0.71 0.15 4.56
66.0 1000 33.7 348.67 219.50 65.13% 0.71 0.16 4.64
67.0 1000 33.7 343.91 221.10 65.61% 0.72 0.16 4.71
68.0 1000 33.7 339.23 222.68 66.08% 0.72 0.16 4.78
69.0 1000 33.7 334.63 224.23 66.54% 0.73 0.16 4.85
70.0 1000 33.7 330.11 225.75 66.99% 0.73 0.17 4.92
71.0 1000 33.7 325.67 227.25 67.43% 0.74 0.17 4.99
72.0 1000 33.7 321.30 228.72 67.87% 0.75 0.17 5.06
* AOC, absolute operation costs. ** OCV, Operation costs per volume.
Table 4.9. Calculated values of the electricity cost per mass TOC removed for the aerobic AS
process alone.
Aerobic AS Process Alone
HRT
(h)
TOC0
(mg/L)
V
(L)
TOCf
(mg/L)
TOC removed
(g)
% TOC
removal
J
($/kg)
AOC*
($)
OCV** of SSWW
($/m3)
0.5 1000 12 951.12 5.87 4.89% 0.50 0.00 0.25
1.0 1000 12 906.79 11.19 9.32% 0.53 0.01 0.49
2.0 1000 12 829.48 20.46 17.05% 0.58 0.01 0.99
3.0 1000 12 764.31 28.28 23.57% 0.63 0.02 1.48
4.0 1000 12 708.64 34.96 29.14% 0.68 0.02 1.97
5.0 1000 12 660.53 40.74 33.95% 0.73 0.03 2.47
6.0 1000 12 618.53 45.78 38.15% 0.78 0.04 2.96
7.0 1000 12 581.56 50.21 41.84% 0.82 0.04 3.45
8.0 1000 12 548.75 54.15 45.12% 0.87 0.05 3.94
9.0 1000 12 519.45 57.67 48.05% 0.92 0.05 4.44

149
Aerobic AS Process Alone
HRT
(h)
TOC0
(mg/L)
V
(L)
TOCf
(mg/L)
TOC removed
(g)
% TOC
removal
J
($/kg)
AOC*
($)
OCV** of SSWW
($/m3)
10.0 1000 12 493.12 60.83 50.69% 0.97 0.06 4.93
11.0 1000 12 469.33 63.68 53.07% 1.02 0.07 5.42
12.0 1000 12 447.73 66.27 55.23% 1.07 0.07 5.92
13.0 1000 12 428.03 68.64 57.20% 1.12 0.08 6.41
14.0 1000 12 410.00 70.80 59.00% 1.17 0.08 6.90
15.0 1000 12 393.42 72.79 60.66% 1.22 0.09 7.40
16.0 1000 12 378.13 74.62 62.19% 1.27 0.09 7.89
17.0 1000 12 363.98 76.32 63.60% 1.32 0.10 8.38
18.0 1000 12 350.85 77.90 64.91% 1.37 0.11 8.88
19.0 1000 12 338.64 79.36 66.14% 1.42 0.11 9.37
20.0 1000 12 327.25 80.73 67.28% 1.47 0.12 9.86
21.0 1000 12 316.60 82.01 68.34% 1.52 0.12 10.35
22.0 1000 12 306.62 83.21 69.34% 1.56 0.13 10.85
23.0 1000 12 297.25 84.33 70.27% 1.61 0.14 11.34
24.0 1000 12 288.44 85.39 71.16% 1.66 0.14 11.83
25.0 1000 12 280.13 86.38 71.99% 1.71 0.15 12.33
26.0 1000 12 272.29 87.32 72.77% 1.76 0.15 12.82
27.0 1000 12 264.88 88.21 73.51% 1.81 0.16 13.31
28.0 1000 12 257.86 89.06 74.21% 1.86 0.17 13.81
29.0 1000 12 251.20 89.86 74.88% 1.91 0.17 14.30
30.0 1000 12 244.88 90.61 75.51% 1.96 0.18 14.79
31.0 1000 12 238.87 91.34 76.11% 2.01 0.18 15.28
32.0 1000 12 233.14 92.02 76.69% 2.06 0.19 15.78
33.0 1000 12 227.68 92.68 77.23% 2.11 0.20 16.27
34.0 1000 12 222.48 93.30 77.75% 2.16 0.20 16.76
35.0 1000 12 217.50 93.90 78.25% 2.21 0.21 17.26
36.0 1000 12 212.75 94.47 78.73% 2.25 0.21 17.75
37.0 1000 12 208.19 95.02 79.18% 2.30 0.22 18.24
38.0 1000 12 203.83 95.54 79.62% 2.35 0.22 18.74
39.0 1000 12 199.65 96.04 80.04% 2.40 0.23 19.23
40.0 1000 12 195.63 96.52 80.44% 2.45 0.24 19.72
41.0 1000 12 191.78 96.99 80.82% 2.50 0.24 20.22
42.0 1000 12 188.07 97.43 81.19% 2.55 0.25 20.71
43.0 1000 12 184.50 97.86 81.55% 2.60 0.25 21.20
44.0 1000 12 181.07 98.27 81.89% 2.65 0.26 21.69
45.0 1000 12 177.76 98.67 82.22% 2.70 0.27 22.19
46.0 1000 12 174.57 99.05 82.54% 2.75 0.27 22.68
47.0 1000 12 171.49 99.42 82.85% 2.80 0.28 23.17
48.0 1000 12 168.52 99.78 83.15% 2.85 0.28 23.67
49.0 1000 12 165.65 100.12 83.43% 2.90 0.29 24.16
50.0 1000 12 162.88 100.45 83.71% 2.94 0.30 24.65
51.0 1000 12 160.20 100.78 83.98% 2.99 0.30 25.15
52.0 1000 12 157.60 101.09 84.24% 3.04 0.31 25.64
53.0 1000 12 155.09 101.39 84.49% 3.09 0.31 26.13
54.0 1000 12 152.66 101.68 84.73% 3.14 0.32 26.63
55.0 1000 12 150.30 101.96 84.97% 3.19 0.33 27.12
56.0 1000 12 148.01 102.24 85.20% 3.24 0.33 27.61
57.0 1000 12 145.79 102.50 85.42% 3.29 0.34 28.10
58.0 1000 12 143.64 102.76 85.64% 3.34 0.34 28.60
59.0 1000 12 141.55 103.01 85.84% 3.39 0.35 29.09
60.0 1000 12 139.52 103.26 86.05% 3.44 0.36 29.58
61.0 1000 12 137.55 103.49 86.25% 3.49 0.36 30.08
62.0 1000 12 135.63 103.72 86.44% 3.54 0.37 30.57
63.0 1000 12 133.77 103.95 86.62% 3.59 0.37 31.06
64.0 1000 12 131.95 104.17 86.80% 3.64 0.38 31.56

150
Aerobic AS Process Alone
HRT
(h)
TOC0
(mg/L)
V
(L)
TOCf
(mg/L)
TOC removed
(g)
% TOC
removal
J
($/kg)
AOC*
($)
OCV** of SSWW
($/m3)
65.0 1000 12 130.19 104.38 86.98% 3.68 0.38 32.05
66.0 1000 12 128.47 104.58 87.15% 3.73 0.39 32.54
67.0 1000 12 126.79 104.78 87.32% 3.78 0.40 33.03
68.0 1000 12 125.16 104.98 87.48% 3.83 0.40 33.53
69.0 1000 12 123.57 105.17 87.64% 3.88 0.41 34.02
70.0 1000 12 122.02 105.36 87.80% 3.93 0.41 34.51
71.0 1000 12 120.51 105.54 87.95% 3.98 0.42 35.01
72.0 1000 12 119.04 105.72 88.10% 4.03 0.43 35.50
* AOC, absolute operation costs. ** OCV, Operation costs per volume.
Table 4.10. Calculated values of the electricity cost per mass TOC removed for the UV/H2O2
process alone.
UV/H2O2 Process Alone
HRT
(h)
TOC0
(mg/L)
V
(L)
TOCf
(mg/L)
TOC removed
(g)
% TOC
removal
J
($/kg)
AOC*
($)
OCV** of SSWW
($/m3)
0.5 1000 1.35 995.22 0.06 0.48% 48.54 0.00 2.32
1.0 1000 1.35 990.45 0.13 0.95% 48.66 0.01 4.65
2.0 1000 1.35 981.00 0.26 1.90% 48.89 0.01 9.29
3.0 1000 1.35 971.63 0.38 2.84% 49.13 0.02 13.94
4.0 1000 1.35 962.36 0.51 3.76% 49.36 0.03 18.58
5.0 1000 1.35 953.17 0.63 4.68% 49.60 0.03 23.23
6.0 1000 1.35 944.07 0.76 5.59% 49.84 0.04 27.87
7.0 1000 1.35 935.05 0.88 6.49% 50.07 0.04 32.52
8.0 1000 1.35 926.13 1.00 7.39% 50.31 0.05 37.17
9.0 1000 1.35 917.29 1.12 8.27% 50.55 0.06 41.81
10.0 1000 1.35 908.53 1.23 9.15% 50.79 0.06 46.46
11.0 1000 1.35 899.85 1.35 10.01% 51.03 0.07 51.10
12.0 1000 1.35 891.26 1.47 10.87% 51.27 0.08 55.75
13.0 1000 1.35 882.75 1.58 11.72% 51.51 0.08 60.39
14.0 1000 1.35 874.33 1.70 12.57% 51.75 0.09 65.04
15.0 1000 1.35 865.98 1.81 13.40% 52.00 0.09 69.69
16.0 1000 1.35 857.71 1.92 14.23% 52.24 0.10 74.33
17.0 1000 1.35 849.52 2.03 15.05% 52.48 0.11 78.98
18.0 1000 1.35 841.41 2.14 15.86% 52.73 0.11 83.62
19.0 1000 1.35 833.38 2.25 16.66% 52.98 0.12 88.27
20.0 1000 1.35 825.42 2.36 17.46% 53.22 0.13 92.91
21.0 1000 1.35 817.54 2.46 18.25% 53.47 0.13 97.56
22.0 1000 1.35 809.74 2.57 19.03% 53.72 0.14 102.20
23.0 1000 1.35 802.01 2.67 19.80% 53.97 0.14 106.85
24.0 1000 1.35 794.35 2.78 20.56% 54.22 0.15 111.50
25.0 1000 1.35 786.77 2.88 21.32% 54.47 0.16 116.14
26.0 1000 1.35 779.26 2.98 22.07% 54.72 0.16 120.79
27.0 1000 1.35 771.82 3.08 22.82% 54.97 0.17 125.43
28.0 1000 1.35 764.45 3.18 23.56% 55.22 0.18 130.08
29.0 1000 1.35 757.15 3.28 24.29% 55.48 0.18 134.72
30.0 1000 1.35 749.92 3.38 25.01% 55.73 0.19 139.37
31.0 1000 1.35 742.76 3.47 25.72% 55.99 0.19 144.02
32.0 1000 1.35 735.67 3.57 26.43% 56.24 0.20 148.66
33.0 1000 1.35 728.65 3.66 27.14% 56.50 0.21 153.31
34.0 1000 1.35 721.69 3.76 27.83% 56.75 0.21 157.95
35.0 1000 1.35 714.80 3.85 28.52% 57.01 0.22 162.60
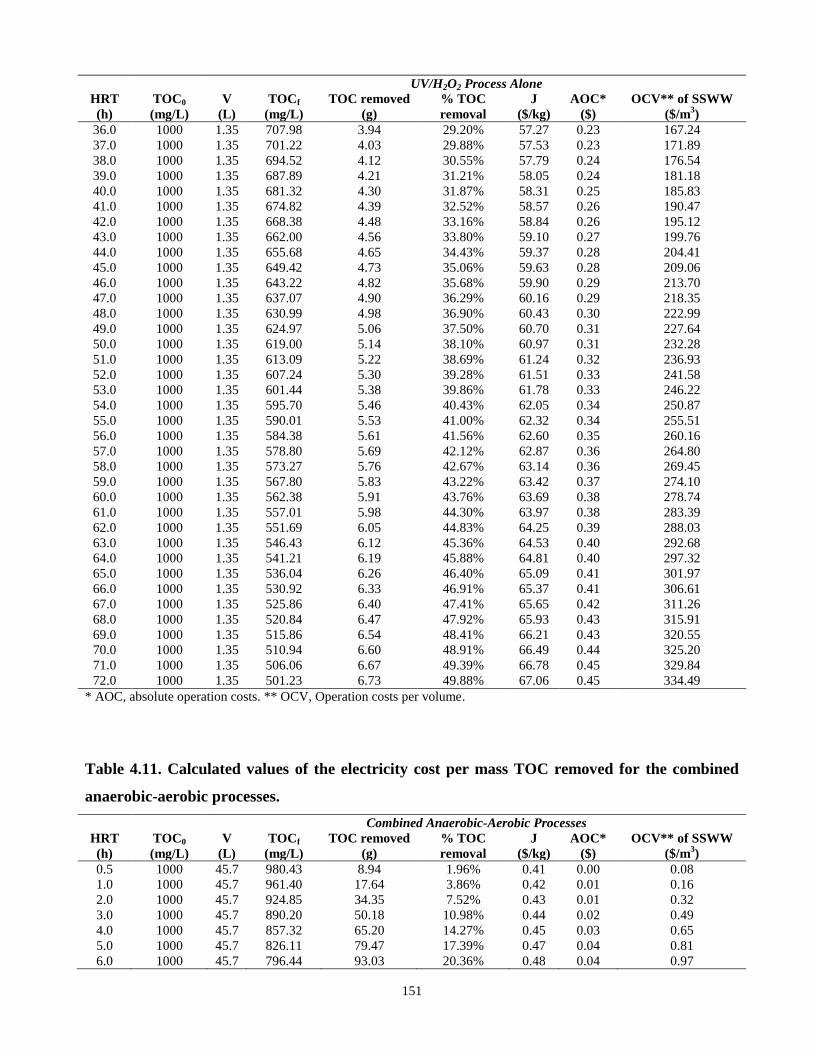
151
UV/H2O2 Process Alone
HRT
(h)
TOC0
(mg/L)
V
(L)
TOCf
(mg/L)
TOC removed
(g)
% TOC
removal
J
($/kg)
AOC*
($)
OCV** of SSWW
($/m3)
36.0 1000 1.35 707.98 3.94 29.20% 57.27 0.23 167.24
37.0 1000 1.35 701.22 4.03 29.88% 57.53 0.23 171.89
38.0 1000 1.35 694.52 4.12 30.55% 57.79 0.24 176.54
39.0 1000 1.35 687.89 4.21 31.21% 58.05 0.24 181.18
40.0 1000 1.35 681.32 4.30 31.87% 58.31 0.25 185.83
41.0 1000 1.35 674.82 4.39 32.52% 58.57 0.26 190.47
42.0 1000 1.35 668.38 4.48 33.16% 58.84 0.26 195.12
43.0 1000 1.35 662.00 4.56 33.80% 59.10 0.27 199.76
44.0 1000 1.35 655.68 4.65 34.43% 59.37 0.28 204.41
45.0 1000 1.35 649.42 4.73 35.06% 59.63 0.28 209.06
46.0 1000 1.35 643.22 4.82 35.68% 59.90 0.29 213.70
47.0 1000 1.35 637.07 4.90 36.29% 60.16 0.29 218.35
48.0 1000 1.35 630.99 4.98 36.90% 60.43 0.30 222.99
49.0 1000 1.35 624.97 5.06 37.50% 60.70 0.31 227.64
50.0 1000 1.35 619.00 5.14 38.10% 60.97 0.31 232.28
51.0 1000 1.35 613.09 5.22 38.69% 61.24 0.32 236.93
52.0 1000 1.35 607.24 5.30 39.28% 61.51 0.33 241.58
53.0 1000 1.35 601.44 5.38 39.86% 61.78 0.33 246.22
54.0 1000 1.35 595.70 5.46 40.43% 62.05 0.34 250.87
55.0 1000 1.35 590.01 5.53 41.00% 62.32 0.34 255.51
56.0 1000 1.35 584.38 5.61 41.56% 62.60 0.35 260.16
57.0 1000 1.35 578.80 5.69 42.12% 62.87 0.36 264.80
58.0 1000 1.35 573.27 5.76 42.67% 63.14 0.36 269.45
59.0 1000 1.35 567.80 5.83 43.22% 63.42 0.37 274.10
60.0 1000 1.35 562.38 5.91 43.76% 63.69 0.38 278.74
61.0 1000 1.35 557.01 5.98 44.30% 63.97 0.38 283.39
62.0 1000 1.35 551.69 6.05 44.83% 64.25 0.39 288.03
63.0 1000 1.35 546.43 6.12 45.36% 64.53 0.40 292.68
64.0 1000 1.35 541.21 6.19 45.88% 64.81 0.40 297.32
65.0 1000 1.35 536.04 6.26 46.40% 65.09 0.41 301.97
66.0 1000 1.35 530.92 6.33 46.91% 65.37 0.41 306.61
67.0 1000 1.35 525.86 6.40 47.41% 65.65 0.42 311.26
68.0 1000 1.35 520.84 6.47 47.92% 65.93 0.43 315.91
69.0 1000 1.35 515.86 6.54 48.41% 66.21 0.43 320.55
70.0 1000 1.35 510.94 6.60 48.91% 66.49 0.44 325.20
71.0 1000 1.35 506.06 6.67 49.39% 66.78 0.45 329.84
72.0 1000 1.35 501.23 6.73 49.88% 67.06 0.45 334.49
* AOC, absolute operation costs. ** OCV, Operation costs per volume.
Table 4.11. Calculated values of the electricity cost per mass TOC removed for the combined
anaerobic-aerobic processes.
Combined Anaerobic-Aerobic Processes
HRT
(h)
TOC0
(mg/L)
V
(L)
TOCf
(mg/L)
TOC removed
(g)
% TOC
removal
J
($/kg)
AOC*
($)
OCV** of SSWW
($/m3)
0.5 1000 45.7 980.43 8.94 1.96% 0.41 0.00 0.08
1.0 1000 45.7 961.40 17.64 3.86% 0.42 0.01 0.16
2.0 1000 45.7 924.85 34.35 7.52% 0.43 0.01 0.32
3.0 1000 45.7 890.20 50.18 10.98% 0.44 0.02 0.49
4.0 1000 45.7 857.32 65.20 14.27% 0.45 0.03 0.65
5.0 1000 45.7 826.11 79.47 17.39% 0.47 0.04 0.81
6.0 1000 45.7 796.44 93.03 20.36% 0.48 0.04 0.97

152
Combined Anaerobic-Aerobic Processes
HRT
(h)
TOC0
(mg/L)
V
(L)
TOCf
(mg/L)
TOC removed
(g)
% TOC
removal
J
($/kg)
AOC*
($)
OCV** of SSWW
($/m3)
7.0 1000 45.7 768.22 105.93 23.18% 0.49 0.05 1.13
8.0 1000 45.7 741.35 118.20 25.86% 0.50 0.06 1.29
9.0 1000 45.7 715.76 129.90 28.42% 0.51 0.07 1.46
10.0 1000 45.7 691.36 141.05 30.86% 0.52 0.07 1.62
11.0 1000 45.7 668.09 151.68 33.19% 0.54 0.08 1.78
12.0 1000 45.7 645.87 161.84 35.41% 0.55 0.09 1.94
13.0 1000 45.7 624.65 171.54 37.54% 0.56 0.10 2.10
14.0 1000 45.7 604.36 180.81 39.56% 0.57 0.10 2.27
15.0 1000 45.7 584.96 189.67 41.50% 0.58 0.11 2.43
16.0 1000 45.7 566.39 198.16 43.36% 0.60 0.12 2.59
17.0 1000 45.7 548.61 206.29 45.14% 0.61 0.13 2.75
18.0 1000 45.7 531.57 214.07 46.84% 0.62 0.13 2.91
19.0 1000 45.7 515.24 221.53 48.48% 0.63 0.14 3.07
20.0 1000 45.7 499.58 228.69 50.04% 0.65 0.15 3.24
21.0 1000 45.7 484.55 235.56 51.54% 0.66 0.16 3.40
22.0 1000 45.7 470.12 242.15 52.99% 0.67 0.16 3.56
23.0 1000 45.7 456.27 248.49 54.37% 0.68 0.17 3.72
24.0 1000 45.7 442.95 254.57 55.71% 0.70 0.18 3.88
25.0 1000 45.7 430.15 260.42 56.99% 0.71 0.18 4.05
26.0 1000 45.7 417.83 266.05 58.22% 0.72 0.19 4.21
27.0 1000 45.7 405.99 271.46 59.40% 0.74 0.20 4.37
28.0 1000 45.7 394.58 276.68 60.54% 0.75 0.21 4.53
29.0 1000 45.7 383.60 281.69 61.64% 0.76 0.21 4.69
30.0 1000 45.7 373.02 286.53 62.70% 0.77 0.22 4.86
31.0 1000 45.7 362.82 291.19 63.72% 0.79 0.23 5.02
32.0 1000 45.7 352.99 295.68 64.70% 0.80 0.24 5.18
33.0 1000 45.7 343.51 300.01 65.65% 0.81 0.24 5.34
34.0 1000 45.7 334.37 304.19 66.56% 0.83 0.25 5.50
35.0 1000 45.7 325.54 308.23 67.45% 0.84 0.26 5.66
36.0 1000 45.7 317.02 312.12 68.30% 0.85 0.27 5.83
37.0 1000 45.7 308.78 315.89 69.12% 0.87 0.27 5.99
38.0 1000 45.7 300.83 319.52 69.92% 0.88 0.28 6.15
39.0 1000 45.7 293.15 323.03 70.69% 0.89 0.29 6.31
40.0 1000 45.7 285.72 326.43 71.43% 0.91 0.30 6.47
41.0 1000 45.7 278.53 329.71 72.15% 0.92 0.30 6.64
42.0 1000 45.7 271.59 332.89 72.84% 0.93 0.31 6.80
43.0 1000 45.7 264.86 335.96 73.51% 0.95 0.32 6.96
44.0 1000 45.7 258.36 338.93 74.16% 0.96 0.33 7.12
45.0 1000 45.7 252.06 341.81 74.79% 0.97 0.33 7.28
46.0 1000 45.7 245.96 344.60 75.40% 0.99 0.34 7.44
47.0 1000 45.7 240.05 347.30 76.00% 1.00 0.35 7.61
48.0 1000 45.7 234.32 349.91 76.57% 1.01 0.36 7.77
49.0 1000 45.7 228.77 352.45 77.12% 1.03 0.36 7.93
50.0 1000 45.7 223.40 354.91 77.66% 1.04 0.37 8.09
51.0 1000 45.7 218.18 357.29 78.18% 1.06 0.38 8.25
52.0 1000 45.7 213.12 359.60 78.69% 1.07 0.38 8.42
53.0 1000 45.7 208.22 361.84 79.18% 1.08 0.39 8.58
54.0 1000 45.7 203.46 364.02 79.65% 1.10 0.40 8.74
55.0 1000 45.7 198.84 366.13 80.12% 1.11 0.41 8.90
56.0 1000 45.7 194.35 368.18 80.56% 1.12 0.41 9.06
57.0 1000 45.7 190.00 370.17 81.00% 1.14 0.42 9.22
58.0 1000 45.7 185.77 372.10 81.42% 1.15 0.43 9.39
59.0 1000 45.7 181.66 373.98 81.83% 1.17 0.44 9.55
60.0 1000 45.7 177.67 375.81 82.23% 1.18 0.44 9.71
61.0 1000 45.7 173.79 377.58 82.62% 1.19 0.45 9.87

153
Combined Anaerobic-Aerobic Processes
HRT
(h)
TOC0
(mg/L)
V
(L)
TOCf
(mg/L)
TOC removed
(g)
% TOC
removal
J
($/kg)
AOC*
($)
OCV** of SSWW
($/m3)
62.0 1000 45.7 170.02 379.30 83.00% 1.21 0.46 10.03
63.0 1000 45.7 166.35 380.98 83.36% 1.22 0.47 10.20
64.0 1000 45.7 162.79 382.60 83.72% 1.24 0.47 10.36
65.0 1000 45.7 159.33 384.19 84.07% 1.25 0.48 10.52
66.0 1000 45.7 155.95 385.73 84.40% 1.27 0.49 10.68
67.0 1000 45.7 152.67 387.23 84.73% 1.28 0.50 10.84
68.0 1000 45.7 149.48 388.69 85.05% 1.29 0.50 11.00
69.0 1000 45.7 146.37 390.11 85.36% 1.31 0.51 11.17
70.0 1000 45.7 143.35 391.49 85.66% 1.32 0.52 11.33
71.0 1000 45.7 140.41 392.83 85.96% 1.34 0.53 11.49
72.0 1000 45.7 137.54 394.14 86.25% 1.35 0.53 11.65
* AOC, absolute operation costs. ** OCV, Operation costs per volume.
Table 4.12. Calculated values of the electricity cost per mass TOC removed for the combined
aerobic-anaerobic processes.
Combined Aerobic-Anaerobic Processes
HRT
(h)
TOC0
(mg/L)
V
(L)
TOCf
(mg/L)
TOC removed
(g)
% TOC
removal
J
($/kg)
AOC*
($)
OCV** of SSWW
($/m3)
0.5 1000 45.7 977.72 10.18 2.23% 0.36 0.00 0.08
1.0 1000 45.7 956.20 20.01 4.38% 0.37 0.01 0.16
2.0 1000 45.7 915.31 38.70 8.47% 0.38 0.01 0.32
3.0 1000 45.7 877.06 56.18 12.29% 0.39 0.02 0.49
4.0 1000 45.7 841.21 72.57 15.88% 0.41 0.03 0.65
5.0 1000 45.7 807.55 87.95 19.24% 0.42 0.04 0.81
6.0 1000 45.7 775.90 102.41 22.41% 0.43 0.04 0.97
7.0 1000 45.7 746.10 116.03 25.39% 0.45 0.05 1.13
8.0 1000 45.7 717.99 128.88 28.20% 0.46 0.06 1.29
9.0 1000 45.7 691.44 141.01 30.86% 0.47 0.07 1.46
10.0 1000 45.7 666.34 152.48 33.37% 0.49 0.07 1.62
11.0 1000 45.7 642.58 163.34 35.74% 0.50 0.08 1.78
12.0 1000 45.7 620.06 173.63 37.99% 0.51 0.09 1.94
13.0 1000 45.7 598.68 183.40 40.13% 0.52 0.10 2.10
14.0 1000 45.7 578.38 192.68 42.16% 0.54 0.10 2.27
15.0 1000 45.7 559.08 201.50 44.09% 0.55 0.11 2.43
16.0 1000 45.7 540.70 209.90 45.93% 0.56 0.12 2.59
17.0 1000 45.7 523.20 217.90 47.68% 0.58 0.13 2.75
18.0 1000 45.7 506.51 225.52 49.35% 0.59 0.13 2.91
19.0 1000 45.7 490.59 232.80 50.94% 0.60 0.14 3.07
20.0 1000 45.7 475.38 239.75 52.46% 0.62 0.15 3.24
21.0 1000 45.7 460.84 246.40 53.92% 0.63 0.16 3.40
22.0 1000 45.7 446.94 252.75 55.31% 0.64 0.16 3.56
23.0 1000 45.7 433.63 258.83 56.64% 0.66 0.17 3.72
24.0 1000 45.7 420.88 264.66 57.91% 0.67 0.18 3.88
25.0 1000 45.7 408.66 270.24 59.13% 0.68 0.18 4.05
26.0 1000 45.7 396.94 275.60 60.31% 0.70 0.19 4.21
27.0 1000 45.7 385.70 280.74 61.43% 0.71 0.20 4.37
28.0 1000 45.7 374.90 285.67 62.51% 0.72 0.21 4.53
29.0 1000 45.7 364.52 290.41 63.55% 0.74 0.21 4.69
30.0 1000 45.7 354.55 294.97 64.55% 0.75 0.22 4.86
31.0 1000 45.7 344.95 299.36 65.50% 0.77 0.23 5.02
32.0 1000 45.7 335.72 303.58 66.43% 0.78 0.24 5.18

154
Combined Aerobic-Anaerobic Processes
HRT
(h)
TOC0
(mg/L)
V
(L)
TOCf
(mg/L)
TOC removed
(g)
% TOC
removal
J
($/kg)
AOC*
($)
OCV** of SSWW
($/m3)
33.0 1000 45.7 326.83 307.64 67.32% 0.79 0.24 5.34
34.0 1000 45.7 318.26 311.55 68.17% 0.81 0.25 5.50
35.0 1000 45.7 310.01 315.32 69.00% 0.82 0.26 5.66
36.0 1000 45.7 302.05 318.96 69.79% 0.83 0.27 5.83
37.0 1000 45.7 294.38 322.47 70.56% 0.85 0.27 5.99
38.0 1000 45.7 286.97 325.85 71.30% 0.86 0.28 6.15
39.0 1000 45.7 279.82 329.12 72.02% 0.88 0.29 6.31
40.0 1000 45.7 272.91 332.28 72.71% 0.89 0.30 6.47
41.0 1000 45.7 266.24 335.33 73.38% 0.90 0.30 6.64
42.0 1000 45.7 259.79 338.28 74.02% 0.92 0.31 6.80
43.0 1000 45.7 253.55 341.13 74.65% 0.93 0.32 6.96
44.0 1000 45.7 247.52 343.89 75.25% 0.95 0.33 7.12
45.0 1000 45.7 241.68 346.55 75.83% 0.96 0.33 7.28
46.0 1000 45.7 236.03 349.14 76.40% 0.97 0.34 7.44
47.0 1000 45.7 230.55 351.64 76.94% 0.99 0.35 7.61
48.0 1000 45.7 225.25 354.06 77.47% 1.00 0.36 7.77
49.0 1000 45.7 220.12 356.41 77.99% 1.02 0.36 7.93
50.0 1000 45.7 215.14 358.68 78.49% 1.03 0.37 8.09
51.0 1000 45.7 210.32 360.89 78.97% 1.05 0.38 8.25
52.0 1000 45.7 205.64 363.02 79.44% 1.06 0.38 8.42
53.0 1000 45.7 201.10 365.10 79.89% 1.07 0.39 8.58
54.0 1000 45.7 196.69 367.11 80.33% 1.09 0.40 8.74
55.0 1000 45.7 192.42 369.07 80.76% 1.10 0.41 8.90
56.0 1000 45.7 188.27 370.96 81.17% 1.12 0.41 9.06
57.0 1000 45.7 184.24 372.80 81.58% 1.13 0.42 9.22
58.0 1000 45.7 180.32 374.59 81.97% 1.15 0.43 9.39
59.0 1000 45.7 176.52 376.33 82.35% 1.16 0.44 9.55
60.0 1000 45.7 172.82 378.02 82.72% 1.17 0.44 9.71
61.0 1000 45.7 169.22 379.66 83.08% 1.19 0.45 9.87
62.0 1000 45.7 165.73 381.26 83.43% 1.20 0.46 10.03
63.0 1000 45.7 162.33 382.82 83.77% 1.22 0.47 10.20
64.0 1000 45.7 159.02 384.33 84.10% 1.23 0.47 10.36
65.0 1000 45.7 155.81 385.80 84.42% 1.25 0.48 10.52
66.0 1000 45.7 152.68 387.23 84.73% 1.26 0.49 10.68
67.0 1000 45.7 149.63 388.62 85.04% 1.28 0.50 10.84
68.0 1000 45.7 146.66 389.98 85.33% 1.29 0.50 11.00
69.0 1000 45.7 143.77 391.30 85.62% 1.30 0.51 11.17
70.0 1000 45.7 140.96 392.58 85.90% 1.32 0.52 11.33
71.0 1000 45.7 138.22 393.84 86.18% 1.33 0.53 11.49
72.0 1000 45.7 135.55 395.06 86.45% 1.35 0.53 11.65
* AOC, absolute operation costs. ** OCV, Operation costs per volume.
Table 4.13. Calculated values of the electricity cost per mass TOC removed for the combined
anaerobic-aerobic and UV/H2O2 processes.
Combined Anaerobic-Aerobic and UV/H2O2 Processes
HRT
(h)
TOC0
(mg/L) V (L)
TOCf
(mg/L)
TOC removed
(g)
% TOC
removal
J
($/kg)
AOC*
($)
OCV** of SSWW
($/m3)
0.5 1000 47.05 966.6793 15.68 3.33% 0.42 0.01 0.14
1.0 1000 47.05 934.5376 30.80 6.55% 0.43 0.01 0.28
2.0 1000 47.05 873.6150 59.46 12.64% 0.45 0.03 0.57
3.0 1000 47.05 816.8971 86.15 18.31% 0.46 0.04 0.85

155
Combined Anaerobic-Aerobic and UV/H2O2 Processes
HRT
(h)
TOC0
(mg/L) V (L)
TOCf
(mg/L)
TOC removed
(g)
% TOC
removal
J
($/kg)
AOC*
($)
OCV** of SSWW
($/m3)
4.0 1000 47.05 764.0753 111.00 23.59% 0.48 0.05 1.13
5.0 1000 47.05 714.8653 134.16 28.51% 0.50 0.07 1.41
6.0 1000 47.05 669.0048 155.73 33.10% 0.51 0.08 1.70
7.0 1000 47.05 626.2518 175.85 37.37% 0.53 0.09 1.98
8.0 1000 47.05 586.3829 194.61 41.36% 0.55 0.11 2.26
9.0 1000 47.05 549.1920 212.11 45.08% 0.56 0.12 2.55
10.0 1000 47.05 514.4884 228.43 48.55% 0.58 0.13 2.83
11.0 1000 47.05 482.0960 243.67 51.79% 0.60 0.15 3.11
12.0 1000 47.05 451.8520 257.90 54.81% 0.62 0.16 3.40
13.0 1000 47.05 423.6056 271.19 57.64% 0.64 0.17 3.68
14.0 1000 47.05 397.2173 283.61 60.28% 0.66 0.19 3.96
15.0 1000 47.05 372.5581 295.21 62.74% 0.68 0.20 4.24
16.0 1000 47.05 349.5082 306.06 65.05% 0.70 0.21 4.53
17.0 1000 47.05 327.9569 316.20 67.20% 0.72 0.23 4.81
18.0 1000 47.05 307.8014 325.68 69.22% 0.74 0.24 5.09
19.0 1000 47.05 288.9463 334.55 71.11% 0.76 0.25 5.38
20.0 1000 47.05 271.3033 342.85 72.87% 0.78 0.27 5.66
21.0 1000 47.05 254.7903 350.62 74.52% 0.80 0.28 5.94
22.0 1000 47.05 239.3310 357.89 76.07% 0.82 0.29 6.22
23.0 1000 47.05 224.8547 364.71 77.51% 0.84 0.31 6.51
24.0 1000 47.05 211.2958 371.09 78.87% 0.86 0.32 6.79
25.0 1000 47.05 198.5929 377.06 80.14% 0.88 0.33 7.07
26.0 1000 47.05 186.6895 382.66 81.33% 0.90 0.35 7.36
27.0 1000 47.05 175.5325 387.91 82.45% 0.93 0.36 7.64
28.0 1000 47.05 165.0729 392.83 83.49% 0.95 0.37 7.92
29.0 1000 47.05 155.2650 397.45 84.47% 0.97 0.39 8.21
30.0 1000 47.05 146.0660 401.78 85.39% 0.99 0.40 8.49
31.0 1000 47.05 137.4364 405.84 86.26% 1.02 0.41 8.77
32.0 1000 47.05 129.3393 409.65 87.07% 1.04 0.43 9.05
33.0 1000 47.05 121.7401 413.22 87.83% 1.06 0.44 9.34
34.0 1000 47.05 114.6069 416.58 88.54% 1.09 0.45 9.62
35.0 1000 47.05 107.9097 419.73 89.21% 1.11 0.47 9.90
36.0 1000 47.05 101.6206 422.69 89.84% 1.13 0.48 10.19
37.0 1000 47.05 95.7136 425.47 90.43% 1.16 0.49 10.47
38.0 1000 47.05 90.1645 428.08 90.98% 1.18 0.51 10.75
39.0 1000 47.05 84.9505 430.53 91.50% 1.21 0.52 11.03
40.0 1000 47.05 80.0505 432.84 91.99% 1.23 0.53 11.32
41.0 1000 47.05 75.4448 435.00 92.46% 1.25 0.55 11.60
42.0 1000 47.05 71.1148 437.04 92.89% 1.28 0.56 11.88
43.0 1000 47.05 67.0434 438.96 93.30% 1.30 0.57 12.17
44.0 1000 47.05 63.2145 440.76 93.68% 1.33 0.59 12.45
45.0 1000 47.05 59.6129 442.45 94.04% 1.35 0.60 12.73
46.0 1000 47.05 56.2247 444.05 94.38% 1.38 0.61 13.02
47.0 1000 47.05 53.0365 445.55 94.70% 1.40 0.63 13.30
48.0 1000 47.05 50.0362 446.96 95.00% 1.43 0.64 13.58
49.0 1000 47.05 47.2122 448.29 95.28% 1.46 0.65 13.86
50.0 1000 47.05 44.5536 449.54 95.54% 1.48 0.67 14.15
51.0 1000 47.05 42.0505 450.72 95.79% 1.51 0.68 14.43
52.0 1000 47.05 39.6933 451.82 96.03% 1.53 0.69 14.71
53.0 1000 47.05 37.4731 452.87 96.25% 1.56 0.71 15.00
54.0 1000 47.05 35.3818 453.85 96.46% 1.58 0.72 15.28
55.0 1000 47.05 33.4115 454.78 96.66% 1.61 0.73 15.56
56.0 1000 47.05 31.5549 455.65 96.84% 1.64 0.75 15.84
57.0 1000 47.05 29.8052 456.48 97.02% 1.66 0.76 16.13
58.0 1000 47.05 28.1561 457.25 97.18% 1.69 0.77 16.41

156
Combined Anaerobic-Aerobic and UV/H2O2 Processes
HRT
(h)
TOC0
(mg/L) V (L)
TOCf
(mg/L)
TOC removed
(g)
% TOC
removal
J
($/kg)
AOC*
($)
OCV** of SSWW
($/m3)
59.0 1000 47.05 26.6014 457.98 97.34% 1.71 0.79 16.69
60.0 1000 47.05 25.1357 458.67 97.49% 1.74 0.80 16.98
61.0 1000 47.05 23.7535 459.32 97.62% 1.77 0.81 17.26
62.0 1000 47.05 22.4501 459.94 97.75% 1.79 0.83 17.54
63.0 1000 47.05 21.2206 460.52 97.88% 1.82 0.84 17.83
64.0 1000 47.05 20.0608 461.06 97.99% 1.85 0.85 18.11
65.0 1000 47.05 18.9666 461.58 98.10% 1.87 0.87 18.39
66.0 1000 47.05 17.9341 462.06 98.21% 1.90 0.88 18.67
67.0 1000 47.05 16.9597 462.52 98.30% 1.93 0.89 18.96
68.0 1000 47.05 16.0400 462.95 98.40% 1.96 0.91 19.24
69.0 1000 47.05 15.1719 463.36 98.48% 1.98 0.92 19.52
70.0 1000 47.05 14.3523 463.75 98.56% 2.01 0.93 19.81
71.0 1000 47.05 13.5784 464.11 98.64% 2.04 0.95 20.09
72.0 1000 47.05 12.8476 464.46 98.72% 2.06 0.96 20.37
* AOC, absolute operation costs. ** OCV, Operation costs per volume.
Figure 4.46 shows the comparison of six techniques in terms of mineralization, measured in
grams of TOC removed as a function of operation time. It can be observed that the combined
anaerobic-aerobic and UV/H2O2 processes were more technically efficient than the other processes
because they could remove 15% more TOC during the same operation time. However, this apparent
advantage must be confirmed in economic terms.
Figure 4.47 shows the operational costs per kilogram of TOC removed, including optimization
of HRT and H2O2 consumption for the six processes as a function of the percentage of TOC removed.
UV/H2O2 alone is the less efficient technology with an optimum removal of 49.88% at a high cost of
$67.06/kg of TOC removed. The TOC removal does not significantly increase by augmenting the
HRT (Figure 4.47b). In contrast, it was observed that the aerobic AS is an efficient process with an
optimum TOC removal of 88.10% at a cost of $4.03/kg of TOC removed (Figure 4.47a).
Figure 4.48 shows the absolute operational costs ($) compared with the percentage of TOC
removed. Two important facts should be noted, the costs increase with the amount of TOC removed
for the six processes, especially when high TOC removal rates are achieved; and also, if low or
intermediate amounts of TOC are to be removed, combined processes and individual processes are
comparable in economic terms.
Finally, Figure 4.49 summarizes the operational costs of the six processes in terms of dollars
per cubic meter of treated wastewater, which is a useful measurement from an industrial viewpoint. It

157
is confirmed that costs ($/m3) increase dramatically with TOC removal because of the electricity
consumption in the UV/H2O2 process alone, reaching values ten times higher than those of the
processes that use biological treatment. Thus, in the combined processes, the main costs are initially
for pumps, reagents and air injection; only when the TOC removal is higher than 60% do the
electricity costs gradually increase.
To conclude, it was determined that the optimum system is the combined anaerobic-aerobic
and UV/H2O2 processes, with an optimal TOC removal of 92.46% at an HRT of 41 h, at a cost of
$1.25/kg of TOC removed and $11.60/m3 of treated SSWW. It should be noted that this process
reaches a TOC removal of 99% at a HRT of 76.5 h (3.19 days) with an estimated operational cost of
$2.19/kg of TOC removed and $21.65/m3 of treated SSWW.

158
Figure 4.46. Mineralization under different processes, ABR process alone, aerobic AS process
alone, UV/H2O2 process alone, combined anaerobic-aerobic processes, combined aerobic-
anaerobic processes, and combined anaerobic-aerobic and UV/H2O2 processes.
0.00
100.00
200.00
300.00
400.00
500.00
600.00
700.00
0 10 20 30 40 50 60 70 80
TO
C r
emoved
(g)
HRT (h)
ABR Process Alone
Aerobic AS Process Alone
UV/H2O2 Process Alone
Combined Anaerobic-Aerobic Processes
Combined Aerobic-Anaerobic Processes
Combined Anaerobic-Aerobic and
UV/H2O2 Processes

159
Figure 4.47. Operation costs per kilogram of TOC removed for each process as a function of
TOC removal. (a) ABR process alone, aerobic AS process alone, combined anaerobic-aerobic
processes, combined aerobic-anaerobic processes, and combined anaerobic-aerobic and
UV/H2O2 processes; (b) UV/H2O2 process alone.
0.00
0.50
1.00
1.50
2.00
2.50
3.00
3.50
4.00
4.50
0.00% 20.00% 40.00% 60.00% 80.00% 100.00%
$/k
g T
OC
rem
oved
% TOC removal
ABR Process Alone
Aerobic AS Process Alone
Combined Anaerobic-Aerobic
Processes
Combined Aerobic-Anaerobic
Processes
Combined Anaerobic-Aerobic
and UV/H2O2 Processes
(a)
0.00
10.00
20.00
30.00
40.00
50.00
60.00
70.00
80.00
0.00% 10.00% 20.00% 30.00% 40.00% 50.00% 60.00%
$/k
g T
OC
rem
oved
% TOC removal
UV/H2O2 Process Alone
(b)
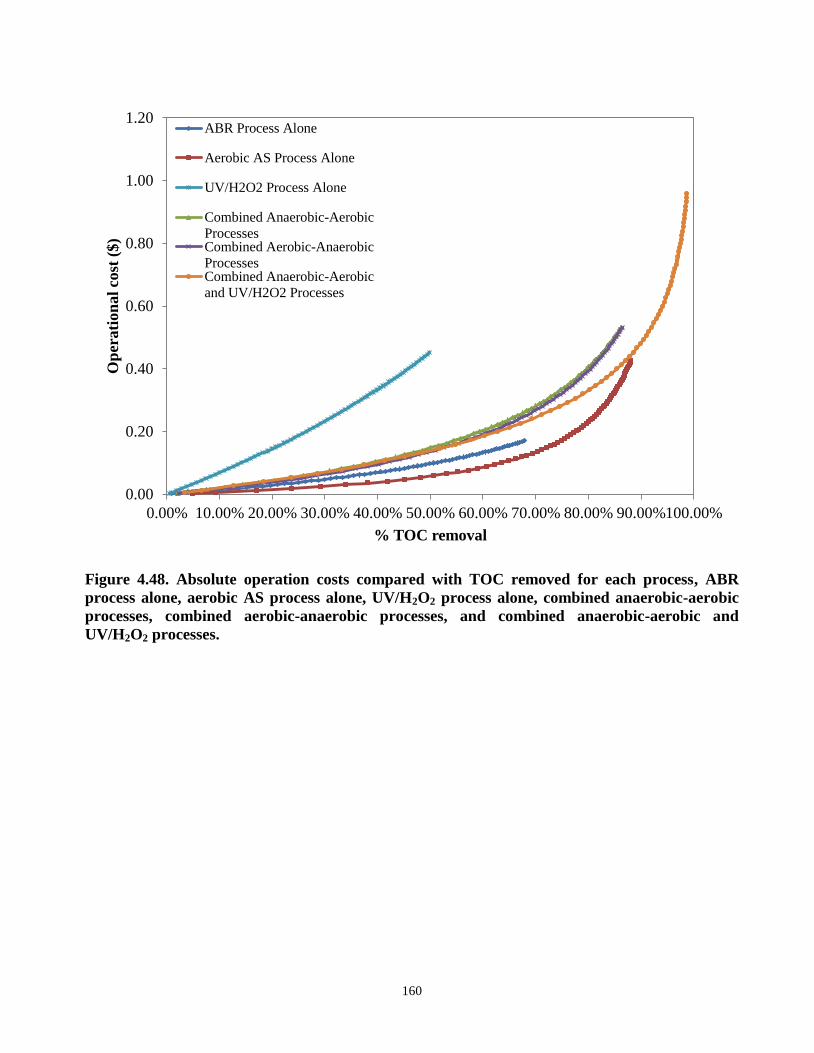
160
Figure 4.48. Absolute operation costs compared with TOC removed for each process, ABR
process alone, aerobic AS process alone, UV/H2O2 process alone, combined anaerobic-aerobic
processes, combined aerobic-anaerobic processes, and combined anaerobic-aerobic and
UV/H2O2 processes.
0.00
0.20
0.40
0.60
0.80
1.00
1.20
0.00% 10.00% 20.00% 30.00% 40.00% 50.00% 60.00% 70.00% 80.00% 90.00%100.00%
Op
erati
on
al
cost
($)
% TOC removal
ABR Process Alone
Aerobic AS Process Alone
UV/H2O2 Process Alone
Combined Anaerobic-Aerobic
ProcessesCombined Aerobic-Anaerobic
ProcessesCombined Anaerobic-Aerobic
and UV/H2O2 Processes

161
Figure 4.49. Operational costs per m3 of treated water compared with mineralization degree:
comparison between the (a) ABR process alone, aerobic AS process alone, combined anaerobic-
aerobic processes, combined aerobic-anaerobic processes, combined anaerobic-aerobic and
UV/H2O2 processes, and (b) UV/H2O2 process alone.
0.00
5.00
10.00
15.00
20.00
25.00
30.00
35.00
40.00
0.00% 20.00% 40.00% 60.00% 80.00% 100.00%
Op
erati
on
aal
cost
per
volu
me
($/m
3)
% TOC removal
ABR Process Alone
Aerobic AS Process Alone
Combined Anaerobic-Aerobic
ProcessesCombined Aerobic-Anaerobic
ProcessesCombined Anaerobic-Aerobic
and UV/H2O2 Processes
(a)
0.00
50.00
100.00
150.00
200.00
250.00
300.00
350.00
400.00
-10.00% 0.00% 10.00% 20.00% 30.00% 40.00% 50.00% 60.00%
Op
erati
on
aal
cost
per
volu
me
($/m
3)
% TOC removal
UV/H2O2 Process Alone
(b)

162
CHAPTER 5
CONCLUSIONS AND RECOMMENDATIONS
5.1. Conclusions
The following conclusions are drawn from this thesis:
Six different systems for the treatment of SSWW were evaluated in this study, including UV/H2O2
alone; aerobic AS alone; ABR alone; combined anaerobic-aerobic processes; combined aerobic-
anaerobic processes; and combined anaerobic-aerobic and UV/H2O2. Performance of those
systems was analyzed through the measurements of the removal efficiencies of TOC, TN, and
CBOD5.
The ABR process demonstrated good efficiency in treating SSWW with an influent concentration
of 1,008.85 mgTOC/L and 254.23 mgTN/L, a HRT of 7 days, and flow rate of 3.34 mL/min,
reaching removals of TOC, TN and CBOD5 of 89.47, 49.68 and 95.16%, respectively. It was also
observed that at a longer HRT, the removal efficiency was higher. Although anaerobic treatment
is efficient, complete stabilization of the organic matter was not possible by anaerobic treatment
alone as the effluent produced by anaerobic treatment contained solubilised organic matter, which
is more suited for treatment using aerobic processes or anaerobic–aerobic systems. For that
reason, later post-treatment using aerobic treatment was necessary to enhance the efficiency and
the biological removal of TN.
The aerobic AS process demonstrated better efficiency than that obtained with the ABR, reaching
removals of TOC, TN and CBOD5 of 94.53, 73.46 and 92.19%, respectively. In spite of the results
of previous studies (Cao, 2009; Cao and Mehrvar, 2011), a good removal of TN (73.46%) was
achieved, varying the flow rate and influent concentration of the SSWW. This may be attributed
to the well-maintained conditions in the systems, where DO concentrations were in the ranges of
0.2–1.2 mg/L and 0.4–3.2 mg/L for the ABR and the aerobic AS, respectively. Therefore, DO

163
concentrations above 1.0 mg/L permitted nitrification, whereas DO concentrations below 0.5
mg/L permitted denitrification.
Although both individual anaerobic and aerobic processes demonstrated a significant efficiency to
treat the SSWW, better results were found by combining anaerobic and aerobic processes, with
TOC removal of 96.36%, TN removal of 80.53% and CBOD5 removal of 99.38% from an influent
concentration of 1,008.85 mgTOC/L and 419.77 mgTN/L at the HRT of 6.24 days and a flow rate
of 3.75mL/min, using combined ABR first and then aerobic AS. The combined aerobic-anaerobic
system was also studied, resulting in high efficiency for TOC, TN, and CBOD5 removal rates, up
to 96.10% TOC, 76.44% TN, and 99.53% CBOD5 were removed. Both combined biological
processes achieved good results for treating SSWW, with TOC, TN and CBOD5 removal rates of
above 95, 75, and 99%, respectively. Nevertheless, it was determined that combined anaerobic-
aerobic processes have a considerable advantage compared to combined aerobic-anaerobic
processes when treating TN, with a difference of approximately 4.09% TN removal rate.
Therefore, combined anaerobic-aerobic processes were used for next experiments. Therefore, an
adequate combination of anaerobic and aerobic processes is essential for the successful removal of
nutrients from SSWW.
An experiment was conducted in the recycling mode, in which the SSWW treated in the aerobic
AS reactor was recycled into the ABR. It was found that recycling the flow did not significantly
decrease either TOC or TN concentrations. Only a minimum variation of 0.02 and 0.05% was
observed for TOC and TN removal rates, whereas the HRT of the recycling mode system doubled
that of the combined anaerobic-aerobic processes; thus, making the combined system with
recycling less efficient than without recirculating the flow.
The UV/H2O2 process was demonstrated to be an effective technology for SSWW post-treatment.
The results revealed a reasonable efficiency to treat a secondary effluent of SSWW. Up to 75.22%
TOC removal rate was obtained for an influent concentration of 64.88 mgTOC/L at the HRT of
180 min with H2O2 concentration of 900 mg/L. Nevertheless, there were no significant changes to
the TN removal rate using UV/H2O2 process alone. An optimum molar ratio dosage of 13.87
mgH2O2/mgTOCin was also found for the UV/H2O2 process. Therefore, a good alternative is to
combine biological treatment and AOPs.

164
The combined anaerobic-aerobic and UV/H2O2 processes proved to be able to enhance the
treatment ability of the TOC, TN and CBOD5 obtained by the other systems. Up to 99.98% TOC,
82.84% TN, and 99.69% CBOD5 removals were obtained for an influent concentration of
1,004.88 mgTOC/L and 200.03 mgTN/L at the HRT of 4.00 days and a flow rate of 5.90 mL/min.
These results confirm that an adequate combination of anaerobic and aerobic processes is essential
for nitrogen reduction, in order to obtain removals of more than 70% (82.84% of TN removed),
and they confirm that using AOPs as post-treatment guarantees the complete mineralization of the
organic matter and disinfection of SSWW.
A cost-effectiveness analysis (CEA) was used to determine the best alternative for SSWW
treatment. HRT was optimized, since HRT affects the final removal efficiency of organic
pollutants in wastewater and the operating and maintenance (O&M) costs of the system. The
combined anaerobic-aerobic and UV/H2O2 processes were more technically efficient than the
other processes, removing 15% more TOC during the same amount of operation time. UV/H2O2
alone is the less efficient technology with an optimum removal of 49.88% at a high cost of
$67.06/kg of TOC removed. If low or intermediate amounts of TOC are to be removed, combined
processes and individual processes are comparable in economic terms. In the combined processes,
the main costs are initially for pumps, reagents and air injection; only when the TOC removal is
higher than 60% do the electricity costs gradually increase. Finally, it was determined that the
optimum system was the combined anaerobic-aerobic and UV/H2O2 processes, with an optimal
TOC removal of 92.46% at an HRT of 41 h, at a cost of $1.25/kg of TOC removed and $11.60/m3
of treated SSWW. It should be note that this process reaches a TOC removal of 99% at a HRT of
76.5 h (3.19 days) with an estimated operational cost of $2.19/kg of TOC removed and $21.65/m3
of treated SSWW. Therefore, this confirms that the best alternative to treat SSWW is by an
adequate combination of biological treatment and AOPs.

165
5.2. Recommendations
The following recommendations are suggested for further research on combined biological
and AOPs processes:
It is suggested to collect the biogas produced in the compartments of the ABR in order to evaluate
the performances of acidogenesis and methanogenesis and a possible usage of this biogas as an
energy source for the system. Following studies should take into account the accumulation of
volatile fatty acids.
Further study should be focused on the characterization of the microorganisms present in the
activated sludge to determine their nitrifying and denitrifying ability.
Further work should conduct the analysis of different intermediates that may be formed during the
UV/H2O2 treatment.
Further research is suggested by using different H2O2 dosages in the combined anaerobic-aerobic
UV/H2O2 processes and other processes such as photo-Fenton to evaluate a possible optimization
in terms of HRT.
Further studies should use actual raw slaughterhouse wastewater in order to evaluate the
applicability of the systems examined in these studies to actual conditions, and determine a
possible scale up of laboratory scale systems to be adapted as onsite treatment for slaughterhouses
in Ontario.
Further research should also consider the examination of emerging contaminants present in
slaughterhouse wastewater, including pharmaceutical compounds used by veterinary physicians,
anti-inflammatories, cleaning products, endocrine disruptors, and possible hazardous compounds,
which are being discharged without proper treatment, particularly in the livestock farming.
Further work may also consider additional investigation of kinetic modeling, optimization of
processes, and modeling of the combined anaerobic-aerobic and UV/H2O2 processes.

166
APPENDICES
Appendix A. Determination of theoretical TOC and TN of the SSWW
As described in Section 3.2.1, the SSWW contains 1,950 mg/L of commercial meat extract
powder (Oxoid Lab Lemco L0029, Oxoid Ltd.), 200 mg/L of glycerol (C3H8O3), 360 mg/L of
ammonium chloride (NH4Cl), 50 mg/L sodium chloride (NaCl), 30 mg/L of potassium dihydrogen
orthophosphate (KH2PO4), 24 mg/L of calcium chloride (CaCl2), and 7.5 mg/L of magnesium
sulphate heptahydrate (MgSO4•7H2O). The carbon source of the SSWW comes from the 17 amino
acids present in the meat extract, described in Table A.1, and glycerol (C3H8O3), while the nitrogen
source comes from the same amino acids (Table A.1) and ammonium chloride (NH4Cl).
An example of the calculation can be described as follows, by taking Valine (C5H11NO2) to
obtain the % w of TOC/w of meat extract and the % w of TN/w of meat extract.
( )
( )
( )
( )
With the total %w of TOC/w of meat extract (31.51 mgC/100 mg meat extract) and %w of
TN/w of meat extract (10.86 mgN/100 mg meat extract) values obtained, theoretical TOC and TN
concentrations can be calculated as the sum of the TOC content of the meat extract (1,950 mg/L) and
the TOC content of the glycerol (C3H8O3) (200 mg/L), and the sum of the TN content of the meat

167
extract (1,950 mg/L) and the TN content of the ammonium chloride (NH4Cl) (360 mg/L),
respectively, as shown below:
( )
( )
( )
( )
Table A.1. Calculations of TOC and TN concentrations of the meat extract based on the
information provided by the manufacturer (Oxoid Ltd.).
Symbol Amino acid %w/w
Molar mass
(g/mol)
Carbon molar
mass (g/mol)
Nitrogen molar
mass (g/mol)
TOC
%w/w
TN
%w/w
Ala Alanine (C3H7NO2) 5.85 89.09 36.03 14.01 2.37 0.92
Arg Arginine (C6H14N4O2) 7.10 174.2 72.06 56.03 2.94 2.28
Asp Aspartic acid (C4H7NO4) 5.10 133.1 48.04 14.01 1.84 0.54
Cys Cysteine (C3H7NO2S) 0.68 121.16 36.03 14.01 0.20 0.08
Glu Glutamic acid (C5H9NO4) 10.71 147.13 60.05 14.01 4.37 1.02
Gly Glycine (C2H5NO2) 10.85 75.07 24.02 14.01 3.47 2.02
Ile Isoleucine (C6H13NO2) 3.17 131.17 72.06 14.01 1.74 0.34
Leu Leucine (C6H13NO2) 3.15 131.17 72.06 14.01 1.73 0.34
Lys Lysine (C6H14N2O2) 4.78 146.19 72.06 28.01 2.36 0.92
Met Methionine (C5H11NO2S) 2.61 149.21 60.05 14.01 1.05 0.25
Phe Phenylalanine (C9H11NO2) 2.34 165.19 108.10 14.01 1.53 0.20
Pro Proline (C5H9NO2) 7.79 115.13 60.05 14.01 4.06 0.95
Ser Serine (C3H7NO3) 1.87 105.09 36.03 14.01 0.64 0.25
Thr Threonine (C4H9NO3) 2.54 119.12 48.04 14.01 1.02 0.30
Trp Tryptophan (C11H12N2O2) 0.34 204.23 132.12 28.01 0.22 0.05
Tyr Tyrosine (C9H11NO3) 0.66 181.19 108.10 14.01 0.39 0.05
Val Valine (C5H11NO2) 3.06 117.15 60.05 14.01 1.57 0.37
Total 72.60 2304.59 1104.98 308.15 31.51 10.86

168
Appendix B. Determination of the Reynolds number
In fluid mechanics, the Reynolds number Re is a dimensionless number that gives a measure
of the ratio of inertial forces to viscous forces and consequently quantifies the relative importance of
these two types of forces for given flow conditions. For flow in a pipe or tube, experimental
observations show that for fully developed flow, laminar flow occurs when Re < 2,000, turbulent flow
occurs when Re > 4,000, and transient flow occurs when 2,000 < Re < 4,000. For flow in a pipe or
tube and in a rectangular duct, the Reynolds number is determined by Equation (3.8). An example of
the Reynolds number calculation is described as follows, the rest of calculations are portrayed in
Table B.1.
(3.8)
where,
Re = Reynolds number;
v = mean fluid velocity (m/s);
L = length that the flow is going through or around (diameter of the pipe or tube) (m);
V = volume of the sample (L);
μ = dynamic viscosity of the fluid (for water at 25°C, η = 8.98×10⁻⁴
kg/m.s);
ρ = density of the fluid (for water at 25°C, ρ = 1000 kg/m3);
Q = volumetric flow rate (m3/s); and
A = pipe cross-sectional area (m2).
(
)
(B.1)
where,
D0 = outer diameter (m);
D1 = inner diameter (m);
then,
( )
(B.1)

169
⁄
( )( ⁄ )( )
( ) ( )
Table B.1. Reynolds number for different flow rates in the ABR, AS, UV/H2O2, and their
combination.
Process Flow rate (mL/min) L (m) A (m2) Re
ABR 2.93 0.120 0.0150 0.44
3.34 0.120 0.0150 0.50
3.75 0.120 0.0150 0.56
4.50 0.120 0.0150 0.67
4.68 0.120 0.0150 0.69
7.50 0.120 0.0150 1.11
7.80 0.120 0.0150 1.16
11.70 0.120 0.0150 1.74
Aerobic AS 2.93 0.100 0.0100 0.54
3.34 0.100 0.0100 0.62
3.75 0.100 0.0100 0.70
4.50 0.100 0.0100 0.84
4.68 0.100 0.0100 0.87
7.50 0.100 0.0100 1.39
7.80 0.100 0.0100 1.45
11.70 0.100 0.0100 2.17
UV/H2O2 2.93 0.022 0.0024 0.50
3.34 0.022 0.0024 0.57
3.75 0.022 0.0024 0.64
4.50 0.022 0.0024 0.77
4.68 0.022 0.0024 0.80
7.50 0.022 0.0024 1.28
7.80 0.022 0.0024 1.34
11.70 0.022 0.0024 2.00
Combined anaerobic-aerobic processes 5.90 0.100 0.0100 1.10
6.75 0.100 0.0100 1.25
Combined anaerobic-aerobic and UV/H2O2 processes 5.90 0.022 0.0024 1.01
6.75 0.022 0.0024 1.16

170
Appendix C.Determination of TSS and VSS
TSS and VSS were determined by Equations (3.2) and (3.3) as explained in Section 3.5.3,
based on the sections 2540D and 2540E of the Standard Methods (APHA, 1998).
( )
(3.2)
( ) ( )
( )
(3.3)
where,
W1 = sum of the weights of the dried filter paper, dish and solids of the sample (mg);
W2 = weight of the dried filter paper (mg);
W3 = weight of the dried dish (mg);
W4 = sum of the weights of the solids of the sample and the dish after burning (mg); and
V = volume of the sample (L).
For example, at a HRT of 7 days and a flow rate of 3.34 mL/min, TSS and VSS of the sludge
values were calculated to observe the acclimatization of the microorganisms, as depicted in Table C.1.
Table C.1. Calculation of the concentration of TSS and VSS of sludge in compartment 4 of the
ABR process.
Item Sample Testing Result in Compartment 4
(1) Volume of the sample of sludge (mL) 2.0000
(2) Weight of the filter + container (g) 1.4432
(3) Weight of the dried filter + container + solids @105°C (g) 1.5046
(4) Weight of the dried filter + container + solids @550°C (g) 1.4707
(5) TSS (g) = (3) – (2) 0.0614
(6) VSS (g) = (5) – (4) + (2) 0.0339
(7) TSS (mg/L) = 1000000×(5) / (1) 30700
(8) VSS (mg/L) = 1000000×(6) / (1) 16950
Appendix D. Sample standard deviation and relative error analysis
Each experiment in the present work was replicated three times, and the reported results
represent the average value of the collected results. In Chapter 4, error bars depicted in the figures

171
represent the sample standard deviation (s), which was used to analyze the accuracy of an
experimental measurement for a finite set of experimental data. s was calculated as follows.
√
∑ ( ) (D.1)
where,
χi = observed values of the sample items (χ1, χ2, …, χn);
= mean value of the sample observations; and
N = sample size.
Relative error was used to express an accuracy of an acceptable value of the quantity being
measured. Relative error could be positive, negative or zero indicating that the measured value is
smaller than, greater than, or equal to the mean of a set of data. The lowest average absolute error was
used as criterion for the optimization of the total electricity costs and HRT. Relative error can be
obtained by Equation (D.2) as shown below.
(D.2)
where,
χ = accepted value; and
= mean of a finite set of data.
The non-linear least square function was used to determine the best-fit criterion, which means
two sets of data are the most close to each other as expressed in Equation (D.3).
∑ *.
/
.
/
+
(D.3)

172
Appendix E. Raw data
Table E.1. TSS and VSS values of the sludge in the ABR and aerobic AS.
1st Test 18-Oct-11 0
Aerobic Sludge
w1 1.4418 g weight of Container + Filter empty
w2 1.4645 g weight of Container + Filter + solids @105
w3 1.4477 g weight of Container + Filter + solids @550
V 10 mL
MLSS 0.00227 g/mL 2270 mg/L
MLVSS 0.00168 g/mL 1680 mg/L
Anaerobic Sludge
w1 1.4312 g weight of Container + Filter empty
w2 1.4736 g weight of Container + Filter + solids @105
w3 1.4469 g weight of Container + Filter + solids @550
V 10 mL
TSS 0.00424 g/mL 4240 mg/L
VSS 0.00267 g/mL 2670 mg/L
2nd Test 20-Oct-11 2
Anaerobic Sludge
w1 1.4452 g weight of Container + Filter empty
w2 1.5108 g weight of Container + Filter + solids @105
w3 1.4711 g weight of Container + Filter + solids @550
V 5 mL
TSS 0.01312 g/mL 13120 mg/L
VSS 0.00794 g/mL 7940 mg/L
Chamber 1
w1 1.4433 g weight of Container + Filter empty
w2 1.5175 g weight of Container + Filter + solids @105
w3 1.4726 g weight of Container + Filter + solids @550
V 5 mL
TSS 0.01484 g/mL 14840 mg/L
VSS 0.00898 g/mL 8980 mg/L
Chamber 2

173
w1 1.4352 g weight of Container + Filter empty
w2 1.5114 g weight of Container + Filter + solids @105
w3 1.4663 g weight of Container + Filter + solids @550
V 5 mL
TSS 0.01524 g/mL 15240 mg/L
VSS 0.00902 g/mL 9020 mg/L
Chamber 3
w1 1.449 g weight of Container + Filter empty
w2 1.5169 g weight of Container + Filter + solids @105
w3 1.4716 g weight of Container + Filter + solids @550
V 5 mL
TSS 0.01358 g/mL 13580 mg/L
VSS 0.00906 g/mL 9060 mg/L
Chamber 4
w1 1.429 g weight of Container + Filter empty
w2 1.5087 g weight of Container + Filter + solids @105
w3 1.4647 g weight of Container + Filter + solids @550
V 5 mL
TSS 0.01594 g/mL 15940 mg/L
VSS 0.0088 g/mL 8800 mg/L
Chamber 5
w1 1.4368 g weight of Container + Filter empty
w2 1.5175 g weight of Container + Filter + solids @105
w3 1.4752 g weight of Container + Filter + solids @550
V 5 mL
TSS 0.01614 g/mL 16140 mg/L
VSS 0.00846 g/mL 8460 mg/L
3rd Test 22-Oct-11 4
Chamber 1
w1 1.4378 g weight of Container + Filter empty
w2 1.5779 g weight of Container + Filter + solids @105
w3 1.5017 g weight of Container + Filter + solids @550
V 5 mL
TSS 0.02802 g/mL 28020 mg/L
VSS 0.01524 g/mL 15240 mg/L

174
Chamber 2
w1 1.4332 g weight of Container + Filter empty
w2 1.5747 g weight of Container + Filter + solids @105
w3 1.4999 g weight of Container + Filter + solids @550
V 5 mL
TSS 0.0283 g/mL 28300 mg/L
VSS 0.01496 g/mL 14960 mg/L
Chamber 3
w1 1.4339 g weight of Container + Filter empty
w2 1.5531 g weight of Container + Filter + solids @105
w3 1.4946 g weight of Container + Filter + solids @550
V 5 mL
TSS 0.02384 g/mL 23840 mg/L
VSS 0.0117 g/mL 11700 mg/L
Chamber 4
w1 1.4434 g weight of Container + Filter empty
w2 1.5824 g weight of Container + Filter + solids @105
w3 1.5101 g weight of Container + Filter + solids @550
V 5 mL
TSS 0.0278 g/mL 27800 mg/L
VSS 0.01446 g/mL 14460 mg/L
Chamber 5
w1 1.431 g weight of Container + Filter empty
w2 1.5793 g weight of Container + Filter + solids @105
w3 1.5072 g weight of Container + Filter + solids @550
V 5 mL
TSS 0.02966 g/mL 29660 mg/L
VSS 0.01442 g/mL 14420 mg/L
4th Test 27-Oct-11 9
Chamber 1
w1 1.4395 g weight of Container + Filter empty
w2 1.5027 g weight of Container + Filter + solids @105
w3 1.4685 g weight of Container + Filter + solids @550
V 2 mL

175
TSS 0.0316 g/mL 31600 mg/L
VSS 0.0171 g/mL 17100 mg/L
Chamber 2
w1 1.4326 g weight of Container + Filter empty
w2 1.4841 g weight of Container + Filter + solids @105
w3 1.4556 g weight of Container + Filter + solids @550
V 2 mL
TSS 0.02575 g/mL 25750 mg/L
VSS 0.01425 g/mL 14250 mg/L
Chamber 3
w1 1.4398 g weight of Container + Filter empty
w2 1.5151 g weight of Container + Filter + solids @105
w3 1.4763 g weight of Container + Filter + solids @550
V 2 mL
TSS 0.03765 g/mL 37650 mg/L
VSS 0.0194 g/mL 19400 mg/L
Chamber 4
w1 1.4432 g weight of Container + Filter empty
w2 1.5046 g weight of Container + Filter + solids @105
w3 1.4707 g weight of Container + Filter + solids @550
V 2 mL
TSS 0.0307 g/mL 30700 mg/L
VSS 0.01695 g/mL 16950 mg/L
Chamber 5
w1 1.4332 g weight of Container + Filter empty
w2 1.5073 g weight of Container + Filter + solids @105
w3 1.4698 g weight of Container + Filter + solids @550
V 2 mL
TSS 0.03705 g/mL 37050 mg/L
VSS 0.01875 g/mL 18750 mg/L
5th Test 31-Oct-11 13
Chamber 1
w1 1.4484 g weight of Container + Filter empty
w2 1.4937 g weight of Container + Filter + solids @105
w3 1.4679 g weight of Container + Filter + solids @550

176
V 2 mL
TSS 0.02265 g/mL 22650 mg/L
VSS 0.0129 g/mL 12900 mg/L
Chamber 2
w1 1.4349 g weight of Container + Filter empty
w2 1.4838 g weight of Container + Filter + solids @105
w3 1.4563 g weight of Container + Filter + solids @550
V 2 mL
TSS 0.02445 g/mL 24450 mg/L
VSS 0.01375 g/mL 13750 mg/L
Chamber 3
w1 1.4361 g weight of Container + Filter empty
w2 1.4993 g weight of Container + Filter + solids @105
w3 1.4663 g weight of Container + Filter + solids @550
V 2 mL
TSS 0.0316 g/mL 31600 mg/L
VSS 0.0165 g/mL 16500 mg/L
Chamber 4
w1 1.4458 g weight of Container + Filter empty
w2 1.4845 g weight of Container + Filter + solids @105
w3 1.4609 g weight of Container + Filter + solids @550
V 2 mL
TSS 0.01935 g/mL 19350 mg/L
VSS 0.0118 g/mL 11800 mg/L
Chamber 5
w1 1.4373 g weight of Container + Filter empty
w2 1.4828 g weight of Container + Filter + solids @105
w3 1.4592 g weight of Container + Filter + solids @550
V 2 mL
TSS 0.02275 g/mL 22750 mg/L
VSS 0.0118 g/mL 11800 mg/L
6th Test 02-Nov-11 15
Chamber 1
w1 1.4422 g weight of Container + Filter empty

177
w2 1.4700 g weight of Container + Filter + solids @105
w3 1.4521 g weight of Container + Filter + solids @550
V 2 mL
TSS 0.0139 g/mL 13900 mg/L
VSS 0.00895 g/mL 8950 mg/L
Chamber 2
w1 1.4378 g weight of Container + Filter empty
w2 1.4893 g weight of Container + Filter + solids @105
w3 1.4582 g weight of Container + Filter + solids @550
V 2 mL
TSS 0.02575 g/mL 25750 mg/L
VSS 0.01555 g/mL 15550 mg/L
Chamber 3
w1 1.4342 g weight of Container + Filter empty
w2 1.4707 g weight of Container + Filter + solids @105
w3 1.4483 g weight of Container + Filter + solids @550
V 2 mL
TSS 0.01825 g/mL 18250 mg/L
VSS 0.0112 g/mL 11200 mg/L
Chamber 4
w1 1.4369 g weight of Container + Filter empty
w2 1.4721 g weight of Container + Filter + solids @105
w3 1.4501 g weight of Container + Filter + solids @550
V 2 mL
TSS 0.0176 g/mL 17600 mg/L
VSS 0.011 g/mL 11000 mg/L
Chamber 5
w1 1.4323 g weight of Container + Filter empty
w2 1.4796 g weight of Container + Filter + solids @105
w3 1.4534 g weight of Container + Filter + solids @550
V 2 mL
TSS 0.02365 g/mL 23650 mg/L
VSS 0.0131 g/mL 13100 mg/L
7th Test 03-Nov-11 16

178
Chamber 1
w1 1.451 g weight of Container + Filter empty
w2 1.4709 g weight of Container + Filter + solids @105
w3 1.4569 g weight of Container + Filter + solids @550
V 2 mL
TSS 0.00995 g/mL 9950 mg/L
VSS 0.007 g/mL 7000 mg/L
Chamber 2
w1 1.4338 g weight of Container + Filter empty
w2 1.4564 g weight of Container + Filter + solids @105
w3 1.4415 g weight of Container + Filter + solids @550
V 2 mL
TSS 0.0113 g/mL 11300 mg/L
VSS 0.00745 g/mL 7450 mg/L
Chamber 3
w1 1.4347 g weight of Container + Filter empty
w2 1.4743 g weight of Container + Filter + solids @105
w3 1.4501 g weight of Container + Filter + solids @550
V 2 mL
TSS 0.0198 g/mL 19800 mg/L
VSS 0.0121 g/mL 12100 mg/L
Chamber 4
w1 1.4325 g weight of Container + Filter empty
w2 1.4658 g weight of Container + Filter + solids @105
w3 1.4452 g weight of Container + Filter + solids @550
V 2 mL
TSS 0.01665 g/mL 16650 mg/L
VSS 0.0103 g/mL 10300 mg/L
Chamber 5
w1 1.4335 g weight of Container + Filter empty
w2 1.4838 g weight of Container + Filter + solids @105
w3 1.455 g weight of Container + Filter + solids @550
V 2 mL
TSS 0.02515 g/mL 25150 mg/L
VSS 0.0144 g/mL 14400 mg/L

179
8th Test 05-Nov-11 18
Chamber 1
w1 1.4327 g weight of Container + Filter empty
w2 1.4692 g weight of Container + Filter + solids @105
w3 1.445 g weight of Container + Filter + solids @550
V 3 mL
TSS 0.0122 g/mL 12167 mg/L
VSS 0.0081 g/mL 8067 mg/L
Chamber 2
w1 1.448 g weight of Container + Filter empty
w2 1.5216 g weight of Container + Filter + solids @105
w3 1.4762 g weight of Container + Filter + solids @550
V 5 mL
TSS 0.01472 g/mL 14720 mg/L
VSS 0.00908 g/mL 9080 mg/L
Chamber 3
w1 1.4421 g weight of Container + Filter empty
w2 1.4926 g weight of Container + Filter + solids @105
w3 1.4614 g weight of Container + Filter + solids @550
V 2 mL
TSS 0.02525 g/mL 25250 mg/L
VSS 0.0156 g/mL 15600 mg/L
Chamber 4
w1 1.4348 g weight of Container + Filter empty
w2 1.4778 g weight of Container + Filter + solids @105
w3 1.4506 g weight of Container + Filter + solids @550
V 3 mL
TSS 0.0143 g/mL 14333 mg/L
VSS 0.0091 g/mL 9067 mg/L
Chamber 5
w1 1.4403 g weight of Container + Filter empty
w2 1.4885 g weight of Container + Filter + solids @105
w3 1.4601 g weight of Container + Filter + solids @550
V 2 mL
TSS 0.0241 g/mL 24100 mg/L
VSS 0.0142 g/mL 14200 mg/L

180
Chamber 4
w1 1.4432 g weight of Container + Filter empty
w2 1.5046 g weight of Container + Filter + solids @105
w3 1.4707 g weight of Container + Filter + solids @550
V 2 mL
TSS 0.0307 g/mL 30700 mg/L
VSS 0.01695 g/mL 16950 mg/L
9th Test 08-Nov-11 21
Chamber 1
w1 1.4316 g weight of Container + Filter empty
w2 1.4767 g weight of Container + Filter + solids @105
w3 1.447 g weight of Container + Filter + solids @550
V 3 mL
TSS 0.015033333 g/mL 15033 mg/L
VSS 0.0099 g/mL 9900 mg/L
Chamber 2
w1 1.4309 g weight of Container + Filter empty
w2 1.5185 g weight of Container + Filter + solids @105
w3 1.4648 g weight of Container + Filter + solids @550
V 5 mL
TSS 0.01752 g/mL 17520 mg/L
VSS 0.01074 g/mL 10740 mg/L
Chamber 3
w1 1.4438 g weight of Container + Filter empty
w2 1.4916 g weight of Container + Filter + solids @105
w3 1.4617 g weight of Container + Filter + solids @550
V 2 mL
TSS 0.0239 g/mL 23900 mg/L
VSS 0.01495 g/mL 14950 mg/L

181
Chamber 4
w1 1.4377 g weight of Container + Filter empty
w2 1.5114 g weight of Container + Filter + solids @105
w3 1.4659 g weight of Container + Filter + solids @550
V 4 mL
TSS 0.018425 g/mL 18425 mg/L
VSS 0.011375 g/mL 11375 mg/L
Chamber 5
w1 1.4337 g weight of Container + Filter empty
w2 1.5025 g weight of Container + Filter + solids @105
w3 1.462 g weight of Container + Filter + solids @550
V 4 mL
TSS 0.0172 g/mL 17200 mg/L
VSS 0.010125 g/mL 10125 mg/L
10th Test 09-Nov-11 22
Chamber 1
w1 1.4394 g weight of Container + Filter empty
w2 1.4725 g weight of Container + Filter + solids @105
w3 1.4498 g weight of Container + Filter + solids @550
V 2 mL
TSS 0.01655 g/mL 16550 mg/L
VSS 0.01135 g/mL 11350 mg/L
Chamber 2
w1 1.4302 g weight of Container + Filter empty
w2 1.4666 g weight of Container + Filter + solids @105
w3 1.4439 g weight of Container + Filter + solids @550
V 2 mL
TSS 0.0182 g/mL 18200 mg/L
VSS 0.01135 g/mL 11350 mg/L
Chamber 3
w1 1.4427 g weight of Container + Filter empty
w2 1.4797 g weight of Container + Filter + solids @105
w3 1.4559 g weight of Container + Filter + solids @550
V 2 mL
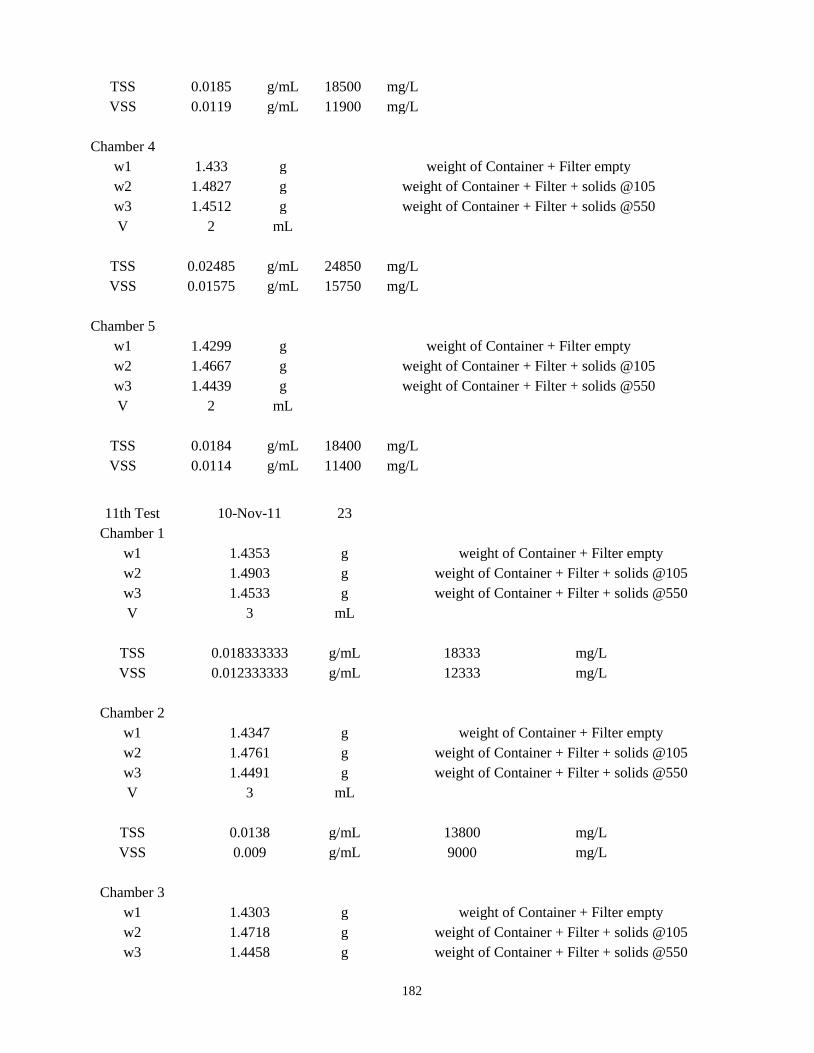
182
TSS 0.0185 g/mL 18500 mg/L
VSS 0.0119 g/mL 11900 mg/L
Chamber 4
w1 1.433 g weight of Container + Filter empty
w2 1.4827 g weight of Container + Filter + solids @105
w3 1.4512 g weight of Container + Filter + solids @550
V 2 mL
TSS 0.02485 g/mL 24850 mg/L
VSS 0.01575 g/mL 15750 mg/L
Chamber 5
w1 1.4299 g weight of Container + Filter empty
w2 1.4667 g weight of Container + Filter + solids @105
w3 1.4439 g weight of Container + Filter + solids @550
V 2 mL
TSS 0.0184 g/mL 18400 mg/L
VSS 0.0114 g/mL 11400 mg/L
11th Test 10-Nov-11 23
Chamber 1
w1 1.4353 g weight of Container + Filter empty
w2 1.4903 g weight of Container + Filter + solids @105
w3 1.4533 g weight of Container + Filter + solids @550
V 3 mL
TSS 0.018333333 g/mL 18333 mg/L
VSS 0.012333333 g/mL 12333 mg/L
Chamber 2
w1 1.4347 g weight of Container + Filter empty
w2 1.4761 g weight of Container + Filter + solids @105
w3 1.4491 g weight of Container + Filter + solids @550
V 3 mL
TSS 0.0138 g/mL 13800 mg/L
VSS 0.009 g/mL 9000 mg/L
Chamber 3
w1 1.4303 g weight of Container + Filter empty
w2 1.4718 g weight of Container + Filter + solids @105
w3 1.4458 g weight of Container + Filter + solids @550
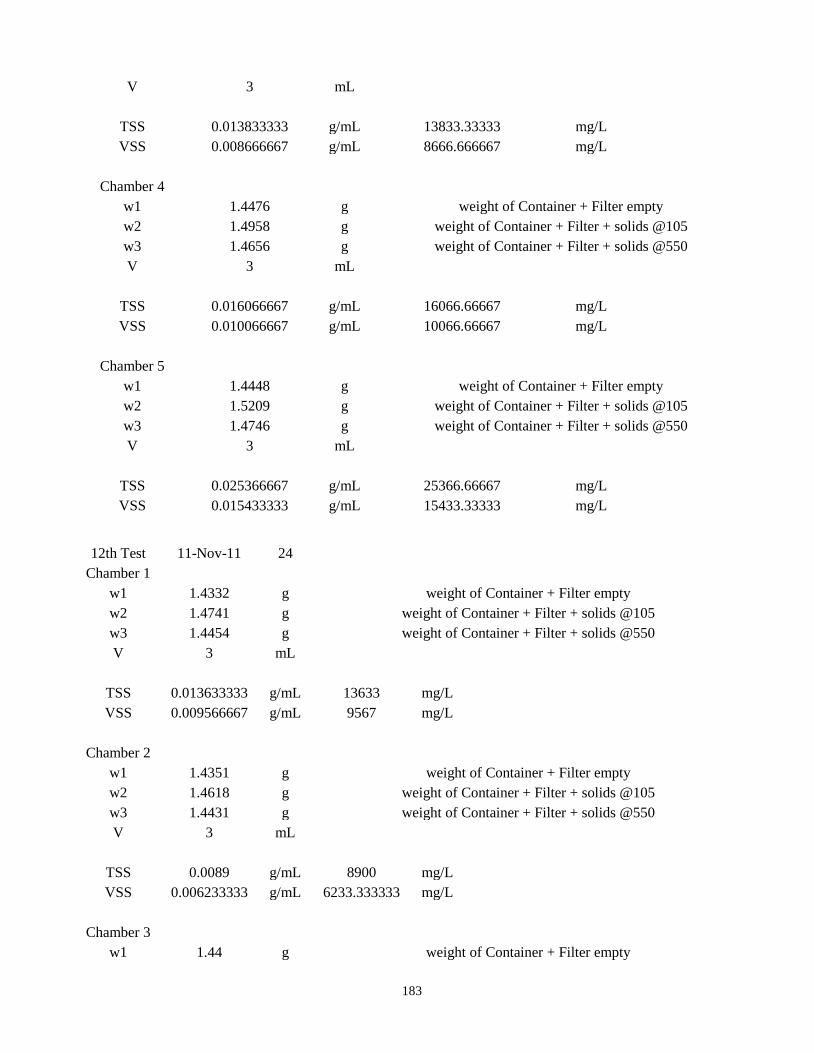
183
V 3 mL
TSS 0.013833333 g/mL 13833.33333 mg/L
VSS 0.008666667 g/mL 8666.666667 mg/L
Chamber 4
w1 1.4476 g weight of Container + Filter empty
w2 1.4958 g weight of Container + Filter + solids @105
w3 1.4656 g weight of Container + Filter + solids @550
V 3 mL
TSS 0.016066667 g/mL 16066.66667 mg/L
VSS 0.010066667 g/mL 10066.66667 mg/L
Chamber 5
w1 1.4448 g weight of Container + Filter empty
w2 1.5209 g weight of Container + Filter + solids @105
w3 1.4746 g weight of Container + Filter + solids @550
V 3 mL
TSS 0.025366667 g/mL 25366.66667 mg/L
VSS 0.015433333 g/mL 15433.33333 mg/L
12th Test 11-Nov-11 24
Chamber 1
w1 1.4332 g weight of Container + Filter empty
w2 1.4741 g weight of Container + Filter + solids @105
w3 1.4454 g weight of Container + Filter + solids @550
V 3 mL
TSS 0.013633333 g/mL 13633 mg/L
VSS 0.009566667 g/mL 9567 mg/L
Chamber 2
w1 1.4351 g weight of Container + Filter empty
w2 1.4618 g weight of Container + Filter + solids @105
w3 1.4431 g weight of Container + Filter + solids @550
V 3 mL
TSS 0.0089 g/mL 8900 mg/L
VSS 0.006233333 g/mL 6233.333333 mg/L
Chamber 3
w1 1.44 g weight of Container + Filter empty

184
w2 1.4645 g weight of Container + Filter + solids @105
w3 1.4478 g weight of Container + Filter + solids @550
V 3 mL
TSS 0.008166667 g/mL 8166.666667 mg/L
VSS 0.005566667 g/mL 5566.666667 mg/L
Chamber 4
w1 1.4368 g weight of Container + Filter empty
w2 1.4642 g weight of Container + Filter + solids @105
w3 1.4461 g weight of Container + Filter + solids @550
V 3 mL
TSS 0.009133333 g/mL 9133.333333 mg/L
VSS 0.006033333 g/mL 6033.333333 mg/L
Chamber 5
w1 1.445 g weight of Container + Filter empty
w2 1.4908 g weight of Container + Filter + solids @105
w3 1.462 g weight of Container + Filter + solids @550
V 3 mL
TSS 0.015266667 g/mL 15266.66667 mg/L
VSS 0.0096 g/mL 9600 mg/L
13th Test 17-Nov-11 30
Chamber 1
w1 1.4307 g weight of Container + Filter empty
w2 1.4868 g weight of Container + Filter + solids @105
w3 1.4465 g weight of Container + Filter + solids @550
V 5 mL
TSS 0.01122 g/mL 11220 mg/L
VSS 0.00806 g/mL 8060 mg/L
Chamber 2
w1 1.4368 g weight of Container + Filter empty
w2 1.4926 g weight of Container + Filter + solids @105
w3 1.4557 g weight of Container + Filter + solids @550
V 5 mL
TSS 0.01116 g/mL 11160 mg/L
VSS 0.00738 g/mL 7380 mg/L

185
Chamber 3
w1 1.4371 g weight of Container + Filter empty
w2 1.4919 g weight of Container + Filter + solids @105
w3 1.4569 g weight of Container + Filter + solids @550
V 5 mL
TSS 0.01096 g/mL 10960 mg/L
VSS 0.007 g/mL 7000 mg/L
Chamber 4
w1 1.4409 g weight of Container + Filter empty
w2 1.5004 g weight of Container + Filter + solids @105
w3 1.4617 g weight of Container + Filter + solids @550
V 5 mL
TSS 0.0119 g/mL 11900 mg/L
VSS 0.00774 g/mL 7740 mg/L
Chamber 5
w1 1.4318 g weight of Container + Filter empty
w2 1.4673 g weight of Container + Filter + solids @105
w3 1.4438 g weight of Container + Filter + solids @550
V 2 mL
TSS 0.01775 g/mL 17750 mg/L
VSS 0.01175 g/mL 11750 mg/L
14th Test 24-Nov-11 37
Chamber 1
w1 2.1842 g weight of Container + Filter empty
w2 2.3144 g weight of Container + Filter + solids @105
w3 2.2198 g weight of Container + Filter + solids @550
V 10 mL
TSS 0.01302 g/mL 13020 mg/L
VSS 0.00946 g/mL 9460 mg/L
Chamber 2
w1 2.1656 g weight of Container + Filter empty
w2 2.325 g weight of Container + Filter + solids @105
w3 2.2385 g weight of Container + Filter + solids @550
V 10 mL
TSS 0.01594 g/mL 15940 mg/L

186
VSS 0.00865 g/mL 8650 mg/L
Chamber 3
w1 2.187 g weight of Container + Filter empty
w2 2.301 g weight of Container + Filter + solids @105
w3 2.2022 g weight of Container + Filter + solids @550
V 10 mL
TSS 0.0114 g/mL 11400 mg/L
VSS 0.0099 g/mL 9880 mg/L
Chamber 4
w1 2.1789 g weight of Container + Filter empty
w2 2.3024 g weight of Container + Filter + solids @105
w3 2.2105 g weight of Container + Filter + solids @550
V 10 mL
TSS 0.0124 g/mL 12350 mg/L
VSS 0.0092 g/mL 9190 mg/L
Chamber 5
w1 1.441 g weight of Container + Filter empty
w2 1.5004 g weight of Container + Filter + solids @105
w3 1.4652 g weight of Container + Filter + solids @550
V 3 mL
TSS 0.0198 g/mL 19800 mg/L
VSS 0.011733333 g/mL 11733.33333 mg/L
15th Test 29-Nov-11 42
Chamber 1
w1 2.1584 g weight of Container + Filter empty
w2 2.2914 g weight of Container + Filter + solids @105
w3 2.1925 g weight of Container + Filter + solids @550
V 10 mL
TSS 0.0133 g/mL 13300 mg/L
VSS 0.0099 g/mL 9890 mg/L
Chamber 2
w1 2.1992 g weight of Container + Filter empty
w2 2.3658 g weight of Container + Filter + solids @105
w3 2.2556 g weight of Container + Filter + solids @550
V 10 mL

187
TSS 0.0167 g/mL 16660 mg/L
VSS 0.0110 g/mL 11020 mg/L
Chamber 3
w1 2.194 g weight of Container + Filter empty
w2 2.4528 g weight of Container + Filter + solids @105
w3 2.2922 g weight of Container + Filter + solids @550
V 12 mL
TSS 0.0216 g/mL 21566.66667 mg/L
VSS 0.0134 g/mL 13383.33333 mg/L
Chamber 4
w1 2.1933 g weight of Container + Filter empty
w2 2.3313 g weight of Container + Filter + solids @105
w3 2.2258 g weight of Container + Filter + solids @550
V 12 mL
TSS 0.0115 g/mL 11500 mg/L
VSS 0.0088 g/mL 8791.666667 mg/L
Chamber 5
w1 2.1974 g weight of Container + Filter empty
w2 2.259 g weight of Container + Filter + solids @105
w3 2.2212 g weight of Container + Filter + solids @550
V 3 mL
TSS 0.0205 g/mL 20533.33333 mg/L
VSS 0.0126 g/mL 12600 mg/L
16th Test 02-Dec-11 45
Chamber 1
w1 2.179 g weight of Container + Filter empty
w2 2.2851 g weight of Container + Filter + solids @105
w3 2.2065 g weight of Container + Filter + solids @550
V 6 mL
TSS 0.0177 g/mL 17683 mg/L
VSS 0.0131 g/mL 13100 mg/L
Chamber 2
w1 2.1844 g weight of Container + Filter empty
w2 2.3081 g weight of Container + Filter + solids @105
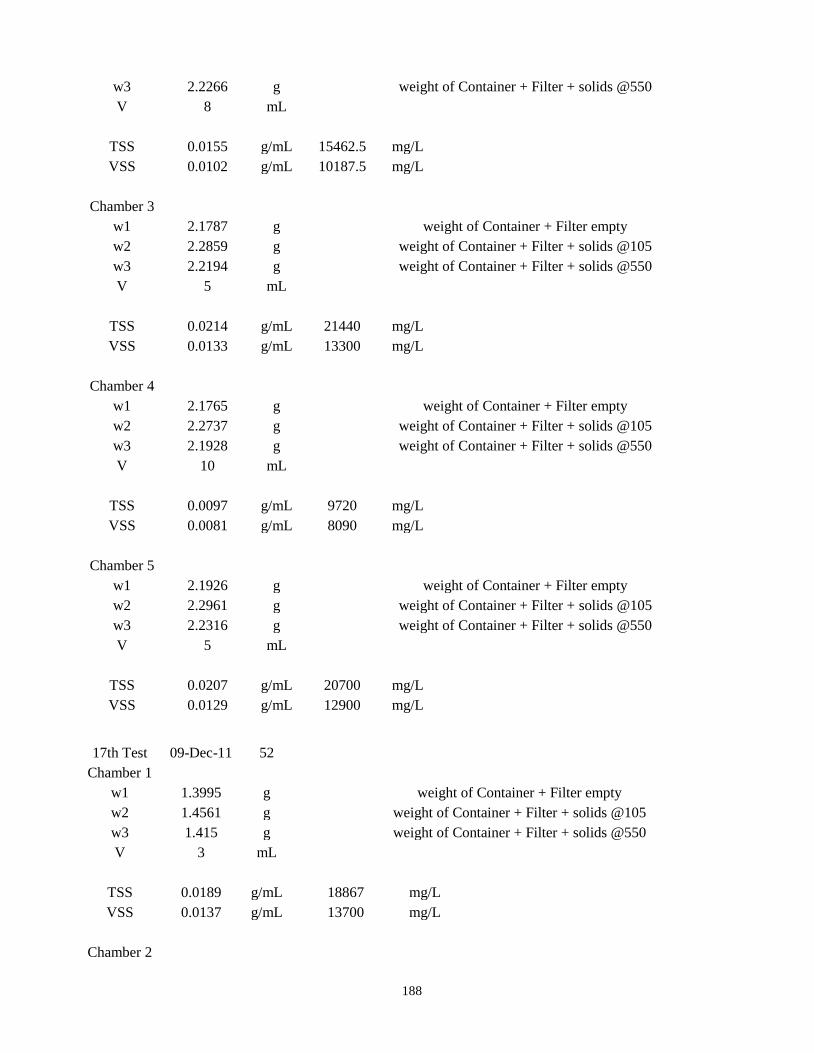
188
w3 2.2266 g weight of Container + Filter + solids @550
V 8 mL
TSS 0.0155 g/mL 15462.5 mg/L
VSS 0.0102 g/mL 10187.5 mg/L
Chamber 3
w1 2.1787 g weight of Container + Filter empty
w2 2.2859 g weight of Container + Filter + solids @105
w3 2.2194 g weight of Container + Filter + solids @550
V 5 mL
TSS 0.0214 g/mL 21440 mg/L
VSS 0.0133 g/mL 13300 mg/L
Chamber 4
w1 2.1765 g weight of Container + Filter empty
w2 2.2737 g weight of Container + Filter + solids @105
w3 2.1928 g weight of Container + Filter + solids @550
V 10 mL
TSS 0.0097 g/mL 9720 mg/L
VSS 0.0081 g/mL 8090 mg/L
Chamber 5
w1 2.1926 g weight of Container + Filter empty
w2 2.2961 g weight of Container + Filter + solids @105
w3 2.2316 g weight of Container + Filter + solids @550
V 5 mL
TSS 0.0207 g/mL 20700 mg/L
VSS 0.0129 g/mL 12900 mg/L
17th Test 09-Dec-11 52
Chamber 1
w1 1.3995 g weight of Container + Filter empty
w2 1.4561 g weight of Container + Filter + solids @105
w3 1.415 g weight of Container + Filter + solids @550
V 3 mL
TSS 0.0189 g/mL 18867 mg/L
VSS 0.0137 g/mL 13700 mg/L
Chamber 2

189
w1 1.3858 g weight of Container + Filter empty
w2 1.4493 g weight of Container + Filter + solids @105
w3 1.4081 g weight of Container + Filter + solids @550
V 4 mL
TSS 0.0159 g/mL 15875 mg/L
VSS 0.0103 g/mL 10300 mg/L
Chamber 3
w1 1.383 g weight of Container + Filter empty
w2 1.4181 g weight of Container + Filter + solids @105
w3 1.3935 g weight of Container + Filter + solids @550
V 2 mL
TSS 0.0176 g/mL 17550 mg/L
VSS 0.0123 g/mL 12300 mg/L
Chamber 4
w1 1.3906 g weight of Container + Filter empty
w2 1.4103 g weight of Container + Filter + solids @105
w3 1.3964 g weight of Container + Filter + solids @550
V 2 mL
TSS 0.0099 g/mL 9850 mg/L
VSS 0.0070 g/mL 6950 mg/L
Chamber 5
w1 1.3914 g weight of Container + Filter empty
w2 1.4447 g weight of Container + Filter + solids @105
w3 1.411 g weight of Container + Filter + solids @550
V 3 mL
TSS 0.0178 g/mL 17766.66667 mg/L
VSS 0.0112 g/mL 11233.33333 mg/L
18th Test 17-Dec-11 60
Chamber 1
w1 1.3658 g weight of Container + Filter empty
w2 1.4459 g weight of Container + Filter + solids @105
w3 1.3926 g weight of Container + Filter + solids @550
V 4 mL
TSS 0.0200 g/mL 20025 mg/L
VSS 0.0133 g/mL 13325 mg/L
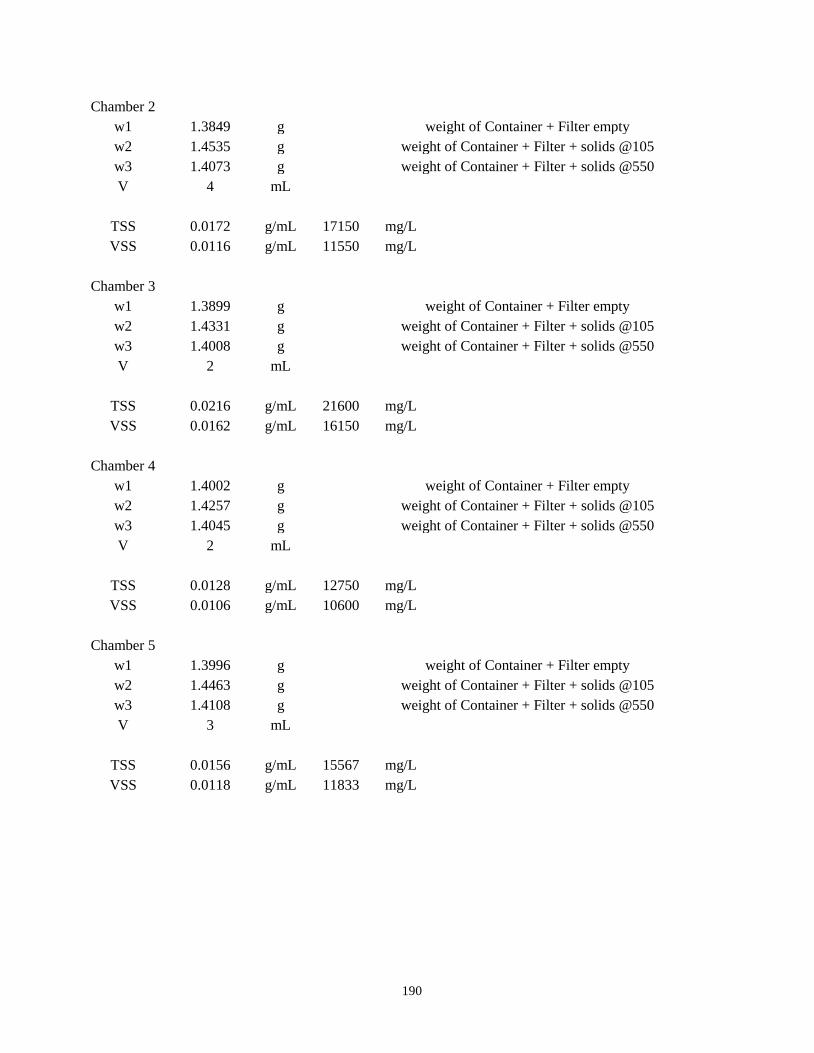
190
Chamber 2
w1 1.3849 g weight of Container + Filter empty
w2 1.4535 g weight of Container + Filter + solids @105
w3 1.4073 g weight of Container + Filter + solids @550
V 4 mL
TSS 0.0172 g/mL 17150 mg/L
VSS 0.0116 g/mL 11550 mg/L
Chamber 3
w1 1.3899 g weight of Container + Filter empty
w2 1.4331 g weight of Container + Filter + solids @105
w3 1.4008 g weight of Container + Filter + solids @550
V 2 mL
TSS 0.0216 g/mL 21600 mg/L
VSS 0.0162 g/mL 16150 mg/L
Chamber 4
w1 1.4002 g weight of Container + Filter empty
w2 1.4257 g weight of Container + Filter + solids @105
w3 1.4045 g weight of Container + Filter + solids @550
V 2 mL
TSS 0.0128 g/mL 12750 mg/L
VSS 0.0106 g/mL 10600 mg/L
Chamber 5
w1 1.3996 g weight of Container + Filter empty
w2 1.4463 g weight of Container + Filter + solids @105
w3 1.4108 g weight of Container + Filter + solids @550
V 3 mL
TSS 0.0156 g/mL 15567 mg/L
VSS 0.0118 g/mL 11833 mg/L

191
Table E.2. TSS and VSS values of the sludge in the ABR.
TSS 0 1 2 4 9 13 15 16 18 21 22 23 24 30 37 42 45 52 60
ABR Chamber 1 4240 13120 14840 28020 31600 22650 13900 9950 12167 15033 16550 18333 13633 11220 13020 13300 17683 18867 20025
ABR Chamber 2 4240 13120 15240 28300 25750 24450 25750 11300 14720 17520 18200 13800 8900 11160 15940 16660 15463 15875 17150
ABR Chamber 3 4240 13120 13580 23840 37650 31600 18250 19800 25250 23900 18500 13833 8167 10960 11400 21567 21440 17550 21600
ABR Chamber 4 4240 13120 15940 27800 30700 19350 17600 16650 14333 18425 24850 16067 9133 11900 12350 11500 9720 9850 12750
ABR Chamber 5 4240 13120 16140 29660 37050 22750 23650 25150 24100 17200 18400 25367 15267 17750 19800 20533 20700 17767 15567
VSS 0 1 2 4 9 13 15 16 18 21 22 23 24 30 37 42 45 52 60
ABR Chamber 1 2670 7940 8980 15240 14250 12900 8950 7000 8067 9900 11350 12333 9567 8060 9460 9890 13100 13700 13325
ABR Chamber 2 2670 7940 9020 14960 19400 13750 15550 7450 9080 10740 11350 9000 6233 7380 8650 11020 10188 10300 11550
ABR Chamber 3 2670 7940 9060 11700 16950 16500 11200 12100 15600 14950 11900 8667 5567 7000 9880 13383 13300 12300 16150
ABR Chamber 4 2670 7940 8800 14460 16950 11800 11000 10300 9067 11375 15750 10067 6033 7740 9190 8792 8090 6950 10600
ABR Chamber 5 2670 7940 8460 14420 18750 11800 13100 14400 14200 10125 11400 15433 9600 11750 11733 12600 12900 11233 11833
Table E.3. TSS and VSS values of the sludge in the aerobic AS.
MLSS 0 1 2 4 9 13 15 16 18 21 22 23 24 27 30
Aerobic 2270 4100 4981 8687 9593 6046 5499 5203 5100 4700 4500 3690 3854 3821 3718
MLVSS 0 1 2 4 9 13 15 16 18 21 22 23 24 27 30
Aerobic 1680 2481 2750 4518 5296 3687 3437 3218 2833 2734 2590 2567 2420 2416 2399

192
Table E.4. pH values of the different processes studied.
0 6 10 12 14 18 19 21 24 28 30 36 39 42 49 60 67 74 81 88 95
10
2
10
9
11
6
12
3
13
0
13
7
14
4
15
1
15
8
16
5
17
2
17
9
18
6
19
3
20
0
Item
p
H
p
H
p
H
p
H
p
H
p
H
p
H
p
H
p
H
p
H
p
H
p
H
p
H
p
H
p
H
p
H
p
H
p
H
p
H
p
H
p
H
p
H
p
H
p
H
p
H
p
H
p
H
p
H
p
H
p
H
p
H
p
H
p
H
p
H
p
H
p
H
SSWW
6.
92
6.
82
6.
86
6.
87
6.
85
6.
92
6.
82
6.
86
6.
87
6.
85
6.
86
6.
87
6.
85
6.
85
6.
86
6.
87
6.
85
6.
87
6.
85
6.
86
6.
87
6.
85
6.
92
6.
82
6.
86
6.
87
6.
85
6.
86
6.
87
6.
85
6.
85
6.
86
6.
87
6.
85
6.
87
6.
85
ABR
Chamber
1
6.
84
6.
57
6.
46
6.
67
6.
94
6.
7
6.
64
6.
83
6.
82
6.
59
6.
7
6.
66
6.
70
6.
47
6.
62
7.
00
6.
70
6.
77
6.
82
6.
76
6.
79
6.
79
6.
77
6.
82
6.
76
6.
79
6.
79
6.
76
6.
79
6.
79
6.
79
6.
76
6.
79
6.
79
6.
79
6.
79
ABR
Chamber
2
6.
97
6.
54
6.
5
6.
58
6.
93
6.
7
6.
64
6.
83
6.
05
6.
63
6.
84
6.
76
6.
78
6.
75
6.
75
6.
35
6.
62
6.
57
6.
51
6.
56
6.
55
6.
54
6.
57
6.
51
6.
56
6.
55
6.
54
6.
56
6.
55
6.
54
6.
54
6.
56
6.
55
6.
54
6.
55
6.
54
ABR
Chamber
3
6.
9
6.
53
6.
53
6.
64
7.
06
6.
73
6.
58
6.
73
6.
01
6.
71
6.
76
6.
84
6.
84
6.
87
6.
80
6.
79
6.
82
6.
80
6.
80
6.
81
6.
80
6.
81
6.
80
6.
80
6.
81
6.
80
6.
81
6.
81
6.
80
6.
81
6.
81
6.
81
6.
80
6.
81
6.
80
6.
81
ABR
Chamber
4
6.
97
6.
58
6.
55
6.
56
7.
21
6.
68
6.
52
6.
72
6.
77
6.
75
6.
89
6.
88
6.
72
6.
87
6.
82
6.
77
6.
82
6.
80
6.
79
6.
81
6.
80
6.
80
6.
80
6.
79
6.
81
6.
80
6.
80
6.
81
6.
80
6.
80
6.
80
6.
81
6.
80
6.
80
6.
80
6.
80
ABR
Chamber
5 7
6.
64
6.
63
6.
75
7.
21
6.
67
6.
5
6.
64
6.
98
6.
7
6.
9
6.
80
6.
79
6.
90
6.
82
7.
02
6.
91
6.
92
6.
95
6.
93
6.
93
6.
94
6.
92
6.
95
6.
93
6.
93
6.
94
6.
93
6.
93
6.
94
6.
94
6.
93
6.
93
6.
94
6.
93
6.
94
ABR
Clarifier 7
6.
62
6.
58
6.
63
7.
14
6.
67
6.
51
6.
63
6.
97
6.
71
6.
84
6.
85
6.
79
6.
88
6.
81
7.
01
6.
90
6.
91
6.
94
6.
92
6.
92
6.
92
6.
91
6.
94
6.
92
6.
92
6.
92
6.
92
6.
92
6.
92
6.
92
6.
92
6.
92
6.
92
6.
92
6.
92
ABR
effluent
7.
9
7.
43
7.
53
7.
34
7.
7
7.
73
7.
62
7.
73
6.
97
7.
64
6.
89
7.
52
6.
81
6.
88
7.
15
7.
05
7.
03
7.
06
7.
05
7.
05
7.
06
7.
05
7.
06
7.
05
7.
05
7.
06
7.
05
7.
05
7.
06
7.
05
7.
05
7.
05
7.
06
7.
05
7.
06
7.
05
Aeration
Tank
7.
6
7.
16
7.
81
7.
85
7.
66
7.
74
5.
78
6.
44
6.
77
6.
55
6.
61
6.
92
6.
74
7.
10
6.
78
7.
02
6.
97
6.
92
6.
97
6.
95
6.
95
6.
96
6.
92
6.
97
6.
95
6.
95
6.
96
6.
95
6.
95
6.
96
6.
96
6.
95
6.
95
6.
96
6.
95
6.
96
AS
Clarifier
7.
38
6.
99
7.
68
7.
8
7.
55
7.
92
6.
9
6.
31
6.
77
7.
27
7.
1
6.
90
6.
92
7.
77
7.
19
7.
00
7.
32
7.
17
7.
16
7.
22
7.
18
7.
19
7.
17
7.
16
7.
22
7.
18
7.
19
7.
22
7.
18
7.
19
7.
19
7.
22
7.
18
7.
19
7.
18
7.
19
AS
effluent
7.
55
7.
22
7.
83
7.
98
7.
56
7.
87
6.
85
6.
53
6.
72
7.
35
6.
51
7.
00
6.
80
7.
60
7.
05
6.
95
7.
20
7.
07
7.
07
7.
11
7.
08
7.
09
7.
07
7.
07
7.
11
7.
08
7.
09
7.
11
7.
08
7.
09
7.
09
7.
11
7.
08
7.
09
7.
08
7.
09
UV/H2O2
6.
20
6.
20
6.
20
6.
18
6.
19
6.
20
6.
20
6.
20
6.
18
6.
19
6.
20
6.
20
6.
19
6.
20
6.
20
6.
20
6.
19
6.
20
6.
20
6.
20
6.
20

193
Table E.5. Temperature values of the different processes studied.
0 6 10 12 14 18 19 21 24 28 30 36 39 42 49 60 67 74 81 88 95 102 109 116 123 130 137 144 151 158 165 172 179 186 193 200
Item
Temp
(°C
)
Temp
(°C
)
Temp
(°C
)
Temp
(°C
)
Temp
(°C
)
Temp
(°C
)
Temp
(°C
)
Temp
(°C
)
Temp
(°C
)
Temp
(°C
)
Temp
(°C
)
Temp
(°C
)
Temp
(°C
)
Temp
(°C
)
Temp
(°C
)
Temp
(°C
)
Temp
(°C
)
Temp
(°C
)
Temp
(°C
)
Temp
(°C
)
Temp
(°C
)
Temp
(°C
)
Temp
(°C
)
Temp
(°C
)
Temp
(°C
)
Temp
(°C
)
Temp
(°C
)
Temp
(°C
)
Temp
(°C
)
Temp
(°C
)
Temp
(°C
)
Temp
(°C
)
Temp
(°C
)
Temp
(°C
)
Temp
(°C
)
Temp
(°C
)
SSW
W
24.
9
24.
9
24.
8
24.
7
24.
7
24.
80
24.
7
24.
80
24.
80
24.
7
24.
80
24.
7
24.
7
24.
80
24.
80
24.
80
24.
7
24.
80
24.
7
24.
7
24.
80
24.
7
24.
7
24.
80
24.
7
24.
80
24.
7
24.
7
24.
80
24.
7
24.
80
24.
7
24.
80
24.
7
24.
7
24.
60
ABR
Chamber 1
25.5 24
25.2
24.9
24.9
25.4 25
24.70
24.1
24.8
24.70
24.7
24.6
24.6
24.70
24.8
24.8
24.6
24.6
24.6
24.70
24.6
24.6
24.70
24.6
24.70
24.6
24.6
24.70
24.6
24.70
24.6
24.70
24.6
24.6
24.50
ABR
Cham
ber 2
25.
7
24.
3
24.
9
25.
1
24.
6
25.
3 25
24.
70
24.
3
24.
9
24.
70
24.
7
24.
6
24.
7
24.
70
24.
9
24.
8
24.
7
24.
6
24.
7
24.
70
24.
6
24.
7
24.
70
24.
7
24.
70
24.
7
24.
7
24.
70
24.
7
24.
70
24.
7
24.
70
24.
7
24.
7
24.
60
ABR
Cham
ber 3
25.
6
24.
5 25
24.
8
24.
9
25.
3
25.
5
24.
70
24.
1
24.
9
24.
70
24.
7
24.
6
24.
6
24.
70
24.
9
24.
8
24.
6
24.
6
24.
6
24.
70
24.
6
24.
6
24.
70
24.
6
24.
70
24.
6
24.
6
24.
70
24.
6
24.
70
24.
6
24.
70
24.
6
24.
6
24.
50
ABR
Cham
ber 4
25.
4
24.
4
25.
3
24.
6 25
25.
3
25.
2
24.
80
24.
4
24.
9
24.
80
24.
8
24.
7
24.
7
24.
80
24.
9
24.
9
24.
7
24.
7
24.
7
24.
80
24.
7
24.
7
24.
80
24.
7
24.
80
24.
7
24.
7
24.
80
24.
7
24.
80
24.
7
24.
80
24.
7
24.
7
24.
70
ABR Cham
ber 5
25.
3
24.
5
25.
4
24.
5
24.
9
25.
5
25.
3
24.
70
24.
1
24.
9
24.
70
24.
7
24.
6
24.
6
24.
70
24.
9
24.
9
24.
6
24.
6
24.
6
24.
70
24.
6
24.
6
24.
70
24.
6
24.
70
24.
6
24.
6
24.
70
24.
6
24.
70
24.
6
24.
70
24.
6
24.
6
24.
50
ABR
Clarif
ier
25.
1
24.
5
25.
4
24.
4
24.
8
25.
4
25.
3
25.
00
25.
1
24.
9
25.
00
25.
0
24.
9
25.
0
25.
00
24.
9
25.
0
25.
0
24.
9
25.
0
25.
00
24.
9
25.
0
24.
90
25.
0
24.
90
25.
0
25.
0
24.
90
25.
0
24.
90
25.
0
24.
90
25.
0
25.
0
24.
90
ABR
efflue
nt
25.
3
24.
6
25.
2
24.
2
24.
8
25.
5
24.
3
24.
60
24.
3
24.
8
24.
60
24.
5
24.
6
24.
6
24.
60
24.
8
24.
7
24.
6
24.
6
24.
6
24.
60
24.
6
24.
6
24.
60
24.
6
24.
60
24.
6
24.
6
24.
60
24.
6
24.
60
24.
6
24.
60
24.
6
24.
6
24.
60
Aerat
ion
Tank
25.
6
24.
3 25
24.
1
25.
1
25.
4
24.
8
24.
60
24.
3
24.
7
24.
60
24.
5
24.
5
24.
5
24.
60
24.
7
24.
7
24.
5
24.
5
24.
5
24.
60
24.
5
24.
5
24.
50
24.
6
24.
50
24.
5
24.
5
24.
40
24.
5
24.
60
24.
5
24.
60
24.
5
24.
5
24.
50
AS Clarif
ier
25.
6
24.
4
25.
2
24.
1 25
25.
1
24.
4
24.
70
24.
3
24.
8
24.
70
24.
6
24.
6
24.
6
24.
70
24.
8
24.
7
24.
6
24.
6
24.
6
24.
70
24.
6
24.
6
24.
60
24.
6
24.
60
24.
6
24.
6
24.
60
24.
6
24.
60
24.
6
24.
60
24.
6
24.
6
24.
60
AS
efflue
nt
25.
6
24.
6
25.
4
24.
3 25
25.
5
24.
5
24.
50
24.
3
24.
8
24.
50
24.
4
24.
4
24.
5
24.
50
24.
8
24.
6
24.
5
24.
4
24.
5
24.
50
24.
4
24.
5
24.
50
24.
5
24.
50
24.
5
24.
5
24.
50
24.
5
24.
50
24.
5
24.
50
24.
5
24.
5
24.
50
UV/
H2O2
26.
5
26.
5
26.
5
26.
4
26.
5
26.
5
26.
4
26.
5
26.
5
26.
5
26.
5
26.
5
26.
5
26.
4
26.
5
26.
6
26.
5
26.
6
26.
5
26.
5
26.
5

194
Table E.6. Calculation of the CBOD5 for the different processes studied.
DO0 DO5 CBOD5 CBOD5 (%)
Vsln (mL) 300
SSWWin
8.49 2.09 640.00
6.40 Vww (mL) 3
UV/H2O2
3.42 2.42 100.00 84.38% 1.00
Aerobic AS
1.49 0.99 50.00 92.19% 0.50
ABR
0.48 0.17 31.00 95.16% 0.31
Combined Ana-Ae
1.65 1.61 4.00 99.38% 0.04
Combined Ae-Ana
0.78 0.75 3.00 99.53% 0.03
Combined Ana-Ae-UV
2.44 2.42 2.00 99.69% 0.02
Blank 1
8.60 8.59 1.00
Blank 2
8.59 8.58 1.00
V DO0 (mg/L) DO5 (mg/L) f SCF (mg/L) SCF Average*
Seed 10mL 10 8.42 7.35 0.40 0.43
0.00 Seed 15mL 15 8.50 7.28 0.27 0.33
Seed 20mL 20 8.56 6.62 0.20 0.39
* Values in the range 0.6 - 1.0 mg/L
DO0 DO5
GGA 1
8.45 6.24
GGA 2
8.43 6.20
Table E.7. Calculation of the TOC and TN removal for the different processes studied.
20%
Q 3.34 HRT 7
TOC
(mg/L)
SD
(mg/L)
TOC Removal
(%)
TN
(mg/L)
SD
(mg/L)
TN Removal
(%)
dw-1 0.307 0.0575
0.0587 0.0373
dw-2 0.2251 0.0188
0.0267 0.007
SSWWin 183.3548 1.2219 0.00% 63.3791 0.3782 0.00%
Ana Chamber
1 71.1603 1.386 61.19% 60.8111 0.559 4.05%
Ana Chamber
2 61.2356 2.1073 66.60% 58.8848 2.0337 7.09%
Ana Chamber
3 58.0253 1.0191 68.35% 54.992 0.7893 13.23%
Ana Chamber
4 54.5 0.8076 70.28% 53.9638 0.8706 14.86%
Ana Chamber
5 51.2816 5.2196 72.03% 46.4038 0.7253 26.78%
Ana Clarifier 49.251 0.6999 73.14% 46.367 1.1157 26.84%
Ana Effluent 29.2356 1.1519 84.06% 43.5296 1.242 31.32%
WWin 183.3548 1.2219 0.00% 63.3791 0.3782 0.00%
Aeration Tank 32.9951 0.9088 82.00% 39.4608 0.1893 37.74%
Ae Clarifier 14.6549 0.4434 92.01% 38.5917 0.8127 39.11%
Ae Effluent 14.4837 0.4042 92.10% 37.2671 1.5777 41.20%

195
40%
Q 3.34 HRT 7
TOC (mg/L) SD (mg/L) TOC Removal (%) TN (mg/L) SD (mg/L) TN Removal (%)
dw-1 1.5883 0.081
0.0505 0.009
dw-2 0.6109 0.0353
0.0279 0.0068
WWin 366.7096 1.433 0.00% 119.2971 11.1508 0.00%
Ch1 95.7851 2.314 73.88% 79.7571 1.7251 33.14%
Ch2 88.1839 2.5392 75.95% 80.4314 0.3346 32.58%
Ch3 85.3256 0.9968 76.73% 76.6218 1.0736 35.77%
Ch4 83.8272 0.7274 77.14% 73.6 1.7407 38.31%
Ch5 76.858 2.0524 79.04% 71.5846 0.8433 39.99%
Ana1 75.3674 1.7162 79.45% 70.6943 0.3211 40.74%
Ana2 57.8479 0.9428 84.23% 70.5164 0.2795 40.89%
WWin 366.7096 1.433 0.00% 119.2971 11.1508 0.00%
Ae1 51.118 1.2525 86.06% 85.2627 0.4361 28.53%
Ae2 39.4769 1.2938 89.23% 74.4391 0.8182 37.60%
Ae3 28.1867 0.962 92.31% 65.921 3.3638 44.74%
60%
Q 4.68 HRT 5
TOC (mg/L) SD (mg/L) TOC Removal (%) TN (mg/L) SD (mg/L) TN Removal (%)
dw-1 0.9888 0.0788
0.0366 0.0015
dw-2 0.3516 0.0592
0.041 0.0005
WWin 639.4368 1.5522 0.00% 144.4031 1.1447 0.00%
Ch1 233.7442 3.2268 63.45% 111.1064 1.789 23.06%
Ch2 207.4607 5.0784 67.56% 108.4051 0.7053 24.93%
Ch3 182.0629 2.2434 71.53% 107.6782 0.315 25.43%
Ch4 159.6082 2.7466 75.04% 107.4829 0.2214 25.57%
Ch5 159.2885 1.8825 75.09% 107.4829 0.995 25.57%
Ana1 157.2442 1.1014 75.41% 105.1249 0.8626 27.20%
Ana2 104.6063 1.7477 83.64% 91.7067 1.1493 36.49%
WWin 639.4368 1.5522 0.00% 144.4031 1.1447 0.00%
Ae1 116.0401 0.4459 81.85% 137.1057 4.6142 5.05%
Ae2 99.0038 0.8644 84.52% 118.1492 0.4158 18.18%
Ae3 66.1437 1.1189 89.66% 82.0349 0.7712 43.19%

196
60%
Q 3.34 HRT 7
TOC (mg/L) SD (mg/L) TOC Removal (%) TN (mg/L) SD (mg/L) TN Removal (%)
dw-1 0.1907 0.0198
0.005 0.0044
dw-2 0.1894 0.0486
0.0186 0.0062
WWin 645.6042 13.8694
147.1487 3.4519
WWin 639.4368 1.5522 0.00% 144.4031 1.1447 0.00%
Ch1 164.816 1.3986 74.22% 109.0119 0.8438 24.51%
Ch2 131.343 1.0813 79.46% 105.463 2.0159 26.97%
Ch3 114.7329 0.66 82.06% 102.5234 5.9991 29.00%
Ch4 90.3126 0.5661 85.88% 100.9901 1.6786 30.06%
Ch5 81.547 0.8644 87.25% 91.0476 0.562 36.95%
Ana1 81.5246 0.4459 87.25% 87.0177 0.1553 39.74%
Ana2 80.4452 1.1189 87.42% 82.9439 0.5151 42.56%
WWin 639.4368 1.5522 0.00% 144.4031 1.1447 0.00%
Ae1 64.804 0.1145 89.87% 100.4628 3.3078 30.43%
Ae2 57.5101 1.0087 91.01% 75.9291 0.3542 47.42%
Ae3 46.9364 0.5914 92.66% 56.935 2.4356 60.57%
60%
Q 2.93 HRT 8
TOC (mg/L) SD (mg/L) TOC Removal (%) TN (mg/L) SD (mg/L) TN Removal (%)
dw-1 0.2698 0.0447
0.0256 0.0098
dw-2 0.3718 0.053
0.0556 0.0117
WWin 645.6042 13.8694
147.1487 3.4519
WWin 639.4368 1.5522 0.00% 144.4031 1.1447 0.00%
Ch1 156.0451 2.9782 75.60% 78.0504 5.511 45.95%
Ch2 111.0964 1.0001 82.63% 76.6637 5.3279 46.91%
Ch3 94.5914 1.4322 85.21% 75.8312 5.3747 47.49%
Ch4 82.9015 1.222 87.04% 70.5431 4.8112 51.15%
Ch5 77.8824 1.0369 87.82% 70.4414 4.8665 51.22%
Ana1 76.811 1.8813 87.99% 70.0945 4.847 51.46%
Ana2 71.0912 0.6281 88.88% 70.0092 4.2549 51.52%
WWin 639.4368 1.5522 0.00% 144.4031 1.1447 0.00%
Ae1 45.268 0.3181 92.92% 93.3773 3.5302 35.34%
Ae2 40.4147 0.5957 93.68% 69.9532 5.7382 51.56%
Ae3 36.7103 2.4535 94.26% 35.8786 5.7034 75.15%

197
80%
Q 11.70 HRT 2
TOC (mg/L) SD (mg/L) TOC Removal (%) TN (mg/L) SD (mg/L) TN Removal (%)
dw-1 1.0075
0.0313
WWin 733.4193 3.2423 0.00% 181.9955 2.1257 0.00%
Ch1 224.6072 3.2834 69.38% 114.3869 2.805 37.15%
Ch2 158.8953 4.774 78.33% 109.3171 0.806 39.93%
Ch3 128.927 4.304 82.42% 104.9981 0.6585 42.31%
Ch4 114.7546 5.5229 84.35% 104.5505 1.7229 42.55%
Ch5 112.9793 0.7469 84.60% 103.701 0.6884 43.02%
Ana1 109.1723 3.598 85.11% 99.3056 0.6279 45.44%
Ana2 107.9521 3.331 85.28% 97.5862 1.608 46.38%
WWin 733.4193 3.2423 0.00% 181.9955 2.1257 0.00%
Ae1 105.1247 6.4358 85.67% 165.7801 1.312 8.91%
Ae2 91.5973 2.8598 87.51% 123.0281 0.645 32.40%
Ae3 42.9999 2.7138 94.14% 120.9563 1.5302 33.54%
80%
Q 4.68 HRT 5
TOC (mg/L) SD (mg/L) TOC Removal (%) TN (mg/L) SD (mg/L) TN Removal (%)
dw-1 0.3949 0.0354
0.0216 0.0041
WWin 733.4193 3.2423 0.00% 181.9955 2.1257 0.00%
Ch1 400.1021 5.849 45.45% 138.5113 3.3977 23.89%
Ch2 353.834 10.633 51.76% 137.969 1.0184 24.19%
Ch3 295.117 9.8539 59.76% 135.0366 0.847 25.80%
Ch4 237.731 11.4415 67.59% 129.1994 2.1291 29.01%
Ch5 188.0034 1.243 74.37% 122.0746 0.8104 32.92%
Ana1 182.0516 6.0007 75.18% 120.8888 0.7644 33.58%
Ana2 129.9731 4.0113 82.28% 104.7248 1.7263 42.46%
WWin 733.4193 3.2423 0.00% 181.9955 2.1257 0.00%
Ae1 86.4916 5.2951 88.21% 133.6378 1.0583 26.57%
Ae2 51.9128 1.6208 92.92% 125.597 0.6589 30.99%
Ae3 41.7024 4.0455 94.31% 115.4007 2.3326 36.59%

198
80%
Q 3.34 HRT 7
TOC (mg/L) SD (mg/L) TOC Removal (%) TN (mg/L) SD (mg/L) TN Removal (%)
dw-1 0.415 0.0088
0.0843 0.0038
WWin 733.4193
0.00% 181.9955
0.00%
Ch1 418.4278 11.2998 42.95% 137.1057 2.2768 24.67%
Ch2 337.03 7.3671 54.05% 134.6899 2.5776 25.99%
Ch3 306.6029 5.7317 58.20% 133.2053 3.5482 26.81%
Ch4 246.4114 3.8294 66.40% 129.5068 2.3276 28.84%
Ch5 205.6607 6.7873 71.96% 123.4488 0.4633 32.17%
Ana1 133.8676 2.732 81.75% 110.3611 1.309 39.36%
Ana2 88.4298 4.0087 87.94% 102.122 2.0679 43.89%
WWin 733.4193
0.00% 181.9955
0.00%
Ae1 98.681 4.5213 86.55% 129.7378 1.3824 28.71%
Ae2 75.6791 1.0401 89.68% 89.9092 1.4468 50.60%
Ae3 40.7836 1.8826 94.44% 57.9372 1.5785 68.17%
100%
Q 7.80 HRT 3
TOC (mg/L) SD (mg/L) TOC Removal (%) TN (mg/L) SD (mg/L) TN Removal (%)
dw-1 0.3199 0.146
0.0059 0.0239
WWin 1008.8495 5.1109 0.00% 254.2300 1.5222 0.00%
Ch1 571.8746 20.4354 43.31% 230.5054 2.6292 9.33%
Ch2 454.0111 9.0468 55.00% 228.072 7.9239 10.29%
Ch3 331.6076 6.07 67.13% 216.1698 4.8588 14.97%
Ch4 260.0331 2.8277 74.22% 209.8313 1.9213 17.46%
Ch5 208.7259 8.4141 79.31% 203.4793 6.8815 19.96%
Ana1 218.5146 1.4615 78.34% 145.2086 1.105 42.88%
Ana2 142.9079 1.9412 85.83% 132.9547 1.2708 47.70%
WWin 1008.8495 5.1109 0.00% 254.23 1.5222 0.00%
Ae1 145.7414 1.3337 85.55% 91.6897 7.5438 63.93%
Ae2 118.0836 1.2225 88.30% 80.186 6.7892 68.46%
Ae3 84.0839 1.4456 91.67% 70.1051 8.1143 72.42%

199
100%
Q 3.34 HRT 7
TOC (mg/L) SD (mg/L) TOC Removal (%) TN (mg/L) SD (mg/L) TN Removal (%)
dw-1 0.5415 0.0791
0.1862 0.0932
WWin 1008.8495 5.1109 0.00% 254.2300 1.5222 0.00%
Ch1 578.6266 11.973 42.64% 237.5711 1.685 6.55%
Ch2 420.5742 2.9245 58.31% 231.3608 2.1225 9.00%
Ch3 332.9334 6.2618 67.00% 230.4288 0.9252 9.36%
Ch4 324.5938 2.218 67.83% 153.9032 0.4274 39.46%
Ch5 270.5846 5.9031 73.18% 145.6495 2.0549 42.71%
Ana1 182.3738 1.3889 81.92% 138.1936 1.2589 45.64%
Ana2 106.2775 6.1932 89.47% 127.929 0.9195 49.68%
WWin 1008.8495 5.1109 0.00% 254.23 1.5222 0.00%
Ae1 191.8118 16.6121 80.99% 137.4408 1.0348 45.94%
Ae2 175.4183 1.4543 82.61% 79.3873 8.1796 68.77%
Ae3 55.2232 6.3439 94.53% 67.4811 7.7837 73.46%
100% Combined Ana-Ae Q 7.50 HRT 3.12
TOC (mg/L) SD (mg/L) TOC Removal (%) TN (mg/L) SD (mg/L) TN Removal (%)
dw-1 0.3863 0.0274
0.0083 0.0085
WWin 1008.8495 5.1109 0.00% 419.7730 1.5222 0.00%
Ch1 721.422 5.1109 28.49% 399.773 1.5222 4.76%
Ch2 520.136 2.878 48.44% 385.371 2.6648 8.20%
Ch3 346.757 4.6709 65.63% 376.954 3.305 10.20%
Ch4 324.384 2.1438 67.85% 364.112 2.9875 13.26%
Ch5 303.9396 2.1095 69.87% 363.676 2.4383 13.36%
Ana1 299.311 2.1356 70.33% 355.758 2.4985 15.25%
Ae1 120.588 0.4762 88.05% 342.048 0.6343 18.52%
Ae2 89.378 0.2583 91.14% 335.293 4.0465 20.13%
Eff 69.1 0.4271 93.15% 280.382 3.4084 33.21%
100% Combined Ana-Ae Q 3.75 HRT 6.24
TOC (mg/L) SD (mg/L) TOC Removal (%) TN (mg/L) SD (mg/L) TN Removal (%)
dw-1 0.5415 0.0791
0.1862 0.0932
WWin 1008.8495 5.1109 0.00% 419.7730 1.5222 0.00%
Ch1 462.2498 14.6377 54.18% 206.7206 5.5128 50.75%
Ch2 396.839 25.2943 60.66% 197.02 1.4041 53.07%
Ch3 338.2224 8.3264 66.47% 187.412 4.0548 55.35%
Ch4 317.3341 16.4419 68.54% 180.2934 1.7837 57.05%
Ch5 306.1535 9.7634 69.65% 152.517 0.559 63.67%
Ana1 162.7555 2.6058 83.87% 147.0215 1.487 64.98%
Ae1 92.6392 2.0167 90.82% 146.1403 2.9999 65.19%
Ae2 63.1264 0.6222 93.74% 102.5989 1.9791 75.56%
Eff 36.6972 0.7358 96.36% 81.7275 0.6145 80.53%

200
100% Combined Ae-Ana Q 7.50 HRT 3.12
TOC (mg/L) SD (mg/L) TOC Removal (%) TN (mg/L) SD (mg/L) TN Removal (%)
dw-1 0.2279 0.0352
0.0135 0.0033
WWin 1008.8495 5.1109 0.00% 425.5423 3.4782 0.00%
Ae1 215.5937 1.402 78.63% 341.4685 7.1308 19.76%
Ae2 177.792 6.3572 82.38% 337.6347 8.3374 20.66%
Ch1 169.0934 4.2979 83.24% 336.0975 7.8471 21.02%
Ch2 161.0194 3.2936 84.04% 334.8627 2.8142 21.31%
Ch3 157.0349 5.6209 84.43% 321.2079 7.0627 24.52%
Ch4 156.8219 4.5948 84.46% 318.6252 4.2298 25.12%
Ch5 148.546 3.771 85.28% 319.486 5.0119 24.92%
Ana 141.1703 2.3643 86.01% 307.1767 4.0528 27.82%
Eff 140.7936 1.696 86.04% 300.3849 3.3672 29.41%
100% Combined Ae-Ana Q 3.75 HRT 6.24
TOC (mg/L) SD (mg/L) TOC Removal (%) TN (mg/L) SD (mg/L) TN Removal (%)
dw-1 0.2279 0.0352
0.0135 0.0033
WWin 1008.8495 5.1109 0.00% 425.5423 3.4782 0.00%
Ae1 204.4599 1.402 79.73% 181.7377 7.1308 57.29%
Ae2 168.8271 6.3572 83.27% 149.9653 8.3374 64.76%
Ch1 151.352 4.2979 85.00% 139.2546 7.8471 67.28%
Ch2 150.31 3.2936 85.10% 128.6837 2.8142 69.76%
Ch3 149.645 5.6209 85.17% 122.3708 7.0627 71.24%
Ch4 149.4387 4.5948 85.19% 121.1771 4.2298 71.52%
Ch5 100.3359 3.771 90.05% 116.9516 5.0119 72.52%
Ana 60.5536 2.3643 94.00% 102.9395 4.0528 75.81%
Eff 39.3044 1.696 96.10% 100.262 3.3672 76.44%
100% Combined Ana-Ae-UV Q 7.50 HRT 3.15
TOC (mg/L) SD (mg/L) TOC Removal (%) TN (mg/L) SD (mg/L) TN Removal (%)
dw-1 0.0925 0.2671
0.0135 0.0033
WWin 941.1858 12.8471 0.00% 214.0842 13.4782 0.00%
Ch1 469.4826 11.3591 50.12% 150.9275 7.1308 29.50%
Ch2 298.0182 16.5156 68.34% 101.4802 8.3374 52.60%
Ch3 230.4414 14.4603 75.52% 95.0801 7.8471 55.59%
Ch4 188.5857 6.3111 79.96% 91.4496 2.8142 57.28%
Ch5 164.1492 4.5808 82.56% 78.2836 1.0627 63.43%
Ana 154.9005 6.1319 83.54% 77.1396 1.2298 63.97%
Ae1 93.0076 1.2746 90.12% 49.9809 1.0119 76.65%
Ae2 92.43 1.4623 90.18% 41.0115 1.0528 80.84%
UV 11.5326 0.1266 98.77% 40.7754 0.3672 80.95%
Eff 10.3053 0.1518 98.91% 40.621 0.2849 81.03%

201
100% Combined Ana-Ae-UV Q 6.75 HRT 3.50
TOC (mg/L) SD (mg/L) TOC Removal (%) TN (mg/L) SD (mg/L) TN Removal (%)
dw-1 0.0925 0.2671
0.0135 0.0033
WWin 1006.8993 10.0131 0.00% 203.8395 11.024 0.00%
Ch1 460.5657 10.0259 51.07% 155.7064 11.135 27.27%
Ch2 296.4317 13.5481 68.50% 102.1924 11.3362 52.27%
Ch3 224.9815 12.4857 76.10% 98.5308 5.3731 53.98%
Ch4 181.3605 8.9379 80.73% 84.4567 2.7559 60.55%
Ch5 161.8782 8.1521 82.80% 79.0176 5.8599 63.09%
Ana 154.1284 8.0405 83.62% 74.8635 3.097 65.03%
Ae1 83.7288 2.9675 91.10% 46.6171 2.668 78.22%
Ae2 81.8802 2.4493 91.30% 37.9036 0.7882 82.30%
UV 8.5292 0.5251 99.09% 37.4527 0.481 82.51%
Eff 8.1433 0.3207 99.13% 37.436 0.2816 82.51%
100% Combined Ana-Ae-UV Q 5.90 HRT 4.00
TOC (mg/L) SD (mg/L) TOC Removal (%) TN (mg/L) SD (mg/L) TN Removal (%)
dw-1 0.0925 0.2671
0.0135 0.0033
WWin 1004.8855 10.0131 0.00% 200.0294 10.034 0.00%
Ch1 454.5485 10.0259 51.70% 152.796 12.135 28.63%
Ch2 295.8308 13.5481 68.57% 100.2822 13.3362 53.16%
Ch3 214.4315 12.4857 77.22% 96.6891 5.3731 54.84%
Ch4 180.8297 8.9379 80.79% 82.878 3.7559 61.29%
Ch5 158.4044 8.1521 83.17% 77.5407 5.89 63.78%
Ana 153.6721 8.0405 83.67% 73.4642 3.097 65.68%
Ae1 83.5613 2.9675 91.12% 45.7458 2.668 78.63%
Ae2 81.7164 2.4493 91.32% 37.1951 0.7882 82.63%
UV 0.1825 0.1305 99.98% 36.7527 0.481 82.83%
Eff 0.1682 0.028 99.98% 36.7363 0.216 82.84%
Table E.8. Maximum values of TOC and TN removal for the different processes studied.
[TN] (mg/L) [TOC] (mg/L)
SSWW 425.5423 1008.8495
ABR 214.1337 106.2775
Aerobic AS 112.9531 50.12
Combined Ae-Ana 100.262 39.3044
Combined Ana-Ae 82.8508 36.6972
Combined Ana-Ae-UV 78.1527 0.1689
%TN Removal %TOC Removal
UV/H2O2 5.99% 75.22%
ABR 49.68% 89.47%
Aerobic AS 73.46% 94.53%
Combined Ae-Ana 76.44% 96.10%
Combined Ana-Ae 80.53% 96.36%
Combined Ana-Ae-UV 82.84% 99.98%

202
Table E.9. TOC and TN values from the UV/H2O2 process alone for the calculation of the
optimal H2O2 dosage.
Optimum H2O2 Dosage in the UV/ H2O2 process V sln (mL) 1400
Slaughterhouse WW (%) 5 V sww (mL) 70 HRT (min)
H2O2 Dosage (mg/L) Parameter (mg/L) dw 0 30 60 90 120 150 180
0
m H2O2 (mg) 0 TOC 0.9888 64.8812 64.498 63.8797 63.6042 62.246 60.7551 60.3673
V Distilled Water (mL) 1330 SD 0.0788 3.5568 3.606 5.633 3.0488 3.0731 3.8387 0.7003
TOC/TOC0
1.0000 0.9941 0.9846 0.9803 0.9594 0.9364 0.9304
TOC removal (%) 0.00% 0.00% 0.59% 1.54% 1.97% 4.06% 6.36% 6.96%
TN 0.0366 19.8650 19.6 19.555 19.514 19.485 19.437 19.241
SD 0.0015 1.3592 1.5718 1.9075 1.8673 2.1294 1.0639 1.9316
TN/TN0
1.0000 0.9867 0.9844 0.9823 0.9809 0.9785 0.9686
TN Change (%) 0.00% 0.00% 1.33% 1.56% 1.77% 1.91% 2.15% 3.14%
[H2O2]/[TOC]
0.00
[H2O2]/(TOCinxHRT)
0.00 0.00 0.00 0.00 0.00 0.00
100
m H2O2 (mg) 140 TOC 1.0485 64.8836 60.4931 58.3678 55.8508 52.3548 49.2112 39.8427
V Distilled Water (mL) 1330 SD 0.0459 3.4583 2.7741 2.8606 2.0636 2.2383 2.2893 2.2795
TOC/TOC0
1.0000 0.9323 0.8996 0.8608 0.8069 0.7585 0.6141
TOC removal (%) 0.00% 0.00% 6.77% 10.04% 13.92% 19.31% 24.15% 38.59%
TN 0.0297 18.6996 18.5401 18.4696 18.326 18.2679 18.2777 17.6063
SD 0.0035 1.0841 1.1699 1.3469 0.9926 1.2757 1.2993 1.1777
TN/TN0
1.0000 0.9915 0.9877 0.9800 0.9769 0.9774 0.9415
TN Change (%) 0.00% 0.00% 0.85% 1.23% 2.00% 2.31% 2.26% 5.85%
[H2O2]/[TOC]
1.54
[H2O2]/(TOCinxHRT)
3.08 1.54 1.03 0.77 0.62 0.51
300
m H2O2 (mg) 420 TOC 1.3880 64.8812 39.3727 38.9027 34.3628 28.5654 28.347 28.2534
V Distilled Water (mL) 1330 SD 0.0692 3.7933 2.1217 1.0307 1.2012 1.1001 1.0173 0.9802
TOC/TOC0
1.0000 0.6068 0.5996 0.5296 0.4403 0.4369 0.4355
TOC removal (%) 0.00% 0.00% 39.32% 40.04% 47.04% 55.97% 56.31% 56.45%
TN 0.0148 16.5127 16.4987 16.4012 16.2228 16.1846 16.1207 15.9192
SD 0.0143 1.4751 1.2457 0.7738 0.8801 1.3639 1.0672 0.993
TN/TN0
1.0000 0.9992 0.9932 0.9824 0.9801 0.9763 0.9641
TN Change (%) 0.00% 0.00% 0.08% 0.68% 1.76% 1.99% 2.37% 3.59%
[H2O2]/[TOC]
4.62
[H2O2]/(TOCinxHRT)
9.25 4.62 3.08 2.31 1.85 1.54
600
m H2O2 (mg) 840 TOC 0.6470 64.8842 38.5881 37.8008 33.9849 28.4601 23.8511 18.898
V Distilled Water (mL) 1330 SD 0.1398 3.0402 0.9236 1.6197 1.477 1.3188 1.5034 0.9936
TOC/TOC0
1.0000 0.5947 0.5826 0.5238 0.4386 0.3676 0.2913
TOC removal (%) 0.00% 0.00% 40.53% 41.74% 47.62% 56.14% 63.24% 70.87%
TN 0.0250 20.6174 20.5333 20.5276 20.4338 19.9723 19.8345 19.7215

203
Optimum H2O2 Dosage in the UV/ H2O2 process V sln (mL) 1400
Slaughterhouse WW (%) 5 V sww (mL) 70 HRT (min)
H2O2 Dosage (mg/L) Parameter (mg/L) dw 0 30 60 90 120 150 180
SD 0.0059 1.8660 0.9053 1.2178 1.6005 1.0582 1.4121 1.5613
TN/TN0
1.0000 0.9959 0.9956 0.9911 0.9687 0.9620 0.9565
TN Change (%) 0.00% 0.00% 0.41% 0.44% 0.89% 3.13% 3.80% 4.35%
[H2O2]/[TOC]
9.25
[H2O2]/(TOCinxHRT)
18.49 9.25 6.16 4.62 3.70 3.08
900
m H2O2 (mg) 1260 TOC 0.3740 64.8819 36.7201 22.8092 20.4505 19.7382 17.643 16.0794
V Distilled Water (mL) 1330 SD 0.0930 2.7177 1.0475 0.9981 0.7622 0.6392 0.8176 0.5407
TOC/TOC0
1.0000 0.5660 0.3515 0.3152 0.3042 0.2719 0.2478
TOC removal (%) 0.00% 0.00% 43.40% 64.85% 68.48% 69.58% 72.81% 75.22%
TN 0.0021 16.9463 16.8832 16.7927 16.6849 16.5805 16.4137 16.3934
SD 0.0113 1.2114 1.4301 1.1453 1.1435 1.0645 1.3149 0.8095
TN/TN0
1.0000 0.9963 0.9909 0.9846 0.9784 0.9686 0.9674
TN Change (%) 0.00% 0.00% 0.37% 0.91% 1.54% 2.16% 3.14% 3.26%
[H2O2]/[TOC]
13.87
[H2O2]/(TOCinxHRT)
27.74 13.87 9.25 6.94 5.55 4.62
1200
m H2O2 (mg) 1680 TOC 0.3438 64.8838 42.6663 30.2953 25.4318 24.1616 23.6652 19.7739
V Distilled Water (mL) 1330 SD 0.0425 0.1557 0.8775 0.7127 0.715 0.4969 3.6254 0.9587
TOC/TOC0
1.0000 0.6576 0.4669 0.3920 0.3724 0.3647 0.3048
TOC removal (%) 0.00% 0.00% 34.24% 53.31% 60.80% 62.76% 63.53% 69.52%
TN 0.0124 19.8745 19.867 19.7409 19.6798 19.5703 19.41 18.981
SD 0.0065 2.0548 1.1183 1.2375 1.0352 1.4666 1.1897 1.6439
TN/TN0
1.0000 0.9996 0.9933 0.9902 0.9847 0.9766 0.9550
TN Change (%) 0.00% 0.00% 0.04% 0.67% 0.98% 1.53% 2.34% 4.50%
[H2O2]/[TOC]
18.49
[H2O2]/(TOCinxHRT)
36.99 18.49 12.33 9.25 7.40 6.16
1500
m H2O2 (mg) 2100 TOC 0.3718 64.8830 63.9984 50.3561 35.6972 34.5233 34.1731 25.0047
V Distilled Water (mL) 1330 SD 0.0530 6.5094 0.8207 1.6583 0.3918 1.3465 1.8898 0.2147
TOC/TOC0
1.0000 0.9864 0.7761 0.5502 0.5321 0.5267 0.3854
TOC removal (%) 0.00% 0.00% 1.36% 22.39% 44.98% 46.79% 47.33% 61.46%
TN 0.0556 10.3963 10.3867 10.283 10.1689 10.0935 10.0381 9.9416
SD 0.0117 0.4491 1.1183 0.3182 0.3403 0.5518 0.3106 0.292
TN/TN0
1.0000 0.9991 0.9891 0.9781 0.9709 0.9655 0.9563
TN Change (%) 0.00% 0.00% 0.09% 1.09% 2.19% 2.91% 3.45% 4.37%
[H2O2]/[TOC]
23.12
[H2O2]/(TOCinxHRT)
46.24 23.12 15.41 11.56 9.25 7.71
2000
m H2O2 (mg) 2800 TOC 0.4726 64.8841 63.897 45.5644 42.8875 41.9274 41.2667 40.8396
V Distilled Water (mL) 1330 SD 0.1458 2.9642 1.6737 0.9256 1.1876 2.2823 0.9188 1.5858

204
Optimum H2O2 Dosage in the UV/ H2O2 process V sln (mL) 1400
Slaughterhouse WW (%) 5 V sww (mL) 70 HRT (min)
H2O2 Dosage (mg/L) Parameter (mg/L) dw 0 30 60 90 120 150 180
TOC/TOC0
1.0000 0.9848 0.7022 0.6610 0.6462 0.6360 0.6294
TOC removal (%) 0.00% 0.00% 1.52% 29.78% 33.90% 35.38% 36.40% 37.06%
TN 0.0155 22.2402 21.9235 21.8382 21.7625 21.5683 21.3475 21.2496
SD 0.0019 1.4422 1.3388 0.9942 1.3951 2.5865 1.4755 2.3422
TN/TN0
1.0000 0.9858 0.9819 0.9785 0.9698 0.9599 0.9555
TN Change (%) 0.00% 0.00% 1.42% 1.81% 2.15% 3.02% 4.01% 4.45%
[H2O2]/[TOC]
30.82
[H2O2]/(TOCinxHRT)
61.65 30.82 20.55 15.41 12.33 10.27
Optimum H2O2 Dosage in the UV/H2O2 process V sln (mL) 1400
Slaughterhouse WW (%) 10 V sww (mL) 140 HRT (min)
H2O2 Dosage (mg/L) Parameter (mg/L) dw Inlet 30 60 90 120 150 180
0
m H2O2 (mg) 0 TOC 0.0122 163.6900 160.2435 156.213 155.5179 154.5622 153.2718 153.1581
V Distilled Water (mL) 1260 SD 0.0263 2.3712 2.404 3.7553 2.032 2.0487 2.5591 0.4668
TOC/TOC0
1.0000 0.9789 0.9543 0.9501 0.9442 0.9364 0.9357
TOC removal (%) 0.00% 0.00% 2.11% 4.57% 4.99% 5.58% 6.36% 6.43%
163.69
TN 0.1212 10.2823 10.233 10.217 10.1722 10.0427 9.9681 9.8264
SD 0.0095 0.4446 0.5367 0.315 0.3369 0.3075 0.2384 0.3005
TN/TN0
1.0000 0.9952 0.9936 0.9893 0.9767 0.9694 0.9557
TN Change (%) 0.00% 0.00% 0.48% 0.64% 1.07% 2.33% 3.06% 4.43%
[H2O2]/[TOC]
0.00
[H2O2]/(TOCinxHRT)
0.00 0.00 0.00 0.00 0.00 0.00
100
m H2O2 (mg) 140 TOC 0.4435 163.6918 158.6074 155.5373 151.9234 145.709 142.1115 135.4624
V Distilled Water (mL) 1260 SD 0.0874 1.1920 1.6798 5.1214 4.6248 1.972 5.6382 3.6488
TOC/TOC0
1.0000 0.9689 0.9502 0.9281 0.8901 0.8682 0.8275
TOC removal (%) 0.00% 0.00% 3.11% 4.98% 7.19% 10.99% 13.18% 17.25%
TN 0.1231 10.3963 10.3495 10.33 10.2689 10.1381 10.0627 9.9319
SD 0.0096 0.4491 0.5422 0.3182 0.3403 0.3106 0.2409 0.3035
TN/TN0
1.0000 0.9955 0.9936 0.9877 0.9752 0.9679 0.9553
TN Change (%) 0.00% 0.00% 0.45% 0.64% 1.23% 2.48% 3.21% 4.47%
[H2O2]/[TOC]
0.61
[H2O2]/(TOCinxHRT)
1.22 0.61 0.41 0.31 0.24 0.20
300
m H2O2 (mg) 420 TOC 0.4024 163.6924 148.8065 133.7997 127.6608 117.3482 109.9497 107.424
V Distilled Water (mL) 1260 SD 0.0439 5.2009 6.4821 2.4589 4.7017 8.2834 1.9445 5.792
TOC/TOC0
1.0000 0.9091 0.8174 0.7799 0.7169 0.6717 0.6563
TOC removal (%) 0.00% 0.00% 9.09% 18.26% 22.01% 28.31% 32.83% 34.37%
TN 0.0374 35.1243 34.4741 34.3737 34.0614 33.7346 33.5985 33.5482

205
Optimum H2O2 Dosage in the UV/H2O2 process V sln (mL) 1400
Slaughterhouse WW (%) 10 V sww (mL) 140 HRT (min)
H2O2 Dosage (mg/L) Parameter (mg/L) dw Inlet 30 60 90 120 150 180
SD 0.0114 3.7716 3.008 2.6123 2.9253 4.5748 1.4837 3.656
TN/TN0
1.0000 0.9815 0.9786 0.9697 0.9604 0.9566 0.9551
TN Change (%) 0.00% 0.00% 1.85% 2.14% 3.03% 3.96% 4.34% 4.49%
[H2O2]/[TOC]
1.83
[H2O2]/(TOCinxHRT)
3.67 1.83 1.22 0.92 0.73 0.61
600
m H2O2 (mg) 840 TOC 1.2403 163.6931 136.7233 121.2595 111.0704 102.4181 95.0924 82.7712
V Distilled Water (mL) 1260 SD 0.0691 8.6615 11.9802 7.254 5.1248 0.3397 3.8398 4.3951
TOC/TOC0
1.0000 0.8352 0.7408 0.6785 0.6257 0.5809 0.5056
TOC removal (%) 0.00% 0.00% 16.48% 25.92% 32.15% 37.43% 41.91% 49.44%
TN 0.2023 36.2005 36.0021 35.8837 35.56 35.427 35.1153 34.7423
SD 0.0201 4.8040 3.2864 1.9203 3.0515 2.6251 2.7583 2.3554
TN/TN0
1.0000 0.9945 0.9912 0.9823 0.9786 0.9700 0.9597
TN Change (%) 0.00% 0.00% 0.55% 0.88% 1.77% 2.14% 3.00% 4.03%
[H2O2]/[TOC]
3.67
[H2O2]/(TOCinxHRT)
7.33 3.67 2.44 1.83 1.47 1.22
900
m H2O2 (mg) 1260 TOC 0.3937 163.6918 146.0666 127.4692 113.1575 97.5334 84.8794 73.5083
V Distilled Water (mL) 1260 SD 0.0481 7.4853 6.2527 3.3747 6.588 1.6574 0.7566 0.2433
TOC/TOC0
1.0000 0.8923 0.7787 0.6913 0.5958 0.5185 0.4491
TOC removal (%) 0.00% 0.00% 10.77% 22.13% 30.87% 40.42% 48.15% 55.09%
TN 0.0204 36.2292 36.0641 35.653 35.48 35.42 34.8381 34.7872
SD 0.0037 3.2827 2.862 2.1929 3.3961 1.7362 2.6891 2.6898
TN/TN0
1.0000 0.9954 0.9841 0.9793 0.9777 0.9616 0.9602
TN Change (%) 0.00% 0.00% 0.46% 1.59% 2.07% 2.23% 3.84% 3.98%
[H2O2]/[TOC]
5.50
[H2O2]/(TOCinxHRT)
11.00 5.50 3.67 2.75 2.20 1.83
1200
m H2O2 (mg) 1680 TOC 0.3649 163.6946 138.4621 128.2274 113.4087 103.2957 89.8321 78.6498
V Distilled Water (mL) 1260 SD 0.0530 4.7491 5.3629 3.0035 2.952 2.4297 0.9795 0.2433
TOC/TOC0
1.0000 0.8459 0.7833 0.6928 0.6310 0.5488 0.4805
TOC removal (%) 0.00% 0.00% 15.41% 21.67% 30.72% 36.90% 45.12% 51.95%
TN 0.0388 42.9504 42.9383 42.5951 41.8654 40.9288 40.9206 40.7872
SD 0.0049 3.3682 3.5499 3.5455 2.7798 3.2706 1.8759 2.6898
TN/TN0
1.0000 0.9997 0.9917 0.9747 0.9529 0.9527 0.9496
TN Change (%) 0.00% 0.00% 0.03% 0.83% 2.53% 4.71% 4.73% 5.04%
[H2O2]/[TOC]
7.33
[H2O2]/(TOCinxHRT)
14.66 7.33 4.89 3.67 2.93 2.44
1500
m H2O2 (mg) 2100 TOC 0.3199 163.6949 145.7094 141.309 128.7489 117.4279 109.9103 98.9008
V Distilled Water (mL) 1260 SD 0.1460 4.2571 2.407 0.7325 0.3592 3.6086 2.6835 2.4337

206
Optimum H2O2 Dosage in the UV/H2O2 process V sln (mL) 1400
Slaughterhouse WW (%) 10 V sww (mL) 140 HRT (min)
H2O2 Dosage (mg/L) Parameter (mg/L) dw Inlet 30 60 90 120 150 180
TOC/TOC0
1.0000 0.8901 0.8632 0.7865 0.7174 0.6714 0.6042
TOC removal (%) 0.00% 0.00% 10.99% 13.68% 21.35% 28.26% 32.86% 39.58%
TN 0.0059 39.2642 38.0812 37.9143 37.7673 37.6885 37.5354 37.4503
SD 0.0239 1.1824 2.01 1.431 0.9946 3.6654 4.0569 4.4301
TN/TN0
1.0000 0.9699 0.9656 0.9619 0.9599 0.9560 0.9538
TN Change (%) 0.00% 0.00% 3.01% 3.44% 3.81% 4.01% 4.40% 4.62%
[H2O2]/[TOC]
9.16
[H2O2]/(TOCinxHRT)
18.33 9.16 6.11 4.58 3.67 3.05
2000
m H2O2 (mg) 2800 TOC 0.4015 163.6923 158.7729 155.0396 154.1321 140.52508 136.9603 136.799
V Distilled Water (mL) 1260 SD 0.2849 4.2162 2.943 2.84 3.9541 3.2802 2.0163 2.9217
TOC/TOC0
1.0000 0.9699 0.9471 0.9416 0.8585 0.8367 0.8357
TOC removal (%) 0.00% 0.00% 3.01% 5.29% 5.84% 14.15% 16.33% 16.43%
TN 0.0102 40.0242 39.7212 39.5277 39.356 38.8934 38.5018 38.2116
SD 0.0015 0.2588 0.1871 0.2875 0.2021 1.2633 1.3846 0.4478
TN/TN0
1.0000 0.9924 0.9876 0.9833 0.9717 0.9620 0.9547
TN Change (%) 0.00% 0.00% 0.76% 1.24% 1.67% 2.83% 3.80% 4.53%
[H2O2]/[TOC]
12.22
[H2O2]/(TOCinxHRT)
24.44 12.22 8.15 6.11 4.89 4.07
Optimum H2O2 Dosage in the UV/H2O2 process V sln (mL) 1400
Slaughterhouse WW (%) 25 V sww (mL) 350 HRT (min)
H2O2 Dosage (mg/L) Parameter (mg/L) dw Inlet 30 60 90 120 150 180
0
m H2O2 (mg) 0 TOC 1.6557 349.8443 349.5167 346.8376 341.9938 336.522 335.4213 333.9472
V Distilled Water (mL) 1050 SD 0.4234 13.9950 12.62 13.252 6.6848 8.9175 8.8915 16.649
TOC/TOC0
1.0000 0.9991 0.9914 0.9776 0.9619 0.9588 0.9546
TOC removal (%) 0.00% 0.00% 0.09% 0.86% 2.24% 3.81% 4.12% 4.54%
TN 0.0543 61.6381 61.5705 61.1039 60.7614 60.4364 60.0095 59.7008
SD 0.0432 4.0668 1.9383 4.8265 2.2845 4.4559 6.3232 5.0482
TN/TN0
1.0000 0.9989 0.9913 0.9858 0.9805 0.9736 0.9686
TN Change (%) 0.00% 0.00% 0.11% 0.87% 1.42% 1.95% 2.64% 3.14%
[H2O2]/[TOC]
0.00
[H2O2]/(TOCinxHRT)
0.00 0.00 0.00 0.00 0.00 0.00
100
m H2O2 (mg) 140 TOC 4.2884 349.8411 348.4553 346.4201 342.7185 337.8742 336.1836 327.7204
V Distilled Water (mL) 1050 SD 2.9827 17.6220 16.904 20.258 12.451 18.429 15.021 17.494
TOC/TOC0
1.0000 0.9960 0.9902 0.9796 0.9658 0.9610 0.9368
TOC removal (%) 0.00% 0.00% 0.40% 0.98% 2.04% 3.42% 3.90% 6.32%
TN 0.0497 74.3675 73.1756 72.5167 71.1686 70.6972 70.6734 70.0148

207
Optimum H2O2 Dosage in the UV/H2O2 process V sln (mL) 1400
Slaughterhouse WW (%) 25 V sww (mL) 350 HRT (min)
H2O2 Dosage (mg/L) Parameter (mg/L) dw Inlet 30 60 90 120 150 180
SD 0.0012 1.5100 5.2891 5.0212 3.3433 0.9933 8.5419 4.5883
TN/TN0
1.0000 0.9840 0.9751 0.9570 0.9506 0.9503 0.9415
TN Change (%) 0.00% 0.00% 1.60% 2.49% 4.30% 4.94% 4.97% 5.85%
[H2O2]/[TOC]
0.29
[H2O2]/(TOCinxHRT)
0.57 0.29 0.19 0.14 0.11 0.10
300
m H2O2 (mg) 420 TOC 1.6431 349.8427 336.4419 333.3634 330.9912 325.8514 316.1888 315.0332
V Distilled Water (mL) 1050 SD 0.0559 17.9241 26.172 23.4321 0.4875 19.4917 13.6321 13.4115
TOC/TOC0
1.0000 0.9617 0.9529 0.9461 0.9314 0.9038 0.9005
TOC removal (%) 0.00% 0.00% 3.83% 4.71% 5.39% 6.86% 9.62% 9.95%
TN 0.0306 72.6251 72.3155 72.2175 70.6664 69.9098 69.0482 68.2953
SD 0.0027 5.0380 5.5156 7.5996 4.8989 4.5144 5.6787 5.1128
TN/TN0
1.0000 0.9957 0.9944 0.9730 0.9626 0.9507 0.9404
TN Change (%) 0.00% 0.00% 0.43% 0.56% 2.70% 3.74% 4.93% 5.96%
[H2O2]/[TOC]
0.86
[H2O2]/(TOCinxHRT)
1.72 0.86 0.57 0.43 0.34 0.29
600
m H2O2 (mg) 840 TOC 0.3863 349.8389 348.7115 332.358 312.272 306.8418 302.2664 298.1659
V Distilled Water (mL) 1050 SD 0.0274 2.6704 19792 2.1623 3.2609 2.4531 2.6767 0.3585
TOC/TOC0
1.0000 0.9968 0.9500 0.8926 0.8771 0.8640 0.8523
TOC removal (%) 0.00% 0.00% 0.32% 5.00% 10.74% 12.29% 13.60% 14.77%
TN 0.0083 113.4200 112.914 111.27 110.334 108.319 107.898 107.275
SD 0.0085 4.0811 0.8786 1.2365 1.256 1.4943 1.2049 0.4066
TN/TN0
1.0000 0.9955 0.9810 0.9728 0.9550 0.9513 0.9458
TN Change (%) 0.00% 0.00% 0.45% 1.90% 2.72% 4.50% 4.87% 5.42%
[H2O2]/[TOC]
1.72
[H2O2]/(TOCinxHRT)
3.43 1.72 1.14 0.86 0.69 0.57
900
m H2O2 (mg) 1260 TOC 0.3469 349.8393 346.8428 343.778 336.9154 326.933 301.613 283.3343
V Distilled Water (mL) 1050 SD 0.0681 3.7327 2.022 2.2931 1.7084 2.6565 1.8778 1.7784
TOC/TOC0
1.0000 0.9914 0.9827 0.9631 0.9345 0.8621 0.8099
TOC removal (%) 0.00% 0.00% 0.86% 1.73% 3.69% 6.55% 13.79% 19.01%
TN 0.0110 111.4290 110.128 108.166 107.759 106.646 105.98 104.7991
SD 0.0027 0.9575 1.0278 0.9873 0.6779 0.7238 1.0256 0.6821
TN/TN0
1.0000 0.9883 0.9707 0.9671 0.9571 0.9511 0.9405
TN Change (%) 0.00% 0.00% 1.17% 2.93% 3.29% 4.29% 4.89% 5.95%
[H2O2]/[TOC]
2.57
[H2O2]/(TOCinxHRT)
5.15 2.57 1.72 1.29 1.03 0.86
1200
m H2O2 (mg) 1680 TOC 1.2265 349.8442 345.2325 342.5441 331.5783 324.9635 318.5033 267.616
V Distilled Water (mL) 1050 SD 0.0886 9.5327 1.948 2.2193 4.6672 4.2282 3.6242 2.5053

208
Optimum H2O2 Dosage in the UV/H2O2 process V sln (mL) 1400
Slaughterhouse WW (%) 25 V sww (mL) 350 HRT (min)
H2O2 Dosage (mg/L) Parameter (mg/L) dw Inlet 30 60 90 120 150 180
TOC/TOC0
1.0000 0.9868 0.9791 0.9478 0.9289 0.9104 0.7650
TOC removal (%) 0.00% 0.00% 1.32% 2.09% 5.22% 7.11% 8.96% 23.50%
TN 0.0856 107.9430 106.9074 106.4394 105.4304 104.1949 103.4741 102.9584
SD 0.0025 2.0639 1.4994 2.213 3.2364 2.6889 3.4585 2.1362
TN/TN0
1.0000 0.9904 0.9861 0.9767 0.9653 0.9586 0.9538
TN Change (%) 0.00% 0.00% 0.96% 1.39% 2.33% 3.47% 4.14% 4.62%
[H2O2]/[TOC]
3.43
[H2O2]/(TOCinxHRT)
6.86 3.43 2.29 1.72 1.37 1.14
1500
m H2O2 (mg) 2100 TOC 0.2490 349.8422 347.4996 346.0875 344.9723 341.9518 330.7287 290.0434
V Distilled Water (mL) 1050 SD 0.0055 1.1366 6.0903 5.8592 2.3846 0.5781 1.616 3.9513
TOC/TOC0
1.0000 0.9933 0.9893 0.9861 0.9774 0.9454 0.8291
TOC removal (%) 0.00% 0.00% 0.67% 1.07% 1.39% 2.26% 5.46% 17.09%
TN 0.0230 98.6301 97.7744 96.4157 95.1634 94.0978 93.818 92.7965
SD 0.0007 2.4716 2.9493 1.7532 1.2818 1.6925 1.6997 3.1472
TN/TN0
1.0000 0.9913 0.9775 0.9649 0.9540 0.9512 0.9409
TN Change (%) 0.00% 0.00% 0.87% 2.25% 3.51% 4.60% 4.88% 5.91%
[H2O2]/[TOC]
4.29
[H2O2]/(TOCinxHRT)
8.58 4.29 2.86 2.14 1.72 1.43
2000
m H2O2 (mg) 2800 TOC 0.2279 349.8415 346.5791 343.3765 341.8818 340.99 335.1191 330.0051
V Distilled Water (mL) 1050 SD 0.0352 5.7086 3.3289 6.2872 6.1553 5.6319 1.6076 4.5845
TOC/TOC0
1.0000 0.9907 0.9815 0.9772 0.9747 0.9579 0.9433
TOC removal (%) 0.00% 0.00% 0.93% 1.85% 2.28% 2.53% 4.21% 5.67%
TN 0.0135 93.9385 93.1295 92.05225 91.29675 90.401 89.468 88.3123
SD 0.0033 1.8904 1.6859 2.6718 2.1883 2.6227 2.2951 3.3716
TN/TN0
1.0000 0.9914 0.9799 0.9719 0.9623 0.9524 0.9401
TN Change (%) 0.00% 0.00% 0.86% 2.01% 2.81% 3.77% 4.76% 5.99%
[H2O2]/[TOC]
5.72
[H2O2]/(TOCinxHRT)
11.43 5.72 3.81 2.86 2.29 1.91

209
Table E.10. Kinetic modeling for the different processes.
ABR process alone modeling
S0 1008.8495 mg/L S1 578.6266 mg/L S2 420.5742 mg/L S3 332.9334 mg/L S4 270.5846 mg/L
S1 578.6266 mg/L S2 420.5742 mg/L S3 332.9334 mg/L S4 270.5846 mg/L S5 106.2775 mg/L
X1 13325 mg/L X2 11550 mg/L X3 16150 mg/L X4 10600 mg/L X5 11833 mg/L
V1 6.74 L V2 6.74 L V3 6.74 L V4 6.74 L V5 6.74 L
t 7 d t 7 d t 7 d t 7 d t 7 d
V 33.7 L V 33.7 L V 33.7 L V 33.7 L V 33.7 L
kC1 3.9857E-05
kC2 2.3241E-05
kC3 1.1643E-05
kC4 1.5527E-05
kC5 9.3321E-05
8.98E+04 0.1062
7.78E+04 0.0537
1.09E+05 0.0376
7.14E+04 0.0329
7.98E+04 0.2209
S1m 578.6266
S2m 420.5742
S3m 332.9334
S4m 270.5846
S5m 106.2775
ABR Process Alone
HRT (d) S0 (mg/L) Sf Experiments (mg/L) Sf Model (mg/L) % TOC removal Experiments % TOC removal Model Error
2 733.42 312.98 330.62 57.33% 54.92% 0.06%
3 1008.85 208.73 324.14 79.31% 67.87% 1.31%
5 639.44 104.61 113.09 83.64% 82.31% 0.02%
5 733.42 129.97 129.71 82.28% 82.31% 0.00%
7 1008.85 106.28 106.28 89.47% 89.47% 0.00%
7 183.35 29.24 19.32 84.06% 89.47% 0.29%
7 366.71 57.85 38.63 84.23% 89.47% 0.27%
7 639.44 80.45 67.36 87.42% 89.47% 0.04%
7 733.42 88.43 77.26 87.94% 89.47% 0.02%
8 639.44 71.09 53.18 88.88% 91.68% 0.08%
Σ Error 2.10%

210
Aerobic AS process alone modeling
S0 1008.8495 mg/L
Sf 55.2232 mg/L
X 2399 mg/L
t 7 d
K 1.0283E-03
2.4669
Aerobic AS Process Alone
HRT (d) S0 (mg/L) Sf Experiments (mg/L) Sf Model (mg/L) % TOC removal Experiments % TOC removal Model Error
7 183.35 14.48 10.04 92.10% 94.53% 0.06%
7 366.71 28.19 20.07 92.31% 94.53% 0.05%
5 639.44 66.14 47.95 89.66% 92.50% 0.08%
7 639.44 46.94 35.00 92.66% 94.53% 0.03%
8 639.44 36.71 30.84 94.26% 95.18% 0.01%
2 733.42 143.00 123.60 80.50% 83.15% 0.07%
5 733.42 41.70 55.00 94.31% 92.50% 0.03%
7 733.42 40.78 40.15 94.44% 94.53% 0.00%
3 1008.85 84.08 120.09 91.67% 88.10% 0.13%
7 1008.85 55.22 55.22 94.53% 94.53% 0.00%
Σ Error 0.46%
UV/H2O2 process alone modeling
p 14 W
ξ 6.8418E-09 mol/s.W
S0 64.8819 mg/L
Sf 16.0794 mg/L
t 10800 s
VT 1.35 L

211
H2O2 900 mg/L
Sf/So 0.2478
KH2O2 1
KTOC 112.6694556
Sf/So model 0.177864833
Error 5E-03
Sf 11.54020831
7.9941E-06
UV/H2O2 Process Alone
HRT (s) S0 (mg/L) Sf Experiments (mg/L) Sf Model (mg/L) % TOC removal Experiments % TOC removal Model Error
1800 64.88 46.72 48.66 27.99% 25.01% 0.09%
3600 64.88 32.81 36.49 49.43% 43.76% 0.32%
5400 64.88 30.45 27.36 53.07% 57.83% 0.23%
7200 64.88 19.74 20.52 69.58% 68.37% 0.01%
9000 64.88 17.64 15.39 72.81% 76.28% 0.12%
10800 64.88 16.08 11.54 75.22% 82.21% 0.49%
Σ Error 0.77%

212
Combined Anaerobic-Aerobic Processes modeling
S0 1008.8495 mg/L S1 462.2498 mg/L S2 396.8390 mg/L S3 338.2224 mg/L S4 306.1535 mg/L S0 162.7555 mg/L
S1 462.2498 mg/L S2 396.839 mg/L S3 338.2224 mg/L S4 306.1535 mg/L S5 162.7555 mg/L Sf 36.6972 mg/L
X1 13325 mg/L X2 11550 mg/L X3 16150 mg/L X4 10600 mg/L X5 11833 mg/L X 2399 mg/L
V1 6.74 L V2 6.74 L V3 6.74 L V4 6.74 L V5 6.74 L t 6.24 d
t 6.24 d t 6.24 d t 6.24 d t 6.24 d t 6.24 d K 2.29E-04
V 45.7 L V 45.7 L V 45.7 L V 45.7 L V 45.7 L
0.5505
kC1 9.64E-05
kC2 1.55E-05
kC3 1.17E-05
kC4 1.07E-05
kC5 8.09E-05
Sfm 36.6972
8.98E+04 0.1895
7.78E+04 0.0264
1.09E+05 0.0278
7.14E+04 0.0168
7.98E+04 0.1412
S1m 36.6972
S1m 462.2498
S2m 396.8390
S3m 338.2224
S4m 306.1535
S5m 162.7555
S1m 462.2498
S1m 396.8390
S1m 338.2224
S1m 306.1535
S1m 162.7555
Combined Anaerobic-Aerobic Processes
HRT (d) S0 (mg/L) Sf Experiments (mg/L) Sf Model (mg/L) % TOC removal Experiments % TOC removal Model Error
3.12 1008.85 69.10 130.84 93.15% 87.03% 0.37%
6.24 1008.85 36.70 36.70 96.36% 96.36% 0.00%
4.68 1008.85 79.63 65.74 92.11% 93.48% 0.02%
9.36 1008.85 37.23 14.00 96.31% 98.61% 0.05%
2.08 1008.85 213.24 225.80 78.86% 77.62% 0.02%
Σ Error 0.46%
Combined Aerobic-Anaerobic Processes modeling
S0 1008.8495 mg/L S0 168.8271 mg/L S1 151.3520 mg/L S2 149.4387 mg/L S3 100.3359 mg/L S4 60.5536 mg/L
Sf 168.8271 mg/L S1 151.3520 mg/L S2 149.4387 mg/L S3 100.3359 mg/L S4 60.5536 mg/L S5 39.3044 mg/L
X 2399 mg/L X1 13325 mg/L X2 11550 mg/L X3 16150 mg/L X4 10600 mg/L X5 11833 mg/L
t 6.24 d V1 6.74 L V2 6.74 L V3 6.74 L V4 6.74 L V5 6.74 L
K 3.32E-04
t 6.24 d t 6.24 d t 6.24 d t 6.24 d t 6.24 d
0.7974
V 45.7 L V 45.7 L V 45.7 L V 45.7 L V 45.7 L
kC1 9.42E-06
kC2 1.20E-06
kC3 3.29E-05
kC4 6.73E-05
kC5 4.96E-05
8.98E+04 0.0185
7.78E+04 0.0021
1.09E+05 0.0784
7.14E+04 0.1053
7.98E+04 0.0866

213
S1m 151.3520
S2m 149.4387
S3m 100.3359
S4m 60.5536
S5m 39.3044
Combined Aerobic-Anaerobic Processes
HRT (d) S0 (mg/L) Sf Experiments (mg/L) Sf Model (mg/L) % TOC removal Experiments % TOC removal Model Error
3.12 1008.85 140.79 129.36 86.04% 87.18% 0.01%
6.24 1008.85 39.30 39.30 96.10% 96.10% 0.00%
4.68 1008.85 57.16 67.76 94.33% 93.28% 0.01%
9.36 1008.85 39.51 15.99 96.08% 98.42% 0.05%
2.08 1008.85 235.32 217.44 76.67% 78.45% 0.03%
Σ Error 0.11%
Combined Anaerobic-Aerobic UV/H2O2 Processes modeling
S0 1004.8855 mg/L S1 454.5485 mg/L S2 295.8308 mg/L S3 214.4315 mg/L S4 180.8297 mg/L S0 153.6721 mg/L p 14 W
S1 454.5485 mg/L S2 295.8308 mg/L S3 214.4315 mg/L S4 180.8297 mg/L S5 153.6721 mg/L Sf 81.7164 mg/L ξ 6.8418E-09 mol/s.W
X1 13325 mg/L X2 11550 mg/L X3 16150 mg/L X4 10600 mg/L X5 11833 mg/L X 2399 mg/L S0 81.7164 mg/L 99.79%
V1 6.74 L V2 6.74 L V3 6.74 L V4 6.74 L V5 6.74 L t 4.00 d Sf 0.1682 mg/L
t 4.00 d t 4.00 d t 4.00 d t 4.00 d t 4.00 d K 9.18E-05
t 4.00 d 5760
V 47.05 L V 47.05 L V 47.05 L V 47.05 L V 47.05 L
0.2201
VT 47.05 L
kC1 1.59E-04
kC2 8.11E-05
kC3 4.10E-05
kC4 3.06E-05
kC5 2.61E-05
H2O2 900 mg/L 0.05 mol/L
8.98E+04 0.3027
7.78E+04 0.1341
1.09E+05 0.0949
7.14E+04 0.0465
7.98E+04 0.0442
Sf/So 0.0021
S1m 454.5485
S2m 295.8308
S3m 214.4315
S4m 180.8297
S5m 153.6721
KH2O2 1
KTOC 1.34E+04
Sf/So model 0.043121112 0.0393
Error 2E-03
Sf 81.53819506
2.7289E-05
Combined Anaerobic-Aerobic UV/H2O2 Processes
HRT (d) S0 (mg/L) Sf Experiments (mg/L) Sf Model (mg/L) % TOC removal Experiments % TOC removal Model Error
3.15 941.19 10.3053 9.9170 98.91% 98.95% 0.00%
3.50 1006.90 8.1433 6.7132 99.19% 99.33% 0.00%
4.00 1004.89 0.1682 3.5237 99.98% 99.65% 0.00%
7.00 1008.85 0.2234 0.0928 99.98% 99.99% 0.00%
2.50 1000.46 26.1234 25.1472 97.39% 97.49% 0.00%
Σ Error 0.00%

214
Table E.11. Maximum TOC and TN removals using UV/H2O2 process alone.
% TOC Removal % TN Removal
[H2O2] (mg/L) SWW at 5% SWW at 10% SWW at 25% SWW at 5% SWW at 10% SWW at 25%
0 6.96% 6.43% 4.54% 3.14% 4.43% 3.14%
100 38.59% 17.25% 6.32% 5.85% 4.47% 5.85%
300 56.45% 34.37% 9.95% 3.59% 4.49% 5.96%
600 70.87% 49.44% 14.77% 4.35% 4.03% 5.42%
900 75.22% 55.09% 19.01% 3.26% 3.98% 5.95%
1200 69.52% 51.95% 23.50% 4.50% 5.04% 4.62%
1500 61.46% 39.58% 17.09% 4.37% 4.62% 5.91%
2000 37.06% 16.43% 5.67% 4.45% 4.53% 5.99%
Figure E.1. Optimum TOC removal by using UV/H2O2 process alone.
0.00%
10.00%
20.00%
30.00%
40.00%
50.00%
60.00%
70.00%
80.00%
90.00%
100.00%
0 100 300 600 900 1200 1500 2000
TO
C R
emoval
(%)
[H2O2] (mg/L)
TOCin = 64.88 mg/L (SWW at 5%)
TOCin = 163.69 mg/L (SWW at 10%)
TOCin = 349.84 mg/L (SWW at 25%)

215
Figure E.2. Optimal Concentration of H2O2 for TOC removal of an influent concentration of
64.88mg/L.
Figure E.3. Relation of molar ratio of [H2O2]/[TOC] for an influent concentration of 64.88mg/L.
0.00%
10.00%
20.00%
30.00%
40.00%
50.00%
60.00%
70.00%
80.00%
0 250 500 750 1000 1250 1500 1750 2000 2250
TO
C R
emoval
(%)
[H2O2] (mg/L)
0.00%
10.00%
20.00%
30.00%
40.00%
50.00%
60.00%
70.00%
80.00%
0.00 5.00 10.00 15.00 20.00 25.00 30.00 35.00
TO
C R
emoval
(%)
[H2O2]/[TOC]

216
Figure E.4. Optimal Concentration of H2O2 for TOC removal of an influent concentration of
163.69mg/L.
Figure E.5. Relation of molar ratio of [H2O2]/[TOC] for an influent concentration of
163.69mg/L.
0.00%
10.00%
20.00%
30.00%
40.00%
50.00%
60.00%
0 500 1000 1500 2000 2500
TO
C R
emoval
(%)
[H2O2] (mg/L)
0.00%
10.00%
20.00%
30.00%
40.00%
50.00%
60.00%
0.00 2.00 4.00 6.00 8.00 10.00 12.00 14.00
TO
C R
emoval
(%)
[H2O2]/[TOC]

217
Figure E.6. Optimal Concentration of H2O2 for TOC removal of an influent concentration of
349.84mg/L.
Figure E.7. Relation of molar ratio of [H2O2]/[TOC] for an influent concentration of
349.84mg/L.
0.00%
5.00%
10.00%
15.00%
20.00%
25.00%
0 500 1000 1500 2000 2500
TO
C R
emov
al
(%)
[H2O2] (mg/L)
0.00%
5.00%
10.00%
15.00%
20.00%
25.00%
0.00 1.00 2.00 3.00 4.00 5.00 6.00 7.00
TO
C R
emoval
(%)
[H2O2]/[TOC]

218
REFERENCES
Abramović, B., Banić, N., and Šojić, D. (2010). Degradation of thiacloprid in aqueous solution by UV
and UV/H2O2 treatments. Chemosphere, 81 (1), 114-119.
Adams, C., Scanlon, P., and Secrist, N. (1994). Oxidation and biodegradability enhancement of 1, 4-
Dioxane using hydrogen peroxide and ozone. Environ. Sci. Tech. 28 (11), 1812–1808.
Adams, C., Spitzer, S., and Cowan, R. (1996). Biodegradation of non-ionic surfactants and effects of
oxidative pre-treatment. J. Environ. Eng. 122, 477–483.
Afzal, A., Oppenländer, T., Bolton, J., and El-Din, M. (2010). Anatoxin-a degradation by Advanced
Oxidation Processes: Vacuum-UV at 172 nm, photolysis using medium pressure UV and
UV/H2O2. Water Res., 44 (1), 278-286.
Agdag, O., and Sponza, D. (2005). Anaerobic/aerobic treatment of municipal landfill leachate in
sequential two-stage up-flow anaerobic sludge blanket reactor (UASB)/completely stirred tank
reactor (CSTR) systems. Process Biochem. 40, 895–902.
Aggelis, G., Gavala, H., and Lyberatos, G. (2001). Combined, separate aerobic and anaerobic
biotreatment of green olive debittering wastewater. J. Agr. Eng. Res. 80, 283–292.
Ahn, Y., Kang, S., Chae, S., Lee, C., Bae, B., and Shin, H. (2007). Simultaneous high-strength
organic and nitrogen removal with combined anaerobic upflow bed filter and aerobic
membrane bioreactor. Desalination 202, 114-121.
Akunna, J., and Clark, M. (2000). Performance of a granular-bed anaerobic baffled reactor
(GRABBR) treating whisky distillery wastewater. Bioresource Technol., 74 (3), 257-261.
Al-Mutairi, N., Al-Sharifi, F.A., and Al-Shammari, S. (2008). Evaluation study of a slaughterhouse
wastewater treatment plant including contact-assisted activated sludge and DAF. Desalination
225, 167-175.
Amit, S., and Rupali, G. (2004). Developments in wastewater treatment methods. Desalination, 167,
55–63.
APHA. (1998). Standards Methods for the Examination of Water and Wastewater. Washington D.C.:
American Water Association, Water Environment Federation.

219
Arslan-Alaton, I., Cokgor, E., and Koban, B. (2007). Integrated photochemical and biological
treatment of a commercial textile surfactant: Process optimization, process kinetics and COD
fractionation. J. Hazard. Mater., 146 (3), 453-458.
Artanto, Y., McDonnell, E., Verheyen, T., Adeloju, S., and Chaffee, A. (2009). The remediation of
MTE water by combined anaerobic digestion and chemical treatment. Fuel, 88 (9), 1786-
1792.
Asano, T., Burton, F., and and Leverenz, H. (2007). Water Reuse: Issues, Technologies and
Applications. New York, NY: McGraw-Hill Professional.
Assalin, M., Almeida, E., and Duran, N. (2009). Combined system of activated sludge and ozonation
for the treatment of Kraft e1 effluent. Int. J. Environ. Res. Publ. Health., 6 (3), 1145-1154.
Aye, T., Anderson, W., and Mehrvar, M. (2003). Photocatalytic treatment of cibacron brilliant yellow
3G-P(reactive yellow 2 textile dye). J. Environ. Sci. Health Part A 38, 1903–1914.
Aye, T., Mehrvar, M., and Anderson, W. (2004). Effects of photocatalysis on the biodegradability of
cibacron brilliant yellow 3G-P (reactive yellow 2). J. Environ. Sci. Health Part A 39, 113–
126.
Baeza, C., Rossner, A., Jardim, W., Litter, M., and Mansilla, H. (2003). Removal of EDTA by UV-
C/hydrogen peroxide. Environ. Technol., 24 (10), 1277-1281.
Balcioglu, I., Arslan, I., and Sacan, M. (2001). Homogeneous and heterogeneous advanced oxidation
of two commercial reactive dyes. Environ. Technol. 22, 813–822.
Balcioǧlu, I., Saraç, C., Kivilcimdan, C., and Tarlan, E. (2006). Application of ozonation and
biotreatment for forest industry wastewater. Ozone Sci. Eng., 28 (6), 431-436.
Barber, W. P., and Stuckey, D. C. (1999). The use of the anaerobic baffled reactor (ABR) for
wastewater treatment: a review. Water Res. 33, 1559-1578.
Barrera, M. (2011). Photochemical treatment of organic constituents and bacterial pathogens from
synthetic slaughterhouse wastewater by combining Vacuum-UV and UV-C. Toronto: Ryerson
University.
Barrera, M., Mehrvar, M., Gilbride, K., McCarthy, L., Laursen, A., Bostan, V., et al. (2011).
Photolytic treatment of organic constituents and bacterial pathogens in secondary effluent of
synthetic slaughterhouse wastewater. Chem. Eng. Res. Des., Article in Press.
Barreto-Rodrigues, M. S. (2009). Combined photocatalytic and fungal processes for the treatment of
nitrocellulose industry wastewater. J. Hazard. Mater., 161 (2-3), 1569-1573.
Baruth, B. (2005). Water Treatment Plant Design (4th ed.). New York, NY: McGraw-Hill.

220
BC MOE. (2010). Code of Practice for the Slaughter and Poultry Processing Industries. Vancouver:
British Columbia Ministry of Environment (BC MOE).
Bell, J., and Buckley, C. (2003). Treatment of a textile dye in the anaerobic baffled reactor. Water SA,
29 (2), 129-134.
Belsky, A. J., Matzke, A., and Uselman, S. (1999). Survey of livestock influences on stream and
riparian ecosystems in the western United States. J. Soil Water Conserv. 54, 419-431.
Beltrán, F., Ovejero, G., and Acedo, B. (1993). Oxidation of atrazine in water by ultraviolet radiation
combined with hydrogen peroxide. Water Res. 27, 1013–1021.
Ben, W., Qiang, Z., Pan, X., and Chen, M. (2009). Removal of veterinary antibiotics from sequencing
batch reactor (SBR) pretreated swine wastewater by Fenton's reagent. Water Res., 43 (17),
4392-4402.
Benitez, F., Acero, J., Garcia, J., and Leal, A. (2003b). Purification of cork processing wastewaters by
ozone, by activated sludge, and by their two sequential applications. Water Res., 37 (17),
4081-4090.
Benitez, F., Real, F., Acero, J., Garcia, J., and Sanchez, M. (2003a). Kinetics of the ozonation and
aerobic biodegradation of wine vinasses in discontinuous and continuous processes. J.
Hazard. Mater., 101 (2), 203-218.
Benka-Coker, M. O., and Ojior, O. O. (1995). Effect of slaughterhouse wastes on the water quality of
Ikpoba River, Nigeria. Bioresour. Technol. 52, 5-12.
Bhatkhande, D., Pangarkar, V., and Beenackers, A. (2002). Photocatalytic degradation for
environmental applications: a review. J. Chem. Technol. Biotechnol. 77, 102–116.
Bielski, B. H., Cabelli, D. E., and Arudi, R. L. (1985). Reactivity of HO2/O2- Radicals in Aqueous
Solution. J. Phys. Chem. Ref., 14 (4), 1041-1100.
Bijan, L., and Mohseni, M. (2005). Integrated ozone and biotreatment of pulp mill effluent and
changes in biodegradability and molecular weight distribution of organic compounds. Water
Res., 39 (16), 3763-3772.
Black, and Veatch. (2010). White's handbook of chlorination and alternative disinfectants (5th ed.).
Hoboken, New Jersey: John Wiley and Sons.
Bodík, I., Kratochvíl, K., Gašpariková, E., and Hutan, M. (2003). Nitrogen removal in an anaerobic
baffled filter reactor with aerobic post-treatment. Bioresource Technol., 86 (1), 79-84.
Bolton, J., and Cotton, C. (2008). The ultraviolet disinfection handbook (1st ed.). Denver, TX:
American Water Works Association (AWWA).

221
Bolton, J., Bircher, K., Tumas, W., and Tolman, C. (2001). Figures-of-merit for the technical
development and application of advanced oxidation technologies for both electric- and solar-
driven systems. Pure Appl. Chem., 73 (4), 627-637.
Boopathy, R. (1998). Biological treatment of swine waste using anaerobic baffled reactors.
Bioresource Technol., 64 (1), 1-6.
Borja, R., Banks, C., and Wang, Z. (1995a). Performance of a hybrid anaerobic reactor, combining a
sludge blanket and a filter, treating slaughterhouse wastewater. Appl. Microbiol. Biotechnol.,
43 (2), 351-357.
Borja, R., Banks, C., and Wang, Z. (1995b). Effect of organic loading rate on anaerobic treatment of
slaughterhouse wastewater in a fluidised-bed reactor. Bioresource Technol., 52 (2), 157-162.
Bowers, A., Gaddipati, P., Eckenfelder, J., and Monsen, R. (1989). Treatment of toxic or refractory
wastewater with hydrogen peroxide. Water Sci. Technol., 477–486.
Brown, N. J. (1997). Health Hazard Manual: Wastewater Treatment Plant and Sewer Workers.
Buffalo, NY: Cornell University ILR School.
Bull, M., Sterritt, R., and Lester, J. (1982). The treatment of wastewaters from the meat industry: A
review. Environmental Technology Letters 3, 117-126.
Buxton, G. V., Greenstock, C. L., Helman, W. P., and Ross, A. B. (1988). Critical Review of rate
constants for reactions of hydrated electrons, hydrogen atoms and hydroxyl radicals (⋅OH/⋅O−
in Aqueous Solution. J. Phys. Chem. Ref. Data 17, 513, 513-887.
Cakir, F., and Stenstrom, M. (2005). Greenhouse gas production: a comparison between aerobic and
anaerobic wastewater treatment technology. Water Res. 39, 4197–4203.
Camin, K. (1970). Cost of waste treatment in the meat packing industry. Proceedings of the 25th
Industrial Waste Conference (pp. 193-202). Ann Arbor, MI: Ann Arbor Science.
Cao, W. (2009). Combined anaerobic baffled reactor and UV/H2O2 process for the treatment of
synthetic slaughterhouse wastewater. Toronto: Ryerson University.
Cao, W., and Mehrvar, M. (2011). Slaughterhouse wastewater treatment by combined anaerobic
baffled reactor and UV/H2O2 processes. Chem. Eng. Res. Des., 89 (7), 1136-1143.
Carey, J. (1990). An introduction to advanced oxidation processes (AOP) for destruction of organics
in wastewater. Proceedings of the Symposium on Advanced Oxidation Process for
Contaminated Water and Air. Toronto.
Cassidy, D., and Belia, E. (2005). Nitrogen and phosphorus removal from an abattoir wastewater in a
SBR with aerobic granular sludge. Water Res., 39 (19), 4817-4823.

222
Castillo, A., Llabres, P., and Mata-Alvarez, J. (1999). A kinetic study of a combined anaerobic–
aerobic system for treatment of domestic sewage. Water Res. 33, 1742–1747.
Cater, S., Stefan, M., Bolton, J., and Safarzadeh-Amiri, A. (2000). UV/H2O2 treatment of methyl t-
butyl ether in contaminated waters. Environ. Sci. Tech. 34, 659–662.
CEC. (1991). Urban Wastewater Treatment Directive 91/271/EEC, Council of the European
Communities (CEC). Off. J. Eur. Comm. 30. 5. 91, L 135/40-52.
Cervantes, F., Pavlostathis, S., and Haandel, A. v. (2006). Advanced Biological Treatment Processes
for Industrial Wastewaters: Principles and Applications. London, UK: IWA Publishing.
Chan, Y. J., Chong, M. F., Law, C. L., and Hassell, D. (2009). A review on anaerobic-aerobic
treatment of industrial and municipal wastewater. Chem. Eng. J. 155, 1-18.
Chelikani, P., Fita, I., and Loewen, P. (2004). Diversity of structures and properties among catalases.
Cell. Mol. Life Sci., 61 (2), 192-208.
Chen, C.-Y., Wu, P.-S., and Chung, Y.-C. (2009). Coupled biological and photo-Fenton pretreatment
system for the removal of di-(2-ethylhexyl) phthalate (DEHP) from water. Bioresource
Technol., 100 (19), 4531-4534.
Chen, H. (2004). ATP content and biomass activity in sequential anaerobic/aerobic reactors. J.
Zhejiang Univ. Sci. 5, 727–732.
Chen, K.-C., and Lin, Y.-F. (1993). The relationship between denitrifying bacteria and methanogenic
bacteria in a mixed culture system of acclimated sludges. Water Res., 27 (12), 1749-1759.
Chernicharo, C. (2006). Post-treatment options for the anaerobic treatment of domestic wastewater.
Review. Environ. Sci. Biotechnol. 5, 73-92.
Christensen, H., Sehested, K., and Corfitzen, H. (1982). Reactions of hydroxyl radicals with hydrogen
peroxide at ambient and elevated temperatures. J. Phys. Chem., 86 (9), 1588-1590.
Clarke, N., and Knowles, G. (1982). High purity water using H2O2 and UV radiation. Effluent Water
Treat. J., 335–341.
Comninellis, C., Kapalka, A., Malato, S., Parsons, S., Poulios, I., and Mantzavinos, D. (2008).
Perspective - Advanced Oxidation Processes for water treatment: advances and trends for
R&D. J. Chem. Technol. Biotechnol. 83, 769–776.
Crittenden, J., Hu, S., Hand, D., and Green, S. (1999). A kinetic model for H2O2/UV process in a
completely mixed batch reactor. Water Res. 33, 2315-2328.
De Morais, J., and Zamora, P. (2005). Use of advanced oxidation processes to improve the
biodegradability of mature landfill leachates. J. Hazard. Mater. 123, 181–186.

223
de Sena, R., Tambosi, J., Genena, A., Moreira, R., Schröder, H., and José, H. (2009). Treatment of
meat industry wastewater using dissolved air flotation and advanced oxidation processes
monitored by GC-MS and LC-MS. Chem. Eng. J., 152 (1), 151-157.
Debik, E., and Coskun, T. (2009). Use of the Static Granular Bed Reactor (SGBR) with anaerobic
sludge to treat poultry slaughterhouse wastewater and kinetic modeling. Bioresour. Technol.
100 (11), 2777-2782.
Del Pozo, and Diez, V. (2003). Organic matter removal in combined anaerobic–aerobic fixed-film
bioreactors. Water Res. 37, 3561–3568.
del Pozo, R. D. (2000). Anaerobic pre-treatment of slaughterhouse wastewater using fixed-film
reactors. Bioresource Technol., 71 (2), 143-149.
Del Pozo, R., and Diez, V. (2005). Integrated anaerobic-aerobic fixed-film reactor for slaughterhouse
wastewater treatment. Water Res. 39, 1114-1122.
Del Pozo, R., Taş, D., Dulkadiroǧlu, H., Orhon, D., and Diez, V. (2003). Biodegradability of
slaughterhouse wastewater with high blood content under anaerobic and aerobic conditions. J.
Chem. Technol. Biotechnol., 78 (4), 384-391.
Devipriyas, S., and Yesodharan, S. (2005). Photocatalytic degradation of pesticide contaminants in
water. Sol. Energy Mater. Sol. Cells 86, 309–348.
Di Iaconi, C., Lopez, A., Ramadori, R., Di Pinto, A., and Passino, R. (2002). Combined chemical and
biological degradation of tannery wastewater by a periodic submerged filter (SBBR). Water
Res., 36 (9), 2205-2214.
Dogruel, S., Genceli, E., Babuna, F., and Orhon, D. (2006). An investigation on the optimal location
of ozonation within biological treatment for a tannery wastewater. J. Chem. Technol.
Biotechnol., 81 (12), 1877-1885.
Durán, A., Monteagudo, J., and San Martín, I. (2012). Photocatalytic treatment of an industrial
effluent using artificial and solar UV radiation: An operational cost study on a pilot plant
scale. J. Environ. Manage., 98 (1), 1-4.
Eckstein, T. (1994). Sequential advanced oxidation–biodegradation of simple aqueous solutions of
aromatic compounds. Chapel Hill, NC: University of North Carolina.
ECO. (2010). Sewage Treatment: Not Good Enough. Toronto: Environmental Commissioner of
Ontario (ECO). The Queen's Printer for Ontario.
Edalatmanesh, M., Mehrvar, M., and Dhib, R. (2008). Optimization of phenol degradation in a
combined photochemical-biological wastewater treatment system. Chem. Eng. Res. Des. 86,
1243-1252.

224
Entezari, M., and Pétrier, C. (2003). A combination of ultrasound and oxidative enzyme: Sono-
biodegradation of substituted phenols. Ultrason. Sonochem., 10 (4-5), 241-246.
Environment Canada. (2000). Framework and recommendations concerning effluent quality of
wastewater disposed by federal institutions. Retrieved December 10, 2010, from
FCEMS/Wastewater Working Group: http://www.csc-scc.gc.ca/text/plcy/doc/318-6-gl_e.pdf
Fang, L. (2000). Environmental Effects of the Beef Industry. Agricultural and Natural Resource
Economics Discussion Paper Series. Queensland, Australia: School of Natural and Rural
Systems Management University of Queensland.
Fdez-Polanco, F., Real, F., and Garcia, P. (1994). Behavior of an anaerobic/aerobic pilotscale
fluidized-bed for the simultaneous removal of carbon and nitrogen. Water Sci. Technol. 29,
339–346.
Feng, H., Hu, L., Mahmood, Q., Fang, C., Qiu, C., and Shen, D. (2009). Effects of temperature and
feed strength on a carrier anaerobic baffled reactor treating dilute wastewater. Desalination
239, 111-121.
Foxon, K., Pillay, S., Lalbahadur, T., Rodda, N., Holder, F., and Buckley, C. (2004). The anaerobic
baffled reactor (ABR): An appropriate technology for on-site sanitation. Water SA, 30 (5),
592-598.
Frostell, B. (1983). Anaerobic–Aerobic Biological Treatment of Starch Industry Waste Waters.
Starch—Stärke 35, 185–189.
Fuchs, W., Binder, H., Mavrias, G., and Braun, R. (2003). Anaerobic treatment of wastewater with
high organic content using a stirred tank reactor coupled with a membrane filtration unit.
Water Res., 37 (4), 902-908.
Garbossa, L., Lapa, K., Zaiat, M., and Foresti, E. (2005). Development and evaluation of a radial
anaerobic/aerobic reactor treating organic matter and nitrogen in sewage. Braz. J. Chem. Eng.
22, 511–519.
García, M., Ribosa, I., Guindulain, T., Sánchez-Leal, J., and Vives-Rego, J. (2001). Fate and effect of
monoalkyl quaternary ammonium surfactants in the aquatic environment. Environ. Pollut.
111, 169–175.
García-Montaño, J., Domènech, X., García-Hortal, J., Torrades, F., and Peral, J. (2008). The testing of
several biological and chemical coupled treatments for Cibacron Red FN-R azo dye removal.
J. Hazard. Mater., 154 (1-3), 484-490.

225
García-Montaño, J., Ruiz, N., Muñoz, I., Doménech, X., García-Hortal, J., and Torrades, F. (2006).
Environmental assessment of different photo-Fenton approaches for commercial reactive dye
removal. J. Hazard. Mater. Part A 138, 218–225.
Gariepy, S., Tyagi, R. D., Couillard, D., and Tran, F. (1989). Thermophilic Process for Protein
Recovery as an Alternative to Slaughterhouse Wastewater Treatment. Biological Wastes 29,
93-105.
Gerardi, M. H. (2002). Nitrification and Denitrification in the Activated Sludge Process. New York:
John Wiley and Sons, Inc.
Gizgis, N., Georgiou, M., and Diamadopoulos, E. (2006). Sequential anaerobic/aerobic biological
treatment of olive mill wastewater and municipal wastewater. J. Chem. Technol. Biotechnol.
81, 1563–1569.
Glaze, W. (1987). Drinking-water treatment with ozone. Environ. Sci. Technol. 21, 224–230.
Glaze, W., Lay, Y., and Kang, J. (1995). Advanced oxidation processes: a kinetic model for the
oxidation of 1-2 dibromo 3-chloropropane in water by the combination of hydrogen peroxide
and UV radiation. Ind. Eng. Chem. Res. 34, 2314–2323.
Gogate, P., and Pandit, A. (2004a). A review of imperative technologies for wastewater treatment I:
oxidations technologies at ambient conditions. Adv. Environ. Res. 8, 501–551.
Gogate, P., and Pandit, A. (2004b). A review of imperative technologies for wastewater treatment II:
hybrid methods. Adv. Environ. Res. 8, 553–597.
Gonzalez, M., Braun, A., Bianco Prevot, A., and Pelizzetti, E. (1994). Vacuum-ultraviolet (VUV)
photolysis of water: Mineralization of atrazine. Chemosphere, 28 (12), 2121-2127.
Gonze, E., Commenges, N., Gonthier, Y., and Bernis, A. (2003). High frequency ultrasound as a pre-
or post-oxidation for paper mill wastewaters and landfill leachate treatment. J. Chem. Eng. 92,
215–225.
Goslan, E., Gurses, F., Banks, J., and Parsons, S. (2006). An investigation into reservoir NOM
reduction by UV photolysis and advanced oxidation processes. Chemosphere, 65 (7), 1113-
1119.
Grady, C. P., Daigger, G. T., and Lim, H. C. (1999). Biological Wastewater Treatment, second ed.
revised and expanded. CRC Press.
Gray, N. (2005). Water Technology: An Introduction for Environmental Scientists and Engineers.
Oxford: Elsevier.

226
Grover, R., Marwaha, S., and Kennedy, J. (1999). Studies on the use of an anaerobic baffled reactor
for the continuous anaerobic digestion of pulp and paper mill black liquors. Process Biochem.,
34 (6-7), 653-657.
Gulyas, H., Choromanski, P., Muelling, N., and Furmanska, M. (2009). Toward chemical-free
reclamation of biologically pretreated greywater: solar photocatalytic oxidation with powdered
activated carbon. J. Cleaner Prod., 17 (13), 1223-1227.
Halweil, B. (2008). Vital signs: Meat production continues to rise. Washington, DC: World Watch
Institute.
Hano, T., Matsumoto, M., Kuribayashi, K., and Hatate, Y. (1992). Biological nitrogen removal in a
bubble column with a draught tube. Chem. Eng. Sci. 47, 3737–3744.
Heijnen, J., Mulder, A., Weltevrede, R., Hols, J., and Vanleeuwen, H. (1991). Large-scale anaerobic–
aerobic treatment of complex industrial-waste water using biofilm reactors. Water Sci.
Technol. 23, 1427–1436.
Hu, S., and Yu, Y. (1994). Preozonation of chlorophenolic wastewater for subsequent biological
treatment. Ozone-Sci. Eng. 16, 13–28.
IJC. (2009). Fourteenth Biennial Report on Great Lakes Water Quality. Windsor, ON: International
Joint Commission.
Isik, and Sponza, D. T. (2004). Anaerobic/aerobic sequential treatment of a cotton textile mill
wastewater. J. Chem. Technol. Biotechnol. 79, 1268–1274.
Isik, M., and Sponza, D. (2006). Biological treatment of acid dyeing wastewater using a sequential
anaerobic/aerobic reactor system. Enzyme Microb. Technol. 38, 887–892.
Isik, M., and Sponza, D. (2008). Anaerobic/aerobic treatment of a simulated textile wastewater. Sep.
Purif. Technol. 60, 64–72.
Johns, M. (1995). Developments in wastewater treatment in the meat processing industry: A review.
Bioresour. Technol. 54, 203-216.
Johnson, M., and Mehrvar, M. (2008). Aqueous metronidazole degradation by UV/H2O2 process in
single-and multi-lamp tubular photoreactors: Kinetics and reactor design. Ind. Eng. Chem.
Res., 47 (17), 6525-6537.
Jones, B., Sakaji, R., and Daughton, C. (1985). Effects of ozonation and ultraviolet irradiation on
biodegradability of oil shale wastewater organic solutes. Water Res. 19, 1421–1428.
Justino, C., Duarte, K., Loureiro, F., Pereira, R., Antunes, S., Marques, S., et al. (2009). Toxicity and
organic content characterization of olive oil mill wastewater undergoing a sequential treatment
with fungi and photo-Fenton oxidation. J. Hazard. Mater., 172 (2-3), 1560-1572.

227
Kapdan, I., and Alparslan, S. (2005). Application of anaerobic–aerobic sequential treatment system to
real textilewastewater for color and COD removal. Enzyme Microb. Technol. 36, 273–79.
Kastanek, F., Maleterova, Y., and Kastanek, P. (2007). Combination of advanced oxidation and/or
reductive dehalogenation and biodegradation for the decontamination of waters contaminated
with chlorinated organic compounds. Sep. Sci. Technol., 42 (7), 1613-1625.
Kennedy, K., and Barriault, M. (2007). Treatment kinetics of aircraft deicing fluid in an anaerobic
baffled reactor. J. Environ. Eng. Sci., 6 (1), 11-17.
Kettunen, R., and Rintala, J. (1995). Sequential anaerobic-aerobic treatment of sulphur rich phenolic
leachates. J. Chem. Technol. Biotechnol. 62, 177–184.
Kim, I., Kim, S., Lee, H., and Tanaka, H. (2011). Effects of adding UV and H2O2 on the degradation
of pharmaceuticals and personal care products during O3 treatment. Environ. Eng. Res., 16
(3), 131-136.
Kim, I., Yamashita, N., and Tanaka, H. (2009a). Performance of UV and UV/H2O2 processes for the
removal of pharmaceuticals detected in secondary effluent of a sewage treatment plant in
Japan. J. Hazard. Mater., 166 (2-3), 1134-1140.
Kim, I., Yamashita, N., and Tanaka, H. (2009b). Photodegradation of pharmaceuticals and personal
care products during UV and UV/H2O2 treatments. Chemosphere, 77 (4), 518-525.
Kim, T.-H., Park, C., Lee, J., Shin, E.-B., and Kim, S. (2002). Pilot scale treatment of textile
wastewater by combined process (fluidized biofilm process-chemical coagulation-
electrochemical oxidation). Water Res., 36 (16), 3979-3988.
Kingsley, O. C. (2011). Using Life Cycle Assessment (LCA) to Assess the Sustainability of Urban
Wastewater Treatment Systems: a Case Study of the Wastewater Treatment Technology of the
Bogotá River. Bogota, Colombia: Universidad Nacional de Colombia.
Klavarioti. (2009). Removal of residual pharmaceuticals from aqueous systems by advanced
oxidation processes. Environ. Int. 35, 402–417.
Koppenol, W. H., Butler, J., and Van Leeuwen, J. W. (1978). The Haber-Weiss Cycle. J. Photochem.
Photobiol., 28, 655–660.
Kotsou, M., Kyriacou, A., Lasaridi, K., and Pilidis, G. (2004). Integrated aerobic biological treatment
and chemical oxidation with Fenton's reagent for the processing of green table olive
wastewater. Process Biochem., 39 (11), 1653-1660.
Koyama, O., Kamayat, Y., and Nakamura, K. (1994). Degradation of chlorinated aromatics by Fenton
oxidation and methanogenic digester sludge. Water Res. 28, 895–899.

228
Krishna, G. G., Kumar, P., and Kumar, P. (2009). Treatment of low-strength soluble wastewater using
an anaerobic baffled reactor (ABR). J. Environ. Manage. 90, 166-176.
Ku, Y., Wang, L., and Shen, Y. (1998). Decomposition of EDTA in aqueous solution by UV/H2O2
process. J. Hazard. Mater., 41-55.
Kuşçu, Ö., and Sponza, D. (2005). Performance of anaerobic baffled reactor (ABR) treating synthetic
wastewater containing p-nitrophenol. Enzyme and Microbial Technology, 36 (7), 888-895.
Kuşçu, O., and Sponza, D. (2006). Treatment efficiencies of a sequential anaerobic baffled reactor
(ABR)/completely stirred tank reactor (CSTR) system at increasing p-nitrophenol and COD
loading rates. Process Biochem., 41 (7), 1484-1492.
Kyriacou, A., Lasaridi, K., Kotsou, M., Balis, C., and Pilidis, G. (2005). Combined bioremediation
and advanced oxidation of green table olive processing wastewater. Process Biochem., 40 (3-
4), 1401-1408.
La Motta, E., Silva, E., Bustillos, A., Padron, H., and Luque, J. (2007). Combined anaerobic/aerobic
secondary municipal wastewater treatment: Pilot-plant demonstration of the UASB/aerobic
solids contact system. J. Environ. Eng. - ASCE 133, 397–403.
L'Amour, R., Azevedo, E., Leite, S., and Dezotti, M. (2008). Removal of phenol in high salinity
media by a hybrid process (activated sludge + photocatalysis). Sep. Purif. Technol., 60 (2),
142-146.
Langenhoff, A., Intrachandra, N., and Stuckey, D. (2000). Treatment of dilute soluble and colloidal
wastewater using an anaerobic baffled reactor: Influence of hydraulic retention time. Water
Res., 34 (4), 1307-1317.
Lapertot, M., Pulgarín, C., Fernández-Ibañez, P., Maldonado, M., Pérez-Estrada, L., and Oller, I.
(2006). Enhancing biodegradability of priority substances (pesticides) by solar photo- Fenton.
Water Res. 40, 1086–1094.
Lee, L., Ng, H., Ong, S., Hu, J., Tao, G., Kekre, K., et al. (2009). Ozone-biological activated carbon
as a pretreatment process for reverse osmosis brine treatment and recovery. Water Res., 43
(16), 3948-3955.
Lee, S., and Carberry, J. (1992). Biodegradation of PCP enhanced by chemical oxidation pre-
treatment. Water Environ. Res. 64, 682–690.
Lei, Y., Shen, Z., Huang, R., and Wang, W. (2007). Treatment of landfill leachate by combined aged-
refuse bioreactor and electro-oxidation. Water Res., 41 (11), 2417-2426.

229
Leitao, R., Haandel, A., Zeeman, G., and Lettinga, G. (2006). The effects of operational and
environmental variations on anaerobic wastewater treatment systems: A review. Bioresour.
Technol. 97, 1105–1118.
Li, K., Stefan, M., and Crittenden, J. (2007). Trichloroethene degradation by UV/H2O2 advanced
oxidation process: Product study and kinetic modeling. Environ. Sci. Technol., 41 (5), 1696-
1703.
Libra, J., and Sosath, F. (2003). Combination of biological and chemical processes for the treatment
of textile wastewater containing reactive dyes. J. Chem. Technol. Biotechnol., 78 (11), 1149-
1156.
Liu, H., Yang, C., Pu, W., and Zhang, J. (2008). Removal of nitrogen fromwastewater for reusing to
boiler feed-water by an anaerobic/aerobic/membrane bioreactor. Chem. Eng. J. 140, 122–129.
Lo, K., and Liao, P. (1986). Anaerobic aerobic biological treatment of screened dairy manure.
Biomass 10, 187–193.
Lo, K., and Liao, P. (1989). Anaerobic–aerobic biological treatment of amixture of cheese whey and
dairy manure. Biological Wastes 28, 91-101.
López-Peñalver, J., Sánchez-Polo, M., Gómez-Pacheco, C., and Rivera-Utrilla, J. (2010).
Photodegradation of tetracyclines in aqueous solution by using UV and UV/H2O2 oxidation
processes. J. Chem. Technol. Biotechnol., 85 (10), 1325-1333.
Luiz, D., Genena, A., José, H., Moreira, R., and Schröder, H. (2009). Tertiary treatment of
slaughterhouse effluent: Degradation kinetics applying UV radiation or H2O2/UV. Water Sci.
Technol., 60 (7), 1869-1874.
Manjunath, N., Mehrotra, I., and Mathur, R. (2000\). Treatment of wastewater from slaughterhouse
by DAF-UASB system. Water Res., 34 (6), 1930-1936.
Mänttäri, M., Kuosa, M., Kallas, J., and Nyström, M. (2008). Membrane filtration and ozone
treatment of biologically treated effluents from the pulp and paper industry. J. Membr. Sci.,
309 (1-2), 112-119.
Mascolo, G., Laera, G., Pollice, A., Cassano, D., Pinto, A., Salerno, C., et al. (2010). Effective
organics degradation from pharmaceutical wastewater by an integrated process including
membrane bioreactor and ozonation. Chemosphere, 78 (9), 1100-1109.
Masse, D., and Masse, L. (2000a). Treatment of slaughterhouse wastewater in anaerobic sequencing
batch reactors. Can. Agr. Eng. 42, 131-137.
230
Masse, D., and Masse, L. (2000b). Characterization of wastewater from hog slaughterhouses in
Eastern Canada and evaluation of their in-plant wastewater treatment systems. Can. Agr. Eng.
42 (3), 139-146.
Matsumura, E., and Mierzwa, J. (2008). Water conservation and reuse in poultry processing plant – a
case study. Resour. Conser. Recy. 52 (6), 835–842.
McMurray, J., and Fay, R. (1998). Chemistry (5th ed.). Upper Saddle River, NJ: Pearson Prentice-
Hall.
Mehrvar, M., Anderson, W., and Moo-Young, M. (2001). Photocatalytic degradation of aqueous
organic solvents in the presence of hydroxyl radical scavengers. Int. J. Photoenergy, 3 (4),
187-191.
Merzouki, M., Bernet, N., Delgenès, J., and Benlemlih, M. (2005). Effect of prefermentation on
denitrifying phosphorus removal in slaughterhouse wastewater. Bioresource Technol., 96 (12),
1317-1322.
Miguez, C., Shen, C., Bourque, D., Guiot, S., and Grouleau, D. (1999). Monitoring methanotrophic
bacteria in hybrid anaerobic–aerobic reactors with PCR and a catabolic gene probe. Appl.
Environ. Microbiol. 65, 381–388.
Miller, R., Singer, G., Rosen, J., and Bartha, R. (1988). Sequential degradation of chlorophenols by
photolytic and microbial treatment. Environ. Sci. Tech. 22, 1215–1209.
Mittal, G. (2006). Treatment of wastewater from abattoirs before land application - A review.
Bioresource Technol., 97 (9), 1119-1135.
Mohajerani, M., Mehrvar, M., and Ein-Mozaffari, F. (2009). An overview of the integration of
advanced oxidation technologies and other processes for wastewater treatment. Int. J. Eng. 3,
120–146.
Moosavi, G., Mesdaghinia, A., Naddafi, K., and Mahvi, A. (2004). Feasibility of development and
application of an up-flow anaerobic/aerobic fixed bed combined reactor to treat high strength
wastewaters. 10th World Congress on Anaerobic Digestion, (pp. 2436–2440). Montreal, QC.
Mouthon-Bello, J., and Zhou, H. (2006). Performance of a submerged membrane bioreactor system
for biological nutrient removal. Water Environ. Res., 78 (5), 538-547.
Muñoz, D. (2005). Sistema de Tratamiento de Aguas Residuales de Matadero: Para una Población
Menor 2000 Habitantes. System of Residual Water Treatment of Slaughter House: For a
Smaller Population 2000 Inhabitants. Facultad de Ciencias Agropecuarias 3, 87-98.
Muñoz, R., and Guieysee, B. (2006). Algal–bacterial processes for the treatment of hazardous
contaminants: a review. Water Res. 40, 2799–2815.

231
Nachaiyasit, S., and Stuckey, D. (1997). Effect of low temperatures on the performance of an
anaerobic baffled reactor (ABR). J. Chem. Technol. Biotechnol., 69 (2), 276-284.
Nadarajah, N., Van Hamme, J., Pannu, J., Singh, A., and Ward, O. (2002). Enhanced transformation
of polycyclic aromatic hydrocarbons using a combined Fenton's reagent, microbial treatment
and surfactants. Appl. Microbiol. Biotechnol., 59 (4-5), 540-544.
Nemerow, N. (2007). Industrial Waste Treatment. Burlington, MA: Elsevier Science and Tecnology.
Neyens, E., and Baeyens, J. (2003). A review of classic Fenton's peroxidation as an advanced
oxidation technique. J. Hazard. Mater. 98, 33–50.
Núñez, L., Fuente, E., Martínez, B., and García, P. (1999). Slaughterhouse wastewater treatment
using ferric and aluminium salts and organic polyelectrolites. J. Environ. Sci. Health A Tox.
Hazard Subst. Environ. Eng., 34 (3), 721-736.
OEB. (2011, November 1). Ontario Energy Board - Electricity Prices at a Glance. Retrieved March
1, 2012, from
http://www.ontarioenergyboard.ca/OEB/Consumers/Electricity/Electricity+Prices
Oller, I., Malato, S., and Sanchez-Perez, J. (2011). Combination of Advanced Oxidation Processes
and biological treatments for wastewater decontamination - A review. Sci. Total Environ., 409
(20), 4141-4166.
OMAFRA. (2011, December 20). Provincially Licensed Meat Plants in Ontario. Retrieved January
31, 2012, from Ontario Ministry of Agricultural and Rural Affairs (OMAFRA):
http://www.omafra.gov.on.ca/english/food/inspection/maps/MeatPlantTables/TblAllAbattoirs.
htm
OMOE. (1996). Guidelines for the Utilization of Biosolids and other Wastes on Agricultural Land.
Retrieved June 27, 2012, from Ontario Ministry of Environment (OMOE):
http://www.ene.gov.on.ca/stdprodconsume/groups/lr/@ene/@resources/documents/resource/st
d01_079003.pdf
Oppenländer, T. (2003). Photochemical purification of water and air, Advanced Oxidation Processes
(AOPs): Principles, reaction mechanisms, reactor concepts. Winheim, Germany: Wiley-VCH.
Pagano, M., Lopez, A., Volpe, A., Mascolo, G., and Ciannarella, R. (2008). Oxidation of nonionic
surfactants by Fenton and H2O 2/UV processes. Environ.l Technol., 29 (4), 423-433.
Park, S.-J., Yoon, T.-I., Bae, J.-H., Seo, H.-J., and Park, H.-J. (2001). Biological treatment of
wastewater containing dimethyl sulphoxide from the semi-conductor industry. Process
Biochem., 36 (6), 579-589.

232
Pera-Titus, M., García-Molina, V., Baños, M., Giménez, J., and Espulgas, S. (2007). Degradation of
chlorophenols by means of advanced oxidation processes: a general review. Appl. Catal. B-
Environ. 47, 219–256.
Pignatello, J., Oliveros, E., and MacKay, A. (2006). Advanced oxidation processes for organic
contaminant destruction based on the Fenton reaction and related chemistry. Crit. Rev.
Environ. Sci. Technol. 36, 1-84.
Pittier, P., and Chudoba, J. (1990). Biodegradability of Organic Substances in the Aquatic
Environment. Boca Raton, FL: CRC Press.
Polprasert, C., Kemmadamrong, P., and Tran, F. (1992). Anaerobic baffle reactor (ABR) process for
treating a slaughterhouse wastewater. Environ. Technol., 13 (9), 857-865.
Poole, A. (2004). Treatment of biorefractory organic compounds in wool scour effluent by hydroxyl
radical oxidation. Water Res., 38 (14-15), 3458-3464.
Pophali, G., Khan, R., Dhodapkar, R., Nandy, T., and Devotta, S. (2007). Anaerobic–aerobic
treatment of purified terephthalic acid (PTA) effluent; a techno-economic alternative to two-
stage aerobic process. J. Environ. Manage. 85, 1024–1033.
Prando, R., and Gambogi, A. (2009). Water resources in Uruguay. Main features and challenges
towards their sustainable use. Retrieved December 5, 2010, from http://www.acad-eng-
gen.ca/documents/Session%204/Prando_Gambogi.pdf
Pulgarín, C., and Kiwi, J. (1996). Overview on photocatalytic and electrocatalytic pretreatment of
industrial non-biodegradable pollutants and pesticides. Chimia 50, 50–55.
Pulgarin, C., Invernizzi, M., Parra, S., Sarria, V., Polania, R., and Peringer, P. (1999). Strategy for the
coupling of photochemical and biological flow reactors useful in mineralization of
biorecalcitrant industrial pollutants. Catal. Today 54, 341-352.
Quinete, N., Orata, F., Maes, A., Gehron, M., Bauer, K.-H., Moreira, I., et al. (2010). Degradation
studies of new substitutes for perfluorinated surfactants. Arch. Environ. Contam. Toxicol., 59
(1), 20-30.
Quinn, J., and McFarlane, P. (1989). Effects of slaughterhouse and dairy factory wastewaters on
epilithon: A comparison in laboratory streams. Water Res. 23, 1267-1273.
Rafin, C., Veignie, E., Fayeulle, A., and Surpateanu, G. (2009). Benzo[a]pyrene degradation using
simultaneously combined chemical oxidation, biotreatment with Fusarium solani and
cyclodextrins. Bioresource Technol., 100 (12), 3157-3160.

233
Rajakumar, R., Meenambal, T., Banu, J. R., and Yeom, I. (2011). Treatment of poultry
slaughterhouse wastewater in upflow anaerobic filter under low upflow velocity. Int. J.
Environ. Sci. Technol. 8, 149-158.
Rajakumar, R., Meenambal, T., Banu, J. R., and Yeom, I. (2011). Treatment of poultry
slaughterhouse wastewater in upflow anaerobic filter under low upflow velocity. International
journal of Environmental Science and Technology 8, 149-158.
Rajesh Banu, J., Anandan, S., Kaliappan, S., and Yeom, I.-T. (2008). Treatment of dairy wastewater
using anaerobic and solar photocatalytic methods. Sol. Energy, 82 (9), 812-819.
Reginatto, V., Teixeira, R., Pereira, F., Schmidell, W., Furigo Jr., A., Menes, R., et al. (2005).
Anaerobic ammonium oxidation in a bioreactor treating slaughterhouse wastewater. Braz. J.
Chem. Eng., 22 (4), 593-600.
Reungoat, J., Macova, M., Escher, B., Carswell, S., Mueller, J., and Keller, J. (2010). Removal of
micropollutants and reduction of biological activity in a full scale reclamation plant using
ozonation and activated carbon filtration. Water Res., 44 (2), 625-637.
Reynolds, T., and Richards, P. (1996). Unit Operations and Processes in Environmental Engineering,
2nd ed. Boston, MA: PWS Publishing Company.
Reynolds, T., and Yang, J. (1966). Model of the completely-mixed activated sludge process. Proc.
21st Ind. Waste Conf., Purdue Univ. Part 2, 696-713.
Rizzo, L., Rocca, C., Belgiorno, V., and Bekbolet, M. (2008). Application of photocatalysis as a post
treatment method of a heterotrophic-autotrophic denitrification reactor effluent. Chemosphere,
72 (11), 1706-1711.
Rodriguez-Martinez, J., Rodriguez-Garza, I., Pedraza-Flores, E., Balagurusamy, N., Sosa-Santillan,
G., and Garza-Garcia, Y. (2002). Kinetics of anaerobic treatment of slaughterhouse
wastewater in batch and upflow anaerobic sludge blanket reactor. Bioresource Technology 85,
235–241.
Ros, M., and Zupancic, G. (2004). Two-stage thermophilic anaerobic–aerobic digestion of waste-
activatedsludge. Environ. Eng. Sci. 21, 617–626.
Rosal, R., Rodríguez, A., Perdigón-Melón, J., Petre, A., García-Calvo, E., Gómez, M., et al. (2010).
Occurrence of emerging pollutants in urban wastewater and their removal through biological
treatment followed by ozonation. Water Res., 44 (2), 578-588.
Rosario-Ortiz, F., Wert, E., and Snyder, S. (2010). Evaluation of UV/H2O2 treatment for the oxidation
of pharmaceuticals in wastewater. Water Res., 44 (5), 1440-1448.

234
Ruiz, I., Veiga, M. C., Santiago, P. d., and Blazquez, R. (1997). Treatment of slaughterhouse
wastewater in a UASB reactor and an anaerobic filter. Bioresource Technology 60 (3), 251-
258.
Sachon (1982). Traitement des eaux résiduaires des abattoirs de bétail. Proceedings of the
International Symposium on Food Industries and The Environment, (pp. 293-305). Budapest,
Hungary.
Sachon, G. (1986). Les eaux résiduaires des abattoirs de bétail. Gestion et traitement. Tribune
Cebedeau 515, 27-45.
Salminen, E., and Rintala, J. (2002). Anaerobic digestion of organic solid poultry slaughterhouse
waste – a review. Bioresour. Technol. 83, 13–26.
Sangodoyin, A., and Agbawhe, O. (1992). Environmental study on surface and groundwater
pollutants from abattoir effluents. Bioresour. Technol. 41, 193-200.
Sarria, V., Deront, M., Peringer, P., and Pulgarin, C. (2003). Degradation of a biorecalcitrant dye
precursor present in industrial wastewaters by a new integrated iron(III) photoassisted-
biological treatment. Appl. Catal. B-Environ. 40, 231-246.
Sarria, V., Parra, S., Invernizzi, M., Péringer, P., and Pulgarin, C. (2001). Photochemical-biological
treatment of a real industrial biorecalcitrant wastewater containing 5-amino-6-methyl-2-
benzimidazolone. Water Sci. Technol., 44 (5), 93-101.
Sarria, V., Péringer, P., Cáceres, J., Blanco, J., Malato, S., and Pulgarín, C. (2009). Solar degradation
of 5-amino-6-methyl-2-benzimidazolone by TiO2 and iron (III) catalyst with H2O2. Sol.
Energy 29, 853–860.
Sawyer, C., McCarthy, P., and Martin, G. (2002). Chemistry for Environmental Engineering and
Science (5th ed.). New York, NY: McGraw-Hill Science.
Sayed, S., and De Zeeuw, W. (1988). The performance of a continuously operated flocculent sludge
UASB reactor with slaughterhouse wastewater. Biol. Waste., 24 (3), 199-212.
Sayed, S., van Campen, L., and Lettinga, G. (1987). Anaerobic treatment of slaughterhouse waste
using a granular sludge UASB reactor. Biol. Waste., 21 (1), 11-28.
Sayed, S., Zanden, J. v., Wijffels, R., and Lettinga, G. (1988). Anaerobic degradation of the various
fractions of slaughterhouse wastewater. Biological Wastes 23, 117-142.
Schaar, H., Clara, M., Gans, O., and Kreuzinger, N. (2010). Micropollutant removal during biological
wastewater treatment and a subsequent ozonation step. Environ. Pollut., 158 (5), 1399-1404.

235
Sehested, K., Rasmussen, O., and Fricke, H. (1968). Rate constants of OH with HO2, O2-, and
H2O2+ from hydrogen peroxide formation in pulse-irradiated oxygenated water. J. Phys.
Chem., 72 (2), 626-631.
Seif, H., and Moursy, A. (2001). Treatment of Slaughterhouse Wastes. Sixth International Water
Technology Conference (pp. 269-275). Alexandria, Egypt: IWTC.
Setiadi, T., Husaini, and Djajadiningrat, A. (1996). Palm oil mill effluent treatment by anaerobic
baffled reactors: Recycle effects and biokinetic parameters. Water Sci. Technol., 34 (11 pt 7),
59-66.
Shannon, M., Bohn, P., Elimelech, M., Georgiadis, J., Mariñas, B., Mayes, et al. (2008). Science and
technology for water purification in the coming decades. Nature 452, 301–310.
Shemer, H., Kunukcu, Y., and Linden, K. (2006). Degradation of the pharmaceutical Metronidazole
via UV, Fenton and photo-Fenton processes. Chemosphere, 63 (2), 269-276.
Shen, C., and Guiot, S. (1996). Long-term impact of dissolved O2 on the activity of anaerobic
granules. Biotechnol. Bioeng. 49, 611–620.
Shu, H. (2006). Degradation of dyehouse effluent containing C.I. Direct Blue 199 by processes of
ozonation, UV/H2O2 and in sequence of ozonation with UV/H2O2. J. Hazard. Mater. 133, 92–
98.
Sigge, G., Britz, T., Fourie, P., Barnardt, C., and Strydom, R. (2002). Combining UASB technology
and advanced oxidation processes (AOP’s) to treat food processing wastewaters. Water Sci.
Technol. 45, 329–334.
Sirianuntapiboon, S., and Manoonpong, K. (2001). Application of granular activated carbon-
sequencing batch reactor (GAC-SBR) system for treating wastewater from slaughterhouse.
Thammasat Int. J. Sci. Technol. 6 (1), 16-25.
Sirtori, C., Zapata, A., Oller, I., Gernjak, W., Agüera, A., and Malato, S. (2009). Solar photo-fenton
as finishing step for biological treatment of a pharmaceutical wastewater. Environ. Sci.
Technol., 43 (4), 1185-1191.
Sklyar, V., Epov, A., Gladchenko, M., Danilovich, D., and Kalyuzhnyi, S. (2003). Combined biologic
(anaerobic–aerobic) and chemical treatment of starch industry wastewater. Appl. Biochem.
Biotechnol. 109, 253–262.
Sperling, M. v., Freire, V., and Chernicharo, C. d. (2001). Performance evaluation of a UASB-
activated sludge system treating municipal wastewater. Water Sci. Technol. 43, 323–328.

236
Sponza, and Demirden, P. (2007). Treatability of sulfamerazine in sequential upflow anaerobic sludge
blanket reactor (UASB)/completely stirred tank reactor (CSTR) processes. Sep. Purif.
Technol. 56, 108–117.
Sroka, E., Kamiński, W., and Bohdziewicz, J. (2004). Biological treatment of meat industry
wastewater. Desalination, 162 (1-3), 85-91.
Staehelin, J., Bühler, R., and Hoigné, J. (1984). Ozone decomposition in water studied by pulse
radiolysis. 2. OH and HO4 as chain intermediates. J. Phys. Chem., 88 (24), 5999-6004.
Steber, J., and Wierich, P. (1986). Properties of hydroxyethano diphosphonate affecting
environmental fate: degradability, sludge adsorption, mobility in soils, and bioconcentration.
Chemosphere 15, 929–945.
Stefan, M., Hoy, A., and Bolton, J. (1996). Kinetics and mechanism of the degradation and
mineralization of acetone in dilute aqueous solution sensitized by the UV photolysis of
hydrogen peroxide. Environ. Sci. Technol. 30, 2382–2390.
Stephenson, T., and Lester, J. N. (1986). Evaluation of startup and operation of four anaerobic
processes treating a synthetic meat waste. Biotechnol. Bioeng., 28 (3), 372-380.
Supaka, N., Juntongjin, K., Damronglerd, S., Delia, M., and Strehaiano, P. (2004). Microbial
decolorization of reactive azo dyes in a sequential anaerobic–aerobic system. Chem. Eng. J.
99, 169–176.
Szpyrkowicz, L., Kaul, S., Neti, R., and Satyanarayan, S. (2005). Influence of anode material on
electrochemical oxidation for the treatment of tannery wastewater. Water Res., 39 (8), 1601-
1613.
Tabrizi, G., and Mehrvar, M. (2004). Integration of advanced oxidation technologies and biological
processes: recent developments, trends, and advances. J. Environ. Sci. Health Part A 39,
3029–3081.
Tabrizi, G., and Mehrvar, M. (2006). Pilot-plant study for the photochemical treatment of aqueous
linear alkyl benzene sulfonate. Sep. Purif. Technol. 49, 115–121.
Tanaka, Hisanaga, J., and Harada, K. (1989a). Efficient photocatalytic degradation of chloral hydrate
in aqueous semiconductor suspensions. Journal of Photochemistry and Photobiology A. Chem.
48, 155-159.
Tanaka, K., Hisanaga, J., and Harada, K. (1989b). Photocatalytic degradation of organohalide
compounds in semiconductor suspensions with added hydrogen peroxide. N. J. Chem. 13, 5-7.
Tarr, M. (2003). Chemical Degradation Methods for Wastes and Pollutants: Environmental and
Industrial Applications. New York, NY: Marcel Dekker.

237
Tartakovsky, B., Manuel, M., and Guiot, S. (2005). Degradation of trichloroethylene in a coupled
anaerobic–aerobic bioreactor: Modeling and experiment. Biochem. Eng. J. 26, 72–81.
Tartakovsky, Michotte, A., Cadieux, J., Lau, P., Hawari, J., and Guiot, S. (2001). Degradation of
Aroclor 1242 in a single-stage coupled anaerobic/aerobic bioreactor. Water Res. 35, 4323–
4330.
Tchobanoglous, G., Burton, F., and Stensel, H. (2003). Wastewater Engineering: Treatment and
Reuse (4th ed.). New York, NY: McGraw Hill.
Tezel, U., Guven, E., Erguder, T., and Demirer, G. (2001). Sequential (anaerobic/aerobic) biological
treatment of dalaman SEKA Pulp and Paper Industry effluent. Waste Manage. 21, 717–724.
Toldrá, F., Flors, A., Lequerica, J., and Vallés, S. (1987). Fluidized bed anaerobic biodegradation of
food industry wastewaters. Biol. Waste., 21 (1), 55-61.
Toor, R., and Mohseni, M. (2007). UV-H2O2 based AOP and its integration with biological activated
carbon treatment for DBP reduction in drinking water. Chemosphere 66, 2087–2095.
Torkian, A., Eqbali, A., and Hashemian, S. (2003). The effect of organic loading rate on the
performance of UASB reactor treating slaughterhouse effluent. Resour. Conserv. and Recy.,
40 (1), 1-11.
Torrades, F., Pérez, M., Mansilla, H., and Peral, J. (2003). Experimental design of Fenton and photo-
Fenton reactions for the treatment of cellulose bleaching effluents. Chemosphere, 53 (10),
1211-1220.
Torres, R., Sarria, V., Torres, W., Peringer, P., and Pulgarin, C. (2003). Electrochemical treatment of
industrial wastewater containing 5-amino-6-methyl-2-benzimidazolone: Toward an
electrochemical-biological coupling. Water Res., 37 (13), 3118-3124.
Treguer, R., Tatin, R., Couvert, A., Wolbert, D., and Tazi-Pain, A. (2010). Ozonation effect on
natural organic matter adsorption and biodegradation - Application to a membrane bioreactor
containing activated carbon for drinking water production. Water Res., 44 (3), 781-788.
Trgovcich, B., Kirsch, E., and Grady, C. (1983). Characteristics of activated sludge effluents before
and after breakpoint chlorination. Res. J. Water Pollut. C. 55, 966–976.
Tritt, W. (1992). The anaerobic treatment of slaughterhouse wastewater in fixed-bed reactors.
Bioresource Technol., 41 (3) , 201-207.
Tritt, W. P., and Schuchardt, F. (1992). Materials flow and possibilities of treating liquid and solid
wastes from slaughterhouses in Germany. A review. Bioresource Technology 41, 235-245.
UN FAO. (2010). Food Outlook: Meat and meat products. Rome, Italy: Food and Agriculture
Organization of the United Nations.

238
US EPA. (2004). Effluent Limitations Guidelines and New Source Performance Standards for the
Meat and Poultry Products Point Source Category. Environmental Protection Agency (EPA):
Federal Register Vol. 69, No. 173.
USACE. (2004, June). St. Clair River and Lake St. Clair Comprehensive Management Plan - Chapter
3: Environmental Health of the Watershed. Retrieved January 30, 2012, from US Army Corps
of Engineers Detroit District:
http://www.lre.usace.army.mil/_kd/Items/actions.cfm?action=Show&item_id=4312&destinati
on=ShowItem
US-EPA. (2002). Environmental assessment of proposed effluent limitations guidelines and standards
for the meat and poultry products industry point source. Washington, DC: US Environmental
Protection Agency.
Uyanik, S. (2003). A novel anaerobic reactor: Split Fed Anaerobic Baffled Reactor (SFABR). Turk. J.
Eng. Environ.Sci., 27 (5), 339-345.
Uyanik, S., Sallis, P., and Anderson, G. (2002). The effect of polymer addition on granulation in an
anaerobic baffled reactor (ABR). Part I: Process performance. Water Res., 36 (4), 933-943.
Van Lier, J., Tilche, A., Ahring, B., Macarie, H., Moletta, R., Dohanyos, M., et al. (2001). New
perspectives in anaerobic digestion. Water Sci. Technol. 43, 1-18.
Venhuis, S., and Mehrvar, M. (2005). Photolytic treatment of aqueous linear alkyl benzene sulfonate.
J. Enviro. Sci. Health Part A 40, 1731–1739.
Vera, M., Aspe, E., Marti, M., and Roeckel, M. (1999). Optimization of a sequential anaerobic–
aerobic treatment of a saline fishing effluent. Process Saf. Environ. Prot. 77, 275–290.
Verheijen, L., Wiersema, D., and Pol, L. H. (1996). Management of Waste from Animal Product
Processing. Retrieved December 10, 2010, from Food and Agriculture Organization of the
United Nations - FAO Corporate Document Repository - J. De Wit International Agriculture
Centre: http://www.fao.org/WAIRDOCS/LEAD/X6114E/X6114E00.HTM
Vossoughi, M., Shakeri, M., and Alemzadeh, I. (2003). Performance of anaerobic baffled reactor
treating synthetic wastewater influenced by decreasing COD/SO4 ratios. Chem. Eng. Process.,
42 (10), 811-816.
Walter, R., Shermah, R., and Downing, D. (1974). Reduction in Oxygen demand of abattoir effluent
by Precipitation with metal. Journal of Agricultural and Food Chemistry 22, 1097-1099.
Wang, Hung, and Shammas. (2006). Advanced Physicochemical Treatment Process: Volume 4
(Handbook of Environmental Engineering). Totowa, NJ: Humana Press.
Wang, L. (2005). Waste Treatment in the Process Industries. Boca Raton, FL: CRC Press.

239
Wang, L., Hung, Y., and Shammas, N. (2010). Handbook of Advanced Industrial and Hazardous
Wastes Treatment. Boca Raton, FL: CRC Press.
Wang, R., Wang, Y., Ma, G., He, Y., and Zhao, Y. (2009a). Efficiency of porous burnt-coke carrier
on treatment of potato starch wastewater with an anaerobic–aerobic bioreactor. Chem. Eng. J.
148, 35–40.
Wang, X.-J., Song, Y., and Mai, J.-S. (2008). Combined Fenton oxidation and aerobic biological
processes for treating a surfactant wastewater containing abundant sulfate. J. Hazard. Mater.,
160 (2-3), 344-348.
Wang, Y. (1992). Effect of chemical oxidation on anaerobic biodegradation of model phenolic
compounds. Water Environ. Res. 64, 268–273.
Wang, Y., and Hong, C. (1999). Effect of hydrogen peroxide, periodate and persulfate on
photocatalysis of 2 chlorobiphenyl in aqueous TiO2 suspensions. Water Res. 33, 2031-2036.
Wang, Z.-P., Huang, L.-Z., Tao, T., Fu, S., Zuo, J., and Lv, B. (2009b). Treatment of landfill leachate
by combined photooxidation and biological anaerobic-aerobic method. 3rd International
Conference on Bioinformatics and Biomedical Engineering, iCBBE 2009, art. no. 5163709, 1-
4.
Ward, B. (1996). Nitrification and denitrification: Probing the nitrogen cycle in aquatic environments.
Microb. Ecol., 32 (3), 247-261.
World Bank. (1999). Pollution Prevention and abatement handbook toward cleaner production.
Washington, DC: The International Bank for Reconstruction and Development.
World Bank Group. (2007). Environmental, Health, and Safety Guidelines for Sugar Manufacturing.
Retrieved December 10, 2010, from International Finance Corporation:
http://www.ifc.org/ifcext/enviro.nsf/AttachmentsByTitle/gui_EHSGuidelines2007_SugarMan
ufacturing/$FILE/Final+-+Sugar+Manufacturing.pdf
Wu, P., and Mittal, G. (2011). Characterization of provincially inspected slaughterhouse wastewater
in Ontario, Canada. Can. Biosyst. Eng., 53, 6.9-6.18.
Yan, M., Wang, D., Ma, X., Ni, J., and Zhang, H. (2010). THMs precursor removal by an integrated
process of ozonation and biological granular activated carbon for typical Northern China
water. Sep. Purif. Technol., 72 (3), 263-268.
Yang, Z., and Zhou, S. (2008). The biological treatment of landfill leachate using a simultaneous
aerobic and anaerobic (SAA) bio-reactor system. Chemosphere 72, 1751–1756.
Yeoh, B. (1995). Anaerobic treatment of industrial wastewaters in Malaysia. Post Conference
Seminar on Industrial Wastewater Management. Kuala Lumpur, Malaysia.

240
Yu, J., Chen, H., Ji, M., and Yue, P. (2000). Distribution and change of microbial activity in
combined UASB and AFB reactors for wastewater treatment. Bioprocess Eng. 22, 315–322.
Zeng, Y., Hong, P., and Wavrek, D. (2000). Integrated chemical-biological treatment of
benzo[a]pyrene. Environ. Sci. Technol., 34 (5), 854-862.
Zhang, D., Lu, P., Long, T., and Verstraete, W. (2005). The integration of methanogensis with
simultaneous nitrification and denitrification in a membrane bioreactor. Process Biochem. 40,
541–547.
Zhang, Y., Love, N., and Edwards, M. (2009). Nitrification in drinking water systems. Crit. Rev.
Environ. Sci. Technol., 39 (3), 153-208.
Zhang, Y., Yan, L., Qiao, X., Chi, L., Niu, X., Mei, Z., et al. (2008). Integration of biological method
and membrane technology in treating palm oil mill effluent. J. Environ. Sci. 20, 558–564.
Zhou, H., and Smith, D. (2002). Advanced technologies in water and wastewater treatment. J.
Environ. Eng. Sci. 1, 247–264.
Zhou, P., Su, C., Li, B., and Qian, Y. (2006). Treatment of high-strength pharmaceutical wastewater
and removal of antibiotics in anaerobic and aerobic biological treatment processes. J. Environ.
Eng., 132 (1), 129-136.
Zumft, W. (1997). Cell biology and molecular basis of denitrification? Microbiol. Mol. Biol. Rev., 61
(4), 533-616.