COMAH LAND USE PLANNING ASSESSMENT FOR PROPOSED SUBSTATION …
58
_____________________________________ Technical Report Prepared For Huntstown Power Company _____________________________________ Technical Report Prepared By Mr Matthew Michie _____________________________________ Our Reference MM/20/11960RR01 ____________________________________ Date Of Issue 8 September 2021 _____________________________________ COMAH LAND USE PLANNING ASSESSMENT FOR PROPOSED SUBSTATION AND UNDERGROUND CABLE ROUTES, CO. DUBLIN
Transcript of COMAH LAND USE PLANNING ASSESSMENT FOR PROPOSED SUBSTATION …

_____________________________________
Technical Report Prepared For
Huntstown Power Company
_____________________________________ Technical Report Prepared By
Mr Matthew Michie
_____________________________________ Our Reference
MM/20/11960RR01
____________________________________ Date Of Issue
8 September 2021 _____________________________________
COMAH LAND USE PLANNING ASSESSMENT
FOR PROPOSED SUBSTATION AND
UNDERGROUND CABLE ROUTES, CO. DUBLIN

MM/20/11960RR01 AWN Consulting Limited
Page 2
Document History
Document Reference Original Issue Date
MM/20/11960RR01 8 September
Revision Level Revision Date Description Sections Affected
Record of Approval
Details Written by Approved by
Signature
Name Mr Matthew Michie Dr Moira Lewis
Title Consultant Senior Consultant
Date 8 September 8 September

MM/20/11960RR01 AWN Consulting Limited
Page 3
EXECUTIVE SUMMARY
A Land Use Planning assessment was completed for the proposed construction of a Substation that is in the vicinity of Huntstown Power Station, Co. Dublin. The Huntstown establishment is notified to the Health and Safety Authority (HSA) as a Lower Tier COMAH site and is subject to the provisions of the Chemicals Act (Control of Major Accident Hazards Involving Dangerous Substances) Regulations, 2015 (COMAH Regulations 2015). The risk-based approach is completed in accordance with current HSA policy and taking account of the Policy and Approach of the Health and Safety Authority to COMAH Risk-based Land-use Planning (19 March 2010). This report examines hazards associated with Fuel Oil, LPG, and Natural gas installations on site. The consequences modelling was carried out using TNO Effects Version 11.3.0 modelling software. The following is concluded:
Natural Gas VCE within a Turbine Enclosure:
• Overpressure levels corresponding to safe and light damage extends to the proposed Substation development;
• Overpressure levels corresponding to 1% mortality outdoors do not extend to the proposed Substation development;
• Overpressure levels corresponding to 1% mortality indoors (Cat. 2) do not extend to the proposed Substation development.
Natural Gas Jet Fire at the GNI AGI:
• The jet flame measures up to 258 m in length (depending on wind speed)
• The thermal radiation level corresponding to 1% mortality outdoors extends to the proposed Substation development; therefore, there is a possibility of fatality to persons outdoors in the event of a jet fire; however, the site is designed to be operated remotely and there are no permanent staff on-site.
• The thermal radiation level corresponding to 100% mortality indoors extends to the proposed development but does not extend to any buildings on site.
• The thermal radiation level corresponding to equipment damage extends to the proposed Substation. There is potential for damage to equipment at the substation.
• GNI will be responsible for the installation, operation, and maintenance of all equipment within the AGI gas compound. All operations within the AGI will comply with standard GNI operational procedures and risk assessments and will be carried out by approved GNI contractors.
In relation to impacts from a jet fire following rupture of the natural gas supply pipeline at the GNI AGI, it is noted that the thermal radiation impacts that are predicted are conservative as they are based on a mass flow rate of 661 kg/s, as recommended by TNO and as explained above. It is noted that after approximately 9 s the release rate will reduce to 126 kg/s and after 44 s it will reduce to less than 3 kg/s and will continue to reduce until all of the natural gas has been released from the pipeline (approximately 600 s or 10 minutes). Therefore, the estimated consequences are conservative. Bunded Pool Fire at Fuel Oil Storage Tanks
• The thermal radiation contour corresponding to the threshold of fatality (4.1 kW/m2) does not extend to the proposed Substation development.

MM/20/11960RR01 AWN Consulting Limited
Page 4
Uncontained Pool Fire following Bund Overtop
• The thermal radiation contour corresponding to the threshold of fatality does not extend to the proposed development;
• The thermal radiation contour corresponding to persons protected indoors does not extend to the proposed development.
LPG BLEVE and Fireball
• The Fireball radius does not extend to the proposed development.
• The thermal radiation corresponding to 1% fatality (6.8 kW/m2) extends to the proposed development, there is potential for fatality to persons outdoors at this establishment.
• The thermal radiation level corresponding to 0% mortality indoors (12.7 kW/m2) extends to the proposed development; however, there will be no buildings in this area; therefore, no fatalities are expected.
It is concluded that there is potential for fatalities to persons outdoors at the proposed development following a Fireball at the LPG tank at the Huntstown Power Station. However, the Substation is designed to be remotely operated and there are no permanent staff on-site. The cumulative individual risk contours for Huntstown Power Station corresponding to the boundary of the inner, middle and outer land use planning zones are illustrated as follows.
It is concluded that the LUP Outer zone and Middle zone of Huntstown Power Station extends to the proposed development. The individual risk contours corresponding to the Inner LUP zone does not extend to the proposed development; therefore, the level of individual risk at the proposed development is acceptable.

MM/20/11960RR01 AWN Consulting Limited
Page 5
CONTENTS Page
List of Figures .................................................................................................................... 6
List of Tables ...................................................................................................................... 7
1.0 INTRODUCTION ................................................................................................. 8
2.0 DESCRIPTION OF DEVELOPMENT ................................................................... 9
2.1 Huntstown Power Station ........................................................................ 9
3.0 BACKGROUND TO RISK ASSESSMENT AND LAND USE PLANNING ......... 14
3.1 Risk Assessment – An Introduction ....................................................... 14 3.2 Land Use Planning and Risk Assessment ............................................. 15 3.3 Land Use Planning and Societal Risk ................................................... 16
4.0 LAND USE PLANNING ASSESSMENT METHODOLOGY AND CRITERIA ..... 18
4.1 Consequence Assessment.................................................................... 18 4.2 Individual Risk Assessment Methodology ............................................. 26
5.0 IDENTIFICATION OF MAJOR ACCIDENT HAZARDS ..................................... 26
5.1 Vapour Cloud Explosion Scenario ......................................................... 26 5.2 Jet Fire Scenario ................................................................................... 26 5.3 Pool Fire Scenario ................................................................................ 27 5.4 Fireball and BLEVE ............................................................................... 28
6.0 LAND USE PLANNING ASSESSMENT OF MAJOR ACCIDENT HAZARDS AT PROPOSED OCGT plant .................................................................................. 28
6.1 Natural Gas Vapour Cloud Explosion at Turbine Enclosure .................. 28 6.2 Natural Gas Jet Fire .............................................................................. 32 6.3 Fuel Oil Tank Rupture and Pool Fire ..................................................... 41 6.4 LPG Fireball and BLEVE ....................................................................... 47
7.0 LAND USE PLANNING RISK CONTOURS ....................................................... 53
8.0 CONCLUSION ................................................................................................... 54
9.0 REFERENCES .................................................................................................. 57

MM/20/11960RR01 AWN Consulting Limited
Page 6
List of Figures
Figure 1 Site Boundary of proposed Substation (red) .......................................................... 11 Figure 2 Proposed Substation Site Layout .......................................................................... 12 Figure 3 Huntstown Power Station Site Layout ................................................................... 13 Figure 4 Wind Rose Dublin Airport 1989 – 2018 (Met.ie) .................................................... 25 Figure 5 Natural Gas VCE in Phase 1 Turbine Enclosure: Overpressure vs Distance ......... 30 Figure 6 Natural Gas VCE in Phase 1 Turbine Enclosure: Probability of Fatality vs Distance30 Figure 7 Natural Gas VCE in Turbine Enclosure: Blast Damage Contours .......................... 31 Figure 8 Natural Gas VCE in Phase 1 Turbine Enclosure: Indoor Mortality Contours, Category 2 Buildings .......................................................................................................................... 31 Figure 9 Natural Gas VCE in Turbine Enclosure: Outdoor Mortality Contours ..................... 32 Figure 10 High Pressure Natural Gas Supply Pipeline Rupture: Release Rate vs. Time ..... 34 Figure 11 High Pressure Natural Gas Supply Pipeline Rupture: Mass Released vs. Time .. 34 Figure 12 Natural Gas Jet Fire at GNI AGI: Frustum Shape ................................................ 36 Figure 13 Natural Gas Jet Fire at GNI AGI: Thermal Radiation vs. Distance ....................... 37 Figure 14 Natural Gas Jet Fire at GNI AGI: Probability of Fatality Outdoors vs. Distance ... 37 Figure 15 Natural Gas Jet Fire at GNI AGI: Probability of Fatality Indoors vs. Distance ...... 38 Figure 16 Natural Gas Jet Fire at GNI AGI: Outdoor Mortality Contours............................. 40 Figure 17 Natural Gas Jet Fire at GNI AGI: Indoor Mortality and Equipment Damage Contours ........................................................................................................................................... 40 Figure 18 Fuel Storage Bunded Pool Fire: Thermal Radiation vs Distance ......................... 43 Figure 19 Fuel Storage Bunded Pool Fire: Threshold of Fatality Contour (4.1 kW/m2) ........ 43 Figure 20 Fuel Oil Uncontained Pool Fire: Thermal Radiation vs Distance .......................... 45 Figure 21 Fuel Oil Uncontained Pool Fire: Probability of Fatality Outdoors vs Distance ...... 46 Figure 22 Uncontained Pool Fire: Thermal radiation contours ............................................. 46 Figure 23 LPG BLEVE: Overpressure vs Distance .............................................................. 48 Figure 24 LPG BLEVE: Probability of Fatality vs Distance .................................................. 49 Figure 25 LPG BLEVE: Blast Damage Contours ................................................................. 49 Figure 26 LPG BLEVE: Indoor Mortality Contours (Category 2) .......................................... 50 Figure 27 LPG BLEVE: Outdoor Mortality Contours ............................................................ 50 Figure 28 LPG Fireball: Fireball, threshold of fatality (4.1 kW/m2) and 1% fatality contours (6.8 kW/m2) ................................................................................................................................ 51 Figure 29 LPG Fireball: Indoor Mortality .............................................................................. 52 Figure 30 Land Use Planning Individual Risk Contours for Huntstown Power Station ......... 53

MM/20/11960RR01 AWN Consulting Limited
Page 7
List of Tables
Table 1 Dangerous Substances Stored at Huntstown Power Station .................................. 10 Table 2 Annual Fatality Rates for a Variety of Activities ...................................................... 15 Table 3 LUP Matrix ............................................................................................................. 16 Table 4 Heat Flux Consequences ....................................................................................... 20 Table 5 Heat Flux Consequences Indoors .......................................................................... 20 Table 6 Conversion from Probits to Percentage .................................................................. 21 Table 7 Blast Damage ......................................................................................................... 22 Table 8 Injury Criteria from Explosion Overpressure ........................................................... 23 Table 9 Blast Overpressure Consequences Indoors ........................................................... 23 Table 10 Atmospheric Stability Class .................................................................................. 24 Table 11 Surface Roughness .............................................................................................. 26 Table 12 Natural Gas VCE in Phase 1 Turbine Enclosure: Model Inputs ............................ 29 Table 13 Natural Gas VCE Phase 1 Turbine Enclosure: Model Outputs ............................. 29 Table 14 High Pressure Natural Gas Supply Pipeline Rupture: Discharge Model Inputs ..... 33 Table 15 Natural Gas Jet Fire at GNI AGI: Model Inputs ..................................................... 35 Table 16 Natural Gas Jet Fire at GNI AGI: Model Outputs .................................................. 36 Table 17 Natural Gas Jet Fire at GNI AGI: Calculated Distances at Specified Thermal Radiation Levels ................................................................................................................. 38 Table 18 Fuel storage tank and bund properties ................................................................. 42 Table 19 Fuel Oil Pool Fire Model Inputs ........................................................................... 42 Table 20 Fuel Storage Uncontained Pool Fire: Model Inputs............................................... 44 Table 21 Uncontained Pool Fire: Model Outputs ................................................................. 44 Table 22 Uncontained Pool Fire: Distances to Specified Thermal Radiation Levels ............ 45 Table 23 LPG BLEVE and Fire Ball: Model Inputs .............................................................. 48 Table 24 LPG Fireball: Model Outputs ................................................................................ 51

MM/20/11960RR01 AWN Consulting Limited
Page 8
1.0 INTRODUCTION
AWN Consulting Ltd. was engaged by Huntstown Power Company to complete a COMAH Land Use Planning Assessment to accompany the planning application to An Bord Pleanála (ABP) for the proposed strategic infrastructure development at the site of c.4.33 ha on lands adjacent to Huntstown Power Station, North Road, Finglas, Dublin 11.
The existing huntstown power station, owned by Huntstown Power Company limited, and Operated by Gensys Power Ltd., is located directly to the west of the development lands. This site is a notified to the Health and Safety Authority (HSA) as a Lower Tier COMAH site and is subject to the provisions of the European Communities (Control of Major Accident Hazards Involving Dangerous Substances) Regulations, 2015 (COMAH Regulations 2015).
This report details the following:
• Description of development;
• Background to risk assessment and land use planning context;
• Land Use Planning assessment methodology and criteria;
• Identification of Major Accident Hazards;
• Land Use Planning Assessment of Major Accident Scenarios;
• Land Use Planning Contours;
• Conclusions.

MM/20/11960RR01 AWN Consulting Limited
Page 9
2.0 DESCRIPTION OF DEVELOPMENT
The proposed development will consist of the construction of a 2 storey 220 kV Gas Insulated Switchgear (GIS) substation known as ‘Mooretown’ comprising switchgear floor, cable pit/entry room, generator room, relay room, battery room, workshop, toilet, store room, mess room, hoist space, stair cores and circulation areas (c.2,068 sqm total gross floor area) with an overall height of c.17m located within an overall EirGrid and Customer compound (c.11,231 sqm in area). Lightning electrodes are attached to the roof of the substation building resulting in an overall height of c.20m. The compound includes 4 no. 220/20 kV transformers, 4 no. 20 kV switchgear buildings and 1 no. 20 kV control room buildings (c.5 m high and c. 35.5 sqm in area each), 220 kV series coil (equipment), fire walls (ranging from c.10 m-12.5 m high), lightning finials and monopoles (c.20 m high). The overall compound is surrounded by a c.2.6 m high palisade fence.
The underground transmission lines (4 no.) will connect the proposed 220 kV GIS Mooretown Substation serving the data hall development proposed under concurrent application (Reg. Ref. FW21A/0151) located on lands adjacent to Huntstown Power Station, North Road, Finglas, Dublin 11 with the 220 kV Finglas cable route located to the south of the site on the private road connecting the North Road with Huntstown Power Station and Huntstown Quarry, with the 220 kV Corduff cable route located to the west of the site and just north of the private road connecting the North Road with Huntstown Power Station and Huntstown Quarry and to the existing Huntstown 220 kV AIS station to the west via 220 kV cables to the Huntstown A and Huntstown B circuits. The four proposed transmission cables cover a distance of between c.125m and c.300m each between the proposed substation and the adjacent connection points.
The proposed development is designed to be remotely operated and will only be occupied during periodic maintenance. The proposed development site is c. 4.33 hectares of predominantly greenfield located to the north west of the M50 orbital ring in the townland of Johnstown and Coldwinters, North Road, Finglas, Dublin 11. The surrounding area is characterised by a variety of energy, industrial, commercial, quarrying, agricultural and residential uses. The subject site is generally bounded to the northeast by the Dogs Trust (Dog Rescue and Rehoming Charity), the southern end of the site is traversed by a vehicular entrance leading to the Huntstown Quarry and bound to the south by an Anaerobic Digestion Plant. The site is bound to the west by the existing Huntstown Power Station. The site location is illustrated on Figure 1 and the proposed substation is illustrated on Figure 2.
2.1 Huntstown Power Station
The existing huntstown power station, owned by Huntstown Power Company limited, and Operated by Gensys Power Ltd., is located directly to the west of the development lands. This site is a notified to the Health and Safety Authority (HSA) as a Lower Tier COMAH site and is subject to the provisions of the European Communities (Control of Major Accident Hazards Involving Dangerous Substances) Regulations, 2015 (COMAH Regulations 2015).
Huntstown Power Station is a Combined Cycle power station providing electricity to the national grid. The site consists of two separate power plants, referred to as Phase 1 and Phase 2.

MM/20/11960RR01 AWN Consulting Limited
Page 10
Phase 1 consists of a high efficiency 343 MW Combined Cycle Gas Turbine (CCGT) power plant operated on natural gas, with distillate oil as a standby fuel. Phase 2 consists of a high efficiency 401 MW CCGT power plant operated on natural gas, also with distillate oil as a standby fuel. Natural gas is mixed with compressed air and ignited so that the hot gas expands through the turbine which in turn generates energy through the gas turbine generators. Hot exhaust gases are passed through an exhaust duct and are used to raise stream in the waste heat recovery boiler. Steam then expands through the steam turbine to generate additional electricity. The Huntstown site comprises the following installations with major accident potential:
• 2 no Combined Cycle Gas Turbine (CCGT) (Phase 1 and Phase 2);
• Natural Gas Supply;
• LPG tank;
• Distillate Storage.
The layout of the Huntstown Power Station is illustrated Figure 3. The dangerous substances and quantities that may be stored at Huntstown Power Station are listed in Table 1.
Substance Quantity (tonnes)
Hydrogen 0.13
LPG 1.53
Petroleum Products (HFO, Diesel, Petrol) 13420 Table 1 Dangerous Substances Stored at Huntstown Power Station

MM/20/11960RR01 AWN Consulting Limited
Page 11
Figure 1 Site Boundary of proposed Substation (red)

MM/20/11960RR01 AWN Consulting Limited
Page 12
Figure 2 Proposed Substation Site Layout (AECOM 60641561-DWG-701)

MM/20/11960RR01 AWN Consulting Limited
Page 13
Figure 3 Huntstown Power Station Site Layout
Phase 2 Diesel tank and bund
Phase 1 Diesel tank and bund
GNI AGI
LPG Tank Gas Turbine Hall

MM/20/11960RR01 AWN Consulting Limited
Page 14
3.0 BACKGROUND TO RISK ASSESSMENT AND LAND USE PLANNING
3.1 Risk Assessment – An Introduction Trevor Kletz (Kletz, 1999) in his seminal work on the subject stated that the essential elements of quantitative risk assessment (QRA) are (i) how often is a Major Accident Hazard (MAH) likely to occur and (ii) Consequence Analysis – what is the impact of the incident: Kletz also commented that another way of expressing this method of QRA is:
How often? How big? So what?
In QRA, the “how often?” question refers to the frequency of the major accident scenario and is answered with reference to historical industry data for similar incidents, or by using frequency analysis techniques. Section 2 of the Health and Safety Authority (HSA) Land Use Planning Policy and Approach document (Introduction to Technical Aspects) describes the policy and approach as follows: “The policy of the HSA is that a simplified application of a risk based approach is the most appropriate for land use planning. The difficulties associated with the complexity of analyzing many scenarios can be avoided by considering a small number of carefully chosen representative events, whose frequency has been estimated conservatively.” The frequency data for major accident scenarios identified in this assessment is based on these conservative frequency values. The ‘how big’ element of the QRA was conducted using TNO Effects modelling software. The “so what” element is perhaps the most contentious issue associated with QRA, as one is essentially asking what is an acceptable level of risk, in this case risk of fatality, posed by a facility. It is widely accepted that “no risk” scenarios do not exist. The occupier of a house with gas fired central heating is exposed to the risk posed by the presence of a natural gas supply in the house. Statistics from the UK Health and Safety Executive (UK HSE Risks associated with Gas Supply, 1993) show that the annual risk of death from gas supply events in the UK (risks include explosion, asphyxiation by fumes from poorly vented heaters, poisoning by gas leaks) is approximately 1.1 in a million. In other words, for every 10 million persons living in houses with a gas supply, 11 will die annually from events related to the supply. Table 2 below presents the annual fatality rates, and the risk of fatality, for a number of activities (from CIRIA Report 152, 1995) in the UK.

MM/20/11960RR01 AWN Consulting Limited
Page 15
Risk Annual Fatality Rate
(per 1,000, 000 people at risk)
Annual Risk of Fatality
Motorcycling 20,000 1 in 50
Smoking (all causes) 3000 1 in 333
Smoking (cancer) 1200 1 in 830
Fire fighting 800 1 in 1250
Farming 360 1 in 2778
Police work (non-clerical) 220 1 in 4545
Road accidents 100 1 in 10,000
Fires 28 1 in 35,700
Natural gas supply to house 1.1 1 in 909,090
Lightning strike 0.5 1 in 2,000,000
Table 2 Annual Fatality Rates for a Variety of Activities
Kletz has shown that the average industrial worker is exposed to a risk of accidental death of somewhere around 1 x 10⁻³ per year, for all situations (work, home, travel).
3.2 Land Use Planning and Risk Assessment
The Seveso III Directive (2012/18/EU) requires Member States to ensure that the objectives of preventing major accidents and limiting the consequences of such accidents for human health and the environment are taken into account in land use planning policies through controls on the siting of new establishments, modifications to establishments and certain types of new developments in the vicinity of establishments. Under the 2015 COMAH Regulations, the Central Competent Authority (the Health and Safety Authority) provides land use planning advice to planning authorities. This land use planning assessment has been carried out in accordance with the HSA’s Policy and Approach to COMAH Risk-based Land-use Planning (HSA, 2010). This approach involves delineating three zones for land use planning guidance purposes, based on the potential risk of fatality from major accident scenarios resulting in damaging levels of thermal radiation (e.g. from pool fires), overpressure (e.g. from vapour cloud explosions) and toxic gas concentrations (e.g. from an uncontrolled toxic gas release). The HSA has defined the boundaries of the Inner, Middle and Outer Land Use Planning (LUP) zones as: 10E-05/year Risk of fatality for Inner Zone (Zone 1) boundary 10E-06/year Risk of fatality for Middle Zone (Zone 2) boundary 10E-07/year Risk of fatality for Outer Zone (Zone 3) boundary
The process for determining the distances to the boundaries of the inner, middle and outer zones is outlined as follows:
• Determine the consequences of major accident scenarios using the modelling methodologies described in the HSA LUP Policy/Approach Document (HSA, 2010);
• Determine the severity (probability of fatality) using the probit functions specified by the HSA;
• Determine the frequency of the accident (probability of event) using data specified by the HSA;

MM/20/11960RR01 AWN Consulting Limited
Page 16
• Determine the individual risk of fatality as follows:
Risk = Frequency x Severity
The 2010 HSA Risk-Based LUP Policy/Approach document provides guidance on the type of development appropriate to the inner, middle and outer LUP zones. The advice for each zone is based on the UK Health and Safety Executive (HSE) Land Use Planning Methodology. The methodology sets four levels of sensitivity, with sensitivity increasing from 1 to 4, to describe the development types in the vicinity of a COMAH establishment.
The Sensitivity Levels used in the Land Use Planning Methodology are based on a rationale which allows progressively more severe restrictions to be imposed as the sensitivity of the proposed development increases. The sensitivity levels are:
Level 1 Based on normal working population;
Level 2 Based on the general public – at home and involved in normal
activities;
Level 3 Based on vulnerable members of the public (children, those
with mobility difficulties or those unable to recognise physical
danger); and
Level 4 Large examples of Level 3 and large outdoor examples of
Level 2 and Institutional Accommodation.
Table 3 details the matrix that is used by the HSA to advise on suitable development for technical LUP purposes:
Level of Sensitivity Inner Zone (Zone 1) Middle Zone (Zone 2) Outer Zone (Zone 3)
Level 1 ✓ ✓ ✓
Level 2 × ✓ ✓
Level 3 × × ✓
Level 4 × × ×
Table 3 LUP Matrix
3.3 Land Use Planning and Societal Risk
Vrijling and van Gelder (2004) have defined Societal Risk as: “the relation between frequency and the number of people suffering from a specified level of harm in a given population from the realisation of specified hazards” An important distinction in Societal Risk assessment is the number of persons that may be affected by off-site impacts, such as people with restricted mobility or children that may be affected by the need to rapidly evacuate a significant number of people from an area. It is therefore prudent, when considering the Societal Risk Impacts of a development, to consider the nature and extent of a population which could be located in the vicinity of establishments with major accident hazard potential, or if adjacent lands are not already developed, to consider the nature and extent of a population which should be permitted to be located in this area. It is recognised that it is not necessary to restrict all access by people to such lands, but

MM/20/11960RR01 AWN Consulting Limited
Page 17
it is considered prudent to restrict the number and type of persons which could be impacted. The HSA LUP Policy and Approach document (HSA, 2010) recommends that for some types of development, particularly those involving large numbers of people, it is likely that the deciding factor from the point of view of land use planning is the societal risk, i.e. the risk of large numbers of people being affected in a single accident. The HSA specifies the following societal risk criteria:
• Upper societal risk criterion value of 1 in 5000 for 50 fatalities (planning authority should advise against permitting the development)
• Broadly acceptable region of 1 in 100,000 for 10 fatalities (planning authority should not advise against permitting the development)
• Significant risk regions between these two values (planning authority should be advised of HSA approach to Risk-based Land Use Planning)

MM/20/11960RR01 AWN Consulting Limited
Page 18
4.0 LAND USE PLANNING ASSESSMENT METHODOLOGY AND CRITERIA This COMAH land use planning assessment has been completed in accordance with risk based approach set out in the HSA’s Policy and Approach to COMAH Risk-based Land-use Planning (HSA, 2010). LUP assessments are completed in the following steps:
• Identify major accident scenarios with reference to the HSA Policy document (HSA, 2010);
• Consequence modelling of major accident scenarios;
• Assign frequencies to major accident scenarios with reference to frequency values outlined in the HSA’s Policy document (HSA, 2010);
• Assessment of individual risk and generation of individual risk contours;
• Where necessary, assessment of societal risk using societal risk indices.
4.1 Consequence Assessment The impacts of physical effects were determined by modelling accident scenarios using TNO Effects Version 11.3.0 modelling software.
Flammable and Overpressure Hazards
The flammable hazards, which may be observed during major accidents, include the following:
Flash Fire: Flash fires are associated with major accidents involving releases of flammable liquids or gases, which form a gas/vapour cloud which ignites at some point remote from the release point. Combustion takes place relatively slowly and there is no significant overpressure. It is generally assumed that the thermal effects are limited to people within the flame envelope where there is a high probability of fatality. Flash fires would have a negligible effect on plant and buildings due to the short duration of the fire and the negligible overpressures created. Vapour Cloud Explosion A Vapour Cloud Explosion (VCE) may be observed during major accidents. Combustion of a flammable gas-air mixture will occur if the composition of the mixture lies in the flammable range and if an ignition source is available. When ignition occurs in a flammable region of the cloud, the flame will start to propagate away from the ignition source. The combustion products expand causing flow ahead of the flame. Initially this flow will be laminar. Under laminar or near laminar conditions the flame speeds for normal hydrocarbons are in the order of 5 to 30 m/s which is too low to produce any significant blast over-pressure. Under these conditions, the vapour cloud will simply burn, causing a flash fire. In order for a vapour cloud explosion to occur, the vapour cloud must be in a turbulent condition. Turbulence may arise in a vapour cloud in various ways:
• By the release of the flammable material itself, for instance a jet release from a high pressure vessel.
• By the interaction of the expansion flow ahead of the flame with obstacles

MM/20/11960RR01 AWN Consulting Limited
Page 19
present in a congested area. In the case of a vapour cloud explosion the principal parameter of interest is the over-pressure observed at various locations. Fireball and BLEVE Fireballs are short-lived flames which generally result from the ignition and combustion of turbulent vapour/two-phase (i.e. aerosol) fuels in air. Releases that fuel fireballs are usually near instantaneous and commonly involve the catastrophic failure of pressurised vessels/pipelines. Fireballs can dissipate large amounts of thermal radiation, which away from their visible boundaries, may transmit heat energy that could be hazardous to life and property. A BLEVE is an explosion which occurs when a storage vessel containing a liquid at a temperature significantly above its boiling point at normal atmospheric pressure, experiences a catastrophic failure. Unlike a vapour cloud explosion, the liquid in question does not have to be flammable, however most of the BLEVEs recorded have been associated with facilities which stored flammable material. The catastrophic failure of a storage vessel and the subsequent rapid vaporisation of the liquid within the vessel produces an explosion overpressure. A BLEVE involving flammable liquid produces both an explosion overpressure and a buoyant fireball.
Physical Effects Modelling The impacts of physical and health effects on workers and the general public outside of the proposed development boundary were determined by modelling accident scenarios using TNO Effects modelling software. Thermal radiation exposure criteria is based on the concept of a ‘dangerous dose’. A ‘dangerous dose’ is defined by the UK Health and Safety Executive as a dose where there is extreme distress to almost everyone, with a substantial proportion of affected persons requiring medical attention and some highly susceptible people might be killed (about 1% fatalities).
Thermal Radiation Criteria Fire scenarios have the potential to create hazardous heat fluxes. Therefore, thermal radiation on exposed skin poses a risk of fatality. Potential consequences of damaging radiant heat flux and direct flame impingement are categorised in Table 4 (HSA, 2010, CCPS, 2000, EI, 2007 and McGrattan et al, 2000).
Thermal Flux
(kW/m2) Consequences
1 – 1.5 Sunburn
5 – 6 Personnel injured (burns) if they are wearing normal clothing and do not escape quickly
8 – 12 Fire escalation if long exposure and no protection
32 – 37.5 Fire escalation if no protection (consider flame impingement)
31.5 US DHUD, limit value to which buildings can be exposed

MM/20/11960RR01 AWN Consulting Limited
Page 20
Thermal Flux
(kW/m2) Consequences
37.5 Process equipment can be impacted, AIChE/CCPS
Up to 350 In flame. Steel structures can fail within several minutes if unprotected or not cooled.
Table 4 Heat Flux Consequences
In relation to persons indoors, the HSA have specified the thermal radiation consequence criteria (from an outdoor fire) detailed in Table 5 (HSA, 2010).
Thermal Flux
(kW/m2)
Consequences
> 25.6 Building conservatively assumed to catch fire quickly and so 100% fatality probability
12.7 – 25.6 People are assumed to escape outdoors, and so have a risk of fatality corresponding to that outdoors
< 12.7 People are assumed to be protected, so 0% fatality probability
Table 5 Heat Flux Consequences Indoors
Thermal Dose Unit (TDU) is used to measure exposure to thermal radiation. It is a function of intensity (power per unit area) and exposure time: Thermal Dose = I1.33 t
where the Thermal Dose Units (TDUs) are (kW/m2)4/3.s, I is thermal radiation intensity (kW/m2) and t is exposure duration (s). The HSA recommends that the Eisenberg probit function (HSA, 2010) is used to determine probability of fatality to persons outdoors from thermal radiation as follows:
Probit = -14.9 + 2.56 ln (I1.33 t)
I Thermal radiation intensity (kW/m2) t exposure duration (s) Probit (Probability Unit) functions are used to convert the probability of an event occurring to percentage certainty that an event will occur. The probit variable is related to probability as follows (CCPS, 2000):
−
−
−=
5 2
2exp
2
1Y
duu
P
where P is the probability of percentage, Y is the probit variable, and u is an integration variable. The probit variable is normally distributed and has a mean value of 5 and a standard deviation of 1. The Probit to percentage conversion equation is (CCPS, 2000):
−
−
−+=
2
5
5
5150
Yerf
Y
YP
The relationship between Probit and percentage certainty is presented in Table 6 (CCPS,

MM/20/11960RR01 AWN Consulting Limited
Page 21
2000).
Table 6 Conversion from Probits to Percentage
For long duration fires, such as jet fires, it is generally reasonable to assume an effective exposure duration of 75 seconds to take account of the time required to escape (HSA, 2010). It is noted that this is a conservative estimation of the time taken to escape and is used in consequence assessment as the maximum exposure duration for heat radiation. With respect to exposure to thermal radiation outdoors, the Eisenberg probit relationship implies:
• 1% fatality – 966 TDUs (6.8 kW/m2 for 75 s exposure duration) (Dangerous Dose)
• 10% fatality – 1452 TDUs (9.23 kW/m2 for 75 s exposure duration)
• 50% fatality – 2387 TDUs (13.4 kW/m2 for 75 s exposure duration)
Overpressure Criteria
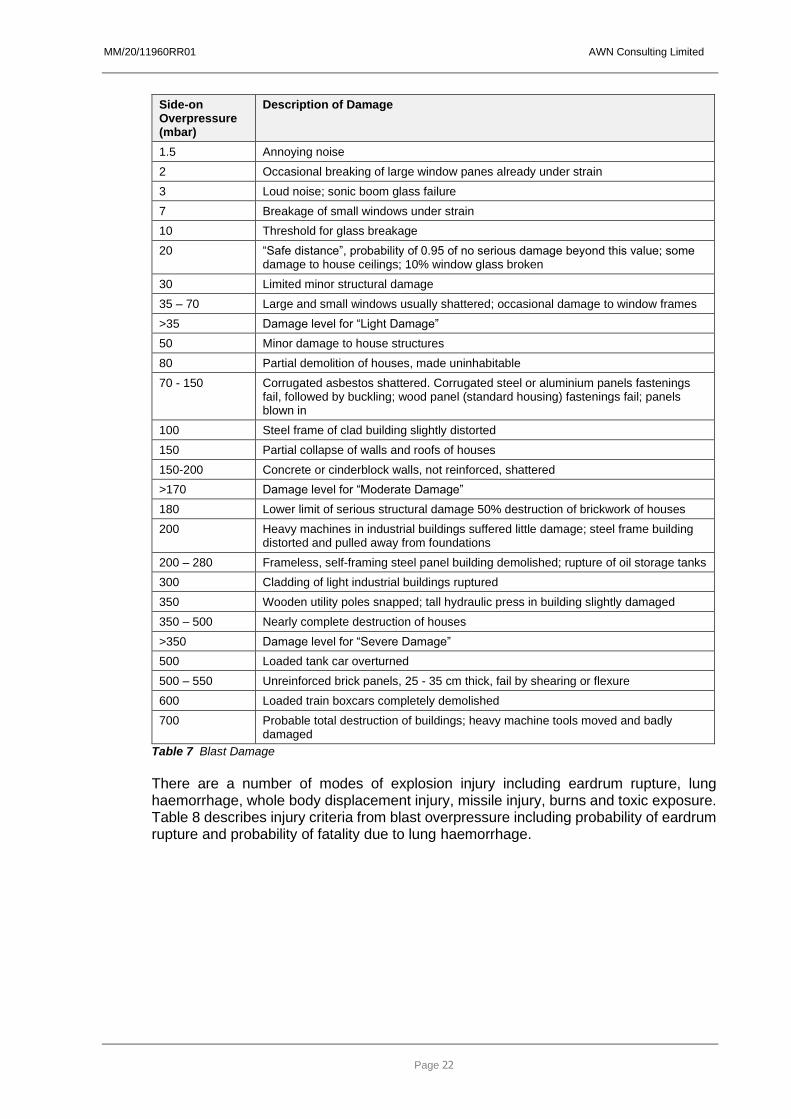
Explosions scenarios can result in damaging overpressures, especially when flammable vapour/air mixtures are ignited in a congested area. Table 7 below describes blast damage for various overpressure levels (Mannan, 2012).
MM/20/11960RR01 AWN Consulting Limited
Page 22
Side-on Overpressure (mbar)
Description of Damage
1.5 Annoying noise
2 Occasional breaking of large window panes already under strain
3 Loud noise; sonic boom glass failure
7 Breakage of small windows under strain
10 Threshold for glass breakage
20 “Safe distance”, probability of 0.95 of no serious damage beyond this value; some damage to house ceilings; 10% window glass broken
30 Limited minor structural damage
35 – 70 Large and small windows usually shattered; occasional damage to window frames
>35 Damage level for “Light Damage”
50 Minor damage to house structures
80 Partial demolition of houses, made uninhabitable
70 - 150 Corrugated asbestos shattered. Corrugated steel or aluminium panels fastenings fail, followed by buckling; wood panel (standard housing) fastenings fail; panels blown in
100 Steel frame of clad building slightly distorted
150 Partial collapse of walls and roofs of houses
150-200 Concrete or cinderblock walls, not reinforced, shattered
>170 Damage level for “Moderate Damage”
180 Lower limit of serious structural damage 50% destruction of brickwork of houses
200 Heavy machines in industrial buildings suffered little damage; steel frame building distorted and pulled away from foundations
200 – 280 Frameless, self-framing steel panel building demolished; rupture of oil storage tanks
300 Cladding of light industrial buildings ruptured
350 Wooden utility poles snapped; tall hydraulic press in building slightly damaged
350 – 500 Nearly complete destruction of houses
>350 Damage level for “Severe Damage”
500 Loaded tank car overturned
500 – 550 Unreinforced brick panels, 25 - 35 cm thick, fail by shearing or flexure
600 Loaded train boxcars completely demolished
700 Probable total destruction of buildings; heavy machine tools moved and badly damaged
Table 7 Blast Damage
There are a number of modes of explosion injury including eardrum rupture, lung haemorrhage, whole body displacement injury, missile injury, burns and toxic exposure. Table 8 describes injury criteria from blast overpressure including probability of eardrum rupture and probability of fatality due to lung haemorrhage.

MM/20/11960RR01 AWN Consulting Limited
Page 23
Probability of Eardrum Rupture (%) Peak overpressure (mbar)
1 (threshold) 165
10 194
50 435
90 840
Probability of Fatality due to Lung Haemorrhage (%)
Peak overpressure (mbar)
1 (threshold) 1000
10 1200
50 1400
90 1750
Table 8 Injury Criteria from Explosion Overpressure
The HSA recommends that the Hurst, Nussey and Pape probit function (HSA, 2010) is used to determine probability of fatality to persons outdoors from overpressure as follows:
Probit = 1.47 + 1.35ln P
P Blast overpressure (psi)
The Hurst, Nussey and Pape probit relationship implies:
• 1% fatality – 168 mbar (Dangerous Dose)
• 10% fatality – 365 mbar
• 50% fatality – 942 mbar
The HSA uses relationships published by the Chemical Industries Association (CIA) to determine the probability of fatality for building occupants exposed to blast overpressure. The CIA has developed relationships for 4 categories of buildings (CIA, 2010):
• Category 1: hardened structure building (special construction, no windows);
• Category 2: typical office block (four storey, concrete frame and roof, brick block wall panels);
• Category 3: typical domestic dwelling (two storey, brick walls, timber floors); and
• Category 4: ‘portacabin’ type timber construction, single storey.
The CIA relationships imply the overpressure levels corresponding to probabilities of fatality of 1%, 10% and 50% detailed in Table 9 below.
Probability of fatality Overpressure Level, mbar
Category 1 Category 2 Category 3 Category 4
1% fatality (dangerous dose)
435 100 50 50
10% fatality 519 183 139 115
50% fatality 590 284 300 242
Table 9 Blast Overpressure Consequences Indoors
For the purposes of this assessment, it is assumed that the vulnerability of building occupants in the vicinity of the proposed development to side-on overpressure are represented by Category 2 type structures.

MM/20/11960RR01 AWN Consulting Limited
Page 24
Modelling Parameters
4.1.5.1 Weather Conditions Weather conditions at the time of a major accident have a significant impact on the consequences of the event. Typically, high wind speeds increase the impact of fires, particularly pool fires, while the associated turbulence dilutes vapour clouds, reducing the impact of toxic and flammable gas releases. Atmospheric Stability Class and Wind Speed Atmospheric stability describes the amount of turbulence in the atmosphere. The stability depends on the windspeed, time of day, and other conditions. Atmospheric stability classes are described in Table 10 (DNV, PHAST supporting documentation).
Wind speed (m/s)
Day: Solar Radiation Night: Cloud Cover
Strong Moderate Slight Thin, <40%
Moderate Overcast,
>80%
2 A A-B B - - D
2 – 3 A-B B C E F D
3 – 5 B B-C C D E D
5 – 6 C C-D D D D D
6 C D D D D D
Table 10 Atmospheric Stability Class
Stability classes are described as follows:
• A very unstable (sunny with light winds)
• B unstable (moderately sunny, stronger winds than class A)
• C slightly unstable – very windy/sunny or overcast/light wind
• D neutral – little sun and high wind or overcast night
• E stable – moderately stable – less overcast and windy than class D
• F very stable – night with moderate clouds and light/moderate winds The following Pasquill stability/wind speed pairs are specified by the HSA in Ireland for consequence modelling:
• Average weather conditions are represented by stability category D and a wind speed of 5 m/s, i.e. Category D5;
• Worst case conditions for toxic dispersion are represented by stability category F and a wind speed of 2 m/s, i.e. Category F2;
• A wind speed of 10 m/s represents the worst case condition for fire scenarios, with stability category D, i.e. Category D10.
Wind Direction and Ambient Temperature The nearest synoptic metrological station to the Huntstown establishment for which long term meteorological data is available is at Dublin Airport. Figure 4 illustrates a wind rose for Dublin Airport (1989 – 2018). It can be seen that the prevailing wind direction is from the south west (240°).

MM/20/11960RR01 AWN Consulting Limited
Page 25
Figure 4 Wind Rose Dublin Airport 1989 – 2018 (Met.ie)
Ambient Temperature The ambient and surface temperature conditions significantly impact the results of the consequence modelling. Typically, atmospheric temperatures in the Dublin area range from -12.2°C to 28.7°C through the year (Dublin Airport 1989 – 2018 averages, www.met.ie). According to the weather data recorded between 1980 and 2018 at Dublin Airport, the average atmospheric temperature observed is 9.8°C. Therefore, an ambient temperature of 10°C has been selected to represent typical temperature conditions at the site. Ambient Humidity Weather data for Dublin Airport, monthly and annual mean and extreme values datasheet supplied by Met Éireann, indicates a mean morning (09:00 UTC) relative humidity of 83% and a mean afternoon (15:00 UTC) humidity of 73.3%. Therefore, for this assessment, a representative ambient humidity of 80% has been assumed.
4.1.5.2 Surface Roughness
Surface roughness describes the roughness of the surface over which the cloud is dispersing. Typical values for the surface roughness are as follows (DNV, PHAST supporting documentation):
0%
1%
2%
3%
4%
5%
6%
7%
8%
010
20
30
40
50
60
70
80
90
100
110
120
130
140
150
160170
180190
200
210
220
230
240
250
260
270
280
290
300
310
320
330
340350
Dublin Airport Wind Rose1989 - 2018
<=1.54 m/s
<=3.09 m/s
<=5.14 m/s
<=8.23 m/s
<=10.8 m/s
>10.8 m/s
Total
MM/20/11960RR01 AWN Consulting Limited
Page 26
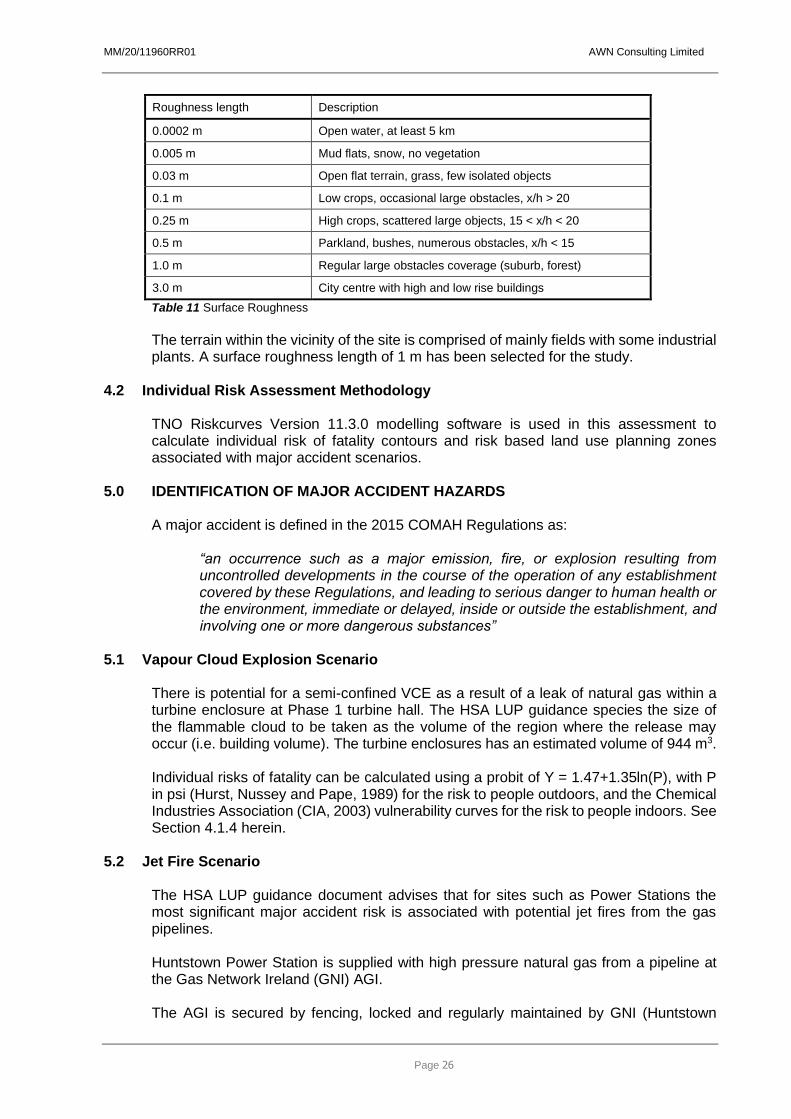
Roughness length Description
0.0002 m Open water, at least 5 km
0.005 m Mud flats, snow, no vegetation
0.03 m Open flat terrain, grass, few isolated objects
0.1 m Low crops, occasional large obstacles, x/h > 20
0.25 m High crops, scattered large objects, 15 < x/h < 20
0.5 m Parkland, bushes, numerous obstacles, x/h < 15
1.0 m Regular large obstacles coverage (suburb, forest)
3.0 m City centre with high and low rise buildings
Table 11 Surface Roughness
The terrain within the vicinity of the site is comprised of mainly fields with some industrial plants. A surface roughness length of 1 m has been selected for the study.
4.2 Individual Risk Assessment Methodology TNO Riskcurves Version 11.3.0 modelling software is used in this assessment to calculate individual risk of fatality contours and risk based land use planning zones associated with major accident scenarios.
5.0 IDENTIFICATION OF MAJOR ACCIDENT HAZARDS A major accident is defined in the 2015 COMAH Regulations as:
“an occurrence such as a major emission, fire, or explosion resulting from uncontrolled developments in the course of the operation of any establishment covered by these Regulations, and leading to serious danger to human health or the environment, immediate or delayed, inside or outside the establishment, and involving one or more dangerous substances”
5.1 Vapour Cloud Explosion Scenario
There is potential for a semi-confined VCE as a result of a leak of natural gas within a turbine enclosure at Phase 1 turbine hall. The HSA LUP guidance species the size of the flammable cloud to be taken as the volume of the region where the release may occur (i.e. building volume). The turbine enclosures has an estimated volume of 944 m3. Individual risks of fatality can be calculated using a probit of Y = 1.47+1.35ln(P), with P in psi (Hurst, Nussey and Pape, 1989) for the risk to people outdoors, and the Chemical Industries Association (CIA, 2003) vulnerability curves for the risk to people indoors. See Section 4.1.4 herein.
5.2 Jet Fire Scenario The HSA LUP guidance document advises that for sites such as Power Stations the most significant major accident risk is associated with potential jet fires from the gas pipelines. Huntstown Power Station is supplied with high pressure natural gas from a pipeline at the Gas Network Ireland (GNI) AGI. The AGI is secured by fencing, locked and regularly maintained by GNI (Huntstown

MM/20/11960RR01 AWN Consulting Limited
Page 27
personnel do not have access to it). An emergency shutoff valve on the high-pressure supply pipeline can be activated from the main control room, it is pneumatically operated and fail closed. The area is ATEX rated. Information on the GNI high pressure natural gas pipeline that supplies natural gas to Huntstown Power Station was obtained from GNI is as follows:
• 300 mm diameter
• 70 bar design pressure
The ‘Wilson Model’ (TNO Yellow Book, 2005) models discharge from a long pipeline. The initial release rate mainly depends on the pipe diameter (full bore rupture scenario) or hole size, the friction flow inside the pipeline depending on the wall roughness and the initial pressure inside the pipeline. Because of the release, the pressure inside the pipeline will drop in the region of the leak firs. The pressure drop ‘travels’ along the length of the pipeline with a velocity equal to the sound velocity. This causes the gas release to become non-stationary until the pressure drop reaches the end of the pipeline. The ongoing release can be assumed to be stationary and continuous until the pipeline is empty.
5.3 Pool Fire Scenario There is potential for a pool fire as a result of a release of fuel oil from the storage tank. In order for a fire to occur at the fuel oil storage tank, it would be necessary for an accidental release of fuel to occur, for an ignition source to be present and for the released fuel oil to ignite (which is extremely unlikely at ambient temperature). The flash point of DERV fuel oil is 68 °C, and this is the lowest temperature at which it can form an ignitable mixture with air. The fuel oil tanks are at atmospheric temperature and pressure. The HSA COMAH LUP Guidelines (HSA, 2010) identify the following major accident events associated with large pool fires at fuel storage sites:
1. A major unbunded pool fire extending up to 100 m from the bund wall, with a total frequency of at least 10E-04/year (for a small installation, and increasing for larger installations to ensure that the risks close to large sites are not less than those for small sites, e.g. based on an event frequency of 10E-04/(100π) per metre/year along a locus 50 m from the vessel storage area).
2. A pool fire which covers the entire surface of the bund with a higher frequency of 10E-03/year.
The worst case event is taken to be a circular pool fire located adjacent to the storage bund (i.e. due to bund overtopping or bund failure). The radius (R) of the fire is taken to be given by:
R = 6.85 V0.44537
with R in metres and V (volume of liquid in pool) in cubic metres, subject to a maximum diameter of 100 m (which occurs when V = 87 m3), which should not normally be exceeded (unless there are special circumstances). It is typically assumed that 50% of the maximum vessel contents may overtop the bund, which implies that the maximum 100m pool diameter occurs for vessels of over 175 m3.

MM/20/11960RR01 AWN Consulting Limited
Page 28
The distances to thermal doses of 1800, 1000 and 500 tdu can be modelled with the value for the SEP of Xylene (surrogate for all hydrocarbons other than class I) set at 25 kW/m2
and at 52 kW/m2 in the case of Pentane (surrogate for class I)).
The levels of thermal radiation as a function of distance from the centre of the pool can be calculated using any standard pool fire model. The calculations are undertaken for 5 m/s wind speed, and that the radiation levels taken are those calculated in the downwind direction (this will be conservative). Risks of fatality are then calculated using the standard Eisenberg probit and an assumption that people would be exposed for a period of 75 seconds (at a constant thermal radiation level).
5.4 Fireball and BLEVE There is a potential for a BLEVE and Fireball following tank rupture the LPG storage tank. The HSA COMAH LUP guidelines (2010) specifies a frequency of 10-4 /year. This is deliberately chosen as being relatively high as it is intended to cover sites with more than one LPG vessel (up to about 10). If there are only a few vessels, and the HSA is satisfied that there is a high probability that the measures in place at the site would mitigate against BLEVEs occurring, then a lower frequency of 10-5 /year per vessel may be adopted.
6.0 LAND USE PLANNING ASSESSMENT OF MAJOR ACCIDENT HAZARDS AT PROPOSED OCGT PLANT The following major accident scenarios at the Huntstown Power Station that could have consequence effects at the proposed Substation development are assessed herein:
• Vapour Cloud Explosion in a turbine enclosure;
• Jet fire from natural gas AGI area;
• Fireball and BLEVE from LPG tank rupture;
• Uncontained pool fire from Fuel Oil tank rupture and overtop.
6.1 Natural Gas Vapour Cloud Explosion at Turbine Enclosure In the event of ignition of a flammable cloud of vapour following a leak of natural gas within the gas turbine enclosure, there is the potential for a vapour cloud explosion to occur with damaging levels of peak overpressure.
VCE Model Inputs TNO Effects Version 11.3.0 was used to model a VCE in one of the turbine enclosures. It is assumed that an accidental release of natural gas occurs in the turbine enclosure of the Phase 1 turbine hall. In order for a vapour cloud explosion to occur, the concentration of natural gas must lie between the lower and upper flammable limits. It is assumed that concentration within the turbine enclosure is a stoichiometric mixture of air and flammable gas. The complete combustion equation for methane is:
CH4 + 2O2 = CO2 + 2H2O The volume of the turbine enclosure was estimated as 944 m3. The (mass) fraction of methane within this volume was calculated as 0.056 and the total flammable mass was calculated as 63.73kg.

MM/20/11960RR01 AWN Consulting Limited
Page 29
The VCE model inputs are detailed in Table 12:
Parameter Units Value Source
Chemical name methane -
Temperature °C 5 Huntstown
Volume of turbine hall m3 944 Huntstown documents
Flammable mass kg 63.73 Mass of methane assuming stoichiometric
mixture of air and flammable vapour
Fraction of flammable cloud
confined
- 1 Confined VCE within turbine enclosure
Curve number - 7 Strong deflagration – assume high ignition
energy, high obstruction and confined
conditions
Wind direction deg 240 Prevailing wind direction at nearest synoptic
met station
Table 12 Natural Gas VCE in Phase 1 Turbine Enclosure: Model Inputs
VCE Model Outputs The model outputs are detailed in Table 13.
Parameter Units Value
Confined mass in explosive range kg 63.73
Total combustion energy MJ 3188.5
Maximum peak overpressure bar 1.04
Table 13 Natural Gas VCE Phase 1 Turbine Enclosure: Model Outputs
The following figures illustrate the overpressure effects following a Natural Gas VCE at the Phase 1 Turbine Enclosure
• Figure 5 Natural Gas VCE in Phase 1 Turbine Enclosure: Overpressure vs Distance
• Figure 6 Natural Gas VCE in Phase 1 Turbine Enclosure: Probability of Fatality vs Distance
Mortality results are presented for receptors outdoors and indoors in the following types of structures:
• Category 2 structures, typical office block – representative of occupied buildings on site
• Category 3 structures, residential dwellings

MM/20/11960RR01 AWN Consulting Limited
Page 30
Figure 5 Natural Gas VCE in Phase 1 Turbine Enclosure: Overpressure vs Distance
Figure 6 Natural Gas VCE in Phase 1 Turbine Enclosure: Probability of Fatality vs Distance
0
200
400
600
800
1000
1200
0 100 200 300 400 500 600 700 800 900 1000
Ove
rpre
ssu
re (
mb
ar)
Distance (m)
Natural Gas VCEOverpressure vs Distance
0
10
20
30
40
50
60
70
80
90
100
0 50 100 150 200 250 300
Pro
ba
bilit
y o
f F
ata
lity
(%
)
Distance (m)
Natural Gas VCE in Gas Turbine Enclosure
Probability of Fatality vs Distance
Outdoors
Indoors Cat 2
Indoors Cat 3
MM/20/11960RR01 AWN Consulting Limited
Page 31
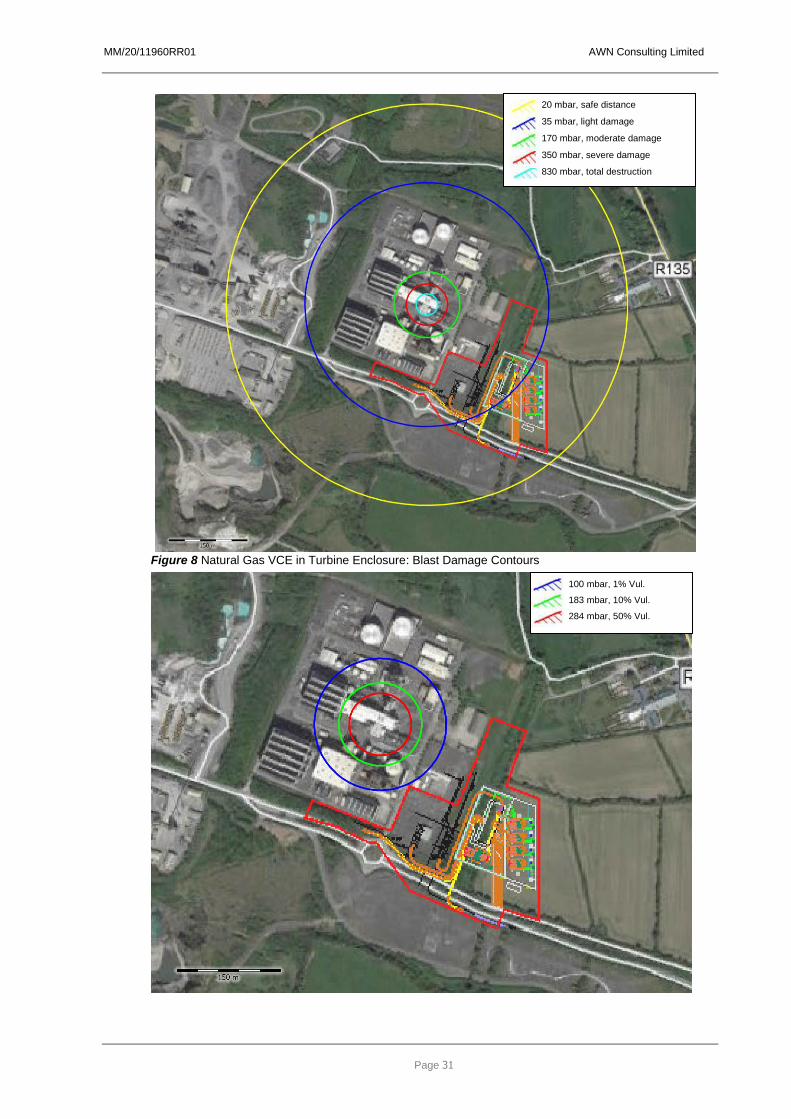
Figure 8 Natural Gas VCE in Turbine Enclosure: Blast Damage Contours
20 mbar, safe distance
35 mbar, light damage
170 mbar, moderate damage
350 mbar, severe damage
830 mbar, total destruction
100 mbar, 1% Vul.
183 mbar, 10% Vul.
284 mbar, 50% Vul.

MM/20/11960RR01 AWN Consulting Limited
Page 32
Figure 9 Natural Gas VCE in Turbine Enclosure: Outdoor Mortality Contours
In the event of a VCE in the Phase 1 Turbine Enclosure the following is concluded:
• Overpressure levels corresponding to safe and light damage extends to the proposed Substation development;
• Overpressure levels corresponding to 1% mortality outdoors do not extend to the proposed Substation development;
• Overpressure levels corresponding to 1% mortality indoors (Cat. 2) do not extend to the proposed Substation development.
It is concluded that a VCE in the Phase 1 Turbine Enclosure is not expected to result in equipment damage or fatalities at the proposed Substation development.
VCE Frequency
The HSA specifies a likelihood of 1E-04 per year when assessing Vapour Cloud Explosion scenarios in processing areas, for land use planning purposes.
6.2 Natural Gas Jet Fire Information on the GNI high pressure natural gas pipeline that supplies natural gas to Huntstown Power Station was obtained from GNI as follows:
• 300 mm diameter;
• 70 bar design pressure;
• Approximately 1.91 km from Kilshane AGI to Huntstown AGI The “Wilson Model” (TNO Yellow Book, 2005) models discharge from a long pipeline.
168 mbar, 1% Vul.
365 mbar, 10% Vul.
942 mbar, 50% Vul.

MM/20/11960RR01 AWN Consulting Limited
Page 33
The initial release rate mainly depends on the pipe diameter (full bore rupture scenario) or hole size, the friction of the flow inside the pipeline depending on the wall roughness and the initial pressure inside the pipeline. Because of the release, the pressure inside the pipeline will drop in the region of the leak at first. The pressure drop ‘travels’ along the length of the pipeline, with a velocity equal to the sound velocity. This causes the gas release to become non-stationary until the pressure drop reaches the end of the pipeline. The ongoing release can be assumed to be stationary and continuous until the pipeline is empty.
Discharge Model Inputs The long pipeline model inputs are detailed in Table 14.
Parameter Units Value Source
Chemical name Methane -
Initial temperature °C 10 Assume average ambient temperature
Initial (absolute) pressure in pipeline
bar 70 Huntstown
Pipeline diameter mm 300 GNI Drawings
Pipeline length km 1.91 Estimated length from Kilshane AGI to Huntstown AGI (GNI drawings and google earth)
Hole type Guillotine fracture Assume pipeline rupture
Table 14 High Pressure Natural Gas Supply Pipeline Rupture: Discharge Model Inputs
Discharge Model Outputs
The long pipeline model calculates the drop off in release rate with time, and also the “Purple Book” representative release rate over time in 5 steps, as illustrated on Figure 10.

MM/20/11960RR01 AWN Consulting Limited
Page 34
Figure 10 High Pressure Natural Gas Supply Pipeline Rupture: Release Rate vs. Time
Figure 11 High Pressure Natural Gas Supply Pipeline Rupture: Mass Released vs. Time
0
100
200
300
400
500
600
700
800
900
1000
0 100 200 300 400 500 600
Rele
ase r
ate
(kg/s
)
Time (s)
Natural Gas Supply Pipeline RuptureRelease Rate vs. Time
Wilson Model
Purple Book Approximation
0
1000
2000
3000
4000
5000
6000
7000
8000
0 100 200 300 400 500 600
Mass r
ele
ased (
kg)
Time (s)
Natural Gas Supply Pipeline RuptureMass Released vs. Time

MM/20/11960RR01 AWN Consulting Limited
Page 35
The long pipeline model outputs are as follows:
Pipeline volume 135 m3 Initial mass in the pipe 7,539.3 kg Average mass flow rate 12.6 kg/s Maximum mass flow rate 935 kg/s
Effects approximates the time-varying source term into five discrete time segments with constant outflow conditions by dividing the total mass released evenly over these five time segments – the Purple Book Approximation on the Release rate vs. Time chart above. The following release rates are calculated for the five discrete time segments:
Segment Time period Release rate
1 0 – 2.29 s 660.77 kg/s
2 2.29 – 8.32s 251.51 kg/s
3 8.32 – 20.34 s 126.21 kg/s
4 20.34 – 42.26 s 72.5 kg/s
5 42.26 – 600 s 2.77 kg/s
TNO recommends that the following rules can be followed:
• For flammable substances, the outflow conditions are equal to the conditions of the first (highest) segment, having approximated the time-varying release with five time segments.
As natural gas is extremely flammable, the outflow conditions that input to the jet fire and flash fire models are equivalent to the first segment. Therefore, the mass flow rate that is input to the jet fire or flash fire models is taken as 660.77 kg/s.
Jet Fire Model Inputs
The inputs for the Jet Fire model are detailed in Table 15
Parameter Units Value Source
Chemical name Methane -
Mass flow rate kg/s 660.77 Long pipeline model output
Exit temperature °C 10 Assume average ambient
Exit pressure bar 70 Pipeline design pressure
Hole diameter mm 300 Pipe rupture scenario
Outflow angle deg 0 Assume horizontal release (worst case scenario)
Release height m 1 Assumption
Ambient temperature °C 10 Dublin Airport 1989 – 2018 averages, www.met.ie
Wind speed m/s 2, 5, 10 HSA recommended wind speed for fire models
Receptor height m 1.5 Assumed
Table 15 Natural Gas Jet Fire at GNI AGI: Model Inputs
MM/20/11960RR01 AWN Consulting Limited
Page 36
Jet Fire Model Outputs
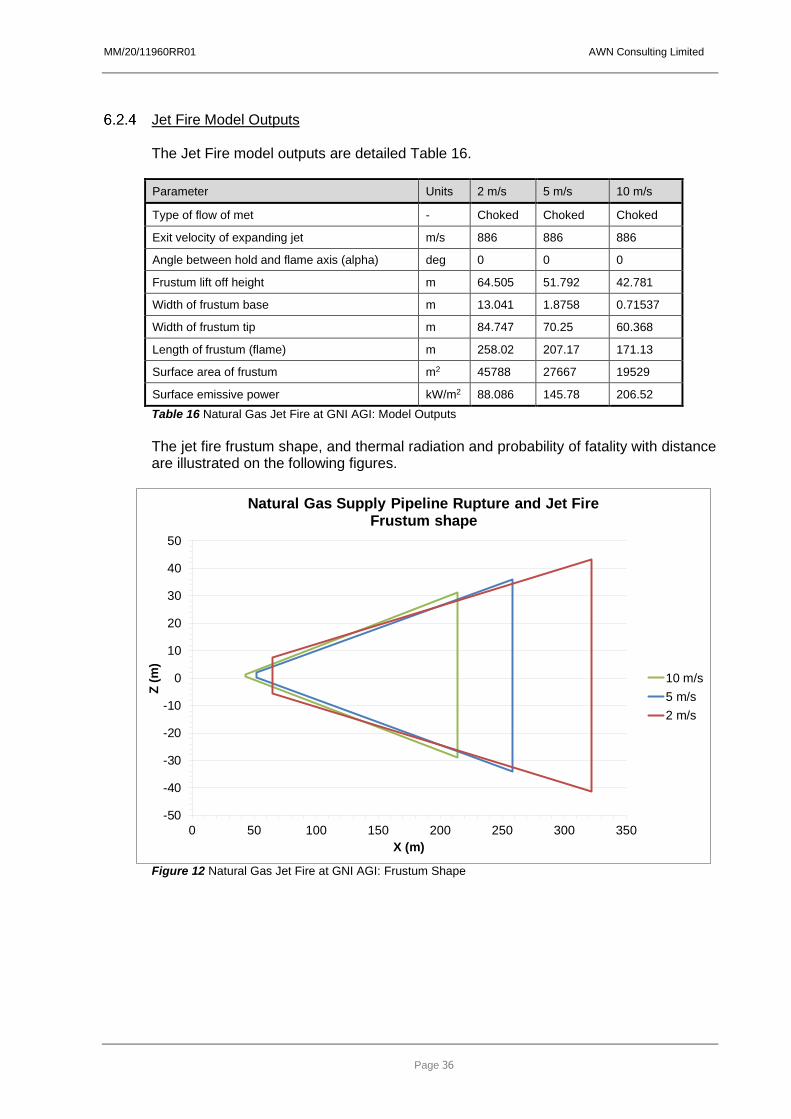
The Jet Fire model outputs are detailed Table 16.
Parameter Units 2 m/s 5 m/s 10 m/s
Type of flow of met - Choked Choked Choked
Exit velocity of expanding jet m/s 886 886 886
Angle between hold and flame axis (alpha) deg 0 0 0
Frustum lift off height m 64.505 51.792 42.781
Width of frustum base m 13.041 1.8758 0.71537
Width of frustum tip m 84.747 70.25 60.368
Length of frustum (flame) m 258.02 207.17 171.13
Surface area of frustum m2 45788 27667 19529
Surface emissive power kW/m2 88.086 145.78 206.52
Table 16 Natural Gas Jet Fire at GNI AGI: Model Outputs
The jet fire frustum shape, and thermal radiation and probability of fatality with distance are illustrated on the following figures.
Figure 12 Natural Gas Jet Fire at GNI AGI: Frustum Shape
-50
-40
-30
-20
-10
0
10
20
30
40
50
0 50 100 150 200 250 300 350
Z (
m)
X (m)
Natural Gas Supply Pipeline Rupture and Jet FireFrustum shape
10 m/s
5 m/s
2 m/s

MM/20/11960RR01 AWN Consulting Limited
Page 37
Figure 13 Natural Gas Jet Fire at GNI AGI: Thermal Radiation vs. Distance
Figure 14 Natural Gas Jet Fire at GNI AGI: Probability of Fatality Outdoors vs. Distance
0
50
100
150
200
250
0 100 200 300 400 500 600
Th
erm
al R
ad
iati
on
(k
W/m
2)
Distance Downwind (m)
Natural Gas Supply Pipeline Rupture and Jet FireThermal Radiation vs. Distance
10 m/s
5 m/s
2 m/s
0.00
10.00
20.00
30.00
40.00
50.00
60.00
70.00
80.00
90.00
100.00
0 100 200 300 400 500 600
Pro
ba
bil
ity o
f F
ata
lity
(%
)
Distance Downwind (m)
Natural Gas Supply Pipeline Rupture and Jet Fire
Probability of Fatality Outdoors vs. Distance
10 m/s
5 m/s
2 m/s

MM/20/11960RR01 AWN Consulting Limited
Page 38
Figure 15 Natural Gas Jet Fire at GNI AGI: Probability of Fatality Indoors vs. Distance
Table 17 details distances to specified thermal radiation levels associated with
• the threshold of morality
• 1%, 10% and 50% mortality outdoors
• 0% mortality and 100% mortality indoors
• damage to process equipment
Consequence Thermal radiation
level (kW/m2)
Distance (m)
2 m/s 5 m/s 10 m/s
Threshold of fatality 4.1 479 428 387
1% mortality outdoors 6.8 444 390 349
0% mortality indoors 12.7 409 354 313
100% mortality indoors 25.6 379 324 282
Equipment damage 37.5 365 310 269
Table 17 Natural Gas Jet Fire at GNI AGI: Calculated Distances at Specified Thermal Radiation Levels
Thermal radiation contours and effect areas are presented on the following figures (for the worst case wind speed scenario):
• Figure 17 Natural Gas Jet Fire at GNI AGI: Indoor Mortality and Equipment Damage Contours
•
0.00
10.00
20.00
30.00
40.00
50.00
60.00
70.00
80.00
90.00
100.00
0 100 200 300 400 500 600
Pro
ba
bil
ity o
f F
ata
lity
(%
)
Distance Downwind (m)
Natural Gas Supply Pipeline Rupture and Jet Fire
Probability of Fatality Indoors vs. Distance
10 m/s
5 m/s
2 m/s

MM/20/11960RR01 AWN Consulting Limited
Page 39
•
Figure 16 Natural Gas Jet Fire at GNI AGI: Outdoor Mortality Contours
• Figure 17 Natural Gas Jet Fire at GNI AGI: Indoor Mortality and Equipment Damage Contours

MM/20/11960RR01 AWN Consulting Limited
Page 40
Figure 16 Natural Gas Jet Fire at GNI AGI: Outdoor Mortality Contours
Figure 17 Natural Gas Jet Fire at GNI AGI: Indoor Mortality and Equipment Damage Contours

MM/20/11960RR01 AWN Consulting Limited
Page 41
In the event of a natural gas jet fire following rupture of the natural gas supply line at the GNI AGI, the following is concluded:
• The jet flame measures up to 258 m in length (depending on wind speed)
• The thermal radiation level corresponding to 1% mortality outdoors extends to the proposed Substation development; therefore, there is a possibility of fatality to persons outdoors in the event of a jet fire.
• The thermal radiation level corresponding to 100% mortality indoors extends to the proposed development but does not extend to any buildings on site.
• The thermal radiation level corresponding to equipment damage extends to the proposed Substation. There is potential for damage to equipment at the substation.
• GNI will be responsible for the installation, operation, and maintenance of all equipment within the AGI gas compound. All operations within the AGI will comply with standard GNI operational procedures and risk assessments and will be carried out by approved GNI contractors.
In relation to impacts from a jet fire following rupture of the natural gas supply pipeline at the GNI AGI, it is noted that the thermal radiation impacts that are predicted are conservative as they are based on a mass flow rate of 661 kg/s, as recommended by TNO and as explained above. It is noted that after approximately 9 s the release rate will reduce to 126 kg/s and after 44 s it will reduce to less than 3 kg/s and will continue to reduce until all of the natural gas has been released from the pipeline (approximately 600 s or 10 minutes). Therefore, the estimated consequences are conservative.
Jet Fire Frequency The HSA Land Use Planning Guidance document does not provide a value for the failure rate of a natural gas pipeline; however, reference is made to the Purple Book (CPD, 2005) which gives a failure rate of 3E-07/yr/m for a full-bore rupture from a pipeline with a diameter between 75 mm and 150 mm. The length of pipeline above ground at the AGI is 150 m. A probability of ignition of 0.09 is assigned based on the Purple Book approximation for a continuous release (>150 kg/s) of a low reactive gas (methane). Therefore, a likelihood of 4.05E-06/year was used in this study.
6.3 Fuel Oil Tank Rupture and Pool Fire Ignition of an accidental release resulting in a pool fire has been modelled using TNO Effects version 11.3.0 modelling software. The HSA COMAH LUP Guidelines (HSA, 2010) identify a bunded pool fire and an uncontained pool fire following bund overtop to be the major accident hazards associated with fuel storage.
Bunded Pool Fire The tank and bund properties for the Phase 1 and Phase 2 tanks are detailed in Table 18.
Parameter Units Value
Phase 1 Phase 2
Volume of liquid in tank m3 7200 7200
Radius of vertical tank m 14 14
Height of liquid in tank m 11.69 11.69
Bund width m 34 32.6
Bund length m 62.6 62.6

MM/20/11960RR01 AWN Consulting Limited
Page 42
Parameter Units Value
Phase 1 Phase 2
Bund height m 5.9 5.9
Bund surface area m2 2128.4 2040.8
Bund volume m3 12557.6 12040.5
Available Bund Surface Area m2 1512.6 1425.1
Table 18 Fuel storage tank and bund properties
It can be seen in Table 18 that the Phase 1 bund has a larger surface area. This will be modelled as a worst-case scenario for a bunded pool fire following fuel tank rupture.
6.3.1.1 Model Inputs Pool fire model inputs are detailed in Table 19.
Parameter Units Value Source
Chemical name Fuel Oil Sample
Recommended by TNO for modelling of marked fuel oil
Area of pool m2 1512.6 Calculated
Maximum heat exposure duration
s 75 HSA LUP guidance (HSA,2010)
Surface Emissive Power kW/m2 52 HSA LUP guidance (HSA,2010)
Temperature of pool °C 10 Atmospheric Temperature
Wind speed m/s 5 HSA LUP guidance (HSA,2010)
Ambient temperature °C 10 30 year average at nearest synoptic meteorological station (Dublin Airport)
Wind direction deg 240 Prevailing wind direction at nearest synoptic met station
Table 19 Fuel Oil Pool Fire Model Inputs
6.3.1.2 Model Outputs
The thermal radiation vs distance for a bunded pool fire is illustrated on Figure 18.

MM/20/11960RR01 AWN Consulting Limited
Page 43
Figure 18 Fuel Storage Bunded Pool Fire: Thermal Radiation vs Distance
The thermal radiation contours corresponding to the threshold of fatality (4.1 kW/m2) are illustrated in Figure 19.
Figure 19 Fuel Storage Bunded Pool Fire: Threshold of Fatality Contour (4.1 kW/m2)
It is concluded that the thermal radiation contour corresponding to the threshold of fatality
0
10
20
30
40
50
60
0 20 40 60 80 100 120 140 160 180 200
Ther
mal
Rad
iati
on
(kW
/m2
)
Distance (m)
Bunded Pool FireThermal Radiation vs Distance

MM/20/11960RR01 AWN Consulting Limited
Page 44
(4.1 kW/m2) does not extend to the proposed Substation development. It is concluded, that a bunded pool fire at the Phase 1 fuel storage tank is not expected to result in any thermal consequences at the proposed Substation.
Uncontained Pool Fire 6.3.2.1 Model Inputs
The area of the pool is calculated using the equation set out in Risk-based Land Use Planning (HSA, 2010): R = 6.85V0.44537 The tank has a volume of 7200m3, therefore, will have the maximum pool diameter as calculated by the equation above (see Section 5.3). The surface area of the pool is 7854 m2. The pool fire is centred 50m to the south east of the bund, in the direction of the proposed Substation. This is a representative worst-case scenario. The pool fire scenario is modelled at a wind speed of 5 m/s as per the HSA’s land use planning policy and approach document (HSA, 2010). The model inputs for the uncontained pool fire are detailed in Table 20.
Parameter Units Value Source
Chemical name Fuel Oil Sample
Recommended by TNO for modelling of marked fuel oil
Area of pool m2 7854 Calculated
Maximum heat exposure duration
s 75 HSA LUP guidance (HSA,2010)
Surface Emissive Power kW/m2 52 HSA LUP guidance (HSA,2010)
Temperature of pool °C 10 Atmospheric Temperature
Wind speed m/s 5 HSA LUP guidance (HSA,2010)
Ambient temperature °C 10 30 year average at nearest synoptic meteorological station (Dublin Airport)
Wind direction deg 240 Prevailing wind direction at nearest synoptic met station
Table 20 Fuel Storage Uncontained Pool Fire: Model Inputs
6.3.2.2 Model Outputs
The uncontained pool fire model outputs are detailed in
Parameter Windspeed 5m/s
Combustion rate (kg/s) 267
Duration of the pool fire (s) 11055
Flame tilt (deg) 46.1
Flame temperature (°C) 708.2
Length of the flame (m) 43.9
Table 21 Uncontained Pool Fire: Model Outputs
The pool fire thermal radiation and probability of fatality with distance are illustrated on the following figures.

MM/20/11960RR01 AWN Consulting Limited
Page 45
Figure 20 Fuel Oil Uncontained Pool Fire: Thermal Radiation vs Distance
Table 22 details distances to specified thermal radiation levels associated with
• the threshold of morality
• 1 % mortality outdoors
• 0% mortality and 100% mortality indoors
• damage to process equipment
Criterion
Thermal Radiation
Level
Distance to specified
levels
kW/m2 m
Threshold of Fatality 4.1 138
1% Mortality Outdoors 6.8 121
Building protected below this level, 0% fatality probability
12.7 102
Building will catch fire quickly, 100% fatality probability
25.6 82
Damage to process equipment 37.5 69
Table 22 Uncontained Pool Fire: Distances to Specified Thermal Radiation Levels
0
10
20
30
40
50
60
0 100 200 300 400 500
Th
erm
al R
ad
iatio
n (
kW
/m2
)
Distance Downwind (m)
Uncontained Pool Fire Thermal Radiation vs. Distance

MM/20/11960RR01 AWN Consulting Limited
Page 46
Figure 21 Fuel Oil Uncontained Pool Fire: Probability of Fatality Outdoors vs Distance
Thermal radiation contours and effect areas corresponding to the threshold of fatality (4.1 kW/m2), 1% fatality (6.8 kW/m2) and person protected indoors (12.7 kW/m2) for an uncontained fuel oil pool fire are illustrated on Figure 22.
Figure 22 Uncontained Pool Fire: Thermal radiation contours
In the event of a tank rupture resulting in a Fuel Oil uncontained pool fire, the following is concluded:
0
20
40
60
80
100
120
0 50 100 150 200
Pro
ba
bili
ty o
f F
ata
lity (
%)
Distance Downwind (m)
Uncontained Pool Fire Probability of Fatality vs. Distance

MM/20/11960RR01 AWN Consulting Limited
Page 47
• The thermal radiation contour corresponding to the threshold of fatality does not extend to the proposed development.
• The thermal radiation contour corresponding to persons protected indoors does not extend to the proposed development.
It is concluded that an uncontained pool fire at the Phase 1 fuel storage tank is not expected to result in any thermal consequences at the proposed Substation.
Pool Fire Frequency The HSA Land Use Planning Guidance document states that a pool fire which covers the entire surface of the bund has a frequency of 1E-03/year. The HSA Land Use Planning Guidance document states for larger installations an event frequency of 10E-04/(100π) per metre/year along a locus 50 m from the vessel storage area). The fuel oil tank storage area is 259 m2, this gives a frequency of 8.23E-05/year. Therefore, as a conservative approach, a frequency of 1E-04/year is used in this study.
6.4 LPG Fireball and BLEVE
The consequences and individual risk of fatality from a BLEVE and Fireball at the LPG tank are assessed in the following sections, as well as details of the protective measures that are in place on the LPG tank. The LPG tank is used as an ignition gas supply for Unit 1 at Huntstown. The tank has the capacity to hold 5 m3 of LPG however the maximum fill level is set to 60%.
Protective Measures The following measures are in place to prevent an accidental release of LPG from the propane tank:
• LPG tank is located in outdoor well-ventilated compound that is secured, with fencing and restricted access;
• Housekeeping ensures that there is no combustible debris in the vicinity of tank;
• Tank maintenance and testing is routinely carried out by an external approved contractor. Non-destructive examination inspections are carried out every 8 years and statutory maintenance is carried out as per advice of Competent Person under Pressure Systems Regulations Act, this role for Huntstown is looked after by Inforisk.
• ATEX zones have been identified at the LPG tank and measures are in place to prevent ignition sources within the zones as follows:
o Control of mobile or portable equipment in classified areas o Tanks are earthed o Delivery tankers are bonded to LPG tank during unloading o Competent driver present during bulk liquefied gas unloading o Warning Ex signage is displayed in classified areas o Hot work permit to be issued and fully implemented in accordance with
local procedures o Access to LPG compound is restricted to authorised personnel only
• Pressure relief valves are located on LPG tank;
• Driver training, traffic management measures and speed limits are in place on site roads to minimise the likelihood of a vehicle accidentally impacting tank.

MM/20/11960RR01 AWN Consulting Limited
Page 48
Model Inputs The LPG BLEVE and fire ball model inputs are detailed in Table 23.
Parameter Units Value Source
Chemical name - Propane -
Tank capacity m3 5 Huntstown
Maximum inventory m3 3 Huntstown
Operating temperature °C 55 Huntstown
Ambient temperature °C 10 30 year average at nearest synoptic meteorological station (Dublin Airport)
Table 23 LPG BLEVE and Fire Ball: Model Inputs
BLEVE Blast Model Outputs
The overpressure vs distance for a BLEVE is illustrated on Figure 23. The probability of fatality vs distance is illustrated on Figure 24. Mortality results are presented for receptors outdoors and indoors in the following types of structures:
• Category 2 structures, typical office block – representative of occupied buildings at the proposed development
• Category 3 structures, residential dwellings
Figure 23 LPG BLEVE: Overpressure vs Distance
0
5000
10000
15000
20000
25000
30000
0 20 40 60 80 100
Overp
ressure
(m
bar)
Distance (m)
LPG Tank Rupture: BLEVEOverpressure vs. Distance

MM/20/11960RR01 AWN Consulting Limited
Page 49
Figure 24 LPG BLEVE: Probability of Fatality vs Distance
The following figures present overpressure contours:
• Figure 25 LPG BLEVE: Blast Damage Contours
• Figure 26 LPG BLEVE: Indoor Mortality Contours (Category 2)
• Figure 27 LPG BLEVE: Outdoor Mortality Contours
Figure 25 LPG BLEVE: Blast Damage Contours
0
10
20
30
40
50
60
70
80
90
100
0 20 40 60 80 100
Pro
babili
ty o
f F
ata
lity
(%)
Distance (m)
LPG Tank Rupture: BLEVEProbability of Fatality vs Distance
Outdoors
Indoors Cat 2
Indoors Cat 3
20 mbar, safe distance
35 mbar, light damage
170 mbar, moderate damage
350 mbar, severe damage
830 mbar, total destruction

MM/20/11960RR01 AWN Consulting Limited
Page 50
Figure 26 LPG BLEVE: Indoor Mortality Contours (Category 2)
Figure 27 LPG BLEVE: Outdoor Mortality Contours
In the event of a BLEVE following rupture of an LPG tank at Huntstown, the following is concluded:
• The overpressure contour corresponding to safe distance (20 mbar) extends to the the proposed development
168 mbar, 1% Vul.
365 mbar, 10% Vul.
942 mbar, 50% Vul.
100 mbar, 1% Vul.
183 mbar, 10% Vul.
284 mbar, 50% Vul.

MM/20/11960RR01 AWN Consulting Limited
Page 51
It is concluded that there are no expected overpressure consequences at the proposed development following a BLEVE at the LPG tank.
Fireball Model Outputs
Fireball modelling results are summarised in below.
Parameter Units Value
Duration of the Fire Ball (s) s 5.5
Max Diameter of the Fire Ball (m) m 64.6
Max Height of the Fire Ball (m) m 96.9
Surface emissive power (max) (kW/m2) kW/m2 400
Table 24 LPG Fireball: Model Outputs
It is concluded that the fireball duration is 5.5 s and the maximum fireball diameter is 64.6 m (radius 32.3 m). The fireball diameter and thermal radiation contours corresponding to the threshold of fatality (4.1 kW/m2) and 1% fatality (6.8 kW/m2) is illustrated as follows:
Figure 28 LPG Fireball: Fireball, threshold of fatality (4.1 kW/m2) and 1% fatality contours (6.8 kW/m2)
The thermal radiation levels corresponding to indoor mortality is illustrated on Figure 29.

MM/20/11960RR01 AWN Consulting Limited
Page 52
Figure 29 LPG Fireball: Indoor Mortality
In the event of a fireball following rupture of an LPG tank at Huntstown Power Station, it is concluded:
• The Fireball radius does not extend to the proposed development.
• The thermal radiation corresponding to 1% fatality (6.8 kW/m2) extends to the proposed development, there is potential for fatality to persons outdoors at this establishment.
• The thermal radiation level corresponding to 0% mortality indoors (12.7 kW/m2) extends to the proposed development; however, there will be no buildings in this area; therefore, no fatalities are expected.
It is concluded that there is potential for fatalities to persons outdoors at the proposed development following a Fireball at the LPG tank at the Huntstown Power Station. However, the Substation is designed to be remotely operated and there are no permanent staff on-site.
BLEVE and Fireball Frequency
There is only 1 No. small LPG tank; therefore, the likelihood of a BLEVE and fireball following rupture of an LPG vessel at Huntstown is taken as 1E-05 per year (HSA, 2010).

MM/20/11960RR01 AWN Consulting Limited
Page 53
7.0 LAND USE PLANNING RISK CONTOURS TNO Riskcurves Version 11.3.0 modelling software was used to model the cumulative risk contours for the establishment. The consequence results, frequencies of major accident hazards and Dublin Airport wind speed and frequency data (see Section 4.1.5) were input to the software. The HSA has defined the boundaries of the Inner, Middle and Outer Land Use Planning (LUP) zones as: 10E-05/year Risk of fatality for Inner Zone (Zone 1) boundary 10E-06/year Risk of fatality for Middle Zone (Zone 2) boundary 10E-07/year Risk of fatality for Outer Zone (Zone 3) boundary
Risk contours for the Huntstown Power Station corresponding to the boundaries of the inner, middle and outer risk based land use planning zones are illustrated on Figure 30.
Figure 30 Land Use Planning Individual Risk Contours for Huntstown Power Station
It is concluded that the LUP Outer zone and Middle zone of Huntstown Power Station extends to the proposed development. The individual risk contours corresponding to the Inner LUP zone does not extend to the proposed development; therefore, the level of individual risk at the proposed development is acceptable.
MM/20/11960RR01 AWN Consulting Limited
Page 54
8.0 CONCLUSION
A Land Use Planning assessment was completed for the proposed construction of a Substation that is in the vicinity of Huntstown Power Station, Co. Dublin. The Huntstown establishment is notified to the Health and Safety Authority (HSA) as a Lower Tier COMAH site and is subject to the provisions of the Chemicals Act (Control of Major Accident Hazards Involving Dangerous Substances) Regulations, 2015 (COMAH Regulations 2015).
The risk-based approach is completed in accordance with current HSA policy and taking account of the Policy and Approach of the Health and Safety Authority to COMAH Risk-based Land-use Planning (19 March 2010).
This report examines hazards associated with Fuel Oil, LPG, and Natural gas installations on site. The consequences modelling was carried out using TNO Effects Version 11.3.0 modelling software. The following is concluded: Natural Gas VCE within a Turbine Enclosure:
• Overpressure levels corresponding to safe and light damage extends to the proposed Substation development;
• Overpressure levels corresponding to 1% mortality outdoors do not extend to the proposed Substation development;
• Overpressure levels corresponding to 1% mortality indoors (Cat. 2) do not extend to the proposed Substation development.
Natural Gas Jet Fire at the GNI AGI:
• The jet flame measures up to 258 m in length (depending on wind speed)
• The thermal radiation level corresponding to 1% mortality outdoors extends to the proposed Substation development; therefore, there is a possibility of fatality to persons outdoors in the event of a jet fire; however, the site is designed to be operated remotely and there are no permanent staff on-site.
• The thermal radiation level corresponding to 100% mortality indoors extends to the proposed development but does not extend to any buildings on site.
• The thermal radiation level corresponding to equipment damage extends to the proposed Substation. There is potential for damage to equipment at the substation.
• GNI will be responsible for the installation, operation, and maintenance of all equipment within the AGI gas compound. All operations within the AGI will comply with standard GNI operational procedures and risk assessments and will be carried out by approved GNI contractors.
In relation to impacts from a jet fire following rupture of the natural gas supply pipeline at the GNI AGI, it is noted that the thermal radiation impacts that are predicted are conservative as they are based on a mass flow rate of 661 kg/s, as recommended by TNO and as explained above. It is noted that after approximately 9 s the release rate will reduce to 126 kg/s and after 44 s it will reduce to less than 3 kg/s and will continue to reduce until all of the natural gas has been released from the pipeline (approximately 600 s or 10 minutes). Therefore, the estimated consequences are conservative. Bunded Pool Fire at Fuel Oil Storage Tanks
• The thermal radiation contour corresponding to the threshold of fatality (4.1

MM/20/11960RR01 AWN Consulting Limited
Page 55
kW/m2) does not extend to the proposed Substation development. Uncontained Pool Fire following Bund Overtop
• The thermal radiation contour corresponding to the threshold of fatality does not extend to the proposed development;
• The thermal radiation contour corresponding to persons protected indoors does not extend to the proposed development.
LPG BLEVE and Fireball
• The Fireball radius does not extend to the proposed development.
• The thermal radiation corresponding to 1% fatality (6.8 kW/m2) extends to the proposed development, there is potential for fatality to persons outdoors at this establishment.
• The thermal radiation level corresponding to 0% mortality indoors (12.7 kW/m2) extends to the proposed development; however, there will be no buildings in this area; therefore, no fatalities are expected.
It is concluded that there is potential for fatalities to persons outdoors at the proposed development following a Fireball at the LPG tank at the Huntstown Power Station. However, the Substation is designed to be remotely operated and there are no permanent staff on-site. The cumulative individual risk contours for Huntstown Power Station corresponding to the boundary of the inner, middle and outer land use planning zones are illustrated as follows.

MM/20/11960RR01 AWN Consulting Limited
Page 56
It is concluded that the LUP Outer zone and Middle zone of Huntstown Power Station extends to the proposed development. The individual risk contours corresponding to the Inner LUP zone does not extend to the proposed development; therefore, the level of individual risk at the proposed development is acceptable.

MM/20/11960RR01 AWN Consulting Limited
Page 57
9.0 REFERENCES Centre for Chemical Process Safety (CCPS) (2000), Guidelines for Chemical Process Quantitative Risk Analysis, 2nd Edition, AIChemE Chemical Industries Association (CIA) (2003), Guidance for the location and design of occupied buildings on chemical manufacturing sites, 2nd Edition Committee for Prevention of Disasters (2005), Guidelines for Quantitative Risk Assessment, CPR 18E, First Edition, The Hague (“Purple Book”) Committee for Prevention of Disasters (2005), Methods for calculation of physical effects, CPR 14E, third Edition, The Hague (“Yellow Book”)
Energy Institute (EI) (2007), Model Code of Safe Practice Part 19 Fire Precautions at Petroleum Refineries and Bulk Storage Installations, 2nd Edition Health and Safety Authority (HSA) (2010), Policy and Approach of the Health & Safety Authority to COMAH Risk-Based Land-Use Planning Including Detailed Implementation by Sector (http://www.hsa.ie/eng/Your_Industry/Chemicals/COMAH/Approach_to_LUP_under_Comah_Regs.pdf) Kletz T. (1999), HAZOP and HAZAN, Identifying and assessing process industry hazards, Institute of Chemical Engineers, 4th Edition McGrattan K.B., Baum H.R., Hamins A. (2000), National Institute for Standards and Technology (US Department of Commerce), NISTIR 6546, Thermal Radiation from Large Pool Fires
Trbojevic V.M. (2005), Risk criteria in EU, European Safety and Reliability Conference
UK Health and Safety Executive (2001), Reducing Risks Protecting People HSE’s Decision Making Process, HSE Books, R2P2 Vrijling, J.K. and van Gelder (2004), P.H.A.J.M., Societal Risk and the Concept of Risk Aversion

MM/20/11960RR01 AWN Consulting Limited
Page 58
End of Report