
Colyton Public School Annual School Report · Colyton Public School’s most valued assets are its...
29
Colyton Public School Annual School Report 1596
-
Upload
phungkhanh -
Category
Documents
-
view
214 -
download
0
Transcript of Colyton Public School Annual School Report · Colyton Public School’s most valued assets are its...

Colyton Public School
Annual School Report
1596

1
Our school at a glance
Students
Colyton Public School’s most valued assets are its students, staff and parents. The 651 students are comprised of 352 girls and 299 boys.
A total of 384 students or almost 59% are from non-English speaking backgrounds and there are 23, or almost 3% of students who identify as Aboriginal.
Staff
There were 26 classroom teachers supported by 7.476 support teachers. The implementation of the Smarter Schools National Partnership allowed the school to advertise for and employ one Highly accomplished Teacher (HAT) and a paraprofessional. The school elected to spit the paraprofessional position into two and employ an educational paraprofessional to assist in classrooms for three days per week and an operational paraprofessional to assist in administration two days per week.
Teaching staff are supported by one School Administration Manager, two full time School Administrative Officers and one full time general assistant.
Significant programs and initiatives
In 2011, Colyton Public School introduced or maintained the following initiatives to enhance students’ learning and extend the capacity of staff to provide quality teaching.
Smarter Schools National Partnership – Improving Teacher Quality, Centre for Excellence (SSNP-ITC-C4E). As a hub school involved schools in working to improve teacher quality with a focus on writing. The schools worked with pre-service, early career and experienced teachers. The schools involve in the SSNP ITC C4E are Colyton, Bennett Road and St Marys South Public Schools; Erskine Park, Penrith Selective and St Marys Senior High schools.
Language, Literacy and Learning (L3) and Best Start Kindergarten assessment and
curriculum implementation program. This year we were a trail school for the implementation of Best Start online for Years 1 and 2;
Contributed to the development of the NSW Board of Studies English curriculum response to the National English curriculum as part of the Curriculum Collaboration Project with a focus on sentence structure;
Connected Classroom virtual excursions and video conferencing for staff and students;
Positive Behaviour For Learning;
National Assessment Program in Literacy and Numeracy (NAPLAN) for students in Year 3 and Year 5;
Personalised learning plan for Aboriginal students;
Operation Art, Mt Druitt Swimming Centre Environmental Design Mosaic Mural Project and Colyton Learning Community Showcase;
School Spectacular at Sydney Entertainment Centre;
150 year celebrations. Our Sesquicentennial celebrations were combined with our Education Week activities forming a week-long celebration to recognise achieving 150 years of providing public education at Colyton Public School;
A small section of the library display for the Sesquicentennial

2
Implementation of the Building the Education Revolution with the installation of Interactive Whiteboards (IWBs) in 25 classrooms and covered walkway to Q Block;
Trained and supported teachers to develop their computer technology skills and capacity to integrate the use of Interactive Whiteboards (IWBs) into daily quality teaching practice; and
Maintained our Opportunity Class programs as well as our multicultural day and talent quest.
Harmony day 2011 – friendship, caring and working together.
Student achievement in 2011 In 2011, the National Assessment Program in Literacy and Numeracy (NAPLAN) numeracy trend for year 3 students shows a small gain on DEC scores. Year 3 students answered more than 50% of the first 15 questions the same or better percentage than Department of Education and Communities (DEC). These were the least difficult questions. In 2011, the (NAPLAN) numeracy trend for year 5 indicted that students outperformed the state comparisons on almost 67% of test items. Year 5 students answered almost 78% of numeracy questions the same or better percentage as state. These mostly fell within the hardest 75% of questions. Year 5 girls’ recovered from negative trend movement and were now outperforming DEC and on par with state. Year 5 boys have increased the gap between DEC and state. Year 5 boys achieved
a much higher mean in all areas of numeracy as assessed in NAPLAN.
Messages
Principal’s message
One of the major features of 2011 was our highly
rewarding implementation of the National
Smarter School Partnership – Improving Teacher
Quality through our Centre for Excellence plan.
Our focus was on writing and improving the
quality of teaching from Kindergarten to Year 12.
A most enjoyable series of events were held
during our Sesquicentennial 150 year celebration.
We combined our sesquicentennial open day
celebrations, bush dance and open classrooms
with our Education Week activities. For many it
was an opportunity to see many old friends and
acquaintances and to re-live and revive memories
of their days at Colyton Public School.
Cutting the cake – Sesquicentennial Open Day 2011
During the Sesquicentennial Open Day our
current students proudly presented a concert and
performed a simu-launch flash mob dance. Staff
and parents collectively organised, assembled
and presented displays of memorabilia, and
Colyton’s biggest morning tea. Team members
from corporate communications spent a team
building day at Colyton and cooked a terrific
barbecue.
During the week of our Sesquicentennial
Celebrations our current students also found the

3
time, energy and enthusiasm to perform as usual
at Westfields in Mount Druitt and represented
the school at the Minchinbury-Mount Druitt
Education Week Concert at Rooty Hill RSL Club.
Students performed at Westfields – Mt Druitt as part of our
Sesquicentennial and Education Week events.
Staff, students and parents also had a fabulous
evening at the Bush Dance and we were pleased
our Local Member the Hon Ed Husic was able to
attend on the evening.
A group of staff in period costume recognizing our colonial
heritage during the 150 Sesquicentennial celebrations.
The school’s motto “Seeking success by working
together” was certainly the essence of a
wonderful week of celebrations.
I certify that the information in this report is the result of a rigorous school self-evaluation process and is a balanced and genuine account of the school’s achievements and areas for development.
G.D.Yates Principal
P & C and/or School Council message The outstanding support of parents, teachers and the community this year has been greatly appreciated. With your help we have managed to donate $6,000 to the school for reading and numeracy material and $6,000 towards maintenance of air conditioners. To achieve this, we held a Welcome Back Disco; Easter and Christmas Colouring Competition; Easter and Christmas Guessing Competitions; we held an Election Day BBQ, Easter Hat Parade stall, Mothers and Fathers days stalls and sold Cookie dough, chocolates and lollies. We assisted at the Sesquicentennial Open day and held a BBQ at the Bush Dance. During the Sesquicentennial and Education Week activities we sold pavers, coffee mugs and key rings as well as orders for the Sesquicentennial booklet.
Members of our P&C selling memorabilia specially created for the day at their stall during our Sesquicentennial Open
Day.
The Clothing Pool profit for 2011 was $667.00 and as at 6 December 131 students were taking advantage of the School Banking conducted and arranged by the Parents and Citizens Association. Our commission from school banking earned $1255.67. Out total income for the year was $26,481.93.
With the funds raised we were able to assist the school community by hiring a cherry picker to take the 150 year whole school photograph, donating funds to assist children who made it to regional and state representative levels in sport and to attend music camps as well as to attend the National Young Leaders Day Conference at the Entertainment Centre in Sydney.

4
We also paid for the cost our purchases for resale and $470.00 for insurance and affiliation. In total our expenses were $ 25,773.89. We currently hold $7,777.38 in total in our everyday account and special projects account. We also represented the school at variety of school functions including, the Kindergarten and Opportunity Class Orientation days.
Parents attending Kindergarten Orientation Day
This year’s Kindergarten students presenting their uniform
fashion parade at the Kindergarten orientation Day
I would like to thank everyone for their continuing support and assistance, without your help and kindness we would not have been less able to help and the support our children and the school.
Tenille Paine P&C President
Student representative’s message
Being elected school captains for 2011 was a great honour and made us feel very proud. The Captains and Prefects regularly conducted school assemblies, helped present Gold Awards and led the school on special occasions.
Features of our leadership were on show when we led the school’s Sesquicentennial open day celebrations, Year 6 farewell evening and attended to our roles helping teachers on a daily basis. We enjoyed raising the flag each day and proudly demonstrating our pride in being Australian. We will long remember out fellow pupils and the friendships we have made. ‘The reason our school was so great is because of our unforgettable mates.’
We will also remember the teachers who have helped us along the way and made learning such fun. ‘It was the teachers that made this such a hit.’
Captains Johan and Marygrace - 2011
We really enjoyed the Year 6 Fun Day, Year 6 farewell, the excursion to Canberra AND Snowy Mountains, the Colyton Learning Community Showcase, Talent Quests, Artibalds, PANIC nights, I Max, Lunar Park and PSSA sport.
As Captains and Prefects of 2011 we were proud to serve our school and we wish the new captains and prefects for 2012 all the best in their jobs.
Marygrace Lardizabal & Johan Fernando
Captains 2011
School context
Student information
It is a requirement that the reporting of information for all students must be consistent with privacy and personal information policies.
Student enrolment profile
Since 2007 enrolments have continued to steadily grow. In 2011, there were 651 students, comprised of 352 boys and 299 girls. Significantly, it should be noted that the number of boys enrolled at the school has grown from 309 in 2007 to 352 in 2011, whilst the number of

5
girls enrolled at the school has remained reasonably static.
Gender 2007 2008 2009 2010 2011
Male 309 319 336 351 352
Female 299 295 296 294 299
Student attendance profile
Regular school attendance is regarded as being crucial for student learning and the development of ongoing self-confidence. In 2011, our daily attendance rate was 94.3%. The was equal to the Western Sydney Region attendance rate of 94.3% and very slightly above the state average attendance rate of 94.2%
Management of non-attendance
Class roll sheets are marked in the classroom by all class teachers each morning and returned to the school office. Information is transferred from the class roll sheet to the OASIS computerised attendance monitoring program.
Student attendance is monitored daily by class teachers and attendance is reviewed weekly by the school’s deputy principal.
Home School Liaison officers regularly visit the school to monitor school attendance. The school refers students with attendance concerns to the Home School Liaison Officer for follow up and individual assistance.
The Child Wellbeing Unit is also contacted when attendance concerns exist. Cases of serious non-attendance are referred for follow up and support and where appropriate legal action by the Home School Liaison Officer.
Class sizes
Primary class sizes are included in the annual school report in order to provide parents with as much local information as possible. The following table shows our class sizes as reported at the 2011 Class Size Audit conducted on Monday 21 March 2011.
Roll class Year Total per year Total In class
K/1H K 12 22
KC K 19 19
KL K 20 20
KN K 20 20
KS K 20 20
1/2R 1 13 26
1A 1 21 21
1D 1 23 23
1M 1 20 20
K/1H 1 10 22
1/2R 2 13 26
2B 2 24 24
2H 2 24 24
2J 2 24 24
3/4B 3 19 30
3H 3 29 29
3P 3 30 30
3/4B 4 11 30
4J 4 30 30
4P 4 30 30
4R 4 30 30
5B 5 28 28
5C 5 28 28
5J 5 26 26
5R 5 30 30
0
100
200
300
400
500
600
700
2007 2008 2009 2010 2011
Stu
den
ts
Year
Enrolments
Male Female
0
25
50
75
100
2008 2009 2010 2011
Att
en
dan
ce r
ate
Year
Student attendance rates
School Region State DEC

6
Roll class Year Total per year Total In class
6E 6 28 28
6R 6 27 27
6S 6 29 29
Structure of classes
In 2011, there were 26 classes arranged into 23 regular mainstream classes and 3 composite classes.
There were two Opportunity Classes OC. Entry into the OC classes is based upon academic merit through an application process conducted by the Selective High School and Opportunity Class Placement Unit.
Staff information
It is a requirement that the reporting of information for all staff must be consistent with privacy and personal information policies.
Staff establishment
Position Number
Principal 1
Deputy Principal 1
Assistant Principal(s) 4
Highly Accomplished Teacher 1
Classroom Teachers 22
Teacher of Reading Recovery 0.815
Support Teacher Learning Assistance 1.6
Teacher Librarian 1.2
Release from face to face 1.176
Primary part-time 1.1
Teacher of ESL 1.4
School Counsellor 1
School Administrative & Support Staff 4.262
Paraprofessional - Educational 0.6
Paraprofessional - Operational 0.4
New arrival program teacher 0.8
Total 43.335
The National Education Agreement requires schools to report on Indigenous composition of their workforce. One member of staff identified as an Aboriginal teacher.
Staff retention
One teacher, Mrs Bourke was successful in gaining a promotion from classroom teacher to
Assistant Principal level. One teacher was successful in gaining a service transfer.
Mrs Bourke dressed in colonial period costume to celebrate the Sesquicentennial Open Day
Ten teachers took maternity leave or extended their existing maternity leave arrangements. It is anticipated that the school will need to employ a significant number of teachers under temporary teaching notices to replace permanent teachers taking advantage of maternity leave benefits.
Teacher qualifications
All teaching staff members meet the professional requirements for teaching in NSW public schools.
Qualifications % of staff
Degree or Diploma 100%
Financial summary
This summary covers funds for operating costs and does not involve expenditure areas such as permanent salaries, building and major maintenance.

7
Date of financial summary: 30/11/2011Income $
Balance brought forward 241183.64Global funds 311909.21Tied funds 190696.76School & community sources 154255.28Interest 15222.07Trust receipts 27871.35Canteen 0.00Total income 941138.31
ExpenditureTeaching & learning Key learning areas 43151.61 Excurs ions 76291.00 Extracurricular dissections 66387.46Library 9242.04Training & development 207.27Tied funds 180751.53Casual relief teachers 81586.04Administration & office 80163.64School-operated canteen 0.00Utilities 60509.59Maintenance 28009.77Trust accounts 26906.31Capital programs 21695.81Total expenditure 674902.07Balance carried forward 266236.24
As at the 30/11/2011 the school held unpaid orders of $ 3, 658.50, unpaid casual salaries of $12,865.09 and retained a balance of tied funds of $52,002.69 and held a total of $13,410.01 in trust funds.
It should be noted that the school budgeted to retain $39,299.87 for general purposes following provision for asset replacement.
The school with support from students and approval of both School Council and Parents and Citizens Association will seek to instal and electronic LED display sign, and to add an additional three mobile interactive whiteboards to support students with learning difficulties, students from language backgrounds other than English and an anticipated new demountable. This is expected to cost $19,000.
Furthermore, funds permitting, the school budgets to install stage curtains and add additional functionality to the audio visual system in the school hall.
A full copy of the school’s 2011 financial statement is tabled at the annual general meetings of the School Council and/or the parent
body. Further details concerning the statement can be obtained by contacting the school.
School performance 2011
Achievements
Arts
Operation Art
Students were again invited to participate in Operation Art as a component of our creative and performing and visual arts programs.
‘Rabbit Proof Fence’ by Aznur Gungar
Aznur indicated she completed this painting because she wanted it to be unique and also to reflect her feelings from her literature studies in class of the book “Rabbit Proof Fence.”
Sport
Our school’s Personal development, health and physical education programs and sporting events aim to give all children the opportunity to participate in a wide selection of sporting activities. Our sporting events programs provides every student a wide range of activities from participation in the special swimming scheme, learning Fundamental Movement Skills and participation in PSSA team sports.
Throughout 2011 teachers observed that the confidence, fitness and skill levels of our students continue to improve. The annual athletics carnival was again very successful and it was pleasurable and rewarding for all involved. This year we again noted a significant and continued improvement in student participation in the athletics and
8
swimming carnivals. Our sporting champions for 2011 were;
Swimming champions - 2011
Michael Mateo Delaney Moss
Athletics champions - 2011
Anthony Gale Elisha Davis
Sportsperson - 2011
Anthony Gale
Significantly, in 2011, the school relocated the cricket nets and installed two super shooters in an artificial court area using a Premiers Sporting Challenge grant and the generous assistance of volunteer parents.
A feature of the 2011 sporting year was the weekly fitness program implemented with the much appreciated and valued financial support of parents. Over the course of Term Three all students K-6 had the opportunity to attend a 40 minute Sports in School session. During these sessions students had the developed a variety of skills using a wide variety of colourful and exciting fitness equipment. As part of these sessions students were also introduced to a range of health issues, including healthy eating and sun safety. In 2012, the school will again hold a 3-6 athletics carnival and a 3-6 swimming carnival with 8 year old students invited to attend.
In 2012, the school also plans to further promote healthy eating and positive life styles choices by refining our Crunch and Snip policy and seeking accreditation as a Crunch and Sip school. The school will also continue to train and update staff and students in the areas of Road Safety, Child Protection, Drug Education, Life Education and Keep them Safe.
Performing Arts – Choir
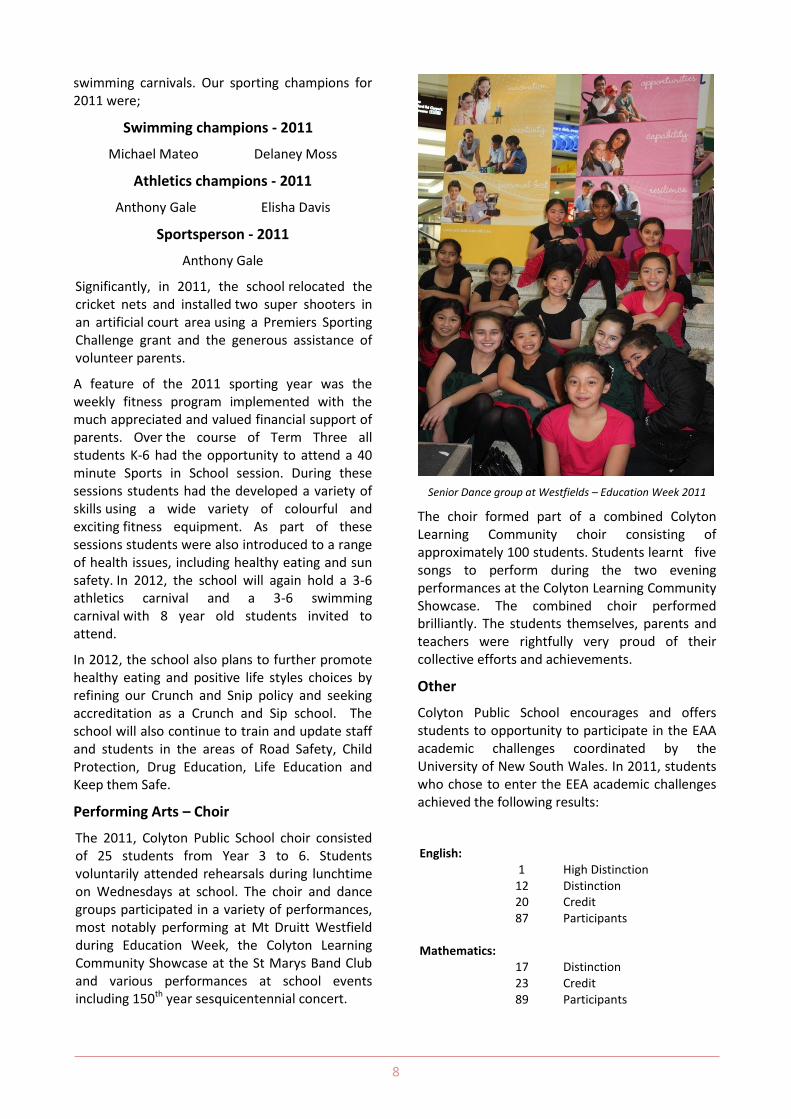
The 2011, Colyton Public School choir consisted of 25 students from Year 3 to 6. Students voluntarily attended rehearsals during lunchtime on Wednesdays at school. The choir and dance groups participated in a variety of performances, most notably performing at Mt Druitt Westfield during Education Week, the Colyton Learning Community Showcase at the St Marys Band Club and various performances at school events including 150th year sesquicentennial concert.
Senior Dance group at Westfields – Education Week 2011
The choir formed part of a combined Colyton Learning Community choir consisting of approximately 100 students. Students learnt five songs to perform during the two evening performances at the Colyton Learning Community Showcase. The combined choir performed brilliantly. The students themselves, parents and teachers were rightfully very proud of their collective efforts and achievements.
Other
Colyton Public School encourages and offers students to opportunity to participate in the EAA academic challenges coordinated by the University of New South Wales. In 2011, students who chose to enter the EEA academic challenges achieved the following results: English:
1 High Distinction 12 Distinction 20 Credit 87 Participants
Mathematics:
17 Distinction 23 Credit 89 Participants

9
Science: 9 Distinction 18 Credit 77 Participants
Our school also noted that our Mathematics Olympiad Team A finished in the top 10% of schools from across Australasia who elected to participate in the Mathematics Olympiad competition.
Analysis of school based assessment data
revealed that 58% of Kindergarten students had
achieved reading recovery level 9 or better at the
end of Kindergarten in 2011, compared to 38% in
2010.In 2012 the school will continue to expand
the Best Start online reporting process trialled in
2011 to years 1 and 2.
The Easter Hat Parade was another one of our happy, well supported school traditions.
Academic
In the National Assessment Program, the results across the Years 3, 5, 7 and 9 literacy and numeracy assessments are reported on a scale from Band 1 to Band 10.
The achievement scale represents increasing levels of skills and understandings demonstrated in these assessments.
Yr 3: from Band 1 (lowest) to Band 6 (highest for Year 3)
Yr 5: from Band 3 (lowest) to Band 8 (highest for Year 5)
Literacy – NAPLAN Year 3
As is evident in the graph below there was a noticeable increase in the percentage of year 3 students achieving a band 3 level of achievement in reading compared to the school average 2008-2011. The percentage of students achieving band 6 levels of achievement was lower than the state DEC average.
As there was a change to the area of assessment in writing it is not possible to compare data from previous years. Students in both year 3 and year 5 were asked to write a persuasive text response to a writing stimulus rather that a narrative response.
0
10
20
30
1 2 3 4 5 6P
erc
en
tage
of
stu
de
nts
Bands
Percentage in bands: Year 3 Reading
Percentage in BandSchool Average 2008-2011SSG % in Band 2011State DEC % in Band 2011
0
10
20
30
40
50
1 2 3 4 5 6
Pe
rce
nta
ge o
f st
ud
en
ts
Bands
Percentage in bands: Year 3 Writing
Percentage in Band
SSG % in Band 2011
State DEC % in Band 2011

10
There was a noticeably higher percentage of year 3 students achieving a band 3 level of achievement in writing compared to the Similar School Group (SSG) average and State DEC percentage in bands 2011 as evident in the graph above.
The percentage of students achieving band 6 levels of achievement writing was above SSG percentage lower than the state DEC percentage.
There was a noticeable increase in the percentage of year 3 students achieving a band 5, 4 and 3 levels of achievement in spelling compared to the school average 2008-2011 as evident in the graph above.
The percentage of students achieving band 5 levels of achievement in spelling exceeded the SSG and State DEC percentages.
Students and Reg Murray, President Mt Druitt Chamber of Commerce discussing the content of the mural in Old Mt
Druitt Village.
There was a noticeable increase in the percentage of year 3 students achieving a band 4 level of achievement in grammar and punctuation compared to the school average 2008-2011 as evident in the graph above.
The percentage of students achieving band 4 levels of achievement in grammar and punctuation exceeded the SSG and State DEC percentages.
The percentage of students achieving band 5 and 6 levels of achievement in grammar and punctuation in 2011 was lower than the school average 2008-2011, the SSG and State DEC percentages.
Numeracy – NAPLAN Year 3
There was a noticeable increase in the percentage of year 3 students achieving a band 4 level of achievement in numeracy compared to the school average 2008-2011 as evident in the following graph.
There was a reduction in the percentage of students achieving a band 1 level of achievement in numeracy compared to the school average 2008-2011.
The percentage of students achieving band 5 and 6 levels of achievement in numeracy in 2011 was lower than the school average 2008-2011, the SSG and State DEC percentages.
0
5
10
15
20
25
30
35
1 2 3 4 5 6
Pe
rce
nta
ge o
f st
ud
en
ts
Bands
Percentage in bands: Year 3 Spelling
Percentage in Band
School Average 2008-2011
SSG % in Band 2011
State DEC % in Band 2011
0
5
10
15
20
25
30
35
40
1 2 3 4 5 6
Pe
rce
nta
ge o
f st
ud
en
ts
Bands
Percentage in bands: Year 3 Grammar & Punctuation
Percentage in Band
School Average 2008-2011
SSG % in Band 2011
State DEC % in Band 2011

11
Students and teachers travelled to Life Education lectures at the Life Education Centre. Parent support for this program is
greatly appreciated and highly valued.
The sesquicentennial cake!
Literacy – NAPLAN Year 5
There was a noticeable increase in the percentage of year 5 students achieving a band 5 and 6 level of achievement in reading compared to the school average 2008-2011 as evident in the graph below.
The percentage of students achieving band 8 levels of achievement in reading exceeded the SSG and State DEC percentages though lower than the school average 2008-2011.
The percentage of students achieving band 4 levels of achievement in reading in 2011 was lower than the school average 2008-2011 and State DEC percentages.
0
10
20
30
40
1 2 3 4 5 6
Pe
rce
nta
ge o
f st
ud
en
ts
Bands
Percentage in bands: Year 3 Numeracy
Percentage in Band
School Average 2008-2011
SSG % in Band 2011
State DEC % in Band 2011
0
10
20
30
40
3 4 5 6 7 8
Pe
rce
nta
ge o
f st
ud
en
ts
Bands
Percentage in bands: Year 5 Reading
Percentage in Band
School Average 2008-2011
SSG % in Band 2011
State DEC % in Band 2011
0
10
20
30
40
3 4 5 6 7 8
Pe
rce
nta
ge o
f st
ud
en
ts
Bands
Percentage in bands: Year 5 Writing
Percentage in BandSSG % in Band 2011State DEC % in Band 2011

12
As there was a change to the area of assessment in writing it is not possible to compare data from previous years. Students in both year 3 and year 5 were asked to write a persuasive text response to a writing stimulus rather that a narrative response.
The percentage of year 5 students achieving a band 7 or 8 level of achievement in writing exceeded the Similar School Group (SSG) average and State DEC percentage in bands 2011 as is evident in the graph above.
The percentage of students achieving band 3 levels of achievement was lower than the SSG percentage lower than the state DEC percentage.
Mrs Candy and Mrs Pink in colonial period costume placed wattle on the tables at the Sesquicentennial Open Day
morning tea.
The percentage of year 5 students achieving a band 7 or 8 level of achievement in spelling exceeded the Similar School Group (SSG) and State DEC percentage in bands 2011 as is evident in the graph above.
The percentage of students achieving band 3 levels of achievement in spelling was lower than the school average 2008-2011, SSG percentage and the state DEC percentage.
The percentage of year 5 students achieving a band 8 level of achievement in grammar and punctuation exceeded the school average 2008-2011, Similar School Group (SSG) and State DEC percentage in bands for 2011 as is evident in the graph above.
The percentage of students achieving band 3 levels of achievement in grammar and punctuation was lower than the school average 2008-2011.
The percentage of students achieving a band 6 level of achievement in grammar and punctuation exceeded the school average 2008-2011.
Numeracy – NAPLAN Year 5
The percentage of year 5 students achieving a band 8 level of achievement in numeracy exceeded the school average 2008-2011, Similar School Group (SSG) and State DEC percentage in bands for 2011 as is evident in the following graph.
0
10
20
30
3 4 5 6 7 8
Pe
rce
nta
ge o
f st
ud
en
ts
Bands
Percentage in bands: Year 5 Spelling
Percentage in Band
School Average 2008-2011
SSG % in Band 2011
State DEC % in Band 2011
0
10
20
30
3 4 5 6 7 8
Pe
rce
nta
ge o
f st
ud
en
ts
Bands
Percentage in bands: Year 5 Grammar & Punctuation
Percentage in Band
School Average 2008-2011
SSG % in Band 2011
State DEC % in Band 2011

13
The percentage of students achieving band 7 levels of achievement in numeracy was lower than the school average 2008-2011, SSG and State DEC.
The percentage of students achieving band 5 levels of achievement in numeracy exceeded the school average 2008-2011.
The percentage of students achieving band 4 levels of achievement in numeracy was pleasingly lower than the school average 2008-2011. It should also be noted that the percentage of students achieving a band 3 was essentially similar the school average 2008-2011 and State DEC percentages.
Progress in literacy
As is evident in the graph below the average progress of students in reading between year 3 and year 5 was lower than the SSG and State DEC average 2009-2011.
Note that the average reading progress for the school, SSG and State DEC are lower in 2009-2011 when compared to 2008-2010.
As is evident in the graph above the average progress of students in spelling between year 3 and year 5 was similar to the SSG average and slightly lower than the State DEC average 2009-2011.
Note that the average spelling progress for the school, SSG and State DEC are lower in 2009-2011 when compared to 2008-2010.
As is evident in the following graph the average progress of students in grammar and punctuation between year 3 and year 5 exceeded the SSG and State DEC average 2009-2011.
Note that the average progress in grammar and punctuation for the school exceeded the 2008-2010 average progress. The SSG and State DEC average progress for students from year 3 to year 5 were lower in 2009-2011 when compared to 2008-2010.
0
10
20
30
40
3 4 5 6 7 8
Pe
rce
nta
ge o
f st
ud
en
ts
Bands
Percentage in bands: Year 5 Numeracy
Percentage in Band
School Average 2008-2011
SSG % in Band 2011
State DEC % in Band 2011
0
50
100
2008-2010 2009-2011
Pro
gre
ss
Average progress in Reading between Year 3 and 5
School SSG State DEC
0
50
100
2008-2010 2009-2011
Pro
gre
ss
Average progress in Spelling between Year 3 and 5
School SSG State DEC
0
20
40
60
80
100
120
2008-2010 2009-2011
Pro
gre
ss
Average progress in Grammar & Punctuation between Year 3 and 5
School SSG State DEC

14
Progress in numeracy
As is evident in the following graph the average progress of students in numeracy between year 3 and year 5 exceeded the SSG and was slightly lower than State DEC average 2009-2011.
Note that the average progress in numeracy in 2009-2011 for the school exceeded the 2008-2010 average progress.
Minimum standards
The Commonwealth Government sets minimum standards for reading, writing, grammar and punctuation, spelling and numeracy for Years 3, 5, 7 and 9.
The performance of the students in our school in the National Assessment Program – Literacy and Numeracy is compared to these minimum standards. The percentages of our students achieving at or above these standards are reported below.
Percentage of Year 3 students achieving at or above minimum standard (exempt students
included)
Reading 92.4
Writing 98.7
Spelling 96.2
Grammar & Punctuation 96.2
Numeracy 94.8
Percentage of Year 3 students achieving at or above minimum standard (exempt students
excluded)
Reading 93.6
Writing 100.0
Spelling 97.4
Grammar & Punctuation 97.4
Numeracy 96.1
Percentage of Year 5 students achieving at or above minimum standard (exempt students
included)
Reading 90.3
Writing 96.5
Spelling 98.2
Grammar & Punctuation 92.0
Numeracy 94.6
An old colonial student joins in the spirit and fun of the sesquicentennial open day in period costume.
Significant programs and initiatives
Aboriginal education
Our focus this year in Aboriginal education was on developing personalized learning plans. The school views relationships as being the positive basis upon which all learning and development is constructed.
Multicultural education
Throughout 2011 we implemented significant in class support learning support programs to assist students who are new arrivals to Australia. We
0
20
40
60
80
100
120
2008-2010 2009-2011
Pro
gre
ss
Average progress in Numeracy between Year 3 and 5
School SSG State DEC

15
also supported and assisted students from Language Backgrounds Other Than English through our ESL programs.
Significantly, we were able to employ a School Learning Support Officer (Ethnic) 2 days per week to assist students and parents from Assyrian and Chaldean speaking and writing backgrounds.
Our winning entry in the Bunnings – Jellybean mosaic competition. With the $250 prize staff from Bunnings will
paint a wall at the school during 2012. Note, not one jellybean was eaten during the construction of this mosaic!
National partnership programs
In late 2010 we began to plan for and implement our response to Smarter Schools National Partnership – Improving Teacher Quality, Centre for Excellence (SSNP-ITC-C4E). Colyton, as the hub school involved spoke schools in working to improve teacher quality with a focus on writing. The schools worked with pre-service, early career and experienced teachers. The schools involve in the SSNP ITC C4E are Colyton, Bennett Road and St Marys South Public Schools; Erskine Park, Penrith Selective and St Marys Senior High schools.
Our results are integrated into the remainder of this report. The school views professional learning and professional collegiality as essential for the development of quality teaching. The school acknowledges, appreciates and values the genuine and enthusiastic support of staff from all schools involved and their preparedness to improve and expand their teaching repertoires, skills and knowledge.
Significantly, it should be noted that across the C4E there were 31 student teachers in pre service training involved in school practicum placements.
Progress on 2011 targets
The following analysis and observations are noted in respect to progress on our 2011 targets from the 2010 annual school report.
Target 1 – Literacy Reading Year 3
To raise the percentage of students in year 3 achieving band 2-6 levels of achievement in reading to 96.2%, reduce the percentage of students achieving band 1-2 to less than 14.6% and maintain the percentage of students at ‘proficiency’ band 5 or 6 levels of achievement to at or above 41.6%.
Our achievements include:
Analysis of 2011 NAPLAN data reveals that:
94% of Year 3 students achieved at or above minimum standard in reading, 2.2% below the school’s target of 96.2%.
In Year 3 23.1% of students achieved minimum standards, ie band 2-3 levels of achievement. This was 10.5% more than the target 14.6%. A total of 29.5% of students achieved ‘proficiency’ in reading and this was 12.1% lower than the target of 41.6%.
Best Start online recording was successfully trialed in Year 1 and Year 2 classes. In 2012 we will consolidated our learning and continue to expand our capacity to use best Start tools to enhance student learning outcomes and teacher quality. Language, Literacy, Learning (L3) was very successfully implemented in Early Stage 1 classrooms.
All Early Stage 1 classrooms were similarly resourced to support new L3 teaching and learning strategies in early reading skills development.
Target 1
To raise the percentage of students in year 5 achieving band 4-8 levels of achievement in reading to 91.7%, reduce the percentage of students achieving band 3-4 to less than 21.8% and maintain the percentage of students at

16
‘proficiency’ band 7 or 8 levels of achievement to at or above 33.8%.
Our achievements include:
90.2% of Year 5 students achieved at or above band 4-8 levels of achievement in reading This was 0.5%% lower than the school’s target of 91.7%.
In Year 5 21.2% of students achieved minimum standards, band 3-4 levels of achievement this was 0.6% lower than the target of 21.8%.
32.7% of students achieved ‘proficiency’ in reading and this was 1.1% lower than the target of 33.8%.
Target 2
In Writing 90 % of Year 5 students achieving Band 4-8 and 90% of Year 3 students achieving Band 2 or higher in NAPLAN.
96% of Year 5 students achieved at or above minimum standard in writing, exceeding the school’s target by 6%.
100% of Year 3 students achieved at or above minimum standard in writing, exceeding the school’s target by 10.0%.
Throughout 2011 all teachers were supported to develop their capacity to provide quality teaching in writing through the National Smarter Schools National Partnership – Centre for Excellence Improving teacher Quality. The achievements of students in writing are a reflection of the individual and collective efforts of teachers through of the C4E writing initiatives.
Target 3
To raise the percentage of students in year 3 achieving band 2-6 levels of achievement in overall numeracy to 93.6%; reduce the percentage of students achieving band 1-2 to less than 19.6% and maintain the percentage of students at ‘proficiency’ band 5 or 6 levels of achievement to at or above 35.2%
Analysis of 2011 NAPLAN data reveals that:
96.1% of year 3 students achieved at or above minimum standard in numeracy, this exceeded by 2.5% the school’s target of 93.6%.
25.0% of year 3 students achieved minimum standards, band 3-4 levels of achievement in numeracy this was lower by 5.4% than the target of 19.6 % set in 2010. A total of 22.4% of students achieved ‘proficiency’ in numeracy; this was 12.8% lower than the target of 35.2%.
Target 4
To raise the percentage of students in year 5 achieving band 4-8 levels of achievement in overall numeracy to 96.2%; reduce the percentage of students achieving band 3-4 to less than 20.2% and maintain the percentage of students at ‘proficiency’ band 7 or 8 levels of achievement to at or above 20.2%.
Our achievements include:
Analysis of 2011 NAPLAN data reveals that:
94.6% of year 5 students achieved at or above minimum standard in numeracy, 1.6% below the school’s target of 96.2%.
18.8% of year 5 students achieved minimum standards, band 3-4 levels of achievement in numeracy this was an improvement 1.4% over the target of 20.2%. A total of 36.6% of students achieved ‘proficiency’ in numeracy and this exceeded the target of 20.2%.
Through the school’s Smarter Schools National Partnership – Improving Teacher Quality- Centre For Excellence the school will work with teachers from Colyton Public School and all primary schools involved in the Centre For Excellence program to implement school and Centre For Excellence wide consistency in teaching numeracy.
Students and parents joined in the spirit of the sesquicentennial and dressed in old colonial day period
costume.

17
Target 5
To increase student engagement in learning and the achievement of higher bands of performance through increased school attendance improved punctuality by raising the average attendance rate from 93.7% to 94.4%
Our achievements include:
Analysis of our attendance data for 2011 indicates a daily attendance rate of 94.3%. This is an improvement of 0.6% over our previous attendance rate of 93.7% and very close to our intended target attendance rate of 94.4%.
The school matched the attendance rate for Western Sydney Region and NSW state attendance rates.
Significantly, the following attendances rates for each year were recorded in 2011. Please note, # indicates higher than state average daily attendance rates for 2011.
Kindergarten 94.0%
Year 1 93.6%
Year 2 93.7%
Year 3 94.5% # above state
Year 4 94.1%
Year 5 95.4% # above state
Year 6 94.3% # above state
Key evaluations
It is a requirement for all NSW public schools to conduct at least two annual evaluations – one related to educational and management practice and the other related to curriculum. In 2011 our school carried out evaluations of
As seen in the graph above teachers agreed or strongly agreed that their students are making sound achievements in writing.
Evident in the graph above is the strong agreement felt by teachers towards the support provided by the Highly Accomplished teacher.
The graph above indicates the extent to which teachers felt the paraprofessionals helped them to deliver their teaching and learning programs.
It should also be noted that the paraprofessionals did not work in all classrooms and this is evident by the fact almost 30% of teaching staff disagreed or did not know the extent to which the paraprofessional had assisted them to implement their programs.
The school had placed the educational paraprofessionals according to the needs of students and teachers for support and did not distribute the resource across all teachers. This was considered to be the most appropriate use of the paraprofessional resource. The school also
0
20
40
60
StronglyAgree
Agree Disagree Don'tknow
Q 3. My own class based assessments indicate that my students are making
sound achievements in writing.
0
10
20
30
40
50
60
StronglyAgree
Agree Disagree Don't know
Q 7. The Smarter School's National Partnership, (C4E) Highly
Accomplished Teacher (HAT) has helped me to improve my capacity to
teach writing skills to my students.
0
20
40
60
StronglyAgree
Agree Disagree Don'tknow
Q 8. The Smarter School's National Partnership, (C4E) Paraprofessional
has helped me to deliver my teaching and learning program to my
students.

18
used the paraprofessional role to assist in administration for two days per week.
All teachers responded that they used the NSW Board of Studies syllabus outcomes for writing to check that their teaching and learning programs covered all areas of expected writing outcomes.
Educational and management practice
Throughout 2012 we evaluated the teaching dimension of educational and management practice.
Background
The school has been nominated as A Centre of Excellence – Improving Teacher Quality. The school views the quality teaching framework as a pivot for all teachers in providing consistent quality learning for all students.
The quality of teachers is also influenced by their pre-service training and the continuing development of teachers is now being acknowledged by the number of teachers accredited by the NSW Institute Of Teachers (NSWIoT).
Online surveys were conducted of teaching staff and executive from schools across the Centre For Excellence by DEC and data was also collected from schools by our school.
Findings and conclusions
Data revealed that there were 15 student teacher practicum placements in Semester 1 and 16
student teacher practicum placements in Semester 2 across our Smarter Schools National Partnership – Improving Teacher Quality – Centre For Excellence. The schools involved in the Smarter Schools National Partnership – Improving Teacher Quality – Centre For Excellence are; Bennett Road, St Marys, St Marys South and Colyton Public Schools, Erskine Park High School, Penrith Selective High School, and St Marys Senior High School.
Data also revealed that at four permanent teachers, six temporary teachers completed NSWIoT accreditation at the level of professional competence at Colyton Public School.
Data provided by teachers in Early Stage 1 from our implementation of the Language. Literacy Learning (L3) was analysed. The data is summarized and demonstrated in the next two pie chart graphs.
As is evident in the assessment data supplied by teachers the L3 program in 2011 has improved the percentage of students reading at reading recovery level 9+ from 41% to 58%, increased the percentage of students reading at level 6-8 from 24% to 30% and decreased the percentage of students reading at level 0-5 when compared to our 2010 school based data.
Future directions
There is evidence in our both our school based and NAPLAN data that there has been an improvement in the quality of teaching in writing. In 2012, we will seek to continue to support teachers in developing their capacity to provide quality teaching in writing and to extend that to include quality teaching in numeracy.
0
10
20
30
40
50
60
70
StronglyAgree
Agree Disagree Don'tknow
Q 13. I have used the NSW Board of Studies syllabus outcomes for writing
to check that my teaching and learning program is covering
all expected writing outcomes.
19
Curriculum
During 2011 the school chose to evaluate the writing aspect of the English curriculum. Writing has been a focus for the Smarter Schools National Partnership – Improving Teacher Quality.
The school also carried out the Computer Skills Assessment 6 (CSA6) to evaluate student achievement and our computer skills program.
Background
The school views developing keys skills in writing and technology as being vital for all students. Surveys were completed by staff, parents and students; analysis was completed on NAPLAN data for year 3, 5 and year 7.
The CSA6 practical assessments were completed with year 6 students and their responses comprehensively evaluated and reported as other evaluations.
Findings and conclusions
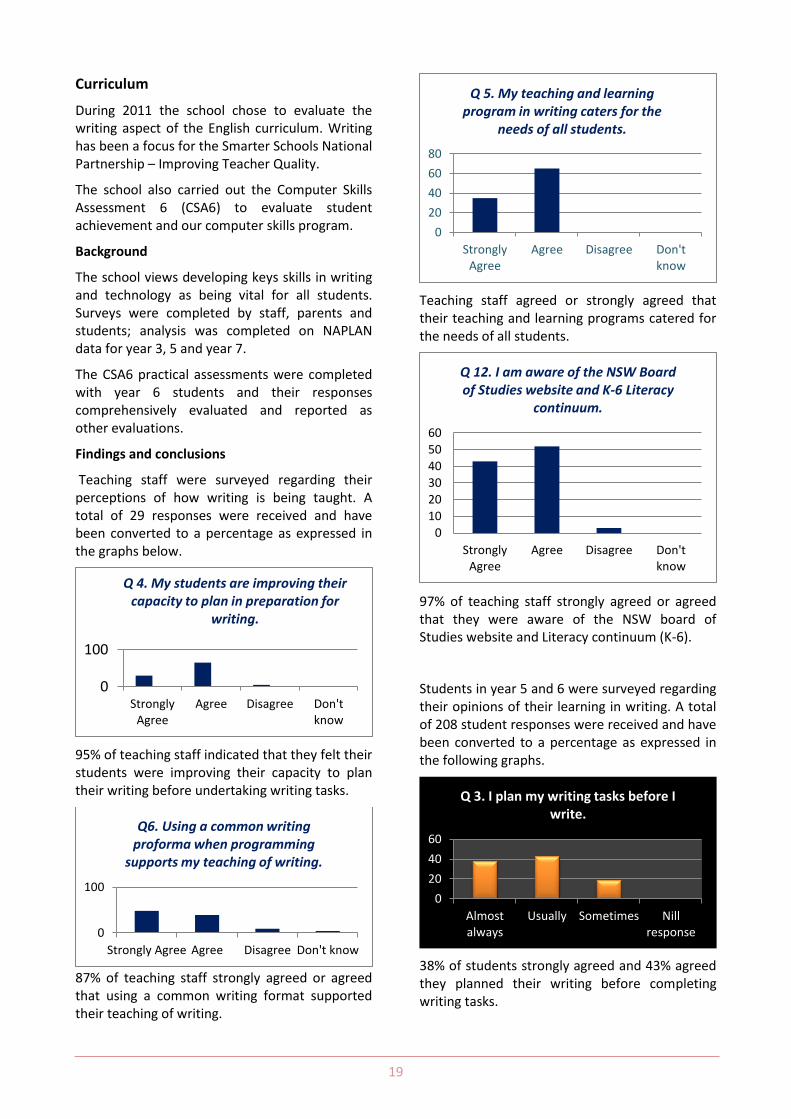
Teaching staff were surveyed regarding their perceptions of how writing is being taught. A total of 29 responses were received and have been converted to a percentage as expressed in the graphs below.
95% of teaching staff indicated that they felt their students were improving their capacity to plan their writing before undertaking writing tasks.
87% of teaching staff strongly agreed or agreed that using a common writing format supported their teaching of writing.
Teaching staff agreed or strongly agreed that their teaching and learning programs catered for the needs of all students.
97% of teaching staff strongly agreed or agreed that they were aware of the NSW board of Studies website and Literacy continuum (K-6).
Students in year 5 and 6 were surveyed regarding their opinions of their learning in writing. A total of 208 student responses were received and have been converted to a percentage as expressed in the following graphs.
38% of students strongly agreed and 43% agreed they planned their writing before completing writing tasks.
0
100
StronglyAgree
Agree Disagree Don'tknow
Q 4. My students are improving their capacity to plan in preparation for
writing.
0
100
Strongly Agree Agree Disagree Don't know
Q6. Using a common writing proforma when programming
supports my teaching of writing.
0
20
40
60
80
StronglyAgree
Agree Disagree Don'tknow
Q 5. My teaching and learning program in writing caters for the
needs of all students.
0
10
20
30
40
50
60
StronglyAgree
Agree Disagree Don'tknow
Q 12. I am aware of the NSW Board of Studies website and K-6 Literacy
continuum.
0
20
40
60
Almostalways
Usually Sometimes Nillresponse
Q 3. I plan my writing tasks before I write.

20
Significantly, 19% of students surveyed disagreed. Teaching staff will continue to engage students in the planning process prior to completing writing tasks.
78% of year 5 and 6 students agreed or strongly agreed they were good at self-editing their writing. Significantly, 21% of students recognized they need further confidence and skills to self – edit their writing. Teachers will continue to help and guide students to self-correct and proof read their writing tasks.
70% of year 5 and 6 students strongly agreed and 24% agreed that they enjoyed interactive whiteboard lessons that helped them to write.
Teachers will continue to use the interactive whiteboard technology to provide stimulus, background experiences and information to guide students in completing their writing tasks.
48% of students strongly agreed and 36% of students agreed their teacher made English writing lessons interesting and enjoyable.
Parents were invited to complete writing survey through the schools Newsletter. A total of 65 responses were received. Interestingly 7 surveys were completed online and emailed to the school. The responses have been converted to a percentage and expressed in the graphs below.
69% of parents who responded to the survey on writing strongly agreed writing was an important area of learning at school.
74% of parent respondents strongly agreed their child enjoys participating in English writing lessons using the interactive whiteboards. A number of parents also indicate that they would like to see how teachers and students use the interactive whiteboards in their comments.
0
20
40
60
Stronglyagree
Agree Disagree Nillresponse
Q 3. I plan my writing tasks before I write.
0
50
100
Stronglyagree
Agree Disagree Nillresponse
Q 6. I enjoy interactive whiteboard presentations that help me to write.
0
50
100
Stronglyagree
Agree Disagree Nillresponse
Q 8. My teacher makes English - writing lessons interesting and
enjoyable
0
20
40
60
80
Stronglyagree
Agree Disagree Don't know
Q 1. English – writing is an important learning area at school.
0
20
40
60
80
Stronglyagree
Agree Disagree Don't know
Q7. My child enjoys participating English writing lessons using the
Interactive Whiteboard.
0
50
100
Stronglyagree
Agree Disagree Don'tknow
Q 9. I would like to see parent information sessions and workshops
in writing, so that parents have a greater understanding of what is
being taught in class and expected of students.

21
42% of parent respondents agreed and 58% of parents strongly agreed they like information sessions on writing.
A range of responses was noted to the above question. 72% of parents who responded indicated that their child enjoys presenting written texts at home or school. Teachers will continue to provide opportunities for students to present and share their written texts and develop confidence in presenting their work to others.
Future directions
The school will continue our plans to provide quality professional learning and teaching in the writing through our Smarter School National Partnership – Improving Teacher Quality.
Parents will be invited to attend a series coffee and chat sessions in 2012 to assist them in helping their children and to share information about school and DEC programs.
Other evaluations
During term 4 2011, students from year 6
completed the Computer Skills Assessment for
Year 6, (CSA6). The school has elected to invite
students to participate in the CSA6 each year to
assist in our evaluations of student achievement
and our teaching in the area of computer skills.
As not all schools elect to participate in the CSA6
the information we gathered is essentially based
only on our achievement of our schools’ year 6
students who completed the test.
There were 36 test items in the CSA6. A total of
81 year 6 students completed the CSA in 2011.
The average raw score for our students was 25,
or 69% correct and the range of score was from 4
to 35.
The median or middle raw score was 27 or 75%
correct. In 2012, we will again invite year 6
students to complete the CSA 6 and review
student achievement and our computer skills
development programs.
Analysis of responses to assessment questions revealed that our year 6 students showed strengths in word processing, internet and computer skills but need more assistance with spread sheets and databases. These aspects of our computer skills program will be strengthened in 2012.
Parent, student, and teacher satisfaction
In 2011 the school sought the opinions of parents, students and teachers about the school.
A sample of 65 randomly selected parents was contacted by phone and their responses were recorded. For easy comparison the responses have been converted to percentages. There were ten questions in the phone survey and a summary of five questions are reported in this annual school report. Their responses are presented below.
As is evident in the graph above parents who responded to the survey strongly agreed or agreed that the school was friendly, tolerant and accepting of all students.
0
10
20
30
40
Stronglyagree
Agree Disagree Don'tknow
Q 12. My child enjoys presenting their written texts to an audience at
school or at home.
0
20
40
60
80
Stronglyagree
Agree Disagree Stronglydisagree
Q 2. The school is a friendly school that is tolerant and accepting of all
students.

22
All parents who responded to the survey strongly agreed or agreed that the school adopts new technology to engage its students in quality learning.
All parents who responded to the survey strongly agreed or agreed that student achievements are recognized throughout the school.
All parents who responded to the survey strongly agreed or agreed that the school offers a wide range of extra curricula programs and activities for students.
In 2012 the school will undertake the GOTIT program to assist the whole school community to develop insights into and awareness of strategies to support students with autism and related emotional and social needs.
During 2012, the school will review and revise the School Learning Support Teacher allocation and roles in supporting students and their families across the school.
Professional learning
Teacher professional learning continues to be a key element in supporting students to achieve improved learning outcomes and teacher capacity to address the learning needs of all students.
A total of $31,956.95 was paid in respect to teacher professional learning in the following areas; syllabus implementation, quality teaching, supporting beginning teachers, teacher welfare, use of ICT, supporting teacher understanding, skill and knowledge in respect to literacy, and numeracy and career development.
Coffee cups and keys rings – sesquicentennial memorabilia.
0
20
40
60
80
Stronglyagree
Agree Disagree Stronglydisagree
Q 5. The school adopts new technology to engage its students in quality
learning.
0
20
40
60
80
Stronglyagree
Agree Disagree Stronglydisagree
Q7. Student achievements are recognised throughout the school.
0
20
40
60
80
Stronglyagree
Agree Disagree Stronglydisagree
Q10. A wide range of extracurricular
programs are offered eg sport, performing arts, public speaking and
debating.
0
10
20
30
40
50
60
Stronglyagree
Agree Disagree Stronglydisagree
Q6. Fair discipline exists within the school.

23
School planning 2012—2014
The school planning policy provides direction for the preparation and implementation of school plans including the identification of priority areas, intended outcomes and targets that are consistent with the NSW State Plan and the Department’s planning documents.
School priority 1
Outcome for 2012–2014
Improved Literacy – Writing
2012 Targets to achieve this outcome include:
In Writing 95 % of Year 5 students achieving Band 4-8 and 95% of Year 3 students achieving Band 2 or higher in NAPLAN.
Strategies to achieve these targets include:
Literacy, learning language (L3) is implemented in all Early Stage 1 class and teachers are trained and qualified in implementation of L3.
Best Start curriculum and assessment program is fully implemented across the early years, K-1 and year 2. Teaching and support staff are using IWB technology and consistent strategies in teaching writing.
A common approach to teaching writing and lesson preparation is in operation across the school. The HAT and paraprofessionals support writing and student learning.
School priority 2
Improved Numeracy
2012 Targets to achieve this outcome include:
In Numeracy 95 % of Year 5 students achieving Band 4-8 and 95% of Year 3 students achieving Band 2 or higher in NAPLAN.
Strategies to achieve these targets include:
Early Stage 1, year 1 and year 2 teachers actively implementing Best Start and recording student assessment data online to inform teaching and learning.
All teachers using a common approach to planning for teaching of numeracy that integrates the quality teaching framework into all numeracy lessons. Quality teaching in
numeracy is supported by the Smarter Schools National Partnership – Improving Teacher Quality – Centre for Excellence programs.
Students in senior years engaged with video conferencing lessons.
Numeracy assessment tasks are rich tasks developed in line with the quality teaching frameworks, practical and authentic in nature, acknowledge student achievement and inform teaching.
Maths Olympiad, EEA assessments are further promoted. Students actively engaged in relevant, practical and authentic numeracy extension programs.
Improved Literacy – Reading
2012 Targets to achieve this outcome include:
In Reading 95 % of Year 5 students achieving Band 4-8 and 95% of Year 3 students achieving Band 2 or higher in NAPLAN.
Strategies to achieve these targets include:
The National Year of Reading is promoted across the community and students are actively supported to engage in developing deep reading skills.
Best Start curriculum and assessment program is fully implemented across the early years, K-1 and year 2. Teaching and support staff are using IWB technology and consistent strategies in teaching reading.
Support teaching staff (ESL,STLA) are using phonemic awareness programs that support learners experiencing difficulties in achieving L3 and Best Start curriculum learning outcomes.
Quality teaching in writing and reading are supported by the Smarter Schools National Partnership – Improving Teacher Quality – Centre for Excellence programs. Stop and Read daily program introduced across the school.
Improved social cohesion
2012 Targets to achieve this outcome include:
Increased achievement of learning outcomes and deeper engagement in learning of students assisted by teachers in support roles.

24
Strategies to achieve these targets include:
Review of the STLA allocation and roles in supporting students.
All Teaching and support staff have permanent access to and are actively using IWB technology and consistent teaching strategies to those in regular main steam classrooms. Support teaching staff,(STLA, ESL) are using phonemic awareness programs that support learners experiencing difficulties in achieving L3 and Best Start curriculum learning outcomes.
The learning support team (LST) and support teachers respond flexibly to meet the current and emerging needs of students with special needs.
GOTIT autism awareness program implement with the support of NSW Health during 2012. Teachers and parents offered training and support.
Conductive hearing loss screening program implemented to detect and assist students presenting at school with Otitis Media and related hearing loss. Staff awareness training and screening for students.
Students with a confirmed disability have a personalized and support plan.
About this report
In preparing this report, the self-evaluation committee has gathered information from evaluations conducted during the year and analysed other information about the school's practices and student learning outcomes. The self-evaluation committee and school planning committee have determined targets for the school's future development.
Geoff Yates Principal
Cobi Candy Assistant Principal
Greg Edwards Assistant Principal
Stacey Hind Class Teacher
Lisa Rodgers Class Teacher
Sharon Gordon Highly Accomplished Teacher
Tenile Paine P&C President
Reg Barono School Council President
School contact information
Colyton Public School
105 Nelson Street
MOUNT DRUITT
Ph: 9625 8185
Fax: 9832 2403
Email: [email protected]
Web:
School Code: 1596
Parents can find out more information about Annual School Reports, how to interpret information in the reports and have the opportunity to provide feedback about these reports at:
http://www.schools.nsw.edu.au/asr

25
The following pages are dedicated to pictures
from the Sesquicentennial and activities
throughout 2011.
A copy of the logo created by Mr Bourke
recognizing the Sesquicentennial – 150 years of
public education at Colyton Public School 1861-
2011
Our School Spectacular Dancers performed at the
Entertainment Centre and also during the
Sesquicentennial.
The OC classes performed their rap during the
Sesquicentennial concert.
Miss Hall introducing the junior dancers at
Westfields – Mt Druitt
Mrs Aarts, Ms Kemp and Mr Bourke assisting
guests to sign on and obtain official badges at the
beginning of the Sesquicentennial Open Day
The Bush Dance – a fun time for all who were
able to attend during the Sesquicentennial.
26
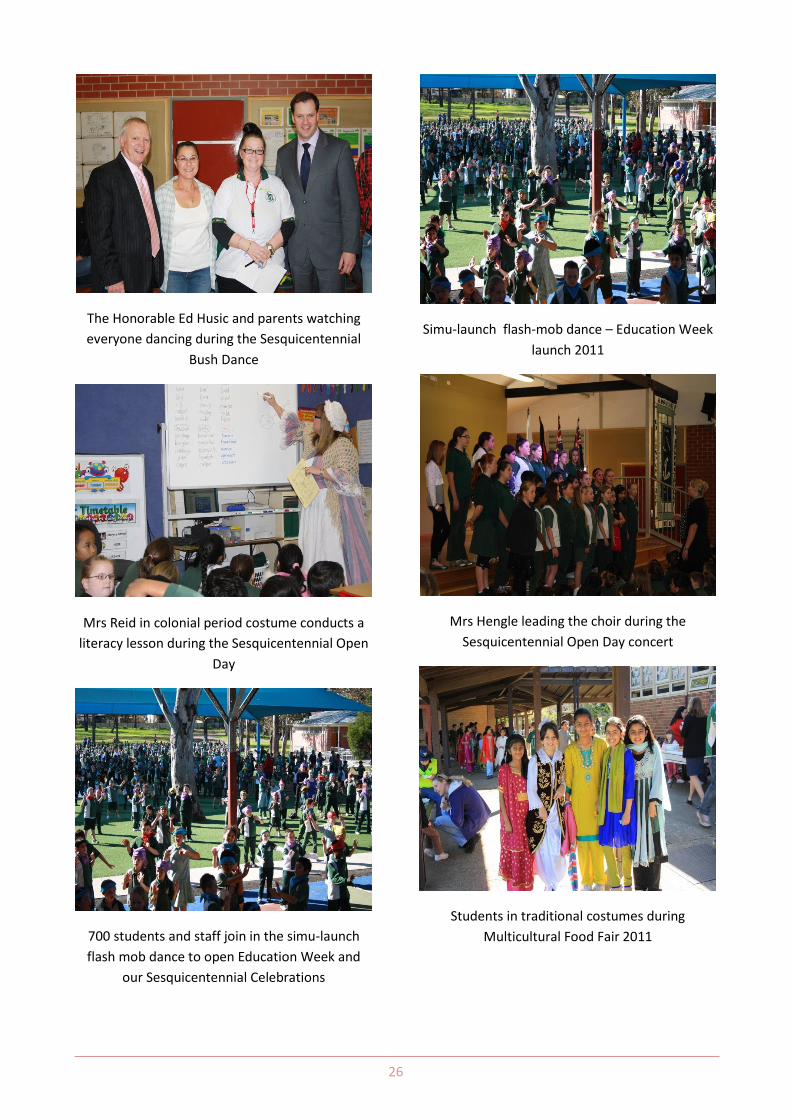
The Honorable Ed Husic and parents watching
everyone dancing during the Sesquicentennial
Bush Dance
Mrs Reid in colonial period costume conducts a
literacy lesson during the Sesquicentennial Open
Day
700 students and staff join in the simu-launch
flash mob dance to open Education Week and
our Sesquicentennial Celebrations
Simu-launch flash-mob dance – Education Week
launch 2011
Mrs Hengle leading the choir during the
Sesquicentennial Open Day concert
Students in traditional costumes during
Multicultural Food Fair 2011

27
Teachers and parents serving and students in
traditional costumes during the Multicultural
Food Fair 2011
Students in traditional costumes during the
Multicultural Food Fair 2011
Students in traditional costumes and chosen
costumes during the Multicultural Food Fair 2011
Students from Year 5 engaged in workshops
during the Mount Druitt Swimming Centre -
Environmental Design of the Mosaic Mural
project. In 2012, students will be invited to the
official opening and launch of the design at Mt
Druitt Swimming Centre.
Above and below Get Skilled – Get Fit weekly
fitness program, 2011.

28


