Columbia River Crossing Environmental Impact Statement
60
Designing A Critical Link Designing A Critical Link PSU Transportation Seminar May 19, 2006
-
Upload
trec-at-psu -
Category
Education
-
view
89 -
download
0
Transcript of Columbia River Crossing Environmental Impact Statement

Designing A Critical LinkDesigning A Critical LinkPSU Transportation Seminar
May 19, 2006

2PSU Transportation Seminar – May 19, 2006
Presentation Outline
• Project History• Function and Role of the I-5 Crossing• Need for the Columbia River Crossing project • Design Challenges• Project Alternatives• Process and Schedule

Project HistoryProject History

4PSU Transportation Seminar – May 19, 2006
I-5 Columbia River Bridges
• 2 side-by-side bridges
• Eastern (northbound) built in 1917
• Western (southbound) built in 1958
• 3 lanes each direction

5PSU Transportation Seminar – May 19, 2006
I-5 Columbia River Bridges
• Glenn Jackson Bridge -1982
• Current traffic volumes
• ~135,000 vehicles per day on each bridge

6PSU Transportation Seminar – May 19, 2006
Recommendations from the 2002 Partnership Study:
• Provide for high capacity transit linking Portland and Clark County
• Improve I-5 by addressing bottlenecks at:
• 99th Street to I-205, Clark County
• Delta Park to Lombard, Portland
• Columbia River Crossing and related interchanges (SR-500 to Columbia Boulevard)

Function and RoleFunction and Role

8PSU Transportation Seminar – May 19, 2006
Function and Role of theI-5 Bridge Influence Area
• Connects Washington and Oregon
• Connects with 4 state highways and 5 major arterial roadways
• Provides access to variety of land uses

9PSU Transportation Seminar – May 19, 2006
Southbound Vehicle Trips within BIA (2005)

10PSU Transportation Seminar – May 19, 2006
Northbound Vehicle Trips within BIA (2005)

Need for the Project Need for the Project

12PSU Transportation Seminar – May 19, 2006
Project to address a range of needs: • Travel demand exceeds capacity• Transit service is limited to the same congested
corridor as other modes• Freight mobility to/from and through the area is
impaired• Crash rates are too high• Bike and pedestrian facilities are inadequate• Bridges do not meet current seismic standards

13PSU Transportation Seminar – May 19, 2006
Travel demand exceeds capacity
• Causing heavy congestion and delay during peak travel periods for automobile, transit, and freight traffic
• Limiting mobility within the region and impedes access to major activity centers.

14PSU Transportation Seminar – May 19, 2006
Time of Day (Hour Beginning)
Traf
fic V
olum
es –
All V
ehic
les
Northbound I-5 Volume Across Interstate Bridge (2005)

15PSU Transportation Seminar – May 19, 2006
Time of Day (Hour Beginning)
Traf
fic V
olum
es –
All V
ehic
les
Northbound I-5 Volume Across Interstate Bridge (2005)

16PSU Transportation Seminar – May 19, 2006
Time of Day (Hour Beginning)
Traf
fic V
olum
es –
All V
ehic
les
Northbound I-5 Volume Across Interstate Bridge (2005)

17PSU Transportation Seminar – May 19, 2006
Time of Day (Hour Beginning)
Traf
fic V
olum
es –
All V
ehic
les
Northbound I-5 Volume Across Interstate Bridge (2005)

18PSU Transportation Seminar – May 19, 2006
Time of Day (Hour Beginning)
Traf
fic V
olum
es –
All V
ehic
les
Southbound I-5 Volume Across Interstate Bridge (2005)

19PSU Transportation Seminar – May 19, 2006
Time of Day (Hour Beginning)
Traf
fic V
olum
es –
All V
ehic
les
Northbound I-5 Volume Across Interstate Bridge (2020)

20PSU Transportation Seminar – May 19, 2006
Time of Day (Hour Beginning)
Traf
fic V
olum
es –
All V
ehic
les
Northbound I-5 Volume Across Interstate Bridge (2020)

21PSU Transportation Seminar – May 19, 2006
Time of Day (Hour Beginning)
Traf
fic V
olum
es –
All V
ehic
les
Northbound I-5 Volume Across Interstate Bridge (2020)

22PSU Transportation Seminar – May 19, 2006
Time of Day (Hour Beginning)
Traf
fic V
olum
es –
All V
ehic
les
Northbound I-5 Volume Across Interstate Bridge (2020)

23PSU Transportation Seminar – May 19, 2006
Time of Day (Hour Beginning)
Traf
fic V
olum
es –
All V
ehic
les
Southbound I-5 Volume Across Interstate Bridge (2020)

24PSU Transportation Seminar – May 19, 2006
Travel Demands and Traffic Congestion
If:• no I-5 highway capacity improvements, or• traffic demands increase to predicted 2020 levels, Then:• the current duration of congestion would be expected
to more than double by 2020

25PSU Transportation Seminar – May 19, 2006
Existing Transit Services
• One local bus route serving Portland and Vancouver downtowns
• Five commuter express routes serving Clark County and downtown Portland
• Interstate MAX to Expo • Transit services constrained
by limited roadway capacity and congestion

26PSU Transportation Seminar – May 19, 2006
Transit travel times are expected to double between 2000 and 2020
Projected Transit Travel Time between downtown Portland and downtown Vancouver under 2020 No
Build Conditions
27.3
55.4
010203040506070
Year 2000 Year 2020
Min
ute
s
Travel TimeSource: I-5 Partnership Evaluation Summary, 2003

27PSU Transportation Seminar – May 19, 2006
The I-5 bridge area and its approaches experience crash rates over two times higher than statewide averages for comparable urban freeways in Washington and Oregon, largely due to outdated design.
Incident evaluations attribute crashes to congestion, closely spaced interchanges, short weave and merge sections, vertical grade changes in the bridge span, and narrow shoulders.
Safety
28PSU Transportation Seminar – May 19, 2006
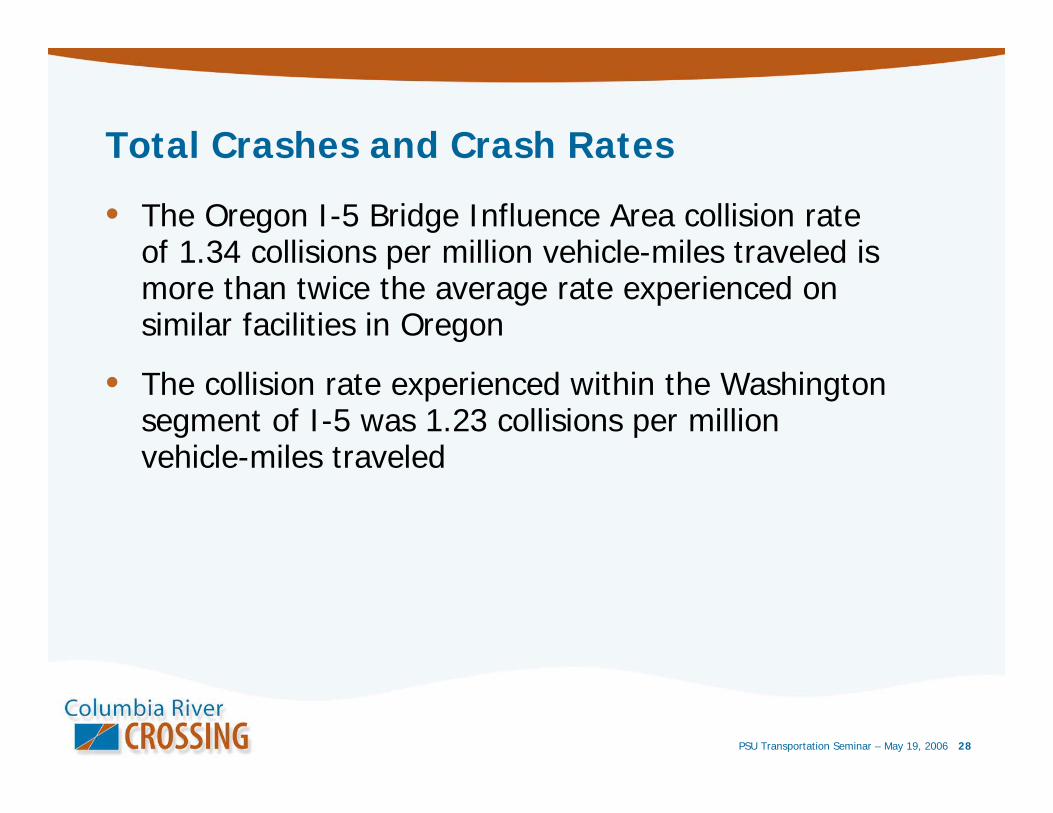
Total Crashes and Crash Rates
• The Oregon I-5 Bridge Influence Area collision rate of 1.34 collisions per million vehicle-miles traveled is more than twice the average rate experienced on similar facilities in Oregon
• The collision rate experienced within the Washington segment of I-5 was 1.23 collisions per million vehicle-miles traveled

29PSU Transportation Seminar – May 19, 2006
Washington I-5 BIA Crash History (2000-2004)

30PSU Transportation Seminar – May 19, 2006
Oregon I-5 BIA Crash History (2000-2004)

31PSU Transportation Seminar – May 19, 2006
Collisions by Type and Severity
• The total number of southbound crashes in Washington is about twice that of northbound crashes
• 69% rear-ends
• 18% side-swipes
• The total number of northbound crashes in Oregon is about twice that of southbound crashes
• 80% rear-ends
• 14% side-swipes

32PSU Transportation Seminar – May 19, 2006
Existing Highway Geometrics
Assessment was conducted to determine I-5 mainline features that do not meet current design standards:
• Ramp-to-highway acceleration lane length
• Highway-to-ramp deceleration lane length
• Highway weaving area lane length
• Highway horizontal alignment
• Highway vertical alignment
• Highway shoulder width

33PSU Transportation Seminar – May 19, 2006
Non-Standard Geometric Design Featuresin Washington
Ramp-to-highway acceleration lane lengthHighway-to-ramp deceleration lane lengthRamp-to-ramp separation lengths
Highway weaving area lane length
Highway horizontal alignmentHighway vertical alignment
Highway shoulder width

34PSU Transportation Seminar – May 19, 2006
Non-Standard Geometric Design Featuresin Oregon
Ramp-to-highway acceleration lane lengthHighway-to-ramp deceleration lane lengthRamp-to-ramp separation lengths
Highway weaving area lane length
Highway horizontal alignmentHighway vertical alignment
Highway shoulder width

35PSU Transportation Seminar – May 19, 2006
Collision Types and Highway Geometrics - Washington
Ramp-to-highway acceleration lane lengthHighway-to-ramp deceleration lane lengthRamp-to-ramp separation lengths
Highway weaving area lane length
Highway horizontal alignmentHighway vertical alignment
Highway shoulder width

36PSU Transportation Seminar – May 19, 2006
Collision Types and Highway Geometrics - Oregon
Ramp-to-highway acceleration lane lengthHighway-to-ramp deceleration lane lengthRamp-to-ramp separation lengths
Highway weaving area lane length
Highway horizontal alignmentHighway vertical alignment
Highway shoulder width

37PSU Transportation Seminar – May 19, 2006
Crashes During Bridge Lifts and Traffic Stops
• There is at least a 3 times higher likelihood of a northbound collision when a bridge lift/traffic stop occurs than when it does not
• There is over a 4 times higher likelihood of a southbound collision when a bridge lift/traffic stop occurs than when it does not

38PSU Transportation Seminar – May 19, 2006
Time of Day (Hour Beginning)
Num
ber o
f Cra
shes
Nor
thbo
und
Traf
fic V
olum
e
Northbound I-5 Crashes within BIA (2000-04)

39PSU Transportation Seminar – May 19, 2006
Northbound I-5 Crashes within BIA (2020)
Time of Day (Hour Beginning)
Num
ber o
f Cra
shes
Nor
thbo
und
Traf
fic V
olum
e

40PSU Transportation Seminar – May 19, 2006
Facilities for crossing the Columbia River are not designed to promote non-motorized access and connectivity across the river.
Bicycle and Pedestrian Facilities

41PSU Transportation Seminar – May 19, 2006
Minimum Standard Multi-Use Pathway on a Bridge Structure

42PSU Transportation Seminar – May 19, 2006
The bridges do not meet current seismic standards, leaving them vulnerable to failure in an earthquake.
Seismic
The major concerns are the foundations that are on timber piling, and the steel braces that are found in the lift span towers
Both are incapable of sustaining potential seismic forces

Design ChallengesDesign Challenges

44PSU Transportation Seminar – May 19, 2006
Vertical ConstraintsAir and Marine Navigation
WashingtonOregon
Existing Lift Spans
BNSF RR

45PSU Transportation Seminar – May 19, 2006
Vertical ConstraintsAir and Marine Navigation
WashingtonOregon
Approach Slope for Pearson Air Park

46PSU Transportation Seminar – May 19, 2006
Vertical ConstraintsAir and Marine Navigation
WashingtonOregon
Marine Vessel Clearance Requirements

47PSU Transportation Seminar – May 19, 2006
Vertical ConstraintsAir and Marine Navigation
WashingtonOregon

48PSU Transportation Seminar – May 19, 2006
Proximity of rail bridge to the I-5 Bridges

49PSU Transportation Seminar – May 19, 2006
Marine Navigation
Por
tland
Van
couv
er
BNSF Rail Br.
I-5 Bridges
Movable bridge span
Downstream
Bridge supports (piers)
Upstream

50PSU Transportation Seminar – May 19, 2006
Project Area Resources

Project AlternativesProject Alternatives

52PSU Transportation Seminar – May 19, 2006
Project Alternatives
… are under construction!• Alternatives will include:
• TDM and TSM measures• Replacement and supplemental bridges• Bus and LRT transit alternatives (and perhaps
commuter rail)• Consideration of general purpose freeway lanes,
managed lanes, and arterial lanes• Improvements to up to eight interchanges• Freight improvements• Bicycle and pedestrian improvements

53PSU Transportation Seminar – May 19, 2006
Preliminary River Crossing Concept

54PSU Transportation Seminar – May 19, 2006
Preliminary River Crossing Concept

55PSU Transportation Seminar – May 19, 2006
Preliminary River Crossing Concept

56PSU Transportation Seminar – May 19, 2006
Preliminary River Crossing Concept

Process and ScheduleProcess and Schedule

58PSU Transportation Seminar – May 19, 2006
Initial Development of
Alternatives
EIS Process and Schedule
2005 2006
Draft Environmental Impact Statement
2007 2008
Final EIS and Record of Decision
Evaluation Steps:1. Confirm “Universe” of Project Components2. Screen Components3. Assemble Components into Project Alternatives4. Screen Alternatives for Evaluation in DEIS5. Select Locally Preferred Alternative
Alternative Development and
Screening

59PSU Transportation Seminar – May 19, 2006
Other Challenges to Address:
• Ownership• Bridges• High Capacity Transit
• Funding• Tolling?
• Project Delivery • Operations
60PSU Transportation Seminar – May 19, 2006
Questions?