
Colour Correction using Histogram Stretching
13
Colour Correction using Histogram Stretching Part of series on Integrating space assets in airport management and operation GLOBAL AVIATION INNOVATION INCREASING FLIGHT SAFETY USER FRIENDLY SOFTWARE SOLUTIONS COMPLIANCE ASCEND XYZ
-
Upload
poul-kjeldager-sorensen -
Category
Science
-
view
173 -
download
3
Transcript of Colour Correction using Histogram Stretching
Colour Correction using Histogram Stretching Part of series on
Integrating space assets in airport management and operation
GLOBAL AVIATION INNOVATION
INCREASING FLIGHTSAFETY
USER FRIENDLY SOFTWARE SOLUTIONS
COMPLIANCE
ASCEND XYZ

Histogram Stretching
Scope
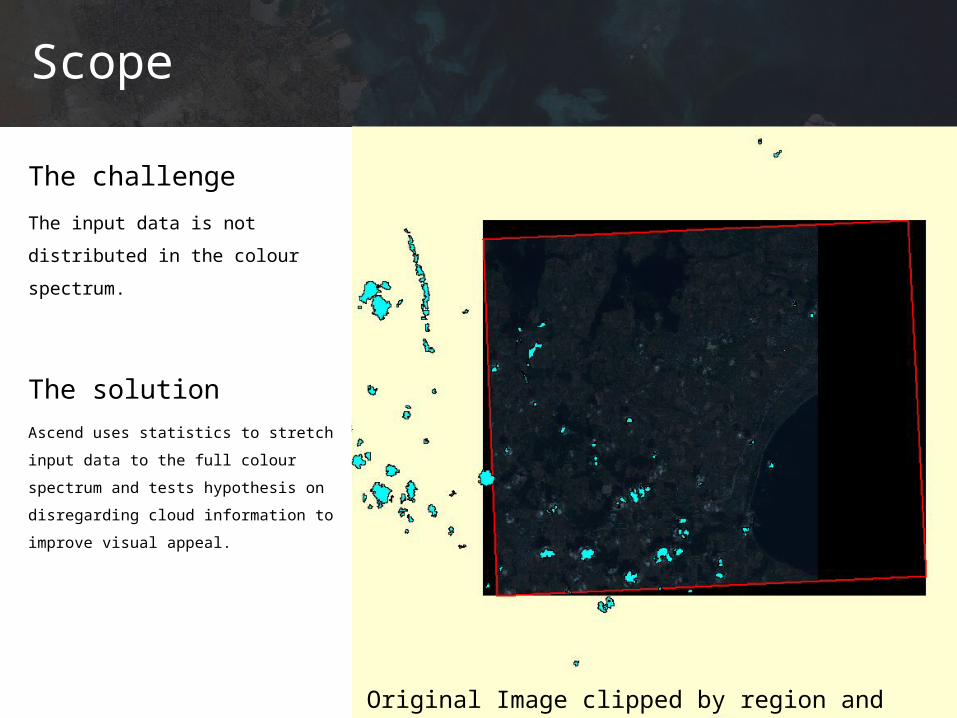
The challengeThe input data is not distributed in the colour spectrum.
The solution Ascend uses statistics to stretch input data to the full colour spectrum and tests hypothesis on disregarding cloud information to improve visual appeal.
Original Image clipped by region and clouds shown.
Naive histogram stretching
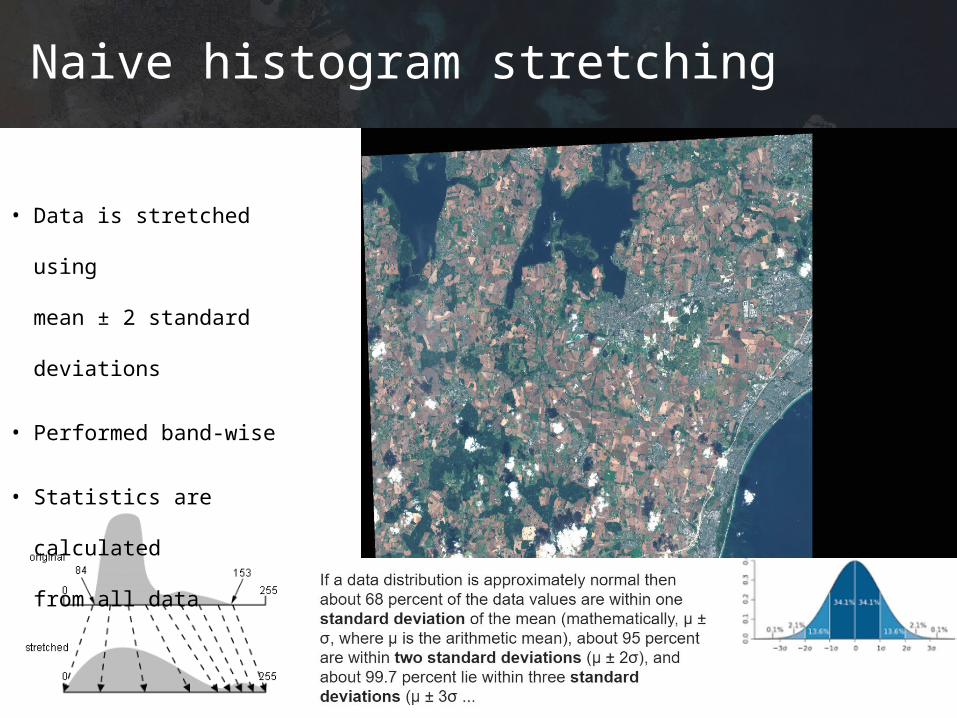
• Data is stretched using
mean ± 2 standard
deviations
• Performed band-wise
• Statistics are calculated
from all data

Original RGB Band (16 bit)
Results : Huge Improvements
Naive Histogram Stretching
Vector dataUsing Clouds to improve algorithm
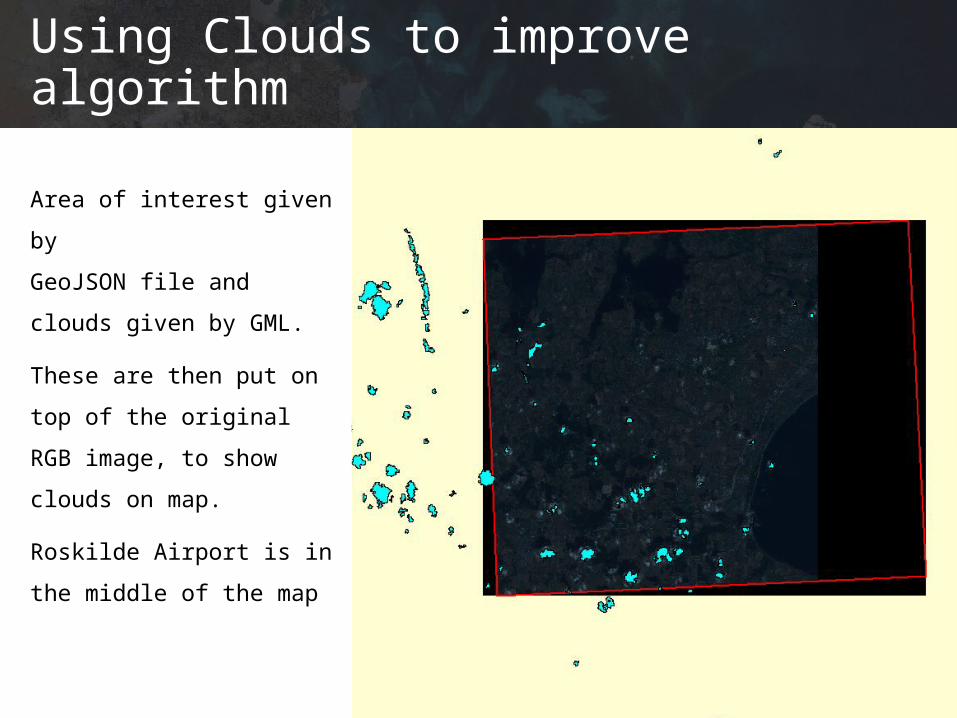
Area of interest given byGeoJSON file and clouds given by GML.
These are then put on top of the original RGB image, to show clouds on map.
Roskilde Airport is in the middle of the map

Histogram stretching of cloud data• Data is stretched using mean
± 2 standard deviations
• It is performed band-wise
• Statistics are calculated only from areas not covered by clouds
Take it to the next level?
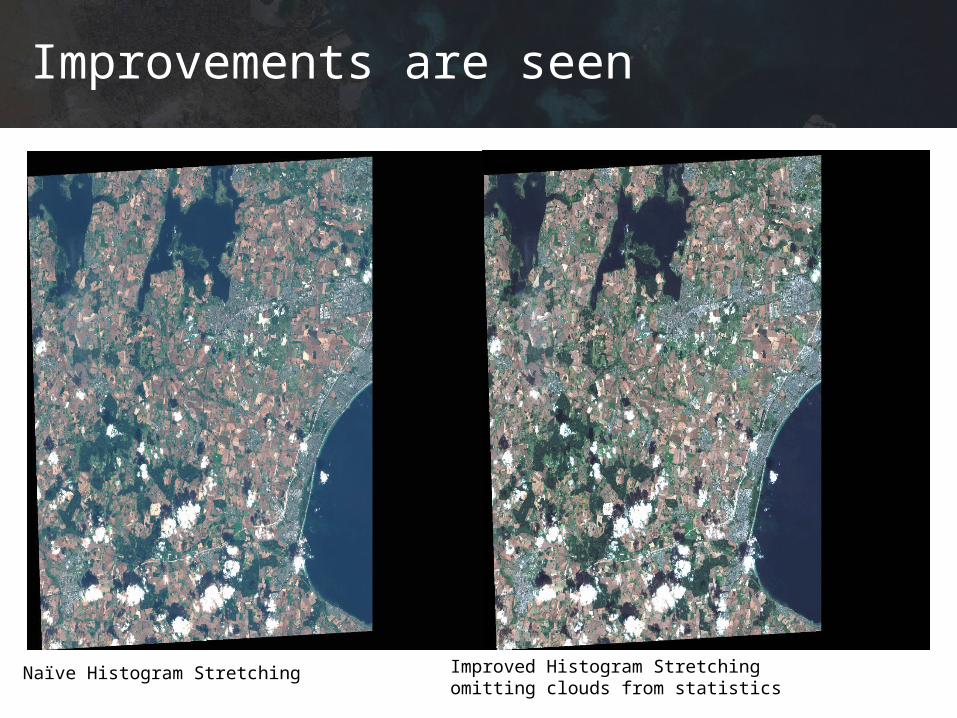
Improved Histogram Stretchingomitting clouds from statisticsNaïve Histogram Stretching
Improvements are seen

Original Sentinel RGB Bands Naive Histogram Stretching
Another Example
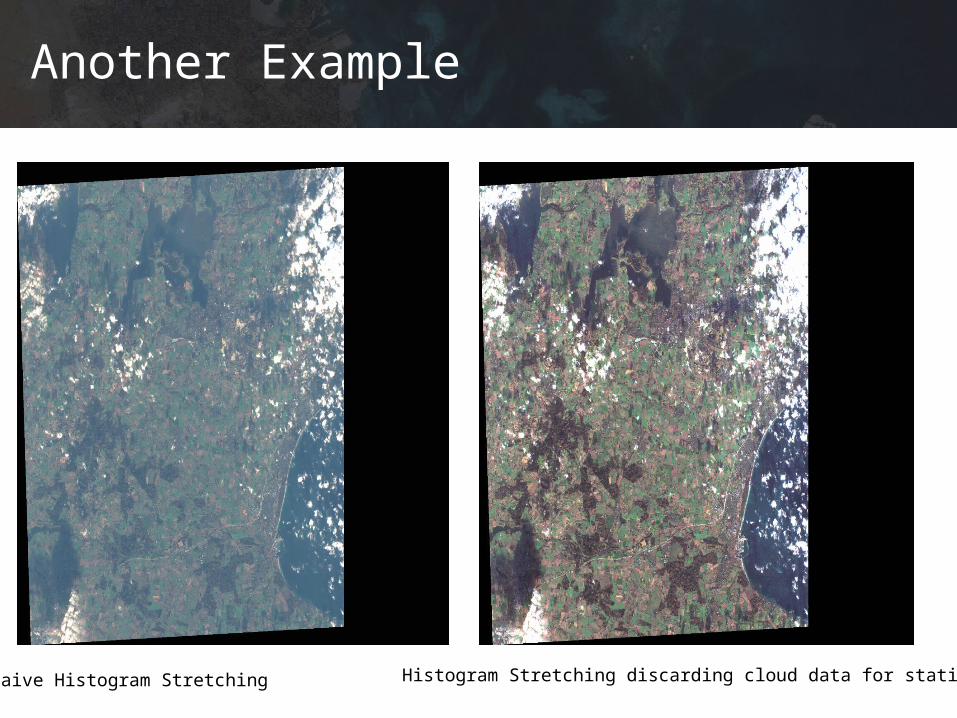
Another Example
Naive Histogram Stretching Histogram Stretching discarding cloud data for statistics

Experiment: Small non cloud area used
Naive Histogram Stretched dataCloud Mask: Green is clouds, grey is no clouds.

Example: When the visibility is better some places, and worse in other places.
Naive histogram Stretching Histogram without cloud data

Discussions
The naive histogram stretching clearly improve visual appeal for end users and has been implemented for first release.
Does the improved histogram stretching, using disregard of clouds in data statistics for the histogram stretching, improve the visual experience for the end user?
Is it worth the resources to move the improved algorithm into production?
How do we reduce the time from moving research experiments into production?
What could make the visibility even better?


![Enhancement of Underwater Images with Statistical Model of ... · (ICM) [9] and the unsupervised color correction method (UCM) [10] based on histogram stretching in RGB and HSI color](https://static.fdocuments.net/doc/165x107/5fdbbbb303a31a3054305408/enhancement-of-underwater-images-with-statistical-model-of-icm-9-and-the.jpg)


![영상처리 실습 #4 Histogram 연산 [ Histogram 대화상자 만들기 ]. Histogram 대화상자 만들기.](https://static.fdocuments.net/doc/165x107/5697bfe71a28abf838cb5e1a/-4-histogram-histogram-.jpg)