![ROUGHNESS ANALYSIS OF DENTAL RESIN-BASED … M-JPE.pdf · restorative material [1]. Resin-based composites (RBCs) are the most commonly used biomaterials in contemporary dental practice](https://static.fdocuments.net/doc/165x107/5fd5496bfd5dd1047067f438/roughness-analysis-of-dental-resin-based-m-jpepdf-restorative-material-1-resin-based.jpg)
COLOUR CHANGES IN NANO-FILLED AND MICRO … · 3.2.1 The Resin Matrix ... 49 CHAPTER 5: MATERIALS &...
119
A report submitted to the University of Adelaide in partial fulfilment of the requirements for the degree of DOCTOR OF CLINICAL DENTISTRY HSU ZENN YEW DDS (UKMALAYSIA) OCTOBER 2011 COLOUR CHANGES IN NANO-FILLED AND MICRO-HYBRID COMPOSITE RESINS ON EXPOSURE TO SPICES
Transcript of COLOUR CHANGES IN NANO-FILLED AND MICRO … · 3.2.1 The Resin Matrix ... 49 CHAPTER 5: MATERIALS &...

A report submitted to the University of Adelaide in partial fulfilment of the
requirements for the degree of
DOCTOR OF CLINICAL DENTISTRY
HSU ZENN YEW DDS (UKMALAYSIA)
OCTOBER 2011
COLOUR CHANGES IN NANO-FILLED AND MICRO-HYBRID COMPOSITE RESINS ON EXPOSURE TO SPICES
i
TABLE OF CONTENTS ....................................................................................................................... i
ABSTRACT........................................................................................................................................ iv
DECLARATION ................................................................................................................................. vi
ACKNOWLEDGEMENT ................................................................................................................... vii
LIST OF TABLES .............................................................................................................................viii
LIST OF FIGURES ........................................................................................................................... .ix
CHAPTER 1: INTRODUCTION .......................................................................................................... 1
CHAPTER 2: LITERATURE REVIEW – THE SCIENCE OF COLOUR ............................................. 5
2.1 Principles of Colour ............................................................................................. 5
2.1.1 Nature of Light Source ................................................................................ 6
2.1.2 Physical properties of the object ................................................................ 12
2.1.3 The Detector .............................................................................................. 16
2.2 Colour Description ....................................................................................................... 20
2.2.1 Munsell Colour Order System .................................................................... 20
2.2.2 CIE Colour Ordering System .................................................................... 21
2.2.3 Colour Measurements ............................................................................... 24
2.2.3.1 Visual Colour Measurements ....................................................... 24
2.2.3.2 Instrumental Colour Measurements .............................................. 25
CHAPTER 3: LITERATURE REVIEW – COMPOSITE RESINS ...................................................... 30
3.1 Historical Perspective .................................................................................................. 30
3.2 Composition ............................................................................................................... 31
TABLE OF CONTENTS
ABSTRACT

ii
3.2.1 The Resin Matrix ....................................................................................... 31
3.2.2 The Inorganic Filler Particles ...................................................................... 33
3.2.3 The Interfacial Phase ................................................................................. 36
3.3 Finishing and Polishing Systems ................................................................................ 37
3.4 Colour Stability of Composite resins ........................................................................... 39
3.4.1 Intrinsic Staining ........................................................................................ 39
3.4.2 Extrinsic Staining ...................................................................................... 42
CHAPTER 4: LITERATURE REVIEW – BASIC COMPOSITION OF SPICES ............................... .46
4.1 Turmeric ..................................................................................................................... 46
4.2 Paprika ........................................................................................................................ 48
4.3 Tamarind ..................................................................................................................... 49
CHAPTER 5: MATERIALS & METHODS ........................................................................................ 50
5.1 Test material preparations .......................................................................................... 50
5.2 Thermocycling process ............................................................................................... 52
5.3 Staining process ........................................................................................................ 54
5.4 Colour Assessment .................................................................................................... 56
5.4.1 Spectrophotometer set-up ....................................................................... 56
5.4.2 Colour Measurement ............................................................................... 57
5.5 Statistical Analysis ...................................................................................................... 57
CHAPTER 6: RESULTS ................................................................................................................. 58
6.1 Effect of Spices on Colour Stability of Composite resins ............................................. 58
6.2 Effect of Immersion Time on Colour Stability of Composite resins ............................. 63
6.3 Effects of Finishing Methods and Type of Composite resins on Colour Stability of Composite
Resins……………………………………………………………………………………….. 64
6.4 Changes in ∆L*, ∆a*,∆b* Values .............................................................................. .66

iii
CHAPTER 7: DISCUSSION ............................................................................................................. 74
7.1 Effect of Spices on Colour Stability of Composite resins ............................................. 74
7.2 Effect of Immersion Time on Colour Stability of Composite resins ............................. .77
7.3 Effects of Finishing Methods and Type of Composite resin on the Colour Stability of
Composite resins ........................................................................................................ 78
7.4 Limitations of the study ............................................................................................ .83
CHAPTER 8: CONCLUSION & RECOMMENDATIONS ................................................................. 84
CHAPTER 9: BIBLIOGRAPHY ....................................................................................................... .86
iv
Colour changes in composite resins after immersion in beverages such as coffee, tea, alcohol
beverage and carbonated drinks have been reported. Although much work has been done to determine the
staining susceptibility of composite resins to various liquid beverages, effects of spices on colour stability of
composite resins have not been fully researched.
Objectives: The aim of this study is to evaluate the colour stability of nano-filled (Filtek Supreme™)
and micro-hybrid (Gradia Direct™) composite resins finished with either Sof-Lex™ discs or mylar strips
upon exposure to turmeric, paprika and tamarind.
Materials and methods: Twenty cylindrical specimens were fabricated from two commercially
available composite resins; Filtek Supreme XT™ (3M ESPE, St Paul, MN) and Gradia Direct X™(GC
AMERICA). The top surfaces of the specimen were polished with Sof–Lex™ aluminium oxide discs
(3M/ESPE, St Paul, MN USA) while the bottom surfaces were mylar strips finished. All samples were
subjected to 500 thermocycling rounds between 5 and 55 ºC with 20 seconds dwell time prior to immersion
in staining solution. Twenty specimens from each type of composite were then randomly divided into 4
groups (n=5) and immersed in each staining solutions (0.1% turmeric, paprika and tamarind) and distilled
water (control) at 37 ºC. Colour measurement at baseline, after thermocycling, 24 hours (1 day), 72 hours
(3 days) and 168 hours (7 days) of immersion in staining solutions were recorded with a reflection
spectrophotometer under the D65 (daylight) illuminant using CIE L* a* b* parameters. Repeated measures
analysis of variance (ANOVA) and Bonferroni post hoc tests were used to determine the significance and
possible interactions of each factor.
ABSTRACT

v
Results: Among all the staining solutions tested, the highest colour deviation was obtained in the
turmeric group, with mean colour change (∆E) ranging between 17.92 and 55.25. Paprika recorded mean
colour change (∆E) ranging between 1.28 and 3.72, while tamarind produced mean colour change (∆E)
ranging between 1.12 and 5.42. The effect of finishing method on colour stability of composite resins
appeared to be dependent on the type of composite resin. Filtek Supreme™ with mylar strips finished
generally resulted in significantly more colour changes compared with specimens polished Sof-Lex™ discs,
while Gradia Direct™ finished with mylar strips were found to be more resistant to colour changes. Colour
change (ΔE) values were significantly influenced by the staining solutions, types of materials and finishing
methods.
Conclusion: Within the limitations of this study, all spices used (turmeric, paprika and tamarind)
have a potential to stain composite resins; with turmeric causing the most severe discolouration regardless
of the type of composite resin or finishing technique employed. The result of this study also suggests that
different materials respond differently to staining by spices when either finished with mylar strips or polished
with Sof-Lex™ discs. Also, contemporary composite resins available in the market e.g. nano-composite and
micro-filled hybrid composite are still susceptible to discolouration by exogenous factors despite
advancement in the development of resin based restorative material.

vi
I, Hsu Zenn Yew certify that this work contains no material which has been accepted for the award
of any other degree or diploma in any university or other tertiary institution and, to the best of my knowledge
and belief, contains no material previously published or written by another person, except where due
reference has been made in the text.
I give consent to this copy of my thesis, when deposited in the University Library, being made
available for loan and photocopying, subject to the provisions of the Copyright Act 1968.
I also give permission for the digital version of my thesis to be made available on the web, via the
University‟s digital research repository, the Library catalogue, and also through web search engines, unless
permission has been granted by the University to restrict access for a period of time.
Declared by: Dr Hsu Zenn Yew Witnessed by:_____________________
Date: Date:
DECLARATION

vii
It is a pleasure to thank the many people who made this thesis possible. I would like to express my
sincere gratitude to my supervisor Prof Lindsay Richards, for giving me the confidence to explore my
research interest and supported me thoughout my thesis with his immense patience, motivation,
enthusiasm and knowledge whilst allowing me the room to work in my own way.
My sincere thanks also go to Dr Thomas Berekally and Dr Uyen Ha for their valuable advice,
guidance, encouragement and insightful comments in writing this thesis.I am grateful to Mr Victor Marino
who has provided the laboratory support and equipment I have needed to produce and complete my thesis.
In my daily work I have been blessed with a friendly and cheerful group of fellow students .Many
thanks go in particular to the DClinDent (Prost) postgraduate students; Drs Rory Hancock, Amal Ibrahim,
Sophie Bui, Zainab Hamudi, My Anh Vu and Chin Nguyen for the stimulating discussions, for the sleepless
nights we were working together before deadlines, and for all the fun we have had in the last three years.
I thank my brother and friends in Australia, Malaysia and elsewhere for their support and
encouragement throughout, some of whom have already been named. Lastly, and most importantly, I wish
to thank my grandparents Kok Guan Goon and Yen Tuan Goon who raised me, supported me, taught me,
and loved me. To them I dedicate this thesis.
ACKNOWLEDGEMENT

viii
Tables Pages
Table 2.1: Wavelengths of colours. ...................................................................................................... 7
Table 2.2: Some of the instrumental colour measurement devices. .................................................. 29
Table 5.1: Composite resins used in this study. ................................................................................. 50
Table 5.2: Irradiation time and depth of cure. .................................................................................. 522
Table 5.3: Type of staining solutions used in this study. .................................................................... 54
Table 6.1: Mean and standard deviations (Sd) of colour changes (∆ E) and L*, a*, b* values of composite
resins tested after immersion in the staining solutions over the period of 24,72 and 168 hours.
......................................................................................................................................... 60
Table 6.2: Repeated Measure Analysis ANOVA (Within Subject Analysis). ...................................... 63
Table 6.3: Repeated Measure Analysis ANOVA (Between Subject Analysis) ................................... 64
Table 6.4: Repeated Measure Analysis (ANOVA): p values for each variable and interaction term for ∆L*,
∆a* and ∆b*. .................................................................................................................... 67
Table 6.5: Repeated Measure Analysis (ANOVA): p values for each variable and interaction term for ∆L*,
∆a* and ∆b* as a function of time. .................................................................................... 68
LIST OF TABLES

ix
Figures Pages
Figure 2.1: Spectrum of colours (adapted from www.physics.arizona.edu[44]). .................................. 6
Figure 2.2: The electromagnetic spectrum (adapted from www.physics.arizona.edu[44]). .................. 6
Figure 2.3: Spectral relative power curve vs. wavelength (adapted from www.geelighting.com [54]). . 8
Figure 2.4:Spectral curve of various natural daylights (adapted from www.handprint.com [55]) .......... 9
Figure 2.5: Colour Temperature (adapted from www.lumicrest.com[122]) ......................................... 10
Figure 2.6: Colour Rendering Index (adapted from www.handprint.com[55]) .................................... 10
Figure 2.7: Light transmission, reflection, absorption and scattering (adapted from Wyazecski [42])12
Figure 2.8: Absorption of lights (adapted from www.dba.med.sc.edu [57]). ....................................... 14
Figure 2.9: Spectral reflectance curve (adapted from www.dba.med.sc.edu [57]). ............................ 15
Figure 2.10: The structure of the eye (adapted from Schlote(2006) [58]). ......................................... 16
Figure 2.11: Spectral sensitivity curve of retina (adapted from Schlote (2006) [58]). ......................... 18
Figure 2.12: Munsell colour tree (adapted from www.britannica.com [61]). ...................................... 21
Figure2.13: CIE colour spaces-CIE XYZ (left) and CIE LAB (right) (adapted from www.britannica.com [61])
................................................................................................................................................ 22
Figure 4.1: Turmeric (adapted from www.purplesage.org.uk[279])………………….………………….47
LIST OF FIGURES

x
Figure 4.2: Paprika (adapted from www.homecooking.com [280]).. .................................................. 48
Figure 4.3: Tamarind (adapted from www.manjulaskitchen.com [281]) ............................................. 49
Figure 5.1: Composite resins in stainless steel matrix. ...................................................................... 51
Figure 5.2: Chart representing sample preparation. .......................................................................... 53
Figure 5.3: Vertically placed specimens in customized holder. .......................................................... 55
Figure 5.4: Staining solutions in incubator and vibrator. .................................................................... 55
Figure 5.5: Positioning jig. ................................................................................................................. 56
Figure 6.1: Mean colour changes (∆E) of specimens immersed in turmeric, paprika, tamarind and control
solutions by types of composite and finishing methods. .................................................. 61
Figure 6.2: Mean colour changes (∆E) of specimens immersed in turmeric (A), paprika (B), tamarind(C) and
control (D) solution (expanded scale). ............................................................................. 62
Figure 6.3: Mean colour changes ∆E of specimens immersed in turmeric(A), paprika(B), tamarind(C) and
control solutions(D) by types of composite and finishing methods. .................................. 65
Figure 6.4: Means of L*, a*, b* coordinates of specimens immersed in turmeric solution for Filtek
Supreme™ and Gradia Direct™ finished by either Sof-Lex™ discs or mylar strips (For standard
deviations, please refer Table 6.1). .................................................................................. 70
Figure 6.5: Means of L*, a*, b* coordinates of specimens immersed in turmeric solution for Filtek
Supreme™ and Gradia Direct™ finished by either Sof-Lex™ discs or mylar strips in expanded
scale. (For standard deviations, please refer Table 6.1) .................................................. 70
Figure 6.6: Means of L*, a*, b* coordinates of specimens immersed in paprika solution for Filtek Supreme™
and Gradia Direct™ finished by either Sof-Lex™ discs or mylar strips (For standard deviations,
please refer Table 6.1). .................................................................................................... 71

xi
Figure 6.7: Means of L*, a*, b* coordinates of specimens immersed in paprika solution for Filtek Supreme™
and Gradia Direct™ finished by either Sof-Lex™ discs or mylar strips in expanded scale (For
standard deviations, please refer Table 6.1). ................................................................... 71
Figure 6.8:Means of L*, a*, b* coordinates of specimens immersed in tamarind solution for Filtek
Supreme™ and Gradia Direct™ finished by either Sof-Lex™ discs or mylar strips (For standard
deviations, please refer Table 6.1). .................................................................................. 72
Figure 6.9: Means of L*, a*, b* coordinates of specimens immersed in tamarind solution for Filtek
Supreme™ and Gradia Direct™ finished by either Sof-Lex™ discs or mylar strips in expanded
scale (For standard deviations, please refer Table 6.1). .................................................. 72
Figure 6.10: Means of L*, a*, b* coordinates of specimens immersed in control solution for Filtek Supreme
and Gradia Direct finished by either Sof-Lex™ discs or mylar strips (For standard deviations,
please refer Table 6.1). .................................................................................................... 73
Figure 6.11: Means of L*, a*, b* coordinates of specimens immersed in control solution for Filtek Supreme
and Gradia Direct finished by either Sof-Lex™ discs or mylar strips in expanded scale (For
standard deviations, please refer Table 6.1). ................................................................... 73
1
One of the quintessential challenges in restorative and aesthetic dentistry is to produce a
natural looking restoration that blends harmoniously with the oral environment. Apart from the important
parameters of shape and morphology, the colour of a restoration is often regarded as being another
essential building block necessary for constructing a „biomimetic‟ restoration [1-3]. Successful colour
matching in a restoration is one of the critical clinical requirements to increase the acceptance of
restorations [4]. For a lasting impression of the esthetic outcome, “colour stability” or the ability of the
material to retain the matched shade over a long period of time is also crucial. “Colour selection” is
nevertheless often considered one of the most fascinating and frustrating areas in dentistry [2, 5-7]. For
many years, colour researchers lamented that lack of colour knowledge among clinicians had
contributed to this problem [6, 7]. Therefore, an understanding of colour science and its parameters are
important tools for optimising the esthetic outcome of restorations. Colour is most commonly generated
by the addition of chemical colourants or manipulation of the physico-chemical content of the restorative
material. To fully comprehend the influence of material composition on colour perception, the observer
needs to have knowledge of the physical aspect of colours. Furthermore, the science of colour physics
enables a quantification and comparison of colour differences, which is an essential component in
determining the colour stability of material. The first chapter of this research report will discuss the
above issues; looking at colour from a physical perspective and highlighting its importance with respect
to colour measurement in dentistry.
Considering the importance of aesthetics in restorative dentistry, it is important to know the
inherent properties responsible for the long term success of a restoration in terms of colour stability.
CHAPTER 1
INTRODUCTION

2
This study investigated the colour stability of composite resins when exposed to a range of spices.
Composite resins are tooth coloured restorative materials, composed of a mixture of filler and resin
polymer [8]. Since their inception over half a century ago [9], composite resins have gained
considerable popularity in the mainstream operative dentistry as a direct restorative material for both
anterior and posterior teeth. The reasons behind this trend are the inherent property of composite resins
to emulate the natural colour of teeth [8] and the increasing demand amongst patients for aesthetics,
the perception of mercury toxicity in amalgam restorations and the availability of good adhesive system
[10]. Over the last decade, there has been a strong research focus on the improvement of the clinical
performance of the material. Through modifications of the filler content, composite resins have evolved
into a range of material with various filler sizes. In general, a smaller filler size with a higher filler loading
volume contributes to better polishability and the ability to retain a smooth polish surface [11], thus
giving a more aesthetically pleasing results. The wake of nanotechnology has seen the incorporation of
nano-sized fillers into composite resins. Nano-filled composite resins with filler size of 5 – 100
nanometers, (smaller than its predecessors‟ filler size), have been reported to have superior clinical
performance and aesthetic qualities [12].
Despite its popularity in satisfying aesthetic demands, previous studies have revealed that
composite resins are susceptible to discolouration [13-15]. This may result in patient dissatisfaction [16]
and replacement of restorations [17-20]. The discolouration of composite resins may be attributed to
intrinsic or extrinsic factors [21-23]. Intrinsic discolouration involves physico-chemical alteration within
the material. Alternatively, extrinsic staining involves surface discolouration by extrinsic substances.
Research has found that beverages including coffee [24-30], tea [21, 24-27, 30-33], alcohol beverages
[26-28, 30, 34, 35], carbonated drinks [24, 26, 28, 33, 34, 36] and fruit juices [24, 33, 34, 36] caused
significant colour changes in composite resins, with red wine causing the most severe staining, followed
by tea and coffee [26, 27].

3
Colourants or dyes are usually added to enhance the appearance of food and may have the
potential to stain composite resins [11, 37]. Research by Dietschi et al [11] has shown that composite
resins are also susceptible to staining by artificial food dyes (erythrosine and sunset yellow). Throughout
Asia, spices are used to flavour and colour local dishes. Turmeric, paprika and tamarind are the most
common spices used alone or in combination with other mixed spices in Asian cuisine [38].
Although much work has been done to ascertain the staining susceptibility of composite resins
to various liquid beverages, the effect of spices on the colour stability of composite resins have not been
fully researched. Due to the extensive use of spices in Asian cooking, as well as in many other parts of
the world, it would be useful and timely to determine the staining potential of these spices on the colour
stability of composite resins. Currently there is a paucity of data pertaining to the discolouration
susceptibility of some of the more contemporary composite resins available in the market. The
determination of colour stability properties of composite resins is crucial as this information can provide
guidance for clinicians on appropriate selection of material for clinical restorative usage. This study may
contribute to the development of more stain resistant composite resins.

4
The aim of this study is to evaluate the colour stability of nano-filled (Filtek Supreme™) and
micro-hybrid (Gradia Direct™) composite resins finished with either Sof-Lex™ discs or mylar strips upon
exposure to turmeric, paprika and tamarind. The null hypotheses at the present study are:
1. There are no significant colour changes in each composite resins tested on exposure to
turmeric, paprika and tamarind spice solutions.
2. There is no colour difference in each composite resins tested in the respective spice solution at
baseline, 24 hours (1 day), 72 hours (3 days) and 168 hours (7 days).
3. There is no significant colour difference between the two composite resins tested (Filtek
Supreme™ and Gradia Direct™).
4. There is no significant colour difference between Sof-Lex™ discs polished and mylar strips
finished composite resins.

5
.
2.1 Principles of Colour.
The “COMMISSION INTERNATIONALE DE L'ECLAIRAGE” [39] (CIE or The International
Commission on Illumination) defines (perceived) colour as:
“Attribute of a visual perception consisting of any combination of chromatic and achromatic
content. This attribute can be described by chromatic colour names such as yellow, orange, brown,
red…etc, or by achromatic colour names such as white, gray, black, etc, and qualified by bright, dim,
light, dark, etc., or by combinations of such names.”
A Google search for “colour definition” yields about 162 million results. The Oxford English
Dictionary defines colour as: „the property possessed by an object of producing different sensations on
the eye as a result of the way it reflects or emits light‟ [40]. Given the above definition, colour can be
considered a multi dimensional phenomenon that is dependent on interactions of three factors, namely,
(1) the nature of the light source, (2) the physical properties of the object and (3) the detector [41, 42].
For colour to exist, all three parameters must be present and any change in the condition of any of the
three will lead to a change in the perception of colour.
CHAPTER 2
LITERATURE REVIEW: THE SCIENCE OF COLOUR

6
2.1.1 Nature of Light Source
Our modern understanding of light and colour begins with Isaac Newton, when in 1666, he
discovered white light can be refracted through a prism into a spectrum of different colours (Figure 2.1)
[41-43]. Although at that point in time, Newton did not fully understand the reason why colour was
generated, his simple experiment demonstrated that colour comes from light.
Figure 2.1: Spectrum of colours (adapted from www.physics.arizona.edu[44]).
Figure 2.2: The electromagnetic spectrum (adapted from www.physics.arizona.edu[44]).
Light is a form of electromagnetic energy consisting of a spectrum of wavelengths
including ultraviolet, infrared, and visible light. The eye is only able to discriminate wavelength in the
visible part of the spectrum. As illustrated in Figure 2.2, the visible light spectrum is the narrow band of
electromagnetic wavelength (within an approximate range of 380 or 400 nm to 760 or 780 nm) that we
NOTE: This figure is included on page 6 of the print copy of the thesis held in the University of Adelaide Library.
NOTE: This figure is included on page 6 of the print copy of the thesis held in the University of Adelaide Library.

7
see as colours. Each colour in the spectrum corresponds to a different wavelength as represented in
Table 2.1 [41, 42, 45, 46].
Table 2.1: Wavelengths of colours.
Colours Wavelength (nm)
Red 650-800
Orange 590-649
Yellow 550-589
Green 490-539
Blue 460-489
Indigo 440-459
Violet 390-439
As light is a stimulus for colour, without which colour cannot be seen, most colour scientists
believe that “colour is not a characteristic of objects but, rather, of light which enters our eyes from
them” [47]. However, light comes from a variety of sources. Light that is composed of all spectral
wavelengths in equal quantities is rare. If the source does not contain a particular wavelength then
obviously the corresponding colour cannot be seen [48]. Therefore, the colour we see depends on the
quality and quantity of the light source illuminating the object [49]. This concept mandates consideration
of the characteristic of the light source. In research, the term “illuminant” is used to refer to the light
source.
The quality of a light source can be characterized numerically by a spectral curve, colour
temperature and a colour rendering index [49]. Each light source has its own relative spectral power
distribution across the visible spectrum (Figure 2.3). For example, daylight appears blue-green due to its
8
relatively high spectral power in the blue and green areas of the spectrum. On the other hand,
incandescent light looks red as its greatest spectral power distribution is in the red area [49].
Figure 2.3: Spectral relative power curve vs. wavelength (adapted from www.geelighting.com [54]).
Therefore, the colour of the same object viewed under these two light sources, would appear
bluish under daylight and reddish under incandescent light. This phenomenon has been described as
metamerism. Metamerism is a phenomenon which occurs when these two materials have an identical
colour under one illuminant, but different colours under another illuminant [48].
Most light sources emit light that is a mixture of different wavelengths, although some
wavelengths are missing from certain kinds of light sources, such as incandescent light (Figure 2.3).
Traditionally, natural day light with close to a full spectrum of white light, was considered the “normal”
standard in colour rendering [7]. However, it is highly variable depending on the time of the day, season
of the year, amount of cloud cover and the degree of atmospheric pollution (Figure 2.4) [2, 5]. Due to
these variations, colour corrected lights, which reproduce a similar spectral curve to natural daylight, are
recommended as an alternative choice of light source for colour matching [50-52].
Another measurement of light quality is the colour temperature. This numerical characterisation
measures the distribution of power, as stated in Kelvin (K), in the spectrum of light (Figure 2.5), and
NOTE: This figure is included on page 8 of the print copy of the thesis held in the University of Adelaide Library.

9
describes warmth or coolness of the light source. It is derived from equating the light source to the
colour given off by heating the black body radiator. A blackbody is a hollow heated chamber with a small
hole. As the radiator becomes warmer, it begins to glow red, then yellow, white and eventually blue [46,
48]. The ideal colour temperature for colour rendering is 5500 K, the medium temperature that
corresponds to “white‟ light or natural day light [2, 51, 53].
The Colour Rendering Index (CRI) is expressed as a rating from 0 to 100 is another
measurement of the quality of light [54]. It is a measure of completeness of the light spectrum. Complete
spectral lighting improves the shade matching procedure. A CRI measure of 100 indicates that the light
source has the entire visible wavelength present. The higher the rate (illustrated by the square loci in
Figure 2.6), the closer the light source in reproducing the colours of various objects in comparison with
an ideal light source. Theoretically, a light source with CR I = 100 is desirable. However, according to
Preston & Bergen [51], CRI greater than 90 will be adequate in shade matching in clinical dental
settings.
Figure 2.4: Spectral curve of various natural daylights (adapted from www.handprint.com [55]).
NOTE: This figure is included on page 9 of the print copy of the thesis held in the University of Adelaide Library.

10
Figure 2.5: Colour Temperature (adapted from www.lumicrest.com[122]).
Figure 2.6: Colour Rendering Index (adapted from www.handprint.com[55]).
NOTE: This figure is included on page 10 of the print copy of the thesis held in the University of Adelaide Library.
NOTE: This figure is included on page 10 of the print copy of the thesis held in the University of Adelaide Library.

11
Apart from the quality of lights, the amount or quantity of lighting is also crucial. The quantity of
light or luminance, is commonly measured in lux or foot candles (1 foot candle = 10.8 lux). When
illuminance is too dim (amount of light too small), difficulty may arise in assessing fine details and subtle
variations in colour. Conversely, a high light intensity may result in glare. Hence, the accuracy of colour
rendering is reduced [49]. In dentistry, different levels of light intensity have been suggested for shade
or colour determination, ranging from 75 to 250 foot candles [5, 51, 53]. Preston and Bergen [2] have
recommended a minimum of 150 foot candles for dental operatory. Another group of researchers [50]
have proposed that the intensity of office illumination is not critical in matching tooth shades. They found
that dentists can achieve reproducible colour matches at all the foot candle levels, including the two
extreme levels of 75 and 300. The authors contend that once a certain light intensity is achieved, colour
matching is adequate, and any progression above this intensity does not significantly influence the
ability to discriminate colour differences. Instead, greater consideration should be given to the contrast,
i.e. the difference between the brightness of an object and its surrounding background (task to ambient
light ratio). Excessive contrast causes glare and impedes colour matching. Preston et al [51]
recommend that the task-to-ambient-light ratio should not exceed 3: 1 to prevent glare.
In summary, one of the major variables affecting colour is the source of light that falls on the
object viewed. Understanding the characteristics of the light source and their influence in colour
assessment may be beneficial in establishing the proper environment for colour identification
procedures. The selection of a light source or illuminant for illumination should take into account the
colour temperature, spectral curve and colour rendering index as well as the intensity of the light.

12
2.1.2 Physical properties of the object
The nature of light and the visible spectrum constitute one part of this three dimensional
phenomenon called colour. The next part of the triad involves the interaction of the light with the object.
Depending on the characteristics of the object, light may be (1) transmitted, (2) reflected, (3) absorbed,
(4) scattered (Figure 2. 7) [41,42].
Figure 2.7: Light transmission, reflection, absorption and scattering (adapted from Wyazecski [42]).
Generally, a material transmits light when it allows the light to pass through it. Transparent
materials allow all light to pass through (e.g. glass). The colour of a transparent object depends on the
colour of light it transmits. If red light passes through a transparent object, the emerging colour is red.
13
However, light does not pass directly through materials. It changes direction and is scattered as
it passes through. This bending of light at the surface of an object is called refraction. The amount of
bending not only depends on the angle of incidence, but also on the refractive index (RI) of the material
itself. Refractive index (RI) is the ratio of the speed of light in a vacuum (i.e. space) to the speed of light
in a given material. The RI of a substance is further affected by the wavelength of the light striking it.
The red end of the visible spectrum does not refract as much as the violet end. The effect is a visible
separation of the wavelengths [41, 46].
Translucent materials partly transmit and partly absorb the light that passes through them (e.g.
frosted glass), while in opaque materials none of the light is transmitted [41]. When light strikes an
opaque material, it will either be reflected, scattered or a degree of both depending on the surface
characteristics of the object.
A smooth or glossy surface is one made up of particles of equal, or nearly equal, refractive
index. These surfaces reflect light at an intensity and angle similar or equal to the incident beam - this is
called specular reflection or gloss. The more reflective a surface the more wavelength returns to the
eye, thus the object may be perceived brighter or more intense in colour [41, 46, 48, 49].
Scattering, or diffusion, is another aspect of reflection. When a substance contains particles of
different refractive indices, such as on a rough surface, a light beam striking the surface will be
scattered and the individual wavelengths will bend differently, yielding a substantially different spectrum
returning to the eye. Therefore, a polished surface can appear bright due to specular reflection but more
translucent due to less scattering of the light.
The amount of light scattered depends on the difference in the two refractive indices and also
on the size of the particles. Scattering increases in proportion to the particle size. The scattering
property of a material can therefore be controlled by selection of particles with appropriate differences in

14
refractive index and or by control of particle size. A transparent composite material with least scattering
can be obtained when the pigment particles are of very small particle size and have a similar refractive
index as the surrounding matrix [41].
Finally, some of the light incident upon an opaque or translucent material can be absorbed.
Colour is a result of the way in which an object absorbs and reflects light (Figure 2.8). The colour
impression that the eyes generate depends on which wavelengths of the visible light spectrum are
reflected by an object. For an object to appear red, only the red wavelength is reflected when
electromagnetic waves (light) hit the surface of the object, while the remaining visual wavelengths are
absorbed. A black object appears black because it absorbs all wavelengths, and reflects nothing. When
all wavelengths are reflected equally, the object appears white [41, 46, 48].
Figure 2.8: Absorption of lights (adapted from www.dba.med.sc.edu [57]).
Similar to spectral power distributions as a property of the light source, the spectral reflectance
or transmittance curve is a property of a coloured object. Spectral reflectance (or transmittance) refers
to the amount of light at each wavelength reflected from an object as compared to a reflection standard
e.g. from a pure white object that reflects 100% at all wavelengths (or the amount transmitted through
an object as compared to the amount transmitted through a clear medium such as air.) [41, 46, 48].
NOTE: This figure is included on page 14 of the print copy of the thesis held in the University of Adelaide Library.

15
The spectral reflectance or transmittance curves (Figure 2.9) contribute toward the definition of
colour. The colour of an object is determined by which wavelength in the light spectrum that is reflected
or transmitted. So, a red object possesses a higher percentage reflectance at higher wavelengths of the
spectrum compared to a white or standard object. This spectral reflectance or transmittance curve is
commonly used by colour scientists in the study of colourimetry or colour measurement.
Figure 2.9: Spectral reflectance curve (adapted from www.dba.med.sc.edu [57]).
In summary, when light strikes an object, one or more phenomena can be observed. Colour can
be influenced by how an object modifies the light, which in turn depends on the physical properties of
the object. Contour and surface texture determine how light is reflected, scattered, transmitted or
absorbed, thus affecting the colour perception.
NOTE: This figure is included on page 15 of the print copy of the thesis held in the University of Adelaide Library.

16
2.1.3 The Detector
Just as there is no colour without light, there is no colour without an observer. To fully
appreciate the occurrence of colour, it is necessary to have an understanding of how vision occurs.
Figure 2.10: The structure of the eye (adapted from Schlote(2006) [58]).
The main structures of the eye are the iris, lens, pupil, cornea, retina, vitreous humor, retina and
optic nerve (Figure 2.10). However, a discussion of the role of each component and the detailed
mechanics of human vision will not be presented here.
Generally, light from the object enters the eye through the cornea and then passes through an
aperture called the pupil. The amount of light entering the eye is controlled by the constriction and
dilatation of the iris. Light is then focused on the lens. The lens then passes the light through a
transparent gel called the vitreous humor and focuses an inverted image of the object being viewed on
the retina at the back of the eyeball. The retina is the light-sensitive part of the eye and its surface is
composed of photoreceptors or nerve endings. Light reaching these photoreceptors is converted into
nerve impulses that are sent through the optic nerve as a stimulus to the occipital lobe of the cerebral
cortex where the information is interpreted [2, 58, 59].
NOTE: This figure is included on page 16 of the print copy of the thesis held in the University of Adelaide Library.

17
Any changes that occur in the pathway of the lights to the brain may result in alteration of colour
perception. For example, with advancing age, the lens or the cornea may undergo degeneration and
become less efficient in transmitting light. As a consequence, the perception of colour can be altered [2,
58].
There are two types of photoreceptors, rods and cones. The greatest concentration of rods and
cones is in an area of the retina called the fovea. The rods contain a pigment called rhodopsin and are
light sensitive but not colour sensitive (that is, they are monochromatic), while the cones contain the
pigments erythrolabe, chlorolabe, and rhodopsin, which are sensitive to wavelengths in the red, green,
and blue parts of the visible spectrum. For this reason, human vision is often referred to as a tri-stimulus
response [59]. Furthermore, rods are more acutely sensitive to light, while cones are insensitive to light
below a certain level of luminance. Therefore in low light intensity, only black and white colours are
evident as only the monochromatic rods receive the light and relay it to the brain.
When the eyes are exposed to a particular colour for a prolonged period, colour adaptation can
occur. The red, green and blue cone receptors can to a certain extent adapt independently to the
prevailing illumination if one set of cones is more or less strongly stimulated than the others. For
example, under incandescent light, blue receptors are less strongly stimulated than green or red
receptors, the former increase their relative sensitivity, causing the light to seem less strongly coloured
than it otherwise would appear [58, 59].
After prolonged exposure to a particular colour, such as a red stimulus, the red cone receptors
sensitive to the stimulus become fatigued. This is due to the depletion of the principal photosensitive
pigments in the cone, resulting in the eye progressively become less sensitive to the particular colour
and alteration of colour perception. When the stimulus changes, the least depleted cells (the blue and

18
green receptors) respond more strongly. The object may appear more greenish-bluish, which is the
complementary colours to red. This is a negative afterimage [2]. Consideration of the negative
afterimage phenomenon is important in the selection of background for colour determination [49]. Owing
to the absence of complementary colours, a neutral gray background is advocated for colour
determination. Another example in relation to dentistry is the use of a blue – black background to make
the eyes more sensitive to yellow-orange colour [53].
Positive afterimage also exists. This is due to continuous stimulation of retinal receptors shortly
after the stimulus is removed producing a visual afterimage that retains the same colour relationships as
those appearing in the original image. Therefore, after prolonged exposure, the colour of the two objects
may appear to be more alike [2, 49].
Similar to spectral power distributions and spectral reflectance curves discussed in the
preceeding sections, visual sensitivity is also characterized by a graph called a spectral response or
sensitivity curve (Figure 2.11). The sensitivity curve reflects the sensitivities of the cones to short (420–
440 nm), medium (534–545 nm), and long (564–580 nm) wavelengths that correspond to blue, green
and red respectively. The difference in the signals received from the three cone types allows the brain to
perceive all possible colours [42].
Figure 2.1 Spectral sensitivity curve of retina (adapted from Schlote (2006) [58]).
NOTE: This figure is included on page 18 of the print copy of the thesis held in the University of Adelaide Library.

19
Essentially there are three major elements for the production of colour: a light source, the object
that absorbs, transmits, reflects or scatters the light from the source, and the detection by the visual
system. These three parameters have been described by an appropriate curve against the wavelength;
the light source by spectral power distribution curve; the object by the spectral reflectance and
transmittance curve and the detector by the spectral response curve. The stimulus that the brain
interprets as a colour is made up of these three spectral curves. In other words, various factors
influence the observed colour of a surface, illumination, surface material, texture, surface area and the
physiological state of the eye of the observer. Collectively, all these parameters have been employed in
many colour measuring devices e.g. spectrophotometer.
20
2.2 Colour Description
Despite significant improvements in scientific knowledge pertaining to optics, the definition of
colour still remains a subject of vigorous debate. Basically, there are two schools of thought: colour has
been described either objectively as physical phenomenon or subjectively as a psychological response
to a physical stimulus.
The preceeding sections described the basic physics of colour. However, colour has also been
studied from the perspective of several other disciplines particularly chemistry, physiology, psychology
and aesthetics, culminating in a vast number of colour terms used to describe different aspects of the
colour sensation. Differing interpretations of colour can be misleading and result in problems in colour
communication. Because of the practical need to describe colour accurately and communicate observed
colour, various colour order systems have been developed.
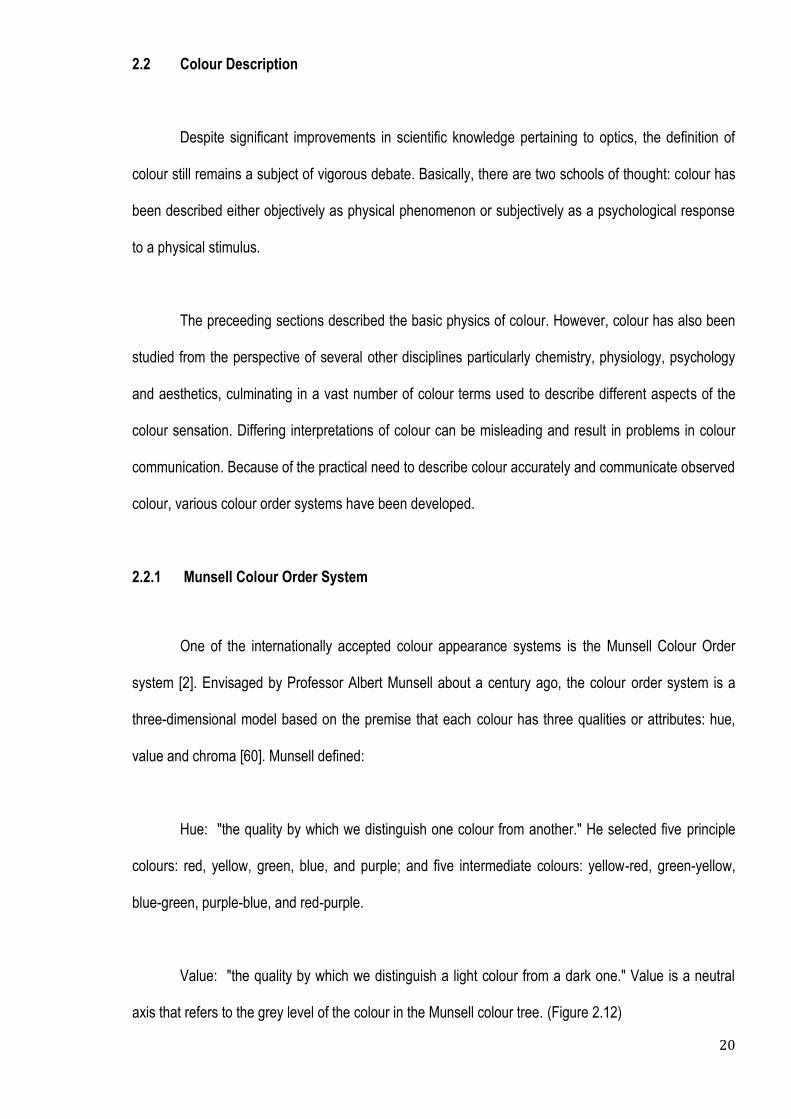
2.2.1 Munsell Colour Order System
One of the internationally accepted colour appearance systems is the Munsell Colour Order
system [2]. Envisaged by Professor Albert Munsell about a century ago, the colour order system is a
three-dimensional model based on the premise that each colour has three qualities or attributes: hue,
value and chroma [60]. Munsell defined:
Hue: "the quality by which we distinguish one colour from another." He selected five principle
colours: red, yellow, green, blue, and purple; and five intermediate colours: yellow-red, green-yellow,
blue-green, purple-blue, and red-purple.
Value: "the quality by which we distinguish a light colour from a dark one." Value is a neutral
axis that refers to the grey level of the colour in the Munsell colour tree. (Figure 2.12)

21
Chroma: “the quality that distinguishes the difference from a pure hue to a gray shade” The
chroma axis extends from the value axis at a right angle. However, chroma is not uniform for every hue.
Figure 2.12: Munsell colour tree (adapted from www.britannica.com [61]).
The system uses decimal notation, instead of colour names. For instance, for a fairly saturated
red with medium lightness would be 5R 5/10; with 5R meaning the colour is in the middle of the red hue
band, 5/ meaning medium lightness and a chroma of 10. It should be noted, too, that Munsell's scale of
value is visual or perceptual, and not on a strict set of mathematical values from a light source or
illuminant. This method of colour designation has been adopted in dental shade guides and some
instrumental colour measurement devices in dentistry.
2.2.2 CIE Colour Ordering System
Another colour ordering system is the CIE XYZ colourimetric system developed by Commission
Internationale de l'Eclairage (International Commission on Illumination) in 1931 [62]. Since then, two
more colour systems have been developed, the CIE LUV and CIE LAB. Another newly recommended
colour system for colour difference is CIEDE2000 [63].
NOTE: This figure is included on page 21 of the print copy of the thesis held in the University of Adelaide Library.

22
These colour systems are mainly used in science and industry as a standard system enabling
the specification of all colours as points in the 3-dimensional colour space (Figure 2.13). The systems
are not based on perceptual scale of colour and they do not describe the appearance of colour. Via
mathematical calculations of the coordinates in the colour space, these systems may be used to record
and specify colour in numbers as well as to quantify and visualize the relationship of colours.
Most colour differences reported in the dental literature are based on the CIE LAB system. This
system has been well reviewed for applications in dentistry by Westland et al [64]. CIELAB indicates
these values with three axes: L*, a*, and b*. Similar to the Munsell value axis, the central vertical axis of
the system represents lightness (signified as L*) whose values run from 0 (black) to 100 (white). The
colour axes are based on the fact that a colour can't be both red and green, or both blue and yellow,
because these colours oppose each other. On the a-a' axis, positive values indicate amounts of red
while negative values indicate amounts of green. On the b-b' axis, yellow is positive and blue is
negative. For both axes, zero is neutral gray [62, 65].
Figure 2.13: CIE colour spaces-CIE XYZ (left) and CIE LAB (right) (adapted from www.britannica.com
[61]).
Often, CIELAB colour spaces are used for measurement of colour difference. By comparing
data before and after the process, the colour difference can be calculated in a simple way as the
Euclidean distance between two coordinates (before and after) in the colour space. Therefore, it can be
NOTE: This figure is included on page 22 of the print copy of the thesis held in the University of Adelaide Library.

23
expressed by a single number independently of the location of the two coordinates. Differences of two
stimuli (L*1, a*1, b*1) and (L*2, a*2, b*2) can be calculated using the following formula [64]:
∆ E = [(∆ L*)2 + (∆ a*)2 +(∆ b*)2 ]1/2
At this point the question might be raised as to the relevance of this colour science to dentistry.
The amount of ∆ E is useful in determining how much colour difference constitutes an acceptable shade
mismatch that is perceptible to observers. The threshold of perceptibility and acceptability, however,
remains controversial.
Douglas et al [66] found that the predicted colour difference at which 50% of the dentist
observers could perceive a colour difference (50/50 perceptibility) was ∆E 2.6 units. In terms of
acceptability, a colour mismatch of more than ∆E 5.5 was considered unacceptable. Seghi et al [67], on
the other hand, stated that ∆E less than 1 was imperceptible and if the value is greater than 2, colour
difference was discernible by most observers. Other authors reported the range of clinically acceptable
threshold was from ∆E 2 to 4.4 [68-71]. Most considered ∆E 3.3 as clinically unacceptable [70, 71].
Based on these studies, colour difference of ∆E more than 1 is considered perceivable and clinically
unacceptable if greater than 3.3.

24
2.2.3 Colour Measurements
Colour measurement can be broadly classified into two categories – visual and instrumental colour
assessment.
2.2.3.1 Visual Colour Measurement
Subjective colour identification usually involves a visual colour assessment. It is commonly
performed by visual comparison with reference colour samples whose specification is known. In
dentistry, shade guides are routinely used as the standard colour samples against which a tooth or
restoration is compared. Some of the popular shade guides are: Vitapan Classical, Chromascop and
Vita System 3D Master. In addition, custom made and specific chroma and value guides are also
available.
One major criticism of these shade guides is the lack of a logical and ordered distribution in the
natural tooth colour space [72]. Hall [73] pointed out that since a tooth contains more than 100 000
colours compared to the limited number of tabs in the shade guide, the probability of obtaining colour
match is approximately 1 in 100 000, assuming that the tooth and shade tabs contain only one colour.
This probability is reduced since both tooth and shade tabs consist of more than one colour. Moreover,
in a porcelain shade guide, if enamel, dentine, opaque and gingival shades are considered the chance
of getting an accurate match is almost nil. To have any realistic chance of obtaining a colour match, the
number of tabs in the shade guides would have to be increased to thousands which is not practical.
Based on the superimposition of the colour spaces recorded for shade guides and the recorded tooth
colour in Munsell, Hall also found that shade tabs were not uniformly positioned to reflect all three colour
dimensions.

25
The most widely used shade guide used for composite materials is made of ceramic. Such
shade tabs have been shown to be incompatible with composite resins material [74]. A recent study by
Browning et al [75] found that when various shade tabs of Vitapan Classical shade guides were
compared with correspondent tabs made of direct restorative composites, no material/shade
combination resulted in an acceptable colour difference. They concluded that there was poor match
between composite resins and the shade guide.
Visual measurements are generally considered to be easier to perform than instrumental ones.
From the preceeding sections, we know that there are various physical, physiological and psychological
factors affecting the visual perception of colour. Moreover, the level of experience of the clinician
performing the shade selection is also crucial. Capa et al [76] evaluated the influence of dentists' and
non-dentists' experience, age, sex, eye colour and use of eyeglasses or contact lenses on tooth shade-
matching ability. They concluded that only professional experience was associated positively with the
outcome, while the other factors did not have any effect on shade-matching results.
As a result, colour perceived may be subjective and vary from one observer to another or even
within the observer. To overcome these limitations of visual assessment, many instruments have been
developed in the hope of providing a more objective measurement.
2.2.3.2 Instrumental Colour Measurement
An alternative to visual colour evaluation is instrumental colour measurement. There are two
main categories of instruments used for colour assessment, spectrophotometers and colourimeters.
These methods of measurement and their application in dentistry have been comprehensively reviewed
recently by several authors [3, 78, 79].

26
A spectrophotometer breaks down radiation into its component wavelengths and provides
wavelength by wavelength spectral analysis of the reflecting or transmitting properties of the object,
while a colourimeter quantifies colour by measuring three primary colour components of light, which
corresponding to physiological trichromatic nature of the normal eye.
Compared to a spectrophotometer, a colourimeter is relatively simple and less costly but only
provides data in terms of colour coordinates. The spectrophotometer is more elaborate, expensive and
bulky. Table 2.2 shows some of the commercially available colour measurement instruments used in
dentistry [41, 78, 79].
These two devices are essentially comprised of a standard light source (illuminant), the subject,
detector (replacing human eyes) and interpreter. The light created by the light source passes through
the subject where some light is usually absorbed, is received by the sensor, and is interpreted into an
output such as a CIE chromacity graph. There are multiple illuminants possible, including the CIE
Illuminant A, B, C, D, E and F representing various types of light sources. The general recommendation
of illuminant for colour matching is D65 [41, 78, 79]. Most instruments are keyed to dental shade guides
systems and can be converted into the shade tab. This enables users to cross reference the shade
guide tabs in the database and the image captured.
This eliminates human interpretation, thus data can be obtained objectively, overcoming some
of the problems associated with visual subjective assessment, including physical elements such as light
and reflection, or the physiological and psychological factors of the observer. Another distinct advantage
of instrumental colour measurement is the repeatability of the measurement. Intra- and inter- operator
consistency using these devices has been demonstrated [80-84], and considered superior to visual
assessment [85, 86].

27
Mathematically, the data can be translated into notations of colour order systems e.g. Munsell
or the CIE colour system. Via mathematical calculation, colour can be identified by numbers and colour
differences can be determined [78, 87]. Therefore, one of the major advantages of instrumental colour
measurement is the quantification of colour changes. Through calculation of colour differences, changes
in colour can be precisely and objectively recorded and analysed. These measurements also allow one
to quantify and analyse which parameters of colour (hue, chroma and value) have changed and to what
extent.
By comparing a test instrument to a reference “correct” instrument, the accuracy of the colour
measurement devices has been determined. Varying results have been shown [88, 89] especially in
clinical settings, with accuracy levels ranging from 68-91% being reported [90]. Some studies have
found the percentage of accurate matching comparable between the two methods [77, 91], while one
study found otherwise [92]. Recent studies have shown the accuracy or performance of the some of
devices seem to vary according to the dental shade guide systems [88, 89], but the general trend was
that instrumental colour evaluation produced less colour mismatch or difference with the standard
(better accuracy) compared with the visual colour assessment [93-95].
In dentistry, the instrumental colour measurement also encompasses imaging systems. With an
appropriate calibration protocol (eg; object-camera distance, digital camera settings, and suitable
illumination conditions), the digital imaging method has been suggested as an alternative colour
measurement tool with reasonable accuracy and reliability [96-101]. Schropp et al [102] evaluated the
efficacy of digital photographs and computer graphic software for colour matching compared to
conventional visual matching, and concluded that the former method is more reliable. In terms of
reproducibility, a clinical study conducted by Sagel et al [103] found that the clinical measurement of
mean tooth colour from digital images was highly reproducible if proper calibration protocols were used.

28
From the previous information, it becomes apparent that colour selection of restorative material
usually involves the measurement of colour either subjectively (through the human eye) or objectively
(with an instrument). Visual methods of specifying colours are subjective, inconsistent and may differ
intra or inter-observer. Instrumental colour analysis, on the other hand, allows a more objective,
quantitative, accurate and reproducible colour evaluation. Owing to these benefits, instrumental
evaluation is the most common colour measurement method employed in all previous studies
concerning the colour stability of composite resins. For the purpose of this study, instrumental colour
measurement with a reflectance spectrophotometer (Medical High Technology SpectroShade™ Micro,
Optic Research, Switzerland; Version 2.41) was used to measure colour changes.

29
Table 2. 2: Some of the instrumental colour measurement devices.
Devices Type Manufacturer
Shade-Eye-NCC™ Colourimeter Shofu Dental Inc., San Marcos, USA
ShadeVision/ShadeRite™ Imaging
Colourimeter
Dental Visiona X-Rite Inc., Grandville,
USA
ShadeScan™ Colourimeter Cynovad, Montré al, Canada
Easyshade Compact™ Spectrophotometer Vident, Brea, CA
Shade- X-Rite™ Spectrophotometer Grandville, MI
SpectroShade Micro MHT™ Imaging
Spectrophotometer
Niederhasli, Switzerland
CrystalEye™ Imaging
Spectrophotometer
Olympus America, Center Valley
ClearMatch™ Digital image
analysis
Clarity Dental, Salt Lake City, UT

30
3.1 Historical Perspective
3.1 Historical Perspective
According to McLean, German chemists during World War II developed a self cured
methacrylate resin. The material was the first plastic material introduced to replace the only dental
aesthetic material previously available; silicate cements. Despite their initial success, chemically cured
acrylic resins were plagued with poor colour stability and associated with inferior mechanical properties
in concert with a high polymerisation shrinkage of 7% that predisposed them to microleakage [104].
In an attempt to minimize the drawbacks of acrylic resin, particularly the high polymerisation
shrinkage, many researchers added filler particles to the acrylic resin. One of these researchers, Dr
Rafael Bowen, explored the possibility of using epoxy resins (di-glycidyl ether of bisphenol-A) mixed
with silica particles. However, the polymerisation of the material was inhibited in the presence of
moisture [105]. To overcome this problem, Bowen added methyl methacrylate groups to the end groups
of the epoxy resin resulting in the discovery of the famous Bis-GMA (bisphenol-A-glycidyl methacrylate)
in 1959 [9]. This pivotal discovery of the Bowen resin instigated the eventual introduction of composite
resins into the field of restorative dentistry. Together with acid etching of dental enamel, proposed by
Buonocore in 1955 [106], the introduction of composite resins have revolutionized dentistry or more
specifically aesthetic restorative dentistry.
CHAPTER 3
LITERATURE REVIEW: COMPOSITE RESINS

31
3.2 Composition
In polymer technology, the term composite is defined as a multiphase substance formed from a
combination of materials that differ in composition or form, that remain bonded together and retain their
identities and properties [107]. The interfaces between components are maintained and act
synergistically to provide an improved physical mixture that is not obtainable in any of the original
components acting alone [108]. In restorative dentistry, dental composite resins consist of three main
components: (1) organic resin (matrix phase), (2) inorganic filler particles (dispersed phase), and (3) the
coupling agent that chemically bonds the inorganic filler to the resin matrix (surface interfacial phase)
[109].
3.2.1 The Resin Matrix
The organic phase of composite resins is generally composed of a polymeric matrix built up by
a chain of repetitive mono-, di- or tri-functional monomers [8, 109]. Various types of monomers systems
have been used in composite resins. To this day, almost 80-90% of commercial composite resins
contain a monomers system based on the Bis-GMA resin pioneered by Bowen [110]. Bis-GMA has a
high molecular weight monomers system and an associated high viscosity that makes it more difficult to
add filler to the monomers. In order to lower the viscosity and to accommodate better filler load,
manufacturers add low molecular weight (low viscosity) monomers e.g. tri-ethyleneglycol dimethacrylate
(TEGDMA) and ethyleneglycol methacrylate (EGDMA).
The bulky aromatic groups in the central part of Bis-GMA form a larger barrier for the monomers
chains to rotate and align for cross linking during the polymerisation process resulting in a lower degree
of conversion. The addition of long chain, flexible dimethacrylates of TEGDMA has been shown to
increase the degree of conversion of composite resins. As a consequence, the degree of conversion in
Bis-GMA and TEGDMA copolymers has been found to decrease with an increasing content of Bis-GMA

32
[111]. The presence of residual unreacted monomers increases the susceptibility of the organic resin
matrix to degradative reactions that in turn result in discolouration of the material [8]. However,
TEDGMA have been shown to be hydrophilic and absorb water that could lead to penetration of staining
agents [112, 113].
Another monomers frequently used as the matrix for resin composites is urethane
dimethacrylate (UDMA). Introduced by Knight et al in 1973, this monomers has been used alone or in
combination with other monomers systems such as Bis-GMA. Results of in-vitro studies indicate that the
monomers exhibited not only improved mechanical properties, but also less hydrophilicity hence, less
water absorption, than did polymers of Bis-GMA or of TEGDMA [8, 111]. According to Sideriduo et al
[113], gradual replacement of TEGDMA with UDMA or/and Bis-EMA in co-polymerisation with Bis-GMA
resulted in more flexible resins with lower water absorption, depending on the TEGDMA content. These
favourable properties, according to some authors, are associated with better colour stability of the
material [114].
Bis-GMA has been controversially implicated in the leaching of estrogenic bisphenol-A
monomers into the environment [115, 116]. However, this remains a subject of debate in the dental
literature [117]. Due to ongoing discussion on the (possible) side effects of Bis-GMA, it became the
philosophy of some manufacturers (e.g. GC America) to avoid the incorporation of this monomers
system in their direct restorative products.
Apart from a monomers system, there are other important resin matrix components including an
initiator (e.g. camphoroquinone and amine for light cured composite resins and amine-peroxide system
in self-cured composite resins), co-initiators, polymerisation inhibitors (to extend working time and
storage stability) and various pigments. Earlier studies have shown that the presence of amine
contributed to the discolouration of the composite. This is thought to be related to the tendency of
33
isomeric dimethacrylates to form yellow-tinted charge-transfer complexes with the tertiary aromatic
amines [109, 126].
3.2.2 The Inorganic Filler Particles
The disperse phase of composite resins is made up of inorganic fillers. Some common filler
particles include ground quartz, alumina silicate, pyrolytic silica, lithium aluminum silicates, or
borosilicate glass. In many composites, quartz is partially replaced by heavy metal oxides of barium,
strontium, zinc, aluminium or zirconium to impart radio-opacity to the material [109]. The addition of
inorganic fillers was pioneered at the time when various attempts were being made to improve the
physical and mechanical properties of acrylic resin. Alterations in the filler particle size, distribution, and
quantity were noted to dramatically affect mechanical properties including compression strength and/or
hardness, flexural strength, the elastic modulus, dimensional stability, coefficient of thermal expansion,
water absorption, and wear resistance [8, 10, 109, 118, 127-131]. A plethora of investigations have
been published on these properties.
The more significant advances in composite resins are largely attributable to the remarkable
improvements and modifications in the inorganic component of the material. Manufacturers have
employed various techniques to increase filler loading, such as milling or grinding, air abrasion,
precipitation, ultrasonic interaction, erosion or through condensation to produce filler particles of various
sizes [130].
The first classification system of composite resins was introduced by Lutz and Phillips [132].
This was based on the average size of the filler particles, manufacturing techniques, and the chemical
composition of the filler particles. The authors divided composite resins into macro-filler composites
(particles from 0.1 to 100 μm), micro-filler composites (0.04 μm particles) and hybrid composites (fillers

34
of different sizes). Several other classification systems based on filler content have since been
suggested by numerous authors [133].
Traditional composite resins are described as containing macro-filler particles which are
mechanically ground or crushed from larger pieces of purely inorganic materials (such as quartz), into
particles or splinters of irregular shape, with sizes ranging from 0.1 to 100µ m. Due to the large size and
extreme hardness of the filler particles, the resin matrix tends to wear faster than the fillers. Clinically,
this can give rise to a rough surface after polishing, wear from prolonged function, and increased
susceptibility to discolourations [8, 132].
Micro-filled composites, as their name implies, are composites that are filled with very small
pyrogenic or colloidal silica particles with size averages in the order of 0.04 µ m [132]. The small filler
particles in the micro-filled composite resins render the material highly polishable. However, the high
surface area-to-volume ratio of the colloidal silica particles creates problems in attaining the higher level
of loading found in composites containing homogenous filler particles. Consequently the materials have
poor mechanical properties and are less than ideal for use in heavy stress bearing situations. To
increase the filler loading, most manufacturers add pre-polymerised resin particles. The pre-polymerised
filler particles are produced by adding colloidal silica to the resin matrix, which is then polymerized and
subsequently ground into particles averaging approximately 25 µ m. These smaller particles of highly
filled resin are then added to a resin matrix creating a heterogenous micro-filled material [8, 109].
A composite resin classified as a hybrid contains colloidal silica particles of different sizes [132],
typically 1-µ m to 5-µ m with a filler loading that approximates nearly 75% by weight. Hybrid composites
were created to overcome the inherent weakness of micro-filled composites (lack of mechanical
strength) and macro-filled composites (excessive wear and lack of esthetics). Although demonstrating
good handling characteristics and initial high polishability, polish retention is rather poor due to the
presence of substantially larger filler particles similar to the macro-fillers.

35
The presence of larger filler particles also results in a significant refractive index mismatch with
the resin matrix. In preceeding sections (Section 2.1.2) it has been shown that when a substance
contains particles of a different refractive index, a light beam striking the substance will be scattered and
individual wavelengths will bend differently, yielding a substantially different spectrum returning to the
eye and produce an opaque material. Therefore, manufacturers developed micro-hybrids with reduced
particle sizes of 0.04-µ m to 1-µm. Gradia Direct™ from GC America is an example of composite resins
containing this type of system. The manufacturer claims that micro-hybrid resin composite with pre-
polymerised resin fillers have „much appreciated‟ advantages in terms of aesthetic, polishability and
wear resistance [134].
The emergence of nanotechnology has seen the incorporation of nano-sized fillers into
composite resins. Unlike conventional particles that are milled or ground down from larger-sized
particles into smaller particles (from one to several microns), nano-particles, are built up on the
molecular level. There are two types of nano-composites; nano-filled and nano-hybrids. Nano-filled
composite resins e.g. Filtek™ Supreme Plus (3M ESPE) are composed of nanomeric particles
dispersed as single units within the resin matrix and/or in combination with agglomerated clusters of the
nano-particles [12]. According to the manufacturer, the nano-cluster filler particles consist of loosely
bound aggregates of engineered nano-filler particles. As the particles in the nano-cluster are not tightly
sintered, their wear rate and pattern during abrasion are more similar to the nano-filled matrix. The
manufacturer states that the nano-particles in the nano-cluster wear by breaking of the individual
particles rather than plucking of the whole cluster, resulting in better polish retention [135].
A nano-hybrid composite (Premise™ Kerr/Sybron) combines both nanometer-sized particles
with more conventional filler technology [129]. Another type of nano-composite, Ceram-X ™(Dentsply) is
considerably different. It is an ormocer-based nano-composite. Rather than existing as an individual
particle or an agglomerated cluster, the nano-particle becomes part of the resin matrix [129].

36
Nano-fillers have a significant effect on the optical properties of composite resins [12]. As the
size of the particles is far below the wavelength of visible light, they are unmeasurable by the refractive
index. Therefore, there is an almost negligible scattering of light, and most of the longer wavelengths of
the light transmit directly through the material resulting in a high translucency [12].
Based on their filler content, composite resins can be further classified into flowable composite,
packable / condensable composite and fiber reinforced composites, however, this will not be presented
here. There appears to be a strong research focus on filler technology, especially in the development of
bioactive or “smart” composite with caries prevention capacity eg calcium and phosphate or fluoride ion-
releasing [129, 136].
3.2.3 The Interfacial Phase
The third basic component of composite resins, the interfacial phase or the coupling agent,
connects the resin matrix and the inorganic filler. Commonly, vinyl, epoxy and methyl silanes are used.
The compound molecules have a silane group at one end and a methacrylate group at the other end,
and can bond with both the filler and the resin matrix respectively. The interface between the filler and
resin matrix involves three types of molecular interaction – covalent bonds, hydrogen bonds and
hydrophobic interactions. The covalent bonds are derived from double carbon bonds (C=C) between the
residual double carbon group in the pre-polymerised fillers and the methacrylate matrix monomers,
while the hydrogen bonds are derived from polar constituents such as the – OH, – NH, and – C=O
groups. The hydrophobic interactions involve molecular bonds between organic groups such as alkyl
groups [134]. The quality of the bond is crucial as it influences the abrasion resistance, polishability and
surface hardness of the restorative material [125].

37
3.3 Finishing and Polishing Systems
Following placement of composite resins, it has been established that finishing and polishing
are essential in determining the success of a restoration [137]. For this reason, manufacturers have
introduced a wide variety of burs, diamonds, abrasives, strips and pastes for finishing and polishing
composite resins [137]. Polishing techniques range from multiple steps with sequential use of less
abrasive materials to those with one-step polishing technique [138-140].
The effect of polishing on the colour stability of composite resins may be related to the surface
topography of the material after the polishing procedure [141].Generally, the rougher the surface, the
more susceptible the material is to extrinsic staining [142]. Surface morphology following polishing is
closely related to the filler size, shape, and loading in the resin composite. The larger the filler particles,
the rougher the surface will be after polishing [143, 144]. Factors related to the abrasive system such as
flexibility of the material in which the abrasive is impregnated, hardness of the abrasive, and geometry,
speed and form of application of the instruments used are also crucial [145].
Many studies have been conducted to establish a finishing and polishing procedure that will
produce a smooth-surfaced restoration. Studies have shown the smoothest composite surface is
obtained under polyester matrix film [28, 138-140, 146-148]. Park et al [149] have shown that in micro-
hybrid composite resins, there is no difference in surface discolouration between mylar strips finished
and the polished surface. They have postulated that this is due to the relatively smaller filler particles, a
shorter inter-filler distance in the micro-hybrid composites and the lower resin component present on the
surface of the mylar strips finished micro-hybrid composites. However, several other investigations have
shown that removal of the polymer-rich, outermost resin layer is essential in achieving a stain-resistant,
more esthetically stable surface [71, 138, 150-152].

38
Aluminum oxide-based abrasives devices such as Sof-Lex™ discs have also proven their
efficiency in finishing and polishing composite restorations [143, 151, 153-158]. It has been shown that
when used in sequentially decreasing abrasiveness, they promote uniform wear as both fillers and
matrix are reduced evenly. Some studies [159, 160] support the idea that multiple-step polishing
techniques provide a lower degree of discolouration for both composite resins, while others [138, 139,
161] promote the use of one-step polishing method. Recently, Berger et al [162] recommended the use
of finishing systems supplied by the composite‟s manufacturer as they observed a lower surface
roughness and staining in composite resins polished with finishing systems from the same company.
However, there is no consensus in the literature about the effectiveness of different finishing and
polishing procedures in relation to the staining susceptibility of composite resins.

39
3.4 Colour Stability of Composite resins
Composite resins have been shown to be prone to discolouration on exposure to an oral
environment over a period of time. Horsted – Bindslev and Mjor [163] believe the discolouration of the
composite resins may be caused by intrinsic and extrinsic factors. Intrinsic factors involve alterations or
changes in the chemical structure of the composite resins under physical and chemical conditions, while
extrinsic factors are mainly due to surface staining from absorption or adsorption of exogenous
substances [21, 22].
3.4.1. Intrinsic Staining
As described earlier, the chemical structure of composite resins can be represented in four
parts: an organic resin matrix, inorganic filler particles, a silane coupling agent that bonds both organic
and inorganic phase and the initiator–accelerator system [8]. An alteration or changes to any of these
components within the material may result in a permanent discolouration at the subsurface and internal
layers of composite resins.
The susceptibility of composite resins to intrinsic staining varies according to the chemical
composition of resin matrix, types and amount of filler and initiator and accelerator system [164-167].
Different monomers type in the organic resin matrix may affect the colour stability of composite resins
[168]. Studies have found that this may be directly related to monomers hydrophobicity [11, 169] and
water absorption properties [70, 114, 171]. Water absorption produces deleterious effects including
hygroscopic swelling, plasticization, softening, oxidation and hydrolysis of the resin matrix that leads to
penetration of staining pigments [172, 173].
It has been shown that urethane dimethacrylate (UDMA) exhibits less staining compared to
Bisphenol A-glycidyl methacrylate (Bis-GMA), which is the common resin monomers used [70].

40
Conversely, composite resins with hydrophilic monomers e.g. tri-ethylene glycol dimethacrylate
(TEDGMA) exhibit higher water absorption [174], and therefore permits penetration of any hydrophilic
colourant into the resin matrix. This is further substantiated in investigations by Douglas and Craig [114],
who have concluded that composite resins with lower water sorption rates arising from the use of
hydrophobic (less affinity to water) resin monomers are less prone to discolouration.
The colour properties of composite resins are influenced by their filler content [11, 175, 176].
Arikawa et al [177] have demonstrated that the light transmittance/diffusion characteristics of composite
resins and colour are significantly affected by the size and shape of filler particles as well as filler load.
This is in agreement with results from another study by Lim et al [178], in which the effect of filler on
colour parameters (lightness, hue and chroma) was evaluated. It was found that the amount of filler
significantly influenced the lightness of composite resins.
The staining potential of composite resins is related to its surface structure. The rougher the
surface, the more susceptible the material is to extrinsic staining [142]. The surface characteristic of
composite resins depends on types of fillers used [178-180] and finishing or polishing technique. Fillers
appear to affect how well a composite finishes [168]. In general, smaller filler particles allow better
polishability, thus producing a smoother surface [11]. Recently, composite resins with nano-sized
particles have been developed with this thought in mind. It has been demonstrated that nano-filled or
nano-hybrid composite resins with average filler particle size of 5-100 nanometers [12] have less
discolouration [36] compared to the traditional micro-filled composite resins with quartz particles of
various size ranging from 0.01 – 0.1µ m. However, studies by Ertas et al and Guler et al [26, 182] have
shown contradicting results. Nano-composite resins did not exhibit greater stain resistance to the
colourant tested. This study will therefore investigate the colour stability of nano-filled composite resins.
Besides fillers, the initiator or accelerator in composite resins can also produce colour changes
in composite resins [183-186]. Studies found that initiators such as tertiary amine (N,Ndimethyl-p-

41
toluidine) in chemically cured resin or the photoinitator (camphoroquinone) in light polymerized based
cement may oxidize into a yellowish-brownish coloured compound thus leading to the discolouration of
the composite resins [185, 187-190]. In addition, hydroquinone used as the inhibitor for spontaneous
polymerisation of composite resins, was also found to cause discolouration [190].
Results from laboratory studies reveal that the degree of polymerisation also plays a role in the
colour stability of composite resins [183-186]. Suboptimal polymerisation leaves unreacted initiators or
accelerators in the composite resins that in turn result in a yellowing of the composite resins [190, 193].
Furthermore, incomplete conversion of monomers as a result of insufficient polymerisation is related to
increased water absorption of the composite resins which subsequently could potentiate the risk of
discolouration [194].
Several studies have investigated various physico-chemical conditions in the oral environment
that may alter or change the chemical structure within composite resins. The effect of daylight [195] or
ultraviolet irradiation [196, 197], thermal changes and water [195, 198-200] on colour properties of
composite resins have been widely documented. Rosentritt [201] evaluated the colour of composite
resins after 24 hours of photo-aging found that the composite resins become yellower, greener and
darker after exposure. Similar findings were also observed by other researchers [202-207].
Apart from photo-aging, colour change in composite resins as a result of water aging has been
described. Brauer [208] has reported that there was significant colour change in composite resins when
stored in 600C water. This result is consistent with a report by Vichi et al (2004) [200]. However, in the
oral environment, a slow intermittent temperature fluctuation is more likely. When composite resins was
subjected to intermittent exposures of high and low temperatures in a humid or moist environment
(thermocycling) to simulate the oral condition, the material become darker and decreased in
translucency after thermocycling [205, 209-216].

42
The colour change of composite resins upon exposure to various aging conditions is time and
dose dependent, and may be attributed to changes in the surface microstructure and chemical
composition within the matrix of the composite resins [217]. Changes have been observed not only
within the matrix but also at the interface between organic matrix and filler particles. On this note,
Schulze et al [167] found that there is a decrease in barium and silicone on the surface of the composite
leading to surface degeneration along with rearrangement of the polymer molecule(s). Similarly, Lin et al
[218] postulate that a weakening of the chemical bonds in the organic polymer create pores within the
resin matrix as well as exposure of filler particles, thereby contributing to the colour changes in
composite resins. Surface deterioration induced by the physico-chemical changes creates microcracks
within the material that facilitate the penetration of stains.
In this study, the selected composite resins will be subjected to accelerated aging through
thermocycling prior to immersion in staining solution.
3.4.2. Extrinsic Staining
Extrinsic discolouration of composite resins may occur as a result of staining by the pigments
from exogenous contaminants. Unlike intrinsic staining, extrinsic discolouration involves surface or
subsurface adsorption or absorption of chromogenic substances and can be removed mechanically or
chemically [26]. Colour alteration of composite resins after immersion in various liquid beverages has
been a subject of great interest in many studies. Coffee [24-30, 36, 37, 219-222], tea [21, 24-27, 30-33,
221-223], alcoholic beverages [26-28, 30, 34, 35, 37, 207, 219, 222], carbonated drinks [24, 26, 28, 33,
34, 36, 207, 220-224] and fruit juices [24, 33, 34, 36, 222, 225] are the common staining agents
investigated.
Staining by red wine may be attributed to the presence of alcohol and low pH. This is supported
in conclusions of a study by Villalta et al [35], where presence of alcohol and low pH (as in red wine)

43
resulted in surface degradation of the composite resins, therefore contributing to the intrinsic colour
changes. In another study [227], SEM analysis of a composite resin after pH cycling revealed that there
was disintegration of the polymer matrix and degradation of silane bonding between filler and organic
matrix, leading to protrusion of filler particles as well as voids from particle loss. Consequently, surface
roughness was noted. As indicated earlier, rough surfaces increase the retention of chromogenic agents
or colour pigments.
Similarly, alcohol affects the colour of composite resins through softening of the surface
material [228], facilitating the absorption of external pigments [229]. A recent study by Aguir et al [230]
showed that alcohol caused only superficial staining. It was believed that because of the presence of
water in the subsurface of the composite resins, alcohol was ineffective in removing the polymer in the
subsurface. Furthermore, the surface dissolution by alcohol might be more selective in the linear
polymer than the cross linked structure. In addition, Satou et al [171] believe that the discolouration of
composite resins are the result of binding between hydrophilic un-reacted component in the initiators in
the composite resins and the hydrophilic pigments in the red wine.
There has been a lot of speculation about the discolouration of composite resins by coffee and
tea. According to Um and Ruyter [21], discolouration caused by coffee and tea is due to yellow
colourants in the beverages. The investigators believe that yellow colourants in tea have higher polarity
compared with coffee. Therefore, tea caused adsorption of colourant on surface of composite resins
and can be mechanically removed. While coffee stains composite resins by adsorption and absorption
of colourant into the organic matrix of material as a result of the compatibility of yellow colourant in
coffee with the organic matrix of composite resins. Another group of researchers [25] found that the
penetration of the stain is noted to be superficial, approximately 3- 5 µ m, and mechanical cleaning could
reduce the staining. The greatest degree of discolouration by coffee is observed during first week of
immersion. Addition of sugar in coffee accentuates the staining by coffee [231, 232]. This is thought to
be caused by the sticky effect produced by sugar. [231].
44
Colour alteration in composite resins when subjected to various organic and chemical
substances has been reported. Staining by alcohol based mouthwashes [30, 233], fluoride varnishes
[234] and bleaching agents [235-238] has been described. Khokhar et al [70] and Omata et al [27] found
that the addition of chlorhexidine and saliva increased the staining effect of coffee and tea. Leard et al
[32] explains that this phenomenon may be attributed to the binding of the cationic (positive charged) in
the anti-septic mouthwash surface anionic (negative charged) surfaces of chromogenic agents in
beverages.
Salivary esterase was found by Lee et al [239] to cause increased in surface roughness and
perceivable colour change in composite resins. The following year, the same group of researchers [240]
published their work on the effect of the combined treatment of organic and chemical solutions on the
colour of composite resins. They discovered that the discolouration of composite resins by methylene
blue dye after immersion in a combined organic solution (mucin and serum) and chlorhexidine or
carbamide peroxide was due to absorption of the stains by a deteriorated resin.
Colourants or dyes are usually added to enhance the appearance of food and may have
potential to stain composite resins [241]. Research by Dietschi et al [11] showed that composite resins
are also susceptible to staining by artificial food dyes (erythrosine and sunset yellow). This is supported
in recent findings by Rutkunas et al [37]. The researchers noted that the concentration of food colourant
used by the manufacturers ranged from 0.02% up to 3%. They used food colourant sunset yellow and
quinoline yellow dyes at a concentration of 0.1%.
In Asia, spices are used to flavor and colour local dishes. Turmeric, paprika and tamarind are
the common spices used to enhance the colour of Asian cuisine [242, 243]. The effect of these spices
on the colour stability of composite resins, however, has not been fully researched. Only one study by
Stober et al [30] reported that 0.1% turmeric solution caused severe discolouration, with total amount of

45
colour difference (represented as Delta E) more than 10. In a more recent study by Imamura et al [244],
curry is noted to stain composite resins. However, neither author describes the staining mechanism of
the spices. Due to the extensive use of spices in Asian countries, the aim of this study is to determine
the effects of spices on the colour stability of composite resins.
46
The American Food and Drug Administration, in the code of Federal Regulations on food
labeling: Spices, Flavourings, Colourings and Chemical Preservatives, states that:
“Spices are aromatic vegetable substances, in the whole, broken, or ground form, whose
significant function in food is seasoning rather than nutrition. They are true to name and from them no
portion of any volatile oil or other flavouring principle has been removed.” [245].
Spices include turmeric, paprika and tamarind.
4.1 Turmeric
Turmeric is a spice derived from the rhizome curcuma longa, belonging to the Zingiberaceae
(ginger) family. Turmeric is a perennial herb with thick, fleshy orange-brown or pale yellow rhizomes
(Figure 4.1)[242].
Curcumin is the major constituent of turmeric that imparts the yellow gold colour of the spice
[246, 247]. Chemically, curcumin, desmethoxycurcumine and bis-desmethoxycurcumine, are poly-
phenolic [248] compounds of diferulomethane that contain flavonoids and free anthraquinone [249]. The
spectrum of standard curcumin reveals three peaks having maximum values of 413, 412, and 404 nm,
representing curcumin, demethoxycurcumin, and bis-demethoxycurcumin, respectively [250]. The
absorption peak in the visible region (420 nm) explains the yellow colour appearance of the substance.
CHAPTER 4
LITERATURE REVIEW: BASIC COMPOSITION OF SPICES

47
For centuries, turmeric has been used for both its colour and flavour. In the food industry,
turmeric is used in mustard paste, curry powder, canned beverages, baked products and dairy products.
It is used mainly as a natural colourant replacing synthetic colourants such as tartrazine [243].
Known as the Indian Gold, turmeric has been extensively researched and has been shown to
have great promise as a therapeutic agent due to its anti-oxidant, anti-inflammatory, anti-viral, anti-
bacterial, anti-fungal, and potential anti-cancer actions. These properties are attributed to the presence
of curcumin, an active component in turmeric [246, 251-253].
Figure 4.1: Turmeric (adapted from www.purplesage.org.uk [279]).
NOTE: This figure is included on page 47 of the print copy of the thesis held in the University of Adelaide Library.

48
4.2 Paprika
Paprika, a fruit of the genus Capsicum annum is a member of the Solanaceae family that
includes tomato, potato, tobacco and petunia. Spices belonging to the Genus Capsicum are numerous,
including all major peppers (Figure 4.2) [246].
Paprika oleoresin is an extract of capsicum that has been used as a natural dye, colourant and
flavour. There has been extensive research into isolation and characterization of the colour of paprika.
Chromatography evaluation has revealed that the bright red colour of paprika originates from the
carotenoid and capsaicinoids pigments contained in the paprika. In spectrophotometry, these pigments
show maximum absorption at about 462 nm and 470 nm. Capsaicin is the major flavouring compound,
whereas capsanthin and capsorubin are major colouring compounds [255].
Paprika is widely used as a seasoning ingredient to flavour meat as well as colouring agent in
both household and commercial use such as cheese, chilli sauce, salad dressing and curries. It gives a
bright red colour, and an exquisite pungency, taste and aroma to the food. In addition, it is used dried or
fresh in various pharmacological preparations. It has a long history as a source of biologically active
compounds, such as flavonoids, phenols, carotenoids and capsaicinoids [242].
Figure 4.2: Paprika (adapted from www.homecooking.com [280]).
NOTE: This figure is included on page 48 of the print copy of the thesis held in the University of Adelaide Library.

49
4.3 Tamarind
Tamarind comes from the fruit of Tamarind indica, belonging to the Leguminosae family.
Tamarindus indica is a multipurpose tropical fruit tree. Almost all parts of the tree find some use or other
in the food, chemical, pharmaceutical and textile industries. The properties of this species have been
extensively studied, particularly with reference to the fruit pulp (Figure 4.3)[256].
The fruit of the tamarind has blackish brown pods with seeds containing naturally occurring
plant acids such as tartaric acid, carboxylic acids, palmitic acid as well as sugar that contribute to the
outstanding sweet acidic taste. The fruit contains a variety of pigments e.g. the red colour is due to the
water-soluble red-rose anthocyanin pigment. Flavonoid is the major brown/black colour pigment [257].
The tamarind fruit pulp has been an important culinary ingredient for souring curries, sauces,
chutneys and beverages for a long time. Tamarind fruit is also reported to be used for the preparation of
wine like beverages. In South East Asia, fibres are removed from the fruit pulp, which is mixed with
sugar, wrapped in paper and sold as toffees [242].
Tamarind is also extensively used in traditional medicine for treating several common ailments
as an anti-fungal and anti-bacterial. The pharmacological potentials of tamarind are associated with the
presence of flavonoid or poly-phenol components, for example gallic acid [246].
Figure 4.3: Tamarind (adapted from www.manjulaskitchen.com [281]).
NOTE: This figure is included on page 49 of the print copy of the thesis held in the University of Adelaide Library.
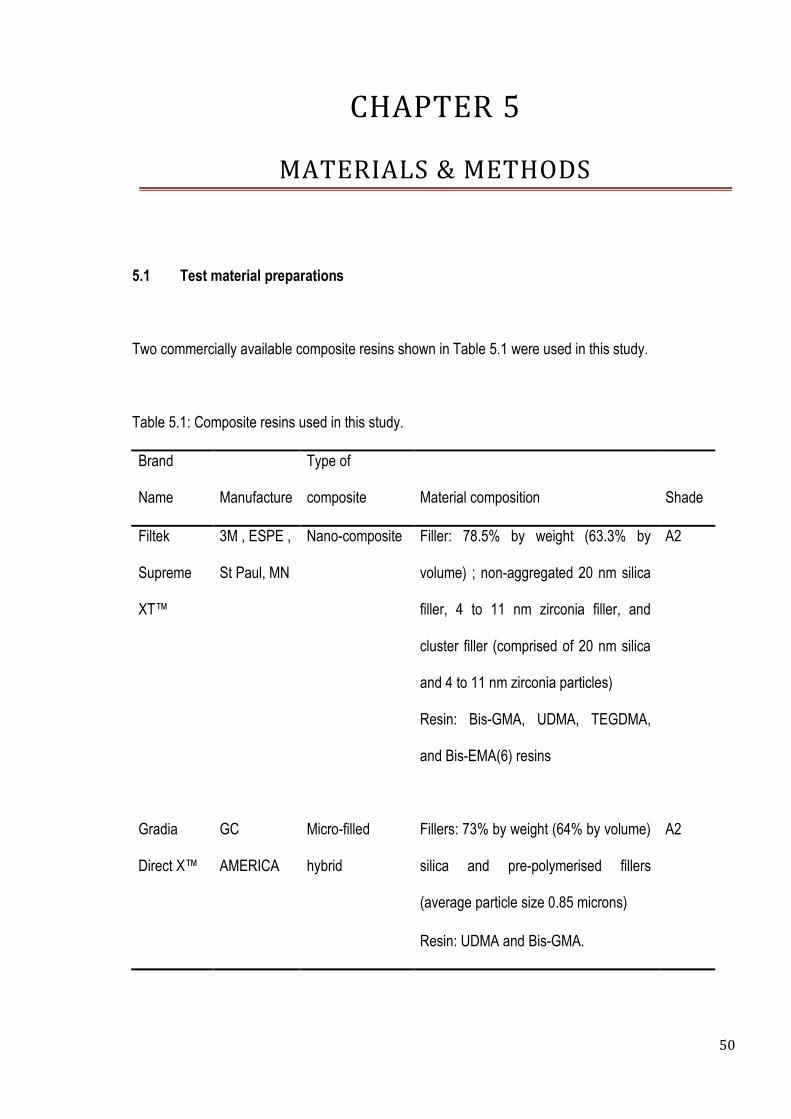
50
5.1 Test material preparations
Two commercially available composite resins shown in Table 5.1 were used in this study.
Table 5.1: Composite resins used in this study.
Brand
Name Manufacture
Type of
composite Material composition Shade
Filtek
Supreme
XT™
3M , ESPE ,
St Paul, MN
Nano-composite Filler: 78.5% by weight (63.3% by
volume) ; non-aggregated 20 nm silica
filler, 4 to 11 nm zirconia filler, and
cluster filler (comprised of 20 nm silica
and 4 to 11 nm zirconia particles)
A2
Resin: Bis-GMA, UDMA, TEGDMA,
and Bis-EMA(6) resins
Gradia
Direct X™
GC
AMERICA
Micro-filled
hybrid
Fillers: 73% by weight (64% by volume)
silica and pre-polymerised fillers
(average particle size 0.85 microns)
A2
Resin: UDMA and Bis-GMA.
CHAPTER 5
MATERIALS & METHODS

51
Based on the results obtained in the pilot study and power calculations, a sample size of 5 for
each group was determined. Twenty cylindrical specimens were fabricated from each type of composite
resin investigated utilising a stainless steel matrix with a central round hole of 8mm in diameter, 3 mm in
depth (Figure 5.1).
Figure 5.1: Composite resins in stainless steel matrix.
Each matrix was placed between two glass slabs which were lined with mylar strips. Each
composite resin was placed in two increments of 1.5 mm each into the mould. The specimens were then
covered with mylar strips and a glass slide placed over the material to extrude the excess material.
The composite resins were light polymerized with a LED curing light (Satelec™ Mini LED/ with
output power of 1250 mW/cm²) according to the manufacturer‟s instructions. The following chart (Table
5.2) shows irradiation time and depth of cure for each composite resins as recommended by the
manufacturer. After polymerisation, all specimens were removed from the mould and all surfaces were
further light cured for another 20 seconds.
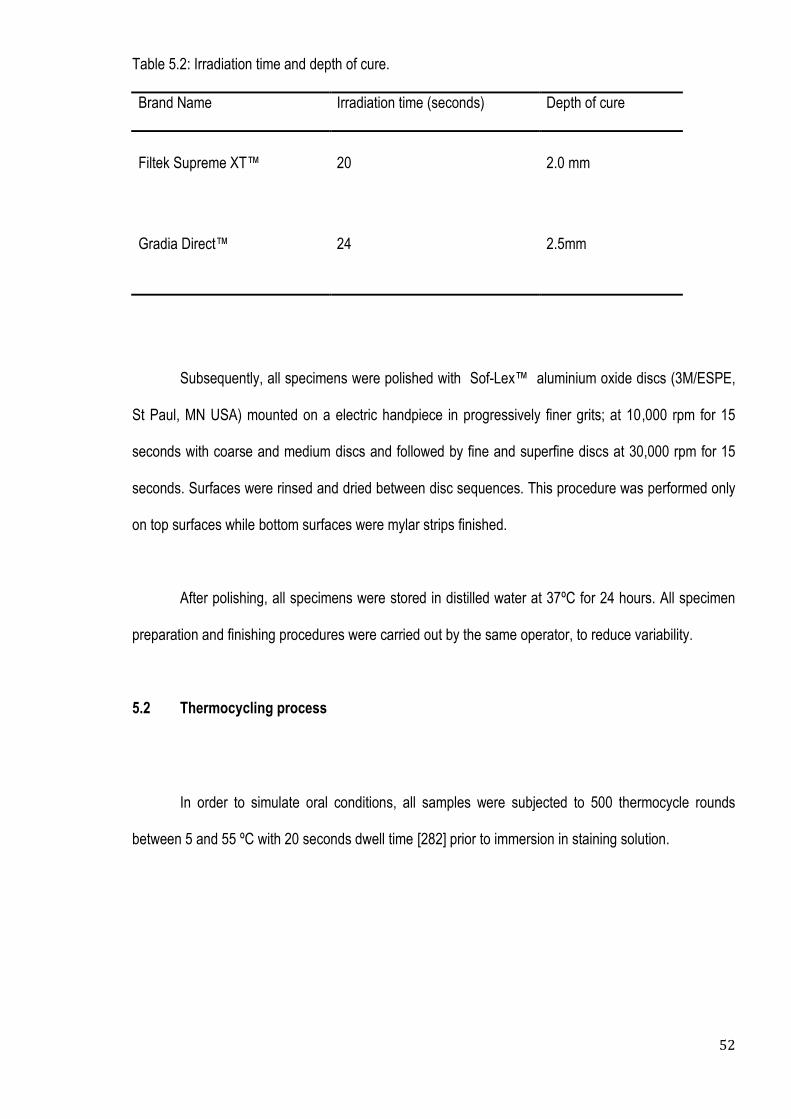
52
Table 5.2: Irradiation time and depth of cure.
Brand Name Irradiation time (seconds) Depth of cure
Filtek Supreme XT™ 20 2.0 mm
Gradia Direct™ 24 2.5mm
Subsequently, all specimens were polished with Sof-Lex™ aluminium oxide discs (3M/ESPE,
St Paul, MN USA) mounted on a electric handpiece in progressively finer grits; at 10,000 rpm for 15
seconds with coarse and medium discs and followed by fine and superfine discs at 30,000 rpm for 15
seconds. Surfaces were rinsed and dried between disc sequences. This procedure was performed only
on top surfaces while bottom surfaces were mylar strips finished.
After polishing, all specimens were stored in distilled water at 37ºC for 24 hours. All specimen
preparation and finishing procedures were carried out by the same operator, to reduce variability.
5.2 Thermocycling process
In order to simulate oral conditions, all samples were subjected to 500 thermocycle rounds
between 5 and 55 ºC with 20 seconds dwell time [282] prior to immersion in staining solution.

53
Figure 5.2: Chart representing sample preparation.

54
5.3 Staining process
Three staining solutions as described in Table 5.3 were used. Distilled water was used as the
control group. In concurrence with Stober et al [30], 0.1% turmeric, paprika and tamarind solutions were
prepared by diluting 1g of spice in 1000ml of boiled distilled water.
Table 3.3: Type of staining solutions used in this study.
Type of staining solution Brand name Manufacturer
Distilled water
Faculty of Health Sciences,
University of Adelaide, Australia
0.1% Turmeric
MasterFoods™
Mars Food Australia
0.1% Paprika
MasterFoods™
Mars Food Australia
0.1% Tamarind
Maharajah‟s Choice™ Ostindo International Ltd
Twenty specimens from each type of composite were then randomly divided into 4 groups
(n=5). Each specimen was arranged vertically in a customized holder (Figure 5.3) to ensure both
finished surfaces exposed to the staining solutions and immersed in a container containing 50 ml of
each staining solution and distilled water (control) at 37 ºC.
All specimens were kept in an incubator and vibrator (Figure 5.4) to prevent precipitation of the
spice particles in the solution for 24 hours. Fresh solutions were prepared every day. Prior to colour
measurements, all specimens were rinsed with distilled water at 37 ºC.

55
Figure 5.3: Vertically placed specimens in customized holder.
Figure 5.4: Staining solutions in incubator and vibrator.

56
5.4 Colour Assessment
The colour of composite resins can be determined by varying methods, including visual
assessment and instrumental measurement by a colourimeter or spectrophotometer. In this study, a
reflectance spectrophotometer (Medical High Technology SpectroShade™ Micro, Optic Research,
Switzerland; Version 2.41) was used to measure colour changes. This system uses two D65 (daylight)
light sources illuminated at 45° and reflected to the detector screen at 0° . CIE L*a* b* parameters and
equations were used.
5.4.1 Spectrophotometer set-up
A customized positioning jig made from self cure acrylic (Figure 5.5) was fabricated to obtain
consistent and standardised orientation of specimen for colour measurement. All specimens were
placed within the circle on the neutral grey background. The indices on the jig (as indicated by the
arrows) allow consistent repositioning of the sensor headpiece of the spectrophotometer over the jig.
The black jig also eliminates the influence of external light during colour evaluation.
Figure 5.5: Positioning jig.
Prior to any measurement, the spectrophotometer was calibrated to white and green ceramic
tiles supplied by the manufacturer. Measurements were performed according to ISO 7491 guidelines
[278] using a neutral gray background.

57
5.4.2 Colour Measurement
Colour measurement at baseline, after thermocycling, 24 hours (1 day), 72 hours (3 days) and
168 (7 days) [283] of immersion in staining solutions were recorded with a reflection spectrophotometer
under the D65 (daylight) illuminant over a white background using CIE L* a* b* parameters.. L*
represents value (ranges from (100) white to (0) black), a* refers to chromacity in red and blue axis (+a
red/ -a green) and b* refers to chromacity in yellow and blue axis (+b yellow/ -b blue).
The following CIE formula will be used to determine the total colour difference after immersion
in staining solution.
∆ E = [(∆ L*)2 + (∆ a*)2 +(∆ b*)2 ]1/2
A total colour change (∆ E) more than 1 is visually perceptible, and (∆ E) more than 3.3 is
considered clinically unacceptable [68-71].
5.5 Statistical Analysis
SPSS Version 17.0 was used for statistical analysis. Descriptive analysis that includes
mean and standard deviation was determined for each of the test groups. To test the significance
and possible interactions of each factor, repeated measures analysis of variance (ANOVA), with
one within-unit factor (three measurement times) and three between-unit factors (two materials,
finishing methods and four staining solutions) were used. Bonferroni post hoc tests were applied to
each factor where significant differences between-unit factors were found. The level of significance
for all statistical testing was pre-determined at a p-value of 0.05 or less.

58
The variables used in this study were:
(1) Staining solutions (turmeric, paprika, tamarind and distilled water),
(2) Immersion time (24 hours (1 day) , 72 hours (3days), 168 hours(7 days)),
(3) Materials (Filtek Supreme™ and Gradia Direct™),
(4) Finishing methods (Sof-Lex™ discs and mylar strips),
The mean and standard deviations for colour changes (ΔE) by the type of composite are
presented in Table 6.1. The results indicated that there was colour difference in both types of
composite resins after thermocycling before immersion in the staining solution. Calculated mean
colour difference (ΔE) values were between 1.53 and 2.94. The average magnitude of the colour
difference (ΔE), however, was below the clinically unacceptable value (3.33).
6.1 Effect of Spices on Colour Stability of Composite resins.
Among all the staining solutions tested, the highest colour deviation was obtained in the
turmeric group, with mean ∆E ranges between 17.92 and 55.25 (Table 6.1). The colour differences
exhibited were significantly higher than the other staining solutions. As clearly depicted in Figure
6.1, this finding was confirmed by the post-hoc test. Regardless of the method of finishing, both
composite resins presented clinically perceptible colour changes after 24 hours immersion in the
solution and ∆E values increased with the staining time. After remarkable colour changes in the
CHAPTER 6
RESULTS
59
first 24 hours, there was steady increase in the ΔE values throughout the investigation period in
Filtek Supreme™, while in Gradia Direct™, gradual changes in the ΔE values were observed
between 24 and 72 hours before the values increased considerably thereafter (Figure 6.2).
Paprika, on the hand, showed clinically noticeable colour changes (ΔE > 3.3) only after 72
hours immersion (Table 6.1). This was detected in Gradia Direct™ finished by either Sof-Lex™
discs or mylar strips, whereas no clinically discernible colour differences were noted in the Filtek
Supreme™ throughout the period of the study. Both of the composites tested showed intense
colour changes after the first 24 hours. For Gradia Direct™, there was a steady increase followed
by a leveling out after 72 hours. Colour changes after 72 hours were clinically unacceptable. Filtek
Supreme™ polished with Sof-Lex™ discs showed a slow increase in colour difference from 24
hours to 72 hours with steady increase noted thereafter, while an equable increase was shown by
Filtek Supreme™ with mylar strips finished throughout the period of investigation (Figure 6.2).
Colour changes in the composite resins after immersion in tamarind solution ranged
between 1.12 and 5.42 (Table 6.1). The colour differences (∆E) greater than 3.33; (above clinical
perceptible limit) were recorded only after 168 hours immersion with mylar strips finished Filtek
Supreme™ and Gradia Direct™ finished with both methods. Gradia Direct™ displayed a different
trend of colour changes to Filtek Supreme™. For Gradia Direct™, a sharp increase occurred at 24
hours followed by a gradual rise until 72 hours before an exponential increase in colour change was
noted. Filtek Supreme™ also showed similar trend in the first 24 hours, followed by steady increase
thereafter. None of the composite resins tested had ∆E higher than this limit (∆E> 3.33) after
storage in distilled water, yet most colour changes occurred in the first 24 hours of immersion
(Figure 6.2). No significant colour changes were observed between paprika, tamarind and control
solutions.
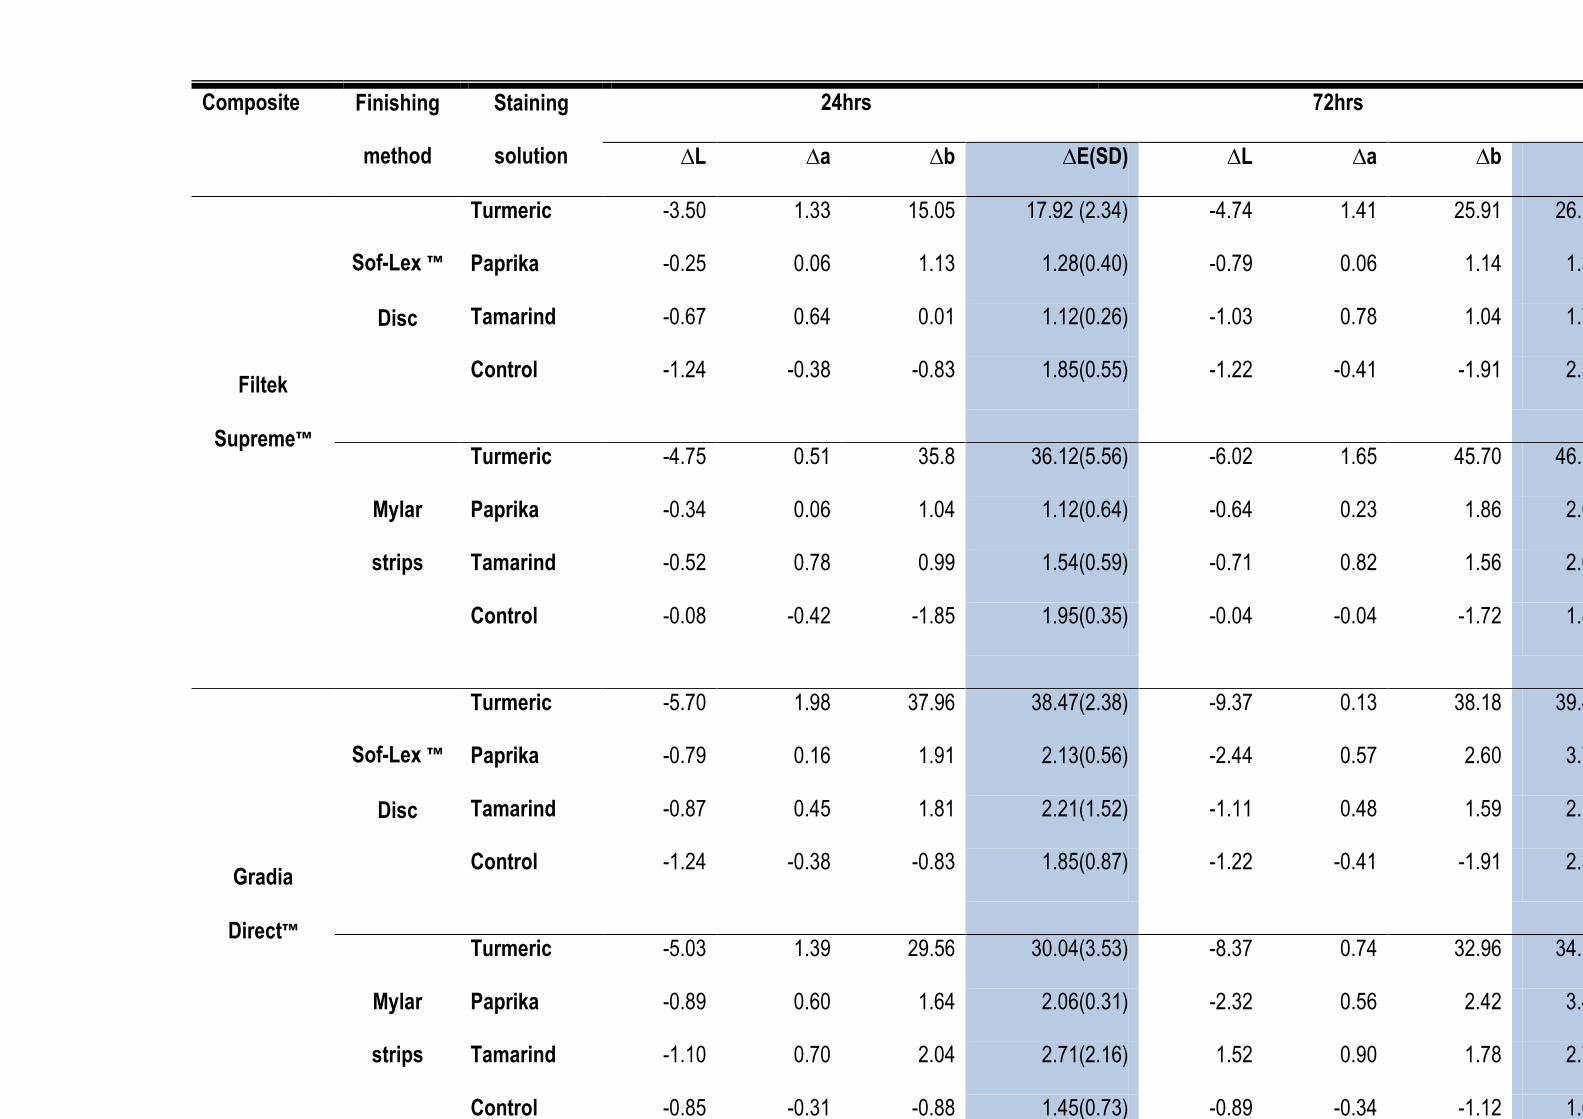
60
Composite Finishing
method
Staining
solution
24hrs 72hrs 168 hours
∆L ∆a ∆b ∆E(SD) ∆L ∆a ∆b ∆E(SD) ∆L ∆a ∆b ∆E(SD)
Filtek
Supreme™
Sof-Lex ™
Disc
Turmeric -3.50 1.33 15.05 17.92 (2.34) -4.74 1.41 25.91 26.38(1.91) -10.41 9.38 35.21 39.24(1.34)
Paprika -0.25 0.06 1.13 1.28(0.40) -0.79 0.06 1.14 1.39(0.41) -1.28 0.34 3.24 3.23(0.59)
Tamarind -0.67 0.64 0.01 1.12(0.26) -1.03 0.78 1.04 1.78(0.27) -2.72 1.2 0.05 3.07(0.18)
Control -1.24 -0.38 -0.83 1.85(0.55) -1.22 -0.41 -1.91 2.39(0.59) -2.58 -0.21 -1.03 2.85(0.67)
Mylar
strips
Turmeric -4.75 0.51 35.8 36.12(5.56) -6.02 1.65 45.70 46.14(3.81) -12.49 13.74 51.58 54.93(1.20)
Paprika -0.34 0.06 1.04 1.12(0.64) -0.64 0.23 1.86 2.03(0.62) -1.99 0.26 2.48 3.21(0.54)
Tamarind -0.52 0.78 0.99 1.54(0.59) -0.71 0.82 1.56 2.00(0.55) -2.97 1.90 1.05 3.70(0.56)
Control -0.08 -0.42 -1.85 1.95(0.35) -0.04 -0.04 -1.72 1.82(0.78) -1.056 -0.99 -2.67 3.11(0.56)
Gradia
Direct™
Sof-Lex ™
Disc
Turmeric -5.70 1.98 37.96 38.47(2.38) -9.37 0.13 38.18 39.47(3.38) -14.23 6.46 46.78 49.32(2.79)
Paprika -0.79 0.16 1.91 2.13(0.56) -2.44 0.57 2.60 3.71(0.62) -3.31 1.16 0.76 3.72(1.02)
Tamarind -0.87 0.45 1.81 2.21(1.52) -1.11 0.48 1.59 2.12(0.69) -4.19 1.70 2.81 5.42(0.93)
Control -1.24 -0.38 -0.83 1.85(0.87) -1.22 -0.41 -1.91 2.39(0.74) -2.58 -0.21 -1.03 2.85(1.01)
Mylar
strips
Turmeric -5.03 1.39 29.56 30.04(3.53) -8.37 0.74 32.96 34.32(4.27) -15.35 1.73 51.75 55.25(1.08)
Paprika -0.89 0.60 1.64 2.06(0.31) -2.32 0.56 2.42 3.45(0.70) -2.51 0.37 2.52 3.61(0.49)
Tamarind -1.10 0.70 2.04 2.71(2.16) 1.52 0.90 1.78 2.70(1.09) -4.62 0.81 2.94 5.70(1.02)
Control -0.85 -0.31 -0.88 1.45(0.73) -0.89 -0.34 -1.12 1.69(0.46) -1.29 -0.60 -0.14 2.17(0.55)
Table 6.1: Means and standard deviations (Sd) of colour changes (∆ E) and L*, a*, b* values of composite resins tested after immersion in the staining solutions over the period of 24,72 and 168 hours.
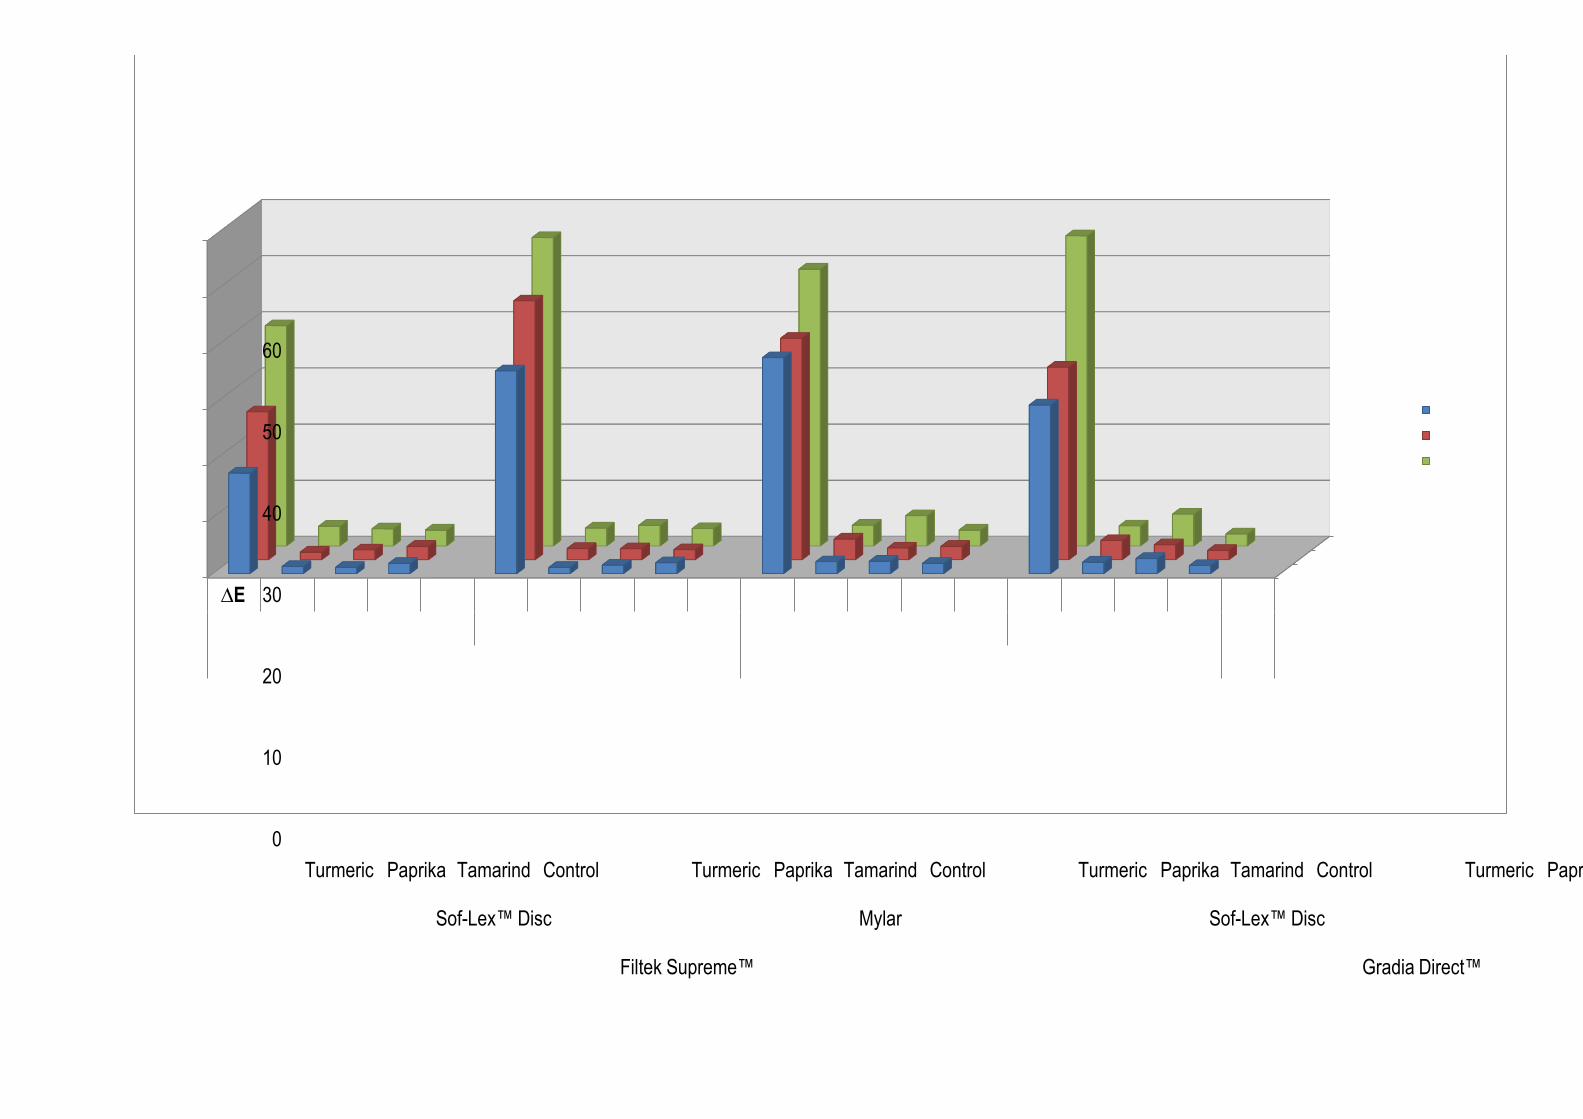
61
Figure 6.1: Mean colour changes ( ∆E) of specimens immersed in turmeric, paprika, tamarind and control solutions by type of composite and finishing methods.
24 Hours
168 Hours
0
10
20
30
40
50
60
Turmeric Paprika Tamarind Control Turmeric Paprika Tamarind Control Turmeric Paprika Tamarind Control Turmeric Paprika Tamarind Control
Sof-Lex™ Disc Mylar Sof-Lex™ Disc Mylar
Filtek Supreme™ Gradia Direct™
∆E 24 Hours
72 Hours
168 Hours

62
(A) (B)
(C) (D)
Figure 6.2: Mean colour changes ∆E of specimens immersed in turmeric (A), paprika (B), tamarind(C) and control (D) solution (expanded scale).
0
10
20
30
40
50
60
0 24 48 72 96 120 144 168 192
∆E
Hours
Turmeric
Filtek Supreme™ Soflex
Filtek Supreme™ Mylar
Gradia Direct™ Soflex
Gradia Direct™ Mylar
0
0.5
1
1.5
2
2.5
3
3.5
4
0 24 48 72 96 120 144 168 192
∆E
Hours
Paprika
Filtek Supreme™ Soflex
Filtek Supreme™ Mylar
Gradia Direct™ Soflex
Gradia Direct™ Mylar
0
1
2
3
4
5
6
0 24 48 72 96 120 144 168 192
∆E
Hours
Tamarind
Filtek Supreme™ Sof-Lex™
Filtek Supreme™ Mylar
Gradia Direct™ Sof-Lex™
Gradia Direct™ Mylar
0
0.5
1
1.5
2
2.5
3
3.5
0 24 48 72 96 120 144 168 192
∆E
Hours
Control
Filtek Supreme™ Sof-Lex™
Filtek Supreme™ Mylar
Gradia Direct™ Sof-Lex™
Gradia Direct™ Mylar

63
6.2 Effect of Immersion Time on Colour Stability of Composite resins.
After immersion in the staining solutions, it was observed that the colour differences (ΔE)
increased in all composite resins over the experimental period, regardless of staining solution. The most
intense colour change occurred in the first 24 hours and the ΔE values were noted to increase with time.
According to repeated measures variance test (Table 6.2), the colour changes (ΔE) values as the
function of immersion time were significantly influenced by the types of materials and staining solutions.
Table 6.2: Repeated Measure Analysis ANOVA (Within Subject Analysis).
As described in the previous section, a diverse trend in the ΔE values was observed in different
materials immersed in different staining solutions. The details of performance of each staining solution
and materials tested can be seen more clearly in the expanded scale graph (Figure 6.2).
Source
Type III Sum of
Squares df
Mean
Square F Sig.
Hours 1248.527 1 1248.527 769.166 .000
Hours * Material 36.395 1 36.395 22.422 .000
Hours * Finishing 2.114 1 2.114 1.302 .258
Hours * Staining 1835.244 3 611.748 376.873 .000
Hours * Material * Finishing .221 1 .221 .136 .713
Hours * Material * Staining 71.503 3 23.834 14.683 .000
Hours * Finishing * Staining 11.694 3 3.898 2.401 .076
Hours * Material * Finishing
* Staining
5.632 3 1.877 1.157 .333

64
6.3 Effects of Finishing Methods and Type of Composite resins on Colour Stability of
Composite resins.
Data analysis in Table 6.3 showed that the colour change (ΔE) values were significantly
influenced by the types of materials, finishing methods and staining solutions. Significant main effects
and interactions were observed for all parameters.
Table 6.3: Repeated Measure Analysis ANOVA (Between Subject Analysis)
Source
Type III Sum of
Squares df Mean Square F Sig.
Material 94.665 1 94.665 17.198 .000
Finishing 167.184 1 167.184 30.373 .000
Staining 56856.869 3 18952.290 3443.174 .000
Material * Finishing 762.660 1 762.660 138.557 .000
Material * Staining 120.248 3 40.083 7.282 .000
Finishing * Staining 329.536 3 109.845 19.956 .000
Material * Finishing *
Staining
1925.589 3 641.863 116.611 .000
Changes in colour were significant among the type of composites. Post hoc testing confirmed
that Gradia Direct™ revealed statistically significant higher colour change values than Filtek Supreme™
(p<0.05). With respect to finishing methods, mylar strips finished specimens showed more colour
differences than Sof-Lex™ discs polished specimens. (Figure 6.3)

65
(A) (B)
(c) (D)
Figure 6.3: Mean colour changes ∆E of specimens immersed in turmeric(A), paprika(B), tamarind(C) and control solutions(D) by types of composite and finishing methods.
0
10
20
30
40
50
60
Sof-Lex™ Disc
Mylar Sof-Lex™ Disc
Mylar
Filtek Supreme™ Gradia Direct™
∆ E
Turmeric
24 hours
72 hours
168 hours
0.00
0.50
1.00
1.50
2.00
2.50
3.00
3.50
4.00
Sof-Lex™ Disc
Mylar Sof-Lex™ Disc
Mylar
Filtek Supreme™ Gradia Direct™
∆ E
Paprika
24 hours
72 hours
168 hours
0
1
2
3
4
5
6
Sof-Lex™ Disc
Mylar Sof-Lex™ Disc
Mylar
Filtek Supreme™ Gradia Direct™
∆ E
Tamarind
24 hours
72 hours
168 hours
0.00
0.50
1.00
1.50
2.00
2.50
3.00
3.50
Sof-Lex™ Disc
Mylar Sof-Lex™ Disc
Mylar
Filtek Supreme™ Gradia Direct™
∆E
Control
24 hours
72 hours
168 hours
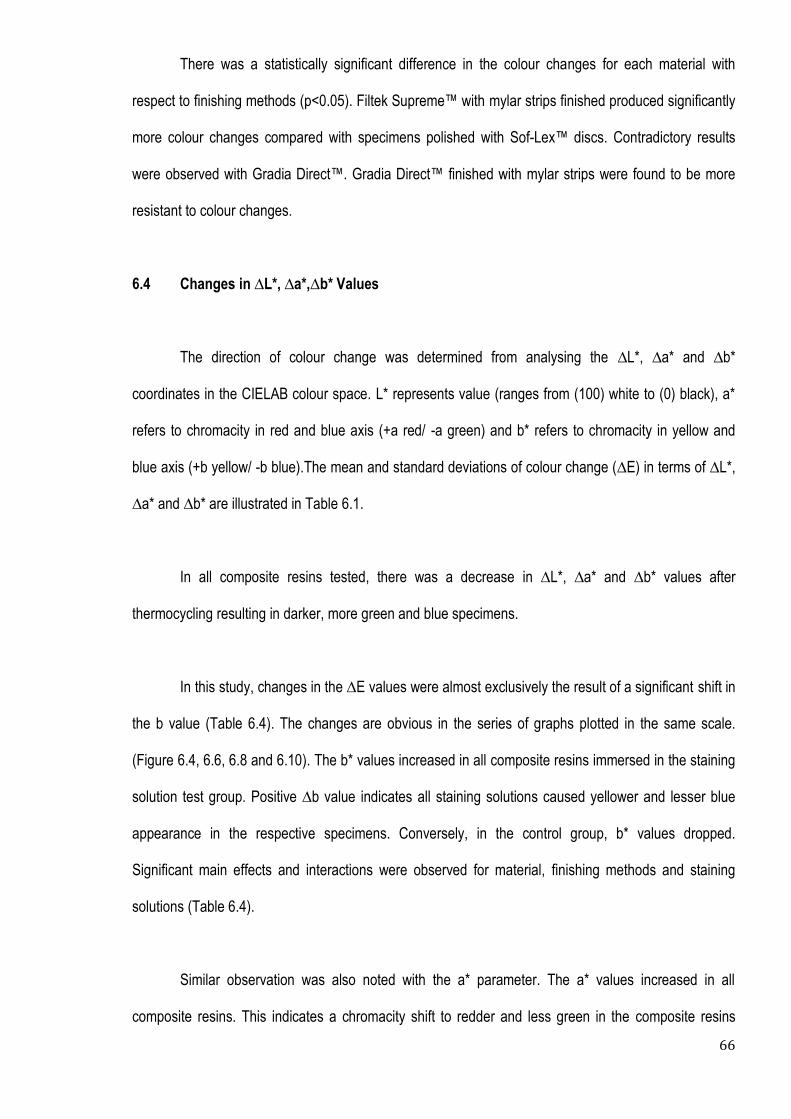
66
There was a statistically significant difference in the colour changes for each material with
respect to finishing methods (p<0.05). Filtek Supreme™ with mylar strips finished produced significantly
more colour changes compared with specimens polished with Sof-Lex™ discs. Contradictory results
were observed with Gradia Direct™. Gradia Direct™ finished with mylar strips were found to be more
resistant to colour changes.
6.4 Changes in ∆L*, ∆a*,∆b* Values
The direction of colour change was determined from analysing the ∆L*, ∆a* and ∆b*
coordinates in the CIELAB colour space. L* represents value (ranges from (100) white to (0) black), a*
refers to chromacity in red and blue axis (+a red/ -a green) and b* refers to chromacity in yellow and
blue axis (+b yellow/ -b blue).The mean and standard deviations of colour change (∆E) in terms of ∆L*,
∆a* and ∆b* are illustrated in Table 6.1.
In all composite resins tested, there was a decrease in ∆L*, ∆a* and ∆b* values after
thermocycling resulting in darker, more green and blue specimens.
In this study, changes in the ∆E values were almost exclusively the result of a significant shift in
the b value (Table 6.4). The changes are obvious in the series of graphs plotted in the same scale.
(Figure 6.4, 6.6, 6.8 and 6.10). The b* values increased in all composite resins immersed in the staining
solution test group. Positive ∆b value indicates all staining solutions caused yellower and lesser blue
appearance in the respective specimens. Conversely, in the control group, b* values dropped.
Significant main effects and interactions were observed for material, finishing methods and staining
solutions (Table 6.4).
Similar observation was also noted with the a* parameter. The a* values increased in all
composite resins. This indicates a chromacity shift to redder and less green in the composite resins
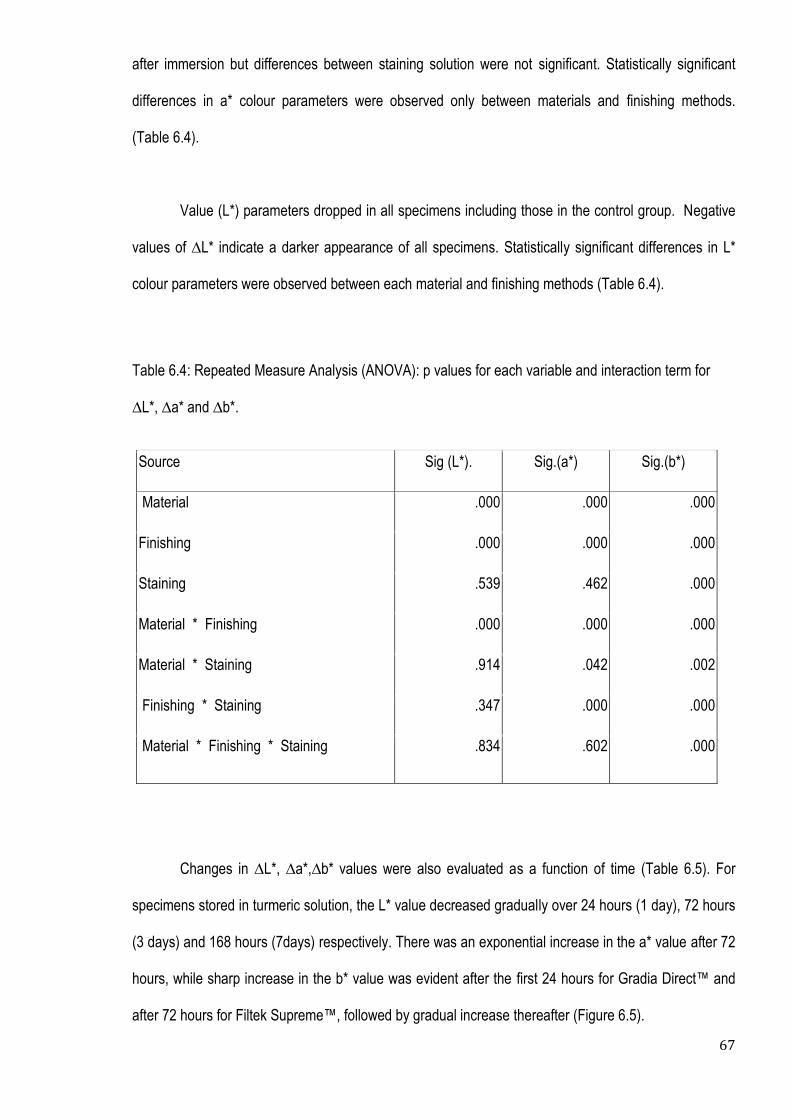
67
after immersion but differences between staining solution were not significant. Statistically significant
differences in a* colour parameters were observed only between materials and finishing methods.
(Table 6.4).
Value (L*) parameters dropped in all specimens including those in the control group. Negative
values of ∆L* indicate a darker appearance of all specimens. Statistically significant differences in L*
colour parameters were observed between each material and finishing methods (Table 6.4).
Table 6.4: Repeated Measure Analysis (ANOVA): p values for each variable and interaction term for
∆L*, ∆a* and ∆b*.
Source Sig (L*). Sig.(a*) Sig.(b*)
Material .000 .000 .000
Finishing .000 .000 .000
Staining .539 .462 .000
Material * Finishing .000 .000 .000
Material * Staining .914 .042 .002
Finishing * Staining .347 .000 .000
Material * Finishing * Staining .834 .602 .000
Changes in ∆L*, ∆a*,∆b* values were also evaluated as a function of time (Table 6.5). For
specimens stored in turmeric solution, the L* value decreased gradually over 24 hours (1 day), 72 hours
(3 days) and 168 hours (7days) respectively. There was an exponential increase in the a* value after 72
hours, while sharp increase in the b* value was evident after the first 24 hours for Gradia Direct™ and
after 72 hours for Filtek Supreme™, followed by gradual increase thereafter (Figure 6.5).

68
Paprika also presented gradual decrease in L* value. An inverse relationship was noted in the
b* value. A different trend was observed in the a* value. For Filtek Supreme™, a dip in the value was
shown at 24 hours before an intense increase thereafter. While for Gradia Direct™, there was gradual
rise in the a* value up throughout the period of investigation. (Figure 6.7).
Table 6.5: Repeated Measure Analysis (ANOVA): p values for each variable and interaction term for
∆L*, ∆a* and ∆b* as a function of time.
Source Sig (L*). Sig.(a*) Sig.(b*)
Hour .000 .000 .000
Hour * Material .000 .000 .000
Hour * Finishing .730 .398 .000
Hour * Staining .000 .000 .000
Hour * Material * Finishing .517 .000 .000
Hour * Material * Staining .205 .000 .000
Hour * Finishing * Staining .314 .022 .000
Hour * Material * Finishing * Staining .814 .000 .000
In the tamarind group, a sharp decline was recorded within L* parameters especially after 72
hours in all specimens. The opposite tendency was shown in a*. Exponential increase in the parameter
was observed after 72 hours. The colour parameter b* values changed steadily throughout the period of
investigation (Figure 6.9).

69
A different trend of colour changes was observed in the control group. Filtek Supreme™ caused
gradual decrease in the L* value, while Gradia Direct™ produced a distinct drop after 24 hours. Both
Filtek Supreme™ and Gradia Direct™ created a subtle increase in the b* value throughout the period of
the study. For the a* value, dramatic increase was seen in the first 24 hours in Gradia Direct™, while in
Filtek Supreme™, a dip in the value was shown at 24 hours before a gradual increase thereafter.
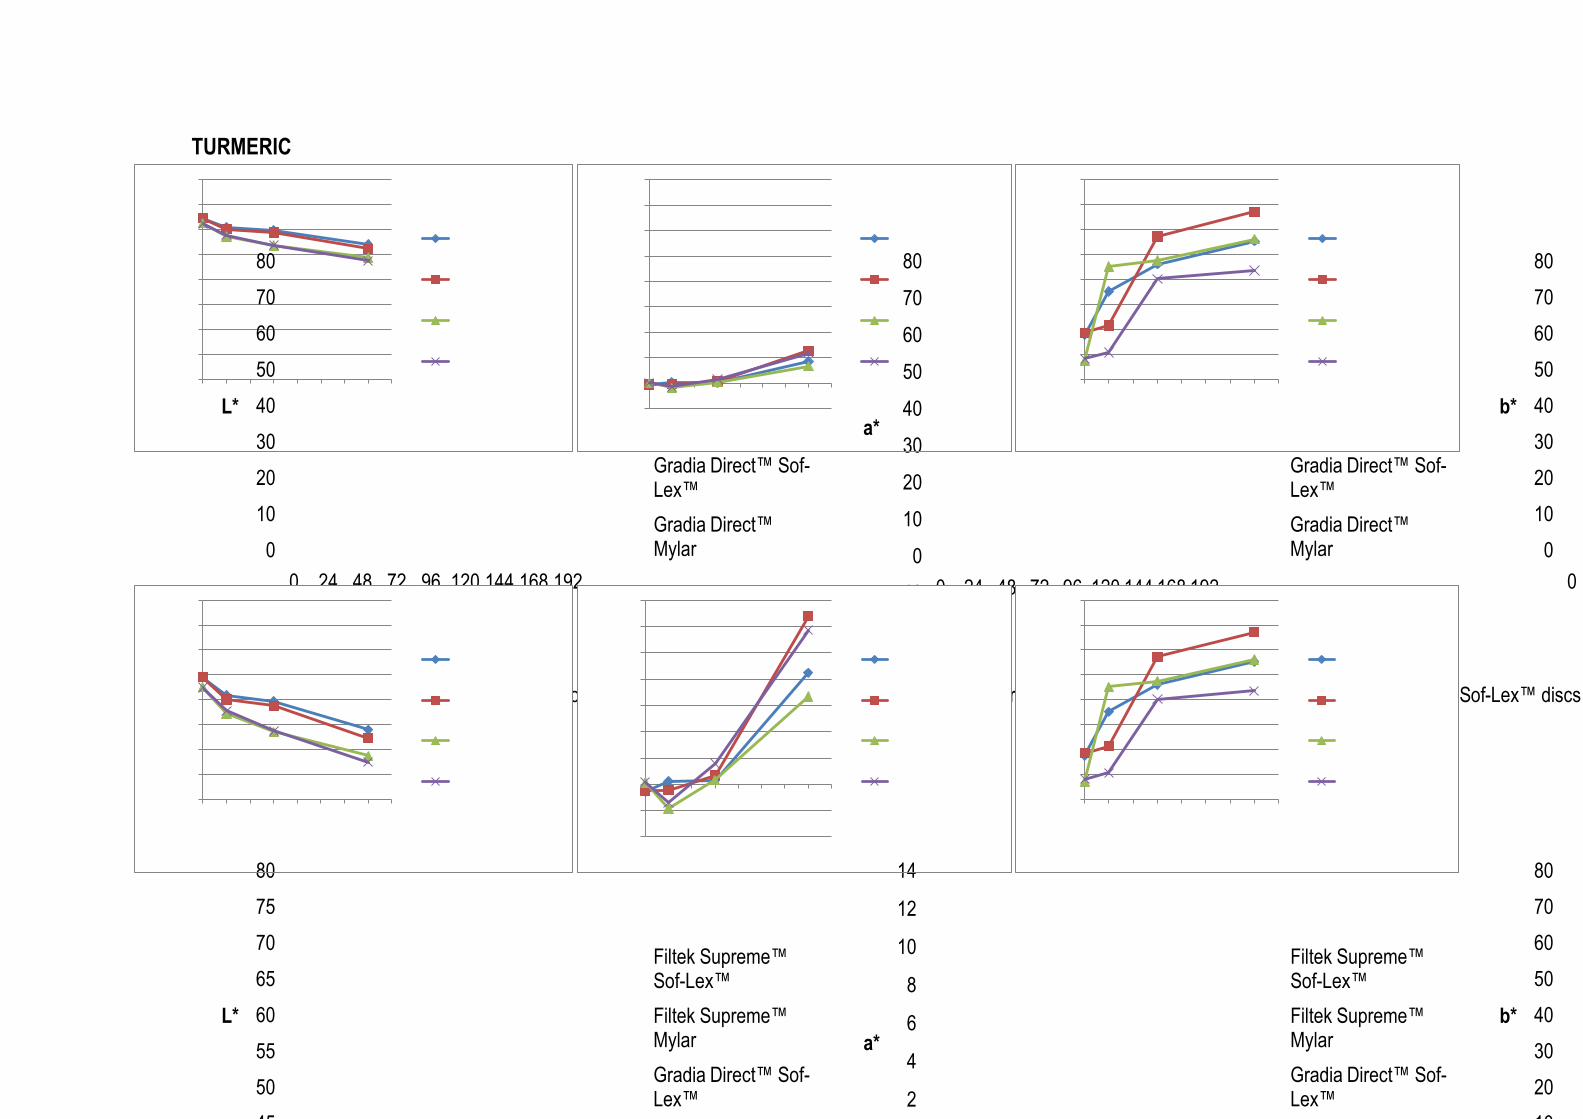
70
TURMERIC
Figure 6.4: Means of L*, a*, b* coordinates of specimens immersed in turmeric solution for Filtek Supreme™ and Gradia Direct™ finished by either Sof-Lex™ discs or mylar strips (For standard deviations, please refer Table 6.1).
Figure 6.5: Means of L*, a*, b* coordinates of specimens immersed in turmeric solution for Filtek Supreme™ and Gradia Direct™ finished by either Sof-Lex™ discs or mylar strips in expanded scale (For standard deviations, please refer Table 6.1).
0
10
20
30
40
50
60
70
80
0 24 48 72 96 120 144 168 192
L*
Hours
Filtek Supreme™ Sof-Lex™
Filtek Supreme™ Mylar
Gradia Direct™ Sof-Lex™
Gradia Direct™ Mylar
-10
0
10
20
30
40
50
60
70
80
0 24 48 72 96 120 144 168 192
a*
Hours
Filtek Supreme™ Sof-Lex™
Filtek Supreme™ Mylar
Gradia Direct™ Sof-Lex™
Gradia Direct™ Mylar 0
10
20
30
40
50
60
70
80
0 24 48 72 96 120 144 168 192
b*
Hours
Filtek Supreme™ Sof-Lex™
Filtek Supreme™ Mylar
Gradia Direct™ Sof-Lex™
Gradia Direct™ Mylar
40
45
50
55
60
65
70
75
80
0 24 48 72 96 120 144 168 192
L*
Hours
Filtek Supreme™ Sof-Lex™
Filtek Supreme™ Mylar
Gradia Direct™ Sof-Lex™
Gradia Direct™ Mylar
-4
-2
0
2
4
6
8
10
12
14
0 24 48 72 96 120 144 168 192
a*
Hours
Filtek Supreme™ Sof-Lex™
Filtek Supreme™ Mylar
Gradia Direct™ Sof-Lex™
Gradia Direct™ Mylar 0
10
20
30
40
50
60
70
80
0 24 48 72 96 120 144 168 192
b*
Hours
Filtek Supreme™ Sof-Lex™
Filtek Supreme™ Mylar
Gradia Direct™ Sof-Lex™
Gradia Direct™ Mylar

71
PAPRIKA
Figure 6.6: Means of L*, a*, b* coordinates of specimens immersed in paprika solution for Filtek Supreme™ and Gradia Direct™ finished by either Sof-Lex™ discs or mylar strips (For standard deviations, please refer Table 6.1).
Figure 6.7: Means of L*, a*, b* coordinates of specimens immersed in paprika solution for Filtek Supreme™ and Gradia Direct™ finished by either Sof-Lex™ discs or mylar strips in expanded scale (For standard deviations, please refer Table 6.1).
0
10
20
30
40
50
60
70
80
0 24 48 72 96 120 144 168 192
L*
Hours
Filtek Supreme™ Sof-Lex™
Filtek Supreme™ Mylar
Gradia Direct™ Sof-Lex™
Gradia Direct™ Mylar
-10
0
10
20
30
40
50
60
70
80
0 24 48 72 96 120 144 168 192
a*
Hours
Filtek Supreme™ Sof-Lex™
Filtek Supreme™ Mylar
Gradia Direct™ Sof-Lex™
Gradia Direct™ Mylar 0
10
20
30
40
50
60
70
80
0 24 48 72 96 120 144 168 192
b*
Hours
Filtek Supreme™ Sof-Lex™
Filtek Supreme™ Mylar
Gradia Direct™ Sof-Lex™
Gradia Direct™ Mylar
58
59
60
61
62
63
64
65
66
0 24 48 72 96 120 144 168 192
L*
Hours
Filtek Supreme™ Sof-Lex™
Filtek Supreme™ Mylar
Gradia Direct™ Sof-Lex™
Gradia Direct™ Mylar
-1.5
-1
-0.5
0
0.5
1
1.5
0 24 48 72 96 120 144 168 192
a*
Hours
Filtek Supreme™ Sof-Lex™
Filtek Supreme™ Mylar
Gradia Direct™ Sof-Lex™
Gradia Direct™ Mylar 0
5
10
15
20
25
30
0 24 48 72 96 120 144 168 192
b*
hours
Filtek Supreme™ Sof-Lex™
Filtek Supreme™ Mylar
Gradia Direct™ Sof-Lex™
Gradia Direct™ Mylar

72
TAMARIND
Figure 6.8: Means of L*, a*, b* coordinates of specimens immersed in tamarind solution for Filtek Supreme™ and Gradia Direct™ finished by either Sof-Lex™ discs or mylar strips (For standard deviations, please refer Table 6.1).
Figure 6.9: Means of L*, a*, b* coordinates of specimens immersed in tamarind solution for Filtek Supreme™ and Gradia Direct™ finished by either Sof-Lex™ discs or mylar strips in expanded scale (For standard deviations, please refer Table 6.1).
0
10
20
30
40
50
60
70
80
0 24 48 72 96 120 144 168 192
L*
Hours
Filtek Supreme™ Sof-Lex™
Filtek Supreme™ Mylar
Gradia Direct™ Sof-Lex™
Gradia Direct™ Mylar
-10
0
10
20
30
40
50
60
70
80
0 24 48 72 96 120 144 168 192
a*
Hours
Filtek Supreme™ Sof-Lex™
Filtek Supreme™ Mylar
Gradia Direct™ Sof-Lex™
Gradia Direct™ Mylar 0
10
20
30
40
50
60
70
80
0 24 48 72 96 120 144 168 192
b*
Hours
Filtek Supreme™ Sof-Lex™
Filtek Supreme™ Mylar
Gradia Direct™ Sof-Lex™
Gradia Direct™ Mylar
56
57
58
59
60
61
62
63
64
65
66
0 24 48 72 96 120 144 168 192
L*
Hours
Filtek Supreme™ Sof-Lex™
Filtek Supreme™ Mylar
Gradia Direct™ Sof-Lex™
Gradia Direct™ Mylar
-1
-0.5
0
0.5
1
1.5
2
0 24 48 72 96 120 144 168 192
a*
Hours
Filtek Supreme™ Sof-Lex™
Filtek Supreme™ Mylar
Gradia Direct™ Sof-Lex™
Gradia Direct™ Mylar 0
5
10
15
20
25
30
0 24 48 72 96 120 144 168 192
b*
Hours
Filtek Supreme™ Sof-Lex™
Filtek Supreme™ Mylar
Gradia Direct™ Sof-Lex™
Gradia Direct™ Mylar

73
CONTROL
Figure 6.10: Means of L*, a*, b* coordinates of specimens immersed in control solution for Filtek Supreme and Gradia Direct finished by either Sof-Lex™ discs or mylar strips (For standard deviations, please refer Table 6.1).
Figure 6.11: Means of L*, a*, b* coordinates of specimens immersed in control solution for Filtek Supreme and Gradia Direct finished by either Sof-Lex™ discs or mylar strips in expanded scale (For standard deviations, please refer Table 6.1).
0
10
20
30
40
50
60
70
80
0 24 48 72 96 120 144 168 192
L*
Hours
Filtek Supreme™ Sof-Lex™
Filtek Supreme™ Mylar
Gradia Direct™ Sof-Lex™
Gradia Direct™ Mylar
-10
0
10
20
30
40
50
60
70
80
0 24 48 72 96 120 144 168 192
a*
Hours
Filtek Supreme™ Sof-Lex™
Filtek Supreme Mylar
Gradia Direct™ Sof-Lex™
Gradia direct Mylar0
10
20
30
40
50
60
70
80
0 24 48 72 96 120 144 168 192
b*
Hours
Filtek Supreme™ Sof-Lex™
Filtek Supreme™ Mylar
Gradia Direct™ Sof-Lex™
Gradia Direct™ Mylar
60
60.5
61
61.5
62
62.5
63
63.5
64
64.5
65
65.5
0 24 48 72 96 120 144 168 192
L*
Hours
Filtek Supreme™ Sof-Lex™
Filtek Supreme™ Mylar
Gradia Direct™ Sof-Lex™
Gradia Direct™ Mylar
-1.00
-0.80
-0.60
-0.40
-0.20
0.00
0.20
0.40
0.60
0.80
1.00
1.20
0 24 48 72 96 120 144 168 192
a*
Hours
Filtek Supreme™ Sof-Lex™
Filtek Supreme Mylar
Gradia Direct™ Sof-Lex™
Gradia direct Mylar0
5
10
15
20
25
0 24 48 72 96 120 144 168 192
b*
Hours
Filtek Supreme™ Sof-Lex™
Filtek Supreme™ Mylar
Gradia Direct™ Sof-Lex™
Gradia Direct™ Mylar

74
In this study, the colour changes in two commercially available composite resins (Filtek
Supreme™ and Gradia Direct™) finished with two different methods (Sof-Lex™ discs and mylar strips)
were measured and compared with the values obtained after 24 hours (1 day), 72 hours (3 days) and
168 hours (7days) storage in three different spices solutions (turmeric, paprika and tamarind solutions).
After statistical analysis of the results (Table 6.3) the staining agent was the most significant factor
affecting colour change (F-value=3443), followed by finishing technique (F-value=30.37) and type of
material (F-value=17.90).
7.1 Effect of Spices on Colour Stability of Composite resins.
The first null hypothesis in this study was that there was no significant colour change in each
composite resins tested on exposure to turmeric, paprika and tamarind spices solution. Since there
were statistical differences found among the staining solutions in producing the colour alterations in
composite resins, the first hypothesis was rejected. Colour changes (∆E) in composite resin with
respect to staining solutions can be summarised as follows:
Turmeric: visually perceptible ∆E (∆E > 1) and clinically unacceptable colour deviations (∆E
>3.3) were recorded after 24 hours immersion.
Paprika: visually noticeable (∆E>1) values were exhibited in both composite after 24 hours
storage. However, clinically unacceptable values (∆E>3.3) were not demonstrated until 72 hours (3
days) immersion.
CHAPTER 7
DISCUSSION

75
Tamarind: visually perceptible changes were noted after 24 hours immersion. Nonetheless,
total colour difference (∆E) exceeding clinically unacceptable level (>3.3) was recorded only after 168
hours (7 days) immersion
Turmeric was shown to cause the highest colour changes in both composite resins, regardless
of finishing methods with mean ∆E ranges between 17.92 and 55.25 (Table 6). This finding is in
agreement with the results reported by Stober et al [30]. They investigated colour stability of highly filled
indirect composite resins used as facings in the removable denture. In this study, various beverages
including 0.1% turmeric were used as staining solution. Turmeric solution was found to cause severe
discolouration with total colour difference (∆E>10) after 4 weeks of storage.
With paprika solution, mean colour changes (∆E) values were between 1.12 and 3.72
Tamarind, on the other hand showed mean ∆E ranging between 1.12 and 5.42 (Table 6.1). To the best
of our knowledge, no study has specifically examined the colour stability of composite resins upon
exposure to paprika and tamarind, making findings in this study preliminary in nature. Further in vitro
and in vivo studies are necessary to confirm our results.
The mechanism behind colour alteration of composite resins after immersion in various liquid
beverages has been a subject of great interest in many studies. The absorption and adsorption of
colourant with different polarities found in beverages such as coffee and tea on the surface of composite
resins have been implicated [21]. Discolouration by food dyes (sunset yellow and quinoline yellow) has
also been investigated. Canay et al [169] postulate that these food colourants are soluble in water and
possess electrostatic charges that may be involved in the surface staining of the composite resins. This
result is in contrast to that of Rutkunas et al [37] which found that water soluble dyes with electrostatic
forces may not be significant in the discolouration of composite resins due to the hydrophobic nature of
the composite resins.
76
The role of poly-phenols play in the dietary constituents as a causative agent in dental staining
has generated great interest in many researchers. Poly-phenols represent a variety of compounds,
mostly derivatives and/or isomers of flavonoids and tannins including catechins and anthocyanidin that
occur in plants [258, 259]. This chemical compound is commonly found in beverages eg tea, wine,
legumes, fruits and cereal [258, 259]. It has also been found that poly-phenols have high affinity with
proteins. This is confirmed by a study conducted by Proctor et al [260], who investigated the interactions
of dietary poly-phenols with salivary protein. It was found that there was increased binding of poly-
phenols with hydroxyapatite in the presence of proline rich proteins.
The literature has shown that various pigment compounds are responsible for the colour of the
spices used in this study. For turmeric, curcuma is the principal pigment that imparts a deep orange
colour. Three compounds (capsanthin, capsorbin and b-carotene) are responsible for the reddish tinge
in paprika, while flavonoid is the major brown/black colour pigment in tamarind. All these compounds
have a poly-phenol structure, which is non polar and cannot dissolve in water molecules due to the high
polarity of water molecules [258]. They are, therefore, hydrophobic. The degree of polarities of these
spices varies between manufacturers and is beyond the scope of this thesis. However, the important
aspect with regard to polarities is that whether the polarity of these compounds is compatible with the
polymer matrix of composite resins; which is not known. Therefore, further investigation is required to
ascertain the compatibility of the colourant in the spices and composite resins as this may determine the
mechanism of discolouration of composite resins by the spices studied.
Discolouration of tooth-coloured, resin-based materials may be caused by intrinsic and extrinsic
factors [163]. Staining by adsorption or absorption of colourants as a result of contamination from
exogenous sources has been described as extrinsic discolouration. Studies have shown that extrinsic
discolouration maybe related to surface morphology. In search of the mechanism of discolouration of
composite resins, another group of investigators, have evaluated the surface morphology of composite
resins after immersion in coffee, tea and wine under scanning electron microscopy [261]. It was found

77
that surfaces of composite resins immersed in wine displayed changes in the surface texture and
presence of surface cracks, which in turn facilitate the adsorption of stains. Surface degradation of
composite resins in the presence of low pH has also been shown by Vilalta et al [35]. The pH of
tamarind used in this study was 5.6 (based on the manufacturer‟s description). Whether low pH in the
tamarind solution produces similar surface changes warrants further investigation.
7.2 Effect of Immersion Time on Colour Stability of Composite resins.
In concert with observations in previous studies, all composite specimens tested in this
investigation exhibited more intense colour changes as the immersion time increased [11, 176]. Most
intense colour changes occurred within the first 24 hours of immersion. This may be related to the water
absorption behaviour of composite resins. Earlier studies indicated that composite resins displayed the
highest water sorption rates in the first 24 hours. This water intake pattern may facilitate the ingress of
the pigments in the staining solution leading to discolouration of the material [113, 262-266].
Assuming an average person spends approximately 60 minutes (1hour) per day eating and
drinking [284], the immersion time (24 hours, 72 hours and 168 hours) used in this study simulates the
equivalent number of days of the composite resins restorations exposure to dietary staining. The pattern
of colour changes in composite resins observed in this study may reflect the potential staining
susceptibility of the composite resins after 24, 72 and 168 days of dietary intake containing turmeric,
paprika or tamarind spices.

78
7.3 Effects of Finishing Methods and Type of Composite resin on the Colour Stability of
Composite resins.
The other null hypotheses tested in this study were that there was no difference in the colour of
composite resins 1) among two different finishing methods and 2) among two different types of
composite resins
In this study, Sof-Lex™ discs and mylar strips were compared. The Sof-Lex™ discs polishing
method produced lower colour changes (∆E) than the mylar strips. However, the effect of finishing
method on the colour stability of composite resins appeared to be dependent on the type of composite
resins. Filtek Supreme™ with mylar strips finished generally resulted in significantly more colour
changes compared with specimens polished with Sof-Lex™ discs. Favourable results in the colour
stability of Filtek Supreme™ polished with Sof-Lex™ discs has also been demonstrated by several
authors [154, 162, 182]. The effect of mylar strips finish on the staining susceptibility of Filtek
Supreme™ has also been evaluated. Ergü cu et al [138] has investigated the effect of different finishing
methods (PoGo™, OptraPol™ and mylar strips) on the colour stability of nano-composite resins
including Filtek Supreme™ upon exposure to a coffee. Compared to PoGo™ and OptraPol™, mylar
strips finished nano-composite resins showed the most intense staining. This discolouration may be
attributed to the presence of a resin-rich surface produced by mylar strips. Therefore, the authors
advocated the removal of this superficial resin layer. This result is also supported by other studies [28,
144, 146, 148, 267].
In contrast, Gradia Direct™ finished with mylar strips were found to be more resistant to colour
changes. In light of these findings, the second and third hypotheses of this study were rejected.

79
The results of this study seem to suggest the existence of different effects of different finishing
methods on the composites tested. This effect is thought to be related to differences in surface quality of
composite resins obtained after different finishing techniques.
The relationship between surface roughness and stain resistance of composite resins has been
established in numerous authors [142, 155, 162, 268-270]. Generally, a rougher surface tends to cause
higher discolouration of the composite resins. The surface texture of composite resins may also
influence the optical properties of the material by affecting the degree of scattering and reflection of light
on the material [271]
Previous studies have shown that a smooth surface was achieved when polymerized against a
mylar strips [140, 143, 147, 272-274]. This observation may explain the lower colour changes found in
Gradia Direct™ cured against mylar strips.
With regard to Sof-Lex™ discs polishing system, many investigators concluded that the
polishing method produce favourable surface roughness for most composite resins tested. Koh and
Neiva [275] evaluated the differences in the surface roughness of both Gradia Direct and Filtek
Supreme™ using four polishing systems: PoGo™/Enhance™ (DENTSPLY/Caulk), Sof-Lex™ discs
(3M ESPE), Astropol™ (Ivoclar Vivadent), and Optidisc™ (KerrHawe). Sof-Lex™ discs were found to
provide the smoothest final surface when used with either composite. In other studies, evaluation of
surface roughness by profilometry showed the lower Ra value for Filtek Supreme™ polished with Sof-
Lex™ discs polishing system compared with other polishing methods [140, 150, 155, 162, 268, 269,
276, 277]. Ra values reported were mostly below 0.2 μm. Further observation by scanning electron
microscope revealed a homogenous surface with fewer surface irregularities when combination of Filtek
Supreme™ and Sof-Lex™ discs polishing system were used. [150, 162, 268, 276, 277]. The lower
discolouration found in the Filtek Supreme™ polished with Sof -Lex™ group could be attributed to the
smooth final surface of the restoration as has been shown in the above studies.
80
.
Generally, composite resins consist of three main components: (1) inorganic filler particles, (2)
resin matrix and (3) coupling agent that chemically bonds the inorganic filler to the resin matrix [109].
Obviously, properties including surface morphology and colour stability of the composite resins are
dependent upon these three basic components.
Variables such as size and amount of filler particles may affect the surface morphology of
composite resins. Both Filtek Supreme™ and Gradia Direct™ have approximately similar filler loading;
72.5% and 77% by weight respectively (Table 5.1). The only difference between these products is the
average particle size. Filtek Supreme™ contains nanomer particles with average particle size of 2-20nm
filled in the interstitial spaces between nano-clusters (formed by individual primary nano-particles
bonded between them by weak intermolecular forces into spherical agglomerates) [12]. Gradia Direct™,
on the other hand, is composed of micro-fined filler particles and pre-polymerised resin filler with
average particle size of about 0.85 µ m [134].
During finishing and polishing procedures, there is a tendency for filler particles to debond from
the matrix creating voids and defects on the surface [125,144, 276]. The larger the filler particle, the
larger the surface defect created, hence the rougher the surface. The average size of filler particles in
Gradia Direct™ is 0.85 µm (850nm) - significantly larger than the average particle size (2-20nm) in
nano-filled Filtek Supreme™. Furthermore, being a micro-hybrid material, Gradia Direct™ may contain
fractions of substantially large filler particle size although the reported average particle size is 0.85 µ m.
The presence of pre-polymerised filler particles in Gradia Direct™ may add to the intricacy of the filler
content. The pre-polymerised filler particles are typically larger than the filler particle and are being
added into the resin matrix to increase the filler loading of the material. The interface between pre-
polymerised fillers and the resin matrix is critical as breakdown of the bond at this interface during
polishing may lead to the detachment of the larger pre-polymerised filler leaving large craters or defects
resulting in rough surfaces.

81
Nevertheless, one can argue that the average size of nano-clusters in Filtek Supreme™ (0.6-
1.0 micron) is similar to that of the average particle size in Gradia Direct™. The manufacturer claims
that through modification of the sintering process, the nano-cluster is made up of loosely agglomerated
nano-particles. These nano-particles in the agglomerates may break away into the matrix during
polishing instead of plucking of the agglomerates that leaves void in the matrix [12].
Therefore, the differences in the effect of Sof-Lex™ discs on Gradia Direct™ and Filtek
Supreme™ as seen in this study may be expected. On the other hand, the presence of particles of
differences sizes and shapes in micro-hybrid composite resins such as Gradia Direct™ may allow
easier packing during placement and extrusion of material under mylar strips, hence achieving a
smoother surface compare to the spherical filler particles in Filtek Supreme™ [268] which may
contribute to the lower colour changes in the Gradia Direct™ with mylar strips finished group.
Apart from filler content, the resin matrix of composite resins may also influence the colour
stability of composite resins. The influence of resin monomers on the colour stability of composite resins
are associated with the hydrophobicity [11, 169] and water absorption properties of the resin monomers
[70, 114]. A study on water absorption of composite resins showed that the highest water intake of
composite resins occurred within the first 24 hours of immersion [170]. The intense colour changes in
the composite resins during the first 24 hours, as demonstrated in this study, may be related to this
pattern of water sorption.
It has been shown that urethane dimethacrylate (UDMA) exhibits less staining compared with
bisphenol A-glycidyl methacrylate (Bis-GMA), which is the common resin monomers used in composite
resins [70]. Conversely, composite resins with hydrophilic monomers e.g. Tri-ethylene glycol
dimethacrylate TEDGMA [170] exhibits higher water sorption [174], and therefore permits penetration of
any hydrophilic colourant into the resin matrix. Filtek Supreme™ contains Bis-GMA, UDMA, TEGDMA,

82
and Bis-EMA(6) resins [135]. While Gradia Direct™ consists of a mixture of urethane dimethacrylate
(UDMA) and dimethacrylate co-monomers [134]. According to the manufacturer [134], due to the
ongoing discussions on the (possible) side effects of Bis-GMA it is GC Corporation‟s policy not to use
Bis-GMA in their commercial products. From the aforementioned discussion, based on the resin
monomers system in each material, it could be speculated that Gradia Direct™ may be more resistant
to colour changes due to the hydrophobicity of the resin matrix. However, in this study, Filtek
Supreme™ displayed less colour change on exposure to spices. This finding seems to suggest that due
to the heterogenous nature of composite resins, it is difficult to predict the colour stability of the material
based solely on the composition of the material. On the other hand, the non-polar hydrophobic nature of
the pigments in the spices as discussed above may contribute to the discolouration of the more
hydropobobic Gradia Direct™.

83
7.4 Limitations of the study
The limitations of this study include the in-vitro use of a spectrophotometer to evaluate colour
differences of only two types of composite resins material. The specimens used in this study had flat
surfaces. In clinical settings, however, various anatomical features including grooves and pits may be
present and this may complicate the polishing procedure. Moreover, the materials in the oral
environment are subjected to various exogenous and endogenous conditions that may modify the
outcome of the material. Due to the in-vitro nature of the study and the complexity of the intraoral
environment, the data ought to be interpreted cautiously when extrapolating to clinical settings.
Therefore, long term clinical studies may be beneficial to evaluate the colour stability of the material.
Another limitation of this study is the concentration of the spice solutions used. The
concentration of spices used as food colourant is highly variable depending on the type of cuisine and
individual preference. Therefore, the 0.1% concentration used in this study is a general estimation.
Finally, this study only tested the composites‟ resistance to staining for 168 hours (7 days).

84
This study evaluated the colour stability of two contemporary composite resins, nano-filled Filtek
Supreme™ and micro-hybrid Gradia Direct™ finished with either Sof-Lex™ discs or mylar strips on
exposure to turmeric, paprika and tamarind. Within the limitations of this study, all spices used (turmeric,
paprika and tamarind) have a potential to stain composite resins; with turmeric causing the most severe
discolouration regardless of the type of composite resins or finishing techniques employed. These
spices are commonly used in cuisine in various parts of the world especially the Asian continent.
Therefore, patients with spicy food intake in their dietary habit should be educated on the possible
colour changes in the restorative material on exposure to these spices. Further in-vivo and in-vitro
analysis may be necessary for better understanding of the mechanism of discolouration of composite
resins under the influence of spices, and colour stability of the material exposed to these natural food
colourants.
Filtek Supreme™ finished with mylar strips generally resulted in significantly more colour
change compared with specimens polished with Sof-Lex™ discs. Gradia Direct™ finished with mylar
strips produce lower colour changes than the Sof-Lex™ discs group. In clinical setting, mylar strips are
usually used to aid contouring of the restoration. As a general rule the restorations are contoured as
closely as possible to the intended morphology and surface finish in order to minimize the need for
subsequent finishing and polishing of the restorations. The necessity for polishing following placement
of the composite resins varies, depending on the need to remove excess material, to adjust anatomic
form and occlusion, and, finally, to obtain a smooth surface.
CHAPTER 8
CONCLUSION & RECOMMENDATIONS
85
The result of this study suggests that different materials respond differently to staining by spices
when either finished with mylar strips or polished with Sof-Lex™ discs. The clinical implication of these
outcomes is that the decision to leave the final restorations as mylar strips finished or to proceed with
polishing depends on the type of composite resins selected.
Also, contemporary composite resins available in the market (e.g. nano-composite and micro-
filled hybrid composite) are still susceptible to discolouration by exogenous factors despite
advancement in the development of resin based restorative material, This suggests that further
research and development are needed to improve the colour stability of the material.
Recommendations for future studies include a longer period of immersion. In this study,
samples were immersed with the staining solutions the entire time. In order to create a more accurate
overall view of the whole staining process, an intermittent staining process to simulate a natural dietary
consumption pattern should be performed. Furthermore, clinically, staining solutions would be mixed
and diluted with saliva. Therefore, future study could include mixture of the staining solutions with, for
example, artificial saliva.
The effect of spices in various concentrations and combinations could be of interest and
worthwhile to investigate more thoroughly. In addition, as there are a variety of commercial composite
resins available in the market, it would be pertinent to include other types of composite resins in future
studies.

86
1. Paravina R PJ: Esthetic Colour Training in Dentistry. St. Louis, MO: Elsevier Mosby; 2004.
2. Preston J. BSF: Colour Science and Dental Art. St. Louis: C. V. Mosby; 1980.
3. Chu SJ, Devigus A and Mieleszko AJ.: Fundamentals of Colour: Shade Matching and
Communication in Esthetic Dentistry Chicago: Quintessence Publishing; 2004.
4. Bergen SF: Colour in esthetics. N Y State Dent J 1985, 51(8):470-471.
5. Preston JD: Current status of shade selection and colour matching. Quintessence Int 1985,
16(1):47-58.
6. Sproull RC: Colour matching in dentistry. I. The three-dimensional nature of colour. J Prosthet
Dent 1973, 29(4):416-424.
7. Clark B: Colour matching in dentistry. J Am Dent Assoc 1933, 20:1065.
8. Anusavice K: Restorative resins: In Phillip‟s science of Dental Materials. WB Saunders
Company.
9. Bowen R: Properties of a silica-reinforced polymer for dental restorations. J Am Dent Assoc
1963, 66:57-64.
10. Ferracane JL: Current trends in dental composites. Crit Rev Oral Biol Med 1995, 6(4):302-318.
11. Dietschi D, Campanile G, Holz J, Meyer JM: Comparison of the colour stability of ten new-
generation composites: an in vitro study. Dent Mater 1994, 10(6):353-362.
12. Mitra SB WD, Holmes BN: An application of nanotechnology in advanced dental materials. J
Am Dent Assoc 2003, 134(10):1382-1390.
13. Burke FJ, Watts DC, Wilson NH, Wilson MA: Current status and rationale for composite inlays
and onlays. Br Dent J 1991, 170(7):269-273.
14. Burke FJ, Wilson NH, Watts DC: Aesthetic inlays. Br Dent J 1994, 177(6):198-201
CHAPTER 9
BIBLIOGRAPHY

87
15. Tyas MJ: Colour stability of composite resins: a clinical comparison. Aust Dent J 1992,
37(2):88-90.
16. Burke FJ, Wilson NH, Watts DC: Composite inlays. Br Dent J 1994, 177(7):241-245.
17. Mjor IA, Moorhead JE: Selection of restorative materials, reasons for replacement, and
longevity of restorations in Florida. J Am Coll Dent 1998, 65(3):27-33.
18. Mjor IA, Moorhead JE, Dahl JE: Reasons for replacement of restorations in permanent teeth in
general dental practice. Int Dent J 2000, 50(6):361-366.
19. Mjor IA, Shen C, Eliasson ST, Richter S: Placement and replacement of restorations in general
dental practice in Iceland. Oper Dent 2002, 27(2):117-123.
20. Mjor IA, Toffenetti F: Placement and replacement of resin-based composite restorations in Italy.
Oper Dent 1992, 17(3):82-85.
21. Um CM, Ruyter IE: Staining of resin-based veneering materials with coffee and tea.
Quintessence Int 1991, 22(5):377-386.
22. Yannikakis SA, Zissis AJ, Polyzois GL, Caroni C: Colour stability of provisional resin restorative
materials. J Prosthet Dent 1998, 80(5):533-539.
23. P Horsted-Bindslev IM: Esthetic restoration. In: Modern Concepts in Operative Dentistry:
Copenhagen: Munksgaard; 1988.
24. Begum Turker S, Kocak A, Esra A: Effect of five staining solutions on the colour stability of two
acrylics and three composite resins based provisional restorations. Eur J Prosthodont Restor
Dent 2006, 14(1):2-6.
25. Chan KC, Fuller JL, Hormati AA: The ability of foods to stain two composite resins. J Prosthet
Dent 1980, 43(5):542-545.
26. Ertas E, Guler AU, Yucel AC, Koprulu H, Guler E: Colour stability of resin composites after
immersion in different drinks. Dent Mater J 2006, 25(2):371-376.
27. Omata Y, Uno S, Nakaoki Y, Tanaka T, Sano H, Yoshida S, Sidhu SK: Staining of hybrid
composites with coffee, oolong tea, or red wine. Dent Mater J 2006, 25(1):125-131.

88
28. Patel SB, Gordan VV, Barrett AA, Shen C: The effect of surface finishing and storage solutions
on the colour stability of resin-based composites. J Am Dent Assoc 2004, 135(5):587-594.
29. Samra AP, Pereira SK, Delgado LC, Borges CP: Colour stability evaluation of aesthetic
restorative materials. Braz Oral Res 2008, 22(3):205-210.
30. Stober T, Gilde H, Lenz P: Colour stability of highly filled composite resins materials for facings.
Dent Mater 2001, 17(1):87-94.
31. Gross MD: A colourimetric study of coffee and tea staining of four composite resins. J Oral
Rehabil 1977, 4(4): 311-322.
32. Leard A: The propensity of different brands of tea and coffee to cause staining associated with
chlorhexidine. J Clin Periodontol 1997, 24(2):115-118.
33. Turker SB, Kocak A., Aktepe E.: Effect of five staining solutions on the colour stability of two
acrylics and three composite resins based provisional restorations. Eur J Prosthodont Restor
Dent 2006, 14(3):121-125.
34. Abu-Bakr N, Han L, Okamoto A, Iwaku M: Colour stability of compomer after immersion in
various media. J Esthet Dent 2000, 12(5):258-263.
35. Villalta P, Lu H, Okte Z, Garcia-Godoy F, Powers JM: Effects of staining and bleaching on
colour change of dental composite resins. J Prosthet Dent 2006, 95(2):137-142.
36. Topcu FT, Sahinkesen G, Yamanel K, Erdemir U, Oktay EA, Erhasan S.: Influence of different
drinks on the colour stability of dental resin composites. . Eur J Dent 2009, 3(1):50-56.
37. Rutkunas V, Sabaliauskas V, Mizutani H: Effects of different food colourants and polishing
techniques on colour stability of provisional prosthetic materials. Dent Mater J, 29(2):167-176.
38. Hutchings JB: Food Colour and Appearance. A Chapman & Hall Food Science Book: Springer;
1999.
39. CIE : CIE definition 845-02-18: (Perceived) colour.
40. The Oxford English Dictionary. Oxford University Press: 2010, 3:2112.
41. Billmeyer FW Jr: Principles of colour technology. New York: John Wiley and Sons; 1981.

89
42. WyazeckiG S: Colour science: concepts and methods, quantitative data and formulae. Volume
2. New York: JohnWiley and Sons; 1982.
43. Newton I: Optiks (based on Edition 4, 1730). New York: Dover Publications; 1955
44. www.physics.arizona.edu
45. Mayekar SM: Shades of a colour. Illusion or reality? Dent Clin North Am 2001, 45(1):155-172.
46. Rossing TD CC: Light science: physics and the visual arts: Birkhä user; 1999.
47. Optical Society of America: The Science of Colour: Crowell Publisher; 1970.
48. Crone RA: A History of Colour: The Evolution of Theories of Lights and Colour. Boston: Kluwer
Academic; 1999.
49. Fondriest J: Shade matching in restorative dentistry: the science and strategies. Int J
Periodontics Restorative Dent 2003, 23(5):467-479.
50. Barna GJ, Taylor JW, King GE, Pelleu GB, Jr.: The influence of selected light intensities on
colour perception within the colour range of natural teeth. J Prosthet Dent 1981, 46(4):450-453.
51. Preston JD, Ward LC, Bobrick M: Light and lighting in the dental office. Dent Clin North Am
1978, 22(3):431-451.
52. Bergen SF, and McCasland J: Dental operatory lighting and tooth colour discrimination. J Am
Dent Assoc 1977, 94:130.
53. Sproull RC: Colour matching in dentistry. Part III. Colour control. J Prosthet Dent 1974,
31(2):146-154.
54. CIE 13.2 1974 (Corrected 1988): Method of Measuring and Specifying Colour Rendering
Properties of Light Sources.
55. www.handprint.com
56. www.gelighting.com
57. http://dba.med.sc.edu
58. Schlote Torsten GF: Pocket atlas of ophthalmology: Thieme; 2006.
59. Agarwal Sunita AA, Apple David J Textbook of Ophthalmology. Volume 2: Jaypee Brothers
Publishers; 2002.

90
60. Kuehni R: The early development of the Munsell system. Colour Research and Application
2002, 27:20-27.
61. http://www.britannica.com/EBchecked/media/61524
62. CIE : Colourimetry technical report. CIE Publication No.15. Vienna, Austria: Bureau Central de
la CIE; 1986.
63. Luo MR CG, Rigg B: The development of the CIE 2000 colour difference formula: CIEDE2000.
Colour Research and Application 2001, 26:340-350.
64. Westland S: Review of the CIE System of Colourimetry and Its Use in Dentistry. Volume 15.
Blackwell Publishing Ltd; 2003:S5-S12.
65. Schanda J: "3: CIE Colourimetry". In Colourimetry: Understanding the CIE System. Wiley
Interscience; 2007:37-46.
66. Douglas RD ST, Wee AG : Intraoral determination of the tolerance of dentists for perceptibility
and acceptability of shade mismatch. J Prosthet Dent 2007, 97(4):200-208.
67. Seghi RR, Gritz MD, Kim J: Colourimetric changes in composites resulting from visible-light-
initiated polymerisation. Dent Mater 1990, 6(2):133-137.
68. Lee SY ND, Giordano R: Colour stability of a new light-cured ceramic stain system subjected to
glazing temperature. Journal of Oral Rehabilitation 2001, 28(5):457-462.
69. Johnston WM, Kao EC: Assessment of appearance match by visual observation and clinical
colourimetry. J Dent Res 1989, 68(5):819-822.
70. Khokhar ZA, Razzoog ME, Yaman P: Colour stability of restorative resins. Quintessence Int
1991, 22(9):733-737.
71. Ruyter IE, Nilner K, Moller B: Colour stability of dental composite resins materials for crown and
bridge veneers. Dent Mater 1987, 3(5):246-251.
72. Sproull RC: Colour matching in dentistry. II. Practical applications of the organization of colour.
J Prosthet Dent 1973, 29(5):556-566.
73. Hall NR: Tooth colour selection: the application of colour science to dental colour matching.
Aust Prosthodont J 1991, 5:41-46.
91
74. Kim HS, Um CM: Colour differences between resin composites and shade guides.
Quintessence Int 1996, 27(8):559-567.
75. Browning WD, Contreras-Bulnes R, Brackett MG, Brackett WW: Colour differences:
polymerized composite and corresponding Vitapan Classical shade tab. J Dent 2009, 37 Suppl
1:e34-39.
76. Capa N, Malkondu O, Kazazoglu E, Calikkocaoglu S: Evaluating factors that affect the shade-
matching ability of dentists, dental staff members and laypeople. J Am Dent Assoc 2010,
141(1):71-76.
77. Dancy WK, Yaman P, Dennison JB, O'Brien WJ, Razzoog ME: Colour measurements as quality
criteria for clinical shade matching of porcelain crowns. J Esthet Restor Dent 2003, 15(2):114-
121.
78. Johnston WM: Colour measurement in dentistry. J Dent 2009, 37(Supplement 1):e2-e6.
79. Chu SJ, Trushkowsky RD, Paravina RD: Dental colour matching instruments and systems.
Review of clinical and research aspects. J Dent, 38 Suppl 2:e2-16.
80. Tung FF, Goldstein GR, Jang S, Hittelman E: The repeatability of an intraoral dental
colourimeter. J Prosthet Dent 2002, 88(6):585-590.
81. Gehrke P, Riekeberg U, Fackler O, Dhom G: Comparison of in vivo visual, spectrophotometric
and colourimetric shade determination of teeth and implant-supported crowns. Int J Comput
Dent 2009, 12(3):247-263.
82. Kim-Pusateri S, Brewer JD, Dunford RG, Wee AG: In vitro model to evaluate reliability and
accuracy of a dental shade-matching instrument. J Prosthet Dent 2007, 98(5):353-358.
83. Kuzmanovic D, Lyons KM: Tooth shade selection using a colourimetric instrument compared
with that using a conventional shade guide. N Z Dent J 2009, 105(4):131-134.
84. Khurana R, Tredwin CJ, Weisbloom M, Moles DR: A clinical evaluation of the individual
repeatability of three commercially available colour measuring devices. Br Dent J 2007,
203(12):675-680.

92
85. Okubo SR, Kanawati A, Richards MW, Childress S: Evaluation of visual and instrument shade
matching. J Prosthet Dent 1998, 80(6):642-648.
86. Da Silva JD, Park SE, Weber HP, Ishikawa-Nagai S: Clinical performance of a newly developed
spectrophotometric system on tooth colour reproduction. J Prosthet Dent 2008, 99(5):361-368.
87. Lagouvardos PE, Fougia AG, Diamantopoulou SA, Polyzois GL: Repeatability and interdevice
reliability of two portable colour selection devices in matching and measuring tooth colour. J
Prosthet Dent 2009, 101(1):40-45.
88. Kim-Pusateri S, Brewer JD, Davis EL, Wee AG: Reliability and accuracy of four dental shade-
matching devices. J Prosthet Dent 2009, 101(3):193-199.
89. Dozic A, Voit NF, Zwartser R, Khashayar G, Aartman I: Colour coverage of a newly developed
system for colour determination and reproduction in dentistry. J Dent 2010, 38 Suppl 2:e50-56.
90. Kanawati A, Richards MW: Repeatability of a dental shade-matching instrument when
compared to traditional visual methods of shade evaluation. Gen Dent 2009, 57(4):323-327.
91. Yilmaz B, Karaagaclioglu L: Comparison of visual shade determination and an intra-oral dental
colourimeter. J Oral Rehabil 2008, 35(10):789-794.
92. Wee AG, Kang EY, Johnston WM, Seghi RR: Evaluating porcelain colour match of different
porcelain shade-matching systems. J Esthet Dent 2000, 12(5):271-280.
93. Paul S, Peter A, Pietrobon N, Hammerle CH: Visual and spectrophotometric shade analysis of
human teeth. J Dent Res 2002, 81(8):578-582.
94. Paul SJ, Peter A, Rodoni L, Pietrobon N: Conventional visual vs spectrophotometric shade
taking for porcelain-fused-to-metal crowns: a clinical comparison. Int J Periodontics Restorative
Dent 2004, 24(3):222-231.
95. Al-Hamdan EM, Hammad IA, Tashkandi E: Evaluation of colour duplication in metal-ceramic
complexes using visual and instrumental shade-matching systems. Int J Prosthodont,
23(2):149-151.
96. Elter A, Caniklioglu B, Deger S, Ozen J: The reliability of digital cameras for colour selection. Int
J Prosthodont 2005, 18(5):438-440.

93
97. Jarad FD, Albadri SS, Mair LH: The use of objective digital matching to achieve an esthetic
composite restoration. J Clin Dent 2008, 19(1):9-13.
98. Lath DL, Wildgoose DG, Guan YH, Lilley TH, Smith RN, Brook AH: A digital image analysis
system for the assessment of tooth whiteness compared to visual shade matching. J Clin Dent
2007, 18(1):17-20.
99. Caglar A, Yamanel K, Gulsahi K, Bagis B, Ozcan M: Could digital imaging be an alternative for
digital colourimeters? Clin Oral Investig, 14(6):713-718.
100. Yamanel K, Caglar A, Ozcan M, Gulsah K, Bagis B: Assessment of colour parameters of
composite resins shade guides using digital imaging versus colourimeter. J Esthet Restor Dent,
22(6):379-388.
101. Snow SR: Assessing and achieving accuracy in digital dental photography. J Calif Dent Assoc
2009, 37(3):185-191.
102. Schropp L: Shade matching assisted by digital photography and computer software. J
Prosthodont 2009, 18(3):235-241.
103. Sagel PA, Gerlach RW: Application of digital imaging in tooth whitening randomized controlled
trials. Am J Dent 2007, 20 Spec No A:7A-14A.
104. McLean J: Limitations of posterior composite resins and extending their use with glass ionomer
cements. Quint Int 1987, 18(8): 517-529.
105. Bowen R: Use of epoxy resins in restorative materials. J Dent Res 1956, 35(3):360-369.
106. Buonocore M: A simple method of increasing the adhesion acrylic filling material to enamel
surfaces. J Dent Res 1955, 34(6): 849-853.
107. Lee S: Preface to the dictionary of composite material technology. Technomic Publishing
Company, Lancaster, PA. ; 1989.
108. Terry DA LK, Blatz MB: Achieving Aesthetic and Restorative Excellence Using an Advanced
Biomaterial: Part I. Dent Today 2009, 28(8):49-50, 52-5.
109. McCabe JF: Applied Dental Materials, Volume 9 edition Wiley-Blackwell; 2008.

94
110. Ruyter IE Oysaed H: Composites for use in posterior teeth: Composition and conversion. J
Biomed Mater Res 1987, 21(1):11-23.
111. Peutzfeldt A: Resin composites in dentistry: The monomers systems. Eur J Oral Sci 1997,
105(2): 97-116.
112. Sideridou I, Achilias DS, Spyroudi C, Karabela M: Water sorption characteristics of light-cured
dental resins and composites based on Bis-EMA/PCDMA. Biomaterials 2004, 25(2):367-376.
113. Sideridou I, Tserki V, Papanastasiou G: Study of water sorption, solubility and modulus of
elasticity of light-cured dimethacrylate-based dental resins. Biomaterials 2003, 24(4):655-665.
114. Douglas WH, Craig RG: Resistance to extrinsic strains by hydrophobic composite resins
systems. J Dent Res 1982, 61(1):41-43.
115. Ferracane JL: Elution of leachable components from composites. J Oral Rehabil 1994,
21(4):441-452.
116. Geurtsen W: Substances released from dental resin composites and glass ionomer cements.
Eur J Oral Sci 1998, 106(2):687-695.
117. Soderholm KJ MA: Bis-GMA-Based Resins in dentistry: are they safe? J Am Dent Assoc
1999,130(2):201-209.
118. Cramer NB, Stansbury JW, Bowman CN: Recent advances and developments in composite
dental restorative materials. J Dent Res, 90(4):402-416.
119. Turssi CP, Ferracane JL, Serra MC: Abrasive wear of resin composites as related to finishing
and polishing procedures. Dent Mater 2005, 21(7):641-648
120. Aykent F, Yondem I, Ozyesil AG, Gunal SK, Avunduk MC, Ozkan S: Effect of different finishing
techniques for restorative materials on surface roughness and bacterial adhesion. J Prosthet
Dent, 103(4):221-227.
121. Celik C, Ozgunaltay G: Effect of finishing and polishing procedures on surface roughness of
tooth-coloured materials. Quintessence Int 2009, 40(9):783-789.
122. www.lumicrest.com.

95
123. Imazato S, Tarumi H, Kato S, Ebisu S. et al: Water sorption and colour stability of composites
containing the antibacterial monomers MDPB. J Dent. 1999, 27(4):279-83.
124. Imazato S: Antibacterial properties of resin composites and dentin bonding systems. Dent Mater
2003, 19(6):449-457.
125. Turssi CP, Ferracane JL, Serra MC: Abrasive wear of resin composites as related to finishing
and polishing procedures. Dent Mater 2005, 21(7):641-648.
126. Vasudeva G: Monomers systems for dental composites and their future: a review. J Calif Dent
Assoc 2009, 37(6):389-398.
127. Ilie N, Hickel R: Investigations on mechanical behaviour of dental composites. Clin Oral Investig
2009, 13(4):427-438.
128. Zimmerli B, Strub M, Jeger F, Stadler O, Lussi A: Composite materials: composition, properties
and clinical applications. A literature review. Schweiz Monatsschr Zahnmed, 120(11):972-986.
129. Chen MH: Update on dental nano-composites. J Dent Res, 89(6):549-560.
130. Lee HL Ong J: Differences in the physical properties of composite dental restoratives:
Suggested causes and the clinical effects. J Oral Rehabil. 1977 Jul;4(3):227-36
131. Kim K H Ong JL, Okuno O: The effect of filler loading and morphology on the mechanical
properties of contemporary composites. J Prosthet Dent. 2002,87(6):642-9.
132. Lutz F PRW: A classification and evaluation of composite resins systems. J Prosthet Dent 1983,
50:480-488.
133. Lang BR, Jaarda M, Wang RF: Filler particle size and composite resins classification systems. J
Oral Rehabil 1992, 19(6):569-584.
134. GCAmerica: GRADIA DIRECT Technical Manual version 1.0, 2003.
135. ESPE M: Filtek™ Supreme XTE Universal Restorative System. Filtek Technical Product Profile.
136. Xu HH, Weir MD, Sun L, Moreau JL, Takagi S, Chow LC, Antonucci JM: Strong nano-
composites with Ca, PO(4), and F release for caries inhibition. J Dent Res 2010, 89(1):19-28.
137. Ritter AV: Posterior resin-based composite restorations: clinical recommendations for optimal
success. J Esthet Restor Dent 2001, 13(2):88-99.

96
138. Ergucu Z, Turkun LS, Aladag A: Colour stability of nano-composites polished with one-step
systems. Oper Dent 2008, 33(4):413-420.
139. Turkun LS, Turkun M: The effect of one-step polishing system on the surface roughness of
three esthetic resin composite materials. Oper Dent 2004, 29(2):203-211.
140. Korkmaz Y, Ozel E, Attar N, Aksoy G: The influence of one-step polishing systems on the
surface roughness and microhardness of nano-composites. Oper Dent 2008, 33(1):44-50.
141. Hachiya Y, Iwaku M, Hosoda H, Fusayama T: Relation of finish to discolouration of composite
resins. J Prosthet Dent 1984, 52(6):811-814.
142. Lu H, Roeder LB, Lei L, Powers JM: Effect of surface roughness on stain resistance of dental
resin composites. J Esthet Restor Dent 2005, 17(2):102-108; discussion 109.
143. Yap AU LK, Sau CW: Surface characteristic of tooth coloured restoration polished utilising
different polishing systems. Oper Dent 1997, 22(6):260-265.
144. Chung KH: Effects of finishing and polishing procedures on the surface texture of resin
composites. Dent Mater 1994, 10(5):325-330.
145. Hondrum SO, Fernandez RJ: Contouring, finishing, and polishing class V restorative materials.
Oper Dent 1997, 22(1):30-36.
146. Hoelscher DC, Neme A, Pink FE, Hughes PJ.: The effect of three finishing systems on four
esthetic restorative materials. Oper Dent 1998, 23(1):36-42.
147. Wilson F HJ, Watts DC: Finishing composite restorative material. J Oral Rehabil 1990, 17(1):79-
87.
148. Ö zgunaltay G YA, Gorucu J: Effect of finishing and polishing procedures on the surface
roughness of new tooth-coloured restoratives. J Oral Rehabil 2003, 30(2):218-224.
149. Park SH, Noh BD, Ahn HJ, Kim HK: Mylar strips-finished versus polished composite surface:
difference in surface discolouration in micro-hybrid composites. J Oral Rehabil 2004, 31(1):62-
66.
150. Endo T, Finger WJ, Kanehira M, Utterodt A, Komatsu M: Surface texture and roughness of
polished nanofill and nano-hybrid resin composites. Dent Mater J 2010, 29(2):213-223.

97
151. Lu H, Roeder LB, Powers JM: Effect of polishing systems on the surface roughness of micro-
hybrid composites. J Esthet Restor Dent 2003, 15(5):297-303.
152. Venturini D, Cenci MS, Demarco FF, Camacho GB, Powers JM: Effect of polishing techniques
and time on surface roughness, hardness and microleakage of resin composite restorations.
Oper Dent 2006, 31(1):11-17.
153. Yap AU, Tan KB, Bhole S: Comparison of aesthetic properties of tooth-coloured restorative
materials. Oper Dent 1997, 22(4):167-172.
154. Sarac D, Sarac YS, Kulunk S, Ural C, Kulunk T: The effect of polishing techniques on the
surface roughness and colour change of composite resins. J Prosthet Dent 2006, 96(1):33-40.
155. Baseren M: Surface roughness of nanofill and nano-hybrid composite resins and ormocer-
based tooth-coloured restorative materials after several finishing and polishing procedures. J
Biomater Appl 2004, 19(2):121-134.
156. Lu H, Powers JM: Colour stability of resin cements after accelerated aging. Am J Dent 2004,
17(5):354-358.
157. Yap AU, Yap SH, Teo CK, Ng JJ: Comparison of surface finish of new aesthetic restorative
materials. Oper Dent 2004, 29(1):100-104.
158. Jung M, Eichelberger K, Klimek J: Surface geometry of four nano-filler and one hybrid
composite after one-step and multiple-step polishing. Oper Dent 2007, 32(4):347-355.
159. Watanabe T, Miyazaki M, Moore BK: Influence of polishing instruments on the surface texture
of resin composites. Quintessence Int 2006, 37(1):61-67.
160. Schmitt VL, Naufel FS, Nahsan FP, Sinhoreti MA, Baseggio W: Effect of the Polishing
Procedures on Colour Stability and Surface Roughness of Composite resins. ISRN Dentistry
2011:6.
161. Turkun LS, Leblebicioglu EA: Stain retention and surface characteristics of posterior composites
polished by one-step systems. Am J Dent 2006, 19(6):343-347.
162. Berger SB, Palialol AR, Cavalli V, Giannini M: Surface roughness and staining susceptibility of
composite resins after finishing and polishing. J Esthet Restor Dent, 23(1):34-43.

98
163. Horsted-BindslevP MI: Esthetic restoration. In: Modern Concepts in Operative Dentistry.:
Copenhagen: Munksgaard; 1988.
164. Hosoya Y, Goto G: Colour changes of light-cured composite resins. J Clin Pediatr Dent 1992,
16(4):247-252.
165. Lee YK, Powers JM: Combined effects of staining substances on resin composites before and
after surface sealant application. J Mater Sci Mater Med 2007, 18(5):685-691.
166. Lee YK, Powers JM: Discolouration of dental resin composites after immersion in a series of
organic and chemical solutions. J Biomed Mater Res B Appl Biomater 2005, 73(2):361-367.
167. Schulze KA, Marshall SJ, Gansky SA, Marshall GW: Colour stability and hardness in dental
composites after accelerated aging. Dent Mater 2003, 19(7):612-619.
168. Reis AF, Giannini M, Lovadino JR, Ambrosano GM: Effects of various finishing systems on the
surface roughness and staining susceptibility of packable composite resins. Dent Mater 2003,
19(1):12-18.
169. Canay S, Hersek N, Tulunoglu I, Uzun G: Evaluation of colour and hardness changes of soft
lining materials in food colourant solutions. J Oral Rehabil 1999, 26(10):821-829.
170. Gerdolle DA, Mortier E, Jacquot B, Panighi MM: Water sorption and water solubility of current
luting cements: an in vitro study. Quintessence Int 2008, 39(3):e107-114.
171. Satou N, Khan AM, Matsumae I, Satou J, Shintani H: In vitro colour change of composite-based
resins. Dent Mater 1989, 5(6):384-387.
172. Sideridou ID, Karabela MM, Vouvoudi E: Dynamic thermomechanical properties and sorption
characteristics of two commercial light cured dental resin composites. Dent Mater 2008,
24(6):737-743.
173. Ferracane JL: Hygroscopic and hydrolytic effects in dental polymer networks. Dent Mater 2006,
22(3):211-222.
174. Kalachandra S, Wilson TW: Water sorption and mechanical properties of light-cured proprietary
composite tooth restorative materials. Biomaterials 1992, 13(2):105-109.

99
175. Ameye C, Lambrechts P, Vanherle G: Conventional and micro-filled composite resins. Part I:
Colour stability and marginal adaptation. J Prosthet Dent 1981, 46(6):623-630.
176. Inokoshi S, Burrow MF, Kataumi M, Yamada T, Takatsu T: Opacity and colour changes of
tooth-coloured restorative materials. Oper Dent 1996, 21(2):73-80.
177. Arikawa H, Kanie T, Fujii K, Takahashi H, Ban S: Effect of filler properties in composite resins
on light transmittance characteristics and colour. Dent Mater J 2007, 26(1):38-44.
178. Lim YK, Lee YK, Lim BS, Rhee SH, Yang HC: Influence of filler distribution on the colour
parameters of experimental resin composites. Dent Mater 2008, 24(1):67-73.
179. Lee YK: Influence of filler on the difference between the transmitted and reflected colours of
experimental resin composites. Dent Mater 2008, 24(9):1243-1247.
180. Hosoya Y, Shiraishi T, Oshiro M, Ando S, Miyazaki M, Powers JM: Effects of specular
component on colour differences of different filler type resin composites after aging. J Dent
2009, 37(8):585-590.
181. Choi MS, Lee YK, Lim BS, Rhee SH, Yang HC: Changes in surface characteristics of dental
resin composites after polishing. J Mater Sci Mater Med 2005, 16(4):347-353.
182. Guler AU, Guler E, Yucel AC, Ertas E: Effects of polishing procedures on colour stability of
composite resins. J Appl Oral Sci 2009, 17(2):108-112.
183. Janda R, Roulet JF, Kaminsky M, Steffin G, Latta M: Colour stability of resin matrix restorative
materials as a function of the method of light activation. Eur J Oral Sci 2004, 112(3):280-285.
184. Janda R, Roulet JF, Latta M, Steffin G, Ruttermann S: Colour stability of resin-based filling
materials after aging when cured with plasma or halogen light. Eur J Oral Sci 2005, 113(3):251-
257.
185. Janda R, Roulet JF, Latta M, Kaminsky M, Ruttermann S: Effect of exponential polymerisation
on colour stability of resin-based filling materials. Dent Mater 2007, 23(6):696-704.
186. Ruttermann S, Suyoun K, Raab WH, Janda R: Effect of exposure time on the colour stability of
resin-based restorative materials when polymerized with quartz-tungsten halogen and LED
light. Clin Oral Investig, 14(5):599-605.

100
187. Brackett MG, Brackett WW, Browning WD, Rueggeberg FA: The effect of light curing source on
the residual yellowing of resin composites. Oper Dent 2007, 32(5):443-450.
188. Schneider LF, Pfeifer CS, Consani S, Prahl SA, Ferracane JL: Influence of photoinitiator type
on the rate of polymerisation, degree of conversion, hardness and yellowing of dental resin
composites. Dent Mater 2008, 24(9):1169-1177.
189. Asmussen E, Antonucci JM, Bowen RL: Adhesion to dentin by means of Gluma resin. Scand J
Dent Res 1988, 96(6):584-589.
190. Asmussen E: Factors affecting the colour stability of restorative resins. Acta Odontol Scand
1983, 41(1):11-18.
191. Eldiwany M, Friedl KH, Powers JM: Colour stability of light-cured and post-cured composites.
Am J Dent 1995, 8(4):179-181.
192. Ikeda T, Nakanishi A, Yamamoto T, Sano H: Colour differences and colour changes in Vita
Shade tooth-coloured restorative materials. Am J Dent 2003, 16(6):381-384.
193. Asmussen E: Factors affecting the quantity of remaining double bonds in restorative resin
polymers. Scand J Dent Res 1982, 90(6):490-496.
194. Pearson GJ, Longman CM: Water sorption and solubility of resin-based materials following
inadequate polymerisation by a visible-light curing system. J Oral Rehabil 1989, 16(1):57-61.
195. Burrow MF, Makinson OF: Colour change in light-cured resins exposed to daylight.
Quintessence Int 1991, 22(6):447-452.
196. Uchida H, Vaidyanathan J, Viswanadhan T, Vaidyanathan TK: Colour stability of dental
composites as a function of shade. J Prosthet Dent 1998, 79(4):372-377.
197. Wozniak WT, Moser JB, Willis E, Stanford JW: Ultraviolet light stability of composite resins. J
Prosthet Dent 1985, 53(2):204-209.
198. Hotta M, Hirukawa H, Yamamoto K, Kimura K: Colour changes of light-cured composite resins
after exposure to water and photographic wetting agent. Restorative Dent 1991, 7(2):38-39.
199. Sarafianou A, Iosifidou S, Papadopoulos T, Eliades G: Colour stability and degree of cure of
direct composite restoratives after accelerated aging. Oper Dent 2007, 32(4):406-411.

101
200. Vichi A, Ferrari M, Davidson CL: Colour and opacity variations in three different resin-based
composite products after water aging. Dent Mater 2004, 20(6):530-534.
201. Rosentritt M, Esch J, Behr M, Leibrock A, Handel G: In vivo colour stability of resin composite
veneers and acrylic resin teeth in removable partial dentures. Quintessence Int 1998,
29(8):517-522.
202. Doray PG, Wang X, Powers JM, Burgess JO: Accelerated aging affects colour stability of
provisional restorative materials. J Prosthodont 1997, 6(3):183-188.
203. Doray PG, Li D, Powers JM: Colour stability of provisional restorative materials after
accelerated aging. J Prosthodont 2001, 10(4):212-216.
204. Furuse AY, Gordon K, Rodrigues FP, Silikas N, Watts DC: Colour-stability and gloss-retention
of silorane and dimethacrylate composites with accelerated aging. J Dent 2008, 36(11):945-
952.
205. Lee YK, Powers JM: Colour and optical properties of resin-based composites for bleached teeth
after polymerisation and accelerated aging. Am J Dent 2001, 14(6):349-354.
206. Paravina RD, Ontiveros JC, Powers JM: Accelerated aging effects on colour and translucency
of bleaching-shade composites. J Esthet Restor Dent 2004, 16(2):117-126.
207. Catelan A, Briso AL, Sundfeld RH, Goiato MC, dos Santos PH: Colour stability of sealed
composite resins restorative materials after ultraviolet artificial aging and immersion in staining
solutions. J Prosthet Dent, 105(4):236-241.
208. Brauer GM: Colour changes of composites on exposure to various energy sources. Dent Mater
1988, 4(2):55-59.
209. Lee YK, Lu H, Oguri M, Powers JM: Changes in colour and staining of dental composite resins
after wear simulation. J Biomed Mater Res B Appl Biomater 2007, 82(2):313-319.
210. Lee YK, Lu H, Powers JM: Changes in opalescence and fluorescence properties of resin
composites after accelerated aging. Dent Mater 2006, 22(7):653-660.

102
211. Lee YK, Lim BS, Rhee SH, Yang HC, Lim YK: Changes in scattering and absorption properties
of esthetic filling materials after aging. J Biomed Mater Res B Appl Biomater 2007, 80(1):131-
139.
212. Lee YK, Lim BS, Rhee SH, Yang HC, Powers JM: Changes of optical properties of dental nano-
filled resin composites after curing and thermocycling. J Biomed Mater Res B Appl Biomater
2004, 71(1):16-21.
213. Lee YK, Lim BS, Rhee SH, Yang HC, Powers JM: Colour and translucency of A2 shade resin
composites after curing, polishing and thermocycling. Oper Dent 2005, 30(4):436-442.
214. Yılmaz B, Yuzugullu B, Cınar D, Berksun S. Effects of shade tab arrangement on the
repeatability and accuracy of shade selection. J Prosthet Dent. 2011;105(6):383-6
215. Lee SH, Lee YK: Effect of thermocycling on optical parameters of resin composites by the
brand and shade. Am J Dent 2008, 21(6):361-367.
216. Lu H, Lee YK, Villalta P, Powers JM, Garcia-Godoy F: Influence of the amount of UV
component in daylight simulator on the colour of dental composite resins. J Prosthet Dent 2006,
96(5):322-327.
217. Davis BA, Friedl KH, Powers JM: Colour stability of hybrid ionomers after accelerated aging. J
Prosthodont 1995, 4(2):111-115.
218. Lin JY, Yao JW, Lin CJ: [The influence of accelerated aging on colour and microstructure of
light-curing composite resins]. Hua Xi Kou Qiang Yi Xue Za Zhi 2008, 26(3):291-295.
219. Mathias P, Rossi TA, Cavalcanti AN, Lima MJ, Fontes CM, Nogueira-Filho Gda R: Cigarette
smoke combined with staining beverages decreases luminosity and increases pigmentation in
composite resins restorations. Compend Contin Educ Dent 2011;32(2):66-70.
220. Ghahramanloo A, Madani AS, Sohrabi K, Sabzevari S: An evaluation of colour stability of
reinforced composite resins compared with dental porcelain in commonly consumed beverages.
J Calif Dent Assoc 2008, 36(9):673-680.
221. Domingos PA, Garcia PP, Oliveira AL, Palma-Dibb RG: Composite resins colour stability:
influence of light sources and immersion media. J Appl Oral Sci, 19(3):204-211.

103
222. Ardu S, Braut V, Gutemberg D, Krejci I, Dietschi D, Feilzer AJ: A long-term laboratory test on
staining susceptibility of esthetic composite resins materials. Quintessence Int, 41(8):695-702.
223. Nasim I, Neelakantan P, Sujeer R, Subbarao CV: Colour stability of micro-filled, micro-hybrid
and nano-composite resins--an in vitro study. J Dent, 38 Suppl 2:e137-142.
224. Tunc ES, Bayrak S, Guler AU, Tuloglu N: The effects of children's drinks on the colour stability
of various restorative materials. J Clin Pediatr Dent 2009, 34(2):147-150.
225. Demirci M, Ersev H, Sancakli HS, Topcubasi M: Clinical evaluation of a polyacid-modified resin
composite (Dyract) in Class III cavities: 5-year results. Am J Dent 2006, 19(5):293-296.
226. Bagheri R, Burrow MF, Tyas M: Influence of food-simulating solutions and surface finish on
susceptibility to staining of aesthetic restorative materials. J Dent 2005, 33(5):389-398.
227. Ferracane JL, Berge HX, Condon JR: In vitro aging of dental composites in water--effect of
degree of conversion, filler volume, and filler/matrix coupling. J Biomed Mater Res 1998,
42(3):465-472.
228. Ferracane JL, Marker VA: Solvent degradation and reduced fracture toughness in aged
composites. J Dent Res 1992, 71(1):13-19.
229. Asmussen E, Hansen EK: Surface discolouration of restorative resins in relation to surface
softening and oral hygiene. Scand J Dent Res 1986, 94(2):174-177.
230. Aguiar FH, Georgetto MH, Soares GP, Catelan A, Dos Santos PH, Ambrosano GM, Figueroba
SR, Lovadino JR: Effect of different light-curing modes on degree of conversion, staining
susceptibility and stain's retention using different beverages in a nano-filled composite resins. J
Esthet Restor Dent 2011, 23(2):106-114.
231. Guler AU, Kurt S, Kulunk T: Effects of various finishing procedures on the staining of provisional
restorative materials. J Prosthet Dent 2005, 93(5):453-458.
232. Guler AU, Yilmaz F, Kulunk T, Guler E, Kurt S: Effects of different drinks on stainability of resin
composite provisional restorative materials. J Prosthet Dent 2005, 94(2):118-124.
233. Lee YK, El Zawahry M, Noaman KM, Powers JM: Effect of mouthwash and accelerated aging
on the colour stability of esthetic restorative materials. Am J Dent 2000, 13(3):159-161.

104
234. Debner T, Warren DP, Powers JM: Effects of fluoride varnish on colour of esthetic restorative
material. J Esthet Dent 2000, 12(3):160-163.
235. Hubbezoglu I, Akaoglu B, Dogan A, Keskin S, Bolayir G, Ozcelik S, Dogan OM: Effect of
bleaching on colour change and refractive index of dental composite resins. Dent Mater J 2008,
27(1):105-116.
236. Li Q, Yu H, Wang Y: Colour and surface analysis of carbamide peroxide bleaching effects on
the dental restorative materials in situ. J Dent 2009, 37(5):348-356.
237. Yalcin F, Gurgan S: Effect of two different bleaching regimens on the gloss of tooth coloured
restorative materials. Dent Mater 2005, 21(5):464-468.
238. Yalcin F, Gurgan S: Bleaching-induced colour change in plastic filling materials. J Biomater
Appl 2005, 19(3):187-195.
239. Lee YK, Lim BS, Powers JM: Colour changes of dental resin composites by a salivary enzyme.
J Biomed Mater Res B Appl Biomater 2004, 70(1):66-72.
240. Lee YK, Kim SH, Powers JM: Changes in translucency of resin composites after storage in
salivary esterase. J Esthet Restor Dent 2005, 17(5):293-299.
241. Satou N, Yukihiro A, Kagiyama Y, Yamane I, Satou J, Kai M, Hayashihara H, Shintani H, Inoue
T: [Effect of polishing on the staining of composite resins with various staining agents].
Hiroshima Daigaku Shigaku Zasshi 1984, 16(2):283-290.
242. Peter K: Handbook of herbs and spices.Volume 1: Woodhead Publishing; 2001.
243. Farrell KT (Ed.): Spices, Condiments and Seasonings. Volume 2: Springer; 1998.
244. Imamura S, Takahashi H, Hayakawa I, Loyaga-Rendon PG, Minakuchi S: Effect of filler type
and polishing on the discolouration of composite resins artificial teeth. Dent Mater J 2008,
27(6):802-808.
245. www.fda.gov/ICECI/ComplianceManuals/CompliancePolicyGuidanceManual/ucm074468.htm
246. ParthasarathyV. A. BC, T. John Zachariah: Chemistry of spices: CABI; 2008.
247. Govindarajan VS: Turmeric--chemistry, technology, and quality. Crit Rev Food Sci Nutr 1980,
12(3):199-301.

105
248. Nakatani N: Phenolic antioxidants from herbs and spices. Biofactors 2000, 13(1-4):141-146.
249. Rouseff R: High Performance Liquid Chromatographic Separation and Spectral
Characterization of the Pigments in Turmeric and Annatto. J Food Science 1988, 53(6): 1853-
1856.
250. Dixit S KS, Das M: A Simple 2-Directional High-Performance Thin-Layer Chromatographic
Method for the Simultaneous Determination of Curcumin, Metanil Yellow, and Sudan Dyes in
Turmeric, Chili, and Curry Powders. J AOAC Int 2008, 91(6); 1387-1396.
251. Araujo CC, Leon LL: Biological activities of Curcuma longa L. Mem Inst Oswaldo Cruz 2001,
96(5):723-728.
252. Ammon HP, Wahl MA: Pharmacology of Curcuma longa. Planta Med 1991, 57(1):1-7.
253. Chattopadhyay I BK, Bandyopadhyay U , Banerjee RK: Turmeric and curcumin: Biological
actions and medicinal applications. Current Science 2004, 87(1), 44-50.
254. Heintze SD, Forjanic M, Rousson V: Surface roughness and gloss of dental materials as a
function of force and polishing time in vitro. Dent Mater 2006, 22(2):146-165.
255. Cantrill R: Paprika Extract, Chemical and Technical Assessment (CTA) for 69th JECFA. 2008.
256. El-Siddig K HPMG, B.A. Prasad, D.K.N.G. Pushpakumara, K.V.R.Ramana, P.Vijayanand, J.T.
Williams: Tamarind Tamarindus indica L. In Southampton Centre for Underutilised Crops.
Southampton, UK.; 2006:198-200.
257. Emmy De Caluwé KHPVD: Tamarind (Tamarindus indica L.): A Review of Traditional Uses,
Phytochemistry and Pharmacolog. In African Natural Plant Products: New Discoveries and
Challenges in Chemistry and Quality. American Chemical Society; 2009:85-110.
258. Bravo L: Poly-phenols: chemistry, dietary sources, metabolism, and nutritional significance. Nutr
Rev 1998, 56(11):317-333.
259. Bennick A: Interaction of plant poly-phenols with salivary proteins. Crit Rev Oral Biol Med 2002,
13(2):184-196.
260. Proctor GB, Pramanik R, Carpenter GH, Rees GD: Salivary proteins interact with dietary
constituents to modulate tooth staining. J Dent Res 2005, 84(1):73-78.

106
261. Fujita M, Kawakami S, Noda M, Sano H: Colour change of newly developed esthetic restorative
material immersed in food-simulating solutions. Dent Mater J 2006, 25(2):352-359.
262. Dermann K, Rupp NW, Brauer GM: Effect of hydrophilic diluents on the properties of cured
composites. J Dent Res 1982, 61(11):1250-1254.
263. Kalachandra S: Influence of fillers on the water sorption of composites. Dent Mater 1989,
5(4):283-288.
264. Pearson GJ: Long term water sorption and solubility of composite filling materials. J Dent 1979,
7(1):64-68.
265. Mese A, Burrow MF, Tyas MJ: Sorption and solubility of luting cements in different solutions.
Dent Mater J 2008, 27(5):702-709.
266. Misra DN, Bowen RL: Sorption of water by filled-resin composites. J Dent Res 1977, 56(6):603-
612.
267. Abd Elhamid M, Mosallam R: Effect of bleaching versus repolishing on colour and surface
topography of stained resin composite. Aust Dent J, 55(4):390-398.
268. Janus J, Fauxpoint G, Arntz Y, Pelletier H, Etienne O: Surface roughness and morphology of
three nano-composites after two different polishing treatments by a multitechnique approach.
Dent Mater, 26(5):416-425.
269. Attar N: The effect of finishing and polishing procedures on the surface roughness of composite
resins materials. J Contemp Dent Pract 2007, 8(1):27-35.
270. Paravina RD, Roeder L, Lu H, Vogel K, Powers JM: Effect of finishing and polishing procedures
on surface roughness, gloss and colour of resin-based composites. Am J Dent 2004, 17(4):262-
266.
271. Lee YK, Lim BS, Kim CW: Effect of surface conditions on the colour of dental resin composites.
J Biomed Mater Res 2002, 63(5):657-663.
272. Tate WH PJ: Surface roughness of composites and hybrid ionomers. Oper Dent 1996, 21(2):53-
58.

107
273. Stoddard J W JG: An evaluation of polishing agents for composite resins. J Prosthet Dent 1991,
65(4):491-495.
274. Bashetty K, Joshi S: The effect of one-step and multi-step polishing systems on surface texture
of two different resin composites. J Conserv Dent, 13(1):34-38.
275. Koh R, Neiva G, Dennison J, Yaman P: Finishing systems on the final surface. J Contemp Dent
Pract. 2008 1;9(2):138-145
276. Senawongse P, Pongprueksa P: Surface roughness of nanofill and nano-hybrid resin
composites after polishing and brushing. J Esthet Restor Dent 2007, 19(5):265-273.
277. Antonson SA, Yazici AR, Kilinc E, Antonson DE, Hardigan PC: Comparison of different
finishing/polishing systems on surface roughness and gloss of resin composites. J Dent. 2011,
39 Suppl 1:e9-e17.
278. ISO 7491:2000. Dental materials – Determination of colour stability.
279. www.purplesage.org.uk
280. www.homecooking.com
281. www.manjulaskitchen.com
282. Araujo Fde O, Vieira LC, Monteiro Junior S: Influence of resin composite shade and location of
the gingival margin on the microleakage of posterior restorations. Oper Dent. 2006 Sep-
Oct;31(5):556-61.
283. Borges AL, Costa AK, Saavedra GS, Komori PC, Borges AB, Rode SM: Color stability of
composites: effect of immersion media. Acta Odontol Latinoam. 2011;24(2):193-9.
284. American Time Use Survey. 2008 Eating & Health Module Microdata Files. Bureau of Labor
Statistic. United States Labor Department.


![Bakopoulou Et Al. [2009] Molecular Toxicology of Substances Released From Resin-Based Dental Restorative Materials](https://static.fdocuments.net/doc/165x107/56d6bfe31a28ab30169818aa/bakopoulou-et-al-2009-molecular-toxicology-of-substances-released-from-resin-based.jpg)