COLORECTAL CANCER AND DIET IN SCOTLAND
453
COLORECTAL CANCER AND DIET IN SCOTLAND By Evropi Theodoratou DOCTOR OF PHILOSOPHY THE UNIVERSITY OF EDINBURGH OCTOBER 2008
Transcript of COLORECTAL CANCER AND DIET IN SCOTLAND

COLORECTAL CANCER AND DIET IN SCOTLAND
By
Evropi Theodoratou
DOCTOR OF PHILOSOPHY
THE UNIVERSITY OF EDINBURGH
OCTOBER 2008

DECLARATION
Thesis: Colorectal cancer and diet in Scotland
I, Evropi Theodoratou hereby declare that I am the sole author of this thesis. I
developed the hypotheses examined in this thesis and conducted all aspects of the
research except when contribution of colleagues is acknowledged. This thesis has not
been submitted for any other degree or professional qualification.
This thesis was based on the analysis of the Scottish Colorectal Cancer Study. The
study was funded by the Cancer Research UK, the Medical Research Council and the
Chief Scientist Office of the Scottish Executive and was headed by Professors Harry
Campbell, Malcolm G Dunlop and Mary E Porteous. The recruitment process of
study participants was co-ordinated by Dr Roseanne Cetnarskyj and conducted by
trained research nurses. Finally, the nutrient data analysis of the Food Frequency
Questionnaires was conducted by Dr Geraldine McNeill and her colleagues at the
University of Aberdeen.
Signature:……………………………………. Date:…………….

iii
AKNOWLEDGMENTS
I would like to thank my principal supervisor Professor Harry Campbell for his
guidance and encouragement, throughout my PhD.
I would also like to thank Dr Niall Anderson, my second supervisor, for his advice
and suggestions mainly regarding the statistical issues of the thesis.
I wish to acknowledge Professors Malcolm Dunlop and Mary Porteous, who
together with Professor Harry Campbell were the principal investigators of the case-
control study that my thesis was based on.
I wish to acknowledge Dr Roseanne Cetnarskyj for coordinating the recruitment
process of the study. In addition, I wish to acknowledge all the research nurses and
the members of the administrative team for their help regarding data collection and
management. I would like to specially thank Mrs Gisela Johnstone for her support
throughout my PhD and during the writing of the thesis.
I wish to acknowledge Dr Geraldine McNeill and her colleagues at the University
of Aberdeen for technical support regarding the Food Frequency Questionnaires and
for providing advice on certain issues regarding nutrient data analysis.
I wish to acknowledge Dr Susan Farrington and Dr Albert Tenesa, for providing
to me the genetic data, as well as advising me regarding specific aspects of the
genetic analysis.
I wish to acknowledge the State Scholarships Foundation in Greece, for funding
me and giving me the opportunity to conduct this thesis.
A special thank you to all the SOCCS study participants, for their kind and
valuable participation.
Finally, I would like to thank my fiancée Manos, my parents Thodoris and
Katerina and my sister Emmanouela, for their support, encouragement and
patience throughout my PhD.
iv
ABSTRACT
Introduction
Colorectal cancer is a cancer that forms in the tissues of the colon and/ or rectum and
more than 95% of colorectal cancers are adenocarcinomas. It is the third most common
cancer in incidence and mortality rates, accounting for 9% of all cancer cases and for 8%
of all cancer related deaths (2002). The established risk factors of colorectal cancer
include personal or family history of previous colorectal cancer or adenomatous polyps,
chronic bowel inflammatory disease and presence of any of the hereditary syndromes. In
addition, due to the fact that the majority of colorectal cancer cases (approximately 90%)
occur after the age of 50, advanced age is also considered as a risk factor. Finally,
evidence for significant associations between colorectal cancer and other risk factors,
including diet, body weight, physical activity, smoking, alcohol intake, NSAIDs intake
and HRT in post-menopausal women, is promising and increasing.
Aims and objectives
The main aims of this project were: 1) to investigate the associations between colorectal
cancer and specific nutrients, including flavonoids, fatty acids, folate, vitamin B2,
vitamin B6, vitamin B12, alcohol, vitamin D and calcium (prior hypotheses 1-4) and 2)
to conduct an overall as well as forward and backward stepwise regression analyses of
demographic, lifestyle and dietary risk factors.
Methods
The analysis of this thesis was based on a population-based case-control study of
colorectal cancer (Scottish Colorectal Cancer Study; SOCCS). In total 3,417 colorectal
cancer cases and 3,396 controls were recruited in the study. Dietary and lifestyle data
were collected by two questionnaires (Lifestyle & Cancer and Food Frequency
Questionnaire) and were available for 2,061 cases and 2,776 controls. For the analysis of
the first two hypotheses (flavonoids and fatty acids) a matched dataset of 1,489 case-
control pairs was used and conditional logistic regression models were applied, whereas
for the analysis of the last two hypotheses (folate, vitamin B2, vitamin B6, vitamin B12,
alcohol, vitamin D and calcium) an unmatched dataset including 2,061 cases and 2,776

v
controls was used and unconditional logistic regression models were applied. For the
overall and stepwise regression analyses the unmatched dataset was used (2,061 cases
and 2,776 controls). Forward and backward stepwise regression was applied on three
different sets of variables and the stability of the resultant models was checked in 100
bootstrap samples.
Results
Regarding the first two hypotheses, statistically significant odds ratios (ORs) (matched
on sex, age and health board are and adjusted for family history of cancer, BMI, physical
activity, smoking, and intakes of total energy, fibre, alcohol and NSAIDs) for highest
versus lowest intakes (quartiles) were observed for flavonols OR (95% CI), p-value for
trend: 0.78 (0.60, 0.99), 0.08) and for the individual flavonoid compounds quercetin and
catechin (OR (95% CI), p-value for trend: 0.77 (0.60, 0.99), 0.04; 0.75 (0.58-0.97), 0.02;
respectively); for the ω3PUFAs fatty acids (OR (95% CI), p-value for trend: 0.75 (0.59,
0.97), 0.01) and for the individual fatty acids stearic acid, EPA and DHA (OR (95% CI),
p-value for trend: 1.46 (1.11, 1.91), 0.01; 0.74 (0.58, 0.95), 0.02; 0.74 (0.58, 0.95), 0.02;
respectively). Regarding the last two hypotheses, statistically significant odds ratios
(ORs) (adjusted for age, sex, deprivation score, family history of cancer, BMI, physical
activity, smoking, and intakes of total energy, fibre, alcohol and NSAIDs) for highest
versus lowest intakes (quartiles) were observed for vitamin B6, vitamin B12 and alcohol
(OR (95% CI), p-value for trend: 0.86 (0.72, 1.03), 0.08; 0.80 (0.67, 0.97), 0.05; 0.83
(0.68, 1.00), 0.03); and for vitamin D (OR (95% CI), p-value for trend: 0.83 (0.69, 0.99),
0.03).
Regarding the second aim of the project, several risk factors were found to be
significantly associated with colorectal cancer in the overall analysis including
demographic and lifestyle factors (family history of cancer, NSAIDs intake, dietary
energy intake, HRT intake and physical activity), food group variables (vegetables, eggs,
sweets, fruit/ vegetable juice, oily fish, coffee, fruit, savoury foods and white fish) and
nutrient variables (tMUFAs, ω3PUFAs, SFAs, tFAs, MUFAs, quercetin, catechin,
phytoestrogen, cholesterol, fibre, protein, starch, magnesium, potassium, manganese,
copper, iron, zinc, phosphorus, selenium, niacin, vitamin B6, carotenes, vitamin C,

vi
vitamin A, potential niacin, biotin, folate, pantothenic acid, vitamin D, vitamin B1 and
vitamin B12). In addition, the variables that were selected to be included in 100% of the
models after applying forward and backward stepwise regression analyses were family
history, NSAIDs, sweets and fruit/ vegetable juice. Finally according to the findings
from the bootstrap analysis, the variables that were selected to be included in models for
the majority of the bootstrap samples (more than 90%) were family history, NSAIDs,
dietary energy, eggs, sweets, fruit/ vegetable juice and white fish.
Discussion
The particular dietary factors that were found to be inversely associated with colorectal
cancer after applying several multivariable logistic regression models were: flavonols,
quercetin, catechin, ω3PUFAs, EPA, DHA, vitamin B6, vitamin B12 and vitamin D. In
addition, high intakes of stearic acid were found to be positively associated with
colorectal cancer. In contrast, high intakes of dietary and total folate were associated
with a decreased colorectal cancer risk in the energy-adjusted model, but this inverse
association was attenuated after further adjustment for several confounding factors
including fibre. Regarding alcohol intake, when it was divided into quartiles, high
alcohol consumption was associated with a statistically significant and dose-dependent
decreased colorectal cancer risk. However, when alcohol intake was divided in
categories an increased colorectal cancer risk for intakes of higher than 60 g/day was
observed. Intakes of ω3PUFAs, vitamin D and vitamin B12 were highly correlated due
to having the same food source (oily fish) and therefore it is difficult to draw specific
conclusions regarding which nutrient is truly associated with colorectal cancer and
which not. Finally, it was observed that for calcium intakes to be inversely associated
with colorectal cancer, a dosage of 1500mg/day or higher was necessary. The majority
of these results are in accordance with results of previous epidemiological and
laboratory studies; however their confirmation in further large-scale studies is required.
Results from the overall and stepwise regression analysis supported previous findings of
an increased colorectal cancer risk due to a high or moderate family history risk. In
addition, high intakes of dietary energy were found to be positively associated with
increased colorectal cancer risk in the overall analysis and in addition dietary energy was

vii
selected to be included in the majority of the stepwise regression models. On the other
hand, regular intake of NSAIDs was found to be inversely associated with colorectal
cancer risk in the overall analysis and in the majority of the stepwise regression models.
Finally, the overall and stepwise regression analyses generated a few new hypotheses
suggesting that low intakes of fruit/ vegetable juice, eggs, white fish and sweets (a
combined variable of high-fat and high-sugar foods) and high intakes of coffee and
magnesium were associated with a decreased colorectal cancer. These findings, though
interesting and important for generation of new hypotheses, need further investigation
(as prior hypotheses) in large-scale observational studies.

viii
TABLE OF CONTENTS
1 COLORECTAL CANCER ........................................................................................................... 7 1.1 INTRODUCTION ..................................................................................................................... 7 1.2 LARGE INTESTINE .................................................................................................................. 7 1.3 CLINICAL CHARACTERISTICS OF COLORECTAL CANCER ........................................................... 8
1.3.1 Definition of colorectal cancer ......................................................................................... 8 1.3.2 Types of colorectal cancer ................................................................................................ 8 1.3.3 Classification of colorectal cancer ................................................................................... 9 1.3.4 Natural history of colorectal adenocarcinoma ................................................................ 11 1.3.5 Clinical grading and staging of colorectal cancer ........................................................... 13
1.4 EPIDEMIOLOGY OF COLORECTAL CANCER ............................................................................. 16 1.4.1 Prevalence of colorectal cancer ..................................................................................... 16 1.4.2 Incidence of colorectal cancer ........................................................................................ 16 1.4.3 Mortality rates of colorectal cancer ................................................................................ 27 1.4.4 Survival rates: Geographical and temporal trends .......................................................... 38 1.4.5 Colorectal cancer projections for Scotland ..................................................................... 42
1.5 MAIN RISK FACTORS ............................................................................................................ 43 1.5.1 Introduction ................................................................................................................... 43 1.5.2 Age ................................................................................................................................ 43 1.5.3 Previous colorectal cancer or adenomatous polyps ......................................................... 48 1.5.4 Family history of colorectal cancer ................................................................................ 48 1.5.5 Inflammatory bowel disease ........................................................................................... 49 1.5.6 Diet ............................................................................................................................... 50 1.5.7 Dietary energy intake ..................................................................................................... 53 1.5.8 Obesity .......................................................................................................................... 54 1.5.9 Physical activity ............................................................................................................. 55 1.5.10 Alcohol...................................................................................................................... 56 1.5.11 Smoking .................................................................................................................... 57 1.5.12 Non steroidal anti-inflammatory drugs and aspirin .................................................... 57 1.5.13 Hormone replacement therapy ................................................................................... 58
1.6 SUMMARY .......................................................................................................................... 59 2 AIMS AND OBJECTIVES.......................................................................................................... 61
2.1 INTRODUCTION ................................................................................................................... 61 2.2 AIMS .................................................................................................................................. 61
2.2.1 Aim 1: To investigate the association between specific nutrients and colorectal cancer ... 61 2.2.2 Aim 2: To conduct an overall analysis of the study and to identify the risk factors that
better explain colorectal cancer risk in this population by applying forward and backward stepwise
regression.................................................................................................................................... 62 2.3 OBJECTIVES ........................................................................................................................ 62
2.3.1 Objectives of aim 1 (Hypotheses 1-4) .............................................................................. 63 2.3.2 Objectives of aim 2......................................................................................................... 64
3 LITERATURE REVIEW OF EXAMINED DIETARY RISK FACTORS ................................ 66 3.1 INTRODUCTION ................................................................................................................... 66 3.2 FLAVONOIDS ....................................................................................................................... 67
3.2.1 Introduction ................................................................................................................... 67 3.2.2 Evidence from observational studies ............................................................................... 68
3.3 FATTY ACIDS ...................................................................................................................... 75 3.3.1 Introduction ................................................................................................................... 75 3.3.2 Evidence from observational studies ............................................................................... 76
3.4 FOLATE, VITAMIN B2, VITAMIN B6, VITAMIN B12................................................................ 102 3.4.1 Introduction .................................................................................................................. 102 3.4.2 Evidence from observational studies .............................................................................. 103
3.5 VITAMIN D AND CALCIUM .................................................................................................. 123

ix
3.5.1 Introduction .................................................................................................................. 123 3.5.2 Evidence from observational studies and randomised clinical trials ............................... 124
4 METHODS ................................................................................................................................ 141 4.1 INTRODUCTION .................................................................................................................. 141 4.2 SCOTTISH COLORECTAL CANCER STUDY ............................................................................ 141
4.2.1 Study design .................................................................................................................. 141 4.2.2 Ethical approval and consultant consent ....................................................................... 141 4.2.3 Case recruitment ........................................................................................................... 142 4.2.4 Control recruitment....................................................................................................... 143 4.2.5 Subject data processing and management ...................................................................... 147 4.2.6 Subject participation analysis ........................................................................................ 151 4.2.7 Biological materials ...................................................................................................... 156 4.2.8 Phenotype data collected ............................................................................................... 157 4.2.9 Self-administered lifestyle and food frequency questionnaires ........................................ 158
4.3 COLLECTION AND PROCESS OF LIFESTYLE AND DIETARY DATA ............................................. 162 4.3.1 Pre-entering (LCQ) or pre-scan (FFQ) review process .................................................. 166 4.3.2 Quality checking of data entry ....................................................................................... 170 4.3.3 Coding of the LCQ variables ......................................................................................... 170 4.3.4 Coding of the FFQ variables ......................................................................................... 181
4.4 COLLECTION AND PROCESS OF ADDITIONAL DATA ............................................................... 191 4.4.1 Deprivation category data ............................................................................................. 191 4.4.2 Family history risk ........................................................................................................ 192 4.4.3 Tumour related parameters ........................................................................................... 192 4.4.4 Genetic data of specific variants .................................................................................... 195
4.5 DATA ANALYSIS OF PART 1 (HYPOTHESIS DRIVEN ANALYSES) .............................................. 196 4.5.1 Introduction .................................................................................................................. 196 4.5.2 Matched and unmatched dataset.................................................................................... 196 4.5.3 List of variables ............................................................................................................ 197 4.5.4 Statistical analysis of part 1 .......................................................................................... 199
4.6 DATA ANALYSIS OF PART 2 (OVERALL AND STEPWISE REGRESSION ANALYSIS) ..................... 203 4.6.1 Introduction .................................................................................................................. 203 4.6.2 Dataset ......................................................................................................................... 203 4.6.3 List of variables ............................................................................................................ 203 4.6.4 Statistical analysis of part 2 .......................................................................................... 206
5 RESULTS: DESCRIPTION OF THE RESULTS PRESENTATION ...................................... 208 6 RESULTS: ASSOCIATIONS BETWEEN COLORECTAL CANCER AND INTAKES OF FLAVONOIDS AND FATTY ACIDS (MATCHED DATASET) ...................................................... 209
6.1 INTRODUCTION .................................................................................................................. 209 6.2 THE STUDY SAMPLE............................................................................................................ 209
6.2.1 Descriptive analysis of the confounding factors ............................................................. 209 6.2.2 Associations between confounding factors and colorectal cancer risk ............................ 210
6.3 FLAVONOIDS ...................................................................................................................... 215 6.3.1 Descriptive analysis ...................................................................................................... 215 6.3.2 Associations between flavonoid variables and colorectal cancer risk ............................. 217 6.3.3 Summary of results ........................................................................................................ 219
6.4 FATTY ACIDS ..................................................................................................................... 232 6.4.1 Descriptive analysis ...................................................................................................... 232 6.4.2 Associations between fatty acid variables and colorectal cancer risk ............................. 234 6.4.3 Summary of results ........................................................................................................ 238
6.5 SUMMARY OF RESULTS OF CHAPTER 6 ................................................................................. 258 6.5.1 Flavonoids .................................................................................................................... 258 6.5.2 Fatty acids .................................................................................................................... 259

x
7 RESULTS: ASSOCIATIONS BETWEEN COLORECTAL CANCER AND INTAKES OF FOLATE, VITAMIN B2, VITAMIN B6, VITAMIN B12, ALCOHOL, VITAMIN D AND CALCIUM (UNMATCHED DATASET)........................................................................................... 260
7.1 INTRODUCTION .................................................................................................................. 260 7.2 THE STUDY SAMPLE............................................................................................................ 260
7.2.1 Descriptive analysis of the confounding factors ............................................................. 260 7.2.2 Associations between confounding factors and colorectal cancer risk ............................ 261
7.3 FOLATE, VITAMIN B2, VITAMIN B6, VITAMIN B12 AND ALCOHOL ......................................... 266 7.3.1 Descriptive analysis ...................................................................................................... 266 7.3.2 Associations between folate, vitamin B2, vitamin B6, vitamin B12, alcohol and colorectal
cancer risk .................................................................................................................................. 267 7.3.3 Summary of results ........................................................................................................ 270
7.4 VITAMIN D AND CALCIUM .................................................................................................. 280 7.4.1 Descriptive analysis ...................................................................................................... 280 7.4.2 Associations between vitamin D, calcium and colorectal cancer risk .............................. 281 7.4.3 Summary of results ........................................................................................................ 284
7.5 SUMMARY OF RESULTS OF CHAPTER 7 ................................................................................. 291 7.5.1 Folate, vitamin B2, vitamin B6, vitamin B12 and alcohol ............................................... 291 7.5.2 Vitamin D and calcium .................................................................................................. 292
8 RESULTS: OVERALL AND STEPWISE REGRESSION ANALYSIS .................................. 293 8.1 INTRODUCTION .................................................................................................................. 293 8.2 OVERALL ANALYSIS ........................................................................................................... 293
8.2.1 Distribution of explanatory variables by case control status........................................... 293 8.2.2 Correlation matrix for the explanatory variables ........................................................... 300 8.2.3 Univariable logistic regression of the explanatory variables .......................................... 311
8.3 STEPWISE REGRESSION ANALYSIS ....................................................................................... 321 8.3.1 Set 1: Demographic factors, lifestyle variables and foods .............................................. 321 8.3.2 Set 2: Demographic factors, lifestyle variables and nutrients ......................................... 327 8.3.3 Set 3: Demographic factors, lifestyle variables, foods and nutrients ............................... 334
8.4 SUMMARY OF RESULTS OF CHAPTER 8 ................................................................................. 343 8.4.1 Overall analysis ............................................................................................................ 343 8.4.2 Stepwise regression analysis ......................................................................................... 343
9 DISCUSSION ............................................................................................................................ 346 9.1 INTRODUCTION .................................................................................................................. 346 9.2 METHODOLOGICAL AND ANALYTICAL ISSUES ...................................................................... 346
9.2.1 Epidemiological issues .................................................................................................. 347 9.2.2 Nutritional epidemiology issues ..................................................................................... 354 9.2.3 Issues on applied analytical methods ............................................................................. 365
9.3 MAIN FINDINGS .................................................................................................................. 372 9.3.1 Main findings of part 1: Hypothesis driven analysis ....................................................... 372 9.3.2 Main findings of part 2: Overall and stepwise regression analysis ................................. 405
9.4 CONCLUSIONS AND RECOMMENDATIONS ............................................................................. 415 9.4.1 Conclusions .................................................................................................................. 415 9.4.2 Recommendations ......................................................................................................... 419

1
LIST OF TABLES
TABLE 1 SUMMARY OF DUKE’S STAGING SYSTEM ................................................................................... 14 TABLE 2 SUMMARY OF TNM CLASSIFICATION ........................................................................................ 15 TABLE 3 SUMMARY OF AJCC STAGING SYSTEM
* .................................................................................... 15 TABLE 4 COLORECTAL CANCER RISK AND FLAVONOID INTAKE; RESULTS FROM PUBLISHED COHORT STUDIES
(1990-2008) .......................................................................................................................................... 70 TABLE 5 COLORECTAL CANCER RISK AND FLAVONOID INTAKE; RESULTS FROM PUBLISHED CASE-CONTROL
STUDIES (1990-2008) ............................................................................................................................ 73 TABLE 6 COLORECTAL CANCER RISK AND SATURATED FAT OR SATURATED FATTY ACIDS; RESULTS FROM
PUBLISHED COHORT STUDIES (1990-2008) .............................................................................................. 78 TABLE 7 COLORECTAL CANCER RISK AND SATURATED FAT OR SATURATED FATTY ACIDS; RESULTS FROM
PUBLISHED CASE-CONTROL STUDIES (1990-2008) ................................................................................... 80 TABLE 8 COLORECTAL CANCER RISK AND MONO-UNSATURATED FAT OR MONO-UNSATURATED FATTY
ACIDS; RESULTS FROM PUBLISHED COHORT STUDIES (1990-2008) ........................................................... 83 TABLE 9 COLORECTAL CANCER RISK AND MONO-UNSATURATED FAT OR MONO-UNSATURATED FATTY
ACIDS; RESULTS FROM PUBLISHED CASE-CONTROL STUDIES (1990-2008) ................................................ 85 TABLE 10 COLORECTAL CANCER RISK AND POLY-UNSATURATED FAT OR POLY-UNSATURATED FATTY ACIDS;
RESULTS FROM PUBLISHED COHORT STUDIES (1990-2008) ...................................................................... 88 TABLE 11 COLORECTAL CANCER RISK AND POLY-UNSATURATED FAT OR POLY-UNSATURATED FATTY ACIDS;
RESULTS FROM PUBLISHED CASE-CONTROL STUDIES (1990-2008) ........................................................... 89 TABLE 12 COLORECTAL CANCER RISK AND OMEGA-3 POLY-UNSATURATED FATTY ACIDS; RESULTS FROM
PUBLISHED COHORT STUDIES (1990-2008) .............................................................................................. 91 TABLE 13 COLORECTAL CANCER RISK AND OMEGA-3 POLY-UNSATURATED FATTY ACIDS; RESULTS FROM
PUBLISHED CASE-CONTROL AND NESTED CASE-CONTROL STUDIES (1990-2008) ....................................... 93 TABLE 14 COLORECTAL CANCER RISK AND OMEGA-6 POLY-UNSATURATED FATTY ACIDS; RESULTS FROM
PUBLISHED COHORT STUDIES (1990-2008) .............................................................................................. 96 TABLE 15 COLORECTAL CANCER RISK AND OMEGA-6 POLY-UNSATURATED FATTY ACIDS; RESULTS FROM
PUBLISHED CASE-CONTROL STUDIES (1990-2008) ................................................................................... 97 TABLE 16 COLORECTAL CANCER RISK AND TRANS FATTY ACIDS; RESULTS FROM PUBLISHED COHORT
STUDIES (1990-2008) ........................................................................................................................... 100 TABLE 17 COLORECTAL CANCER RISK AND TRANS FATTY ACIDS; RESULTS FROM PUBLISHED CASE-CONTROL
STUDIES (1990-2008) ........................................................................................................................... 101 TABLE 18 COLORECTAL CANCER RISK AND FOLATE; RESULTS FROM PUBLISHED COHORT STUDIES (1990-
2008) ................................................................................................................................................... 106 TABLE 19 COLORECTAL CANCER RISK AND FOLATE; RESULTS FROM PUBLISHED CASE-CONTROL STUDIES
(1990-2008) ......................................................................................................................................... 109 TABLE 20 COLORECTAL CANCER RISK AND VITAMIN B2 (RIBOFLAVIN); RESULTS FROM PUBLISHED COHORT
STUDIES (1990-2008) ........................................................................................................................... 113 TABLE 21 COLORECTAL CANCER RISK AND VITAMIN B2 (RIBOFLAVIN); RESULTS FROM PUBLISHED CASE-
CONTROL STUDIES (1990-2008) ............................................................................................................ 114 TABLE 22 COLORECTAL CANCER RISK AND VITAMIN B6; RESULTS FROM PUBLISHED COHORT STUDIES
(1990-2008) ......................................................................................................................................... 116 TABLE 23 COLORECTAL CANCER RISK AND VITAMIN B6; RESULTS FROM PUBLISHED CASE-CONTROL
STUDIES (1990-2008) ........................................................................................................................... 117 TABLE 24 COLORECTAL CANCER RISK AND VITAMIN B12; RESULTS FROM PUBLISHED COHORT STUDIES
(1990-2008) ......................................................................................................................................... 120 TABLE 25 COLORECTAL CANCER RISK AND VITAMIN B12; RESULTS FROM PUBLISHED CASE-CONTROL
STUDIES (1990-2008) ........................................................................................................................... 121 TABLE 26 COLORECTAL CANCER RISK AND VITAMIN D; RESULTS FROM PUBLISHED COHORT STUDIES (1990-
2008) ................................................................................................................................................... 125 TABLE 27 COLORECTAL CANCER RISK AND VITAMIN D; RESULTS FROM PUBLISHED CASE-CONTROL STUDIES
(1990-2008) ......................................................................................................................................... 128

2
TABLE 28 COLORECTAL CANCER RISK AND SERUM/ PLASMA VITAMIN D METABOLITES; RESULTS FROM
PUBLISHED NESTED CASE-CONTROL STUDIES (1990-2008) ...................................................................... 130 TABLE 29 COLORECTAL CANCER RISK AND CALCIUM; RESULTS FROM PUBLISHED COHORT STUDIES (1990-
2008) ................................................................................................................................................... 132 TABLE 30 COLORECTAL CANCER RISK AND CALCIUM; RESULTS FROM PUBLISHED CASE-CONTROL STUDIES
(1990-2008) ......................................................................................................................................... 137 TABLE 31 LIST OF DETAILS INCLUDED IN THE MAIN DATABASE: CASES .................................................. 148 TABLE 32 LIST OF DETAILS INCLUDED IN THE MAIN DATABASE: CONTROLS ............................................ 149 TABLE 33 DISTRIBUTION OF CASES ACROSS SEX, AGE, AND HEALTH BOARD AREA OF RESIDENCE FOR
PARTICIPANTS, NON-PARTICIPANTS AND WITHDRAWN SUBJECTS ............................................................. 152 TABLE 34 REASON OF NO RESPONSE FOR NON-PARTICIPANTS ................................................................. 153 TABLE 35 DISTRIBUTION OF CONTROLS ACROSS SEX, AGE, HEALTH BOARD AREA OF RESIDENCE AND
CARSTAIRS DEPRIVATION INDEX FOR PARTICIPANTS, NON-PARTICIPANTS AND WITHDRAWN SUBJECTS ..... 154 TABLE 36 LIFESTYLE AND CANCER QUESTIONNAIRE SECTIONS AND QUESTIONS ..................................... 160 TABLE 37 FFQ FOOD GROUPS AND OTHER SECTIONS .............................................................................. 161 TABLE 38 DISTRIBUTION OF CASES ACROSS SEX, AGE, HEALTH BOARD AREA OF RESIDENCE AND
DEPRIVATION EXAMINED ACCORDING TO THE QUESTIONNAIRE STATUS ................................................... 163 TABLE 39 DISTRIBUTION OF CONTROLS ACROSS SEX, AGE, HEALTH BOARD AREA OF RESIDENCE AND
DEPRIVATION EXAMINED ACCORDING TO THE QUESTIONNAIRE STATUS ................................................... 164 TABLE 40 LIST OF VARIABLES CODED FROM THE LCQ ........................................................................... 170 TABLE 41 SMOKING VARIABLES ............................................................................................................ 171 TABLE 42 OCCUPATIONAL PHYSICAL ACTIVITY ..................................................................................... 175 TABLE 43 MAXIMUM VALUES FOR RECREATIONAL PHYSICAL ACTIVITIES, STAIR CLIMBING AND HOURS OF
VIGOROUS PHYSICAL ACTIVITY ............................................................................................................. 175 TABLE 44 LEISURE TIME PHYSICAL ACTIVITY ........................................................................................ 176 TABLE 45 TOTAL PHYSICAL ACTIVITY INDEX (ACCORDING TO THE REPORTED OCCUPATIONAL,
RECREATIONAL, HOUSEHOLD VIGOROUS AND STAIR CLIMBING ACTIVITIES)............................................. 176 TABLE 46 CAMBRIDGE PHYSICAL ACTIVITY INDEX (ACCORDING TO THE REPORTED OCCUPATIONAL
PHYSICAL ACTIVITY AND TWO RECREATIONAL PHYSICAL ACTIVITIES: CYCLING AND DOING SPORTS)........ 177 TABLE 47 DISTRIBUTION OF STUDY PARTICIPANTS ACCORDING TO THE TOTAL PHYSICAL ACTIVITY INDEX,
THE CAMBRIDGE PHYSICAL ACTIVITY INDEX AND THE LIMITED PHYSICAL ACTIVITY MEASUREMENT ....... 177 TABLE 48 DISTRIBUTION OF STUDY PARTICIPANTS ACCORDING TO INTAKE OF MEDICINES ....................... 178 TABLE 49 DISTRIBUTION OF FEMALE STUDY PARTICIPANTS ALONG THE WOMEN’S HEALTH PART QUESTIONS
............................................................................................................................................................ 179 TABLE 50 DISTRIBUTION OF STUDY PARTICIPANTS IN BMI CATEGORIES ................................................. 180 TABLE 51 LIST OF MACRO- AND MICRO-NUTRIENT INTAKES FROM THE SCG-FFQ ................................... 183 TABLE 52 LIST OF FLAVONOIDS AND PHYTOESTROGENS ESTIMATED FROM THE SCG-FFQ ....................... 184 TABLE 53 LIST OF TOTAL AND SPECIFIC FATTY ACID CATEGORIES ESTIMATED FROM THE SCG-FFQ ........ 185 TABLE 54 LIST OF FOOD GROUP VARIABLES AND OTHER FOOD-ASSOCIATED VARIABLES .......................... 187 TABLE 55 CARSTAIRS DEPRIVATION INDEX CRITERIA ............................................................................ 191 TABLE 56 DISTRIBUTION OF CASES AND CONTROLS ALONG THE CATEGORIES OF CARSTAIRS DEPRIVATION
INDEX .................................................................................................................................................. 191 TABLE 57 DISTRIBUTION OF CASES AND CONTROLS OF ASSIGNED FAMILY HISTORY ................................. 193 TABLE 58 DISTRIBUTION OF CASES ACCORDING TO TUMOUR LOCATION .................................................. 193 TABLE 59 DISTRIBUTION OF THE CASES ALONG THE CATEGORIES OF THE DUKE’S AND AJCC STAGE
SYSTEMS .............................................................................................................................................. 194 TABLE 60 LIST OF THE VARIABLES INCLUDED IN THE FIRST PART OF THE ANALYSIS (FOUR HYPOTHESES) AND
LIST OF THE POTENTIAL CONFOUNDING FACTORS ................................................................................... 198 TABLE 61 LIST OF THE VARIABLES INCLUDED IN THE THREE DATASETS OF THE SECOND PART OF THE
ANALYSIS. ALL FOOD AND NUTRIENT VARIABLES WERE RESIDUALLY ADJUSTED FOR DIETARY ENERGY,
EXCEPT FOR THE FOOD VARIABLES: TEA AND COFFEE AND THE NUTRIENTS: FLAVONES AND FLAVAN-3-OLS.
............................................................................................................................................................ 204 TABLE 62 SUMMARY STATISTICS OF THE CONFOUNDING FACTORS FOR THE MATCHED DATASET .............. 211

3
TABLE 63 ASSOCIATION BETWEEN THE CONFOUNDING FACTORS AND COLORECTAL CANCER RISK
(UNIVARIABLE CONDITIONAL LOGISTIC REGRESSION ANALYSIS) ............................................................. 213 TABLE 64 FLAVONOID VARIABLES (SUBGROUPS AND INDIVIDUAL COMPOUNDS) THAT WERE ELECTED TO BE
INCLUDED IN THE ANALYSIS .................................................................................................................. 220 TABLE 65 DESCRIPTIVE REPORT OF CRUDE AND ENERGY-ADJUSTED FLAVONOID INTAKES ....................... 221 TABLE 66 SPEARMAN RANK CORRELATION COEFFICIENTS BETWEEN FLAVONOID VARIABLES (N=2978, ALL
P-VALUES<5X10⁻⁵) ............................................................................................................................... 223 TABLE 67 THREE MAIN DIETARY (FOOD) SOURCES OF FLAVONOIDS IN OUR POPULATION ......................... 224 TABLE 68 ASSOCIATION BETWEEN THE FLAVONOID VARIABLES AND COLORECTAL CANCER RISK IN THE
WHOLE SAMPLE (3 MAIN CONDITIONAL LOGISTIC REGRESSION MODELS; CASES AND CONTROLS MATCHED ON
AGE, GENDER AND AREA OF RESIDENCE) ................................................................................................ 225 TABLE 69 ASSOCIATION BETWEEN THE FLAVONOID VARIABLES AND COLORECTAL CANCER RISK IN THE
WHOLE SAMPLE (2 ADDITIONAL CONDITIONAL LOGISTIC REGRESSION MODELS; CASES AND CONTROLS
MATCHED ON AGE, GENDER AND AREA OF RESIDENCE) ........................................................................... 228 TABLE 70 ASSOCIATION BETWEEN INTAKES OF TEA, ONIONS, APPLES AND RED WINE AND COLORECTAL
CANCER RISK IN THE WHOLE SAMPLE (3 MAIN CONDITIONAL LOGISTIC REGRESSION MODELS; CASES AND
CONTROLS MATCHED ON AGE, GENDER AND AREA OF RESIDENCE) .......................................................... 230 TABLE 71 FATTY ACID VARIABLES (TOTAL FAS, SUBGROUPS AND INDIVIDUAL COMPOUNDS) THAT WERE
ELECTED TO BE INCLUDED IN THE ANALYSIS .......................................................................................... 239 TABLE 72 DESCRIPTIVE REPORT OF CRUDE AND ENERGY-ADJUSTED FATTY ACID INTAKES ....................... 240 TABLE 73 SPEARMAN RANK CORRELATION COEFFICIENTS BETWEEN FATTY ACID VARIABLES (ALL P-VALUES<5X10⁻⁵) .................................................................................................................................. 243 TABLE 74 THREE MAIN DIETARY (FOOD) SOURCES OF FATTY ACIDS IN OUR POPULATION ......................... 244 TABLE 75 ASSOCIATION BETWEEN THE FATTY ACID VARIABLES AND COLORECTAL CANCER RISK IN THE
WHOLE SAMPLE (3 MAIN CONDITIONAL LOGISTIC REGRESSION MODELS; CASES AND CONTROLS MATCHED ON
AGE, GENDER AND AREA OF RESIDENCE) ................................................................................................ 246 TABLE 76 ASSOCIATION BETWEEN THE FATTY ACID VARIABLES AND COLORECTAL CANCER RISK IN THE
WHOLE SAMPLE (2 ADDITIONAL CONDITIONAL LOGISTIC REGRESSION MODELS; CASES AND CONTROLS
MATCHED ON AGE, GENDER AND AREA OF RESIDENCE) ........................................................................... 253 TABLE 77 ASSOCIATION BETWEEN MEAT AND MEAT PRODUCTS, CONFECTIONERY AND SAVOURY SNACKS,
FISH AND FISH DISHES AND COLORECTAL CANCER RISK IN THE WHOLE SAMPLE (3 MAIN CONDITIONAL
LOGISTIC REGRESSION MODELS; CASES AND CONTROLS MATCHED ON AGE, GENDER AND AREA OF
RESIDENCE) .......................................................................................................................................... 257 TABLE 78 SUMMARY STATISTICS OF THE CONFOUNDING FACTORS FOR THE UNMATCHED DATASET .......... 262 TABLE 79 ASSOCIATION BETWEEN THE CONFOUNDING FACTORS AND COLORECTAL CANCER RISK
(UNIVARIABLE LOGISTIC REGRESSION ANALYSIS) ................................................................................... 264 TABLE 80 NUTRIENTS INVOLVED IN THE ONE-CARBON METABOLIC PATHWAY THAT WERE ELECTED TO BE
INCLUDED IN THE ANALYSIS .................................................................................................................. 272 TABLE 81 DESCRIPTIVE REPORT OF CRUDE AND ENERGY-ADJUSTED NUTRIENTS INVOLVED IN THE ONE-
CARBON METABOLIC PATHWAY ............................................................................................................. 272 TABLE 82 SPEARMAN RANK CORRELATION COEFFICIENTS BETWEEN NUTRIENTS INVOLVED IN THE ONE-
CARBON METABOLIC PATHWAY (ALL P-VALUES<5X10⁻⁵) ........................................................................ 274 TABLE 83 THREE MAIN DIETARY (FOOD) SOURCES OF NUTRIENTS INVOLVED IN THE ONE-CARBON
METABOLIC PATHWAY IN OUR POPULATION ........................................................................................... 274 TABLE 84 ASSOCIATION BETWEEN THE NUTRIENTS INVOLVED IN THE ONE-CARBON METABOLIC PATHWAY
AND COLORECTAL CANCER RISK IN THE WHOLE SAMPLE (3 MAIN UNCONDITIONAL LOGISTIC REGRESSION
MODELS) .............................................................................................................................................. 275 TABLE 85 ASSOCIATION BETWEEN BOILED OR BAKED POTATOES, BRAN FLAKES, BANANAS, FRIED OILY FISH,
LIVER SAUSAGE OR LIVER PATE AND COLORECTAL CANCER RISK IN THE WHOLE SAMPLE (3 MAIN
UNCONDITIONAL LOGISTIC REGRESSION MODELS) .................................................................................. 278 TABLE 86 VITAMIN D AND CALCIUM TRANSFORMATION ........................................................................ 285 TABLE 87 DESCRIPTIVE REPORT OF CRUDE AND ENERGY-ADJUSTED INTAKES OF VITAMIN D AND CALCIUM
............................................................................................................................................................ 285 TABLE 88 SPEARMAN RANK CORRELATION COEFFICIENTS BETWEEN NUTRIENTS (P-VALUES<5X10⁻⁵) ....... 285

4
TABLE 89 THREE MAIN DIETARY (FOOD) SOURCES OF VITAMIN D AND CALCIUM IN OUR POPULATION ...... 285 TABLE 90 ASSOCIATION BETWEEN VITAMIN D, CALCIUM AND COLORECTAL CANCER RISK IN THE WHOLE
SAMPLE (3 MAIN UNCONDITIONAL LOGISTIC REGRESSION MODELS) ........................................................ 286 TABLE 91 ASSOCIATION BETWEEN VITAMIN D, CALCIUM AND COLORECTAL CANCER RISK IN THE WHOLE
SAMPLE (ADDITIONAL UNCONDITIONAL LOGISTIC REGRESSION MODELS) ................................................ 288 TABLE 92 ASSOCIATION BETWEEN FRIED OILY FISH, SMOKED OILY FISH, SEMI-SKIMMED MILK AND FULL FAT
HARD CHEESE AND COLORECTAL CANCER RISK IN THE WHOLE SAMPLE (3 MAIN UNCONDITIONAL LOGISTIC
REGRESSION MODELS) .......................................................................................................................... 289 TABLE 93 DESCRIPTIVE REPORT OF ALL EXPLANATORY VARIABLES (CATEGORICAL VARIABLES) ............. 295 TABLE 94 DESCRIPTIVE REPORT OF ALL EXPLANATORY VARIABLES (CONTINUOUS VARIABLES) ............... 296 TABLE 95 CORRELATION MATRIX OF THE EXPLANATORY VARIABLES (DEMOGRAPHIC FACTORS, LIFESTYLE
FACTORS, FOODS AND NUTRIENTS) ........................................................................................................ 301 TABLE 96 UNIVARIABLE LOGISTIC REGRESSION OF COLORECTAL CANCER ON EACH EXPLANATORY
VARIABLE INCLUDED IN THE STEPWISE REGRESSION (2061 CASES; 2776 CONTROLS) ................................ 312 TABLE 97 SET 1: STEPWISE REGRESSION BUILT MODEL USING THE QUARTILE FORM OF THE CONTINUOUS
VARIABLES (WHOLE SAMPLE; FORWARD AND BACKWARD STEPWISE REGRESSION RESULTED TO THE SAME
MODEL) ................................................................................................................................................ 326 TABLE 98 SET 2: FORWARD STEPWISE REGRESSION BUILT MODEL USING THE QUARTILE FORM OF THE
CONTINUOUS VARIABLES (WHOLE SAMPLE)........................................................................................... 332 TABLE 99 SET 2: BACKWARD STEPWISE REGRESSION BUILT MODEL USING THE QUARTILE FORM OF THE
CONTINUOUS VARIABLES (WHOLE SAMPLE)........................................................................................... 333 TABLE 100 SET 3: FORWARD STEPWISE REGRESSION BUILT MODEL USING THE QUARTILE FORM OF THE
CONTINUOUS VARIABLES ...................................................................................................................... 339 TABLE 101 SET 3: BACKWARD STEPWISE REGRESSION BUILT MODEL USING THE QUARTILE FORM OF THE
CONTINUOUS VARIABLES ...................................................................................................................... 340 TABLE 102 MATRIX OF THE VARIABLES INCLUDED IN THE THREE SETS AND FINALLY SELECTED INTO THE
FORWARD OR BACKWARD STEPWISE REGRESSION MODELS IN THE WHOLE SAMPLE AND AFTER SEX
STRATIFICATION (ORIGINAL SAMPLE) .................................................................................................... 341

5
LIST OF FIGURES
FIGURE 1 AGE STANDARDISED (EUROPEAN STANDARD POPULATION) INCIDENCE RATES OF COLORECTAL
CANCER (PER 100,000) IN SCOTTISH HEALTH BOARDS BY SEX. INCIDENCE RATES MARKED WITH A STAR (*)
WERE BASED ON LOW NUMBERS (≤50); (2005, CANCER REGISTRY SCOTLAND, ISD). ............................... 19 FIGURE 2 AGE STANDARDISED (EUROPEAN STANDARD POPULATION) INCIDENCE RATES OF COLORECTAL
CANCER (PER 100,000) IN SCOTLAND BY SEX (2005; CANCER REGISTRY SCOTLAND, ISD) ....................... 20 FIGURE 3 AGE STANDARDISED (EUROPEAN STANDARD POPULATION) INCIDENCE RATES OF COLORECTAL
CANCER (PER 100,000) IN THE UK BY SEX (2004; CANCER RESEARCH UK) ............................................. 20 FIGURE 4 AGE STANDARDISED (EUROPEAN STANDARD POPULATION) INCIDENCE RATES OF COLORECTAL
CANCER (PER 100,000) IN EUROPE BY SEX (2006 ESTIMATES; CANCER RESEARCH UK) ............................ 21 FIGURE 5 AGE STANDARDISED (WORLD STANDARD POPULATION) INCIDENCE RATES OF COLORECTAL
CANCER (PER 100,000) WORLDWIDE BY SEX (2002 ESTIMATES; INTERNATIONAL AGENCY FOR RESEARCH IN
CANCER); (*MORE DEVELOPED REGIONS INCLUDE: ALL COUNTRIES OF EUROPE, JAPAN, AUSTRALIA, NEW
ZEALAND AND ALL COUNTRIES OF NORTH AMERICA; LESS DEVELOPED REGIONS INCLUDE ALL COUNTRIES
OF: AFRICA, LATIN AMERICA, THE CARIBBEAN, ASIA -EXCLUDING JAPAN, MICRONESIA, POLYNESIA AND
MELANESIA) ......................................................................................................................................... 22 FIGURE 6 MAPS OF AGE STANDARDISED INCIDENCE RATES OF COLORECTAL CANCER (WORLD STANDARD
POPULATION) SEPARATELY FOR MEN AND WOMEN; SOURCE: INTERNATIONAL AGENCY FOR RESEARCH ON
CANCER (2002 ESTIMATES) .................................................................................................................... 23 FIGURE 7 AGE STANDARDISED (EUROPEAN STANDARD POPULATION) INCIDENCE RATES OF COLORECTAL
CANCER (PER 100,000) IN SCOTLAND BY SEX FROM 1982 TO 2005 (CANCER REGISTRY SCOTLAND, ISD).. 24 FIGURE 8 AGE STANDARDISED (EUROPEAN STANDARD POPULATION) INCIDENCE RATES OF COLORECTAL
CANCER (PER 100,000) IN GREAT BRITAIN BY SEX FROM 1982 TO 2005 (CANCER RESEARCH UK) ............ 24 FIGURE 9 AGE STANDARDISED (WORLD STANDARD POPULATION) INCIDENCE RATES OF MALE COLORECTAL
CANCER (PER 100,000) IN SELECTED COUNTRIES FROM 1982 TO 2002 (INTERNATIONAL AGENCY FOR
RESEARCH ON CANCER) ......................................................................................................................... 25 FIGURE 10 AGE STANDARDISED (WORLD STANDARD POPULATION) INCIDENCE RATES OF FEMALE
COLORECTAL CANCER (PER 100,000) IN SELECTED COUNTRIES FROM 1982 TO 2002 (INTERNATIONAL
AGENCY FOR RESEARCH ON CANCER) ..................................................................................................... 26 FIGURE 11 AGE STANDARDISED (EUROPEAN STANDARD POPULATION) MORTALITY RATES OF COLORECTAL
CANCER (PER 100,000) IN SCOTTISH HEALTH BOARDS BY SEX. MORTALITY RATES MARKED WITH A STAR (*)
WERE BASED ON LOW NUMBERS (≤50); (2006, CANCER REGISTRY SCOTLAND, ISD) ................................ 30 FIGURE 12 AGE STANDARDISED (EUROPEAN STANDARD POPULATION) MORTALITY RATES OF COLORECTAL
CANCER (PER 100,000) IN SCOTLAND BY SEX (2006; CANCER REGISTRY SCOTLAND, ISD) ....................... 31 FIGURE 13 AGE STANDARDISED (EUROPEAN STANDARD POPULATION) MORTALITY RATES OF COLORECTAL
CANCER (PER 100,000) IN THE UK BY SEX (2005; CANCER RESEARCH UK) ............................................. 31 FIGURE 14 AGE STANDARDISED (WORLD STANDARD POPULATION) MORTALITY RATES OF COLORECTAL
CANCER (PER 100,000) IN EUROPE BY SEX (2002 ESTIMATES; INTERNATIONAL AGENCY FOR RESEARCH ON
CANCER) ............................................................................................................................................... 32 FIGURE 15 AGE STANDARDISED (WORLD STANDARD POPULATION) MORTALITY RATES OF COLORECTAL
CANCER (PER 100,000) WORLDWIDE BY SEX (2002 ESTIMATES; INTERNATIONAL AGENCY FOR RESEARCH ON
CANCER); (*MORE DEVELOPED REGIONS INCLUDE: ALL COUNTRIES OF EUROPE, JAPAN, AUSTRALIA, NEW
ZEALAND AND ALL COUNTRIES OF NORTH AMERICA; LESS DEVELOPED REGIONS INCLUDE ALL COUNTRIES
OF: AFRICA, LATIN AMERICA, THE CARIBBEAN, ASIA -EXCLUDING JAPAN, MICRONESIA, POLYNESIA AND
MELANESIA) ......................................................................................................................................... 33 FIGURE 16 MAPS OF AGE STANDARDISED MORTALITY RATES OF COLORECTAL CANCER (WORLD STANDARD
POPULATION) SEPARATELY FOR MEN AND WOMEN; SOURCE: INTERNATIONAL AGENCY FOR RESEARCH ON
CANCER (2002 ESTIMATES) .................................................................................................................... 34 FIGURE 17 AGE STANDARDISED (EUROPEAN STANDARD POPULATION) MORTALITY RATES OF COLORECTAL
CANCER (PER 100,000) IN SCOTLAND BY SEX FROM 1983 TO 2006 (CANCER REGISTRY SCOTLAND, ISD).. 35 FIGURE 18 AGE STANDARDISED (EUROPEAN STANDARD POPULATION) MORTALITY RATES OF COLORECTAL
CANCER (PER 100,000) IN THE UK BY SEX FROM 1982 TO 2005 (CANCER RESEARCH UK) ........................ 35

6
FIGURE 19 NUMBER OF DEATHS FROM COLORECTAL CANCER FOR MEN IN SELECTED COUNTRIES FROM 1983
TO 2003 (INTERNATIONAL AGENCY FOR RESEARCH IN CANCER) .............................................................. 36 FIGURE 20 NUMBER OF DEATHS FROM COLORECTAL CANCER FOR WOMEN IN SELECTED COUNTRIES FROM
1983 TO 2003 (INTERNATIONAL AGENCY FOR RESEARCH IN CANCER) ...................................................... 37 FIGURE 21 AGE STANDARDISED ONE-YEAR AND FIVE-YEAR RELATIVE SURVIVAL RATES (EUROPEAN
CANCER PATIENT POPULATION - EUROCARE-4) FOR PATIENTS DIAGNOSED IN SCOTLAND, 1980-2004
(CANCER REGISTRY SCOTLAND, ISD). (NOTE: 5-YEAR SURVIVAL RATES FOR TIME PERIOD 2000-2004 ARE
BASED ON ESTIMATES). .......................................................................................................................... 40 FIGURE 22 AGE STANDARDISED ONE-YEAR AND FIVE-YEAR RELATIVE SURVIVAL RATES FOR PATIENTS
DIAGNOSED IN ENGLAND, WALES AND N. IRELAND, 1981-2001 (CANCER RESEARCH UK). (NOTE: 1- AND 5-
YEAR SURVIVAL RATES FOR TIME PERIOD 2000-2001 ARE BASED ON ESTIMATES). .................................... 41 FIGURE 23 COLORECTAL CANCER INCIDENCE PROJECTIONS FOR SCOTLAND (2001-2020) FOR THE WHOLE
POPULATION AND AFTER AGE STRATIFICATION (<75, 75+ YEARS OLD). (THE SCOTTISH GOVERNMENT
STATISTICS) .......................................................................................................................................... 42 FIGURE 24 NUMBERS OF NEW CASES AND AGE-SPECIFIC INCIDENCE RATES BY SEX FOR COLORECTAL
CANCER IN SCOTLAND (2005, CANCER REGISTRY SCOTLAND, ISD) ........................................................ 44 FIGURE 25 NUMBERS OF NEW CASES AND AGE-SPECIFIC INCIDENCE RATES BY SEX FOR COLORECTAL
CANCER IN THE UK (2004, CANCER RESEARCH UK) ............................................................................... 44 FIGURE 26 NUMBERS OF NEW CASES AND AGE-SPECIFIC INCIDENCE RATES FOR COLORECTAL CANCER IN
MEN IN SELECTED COUNTRIES (2002, INTERNATIONAL AGENCY FOR RESEARCH IN CANCER) ..................... 45 FIGURE 27 NUMBERS OF NEW CASES AND AGE-SPECIFIC INCIDENCE RATES FOR COLORECTAL CANCER IN
WOMEN IN SELECTED COUNTRIES (2002, INTERNATIONAL AGENCY FOR RESEARCH IN CANCER) ................ 46 FIGURE 28 AGE SPECIFIC 5-YEAR RELATIVE SURVIVAL (%) IN SCOTLAND FOR 1995-1999 (CANCER
REGISTRY SCOTLAND, ISD) ................................................................................................................... 47 FIGURE 29 AGE SPECIFIC 5-YEAR RELATIVE SURVIVAL (%) IN ENGLAND AND WALES FOR 1996-1999
(CANCER RESEARCH, UK) ..................................................................................................................... 47 FIGURE 30 SIMPLIFIED DIAGRAM OF THE ONE-CARBON (FOLATE) METABOLIC PATHWAY. ADAPTED FROM
SHARP & LITTLE, AJE, 2007 ................................................................................................................. 105 FIGURE 31 SELECTION PROCEDURE OF CONTROLS .................................................................................. 145

Chapter one Colorectal cancer
7
1 COLORECTAL CANCER
1.1 Introduction
This chapter describes the epidemiology, natural history and progression of colorectal
cancer. In addition, the prevalence, incidence and survival rates as evaluated in
epidemiologic research are presented. Finally, the established genetic and non-genetic
(environmental) risk factors are summarised.
1.2 Large intestine
The large intestine is the most distal part of the lower gastrointestinal tract and its main
roles are: to absorb vitamins that are created by the colonic bacteria (over 700 different
species), to absorb the remaining water from indigestible food matter, to maintain the
fluid balance of the body and to compact and store faecal material until eliminated
through the anus.
The main parts of the large intestine are the caecum, the appendix, the colon and the
rectum. The caecum is the connection between the small and large intestines and its
main role is to accept and store processed material of undigested food, water, vitamins
and minerals and to move it towards the colon. The appendix is a small projection
emerging from the caecum and it has no known function. The colon is the largest part of
the large intestine and it has 4 sections (ascending, transverse, descending and sigmoid)
that are located in the abdominal cavity. Within the colon, the processed material mixes
with mucus and colonic bacteria to form faeces. In addition, the lining of the colon
absorbs most of the water, some vitamins and minerals and the colonic bacteria
chemically break down part of the fibre to produce nutrients for their own survival and
to nourish the cells lining the colon. Through muscular movements of the colon, faeces
are pushed along the colon and move into the rectum, which is the final part of the large
intestine and where the faeces are stored before being excreted as a bowel motion.
Regarding the histology of the large intestine, the intestinal wall has four primary layers:
1) Serosa or adventitia, which is the outer layer responsible for keeping the digestive
tract in the right position inside the body; 2) Muscularis externa, which is composed of a
continuous inner layer of circular muscle and a discontinuous outer layer of longitudinal

Chapter one Colorectal cancer
8
muscle responsible for the motility of the lumen contents; 3) Submucosa, which is the
connective tissue located between the layer of circular muscle and the mucosa; 4)
Mucosa, which is the inner layer of the intestinal wall comprising a single layer of
columnar epithelium (surface epithelium), connective tissue (lamina propria) and an
outer muscle layer (lamina muscularis mucosa) and is characterised by the presence of
numerous invaginations of the surface epithelium into the lamina propria glands, which
are approximately 50 cells deep (crypts of Lieberkühn). These crypts are used mainly for
water absorption. In addition, colon cells proliferate and differentiate (from stem cells)
in the lower parts of the crypts and then migrate to the upper part of the crypts to renew
the superficial epithelial cells (approximately every six days) (1). Several problems or
disorders can arise in the large intestine including irritable bowel syndrome,
inflammatory bowel disease (including Crohn’s disease and ulcerative colitis), colorectal
polyps and colorectal cancer.
1.3 Clinical characteristics of colorectal cancer
1.3.1 Definition of colorectal cancer
“Colorectal cancer is a cancer that forms either in the tissues of the colon, the longest
part of the large intestine, or in the tissues of the rectum, the last part of the large
intestine before the anus” (definition taken from National Cancer Institute;
www.cancer.gov).
1.3.2 Types of colorectal cancer
The main types of colorectal cancer are: 1) adenocarcinomas, 2) squamous cell
carcinomas, 3) carcinoid tumours, 4) sarcomas and 5) lymphomas. More than 95% of
colorectal cancers are adenocarcinomas with the cancer starting in the gland cells in the
lining of the intestinal wall. Colorectal adenocarcinomas can be of two types according
to the microbiology of the cancer cells: mucinous (98-99% of adenocarcinomas; cancer
cell in pools of mucus) or signet-ring tumours (1-2% of adenocarcinomas; mucus inside
the cancer cells). This thesis will be examining the epidemiology of adenocarcinomas of
the large intestine (colon and rectum).

Chapter one Colorectal cancer
9
Briefly the main characteristics of the other types are: squamous cell carcinomas,
carcinoids, sarcomas and lymphomas. Squamous cell carcinomas are cancers that start
from the skin-like cells that make up the bowel lining together with the gland cells.
Carcinoid is an unusual type of slow growing tumour and is called a neuroendocrine
tumour. These cancers grow in hormone producing tissues, usually in the digestive
system and they are rare. Sarcomas are cancers of the supporting cells of the body (bone,
muscle, etc.) and most of the colorectal sarcomas are leiomyosarcomas (started in the
smooth muscle of the large intestine). Finally, lymphomas are cancers of the lymphatic
system and only 0.01% of colorectal cancers are of lymphatic origin.
1.3.3 Classification of colorectal cancer
Colorectal cancer can be classified into three forms according to the way that is
developed. In particular the three major forms are hereditary, familial and sporadic
colorectal cancer. The proportion of each form may be different in different populations,
but generally the majority of colorectal cancer cases in all populations are considered
sporadic, whereas hereditary colorectal cancer is the least common form. Finally, 10-
30% of colorectal cancer cases are considered to be linked to a familial risk (2).
1.3.3.1 Hereditary colorectal cancer syndromes
Colorectal cancer hereditary syndromes that result from inherited susceptibility due to
rare high penetrance mutations may account for up to 5% of all cases. The most
common hereditary syndrome is Hereditary Non-Polyposis Colorectal Cancer (HNPCC),
also known as Lynch syndrome (2-5% of colorectal cancer cases). One of the
characteristics of this syndrome is an unusually high occurrence of colorectal and
specific extra-colonic cancers. In addition, the HNPCC syndrome has an earlier age of
onset. Highly penetrant germline mutations in mismatch repair genes, hMLH1 (located
at chromosome 3p21–23) and hMSH2 (located at chromosome 2p21) resulting in
microsatellite instability in the tumour are responsible for the majority of the HNPCC
cases. These genes are part of the DNA mismatch repair pathway and a HuGE review
published in 2002 identified 45 polymorphisms in hMLH1 and 55 polymorphisms in
hMSH2 (3). Regarding the population prevalence of hMLH1/hMSH2 mutation carriers, it
has been estimated to be 1 in 3,139 in a Scottish population aged 15–74 years (4). In

Chapter one Colorectal cancer
10
addition, according to available gene variant data there is no evidence suggesting any
differences in frequency between populations, or between ethnic groups (3). It has been
reported that the standardised incidence ratio for colorectal cancer for carriers of hMLH1
or hMSH2 mutations when compared with the general population is 68 (5) and the
relative risk for colorectal cancer for first-degree relatives of mutation carriers compared
with first degree relatives of non-carriers is 8.1 (6).
The second most common hereditary syndrome is a highly penetrant autosomal
dominant cancer syndrome known as Familial Adenomatous Polyposis Coli (FAP; 1%
of colorectal cancer cases) and it occurs due to germline mutations of the Adenomatous
Polyposis Coli (APC) gene (tumour suppressor gene located at chromosome 5q21-22)
(7). APC protein down-regulates the Wnt signalling pathway through its binding to β-
catenin and axin and loss of the APC protein function due to APC mutations is
associated with carcinogenesis (8). The main characteristic of FAP is the appearance of
hundreds and in some cases of thousands of colorectal adenomas, which can develop
into carcinomas if left untreated (9).
There are a number of rarer autosomal dominant disorders, including Juvenile Polyposis
Syndrome, Cowden syndrome and Peutz-Jeghers syndrome. Juvenile Polyposis
Syndrome appears usually under the age of 20 years old and it has been suggested that
mutations in SMAD4 (18q), PTEN (10q22-24) and BMPR1A genes are associated with
this syndrome (10;11). Cowden syndrome, on the other hand is characterised by multiple
hamartomas and it has been found to be associated with PTEN mutations (12). Finally,
the Peutz-Jeghers syndrome has been suggested to be associated with mutations in the
LKB/STK11 gene (19p13.3) (13).
1.3.3.2 Familial colorectal cancer
An additional 20% of colorectal cancer cases are associated with a family history of
colorectal cancer (with first degree relatives of a patient with colorectal cancer case
having approximately a 2-4 times increased risk) and comprise the familial colorectal
cancer cases. Low-penetrance APC mutations have been found to be associated with
some types of familial colorectal cancer (14). In particular, the most common APC
mutations that have been found to be associated with familial colorectal cancer include

Chapter one Colorectal cancer
11
I1307K (15) and E1317Q (16), whereas at least 12 additional variants of APC (8 of them
being in exon 15) have been identified (17).
Another familial form of colorectal cancer which was first described in 2002, is MYH
associated polyposis (MAP), (18). This form of colorectal cancer is due to bi-allelic
mutations in MUTYH gene and its phenotype is clinically comparable to the FAP
phenotype (18;19). However, MAP, which is recessively transmitted, generally results in
a smaller number of adenomas and has a later age of onset (20). MUTYH (1p32.1-34.3)
(21) is a base excision repair gene (21;22) and the two most common MUTYH variants
accounting for >80% of disease causing alleles in whites are Y165C and G382D,
whereas the E466X nonsense mutation has been identified in Indian families and the
Y90X in Pakistani families (21). Finally, approximately 30 mutations 52 missense
variants and three inframe insertions/ deletions have been identified (23).
1.3.3.3 Sporadic colorectal cancer
Most cases of colorectal cancers arise sporadically, namely with no background of a
family history of the disease, and genetic and environmental factors are important (24).
Somatic (occurring during an individual’s lifetime) rather than germline (inherited)
mutations in these genes play role in sporadic cancer, with somatic mutations of the APC
gene to be found in as many as 80% of sporadic tumours (25).
1.3.4 Natural history of colorectal adenocarcinoma
1.3.4.1 Adenoma-carcinoma sequence
Colorectal adenocarcinomas start in the innermost layer and can grow through some or
all of the other layers. The vast majority of them derive from adenomatous polyps,
which are circumscribed aggregations of epithelial tissue characterised by uncontrolled
cell division, following a sequence known as the adenoma-carcinoma sequence (1).
Briefly, the first step in the development of tumours from normal epithelium is usually
the onset of dysplasia. In particular, in the colonic crypt, the normal sequence of
proliferation-differentiation of the colonic cells alters. Proliferated cells fail to
differentiate taking up the whole crypt (dysplastic crypt). Single dysplastic crypts
(unicryptal adenomas) are thought to be the first manifestations of tumour development
(hyperproliferative epithelium). Adenomas (adenomatous polyps) can then gradually

Chapter one Colorectal cancer
12
grow in size and change from a tubular to a villous architecture. The cells show first
mild then moderate and then severe dysplasia followed by malignant change resulting in
local invasion with eventual metastasis to distant sites (24). However, most of the
adenomatous polyps do not develop into malignant carcinomas, but they remain benign
and asymptomatic (1). There is evidence suggesting that colorectal carcinomas can
derive from other types of colorectal lesions besides the adenomatous polyps including
serrated polyps and flat adenomas (1). Briefly, serrated polyps include several different
types of lesions such as aberrant crypt foci, hyperplastic polyps, mixed polyps, serrated
adenomas and sessile serrated adenomas. These lesions are normally small, smooth and
sessile and occur mainly in the rectum and sigmoid colon. Recently, a serrated colorectal
carcinogenesis pathway has been described, with some molecular differences with the
conventional adenoma-carcinoma sequence (26). Regarding flat adenomas, they are
superficial, non-polypoidal lesions and their malignant potential is considerably higher
than the malignant potential of adenomatous or serrated polyps. In addition, it has been
proposed that colorectal carcinomas deriving from flat adenomas also follow a different
molecular pathway (27).
1.3.4.2 Molecular genetics of sporadic colorectal carcinogenesis
Like in many other tumour types, colorectal carcinogenesis derives from mutations in
mainly oncogenes and tumour suppressor genes and in comparison to the inherited and
familial colorectal cancer (germline mutations), sporadic colorectal cancer results from
the accumulation of multiple somatic mutations. In addition sporadic colorectal cancer
can have two different genomic profiles, which are known as: 1) chromosomal
instability neoplasia (CIN) and 2) microsatellite instability neoplasia (MIN) (28).
The majority of sporadic colorectal cancers (85-90%) initiate due to mutation in the APC
gene and are characterised by chromosomal instability. These tumours are generally
associated with hyperploidy, allelic losses, frequent tumour suppressor gene mutations
(APC, p53) and are mainly located in the left part of the colon. Mutations in the APC
gene (loss of heterozygosity on chromosome 5q: 5qLOH) occur early in the colorectal
carcinogenesis and they are normally followed by mutations in the k-ras gene and later
in the p53 gene (17pLOH). In addition, mutations in three additional genes (DCC,

Chapter one Colorectal cancer
13
SMAD4, SMAD2) on chromosome 18q (18qLOH) have been found in advanced
adenomas. The remaining 10-15% of sporadic colorectal tumours are characterised by
microsatellite instability (MIN) and are mainly located in the proximal colon. They are
euploid tumours without allelic losses, present infrequent suppressor gene mutations
(p53, APC) and more frequent mutations in the BRAF and PI3KCA oncogenes and some
other genes (TGBβ-RII, BAX, TCF4, Caspase5, HIF1α) (29).
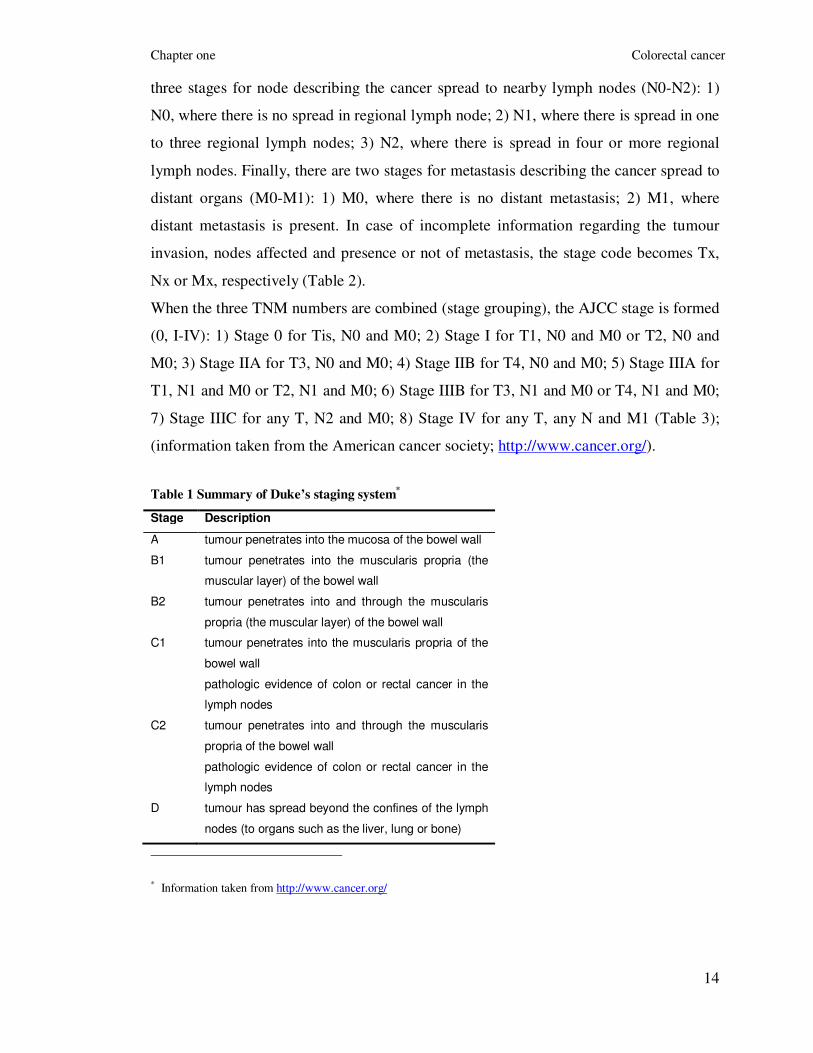
1.3.5 Clinical grading and staging of colorectal cancer
Two systems can be applied to describe the extent of colorectal cancer in the body: the
Dukes’ and the American Joint Committee on Cancer (AJCC) systems. Modified Dukes’
staging, which was originally published by Dukes CE (1932), is a pathological staging
based on resection of the tumour and measures the depth of invasion through the mucosa
and bowel wall. However, it does not take into account the level of nodal involvement or
the grade of the tumour. There are four modified Dukes’ stages (A-D): 1) Stage A,
where the tumour penetrates into the mucosa of the bowel wall; 2) Stage B, where the
tumour penetrates into (B1) and through (B2) the muscularis propria (the muscular
layer) of the bowel wall; 3) Stage C, where the tumour penetrates into (C1) and through
(C2) the muscularis propria of the bowel wall and there is pathologic evidence of colon
or rectal cancer in the lymph nodes; 4) Stage D, where the tumour has spread beyond the
borders of the lymph nodes (to organs such as the liver, lung or bone; Table 1).
The AJCC system is based on the TNM classification. In TNM classification, T stands
for tumour and describes the extent of the tumour spread through the layers that form the
bowel wall, N stands for nodes and indicates whether or not the cancer has spread to
nearby lymph nodes and, if so, how many lymph nodes are affected and M stands for
metastasis and indicates whether or not the cancer has spread to distant organs. Each of
these three elements is categorised separately and classified with a number. There are
five stages for tumour describing its extent through the bowel wall (Tis, T1-T4): 1) Tis,
where tumour involves only the mucosa; 2) T1, where tumour invades submucosa; 3)
T2, where tumour invades muscularis propria; 4) T3, where tumour invades through the
muscularis propria into the subserosa, or into the pericolic or perirectal tissues; 5) T4,
where tumour directly invades other organs or structures, and/or perforates. There are
Chapter one Colorectal cancer
14
three stages for node describing the cancer spread to nearby lymph nodes (N0-N2): 1)
N0, where there is no spread in regional lymph node; 2) N1, where there is spread in one
to three regional lymph nodes; 3) N2, where there is spread in four or more regional
lymph nodes. Finally, there are two stages for metastasis describing the cancer spread to
distant organs (M0-M1): 1) M0, where there is no distant metastasis; 2) M1, where
distant metastasis is present. In case of incomplete information regarding the tumour
invasion, nodes affected and presence or not of metastasis, the stage code becomes Tx,
Nx or Mx, respectively (Table 2).
When the three TNM numbers are combined (stage grouping), the AJCC stage is formed
(0, I-IV): 1) Stage 0 for Tis, N0 and M0; 2) Stage I for T1, N0 and M0 or T2, N0 and
M0; 3) Stage IIA for T3, N0 and M0; 4) Stage IIB for T4, N0 and M0; 5) Stage IIIA for
T1, N1 and M0 or T2, N1 and M0; 6) Stage IIIB for T3, N1 and M0 or T4, N1 and M0;
7) Stage IIIC for any T, N2 and M0; 8) Stage IV for any T, any N and M1 (Table 3);
(information taken from the American cancer society; http://www.cancer.org/).
Table 1 Summary of Duke’s staging system*
Stage Description
A tumour penetrates into the mucosa of the bowel wall
B1 tumour penetrates into the muscularis propria (the
muscular layer) of the bowel wall
B2 tumour penetrates into and through the muscularis
propria (the muscular layer) of the bowel wall
C1 tumour penetrates into the muscularis propria of the
bowel wall
pathologic evidence of colon or rectal cancer in the
lymph nodes
C2 tumour penetrates into and through the muscularis
propria of the bowel wall
pathologic evidence of colon or rectal cancer in the
lymph nodes
D tumour has spread beyond the confines of the lymph
nodes (to organs such as the liver, lung or bone)
* Information taken from http://www.cancer.org/

Chapter one Colorectal cancer
15
Table 2 Summary of TNM classification*
Tumour (T) Lymph nodes (N) Distant metastasis (M)
Tis tumour involves only the
mucosa
N0 there is no metastasis in
regional lymph node
M0 there is no distant
metastasis
T1 tumour invades
submucosa
N1 there is metastasis in 1 to
3 regional lymph nodes
M1 there is distant
metastasis
T2 tumour invades
muscularis propria
N2 there is metastasis in 4 or
more regional lymph
nodes
Mx incomplete information
regarding distant
metastasis
T3 tumour invades through
the muscularis propria into
the subserosa, or into the
pericolic or perirectal
tissues
Nx incomplete information
regarding number of
affected lymph nodes
T4 tumour directly invades
other organs or structures,
and/or perforates
Tx incomplete information
regarding tumour invasion
Table 3 Summary of AJCC staging system*
Stage TNM stage equivalent Description
0 Tis, N0, M0 carcinoma in situ or intramucosal carcinoma
I T1, N0, M0 or
T2, N0, M0
Cancer has begun to spread, but is still in the
inner lining
IIA T3, N0, M0 Cancer has spread to other organs near the
colon or rectum, but it has not reached lymph
nodes
IIB T4, N0, M0
IIIA T1, N1, M0 or
T2, N1, M0
Cancer has spread to lymph nodes, but has
not been carried to distant organs of the
body IIIB T3, N1, M0 or
T4, N1, M0
IIIC any T, N2, M0
IV any T, any N, M1 Distant organs metastasis (i.e. lungs and
liver)
* Information taken from http://www.cancer.org/

Chapter one Colorectal cancer
16
1.4 Epidemiology of colorectal cancer
1.4.1 Prevalence of colorectal cancer
According to the International Agency for Research on Cancer (IARC) 5-year world
prevalence of colorectal cancer in 2002 was approximately 0.05%. For more developed
countries (including all countries of Europe, all countries of North America, Japan,
Australia and New Zealand) 5-year prevalence was higher than for less developed
countries (including all countries of Africa, Latin America, the Caribbean, Asia -
excluding Japan, Micronesia, Polynesia and Melanesia) (0.17% and 0.016%
respectively) (IARC). In particular, 5-year prevalence of colorectal cancer for Europe
and the UK in 2005 were 0.12% and 0.15% respectively (IARC). In addition, according
to the Scottish Cancer Registry, 5-year prevalence of colorectal cancer in 2005 in
Scotland was 0.14% (0.15% for men and 0.12% for women).
1.4.2 Incidence of colorectal cancer
1.4.2.1 Geographical trends
Colorectal cancer is the third most common cancer in Scotland for both males and
females (12.9% of all cancers, 2005), with 3,412 individuals (1,854 men and 1,558
women) affected in 2005 (Scottish Cancer Registry). The crude incidence rates were
75.5/100,000 for men and 59.0/100,000 for women. Age-standardised (European
standard population) incidence rates (EASR) by sex are presented separately for each
Scottish Health Board (Figure 1) as well as for North, South East and West of Scotland
(Figure 2). The EASR incidence for Scotland in 2005 was 61.3/100,000 for men and
38.1/100,000 for women. Age-standardised (World standard population) incidence rate
(WASR) for Scotland in 2005 was 40.2/100,000 for men and 25.2/100,000 for women.
The highest EASR incidence rates were observed in the West of Scotland for men
(62.4/100,000) and in the North of Scotland for women (39.5/100,000) (Scottish Cancer
Registry).
Incidence rates for the UK and separately for England, Wales, Scotland and N. Ireland
were obtained from Cancer Research UK (2004). In 2004, 36,109 British individuals
were affected from colorectal cancer (19,657 men and 16,452 women) and the crude
incidence rate was 67.2/100,000 for men and 53.9/100,000 for women. EASR incidence
rates for the UK, England, Wales, Scotland and N. Ireland are presented in Figure 3.

Chapter one Colorectal cancer
17
The EASR incidence rate for the UK was 55.3/100,000 for men and 35.5/100,000 for
women. The highest EASR incidence rate was observed in Scotland for men
(65/100,000) and in N. Ireland for women (40.5/100,000). Colorectal cancer incidence
rates for 2005 were available for Scotland (Scottish Cancer Registry), Wales (Welsh
Cancer Intelligence & Surveillance Unit) and for N. Ireland (N. Ireland Cancer
research). However, at the point that this thesis was written, 2005 data were not
available for England. EASR incidence rates for 2005 were 61.3/100,000 (men) and
38.1/100,000 (women) for Scotland, 58.8/100,000 (men) and 34.4/100,000 (women) for
Wales and 64.2/100,000 (men) and 35.4/100,000 (women) for N. Ireland.
Incidence rates of colorectal cancer in countries of the European Union (EU) according
to the 2006 estimates (Cancer Research UK) varied by a factor of 3 for men and a factor
of 2 for women, with the lowest EASR incidence rates to be observed in Greece
(31/100,000 for men and 21.3/100,000 for women) and the highest EASR incidence
rates to be observed in Hungary (106/100,000 for men and 50.6/100,000 for women).
EASR estimates for the EU are 59/100,000 for men and 35.6/100,000 for women and
together with the EASR 2006 estimates for each country member of the EU are
presented in Figure 4.
According to the IARC, approximately 1,023,152 new cases of colorectal cancer were
diagnosed in 2002 (9% of all new cancer cases) making colorectal cancer the third most
common cancer worldwide. 65% of the new cases of colorectal cancer in 2002 were
recorded in the more developed regions. Large variations in incidence rates were
observed with the lowest WASR incidence rate to be observed in Africa (WASR
incidence rate in middle Africa: 2.3/100,000 for men and 3.3/100,000 for women) and
the highest to be observed in Australia, N. America and Europe (highest WASR
incidence rate in Australia/ N. Zealand: 48.2/100,000 for men and 36.9/100,000 for
women). WASR incidence rates are presented in a bar chart in Figure 5 and in a world
map in Figure 6 separately for men and women.
1.4.2.2 International temporal trends
In Scotland male colorectal cancer incidence rates rose slowly each year between 1982
and 1995 (1982 EASR incidence rate: 51.2/100,000; 1995 EASR incidence rate:
62.0/100,000). In 1996 there was an almost 6% increase in colorectal cancer incidence

Chapter one Colorectal cancer
18
reaching a 69.7/100,000 EASR incidence rate (highest EASR incidence rate from 1982
to 2005). Since 1997, there has been an almost constant gradual decrease of EASR
incidence rates (2005 EASR incidence rate: 61.3/100,000). The lowest male colorectal
cancer EASR incidence rate was observed in 1982 (51.2/100,000) (Figure 7). Over the
same period female colorectal cancer incidence rates were generally constant, with slight
fluctuations. The highest EASR incidence rate was observed also in 1996 (45.6/100,000)
and the lowest EASR incidence rate was observed in 2005 (38.1/100,000) (Figure 7).
According to Cancer Research UK, male colorectal cancer incidence rates in Great
Britain rose slowly by an average of 1% each year between 1982 and 1999. Since 1999
and until 2004 there has been a slight decrease. The highest EASR incidence rate was
observed in 1999 (58.2/100,000) and the lowest in 1982 (48.8/100,000) (Figure 8). Over
the same period the female colorectal cancer incidence rates have changed very little.
The highest EASR incidence rate was observed in 1992 (38.16/100,000) and the lowest
EASR incidence rate was observed in 2003 (34.9/100,000) (Figure 8).
There is no clear trend in global age standardised incidence rates of colorectal cancer. In
countries of relatively low-income economy, which have recently made a transition to a
higher-income economy (e.g. eastern and southern European countries, Japan,
Singapore), a rapid increase in incidence rates has been observed (30). However in
countries with traditionally high colorectal cancer incidence rates a slight decrease has
been observed in the last few years (e.g. Canada, USA and New Zealand/Australia) (30).
Trends in age standardised incidence rates for male and female colorectal cancer are
presented in Figure 9 and Figure 10 for selected countries.
Despite the decrease of the age-standardised incidence rates particularly in countries of
high-income economy, the absolute number of colorectal cancer cases continues to
increase, mainly because of the increasing age of the population. For Scotland, in
particular, in 1982 2,726 men and women were diagnosed with colorectal cancer,
whereas in 2005 3,412 people were diagnosed with, a 25.2% increase. In addition, a
report published in 2006 from the European Network of Cancer Registries (ENCR),
estimated that between 2004 and 2006 there was a 10.3% increase in absolute number of
all cancers in Europe and concluded that absolute numbers of cancer will continue to

Chapter one Colorectal cancer
19
increase even if age-specific incidence rates remain constant or decrease, mainly due to
the ageing European population (31).
Figure 1 Age standardised (European standard population) incidence rates of colorectal cancer (per
100,000) in Scottish Health Boards by sex. Incidence rates marked with a star (*) were based on low
numbers (≤50); (2005, Cancer Registry Scotland, ISD).

Chapter one Colorectal cancer
20
Figure 2 Age standardised (European standard population) incidence rates of colorectal cancer (per
100,000) in Scotland by sex (2005; Cancer Registry Scotland, ISD)
Figure 3 Age standardised (European standard population) incidence rates of colorectal cancer (per
100,000) in the UK by sex (2004; Cancer Research UK)

Chapter one Colorectal cancer
21
Figure 4 Age standardised (European standard population) incidence rates of colorectal cancer (per
100,000) in Europe by sex (2006 estimates; Cancer Research UK)

Chapter one Colorectal cancer
22
Figure 5 Age standardised (World standard population) incidence rates of colorectal cancer (per
100,000) worldwide by sex (2002 estimates; International Agency for research in cancer); (*More
developed regions include: all countries of Europe, Japan, Australia, New Zealand and all countries
of North America; Less developed regions include all countries of: Africa, Latin America, the
Caribbean, Asia -excluding Japan, Micronesia, Polynesia and Melanesia)

Chapter one Colorectal cancer
23
Figure 6 Maps of age standardised incidence rates of colorectal cancer (World Standard population)
separately for men and women; Source: International Agency for research on cancer (2002
estimates)

Chapter one Colorectal cancer
24
Figure 7 Age standardised (European standard population) incidence rates of colorectal cancer (per
100,000) in Scotland by sex from 1982 to 2005 (Cancer Registry Scotland, ISD)
Figure 8 Age standardised (European standard population) incidence rates of colorectal cancer (per
100,000) in Great Britain by sex from 1982 to 2005 (Cancer Research UK)

Chapter one Colorectal cancer
25
Figure 9 Age standardised (World standard population) incidence rates of male colorectal cancer
(per 100,000) in selected countries from 1982 to 2002 (International Agency for research on cancer)

Chapter one Colorectal cancer
26
Figure 10 Age standardised (World standard population) incidence rates of female colorectal cancer
(per 100,000) in selected countries from 1982 to 2002 (International Agency for research on cancer)

Chapter one Colorectal cancer
27
1.4.3 Mortality rates of colorectal cancer
1.4.3.1 Geographical trends
Colorectal cancer was the second most common cause of death from cancer in Scotland
for males and the third for females (10.3% of all deaths from cancer for both sexes,
2005), with 1,550 individuals (835 men and 715 women) having died in 2006 (Scottish
Cancer Registry). Crude mortality rate was 33.8/100,000 for men and 27.0/100,000 for
women. EASR mortality rates by sex are presented separately for each Scottish Health
Board (Figure 11) as well as for North, South East and West of Scotland (Figure 12).
The EASR and WASR mortality rates for Scotland in 2006 was 27.0/100,000 and
17.2/100,000 for men and 15.8/100,000 and 10.0/100,000 for women. The highest
EASR mortality rates were observed in the West of Scotland for men (28.3/100,000) and
in the North of Scotland for women (17.3/100,000) (Scottish Cancer Registry).
Mortality rates for the UK and separately for England, Wales, Scotland and N. Ireland
were obtained from Cancer Research UK (2005). In 2005, 16,092 British individuals
died from colorectal cancer (8,637 men and 7,455 women) and the crude mortality rate
was 29.4/100,000 for men and 24.3/100,000 for women. EASR mortality rates for the
UK, England, Wales, Scotland and N. Ireland are presented in Figure 13. The EASR
mortality rate for the UK was 23.3/100,000 for men and 14.3/100,000 for women and
geographic distribution was similar with a relatively small variation. The highest EASR
mortality rates for both men and women were observed in N. Ireland (16.1/100,000 and
11.7/100,000 respectively). Colorectal cancer mortality rates for 2006 were available for
Scotland (Scottish Cancer Registry) and for N. Ireland (N. Ireland Cancer research).
However, at the point that this thesis was written 2006 mortality data were not available
for England and Wales. EASR mortality rates for 2006 were 27.0/100,000 (men) and
15.8/100,000 (women) for Scotland and 24.6/100,000 (men) and 13.7/100,000 (women)
for N. Ireland.
Mortality rates of colorectal cancer in countries of the EU according to the 2002 data
from the IARC varied by a factor of 3 for both men and women, with the lowest WASR
mortality rates to be observed in Greece (9.7/100,000 for men and 8.0/100,000 for

Chapter one Colorectal cancer
28
women) and the highest WASR mortality rates to be observed in Hungary (35.6/100,000
for men and 21.2/100,000 for women). WASR mortality rates for 2002 estimates of each
country member of the EU are presented in Figure 14.
According to the IARC, approximately 528,978 individuals died from colorectal cancer
in 2002 (8% of all cancer related deaths) and 60% of colorectal cancer deaths were
recorded in the more developed regions. Large variations in mortality rates were
observed with the lowest WASR mortality rate to be observed in Africa (WASR
mortality rate in middle Africa: 2.2/100,000 for men and 3.0/100,000 for women) and
the highest to be observed in Europe, Australia, N. America (highest WASR mortality
rate in Central and Eastern Europe: 19.7/100,000 for men and 12.9/100,000 for women).
WASR incidence rates are presented in a bar chart in Figure 15 and in a world map in
Figure 16 separately for men and women.
1.4.3.2 International temporal trends
In Scotland male colorectal cancer mortality rates were unstable from 1983 to 1997,
with moderate fluctuations. Since 1997, a steady decline in EASR male mortality rates
has been observed (18% difference between 1997 and 2006). The lowest EASR
mortality rate in male colorectal cancer was observed in 2006 (27.0/100,000) and the
highest was observed in 1993 (34.4/100,000) (Figure 17). Over the same period (1983-
2006), there was a constant decline in female colorectal cancer mortality rates with
slight fluctuations (38% difference between 1983 and 2006). The highest EASR
mortality rate was observed also in 1983 (25.3/100,000) and the lowest were observed in
2004 and 2005 (15.7/100,000) (Figure 17). Regarding the absolute number of deaths,
1,714 men and women died from colorectal cancer in Scotland in 1983, whereas there
was a 9.6% decrease in 2006, with 1,550 colorectal cancer deaths.
Male colorectal cancer mortality rates in the UK were generally constant from 1982 to
1992 with two peaks in 1984 (EASR mortality rate: 33.0/100,000) and in 1992 (EASR
mortality rate: 31.9/100,000). Since 1992 there has been a constant decline in mortality
rates with an almost 27% difference between the years 1992 and 2005. The highest
EASR mortality rate was observed in 1984 (33.0/100,000) and the lowest in 2005
(23.3/100,000) (Figure 18). Over the same period (1982-2005), there was a constant

Chapter one Colorectal cancer
29
decline in female colorectal cancer mortality rates (36% difference between 1982 and
2005). The highest EASR mortality rate was observed in 1995 (23.4/100,000) and the
lowest EASR mortality rate was observed in 2005 (14.3/100,000) (Figure 18).
Generally global mortality rates of colorectal cancer for both men and women have been
either constant or slightly increasing over time. However there are some exceptions with
greater increase in colorectal cancer mortality rates especially in countries that have
recently adopted a more western type of lifestyle (e.g. Japan and countries of the Eastern
and Southern Europe). In contrast decreases in mortality rates have been observed over
time for some countries (e.g. the UK, Sweden).
According to the ENCR report, in contrast to what was observed in Scotland, a 1.8%
increase in absolute number of deaths from colorectal cancer for men and women was
reported from 2004 to 2006 (31). Changes in absolute numbers of colorectal cancer
deaths for selected countries are presented in Figure 19 and Figure 20.

Chapter one Colorectal cancer
30
Figure 11 Age standardised (European standard population) mortality rates of colorectal cancer
(per 100,000) in Scottish Health Boards by sex. Mortality rates marked with a star (*) were based on
low numbers (≤50); (2006, Cancer Registry Scotland, ISD)

Chapter one Colorectal cancer
31
Figure 12 Age standardised (European standard population) mortality rates of colorectal cancer
(per 100,000) in Scotland by sex (2006; Cancer Registry Scotland, ISD)
Figure 13 Age standardised (European standard population) mortality rates of colorectal cancer
(per 100,000) in the UK by sex (2005; Cancer Research UK)

Chapter one Colorectal cancer
32
Figure 14 Age standardised (World standard population) mortality rates of colorectal cancer (per
100,000) in Europe by sex (2002 estimates; International Agency for research on cancer)

Chapter one Colorectal cancer
33
Figure 15 Age standardised (World standard population) mortality rates of colorectal cancer (per
100,000) worldwide by sex (2002 estimates; International Agency for research on cancer); (*More
developed regions include: all countries of Europe, Japan, Australia, New Zealand and all countries
of North America; Less developed regions include all countries of: Africa, Latin America, the
Caribbean, Asia -excluding Japan, Micronesia, Polynesia and Melanesia)

Chapter one Colorectal cancer
34
Figure 16 Maps of age standardised mortality rates of colorectal cancer (World Standard
population) separately for men and women; Source: International Agency for research on cancer
(2002 estimates)

Chapter one Colorectal cancer
35
Figure 17 Age standardised (European standard population) mortality rates of colorectal cancer
(per 100,000) in Scotland by sex from 1983 to 2006 (Cancer Registry Scotland, ISD)
Figure 18 Age standardised (European standard population) mortality rates of colorectal cancer
(per 100,000) in the UK by sex from 1982 to 2005 (Cancer Research UK)

Chapter one Colorectal cancer
36
Figure 19 Number of deaths from colorectal cancer for men in selected countries from 1983 to 2003
(International Agency for research in cancer)

Chapter one Colorectal cancer
37
Figure 20 Number of deaths from colorectal cancer for women in selected countries from 1983 to
2003 (International Agency for research in cancer)

Chapter one Colorectal cancer
38
1.4.4 Survival rates: Geographical and temporal trends
Survival rates for colorectal cancer have been significantly improved the last 25 years
both for Scotland and the UK, a pattern that has been observed for many cancers. In
particular, 1-year and 5-year relative survival rates in Scotland were 75.8% and 54.9%
for men and 74.1% and 55.1% for women (time period 2000-2004; Scottish Cancer
Registry, ISD). One year relative survival rates in Scotland have increased by 30% for
men and by 26% for women and 5-year relative survival rates have been increased by
50% for men and 51% for women (relative increases, time period 1980-2004; Figure
21). In addition median survival after diagnosis has been increased from 1.9 years in
1980-1984 to 4.1 years in 1995-1999. Survival rates and survival rate changes were
similar for England, Wales and the N. Ireland. In particular, 1- and 5-year relative
survival rates in 2000-2001 were 74% and 52% for men and 73% and 53% for women
(Cancer Research UK, N. Ireland Cancer Registry; Figure 22). Survival has been
considered to depend highly on stage at diagnosis, with more advanced cancers having
poorer prognosis. In particular, approximate 5-year survival rates for the UK have been
estimated to be 83% for Dukes’ stage A, 64% for stage B, 38% for stage C and 3% for
stage D (Cancer Research UK).
According to the EUROCARE study, the mean age-adjusted 5-year survival rate for
colorectal cancer in Europe was 53.8% in the time period 1995-1999, a rate which is
significantly higher than the survival rates that were observed in previous time periods.
In particular the relative difference in 5-year survival rates in Europe between the time
periods 1990-1994 and 1995-1999 was 8.5% (32). The European 5-year survival rates
were higher than those observed in Great Britain in the same time-period (32). The
variation of colorectal cancer survival with geography was similar to other common
cancers (including lung, breast, and prostate). In particular, the highest 5-year survival
rates were observed in Nordic countries (except Denmark) and central Europe,
intermediate in southern Europe, low in the UK and Ireland, and the lowest in Eastern
Europe (32). It has been suggested that these differences within Europe are mainly due
to the stage at diagnosis as well as due to less effective treatments (Cancer Research UK,
(33;34)). However, the between-countries and inter-regional differences in colorectal
Chapter one Colorectal cancer
39
cancer survival rates that were observed in 1995-1999 have been narrowed significantly
compared to previous years (33;35;36).
Colorectal cancer survival rates in other parts of the world show a similar pattern of
increase. In particular, 5-year relative survival rates in USA in 1996-2004 were 65.4%
for men and 65.2% for women, showing an 8% and a 6% relative increase when
compared to survival rates in 1993-1995 (Surveillance Epidemiology and End Results,
National Cancer Institute). In Australia, 5-year survival rates in 1998-2004 were 61.3%
for men and 62.4% for women, showing an 8% and 9% relative increase when compared
to survival rates in 1992-1997 (Australia’s Health 2008, Australian Institute of Health
and Welfare). Finally, 5-year survival rate for colorectal cancer in Japan in 1993-1996
was 64.6% for both sexes (National Cancer Centre, Japan).

Chapter one Colorectal cancer
40
Figure 21 Age standardised one-year and five-year relative survival rates (European Cancer Patient
Population - EUROCARE-4) for patients diagnosed in Scotland, 1980-2004 (Cancer Registry
Scotland, ISD). (Note: 5-year survival rates for time period 2000-2004 are based on estimates).

Chapter one Colorectal cancer
41
Figure 22 Age standardised one-year and five-year relative survival rates for patients diagnosed in
England, Wales and N. Ireland, 1981-2001 (Cancer Research UK). (Note: 1- and 5-year survival
rates for time period 2000-2001 are based on estimates).

Chapter one Colorectal cancer
42
1.4.5 Colorectal cancer projections for Scotland
In 2004 the updated cancer incidence projections for Scotland (2001-2020) were
released from Scottish government. It is estimated that over 168,000 adult individuals
will be diagnosed with cancer during 2016-2020 (approximately 33,700 new cases per
year), which represents a 28% increase in the number of cancer cases (comparing
number of cases in 2001 with number of cases in 2020). An increase in the number of
cases is predicted for several types of cancer (including colorectal) with notable
exceptions being stomach, lung and cervical cancers, which are predicted to decline.
Most of the estimated increase is predicted to be due to the growing number of elderly
people in the Scottish population, but for some types of cancer risk is thought to increase
independently of the the high number of elderly people (The Scottish Government,
Statistics).
For colorectal cancer, during 2016-2020 24,643 cases are predicted to be diagnosed
(42.4% more than the number of colorectal cancer cases diagnosed in 1996-2000). This
number comprises 12,472 individuals younger than 75 years old (50.6%) and 12,171
individuals older than 75 years old (49.4%) (The Scottish Government, Statistics).
Incidence projections of colorectal cancer for the years 2001-2005, 2006-2010, 2011-
2015 and 2016-2020 are presented in Figure 23 for the whole population and separately
for individuals younger and older than 75 years old.
Figure 23 Colorectal cancer incidence projections for Scotland (2001-2020) for the whole population
and after age stratification (<75, 75+ years old). (The Scottish Government Statistics)

Chapter one Colorectal cancer
43
1.5 Main risk factors
1.5.1 Introduction
Many factors have been found to be positively or inversely associated with colorectal
cancer. Age, personal history of previous colorectal cancer or adenomatous polyps,
family history of colorectal cancer, chronic bowel inflammatory disease, and presence of
either HNPCC or FAP are considered as established risk factors of colorectal cancer.
According to the American Cancer Society, individuals that: 1) have a personal history
of colorectal cancer, 2) have a personal history of adenomatous polyps, or 3) have a
family history of colorectal cancer, are at increased risk of developing colorectal cancer.
Individuals that: 1) have a history of inflammatory bowel disease (including ulcerative
colitis and Crohn’s disease) of significant duration or 2) have one of the two hereditary
syndromes (HNPCC or FAP), are at high risk of developing colorectal cancer. For
individuals at increased and high colorectal cancer risk screening and surveillance
techniques should be provided to decrease incidence and mortality rates (37). Finally, it
has been suggested that colorectal cancer risk rises significantly from the age of 50 and
therefore in many countries screening programmes for those older than 50 years old
have been recommended. In Scotland in particular, individuals aged from 50 to 74 years
old are invited every two years for bowel screening.
Evidence for other risk factors, including diet, body weight, physical activity, smoking,
alcohol intake, non steroidal anti-inflammatory drugs (NSAIDs) intake and hormone
replacement therapy (HRT) in post-menopausal women will be described in this chapter.
1.5.2 Age
Colorectal cancer risk increases with age and it is more likely to occur in individuals
older than 50 years old (National Cancer Institute). In Scotland in 2005, 95% of
colorectal cancer cases were older than 50 years old (95.3% for men and 94.5% for
women) and the distribution of patients and incidence rates according to age separately
for men and women are presented in Figure 24 (Cancer Registry Scotland, 2005). The
distribution of colorectal cancer cases according to age in the UK (Cancer Research UK,
2004) and selected countries of the world (IARC, 2002) is similar to the Scottish
distribution (Figure 25, Figure 26, Figure 27).
In addition, age affects survival rates with older patients having poorer prognosis. This
might be due to various reasons. For example they may seek medical advice at a later

Chapter one Colorectal cancer
44
stage of the disease or due to advanced age they may not be able to receive the
appropriate treatment or they may have poorer surgical prognosis (33). Age specific
colorectal cancer 1-year and 5-year survival rates for Scotland, England and Wales are
presented in Figure 28 and Figure 29.
Figure 24 Numbers of new cases and age-specific incidence rates by sex for colorectal cancer in
Scotland (2005, Cancer Registry Scotland, ISD)
Figure 25 Numbers of new cases and age-specific incidence rates by sex for colorectal cancer in the
UK (2004, Cancer Research UK)

Chapter one Colorectal cancer
45
Figure 26 Numbers of new cases and age-specific incidence rates for colorectal cancer in men in
selected countries (2002, International Agency for research in cancer)
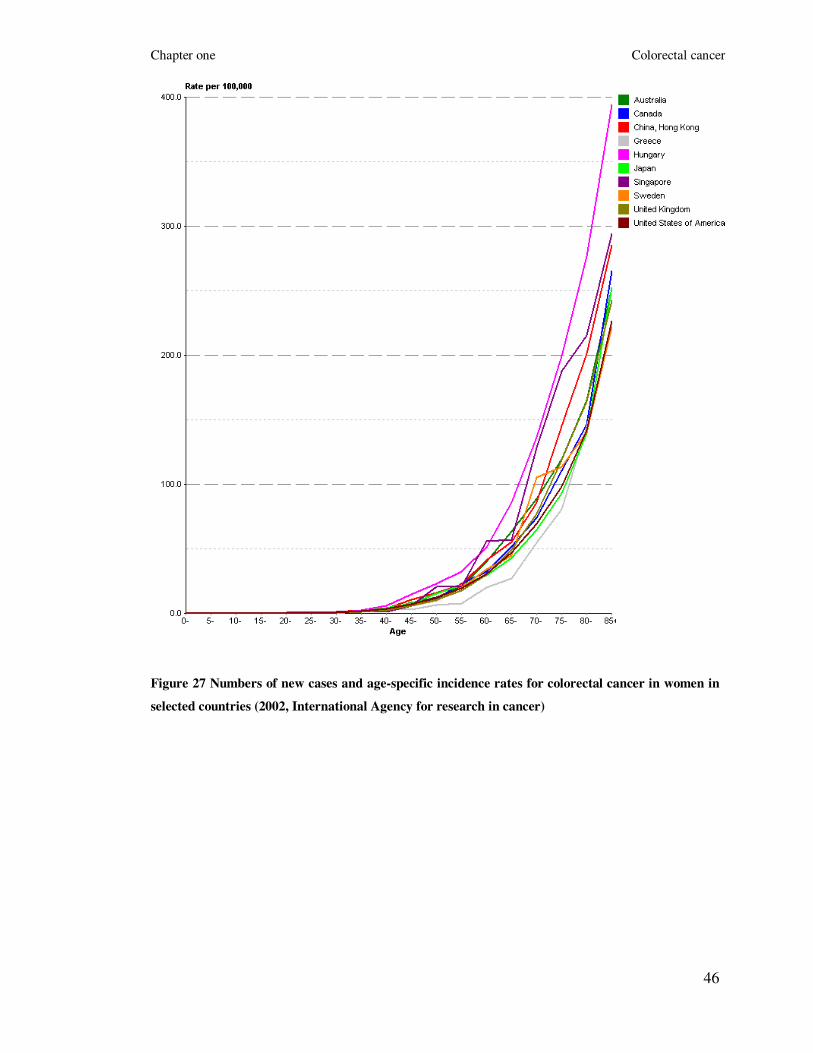
Chapter one Colorectal cancer
46
Figure 27 Numbers of new cases and age-specific incidence rates for colorectal cancer in women in
selected countries (2002, International Agency for research in cancer)

Chapter one Colorectal cancer
47
Figure 28 Age specific 5-year relative survival (%) in Scotland for 1995-1999 (Cancer Registry
Scotland, ISD)
Figure 29 Age specific 5-year relative survival (%) in England and Wales for 1996-1999 (Cancer
Research, UK)

Chapter one Colorectal cancer
48
1.5.3 Previous colorectal cancer or adenomatous polyps
Patients with previous colorectal cancer are at risk of developing recurrent or
metachronous cancers and therefore long-term colonoscopic surveillance is necessary
(38). However, the frequency and epidemiological characteristics of metachronous (a
new primary cancer in a person with a history of cancer) colorectal cancers is still
unknown. According to the findings of a recent population-based study in France, the
cumulative risk of metachronous cancers was 2% among 5-year survivors and 7%
among 20-year survivors (39). In addition, a two to three fold increased incidence risk of
colorectal cancer was observed in four other population-based studies (Connecticut,
Utah, Sweden and Finland) (40-43).
Adenomatous polyps are neoplastic benign epithelial tumours and most
adenocarcinomas of the colon and rectum arise from pre-existing adenomatous polyps
via the adenoma–carcinoma sequence (44). Numerous studies have demonstrated that
these patients have a higher risk of recurrent adenomas and/ or of developing colorectal
cancer than the general population (45). Both the risk of adenomas recurrence and
colorectal cancer is associated with the size and number of the initially detected
adenomas (46). Approximately between 15 to 60% of polypectomy patients develop a
recurrence and the risk of colorectal cancer for these patients has been estimated to be at
least twice the risk of the general population (46). Regarding the other types of
adenomas, serrated adenomas are considered as lesions of non-neoplastic characteristics
and with no or low malignant potential. (26). In contrast, the colorectal cancer risk of
flat adenomas is considerably higher than for adenomatous or serrated polyps (27).
1.5.4 Family history of colorectal cancer
According to the Scottish Executive cancer guidelines (http://www.sehd.scot.nhs.uk/),
the criteria for high family history risk of colorectal cancer are: 1) at least three family
members affected by colorectal cancer or at least two with colorectal cancer and one
with endometrial cancer in at least two generations; one affected relative must be ≤50
years old at diagnosis and one of the relatives must be a first degree relative of the other
two; or 2) presence of the HNPCC syndrome; or 3) untested first degree relatives of

Chapter one Colorectal cancer
49
known gene carriers. The criteria for moderate risk are: 1) one first degree relative
affected by colorectal cancer when aged <45 years old; or 2) two affected first degree
relatives with one aged <55 years old; or 3) three affected relatives with colorectal or
endometrial cancer, who are first degree relatives of each other and one a first degree
relative of the consultant. Individuals that do not fulfil all the above criteria are classified
as low family history risk (Scottish Executive cancer guidelines). According to a meta-
analysis, which was published in 2006 and included 59 studies (published from 1958 to
2004), the pooled colorectal cancer relative risk estimate when at least one first degree
relative was affected was 2.24 (95% CI 2.06, 2.43) and it rose to 3.97 (95% CI 2.60,
6.06) when there were at least two affected relatives. In addition, the absolute risk by
age of 70 for a 50-year old individual was 3.4% (95% CI 2.8 to 4.0) with at least one
affected relative or 6.9% (95% CI 4.5 to 10.4) with two or more, which is considerable
higher than the 1.8% population lifetime risk for a 50-year old (47).
1.5.5 Inflammatory bowel disease
Inflammatory bowel disease is a group of idiopathic (of unknown cause) inflammatory
conditions of the large intestine and it comprises ulcerative colitis and Crohn’s disease.
Ulcerative colitis mainly affects the large intestine and it mainly occurs with
inflammation of the mucosa. In contrast, Crohn's disease can develop in any part of the
gastrointestinal tract but most commonly affects the distal part of the small intestine and
parts of the large intestine. In addition, inflammation in Crohn’s disease extends much
deeper into the layers of the intestinal wall than in ulcerative colitis (48).
According to a meta-analysis of 116 studies, the overall prevalence of colorectal cancer
in patients with ulcerative colitis is 3.7%. In addition, an estimation of the cumulative
colorectal cancer risk according to the duration of ulcerative colitis was calculated to be
2% at 10 years, 8% at 20 years, and 18% at 30 years (49). The evidence for the link
between Crohn’s disease and colorectal cancer is less clear than for ulcerative colitis.
According to a meta-analysis conducted in 2007, patients with Crohn’s disease were
found to have a 2.4-fold increase in risk of colorectal cancer, which was however
associated with significant heterogeneity. After cancer site stratification, the risk of

Chapter one Colorectal cancer
50
colon cancer was found to increase by a factor of 2.59 (no significant heterogeneity) but
rectal cancer risk was not significantly associated with Crohn’s disease (50).
When considering geographic variations the risk of colorectal cancer was found to be
significantly higher in North America and the United Kingdom compared with
Scandinavian and other countries for both patients with ulcerative colitis and Crohn’s
disease (49;50). Compared with sporadic colorectal cancer, colorectal cancer arising in
patients with inflammatory bowel disease affects individuals at a younger age,
progresses to invasive adenocarcinoma from flat and non-polypoid dysplasia more
frequently and exhibits a mucinous and signet ring cell histology in a higher proportion
of cases (48).
1.5.6 Diet
According to the second report of Food, Nutrition, Physical Activity and the Prevention
of Cancer of the American Institute for Cancer Research / World Cancer Research Fund
(AICR/WCRF), which was released in November of 2007 diet has a very important role
in the prevention and causation of colorectal cancer (30). It has also been thought that
the role of diet in colorectal carcinogenesis is particularly important when a poor diet is
combined with a generally unhealthy lifestyle, consisting of excess calorie intake and
weight gain, physical inactivity and high consumption of alcohol (51). The roles of
several foods and nutrients in colorectal carcinogenesis have been investigated in many
observational studies; however the evidence regarding the effect of particular dietary
factors is still generally inconsistent. The foods and nutrients, on which there is most
published data, are red and processed meat, dietary fibre, fruit and vegetables, folate,
vitamin D and calcium.
In this chapter, findings regarding red and processed meat, dietary fibre and fruit and
vegetables will be summarised. Evidence regarding specific nutrients, which
associations with colorectal cancer were investigated in this thesis will be presented in
chapter 3. Thus a detailed literature search will be presented for the following nutrients:
a) flavonoids, b) fatty acids, c) folate, vitamin B2, vitamin B6 and vitamin B12 and d)
vitamin D and calcium (see chapter 3 on page 66).

Chapter one Colorectal cancer
51
1.5.6.1 Red and processed meat
Evidence regarding the positive association between colorectal cancer and intake of red
and processed meat is quite consistent. In the second report of AICR/WCRF, a
systematic review and meta-analysis of observational analytical studies of risks
associated with intake of red meat and processed meat showed a positive association
with colorectal cancer (30). Regarding red meat, 16 cohort and 71 case-control studies
were included with nearly all of them showing a positive association with colorectal
cancer. A meta-analysis of the cohort data showed that every 50g/day increase of red
meat intake was associated with a 15% increase in colorectal cancer risk. Fourteen
cohort and 44 case-control studies investigating the association with processed meat
were included in this report and meta-analysis of the cohort studies showed a positive
association with colorectal cancer risk (30). Another recent meta-analysis of prospective
studies of meat and colorectal cancer reported a significantly elevated summary relative
risks for both red meat (RR (95% CI): 1.28 (1.15, 1.42)) and processed meat (1.20 (1.11,
1.31)) in the highest versus lowest category of intake (52). Finally, results from a recent
large prospective study (NIH-AARP Diet and Health Study, USA), which included over
5,000 colorectal cancer cases reported a statistically significant positive association
between colorectal cancer risk and intakes of both red (HR (95% CI): 1.24 (1.12, 1.36))
and processed meat (1.20 (1.09, 1.32)) (53).
1.5.6.2 Dietary fibre
The first observation that high fibre intake may decrease colorectal cancer risk was
published in 1969 (54). Since then many studies (case-control studies, cohort studies and
meta-analyses) have been published, but the relationship of dietary fibre intake with the
development of colorectal cancer is still not completely understood. In the second
AICR/WCRF report, 16 cohort and 91 case-control studies were investigated and meta-
analysis of the cohort studies showed a 10% decreased risk per 10g/day of fibre intake
(30). However, a pooled analysis of 8,100 colorectal cancer cases, followed up for 6–20
years, showed a statistically non-significant decreased risk for the groups that consumed
the most dietary fibre (55). Recent results from the Multiethnic Cohort study in Hawaii

Chapter one Colorectal cancer
52
and Los Angeles (2,110 cases) showed that fibre was inversely associated with
colorectal cancer for both men and women (age and ethnicity adjusted model: RR (95%
CI): men: 0.49 (0.41, 0.60); women: 0.75 (0.61, 0.92)). However after further adjustment
(family history of colorectal cancer, history of colorectal polyp, pack-years of cigarette
smoking, BMI, hours of vigorous activity, aspirin use, multivitamin use, HRT, alcohol,
red meat, folate and vitamin D) this inverse association remained statistically significant
only in men (RR (95% CI): 0.62 (0.48, 0.79)) (56). In the Pooling Project of Prospective
Studies of Diet and Cancer (8,081 colorectal cancer cases; 13 cohort studies) a
statistically significant inverse association was found in an age-adjusted model (RR
(95% CI): 0.84 (0.77–0.92)), but the association was diluted after further adjustment
(RR (95% CI): 0.94 (0.86, 1.03); adjusted for: age, body mass index, height, education,
family history of colorectal cancer, use of postmenopausal hormone therapy, oral
contraceptive use, use of NSAIDs, multivitamin use, smoking, and intake of dietary
energy, dietary folate, red meat, total milk and alcohol) (55). Further analyses of the
Pooling Project though showed a statistically significant increased risk for colorectal
cancer among participants with a very low intake of fibre (dietary fibre intake of
<10 g/day versus intake of ≥30 g/day, RR (95% CI): 1.18 (1.05–1.31)). Finally, results
from the European Prospective Investigation into Cancer and Nutrition (EPIC; 1,721
cases, nine European countries) showed a statistically significant lower risk for
colorectal cancer associated with high-fibre intake (model adjusted for age, sex, energy
from fat and non-fat sources, height, weight, folate, physical activity, alcohol, smoking,
educational level, and intake of red and processed meat; RR (95% CI): 0.79 (0.63–0.99))
(57).
1.5.6.3 Fruit and vegetables
According to the results of the first AICR/WCRF published in 1997, evidence that
vegetables protect against colorectal cancer was judged as convincing (58). However,
analysis of more recent cohort and case-control studies challenged this hypothesis of
reduced risk and the conclusion of the second AICR/WCRF report (2007) suggested that
there is limited evidence of a protective colorectal cancer effect of both fruit and
vegetables (30). In particular, 17 cohort and 71 case-control studies investigating the

Chapter one Colorectal cancer
53
effect of non-starchy vegetables were included in the second AICR/WCRF report (2007)
and meta-analysis of the cohort data produced no evidence of an inverse association.
Similarly, analysis of 20 cohort and 57 case-control studies, which have investigated the
effect of fruit intakes showed no clear evidence of an overall association (30). However,
a comparison of the groups of the highest vegetable intakes against those with the lowest
suggested a possible inverse association. In addition, fruit intake in women was
inversely associated with colorectal cancer risk (30). A review of nine case-control
studies conducted from the International Agency for Research on Cancer in 2003 (59)
summarised that colorectal cancer risk was lowered by 13% (odds ratio (OR) (95% CI):
0.87, (0.78, 0.97)) and 37% (OR (95% CI): 0.63 (0.56, 0.70))
when the highest versus
the lowest category of respectively fruit and vegetable intakes were compared. However,
a review of 11 prospective cohort studies published in the same report (59) found that
fruit and vegetable intakes were not related to risk of colorectal cancer. Finally, the
Women's Health Initiative Randomised Controlled (WHI) Dietary Modification Trial
concluded that daily intake of at least five servings of fruits and vegetables along with a
low-fat diet over an approximately 8 year period, did not lower risk of colorectal cancer
in postmenopausal women (60).
1.5.7 Dietary energy intake
Specific biological functions of the body need the intake of energy to be performed.
These include body’s functions and processes at rest (basal metabolic rate - BMR),
digestion and assimilation of food and physical activities (30). Energy requirements of
the individuals depend on their sex, age, size and physical exercise levels (30). Positive
energy balance, which leads to weight gain, occurs when an individual consumes more
energy than the energy that is expended by his or her biological functions. On the other
hand, negative energy balance, which leads to weight loss, occurs when an individual
consumes less energy than the energy that is expended by his or her biological functions
(30). A number of observational studies have investigated the effect of high dietary
energy intake on colorectal cancer (61). In particular, findings from case-controls studies
suggest that there is a positive and dose-dependent association between dietary energy
intake and colorectal cancer risk, whereas findings from prospective studies, do not

Chapter one Colorectal cancer
54
support strong inverse associations, suggesting that the case-control findings might be
biased (62-69). A recent case-control investigated the joint effect of energy intake, body
mass index (BMI) and physical activity and suggested that dietary energy intakes are
inversely associated with colorectal cancer only among the individuals of low physical
activity, a finding that might explain the inconsistent results (70).
1.5.8 Obesity
Results from observational studies have concluded that obesity is an important risk
factor in several cancers, including colorectal cancer (71). In the second AICR/WCRF
(2007), analysis of 68 cohort and of 86 case-control studies that investigated the effect of
body fatness measured by BMI (kg/m2), showed a strong positive association (meta-
analysis of cohort data: 15% increase in risk per 5 kg/m2
increase in BMI). In addition,
analysis of 13 cohort and six case-control studies investigating abdominal fatness
measured by either waist circumference or waist to hip ratio also showed a strong
positive association (30). Therefore, the panel of the second AICR/WCRF report (2007)
concluded that the evidence that obesity (both body and abdominal) is causally linked
with colorectal cancer is convincing (30). In addition, results from the EPIC study,
published in 2006 showed that the highest quintile of waist circumference was
associated with a RR for colon cancer of 1.4 (95% CI 1.0, 1.9) in men and 1.5 (95% CI
1.1, 2.0) in women (72). One recent meta-analysis, which was published in 2007 and
included 30 prospective studies (1966-2007) concluded that overall, a 5 kg/m2 increase
in BMI was related to an increased risk of colon cancer in both men (RR (95% CI): 1.30
(1.25, 1.35)) and women (RR (95% CI): 1.12 (1.07, 1.18)). BMI was positively
associated with rectal cancer in men (RR (95% CI): 1.12 (1.09, 1.16)) but not in women
(RR (95% CI): 1.03 (0.99, 1.08)). Regarding abdominal fatness, colon cancer risk
increased with increasing waist circumference (per 10 cm increase) in both men and
women (RR (95% CI): 1.33 (1.19, 1.49); 1.16 (1.09, 1.23), respectively) (73). Results
from a second meta-analysis also published in 2007 (31 studies: 23 cohort, 8 case-
control) indicated that the RR of colorectal cancer for the obese (BMI≥ 30 kg/m2) versus
the normal weight individuals (<25 kg/m2) was 1.19 (1.11, 1.29) and the RR comparing
those with the highest, to the lowest, level of central obesity was 1.45 (1.31, 1.61) (74).

Chapter one Colorectal cancer
55
Finally, a third meta-analysis published in 2008, reported a strong association between
BMI and colon cancer (per 5 kg/m2 increase in BMI: RR (95% CI), p-value: 1.24 (1.20,
1.28), <0.0001) and a weak association between BMI and rectal cancer in men (per 5
kg/m2 increase in BMI: RR (95% CI), p-value: 1.09 (1.06, 1.12), <0.0001). In addition,
it reported a weak association between colon cancer and a 5 kg/m2 increase in BMI in
women (RR (95% CI): 1.09 (1.05, 1.13), <0.0001) (75).
1.5.9 Physical activity
Results from both cohort and case-control studies have consistently indicated that
increased physical activity is inversely associated with male colon cancer risk, reporting
risk reductions of about 40% with high versus low levels of physical activity (76). In
addition, results of observational studies regarding the relationship between physical
activity and female colon cancer have reported less strong but similar associations (76).
However, results for the association between physical activity and rectal cancer are
much less consistent, with only a small proportion of the published studies showing a
statistically significant inverse association (77). The second AICR/WCRF report (2007),
after reviewing evidence from 11 cohort studies of total physical activity, 12 cohort
studies of occupational physical activity and 24 cohort studies of recreational physical
activity, concluded that there is enough evidence that high levels, greater frequency and
greater intensity of physical activity lowers colon cancer risk, but there is not enough
evidence regarding rectal cancer risk (30). In addition, a meta-analyses of 19 cohort
studies published in 2005 reported that increased physical activity was linked to a
statistically significant reduction in the risk of male colon cancer (RR (95% CI):
occupational physical activity 0.79 (0.72, 0.87); recreational physical activity 0.78 (0.68,
0.91). For women though, only recreational physical activity was protective against
colon cancer (RR (95% CI): 0.71 (0.57-0.88). In addition, no protection against rectal
cancer was observed in either sex (78). Finally, results from the EPIC study including
1,094 colon and 599 rectal cases, showed an inverse association between physical
activity and colon cancer (RR (95% CI): 078 (0.59, 1.03)), but no association with rectal
cancer (77).

Chapter one Colorectal cancer
56
1.5.10 Alcohol
In a recent monograph by WHO International Agency for Research on Cancer (IARC) it
was stated that colorectal cancer is causally related to alcohol consumption (79), a
conclusion that is in accordance with the conclusion from the second AICR/WCRF
report (2007). In particular, in the second AICR/WCRF (2007) report meta-analysis
from 24 cohort studies investigating consumption of alcoholic drinks and from 13 cohort
studies investigating ethanol intakes showed that intake of more than 30g per day of
ethanol is causally linked with male colorectal cancer and probably linked with female
colorectal cancer (30). Results from the EPIC study suggested that both lifetime and
baseline alcohol intake were significantly associated with colorectal cancer incidence
for alcohol intakes of 30-59.9 g/day compared to 0.1-4.9 g/day (23% and 26% increase
in risk, respectively) (80). In addition, a recent meta-analysis, which included 16
prospective cohort studies of colorectal cancer reported that high alcohol intake was
significantly associated with increased risk of both colon and rectal cancer (highest
versus lowest category of alcohol intake RR (95% CI): 1.50 (1.25, 1.79); 1.63 (1.35,
1.97); respectively) (81). Finally, another recent pooled meta-analysis of eight cohort
studies found an increased risk of colorectal cancer with alcohol consumption but this
positive association was again limited to consumption of more than 30 g/day (RR (95%
CI): 0 g/day vs. 30-45 g/day 1.16 (0.99, 1.36); 0 g/day vs. ≥45 g/day 1.41 (1.16 to 1.72))
(82).
Regarding the associations between colorectal cancer and specific types of alcohol (i.e.
wine, beer, spirits), findings from observational studies are mainly inconsistent (83). The
main concept is that different alcoholic beverages contain many other different
substances apart from alcohol, which might have different effects on colorectal cancer.
One example is the hypothesis that beer might increase rectal cancer risk due to its high
content in volatile nitrosamines (83). However, results from various large studies,
including results from a meta-analysis published in 1990 (84), from the Pooling Project
(82), from the EPIC study (80) and from the Netherlands Cohort Study (83), did not
provide strong evidence for a different colorectal cancer risk (overall or site specific)
according to the type of alcohol.

Chapter one Colorectal cancer
57
1.5.11 Smoking
Cigarette smoking has been consistently linked with risk of colorectal adenomatous
polyps. A recent meta-analysis combining findings from 42 case-control and nested
case-control studies (15,354 cases and 100,011 controls) reported pooled colorectal
adenoma ORs of 2.14 (1.86, 2.46) for current vs. never smokers, of 1.47 (1.29, 1.67) for
former vs. never smokers and of 1.82 (1.65, 2.00) for ever versus never smokers (85). In
the same meta-analysis the authors found that smoking was also more strongly
associated with high risk adenomas than with low risk adenomas and therefore they
concluded that smoking is an important risk factor for both the formation and
aggressiveness of adenomatous polyps (85). In addition, a systematic review conducted
in 2001, after reviewing 22 studies on the association between colorectal adenomas and
smoking, reported that long-term heavy smokers have a 2 to 3 fold increased risk to
develop colorectal adenomas (86). However, evidence of a causal link between smoking
and colorectal cancer is still debatable, and it was not considered as an established risk
factor for colorectal cancer by the IARC (85). Early studies (before the 1970s) reported
no associations whereas more recent studies reported positive associations between
cigarette smoking and colorectal cancer (87). A possible explanation of this difference is
that early studies may not have considered a sufficiently long time lag between smoking
exposure and time of risk (86). However, inconsistencies in the relationship between
smoking and colorectal cancer risk have been reported also in more recent studies, with
some studies reporting statistically significant associations only with rectal cancer (87-
89), other studies reporting statistically significant associations only among men (90;91)
and some other studies reporting generally no significant associations (92;93).
1.5.12 Non steroidal anti-inflammatory drugs and aspirin
The protective short-term effect of NSAIDs and/ or aspirin on colorectal adenomas in
patients with a history of colorectal adenomas or colorectal cancer has been
demonstrated in three recent randomised clinical trials (94-96). In addition, results from
three other randomised control studies showed a 40% reduction in colorectal adenomas
recurrence with the use of either celecoxib or rofecoxib, which are also cyclo-

Chapter one Colorectal cancer
58
oxygenase-2 enzyme (COX-2) inhibitors (97-99). However, the effect of NSAIDs or
aspirin on colorectal cancer risk is still not well established, possibly due to the long
time that colorectal cancer needs to develop (100). Two large randomised trials, the
Physicians’ Health Study (101) and the Women’s Health Study (102), failed to show a
protective benefit of low-dose aspirin on risk of colorectal cancer in men and women.
However, this failure to detect a protective effect of aspirin might be due to either low
doses or insufficient duration of the treatment and results from a recent secondary
analysis (103) of data pooled from two other randomised trials (104;105) support this
argument (pooled HR (95% CI), p-value: 0.74 (0.56, 0.97) 0.02 overall; 0.63 (0.47, 0.85,
0.002 for 5 years or more). In addition, results from the Health Professional Follow-up
Study after 18 years of follow up, reported that regular, long-term aspirin use reduces
risk of colorectal cancer among men, but the benefit of aspirin requires at least 6 years of
continuous and consistent use (100). Finally, both a systematic review of randomised,
controlled trials, case-control and cohort studies (106) and a meta-analysis of
observational studies, including data from 19 case-control and 11 cohort studies (103)
reported that regular use of aspirin or NSAIDs was consistently associated with a
reduced risk of colorectal cancer, especially in high doses and after use for more than 10
years.
1.5.13 Hormone replacement therapy
Post menopausal HRT has been found to be inversely associated with colorectal cancer
in several observational studies (summarised in (107-109)). A meta-analysis of 18
observational studies, published in 1999 reported a 34% reduction in colorectal cancer
risk for current versus no HRT (RR (95% CI): 0.66 (0.59, 0.74)) and a 20% reduction in
risk for ever versus never users of HRT (RR (95% CI): 0.80 (0.74, 0.86)) (107). A
systematic review and meta-analysis of 15 randomised clinical trials was published in
2005 from the Cochrane Collaboration and investigated the effects of long term HRT for
peri-menopausal and post-menopausal women on several chronic diseases including
colorectal cancer (110). Colorectal cancer outcome was measured in four of these trials
(111-114), however only the WHI trial data were included in the meta-analysis due to
the very small size of the remaining three clinical trials. Therefore, according to the

Chapter one Colorectal cancer
59
findings of this study, for women taking oestrogen combined with progesterone HRT
there was no statistically significant difference in the incidence of colorectal cancer
when compared to women taking placebo after one to four years’ follow-up. However,
women taking combined continuous HRT for five or more years had a statistically
significant lower incidence of colon cancer (RR (95% CI): 0.62 (0.43 to 0.89)) (114).
Furthermore cancers, which were diagnosed in women who were taking combined HRT,
had greater lymph node involvement and were of a more advanced stage (114).
However, the statistically significant lower colorectal cancer risk observed in the
combined continuous HRT group during the intervention phase of the WHI trial did not
persist three years after stopping the intervention (HR (95% CI): 1.08 (0.66-1.77))
(115).
1.6 Summary
Colorectal cancer is a cancer that forms either in the tissues of the colon or the rectum,
and more than 95% of colorectal cancers are adenocarcinomas, deriving from colorectal
adenomatous polyps. Approximately 25% of colorectal cancer cases are due to an
inherited predisposition (5-10% hereditary syndromes, 15-20% familial colorectal
cancer) with the remaining 75% having no obvious genetic predisposition (sporadic
colorectal cancer). Sporadic colorectal cancer might therefore occur due to low-
penetrance genetic mutations, due to effects of environmental risk factors or due to
specific gene-environment interactions.
Colorectal cancer is the third most common cancer in global incidence and mortality
rates accounting for 9% of all cancer cases and for 8% of all cancer related deaths
(2002). However, large geographical variations in incidence rates are observed with the
lowest rates to be recorded in Africa and the highest in N. America, Europe and
Australia. Temporal trends in incidence rates of colorectal cancer differ between
countries, with countries that have recently made a transition to a higher-income
economy (e.g. eastern and southern European countries, Japan, Singapore) to show a
rapid increase and countries with traditionally higher colorectal cancer incidence rates to

Chapter one Colorectal cancer
60
show a slight decrease in the last few years. Survival rates of colorectal cancer though
have been significantly improved in most countries the last 25 years.
The established risk factors of colorectal cancer include personal history of previous
colorectal cancer or adenomatous polyps, family history of colorectal cancer, chronic
bowel inflammatory disease and presence of any of the hereditary syndromes. In
addition, due to the fact that the majority of colorectal cancer cases (approximately 90%)
occur after the age of 50, advanced age is also considered as a risk factor and in many
countries colorectal cancer screening is recommended for those older than 50 years old.
Finally, evidence for significant associations between colorectal cancer and other risk
factors, including diet, body weight, physical activity, smoking, alcohol intake, NSAIDs
intake and HRT in post-menopausal women, is promising and increasing.

Chapter two Aims and objectives
61
2 AIMS AND OBJECTIVES
2.1 Introduction
In chapter 1, the fact that colorectal cancer is a common cancer accounting for 9% of all
cancer cases and for 8% of all cancer related deaths was highlighted. At least 75% of
colorectal cancer cases occur without a specific genetic background (sporadic colorectal
cancer) and some established non-genetic risk factors (including age, personal history of
previous colorectal cancer or adenomatous polyps, chronic bowel inflammatory disease,
specific dietary aspects, body weight, physical activity, smoking, alcohol intake,
NSAIDs intake and HRT) are thought to affect colorectal carcinogenesis. In this chapter
the main aims and objectives of the thesis will be presented. In particular, this thesis had
two aims, for the investigation of which a population-based case-control study of
colorectal cancer was used (described in detail in chapter four, on page 141).
2.2 Aims
2.2.1 Aim 1: To investigate the association between specific
nutrients and colorectal cancer
The first aim of this thesis was to determine whether particular nutrients are associated
with colorectal cancer in a hypothesis-driven type of analysis. The dietary risk factors
that were selected for this part of the analysis (part 1) were of two types. The first type
(hypotheses 1 and 2) included relatively novel dietary risk factors, whose associations
with colorectal cancer were not widely investigated in observational studies. In
particular, this group included the following risk factors: 1) the flavonoid subgroups:
flavonols, flavones, flavan3ols, procyanidins, flavanones and the individual flavonoid
compounds: quercetin, catechin, epicatechin, naringenin and hesperetin (hypothesis 1);
and 2) total fatty acids (FAs), the fatty acid subgroups saturated fatty acids (SFAs),
mono-unsaturated fatty acids (MUFAs), poly-unsaturated fatty acids (PUFAs), omega-3
PUFAs (ω3PUFAs), omega-6 PUFAs (ω6PUFAs), trans fatty acids (tFAs) and trans
mono-unsaturated fatty acids (tMUFAs) and the individual fatty acid compounds

Chapter two Aims and objectives
62
palmitic acid, stearic acid, oleic acid, linoleic acid, γ-linolenic acid, arachidonic acid, α-
linolenic acid, eicosapentaenoic acid (EPA) and docosahexaenoic (DHA) (hypothesis 2).
The second type of the dietary risk factors (hypotheses 3 and 4) that were included in the
hypothesis-driven analysis part (part 1) consisted of dietary risk factors that were more
widely studied in other observational studies, but their role in colorectal carcinogenesis
is still not well established. In addition, for hypotheses 3 and 4, associations between
colorectal cancer and particular genetic factors closely linked to the dietary factors were
investigated. In particular the risk factors included in hypothesis 3 were the dietary risk
factors folate, vitamin B2, vitamin B6, vitamin B12 and alcohol, which are involved in
the one-carbon metabolic pathway (folate metabolic pathway) and the four following
single nucleotide polymorphisms (SNPs) of three genes also involved in the one-carbon
metabolic pathway: rs1801133 (MTHFR C677T), rs1801131 (MTHFR A1298C),
rs1805087 (MTR A2756G) and rs1801394 (MTRR A66G) (genetic risk factors). Finally,
the risk factors that were included in hypothesis 4 were vitamin D and calcium (dietary
risk factors) and the four following SNPs of the vitamin D receptor (VDR) gene:
rs10735810 (FokI), rs1544410 (BsmI), rs11568820 and rs7975232 (ApaI).
2.2.2 Aim 2: To conduct an overall analysis of the study and
to identify the risk factors that better explain colorectal cancer
risk in this population by applying forward and backward
stepwise regression
The second aim of this thesis was to investigate the relationship between all the lifestyle
and dietary risk factors that were collected from the Scottish Colorectal Cancer Study
and colorectal cancer (overall analysis). In addition, stepwise regression models were
applied in order to identify the risk factors that explained better colorectal cancer risk.
The main goal of this part of the thesis (part 2) was to generate new hypotheses for
future studies and not to draw any specific conclusions about the associations of these
risk factors with colorectal cancer.
2.3 Objectives
The main objectives of this thesis are described below separately for aims 1 and 2.

Chapter two Aims and objectives
63
2.3.1 Objectives of aim 1 (Hypotheses 1-4)
2.3.1.1 Hypotheses 1 and 2
1) To summarise the dietary intake of the novel dietary risk factors (flavonoid and
fatty acid subgroups and individual compounds) for all subjects and after case/
control status stratification (mean, standard deviation, median, interquartile range
of the dietary intakes; calculation of the t-test and Wilcoxon rank test).
2) To investigate the univariable associations between the novel dietary risk factors
(same as above) and colorectal cancer using a crude conditional logistic
regression model.
3) To investigate the multivariable associations between the novel dietary risk
factors (same as above) and colorectal cancer using four conditional logistic
regression models adjusted for different potential confounding factors.
4) To investigate the multivariable associations between the novel dietary risk
factors (same as above) and colorectal cancer using a conditional logistic
regression model adjusted for potential confounding factors, after sex, age and
cancer site stratification.
2.3.1.2 Hypotheses 3 and 4
1) To summarise the dietary intake of the additional dietary risk factors (folate,
vitamin B2, vitamin B6, vitamin B12, alcohol, vitamin D and calcium) for all
subjects and after case/ control status stratification (mean, standard deviation,
median, interquartile range of the dietary intakes; calculation of the t-test and
Wilcoxon rank test).
2) To investigate the univariable associations between the additional dietary risk
factors (same as above) and colorectal cancer using a crude unconditional
logistic regression model.
3) To investigate the multivariable associations between the additional dietary risk
factors (same as above) and colorectal cancer using three unconditional logistic
regression models adjusted for different potential confounding factors.

Chapter two Aims and objectives
64
4) To investigate the multivariable associations between the additional dietary risk
factors (same as above) and colorectal cancer using an unconditional logistic
regression model adjusted for potential confounding factors, after sex, age and
cancer site stratification.
5) To investigate the univariable and multivariable associations between the genetic
factors and colorectal cancer using a crude and a simply adjusted unconditional
logistic regression model.
6) To investigate the multivariable associations between the additional dietary risk
factors (same as above) and colorectal cancer using an unconditional logistic
regression model adjusted for potential confounding factors, after stratification
according to the genetic factors and to investigate the interaction relationships
between the genetic factors and the dietary risk factors.
2.3.2 Objectives of aim 2
1) To summarise all the explanatory variables that were to be included in the
second part of the analysis by presenting percentages of the categorical
variables and mean (with standard deviations) and median intakes (with
interquartile ranges) of the continuous variables (for the whole sample and after
case/ control status stratification).
2) To examine the correlation relationships (calculating Spearman rank correlation
coefficient) between each individual continuous explanatory variable.
3) To investigate the univariable associations between each explanatory variable
(quartiles for continuous variables; categories for categorical variables) and
colorectal cancer using a crude unconditional logistic regression model. (Note:
food and nutrient variables were adjusted for dietary energy intake by using the
residual or the standard method of energy adjustment.)
4) To apply forward and backward stepwise regression to three different sets of
explanatory variables (quartile form of continuous variables): a) Set 1:
demographic factors, lifestyle variables and food variables; b) Set 2:
demographic factors, lifestyle variables and nutrients; c) Set 3: demographic
factors, lifestyle variables, food variables and nutrients.

Chapter two Aims and objectives
65
5) To reapply, forward and backward stepwise regression on all three sets of
variables (quartile form of continuous variables) separately for males and
females.
6) To examine the stability of the built models by selecting 100 bootstrap samples
and then for each bootstrap sample, applying forward and backward stepwise
regression to the three different sets of the variables in the whole sample
(bootstrap method).

Chapter three Literature review of examined dietary factors
66
3 LITERATURE REVIEW OF EXAMINED DIETARY
RISK FACTORS
3.1 Introduction
In chapter 1, epidemiological evidence for the most clearly established dietary factors
including red and processed meat, dietary fibre and fruit and vegetables was presented.
In this chapter the dietary risk factors that were examined in the first part of this thesis
comprising the prior hypotheses (aim 1; see chapter 2, on page 61) are described and
evidence from observational studies is presented. These factors include: flavonoids, fatty
acids, nutrients involved in the one-carbon metabolic pathway (folate, vitamin B2,
vitamin B6, and vitamin B12), vitamin D and calcium.
Literature searches for each dietary factor examined in this thesis (as part of the prior
hypothesis) were carried out in the PUBMED (MEDLINE) database limited to humans,
English language and from years 1990 to 2008. The exact words used for each literature
search as well as the results of each search are presented in Appendix I.
The first step of relevant references involved looking at the title of the study in order to
identify whether the publication was applicable for inclusion. If necessary information
for inclusion or exclusion were not available in study’s title, the abstract of the study
was examined (second step). Studies that appeared relevant on first and second step
were entered into a Reference Manager database. The selected studies were then
examined at a whole-article level review to see if they met the inclusion/exclusion
criteria (third step). Those studies that did not meet the inclusion criteria were excluded.
The inclusion criteria were studies, which were: 1) Observational (prospective or
retrospective); 2) Having as primary or secondary endpoint colon and/or rectal
adenocarcinoma; 3) Investigating the associations with a) the dietary nutrient intake
(using a validated assessment of diet) or b) serum/ plasma concentration of a valid
metabolite (biomarker) of the nutrient under examination; 4) Providing RRs or ORs and
95% confidence interval (95% CI) or information allowing us to calculate them.
Additional studies were identified through published reviews, systematic literature

Chapter three Literature review of examined dietary factors
67
reviews and meta-analyses and/ or citations from the included studies. Summary tables
are presented in the end of each section.
3.2 Flavonoids
3.2.1 Introduction
One type of plant secondary metabolite is a group of biologically active polyphenolic
compounds widely distributed in a variety of plants. These compounds are of two types:
flavonoids (consist of a C15 skeleton based on 1,3-diphenylpropane) and isoflavones
(consist of a C15 skeleton based on 1,2-diphenylpropan). More than 10,000 plant
flavonoids have been described, and they have been classified into at least ten chemical
subgroups according to their structural patterns and their diverse bioactivities (116).
However, laboratory and epidemiologic studies have focused on isoflavones and six
flavonoid subgroups: flavonols, flavones, flavan3ols, anthocyanidins, pro- or antho-
cyanidins and flavanones.
The main dietary sources of these flavonoids differ widely among subgroups (117-120).
Flavonols (main representatives: quercetin, kaempferol, myricetin) are mainly present in
leafy vegetables, apples, onions and berries and these are the most abundant flavonoids
in foods. Flavones (main representatives: apigenin, luteolin) and procyanidins are in low
quantities in some vegetables and wine respectively. Flavan3ols are found in green tea,
black tea, grapes, apples, chocolate and red wine. Flavanones, such as naringenin and
hesperetin known also as citrus flavonoids are found in citrus fruits and their juices
(121). The last subgroup, isoflavones, can be found in soya beans and together with
lignans, whose precursors are present in a wide variety of plant foods, form the subgroup
of phytoestrogens (122).
Flavonoids have many biological activities including antioxidant effects, inhibiting
inflammation, antimutagenic and antiproliferative properties and involvement in the cell
cycle regulation and apoptosis (117). In addition, results from laboratory studies show
that flavonoids affect both molecular and cellular mechanisms that are involved in
carcinogenesis (119). For colorectal cancer, in particular, in vitro colon cell lines and in
vivo animal studies have reported anticarcinogenic properties associated with

Chapter three Literature review of examined dietary factors
68
flavonoids, including free radical scavenging, modifying or inactivating enzymes that
activate or detoxify carcinogens, inhibiting the induction of transcription factors such as
activator protein-1 (AP-1) activity and inducing apoptosis (123;124).
3.2.2 Evidence from observational studies
A few observational studies, have reported associations between flavonoid intake and
incidence of different types of cancer (breast, lung, stomach, prostate, urothelial, bladder
and colorectal) (125-130), but the most consistent findings have been observed for a
reduced lung cancer risk (131). Regarding colorectal cancer, 13 observational studies
(nine cohort and four case-control studies) that have examined the association between
flavonoid and isoflavone intakes and colorectal cancer have been identified and 12 of
them are presented in Table 4 (cohort studies) and Table 5 (case-control studies)
(118;125;128;129;131-139). Four of the nine cohort studies were small with less than
200 cases and thus had very limited power to detect moderate or weak associations
(118;128;129;134). In addition, the three larger cohort studies did not investigate all 6
subgroups of flavonoids (125;132;133;139) and only one, the Iowa Women’s Health
study reported statistically significant associations (125). This explanatory study
examined associations between flavan3ols and many types of cancer and was restricted
to postmenopausal women. The authors reported an inverse association with rectal
cancer but did not correct statistical significance levels to account for the many tests
performed and concluded that the role of flavonoid intake in colorectal cancer should be
studied further (125). In a more recent analysis of the Iowa Women’s Health study, the
association between total flavonoids and the main subgroups (flavonols, flavones,
flavan3ols, anthocyanidins, procyanidins, flavanones and isoflavones) and incidence of
several types of cancer (including colorectal) was examined (131). However, no
statistically significant associations between colorectal cancer and total flavonoid or any
of the main subgroups was observed and the main finding of this study was a further
support of an inverse association between flavonoids and lung cancer (not enough data
to be presented in Table 4) (131).
All four case-control studies reported statistically significant inverse associations
between flavonoid subgroups or compounds and colorectal cancer. In the Italian case-

Chapter three Literature review of examined dietary factors
69
control study the effect of the main six flavonoid subgroups was examined and the
authors have reported a statistically significant inverse association for flavonols,
flavones, anthocyanidins and isoflavones (135). The Canadian and Chinese case-control
studies examined the associations between colorectal cancer and specific flavonoids and
reported significant findings for phytoestrogens (and separately for lignans and
isoflavones) and for specific flavan3ols, respectively (137;138).

Chapter three Literature review of examined dietary factors
70
Table 4 Colorectal cancer risk and flavonoid intake; Results from published cohort studies (1990-2008)*
Study Country;
Study; Sample
Assessment Flavonoid Comparison
(high vs. low)
Outcome Cases Adjustments RR (95% CI) p†
Mursu J,
2008 (134)
Finland;
Kuopio Ischaemic
Heart Disease
Risk Factor Study;
2590 FM
4-day food
recording;
quartiles
flavonols
flavones
flavan3ols
anthocyanidins
flavanones
total flavonoids
highest vs. lowest
quartile (mg/d)
colorectal 55 age, examination
years, BMI, smoking,
PA, alcohol, fat, SF and
energy adjusted intake
of fibre, vitamin C and
E
1.53 (0.72, 3.23)
0.71 (0.30, 1.65)
1.37 (0.65, 2.89)
0.59 (0.24, 1.41)
0.90 (0.37, 2.20)
1.16 (0.58, 2.34)
0.59
0.56
0.82
0.97
0.52
0.83
Oba S, 2007
(139)
Japan;
Prospective
Takayama study;
30221 FM
FFQ;
tertiles
isoflavones M: 59.58 vs. 22.45 mg/d
F: 59.58 vs. 22.45 mg/d
colon 111
102
energy, age, height,
alcohol, smoking, BMI,
PA, coffee, use of HRT
(women)
1.47 (0.90, 2.40)
0.73 (0.44, 1.18)
0.12
0.20
Lin J, 2006
(133)
USA;
Nurses’ Health
Study, Health
Professionals
Follow-up Study;
10741FM
FFQ;
quintiles
total flavonoids
quercetin
kaempferol
myricetin
M >30.5 vs. <10.7 mg/d
F>31.1 vs. <0.96 mg/d
colorectal 380
498
380
498
380
498
380
498
age, BMI, FH, history of
CR polyps, prior
sigmoidoscopy
screening, PA, pack-
years of smoking, red
meat, alcohol, energy,
calcium, folate, fibre,
aspirin, multivitamin
1.28 (0.89, 1.83)
1.13 (0.83, 1.52)
1.16 (0.80, 1.68)
1.01 (0.75, 1.35)
1.09 (0.78, 1.52)
1.14 (0.85, 1.52)
1.33 (0.93, 1.89)
0.89 (0.67, 1.18)
0.21
0.42
0.40
0.40
0.29
0.55
0.43
0.96
Arts IC, 2002
(125)
USA;
Iowa Women’s
Health Study;
34651F
FFQ;
quintiles
catechins
catechin
+ epicatechin
>75.1 vs. <3.6 mg/d
>24.7 vs. <3.6 mg/d
>24.3 vs. <3.2 mg/d
>15.7 vs. <3.2 mg/d
colon
rectal
colon
rectal
635
132
635
132
age, energy, BMI,
waist-to-hip ratio, PA,
pack-years of smoking,
smoking, number of
years since quit
smoking, alcohol, fruit
1.10 (0.85, 1.44)
0.55 (0.32, 0.95)
1.04 (0.71, 1.29)
0.92 (0.50, 1.71)
0.63
0.002
0.90
0.75

Chapter three Literature review of examined dietary factors
71
gallates >50.8 vs. <0.4 mg/d
>8.9 vs. <0.4 mg/d
colon
rectal
635
132
and vegetable 0.95 (0.72, 1.25)
0.39 (0.22, 0.71)
0.44
0.02
Knekt P, 2002
(118)
Finland;
Finnish Mobile
Clinic Health
Examination
Survey; 10054 FM
diet history;
quartiles
quercetin
kaempferol
myricetin
hesperetin
naringenin
total
M >3.9 vs. <1.5 mg/d
F >4.7 vs. <1.8 mg/d
M >0.8 vs. <0.1 mg/d
F >0.9 vs. <0.1 mg/d
M >0.1 vs. <0.06 mg/d
F >0.2 vs. <0.03 mg/d
M >15.4 vs. 0 mg/d
F >26.8 vs. <3.2 mg/d
M >4.7 vs. <4.7 mg/d
F >7.7 vs. <0.9 mg/d
M >26.9 vs. <4.3 mg/d
F >39.5 vs. <8.5 mg/d
colorectal 90 sex, age, geographic
area, occupation,
smoking, BMI
0.62 (0.33, 1.17)
1.13 (0.60, 2.12)
1.31 (0.71, 2.43)
0.97 (0.50, 1.90)
0.93 (0.48, 1.82)
0.84 (0.43, 1.64)
0.22
0.96
0.39
0.84
0.99
0.95
Hirvonen T,
2001 (128)
Finland;
Alpha-Tocopherol,
Beta-Carotene
Cancer
Prevention Study;
27110 M
diet history;
quartiles
flavonols
+ flavones
16.3 vs. 4.2 mg/d colorectal 133 age; supplement group 1.70 (1.00, 2.70) 0.10
Goldbohm
RA, 1998
(132)
Netherlands;
Netherlands
Cohort Study;
3726FM
flavonols
+ luteolin
43.5 vs. 12.7 mg/d colorectal 603 0.97 (0.71, 1.32) 0.92

Chapter three Literature review of examined dietary factors
72
Knekt P, 1997
(129)
Finland;
Finnish Mobile
Clinic Health
Examination
Survey; 9959FM
diet history
interview;
quartiles
flavonols
flavones
M >4.8 vs. <2.1 mg/d
F >5.5 vs. <2.4 mg/d
colorectal 72 sex, age, geographic
area, occupation, BMI,
smoking, energy,
vitamin C, vitamin E,
beta carotene, fibre,
SFAs, MUFAs,
PUFAs, cholesterol
0.74 (0.32, 1.68)
* Abbreviations: F: females; M: males; FFQ: food frequency questionnaire; BMI: body mass index; FH: family history; CRC: colorectal cancer; PA: physical activity; HRT: hormone
replacement therapy; NSAIDs: Non-steroidal anti-inflammatory drugs; SFAs: saturated fatty acids; MUFAs: mono-unsaturated fatty acids; PUFAs: poly-unsaturated fatty acids
† P-value for trend

Chapter three Literature review of examined dietary factors
73
Table 5 Colorectal cancer risk and flavonoid intake; Results from published case-control studies (1990-2008)*
Study Country;
Study; Sample
Assessment Flavonoid Comparison
(high vs. low)
Outcome Cases Adjustments OR (95% CI) p†
Theodoratou
E, 2007‡
(136)
Scotland;
SOCCS study;
2912 FM
FFQ;
quartiles
flavonols
flavones
flavan3ols
procyanidins
flavanones
phytoestrogens
>36.8 vs. <16.0 mg/d
>1.9 vs. <0.5 mg/d
>162.1 vs. 42.6 mg/d
>45.2 vs. <16.7 mg/d
>40.6 vs. <7.4 mg/d
>857.6 vs. <402.7 µg/d
colorectal 1456 matched on age, sex,
residence area;
adjusted for FH; BMI;
PA; smoking; and
intakes of energy
(residual), fibre,
alcohol and NSAIDs
0.73 (0.59, 0.91)
1.11 (0.88, 1.40)
0.81 (0.65, 1.01)
0.81 (0.65, 1.00)
1.13 (0.89, 1.43)
0.93 (0.74, 1.15)
0.02
0.60
0.08
0.08
0.37
0.67
Yuan MJ,
2006 (137)
China; nested
case-control of the
Shanghai Cohort;
968 FM
urine metabolite
measurements;
4 categories
EGC
EC
>7.82 vs. 0 µmol/g Cr
>2.00 vs. 0 µmol/g Cr
colorectal 162
matched on age, date
of blood collection and
neighbourhood of
residence; adjusted
for: smoking
(cigarettes/day, and
number of years),
alcohol, number of
alcoholic beverages
0.76 (0.47, 1.24)
0.91 (0.55, 1.51)
0.28
0.59
Cotterchio
M, 2006 (138)
Canada,
Ontario Familial
Colorectal Cancer
Registry; 2985 FM
FFQ;
tertiles
lignans
isoflavones
phytoestrogens
>0.26 vs. <0.16 mg/d
>1.10 vs. <0.29 mg/d
>1.34 vs. <0.53 mg/d
colorectal 1095 lignans adjusted for:
age, sex, dietary fibre,
and energy;
isoflavones and
phytoestrogens
adjusted for age, sex,
and energy
0.73 (0.56, 0.94)
0.71 (0.58, 0.86)
0.71 (0.59, 0.86)
0.01
<0.01
<0.01
Rossi M,
2006 (135)
Italy; 6107 FM FFQ;
quintiles
flavonols
flavones
flavan3ols
anthocyanidins
>28.5 vs. <13.2 mg/d
>0.7 vs. <0.3 mg/d
>88.5 vs. <20.8 mg/d
>31.7 vs. <5.3 mg/d
colorectal 1953 age, sex, study centre,
FH, education, alcohol,
BMI, occupational PA,
energy (residual)
0.64 (0.54-0.77)
0.78 (0.65-0.93)
0.98 (0.82-1.18)
0.67 (0.54-0.82)
<0.001
0.004
0.74
<0.001

Chapter three Literature review of examined dietary factors
74
flavanones
isoflavones
total flavonoids
>67.0 vs. <12.5 mg/d
>33.9 vs. <14.4 µg/d
>191.1 vs. <75.3 mg/d
0.96 (0.81-1.15)
0.76 (0.63-0.91)
0.97 (0.81-1.16)
0.43
0.001
0.50
* Abbreviations: F: females; M: males; FFQ: food frequency questionnaire; BMI: body mass index; FH: family history; CRC: colorectal cancer; PA: physical activity; HRT: hormone
replacement therapy; NSAIDs: Non-steroidal anti-inflammatory drugs
† P-value for trend
‡ Results that are part of the current thesis and will be presented in detail in the following chapters

Chapter three Literature review of examined dietary factors
75
3.3 Fatty acids
3.3.1 Introduction
All fats consist of fatty acids (organic (carboxylic) acids), which are classified as either
saturated or unsaturated, depending on their chemical structure. SFAs have no double
bonds between the carbon atoms of the fatty acid chain. The most abundant SFAs are
butyric acid, which is the main product of fibre fermentation in the large bowel, and
palmitic and stearic acids, which are mainly found in meat products. SFAs are also
found in butter, lard, coconut oil, cream and cheese. Unsaturated fatty acids have one
(MUFAs) or more (PUFAs) double bonds in the fatty acid chain. The most common
MUFAs are palmitoleic acid and oleic acid and they are mainly present in nuts,
avocados and olive oil. PUFAs are further divided in ω3PUFAs and ω6PUFAs fatty
acids. The difference is that ω3PUFAs have a double bond, three carbons away from the
methyl carbon, whereas ω6PUFAs have it six carbons away from the methyl carbon.
Omega-3 PUFA subgroup consists of α-linolenic acid mainly found in seeds (rapeseed,
soybeans, walnuts and flaxseed) oils, and EPA and DHA acids mainly found in oily fish
(herring, salmon, mackerel and halibut) and sea food. Omega-6 PUFAs consist of
linoleic, γ-linolenic and arachidonic acids and their main sources are sunflower and
safflower oil. Unlike other fatty acids, linoleic and α-linolenic acids (essential fatty
acids) cannot be synthesised by the body and therefore intake through the diet is
required (140). Trans fatty acids are a type of either MUFAs or PUFAs and occur
naturally in small quantities in meat and dairy products from ruminates. However, most
tFAs consumed today, are industrially produced through partial hydrogenation of plant
oils and animal fats (141).
Animal and cell-line studies have suggested that the effect of fats depends not only on
their quantity but also on composition of fatty acids, which might explain the differences
in the observed associations (142). Several hypothesised mechanisms regarding the role
of specific fatty acids on the development of colon cancer have been described. One
example is the anticarcinogenic properties of butyric acid, which is mainly produced in
the large bowel as result of fibre fermentation (142). Furthermore it has been shown that
MUFAs and tFAs promote human colon growth through increase in fatty acid oxidation
and disturbance of membrane enzymes (142). In addition, there is increasing interest on

Chapter three Literature review of examined dietary factors
76
the possible protective effects of ω3PUFAs in contrast to the increased risk of
ω6PUFAs. The different effects of these two series are related to their enzymatic
competition for their metabolic conversion in eicosanoids, which effect many
physiological processes, including apoptosis, cell proliferation and immune cell function
(143;144).
3.3.2 Evidence from observational studies
Consumption of fats and oils varies throughout the world, with intake in more developed
regions of the world (Europe, North America, Australia and New Zealand) being higher
(approximately 30-40 % of total energy intake) than in less developed countries (Africa,
Asia and Latin America; approximately 20-30% of total energy intake) (30). Since the
first study that suggested that dietary fats might affect colorectal carcinogenesis (145)
many studies have investigated the colorectal cancer effect of fat according to its amount
(total fat), its type (saturated, mono-unsaturated and poly-unsaturated fat) and its origin
(animal, vegetable, fish derived fat) (142). Neither case-control nor cohort studies have
found that high total fat intakes increase risk of colorectal cancer (64). In addition a
meta-analysis of case-control studies (conducted from 1976 to 1988) concluded that
there were no energy-independent associations between the three major fat subclasses
(SFAs, MUFAs or PUFAs) and colorectal cancer (142). Regarding specific fatty acid
subgroups (SFAs, MUFAs, PUFAs, ω3PUFAs, ω6PUFAs and tFAs), few observational
studies have studied their associations with colorectal cancer. Regarding the fat origin,
results from ecological studies indicate that diets particularly high in animal fat to be
generally associated with increased risk in colorectal cancer, in contrast to diets high in
vegetable or fish derived fat (146). In addition, according to the AICR/WCRF report
(2007), the evidence that high intake of animal fat is causally linked to colorectal cancer
is fairly consistent but limited and a summary relative risk of three prospective studies
was 1.16 (95% CI 0.92, 1.38) per 20g/day (30). In addition, according to the findings of
the same report the evidence that high fish intake is inversely associated with colorectal
cancer is limited (summary RR of seven prospective studies (95% CI): 0.96 (0.92, 1.00))
(30).
We identified nine cohort (Table 6) and six case-control studies (Table 7) that studied
the association between colorectal cancer and saturated fat (62;63;65;66;141;147-156)
Chapter three Literature review of examined dietary factors
77
and two cohort (Table 6) and nine case-control studies (Table 7) that studied the
association between colorectal cancer and SFAs (157-167). Only one case-control
reported a statistically significant positive association between SFAs and colorectal
cancer (160). Regarding MUFAs, we identified seven cohort (Table 8) and four case-
control studies (Table 9) that examined the association between mono-unsaturated fat
and colorectal cancer (62;63;66;141;147-150;152;153;155) and three cohort (Table 8)
and nine case-control studies (Table 9) that examined the association between MUFAs
and colorectal cancer (157-168). One cohort study reported a statistically significant
inverse association between MUFAs and colon cancer (168) and one case-control study
a significant inverse association between MUFAs and colorectal cancer (66). Regarding
PUFAs, we identified four cohort (Table 10) and four case-control studies (Table 11)
that examined the association between poly-unsaturated fat and colorectal cancer
(62;66;147;148;150;152;153;155) and two cohort (Table 10) and seven case-control
studies (Table 11) that examined the association between PUFAs and colorectal cancer
(157;160-167). Three case-control studies reported significant inverse associations
between PUFAs or poly-unsaturated fat and colorectal cancer (66;160;165).
A few studies have investigated the associations between colorectal cancer and
ω3PUFAs or ω6PUFAs, separately. We identified six cohort (Table 12) and 10 case-
control studies (Table 13) that tested association between risk of colorectal cancer and
ω3PUFAs or the individual ω3PUFAs EPA, DHA and/or α-linolenic acid
(141;147;150;158-164;166;169-173). In total, one cohort and four case-control studies
reported a statistically significant inverse association between ω3PUFAs and colorectal
cancer (158;161;164;170;172). Regarding ω6PUFAs, we identified three cohort (Table
14) and 10 case-control studies (Table 15) that investigated their associations (or the
associations with linoleic acid) with colorectal cancer (141;150;158-
164;166;169;173;174), with only one case-control study reporting a significant inverse
association (160). Finally, we identified three cohort (Table 16) and three case-control
(Table 17) studies that examined the association between tFAs and colorectal cancer
(141;161;162;164;175;176), with one case-control study reporting significant positive
association for female colorectal cancer cases (175).

Chapter three Literature review of examined dietary factors
78
Table 6 Colorectal cancer risk and saturated fat or saturated fatty acids; Results from published cohort studies (1990-2008)*
Study Country;
Study; Sample
Assessment Fatty acid
subgroup
Comparison
(high vs. low)
Outcome Cases Adjustments RR (95% CI) p†
Weijenberg MP,
2007 (152)
The Netherlands;
Netherlands
Cohort Study;
120852 FM
FFQ;
quartiles
SF M: 45.8 vs. 28.9 g/d
F: 36.6 vs. 23.9 g/d
colon 434 age, sex, BMI, smoking,
energy, FH of CRC
0.94 (0.69, 1.27) 0.54
Brink M, 2004
(148)
The Netherlands;
Netherlands
Cohort Study;
3346 FM
FFQ;
quartiles
SF M: 45.8 vs. 28.9 g/d
F: 36.6 vs. 23.9 g/d
rectum 160
age, sex, BMI, smoking,
energy intake, FH of CRC
0.73 (0.46, 1.17) 0.37
Lin J, 2004
(141)
USA;
Women’s Health
Study; 37547 F
FFQ;
quintiles
SF 13 vs. 7 % energy colorectal 202 age, random treatment
assignment, BMI, FH of
CRC, history of colorectal
polyps, PA, cigarette
smoking, alcohol
consumption,
postmenopausal HRT,
and energy
0.92 (0.61, 1.41) 0.44
Flood A, 2003
(156)
USA;
Breast Cancer
Detection
Demonstration
Project; 45496 F
FFQ;
quintiles
SF 15.7 vs. 7.1 g/d colorectal 487 energy 1.02 (0.77, 1.34) 0.74
Jarvinen R,
2001 (157)
Finland;
Finnish Mobile
Clinic Health
Examination
Survey;9959 FM
diet history;
quartiles
SFAs M: >86.6 vs. 53.5 g/d
F: >60.1 vs. <35.6 g/d
colorectal 109 age, sex, BMI,
occupation, smoking,
geographical area,
energy, vegetables, fruits
and cereals
1.47 (0.56, 3.83)
Pietinen P,
1999 (162)
Finland;
Alpha-Tocopherol,
diet history;
quartiles
SFAs 65.1 vs. 33.8 g/d colorectal 185 age, supplement group,
smoking years, BMI,
0.9 (0.6, 1.4) 0.27

Chapter three Literature review of examined dietary factors
79
Beta-Carotene
Cancer Prevention
Study; 27111M
alcohol, education, PA at
work, calcium
Kato I, 1997
(65)
USA;
New York’s
University Health
Study; 14727 F
FFQ;
quartiles
SF high vs. low quartile colorectal 100 total calorie intake, age,
place at enrolment,
highest level of education
1.05 (0.59, 1.88) 0.51
Gaard M, 1996
(63)
Norway; 50535FM FFQ SF colon 143 energy no association
Bostick RM,
1994 (147)
USA;
Iowa’s Women’s
Health; 32215 F
FFQ;
quintiles
SF >31.7 vs. <16.0 g/d colon 212 age, energy, height,
parity, vitamin E, vitamin
E x age term, vitamin A
supplement intake,
residual energy
adjustment
1.21 (0.78, 1.89) 0.98
Giovannucci E,
1994 (149)
USA;
Health
Professionals
Follow-up Study;
47949 M
FFQ;
quintiles
SF 33.0 vs. 17.4 g/d colon 205 age, energy (residual) 0.88 (0.56, 1.37) 0.79
Goldbohm RA,
1994 (155)
The Netherlands;
Netherlands
Cohort Study;
3500 FM
FFQ;
quintiles
SF M: 47 vs. 28 g/d
F: 27 vs. 23 g/d
colon 215 age, energy, dietary fibre 1.07 (0.69, 1.66) 0.91
* Abbreviations: F: females; M: males; FFQ: food frequency questionnaire; SF: saturated fat; SFAs: saturated fatty acids; BMI: body mass index; FH: family history; CRC: colorectal
cancer; PA: physical activity; HRT: hormone replacement therapy; NSAIDs: Non-steroidal anti-inflammatory drugs
† P-value for trend

Chapter three Literature review of examined dietary factors
80
Table 7 Colorectal cancer risk and saturated fat or saturated fatty acids; Results from published case-control studies (1990-2008)*
Study Country;
Study; Sample
Assessment Fatty acid
subgroup
Comparison
(high vs. low)
Outcome Cases Adjustments OR (95% CI) p†
Theodoratou E,
2007‡ (164)
Scotland;
SOCCS; 2910FM
FFQ;
quartiles
SFAs ≥43.64 vs. <31.72 g/d colorectal 1458 matched on age, sex,
are of residence,
adjusted for FH, total
energy intake
(residual method),
fibre intake, alcohol
intake, use of
NSAIDs, smoking,
BMI, PA
1.27 (1.00, 1.61) 0.08
Kimura Y, 2007
(158)
Japan;
Fukuoka
Colorectal Cancer
Study; 1575FM
FFQ;
quintiles
SFAs 22.10 vs. 11.39 g/d colorectal
782 energy (residual),
age, sex, residential
area, BMI 10 years
before, parental CRC,
smoking, alcohol use,
type of job, leisure-
time PA, dietary
calcium and fibre
intake
1.04 (0.71, 1.51) 0.52
Kuriki K, 2006
(160)
Japan; 295 FM Erythrocyte
measurements
using gas-liquid
chromatography;
tertiles
SFAs >52.80 vs. <50.89 mol% colorectal 74 BMI, habitual
exercise, drinking and
smoking status,
green-yellow
vegetable intake, FH
8.20 (2.86, 23.52) <0.0001
Wakai K, 2006
(166)
Japan; 2535 FM FFQ;
quartiles
SFAs high vs. low quartile colon
rectal
265
242
energy, sex, age,
year and season of
first visit to the
hospital, reason for
visit, FH of CRC<
0.83 (0.57, 1.20)
0.86 (0.56, 1.33)
0.35
0.57

Chapter three Literature review of examined dietary factors
81
BMI, exercise,
alcohol, smoking,
multivitamin use
Kojima M, 2005
(159)
Japan;
Japan
Collaborative
Cohort Group;
650 FM
serum;
quartiles
SFAs M: ≥36.1 vs. <31.9
weight % of total serum
lipids
F: ≥35.4 vs. <31.4
weight % of total serum
lipids
colorectal 83
86
matched on age and
participating
institution; adjusted
for FH of CRC, BMI,
education, smoking,
alcohol, green leafy
vegetable intake, PA
1.71 (0.66, 4.47)
0.59 (0.23, 1.52)
0.36
0.51
Senesse P,
2004 (167)
France; 480 FM diet history;
quartiles
SFAs M: >50.8 vs. <8.9 g/d
F: >44.0 vs. <7.7 g/d
colorectal 171 age, sex, energy,
BMI, PA
1.4 (0.6, 3.2) 0.50
Nkondjock A,
2003 (161)
Canada;
1070 FM
FFQ;
quartiles
SFAs >123.3 vs. 66.14 g/d colorectal 402
energy (residual),
age, marital status,
history of colorectal
cancer in first-degree
relatives, BMI one
year prior to
diagnosis, and PA
0.97 (0.68, 1.38) 0.53
Levi F, 2002
(66)
Switzerland;
836 FM
FFQ;
tertiles
SF >312 vs. <205 g/d colorectal 286 age, sex, education,
PA and residual
energy
1.4 (0.9, 2.2) >0.05
Franceschi S,
1998 (62)
Italy; 6107 FM FFQ;
per 100 kcal of
total energy/day
SF mean: 230 kcal/day colorectal 1953 age, sex, study
centre, education, PA
and alcohol intake
1.12 (0.98, 1.28)
Slattery ML,
1997 (163)
USA; 4403 FM CARDIA diet
history;
quintiles
SFAs M >69.3 vs. <42.0 g/MJ
F >68.0 vs. 39.2 g/MJ
colon 1095
888
age at diagnosis or
selection, energy
intake, dietary fibre,
cholesterol, calcium,
BMI, physical activity,
FH of CRC, NSAIDs
0.88 (0.64, 1.22)
0.96 (0.67, 1.37)

Chapter three Literature review of examined dietary factors
82
Le Marchand L,
1997 (150)
USA (Hawaii);
2384 FM
FFQ;
quartiles
SF M >27 vs. <18 g/d
F >20 vs. <14 g/d
colorectal 698
494
age, FH of CRC,
alcoholic drinks/week,
pack-years,
lifetime recreational
PA, BMI five years
ago, and caloric,
dietary fibre and
calcium intakes;
residual Calorie-
adjustment
1.2 (0.8, 1.8)
1.5 (0.9, 2.4)
0.4
0.09
Ghadirian P,
1997 (153)
Canada; 1070 FM FFQ;
quartiles
SF high vs. low quartile colon 402 sex, age, marital
status, history of
colon carcinoma in
first-degree relatives,
energy
0.71 (0.49, 1.03) 0.09
De Stefani E,
1997 (154)
Uruguay; 846 FM quartiles SF >35.3 vs. ≤25.8 mg/d colorectal 282 age, sex, residence,
urban/rural status,
energy, calcium,
vitamin D, folate
1.52 (0.84, 2.77) 0.18
Trichopoulou
A, 1992 (151)
Greece; 200 FM FFQ SF continuous colorectal 100 age, gender, energy 1.28 (0.71, 2.30) >0.05
Zaridze D, 1992
(165)
Russia; 434 FM FFQ;
quartiles
SFAs M: >80.8 vs. <48.3 g/d
F: >74.8 vs. <44.5 g/d
colorectal 217 energy, education 1.56 (0.59, 4.18) 0.40
* Abbreviations: F: females; M: males; FFQ: food frequency questionnaire; SF: saturated fat; SFAs: saturated fatty acids; BMI: body mass index; FH: family history; CRC: colorectal
cancer; PA: physical activity; HRT: hormone replacement therapy; NSAIDs: Non-steroidal anti-inflammatory drugs
† P-value for trend
‡ Results that are part of the current thesis and will be presented in detail in the following chapters

Chapter three Literature review of examined dietary factors
83
Table 8 Colorectal cancer risk and mono-unsaturated fat or mono-unsaturated fatty acids; Results from published cohort studies (1990-2008)*
Study Country; Study;
Sample
Assessment Fatty acid
subgroup
Comparison
(high vs. low)
Outcome Cases Adjustments RR (95% CI) p†
Weijenberg MP,
2007 (152)
The Netherlands;
Netherlands Cohort
Study;
120852 FM
FFQ;
quartiles
MUF M: 42.5 vs. 28.2 g/d
F: 33.1 vs. 22.4 g/d
colon 434 age, sex, BMI, smoking,
energy intake and FH of
CRC
0.99 (0.73, 1.34) 0.79
Brink M, 2004
(148)
The Netherlands;
Netherlands Cohort
Study;
3346 FM
FFQ;
quartiles
MUF M: 42.5 vs. 28.2 g/d
F: 33.0 vs. 22.4 g/d
rectum 160
age, sex, BMI, smoking,
energy intake and FH of
CRC
0.87 (0.56, 1.37) 0.80
Lin J, 2004
(141)
USA;
Women’s Health
Study; 37547 F
FFQ;
quintiles
MUF 15 vs. 8 % energy colorectal 202 age, random treatment
assignment, BMI, FH of
CRC, history of colorectal
polyps, PA, smoking,
alcohol consumption,
HRT, energy
1.09 (0.68, 1.73) 0.72
Jarvinen R,
2001 (157)
Finland;
Finnish Mobile Clinic
Health Examination
Survey; 9959 FM
diet history;
quartiles
MUFAs M: >49.2 vs. 30.5 g/d
F: >34.0 vs. <20.8
colorectal 109 age, sex, BMI,
occupation, smoking,
geographical area, energy
intake, vegetables, fruits
and cereals
2.37 (0.86, 6.51)
Pietinen P,
1999 (162)
Finland;
Alpha-Tocopherol,
Beta-Carotene
Cancer Prevention
Study; 27111M
modified diet
history;
quartiles
MUFAs 40.7 vs. 28.4 g/d colorectal 185 age, supplement group,
smoking years, BMI,
alcohol, education, PA at
work, calcium
1.2 (0.8, 1.8) 0.44
Gaard M, 1996
(63)
Norway; 50535 FM FFQ MUF colon 143 energy no association

Chapter three Literature review of examined dietary factors
84
Chyou PH,
1996 (168)
Japanese-American
(USA); 7945 M
24 hour diet
history;quartiles
MUFAs ≥41 vs. <22 g/d colon
rectum
330
123
age 0.73 (0.53, 1.00)
1.47 (0.88, 2.47)
0.02
0.47
Bostick RM,
1994 (147)
USA;
Iowa’s Women’s
Health; 32215 F
FFQ;
quintiles
MUF >33.1 vs. <16.6 g/d colon 212 age, energy (residual),
height, parity, vitamin E,
vitamin E x age term,
vitamin A supplement
0.85 (0.54, 1.35) 0.70
Giovannucci E,
1994 (149)
USA;
Health Professionals
Follow-up Study;
47949 M
FFQ;
quintiles
MUF 34.2 vs. 19.1 g/d colon 205 age, energy (residual) 1.07 (0.68, 1.69) 0.68
Goldbohm RA,
1994 (155)
The Netherlands;
Netherlands Cohort
Study;
3500 FM
FFQ;
quintiles
MUF M: 43 vs. 27 g/d
F: 27 vs. 23 g/d
colon 215 age, energy, dietary fibre 1.00 (0.63, 1.57) 0.88
* Abbreviations: F: females; M: males; FFQ: food frequency questionnaire; MUF: mono-unsaturated fat; MUFAs: mono-unsaturated fatty acids; BMI: body mass index; FH: family
history; CRC: colorectal cancer; PA: physical activity; HRT: hormone replacement therapy; NSAIDs: Non-steroidal anti-inflammatory drugs
† P-value for trend

Chapter three Literature review of examined dietary factors
85
Table 9 Colorectal cancer risk and mono-unsaturated fat or mono-unsaturated fatty acids; Results from published case-control studies (1990-2008)*
Study Country;
Study; Sample
Assessment Fatty acid
subgroup
Comparison
(high vs. low)
Outcome Cases Adjustments OR (95% CI) p†
Theodoratou E,
2007‡ (164)
Scotland;
SOCCS; 2910FM
FFQ;
quartiles
MUFAs ≥36.16 vs. <28.72 g/d colorectal 1458 matched on age, sex,
are of residence;
adjusted for FH, total
energy intake (residual),
fibre intake, alcohol
intake, use of NSAIDs,
smoking, BMI, PA
1.33 (1.05, 1.68) 0.06
Kimura Y, 2007
(158)
Japan;
Fukuoka
Colorectal Cancer
Study; 1575FM
FFQ;
quintiles
MUFAs 28.06 vs. 15.29 g/d colorectal
782 Energy (residual), age,
sex, residential area,
BMI 10 years before,
parental CRC, smoking,
alcohol use, type of job,
leisure-time PA, dietary
calcium and fibre intake
0.88 (0.62, 1.25) 0.44
Kuriki K, 2006
(160)
Japan; 295FM Erythrocyte
measurements
using gas-liquid
chromatography;
tertiles
MUFAs >18.85 vs. <17.56
mol%
colorectal 74 BMI, habitual exercise,
drinking and smoking
status, green-yellow
vegetable intake, and FH
colorectal cancer
1.93 (0.88, 4.23) 0.15
Wakai K, 2006
(166)
Japan; 2535 FM FFQ;
quartiles
MUFAs high vs. low quartile colon
rectal
265
242
energy, sex, age, year
and season of first visit
to the hospital, reason
for visit, FH of CRC<
BMI, exercise, alcohol,
smoking, multivitamin
0.92 (0.62, 1.36)
0.76 (0.51, 1.14)
0.80
0.15
Kojima M, 2005
(159)
Japan;
nested case-
serum;
quartiles
MUFAs M: ≥24.7 vs. <20.8
weight % of total
colorectal 83
matched on age and
participating institution;
2.05 (0.86, 4.89)
0.06

Chapter three Literature review of examined dietary factors
86
control of Japan
Collaborative
Cohort Group;
650 FM
serum lipids
F: ≥24.1 vs. <20.4
weight % of total
serum lipids
86
adjusted for FH of CRC,
BMI, education, smoking,
alcohol, green leafy
vegetable intake, PA
0.83 (0.36, 1.92)
0.51
Senesse P,
2004 (167)
France; 480 FM diet history;
quartiles
MUFAs M: >44.5 vs. <10.0 g/d
F: >35.6 vs. <8.1 g/d
colorectal 171 age, sex, energy, BMI,
PA
1.0 (0.4, 2.4) 0.95
Nkondjock A,
2003 (161)
Canada;
1070 FM
FFQ;
quartiles
MUFAs >50.01 vs. 25.99 g/d colorectal 402
energy (residual), age,
marital status, history of
colorectal cancer in first-
degree relatives, BMI
one year prior to
diagnosis, and PA
0.99 (0.69, 1.41) 0.96
Levi F, 2002
(66)
Switzerland;
836 FM
FFQ;
tertiles
MUF >335 vs. <249 g/d colorectal 286 age, sex, education, PA
and residual energy
0.6 (0.4, 0.9) <0.05
Franceschi S,
1998 (62)
Italy;
6107 FM
FFQ;
per 100 kcal of
total energy/day
MUF mean: 264 kcal/day colorectal 1953 age, sex, study centre,
education, PA and
alcohol intake
1.00 (0.91, 1.10)
Slattery ML,
1997 (163)
USA; 4403 FM CARDIA diet
history;
quintiles
MUFAs M >66 vs. <44 g/MJ
F >63 vs. <39 g/MJ
colon 1095
888
age at diagnosis or
selection, energy intake,
dietary fibre, cholesterol,
calcium, BMI, PA, FH of
CRC, NSAIDs
0.89 (0.65, 1.21)
0.94 (0.66, 1.34)
Le Marchand L,
1997 (150)
USA (Hawaii);
2384 FM
FFQ;
quartiles
MUF M >33 vs. <24 g/d
F >20 vs. <14 g/d
colorectal 698
494
age, FH of CRC,
alcoholic drinks/week,
pack-years,
lifetime recreational PA,
BMI five years ago, and
caloric, dietary fibre and
calcium intakes; residual
Calorie-adjustment
1.4 (0.9, 2.1)
1.4 (0.9, 2.2)
0.06
0.1

Chapter three Literature review of examined dietary factors
87
Ghadirian P,
1997 (153)
Canada; 1070 FM FFQ;
quartiles
MUF high vs. low quartile colon 402 sex, age, marital status,
history of colon
carcinoma in first-degree
relatives, energy
0.89 (0.61, 1.30) 0.63
Zaridze D, 1992
(165)
Russia; 434 FM FFQ;
quartiles
MUFAs M: >72.4 vs. <45.9 g/d
F: >69.4 vs. <42.8 g/d
colorectal 217 energy, education 0.54 (0.20, 1.51) 0.23
* Abbreviations: F: females; M: males; FFQ: food frequency questionnaire; MUF: mono-unsaturated fat; MUFAs: mono-unsaturated fatty acids; BMI: body mass index; FH: family
history; CRC: colorectal cancer; PA: physical activity; HRT: hormone replacement therapy; NSAIDs: Non-steroidal anti-inflammatory drugs
† P-value for trend
‡ Results that are part of the current thesis and will be presented in detail in the following chapters
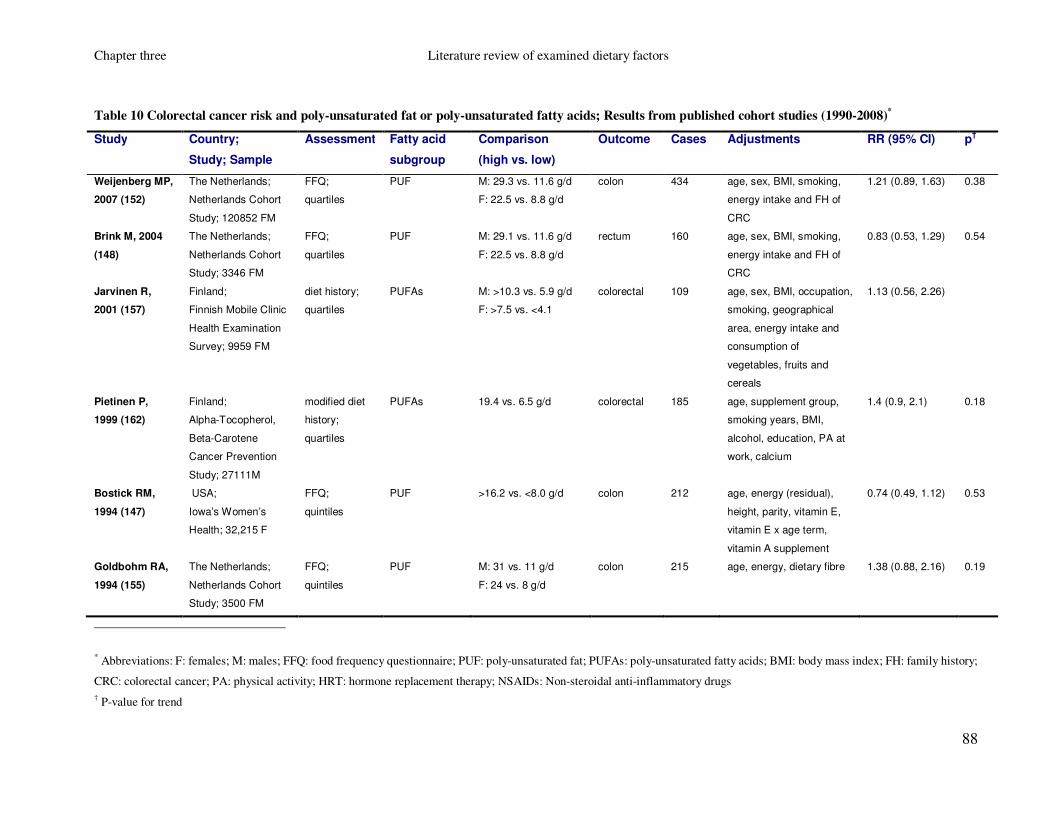
Chapter three Literature review of examined dietary factors
88
Table 10 Colorectal cancer risk and poly-unsaturated fat or poly-unsaturated fatty acids; Results from published cohort studies (1990-2008)*
Study Country;
Study; Sample
Assessment Fatty acid
subgroup
Comparison
(high vs. low)
Outcome Cases Adjustments RR (95% CI) p†
Weijenberg MP,
2007 (152)
The Netherlands;
Netherlands Cohort
Study; 120852 FM
FFQ;
quartiles
PUF M: 29.3 vs. 11.6 g/d
F: 22.5 vs. 8.8 g/d
colon 434 age, sex, BMI, smoking,
energy intake and FH of
CRC
1.21 (0.89, 1.63) 0.38
Brink M, 2004
(148)
The Netherlands;
Netherlands Cohort
Study; 3346 FM
FFQ;
quartiles
PUF M: 29.1 vs. 11.6 g/d
F: 22.5 vs. 8.8 g/d
rectum 160
age, sex, BMI, smoking,
energy intake and FH of
CRC
0.83 (0.53, 1.29) 0.54
Jarvinen R,
2001 (157)
Finland;
Finnish Mobile Clinic
Health Examination
Survey; 9959 FM
diet history;
quartiles
PUFAs M: >10.3 vs. 5.9 g/d
F: >7.5 vs. <4.1
colorectal 109 age, sex, BMI, occupation,
smoking, geographical
area, energy intake and
consumption of
vegetables, fruits and
cereals
1.13 (0.56, 2.26)
Pietinen P,
1999 (162)
Finland;
Alpha-Tocopherol,
Beta-Carotene
Cancer Prevention
Study; 27111M
modified diet
history;
quartiles
PUFAs 19.4 vs. 6.5 g/d colorectal 185 age, supplement group,
smoking years, BMI,
alcohol, education, PA at
work, calcium
1.4 (0.9, 2.1) 0.18
Bostick RM,
1994 (147)
USA;
Iowa’s Women’s
Health; 32,215 F
FFQ;
quintiles
PUF >16.2 vs. <8.0 g/d colon 212 age, energy (residual),
height, parity, vitamin E,
vitamin E x age term,
vitamin A supplement
0.74 (0.49, 1.12) 0.53
Goldbohm RA,
1994 (155)
The Netherlands;
Netherlands Cohort
Study; 3500 FM
FFQ;
quintiles
PUF M: 31 vs. 11 g/d
F: 24 vs. 8 g/d
colon 215 age, energy, dietary fibre 1.38 (0.88, 2.16) 0.19
* Abbreviations: F: females; M: males; FFQ: food frequency questionnaire; PUF: poly-unsaturated fat; PUFAs: poly-unsaturated fatty acids; BMI: body mass index; FH: family history;
CRC: colorectal cancer; PA: physical activity; HRT: hormone replacement therapy; NSAIDs: Non-steroidal anti-inflammatory drugs
† P-value for trend

Chapter three Literature review of examined dietary factors
89
Table 11 Colorectal cancer risk and poly-unsaturated fat or poly-unsaturated fatty acids; Results from published case-control studies (1990-2008)*
Study Country;
Study;
Sample
Assessment Fatty acid
subgroup
Comparison
(high vs. low)
Outcome Cases Adjustments OR (95% CI) p†
Theodoratou E,
2007‡ (164)
Scotland;
SOCCS;
2910 FM
FFQ;
quartiles
PUFAs ≥16.75 vs. <12.01 g/d colorectal 1458 matched on age, sex,
are of residence;
adjusted for FH, total
energy intake (residual
method), fibre intake,
alcohol intake, use of
NSAIDs, smoking, BMI,
PA
0.97 (0.77, 1.23) 0.54
Kuriki K,
2006 (160)
Japan;
295 FM
Erythrocyte
measurements
using gas-liquid
chromatography;
tertiles
PUFAs >31.09 vs. <28.21 mol% colorectal 74 BMI, habitual exercise,
drinking and smoking
status, green-yellow
vegetable intake, FH
0.15 (0.05, 0.46) <0.005
Wakai K,
2006 (166)
Japan;
2535 FM
FFQ;
quartiles
PUFAs high vs. low quartile colon
rectal
265
242
energy, sex, age, year
and season of first visit
to the hospital, reason
for visit, FH of CRC<
BMI, exercise, alcohol,
smoking, multivitamin
use
0.90 (0.61, 1.31)
0.76 (0.51, 1.12)
0.88
0.47
Senesse P,
2004 (167)
France;
480 FM
diet history;
quartiles
PUFAs M: >18.8 vs. <2.6 g/d
F: >14.4 vs. <2.1 g/d
colorectal 171 age, sex, energy, BMI,
PA
1.4 (0.7, 2.9) 0.28
Nkondjock A,
2003 (161)
Canada;
1070 FM
FFQ;
quartiles
PUFAs >21.55 vs. 11.15 g/d colorectal 402
energy (residual), age,
marital status, FH of
CRC, BMI one year
prior to diagnosis, and
PA
1.04 (0.74, 1.48) 0.69

Chapter three Literature review of examined dietary factors
90
Levi F,
2002 (66)
Switzerland;
836 FM
FFQ;
tertiles
PUF >194 vs. <138 g/d colorectal 286 age, sex, education, PA
and residual energy
0.6 (0.4, 0.9) <0.05
Franceschi S,
1998 (62)
Italy;
6107 FM
FFQ; per 100
kcal of energy
PUF mean: 96 kcal/day colorectal 1953 age, sex, study centre,
education, PA and
alcohol
0.89 (0.76, 1.02)
Slattery ML,
1997 (163)
USA;
4403 FM
CARDIA diet
history;
quintiles
PUFAs M >34.7 vs. <21.3 g/MJ
F >8.26 vs. 4.94 g/MJ
colon 1095
888
age at diagnosis or
selection, energy intake,
dietary fibre,
cholesterol, calcium,
BMI, PA, FH of CRC,
NSAIDs
1.07 (0.82, 1.41)
1.05 (0.77, 1.43)
Le Marchand L,
1997 (150)
USA (Hawaii);
2384 FM
FFQ;
quartiles
PUF M >28 vs. <19 g/d
F >22 vs. <15 g/d
colorectal 698
494
age, FH of CRC,
alcoholic drinks/week,
pack-years,
lifetime recreational PA,
BMI five years ago, and
caloric, dietary fibre and
calcium intakes;
residual Calorie-
adjustment
0.7 (0.5, 1.1)
0.9 (0.6, 1.5)
0.2
0.7
Ghadirian P,
1997 (153)
Canada;
1070 FM
FFQ;
quartiles
PUF high vs. low quartile colon 402 sex, age, marital status,
history of colon
carcinoma in first-
degree relatives, energy
0.96 (0.65, 1.42) 0.51
Zaridze D,
1992 (165)
Russia;
434 FM
FFQ;
quartiles
PUFAs M: >30.4 vs. <15.1 g/d
F: >31.2 vs. <17.0 g/d
colorectal 217 energy, education 0.29 (0.13, 0.64) 0.004
* Abbreviations: F: females; M: males; FFQ: food frequency questionnaire; PUF: poly-unsaturated fat; PUFAs: poly-unsaturated fatty acids; BMI: body mass index; FH: family history;
CRC: colorectal cancer; PA: physical activity; HRT: hormone replacement therapy; NSAIDs: Non-steroidal anti-inflammatory drugs
† P-value for trend
‡ Results that are part of the current thesis and will be presented in detail in the following chapters

Chapter three Literature review of examined dietary factors
91
Table 12 Colorectal cancer risk and omega-3 poly-unsaturated fatty acids; Results from published cohort studies (1990-2008)*
Study Country; Study;
Sample
Assessment Fatty acid
subgroup
Comparison
(high vs. low)
Outcome Cases Adjustments RR (95% CI) p†
Hall MN, 2008
(170)
USA;
Physicians' Health
Study; 22071 M
FFQ;
quartiles
ω3PUFAs
(from fish)
high vs. low quartile colorectal 500 age, smoking, BMI,
multivitamin use, history
of diabetes, random
assignment to aspirin or
placebo, vigorous
exercise, alcohol intake,
red meat intake
0.76 (0.59, 0.98) 0.02
Lin J, 2004
(141)
USA;
Women’s Health
Study; 37547 F
FFQ;
quintiles
ω3PUFAs 0.21 vs. 0.03 %energy colorectal 202
age, random treatment
assignment, BMI, FH of
CRC, history of colorectal
polyps, PA, cigarette
smoking, alcohol
consumption,
postmenopausal HRT,
and total energy intake
1.11 (0.73, 1.69)
0.43
Kobayashi M,
2004 (171)
Japan;
Japan Public Health
Centre-based Study;
95.376 FM
FFQ;
quartiles
EPA
DHA
F 0.31 vs. 0.06 g/d
M 0.39 vs. 0.07 g/d
F 0.50 vs. 0.11 g/d
M 0.64 vs. 0.14 g/d
colon
rectum
colon
rectum
colon
rectum
colon
rectum
156
68
300
154
156
68
300
154
age, area, FH of CRC,
BMI, PA, smoking,
alcohol, use of vitamin
supplements, energy,
cereal, vegetable and
meat intake
1.04 (0.60, 1.80)
0.57 (0.29, 1.15)
1.06 (0.71, 1.58)
1.37 (0.81, 2.32)
1.08 (0.63, 1.87)
0.66 (0.33, 1.33)
0.98 (0.66, 1.46)
1.17 (0.70, 1.96)
0.87
0.27
0.74
0.28
0.59
0.47
0.93
0.61
Terry P, 2001
(173)
Sweden;
Swedish
Mammography
Screening Cohort
61463 F
FFQ;
quartiles
ALA
EPA
DHA
0.70 vs. 0.45 g/d
0.09 vs. 0.03 g/d
0.18 vs. 0.08 g/d
colorectal 460 age, BMI, education level,
energy intake, intakes of
red meat and alcohol,
dietary fibre, calcium,
vitamin C, folic acid,
0.99 (0.75, 1.32)
0.96 (0.72, 1.28)
0.90 (0.60, 1.20)
0.99
0.91
0.49

Chapter three Literature review of examined dietary factors
92
vitamin D, SFAs, MUFAs,
PUFAs
Pietinen P,
1999 (162)
Finland;
Alpha-Tocopherol,
Beta-Carotene
Cancer Prevention
Study; 27111M
modified
dietary history;
quartiles
ω3PUFAs
(from fish)
0.7 vs. 0.2 g/d colorectal 185 age, supplement group,
smoking years, BMI,
alcohol, education, PA at
work, calcium
1.2 (0.8, 1.9) 0.84
Bostick RM,
1994 (147)
USA;
Iowa’s Women’s
Health; 32215 F
FFQ; quintiles ω3PUFAs >0.18 vs. <0.03 g/d colon 212 age, energy (residual),
height, parity, vitamin E,
vitamin E x age term,
vitamin A supplement
0.70 (0.45, 1.09) 0.26
* Abbreviations: F: females; M: males; FFQ: food frequency questionnaire; ω3PUFAs: omega 3 poly-unsaturated fatty acids; SFAs: saturated fatty acids; MUFAs: mono-unsaturated
fatty acids; PUFAs: poly-unsaturated fatty acids; EPA: eicosapentaenoic acid; DHA: docosahexaenoic acid; ALA: α-linolenic acid; BMI: body mass index; FH: family history; CRC:
colorectal cancer; PA: physical activity; HRT: hormone replacement therapy; NSAIDs: Non-steroidal anti-inflammatory drugs
† P-value for trend

Chapter three Literature review of examined dietary factors
93
Table 13 Colorectal cancer risk and omega-3 poly-unsaturated fatty acids; Results from published case-control and nested case-control studies (1990-2008)*
Study Country;
Study;
Sample
Assessment Fatty acid
subgroup
Comparison
(high vs. low)
Outcome Cases Adjustments OR (95% CI) p†
Hall MN, 2007
(169)
USA;
Physicians'
Health Study;
460M
blood measurements;
quartiles
ω3PUFAs >6.06 vs. <4.43 %TF colorectal 178 BMI, multivitamin use,
history of diabetes,
random assignment to
aspirin or placebo,
vigorous exercise,
alcohol intake, red meat
0.60 (0.32, 1.11) 0.10
Theodoratou E,
2007‡ (164)
Scotland;
SOCCS;
2910FM
FFQ;
quartiles
ω3PUFAs ≥2.82 vs. <1.85 g/d colorectal 1458 matched on age, sex,
are of residence;
adjusted for FH, total
energy intake (residual),
fibre intake, alcohol
intake, use of NSAIDs,
smoking, BMI, PA
0.63 (0.50, 0.80) <0.0005
Kimura Y, 2007
(158)
Japan;
Fukuoka
Colorectal
Cancer Study;
1575FM
FFQ;
quintiles
ω3PUFAs 3.94 vs. 1.99 g/d colorectal 782 Energy (residual), age,
sex, residential area,
BMI 10 years before,
parental CRC, smoking,
alcohol use, type of job,
leisure-time PA, dietary
calcium and fibre intake
0.74 (0.52, 1.06) 0.05
Kuriki K, 2006
(160)
Japan;
295FM
Erythrocyte
measurements using
gas-liquid
chromatography;
tertiles
ω3PUFAs >9.75 vs. <7.98 mol% colorectal 74 BMI, habitual exercise,
drinking and smoking
status, green-yellow
vegetable intake, and
FH colorectal cancer
0.41 (0.15, 1.09) 0.16
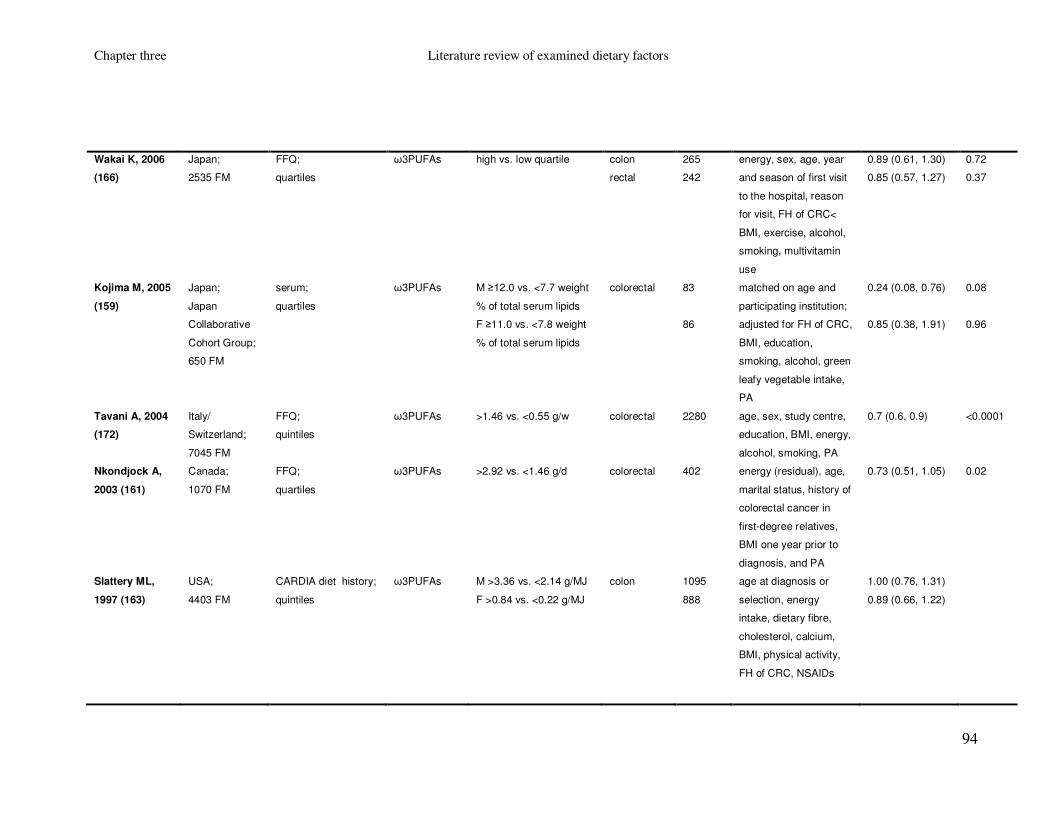
Chapter three Literature review of examined dietary factors
94
Wakai K, 2006
(166)
Japan;
2535 FM
FFQ;
quartiles
ω3PUFAs high vs. low quartile colon
rectal
265
242
energy, sex, age, year
and season of first visit
to the hospital, reason
for visit, FH of CRC<
BMI, exercise, alcohol,
smoking, multivitamin
use
0.89 (0.61, 1.30)
0.85 (0.57, 1.27)
0.72
0.37
Kojima M, 2005
(159)
Japan;
Japan
Collaborative
Cohort Group;
650 FM
serum;
quartiles
ω3PUFAs
M ≥12.0 vs. <7.7 weight
% of total serum lipids
F ≥11.0 vs. <7.8 weight
% of total serum lipids
colorectal 83
86
matched on age and
participating institution;
adjusted for FH of CRC,
BMI, education,
smoking, alcohol, green
leafy vegetable intake,
PA
0.24 (0.08, 0.76)
0.85 (0.38, 1.91)
0.08
0.96
Tavani A, 2004
(172)
Italy/
Switzerland;
7045 FM
FFQ;
quintiles
ω3PUFAs >1.46 vs. <0.55 g/w
colorectal 2280 age, sex, study centre,
education, BMI, energy,
alcohol, smoking, PA
0.7 (0.6, 0.9) <0.0001
Nkondjock A,
2003 (161)
Canada;
1070 FM
FFQ;
quartiles
ω3PUFAs >2.92 vs. <1.46 g/d colorectal 402
energy (residual), age,
marital status, history of
colorectal cancer in
first-degree relatives,
BMI one year prior to
diagnosis, and PA
0.73 (0.51, 1.05) 0.02
Slattery ML,
1997 (163)
USA;
4403 FM
CARDIA diet history;
quintiles
ω3PUFAs
M >3.36 vs. <2.14 g/MJ
F >0.84 vs. <0.22 g/MJ
colon 1095
888
age at diagnosis or
selection, energy
intake, dietary fibre,
cholesterol, calcium,
BMI, physical activity,
FH of CRC, NSAIDs
1.00 (0.76, 1.31)
0.89 (0.66, 1.22)

Chapter three Literature review of examined dietary factors
95
Le Marchand L,
1997 (150)
USA (Hawaii);
2384 FM
FFQ;
quartiles
ω3PUFAs
M >2.6 vs. <1.7 g/d
F >2.1 vs. <1.3 g/d
colorectal 698
494
age, FH of CRC,
alcoholic drinks/week,
pack-years, lifetime
recreational PA, BMI
five years ago, and
caloric, dietary fibre and
calcium intakes; energy
(residual)
0.8 (0.5, 1.1)
1.4 (0.9, 2.2)
0.1
0.4
* Abbreviations: F: females; M: males; FFQ: food frequency questionnaire; ω3PUFAs: omega 3 poly-unsaturated fatty acids; SFAs: saturated fatty acids; MUFAs: mono-unsaturated
fatty acids; PUFAs: poly-unsaturated fatty acids; BMI: body mass index; FH: family history; CRC: colorectal cancer; PA: physical activity; HRT: hormone replacement therapy;
NSAIDs: Non-steroidal anti-inflammatory drugs
† P-value for trend
‡ Results that are part of the current thesis and will be presented in detail in the following chapters

Chapter three Literature review of examined dietary factors
96
Table 14 Colorectal cancer risk and omega-6 poly-unsaturated fatty acids; Results from published cohort studies (1990-2008)*
Study Country; Study;
Sample
Assessment Fatty acid
subgroup
Comparison
(high vs. low)
Outcome Cases Adjustments RR (95% CI) p†
Lin J, 2004
(141)
USA;
Women’s Health
Study; 37547 F
FFQ;
quintiles
ω6PUFAs 7.6 vs. 3.8 % energy colorectal 202 age, random treatment
assignment, BMI, FH of
CRC, history of
colorectal polyps, PA,
cigarette smoking,
alcohol consumption,
postmenopausal HRT,
and total energy intake
1.60 (0.98, 2.60) 0.16
Terry P, 2001
(173)
Sweden; 61463 F FFQ;
quartiles
linoleic acid 7.4 vs. 3.7 g/d colorectal 460 age, BMI, education
level, energy intake,
intakes of red meat and
alcohol, dietary fibre,
calcium, vitamin C, folic
acid, vitamin D, SFAs,
MUFAs, PUFAs
1.06 (0.78, 1.45) 0.53
Pietinen P, 1999
(162)
Finland;
Alpha-Tocopherol,
Beta-Carotene
Cancer Prevention
Study; 27111M
modified
dietary history;
quartiles
linoleic acid 16.4 vs. 4.5 g/d colorectal 185 age, supplement group,
smoking years, BMI,
alcohol, education, PA at
work, calcium
1.3 (0.8, 2.0) 0.20
* Abbreviations: F: females; FFQ: food frequency questionnaire; ω6PUFAs: omega 6 poly-unsaturated fatty acids; BMI: body mass index; FH: family history; CRC: colorectal cancer;
PA: physical activity; HRT: hormone replacement therapy; NSAIDs: Non-steroidal anti-inflammatory drugs
† P-value for trend

Chapter three Literature review of examined dietary factors
97
Table 15 Colorectal cancer risk and omega-6 poly-unsaturated fatty acids; Results from published case-control studies (1990-2008)*
Study Country;
Study; Sample
Assessment Fatty acid
subgroup
Comparison
(high vs. low)
Outcome Cases Adjustments OR (95% CI) p†
Hall MN, 2007
(169)
USA;
Physicians' Health
Study; 460 M
blood
measurements;
quartiles
ω6PUFAs >40.1 vs. <36.1 %TF colorectal 178 BMI, multivitamin use,
history of diabetes,
random assignment to
aspirin or placebo,
vigorous exercise,
alcohol intake, red meat
intake.
0.64 (0.35, 1.17) 0.16
Theodoratou E,
2007‡ (164)
Scotland;
SOCCS;
2910 FM
FFQ;
quartiles
ω6PUFAs ≥13.12 vs. <8.90 g/d colorectal 1458 matched on age, sex,
are of residence;
adjusted for FH, total
energy intake (residual
method), fibre intake,
alcohol intake, use of
NSAIDs, smoking, BMI,
PA
1.03 (0.81, 1.30) 0.86
Kimura Y, 2007
(158)
Japan;
Fukuoka
Colorectal Cancer
Study; 1575 FM
FFQ;
quintiles
ω6PUFAs 15.23 vs. 7.98 g/d colorectal 782 Energy (residual), age,
sex, residential area,
BMI 10 years before,
parental CRC, smoking,
alcohol use, type of job,
leisure-time PA, dietary
calcium and fibre intake
0.77 (0.54, 1.10) 0.17
Kuriki K, 2006
(160)
Japan; 295 FM Erythrocyte
measurements
using gas-liquid
chromatography;
tertiles
ω6PUFAs >21.51 vs. <19.74 mol% colorectal 74 BMI, habitual exercise,
drinking and smoking
status, green-yellow
vegetable intake, and FH
colorectal cancer
0.24 (0.10, 0.59) <0.005

Chapter three Literature review of examined dietary factors
98
Wakai K, 2006
(166)
Japan; 2535 FM FFQ;
quartiles
ω6PUFAs high vs. low quartile colon
rectal
265
242
energy, sex, age, year
and season of first visit
to the hospital, reason
for visit, FH of CRC<
BMI, exercise, alcohol,
smoking, multivitamin
0.84 (0.57, 1.24)
0.97 (0.65, 1.45)
0.77
0.78
Kojima M, 2005
(159)
Japan;
Japan
Collaborative
Cohort Group;
650 FM
serum;
quartiles
ω6PUFAs
M ≥36.1 vs. <28.9 weight
% of total serum lipids
F ≥37.5 vs. <31.9 weight
% of total serum lipids
colorectal 83
86
matched on age and
participating institution;
adjusted for FH of CRC,
BMI, education, smoking,
alcohol, green leafy
vegetable intake, PA
0.69 (0.30, 1.61)
1.15 (0.48, 2.75)
0.36
0.32
Koh WP, 2004
(174)
China
(Singapore);
Singapore
Chinese Health
Study; 1487 FM
FFQ;
quartiles
ω6PUFAs
high vs. low quartile colorectal 310 age, year of recruitment,
gender, dialect,
education, BMI, smoking,
alcohol, FH of CRC
1.04 (0.63, 1.70)
Nkondjock,
2003 (161)
Canada; 1070 FM FFQ;
quartiles
ω6PUFAs >18.06 vs. 19.05 g/d colorectal 402
energy (residual), age,
marital status, history of
colorectal cancer in first-
degree relatives, BMI
one year prior to
diagnosis, and PA
1.07 (0.76, 1.54) 0.27
Slattery ML,
1997 (163)
USA; 4403 FM CARDIA diet
history;
quintiles
linoleic acid
M: >30.9 vs. <18.4 g/MJ
F: >7.31 vs. <4.24
colon 1095
888
age at diagnosis or
selection, energy intake,
dietary fibre, cholesterol,
calcium, BMI, physical
activity, FH of CRC,
NSAIDs
1.12 (0.85, 1.47)
1.07 (0.79, 1.46)
Chapter three Literature review of examined dietary factors
99
* Abbreviations: F: females; M: males; FFQ: food frequency questionnaire; ω6PUFAs: omega 6 poly-unsaturated fatty acids; BMI: body mass index; FH: family history; CRC:
colorectal cancer; PA: physical activity; HRT: hormone replacement therapy; NSAIDs: Non-steroidal anti-inflammatory drugs
† P-value for trend
‡ Results that are part of the current thesis and will be presented in detail in the following chapters

Chapter three Literature review of examined dietary factors
100
Table 16 Colorectal cancer risk and trans fatty acids; Results from published cohort studies (1990-2008)*
Study Country; Study;
Sample
Assessment Fatty acid
subgroup
Comparison
(high vs. low)
Outcome Cases Adjustments RR (95% CI) p†
Limburg PJ,
2008 (176)
USA;
Iowa Women's
Health Study;
35216 F
FFQ;
quartiles
tFAs >3.28 vs. ≤1.96 g/d colorectal 1229 age, total energy intake
(residual), body mass index,
physical activity level,
oestrogen use, self-reported
diabetes mellitus, smoking
status, and intake of total
fat, red meat, fruits and
vegetables, calcium, folate,
vitamin E and alcohol
1.06 (0.88, 1.28) 0.40
Lin J, 2004
(141)
USA;
Women’s Health
Study; 37547 F
FFQ;
quintiles
tFAs 1.9 vs. 0.6% energy colorectal 202 age, random treatment
assignment, BMI, FH of
CRC, history of colorectal
polyps, PA, cigarette
smoking, alcohol
consumption,
postmenopausal HRT, and
total energy intake
1.30 (0.89, 2.05) 0.18
Pietinen P, 1999
(162)
Finland;
Alpha-Tocopherol,
Beta-Carotene
Cancer Prevention
Study; 27111 M
modified diet
history;
quartiles
tFAs 5.7 vs. 1.8 g/d colorectal 185 age, supplement group,
smoking years, BMI,
alcohol, education, PA at
work, calcium
1.1 (0.7, 1.6) 0.49
* Abbreviations: F: females; M: males; FFQ: food frequency questionnaire; tFAs: trans fatty acids; BMI: body mass index; FH: family history; CRC: colorectal cancer; PA: physical
activity; HRT: hormone replacement therapy; NSAIDs: Non-steroidal anti-inflammatory drugs
† P-value for trend
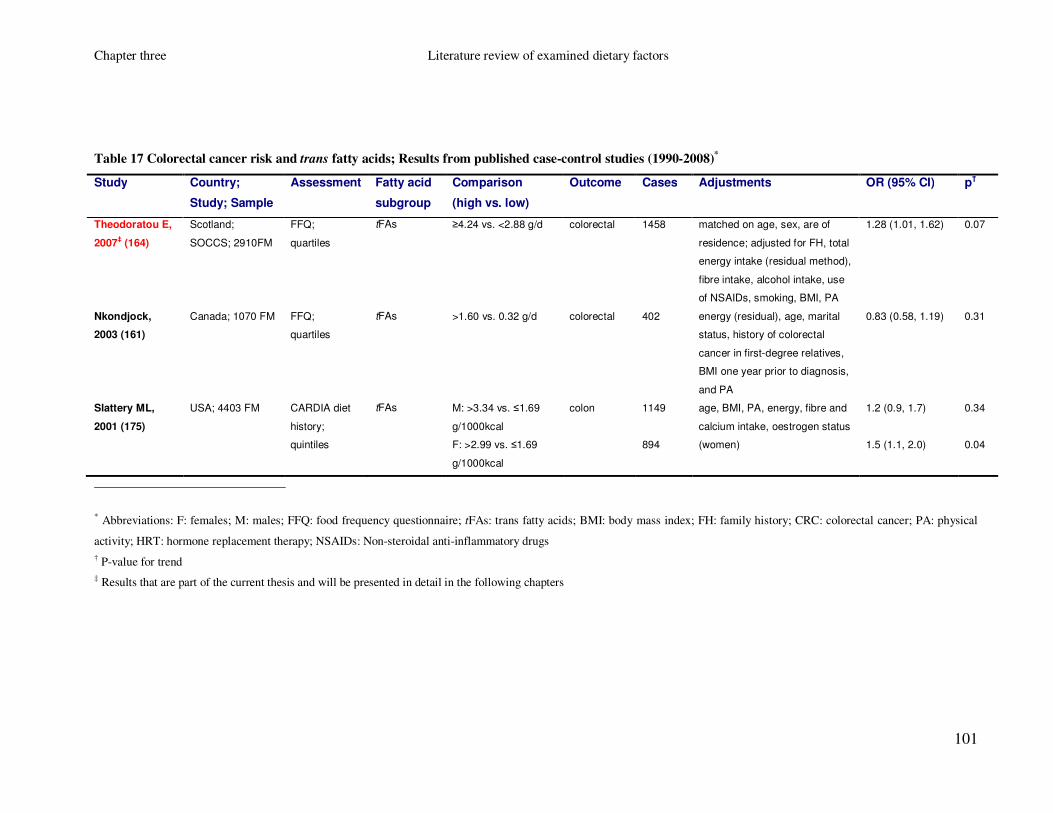
Chapter three Literature review of examined dietary factors
101
Table 17 Colorectal cancer risk and trans fatty acids; Results from published case-control studies (1990-2008)*
Study Country;
Study; Sample
Assessment Fatty acid
subgroup
Comparison
(high vs. low)
Outcome Cases Adjustments OR (95% CI) p†
Theodoratou E,
2007‡ (164)
Scotland;
SOCCS; 2910FM
FFQ;
quartiles
tFAs ≥4.24 vs. <2.88 g/d colorectal 1458 matched on age, sex, are of
residence; adjusted for FH, total
energy intake (residual method),
fibre intake, alcohol intake, use
of NSAIDs, smoking, BMI, PA
1.28 (1.01, 1.62) 0.07
Nkondjock,
2003 (161)
Canada; 1070 FM FFQ;
quartiles
tFAs >1.60 vs. 0.32 g/d colorectal 402
energy (residual), age, marital
status, history of colorectal
cancer in first-degree relatives,
BMI one year prior to diagnosis,
and PA
0.83 (0.58, 1.19) 0.31
Slattery ML,
2001 (175)
USA; 4403 FM CARDIA diet
history;
quintiles
tFAs M: >3.34 vs. ≤1.69
g/1000kcal
F: >2.99 vs. ≤1.69
g/1000kcal
colon 1149
894
age, BMI, PA, energy, fibre and
calcium intake, oestrogen status
(women)
1.2 (0.9, 1.7)
1.5 (1.1, 2.0)
0.34
0.04
* Abbreviations: F: females; M: males; FFQ: food frequency questionnaire; tFAs: trans fatty acids; BMI: body mass index; FH: family history; CRC: colorectal cancer; PA: physical
activity; HRT: hormone replacement therapy; NSAIDs: Non-steroidal anti-inflammatory drugs
† P-value for trend
‡ Results that are part of the current thesis and will be presented in detail in the following chapters

Chapter three Literature review of examined dietary factors
102
3.4 Folate, vitamin B2, vitamin B6, vitamin B12
3.4.1 Introduction
Folate, vitamin B2 (riboflavin), vitamin B6 and vitamin B12 are water soluble vitamins
that occur naturally in food. In addition, their synthetic forms can be taken as
supplements. Their main dietary sources of folate are: broccoli, brussels sprouts,
asparagus, peas, chickpeas, brown rice and fortified breakfast cereals; of vitamin B2 are:
milk, eggs, fortified breakfast cereals, rice and mushrooms; of vitamin B6 are: poultry,
fish, meat, legumes, nuts, potatoes, whole grains and fortified breakfast cereals; and of
vitamin B12 are: meat, salmon, cod, milk, cheese, eggs, yeast extract, and fortified
breakfast cereals (Food Standards Agency). The recommended daily intake for adults for
folate is 0.2mg (0.4mg for pregnant women), for vitamin B2 1.3mg for men and 1.1mg
for women, for vitamin B6 1.4mg for men and 1.2mg for women and for vitamin B12
0.0015mg (Food Standards Agency).
The metabolic pathway of folate, also known as one-carbon metabolism is very
important for DNA synthesis, repair and methylation and vitamins B2, B6 and B12 act
as co-enzymes in different steps of the pathway (Figure 30). Briefly, folate or folic acid
is converted initially to 5,10-methylene thetrahydrofolate (5,10-MTHF; co-enzyme:
vitamin B6), which is the compound needed for the nucleotide synthesis and DNA
methylation. 5,10-MTHF is then converted to 5-MTHF by the enzyme MTHF reductase
(MTHFR) and the co-enzyme vitamin B2. In the next step, 5,10-MTHF gives
homocysteine and methionine and the enzyme that catalyses the latter reaction is
methionine synthase (MTR; co-enzyme: vitamin B12) which is activated by the MTR
reductase (MTRR) (177;178). In the final step homocysteine, through the action of the
enzyme cystathionine β-synthase (CBS) and the co-enzyme vitamin B6, is catabolised to
glutathione, a detoxification enzyme that inactivates many carcinogenic compounds and
protect cells from oxidative stress and DNA damage (177-179) (Figure 30).
The role of folate in preventing neural tube defects (NTDs) is well established and in
1998 mandatory folic acid fortification was introduced in the USA and Canada in order
to reduce the number of children born with that defect (180). Indeed, the rate of NTDs

Chapter three Literature review of examined dietary factors
103
during the full fortification period (2000-2002) was decreased by 46% in Canada when
compared to the pre-fortification period (1993-1997) (181). In 2007, the Standing
Advisory Committee on Nutrition of the United Kingdom decided that mandatory folic
acid fortification (by adding folic acid to either bread or flour) should be introduced also
in the UK (182). However, a recent temporal study reported a statistically significant
increase in colorectal cancer absolute rates both in the USA and Canada for the period
that followed the full folic-acid fortification (180). And since it has been hypothesised
that folate and in particular folic acid might have some enhancing effects on cancer,
including colorectal cancer (183), folic acid fortification in the UK has been postponed
until the release of the results of two clinical trials investigating the relationship between
folic acid and several types of cancer.
3.4.2 Evidence from observational studies
According to the WCRF/AICR second report (2007), there is limited evidence that folate
is inversely associated with colorectal cancer, and due to the inconsistency of the results
of the different studies, residual confounding from other nutrients (e.g. fibre) cannot be
ruled out (30). In addition, a meta-analysis, which was published in 2005 and included
seven cohort and nine case-control studies, reported that there is some evidence of a
protective effect of dietary folate (and not supplementary folic acid) on colorectal
cancer, but due to significant heterogeneity (particularly among case-control studies) this
effect might be confounded by other dietary nutrients (e.g. fibre) (184). We identified 14
cohort (Table 18) and 24 case-control studies (Table 19) that investigated the association
between folate/folic acid and colorectal cancer (166;167;185-220). Four cohort and five
case-control studies reported a statistically significant inverse association between
dietary folate (185;190;192;193;199;201;206;218;220) and colorectal cancer, two case-
control studies reported a statistically significant inverse association between serum
folate levels and colorectal cancer (198;209) and one case-control study reported a
statistically significant inverse association between supplementary folic acid and colon
cancer (219).
A smaller number of observational studies have investigated the associations between
colorectal cancer and vitamin B2, vitamin B6 and vitamin B12. We identified: one

Chapter three Literature review of examined dietary factors
104
cohort (Table 20) and six case-control studies (Table 21) investigating the association
between vitamin B2 and colorectal cancer (185;203;206;207;212;221;222), with only
one case-control study reporting a statistically significant inverse association (221); four
cohort (Table 22) and 11 case-control (Table 23) investigating the association between
vitamin B6 and colorectal cancer (167;185;195;196;200;203;206;207;212;213;218;221;
223-225), with three cohort studies and five case-control studies reporting a statistically
significant inverse association between colorectal cancer and dietary vitamin B6
(196;200;213;218;221;223-225) and one cohort study reporting a statistically significant
positive association between rectal cancer and total vitamin B6 (195); and two cohort
(Table 24) and nine case-control (Table 25) investigating the association between
vitamin B12 and colorectal cancer (167;185;195;196;200;203;206;207;209;212;226),
with one cohort study reporting a significant positive association between dietary
vitamin B12 and colorectal cancer (196).

Chapter three Literature review of examined dietary factors
105
Figure 30 Simplified diagram of the one-carbon (folate) metabolic pathway. Adapted from Sharp & Little, AJE, 2007

Chapter three Literature review of examined dietary factors
106
Table 18 Colorectal cancer risk and folate; Results from published cohort studies (1990-2008)*
Study Country;
Study; Sample
Assessment Nutrient Comparison
(high vs. low)
Outcome Cases Adjustments RR (95% CI) p†
Ishihara J,
2007 (196)
Japan;
Japan Public Health
Centre-based
Prospective Study;
81184 FM
FFQ;
quartiles
folate;
Diet
M: 530 vs. 214 µg/d
F: 564 vs. 238 µg/d
colorectal 335
191
age, alcohol, smoking,
BMI, supplement use,
PA, calcium, vitamin D,
meat intake, study area
1.20 (0.85, 1.71)
1.33 (0.85, 2.09)
0.46
0.14
de Vogel S,
2006 (189)
The Netherlands;
Netherlands Cohort
Study; 4728 FM
FFQ;
tertiles
folate;
Diet
M: 279.9 vs. 162.7 µg/d
F: 248.0 vs. 142.5 µg/d
colon 213
186
age, FH, BMI, iron, fibre,
energy, riboflavin,
vitamin B6, vitamin C,
and methionine
0.96 (0.61, 1.54)
0.82 (0.45, 1.49)
0.84
0.53
Rossi E,
2006 (210)
Australia;
1969 & 1978
Busselton Health
survey; 1035 FM
serum and red
cell;
quartiles
folate Serum: <2.99 µg/l vs.
≥6.00
Red cell: <199.9 vs.
≥350.0 µg/l
(high quartile is the
reference category)
colorectal 41 age, sex, smoking,
alcohol, BMI
2.15 (0.73, 6.31)
2.00 (0.82, 4.83)
Zhang SM,
2006 (218)
USA
Women’s Health
Study; 37916 F
FFQ;
quintiles
folate;
Diet +
Supplements
≥614 vs. <259 µg/d (total)
≥385 vs. <244 µg/d (diet)
≥385 vs. <244 µg/d (diet,
excluding supplement
users)
colorectal
220
220
139
age, randomised
treatment assignment,
BMI, FH of CRC, history
of colon polyps, PA,
smoking status, red
meat, alcohol, energy,
menopausal status,
HRT, aspirin
1.16 (0.76, 1.79)
0.67 (0.43, 1.03)
0.46 (0.26, 0.81)
0.46
0.21
0.02
Brink M,
2005 (187)
The Netherlands,
Netherlands Cohort
Study; 3656 FM
FFQ;
per 100 µg/d
increase
folate;
Diet
M: per 100 µg/d increase
F: per 100 µg/d increase
colon
rectal
colon
rectal
231
99
199
51
age, BMI, smoking,
alcohol, fresh meat,
energy, FH of CRC,
vitamin C, iron, fibre
0.87 (0.66, 1.14)
0.58 (0.36, 0.93)
0.98 (0.62, 1.56)
1.85 (1.13, 3.02)

Chapter three Literature review of examined dietary factors
107
Larsson SC,
2005 (202)
Sweden;
Swedish
Mammography
Cohort; 61433 F
FFQ;
quintiles
folate;
Diet
≥212 vs. <150 µg/d colorectal
805
age, BMI, education,
energy, intake of red
meat, SF, calcium,
vitamin B6, beta-
carotene, cereal fibre
0.80 (0.60, 1.06)
0.11
Wei EK,
2004 (217)
USA;
Nurses' Health
Study, Health
Professionals
Follow-Up Study;
87733 F, 46632 M
FFQ;
quartiles
folate;
Diet
>400 vs. ≤200 µg/d colon
rectal
1139
339
age, FH, BMI, PA, beef,
pork or lamb as a main
dish, processed meat,
alcohol, calcium, height,
pack-years smoking
before age 30, history of
endoscopy, sex
0.82 (0.68, 0.99)
1.18 (0.80, 1.74)
0.06
0.83
Konings
EJM, 2002
(199)
The Netherlands;
The Netherlands
Cohort Study;
120852 FM
FFQ;
quintiles
folate;
Diet
M: >266 vs. <168 µg/d
F: >243 vs. <150 µg/d
colon
rectal
colon
rectal
400
259
360
152
age, alcohol intake,
energy intake, FH of
CRC, iron intake, vitamin
C intake, and dietary
fibre intake
0.73 (0.46, 1.17)
0.66 (0.35, 1.21)
0.68 (0.39, 1.20)
1.26 (0.58, 2.76)
0.03
0.03
0.18
0.55
Flood A,
2002 (191)
USA;
Breast Cancer
Detection
Demonstration
Project; 45264 F
FFQ;
quintiles
folate;
Diet +
Supplements
Diet: >272 vs. <142 µg/d
Total: >633 vs. <188 µg/d
colorectal 490 energy, methionine, and
alcohol, and for total fat
(for the analysis of the
total fat)
0.86 (0.65, 1.13)
1.01 (0.75, 1.35)
0.14
0.67
Terry P,
2002 (215)
Canada;
Canadian National
Breast Screening
Study; 5629 F
FFQ;
quintiles
folate;
Diet
>367 vs. ≤233 µg/d colorectal 295 age, smoking, BMI,
hours of vigorous PA,
education, and intakes of
total fat and energy
0.6 (0.4, 1.1) 0.25
Harnack L,
2002 (195)
USA;
Iowa Women’s
Health Study;
32215 F
FFQ;
quintiles for
colon, tertiles
for rectal cancer
folate;
Diet +
Supplements
>634.03 vs. <231.12 µg/d
>463.37 vs. <281.85 µg/d
colon
rectal
598
123
age, pack-years of
cigarettes, BMI,
oestrogen use, and
intakes of calcium,
vitamin E and energy
1.12 (0.77, 1.63)
0.89 (0.52, 1.51)
0.67
0.44

Chapter three Literature review of examined dietary factors
108
Su JL, 2001
(214)
USA;
NHANES I
Epidemiologic
Follow-up Study;
14407 FM
24-hour recall
interview;
quartiles
folate;
Diet
>249.0 vs. <103.3 µg/d colon 219 baseline age, race,
gender, education level,
dietary intakes of
calories, fat, vitamin B6,
vitamin B12, alcohol
0.57 (0.34, 0.97) 0.18
Giovannucci
E, 1998 (193)
USA;
Nurses' Health
Study; 88756 F
FFQ;
quartiles
folate;
Diet +
Supplements
>400 vs. ≤200 µg/d colon 442 energy, smoking, FH of
CRC; PA, BMI, aspirin
use; and intakes of red
meat, alcohol, and fibre
0.69 (0.52, 0.93) 0.01
Sellers TA,
1998 (220)
USA;
Iowa Women’s
Health Study;
35216 F
FFQ;
tertiles
folate;
Diet
No FH of CRC
>413.49 vs. ≤255.38 µg/d
FH of CRC
>413.49 vs. ≤255.38 µg/d
colon 180
62
age, energy, history of
rectal cancer polyps
0.7 (0.5, 1.0)
0.9 (0.5, 1.7)
0.05
0.8
* Abbreviations: F: females; M: males; FFQ: food frequency questionnaire; BMI: body mass index; FH: family history; CRC: colorectal cancer; PA: physical activity; HRT: hormone
replacement therapy; NSAIDs: Non-steroidal anti-inflammatory drugs; SF: saturated fat
† P-value for trend

Chapter three Literature review of examined dietary factors
109
Table 19 Colorectal cancer risk and folate; Results from published case-control studies (1990-2008)*
Study Country;
Study; Sample
Assessment Nutrient Comparison
(high vs. low)
Outcome Cases Adjustments OR (95% CI) p†
Sharp L, 2008
(212)
Scotland;
672 FM
FFQ;
quartiles
folate;
Diet +
Supplements
≥348.6 vs. ≤263.9 µg/d colorectal 264 sex, age, total energy, PA,
FH of CRC, NSAIDs, sex ×
NSAID
1.37 (0.79, 2.36) 0.40
Otani T, 2008
(208)
Japan;
nested case-
controls of Public
Health Centre-
based prospective
study; 1125 FM
plasma
measurement;
quartiles
folate M: ≥8.6 vs. <5.6 ng/m
F: ≥10.6 vs. <6.6 ng/ml
colorectal 163
160
matched pairs with
adjustment for pack-years
of smoking, alcohol, BMI,
PA, vitamin supplement
use, and FH of CRC
0.86 (0.45, 1.60)
1.00 (0.56, 1.90)
0.88
0.63
Coogan PF,
2007 (188)
USA; 2394 FM FFQ;
quartiles
folate;
Diet
≥370.6 vs. ≤216.5 µg/d colorectal 1229 age, sex, NSAIDs,
screening colonoscopy,
doctor visits 2 years before
index date, alcohol,
education, calcium
supplement use, vitamin E
use, SF, cholesterol, fibre,
methionine, energy, folate
containing supplement use
0.7 (0.4, 1.1) 0.1
Murtaugh MA,
2007 (206)
USA; 1730 FM Dietary history
(CARDIA);
tertiles
folate;
Diet +
Supplements
Diet: >475 vs. ≤323 µg/d
Total: >743 vs. ≤441 µg/d
rectal 751 age, sex, BMI, PA, energy,
fibre, calcium, ibuprofen
use, and smoking
0.66 (0.48, 0.92)
0.82 (0.64, 1.05)
0.01
0.09
Van Guelpen
B, 2006 (216)
Sweden;
nested case-
control of Northern
Sweden Health
and Disease
Cohort; 663 FM
plasma
measurement;
quintiles
folate M: >11.3 vs. <5.1 µmol/l
F: >13.0 vs. <5.7 µmol/l
colorectal 226 BMI, current smoking,
recreational and
occupational PA, and
alcohol intake
1.34 (0.72, 2.50) 0.33

Chapter three Literature review of examined dietary factors
110
Kune G, 2006
(200)
Australia;
1442 FM
FFQ;
quintiles
folate;
Diet
>419 vs. <246 µg/d colorectal 715 age, sex, alcohol, BMI,
energy intake, FH of CRC,
oral contraceptive pill use,
cigarette pack-years,
aspirin use
1.24 (0.81, 1.89)
Wakai K, 2006
(166)
Japan; 2535 FM FFQ;
quartiles
folate;
Diet
high vs. low quartile colon
rectal
265
242
energy, sex, age, year and
season of first visit to the
hospital, reason for visit, FH
of CRC< BMI, exercise,
alcohol, smoking,
multivitamin use
0.75 (0.51, 1.11)
0.81 (0.53, 1.23)
0.32
0.20
Jiang Q, 2005
(197)
China; 469 FM FFQ;
quartiles
folate;
Diet
≥172.08 vs. <115.64 µg/d colon
rectal
53
73
sex, age, methionine,
smoking status, drinking
status, and zinc
0.91 (0.69, 1.19)
1.39 (0.56, 3.50)
0.41
0.41
Otani T, 2005
(207)
Japan; 331 FM FFQ;
tertiles
folate;
Diet
≥485 vs. <343 µg/d colorectal 107 Matched on sex, age,
residence area; adjusted for
smoking, alcohol
consumption, BMI, dietary
fibre intake
1.3 (0.49, 3.4) 0.62
Senesse P,
2004 (167)
France; 480 FM diet history;
quartiles
folate;
Diet
M: >350.3 vs. <79.8 µg/d
F: >300.7 vs. <116.8 µg/d
colorectal 171 age, sex, energy, BMI, PA 1.1 (0.6, 2.0) 0.96
Satia-Abouta
J, 2003 (211)
USA;
North Carolina
Colon Cancer
Study; 1609 FM
FFQ;
quartiles
folate;
Diet +
Supplements
Whites :
741 vs. 196 µg/d
African/Americans:
642 vs. 147 µg/d
colon 337
276
energy, other potential
confounders examined
include age, sex, education,
BMI, smoking, PA, FH of
CRC, NSAIDs, supplement
use, fat, dietary fibre,
calcium, folate, fruits,
vegetables
0.8 (0.5, 1.2)
0.9 (0.5, 1.6)
0.11
0.70
Pufulete M,
2003 (209)
UK; 104 FM FFQ;
serum
folate;
score based
high vs. low tertile colorectal 28 sex, age, BMI, smoking,
and alcohol intake
0.09 (0.01, 0.57) 0.01

Chapter three Literature review of examined dietary factors
111
measurements;
erythrocyte
measurements;
tertiles
on dietary
intakes and
serum and
erythrocyte
measurements
La Vecchia C,
2002 (201)
Italy; 6107 FM FFQ;
quintiles
folate;
Diet
>330.8 vs. <197.6 µg/d colorectal 1953 energy, sex, age, study
centre, education, PA and
FH
0.72 (0.60, 0.86) 0.01
Le Marchand
L, 2002 (203)
USA; 1454 FM FFQ;
quintiles
folate;
Diet +
Supplements
Diet : >406 vs. ≤252 µg/d
Total: >2430 vs. ≤297
µg/d
colorectal 727 Matched on sex, age,
ethnicity; adjusted for
energy (residual method),
pack-years of cigarette
smoking, lifetime
recreational PA, lifetime
aspirin use, BMI, years of
schooling, intakes of non-
starch polysaccharides from
vegetables, calcium from
foods and supplements
0.9 (0.6, 1.3)
0.8 (0.6, 1.1)
0.43
0.23
Levi F, 2000
(204)
Switzerland;
714 FM
FFQ ;
tertiles
folate;
Diet
1144.9 vs. 431.2 µg/d colorectal 223 age, sex, years of
education, smoking,
alcohol, BMI, PA, total
energy and fibre
intake
1.54 (0.8, 3.1) >0.05
Kato I, 1999
(198)
USA ;
nested case-
control of New
York University
Women’s Health
Study cohort;
628 F
FFQ and
serum
measurements;
quartiles
folate;
Diet +
Supplements
FFQ: ≥626 vs. ≤224 µg/d
Serum: ≥31.04 vs. ≤12.23
nmol/l
colorectal 105 FH of CRC, beer intake,
prior occult blood testing
and number of hours spent
in sport activities in their
early 30
0.88 (0.46, 1.69)
0.52 (0.27, 0.97)
0.67
0.04
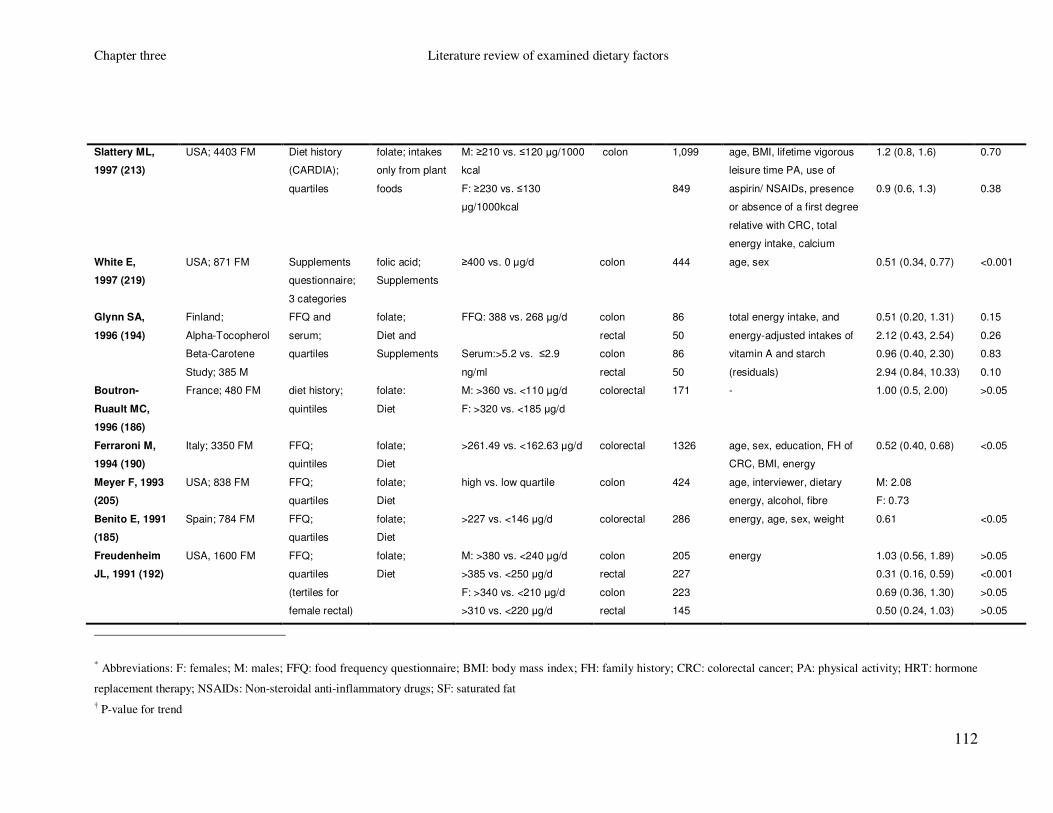
Chapter three Literature review of examined dietary factors
112
Slattery ML,
1997 (213)
USA; 4403 FM Diet history
(CARDIA);
quartiles
folate; intakes
only from plant
foods
M: ≥210 vs. ≤120 µg/1000
kcal
F: ≥230 vs. ≤130
µg/1000kcal
colon 1,099
849
age, BMI, lifetime vigorous
leisure time PA, use of
aspirin/ NSAIDs, presence
or absence of a first degree
relative with CRC, total
energy intake, calcium
1.2 (0.8, 1.6)
0.9 (0.6, 1.3)
0.70
0.38
White E,
1997 (219)
USA; 871 FM Supplements
questionnaire;
3 categories
folic acid;
Supplements
≥400 vs. 0 µg/d colon 444 age, sex 0.51 (0.34, 0.77) <0.001
Glynn SA,
1996 (194)
Finland;
Alpha-Tocopherol
Beta-Carotene
Study; 385 M
FFQ and
serum;
quartiles
folate;
Diet and
Supplements
FFQ: 388 vs. 268 µg/d
Serum:>5.2 vs. ≤2.9
ng/ml
colon
rectal
colon
rectal
86
50
86
50
total energy intake, and
energy-adjusted intakes of
vitamin A and starch
(residuals)
0.51 (0.20, 1.31)
2.12 (0.43, 2.54)
0.96 (0.40, 2.30)
2.94 (0.84, 10.33)
0.15
0.26
0.83
0.10
Boutron-
Ruault MC,
1996 (186)
France; 480 FM diet history;
quintiles
folate:
Diet
M: >360 vs. <110 µg/d
F: >320 vs. <185 µg/d
colorectal 171 - 1.00 (0.5, 2.00) >0.05
Ferraroni M,
1994 (190)
Italy; 3350 FM FFQ;
quintiles
folate;
Diet
>261.49 vs. <162.63 µg/d colorectal 1326 age, sex, education, FH of
CRC, BMI, energy
0.52 (0.40, 0.68) <0.05
Meyer F, 1993
(205)
USA; 838 FM FFQ;
quartiles
folate;
Diet
high vs. low quartile colon 424 age, interviewer, dietary
energy, alcohol, fibre
M: 2.08
F: 0.73
Benito E, 1991
(185)
Spain; 784 FM FFQ;
quartiles
folate;
Diet
>227 vs. <146 µg/d colorectal 286 energy, age, sex, weight 0.61 <0.05
Freudenheim
JL, 1991 (192)
USA, 1600 FM FFQ;
quartiles
(tertiles for
female rectal)
folate;
Diet
M: >380 vs. <240 µg/d
>385 vs. <250 µg/d
F: >340 vs. <210 µg/d
>310 vs. <220 µg/d
colon
rectal
colon
rectal
205
227
223
145
energy 1.03 (0.56, 1.89)
0.31 (0.16, 0.59)
0.69 (0.36, 1.30)
0.50 (0.24, 1.03)
>0.05
<0.001
>0.05
>0.05
* Abbreviations: F: females; M: males; FFQ: food frequency questionnaire; BMI: body mass index; FH: family history; CRC: colorectal cancer; PA: physical activity; HRT: hormone
replacement therapy; NSAIDs: Non-steroidal anti-inflammatory drugs; SF: saturated fat
† P-value for trend

Chapter three Literature review of examined dietary factors
113
Table 20 Colorectal cancer risk and vitamin B2 (riboflavin); Results from published cohort studies (1990-2008)*
Study Country;
Study;
Sample
Assessment Nutrient Comparison
(high vs. low)
Outcome Cases Adjustments RR (95% CI) p†
Shin A,
2006 (222)
China;
Shanghai Women's
Health Study;
73314 F
FFQ;
quintiles
vitamin B2;
Diet
>1.12 vs. ≤0.61mg/d colorectal 283 age, menopausal
status, education,
cigarette smoking,
alcohol consumption,
exercise, FH of CRC,
vitamin supplements
use and calorie intake
1.4 (0.9, 2.4) 0.36
* Abbreviations: F: females; M: males; FFQ: food frequency questionnaire; BMI: body mass index; FH: family history; CRC: colorectal cancer; PA: physical activity; HRT: hormone
replacement therapy; NSAIDs: Non-steroidal anti-inflammatory drugs
† P-value for trend
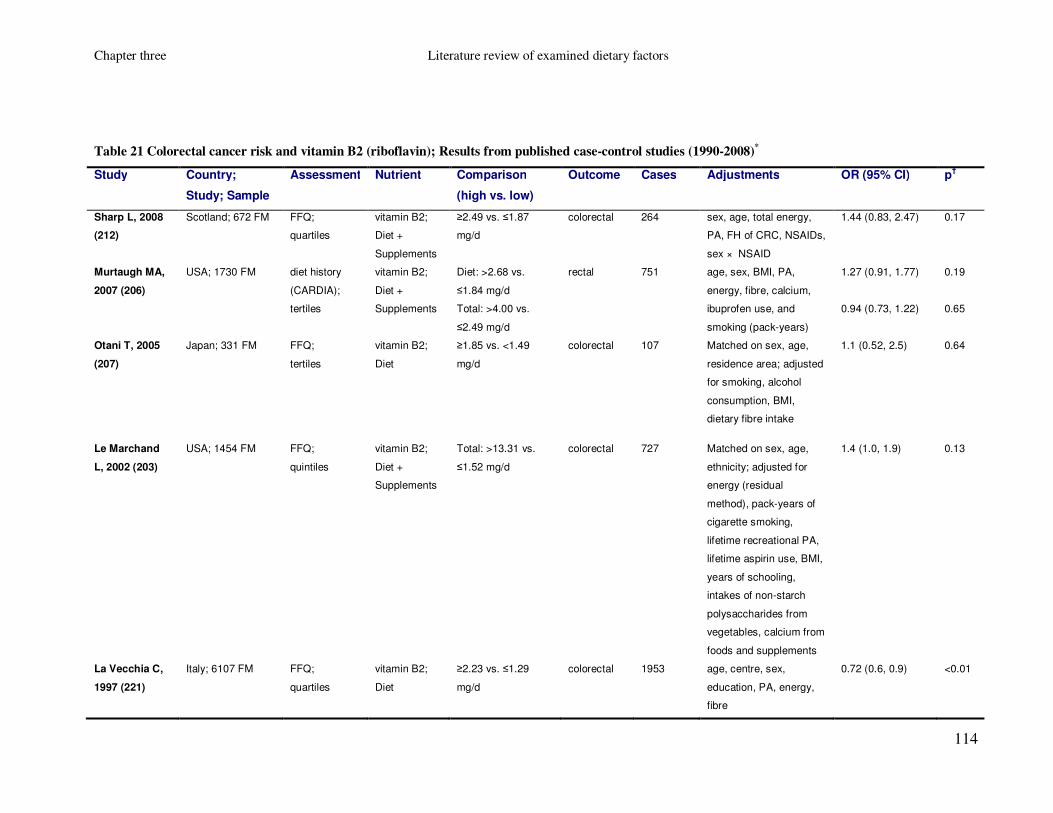
Chapter three Literature review of examined dietary factors
114
Table 21 Colorectal cancer risk and vitamin B2 (riboflavin); Results from published case-control studies (1990-2008)*
Study Country;
Study; Sample
Assessment Nutrient Comparison
(high vs. low)
Outcome Cases Adjustments OR (95% CI) p†
Sharp L, 2008
(212)
Scotland; 672 FM FFQ;
quartiles
vitamin B2;
Diet +
Supplements
≥2.49 vs. ≤1.87
mg/d
colorectal 264 sex, age, total energy,
PA, FH of CRC, NSAIDs,
sex × NSAID
1.44 (0.83, 2.47) 0.17
Murtaugh MA,
2007 (206)
USA; 1730 FM diet history
(CARDIA);
tertiles
vitamin B2;
Diet +
Supplements
Diet: >2.68 vs.
≤1.84 mg/d
Total: >4.00 vs.
≤2.49 mg/d
rectal 751 age, sex, BMI, PA,
energy, fibre, calcium,
ibuprofen use, and
smoking (pack-years)
1.27 (0.91, 1.77)
0.94 (0.73, 1.22)
0.19
0.65
Otani T, 2005
(207)
Japan; 331 FM FFQ;
tertiles
vitamin B2;
Diet
≥1.85 vs. <1.49
mg/d
colorectal 107 Matched on sex, age,
residence area; adjusted
for smoking, alcohol
consumption, BMI,
dietary fibre intake
1.1 (0.52, 2.5) 0.64
Le Marchand
L, 2002 (203)
USA; 1454 FM FFQ;
quintiles
vitamin B2;
Diet +
Supplements
Total: >13.31 vs.
≤1.52 mg/d
colorectal 727 Matched on sex, age,
ethnicity; adjusted for
energy (residual
method), pack-years of
cigarette smoking,
lifetime recreational PA,
lifetime aspirin use, BMI,
years of schooling,
intakes of non-starch
polysaccharides from
vegetables, calcium from
foods and supplements
1.4 (1.0, 1.9) 0.13
La Vecchia C,
1997 (221)
Italy; 6107 FM FFQ;
quartiles
vitamin B2;
Diet
≥2.23 vs. ≤1.29
mg/d
colorectal
1953
age, centre, sex,
education, PA, energy,
fibre
0.72 (0.6, 0.9) <0.01

Chapter three Literature review of examined dietary factors
115
Benito E, 1991
(185)
Spain; 784 FM FFQ;
quartiles
vitamin B2;
Diet
>1.87 vs. <1.17
µg/d
colorectal 286 energy, age, sex, weight 1.41 >0.05
* Abbreviations: F: females; M: males; FFQ: food frequency questionnaire; BMI: body mass index; FH: family history; CRC: colorectal cancer; PA: physical activity; HRT: hormone
replacement therapy; NSAIDs: Non-steroidal anti-inflammatory drugs
† P-value for trend

Chapter three Literature review of examined dietary factors
116
Table 22 Colorectal cancer risk and vitamin B6; Results from published cohort studies (1990-2008)*
Study Country;
Study; Sample
Assessment Nutrient Comparison
(high vs. low)
Outcome Cases Adjustments RR (95% CI) p†
Ishihara J,
2007 (196)
Japan;
Japan Public Health
Centre-based
Prospective Study;
81184 FM
FFQ;
quartiles
vitamin B6;
Diet
M: 1. 91 vs. 1.09 mg/d
F: 1.80 vs. 1.02 mg/d
colorectal 335
191
age, alcohol, smoking,
BMI, supplement use,
PA, calcium, vitamin D,
meat intake, study area
0.69 (0.48, 0.98)
1.10 (0.67, 1.83)
0.03
0.99
Zhang SM,
2006 (218)
USA
Women’s Health
Study; 37,916 F
FFQ;
quintiles
vitamin B6;
Diet +
Supplements
≥4.00 vs. <1.78 mg/d
(total)
≥2.40 vs. <1.69 mg/d
(diet)
≥2.40 vs. <1.69 mg/d
(diet, excluding
supplement users)
colorectal
220
220
139
age, randomised
treatment assignment,
BMI, FH of CRC, history
of colon polyps, PA,
smoking, red meat,
alcohol, energy,
menopausal status,
HRT, aspirin
1.14 (0.77, 1.69)
0.84 (0.56, 1.27)
0.69 (0.41, 1.15)
0.07
0.18
0.05
Larsson SC,
2005 (223)
Sweden;
Swedish
Mammography
Cohort; 61433 F
FFQ;
quintiles
vitamin B6;
Diet
≥2.05 vs. <1.53 mg/d colorectal 805 age, BMI, education,
energy, intake of red
meat, SF, calcium,
folate, beta-carotene,
cereal fibre
0.66 (0.50, 0.86)
0.002
Harnack L,
2002 (195)
USA;
Iowa Women’s
Health Study;
32215 F
FFQ;
quintiles for
colon, tertiles
for rectal cancer
vitamin B6;
Diet +
Supplements
>4.35 vs. <1.59 mg/d
>3.27 vs. <1.93 mg/d
colon
rectal
598
123
age, pack-years of
cigarettes, BMI,
oestrogen use, and
intakes of calcium,
vitamin E and energy
0.95 (0.67, 1.36)
1.97 (1.08, 3.62)
0.88
0.03
* Abbreviations: F: females; M: males; FFQ: food frequency questionnaire; BMI: body mass index; FH: family history; CRC: colorectal cancer; PA: physical activity; HRT: hormone
replacement therapy; NSAIDs: Non-steroidal anti-inflammatory drugs
† P-value for trend

Chapter three Literature review of examined dietary factors
117
Table 23 Colorectal cancer risk and vitamin B6; Results from published case-control studies (1990-2008)*
Study Country;
Study; Sample
Assessment Nutrient Comparison
(high vs. low)
Outcome Cases Adjustments OR (95% CI) p†
Sharp L, 2008
(212)
Scotland; 672 FM FFQ;
quartiles
vitamin B6;
Diet +
Supplements
≥3.04 vs. ≤2.29
mg/d
colorectal 264 sex, age, total energy,
PA, FH of CRC, NSAIDs,
sex × NSAID
1.07 (0.63, 1.81) 0.86
Theodoratou
E, 2008‡ (224)
Scotland;
SOCCS study;
4750 FM
FFQ;
quartiles
vitamin B6;
Diet +
Supplements
Diet: ≥3.26 vs.
≤2.55 mg/d
Total: ≥3.39 vs.
≤2.58 mg/d
colorectal 2028 energy (residual), age,
sex, folate, fibre, alcohol,
smoking, BMI, PA
NSAIDs, FH of CRC
0.77 (0.61, 0.98)
0.86 (0.69, 1.07)
0.03
0.12
Murtaugh MA,
2007 (206)
USA; 1730 FM diet history
(CARDIA);
tertiles
vitamin B6;
Diet +
Supplements
Diet: >2.6 vs. ≤1.79
mg/d
Total: >4.08 vs.
≤2.44 mg/d
rectal 751 age, sex, BMI, PA,
energy, fibre, calcium,
ibuprofen use, and
smoking (pack-years)
0.92 (0.72, 1.17)
0.92 (0.72, 1.17)
0.59
0.46
Kune G, 2006
(200)
Australia; 1442 FM FFQ;
quintiles
vitamin B6;
Diet
>3.4 vs. <1.7 mg/d colorectal 715 age, sex, alcohol, BMI,
energy intake, FH of
CRC, oral contraceptive
pill use, cigarette pack-
years, aspirin use
0.52 (0.34, 0.80)
Wei EK, 2005
(225)
USA;
nested case-
control of Nurses’
Health Study;
544 F
FFQ;
quartiles
vitamin B6;
diet +
Supplements
plasma PLP
concentration;
quartiles
8.6 vs. 1.6 mg/d
131.2 vs. 23.9
pmol/ml
colorectal 194
188
Matched on year of birth,
month and year of blood
collection, fasting status;
adjusted for BMI, PA,
smoking, menopausal
status, post menopausal
HRT, duration of regular
aspirin use, FH of CRC,
intake of alcohol and red
meat, plasma vitamin D,
history of endoscopy
0.60 (0.34, 1.06)
0.56 (0.31, 1.01)
0.03
0.07

Chapter three Literature review of examined dietary factors
118
Otani T, 2005
(207)
Japan; 331 FM FFQ;
tertiles
vitamin B6
diet
≥1.74 vs. <1.46
mg/d
colorectal 107 Matched on sex, age,
residence area; adjusted
for smoking, alcohol
consumption, BMI,
dietary fibre intake
0.88 (0.41, 1.9) 0.77
Senesse P,
2004 (167)
France; 480 FM diet history;
quartiles
vitamin B6;
Diet
M: >2.2 vs. <0.6
mg/d
F: >1.7 vs. <0.7
mg/d
colorectal 171 age, sex, energy, BMI,
PA
1.9 (0.9, 4.0) 0.13
Le Marchand
L, 2002 (203)
USA; 1454 FM FFQ;
quintiles
vitamin B6;
Diet
>2.46 vs. ≤1.69
mg/d
colorectal 727 Matched on sex, age,
ethnicity; adjusted for
energy (residual),
smoking, lifetime
recreational PA, lifetime
aspirin use, BMI, years
of schooling, intakes of
non-starch
polysaccharides from
vegetables, calcium from
foods and supplements
1.0 (0.7, 1.4) 0.74
La Vecchia C,
1997 (221)
Italy; 6,107 FM FFQ;
quartiles
vitamin B6;
Diet
≥2.78 vs. ≤2.04
mg/d
colorectal
1953
age, centre, sex,
education, PA, energy,
fibre
0.53 (0.4, 0.7)
<0.001
Slattery ML,
1997 (213)
USA; 4403 FM Diet history
(CARDIA);
quartiles
vitamin B6;
intakes only
from plant
foods
M: ≥1.18 vs. ≤0.75
mg/1000 kcal
F: ≥1.28 vs. ≤0.82
mg/1000kcal
colon 1,099
849
age, BMI, lifetime
vigorous leisure time PA,
use of aspirin/ NSAIDs,
presence or absence of
a first degree relative
with CRC, total energy
intake, calcium
0.7 (0.6, 1.0)
0.6 (0.5, 0.8)
<0.01
<0.01

Chapter three Literature review of examined dietary factors
119
Benito E, 1991
(185)
Spain;
784
FFQ;
quartiles
vitamin B6;
Diet
>2.20 vs. <1.40
mg/d
colorectal 286 energy, age, sex, weight 0.85 >0.05
* Abbreviations: F: females; M: males; FFQ: food frequency questionnaire; BMI: body mass index; FH: family history; CRC: colorectal cancer; PA: physical activity; HRT: hormone
replacement therapy; NSAIDs: Non-steroidal anti-inflammatory drugs; SF: saturated fat
† P-value for trend
‡ Results that are part of the current thesis and will be presented in detail in the following chapters

Chapter three Literature review of examined dietary factors
120
Table 24 Colorectal cancer risk and vitamin B12; Results from published cohort studies (1990-2008)*
Study Country;
Study; Sample
Assessment Nutrient Comparison
(high vs. low)
Outcome Cases Adjustments RR (95% CI) p†
Ishihara J,
2007 (196)
Japan;
Japan Public Health
Centre-based
Prospective Study;
81184 FM
FFQ;
quartiles
vitamin B12;
Diet
M: 13.7 vs. 4.2 µg/d
F: 12.8 vs. 4.0 µg/d
colorectal 335
191
age, alcohol, smoking,
BMI, supplement use,
PA, calcium, vitamin D,
meat intake, study area
1.50 (0.96, 2.35)
1.70 (0.96, 3.01)
0.05
0.07
Harnack L,
2002 (195)
USA;
Iowa Women’s
Health Study;
32215 F
FFQ;
quintiles for
colon, tertiles
for rectal cancer
vitamin B6;
Diet +
Supplements
>18.36 vs. <5.12 µg/d
>14.67 vs. <7.17 µg/d
colon
rectal
598
123
age, pack-years of
cigarettes, BMI,
oestrogen use, and
intakes of calcium,
vitamin E and energy
0.94 (0.69, 1.27)
1.29 (0.78, 2.14)
0.86
0.35
* Abbreviations: F: females; M: males; FFQ: food frequency questionnaire; BMI: body mass index; FH: family history; CRC: colorectal cancer; PA: physical activity; HRT: hormone
replacement therapy; NSAIDs: Non-steroidal anti-inflammatory drugs; SF: saturated fat
† P-value for trend

Chapter three Literature review of examined dietary factors
121
Table 25 Colorectal cancer risk and vitamin B12; Results from published case-control studies (1990-2008)*
Study Country;
Study; Sample
Assessment Nutrient Comparison
(high vs. low)
Outcome Cases Adjustments OR (95% CI) p†
Dahlin AM,
2008 (226)
Sweden;
Northern Sweden
Health and
Disease Study;
678 FM
plasma
measurements;
quintiles
plasma
vitamin B12
M: ≥351.2 vs.
<220.2 pmol/L
F: ≥391.9 vs.
<232.1 pmol/L
colorectal 226 BMI, current smoking,
recreational and
occupational PA, alcohol,
and plasma folate and total
homocysteine
0.82 (0.46, 1.45) 0.71
Sharp L, 2008
(212)
Scotland; 672 FM FFQ;
quartiles
vitamin B12;
Diet +
Supplements
≥7.98 vs. ≤5.25
µg/d
colorectal 264 sex, age, total energy, PA,
FH of CRC, NSAIDs, sex ×
NSAID
0.95 (0.56, 1.62) 0.73
Murtaugh MA,
2007 (206)
USA; 1730 FM diet history
(CARDIA);
tertiles
vitamin B12;
Diet +
Supplements
Diet: >6.57 vs.
≤3.92 µg/d
Total: >11.2 vs.
≤6.09 µg/
rectal 751 age, sex, BMI, PA, energy,
fibre, calcium, ibuprofen
use, and smoking (pack-
years)
1.13 (0.86, 1.51)
0.91 (0.71, 1.15)
0.37
0.37
Kune G, 2006
(200)
Australia;
1442 FM
FFQ;
quintiles
vitamin B12;
Diet
>11.1 vs. <4.1
µg/d
colorectal 715 age, sex, alcohol, BMI,
energy intake, FH of CRC,
oral contraceptive pill use,
cigarette pack-years, aspirin
use
0.49 (0.34, 0.71)
Otani T, 2005
(207)
Japan; 331 FM FFQ;
tertiles
vitamin B12;
Diet
≥11.2 vs. <7.3
µg/d
colorectal 107 Matched on sex, age,
residence area; adjusted for
smoking, alcohol, BMI,
dietary fibre intake
1.1 (0.55, 2.2) 0.77
Senesse P,
2004 (167)
France; 480 FM diet history;
quartiles
vitamin B12;
Diet
M: >13.5 vs. <2.0
µg/d
F: >9.87 vs. <2.0
µg/d
colorectal 171 age, sex, energy, BMI, PA 1.4 (0.8, 2.5) 0.21
Pufulete M,
2003 (209)
UK; 104 FM serum
measurements;
tertiles
vitamin B12 high vs. low
tertile µg/l
colorectal 28 sex, age, BMI, smoking, and
alcohol intake
0.25 (0.04, 1.72) 0.22

Chapter three Literature review of examined dietary factors
122
Le Marchand
L, 2002 (203)
USA; 1454 FM FFQ;
quintiles
vitamin B12;
Diet
>4.99 vs. ≤2.89
µg/d
colorectal 727 Matched on sex, age,
ethnicity; adjusted for
energy (residual), smoking,
lifetime recreational PA,
lifetime aspirin use, BMI,
years of schooling, non-
starch polysaccharides from
vegetables, calcium from
foods and supplements
1.1 (0.8, 1.6) 0.69
Benito E, 1991
(185)
Spain; 784 FFQ;
quartiles
vitamin B12;
Diet
>22.09 vs. <3.93
µg/d
colorectal 286 energy, age, sex, weight 0.61 >0.05
* Abbreviations: F: females; M: males; FFQ: food frequency questionnaire; BMI: body mass index; FH: family history; CRC: colorectal cancer; PA: physical activity; HRT: hormone
replacement therapy; NSAIDs: Non-steroidal anti-inflammatory drugs
† P-value for trend

Chapter three Literature review of examined dietary factors
123
3.5 Vitamin D and calcium
3.5.1 Introduction
Vitamin D can be ingested or synthesized in the skin from inactive precursors through
the action of UV sunlight. Its active form, 1α,25(OH)2D3 is produced after two
hydroxylation steps in the liver and kidneys (227). Foods that are good sources of
vitamin D include oily fish and eggs, as well as fortified margarine, breakfast cereals
and powdered milk. The recommended dietary intake of vitamin D is 10µg per day
(Food Standards Agency). Calcium is mainly found in dairy products including milk and
cheese. Other calcium sources include green leafy vegetables, soya products with added
calcium (such as soya beans, tofu, soya drinks), nuts, bread and anything made with
fortified flour. The recommended daily intake of calcium is currently 700 mg in the UK
(Food Standards Agency). It has been suggested that prevalence of vitamin D deficiency
(<75 nmol/l of 25(OH)D) in Scotland is high not only among elderly housebound
individuals, but also among the middle aged ones, with persons that live in Scotland
having a double risk of having less than 40 nmol/l of 25(OH)D than those who live in
England or Wales (228). One of the main reasons is the high latitude of Scotland, with
skin being unable to make vitamin D effectively during the winter months. Therefore,
routine vitamin D and calcium supplementation especially for the ones that are
housebound (>65 years old) is recommended (229).
Vitamin D regulates the blood concentration and absorption of calcium (227). Several
biological mechanisms regarding the way that vitamin D and calcium might affect
colorectal carcinogenesis have been described in laboratory studies. Briefly, some of the
mechanisms of vitamin D and calcium include binding of long-chain fatty acids and bile
acids in the small intestine or on the colonic lumen and therefore protecting the colonic
mucosa from their mutagenic actions (230;231). They may also affect colorectal cancer
risk via binding to the VDR influencing cell proliferation, differentiation, apoptosis and
angiogenesis (231;232) or affecting insulin resistance (233).

Chapter three Literature review of examined dietary factors
124
3.5.2 Evidence from observational studies and randomised
clinical trials
According to the findings of the second WCRF/AICR report (2007), the evidence that
vitamin D status is associated with a decreased colorectal cancer risk is limited (30). In
addition, a randomised clinical trial investigating the effects of daily calcium and
vitamin D supplementation for seven years showed no effect on colorectal cancer
incidence among postmenopausal women (234).
We identified 13 cohort (162;193;220;231;235-243) and 13 case-control studies
(166;167;185;190;204;221;244-250) that examined the associations between dietary or
total vitamin D intake and colorectal cancer and their results are inconclusive (Table 26,
Table 27). Briefly, five cohort and four case-control studies reported a significant
inverse association between total or dietary calcium intake and colorectal cancer or
colon cancer (190;220;221;231;237;240;241;246;250). Results from serum/ plasma
studies (234;251-255) are more consistent, indicating an inverse association with
colorectal cancer (Table 28). In addition, a pooled meta-analysis of five studies
examining the association between serum 25(OH)D and colorectal cancer risk, reported
a significant and dose dependent (p<0.0001) association with the OR and 95% CI of the
highest versus the lowest quintile being 0.46 (0.32, 0.64) (256).
Regarding calcium, a pooled meta-analysis of 10 cohort studies reported a statistically
significant reduced risk of colorectal cancer for the highest versus the lowest calcium
intake (RR (95% CI): 0.86 (0.78, 0.95)) (257). In addition a meta-analysis of 10 cohort
studies conducted in the second WCRF/AICR report (2007), reported a RR for
colorectal cancer of 0.98 (95% CI: 0.95, 1.00) per 200mg increase of calcium intake
(30).
We identified 21 cohort (63;65;162;217;220;222;230;231;235-243;258-261) and 24
case-control studies (126;153;166;167;185;190;204;205;211;219;221;244-249;262-267)
investigating the association between calcium and colorectal cancer risk (Table 29,
Table 30). Briefly, ten cohort and ten case-control studies reported a statistically
significant inverse association between total or dietary calcium and colorectal cancer
risk (65;153;162;166;211;219-221;230;231;235;241-243;245-247;258;262;267).

Chapter three Literature review of examined dietary factors
125
Table 26 Colorectal cancer risk and vitamin D; Results from published cohort studies (1990-2008)*
Study Country;
Study;
Sample
Assessment Nutrient Comparison
(high vs. low)
Outcome Cases Adjustments RR (95% CI) p†
Park S-Y,
2007 (231)
USA;
Multiethnic
cohort study;
191011 FM
FFQ;
quintiles
Vitamin D;
Diet +
Supplements
Total:
M: ≥276 vs. ≤39 IU/1000kcal/d
F: ≥276 vs. ≤39 IU/1000kcal/d
Diet:
M: ≥96 vs. ≤31 IU/1000kcal/d
F: ≥96 vs. ≤31 IU/1000kcal/d
Supplements:
M: >400 vs. 0 IU/d
F: >400 vs. 0 IU/d
Diet no supplement users
M: ≥96 vs. ≤31 IU/1000kcal/d
F: ≥96 vs. ≤31 IU/1000kcal/d
colorectal
1138
972
1138
972
1138
972
1138
972
ethnicity, time since
cohort entry, age, pack-
years of cigarette
smoking, FH of CRC,
PA, history of intestinal
polyps, NSAIDs, BMI,
energy, dietary fibre,
HRT (women),
multivitamins
0.72 (0.51, 1.00)
0.89 (0.63, 1.27)
0.91 (0.73, 1.13)
0.78 (0.63, 0.96)
0.65 (0.49, 0.84)
0.97 (0.75.1.26)
0.87 (0.66, 1.13)
0.69 (0.52, 0.93)
0.03
0.80
0.27
0.12
0.001
0.81
0.29
0.03
Kesse E,
2005 (238)
France;
E3N-EPIC;
73034 F
FFQ;
quartiles
vitamin D;
Diet
>3.23 vs. <1.72 µg/d
colorectal 172 educational level,
current smoking status,
FH of CRC BMI, PA,
energy, alcohol
0.89 (0.58, 1.36) 0.37
Lin J,
2005 (239)
USA;
Women’s
Health Study;
39976 F
FFQ;
quintiles
vitamin D;
Diet +
Supplements
≥545 vs. <161 IU/d (total)
≥333 vs. <125 IU/d (diet)
>0-400 vs. 0 µg/d (Supplements)
colorectal 223 age, randomised
treatment assignment,
BMI, FH of CRC,
history of colon polyps,
PA, smoking status, red
meat, alcohol, total
energy, SF,
multivitamin use,
menopausal status,
HRT
1.34 (0.84, 2.13)
0.96 (0.60, 1.55)
1.36 (0.95, 1.95)
0.08
0.99
0.10
McCullough
ML, 2003
(241)
USA;
Cancer
Prevention
FFQ;
quintiles
vitamin D;
Diet +
Multivitamins
>525 vs. <110 IU/d (total)
>240 vs. <90 IU/d (diet)
colorectal 683
age, smoking, BMI,
education, PA, FH of
CRC, energy, %SF,
0.80 (0.62, 1.02)
0.92 (0.71, 1.18)
0.02
0.19

Chapter three Literature review of examined dietary factors
126
Study II
Nutrition;
127749 FM
M: >240 vs. <90 IU/d (diet)
(excluding multivitamin users)
F: >240 vs. <90 IU/d (diet)
(excluding multivitamin users)
259
140
fruit, vegetables,
multivitamins, HRT
(women)
0.74 (0.50, 1.11)
1.13 (0.63, 2.04)
0.07
0.79
Terry P,
2002 (242)
Sweden;
Swedish
Mammograph
y Screening
Cohort
61463 F
FFQ;
quartiles
vitamin D ;
Diet
≥3.8 vs. <2.6 µg/d colorectal 572 energy, age, BMI,
education level, red
meat, alcohol, energy
adjusted SF, folic acid,
vitamin C, calcium
1.05 (0.83, 1.33)
0.73
Jarvinen R,
2001 (236)
Finland;
Finnish Mobile
Clinic Health
Examination
Survey;
9959 FM
FFQ;
quartiles
vitamin D;
Diet
M: ≥4.89 vs. <2.58 µg/d
F: ≥3.42 vs. <1.82 µg/d
colorectal 72 age, sex, BMI,
occupation, smoking,
geographical area,
energy
1.74 (0.82, 3.68) 0.13
Pietinen P,
1999 (162)
Finland;
Alpha-
Tocopherol,
Beta-Carotene
Cancer
Prevention
Study;
27111 M
FFQ;
quartiles
vitamin D;
Diet
8.62 vs. 2.58 µg/d colorectal 185 age, supplement group,
smoking years, BMI,
alcohol, education, PA
at work, calcium
1.00 (0.70, 1.50) 0.77
Zheng W,
1998 (243)
USA;
Iowa
Women’s
Health Study;
34702 F
FFQ;
tertiles
vitamin D;
Diet +
Supplements
>475.5 vs. <224.1 IU/d rectal 144 age, smoking status,
pack-years of smoking,
HRT, energy
0.76 (0.50, 1.16) 0.20
Giovannucci
E, 1998 (193)
USA;
Nurses'
Health Study;
88756 F
FFQ;
quartiles
vitamin D;
Diet +
Supplements
high vs. low quartile colon 442 energy, smoking, FH of
CRC; PA, BMI, aspirin
use; and intakes of red
meat, alcohol, fibre,
folate
0.86 (0.60, 1.28) >0.20

Chapter three Literature review of examined dietary factors
127
Sellers TA,
1998 (220)
USA;
Iowa
Women’s
Health Study;
35216 F
FFQ;
tertiles
vitamin D;
Diet +
Supplements
No FH of CRC
>478.2 vs. ≤226.3 IU/d (total)
high vs. low tertile (diet)
>400 vs. 0 IU/d (supplement)
FH of CRC
>478.2 vs. ≤226.3 IU/d (total)
high vs. low tertile (diet)
>400 vs. 0 IU/d (supplement)
colon 180
62
age, energy, history of
rectal cancer polyps
0.6 (0.4, 0.9)
0.7 (0.5, 1.0)
0.8 (0.5, 1.3)
0.9 (0.5, 1.7)
0.8 (0.4, 1.7)
1.1 (0.5, 2.4)
0.02
0.06
0.3
0.7
0.6
0.9
Martinez EM,
1996 (240)
USA;
Nurses Health
Study;
89448 F
FFQ;
quintiles
vitamin D;
Diet +
Supplements
>477 vs. <92 IU/d (total)
>477 vs. <92 IU/d (total) (women
with unchanged milk intake)
>245 vs. <76 IU/d (diet)
>245 vs. <76 IU/d (diet) (women
with unchanged milk intake)
colorectal 501
346
501
346
age, BMI, PA, FH of
CRC, aspirin, cigarette
smoking, red-meat
intake, and alcohol
0.88 (0.66, 1.16)
0.67 (0.47, 0.95)
0.84 (0.63, 1.13)
0.77 (0.54, 1.09)
0.23
0.02
0.16
0.11
Kearney J,
1996 (237)
USA;
Health
Professionals;
47935 M
FFQ;
quintiles
vitamin D;
Diet +
Supplements
≥613 vs. <161 IU/d (total)
≥358 vs. <134 IU/d (dietary)
≥448 vs. <4.0 IU/d (supplements)
colon 203 age, total calories, FH
of CRC, previous
polyps screening, past
history of smoking,
alcohol, aspirin, PA,
BMI, red meat, SF,
dietary fibre
0.66 (0.42, 1.05)
0.88 (0.54, 1.42)
0.48 (0.22, 1.02)
0.02
0.55
0.11
Bostick RM,
1993 (235)
USA;
Iowa
Women’s
Health Study;
32216 F
FFQ;
quintiles
vitamin D;
Diet +
Supplements
>618 vs. <159 IU/d (total)
>373 vs. <127 IU/d (diet)
>400 vs. 0 IU/d (Supplements)
colon 212 age, energy, height,
parity, low fat meat
intake, vitamin E, a
vitamin E x age
interaction term
0.73 (0.45, 1.18)
0.98 (0.61, 1.58)
0.67 (0.40, 1.13)
0.42
0.98
0.13
* Abbreviations: F: females; M: males; FFQ: food frequency questionnaire; BMI: body mass index; FH: family history; CRC: colorectal cancer; PA: physical activity; HRT: hormone
replacement therapy; NSAIDs: Non-steroidal anti-inflammatory drugs; SF: saturated fat
† P-value for trend

Chapter three Literature review of examined dietary factors
128
Table 27 Colorectal cancer risk and vitamin D; Results from published case-control studies (1990-2008)*
Study Country;
Study;
Sample
Assessment Nutrient Comparison
(high vs. low)
Outcome Cases Adjustments OR (95% CI) p†
Theodoratou
E, 2008‡ (250)
Scotland;
SOCCS
study;
4750 FM
FFQ;
quintiles
vitamin D;
Diet +
Supplements
Diet: ≥6.00 vs. ≤2.51 µg/d
Total: ≥8.31 vs. ≤2.76 µg/d
colorectal 2070 energy (residual
method), energy
(included as a
covariate), age, sex,
deprivation score, fibre,
FH of CRC, BMI,
smoking, NSAIDs, PA
0.77 (0.63, 0.94)
0.80 (0.65, 0.98)
0.01
0.01
Wakai K,
2006 (166)
Japan;
2535 FM
FFQ;
quartiles
vitamin D;
Diet
high vs. low quartile colon
rectal
265
242
energy, sex, age, year
and season of first visit
to the hospital, reason
for visit, FH of CRC<
BMI, exercise, alcohol,
smoking, multivitamin
use
1.04 (0.72, 1.51)
0.97 (0.66, 1.44)
0.92
0.91
Slattery ML,
2004 (249)
USA;
2143 FM
Diet history
(CARDIA);
tertiles
vitamin D;
Diet
M: >10.2 vs. <4.2 µg/d
F: >8.3 vs. <3.1 µg/d
rectal 556
390
age, PA, energy, fibre,
BMI, NSAIDs
1.08 (0.73, 1.60)
0.52 (0.32, 0.85)
Senesse P,
2004 (167)
France;
480 FM
diet history;
quartiles
vitamin D;
Diet
M: >5.3 vs. <0.6 µg/d
F: >4.3 vs. <0.7 µg/d
colorectal 171 age, sex, energy, BMI,
PA
1.1 (0.6, 2.0) 0.66
Levi F, 2000
(204)
Switzerland;
7140 FM
FFQ diet;
tertiles
vitamin D;
Diet
2.6 vs. 1.2 µg/d colorectal 223 age, sex, years of
education, smoking,
alcohol drinking, BMI,
PA, energy, fibre
1.46 (0.90, 2.30) >0.05
Kampman E,
2000 (245)
USA;
4403 FM
Dietary history
(CARDIA);
quintiles
vitamin D;
Diet
M: >11.2 vs. <3.6 µg/d
F: >8.6 vs. <2.6 µg/d
colon 1086
880
age, BMI, FH, aspirin
and./ or NSAIDs,
energy, long-term
vigorous activity, fibre,
calcium
1.40 (1.00, 2.20)
1.10 (0.70, 1.70)

Chapter three Literature review of examined dietary factors
129
Marcus PM,
1998 (246)
USA;
1190 FM
FFQ;
quintiles
vitamin D;
Diet +
Supplements
≥557 vs. <148 IU/d (total)
≥336 vs. <122 IU/d (diet)
≥400 vs. 0 IU/d (Supplement)
≥557 vs. <148 IU/d (total)
≥336 vs. <122 IU/d (diet)
≥400 vs. 0 IU/d (Supplement)
colon
rectal
348
164
age, energy, fibre 0.70 (0.40, 1.10)
0.80 (0.50, 1.30)
0.80 (0.60, 1.10)
0.80 (0.50, 1.50)
0.90 (0.40, 1.60)
0.90 (0.60, 1.40)
0.05
0.45
0.12
0.42
0.99
0.16
La Vecchia C,
1997 (221)
Italy;
4154 FM
FFQ;
quintiles
vitamin D;
Diet
≥4.28 vs. <2.02 µg/d colorectal 1953
age, area of residence,
sex, education, PA,
energy, fibre
0.77 (0.60, 0.90) <0.01
Pritchard RS,
1996 (248)
Sweden;
1081 FM
FFQ;
quartiles
vitamin D;
Diet
≥7 vs. ≤2.8 µg/d
colon
rectal
352
217
age, sex, energy,
protein
0.60 (0.40, 1.00)
0.50 (0.30, 0.90)
0.08
0.08
Boutron MC,
1996 (244)
France;
480 FM
Diet history;
quintiles
vitamin D;
Diet
M: >5.7 vs. <2.5 µg/d
F: >4.7 vs. <2.1 µg/d
colorectal 171 age, sex and caloric
intake
0.80 (0.40, 1.60) 0.77
Ferraroni M,
1994 (190)
Italy;
3350 FM
FFQ;
quintiles
vitamin D;
Diet
>1.97 vs. <0.79 µg/d colorectal 1326
age, sex, education, FH
of CRC, BMI, energy
0.74 (0.58, 0.95) <0.05
Peters RK,
1992 (247)
USA;
1492 FM
FFQ;
per 108 IU
increase/day
vitamin D;
Diet
per 108 IU increase/day colon 746 fat, protein,
carbohydrates, alcohol,
calcium, FH, weight, PA,
pregnancies (females)
1.08 (0.97, 1.20)
Benito E,
1991 (185)
Spain;
784 FM
FFQ;
quartiles
vitamin D;
Diet
>1.66 vs. <0.32 µg/d colorectal 286 energy, age, sex, weight 0.74 >0.05
* Abbreviations: F: females; M: males; FFQ: food frequency questionnaire; BMI: body mass index; FH: family history; CRC: colorectal cancer; PA: physical activity; HRT: hormone
replacement therapy; NSAIDs: Non-steroidal anti-inflammatory drugs; SF: saturated fat
† P-value for trend
‡ Results that are part of the current thesis and will be presented in detail in the following chapters

Chapter three Literature review of examined dietary factors
130
Table 28 Colorectal cancer risk and serum/ plasma vitamin D metabolites; Results from published nested case-control studies (1990-2008)*
Study Country;
Study;
Sample
Assessment Metabolite Comparison
(high vs. low)
Outcome Cases Adjustments OR (95% CI) p†
Wu K, 2007
(255)
USA;
Health
Professionals
Follow-up Study;
535 M
plasma
measurements;
quintiles
25(OH)D 39.4 vs. 18.4 ng/ml
colorectal
179
FH, aspirin use, PA,
folate, calcium, retinol,
pack-years of smoking,
alcohol, meat intake
(total red and
processed meat)
0.83 (0.45, 1.52)
0.24
Otani T,
2007 (253)
Japan;
Japan Public
Health Centre-
based
Prospective
Study; 1125 FM
plasma
measurements;
quartiles
25(OH)D M: >32.1 vs. <22.9 ng/ml
F: >27.0 vs. 18.7 ng/ml
colorectal
colorectal
163
160
matched on sex, age,
study area, date of
blood draw, fasting
time; adjusted for pack-
years of smoking,
alcohol, BMI, PA,
vitamin supplement
use, FH of CRC
0.73 (0.35, 1.5)
1.1 (0.50, 2.3)
0.39
0.74
Wactawski-
Wende J,
2006 (234)
USA;
Women's Health
Initiative; 612 F
serum
measurements;
quartiles
25(OH)D ≥23 vs. <12 ng/mL colorectal 306 matched on age,
centre, race or ethnic
group, date of blood
sampling
0.4 (0.2, 0.8) 0.01
Feskanich
D, 2004
(252)
USA;
Nurses’ Health
Study; 579 F
plasma
measurements;
quintiles
25(OH)D
1,25(OH)2D
39.9 vs. 16.2 ng/mL
43.0 vs. 21.7 pg/ml
colorectal
193
matched on year of
birth, month of blood
draw; adjusted for BMI,
PA, pack-years of
smoking, menopausal
status, HRT, aspirin, FH
of CRC, calcium, folate,
methionine, retinol, red
meat, alcohol
0.53 (0.27, 1.04)
1.77 (0.93, 3.36)
0.02
0.51

Chapter three Literature review of examined dietary factors
131
Tangrea J,
1997 (254)
Finland;
Alpha-
Tocepherol
Beta-Carotene
Prevention
Study;
438 M
serum
measurements;
quartiles
25(OH)D
1,25(OH)2D
>19.3 vs. ≤9.8 ng/l
>43.1 vs. ≤31.7 ng/l
colorectal
146
matched on age, date
of baseline blood draw,
study clinic
0.6 (0.3, 1.1)
0.9 (0.5, 1.7)
0.13
0.76
Braun MM,
1995 (251)
USA; 171 FM serum
measurements;
quintiles
25(OH)D
1,25(OH)2D
>30.1 vs. <17.2 ng/mL
>41.3 vs. <26.6 pg/ml
colon 57 matched on age, race,
sex, date of blood draw
0.40 (0.1, 1.4)
1.1 (0.4, 3.2)
0.57
0.88
* Abbreviations: F: females; M: males; FFQ: food frequency questionnaire; BMI: body mass index; FH: family history; CRC: colorectal cancer; PA: physical activity; HRT: hormone
replacement therapy; NSAIDs: Non-steroidal anti-inflammatory drugs; SF: saturated fat
† P-value for trend

Chapter three Literature review of examined dietary factors
132
Table 29 Colorectal cancer risk and calcium; Results from published cohort studies (1990-2008)*
Study Country;
Study;
Sample
Assessment Nutrient Comparison
(high vs. low)
Outcome Cases Adjustments RR (95% CI) p†
Park S-Y,
2007 (231)
USA;
Multiethnic
cohort study;
191011 FM
FFQ;
quintiles
calcium;
Diet +
Supplements
Total:
M: ≥611 vs. ≤288 mg/1000kcal/d
F: ≥611 vs. ≤288 mg/1000kcal/d
Diet:
M: ≥466 vs. ≤260 mg/1000kcal/d
F: ≥466 vs. ≤260 mg/1000kcal/d
Supplements
M: ≥200 vs. 0 mg/d
F: ≥200 vs. 0 mg/d
Diet excluding supplement users:
M: ≥466 vs. ≤260 mg/1000kcal/d
F≥466 vs. ≤260 mg/1000kcal/d
colorectal 1138
972
1138
972
1138
972
1138
972
ethnicity, time since
cohort entry, age, pack-
years of cigarette
smoking, FH of CRC,
PA, history of intestinal
polyps, NSAIDs, BMI,
energy, dietary fibre,
HRT (women),
multivitamins
0.70 (0.52, 0.93)
0.64 (0.50, 0.83)
0.76 (0.59, 0.96)
0.91 (0.72, 1.17)
0.74 (0.60, 0.90)
0.82 (0.69, 0.98)
0.73 (0.54, 1.00)
0.70 (0.50, 0.97)
0.006
0.003
0.02
0.61
0.003
0.02
0.06
0.02
Shin A,
2006 (222)
China;
Shanghai
Women's
Health Study;
73314 F
FFQ;
quintiles
calcium;
Diet
>610.8 vs. ≤291.9 mg/d colorectal
283 age, menopausal status,
education, cigarette
smoking, alcohol
consumption, exercise,
FH of CRC, vitamin
supplements use and
calorie intake
0.9 (0.6, 1.4) 0.48
Larsson
SC, 2006
(230)
Sweden;
Cohort of
Swedish Men;
45306 M
FFQ;
quartiles
calcium;
Diet +
Supplements
≥1445 vs. <956 mg/d colorectal 449 age, education, FH of
CRC, BMI, exercise,
history of diabetes,
smoking, aspirin,
multivitamin use, energy,
SF, total vitamin D,
alcohol, fruit, vegetables,
red meat
0.68 (0.51, 0.91) 0.01

Chapter three Literature review of examined dietary factors
133
Kesse E,
2005 (238)
France;
E3N-EPIC;
73034 F
FFQ;
quartiles
calcium;
Diet
total Ca: >1201.8 vs. <766.2 mg/d
dairy Ca: >736.0 vs. <359.2 mg/d
colorectal 172 educational level, current
smoking status, FH of
CRC BMI, PA, energy,
alcohol
0.72 (0.47, 1.10)
0.86 (0.56, 1.32)
0.08
0.25
Lin J,
2005 (239)
USA;
Women’s
Health Study;
39976 F
FFQ;
quintiles
calcium;
Diet +
Supplements
≥1357 vs. <614 mg/d (total)
≥1083 vs. <480 mg/d (diet)
≥500 vs. 0 ug/d (Supplements)
colorectal 223 age, randomised
treatment assignment,
BMI, FH of CRC, history
of colon polyps, PA,
smoking status, red
meat, alcohol, total
energy, SF, multivitamin
use, menopausal status,
HRT
1.20 (0.79, 1.85)
0.90 (0.53, 1.54)
1.30 (0.90, 1.87)
0.21
0.81
0.13
Flood A,
2005 (258)
USA;
Breast Cancer
Detection
Demonstration
Project;
45354 F
FFQ;
quintiles
calcium;
Diet +
Supplements
>1270 vs. <472 mg/d (total)
>830 vs. <412 mg/d (diet)
>800 vs. 0 ug/d (Supplements)
colorectal 482 energy, age 0.74 (0.55, 0.99)
0.74 (0.56, 0.98)
0.76 (0.56, 0.98)
0.02
0.05
0.09
Wei EK,
2004 (217)
USA;
Nurses'
Health Study,
Health
Professionals
Follow-Up
Study;
87733 F,
46632 M
FFQ;
quartiles
calcium;
Diet
>1100 vs. <600 µg/d colon
rectal
1139
339
age, FH, BMI, PA, beef,
pork or lamb as a main
dish, processed meat,
alcohol, calcium, height,
pack-years smoking
before age 30, history of
endoscopy, sex
0.88 (0.73, 1.07)
0.92 (0.65, 1.30)
0.17
0.66
McCullou
gh ML,
2003 (241)
USA;
Cancer
Prevention
Study II
FFQ
quintiles
calcium;
Diet +
Supplements
>988 vs. <504 mg/d (diet)
>500 vs. 0 mg/d (Supplements)
>1255 vs. <561 mg/d (total)
colorectal 683
age, smoking, BMI,
education, PA, FH of
CRC, energy, %SF, fruit,
vegetables,
0.92 (0.72, 1.17)
0.69 (0.49, 0.96)
0.87 (0.67, 1.12)
0.28
0.03
0.02

Chapter three Literature review of examined dietary factors
134
Nutrition;
127749 FM
multivitamins, HRT
(women)
Wu K,
2002 (261)
USA;
Nurses'
Health Study,
Health
Professionals
Follow-Up
Study;
87998F
47344 M
FFQ;
number of
categories: 7 for
total Ca; 6 for
dietary Ca; 6 for
dairy Ca; 6 for
non-dairy Ca
calcium;
Diet +
Supplements
M: >1250 vs. ≤500 mg/d (total)
F: >1250 vs. ≤500 mg/d (total)
M: >1000 vs. ≤500 mg/d (diet)
F: >1000 vs. ≤500 mg/d (diet)
M: >800 vs. ≤200 mg/d (dairy)
F: >800 vs. ≤200 mg/d (dairy)
M: >350 vs. ≤250 mg/d (non-dairy)
F: >350 vs. ≤250 mg/d (non-dairy)
colon 399
626
age, FH, BMI, PA, pack-
years of smoking before
age of 30, aspirin, red
meat, alcohol; for
women: HRT,
menopausal status
0.64 (0.43, 0.95)
0.94 (0.66, 1.33)
0.67 (0.46, 0.96)
0.97 (0.68, 1.38)
0.78 (0.53, 1.16)
0.78 (0.50, 1.21)
1.02 (0.73, 1.43)
1.03 (0.70, 1.54)
0.17
0.35
0.24
0.21
0.33
0.26
0.37
0.43
Terry P,
2002 (242)
Sweden;
Swedish
Mammograph
y Screening
Cohort
61463 F
FFQ;
quartiles
calcium ;
Diet
914 vs. 486 mg/d colorectal 572 energy, age, BMI,
education level, red
meat, alcohol, energy
adjusted SF, folic acid,
vitamin C, calcium
0.72 (0.56, 0.93) 0.02
Jarvinen
R, 2001
(236)
Finland;
Finnish Mobile
Clinic Health
Examination
Survey;
9959 FM
FFQ;
quartiles
calcium;
Diet
M: ≥1953.3 vs. <1178.2 mg/d
F: ≥1416.7 vs. <862.5 mg/d
colorectal 72 age, sex, BMI,
occupation, smoking,
geographical area,
energy
1.43 (0.61, 3.39) 0.97
Pietinen
P, 1999
(162)
Finland;
Alpha-
Tocopherol,
Beta-Carotene
Cancer
Prevention
Study;
27111 M
FFQ;
quartiles
calcium;
Diet
1789 vs. 856 mg/d colorectal 185 age, supplement group,
smoking years, BMI,
alcohol, education, PA at
work, calcium
0.6 (0.4, 0.9) 0.04

Chapter three Literature review of examined dietary factors
135
Zheng W,
1998 (243)
USA;
Iowa
Women’s
Health Study;
34702 F
FFQ;
tertiles
calcium;
Diet +
Supplements
>1278.7 vs. <800.8 mg/d rectal 144 age, smoking status,
pack-years of smoking,
HRT, energy
0.59 (0.37, 0.94) 0.02
Sellers
TA, 1998
(220)
USA;
Iowa
Women’s
Health Study;
35216 F
FFQ;
tertiles
calcium;
Diet +
Supplements
No FH of CRC
>1296.6 vs. ≤820.7 mg/d (total)
>964.7 vs. ≤615 mg/d (diet)
>500 vs. 0 IU/d (supplement)
FH of CRC
>1296.6 vs. ≤820.7 mg/d (total)
>964.7 vs. ≤615 mg/d (diet)
>500 vs. 0 IU/d (supplement)
colon 180
62
age, energy, history of
rectal cancer polyps
0.5 (0.3, 0.7)
0.7 (0.4, 1.0)
0.6 (0.4, 0.9)
1.2 (0.6, 2.2)
0.8 (0.4, 1.7)
1.0 (0.5, 2.1)
0.001
0.06
0.02
0.7
0.6
1.0
Kato I,
1997 (65)
USA;
New York’s
University
Health Study;
14727 F
FFQ;
quartiles
calcium high vs. low quartiles (total)
high vs. low quartiles (from
fish/shellfish)
high vs. low quartiles (from dairy)
colorectal 100 total calorie intake, age,
place at enrolment,
highest level of
education
0.71 (0.39, 1.28)
0.41 (0.22, 0.74)
0.65 (0.38, 1.11)
0.18
0.001
0.04
Gaard M,
1996 (63)
Norway;
50535 FM
FFQ calcium colon 143 energy no association
Martinez
EM, 1996
(240)
USA;
Nurses Health
Study;
89448 F
FFQ;
quintiles
calcium;
Diet
>957 vs. <475 mg/d (diet)
>957 vs. <475 mg/d (diet) (women
with unchanged milk intake)
colorectal 501
346
age, BMI, PA, FH of
CRC, aspirin, cigarette
smoking, red-meat
intake, and alcohol
0.80 (0.60, 1.07)
0.74 (0.53, 1.05)
0.25
0.12
Kearney
J, 1996
(237)
USA;
Health
Professionals;
47935 M
FFQ;
quintiles
calcium;
Diet +
Supplements
≥1213 vs. <631 mg/d (total)
≥1051 vs. <605 mg/d (dietary)
≥620 vs. <137 mg/d (dairy)
≥864 vs. <119 mg/d (non-dairy)
colon 203 age, total calories, FH of
CRC, previous polyps
screening, past history of
smoking, alcohol, aspirin,
PA, BMI, red meat, SF,
dietary fibre
0.75 (0.48, 1.15)
0.81 (0.52, 1.28)
0.68 (0.42, 1.09)
0.86 (0.50, 1.48)
0.22
0.62
0.28
0.30
Kampman
E, 1994
The
Netherlands;
FFQ;
quintiles
calcium;
Diet
1288 vs. 596 mg/d (diet)
417 vs. 238 mg/d (non-dairy)
colorectal 478 age, gender, FH of CRC,
energy, energy-adjusted
0.92 (0.64, 1.34)
1.77 (1.08, 2.90)
0.89
0.01

Chapter three Literature review of examined dietary factors
136
(259) Netherlands
Cohort; 3346
FM
634 vs. 64 mg/d (fermented dairy)
540 vs. 45 mg/d (unfermented
dairy)
intake of fat and dietary
fibre, BMI, history of
gallbladder surgery
1.14 (0.77, 1.68)
0.71 (0.48, 1.05)
0.32
0.11
Bostick
RM, 1993
(235)
USA;
Iowa
Women’s
Health Study;
32216 F
FFQ;
quintiles
calcium;
Diet +
Supplements
>1547 vs. <629 mg/d (total)
>1186 vs. <496 IU/d (diet)
>500 vs. 0 mg/d (Supplements)
colon 212 age, energy, height,
parity, low fat meat
intake, vitamin E, a
vitamin E x age
interaction term
0.52 (0.33, 0.82)
0.73 (0.48, 1.13)
0.57 (0.37, 0.88)
0.01
0.28
0.03
Stemmer
mann GN,
1990 (260)
Hawaii
(Japanese);
7572 M
24 hr diet recall;
tertiles
calcium;
Diet
low vs. high (total)
low vs. high (dairy)
low vs. high (non-dairy)
colon 189 age 1.3 (0.9, 1.8)
1.2 (0.9, 1.8)
1.1 (0.8, 1.6)
0.16
0.27
0.55
* Abbreviations: F: females; M: males; FFQ: food frequency questionnaire; BMI: body mass index; FH: family history; CRC: colorectal cancer; PA: physical activity; HRT: hormone
replacement therapy; NSAIDs: Non-steroidal anti-inflammatory drugs; SF: saturated fat
† P-value for trend

Chapter three Literature review of examined dietary factors
137
Table 30 Colorectal cancer risk and calcium; Results from published case-control studies (1990-2008)*
Study Country;
Study;
Sample
Assessment Nutrient Comparison
(high vs. low)
Outcome Cases Adjustments OR (95% CI) p†
Theodoratou
E, 2008‡ (250)
Scotland;
SOCCS
study;
4750 FM
FFQ;
quintiles
calcium;
Diet +
Supplements
Diet: ≥1.32 vs. ≤0.89 g/d
Total: ≥1.34 vs. ≤0.89 g/d
colorectal 2070 energy (residual
method), energy
(included as a covariate),
age, sex, deprivation
score, fibre, FH of CRC,
BMI, smoking, NSAIDs,
PA
0.96 (0.78, 1.17)
0.89 (0.72, 1.09)
0.86
0.62
Wakai K,
2006 (166)
Japan;
2535 FM
FFQ;
quartiles
calcium;
Diet
high vs. low quartile colon
rectal
265
242
energy, sex, age, year
and season of first visit
to the hospital, reason
for visit, FH of CRC<
BMI, exercise, alcohol,
smoking, multivitamin
use
0.67 (0.46, 1.00)
0.97 (0.63, 1.50)
0.04
0.99
Slattery ML,
2004 (249)
USA;
2143 FM
Diet history
(CARDIA);
tertiles
calcium;
Diet
M: >1543 vs. <743 mg/d
F: >1275 vs. <628 mg/d
rectal 556
390
age, PA, energy, fibre,
BMI, NSAIDs
1.02 (0.66, 1.56)
0.39 (0.24, 0.64)
Senesse P,
2004 (167)
France;
480 FM
diet history;
quartiles
calcium;
Diet
M: >1241.3 vs. <321.1 mg/d
F: >1168.6 vs. <365.6 mg/d
colorectal 171 age, sex, energy, BMI,
PA
1.4 (0.8, 2.6) 0.38
Satia-Abouta
J, 2003 (211)
USA;
North
Carolina
Colon
Cancer
Study;
1609 FM
FFQ;
quartiles
calcium;
Diet +
Supplements
Whites :
1691 vs. 456 mg/d
African/Americans:
1143 vs. 304 mg/d
colon 337
276
energy, other potential
confounders examined
include age, sex,
education, BMI, smoking,
PA, FH of CRC, NSAIDs,
supplement use, fat,
dietary fibre, calcium,
folate, fruits, vegetables
0.4 (0.3, 0.6)
0.6 (0.3, 1.1)
<0.0001
0.08

Chapter three Literature review of examined dietary factors
138
Ma J, 2001
(265)
USA;
Health
Professionals
Study;
511 M
FFQ;
tertiles
calcium;
dairy foods
≥340 vs. ≤132 mg/d (dairy)
≥291 vs. ≤42 mg/d (milk)
colorectal 193 age, smoking, BMI,
alcohol, multivitamin use,
aspirin, exercise, molar
ratio of IGF-I to IGFBP-3
0.62 (0.38, 1.02)
0.66 (0.40, 1.09)
0.09
0.06
Levi F, 2000
(204)
Switzerland;
7140 FM
FFQ diet;
tertiles
calcium;
Diet
1144.9 vs. 431.2 mg/d colorectal 223 age, sex, years of
education, smoking,
alcohol drinking, BMI,
PA, energy, fibre
0.96 (0.5, 1.7) >0.05
Kampman E,
2000 (245)
USA;
4403 FM
Dietary history
(CARDIA);
quintiles
calcium;
Diet
M: >1701 vs. <681 mg/d
F: >1330 vs. <546 mg/d
colon 1086
880
age, BMI, FH, aspirin
and./ or NSAIDs, energy,
long-term vigorous
activity, fibre
0.7 (0.5, 0.9)
0.6 (0.4, 0.9)
Marcus PM,
1998 (246)
USA;
1190 F
FFQ;
quintiles
calcium;
Diet +
Supplements
≥1396 vs. <532 mg/d (total)
≥1121 vs. <466 mg/d (diet)
≥800 vs. 0 mg/d (Supplement)
≥1396 vs. <532 mg/d (total)
≥1121 vs. <466 mg/d (diet)
≥800 vs. 0 mg/d (Supplement)
colon
rectal
348
164
age, energy, fibre, SF,
animal fat,
0.6 (0.4, 1.0)
0.8 (0.5, 1.4)
1.0 (0.7, 1.6)
0.6 (0.3, 1.1)
0.7 (0.3, 1.3)
0.8 (0.5, 1.6)
0.03
0.13
0.68
0.07
0.53
0.34
La Vecchia C,
1997 (221)
Italy;
4154 FM
FFQ;
quintiles
calcium;
Diet
≥1495 vs. <799 ug/d colorectal 1953
age, area of residence,
sex, education, PA,
energy, fibre
0.72 (0.6, 0.9) <0.01
White E,
1997 (219)
USA;
871 FM
Questionnaire
for Supplements;
4 categories
calcium;
Supplements
>100 vs. 0 mg/d colon 444 age, sex 0.78 (0.52, 1.18) 0.03
Ghadirian P,
1997 (153)
Canada;
1070 FM
FFQ;
quartiles
calcium;
Diet
high vs. low quartile colon 402 sex, age, marital status,
history of colon
carcinoma in first-degree
relatives, energy
0.69 (0.47, 1.00) 0.04
De Stefani E,
1997 (126)
Uruguay;
846 FM
quartiles calcium;
Diet
>951.9 vs. ≤554.3 mg/d colorectal 282 age, sex, residence,
urban/rural status,
0.41 (0.24, 0.69) 0.001

Chapter three Literature review of examined dietary factors
139
energy, protein, fat,
folate
Pritchard RS,
1996 (248)
Sweden;
1081 FM
FFQ;
quartiles
calcium;
Diet
≥1057 vs. ≤640 mg/d
colon
rectal
352
217
age, sex, energy, protein 1.2 (0.7, 2.1)
1.0 (0.5, 1.9)
0.62
0.73
Boutron MC,
1996 (244)
France;
480 FM
Diet history;
quintiles
calcium;
Diet
high vs. low quintile (diet)
high vs. low quintile (non-dairy)
high vs. low quintile (dairy)
colorectal 171 age, sex and caloric
intake
1.7 (0.8, 2.3)
1.6 (0.8, 3.0)
1.8 (0.9, 3.4)
0.33
0.11
0.17
Ferraroni M,
1994 (190)
Italy;
3350 FM
FFQ;
quintiles
calcium;
Diet
>1029.7 vs. <468.1 mg/d colorectal 1326
age, sex, education, FH
of CRC, BMI, energy
0.84 (0.65, 1.08) >0.05
Slattery ML,
1994 (267)
USA;
715 FM
FFQ;
quartiles
calcium;
Diet
M: >1401.7 vs. ≤641.2 mg/d
F: >1141.0 vs. ≤592.5 mg/d
colon 324 age, BMI, energy, fibre 0.3 (0.1, 0.8)
0.6 (0.2, 1.3)
Kampman E,
1994 (264)
The
Netherlands;
491 FM
diet history calcium; Diet Diet
>1480 vs. ≤1010 mg/d
From fermented dairy
>683 vs. ≤333 mg/d
From unfermented dairy
>530 vs. ≤170 mg/d
From non-dairy
>402 vs. ≤296 mg/d
colon 232 age, gender,
urbanization level,
energy, FH of CRC,
cholecystectomy and
energy-adjusted intake of
total fat, dietary fibre,
vitamin C and alcohol
1.81 (1.05, 3.12)
1.26 (0.74, 2.16)
1.10 (0.63, 1.91)
0.69 (0.36, 1.32)
0.02
0.32
0.94
0.34
Meyer F,
1993 (205)
USA;
838 FM
FFQ;
quartiles
calcium;
Diet
high vs. low quartile colon 424 age, interviewer, dietary
energy, alcohol, fibre
M: 1.37
F: 0.35
Peters RK,
1992 (247)
USA;
1492 FM
FFQ;
continuous
calcium;
Diet
continuous colon 746 FH, weight, PA,
pregnancies (females)
0.85 (0.78, 0.93) <0.001
Arbman G,
1992 (262)
Sweden;
82 FM
diet history;
2 categories
calcium;
Diet
above vs. below the median
intake
colorectal 41 energy 0.33 (0.10, 0.94) <0.05
Benito E,
1991 (185)
Spain;
784 FM
FFQ;
quartiles
calcium;
Diet
>1034 vs. <545 mg/d colorectal 286 energy, age, sex, weight 1.48 >0.05
Freudenheim
JL, 1990
(263)
USA;
844 FM
FFQ;
quartiles (men),
tertiles (women)
calcium;
Diet
M: high vs. low quartile
F: high vs. low quartile
rectal 277
145
1.51 (0.94, 2.44)
1.63 (0.91, 2.91)
>0.05
>0.05

Chapter three Literature review of examined dietary factors
140
Negri E, 1990
(266)
Italy;
1942 FM
FFQ;
quintiles
calcium;
Diet
>1046 vs. <480 mg/d colon
rectal
558
352
age, sex, education, area
of residence, and
consumption of selected
indicator foods
1.1 (0.8, 1.6)
1.2 (0.8, 1.9)
>0.05
>0.05
* Abbreviations: F: females; M: males; FFQ: food frequency questionnaire; BMI: body mass index; FH: family history; CRC: colorectal cancer; PA: physical activity; HRT: hormone
replacement therapy; NSAIDs: Non-steroidal anti-inflammatory drugs; SF: saturated fat
† P-value for trend
‡ Results that are part of the current thesis and will be presented in detail in the following chapters
Chapter four Methods
141
4 METHODS
4.1 Introduction
In this chapter the overall methodology of the thesis is described. In the first part, the
population-based case-control study that the analysis was based on is presented. In the
second part of the chapter the specific elements of data collection and process (prior to
analysis) are described. Finally, in part three of the chapter the overall statistical
methodology is outlined.
4.2 Scottish Colorectal Cancer Study
4.2.1 Study design
This thesis was based on a population-based case-control study of colorectal cancer
(Scottish Colorectal Cancer Study; SOCCS) in relation to genetic susceptibility, lifestyle
and dietary risk factors. The recruitment for this study commenced in February 1999 and
ended in December 2006. It was funded by the Cancer Research UK (CR-UK), the
Medical Research Council (MRC) and the Chief Scientist Office of the Scottish
Executive (CSO) and was headed by Professors Malcolm G Dunlop, Harry Campbell
and Mary E Porteous. The main aims of the study were to identify genetic factors that
influence colorectal carcinogenesis but also to investigate what are the effects of diet and
general lifestyle on colorectal cancer.
4.2.2 Ethical approval and consultant consent
Ethical approval for the SOCCS study was obtained from the MultiCentre Research
Ethics committee for Scotland (MREC; approval number MREC/ 01/0/0), 18 Local
Research Ethics committees, 18 Caldicott guardians and 16 NHS Trust management
committees (Appendix II). The principles and procedures detailed in the MRC document
“Human tissue and biological samples for use in research”, November 1999 were
followed and the model consent form proposed by MRC was used. Individual informed
consent was received on the basis that the DNA sample and other data about the
individual could be stored by the research team at Edinburgh University for uses in
future research and may be shared with other medical research groups (with appropriate

Chapter four Methods
142
ethical approvals first being obtained where necessary). This consent includes
interactions with researchers working for commercial companies (Appendix II).
Consultant surgeons in all Scottish hospitals were asked permission for their eligible
patients to receive information on the SOCCS studies. More than 100 surgeons allowed
and only two surgeons refused to allow their patients to be informed.
4.2.3 Case recruitment
4.2.3.1 Eligibility for the study
All cases between 16 and 79 years old with colorectal adenocarcinoma diagnosed after
February of 1999 and permanently resident in Scotland were eligible to take part in the
study. In each case the diagnosis was confirmed histologically and with reference to the
pathological report.
Cases that 1) were not normally resident in Scotland, 2) were recurrent colorectal cancer
cases or 3) had a) squamous cell carcinoma of the anus, b) melanoma of the rectum or c)
carcinoid tumours of the colon, were not eligible to be included in the study. In addition
cases that could not give informed consent, because they 1) were too ill, 2) had mental
health problems, 3) had learning difficulties or 4) had dementia, were excluded from the
study.
4.2.3.2 Recruitment
Eight research nurses were trained by the principal investigators, the project co-ordinator
and the research nurse co-ordinator (3-day training session) and appointed to eight
geographical areas. Study awareness in 41 NHS and private funded Scottish hospitals
was ensured by several presentations to the medical and nursing staff delivered by the
research nurse co-ordinator. Following this presentation a recruitment strategy to
ascertain eligible patients and to provide them with the study’s information pack was
developed. For eligible cases that did not wish to participate (non-participants) or did not
respond within two months of initial approach (non-responders) a non-participant form
was completed, recording sex, age of diagnosis, consultant, health board (where treated),
reason of non-participation (if given) and type of surgery (if applicable; curative or
palliative).

Chapter four Methods
143
The initial recruitment plan for the study was that each research nurse would visit and
recruit patients in the last few days of their hospital stay. However, because of a new
discharge policy, which was implemented soon after recruitment commenced, eligible
cases were recruited in their homes after having been discharged from the hospital.
4.2.3.3 Recruitment protocol
According to the recruitment protocol, each patient received an information pack
containing a patient invitation letter, a patient information sheet, a sample consent form,
a patient detail sheet and a prepaid envelope, 24 hours prior to the recruitment visit
(Appendix II). The main steps of the patient recruitment were:
• Discussion with the patient about the main aims and elements of the study;
• Check that all necessary details on the patient details sheet were completed and
legible;
• Permission to take a family history and drawing of it on sheet provided;
• Assessment of family history risk (moderate and high risk patients were offered
genetic testing or were referred to a cancer genetic clinic);
• Recording of any previous cancer(s) (including year and hospital of diagnosis);
• Completion of study’s consent form;
• If patient wished for his/ her blood sample to be taken, also the DNA storage consent
form was completed;
• Completion of next of kin sheet (in case the patient did not wish his/ her blood
sample to be taken);
• Completion of the treatment questionnaire;
• Patient was asked to complete the lifestyle (Appendix III) and food frequency
questionnaires (Appendix IV) to the best of his/her ability and return in pre-paid
envelope (this step was included for cases recruited after 01 September 2001).
4.2.4 Control recruitment
4.2.4.1 Selection procedure
Controls eligible for the study were randomly identified through the Community Health
Index (CHI), which is a NHS population-based register. CHI is a national register of all

Chapter four Methods
144
individuals who are registered with a general practitioner (GP) in Scotland. The
completeness of the CHI has been estimated to be greater than 95% and it thus
represents an excellent sampling frame for the selection of population-based controls
(268). The controls were drawn following a matching protocol applied to the CHI and
they were recruited through clinics set up in over 40 locations across Scotland. Access to
the CHI for research purposes has recently been restricted following implementation of
the Data Protection Act 1998 on 1 March 2000. However, the study received MREC
(Scotland) approval to collaborate with the guardians of the CHI to use it as a sampling
frame but without knowing the identity of individuals until they agreed to participate.
Controls were selected at random according to the study’s instructions, by the
Practitioner Services Division (PSD) of the Information and Statistics Division (ISD) of
the NHS in Scotland (Step 1) and invitations passed on to these individuals via their GPs
(Step 2). In particular, the GPs’ information pack sent by post contained information and
forms 1) for the GPs (covering letter, reply form, explanatory letter) and 2) for the
controls (information sheet, reply form (Appendix II), lifestyle and food frequency
questionnaires (Appendix III, IV). In case of no reply from the GP (within a 4 week
period), a second information pack was sent repeating Step 2. If the GP refused to
inform the eligible control, the type of response (NO) was recorded in the control
recruitment recording form, the next eligible control for a particular case was
approached and steps 1 and 2 were repeated (Step 3). If the GP agreed to inform the
eligible control, the type of response (YES) was recorded in the control recruitment
recording form and the study office waited for 3 weeks for the control to reply via ISD
(Step 3). In case of no reply (within a 3 week period) a reminder letter was sent directly
to the control (Step 4). If the control refused to take part, the type of response (NO) was
recorded in the control recruitment recording form, the next eligible control for a
particular case was approached and steps 1 and 2 were repeated (Step 5). If the control
agreed to participate, the type of response was recorded (YES) in the control recruitment
recording form and the details were passed to the research nurse responsible for the
recruitment visit (Step 6) (Figure 31).

Chapter four Methods
145
Figure 31 Selection procedure of controls

Chapter four Methods
146
4.2.4.2 Recruitment protocol
According to the recruitment protocol, each control received the lifestyle and food
frequency questionnaires prior to the recruitment meeting and controls were responsible
to bring them to the recruitment meeting. The main steps of the control recruitment
were:
• Discussion with the control about the main aims and elements of the study;
• Check that all necessary details were completed and legible on the control details
sheet;
• Permission to take a family history and drawing of it on sheet provided;
• Assessment of family history risk (moderate and high risk patients were offered
genetic testing or were referred to a cancer genetic clinic);
• Recording of any previous cancer(s) (including year and hospital of diagnosis);
• Completion of study’s consent form;
• If control wished for his/ her blood sample to be taken, also the DNA storage
consent form was completed.
• Completion of next of kin sheet (in case the control did not wish his/ her blood
sample to be taken);
• Control was asked whether he/ she had brought along the lifestyle (Appendix III)
and food frequency questionnaires (Appendix IV). If:
o Yes; Questionnaires were quickly checked through and any necessary help
was given.
o No (forgot to bring along); A prepaid reply envelope was provided.
o No (did not receive questionnaires); Blank questionnaires and a prepaid reply
envelope were provided.
o No (refused to complete); this answer was recorded in the controls detail
form.

Chapter four Methods
147
4.2.5 Subject data processing and management
4.2.5.1 Assignment of ID numbers
Subjects were assigned to unique identification (ID) numbers (Study ID). The Study ID
consisted of four ID parts: a) “Case” ID (4 digits); b) “Status” ID (1 digit); c) “Relevant
number” ID (2 digits); d) “Nurse number” ID (2 digits). For cases, “Case” ID numbers
were assigned consecutively according to the order in which they were identified from
the hospital files. Control subjects were assigned a “Case” ID identical to the “Case” ID
of the case subjects that they were matched to. “Status” ID was used to separate cases
from control subjects by having the value 0 for cases and the value 2 or 4 for the
controls. “Relevant number” ID was used when multiple controls were recruited for one
case. Therefore, it always had the value 00 for cases and from 00 up to 06 for the
controls. Finally each research nurse had each own code number (“Nurse number” ID).
For storing, elaborating and analysis of the collected data this ID system was used in
order to protect the subjects’ identity.
4.2.5.2 Main database
Recruitment and subject details were entered in an Access database (Main database).
Details for non-participants and participants were held in separate tables. The main
information contained in the non-participant and participant tables are listed separately
for cases and controls in Table 31 and Table 32.

Chapter four Methods
148
Table 31 List of details included in the Main database: Cases
Title Data
Participants
Study ID Unique ID number
CHI number National unique identification number assigned from the Community
Health Index
Recruitment Date Date of recruitment
Name 3 columns for case’s title, forename and surname
Address 6 columns for case’s address: Address line 1, address line 2, post code,
post code area, health board area, post code area for calculation of
deprivation score
Deprivation score Deprivation score
Date of birth Case’s date of birth
Sex Sex
MRC consent Study participation consent (Yes/ No)
C note consent Case medical records consent (Yes/ No)
GP details 7 columns for case’s GP details: Name, surgery, address (2 columns),
town, postcode, telephone number
Hospital Name of hospital that the case was treated and recruited
Blood sample details 9 columns for blood sample receipt
Questionnaire Whether lifestyle and food frequency questionnaires were given and
returned
Risk CRC family history risk (low, moderate, high, unclear, not applicable,
missing)
Withdrawn 3 columns: Case withdrawn (yes/no), date of withdrawn, reason of
withdrawn
Non-participants
ID number Unique ID number
Sex Sex
Age Age (at time of approach for recruitment)
Under 55 Whether the case was under 55 years old
Hospital Name of the hospital the case was treated
Consultant 2 columns for the consultant and the associated consultant that treated
the case
Date of invite Date that the case was invited to take part
Health board Health board of residence

Chapter four Methods
149
Reason Reason of no participation
Surgery Whether the case had colorectal cancer surgery or not (yes/no)
Curative/ Palliative Whether the surgery was curative, palliative or not recorded
Additional Info Additional information regarding the reason of no participation
Table 32 List of details included in the Main database: Controls
Title Data
Participants
Study ID Unique ID number
CHI number National unique identification number assigned from the Community
Health Index
PSD* Date Date that control’s details received from PSD
Name 3 columns for control’s title, forename and surname
Address 6 columns for control’s address: Address line 1, address line 2, post code,
post code area, health board area, post code area for calculation of
deprivation score
Deprivation score Deprivation score
Date of birth Control’s date of birth
Sex Sex
GP details 7 columns for control’s GP: Name, surgery, address (2 columns), town,
postcode, telephone number
Appointment date Date of appointment of control with research nurse
MRC consent Study participation consent (Yes/ No)
Blood sample details 9 columns for blood sample receipt
Questionnaire Whether lifestyle and food frequency exposure questionnaires were given
and returned
Risk CRC family history risk (low, moderate, high, unclear, not applicable,
missing)
Withdrawn 3 columns: Control withdrawn (yes/no), date of withdrawn, reason of
withdrawn
Non-participants
ID number Unique ID number
Case ID ID of the case that controls was approached for
Sex Sex
PSD* Centre PSD centre
For each control The following variables were completed for all the approached controls

Chapter four Methods
150
approached:
PSD* PSD sector
Control Start recruiting control (yes/no)
Control accept Control accepted to be recruited to the study (yes/no)
Post code area Post code area for calculation of deprivation score
For a subset of the
approached controls:
The following variables were completed for a subset of the controls
approached for recruitment. (Up to 15 controls for each case could have
been approached)
PSD* PSD sector
Control Start recruiting control (yes/no)
GP write 1 Write to the GP for the first time regarding control (yes/no)
GP re-write Write to the GP for a second time regarding control (yes/no)
GP reply GP replied regarding control (yes/no)
GP accept GP accepted to send study information package to control (yes/no)
Control re-write Write for a second time to control (yes/no)
Control reply Reply from the control (yes/no)
Control accept Control accepted to be recruited to the study (yes/no)
Post code area Post code area for calculation of deprivation score
Deprivation score Deprivation score
Reason Reason why the GP or control has not agreed to participate (if applicable)
Other notes Additional information regarding control recruitment status
* PSD: Practitioner Services Division

Chapter four Methods
151
4.2.6 Subject participation analysis
In total, 6,678 eligible cases were identified, of which 3,471 cases agreed to participate
(overall participation rate: 52.0%). Of the 3,471 recruited cases 54 withdrew from the
study and 3,417 cases were finally included in the study (98.4% of the recruited cases).
The main reasons of cases withdrawn were: 1) 43 cases did not fulfil the inclusion
criteria, 2) five cases withdrew their consent, 3) five cases were duplicates and 4) one
case was never recruited.
Regarding controls, 10,593 population-based controls were identified, of which 4,134
agreed to participate (overall participation rate: 39.0%). Of the 4,134 recruited controls,
737 withdrew from the study and 3,396 controls were finally included in the study
(82.2% of the recruited controls). The main reasons of controls withdrawn were: 1) 364
controls withdrew their consent, 2) 185 controls were never recruited, 3) 105 controls
could not be contacted or moved house, 4) 40 controls did not give blood or their DNA
yield was insufficient, 5) 10 controls did not attend the appointments, 6) 10 controls
developed colorectal cancer, 7) 23 controls for other reasons.
Distribution of cases was examined across sex, age, and health board area of residence
for participants, non-participants and withdrawn subjects (Table 33). Among the non-
participants, reason of no response was also examined (Table 34). Distribution of
controls was examined across sex, age, health board area of residence, and deprivation
score for participants, non-participants and withdrawn subjects (Table 35). For
deprivation score information see chapter 4.4.1.
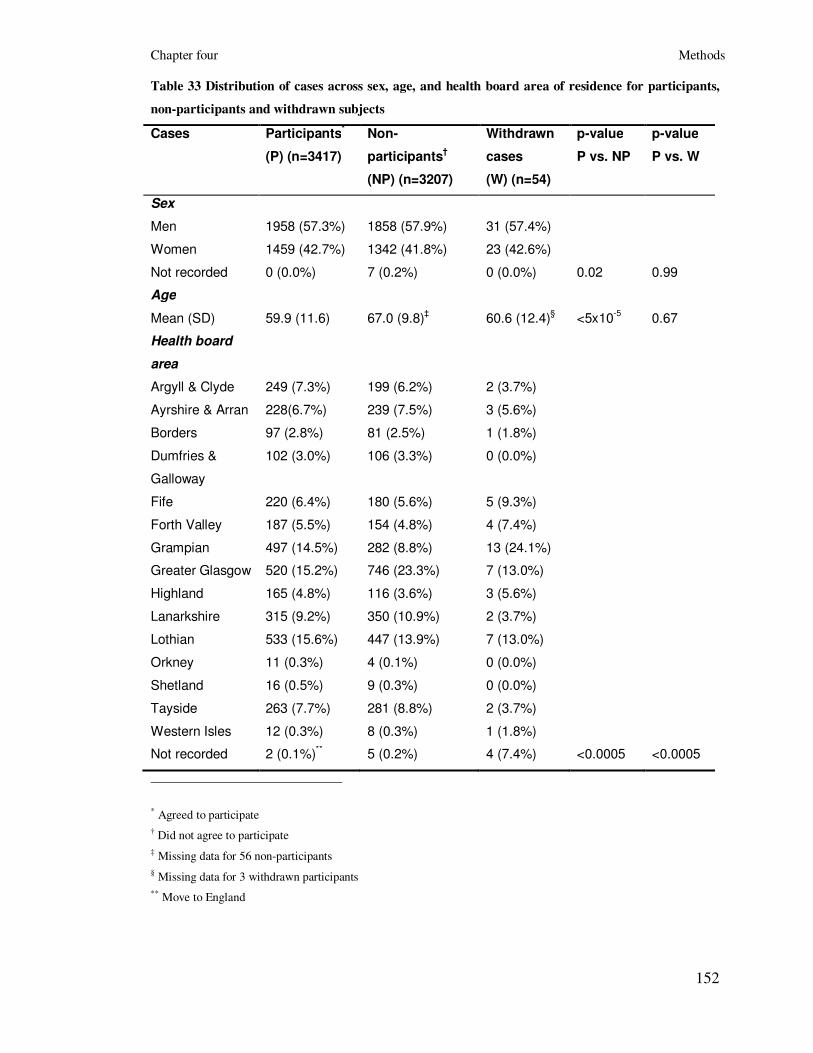
Chapter four Methods
152
Table 33 Distribution of cases across sex, age, and health board area of residence for participants,
non-participants and withdrawn subjects
Cases Participants*
(P) (n=3417)
Non-
participants†
(NP) (n=3207)
Withdrawn
cases
(W) (n=54)
p-value
P vs. NP
p-value
P vs. W
Sex
Men 1958 (57.3%) 1858 (57.9%) 31 (57.4%)
Women 1459 (42.7%) 1342 (41.8%) 23 (42.6%)
Not recorded 0 (0.0%) 7 (0.2%) 0 (0.0%) 0.02 0.99
Age
Mean (SD) 59.9 (11.6) 67.0 (9.8)‡ 60.6 (12.4)
§ <5x10
-5 0.67
Health board
area
Argyll & Clyde 249 (7.3%) 199 (6.2%) 2 (3.7%)
Ayrshire & Arran 228(6.7%) 239 (7.5%) 3 (5.6%)
Borders 97 (2.8%) 81 (2.5%) 1 (1.8%)
Dumfries &
Galloway
102 (3.0%) 106 (3.3%) 0 (0.0%)
Fife 220 (6.4%) 180 (5.6%) 5 (9.3%)
Forth Valley 187 (5.5%) 154 (4.8%) 4 (7.4%)
Grampian 497 (14.5%) 282 (8.8%) 13 (24.1%)
Greater Glasgow 520 (15.2%) 746 (23.3%) 7 (13.0%)
Highland 165 (4.8%) 116 (3.6%) 3 (5.6%)
Lanarkshire 315 (9.2%) 350 (10.9%) 2 (3.7%)
Lothian 533 (15.6%) 447 (13.9%) 7 (13.0%)
Orkney 11 (0.3%) 4 (0.1%) 0 (0.0%)
Shetland 16 (0.5%) 9 (0.3%) 0 (0.0%)
Tayside 263 (7.7%) 281 (8.8%) 2 (3.7%)
Western Isles 12 (0.3%) 8 (0.3%) 1 (1.8%)
Not recorded 2 (0.1%)** 5 (0.2%) 4 (7.4%) <0.0005 <0.0005
* Agreed to participate
† Did not agree to participate
‡ Missing data for 56 non-participants
§ Missing data for 3 withdrawn participants
** Move to England

Chapter four Methods
153
Table 34 Reason of no response for non-participants
Type of “no” response Cases (non-participants: n=3207)
Unable to take part* 1276 (39.8%)
Did not want to take part 1877 (58.5%)
Not recorded 54 (1.7%)
* Reasons for being unable to take part: deceased (n=377), exact reason not recorded (n=289), patient too ill to
participate (n=276), advanced disease (n=52), unaware of diagnosis (n=33), dementia (n=29), learning difficulties
(n=28), not appropriate (n=26), limited understanding (n=18), consultant not agreed for patient to be approached
(n=18), patient confused (n=18), mental health problems (n=17), not approached (n=8), unable to give informed
consent (n=7), communication problems (n=7), Alzheimer’s disease/ Parkinson’s disease/ Schizophrenia (n=7),
unconfirmed diagnosis (n=6), patient too anxious (n=6), memory problems (n=5), patient did not speak English (n=5),
patient depressed (n=3), patient did not live in Scotland (n=3), other reason (n=38).
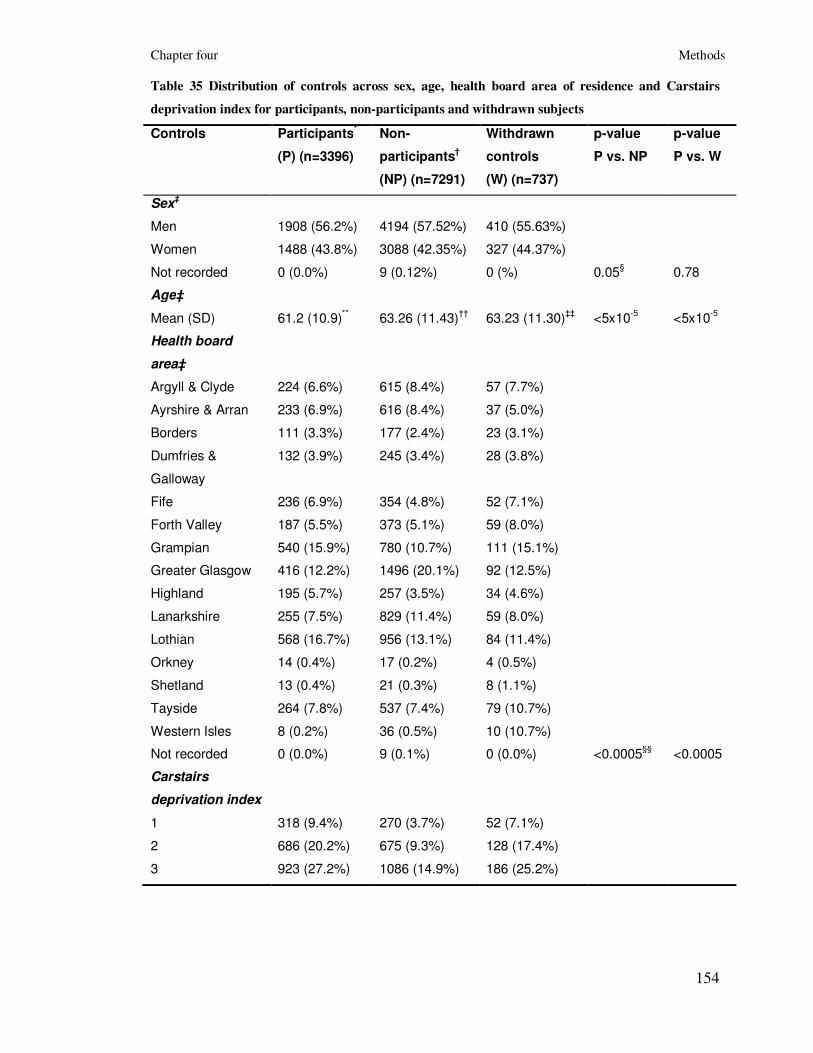
Chapter four Methods
154
Table 35 Distribution of controls across sex, age, health board area of residence and Carstairs
deprivation index for participants, non-participants and withdrawn subjects
Controls Participants*
(P) (n=3396)
Non-
participants†
(NP) (n=7291)
Withdrawn
controls
(W) (n=737)
p-value
P vs. NP
p-value
P vs. W
Sex‡
Men 1908 (56.2%) 4194 (57.52%) 410 (55.63%)
Women 1488 (43.8%) 3088 (42.35%) 327 (44.37%)
Not recorded 0 (0.0%) 9 (0.12%) 0 (%) 0.05§ 0.78
Age‡
Mean (SD) 61.2 (10.9)** 63.26 (11.43)
†† 63.23 (11.30)
‡‡ <5x10
-5 <5x10
-5
Health board
area‡
Argyll & Clyde 224 (6.6%) 615 (8.4%) 57 (7.7%)
Ayrshire & Arran 233 (6.9%) 616 (8.4%) 37 (5.0%)
Borders 111 (3.3%) 177 (2.4%) 23 (3.1%)
Dumfries &
Galloway
132 (3.9%) 245 (3.4%) 28 (3.8%)
Fife 236 (6.9%) 354 (4.8%) 52 (7.1%)
Forth Valley 187 (5.5%) 373 (5.1%) 59 (8.0%)
Grampian 540 (15.9%) 780 (10.7%) 111 (15.1%)
Greater Glasgow 416 (12.2%) 1496 (20.1%) 92 (12.5%)
Highland 195 (5.7%) 257 (3.5%) 34 (4.6%)
Lanarkshire 255 (7.5%) 829 (11.4%) 59 (8.0%)
Lothian 568 (16.7%) 956 (13.1%) 84 (11.4%)
Orkney 14 (0.4%) 17 (0.2%) 4 (0.5%)
Shetland 13 (0.4%) 21 (0.3%) 8 (1.1%)
Tayside 264 (7.8%) 537 (7.4%) 79 (10.7%)
Western Isles 8 (0.2%) 36 (0.5%) 10 (10.7%)
Not recorded 0 (0.0%) 9 (0.1%) 0 (0.0%) <0.0005§§
<0.0005
Carstairs
deprivation index
1 318 (9.4%) 270 (3.7%) 52 (7.1%)
2 686 (20.2%) 675 (9.3%) 128 (17.4%)
3 923 (27.2%) 1086 (14.9%) 186 (25.2%)

Chapter four Methods
155
4 794 (23.4%) 1310 (18.0%) 183 (24.8%)
5 365 (10.7%) 714 (9.8%) 99 (13.4%)
6 218 (6.4%) 547 (7.5%) 61 (8.3%)
7 92 (2.7%) 341 (4.7%) 28 (3.8%)
Not recorded 0 (0.0%) 2348 (32.2%) 0 (0.0%) <0.0005***
0.01
* Agreed to participate
† Did not agree to participate
‡ Sex, age and Health Board information for non-participants population controls was obtained from the cases the non-
participant population controls were matched to.
§ The chi-square test p-value was 0.17, when we compared men and women distributions (participants versus non-
participants) ignoring the 9 subjects, whose sex was not recorded.
** For 17 participants, age was calculated based on the date that the PSD report was returned to the study office and
for 4 participants age could not be calculated.
†† Age is missing for 9 non-participants population controls.
‡‡ For 467 withdrawn population controls, age was calculated based on the date that the PSD report was returned to
the study office and for 4 withdrawn population controls age could not be calculated.
§§ The chi-square test p-value was <0.0005, when we compared Health Board distributions (participants versus non-
participants) ignoring the 9 subjects, whose health board information was not recorded.
*** The chi-square p-value was <0.0005 when we compared Carstairs Deprivation Index distributions (participants
versus non-participants) ignoring the 2348 subjects, whose post code sector information was either not recorded or
inadequate.

Chapter four Methods
156
4.2.7 Biological materials
Materials collected from case and control subjects comprised blood, from which DNA,
peripheral blood lymphocytes and plasma were prepared and stored in a custom made
facility. In addition, tumour material and matched tumour/ normal material were
collected from cases under 55 years old. Tumour material was also collected from older
cases (>55 years old), but the rate of success was lower than for those >55 years old.
4.2.7.1 DNA preparation, storage and quality assurance
Blood samples were transferred to the academic campus at the Western General Hospital
within 72 hours of sampling. Three aliquots of 10ml of blood were collected from each
subject in two sodium Ethylene Diamine Tetraacetic Acid (EDTA) tubes and one Acid
Citrate Dextrose (ACD) tube. Samples were received centrally, logged and bar-coded in
the Wellcome Trust Millennial Clinical Research Facility (WT-CRF). DNA extraction
was carried out using Nucleon kits. Samples were bar coded for sample tracking and
management. Standard operating procedures appropriate for CPA accreditation were
followed by the laboratory. One EDTA sample was directly extracted to DNA, the other
was stored frozen as a white blood cell pallet in case of extraction failure. Median DNA
yield on samples was 327µg (maximum yield 1197µg). The minimum yield was 50 µg
of DNA since patients were asked to give a further blood sample in event of lower
yields. Quality control procedures included spectrophotometric readings of every sample
(either A260/280 or PicoGreen™), agarose gel electrophoresis of uncut and restriction
enzyme cut DNA from 2% of samples and a control PCR on 1% of samples. Stock DNA
concentration is currently stored at a target concentration of 1 mg/ml.
4.2.7.2 Peripheral Blood Lymphocytes
Peripheral blood lymphocytes processing and cryopreservation was carried out in the
Cytogenetics Service of the South East Scotland Clinical Genetic Service, which is
aligned with the WT-CRF. 10ml of blood in ACD anticoagulant tubes were bar coded.
Peripheral blood lymphocytes were separated from whole blood by centrifugation over
Ficoll-Hypaque. After centrifugation, mononuclear cells were isolated from the interface
of the buffer, washed in media and preserved in FCS/DMSO. After controlled cooling,

Chapter four Methods
157
the cells were stored in liquid nitrogen in two aliquots, if sufficient blood in good
condition was received. If fewer lymphocytes were obtained they were stored in one
aliquot. The mean cell count of project samples was 4.4 x 10⁶ cells (maximum cell count
has been 80 x 106 cells).
4.2.7.3 Plasma
Plasma was prepared by gentle centrifugation of sodium EDTA tubes prior to DNA
extraction. 1500 µl of plasma was stored for each case and control for future proteomic
studies. Plasma samples were all bar-coded and stored at -80ºC.
4.2.7.4 Tumour material
Formalin-fixed, paraffin-embedded tumour and normal material from all colorectal
cancer patients aged <55yrs at diagnosis was collected. In addition, matched tumour/
normal material was stored for cases aged <55yrs.
4.2.8 Phenotype data collected
4.2.8.1 Tumour related parameters, clinical data and treatment
details
Tumour related parameters, clinical data and treatment details were extracted from
medical records by medical students or research nurses trained by the research nurse co-
ordinator. In particular, information on tumour site, histological type, degree of
differentiation, presence of synchronous or metachronous polyps, co-existent
inflammatory bowel disease, Charlson co-morbidity index and types of symptoms before
diagnosis were gained from pathology reports and medical records. In addition details on
surgery procedure, adjuvant chemotherapy, radiotherapy and/ or palliative treatment
were extracted from medical records.
To extract tumour stage details, a Specialist Registrar looked at all the pathology reports.
However pathology reports of some subjects lacked information regarding metastasis
status. For those cases, the Specialist Registrar looked at their Computerised
Tomography (CT) scans (Health boards of: Lothian, Fife) and/ or wrote to the cases
consultant (hospital) doctors and/ or to the cases GP doctors to get the necessary

Chapter four Methods
158
information. Two systems were used to describe the extent of colorectal cancer in the
patient bodies: the Dukes’ and AJCC systems.
4.2.8.2 Personal, demographic and family history data
Ethnicity and ancestry data were recorded for all study participants. Demographic data
were derived directly from participants and NHS clinical notes. Data were also collected
from central NHS data and held by the Information and Statistics Division of the NHS in
Scotland.
In addition, if participants agreed, a three-generation family history was constructed by a
trained research nurse at recruitment time. Each family history then was assessed
according to the risk levels published in the Scottish Executive cancer guidelines for
colorectal cancer.
4.2.9 Self-administered lifestyle and food frequency
questionnaires
Two standard questionnaires (the Lifestyle and Cancer Questionnaire - LCQ and the
Scottish Collaborative Group Food Frequency Questionnaire - SCG-FFQ) were
administered gathering data on use of aspirin/ NSAIDs, reproductive history/ hormonal
factors, occupation, inflammatory bowel disease and on lifestyle characteristics such as
diet, physical activity, tobacco smoking and alcohol intake. These questionnaires
consisted of validated instruments used in other studies (i.e. the physical activity section
was based on a modified version of the standard EPIC questionnaire, the women’s
reproduction section was based on the Million Women Study questionnaire and for
measuring dietary intakes the SCG-FFQ was used, which was validated in Scottish
populations). The reference (exposure) period for both questionnaires was one year prior
recruitment for controls or one year prior to diagnosis for cases.
4.2.9.1 Lifestyle and Cancer Questionnaire
The LCQ was used in order to gather information about the general lifestyle of the
subjects and the questions were referred in a time period of one year before diagnosis
(cases) or recruitment (controls). It consisted of 69 questions grouped in 8 categories
(Medical history, Lifestyle, Physical activity, Height and weight, Medicines, About you,

Chapter four Methods
159
Employment, Women’s health questions) (Table 36: a summarised presentation of the
LCQ; Appendix III; the LCQ). There was an information sheet enclosed with
instructions of how to complete the questionnaire and in the last page of it there was
space to add any comments or concerns.
4.2.9.2 Scottish Collaborative Group Food Frequency
Questionnaire
The FFQ used in this study was the validated SCG-FFQ, Version 6.41, which has been
based on an FFQ extensively used in Scottish populations (269). It has been validated
against 4-day weighed diet records (270;271) and against serum phytoestrogen
concentrations (272). The SCG-FFQ consisted of a list of 150 foods, divided into 20
food groups (Table 37: a summarised presentation of the FFQ; Appendix IV; the SCG-
FFQ). Subjects were asked to describe the amount and frequency of each food on the list
they have eaten a year prior to recruitment. Regarding frequency, subjects were asked to
circle “R” (stands for rarely/ never) for those foods that were eaten either never or less
than once a month. For foods that were eaten once a month or more, subjects were asked
to report the amount of food eaten (counted in measures: 1 up to 5+ measures) and the
number of days per week the food was usually eaten (once a month up to 7 days per
week). In addition the FFQ included a field that the subjects could use to add other foods
that were not listed in the FFQ and that they ate regularly (once a month or more often).
Subjects were also asked to report the type and amount of vitamins, minerals and food
supplements if taken, recent dietary changes and special diets or dietary restrictions. The
last part of the FFQ consisted of general questions about the diet of the subjects
including the amount of meals per day, the times per usual week that had fried or grilled
meat and how well cooked they normally had their fried or grilled meat (lightly, medium
or well browned). An FFQ information sheet that included a colour picture showing
examples of the size of measures was enclosed with the FFQ.

Chapter four Methods
160
Table 36 Lifestyle and Cancer Questionnaire sections and questions
Group Subgroup LCQ Questions
Medical History - 1 – 6
Lifestyle Cigarette smoking 7 – 15
Cigar smoking 16 – 20
Pipe smoking 21 – 25
Physical Activity Occupational Physical Activity 26 – 27
Leisure Physical Activity 28 – 30
Height and Weight - 31 – 32
Medicines Aspirin / Painkillers 33, 35
Stomach medicines/tablets 34, 35
About you Education 36
Ethnic Origin 37
Ancestry 38 – 44
Employment - 45 – 54
Women’s Health Questions Menstrual Periods 55 – 57
Hormone Replacement Therapy 58 – 62
Reproductive History 63 – 65
Hormonal forms of Contraception 66 – 69

Chapter four Methods
161
Table 37 FFQ food groups and other sections
FFQ Section Food group / Other questions
1. a – e Breads
2. a – f Breakfast cereals
3. a – e Milk
4. a – e Cream and yoghurt
5. a – e Cheese
6. a – c Eggs
7. a – l Meats
8. a – l Fish
9. a – j Potatoes, rice and pasta
10. a – s Savoury foods, soups and sauces
11. a – q Vegetables
12. a – j Fruit
13. a – h Puddings and desserts
14. a – i Chocolates, sweets, nuts and crisps
15. a – g Biscuits
16. a – e Cakes
17. a – g Spreads
18. a – m Beverages and soft drinks
19. a – h Alcoholic drinks
20. a – d Other foods and drinks
21. a – d Vitamin, mineral and food supplements
22. a – i Dietary restrictions and special diets
23. a – j Other information

Chapter four Methods
162
4.3 Collection and process of lifestyle and dietary
data
This thesis was based on the analysis of the data collected from the self-administered
environmental exposure questionnaires. In this part of the chapter details about the
collection, storing and process of the lifestyle and dietary data are presented.
Of the 3,417 cases that were enrolled in the study: 291 cases were not asked to complete
the lifestyle and food frequency questionnaires (participants recruited before September
of 2001; 8.5%), 508 cases refused to complete the questionnaires (14.9%), 2,244 cases
returned both questionnaires (65.7%), 64 cases returned just one questionnaire (1.9%; 52
cases returned only the LCQ and 12 cases returned only the FFQ) and 310 cases did not
return any of the questionnaires (9.1%) (Table 38).
Of the 3,396 controls that were enrolled in the study: 26 controls were not asked to
complete the lifestyle and food frequency questionnaires (0.8%), 33 controls refused to
complete the questionnaires (1.0%), 2,850 controls returned both questionnaires
(83.9%), 124 controls returned just one questionnaire (3.6%; 105 controls returned only
the LCQ and 19 controls returned only the FFQ) and 363 controls did not return any of
the questionnaires (10.7%) (Table 39). Distribution of cases and controls across sex, age,
health board area of residence and deprivation score was examined according to the
questionnaire status (not asked, refused, not returned, returned both, returned one)
(Table 38, Table 39).

Chapter four Methods
163
Table 38 Distribution of cases across sex, age, health board area of residence and deprivation examined according to the questionnaire status
Cases Not asked
Refused
Not returned
Returned-
both
Returned-
one
Not asked/
refused/
not returned
Returned
(one or both)
p-value
(returned
vs. all other)
Number 291 508 310 2244 64 1109 2308
Sex
Males 169 (58.1%) 312 (61.4%) 162 (52.3%) 1277 (56.9%) 38 (59.4%) 643 (58.0%) 1315 (57.0%)
Females 122 (41.9%) 196 (38.6%) 148 (47.7%) 967 (43.1%) 26 (40.6%) 466 (42.0%) 993 (43.0%) 0.58
Age 48.1 (7.1) 62.7 (12.0) 49.2 (6.0) 62.2 (10.8) 61.59 (11.4) 55.1 (11.8) 62.2 (10.8) <5x10⁻⁵
Health board
area
Argyll & Clyde 23 (7.9%) 36 (7.1%) 30 (9.7%) 154 (6.9%) 6 (9.4%) 89 (8.0%) 160 (6.9%)
Ayrshire & Arran 20 (6.9%) 29 (5.7%) 23 (7.4%) 155 (6.9%) 1 (1.6%) 72 (6.5%) 156 (6.8%)
Borders 2 (0.7%) 6 (1.2%) 6 (1.9%) 81 (3.6%) 2 (3.1%) 14 (1.3%) 83 (3.6%)
Dumfries &
Galloway
9 (3.1%) 12 (2.4%) 6 (1.9%) 72 (3.2%) 3 (4.7%) 27 (2.4%) 75 (3.2%)
Fife 17 (5.8%) 27 (5.3%) 29 (9.3%) 142 (6.3%) 5 (7.8%) 73 (6.6%) 147 (6.4%)
Forth Valley 13 (4.5%) 33 (6.5%) 11 (3.5%) 128 (5.7%) 2 (3.1%) 57 (5.1%) 130 (5.6%)
Grampian 34 (11.7%) 60 (11.8%) 40 (12.9%) 351 (15.6%) 12 (18.7%) 134 (12.1%) 363 (15.7%)
Greater Glasgow 47 (16.1%) 121 (23.8%) 33 (10.6%) 311 (13.9%) 8 (12.5%) 201 (18.1%) 319 (13.8%)
Highland 17 (5.8%) 29 (5.7%) 13 (4.2%) 100 (4.5%) 6 (9.4%) 59 (5.3%) 106 (4.6%)
Lanarkshire 29 (10.0%) 72 (14.2%) 31 (10.0%) 179 (8.0%) 4 (6.2%) 132 (11.9%) 183 (7.9%)
Lothian 47 (16.1%) 63 (12.4%) 60 (19.3%) 354 (15.8%) 9 (14.1%) 170 (15.3%) 363 (15.7%)
Orkney 1 (0.3%) 1 (0.2%) 1 (0.3%) 8 (0.4%) 0 (0.0%) 3 (0.3%) 8 (0.3%)
Shetland 6 (2.1%) 0 (0.0%) 2 (0.6%) 7 (0.3%) 1 (1.6%) 8 (0.7%) 8 (0.3%)
Tayside 23 (7.9%) 17 (3.3%) 22 (7.1%) 196 (8.7%) 5 (7.8%) 62 (5.6%) 201 (8.7%)
Western Isles 1 (0.3%) 2 (0.4%) 3 (1.0%) 6 (0.3%) 0 (0.0%) 6 (0.5%) 6 (0.3%)

Chapter four Methods
164
Not recorded 2 (0.7%) 0 (0.0%) 0 (0.0%) 0 (0.0%) 0 (0.0%) 2 (0.2%) 0 (0.0%) <0.0005
Deprivation
score
1 27 (9.3%) 30 (5.9%) 22 (7.1%) 206 (9.2%) 2 (3.1%) 79 (7.1%) 208 (9.0%)
2 32 (11.0%) 84 (16.5%) 65 (21.0%) 463 (20.6%) 13 (20.3%) 181 (16.3%) 476 (20.6%)
3 73 (25.1%) 105 (20.7%) 85 (27.4%) 578 (25.8%) 19 (29.7%) 263 (23.7%) 597 (25.9%)
4 72 (24.7%) 141 (27.7%) 81 (26.1%) 523 (23.3%) 11 (17.2%) 294 (26.5%) 534 (23.1%)
5 33 (11.3%) 61 (12.0%) 34 (11.0%) 247 (11.0%) 14 (21.9%) 128 (11.5%) 261 (11.3%)
6 30 (10.3%) 52 (10.2%) 11 (3.5%) 159 (7.1%) 3 (4.7%) 93 (8.4%) 162 (7.0%)
7 22 (7.6%) 35 (6.9%) 12 (3.9%) 66 (2.9%) 2 (3.1%) 69 (6.2%) 68 (2.9%)
Not recorded 2 (0.7%) 0 (0.0%) 0 (0.0%) 2 (0.1%) 0 (0.0%) 2 (0.2%) 2 (0.1%) <0.0005
Table 39 Distribution of controls across sex, age, health board area of residence and deprivation examined according to the questionnaire status
Controls Not asked
Refused Not returned
Returned-
both
Returned-
one
Not asked/
refused/
not returned
Returned
(one or both)
p-value
returned
vs. all other)
Number 26 33 363 2850 124 422 2974
Sex
Males 17 (65.4%) 20 (60.6%) 186 (51.2%) 1617 (56.7%) 68 (54.8%) 223 (52.8%) 1685 (56.7%)
Females 9 (34.6%) 13 (39.4%) 177 (48.8%) 1233 (43.3%) 56 (45.2%) 199 (47.2%) 1289 (43.3%) 0.14
Age 50.5 (5.5) 67.3 (9.4) 51.0 (7.9) 62.4 (10.5) 61.4 (11.6) 52.3 (9.0) 62.4 (10.6) <5x10⁻⁵
Health board
area
Argyll & Clyde 2 (7.7%) 1 (3.0%) 31 (8.5%) 182 (6.4%) 8 (6.4%) 34 (8.1%) 190 (6.4%)
Ayrshire & Arran 5 (19.2%) 1 (3.0%) 25 (6.9%) 197 (6.9%) 5 (4.0%) 31 (7.3%) 202 (6.8%)
Borders 1 (3.8%) 1 (3.0%) 11 (3.0%) 93 (3.3%) 5 (4.0%) 13 (3.1%) 98 (3.3%)

Chapter four Methods
165
Dumfries &
Galloway
2 (7.7%) 0 (0.0%) 9 (2.5%) 114 (4.0%) 7 (5.6%) 11 (2.6%) 121 (4.1%)
Fife 3 (11.5%) 5 (15.1%) 33 (9.1%) 181 (6.3%) 14 (11.3%) 41 (9.7%) 195 (6.6%)
Forth Valley 0 (0.0%) 0 (0.0%) 10 (2.7%) 171 (6.0%) 6 (4.8%) 10 (2.4%) 177 (5.9%)
Grampian 2 (7.7%) 9 (27.3%) 51 (14.0%) 458 (16.1%) 20 (16.1%) 62 (14.7%) 478 (16.1%)
Greater
Glasgow
2 (7.7%) 3 (9.1%) 39 (10.7%) 362 (12.7%) 10 (8.1%) 44 (10.4%) 372 (12.5%)
Highland 1 (3.8%) 2 (6.1%) 26 (7.2%) 159 (5.6%) 7 (5.6%) 29 (6.9%) 166 (5.6%)
Lanarkshire 2 (7.7%) 3 (9.1%) 23 (6.3%) 219 (7.7%) 8 (6.4%) 28 (6.6%) 227 (7.6%)
Lothian 2 (7.7%) 6 (18.2%) 70 (19.3%) 469 (16.5%) 21 (16.9%) 78 (14.5%) 490 (16.5%)
Orkney 0 (0.0%) 1 (3.0%) 0 (0.0%) 13 (0.5%) 0 (0.0%) 1 (0.2%) 13 (0.4%)
Shetland 0 (0.0%) 0 (0.0%) 1 (0.3%) 11 (0.4%) 1 (0.8%) 1 (0.2%) 12 (0.4%)
Tayside 4 (15.4%) 1 (3.0%) 33 (9.1%) 215 (7.5%) 11 (8.9%) 38 (9.0%) 226 (7.6%)
Western Isles 0 (0.0%) 0 (0.0%) 1 (0.3%) 6 (0.2%) 1 (0.8%) 1 (0.2%) 7 (0.2%)
Not recorded 0 (0.0%) 0 (0.0%) 0 (0.0%) 0 (0.0%) 0 (0.0%) 0 (0.0%) 0 (0.0%) 0.05
Deprivation
score
1 3 (11.5%) 2 (6.1%) 38 (10.5%) 263 (9.2%) 12 (9.7%) 43 (10.2%) 275 (9.2%)
2 4 (15.4%) 5 (15.1%) 70 (19.3%) 577 (20.2%) 30 (24.2%) 79 (18.7%) 607 (20.4%)
3 5 (19.2%) 10 (30.3%) 94 (25.9%) 782 (27.4%) 32 (25.8%) 109 (25.8%) 814 (27.4%)
4 8 (30.8%) 9 (27.3%) 82 (22.6%) 666 (23.4%) 29 (23.4%) 99 (23.5%) 695 (23.4%)
5 3 (11.5%) 2 (6.1%) 47 (12.9%) 300 (10.5%) 13 (10.5%) 52 (12.3%) 313 (10.5%)
6 3 (11.5%) 2 (6.1%) 25 (6.9%) 182 (6.4%) 6 (4.8%) 30 (7.1%) 188 (6.3%)
7 0 (0.0%) 3 (9.1%) 7 (1.9%) 80 (2.8%) 2 (1.6%) 10 (2.4%) 82 (2.8%) 0.83

Chapter four Methods
166
4.3.1 Pre-entering (LCQ) or pre-scan (FFQ) review process
A protocol was set up to review the returned questionnaires. In the main database of the
study a field was set up to record the status of the questionnaires (returned: no/ yes).
When the questionnaires returned to the study office, it was recorded in the main
database (returned: yes), the sex of the subject was written at the top of the LCQ and
they were passed to the project co-ordinator (from 01/02/1999 to 15/01/2005) or to the
author (from 16/01/2005 to 31/12/2006) for checking for any blanks, missed questions
or mistakes. If only one questionnaire was returned (either the LCQ or the FFQ) this was
noted on the top of the returned questionnaire and it was recorded in the field of the
main database (returned: yes).
4.3.1.1 Lifestyle and Cancer Questionnaire
If there were any blanks, missed questions or mistakes in the LCQ, then it was sent back
to the subject for corrections and the new corrected version was used. If the
questionnaire sent for corrections was not back within three months then the uncorrected
version was used. The pre-enter review checklist is presented in Box 1. After the pre-
enter review the original or corrected LCQs were entered manually in the Lifestyle and
Cancer database and the hard-copies were stored in filing cabinets according to their
status (cases or population controls) and in numerical order.
4.3.1.2 Food frequency questionnaire
The FFQs pre-scan review was done using the FFQ review checklist (Box 2) to ensure
that the FFQ was complete and ready to be scanned. For any queries regarding the
“Spreads” and “Other Foods” sections the FFQ queries database was developed. In this
database any queries on other foods and odd spreads or fats were stored. With the
guidance of Dr Geraldine McNeill (University of Aberdeen) the “Extra Fats” guidelines
and the “Other Foods” guidelines were developed and the latter queries were answered.
After the pre-scan review the original or corrected FFQs were scanned using a multi-
page scanner and the software scanning package TELEForm. Once the FFQs had been
scanned, the scanning procedure was verified using the TELEForm Verifier. In
particular, it was checked whether the FFQ data had been correctly scanned and read,

Chapter four Methods
167
that open answer questions were correctly identified and that the chosen values for
multiple response answers were correctly recognised. The FFQ data were then
automatically exported and saved to an SPSS file and the hard-copies were stored in
filing cabinets according to their status (cases or controls) and in numerical order.
Box 1: LCQ pre-enter review checklist
Data checks • The whole questionnaire was checked to see if blank.
• If there were any questions, where there were major parts not filled in or two or
more conflicting options had been reported the questionnaire was sent back.
• If there was a need to decide on conflicting answers, the first part was taken as the
correct one.
• If there was more than one dates entered the earliest one was used.
• Physical activity section (Q28):
- The items of this question form a score so if there were any missing parts, the
questionnaire was sent back to the subject.
- If a range instead of an absolute value was given, the average was taken.
• Height and weight (Q31 and Q32a): If a range instead of an absolute value was
given, the average was taken.
• Waist measurement: If no waist measurement was given the clothing size was
asked and the waist measurement was calculated from a clothing guide.
• Medicine section (Q33-Q35):
- If Q33a was YES and nothing ticked at Q33b it meant that participants did not
take any medicines for at least 4 days a week for at least a month.
- Any medicines ticked at Q33b and Q34b were checked that they were listed at
Q35.
- Number of months taken for a medicine was calculated if participants were no
longer taking the medicine and it was left blank if they were still taking it.
• Employment section (Q45-54):
- If this section was completely blank the questionnaire was sent back for
clarification.
- Often self-employed people with no employees said that 0 people worked at their
work, which was corrected to 1-9 employees.
• Female section (Q55-Q69):
- The female part of the LCQ was checked to see whether it was blank for male

Chapter four Methods
168
subjects and completed for female subjects.
- If the whole section was blank (and the questionnaire was filled in by a female
subject) the questionnaire was sent back to the subject
- It was checked that for each birth given in Q64 a record was entered in Q65
Filling of LCQs • After manually entering, the LCQs were stored in filing cabinets according to their
status (cases or population controls) and in numerical order.
Box 2: FFQ pre-scan review checklist
Data checks • The whole questionnaire was checked to see if it was blank.
• For the questions 1 to 18 the following checks were done:
- Number of blank lines: For up to 10 blank lines (both “measures per day” and
“number of days per week” were blank) the questionnaire was not returned for
completion.
- Number of missing “measures per day”: For up to 10 missing “measures per day”
the questionnaire was not returned for completion.
- Number of missing “days per week”: For up to 10 missing “days per week” the
questionnaire was not returned for completion.
- If M (monthly) was circled together with a number of days per week then: if it was
M and 1, 2 or 3 the number was just crossed out. If it was M and 4, 5, 6 or 7 the M
and the number were crossed out and 1 for once a week was circled.
- If R (rarely) was circled together with a number for the “measure per day”, the
number was crossed out leaving the R alone.
- If the subject had circled M plus days or R plus measures all the way through, then
the questionnaire was sent back for clarification.
• In the dietary restrictions section we checked if anything not eaten did not
correspond with the questions 1 to 18 and that all the fields were answered.
Coding • Questions 17.e and 17.g were open-ended questions relating to the spreads, fats
and oil consumed. Codes were entered onto the FFQ according to the type of
spread/ fat/ oil. Queries were entered in the FFQ queries database and were
checked with Dr G McNeill.
Other foods • Section 20 allowed subjects to record foods and drinks that were not included in
the FFQ and that they regularly ate. If the subject had reported any other food we
did as follows:
- We checked if the food could be easily entered in the FFQ and if so we did that by
consulting the Other Food guidance and the FFQ queries database.
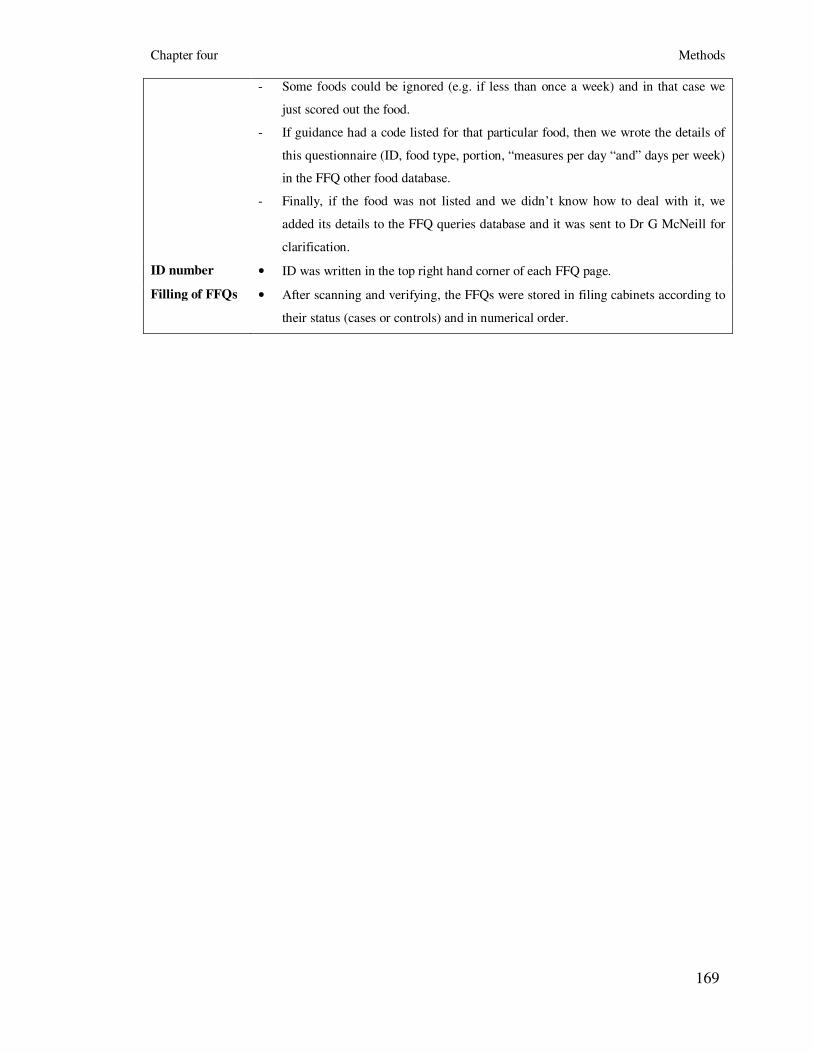
Chapter four Methods
169
- Some foods could be ignored (e.g. if less than once a week) and in that case we
just scored out the food.
- If guidance had a code listed for that particular food, then we wrote the details of
this questionnaire (ID, food type, portion, “measures per day “and” days per week)
in the FFQ other food database.
- Finally, if the food was not listed and we didn’t know how to deal with it, we
added its details to the FFQ queries database and it was sent to Dr G McNeill for
clarification.
ID number • ID was written in the top right hand corner of each FFQ page.
Filling of FFQs • After scanning and verifying, the FFQs were stored in filing cabinets according to
their status (cases or controls) and in numerical order.

Chapter four Methods
170
4.3.2 Quality checking of data entry
A quality checking protocol and quality checking databases were developed for all data
entry of the environmental questionnaires and it was applied on a regular basis by the
project co-ordinator (from 01/02/1999 to 15/01/2005) or by the author (from 16/01/2005
to 31/12/2006). This generally involved looking at 1 in 20 questionnaires and checking
that they had been entered correctly. The quality checking procedure was recorded on a
separate sheet for each database, noting the number of errors. Any errors found were
corrected on the original databases.
4.3.3 Coding of the LCQ variables
2,296 and 2,955 LCQs were received from cases and controls respectively. Six cases
(0.3%) and nine controls (0.3%) sent blank LCQs and could not be used in the analysis.
In addition 13 controls (0.4%) were removed. These controls were given the same IDs
with 13 withdrawn controls. However, it was not possible to distinguish whether the
questionnaires were from the newly recruited or from the withdrawn controls and
therefore they were not included in the analysis. The final number of LCQs that could be
analysed was 2,290 for the cases and 2,933 for the controls. After the entering procedure
of the data and the quality checking of it, the LCQ data were processed to form the
variables used in the analysis (Table 40).
Table 40 List of variables coded from the LCQ
Category Variables
Smoking Smoking Status; Level of smoking; Duration of smoking; Pack-years of
smoking (see Table 41)
Physical Activity Occupational Physical Activity; Leisure time Physical Activity
(recreational, household and stair climbing variables); Total Physical
Activity index (see Table 45); Cambridge Physical Activity index (see
Table 46); Limited Physical Activity (see Table 47)
Medicines Mini-aspirin intake; Non steroidal anti-inflammatory drugs intake;
Painkillers intake; Stomach tablets intake; Dose of intake (for mini
aspirin); Duration of intake (see Table 48)
Women’s Health Hormone replacement intake; Hormonal forms of contraceptives (see
Table 49)

Chapter four Methods
171
4.3.3.1 Smoking variables
The smoking variables were coded using information from the lifestyle section of the
LCQ (questions 7 to 25). Smoking status variable was coded using information from
questions 7, 9, 16, 18, 21 and 23. Subjects that had never smoked regularly cigarettes (at
least one per day), cigars (at least one per month) or a pipe were considered as “never
smokers”. Subjects that had used to smoke regularly cigarettes, cigars or a pipe, but
quitted at least one year prior to recruitment were considered as “former smokers”.
Subjects that smoked regularly cigarettes, cigars or a pipe were considered as “current
smokers” (Table 41).
The other three smoking variables (level, duration and pack-years of smoking) were
based only on the smoking cigarettes questions (questions 7 to 15) and they were
available for “current” and “former” smokers (Table 41). “Level of smoking” variable
was about the quantity of cigarettes smoked per day and “Duration of smoking” variable
was about the total years of smoking. “Pack-years of smoking” variable was coded
combining information for both the quantity and duration of smoking using the
following formula:
Pack-years of smoking = (n x y) / 20,
Where n was the number of cigarettes smoked per day and y was the number of years of
smoking (Table 41).
Table 41 Smoking variables
Smoking variables
All subjects Cases (n=2290) Controls (n=2933)
Smoking Status
Never 965 (42.1%) 1261 (43.0%)
Former 884 (38.6%) 1110 (37.8%)
Current 394 (17.1%) 537 (18.3%)
Missing 47 (2.0%) 25 (0.8%)
Current smokers Cases (n=342) Controls (n=467)
Level of smoking
0-10 43 (12.6%) 78 (16.7%)

Chapter four Methods
172
10-20 127 (37.1%) 182 (39.0%)
≥ 20 163 (47.7%) 203 (43.5%)
missing 9 (2.6%) 4 (0.9%)
Duration of smoking
0-15 7 (2.0%) 6 (1.3%)
15-30 42 (12.3%) 57 (12.2%)
≥ 30 291 (85.1%) 404 (86.5%)
missing 2 (0.6%) 0 (0.0%)
Pack-years of smoking
0-10 25 (7.3%) 39 (8.3%)
10-20 46 (13.4%) 77 (16.5%)
≥ 20 261 (76.3%) 347 (74.3%)
missing 10 (2.9%) 4 (0.9%)
Former smokers Cases (n=900) Controls (n=1127)
Level of smoking
0-10 116 (12.9%) 165 (14.6%)
10-20 308 (34.2%) 385 (34.2%)
≥ 20 458 (50.9%) 563 (50.0%)
missing 18 (2.0%) 14 (1.2%)
Duration of smoking
0-15 184 (20.4%) 294 (26.1%)
15-30 339 (37.7%) 400 (35.5%)
≥ 30 350 (38.9%) 411 (36.5%)
missing 27 (3.0%) 22 (36.5%)
Pack-years of smoking
0-10 221 (24.6%) 315 (27.9%)
10-20 180 (20.0%) 260 (23.1%)
≥ 20 465 (51.7%) 523 (46.4%)
missing 33 (3.7%) 29 (2.6%)

Chapter four Methods
173
4.3.3.2 Physical activity variables
The physical activity part of the LCQ was the short version of the EPIC core physical
activity questionnaire and we used their protocol for coding the variables. The four EPIC
physical activity questions referred to activity for the year prior to diagnosis or
recruitment. The first question was about the occupational physical activity and it had
two parts: 1) a binary part asking for the occupation status a year prior to the
recruitment (q26) and 2) a four-points, mutually-exclusive, ordered part concerning the
intensity of the physical activity at work (q27). The way that the questionnaire was
designed only the participants that were currently working, were asked about the type of
their job. Therefore, participants that were either unemployed or retired (for at least one
year prior to recruitment) did not report their physical activity at work.
The second question (recreational physical activities) asked about the amount of time
spent (in hours per week) in each of the following activities: walking (separately for
summer and winter), cycling (separately for summer and winter), gardening (separately
for summer and winter), do-it-yourself activities, physical exercise (separately for
summer and winter) and housework (q28). The third question asked whether any of the
activities in question 28 were engaged in such that it caused sweating or faster heartbeat
and if so, for how many hours during a typical week (q29). Finally, the fourth question
asked about the amount of flights of stairs climbed per day (q30).
To be able to assess the impact of the physical activity as a whole, it was necessary to
combine occupational data with the recreational, household, vigorous activity and flights
of stair climbing data. We did that by using two different indexes; the Total Physical
Activity index (developed by the EPIC study group) and the Cambridge Physical
Activity index (developed by the Cambridge group of the EPIC study). The first index is
a cross tabulation table of the occupational physical activity and a summary variable of
the household, recreational and stair climbing physical activities. The second index
combines the occupational physical activity with two measurements of the recreational
physical activity: cycling and physical exercise. In addition, we applied a limited
physical activity measurement taking into account only two recreational physical
activities.
Chapter four Methods
174
Occupational physical activity
To assess the physical activity at work a six-level categorical variable was created
(“Occupational physical activity”): 1) sedentary occupation, 2) standing occupation, 3)
manual work, 4) heavy manual work, 5) unemployed (included participants that reported
not to have done any type of work a year prior to recruitment), 6) missing (Table 42). A
limitation of the occupational part of the physical activity questionnaire was that the
retired participants were misclassified as unemployed and their occupational physical
activity was not reported. Therefore 48% of the cases and 47% of the controls were
classified as unemployed (Table 42).
Leisure time physical activity
Regarding the leisure time physical activity 12 variables were available: 1) Walking in
summer (hours/week), 2) walking in winter (hours/week), 3) cycling in summer
(hours/week), 4) cycling in winter (hours/week), 5) gardening in summer (hours/week),
6) gardening in winter (hours/week), 7) doing sports in summer (hours/week), 8) doing
sports in winter (hours/week), 9) housework (hours/week), 10) Do-It-Yourself (DIY)
activities (hours/week), 11) engaging in vigorous activities (hours/week) and 12) number
of flights of stairs climbed per day. Reasonable maximum gender-specific cut-off points
were set for each activity and values above those maxima were deleted (Table 43).
To estimate the intensity of the leisure time physical activity, the hours per week of each
activity were multiplied with a specific metabolic equivalent (MET) value. A MET is
defined as the ratio of the metabolic rate for a specific activity compared to the resting
metabolic rate. The MET values used were abstracted from the Compendium of Physical
Activities (273) and were: 3.0 for walking, 6.0 for cycling, 4.0 for gardening, 6.0 for
sports, 4.5 for DIY activities, 3.0 for housework and 9.0 for vigorous activities. To
convert the flights of stairs into a MET-hour/week variable we used the following
formula (taken from the EPIC protocol):
20 steps/flight * 1min/72 steps * 1hr/60min * #flights/day * 8 METS * 7 days/week

Chapter four Methods
175
Means for all those variables that had been reported separately for summer and winter
were created and finally by adding all the METS-hours/week variables of the leisure
time, the summary variable “Leisure time physical activity” was created (Table 44).
Total Physical Activity index was the sum of “Occupational activity” and “Leisure time
physical activity” (Table 45). Cambridge Physical Activity index was the sum of
“Occupational activity” and two recreational physical activities (cycling and doing
sports) (Table 46). Finally, for the third measurement of the physical activity only the
“cycling” and “doing sports” recreational physical activities were used and the
“Occupational activity” was not included. In Table 47 the distribution of the study
participants according to the three different physical activity measurements is presented.
Table 42 Occupational physical activity
Occupational physical activity Cases (n=2290) Controls (n=2933)
Sedentary occupation 454 (19.8%) 625 (21.3%)
Standing occupation 350 (15.3%) 462 (15.7%)
Manual work 266 (11.6%) 351 (12.0%)
Heavy manual work 83 (3.6%) 72 (2.4%)
Unemployed (including retired) 1103 (48.2%) 1389 (47.4%)
Missing 34 (1.5%) 34 (1.2%)
Table 43 Maximum values for recreational physical activities, stair climbing and hours of vigorous
physical activity
Leisure
physical activity
(hours per week)
Men Women Subjects
with missing
data (%)
Subjects with
values above
cut off point (%)
median
(IQ range)
Cut off
point
median
(IQ range)
Cut off
point
Cases (n=2290)
Walking- summer 9 (4-16) 55 10 (5-15) 55 49 (2.1%) 38 (1.7%)
Walking- winter 7 (3-12) 50 7 (4-12) 50 56 (2.4%) 28 (1.2%)
Cycling- summer 0 (0-0) 20 0 (0-0) 20 146 (6.4%) 0 (0.0%)
Cycling- winter 0 (0-0) 15 0 (0-0) 15 157 (6.8%) 1 (0.0%)
Gardening- summer 4 (1-8) 35 3 (0-7) 30 58 (2.5%) 18 (0.8%)
Gardening- winter 0 (0-2) 30 0 (0-1) 25 97 (4.2%) 3 (0.1%)
Doing sports- summer 0 (0-2) 30 0 (0-2) 30 100 (4.4%) 2 (0.1%)
Doing sports- winter 0 (0-2) 25 0 (0-2) 25 108 (4.7%) 2 (0.1%)
Housework 3 (0-7) 30 15 (10-25) 70 65 (2.8%) 23 (1.0%)

Chapter four Methods
176
DIY activities 2 (0-4) 30 0 (0-1) 30 120 (5.2%) 10 (0.4%)
Flights of stairs 6 (2-10) 50 5 (1-10) 50 66 (2.9%) 22 (1.0%)
Vigorous activities 4 (2-10) 40 4 (2-8) 40 50 (2.2%) 11 (0.5%)
Controls (n=2933)
Walking- summer 10 (5-15) 55 8 (4-14) 55 41 (1.4%) 33 (1.1%)
Walking- winter 7 (3-12) 50 6 (3-12) 50 48 (1.6%) 24 (0.8%)
Cycling- summer 0 (0-0) 20 0 (0-0) 20 60 (2.0%) 2 (0.1%)
Cycling- winter 0 (0-0) 15 0 (0-0) 15 80 (2.7%) 0 (0.0%)
Gardening- summer 3 (1-8) 35 3 (0-7) 30 15 (0.5%) 23 (0. 8%)
Gardening- winter 0 (0-2) 30 0 (0-1) 25 48 (1.6%) 3 (0.1%)
Doing sports- summer 0 (0-2) 30 0 (0-3) 30 42 (1.4%) 5 (0.2%)
Doing sports- winter 0 (0-2) 25 0 (0-2) 25 58 (2.0%) 11 (0.4%)
Housework 3 (1-8) 30 15 (8-25) 70 37 (1.3%) 39 (1.3%)
DIY activities 2 (0-4) 30 0 (0-1) 30 58 (2.0%) 18 (0.6%)
Flights of stairs 6 (1-10) 50 5 (1-10) 50 49 (1.7%) 44 (1.5%)
Vigorous activities 4 (2-8) 40 4 (2-7) 40 58 (2.0%) 12 (0.4%)
Table 44 Leisure time physical activity
Leisure time physical activity
(Met-hours/week)
Cases (n=2290) Controls (n=2933)
≤61.30 498 (21.7%) 617 (21.0%)
61.30 to 101.59 460 (20.1%) 656 (22.4%)
101.59 to 159.89 474 (20.7%) 636 (21.7%)
>159.89 477 (20.8%) 636 (21.7%)
Missing 381 (16.6%) 388 (13.2%)
Table 45 Total Physical Activity Index (according to the reported occupational, recreational,
household vigorous and stair climbing activities)
Occupational
activity Leisure time physical activity (Met-hours/week)
Low
(≤61.30)
Medium
(61.30 to 101.57)
High
(101.57 to 159.89)
Very high
(>159.89)
Sedentary Inactive Inactive Moderately inactive Moderately active
Standing Moderately inactive Moderately inactive Moderately active Active
Manual Moderately active Moderately active Active Active
Heavy manual Moderately active Moderately active Active Active
Unemployed Moderately inactive Moderately inactive Moderately active Moderately active
Unknown/ Missing Inactive Moderately inactive Moderately inactive Moderately active

Chapter four Methods
177
Table 46 Cambridge Physical Activity Index (according to the reported occupational physical
activity and two recreational physical activities: cycling and doing sports)
Occupational
activity Cycling and doing sports (hours/week)
Low (0) Medium (0 to 3.5) High (3.5 to 7) Very high (≥7)
Sedentary Inactive Moderately inactive Moderately active Active
Standing Moderately inactive Moderately active Active Active
Manual Moderately active Active Active Active
Heavy manual Active Active Active Active
Table 47 Distribution of study participants according to the Total Physical Activity Index, the
Cambridge Physical Activity Index and the limited physical activity measurement
Physical activity Cases (n=2290) Controls (n=2933)
Total Physical Activity Index
Inactive 267 (11.7%) 344 (11.7%)
Moderately inactive 696 (30.4%) 928 (31.6%)
Moderately active 695 (30.3%) 963 (32.8%)
Active 251 (11.0%) 310 (10.6%)
Missing 381 (16.6%) 388 (13.2%)
Cambridge Physical Activity Index
Inactive 220 (9.6%) 259 (8.8%)
Moderately inactive 295 (12.9%) 436 (14.9%)
Moderately active 295 (12.9%) 419 (14.3%)
Active 287 (12.5%) 348 (11.9%)
Missing 1193 (52.1%) 1471 (50.1%)
Limited physical activity measurement
(hours/ week of cycling and sports)
0 hours/week 1233 (53.8%) 1540 (52.5%)
0-3.5 hours/week 518 (22.6%) 727 (24.8%)
3.5-7 hours/week 216 (9.4%) 356 (12.1%)
>7 hours/week 145 (6.3%) 198 (6.7%)
missing 178 (7.8%) 112 (3.8%)

Chapter four Methods
178
4.3.3.3 Consumption of analgesics (including aspirin and NSAIDs)
Information on the use of mini aspirin, NSAIDs and painkillers was ascertained by
asking participants the following questions: "Up until a year ago, had you ever taken
aspirin or other painkillers?" (q33a) and “Up until a year ago, had you ever taken any of
the following medicines or tablets for at least 4 days per week for at least one month?”
(q33b). In particular, subjects were asked to give information for the following
medicines or tablets: mini-dose aspirin (75mg), normal-dose aspirin (325mg),
aceclofenac, diclofenac sodium, diclofenac sodium with misoprostol, etodolac,
ibuprofen, ibuprofen + codeine phosphate, indomethacin, mefenamic acid, meloxicam,
nabumetone, naproxen, piroxicam, rofecoxib and any other NSAIDs or painkillers that
were not included in the list. Individuals who reported regular drug use (for at least 4
days per week for at least one month) were asked to give further information regarding
the started taking date, the total number of months taken and the number of days per
week taken (q35). Medicine information was available for 2,279 cases (99.5%) and
2,911 (99.2%) controls and was entered in a separate Access database (Drugs database).
In Table 48 the distribution of study participants according to their medicine intake is
shown.
Table 48 Distribution of study participants according to intake of medicines
Categories Cases (n=2290) Controls (n=2933)
No* 1602 (70.0%) 1854 (63.2%)
Mini aspirin† 354 (15.5%) 527 (18.0%)
Normal aspirin‡ 16 (0.7%) 19 (0.6%)
NSAIDs§ 241 (10.5%) 385 (13.1%)
NSAIDs and mini aspirin** 53 (2.3%) 115 (3.9%)
NSAIDs and normal aspirin††
13 (0.6%) 11 (0.4%)
Missing 11 (0.5%) 22 (0.7%)
* Subjects with no intake of mini aspirin, normal aspirin and other NSAID drugs
† Subjects that only take mini aspirin (excluding subjects that additionally take any other NSAIDs)
‡ Subjects that only take normal aspirin (excluding subjects that additionally take any other NSAIDs)
§ Subjects that only take NSAIDs (excluding subjects that additionally take mini aspirin)
** Subjects that take both mini aspirin and other NSAIDs
†† Subjects that take both normal aspirin and other NSAIDs

Chapter four Methods
179
4.3.3.4 Women’s health variables
Female information was ascertained from the women’s health part of the LCQ
(questions 55 to 69). 2,259 female participants completed a LCQ and 2,255 of them
completed the female section of it (99.8%). We mainly used information regarding the
menstrual, hormonal replacement therapy (HRT) and oral contraception intake status.
The distribution of female cases and controls for these variables is shown in Table 49.
Table 49 Distribution of female study participants along the women’s health part questions
Women’s health part Cases (n=987) Controls (n=1272)
Menstrual status
Post-menopausal 751 (76.10%) 961 (75.5%)
Pre- / peri-menopausal 224 (22.7%) 292 (23.0%)
Missing 12 (1.2%) 19 (1.5%)
Hormonal replacement therapy
Ever had 240 (24.3%) 421 (33.1%)
Never had 731 (74.1%) 840 (66.0%)
Missing 16 (1.6%) 11 (0.9%)
Hormonal replacement therapy (for the subjects
that reported to have had HRT)
Were on a year prior to recruitment 108 190
Were not on a year prior to recruitment 128 230
Missing 4 1
Oral contraception
Ever used 404 (40.9%) 586 (46.1%)
Never used 556 (56.3%) 659 (51.8%)
Don’t remember 4 (0.4%) 3 (0.2%)
Missing 23 (2.3%) 24 (1.9%)

Chapter four Methods
180
4.3.3.5 Body Mass Index
Body Mass Index (BMI) was calculated using information from questions 31 and 32 and
by applying the following formula:
BMI = weight (in kilograms) / height2 (in metres)
Height information was available for 2,272 cases (99.2%) and 2,918 controls (99.5%).
Weight information was available for 2,265 cases (98.9%) and 2,899 controls (98.8%).
Two cases and one control were further removed due to reporting extreme values of
either height (3.39 and 0.58 metres) or weight (886.2 kilos). In addition subjects that had
either missing height or missing weight data could not be included in the BMI
calculation. Finally, BMI was calculated for 2,257 cases (98.6%) and 2,894 controls
(98.7%). BMI categories were selected according to WHO recommendations: under-
weight (<18.5), average (18.5 – 24.99), over-weight (25-30), and obese (≥ 30) and the
distributions of cases and controls are shown in Table 50.
Table 50 Distribution of study participants in BMI categories
BMI (kg/m2) Cases (n=2290) Controls (n=2933)
Mean (SD) 26.7 (4.4) 26.7 (4.6)
BMI categories
18.5 – 24.99 (normal weight) 856 (37.4%) 1056 (36.0%)
<18.5 (under-weight) 24 (1.0%) 42 (1.4%)
25-30 (over-weight) 949 (41.4%) 1240 (42.3%)
≥ 30 (obese) 428 (18.7%) 556 (19.0%)
Missing 33 (1.4%) 39 (1.3%)

Chapter four Methods
181
4.3.4 Coding of the FFQ variables
2,256 and 2,851 FFQs were received from cases and controls respectively.
Questionnaires that had blank values and/or blank lines were processed as described in
the missing values protocol (Box 3). 241 questionnaires did not fulfil the missing values
criteria (183 from cases (8.1%) and 58 from controls (2.0%)) and therefore 2,073 cases
and 2,793 controls had valid FFQs for further analysis. After elaborating the FFQ data,
two types of results were obtained: 1) nutrient and mineral intakes and 2) food item and
food group intakes.
4.3.4.1 Nutrient intake calculations
Intakes of dietary energy, macro- and micro-nutrients were calculated using UK
National Nutrient Databank, based on “McCance and Widdowson’s, The Composition
of Foods (5th edition)” and related supplements. Flavonoid data for the subgroups of
flavones, flavonols, flavan3ols, procyanidins and flavanones and also for the individual
flavonoid compounds quercetin, kaempferol, myricetin, apigenin, luteolin, catechin,
epicatechin, epigallocatechin, epicatechin-3 gallate, epigallocatechin-3 gallate,
gallocatechin, naringenin and hesperetin were obtained from a nutrient database for
flavonoids developed by Kyle & Duthie (274). Phytoestrogen values were derived from
a database developed by Ritchie (275). Finally, specific fatty acid data (including total
FAs, SFAs, MUFAs, PUFAs, ω6PUFAs, ω3PUFAs, tFAs and tMUFAs, palmitic acid,
stearic acid, oleic acid, linoleic acid, γ-linolenic acid, arachidonic acid, α-linolenic acid,
EPA and DHA) were obtained from both the UK food composition tables (McCance and
Widdowson’s The Composition of Foods, 6th summary edition) and the FOODBASE
database (London, Institute of Brain Chemistry), a nutrient database for fatty acids.
Although FOODBASE database contained some errors, all values were manually
checked and corrected from the team of the University of Aberdeen.
Fixed ascii files (DAT files) were created from the saved SPSS scanned FFQs and sent
to the University of Aberdeen for nutrient calculation. In University of Aberdeen, data
were stored in an SQL Server database and then a programme written in MS Access
(2000) was used to access and prepare the data. The nutrient analysis was performed
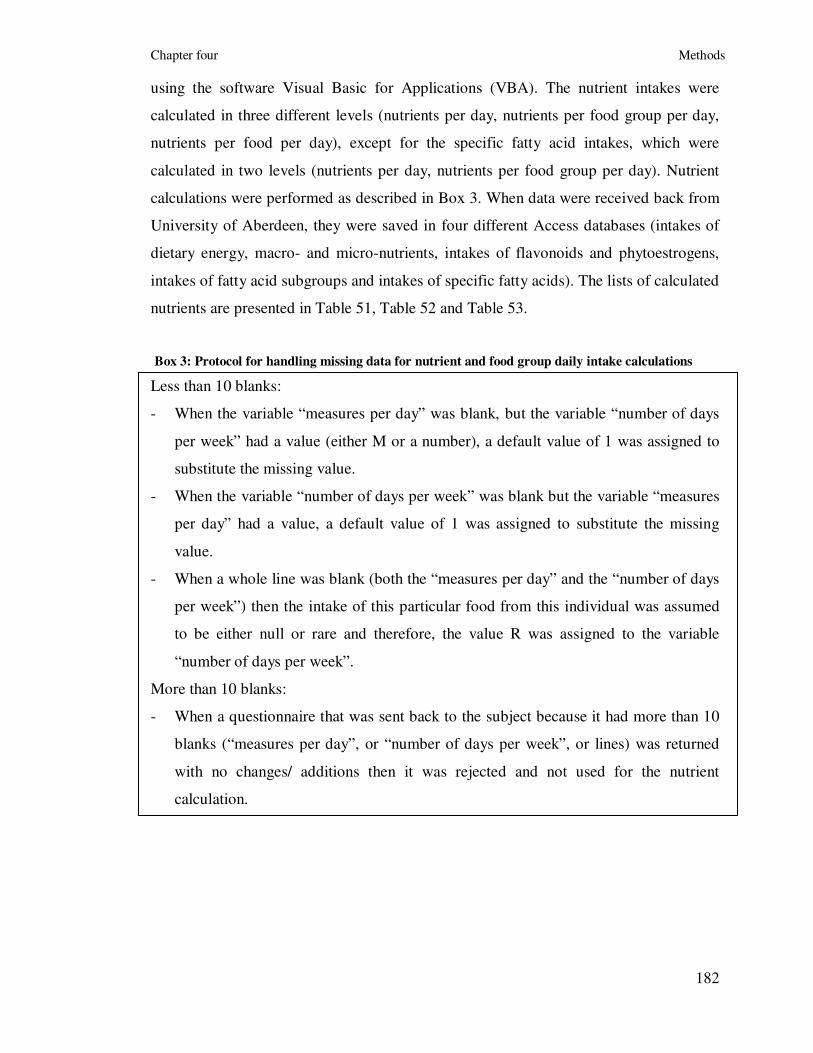
Chapter four Methods
182
using the software Visual Basic for Applications (VBA). The nutrient intakes were
calculated in three different levels (nutrients per day, nutrients per food group per day,
nutrients per food per day), except for the specific fatty acid intakes, which were
calculated in two levels (nutrients per day, nutrients per food group per day). Nutrient
calculations were performed as described in Box 3. When data were received back from
University of Aberdeen, they were saved in four different Access databases (intakes of
dietary energy, macro- and micro-nutrients, intakes of flavonoids and phytoestrogens,
intakes of fatty acid subgroups and intakes of specific fatty acids). The lists of calculated
nutrients are presented in Table 51, Table 52 and Table 53.
Box 3: Protocol for handling missing data for nutrient and food group daily intake calculations
Less than 10 blanks:
- When the variable “measures per day” was blank, but the variable “number of days
per week” had a value (either M or a number), a default value of 1 was assigned to
substitute the missing value.
- When the variable “number of days per week” was blank but the variable “measures
per day” had a value, a default value of 1 was assigned to substitute the missing
value.
- When a whole line was blank (both the “measures per day” and the “number of days
per week”) then the intake of this particular food from this individual was assumed
to be either null or rare and therefore, the value R was assigned to the variable
“number of days per week”.
More than 10 blanks:
- When a questionnaire that was sent back to the subject because it had more than 10
blanks (“measures per day”, or “number of days per week”, or lines) was returned
with no changes/ additions then it was rejected and not used for the nutrient
calculation.

Chapter four Methods
183
Table 51 List of macro- and micro-nutrient intakes from the SCG-FFQ
Nutrient Units
Water g/day
Dietary energy intake kcal/day
Dietary energy intake kJ/day
Protein g/day
Fat g/day
Carbohydrate g/day
Saturated fat g/day
Monounsaturated fat g/day
Polyunsaturated fat g/day
Cholesterol mg/day
Total sugar g/day
Starch g/day
Fibre g/day
Sodium mg/day
Potassium mg/day
Calcium mg/day
Magnesium mg/day
Phosphorus mg/day
Iron mg/day
Copper mg/day
Zinc mg/day
Chloride mg/day
Manganese mg/day
Selenium µg/day
Iodine µg/day
Retinol µg/day
Carotene equivalent µg/day
Vitamin D µg/day
Vitamin E mg/day
Thiamine mg/day
Vitamin B2 mg/day
Niacin mg/day
Potential niacin (from tryptophan) mg/day
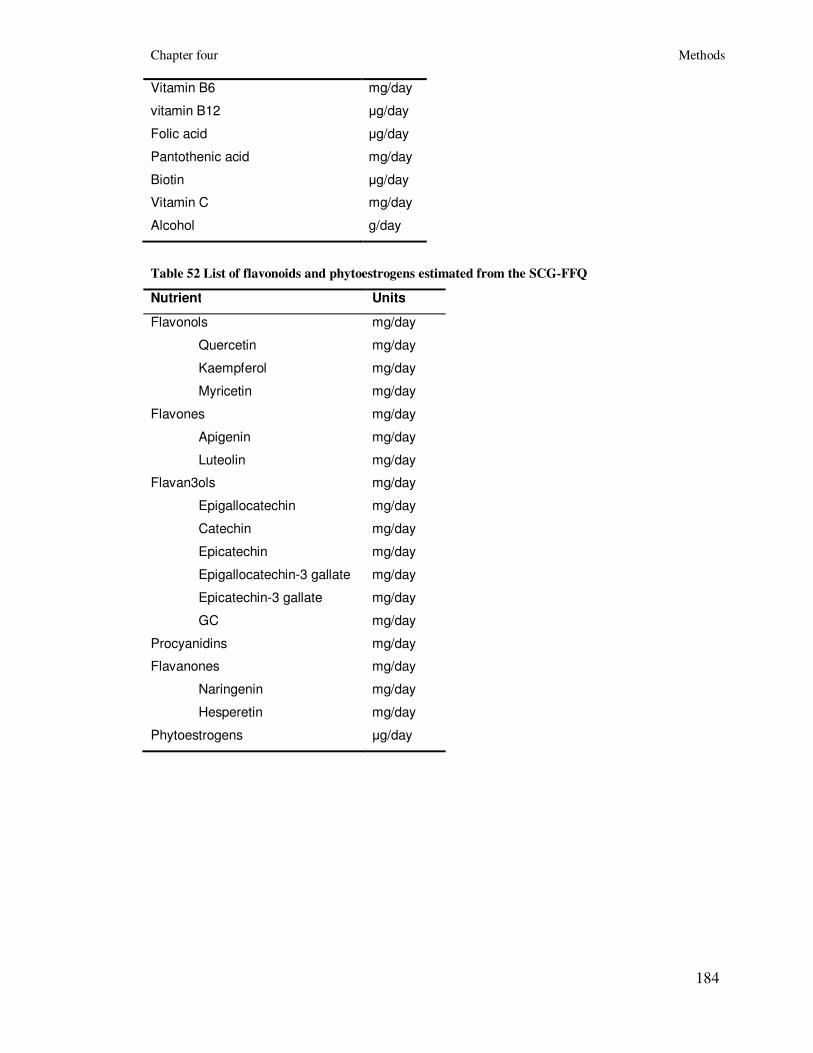
Chapter four Methods
184
Vitamin B6 mg/day
vitamin B12 µg/day
Folic acid µg/day
Pantothenic acid mg/day
Biotin µg/day
Vitamin C mg/day
Alcohol g/day
Table 52 List of flavonoids and phytoestrogens estimated from the SCG-FFQ
Nutrient Units
Flavonols mg/day
Quercetin mg/day
Kaempferol mg/day
Myricetin mg/day
Flavones mg/day
Apigenin mg/day
Luteolin mg/day
Flavan3ols mg/day
Epigallocatechin mg/day
Catechin mg/day
Epicatechin mg/day
Epigallocatechin-3 gallate mg/day
Epicatechin-3 gallate mg/day
GC mg/day
Procyanidins mg/day
Flavanones mg/day
Naringenin mg/day
Hesperetin mg/day
Phytoestrogens µg/day

Chapter four Methods
185
Table 53 List of total and specific fatty acid categories estimated from the SCG-FFQ
Nutrient Units
Total fatty acids g/day
Total saturated fatty acids g/day
Palmitic acid g/day
Stearic acid g/day
Total monounsaturated fatty acids g/day
Total poly-unsaturated fatty acids g/day
Oleic acid g/day
Total ω6 poly-saturated fatty acids g/day
Linoleic acid g/day
γ-Linolenic acid mg/day
Arachidonic acid mg/day
Total ω3 poly-saturated fatty acids g/day
α-Linolenic acid mg/day
Eicosapentaenoic acid (EPA) mg/day
Docosahexaenoic acid (DHA) mg/day
Total trans fatty acids g/day
Total trans mono-unsaturated fatty acids g/day

Chapter four Methods
186
4.3.4.2 Food group variables
In addition to the nutrients, the FFQ food items were used to calculate food group intake
data (Table 54), using a procedure that followed the same protocol as the one used in the
nutrient calculations and questionnaires that had blank values and/or blank lines were
processed as described in the Missing values protocol (Box 3).
In particular, the daily consumption of each individual food item (e.g. daily consumption
of carrots) and of each food group (e.g. vegetables) was computed using the following
formulas:
- Daily consumption of food items:
- When the day response was one to seven days per week:
Food item intake per day = (number of measures)*(number of days)/7
- When the day response was “monthly” an alternative formula was used:
Food item intake per day = (number of measures)* 1.5 measures/ 28 days
- When the day response “Rarely” was recorded then a default value of 0 for the
daily food item intake was used.
- Daily consumption of food groups:
Food group intake = sum of food item intakes within the food group
In addition to the food items and groups consumption the grilled meat score was
calculated. It combined the number of times that a subject ate grilled or fried meat with
the doneness of the meat using the following formula:
Grilled meat score = [Number of times of grilled or fried meat per week]*[meat
doneness]
Note: Meat doneness: 1 = lightly browned, 2 = medium browned or 3 = well browned.

Chapter four Methods
187
Table 54 List of food group variables and other food-associated variables
Food group FFQ food items (FFQ question number)
Total: Bread/Cereal products
Bread products
Cereal products
Breads (qu.1), Breakfast Cereals (qu.2)
Breads (qu.1)
Breakfast Cereals (qu.2)
Total: Fruit & Vegetables
Fruit
Vegetables
Fruit (qu.12), Vegetables (qu.11)
Fruit (qu.12)
Vegetables (qu.12)
Total: Meat products
Meat products
Red meat
Processed meat
Meats (qu.7), Fish (qu.8)
Meats (qu.7)
Meats (qu.7: a-e, g-i)
Meats (qu.7: b, c, i-l)
Total: Fish
White fish
Oily fish
Fish (qu.8)
Fish (qu.8: a-d)
Fish (qu.8: e-g, i)
Total: Dairy products
Milk products
Cream & yoghurts
Cheese
Eggs
Milk (qu.3), Cream and Yoghurt (qu.4),
Cheese (qu.5), Eggs (qu.6)
Milk (qu.3)
Cream and Yoghurt (qu.4)
Cheese (qu.5)
Eggs (qu.6)
Total: Alcohol intake
Beer & Lager
Wine
Spirits
Alcoholic drinks (qu.19) – as units
Alcoholic drinks (qu.19: a-c)
Alcoholic drinks (qu.19: d, e)
Alcoholic drinks (qu.19: f-h)
Total: Beverages and Soft drinks
Beverages
Caffeine beverages
Non-caffeine beverages
Soft drinks
Fruit/vegetable juices
Fizzy drinks
Beverages and Soft drinks (qu.18)
Beverages and Soft drinks (qu.18: a-e)
Beverages and Soft drinks (qu.18: a, c, e)
Beverages and Soft drinks (qu.18: b, d)
Beverages and Soft drinks (qu.18: f-l)
Beverages and Soft drinks (qu.18: f-i)
Beverages and Soft drinks (qu.18: j, k)
Frequency of eating: Total number
of meals and snacks per day
Number of main meals per day
Number of snack meals per day
Number of snack foods per day
Number of sweet drinks per day
Other information (qu23: a-d)
Other information (qu23: a)
Other information (qu23: b)
Other information (qu23: c)
Other information (qu23: d)

Chapter four Methods
188
4.3.4.3 Computation of energy-adjusted nutrient and food group
variables
To adjust for the potential effect of dietary energy intake on the associations between the
nutrient or food intakes and colorectal cancer we used the residual method, as
determined by Willet and Stampfer (276). This method estimates individual dietary
intake when the energy intake remains constant (Box 4). However, to apply this method
the distribution of the particular nutrient or food should be normal. Therefore, in case
that a particular nutrient or food was not normally distributed (even after logarithmic or
square-root transformation) then the standard method of energy adjustment was used,
where dietary energy intake was added as a covariable in the logistic regression model
that was used to estimate the association between the nutrient or food and colorectal
cancer (Box 4).
Box 4 Procedure followed to control for the possible confounding effect of dietary energy intake
(residual or standard method of energy adjustment)
For each dietary intake variable we did as follows:
1. Check the distribution of dietary energy intake
The distribution of dietary energy intake was checked and any outliers were identified.
2. Check the distribution of nutrient/food intake
The distribution of each nutrient/ food was checked. If it was normal we went to step 5. The nutrients or
foods that were not normally distributed were transformed (logarithmic or square root transformation).
3. Check the distribution of transformed nutrient/food intake
The distribution of the transformed nutrient/ food was checked. If it was normal, we went to step 5. If it
was not normally distributed, we went to step 4.
4. Standard energy adjustment
The confounding effect of energy was controlled by adding energy as a covariable in the logistic
regression model with colorectal cancer as the response variable and nutrient intake as an explanatory
variable.
5. Residual energy adjustment: Simple linear regression
Simple linear regression with dietary intake variable as response (Y variable) and energy intake as x
variable was performed: Y = a + bx; a is the intercept and b is the slope
6. Residual energy adjustment: Record the residuals
Residuals from step 5, the intercept a and the slope b were saved.

Chapter four Methods
189
7. Residual energy adjustment: Calculate the mean energy intake
The mean energy intake (χ) i.e. mean of x was calculated.
8. Residual energy adjustment: Calculate the expected nutrient intake, when energy intake is
constant (i.e. equal to its mean)
The expected nutrient intake (y variable) was calculated using the formula: y = a + (b* χ)
Where values for a and b were from step 5 and χ is the mean of the energy intake, from step 7. The value
for y for each dietary intake variable was calculated.
9. Residual energy adjustment: Calculate the energy adjusted dietary intake variable
To obtain the energy adjusted dietary intake value, y was added to the residuals recorded in step 5 and
saved in step 6.
10. Residual energy adjustment: For previously transformed variables
If the dietary intakes in step 2 have been transformed, these were reversed in this step. For example if the
log transformation of a dietary intake variable had been used then the values obtained in step 9 were to be
exponentiated.
11. Residual energy adjustment: Analyse the energy adjusted variables
We looked at the mean, standard deviation, minimum and maximum of the energy adjusted variable. We
compared the mean of the energy adjusted variable to that of the original variable. The means should have
been similar, but the standard deviation should have been lower for the energy adjusted variable. There
should have been no negative values in the energy adjusted variable. If negative values were present we
went back to step 1 and step 2 and checked for outliers and ensured that the skewness of the data was
between –1 and 1.

Chapter four Methods
190
4.3.4.4 Supplements
Regular intake of dietary supplements (within the reference period) was recorded in
section 21 of the FFQ and nutrient intake from these supplements was added to the daily
nutrient intake from the FFQ. The supplement information (which included the brand
name of the supplement, the type of the supplement, the dosage, the measures per day
and the days per week) was entered in a database different to the FFQ database
(Supplement database). The total number of subjects that took any kind of supplements
was 1,772 (706 cases and 1,066 controls).
A database containing the vitamin, mineral and herb dosages of the products recorded by
the subjects was established (Supplement reference look-up database). The necessary
information regarding the composition of the supplements was collected by the
manufacturer’s product information, by contacting the company directly or by the
internet.
The combination of the Supplement database and Supplement reference look-up
database gave all the necessary information to calculate the daily nutrient intake from
the supplements which was null for subjects that had not been taking any supplements.
This combination was made on a supplement code that was attached on each specific
supplement. This code was unique for each brand-type-dosage supplement and was
entered in both tables. For example the supplement Cod Liver Oil (525 mg each capsule)
that was made by the brand Seven Seas had the code SS CLO 525.
The daily intake from the supplements was added to the nutrient output from foods after
the energy adjustment. The reason for this was that we were not willing to energy-adjust
for the supplement intake. It is possible that the participants might have overestimated
their supplement intake since they may have forgotten to take them some time or even
stopped for a period. However, this overestimation probably would not be related to any
overestimation of their total dietary energy intake. Therefore on balance and having
consulted Dr G McNeill (University of Aberdeen), we felt it would be more accurate to
adjust the nutrients from foods for total dietary energy intake and then add the estimated
daily nutrient intakes from supplements to the adjusted values.

Chapter four Methods
191
4.4 Collection and process of additional data
4.4.1 Deprivation category data
The Carstairs deprivation index (deprivation score), which was based on the 2001
Census data, was assigned to each subject at the postcode sector level. The index
contained seven categories ranging from very low deprivation (deprivation score 1) to
very high deprivation (deprivation score 7). The criteria that are included in the Carstairs
deprivation index are presented in Table 55. In Table 56 the distribution of cases and
controls along the Carstairs deprivation index categories is presented.
Table 55 Carstairs Deprivation Index criteria
Criterion Description
Overcrowding: Persons in private household living at a density
of >1 person per room of all persons in private
households
Male unemployment: Proportion of economically active males who are
seeking work
Low social class: Proportion of all persons in private households
with head of household in social class 4 or 5
No car: Proportion of all persons in private households
with no car
Table 56 Distribution of cases and controls along the categories of Carstairs deprivation index
Deprivation score Cases
(n=3417)
Controls
(n=3396)
1 287 (8.4%) 318 (9.4%)
2 657 (19.2%) 686 (20.2%)
3 860 (25.2%) 923 (27.2%)
4 828 (24.2%) 794 (23.4%)
5 389 (11.4%) 365 (10.7%)
6 255 (7.5%) 218 (6.4%)
7 137 (4.0%) 92 (2.7%)
Missing 4 (0.1%) 0 (0.0%)

Chapter four Methods
192
4.4.2 Family history risk
Family history risk was assigned according to the Scottish guidelines (see Introduction,
chapter 1.5.4). The distribution of cases and controls along the family history categories
are presented in Table 57.
4.4.3 Tumour related parameters
4.4.3.1 Site of cancer
Information about the site of tumour was extracted from the medical history records and
from the treatment questionnaires. Distribution of the cases according to the tumour
location is presented in Table 58.
4.4.3.2 Stage of cancer
During the recruitment period Duke’s stage was recorded to describe the extent of the
cancer in the body. In addition, by using Duke’s stage information we formed the AJCC
stage for each case. However, for 2,719 cases metastasis information was missing and
data were requested from the Scottish regional cancer networks (SCAN, WoSCAN and
NoSCAN). These data were also incomplete and therefore CT scans for all patients from
the Lothian region were requested (n= 578) and individually checked for evidence of
metastasis. For the WoSCAN and NoSCAN regions, the consultants of individual
patients were contacted by letter requesting the staging information for their patients.
Following this first round of letter to consultant surgeons, it became clear that there were
inconsistencies between the staging provided by the regional databases and the death
status (e.g. patients noted to have metastasis in the databases were alive several years
later). A second round of letters was then sent to consultant surgeons requesting
clarification of metastases status of their patients. For the remaining cases with
outstanding metastasis status, individual GPs were contacted by letter. This process led
to only 126 cases left without staging. The distribution of the cases according to the
Duke’s and AJCC staging systems is presented in Table 59.

Chapter four Methods
193
Table 57 Distribution of cases and controls of assigned family history
Family history risk Cases
(n=3417)
Controls
(n=3396)
Low 2503 (73.7%) 3084 (90.8%)
Medium 613 (18.0%) 33 (1.0%)
High 74 (2.2%) 1 (0.0%)
Unknown 135 (4.0%) 20 (0.6%)
Not given 92 (2.7%) 258 (7.6%)
Refused 61 28
Adopted 1 8
Other reason 0 1
No reason given 30 221
Table 58 Distribution of cases according to tumour location
Site of cancer Cases
(n=3417)
Colon cancer 2006 (58.7%)
Proximal 947
Distal 782
2 proximal tumours 23
2 distal tumours 8
1 proximal, 1 distal 10
Unspecified 236
Rectal cancer 1355 (39.6%)
Colon and rectal cancer 18 (0.5%)
Other (including cancer of
the appendix and anus,
polyps only or unknown)
30 (0.9%)
Missing 8 (0.2%)

Chapter four Methods
194
Table 59 Distribution of the cases along the categories of the Duke’s and AJCC stage systems
Stage of cancer Cases (n=3417)
Duke’s staging
A 609 (17.8%)
B 1203 (35.2%)
C 1371 (40.1%)
D 31 (0.9%)
Missing 203 (5.9%)
Metastasis
No 2819 (82.5%)
Yes 520 (15.2%)
Missing 78 (2.3%)
AJCC
1 619 (18.1%)
2A 871 (25.5%)
2B 241 (7.0%)
2 (unspecified) 8 (0.2%)
3A 110 (3.2%)
3B 591 (17.3%)
3C 344 (10.1%)
4 507 (14.8%)
Missing 126 (3.7%)

Chapter four Methods
195
4.4.4 Genetic data of specific variants
In this thesis a limited amount of genetic variants were considered for investigation. In
particular the genes, which were associated with colorectal cancer were investigated,
were the following: rs1801133 (MTHFR C677T), rs1801131 (MTHFR A1298C),
rs1805087 (MTR A2756G) and rs1801394 (MTRR A66G) (hypothesis 3), and four VDR
SNPs: rs10735810 (FokI), rs1544410 (BsmI), rs11568820 and rs7975232 (ApaI)
(hypothesis 4).
Genotyping for MTHFR, MTR and MTRR SNPs was undertaken as part of an array-
based candidate gene approach. Genotyping of patients aged less than 55 years old along
with matched controls was undertaken together using the Illumina Infinium I Custom
array platform and performed by Illumina in San Diego. DNA samples were accurately
quantified by Pico-GreenTM
and quality controlled prior to dispatch to San Diego. To
avoid potential systematic batch-to-batch variation or bias, samples were anonymised as
to disease status and were randomly distributed within plates. Data were subject to
Illumina quality control procedures and genotypes were discarded if call rates were less
than 99.5%. Genotype data for the MTHFR, MTR and MTRR SNPs were available for a
subsample of 1001 cases and 1010 controls.
Genotyping for the four VDR SNPs was undertaken in two phases as part of an array-
based candidate gene approach, using the Illumina Infinium I Custom array platform and
performed by Illumina (San Diego). In phase I, two VDR gene variants (rs10735810 and
rs1544410) of 1,012 cases and 1,012 controls (<55 years old) were genotyped, whereas
in phase II, four VDR gene variants (rs10735810, rs1544410, rs11568820, rs7975232)
of 2,013 patients and 2,071 controls (21 to 83 years old) were genotyped. DNA samples
were accurately quantified by Pico-GreenTM
and quality controlled prior to dispatch to
San Diego. Case and control DNA samples were stored, genotyped and analysed in the
same way. In addition to avoid potential systematic batch-to-batch variation or bias,
samples were anonymised as to disease status and were randomly distributed within
plates. Data were subject to Illumina quality control procedures and genotypes were
discarded if call rates were less than 99.5%.

Chapter four Methods
196
4.5 Data analysis of part 1 (Hypothesis driven
analyses)
4.5.1 Introduction
In the first part of this thesis particular dietary factors were investigated in order to
assess their associations with colorectal cancer in a hypothesis-driven type of analysis.
In particular, four different hypotheses were tested comprising the investigation of the
associations between colorectal cancer and: 1) flavonoid variables (hypothesis 1), 2)
fatty acid variables (hypothesis 2), 3) nutrients involved in the one-carbon metabolic
pathway (including folate, vitamin B2, vitamin B6, vitamin B12 and alcohol; hypothesis
3) and 4) vitamin D and calcium (hypothesis 4). Results of the first two hypotheses are
presented in chapter 6 and results of the last two hypotheses are presented in chapter 7.
In this section the datasets that were used to investigate the aforementioned hypotheses
including detailed list of the included variables will be presented. Finally, the overall
descriptive statistical analysis of part 1 and the particular statistical methods that were
employed will be described. All statistical analyses were conducted using the statistical
package STATA IC (version 10.0, TEXAS, USA).
4.5.2 Matched and unmatched dataset
2,062 cases and 2,776 controls had complete and valid FFQ and LCQ data and were
included in the analysis. Analysis was applied in two different datasets: a finely matched
(1:1) dataset including 1,489 cases and 1,489 controls (used for investigation of
hypotheses 1 and 2) and an unmatched dataset including 2,062 cases and 2,776 controls
(used for investigation of hypotheses 3 and 4). The characteristics of both the matched
and unmatched dataset are presented in the first section of chapter 6 and chapter 7,
respectively. For the genetic analysis of hypothesis 3 (analysis of the following SNPs:
rs1801133, rs1801131, rs1805087 and rs1801394) an unmatched dataset including 1,001
cases and 1,010 controls (aged ≤55 years old) was used. In addition, for the joined
analysis of the genetic and dietary factors of hypothesis 3, an unmatched dataset of 468
cases and 761 controls younger than 55 years old was used. Regarding the genetic
analysis of the hypothesis 4, an unmatched dataset of 2,013 cases and 2,071 controls was

Chapter four Methods
197
used (for SNPs rs11568820, rs7975232), whereas an unmatched dataset of 3,025 cases
and 3,083 controls was used (for SNPs rs10735810 and rs1544410). Finally, for the
joined analysis of rs7975232, rs11568820 and the dietary factors of hypothesis 4 a
dataset of 1,392 cases and 1,817 controls was used, whereas for the joined analysis of
rs10735810, rs1544410 and the dietary factors of hypothesis 4 a dataset of 1,859 cases
and 2,578 controls was used.
4.5.3 List of variables
The variables that were included in hypothesis 1 (association between flavonoids and
colorectal cancer) were: 1) the flavonoid subgroups: flavonols, flavones, flavan3ols,
procyanidins, flavanones and phytoestrogens and 2) the individual flavonoid
compounds: quercetin, catechin, epicatechin, naringenin and hesperetin. The variables
that were included in hypothesis 2 (association between fatty acids and colorectal
cancer) were: 1) total FAs, 2) the fatty acid subgroups: SFAs, MUFAs, PUFAs,
ω6PUFAs, ω3PUFAs, tFAs and tMUFAs and 3) the individual fatty acid compounds:
palmitic acid, stearic acid, oleic acid, linoleic acid, γ-linolenic acid, arachidonic acid, α-
linolenic acid, EPA and DHA. The variables that were included in hypothesis 3
(association between nutrients involved in one-carbon metabolic pathway and colorectal
cancer) were: folate, vitamin B2, vitamin B6, vitamin B12 and alcohol and the SNPs
rs1801133, rs1801131, rs1805087 and rs1801394. Finally, the variables that were
included in hypothesis 4 were: vitamin D and calcium and the SNPs rs10735810,
rs1544410, rs11568820 and rs7975232. The variables and potential confounding factors
that were included in this part of the analysis are listed in Table 60.

Chapter four Methods
198
Table 60 List of the variables included in the first part of the analysis (four hypotheses) and list of
the potential confounding factors
Variables Confounders
Matched analysis Unmatched analysis
Hypothesis 1 Hypothesis 2 Hypothesis 3 Hypothesis 4 All hypotheses
Flavonols Total FAs Folate Vitamin D Age
Flavones SFAs Vitamin B2 Calcium Sex
Flavan3ols MUFAs Vitamin B12 rs10735810 Deprivation index
Procyanidins PUFAs Vitamin B6 rs1544410 Family history
Flavanones ω6PUFAs Alcohol rs11568820 Body mass index
Phytoestrogens ω3PUFAs rs1801133 rs7975232 Physical activity
Quercetin tFAs rs1801131 Smoking
Catechin tMUFAs rs1805087 Dietary energy
Epicatechin Palmitic acid rs1801394 Dietary fibre
Naringenin Stearic acid Alcohol
Hesperetin Oleic acid NSAIDs*
Linoleic acid
γ-Linolenic acid
Arachidonic acid
α-Linolenic acid
EPA
DHA
* NSAIDs: Non Steroidal Anti-inflammatory Drugs

Chapter 4 Methods
199
4.5.4 Statistical analysis of part 1
4.5.4.1 Descriptive analysis
The distribution of each dietary and potential confounding variable was examined. Any
extreme values and outliers were noted with the view of omitting them from subsequent
analysis using continuous data. Any variable that showed a skewed distribution was
normalised by using appropriate transformation methods (logarithmic or square root
transformation). In addition, a correlation analysis, using spearman’s rank correlation
was performed on the dietary variables to examine any association between these
variables.
The distribution of each environmental variable and confounding factor was examined
by cases versus controls. Differences in dietary intakes and confounding variables
between cases and controls were tested for significance by using t-test (continuous
variables) and Pearson χ2 test (categorical variables). Finally, the Wilcoxon rank-sum
test was used to test for differences in median dietary intakes.
4.5.4.2 Data categorisation
Dietary and non-dietary variables that were measured on a continuous scale were
initially used as continuous variables in the statistical models. In addition they were
grouped into four categories using quartiles as the cut-off points (based on the combined
distribution of cases and controls).
4.5.4.3 Logistic regression analysis
The association of case/ control status with each dietary, non-dietary and confounding
variable of the four hypotheses was examined by using logistic regression models. In
general, logistic regression analysis is used to model dichotomous outcomes (log odds of
an outcome) defined by the values of covariables in the model. For the analysis of the
unmatched dataset (unconditional) logistic regression was used. For the analysis of the
matched dataset, conditional logistic regression analysis was used, which is a
modification of the (unconditional) logistic regression where the likelihood takes into
account the fine matching.

Chapter 4 Methods
200
Odds ratios and 95% CIs were obtained by comparing quartiles of each dietary variable
using the lowest quarter as reference. In addition linear trend of the ORs that represents
a dose-response association was examined by calculating a p-value for trend. Uni- and
multi-variable conditional or unconditional logistic regression models were used to
study the associations between colorectal cancer and each dietary and confounding
factor.
Three main logistic regression models (conditional or unconditional) were applied:
Model I was not adjusted for any confounding factors (crude analysis); Model II was
corrected for dietary energy intake by using either the residual method, as determined by
Willet and Stampfer (for the normal distributed variables) or the standard method
including the dietary energy variable as a covariate in the regression model (for the non-
normal distributed variables); Model III was corrected for family history of cancer (low,
medium/high risk), BMI (kg/m2, continuously), physical activity (hours/week of cycling
and any other sport activities, 4 categories), smoking (yes vs. no), dietary energy intake
(residual or standard method of adjustment), fibre intake (grams/day, energy adjusted,
continuously), alcohol intake (grams/day, energy adjusted, continuously) and regular
NSAIDs intake (yes vs. no) and additionally for age (continuous), sex and deprivation
score for the unmatched analysis.
Two additional models were applied in hypothesis 1 (associations between colorectal
cancer and intakes of flavonoids): Model IV, which was corrected for the confounding
factors of model III and additionally for fruit and vegetable intake (measures/day,
continuously, energy adjusted); and model V, which was corrected for the confounding
factors of model III and further adjusted mutually between flavonoid categories. Two
additional models were applied in hypothesis 2 (associations between colorectal cancer
and intakes of fatty acids), as well: Model IV, which was corrected for the confounding
factors of model III and in addition to the residual energy adjustment dietary energy
intake was included as a covariate; and model V, which was corrected for the
confounding factors of model III and further adjusted for total fatty acid intake. Finally,
one additional model was applied in hypothesis 4 (associations between colorectal

Chapter 4 Methods
201
cancer and intakes of vitamin D and calcium): Model IV, which was corrected for the
confounding factors of model III and further adjusted for intake of ω3PUFAs.
In addition to the whole sample analysis, ORs and 95% CIs were calculated in stratified
groups according to sex, age (≤55 years old and >55 years old) and cancer site (colon
and rectal cancer) by applying model III for all four hypotheses.
4.5.4.4 Analysis of genetic data and gene-environment interactions
(for hypotheses 3 and 4)
The association of case/ control status with each SNP (hypotheses 3 and 4) was
examined by using logistic regression models. Each genotype (heterozygous and
homozygous for the variant allele) was compared with the reference category
(homozygous for the wild type allele) in order to obtain ORs and 95% CIs. Two
unconditional logistic regression models were used to study the associations between
colorectal cancer and each SNP: one univariable model and one simply adjusted for age,
sex and deprivation score. In addition, multivariable associations between the dietary
risk factors that were included in hypotheses 3 and 4, and colorectal cancer were
investigated after stratification of the study sample according to the genetic factors by
applying model III. In addition, interaction associations were examined by investigating
the combined effects of the genotypes and nutrient intakes. Interaction was tested by
examining the deviance of two different nested models; an interactive model and its
nested multiplicative one. The referent category used was homozygotes of the wild type
allele and being at the lower quartile of the dietary nutrient intake.
4.5.4.5 Multiple testing
For each hypothesis we corrected the observed p-values according to the number of tests
that were performed in order to control for multiple testing. Correction for multiple
testing was conducted in three different ways.
First, the p-values were corrected using the Bonferroni correction for the number of
independent tests performed as follows: hypothesis 1 (flavonoids) was corrected for six
independent tests; hypothesis 2 (fatty acids) for 14 independent tests (eight for the fatty
acids making a subtotal of 14 tests including hypothesis 1); hypothesis 3 (folate, vitamin

Chapter 4 Methods
202
B2, vitamin B6, vitamin B12 and alcohol) was corrected for 19 independent tests (five
for the current hypothesis making a subtotal of 19 tests including hypotheses 1 and 2);
and hypothesis 4 (vitamin D and calcium) was corrected for 21 independent tests (two
for the current hypothesis making a subtotal of 21 tests including hypotheses 1, 2 and 3).
For an original significance level (α) of 0.05, the adjusted significance level for
hypothesis 1 was 0.008 (0.05 divided by 6), for hypothesis 2 was 0.004 (0.05 divided by
14), for hypothesis 3 was 0.003 (0.05 divided by 19) and for hypothesis 4 was 0.002
(0.05 divided by 21).
The second way was to account for the number of tests separately for each hypothesis
but to consider each single test by including the number of models as follows:
hypothesis 1 was corrected for 30 tests for the flavonoid subgroups (6 flavonoid
subgroups multiplied by 5 models = 30 tests) and for 25 tests for the individual
flavonoids (5 individual flavonoids multiplied by 5 models = 25 tests); hypothesis 2 was
corrected for 39 tests for the fatty acid subgroups (total fatty acids multiplied by 4
models = 4 tests plus 7 fatty acid subgroups multiplied by 5 models = 35 tests) and for
45 tests for the individual fatty acids (9 individual fatty acids multiplied by 5 models =
45 tests); hypothesis 3 was corrected for 15 tests (5 nutrients multiplied by 3 models =
15 tests); and hypothesis 4 was corrected for eight tests (2 nutrients multiplied by 4
models = 8 tests). Both the Bonferroni correction method and the less conservative False
Discovery Rate (FDR) method were applied.
Third, the significance level was corrected for the toal number of tests performed in all 4
hypotheses, by applying both the Bonferroni and the FDR method. In the subgroup
level, we corrected for 69 independent tests (30 in hypothesis 1 and 40 in hypothesis 2),
whereas in the individual nutrient level we corrected for 93 tests (25 in hypothesis 1, 45
in hypothesis 2, 15 in hypothesis 3 and 8 in hypothesis 4).

Chapter 4 Methods
203
4.6 Data analysis of part 2 (Overall and stepwise
regression analysis)
4.6.1 Introduction
In the second part of the thesis, an overall univariable analysis of all the collected risk
factors (including demographic factors, lifestyle variables, food variables and nutrients)
was conducted. In addition, stepwise regression models were applied to three different
sets of variables to develop models that explain colorectal cancer risk. Results of the
second part of the thesis are presented in chapter 8.
This section includes a description of the datasets used and the statistical methods. All
statistical analyses were conducted using the statistical package STATA IC (version
10.0, TEXAS, USA).
4.6.2 Dataset
The dataset that was used for part 2 of the analysis was the unmatched one consisting of
2,062 cases and 2,776. Its main characteristics are presented in the first section of
chapter 7 (on page 260).
4.6.3 List of variables
The variables, which were tested for an association with colorectal cancer were: 1) the
demographic risk factors: age, sex, family history and deprivation score; 2) the lifestyle
variables: smoking, alcohol intake, BMI, physical activity, dietary energy intake,
NSAIDs intake and HRT intake (females only); 3) the food variables: breads, cereals,
milk, cream, cheese, eggs, poultry, red meat, processed meat, white fish, oily fish,
potatoes/ pasta/ rice, fruit, vegetables, savoury1, sweets
2, tea, coffee, fruit/ vegetable
juice, fizzy drinks; and 4) the nutrients: quercetin, catechin, epicatechin, flavones,
procyanidins, flavanones, phytoestrogens, SFAs, MUFAs, ω6PUFAs, ω3PUFAs, tFAs,
tMUFAs, sodium, potassium, calcium, magnesium, phosphorus, iron, copper, zinc,
manganese, selenium, iodine, chloride, vitamin A, carotenes, vitamin D, vitamin E,
1 Summary variable of savoury foods, soups and sauces
2 Summary variable of puddings and deserts; chocolates, sweets, nuts and crisps; biscuits; and cakes

Chapter 4 Methods
204
vitamin B1, vitamin B2, niacin, vitamin B6, vitamin B12, folate, pantothenic acid,
potential niacin, biotin and vitamin C.
Stepwise regression was applied in three different sets of variables that are presented in
Table 61. Briefly, set 1 consisted of demographic risk factors, lifestyle variables and
food variables; set 2 consisted of demographic risk factors, lifestyle variables and
nutrients; and set 3 consisted of demographic risk factors, lifestyle variables, food
variables and nutrients. All food and nutrient variables were adjusted for dietary energy
(by the residual method), except for tea and coffee (sets 1 and 3) and flavones (sets 2
and 3).
Table 61 List of the variables included in the three datasets of the second part of the analysis. All
food and nutrient variables were residually adjusted for dietary energy, except for the food
variables: tea and coffee and the nutrients: flavones and flavan-3-ols.
Set 1 Set 2 Set 3
Demographic risk factors Demographic risk factors Demographic risk factors
Age, sex, family history,
deprivation score
Age, sex, family history,
deprivation score
Age, sex, family history,
deprivation score
Lifestyle variables Lifestyle variables Lifestyle variables
Smoking, alcohol intake, BMI,
physical activity, dietary
energy intake, NSAIDs, HRT
(females only)
Smoking, alcohol intake,
BMI, physical activity,
dietary energy intake,
NSAIDs, HRT (females only)
Smoking, alcohol intake,
BMI, physical activity,
dietary energy intake,
NSAIDs, HRT (females only)
Food variables Flavonoid variables Food variables
Breads, cereals, milk, cream,
cheese, eggs, poultry, red
meat, processed meat, white
fish, oily fish, potatoes/ pasta/
rice, fruit, vegetables,
savoury*, sweets
†, tea (crude
intakes), coffee (crude
intakes), fruit/ vegetable juice,
fizzy drinks
Quercetin, catechin,
epicatechin, flavones (crude
intake), procyanidins,
flavanones, phytoestrogens
Breads, cereals, milk,
cream, cheese, eggs,
poultry, red meat, processed
meat, white fish, oily fish,
potatoes/ pasta/ rice, fruit,
vegetables, savoury,
sweets, tea (crude intakes),
coffee (crude intakes), fruit/
vegetable juice, fizzy drinks
Fatty acid variables Flavonoid variables
SFAs, MUFAs, ω6PUFAs,
ω3PUFAs, tFAs, tMUFAs
Quercetin, catechin,
epicatechin, flavones (crude

Chapter 4 Methods
205
intake), procyanidins,
flavanones, phytoestrogens
Macronutrients Fatty acid variables
Protein, cholesterol, sugars,
starch, fibre
SFAs, MUFAs, ω6PUFAs,
ω3PUFAs, tFAs, tMUFAs
Minerals Macronutrients
Sodium, potassium, calcium,
magnesium, phosphorus,
iron, copper, zinc,
manganese, selenium,
iodine
Protein, cholesterol, sugars,
starch, fibre
Vitamins Minerals
Vitamin A, carotenes,
vitamin D, vitamin E, vitamin
B1, vitamin B2, niacin,
vitamin B6, vitamin B12,
folate, pantothenic acid,
biotin, vitamin C
Sodium, potassium, calcium,
magnesium, phosphorus,
iron, copper, zinc,
manganese, selenium,
iodine
Vitamins
Vitamin A, carotenes,
vitamin D, vitamin E, vitamin
B1, vitamin B2, niacin,
vitamin B6, vitamin B12,
folate, pantothenic acid,
biotin, vitamin C
* Summary variable of savoury foods, soups and sauces
† Summary variable of puddings and deserts; chocolates, sweets, nuts and crisps; biscuits; and cakes

Chapter 4 Methods
206
4.6.4 Statistical analysis of part 2
4.6.4.1 Descriptive analysis
The distribution of each demographic, lifestyle, food and nutrient variable was
examined. Any extreme values and outliers were investigated with the view of omitting
them from subsequent analysis using continuous data. Any variable that showed a
skewed distribution was normalised by using appropriate transformation methods
(logarithmic or square root transformation).
The distribution of each variable was examined by cases versus controls and the
distributions were tested for significance by using t-test (continuous variables) and
Pearson χ2 test (categorical variables). In addition, the Wilcoxon rank-sum test was used
to test the median of the continuous variables. Finally, a correlation analysis, using
spearman’s rank correlation was performed on all continuous variables to examine any
association between these variables. All food and nutrient variables were residually
energy adjusted (except for tea, coffee and flavones).
4.6.4.2 Data categorisation
Dietary and non-dietary variables that were measured on a continuous scale were
initially used as continuous variables in the statistical models. In addition they were
standardised and changes per standard deviation were reported. Finally, they were
grouped into four categories using quartiles as the cut-off points (based on the combined
distribution of cases and controls).
4.6.4.3 Overall univariable logistic regression
Univariable logistic regression models were fitted for each demographic, lifestyle,
dietary, food and nutrient variable. For the regression of food and nutrient variables,
their residual energy adjusted form was included (except for the food groups tea and
coffee and the nutrient: flavones).
4.6.4.4 Stepwise regression
Stepwise regression (both forward and backward) was applied to the three different set
of variables. The p-value threshold for a variable to enter the model (forward stepwise
regression) or to remain in the model (backward stepwise regression) was 0.10. In each

Chapter 4 Methods
207
set of variables the quartile form of the continuous variables was included. Finally,
forward and backward stepwise regression was reapplied separately for males and
females for all three sets of variables using the quartile form of the continuous variables.
4.6.4.5 Bootstrap method
In order to examine the stability of the built models the bootstrap method was applied.
A bootstrap sample is a sample of the same size as the original sample but where
subjects have been replaced. A given subject of the original sample may occur in a
specific bootstrap sample many times, only once, or not at all. 100 bootstrap samples
were selected. Once a bootstrap sample was selected by the computer programme, for
each set of variables forward and backward stepwise regression models were applied (in
the whole sample). The p-value threshold for a variable to enter the model (forward
stepwise regression) or to remain in the model (backward stepwise regression) was again
0.10. Therefore, for a given bootstrap sample and for each set of variables, two final
models were obtained (1 after applying forward and 1 after applying backward stepwise
regression).
For each obtained model, the selected variables were noted, results across the variable
selection models were compared and this procedure was repeated for all 100 bootstrap
samples. For each variable, the number of times that it was included in a regression
model was calculated. In addition, the agreement between the type and number of
variables included in the models after applying forward and backward stepwise
regression was determined.
4.6.4.6 Multiple testing
The purpose of the overall and stepwise analysis was not to draw any certain
conclusions about the strength of the associations between the risk factors and colorectal
cancer. Instead, the purpose was to identify risk factors and to generate new hypotheses,
which would then be tested in other prospective or retrospective studies. Therefore, no
correction was made for multiple testing.

Chapter 5 Results: Description of results presentation
208
5 RESULTS: Description of the results
presentation
This chapter describes the layout of the results and discussion sections of the thesis. In
chapters 6 and 7, the analyses of the four “a priori” hypotheses will be described (aim 1).
Chapter 6 includes the results of the matched analysis of the novel dietary risk factors
(flavonoid and fatty acid subgroups and individual compounds), whereas chapter 7
includes the unmatched analysis of the additional dietary risk factors (folate, vitamin B2,
vitamin B6, vitamin B12, alcohol, vitamin D and calcium). Chapter 8 (aim 2) includes
the results of the univariable overall analysis of all the explanatory variables and of the
stepwise regression models.
In the first part of each chapter the study population that was included in the analysis is
presented, including descriptive analysis of the main confounding factors and logistic
regression analysis to investigate the association relationships between the confounding
factors and colorectal cancer risk. Since the study sample that was used in chapters 7 and
8 was the same, description of its main characteristics will be presented only once, in
chapter 7. In the second part of each chapter descriptive analysis of the dietary variables
(chapters 6 and 7) or of all the explanatory variables (chapter 8) are presented including
distribution analysis (whole sample and by case/ control status) and correlation analysis.
In addition, the association relationships between colorectal cancer and each variable are
investigated by applying different logistic regression models. Finally, the last part of
chapter 8 includes the stepwise regression stepwise models for three different sets of
explanatory variables. In the end of each chapter, a brief summary is included
highlighting the main findings of each analysis, whereas further discussion of the
important findings will be presented in chapter 9 (Discussion). Tables and figures of the
analyses are presented at the end of each section of each chapter, as indicated in the text.
Chapter six Results: Flavonoids, fatty acids and colorectal cancer
209
6 RESULTS: Associations between colorectal
cancer and intakes of flavonoids and fatty acids
(matched dataset)
6.1 Introduction
In this chapter the results of the matched analysis of the novel dietary risk factors that
comprise the first two hypotheses, are presented. In particular the dietary risk factors that
were analysed using the matched dataset included: 1) flavonoids (subgroups, individual
compounds) and 2) fatty acids (total, subgroups, individual compounds).
In the first part, the study population included in the matched analysis is described,
including descriptive analysis of the main confounding factors and logistic regression
analysis to investigate their association relationships with colorectal cancer risk.
In the second part of the chapter descriptive analysis of the flavonoid and fatty acid
variables are presented including distribution analysis (whole sample and by case/
control status) and correlation analysis. In addition, the association relationships
between colorectal cancer and each flavonoid and fatty acid variable are investigated by
applying three main and two additional conditional logistic regression models. All tables
and figures are presented at the end of each section or in the Appendix, as indicated in
the text.
6.2 The study sample
This section describes the characteristics of the cases and controls that were included in
the matched dataset. In total 2,980 cases and controls were matched (1:1). One case had
unrealistically high dietary energy and nutrient intakes and was removed from further
analysis, together with its matched control.
6.2.1 Descriptive analysis of the confounding factors
The distribution of the continuous confounding factors was examined by looking at their
histograms. In addition, their summary statistics are presented in Table 62 for the whole
sample and also separately for cases and controls. The t-test was used to test differences
between cases and controls in mean age, BMI, dietary energy intake, fibre intake (crude
Chapter six Results: Flavonoids, fatty acids and colorectal cancer
210
and residually energy adjusted) and alcohol intake (crude and residually energy
adjusted). The Pearson χ2 test was used to test the differences in terms of sex,
deprivation score, family history of cancer, physical activity (hours/ week of cycling and
sport activities), smoking status and NSAIDs intake (Table 62).
6.2.2 Associations between confounding factors and
colorectal cancer risk
The association relationship between each confounding factor and colorectal cancer risk
was tested by applying univariable conditional logistic regression models (Table 63).
Statistically significant associations were observed for the majority of the confounding
factors, including:
- Family history of cancer (moderate/ high vs. low: OR (95% CI), p-value: 13.21
(7.68, 22.75), 1.25x10⁻²⁰
);
- Physical activity (>7 hours/week vs. 0 hours/week: OR (95% CI), p-value for trend:
0.77 (0.56, 1.04), 0.009);
- Dietary energy intake (highest vs. lowest quartile: OR (95% CI), p-value for trend:
1.34 (1.09, 1.65), 0.001);
- Residually energy adjusted fibre intake (highest vs. lowest quartile: OR (95% CI) p-
value for trend) 0.67 (0.54, 0.83), 0.0001);
- Residually energy adjusted alcohol intake (highest vs. lowest quartile: OR (95% CI),
p-value for trend: 0.81 (0.65, 1.00), 0.04);
- NSAIDs intake (yes vs. no: OR (95% CI) p-value: 0.74 (0.63, 0.86), 0.0001).

Chapter six Results: Flavonoids, fatty acids and colorectal cancer
211
Table 62 Summary statistics of the confounding factors for the matched dataset
Variables All subjects*
(n=2978)
Cases*
(n=1489)
Controls*
(n=1489)
p-value†
Age (years) 64.0 (9.7) 63.6 (9.7) 64.4 (9.7) 0.03
Age (years)
≤55 years 596 (20.0%) 318 (21.4%) 278 (18.7%)
>55 years 2382 (80.0%) 1171 (78.6%) 1211 (81.3%) 0.07
Sex
Men 1734 (58.2%) 867(58.2%) 867(58.2%)
Women 1244 (41.8%) 622 (41.8%) 622 (41.8%) 1.00
Deprivation score‡
1 311 (10.4%) 140 (9.4%) 171 (11.5%)
2 650 (21.8%) 327 (22.0%) 323 (21.7%)
3 769 (25.8%) 402 (27.0%) 367 (24.7%)
4 713 (23.9%) 356 (23.9%) 357 (24.0%)
5 305 (10.2%) 152 (10.2%) 153 (10.3%)
6 162 (5.4%) 77 (5.2%) 85 (5.7%)
7 68 (2.3%) 35 (2.4%) 33 (2.2%) 0.52
Family history risk of
cancer
Low 2664 (89.4%) 1215 (81.6%) 1449 (97.3%)
Medium 186 (6.2%) 170 (11.4%) 16 (1.1%)
High 22 (0.7%) 21 (1.4%) 1 (0.1%)
Unknown 71 (2.4%) 62 (4.2%) 9 (0.6%) <0.0005
Missing 35 (1.2%) 21 (1.4%) 14 (0.9%)
BMI (kg/m2) § 23.6 (4.4) 26.6 (4.3) 26.7 (4.6) 0.45
Physical activity
(hours/day)
(cycling and other
sport activities)
0 1646 (55.3%) 846 (56.8%) 800 (53.7%)
0-3.5 692 (23.2%) 337 (22.6%) 355 (23.8%)
3.5-7 322 (10.8%) 144 (9.7%) 178 (11.9%)
>7 198 (6.6%) 89 (6.0%) 109 (7.3%) 0.07
Missing 120 (4.0%) 73 (4.9%) 47 (3.1%)

Chapter six Results: Flavonoids, fatty acids and colorectal cancer
212
Smoking
No 1242 (41.7%) 606 (40.7%) 636 (42.7%)
Yes** 1701(57.1%) 862 (57.9%) 839 (56.3%) 0.32
Missing 35 (1.2%) 21 (1.4%) 14 (0.9%)
Dietary energy
intake (MJ/day) ††
10.9 (4.1%) 11.2 (4.2%) 10.6 (3.9%) 0.0002
Fibre intake (g/day)‡‡
22.4 (9.6) 22.3 (9.5) 22.4 (9.8) 0.90
Energy-adjusted
fibre intake (g/day)
21.9 (6.0) 21.4 (5.8) 22.3 (6.2) 0.0001
Alcohol intake
(g/day)§§
13.1 (15.6) 13.1 (16.1) 13.0 (15.1) 0.79
Energy-adjusted
alcohol intake
(g/day)***
12.9 (15.0) 12.8 (15.5) 13.0 (14.4) 0.36
NSAIDs intake†††
No 1939 (65.1%) 1019 (68.4%) 920 (61.8%)
Yes 1038 (34.8%) 469 (31.5%) 569 (38.2%) <0.0005
Missing 1 (0.0%) 1 (0.1%) 0 (0.0%)
* Mean values and in parentheses standard deviations for quantitative variables; number of subjects and in parenthesis
percentages for categorical variables.
† P-values from the Pearson χ2 for categorical variables; from t-test for continuous variables
‡ Locally based deprivation index (Carstairs deprivation index) based on the 2001 Census data; 7 categories ranging
from very low deprivation (deprivation score 1) to very high deprivation (deprivation score 7)
§ Missing data for 15 cases and 19 controls; T-test was applied after logarithmic transformation
** Smokers were defined as individuals who have smoked at least one cigarette per day and/ or one cigar per month
and/ or pipe.
†† T-test was applied after logarithmic transformation
‡‡ T-test was applied after logarithmic transformation
§§ T-test was applied after square-root transformation
*** T-test was applied after square-root transformation
††† Frequent use was defined as an intake of at least 4 days per week for at least one month.

Chapter six Results: Flavonoids, fatty acids and colorectal cancer
213
Table 63 Association between the confounding factors and colorectal cancer risk (univariable
conditional logistic regression analysis)
Confounding
variables
Categories Frequency Univariable analysis
cases controls OR 95% CI p-value
Family history
risk of cancer
Low 1215 1449 1.00
Medium/ High 191 17 13.21 7.68, 22.75 1.25x10⁻²⁰
BMI (kg/m2) continuous 1474 1470 0.99 0.98, 1.01 0.38
BMI (kg/m2) 18.5-25 573 531 1.00
<18.5 13 18 0.67 0.33, 1.38 0.28
25-30 629 644 0.90 0.77, 1.06 0.23
≥ 30 259 277 0.87 0.71, 1.07 0.18
p-value for trend 0.14
Physical activity
(hours/week)
0 1646 846 1.00
0-3.5 692 337 0.90 0.75, 1.08 0.25
3.5-7 322 144 0.75 0.59, 0.97 0.03
>7 198 89 0.77 0.56, 1.04 0.09
p-value for trend 0.009
Smoking No 606 636 1.00
Former 616 586 1.11 0.94, 1.31 0.22
Current 246 253 1.02 0.83, 1.25 0.88
p-value for trend 0.51
Dietary energy
intake (MJ/day)
continuous 1489 1489 1.03 1.01, 1.05 0.0005
Dietary energy
intake (MJ/day)
0- 8.28 352 393 1.00
8.28-10.17 345 399 0.98 0.80, 1.20 0.82
10.17- 12.73 389 356 1.25 1.02, 1.55 0.04
>12.73 403 341 1.34 1.09, 1.65 0.006
p-value for trend 0.001
Fibre intake
(g/day)
continuous 1489 1489 1.00 0.99, 1.01 0.83
Fibre intake
(g/day)
0- 16.10 382 381 1.00
16.10- 20.70 371 368 1.01 0.82, 1.23 0.95
20.70- 26.80 380 364 1.04 0.85, 1.28 0.68
>26.80 356 376 0.94 0.77, 1.16 0.58

Chapter six Results: Flavonoids, fatty acids and colorectal cancer
214
p-value for trend 0.68
Fibre intake
energy adjusted
(g/day)
continuous 1489 1489 0.97 0.96, 0.98 2.3x10⁻⁵
Fibre intake
energy adjusted
(g/day)
0- 17.45 392 353 1.00
17.45- 20.89 392 352 1.00 0.81, 1.22 0.97
20.89- 24.85 384 361 0.95 0.77, 1.17 0.61
>25.85 321 423 0.67 0.54, 0.83 3.6x10⁻⁵
p-value for trend 0.0001
Alcohol intake
(g/day)
continuous 1489 1489 1.00 0.99, 1.01 0.81
Alcohol intake
(g/day)
0-1.60 376 369 1.00
1.60-8.10 392 366 1.05 0.86, 1.28 0.63
8.10-18.80 362 369 0.95 0.78, 1.17 0.64
>18.80 359 385 0.89 0.72, 1.11 0.31
p-value for trend 0.24
Alcohol intake
energy adjusted
(g/day)
continuous 1489 1489 1.00 0.99, 1.00 0.76
Alcohol intake
energy adjusted
(g/day)
0-1.61 384 361 1.00
1.61-8.12 387 357 1.02 0.83, 1.25 0.87
8.12-18.85 368 377 0.91 0.74, 1.12 0.37
>18.85 350 394 0.81 0.65, 1.00 0.05
p-value for trend 0.04
NSAIDs intake No 1939 1019 1.00
Yes 1038 469 0.74 0.63, 0.86 0.0001
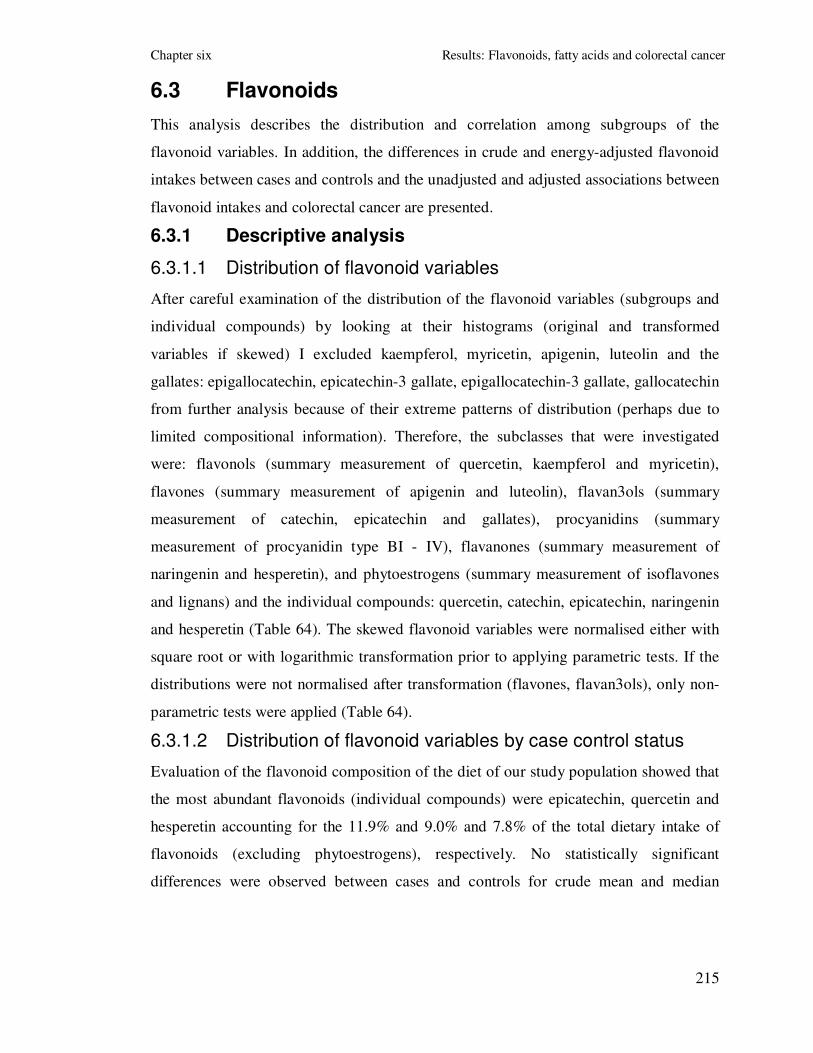
Chapter six Results: Flavonoids, fatty acids and colorectal cancer
215
6.3 Flavonoids
This analysis describes the distribution and correlation among subgroups of the
flavonoid variables. In addition, the differences in crude and energy-adjusted flavonoid
intakes between cases and controls and the unadjusted and adjusted associations between
flavonoid intakes and colorectal cancer are presented.
6.3.1 Descriptive analysis
6.3.1.1 Distribution of flavonoid variables
After careful examination of the distribution of the flavonoid variables (subgroups and
individual compounds) by looking at their histograms (original and transformed
variables if skewed) I excluded kaempferol, myricetin, apigenin, luteolin and the
gallates: epigallocatechin, epicatechin-3 gallate, epigallocatechin-3 gallate, gallocatechin
from further analysis because of their extreme patterns of distribution (perhaps due to
limited compositional information). Therefore, the subclasses that were investigated
were: flavonols (summary measurement of quercetin, kaempferol and myricetin),
flavones (summary measurement of apigenin and luteolin), flavan3ols (summary
measurement of catechin, epicatechin and gallates), procyanidins (summary
measurement of procyanidin type BI - IV), flavanones (summary measurement of
naringenin and hesperetin), and phytoestrogens (summary measurement of isoflavones
and lignans) and the individual compounds: quercetin, catechin, epicatechin, naringenin
and hesperetin (Table 64). The skewed flavonoid variables were normalised either with
square root or with logarithmic transformation prior to applying parametric tests. If the
distributions were not normalised after transformation (flavones, flavan3ols), only non-
parametric tests were applied (Table 64).
6.3.1.2 Distribution of flavonoid variables by case control status
Evaluation of the flavonoid composition of the diet of our study population showed that
the most abundant flavonoids (individual compounds) were epicatechin, quercetin and
hesperetin accounting for the 11.9% and 9.0% and 7.8% of the total dietary intake of
flavonoids (excluding phytoestrogens), respectively. No statistically significant
differences were observed between cases and controls for crude mean and median

Chapter six Results: Flavonoids, fatty acids and colorectal cancer
216
flavonoid intakes (Table 65). After energy adjustment (residual energy adjustment for
normal distributed flavonoid variables) cases reported a lower mean intake for flavonols
(p=0.02), flavanones (p=0.04), quercetin (p=0.004), catechin (p=0.003), naringenin
(p=0.04), and hesperetin (p=0.04). In addition cases reported a lower median intake for
flavonols (p=0.02), quercetin (p=0.004) and catechin (p=0.002) (Table 65).
6.3.1.3 Correlations between the flavonoid variables
Overall the flavonoid variables were highly correlated. The highest correlations were
observed between flavonols, flavan3ols, procyanidins, quercetin, catechin and
epicatechin, with r>0.7. In addition, flavanones, naringenin and hesperetin were highly
correlated with r>0.7. Phytoestrogens were not correlated with any of the flavonoid
subgroups or individual compounds (r≤0.15) (Table 66).
6.3.1.4 Main sources of flavonoid variables
The three main food sources (at individual food item level) of the flavonoid subgroups
were: 1) for flavonols: regular tea (64.3%), onions (9.1%), and soups- home made
(6.3%); 2) for flavones: soups- home made (78.2%), other salad vegetables (10.9%),
and meat or chicken pies, pasties, sausage roll (4.3%); 3) for flavan3ols: regular tea
(89.3%), apples (3.1%), and red wine (2.1%); 4) for procyanidins: regular tea (74.2%),
apples (11.2%), and red wine (8.4%); 5) for flavanones: oranges, satsumas or grapefruits
(69.3%), pure fruit juice (29.1%) and red wine (1.2%); and 6) for phytoestrogens: soya
milk (26.3%), wholemeal bread (including toast and sandwiches) (18.0%), soya beans,
TVP, Tofu or soya meat substitute (13.4%) (Table 67).
In addition the three main food sources of the flavonoid individual compounds were: 1)
for quercetin: regular tea (50.6%), red wine (13.3%) and soups- home made (9.0%); 2)
for catechin: regular tea (45.1%), red wine (16.2%) and other fruits (9.8%); 3) for
epicatechin: regular tea (67.5%), apples (11.7%), chocolate (6.1%); 4) for naringenin:
oranges, satsumas or grapefruits (70.5%), pure fruit juice (26.7%), red wine (2.1%); and
5) for hesperetin: oranges, satsumas or grapefruits (67.8%), pure fruit juice (31.5%) and
red wine (0.6%) (Table 67).

Chapter six Results: Flavonoids, fatty acids and colorectal cancer
217
6.3.2 Associations between flavonoid variables and
colorectal cancer risk
6.3.2.1 Main conditional logistic regression models
None of the flavonoid variables were significantly associated with colorectal cancer in
the crude model (Model I) (Table 68). In Model II, flavonols, procyanidins, quercetin,
catechin and epicatechin were significantly associated with a decreased colorectal cancer
risk (high vs. low quartile OR (95%): 0.77 (0.63-0.94), 0.80 (0.65-0.98), 0.71 (0.58-
0.88), 0.68 (0.55-0.83), 0.77 (0.63-0.94); respectively), and these associations were also
dose-dependant (p-value for trend: 0.02, 0.04, 0.002, 0.0001, 0.04; respectively) (Table
68). Quercetin and catechin showed also and inverse and dose-dependent association
with colorectal cancer risk in Model III (p-value for trend: 0.04 and 0.02; respectively)
with approximately a 25% reduction in risk for those of high versus those of low intake
(OR (95% CI): 0.77 (0.60-0.99), 0.75 (0.58-0.97); respectively) (Table 68). In distinct
contrast, there were no associations between flavones, flavanones and phytoestrogens
and colorectal cancer risk (p-value for trend 0.28, 0.39 and 0.87 respectively in model
III) (Table 68).
6.3.2.2 Additional conditional logistic regression models
Since these associations could be confounded by other compounds present in fruit and
vegetables or by the intake of other flavonoids we explored these relationships further in
two additional models (Model IV and V; Table 69). Model IV was corrected for the
confounding factors of model III and for fruit and vegetable intake (measures/day,
continuously, energy adjusted). The observed association with catechin remained
significant (high vs. low quartile OR (95% CI): 0.79 (0.61-1.03); p-value for trend 0.05)
(Table 69). The associations with flavonols, quercetin and epicatechin had the same
direction, but were marginally not statistically significant (high vs. low quartile OR
(95% CI): 0.81 (0.63-1.01), 0.82 (0.63-1.06), 0.78 (0.61-1.00), respectively) (Table 69).
In model V association were corrected for the confounding factors of model III and
further adjusted mutually between flavonoid categories. The observed associations
between flavonols, catechin, epicatechin and colorectal cancer became stronger and

Chapter six Results: Flavonoids, fatty acids and colorectal cancer
218
remained statistically significant (high vs. low quartile OR (95% CI), p-value for trend:
0.29 (0.16-0.54), 0.0001; 0.56 (0.37-0.86), 0.007; 0.46 (0.23-0.92), 0.03; respectively)
(Table 69).
6.3.2.3 Multiple testing corrections
Bonferroni correction for multiple testing
In model II, the inverse association with catechin (p-value 0.0001) remained significant
under every level of correction and the inverse association with quercetin (p-value
0.002) remained significant in the first two levels, but not after having considered all the
tests conducted in all 4 hypotheses (Table 68). In model V, the inverse association with
flavonols (p-value 0.0001) remained significant under every level of correction, whereas
the inverse association with catechin (p-value 0.007) remained significant only in the
first level of correction (Table 69).
FDR correction for multiple testing
After correcting for multiple testing using the FDR method the inverse associations that
remained significant were: with catechin (p=0.0001) and quercetin (p=0.002) in model II
(Table 68) and with flavonols (p=0.0001) and catechin (p=0.007) in model V (Table 69).
6.3.2.4 Associations between colorectal cancer and the main food
sources of flavonols, procyanidins, quercetin, catechin and
epicatechin
Intakes of the following food items were tested: regular tea, onions, apples and red wine.
Results from model III, showed that comparison of highest versus lowest quartile intakes
of these foods (tertiles for red wine intakes) showed ORs for colorectal cancer risk of
0.82 (95% CI 0.63, 1.06; p-value for trend 0.27) for regular tea; 0.92 (95% CI 0.72, 1.17;
p-value for trend 0.44) for onions; 0.97 (95% CI 0.75, 1.25; p-value for trend 0.77) for
apples; and 0.87 (95% CI 0.68, 1.11; p-value for trend 0.33) for red wine (Table 70).
6.3.2.5 Associations between the flavonoid variables and colorectal
cancer after sex, age and cancer site stratification
Associations between each flavonoid variable and colorectal cancer risk were tested
after sex, age and cancer site stratification by applying model III (data not shown). Sex-

Chapter six Results: Flavonoids, fatty acids and colorectal cancer
219
specific associations were similar for almost all flavonoid subgroups and individual
compounds. However, high intake of phytoestrogens was associated with a non
statistically significant decrease in colorectal cancer risk for men (high vs. low intake
OR (95% CI), p-value for trend: 0.80 (0.58, 1.10), 0.14), but with a not statistically
significant increase in colorectal cancer risk for women (high vs. low intake OR (95%
CI), p-value for trend: 1.55 (1.02, 2.36), 0.06) (data not shown). Intakes of flavonols,
procyanidins, quercetin, catechin and epicatechin were significantly and dose-
dependently associated with a decreased risk of colorectal cancer for the individuals
older than 55 years old (data not shown). However, associations were not as clear for the
individuals younger than 55 years old, with none of them reaching the 0.05 significance
level (data not shown). Finally, after cancer site stratification, flavonols, procyanidins,
quercetin, catechin and epicatechin were found to be inversely though not significantly
associated with both colon and rectal cancer (data not shown).
6.3.3 Summary of results
Moderately strong inverse associations which showed dose response relationships were
found: 1) in model II: between colorectal cancer risk and intakes of flavonols (p=0.02),
procyanidins (p=0.04), quercetin (p=0.002), catechin (p=0.0001) and epicatechin
(p=0.04) (Table 68); 2) in model III: between colorectal cancer and intakes of quercetin
(p=0.04) and catechin (p=0.02) (Table 68); 3) in model IV between colorectal cancer
and catechin (p=0.05) (Table 69); 4) in model V between colorectal cancer and intakes
of flavonols (p=0.0001), catechin (p=0.007) and epicatechin (p=0.03) (Table 69). In
marked contrast we showed no associations between intakes of the other four of the six
flavonoid subgroups studied (flavones, flavan3ols, flavanones and phytoestrogens) and
colorectal cancer risk (Table 68, Table 69).
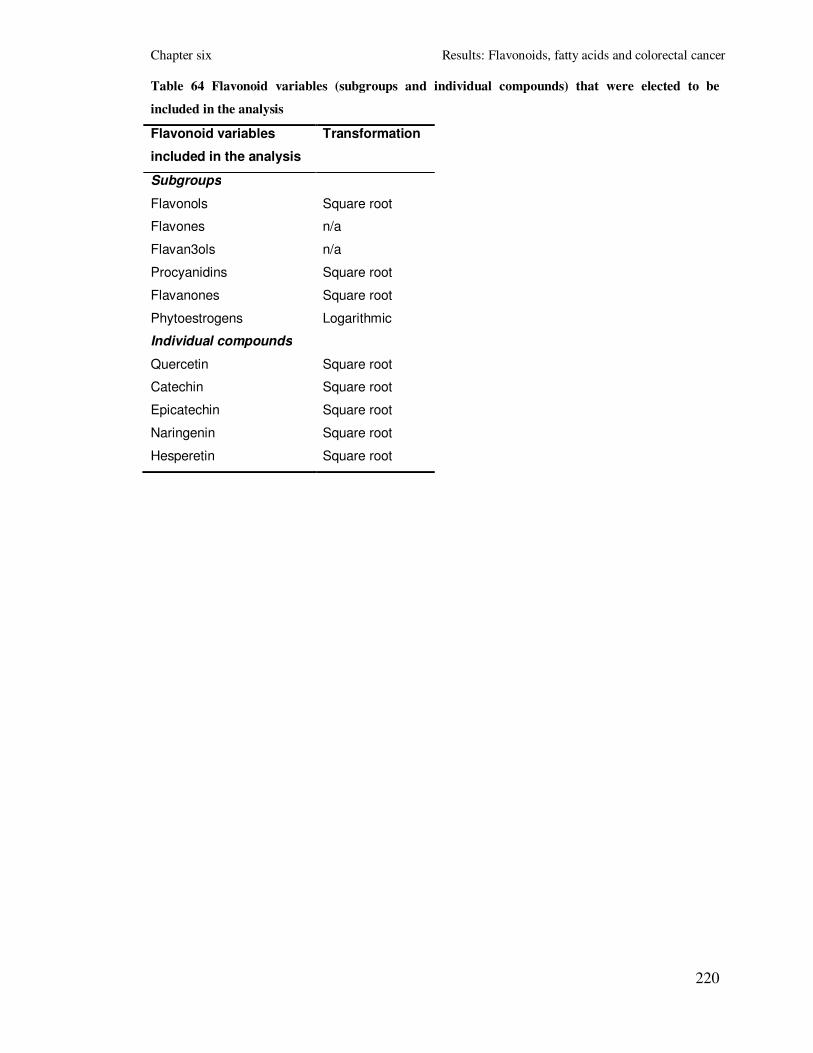
Chapter six Results: Flavonoids, fatty acids and colorectal cancer
220
Table 64 Flavonoid variables (subgroups and individual compounds) that were elected to be
included in the analysis
Flavonoid variables
included in the analysis
Transformation
Subgroups
Flavonols Square root
Flavones n/a
Flavan3ols n/a
Procyanidins Square root
Flavanones Square root
Phytoestrogens Logarithmic
Individual compounds
Quercetin Square root
Catechin Square root
Epicatechin Square root
Naringenin Square root
Hesperetin Square root

Chapter six Results: Flavonoids, fatty acids and colorectal cancer
221
Table 65 Descriptive report of crude and energy-adjusted flavonoid intakes
Flavonoids All subjects
(n=2978)
Cases
(n=1489)
Controls
(n=1489)
T-test Wilcoxon
rank test
Mean
(SD)
Median
(IQR)
Mean
(SD)
Median
(IQR)
Mean
(SD)
Median (IQR) p-value p-value
Subgroups
Flavonols (mg/day) 26.5
(13.3)
26.9
(15.4, 36.5)
26.2
(13.2)
26.8
(15.1, 36.3)
26.8
(13.3)
27.1
(15.8, 36.9)
0.28 0.28
Flavonols- energy
adjusted (mg/day)
26.3
(12.5)
27.1
(15.6, 36.3)
25.8
(12.4)
26.5
(14.9, 35.9)
26.9
(12.6)
27.7
(16.1, 37.0)
0.02 0.02
Flavones (mg/day) 1.3 (1.2) 1.0
(0.5, 1.9)
1.4 (1.3) 1.1
(0.5, 1.9)
1.3 (1.1) 1
(0.5, 1.8)
n/a 0.14
Flavones- energy adjusted
(mg/day)
n/a n/a n/a n/a n/a n/a n/a n/a
Flavan3ols (mg/day) 105.9
(66.7)
115.0
(42.0, 161.3)
105.5
(66.3)
115.2
(42.0, 159.8)
106.3
(67.1)
114.4
(42.1, 163.7)
n/a 0.72
Flavan3ols- energy
adjusted (mg/day)
n/a n/a n/a n/a n/a n/a n/a n/a
Procyanidins (mg/day) 31.3
(17.7)
32.2
(16.3, 45.3)
30.9
(17.7)
31.9
(15.9, 45.0)
31.6
(17.7)
32.5
(16.7, 45.6)
0.40 0.30
Procyanidins- energy
adjusted (mg/day)
31.2
(17.4)
32.3
(16.4, 45.0)
30.6
(17.2)
31.8
(15.8, 43.8)
31.7
(17.5)
33.3
(16.9, 45.7)
0.09 0.08
Flavanones (mg/day)
29.3
(31.9)
20.3
(7.5, 40.5)
28.3
(30.6)
20.1
(8.1, 39.4)
30.3
(33.1)
20.6
(6.7, 42.1)
0.51 0.61
Flavanones- energy
adjusted (mg/day)
29.1
(31.0)
20.5
(7.7, 40.9)
28.0
(29.8)
19.9
(8.5, 38.1)
30.3
(32.2)
21.3
(7.2, 42.7)
0.04 0.27
Phytoestrogens (µg/day) 1075.2 596.0 981.6 593.1 1168 599.3 0.73 0.84

Chapter six Results: Flavonoids, fatty acids and colorectal cancer
222
(3490.3) (393.8, 875.4) (2674.8) (407.2, 860.4) (4147.5) (384.5, 889.5)
Phytoestrogens- energy
adjusted (µg/day)
1059.2
(3732.6)
581.7
(401.3, 856.5)
925.5
(2345.3)
570.7
(404.1, 832.1)
1192.9
(4726.3)
596.0
(400.3, 885.2)
0.45 0.27
Individual compounds
Quercetin (mg/day) 17.6
(8.4)
17.5
(11.4, 22.8)
17.4
(8.4)
17.3
(11.3, 22.8)
17.8
(8.4)
17.8
(11.5, 22.8)
0.22 0.19
Quercetin- energy
adjusted (mg/day
17.4
(7.6)
17.6
(11.5, 22.8)
17.0
(7.5)
17.2
(11.1, 22.3)
17.8
(7.7)
18.0
(12.0, 23.4)
0.004 0.004
Catechin (mg/day) 7.5
(4.1)
7.1
(4.7, 9.5)
7.4
(4.0)
7.0
(4.7, 9.3)
7.6
(4.2)
7.2
(4.9, 9.7)
0.12 0.08
Catechin- energy adjusted
(mg/day)
7.4
(3.9)
7.2
(4.8, 9.4)
7.2
(3.8)
7.0
(4.6, 9.0)
7.7
(3.9)
7.4
(5.0, 9.7)
0.003 0.002
Epicatechin (mg/day) 23.2
(12.3)
23.9
(13.0, 32.7)
23.0
(12.3)
23.9
(12.7, 32.3)
23.4
(12.3)
24.0
(13.2, 33.0)
0.55 0.33
Epicatechin- energy
adjusted (mg/day)
23.1
(11.9)
24.0
(12.9, 32.5)
22.7
(11.7)
23.4
(12.6, 31.8)
23.5
(12.0)
24.3
(13.2, 33.2)
0.07 0.06
Naringenin (mg/day) 14.2
(15.6)
9.9
(3.7, 19.9)
13.7
(14.9)
9.9
(4.0, 18.9)
14.7
(16.2)
9.9
(3.3, 21.0)
0.48 0.64
Naringenin- energy
adjusted (mg/day)
14.1
(15.2)
9.9
(3.8, 19.7)
13.5
(14.6)
9.6
(4.0, 18.3)
14.7
(15.7)
10.2
(3.6, 20.9)
0.04 0.27
Hesperetin (mg/day) 15.1
(16.3)
10.5
(3.8, 20.8)
14.6
(15.6)
10.4
(4.1, 20.5)
15.6
(16.9)
10.6
(3.4, 21.5)
0.55 0.61
Hesperetin- energy
adjusted (mg/day)
15.0
(15.9)
10.6
(3.9, 21.1)
14.4
(15.3)
10.3
(4.2, 19.9)
15.6
(16.5)
11.0
(3.6, 21.9)
0.04 0.29

Chapter six Results: Flavonoids, fatty acids and colorectal cancer
223
Table 66 Spearman rank correlation coefficients between flavonoid variables (n=2978, all p-values<5x10⁻⁵)
Flavonoids Flavonols Flavones Flavan3ols Procyanidins Flavanones Phytoestr. Quercetin Catechin Epicatechin Naringenin Hesperetin
Flavonols 1.00
Flavones 0.26 1.00
Flavan3ols 0.94 0.08 1.00
Procyanidins 0.92 0.09 0.95 1.00
Flavanones 0.08 0.16 0.02 0.07 1.00
Phytoestrogens 0.13 0.12 0.08 0.09 0.11 1.00
Quercetin 0.98 0.35 0.86 0.87 0.15 0.15 1.00
Catechin 0.71 0.15 0.72 0.81 0.11 0.11 0.70 1.00
Epicatechin 0.93 0.10 0.96 0.96 0.11 0.11 0.88 0.79 1.00
Naringenin 0.08 0.16 0.02 0.07 1.00 0.11 0.15 0.23 0.11 1.00
Hesperetin 0.08 0.16 0.02 0.06 1.00 0.10 0.15 0.21 0.11 1.00 1.00

Chapter six Results: Flavonoids, fatty acids and colorectal cancer
224
Table 67 Three main dietary (food) sources of flavonoids in our population
Flavonoids Main sources
Flavonols Regular tea (62.3%)
Onions (8.8%)
Soups- home made (6.1%)
Flavones Soups- home made (77.8%)
Other salad vegetables (11.5%)
Meat or chicken pies, pasties, sausage roll (4.1%)*
Flavan3ols Regular tea (88.6%)
Apples (3.0%)
Red wine (2.0%)
Procyanidins Regular tea (72.9%)
Apples (12.7%)
Red wine (8.4%)
Flavanones Oranges, satsumas or grapefruits (69.1%)
Pure fruit juice (29.1%)
Red wine (1.3%)
Phytoestrogens Soya milk (24.6%)
Wholemeal bread (including toast and sandwiches) (18.0%)
Soya beans, TVP, Tofu or soya meat substitute (12.5%)
Quercetin Regular tea (50.6%)
Onions (13.3%)
Soups- home made (9.0%)
Catechin Regular tea (45.1%)
Red wine (16.2%)
Other fruits (9.8%)
Epicatechin Tea (67.5%)
Apples (11.7%)
Chocolate (6.1%)
Naringenin Oranges, satsumas or grapefruits (70.5%)
Pure fruit juice (26.7%)
Red wine (2.1%)
Hesperetin Oranges, satsumas or grapefruits (67.8%)
Pure fruit juice (31.5%)
Red wine (0.6%)
* Flavones probably come from suede or parsley that are usual ingredients of these foods

Chapter six Results: Flavonoids, fatty acids and colorectal cancer
225
Table 68 Association between the flavonoid variables and colorectal cancer risk in the whole sample (3 main conditional logistic regression
models; Cases and controls matched on age, gender and area of residence)
Flavonoids Quartiles* Frequency Model I
† Model II
‡ Model III§
cases controls OR 95% CI OR 95% CI OR 95% CI
Flavonols
(mg/day)
0 - 15.59 392 353 1.00 1.00 1.00
15.59 - 27.09 373 371 0.90 0.73, 1.11 0.90 0.74, 1.11 0.88 0.69, 1.13
27.09 - 36.34 381 364 0.95 0.77, 1.16 0.94 0.76, 1.15 0.92 0.72, 1.17
> 36.75 343 401 0.87 0.71, 1.07 0.77 0.63, 0.94 0.78 0.60, 0.99
p-value for trend (quartiles) 0.27 0.02 0.08
p-value for trend (continuous) 0.27 0.02 0.16
Flavones
(mg/day)
0-0.5 424 427 1.00 1.00 1.00
0.5-1.0 317 332 0.96 0.78, 1.18 0.93 0.76, 1.14 0.91 0.71, 1.16
1.0-1.9 380 403 0.95 0.78, 1.16 0.90 0.74, 1.10 1.04 0.82, 1.31
>1.9 368 327 1.13 0.93, 1.38 0.99 0.80, 1.23 1.14 0.87, 1.48
p-value for trend (quartiles) 0.32 0.78 0.28
p-value for trend (continuous) 0.018 0.32 0.11
Flavan3ols
(mg/day)
0-42 374 372 1.00 1.00 1.00
42-114.95 366 377 0.97 0.79, 1.20 0.97 0.78, 1.19 0.95 0.74, 1.22
114.95-161.3 393 352 1.12 0.91, 1.38 1.11 0.90, 1.37 1.09 0.85, 1.40
>161.3 356 388 0.92 0.75, 1.12 0.86 0.70, 1.05 0.81 0.63, 1.04
p-value for trend (quartiles) 0.68 0.32 0.22
p-value for trend (continuous) 0.74 0.34 0.30
Procyanidins
(mg/day)
0-16.40 384 361 1.00 1.00 1.00
16.40-32.34 380 364 0.97 0.79, 1.19 0.97 0.79, 1.20 0.94 0.74, 1.21
32.34-45.01 384 361 1.01 0.83, 1.24 1.00 0.82, 1.22 1.00 0.79, 1.27
>45.01 341 403 0.89 0.73, 1.10 0.80 0.65, 0.98 0.82 0.64, 1.05
p-value for trend (quartiles) 0.37 0.04 0.19

Chapter six Results: Flavonoids, fatty acids and colorectal cancer
226
p-value for trend (continuous) 0.31 0.09 0.31
Flavanones
(mg/day)
0-7.69 353 392 1.00 1.00 1.00
7.69-20.51 404 340 1.36 1.11, 1.67 1.33 1.08, 1.63 1.52 1.19, 1.95
20.51-40.86 388 357 1.26 1.03, 1.54 1.21 0.98, 1.49 1.46 1.13, 1.88
>40.86 344 400 0.98 0.80, 1.20 0.95 0.77, 1.17 1.15 0.88, 1.51
p-value for trend (quartiles) 0.78 0.48 0.39
p-value for trend (continuous) 0.09 0.04 0.67
Phytoestrogens
(µg/day)
0-401.33 368 377 1.00 1.00 1.00
401.33-581.70 403 341 1.29 1.05, 1.59 1.22 0.99, 1.50 1.18 0.92, 1.50
581.70-856.39 372 373 1.17 0.95, 1.43 1.02 0.83, 1.26 1.12 0.87, 1.42
>856.39 346 398 1.04 0.84, 1.28 0.90 0.73, 1.10 1.04 0.81, 1.34
p-value for trend (quartiles) 0.97 0.11 0.87
p-value for trend (continuous) 0.15 0.06 0.51
Quercetin
(mg/day)
0-11.53 392 353 1.00 1.00 1.00
11.53-17.63 387 357 0.96 0.78, .18 0.98 0.80, 1.20 0.97 0.76, 1.24
17.63-22.80 379 366 0.91 0.74, 1.11 0.93 0.76, 1.15 0.90 0.70, 1.14
>22.80 331 413 0.93 0.75, 1.14 0.71 0.58, 0.88 0.77 0.60, 0.99
p-value for trend (quartiles) 0.37 0.002 0.04
p-value for trend (continuous) 0.20 0.004 0.12
Catechin
(mg/day)
0-4.84 405 340 1.00 1.00 1.00
4.84-7.21 385 359 0.90 0.73, 1.10 0.89 0.73, 1.10 0.87 0.68, 1.11
7.21-9.40 367 378 0.96 0.78, 1.17 0.82 0.67, 1.01 0.79 0.62, 1.00
>9.40 332 412 0.82 0.67, 1.00 0.68 0.55, 0.83 0.75 0.58, 0.97
p-value for trend (quartiles) 0.11 0.0001 0.02
p-value for trend (continuous) 0.08 0.004 0.19
Epicatechin
(mg/day)
0-12.90 385 360 1.00 1.00 1.00
12.90-24.05 374 370 0.91 0.74, 1.12 0.95 0.77, 1.17 0.95 0.74, 1.21
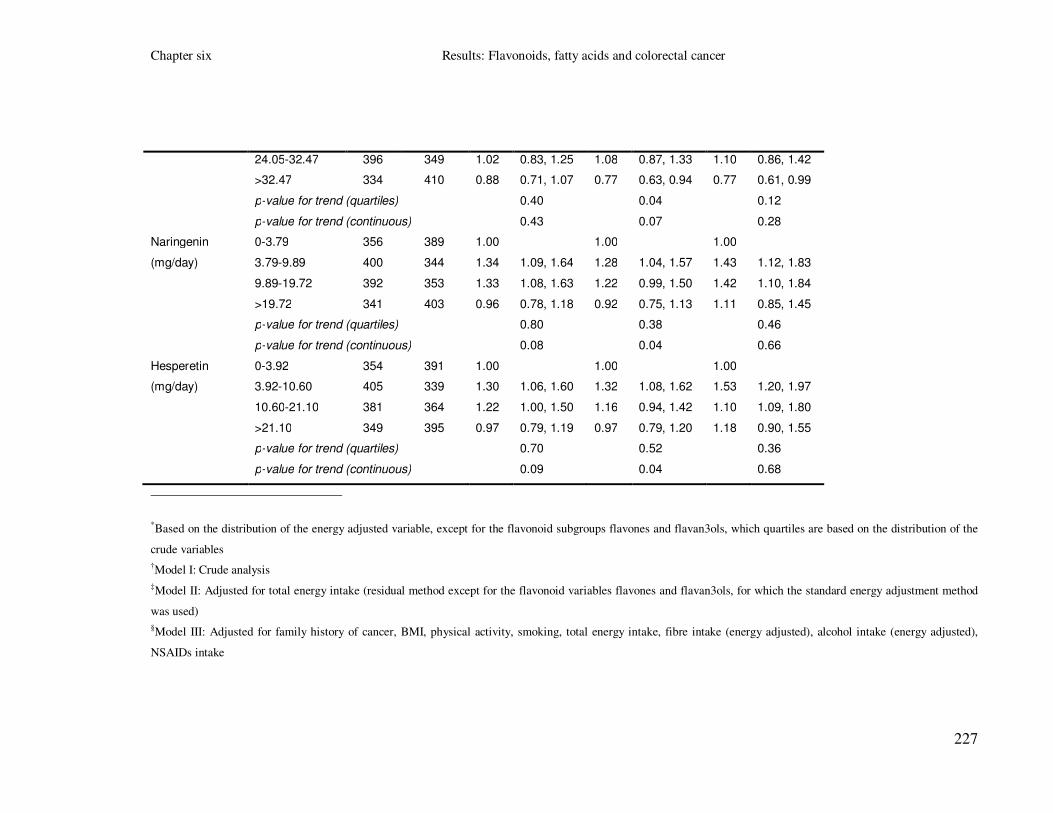
Chapter six Results: Flavonoids, fatty acids and colorectal cancer
227
24.05-32.47 396 349 1.02 0.83, 1.25 1.08 0.87, 1.33 1.10 0.86, 1.42
>32.47 334 410 0.88 0.71, 1.07 0.77 0.63, 0.94 0.77 0.61, 0.99
p-value for trend (quartiles) 0.40 0.04 0.12
p-value for trend (continuous) 0.43 0.07 0.28
Naringenin
(mg/day)
0-3.79 356 389 1.00 1.00 1.00
3.79-9.89 400 344 1.34 1.09, 1.64 1.28 1.04, 1.57 1.43 1.12, 1.83
9.89-19.72 392 353 1.33 1.08, 1.63 1.22 0.99, 1.50 1.42 1.10, 1.84
>19.72 341 403 0.96 0.78, 1.18 0.92 0.75, 1.13 1.11 0.85, 1.45
p-value for trend (quartiles) 0.80 0.38 0.46
p-value for trend (continuous) 0.08 0.04 0.66
Hesperetin
(mg/day)
0-3.92 354 391 1.00 1.00 1.00
3.92-10.60 405 339 1.30 1.06, 1.60 1.32 1.08, 1.62 1.53 1.20, 1.97
10.60-21.10 381 364 1.22 1.00, 1.50 1.16 0.94, 1.42 1.10 1.09, 1.80
>21.10 349 395 0.97 0.79, 1.19 0.97 0.79, 1.20 1.18 0.90, 1.55
p-value for trend (quartiles) 0.70 0.52 0.36
p-value for trend (continuous) 0.09 0.04 0.68
*Based on the distribution of the energy adjusted variable, except for the flavonoid subgroups flavones and flavan3ols, which quartiles are based on the distribution of the
crude variables
†Model I: Crude analysis
‡Model II: Adjusted for total energy intake (residual method except for the flavonoid variables flavones and flavan3ols, for which the standard energy adjustment method
was used)
§Model III: Adjusted for family history of cancer, BMI, physical activity, smoking, total energy intake, fibre intake (energy adjusted), alcohol intake (energy adjusted),
NSAIDs intake

Chapter six Results: Flavonoids, fatty acids and colorectal cancer
228
Table 69 Association between the flavonoid variables and colorectal cancer risk in the whole sample
(2 additional conditional logistic regression models; Cases and controls matched on age, gender and
area of residence)
Flavonoids Quartiles* Frequency Model IV
† Model V
‡
cases controls OR 95% CI OR 95% CI
Flavonols
(mg/day)
0 - 15.59 392 353 1.00 1.00
15.59 - 27.09 373 371 0.90 0.71, 1.15 0.63 0.45, 0.87
27.09 - 36.34 381 364 0.94 0.74, 1.20 0.46 0.29, 0.74
> 36.75 343 401 0.81 0.63, 1.01 0.29 0.16, 0.54
p-value for trend (quartiles) 0.15 0.0001
p-value for trend (continuous) 0.30 7.1x10⁻⁵
Flavones
(mg/day)
0-0.5 424 427 1.00 1.00
0.5-1.0 317 332 0.93 0.73, 1.19 0.93 0.73, 1.19
1.0-1.9 380 403 1.05 0.83, 1.33 1.12 0.88, 1.44
>1.9 368 327 1.14 0.88, 1.49 1.31 0.98, 1.75
p-value for trend (quartiles) 0.28 0.05
p-value for trend (continuous) 0.11 0.006
Flavan3ols
(mg/day)
0-42 374 372 1.00 1.00
42-114.95 366 377 0.95 0.74, 1.23 1.11 0.79, 1.56
114.95-161.3 393 352 1.09 0.85, 1.41 1.51 0.90, 2.52
>161.3 356 388 0.81 0.63, 1.04 1.26 0.63, 2.50
p-value for trend (quartiles) 0.22 0.51
p-value for trend (continuous) 0.32 0.03
Procyanidins
(mg/day)
0-16.40 384 361 1.00 1.00
16.40-32.34 380 364 0.95 0.74, 1.22 0.91 0.64, 1.28
32.34-45.01 384 361 1.01 0.80, 1.29 0.93 0.56, 1.52
>45.01 341 403 0.84 0.65, 1.07 0.74 0.39, 1.43
p-value for trend (quartiles) 0.24 0.37
p-value for trend (continuous) 0.40 0.97
Flavanones
(mg/day)
0-7.69 353 392 1.00 1.00
7.69-20.51 404 340 1.53 1.20, 1.97 1.52 1.18, 1.95
20.51-40.86 388 357 1.48 1.15, 1.91 1.52 1.10, 1.84
>40.86 344 400 1.21 0.92, 1.59 1.14 0.87, 1.50
p-value for trend (quartiles) 0.21 0.44
p-value for trend (continuous) 0.82 0.68
Phytoestrogens
(µg/day)
0-401.33 368 377 1.00 1.00
401.33-581.70 403 341 1.14 0.89, 1.46 1.16 0.91, 1.49
581.70-856.39 372 373 1.03 0.81, 1.33 1.10 0.85, 1.41
>856.39 346 398 0.93 0.72, 1.21 1.04 0.80, 1.34
p-value for trend (quartiles) 0.46 0.92

Chapter six Results: Flavonoids, fatty acids and colorectal cancer
229
p-value for trend (continuous) 0.39 0.48
Quercetin
(mg/day)
0-11.53 392 353 1.00 1.00
11.53-17.63 387 357 1.00 0.78, 1.27 0.89 0.63, 1.26
17.63-22.80 379 366 0.92 0.72, 1.18 0.72 0.43, 1.20
>22.80 331 413 0.82 0.63, 1.06 0.57 0.28, 1.17
p-value for trend (quartiles) 0.10 0.10
p-value for trend (continuous) 0.32 0.43
Catechin
(mg/day)
0-4.84 405 340 1.00 1.00
4.84-7.21 385 359 0.88 0.69, 1.13 0.77 0.58, 1.03
7.21-9.40 367 378 0.80 0.62, 1.02 0.65 0.45, 0.92
>9.40 332 412 0.79 0.61, 1.03 0.56 0.37, 0.86
p-value for trend (quartiles) 0.05 0.007
p-value for trend (continuous) 0.41 0.14
Epicatechin
(mg/day)
0-12.90 385 360 1.00 1.00
12.90-24.05 374 370 0.96 0.75, 1.23 0.77 0.54, 1.09
24.05-32.47 396 349 1.13 0.88, 1.45 0.77 0.46, 1.30
>32.47 334 410 0.78 0.61, 1.00 0.46 0.23, 0.92
p-value for trend (quartiles) 0.15 0.03
p-value for trend (continuous) 0.36 0.52
Naringenin
(mg/day)
0-3.79 356 389 1.00 1.00
3.79-9.89 400 344 1.44 1.12, 1.85 1.44 1.11, 1.87
9.89-19.72 392 353 1.45 1.12, 1.87 1.42 1.06, 1.89
>19.72 341 403 1.17 0.89, 1.54 1.15 0.74, 1.79
p-value for trend (quartiles) 0.25 0.14
p-value for trend (continuous) 0.82 0.99
Hesperetin
(mg/day)
0-3.92 354 391 1.00 1.00
3.92-10.60 405 339 1.54 1.20, 1.98 1.56 1.20, 2.02
10.60-21.10 381 364 1.42 1.10, 1.84 1.43 1.07, 1.91
>21.10 349 395 1.25 0.95, 1.64 1.32 0.85, 2.06
p-value for trend (quartiles) 0.19 0.08
p-value for trend (continuous) 0.82 0.99
* Based on the distribution of the energy adjusted variable, except for the flavonoid subgroups flavones and
flavan3ols, which quartiles are based on the distribution of the crude variables
† Model IV: Adjusted for family history of cancer, BMI, physical activity, smoking, total energy intake, fibre intake
(energy adjusted), alcohol intake (energy adjusted), NSAIDs intake and fruit and vegetable intake (energy adjusted)
‡ Model V: Adjusted for family history of cancer, BMI, physical activity, smoking, total energy intake, fibre intake
(energy adjusted), alcohol intake (energy adjusted), NSAIDs intake and mutually adjusted for other flavonoid
subgroups.

Chapter six Results: Flavonoids, fatty acids and colorectal cancer
230
Table 70 Association between intakes of tea, onions, apples and red wine and colorectal cancer risk in the whole sample (3 main conditional logistic regression
models; Cases and controls matched on age, gender and area of residence)
Food items Quartiles* Frequency Model I
† Model II
‡ Model III§
cases controls OR 95% CI OR 95% CI OR 95% CI
Regular tea
(m/day**)
0-0.85 376 373 1.00 1.00 1.00
0.85-3 553 557 0.99 0.82, 1.20 0.99 0.82, 1.20 0.93 0.74, 1.17
3-4 265 243 1.09 0.86, 1.37 1.05 0.83, 1.33 1.09 0.82, 1.44
>4 295 316 0.93 0.75, 1.15 0.89 0.72, 1.10 0.82 0.63, 1.06
p-value for trend (quartiles) 0.70 0.40 0.27
p-value for trend (continuous) 0.90 0.58 0.36
Onions
(m/day)
0-0.14 553 552 1.00 1.00 1.00
0.14-0.28 266 260 1.02 0.83, 1.26 1.00 0.81, 1.24 1.01 0.78, 1.29
0.28-0.57 325 322 1.01 0.83, 1.22 0.97 0.80, 1.18 0.94 0.74, 1.19
>0.57 345 355 0.97 0.80, 1.17 0.87 0.72, 1.07 0.92 0.72, 1.17
p-value for trend (quartiles) 0.78 0.21 0.44
p-value for trend (continuous) 0.02 0.0002 0.03
Apples
(m/day)
0-0.05 494 501 1.00 1.00 1.00
0.05-0.28 423 377 1.14 0.94, 1.37 1.13 0.93, 1.36 1.16 0.92, 1.45
0.28-0.57 267 262 1.04 0.84, 1.28 1.01 0.82, 1.25 1.07 0.83, 1.40
>0.57 305 349 0.89 0.73, 1.08 0.84 0.69, 1.03 0.97 0.75, 1.25
p-value for trend (quartiles) 0.23 0.09 0.77
p-value for trend (continuous) 0.12 0.02 0.32
Red wine
(m/day)
0 939 877 1.00 1.00 1.00
0-1.5 238 246 0.90 0.73, 1.10 0.89 0.73, 1.09 0.99 0.77, 1.25
>1.5 312 366 0.79 0.66, 0.95 0.78 0.65, 0.93 0.87 0.68, 1.11
p-value for trend (quartiles) 0.01 0.007 0.33

Chapter six Results: Flavonoids, fatty acids and colorectal cancer
231
p-value for trend (continuous) 0.15 0.10 0.45
*Based on the distribution of the crude variables
†Model I: Crude analysis
‡Model II: Adjusted for total energy intake (standard method)
§Model III: Adjusted for family history of cancer, BMI, physical activity, smoking, total energy intake, fibre intake (energy adjusted), alcohol intake (energy adjusted), NSAIDs intake
** m/day: measures per day

Chapter six Results: Flavonoids, fatty acids and colorectal cancer
232
6.4 Fatty acids
This analysis describes the distribution and correlation of the fatty acid variables. In
addition, the differences in crude and energy-adjusted fatty acid intakes between
cases and controls and the unadjusted and adjusted associations between fatty acid
intakes and colorectal cancer are presented.
6.4.1 Descriptive analysis
6.4.1.1 Distribution of fatty acid variables
After careful examination of the distribution of the fatty acid variables (total,
subgroups and individual compounds) by looking at their histograms (original and
transformed variables if skewed) we elected to study the following variables: total
FAs; seven fatty acid subgroups: SFAs, MUFAs, PUFAs, ω6PUFAs, ω3PUFAs,
tFAs and tMUFAs; and nine individual fatty acid compounds: palmitic and stearic
acids (SFAs), oleic acid (MUFAs), linoleic, γ-linolenic and arachidonic acids
(ω6PUFAs) and α-linolenic, EPA and DHA (ω3PUFAs) (
Table 71). For total FAs, the subgroups ω6 and ω3PUFAs and the individual
compounds EPA and DHA, dietary and total (diet and supplements) intakes were
available.
6.4.1.2 Distribution of fatty acid variables by case control status
Evaluation of the fatty acid composition of the diet of our study population showed
that the most abundant fatty acids (individual compounds) were oleic, palmitic and
stearic acids, accounting for the 29.4%, 22.0% and 10.2% of the total dietary intake
of fatty acids respectively. For crude fatty acid intakes, cases reported a higher mean
intake for total FAs (p<5x10⁻⁵), the subgroups: SFAs (p<5x10⁻⁵), MUFAs (p<5x10-
5), PUFAs (p=0.004), ω6PUFAs (p=0.001), tFAs (p<5x10
-5), tMUFAs (p<5x10
-5)
and the individual fatty acids: palmitic (p<5x10⁻⁵
), stearic (p<5x10⁻⁵
), oleic (p<5x10-
5), linoleic (p=0.001), γ-linolenic (p=0.007), arachidonic (p=0.0008) and α-linolenic
(p=0.02) (Table 72). In addition, cases reported a higher median intake for total FAs
(p<5x10⁻⁵), the subgroups: SFAs (p<5x10⁻⁵), MUFAs (p<5x10⁻⁵), PUFAs (p=0.009),
ω6PUFAs (p=0.004), tFAs (p<5x10⁻⁵), tMUFAs (p<5x10⁻⁵) and the individual fatty

Chapter six Results: Flavonoids, fatty acids and colorectal cancer
233
acids: palmitic (p<5x10⁻⁵
), stearic (p<5x10⁻⁵
), oleic (p<5x10⁻⁵
), linoleic (p=0.0045),
γ-linolenic (p=0.01), arachidonic (p=0.0025), α-linolenic (p=0.03) and a lower
median intake for the individual fatty acid of EPA (p=0.05) (Table 72).
After energy adjustment (residual) cases reported a higher mean intake for total FAs
(p=0.0018), the subgroups: SFAs (p=0.0001), MUFAs (p=0.03), tFAs (=0.0026),
tMUFAs (p=0.0003) and the individual fatty acids: palmitic (p=0.0003), stearic
(p=0.0001), oleic (p=0.0062) and a lower mean intake for the subgroup of ω3PUFAs
(p<5x10⁻⁵) and the individual fatty acids of EPA (p<5x10⁻⁵) and DHA (p<5x10⁻⁵)
(Table 72). In addition cases reported a higher median intake for total FAs
(p=0.0005), the subgroups: SFAs (p=0.0001), MUFAs (p=0.01), tFAs (=0.001),
tMUFAs (p<5x10⁻⁵
) and the individual fatty acids: palmitic (p=0.0002), stearic
(p=0.0001), oleic (p=0.002) and a lower median intake for the subgroup of
ω3PUFAs (p<5x10⁻⁵) and the individual fatty acids of EPA (p<5x10⁻⁵) and DHA
(p<5x10⁻⁵) (Table 72).
6.4.1.3 Correlations between the fatty acid variables
Overall they were highly correlated. The highest correlations were observed between
total FAs, SFAs, MUFAs, PUFAs, tFAs, tMUFAs, palmitic acid, stearic acid, oleic
acid with r>0.7. In addition, EPA, DHA and ω3PUFAs were highly correlated with
r>0.8 (Table 73).
6.4.1.4 Main sources of fatty acid variables
For fatty acid variables food sources data were not available for individual food
items. The three main food sources (at food group level) of total FAs were: meat and
meat products (18.0%), spreads1 and cooking oils (13.4%) and confectionery and
savoury snacks (8.3%). The three main food sources of the fatty acid subgroups
were: 1) for SFAs: meat and meat products (17.5%), spreads and cooking oils
(13.1%) and cheese (10.3%); 2) for MUFAs: meat and meat products (19.7%),
spreads and cooking oils (13.7%), fish and fish dishes (8.5%); 3) for PUFAs: meat
and meat products (15.3%), spreads and cooking oils (13.5%), confectionery and
savoury snacks (11.4%); 4) for ω6PUFAs: spreads and cooking oils (15.2%), meat
and meat products (14.8%), confectionery and savoury snacks (10.2%); 5) for
1 Including butter, margarine, jam, honey, marmalade, yeast or meat extract, peanut butter, and chocolate spread

Chapter six Results: Flavonoids, fatty acids and colorectal cancer
234
ω3PUFAs: fish and fish dishes (30.3%), meat and meat products (16.2%) and
vegetables (13.1%); 6) for tFAs: spreads and cooking oils (20.7%), confectionery
and savoury snacks (15.7%) and meat and meat products (15.4%); and 7) for
tMUFAs: spreads and cooking oils (25.2%), meat and meat products (14.6%) and
cheese (11.9%) (Table 74).
Finally, the three main food sources of the fatty acid individual compounds were: 1)
for palmitic acid: meat and meat products (19.8%), spreads and cooking oils (12.8%)
and cheese (8.5%); 2) for stearic acid: meat and meat products (24.8%), spreads and
cooking oils (11.9%) and biscuits (8.7%); 3) for oleic acid: meat and meat products
(20.6%), spreads and cooking oils (14.0%) and confectionery and savoury snacks
(9.0%); 4) for linoleic acid: meat and meat products (15.9%), spreads and cooking
oils (12.8%) and confectionery and savoury snacks (10.6%); 5) for γ-linolenic acid:
meat and meat products (69.8%), potatoes, rice and pasta (8.6%) and fish and fish
dishes (8.5%); 6) for arachidonic acid meat and meat products (62.4%), eggs (11.1%)
and savoury foods, soups and sauces (10.2%); 7) for α-linolenic acid: vegetables
(22.3%), spreads and cooking oils (13.0%) and savoury foods, soups and sauces
(10.6%); 8) for EPA: fish and fish dishes (69.0%), meat and meat products (23.3%)
and savoury foods, soups and sauces (5.7%); and 9) for DHA: fish and fish dishes
(67.8%), meat and meat products (23.6%) and eggs (3.3%) (Table 74).
One thousand fifty four participants reported consumption of supplement products
and 740 of them reported consumption of supplements that contributed to the fatty
acid daily intake (for total FAs; the subgroups of: PUFAs, ω6PUFAs and ω3PUFAs;
and the individual fatty acids of: linoleic, γ-linolenic, α-linolenic, EPA and DHA). In
particular supplements that contributed to the fatty acid daily intakes included: cod or
halibut liver oil (35.6% of total number of supplements taken), evening primrose oil
(5.8%) and fish oils (2.5%). We identified the exact nutrient composition of these
dietary supplements and added the supplement nutrients to the dietary ones.
6.4.2 Associations between fatty acid variables and
colorectal cancer risk
6.4.2.1 Main conditional logistic regression models
In model I, dietary intakes of total FAs, SFAs, MUFAs, PUFAs, ω6PUFAs, tFAs and
tMUFAs as well as of the individual fatty acids palmitic, stearic, oleic, linoleic, γ-

Chapter six Results: Flavonoids, fatty acids and colorectal cancer
235
linolenic, arachidonic, EPA and DHA acid showed a dose-dependent association
with colorectal cancer risk (p-value for trend fatty acid subgroups: 5.6x10⁻⁶, 4.8x10⁻⁶,
2.0x10⁻⁵, 0.01, 0.002, 3.1x10⁻⁶, 3.0x10⁻⁷; p-value for trend individual fatty acids:
1.5x10⁻⁷
, 5.9x10⁻⁷
, 3.1x10⁻⁶
, 0.005, 0.03, 0.001, 0.05, 0.04; respectively) (Table 75).
Associations between total intakes (from diet and supplements) of fatty acids and
colorectal cancer were not examined in model I, since intake from supplements was
added to the energy-adjusted nutrients.
In model II, a dose-dependent increase in risk was observed for dietary intake of total
FAs, SFAs, MUFAs, tFAs and tMUFAs and for the individual fatty acids palmitic,
stearic and oleic (high vs. low intake: OR (95% CI): 1.30 (1.06, 1.59), 1.42 (1.15,
1.75), 1.29 (1.05, 1.58), 1.38 (1.12, 1.70), 1.47 (1.19, 1.80), 1.43 (1.16, 1.75), 1.64
(1.32, 2.02), 1.38 (1.12, 1.69); respectively) (Table 75). In addition, intake of dietary
ω3PUFAs, EPA and DHA was inversely and dose dependently associated with
colorectal cancer (p-value for trend: 9.3x10⁻⁶, 0.0001, 0.0002, respectively) with
approximately a 35% reduction in risk for those of high versus low intake (OR (95%
CI): 0.65 (0.53, 0.79), 0.66 (0.54, 0.81), 0.68 (0.56, 0.84); respectively) (Table 75).
Regarding total intakes, total FAs were associated with an increased and dose
dependent colorectal cancer risk, whereas total intakes of ω3PUFAs, EPA and DHA
were associated with a decreased and dose dependent colorectal cancer risk (p-value
for trend: 0.001, 1.1x10⁻⁵, 3.4x10⁻⁶, 1.2x10⁻⁵; respectively) (Table 75).
In model III, only the association between colorectal cancer and stearic acid and the
inverse associations between colorectal cancer and ω3PUFAs, EPA and DHA
remained statistically significant (high vs. low intake: OR (95% CI), p-value: 1.46
(1.11, 1.91), 0.01; 0.75 (0.59, 0.97), 0.01; 0.74 (0.58, 0.95), 0.02; 0.74 (0.58, 0.95),
0.02; respectively) (Table 75). In addition, ω3PUFA, EPA and DHA total intakes
were inversely and dose-dependently associated with colorectal cancer risk (p-value
for trend: 0.008, 0.003, 0.003; respectively) (Table 75).
6.4.2.2 Additional conditional logistic regression models
The associations between fatty acid variables and colorectal cancer were tested in
two additional models (Model IV and V): Model IV was corrected for the
confounding factors of model III and in addition to the residual energy adjustment
dietary energy intake was included as a covariate (suggested by Willet to reduce the

Chapter six Results: Flavonoids, fatty acids and colorectal cancer
236
random error). In model V associations were corrected for the confounding factors
of model III and further adjusted for intake of total FAs (Table 76). For the
subgroups of PUFAs, ω6PUFAs and ω3PUFAs and the individual fatty acids
linoleic, γ-linolenic, α-linolenic, EPA and DHA additional analyses were conducted
for their total intake (intake from diet and supplements).
For both models IV and V positive statistically significant associations were
observed for stearic acid (Model IV: high vs. low intake OR (95% CI), p-value: 1.38
(1.05, 1.83), 0.03; Model V: high vs. low intake OR (95% CI), p-value: 1.76 (1.18,
2.63), 0.01) and inverse significant associations were observed for ω3PUFAs, EPA
and DHA (Model IV: high vs. low intake OR (95% CI), p-value: 0.75 (0.58, 0.96),
0.008; 0.74 (0.58, 0.95), 0.02; 0.73 (0.57, 0.94), 0.02; Model IV: high vs. low intake
OR (95% CI), p-value: 0.69 (0.53, 0.90), 0.002; 0.72 (0.56, 0.93), 0.01; 0.71 (0.55,
0.92), 0.01; respectively) (Table 76). In addition, total intake of ω3PUFAs, EPA and
DHA were inversely and dose-dependently associated with colorectal cancer risk
after applying both models IV and V (p-value for trend: Model IV: 0.006, 0.003,
0.001; Model V: 0.002, 0.002, 0.001; respectively) (Table 76).
6.4.2.3 Multiple testing corrections
Bonferroni correction for multiple testing
In model I the associations between colorectal cancer and total FAs (p=5.6x10⁻⁶), the
subgroups SFAs (p=4.8x10⁻⁶), MUFAs (p=2.0x10⁻⁵), tFAs (p=3.1x10⁻⁶), tMUFAs
(p=3.0x10⁻⁷), and the individual fatty acids palmitic (p=1.5x10⁻⁷), stearic (p=5.9x10-
7) and oleic (p=3.1x10
-6) remained significant under every level of correction,
whereas association with ω6PUFAs (p=0.002) and arachidonic acid (p=0.001)
remained significant at the first and second level of significance, respectively (Table
75). In model II, the associations with the subgroups ω3PUFAs (p=9.3x10⁻⁶),
tMUFAs (p=0.0003) and the individual compounds stearic (p=7.9x10⁻⁶), EPA
(p=0.0001) and DHA (p=0.0002) remained significant under every level of
correction, the associations with total FAs (p=0.001), the subgroup SFAs (p=0.001)
and the individual compounds palmitic (p=0.001) and oleic (p=0.001) remained
significant in the first two levels, and finally the association between colorectal
cancer and tFAs remained significant only at the first level of correction (Table 75).
Chapter six Results: Flavonoids, fatty acids and colorectal cancer
237
Finally, in model V, the association between ω3PUFAs (p=0.002) and colorectal
cancer remained significant in the first level of correction (Table 76).
FDR correction for multiple testing
After correcting for multiple testing using the FDR method all the associations
between the dietary intakes and colorectal cancer that their observed p-values were
≤0.01 remained significant (Table 75, Table 76).
6.4.2.4 Associations between colorectal cancer and main food
sources of total fatty acids, SFAs, MUFAs, ω3PUFAs, tFAs,
tMUFAs, palmitic acid, stearic acid, oleic acid, EPA and DHA
Intakes of the following food groups were tested: meat and meat products,
confectionery and savoury snacks (including chocolates, sweets, nuts and crisps) and
fish and fish dishes. Results from model III, showed that comparison of highest
versus lowest quartile intakes of these foods showed ORs for colorectal cancer risk
of 0.93 (95% CI 0.72, 1.21; p-value for trend 0.33) for meat and meat products; 1.47
(95% CI 0.72, 1.17; p-value for trend 0.002) for confectionery and savoury snacks;
and 0.77 (95% CI 0.60, 0.99; p-value for trend 0.07) for fish and fish dishes (Table
77).
6.4.2.5 Associations between the fatty acid variables and
colorectal cancer after sex, age and cancer site stratification
Associations between each fatty acid variable and colorectal cancer risk were tested
after sex, age and cancer site stratification by applying model III (data not shown).
Briefly, both dietary and total intakes of ω3PUFAs, EPA and DHA were inversely
associated with colorectal cancer for both men and women; however associations
were stronger and statistically significant for men (associations for dietary intakes for
men: OR (95% CI), p-value for trend: 0.68 (0.49, 0.95), 0.02; 0.70 (0.50, 0.96), 0.02;
0.69 (0.50, 0.95), 0.02; respectively) (data not shown). In addition, dietary and total
intake of total FAs, the fatty acid subgroups MUFAs, tFAs and tMUFAs and dietary
intake of the individual compound oleic acid, were positively and significantly
associated with colorectal cancer for women but not for men (women (dietary
intakes): OR (95% CI), p-value for trend: 1.40 (0.92, 2.13), 0.03; 1.67 (1.10, 2.53),
0.008; 1.38 (0.91, 2.10), 0.05; 2.00 (1.31, 3.06), 0.002; 1.67 (1.10, 2.53), 0.007,
Chapter six Results: Flavonoids, fatty acids and colorectal cancer
238
respectively) (data not shown). After age stratification, dietary and total intakes of
ω3PUFAs, EPA and DHA were inversely associated with colorectal cancer mainly
for the older study participants; with the associations for the individuals younger than
55 years old not being statistically significant (associations for dietary intakes for
individuals ≥55 years old: OR (95% CI), p-value for trend: 0.75 (0.56, 0.99), 0.01;
0.70 (0.53, 0.92), 0.02; 0.71 (0.54, 0.93), 0.02; respectively) (data not shown). In
addition, dietary intakes of SFAs, MUFAs, tFAs, tMUFAs and palmitic acid were
positively though not significantly associated with colorectal cancer only for the
individuals younger than 55 years old (data not shown). Finally, both dietary and
total intakes of ω3PUFAs, EPA and DHA were inversely associated with both colon
and rectal cancer (with associations with colon cancer being statistically significant)
(data not shown). Dietary intakes of MUFAs, tFAs, tMUFAs and oleic acid were
inversely associated only with rectal cancer, though only the positive association
with tMUFAs was statistically significant (high vs. low intake of tMUFAs for rectal
cancer: OR (95% CI), p-value for trend: 1.55 (1.06, 2.28), 0.02) (data not shown).
6.4.3 Summary of results
Moderately strong associations which showed dose response relationships were
found: 1) in model I: between colorectal cancer and dietary intakes of total FAs
(p=5.6x10⁻⁶), SFAs (p=4.8x10⁻⁶), MUFAs (p=2.0x10⁻⁵), PUFAs (p=0.01), ω6PUFAs
(p=0.002), tFAs (p=3.1x10⁻⁶) and tMUFAs (p=3.0x10⁻⁷), palmitic acid (p=1.5x10⁻⁷),
stearic acid (p=5.9x10⁻⁷), oleic acid (p=3.1x10⁻⁶), linoleic acid (p=0.005), γ-linolenic
acid (p=0.03) and arachidonic acid (p=0.001) (high intakes increased risk) (Table 75)
and between colorectal cancer and dietary intakes of EPA (p=0.05) and DHA
(p=0.04) (high intakes decreased risk) (Table 75); 2) in model II: between colorectal
cancer and the dietary intakes of ω3PUFAs (p=9.3x10⁻⁶), EPA (p=0.0001), DHA
(p=0.0002) (high intakes decreased risk) (Table 75) and between colorectal cancer
and dietary intakes of total FAs (p=0.001), SFAs (p=0.001), MUFAs (p=0.01) tFAs
(p=0.002), tMUFAs (p=0.0003), palmitic acid (p=0.001), stearic acid (p=7.9x10⁻⁶
)
and oleic acid (p=0.001) (high intakes increased risk) (Table 75); 3) in model III,
between colorectal cancer and dietary intakes of ω3PUFAs (p=0.01), EPA (p=0.02)
and DHA (p=0.02) (high intakes decreased risk) and between colorectal cancer and
stearic acid (p=0.01) (high intakes increased risk) (Table 75); 4) in model IV and V:
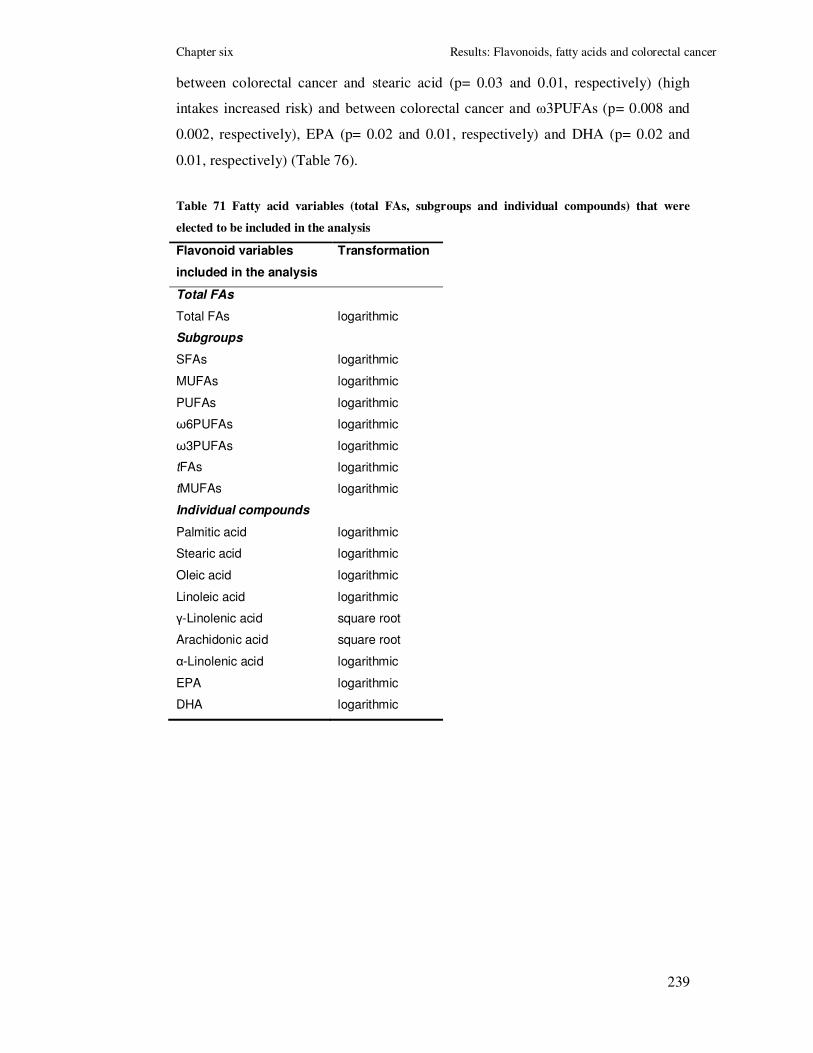
Chapter six Results: Flavonoids, fatty acids and colorectal cancer
239
between colorectal cancer and stearic acid (p= 0.03 and 0.01, respectively) (high
intakes increased risk) and between colorectal cancer and ω3PUFAs (p= 0.008 and
0.002, respectively), EPA (p= 0.02 and 0.01, respectively) and DHA (p= 0.02 and
0.01, respectively) (Table 76).
Table 71 Fatty acid variables (total FAs, subgroups and individual compounds) that were
elected to be included in the analysis
Flavonoid variables
included in the analysis
Transformation
Total FAs
Total FAs logarithmic
Subgroups
SFAs logarithmic
MUFAs logarithmic
PUFAs logarithmic
ω6PUFAs logarithmic
ω3PUFAs logarithmic
tFAs logarithmic
tMUFAs logarithmic
Individual compounds
Palmitic acid logarithmic
Stearic acid logarithmic
Oleic acid logarithmic
Linoleic acid logarithmic
γ-Linolenic acid square root
Arachidonic acid square root
α-Linolenic acid logarithmic
EPA logarithmic
DHA logarithmic

Chapter six Results: Flavonoids, fatty acids and colorectal cancer
240
Table 72 Descriptive report of crude and energy-adjusted fatty acid intakes
Fatty acids All subjects
(n=2950)
Cases
(n=1475)
Controls
(n=1475)
T-test Wilcoxon
rank test
Mean
(SD)
Median
(IQR)
Mean
(SD)
Median
(IQR)
Mean
(SD)
Median
(IQR)
p-value p-value
Total FAs
Total FAs (g/day) 91.4
(41.9)
83.2
(64.0, 109.6)
94.6
(42.9)
86.7
(66.4, 113.4)
88.2
(40.5)
80.0
(62.5, 105.3)
<5x10⁻⁵ <5x10⁻⁵
Total FAs-
energy adjusted (g/day)
85.1
(15.3)
86.2
(75.9, 94.9)
86.0
(14.7)
87.5
(77.1, 95.3)
84.3
(15.9)
85.2
(75.0, 94.2)
0.0018 0.0005
Subgroups
SFAs (g/day) 40.4
(19.7)
36.5
(27.2, 49.1)
42.0
(20.2)
38.1
(28.0, 51.3)
38.7
(18.9)
34.7
(26.5, 46.8)
<5x10⁻⁵
<5x10⁻⁵
SFAs-
energy adjusted (g/day)
37.6
(9.0)
37.2
(31.7, 43.6)
38.2
(8.7)
37.8
(32.4, 44.2)
36.9
(9.3)
36.7
(31.2, 42.7)
0.0001 0.0001
MUFAs (g/day) 34.7
(16.1)
31.5
(24.2, 41.4)
35.8
(16.3)
32.7
(25.1, 43.1)
33.6
(15.9)
30.6
(23.2, 40.5)
<5x10⁻⁵
<5x10⁻⁵
MUFAs-
energy adjusted (g/day)
32.3
(6.0)
32.5
(28.6, 36.0)
32.5
(5.7)
32.8
(29.1, 36.2)
32.0
(6.3)
32.3
(28.1, 35.8)
0.03 0.01
PUFAs (g/day) 15.5
(7.6)
14.1
(10.5, 18.7)
15.9
(7.9)
14.4
(10.6, 19.4)
15.1
(7.3)
13.8
(10.4, 18.1)
0.0041 0.0086
PUFAs-
energy adjusted (g/day)
14.5
(3.8)
14.0
(11.9, 16.6)
14.5
(3.8)
13.9
(11.8, 16.7)
14.5
(3.8)
14.1
(12.0, 16.5)
0.96 0.57
ω6PUFAs (g/day) 12.0
(6.2)
10.8
(10.5, 11.0)
12.4
(6.6)
11.1
(7.9, 15.2)
11.6
(6.6)
10.5
(7.8, 14.0)
0.001 0.004

Chapter six Results: Flavonoids, fatty acids and colorectal cancer
241
ω6PUFAs-
energy adjusted (g/day)
11.2
(3.5)
10.6
(8.9, 13.0)
11.3
(3.6)
10.6
(8.9, 13.0)
11.2
3.4
10.6
(8.8, 13.0)
0.42 0.89
ω3PUFAs (g/day) 2.5
(1.4)
2.2
(1.6, 3.0)
2.5
(1.3)
2.2
(1.6, 3.0)
2.6
(1.6)
2.2
(1.6, 3.0)
0.86 0.98
ω3PUFAs-
energy adjusted (g/day)
2.4
(0.86)
2.2
(1.8, 2.7)
2.3
(0.80)
2.2
(1.8, 2.7)
2.5
(0.91)
2.3
(1.9, 2.8)
<5x10⁻⁵
<5x10⁻⁵
tFAs (g/day) 3.9
(2.1)
3.5
(2.5, 4.7)
4.0
(2.1)
3.6
(2.7, 5.0)
3.7
(2.0)
3.3
(2.4, 4.5)
<5x10⁻⁵
<5x10⁻⁵
tFAs-
energy adjusted (g/day)
3.6
(1.1)
3.5
(2.9, 4.2)
3.7
(1.1)
3.6
(3.0, 4.3)
3.5
(1.2)
3.5
(2.8, 4.2)
0.0026 0.001
tMUFAs (g/day) 2.9
(1.5)
2.7
(1.9, 3.6)
3.0
(1.5)
2.8
(2.0, 3.8)
2.8
(1.4)
2.6
(1.8, 3.4)
<5x10⁻⁵ <5x10⁻⁵
tMUFAs-
energy adjusted (g/day)
2.7
(0.8)
2.7
(2.2, 3.2)
2.8
(0.8)
2.8
(2.3, 3.3)
2.7
(0.8)
2.7
(2.1, 3.2)
0.0003 <5x10⁻⁵
Individual FAs
Palmitic acid (g/day) 20.1
(9.6)
18.2
(13.7, 24.1)
20.9
(9.8)
19.0
(14.2, 25.2)
19.3
(9.2)
17.4
(13.3, 23.2)
<5x10⁻⁵
<5x10⁻⁵
Palmitic acid-
energy adjusted (g/day)
18.7
(4.1)
18.7
(16.1, 21.4)
19.0
(3.9)
18.9
(16.5, 21.5)
18.4
(4.2)
18.4
(15.7, 21.1)
0.0003 0.0002
Stearic acid (g/day) 9.3
(4.6)
8.5
(6.3, 11.4)
9.8
(4.8)
8.9
(6.5, 11.9)
8.9
(4.3)
8.1
(6.1, 10.8)
<5x10⁻⁵
<5x10⁻⁵
Stearic acid-
energy adjusted (g/day)
8.7
(2.0)
8.7
(7.4, 10.0)
8.8
(2.0)
8.9
(7.6, 10.2)
8.5
(2.1)
8.6
(7.2, 8.9)
0.0001 0.0001
Oleic acid (g/day) 26.9
(12.7)
24.5
(18.6, 32.0)
27.8
(12.9)
25.5
(19.4, 33.2)
26.0
(12.3)
23.6
(17.9, 31.3)
<5x10⁻⁵
<5x10⁻⁵
Oleic acid- 25.0 25.2 25.3 25.5 24.8 24.9 0.006 0.002

Chapter six Results: Flavonoids, fatty acids and colorectal cancer
242
energy adjusted (g/day) (4.9) (22.1, 28.1) (4.6) (22.4, 28.2) (5.1) (21.7, 27.9)
Linoleic acid (g/day) 11.5
(6.0)
10.3
(7.5, 14.1)
11.9
(6.4)
10.6
(7.5, 14.6)
11.2
(5.6)
10.1
(7.4, 13.5)
0.0011 0.0045
Linoleic acid-
energy adjusted (g/day)
10.8
(3.5)
10.1
(8.4, 12.6)
10.8
(3.5)
10.1
(8.4, 12.6)
10.7
(3.4)
10.2
(8.4, 12.5)
0.43 0.88
γ-Linolenic acid (mg/day) 9.3
(6.4)
8.0
(5.0, 12.0)
9.6
(6.5)
8.0
(5.0, 12.0)
9.0
(6.3)
8.0
(5.0, 12.0)
0.0069 0.01
γ-Linolenic acid-
energy adjusted (mg/day)
8.9
(4.4)
8.4
(5.9, 11.3)
8.9
(4.4)
8.3
(5.9, 11.3)
8.9
(4.4)
8.5
(5.8, 11.3)
0.75 0.92
Arachidonic acid
(mg/day)
314.3
(167.9)
283.0
(206.7, 383.2)
324.3
(174.9)
289.0
(212.0, 394.0)
304.4
(160.0)
275.5
(200.0, 373.0)
0.0008 0.0025
Arachidonic acid-
energy adjusted (mg/day)
304.1
(102.2)
295.3
(238.7, 358.6)
305.8
(101.9)
297.9
(243.8, 356.9)
302.3
(102.6)
292.5
(234.5, 360.3)
0.36 0.30
α-Linolenic acid (mg/day) 1450.6
(700.1)
1298.5
(990.0, 1749.0)
1472.5
(699.2)
1322.0
(1000.0, 1758.0)
1428.7
(700.6)
1265.0
(973.0, 1742.0)
0.02 0.03
α-Linolenic acid-
energy adjusted (mg/day)
1358.0
(346.8)
1315.8
(1123.3, 1537.8)
1347.9
(331.1)
1314.1
(1130.5, 1522.9)
1368.2
(361.7)
1316.3
(1117.3, 1560.3)
0.11 0.35
EPA (mg/day) 337.7
(327.8)
251.0
(146.0, 418.2)
320.1
(261.4)
243.0
(144.0, 408.0)
355.2
(382.0)
257.0
(151.0, 430.0)
0.07 0.05
EPA-
energy adjusted (mg/day)
316.4
(243.9)
248.4
(155.1, 407.8)
297.4
(223.5)
236.1
(144.8, 387.3)
335.4
(261.4)
261.7
(165.0, 429.3)
<5x10⁻⁵
<5x10⁻⁵
DHA (mg/day) 463.8
(439.4)
350.5
(212.0, 565.2)
440.1
(347.7)
338.0
(206.0, 555.0)
487.4
(514.1)
360
(216.0, 580.0)
0.06 0.07
DHA-
energy adjusted (mg/day)
435.4
(327.0)
346.5
(220.0, 551.5)
410.3
(299.4)
326.2
(210.2, 519.1)
460.5
(350.7)
360.4
(233.6, 577.3)
<5x10⁻⁵
<5x10⁻⁵

Chapter six Results: Flavonoids, fatty acids and colorectal cancer
243
Table 73 Spearman rank correlation coefficients between fatty acid variables (all p-values<5x10⁻⁵)
Fatty acids FAs SFAs MUFAs PUFAs ω6PUFAs ω3PUFAs tFAs tMUFAs PA SA OA LA γLA AA αLA EPA DHA
FAs 1.00
SFAs 0.96 1.00
MUFAs 0.98 0.91 1.00
PUFAs 0.84 0.67 0.85 1.00
ω6PUFAs 0.79 0.62 0.80 0.98 1.00
ω3PUFAs 0.71 0.57 0.76 0.76 0.67 1.00
tFAs 0.89 0.89 0.85 0.68 0.62 0.52 1.00
tMUFAs 0.87 0.87 0.85 0.65 0.62 0.55 0.93 1.00
Palmitic acid (PA) 0.97 0.99 0.93 0.71 0.66 0.61 0.88 0.86 1.00
Stearic acid (SA) 0.96 0.98 0.91 0.72 0.67 0.56 0.90 0.86 0.97 1.00
Oleic acid (OA) 0.97 0.89 0.99 0.86 0.82 0.71 0.84 0.83 0.93 0.91 1.00
Linoleic acid (LA) 0.78 0.61 0.79 0.98 1.00 0.66 0.61 0.61 0.65 0.65 0.81 1.00
γ-Linolenic acid (γLA) 0.64 0.58 0.67 0.57 0.53 0.58 0.50 0.51 0.62 0.63 0.67 0.51 1.00
Arachidonic acid (AA) 0.70 0.64 0.72 0.62 0.58 0.63 0.58 0.60 0.68 0.69 0.71 0.55 0.81 1.00
α-Linolenic acid (αLA) 0.79 0.66 0.82 0.85 0.81 0.82 0.66 0.68 0.70 0.66 0.82 0.80 0.56 0.56 1.00
EPA 0.40 0.32 0.45 0.43 0.33 0.82 0.24 0.28 0.33 0.30 0.37 0.32 0.40 0.50 0.40 1.00
DHA 0.42 0.32 0.46 0.45 0.35 0.83 0.24 0.27 0.35 0.30 0.39 0.34 0.42 0.50 0.42 0.99 1.00

Chapter six Results: Flavonoids, fatty acids and colorectal cancer
244
Table 74 Three main dietary (food) sources of fatty acids in our population
Fatty acids subgroups Main sources (% of total intake)
Total fatty acids
Meat & meat products (18.0%)
Spreads* & cooking oils (13.4%)
Confectionery & savoury snacks (8.3%)
Saturated fatty acids
Meat & meat products (17.5%)
Spreads* & cooking oils (13.1%)
Cheese (10.3%)
Mono-unsaturated fatty
acids
Meat & meat products (19.7%)
Spreads* & cooking oils (13.7%)
Fish & fish dishes (8.5%)
Poly-unsaturated fatty acids
Meat & meat products (15.3%)
Spreads* & cooking oils (13.5%)
Confectionery & savoury snacks (11.4%)
ω6 poly-unsaturated fatty
acids
Spreads* & cooking oils (15.2%)
Meat & meat products (14.8%)
Confectionery & savoury snacks (10.2%)
ω3 poly-unsaturated fatty
acids
Fish & fish dishes (30.3%)
Meat & meat products (16.2%)
Vegetables (13.1%)
trans fatty acids
Spreads* & cooking oils (20.7%)
Confectionery & savoury snacks (15.7%)
Meat & meat products (15.4%)
trans mono-unsaturated
fatty acids
Spreads* & cooking oils (25.2%)
Meat & meat products (14.6%)
Cheese (11.9%)
Palmitic acid Meat & meat products (19.8%)
Spreads‡ & cooking oils (12.8%)
Cheese (8.5%)
Stearic acid Meat & meat products (24.8%)
Spreads* & cooking oils (11.9%)
Biscuits (8.7%)
Oleic acid Meat & meat products (20.6%)
Spreads* & cooking oils (14.0%)
Confectionery & savoury snacks (9.0%)
Linoleic acid Meat & meat products (15.9%)
Spreads* & cooking oils (12.8%)
Confectionery & savoury snacks (10.6%)

Chapter six Results: Flavonoids, fatty acids and colorectal cancer
245
γ-Linolenic acid Meat & meat products (69.8%)
Potatoes, rice and Pasta (8.6%)
Fish & fish dishes (8.5%)
Arachidonic acid Meat & meat products (62.4%)
Eggs (11.1%)
Savoury foods, soups and sauces (10.2%)
α-Linolenic acid Vegetables (22.3%)
Spreads* & cooking oils (13.0%)
Savoury foods, soups and sauces (10.6%)
EPA Fish & fish dishes (69.0%)
Meat & meat products (23.3%)
Savoury foods, soups and sauces (5.7%)
DHA Fish & fish dishes (67.8%)
Meat & meat products (23.6%)
Eggs (3.3%)
* Including butter, margarine, jam, honey, marmalade, yeast or meat extract, peanut butter, and chocolate spread

Chapter six Results: Flavonoids, fatty acids and colorectal cancer
246
Table 75 Association between the fatty acid variables and colorectal cancer risk in the whole sample (3 main conditional logistic regression models; Cases and
controls matched on age, gender and area of residence)
Fatty acids Quartiles* Frequency Model I
† Model II
‡ Model III
§
cases controls OR 95% CI OR 95% CI OR 95% CI
Total FAs
(g/day)
0-75.93 339 399 1.00 1.00 1.00
75.93-86.21 345 392 1.09 0.89, 1.35 1.03 0.84, 1.26 0.99 0.78, 1.27
86.21-94.91 404 334 1.37 1.11, 1.68 1.43 1.17, 1.76 1.25 0.98, 1.61
>94.91 387 350 1.55 1.25, 1.92 1.30 1.06, 1.59 1.05 0.81, 1.36
p-value for trend (quartiles) 5.6x10⁻⁶
0.001 0.36
p-value for trend (continuous) 3.9x10⁻⁵
0.002 0.27
Total FAs
(total) (g/day)
0-75.98 338 400 1.00 1.00
75.98-86.34 346 391 1.04 0.85, 1.28 1.01 0.79, 1.29
86.34-94.95 404 334 1.44 1.17, 1.77 1.27 0.99, 1.34
>95.94 387 350 1.31 1.07, 1.60 1.06 0.82, 1.37
p-value for trend (quartiles) 0.001 0.33
p-value for trend (continuous) 0.002 0.28
SFAs
(g/day)
0-31.72 336 402 1.00 1.00 1.00
31.72-37.18 365 372 1.03 0.83, 1.28 1.18 0.96, 1.45 1.13 0.88, 1.45
37.18-43.55 375 363 1.22 0.99, 1.50 1.24 1.01, 1.52 1.01 0.79, 1.30
>43.55 399 338 1.58 1.28, 1.95 1.42 1.15, 1.75 1.19 0.91, 1.55
p-value for trend (quartiles) 4.8x10⁻⁶
0.001 0.34
p-value for trend (continuous) 4.1x10⁻⁶
0.0001 0.13
MUFAs
(g/day)
0-28.62 333 405 1.00 1.00 1.00
28.62-32.54 377 360 1.10 0.89, 1.35 1.27 1.04, 1.56 1.27 0.99, 1.63
32.54-36.04 385 353 1.38 1.12, 1.69 1.33 1.08, 1.64 1.23 0.96, 1.59
>36.04 380 357 1.50 1.22, 1.86 1.29 1.05, 1.58 1.13 0.88, 1.46

Chapter six Results: Flavonoids, fatty acids and colorectal cancer
247
p-value for trend (quartiles) 2.0x10⁻⁵
0.01 0.45
p-value for trend (continuous) 0.0003 0.03 0.42
PUFAs
(g/day)
0-11.94 380 358 1.00 1.00 1.00
11.94-14.03 370 367 1.01 0.82, 1.24 0.95 0.77, 1.17 1.11 0.87, 1.42
14.03-16.58 348 390 0.96 0.78, 1.18 0.84 0.68, 1.03 0.94 0.74, 1.20
>16.58 377 360 1.35 1.09, 1.66 0.98 0.80, 1.20 0.98 0.76, 1.25
p-value for trend (quartiles) 0.01 0.62 0.54
p-value for trend (continuous) 0.004 0.96 0.66
PUFAs
(total) (g/day)
0-11.99 383 355 1.00 1.00
11.99-14.08 365 372 0.91 0.74, 1.12 1.04 0.82, 1.33
14.08-16.67 350 388 0.83 0.68, 1.02 0.91 0.71, 1.17
>16.67 377 360 0.97 0.79, 1.18 0.97 0.76, 1.24
p-value for trend (quartiles) 0.60 0.56
p-value for trend (continuous) 0.82 0.58
ω6PUFAs
(g/day)
0-8.87 365 373 1.00 1.00 1.00
8.87-10.61 380 357 1.03 0.84, 1.26 1.09 0.89, 1.34 1.14 0.89, 1.45
10.61-13.04 361 377 1.00 0.81, 1.23 0.98 0.79, 1.20 1.07 0.83, 1.37
>13.04 369 368 1.42 1.15, 1.75 1.02 0.84, 1.26 1.02 0.80, 1.31
p-value for trend (quartiles) 0.002 0.92 0.97
p-value for trend (continuous) 0.001 0.42 0.77
ω6PUFAs
(total) (g/day)
0-8.89 365 373 1.00 1.00
8.89-10.62 381 356 1.09 0.89, 1.34 1.15 0.90, 1.47
10.62-13.06 360 378 0.97 0.79, 1.19 1.07 0.83, 1.37
>13.06 369 368 1.02 0.84, 1.26 1.02 0.80, 1.31
p-value for trend (quartiles) 0.89 0.94
p-value for trend (continuous) 0.45 0.80

Chapter six Results: Flavonoids, fatty acids and colorectal cancer
248
ω3PUFAs
(g/day)
0-1.82 416 322 1.00 1.00 1.00
1.82-2.22 377 360 1.12 0.91, 1.38 0.82 0.66, 1.00 0.95 0.74, 1.22
2.22-2.73 348 390 1.05 0.86, 1.28 0.70 0.57, 0.86 0.80 0.63, 1.02
>2.73 334 403 1.07 0.87, 1.32 0.65 0.53, 0.79 0.75 0.59, 0.97
p-value for trend (quartiles) 0.67 9.3x10⁻⁶
0.01
p-value for trend (continuous) 0.26 2.8x10⁻⁵
0.004
ω3PUFAs
(total) (g/day)
0-1.84 409 329 1.00 1.00
1.84-2.26 381 356 0.86 0.70, 1.06 0.95 0.74, 1.22
2.26-2.79 360 378 0.77 0.63, 0.95 0.89 0.70, 1.13
>2.79 325 412 0.64 0.52, 0.78 0.71 0.55, 0.92
p-value for trend (quartiles) 1.1x10⁻⁵ 0.008
p-value for trend (continuous) 5.3x10⁻⁶
0.002
tFAs
(g/day)
0-2.87 325 413 1.00 1.00 1.00
2.87-3.54 379 358 1.08 0.88, 1.32 1.34 1.09, 1.64 1.24 0.97, 1.58
3.54-4.22 386 352 1.19 0.97, 1.47 1.38 1.13, 1.69 1.31 1.03, 1.66
>4.22 385 352 1.63 1.32, 2.00 1.38 1.12, 1.70 1.13 0.88, 1.46
p-value for trend (quartiles) 3.1x10⁻⁶
0.002 0.28
p-value for trend (continuous) 1.1x10⁻⁵ 0.003 0.41
tMUFAs
(g/day)
0-2.20 318 420 1.00 1.00 1.00
2.20-2.71 378 359 1.08 0.88, 1.32 1.40 1.14, 1.73 1.39 1.08, 1.78
2.71-3.23 390 348 1.34 1.09, 1.65 1.47 1.20, 1.80 1.35 1.05, 1.72
>3.23 389 348 1.65 1.34, 2.02 1.47 1.19, 1.80 1.28 1.00, 1.65
p-value for trend (quartiles) 3.0x10⁻⁷
0.0003 0.09
p-value for trend (continuous) 3.1x10⁻⁶
0.0004 0.15
Palmitic acid
(g/day)
0-16.13 329 409 1.00 1.00 1.00
16.13-18.72 369 368 1.16 0.94, 1.44 1.25 1.02, 1.53 1.16 0.91, 1.49

Chapter six Results: Flavonoids, fatty acids and colorectal cancer
249
18.72-21.36 384 354 1.38 1.12, 1.70 1.35 1.10, 1.66 1.22 0.95, 1.57
>21.36 393 344 1.72 1.39, 2.12 1.43 1.16, 1.75 1.13 0.86, 1.47
p-value for trend (quartiles) 1.5x10⁻⁷
0.001 0.36
p-value for trend (continuous) 9.5x10⁻⁶
0.0003 0.21
Stearic acid
(g/day)
0-7.37 322 416 1.00 1.00 1.00
7.37-8.71 368 369 0.95 0.77, 1.18 1.31 1.06, 1.61 1.29 1.00, 1.66
8.71-10.03 377 361 1.27 1.03, 1.57 1.37 1.12, 1.69 1.32 1.02, 1.70
>10.03 408 329 1.61 1.30, 1.99 1.64 1.32, 2.02 1.46 1.11, 1.91
p-value for trend (quartiles) 5.9x10⁻⁷
7.9x10⁻⁶
0.01
p-value for trend (continuous) 8.4x10⁻⁷ 6.6x10⁻⁵
0.08
Oleic acid
(g/day)
0-22.06 334 404 1.00 1.00 1.00
22.06-25.22 365 372 1.13 0.91, 1.39 1.19 0.97, 1.46 1.14 0.89, 1.46
25.22-28.06 385 353 1.50 1.21, 1.85 1.32 1.08, 1.62 1.24 0.97, 1.59
>28.06 391 346 1.56 1.25, 1.93 1.38 1.12, 1.69 1.23 0.95, 1.59
p-value for trend (quartiles) 3.1x10⁻⁶
0.001 0.10
p-value for trend (continuous) 6.9x10⁻⁵
0.006 0.15
Linoleic acid
(g/day)
0-8.41 367 371 1.00 1.00 1.00
8.41-10.14 377 360 1.02 0.83, 1.25 1.06 0.86, 1.29 1.08 0.84, 1.38
10.14-12.56 360 378 0.98 0.79, 1.21 0.96 0.78, 1.18 1.04 0.81, 1.34
>12.56 371 366 1.38 1.12, 1.69 1.02 0.83, 1.25 1.00 0.78, 1.28
p-value for trend (quartiles) 0.005 0.95 0.92
p-value for trend (continuous) 0.001 0.43 0.77
Linoleic acid
(total) (g/day)
0-8.42 368 370 1.00 1.00
8.42-10.15 378 359 1.06 0.86, 1.29 1.09 0.85, 1.39
10.15-12.57 359 380 0.95 0.77, 1.17 1.02 0.80, 1.31
>12.57 370 366 1.01 0.83, 1.24 0.99 0.78, 1.28

Chapter six Results: Flavonoids, fatty acids and colorectal cancer
250
p-value for trend (quartiles) 0.86 0.82
p-value for trend (continuous) 0.46 0.80
γ-Linolenic acid
(mg/day)
0-5.86 368 370 1.00 1.00 1.00
5.86-8.43 387 350 1.00 0.82, 1.21 1.10 0.90, 1.35 1.09 0.86, 1.38
8.43-11.29 352 386 1.15 0.94, 1.40 0.91 0.74, 1.12 0.82 0.64, 1.05
>11.29 368 369 1.24 1.00, 1.54 1.00 0.81, 1.23 0.98 0.76, 1.26
p-value for trend (quartiles) 0.03 0.57 0.37
p-value for trend (continuous) 0.01 0.74 0.99
γ-Linolenic acid
(total) (mg/day)
0-6.06 369 369 1.00 1.00
6.06-8.69 390 347 1.11 0.91, 1.36 1.14 0.90, 1.44
8.69-11.79 342 396 0.86 0.70, 1.06 0.79 0.61, 1.01
>11.79 374 363 1.03 0.83, 1.26 1.05 0.82, 1.35
p-value for trend (quartiles) 0.59 0.58
p-value for trend (continuous) 0.23 0.58
Arachidonic acid
(mg/day)
0-238.75 347 391 1.00 1.00 1.00
238.75-295.30 374 363 1.19 0.97, 1.46 1.17 0.95, 1.44 1.24 0.97, 1.59
295.30-358.60 394 344 1.26 1.02, 1.55 1.29 1.05, 1.58 1.17 0.92, 1.50
>358.60 360 377 1.42 1.15, 1.75 1.07 0.87, 1.31 1.04 0.81, 1.33
p-value for trend (quartiles) 0.001 0.32 0.86
p-value for trend (continuous) 0.001 0.36 0.81
α-Linolenic acid
(mg/day)
0-1123.4 361 377 1.00 1.00 1.00
1123.4-1315.8 381 356 1.03 0.84, 1.26 1.12 0.91, 1.38 1.22 0.95, 1.57
1315.8-1537.6 393 345 1.24 1.00, 1.52 1.19 0.97, 1.46 1.42 1.10, 1.80
>1537.6 340 397 1.13 0.91, 1.39 0.90 0.73, 1.10 1.01 0.78, 1.30
p-value for trend (quartiles) 0.11 0.41 0.75
p-value for trend (continuous) 0.09 0.10 0.53

Chapter six Results: Flavonoids, fatty acids and colorectal cancer
251
α-Linolenic acid
(total) (mg/day)
0-1123.6 361 377 1.00 1.00
1123.6-1316.1 380 357 1.11 0.91, 1.37 1.21 0.95, 1.56
1316.1-1538.3 394 344 1.20 0.97, 1.47 1.42 1.10, 1.83
>1538.3 340 397 0.90 0.73, 1.10 1.01 0.78, 1.31
p-value for trend (quartiles) 0.43 0.71
p-value for trend (continuous) 0.09 0.54
EPA
(mg/day)
0-155.16 409 329 1.00 1.00 1.00
155.16-248.39 371 366 0.95 0.78, 1.17 0.82 0.67, 1.01 0.92 0.72, 1.18
248.39-407.67 363 375 0.89 0.73, 1.09 0.78 0.64, 0.96 0.87 0.68, 1.11
>407.67 332 405 0.82 0.67, 1.01 0.66 0.54, 0.81 0.74 0.58, 0.95
p-value for trend (quartiles) 0.05 0.0001 0.02
p-value for trend (continuous) 0.003 2.4x10⁻⁵
0.003
EPA
(total) (mg/day)
0-166.66 417 321 1.00 1.00
166.66-268.42 368 369 0.77 0.63, 0.95 0.86 0.67, 1.10
268.42-434.83 369 369 0.77 0.63, 0.95 0.85 0.67, 1.09
>434.83 321 416 0.60 0.49, 0.73 0.67 0.52, 0.86
p-value for trend (quartiles) 3.4x10⁻⁶
0.003
p-value for trend (continuous) 3.3x10⁶ 0.001
DHA
(mg/day)
0-220.06 411 327 1.00 1.00 1.00
220.06-346.49 370 367 0.95 0.77, 1.16 0.81 0.66, 0.99 0.85 0.67, 1.09
346.49-551.44 355 383 0.87 0.71, 1.06 0.74 0.60, 0.91 0.84 0.66, 1.07
>551.44 339 398 0.82 0.67, 1.01 0.68 0.56, 0.84 0.74 0.58, 0.95
p-value for trend (quartiles) 0.04 0.0002 0.02
p-value for trend (continuous) 0.003 3.0x10⁻⁵
0.002
DHA
(total) (mg/day)
0-233.35 413 325 1.00 1.00
233.35-362.65 375 362 0.83 0.67, 1.02 0.93 0.72, 1.19

Chapter six Results: Flavonoids, fatty acids and colorectal cancer
252
362.65-577.16 358 380 0.74 0.61, 0.91 0.83 0.65, 1.06
>577.16 329 408 0.64 0.52, 0.78 0.70 0.54, 0.90
p-value for trend (quartiles) 1.2x10⁻⁵
0.003
p-value for trend (continuous) 5.4x10⁻⁶
0.001
*Based on the distribution of the energy adjusted variable
†Model I: Crude analysis
‡Model II: Adjusted for total energy intake (residual method)
§Model III: Adjusted for family history of cancer, BMI, physical activity, smoking, total energy intake (residual method), fibre intake (energy adjusted), alcohol intake (energy adjusted),
NSAIDs intake

Chapter six Results: Flavonoids, fatty acids and colorectal cancer
253
Table 76 Association between the fatty acid variables and colorectal cancer risk in the whole
sample (2 additional conditional logistic regression models; Cases and controls matched on age,
gender and area of residence)
Fatty acids Quartiles* Frequency Model IV
† Model V
‡
cases controls OR 95% CI OR 95% CI
Total FAs
(g/day)
0-75.93 339 399 1.00 n/a
75.93-86.21 345 392 0.97 0.76, 1.24
86.21-94.91 404 334 1.22 0.95, 1.58
>94.91 387 350 1.00 0.77, 1.29
p-value for trend (quartiles) 0.61
p-value for trend (continuous) 0.39
Total FAs
(total) (g/day)
0-75.98 338 400 1.00 n/a
75.98-86.34 346 391 0.99 0.77, 1.27
86.34-94.95 404 334 1.24 0.97, 1.60
>95.94 387 350 1.00 0.77, 1.30
p-value for trend (quartiles) 0.57
p-value for trend (continuous) 0.41
SFAs
(g/day)
0-31.72 336 402 1.00 1.00
31.72-37.18 365 372 1.12 0.87, 1.44 1.09 0.82, 1.46
37.18-43.55 375 363 0.98 0.76, 1.27 0.97 0.70, 1.34
>43.55 399 338 1.13 0.86, 1.47 1.11 0.74, 1.66
p-value for trend (quartiles) 0.60 0.86
p-value for trend (continuous) 0.24 0.27
MUFAs
(g/day)
0-28.62 333 405 1.00 1.00
28.62-32.54 377 360 1.27 0.99, 1.64 1.21 0.90, 1.64
32.54-36.04 385 353 1.23 0.95, 1.59 1.15 0.80, 1.65
>36.04 380 357 1.10 0.85, 1.42 1.02 0.65, 1.60
p-value for trend (quartiles) 0.60 0.78
p-value for trend (continuous) 0.50 0.58
PUFAs
(g/day)
0-11.94 380 358 1.00 1.00
11.94-14.03 370 367 1.11 0.86, 1.42 1.06 0.82, 1.37
14.03-16.58 348 390 0.92 0.72, 1.18 0.88 0.68, 1.14
>16.58 377 360 0.97 0.76, 1.24 0.89 0.67, 1.17
p-value for trend (quartiles) 0.48 0.20
p-value for trend (continuous) 0.70 0.25
PUFAs
(total) (g/day)
0-11.99 383 355 1.00 1.00
11.99-14.08 365 372 1.04 0.81, 1.33 1.00 0.77, 1.28
14.08-16.67 350 388 0.90 0.70, 1.15 0.85 0.65, 1.10
>16.67 377 360 0.96 0.75, 1.23 0.88 0.66, 1.16
p-value for trend (quartiles) 0.51 0.21
p-value for trend (continuous) 0.61 0.20
ω6PUFAs 0-8.87 365 373 1.00 1.00
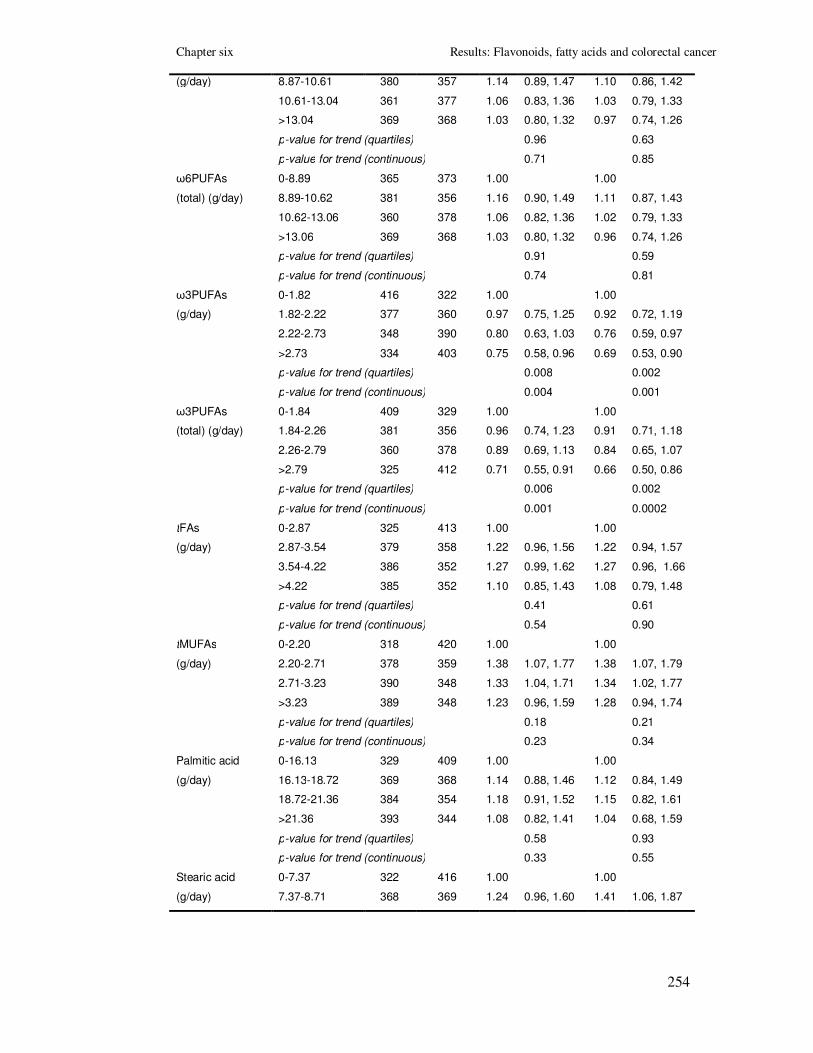
Chapter six Results: Flavonoids, fatty acids and colorectal cancer
254
(g/day) 8.87-10.61 380 357 1.14 0.89, 1.47 1.10 0.86, 1.42
10.61-13.04 361 377 1.06 0.83, 1.36 1.03 0.79, 1.33
>13.04 369 368 1.03 0.80, 1.32 0.97 0.74, 1.26
p-value for trend (quartiles) 0.96 0.63
p-value for trend (continuous) 0.71 0.85
ω6PUFAs
(total) (g/day)
0-8.89 365 373 1.00 1.00
8.89-10.62 381 356 1.16 0.90, 1.49 1.11 0.87, 1.43
10.62-13.06 360 378 1.06 0.82, 1.36 1.02 0.79, 1.33
>13.06 369 368 1.03 0.80, 1.32 0.96 0.74, 1.26
p-value for trend (quartiles) 0.91 0.59
p-value for trend (continuous) 0.74 0.81
ω3PUFAs
(g/day)
0-1.82 416 322 1.00 1.00
1.82-2.22 377 360 0.97 0.75, 1.25 0.92 0.72, 1.19
2.22-2.73 348 390 0.80 0.63, 1.03 0.76 0.59, 0.97
>2.73 334 403 0.75 0.58, 0.96 0.69 0.53, 0.90
p-value for trend (quartiles) 0.008 0.002
p-value for trend (continuous) 0.004 0.001
ω3PUFAs
(total) (g/day)
0-1.84 409 329 1.00 1.00
1.84-2.26 381 356 0.96 0.74, 1.23 0.91 0.71, 1.18
2.26-2.79 360 378 0.89 0.69, 1.13 0.84 0.65, 1.07
>2.79 325 412 0.71 0.55, 0.91 0.66 0.50, 0.86
p-value for trend (quartiles) 0.006 0.002
p-value for trend (continuous) 0.001 0.0002
tFAs
(g/day)
0-2.87 325 413 1.00 1.00
2.87-3.54 379 358 1.22 0.96, 1.56 1.22 0.94, 1.57
3.54-4.22 386 352 1.27 0.99, 1.62 1.27 0.96, 1.66
>4.22 385 352 1.10 0.85, 1.43 1.08 0.79, 1.48
p-value for trend (quartiles) 0.41 0.61
p-value for trend (continuous) 0.54 0.90
tMUFAs
(g/day)
0-2.20 318 420 1.00 1.00
2.20-2.71 378 359 1.38 1.07, 1.77 1.38 1.07, 1.79
2.71-3.23 390 348 1.33 1.04, 1.71 1.34 1.02, 1.77
>3.23 389 348 1.23 0.96, 1.59 1.28 0.94, 1.74
p-value for trend (quartiles) 0.18 0.21
p-value for trend (continuous) 0.23 0.34
Palmitic acid
(g/day)
0-16.13 329 409 1.00 1.00
16.13-18.72 369 368 1.14 0.88, 1.46 1.12 0.84, 1.49
18.72-21.36 384 354 1.18 0.91, 1.52 1.15 0.82, 1.61
>21.36 393 344 1.08 0.82, 1.41 1.04 0.68, 1.59
p-value for trend (quartiles) 0.58 0.93
p-value for trend (continuous) 0.33 0.55
Stearic acid
(g/day)
0-7.37 322 416 1.00 1.00
7.37-8.71 368 369 1.24 0.96, 1.60 1.41 1.06, 1.87

Chapter six Results: Flavonoids, fatty acids and colorectal cancer
255
8.71-10.03 377 361 1.29 0.99, 1.67 1.50 1.08, 2.09
>10.03 408 329 1.38 1.05, 1.83 1.76 1.18, 2.63
p-value for trend (quartiles) 0.03 0.01
p-value for trend (continuous) 0.13 0.12
Oleic acid
(g/day)
0-22.06 334 404 1.00 1.00
22.06-25.22 365 372 1.15 0.90, 1.48 1.17 0.88, 1.56
25.22-28.06 385 353 1.24 0.96, 1.59 1.29 0.93, 1.79
>28.06 391 346 1.22 0.94, 1.58 1.30 0.87, 1.94
p-value for trend (quartiles) 0.12 0.21
p-value for trend (continuous) 0.16 0.33
Linoleic acid
(g/day)
0-8.41 367 371 1.00 1.00
8.41-10.14 377 360 1.09 0.85, 1.39 1.05 0.82, 1.34
10.14-12.56 360 378 1.03 0.80, 1.33 1.00 0.77, 1.30
>12.56 371 366 1.01 0.79, 1.29 0.95 0.72, 1.23
p-value for trend (quartiles) 0.91 0.58
p-value for trend (continuous) 0.70 0.86
Linoleic acid
(total) (g/day)
0-8.42 368 370 1.00 1.00
8.42-10.15 378 359 1.10 0.86, 1.40 1.06 0.82, 1.36
10.15-12.57 359 380 1.02 0.79, 1.30 0.98 0.76, 1.27
>12.57 370 366 1.00 0.78, 1.28 0.94 0.72, 1.22
p-value for trend (quartiles) 0.80 0.49
p-value for trend (continuous) 0.74 0.83
γ-Linolenic acid
(mg/day)
0-5.86 368 370 1.00 1.00
5.86-8.43 387 350 1.12 0.88, 1.42 1.08 0.85, 1.36
8.43-11.29 352 386 0.85 0.66, 1.09 0.80 0.62, 1.02
>11.29 368 369 0.99 0.77, 1.28 0.94 0.72, 1.22
p-value for trend (quartiles) 0.44 0.23
p-value for trend (continuous) 0.86 0.78
γ-Linolenic acid
(total) (mg/day)
0-6.06 369 369 1.00 1.00
6.06-8.69 390 347 1.16 0.91, 1.47 1.12 0.88, 1.42
8.69-11.79 342 396 0.81 0.63, 1.04 0.78 0.61, 1.00
>11.79 374 363 1.06 0.82, 1.36 1.02 0.79, 1.32
p-value for trend (quartiles) 0.61 0.42
p-value for trend (continuous) 0.52 0.57
Arachidonic acid
(mg/day)
0-238.75 347 391 1.00 1.00
238.75-295.30 374 363 1.29 1.01, 1.66 1.24 0.97, 1.58
295.30-358.60 394 344 1.20 0.94, 1.54 1.15 0.90, 1.47
>358.60 360 377 1.04 0.81, 1.34 1.02 0.79, 1.31
p-value for trend (quartiles) 0.88 0.99
p-value for trend (continuous) 0.81 0.97
α-Linolenic acid
(mg/day)
0-1123.4 361 377 1.00 1.00
1123.4-1315.8 381 356 1.24 0.97, 1.60 1.19 0.92, 1.54
1315.8-1537.6 393 345 1.40 1.08, 1.80 1.37 1.05, 1.79

Chapter six Results: Flavonoids, fatty acids and colorectal cancer
256
>1537.6 340 397 1.00 0.77, 1.30 0.96 0.73, 1.27
p-value for trend (quartiles) 0.82 0.90
p-value for trend (continuous) 0.51 0.22
α-Linolenic acid
(total) (mg/day)
0-1123.6 361 377 1.00 1.00
1123.6-1316.1 380 357 1.24 0.96, 1.59 1.19 0.92, 1.53
1316.1-1538.3 394 344 1.40 1.09, 1.81 1.37 1.05, 1.79
>1538.3 340 397 1.01 0.78, 1.31 0.97 0.73, 1.28
p-value for trend (quartiles) 0.78 0.94
p-value for trend (continuous) 0.52 0.22
EPA
(mg/day)
0-155.16 409 329 1.00 1.00
155.16-248.39 371 366 0.93 0.72, 1.18 0.92 0.72, 1.17
248.39-407.67 363 375 0.88 0.69, 1.13 0.86 0.68, 1.10
>407.67 332 405 0.74 0.58, 0.95 0.72 0.56, 0.93
p-value for trend (quartiles) 0.02 0.01
p-value for trend (continuous) 0.003 0.001
EPA
(total) (mg/day)
0-166.66 417 321 1.00 1.00
166.66-268.42 368 369 0.86 0.67, 1.11 0.86 0.67, 1.10
268.42-434.83 369 369 0.86 0.67, 1.10 0.84 0.66, 1.07
>434.83 321 416 0.67 0.52, 0.86 0.66 0.51, 0.84
p-value for trend (quartiles) 0.003 0.001
p-value for trend (continuous) 0.001 0.0004
DHA
(mg/day)
0-220.06 411 327 1.00 1.00
220.06-346.49 370 367 0.85 0.67, 1.09 0.85 0.66, 1.08
346.49-551.44 355 383 0.84 0.66, 1.08 0.83 0.65, 1.06
>551.44 339 398 0.73 0.57, 0.94 0.71 0.55, 0.92
p-value for trend (quartiles) 0.02 0.01
p-value for trend (continuous) 0.002 0.001
DHA
(total) (mg/day)
0-233.35 413 325 1.00 1.00
233.35-362.65 375 362 0.94 0.73, 1.21 0.92 0.72, 1.18
362.65-577.16 358 380 0.83 0.65, 1.07 0.81 0.64, 1.04
>577.16 329 408 0.70 0.55, 0.90 0.67 0.52, 0.87
p-value for trend (quartiles) 0.004 0.002
p-value for trend (continuous) 0.001 0.0003
*Based on the distribution of the energy adjusted variable
†Model IV: Adjusted for family history of cancer, BMI, physical activity, smoking, total energy intake (residual
method), fibre intake (energy adjusted), alcohol intake (energy adjusted), NSAIDs intake and for total energy
intake (included as a covariate)
‡Model V: Adjusted for family history of cancer, BMI, physical activity, smoking, total energy intake (residual
method), fibre intake (energy adjusted), alcohol intake (energy adjusted), NSAIDs intake and for total fatty acids
intake (energy-adjusted)

Chapter six Results: Flavonoids, fatty acids and colorectal cancer
257
Table 77 Association between meat and meat products, confectionery and savoury snacks, fish and fish dishes and colorectal cancer risk in the whole sample (3
main conditional logistic regression models; Cases and controls matched on age, gender and area of residence)
Food groups Quartiles* Frequency Model I
† Model II
‡ Model III§
cases controls OR 95% CI OR 95% CI OR 95% CI
Meat and meat products
(m/day**)
0-1.71 363 375 1.00 1.00 1.00
1.71-2.31 380 357 1.14 0.94, 1.40 1.10 0.90, 1.35 1.03 0.81, 1.32
2.31-3.05 360 378 1.08 0.88, 1.34 0.98 0.80, 1.20 0.85 0.66, 1.08
>3.05 372 365 1.35 1.09, 1.68 1.05 0.85, 1.30 0.93 0.72, 1.21
p-value for trend (quartiles) 0.02 0.89 0.33
p-value for trend (continuous) 0.005 0.40 0.89
Confectionery & savoury
snacks (m/day)
0-0.42 339 399 1.00 1.00 1.00
0.42-0.93 342 395 1.08 0.88, 1.32 1.02 0.83, 1.25 1.08 0.85, 1.37
0.93-1.75 380 358 1.29 1.05, 1.59 1.27 1.04, 1.56 1.26 0.99, 1.60
>1.75 414 323 1.57 1.28, 1.93 1.55 1.25, 1.91 1.47 1.14, 1.90
p-value for trend (quartiles) 7.4x10⁻⁶
9.4x10⁻⁶
0.002
p-value for trend (continuous) 9.0x10⁻⁵
0.002 0.02
Fish and fish dishes
(m/day)
0-0.42 391 347 1.00 1.00 1.00
0.42-0.73 373 364 1.07 0.87, 1.31 0.91 0.74, 1.11 0.93 0.73, 1.18
0.73-1.17 378 360 0.96 0.78, 1.19 0.94 0.76, 1.15 0.96 0.75, 1.21
>1.17 333 404 0.92 0.76, 1.14 0.73 0.60, 0.90 0.77 0.60, 0.99
p-value for trend (quartiles) 0.30 0.006 0.07
p-value for trend (continuous) 0.09 0.002 0.05
*Based on the distribution of the energy adjusted variable
†Model I: Crude analysis
‡Model II: Adjusted for total energy intake (residual method)
§Model III: Adjusted for family history of cancer, BMI, physical activity, smoking, total energy intake, fibre intake (energy adjusted), alcohol intake (energy adjusted), NSAIDs intake
** m/d: measures per day

Chapter six Results: Flavonoids, fatty acids and colorectal cancer
258
6.5 Summary of results of chapter 6
In this chapter the results of the matched analysis of the novel dietary risk factors
(flavonoid and fatty acid subgroups and individual compounds) that comprised the first
two hypotheses, were presented. In particular, one crude and four multivariable
conditional logistic regression models were applied in the whole sample, whereas one
conditional multivariable model adjusted for the main potential confounding factors was
applied after sex, age and cancer site stratification.
6.5.1 Flavonoids
Moderately strong inverse associations which showed dose response relationships were
found in the energy-adjusted conditional logistic regression model (model II) between
colorectal cancer risk and the intake of the subgroups flavonols (p=0.02) and
procyanidins (p=0.04) and the individual flavonoid compounds quercetin (p=0.002),
catechin (p=0.0001) and epicatechin (p=0.04) (Table 68). After adjusting for the main
potential confounding factors (model III), only the inverse associations between
colorectal cancer, quercetin (p=0.04) and catechin (p=0.02) remained statistically
significant (Table 68). Results from model IV, which was corrected for the confounding
factors of model III and for fruit and vegetable intake showed an inverse association
between catechin and colorectal cancer (p=0.05) (Table 69). Finally, results in model V,
which was corrected for the confounding factors of model III and further adjusted
mutually between flavonoid categories, showed inverse associations between colorectal
cancer and flavonols (p=0.0001), catechin (p=0.007) and epicatechin (p=0.03). In
marked contrast we showed no associations between intakes of the other four of the six
flavonoid subgroups studied (flavones, flavan3ols, flavanones and phytoestrogens) and
colorectal cancer risk (Table 68, Table 69). In addition, results of the analysis of the
main food sources (regular tea, onions, apples and red wine) of the flavonoid variables
that were found to be significantly associated with colorectal cancer, suggest that there is
some evidence in favour of an inverse association but this is less well defined than in the
analysis of the association of flavonol, procyanidin, quercetin, catechin or epicatechin
intakes and colorectal cancer risk (Table 70).

Chapter six Results: Flavonoids, fatty acids and colorectal cancer
259
6.5.2 Fatty acids
After residual energy-adjustment (model II) significant inverse dose-dependent
associations were observed between colorectal cancer and the dietary intakes of the fatty
acid subgroup ω3PUFAs (p=9.3x10⁻⁶
) and the individual compounds EPA (p=0.0001)
and DHA (p=0.0002) (Table 75). In contrast, a dose-dependent increase in risk was
observed for intake of dietary total FAs (p=0.001), SFAs (p=0.001), MUFAs (p=0.01)
tFAs (p=0.002) and tMUFAs (p=0.0003) and for the individual fatty acids palmitic
(p=0.001), stearic (p=7.9x10⁻⁶
) and oleic (p=0.001) (Table 75). In model III, only the
positive association between colorectal cancer and stearic acid (p=0.01) and the inverse
associations between colorectal cancer and dietary ω3PUFAs (p=0.01), EPA (p=0.02)
and DHA (p=0.02) remained statistically significant (Table 75). For both model IV
(further adjusted for total fatty acid intake) and model V (further adjusted for energy, in
addition to the residual energy adjustment) positive significant associations were
observed for stearic acid (p= 0.03 and 0.01, respectively) and inverse significant
associations were observed for ω3PUFAs, EPA and DHA (model IV: p=0.008, p=0.02
and p=0.02; model IV: p=0.002, p=0.01, p=0.01; respectively) (Table 76). In marked
contrast, the subgroups of PUFAs, ω6PUFAs and the individual fatty acids linoleic, γ-
linolenic, arachidonic and α-linolenic were not associated with colorectal cancer risk in
any of the adjusted logistic regression models (Table 75). Finally, results of the analysis
of the main food sources (meat and meat products, confectionery and savoury snacks
and fish and fish dishes) of the fatty acids that were found to be significantly associated
with colorectal cancer, suggest that there is some evidence in favour of a statistically
significant association (Table 77).

Chapter seven Results: Additional dietary risk factors and colorectal cancer
260
7 RESULTS: Associations between colorectal
cancer and intakes of folate, vitamin B2, vitamin B6,
vitamin B12, alcohol, vitamin D and calcium (unmatched
dataset)
7.1 Introduction
In this chapter the results of the unmatched analysis of the additional dietary risk factors
that comprise the last two hypotheses are presented. Specifically, the dietary risk factors
that were analysed using the unmatched dataset included: a) folate, vitamin B2, vitamin
B6, vitamin B12, alcohol and b) vitamin D and calcium.
In the first part of this chapter, the study population used in the unmatched analysis is
presented, including descriptive analysis of the main confounding factors and logistic
regression analysis to investigate their association relationships with colorectal cancer
risk. In the second part of the chapter descriptive analysis of the dietary risk factors are
presented including distribution analysis (whole sample and by case/ control status) and
correlation analysis. In addition, the association relationships between colorectal cancer
and each nutrient are investigated by applying three main unconditional logistic
regression models and one additional unconditional logistic regression model (for the
analysis of vitamin D and calcium). All tables and figures are presented at the end of
each section or in the Appendix, as indicated in the text.
7.2 The study sample
This analysis describes the characteristics of the cases and controls that were included in
the unmatched dataset. In total 2,062 cases and 2,776 controls were included. One case
reported very high dietary energy and nutrient intakes and therefore it was removed from
the analysis.
7.2.1 Descriptive analysis of the confounding factors
The distribution of the continuous confounding factors was examined by looking at their
histograms. In addition, their summary statistics are presented in Table 78 for the whole
sample and also separately for cases and controls. The t-test was used to test differences

Chapter seven Results: Additional dietary risk factors and colorectal cancer
261
between cases and controls in mean age, BMI, dietary energy, fibre intake (crude and
residually energy adjusted) and alcohol intake (crude and residually energy adjusted).
The Pearson χ2 test was used to test the differences in terms of sex, deprivation score,
family history of cancer, physical activity (hours/ week of cycling and sport activities),
smoking status and NSAIDs intake.
7.2.2 Associations between confounding factors and
colorectal cancer risk
The association relationship between each confounding factor and colorectal cancer risk
was tested by applying univariable logistic regression models (Table 79). Statistically
significant associations were observed for the majority of the confounding factors,
including:
- Age (>55 years old vs. ≤55 years old: OR (95%CI), p-value: 0.85 (0.75, 0.97), 0.01);
- Family history of cancer (moderate/ high vs. low: OR (95% CI), p-value: 18.58
(12.72, 27.13), 1.12x10-51
);
- Dietary energy intake (highest vs. lowest quartile: OR (95% CI), p-value for trend:
1.37 (1.17, 1.61), 2.2x10⁻⁵
);
- Residually energy adjusted fibre intake (highest vs. lowest quartile: OR (95% CI), p-
value for trend: 0.71 (0.60, 0.84), 3.3x10⁻⁵
);
- NSAIDs intake (yes vs. no: OR (95% CI), p-value: 0.73 (0.65, 0.83), 7.3x10⁻⁷
).

Chapter seven Results: Additional dietary risk factors and colorectal cancer
262
Table 78 Summary statistics of the confounding factors for the unmatched dataset
Variables All subjects
*
(n=4837)
Cases*
(n=2061)
Controls*
(n=2776) p-value
†
Age (years) 62.2 (10.6) 62.0 (10.8) 62.4 (10.5) 0.14
Age (years)
≤55 years 1392 (28.8%) 632 (30.7%) 760 (27.4%)
>55 years 3443 (71.2%) 1429 (69.3%) 2014 (72.6%) 0.01
Sex
Men 2762 (57.1%) 1180 (57.2%) 1582 (57.0%)
Women 2075 (42.9%) 881 (42.8%) 1194 (43.0%) 0.85
Deprivation score‡
1 452 (9.3%) 194 (9.4%) 258 (9.3%)
2 1002 (20.7%) 434 (21.1%) 568 (20.5%)
3 1290 (26.7%) 532 (25.8%) 758 (27.3%)
4 1133 (23.4%) 488 (23.7%) 645 (23.2%)
5 511 (10.6%) 218 (10.6%) 293 (10.6%)
6 318 (6.6%) 140 (6.8%) 178 (6.4%)
7 130 (2.7%) 54 (2.6%) 76 (2.7%) 0.95
Family history risk of
cancer
Low 4305 (89.0%) 1610 (78.1%) 2695 (97.1%)
Medium 328 (6.8%) 299 (14.5%) 29 (1.0%)
High 35 (0.72%) 34 (1.6%) 1 (0.0%)
Unknown 108 (2.2%) 91 (4.4%) 17 (0.61%) <0.0005
Missing 61 (1.3%) 27 (1.3%) 34 (1.2%)
BMI (kg/m2) § 26.7 (4.5) 26.6 (4.4) 26.7 (4.6) 0.41
Physical activity
(hours/day)
(cycling and other
sport activities)
0 2595 (53.6%) 1139 (55.3%) 1456 (52.4%)
0-3.5 1189 (24.6%) 486 (23.6%) 703 (25.3%)
3.5-7 544 (11.2%) 205 (9.9%) 339 (12.2%)
>7 318 (6.6%) 133 (6.5%) 185 (6.7%) 0.04
Missing 191 (3.9%) 98 (4.8%) 93 (3.4%)

Chapter seven Results: Additional dietary risk factors and colorectal cancer
263
Smoking
No 2074 (42.9%) 874 (42.4%) 1200 (43.2%)
Yes** 2719 (56.2%) 1161 (56.3%) 1558 (56.1%) 0.70
Missing 44 (0.9%) 26 (1.3%) 18 (0.65%)
Dietary energy
intake (MJ/day) 10.91 (4.1) 11.26 (4.4) 10.66 (3.95) <5x10
-5
Fibre intake (g/day) 22.4 (9.8) 22.5 (9.8) 22.3 (9.9) 0.64
Energy-adjusted
fibre intake (g/day) 21.4 (6.0) 20.9 (5.7) 21.7 (6.2) <5x10
-5
Alcohol intake
(g/day) 13.2 (15.8) 13.2 (16.0) 13.2 (15.6) 0.98
Energy-adjusted
alcohol intake
(g/day)
13.0 (15.1) 12.8 (15.3) 13.2 (15.0) 0.44
NSAIDs intake††
No 3206 (66.3%) 1449 (70.3%) 1757 (63.3%)
Yes 1605 (33.2%) 605 (29.4%) 1000 (36.0%) <0.0005
Missing 26 (0.5%) 7 (0.3%) 19 (0.7%)
* Mean values and in parentheses standard deviations for quantitative variables; number of subjects and in parenthesis
percentages for categorical variables.
† P-values from the Pearson χ2 for categorical variables; from t-test for continuous variables
‡ Locally based deprivation index (Carstairs deprivation index) based on the 2001 Census data; 7 categories ranging
from very low deprivation (deprivation score 1) to very high deprivation (deprivation score 7). Missing data for one
case
§ Missing data for 21 cases and 34 controls
** Smokers were defined as individuals who have smoked at least one cigarette per day and/ or one cigar per month
and/ or pipe.
†† Frequent use was defined as an intake of at least 4 days per week for at least one month.

Chapter seven Results: Additional dietary risk factors and colorectal cancer
264
Table 79 Association between the confounding factors and colorectal cancer risk (univariable
logistic regression analysis)
Confounding
variables
Categories Frequency Univariable analysis p-value
cases controls OR 95% CI
Age (years) 2061 2774 0.99 0.99, 1.00 0.14
Age (years) ≤55 years 632 760 1.00
>55 years 1429 2014 0.85 0.75, 0.97 0.01
Sex Men 1180 1582 1.00
Women 881 1194 0.99 0.88, 1.11 0.85
Deprivation
score
1 194 258 1.00
2 434 568 1.02 0.81, 1.27 0.89
3 532 758 0.96 0.75, 1.16 0.53
4 488 645 1.01 0.81, 1.25 0.96
5 218 293 0.99 0.77, 1.28 0.94
6 140 178 1.05 0.78, 1.40 0.76
7 54 76 0.94 0.64, 1.40 0.78
p-value for trend 0.94
Family history
risk of cancer
Low 1610 2695 1.00
Medium/ High 333 30 18.58 12.72, 27.13 1.12x10-51
BMI (kg/m2) Continuous 2040 2742 0.99 0.98, 1.01 0.42
BMI (kg/m2) 18.5-25 778 1000 1.00
<18.5 21 38 0.71 0.41, 1.22 0.22
25-30 862 1173 0.94 0.83, 1.07 0.38
≥ 30 379 531 0.92 0.78, 1.08 0.30
p-value for trend 0.27
Physical activity
(hours/week)
0 1139 1456 1.00
0-3.5 486 703 0.88 0.77, 1.02 0.08
3.5-7 205 339 0.77 0.64, 0.93 0.008
>7 133 185 0.92 0.73, 1.16 0.48
p-value for trend 0.02
Smoking No 874 1200 1.00
Former 818 1049 1.07 0.94, 1.21 0.29
Current 343 509 0.93 0.79, 1.09 0.35
p-value for trend 0.63

Chapter seven Results: Additional dietary risk factors and colorectal cancer
265
Dietary energy
intake (MJ/day)
continuous 2061 2776 1.04 1.02, 1.05 7.4x10⁻⁷
Dietary energy
intake (MJ/day)
0- 8.25 478 733 1.00
8.25-10.17 483 725 1.02 0.87, 1.20 0.80
10.17- 12.73 529 680 1.19 1.01, 1.40 0.03
>12.73 571 638 1.37 1.17, 1.61 0.0001
p-value for trend 2.2x10⁻⁵
Fibre intake
(g/day)
continuous 2061 2776 1.00 0.99, 1.01 0.64
Fibre intake
(g/day)
0- 15.90 508 712 1.00
15.90- 20.70 527 690 1.07 0.91, 1.26 0.41
20.70- 26.90 510 685 1.04 0.89, 1.23 0.61
>26.90 516 689 1.05 0.89, 1.23 0.56
p-value for trend 0.64
Fibre intake
energy adjusted
(g/day)
continuous 2061 2776 0.98 0.97, 0.99 2.8x10⁻⁶
Fibre intake
energy adjusted
(g/day)
0- 17.34 549 661 1.00
17.34-20.97 542 667 0.98 0.83, 1.15 0.79
20.97-24.94 521 688 0.91 0.78, 1.01 0.26
>24.94 449 760 0.71 0.60, 0.84 4.0x10⁻⁵
p-value for trend 3.3x10⁻⁵
Alcohol intake
(g/day)
continuous 2061 2776 1.00 0.99, 1.00 0.98
Alcohol intake
(g/day)
0-1.70 526 696 1.00
1.70-8.10 534 692 1.02 0.87, 1.20 0.80
8.10-19.2 501 681 0.97 0.83, 1.14 0.74
>19.20 500 707 0.94 0.80, 1.10 0.42
p-value for trend 0.34
Alcohol intake
energy adjusted
(g/day)
continuous 2061 2776 1.00 0.99, 1.00 0.44
Alcohol intake
energy adjusted
(g/day)
0-1.84 526 684 1.00
1.84- 8.07 539 670 1.05 0.89, 1.23 0.58
8.07-18.99 509 700 0.95 0.80, 1.11 0.50
>18.99 487 722 0.88 0.75, 1.03 0.11
p-value for trend 0.06
NSAIDs intake No 1449 1757 1.00
Yes 605 1000 0.73 0.65, 0.83 7.3x10⁻⁷

Chapter seven Results: Additional dietary risk factors and colorectal cancer
266
7.3 Folate, vitamin B2, vitamin B6, vitamin B12
and alcohol
This analysis describes the distribution and correlation of the nutrients involved in
one-carbon metabolic pathway. In addition, differences in crude and energy-adjusted
nutrient intakes between cases and controls and the unadjusted and adjusted
associations between nutrient intakes and colorectal cancer are presented.
7.3.1 Descriptive analysis
7.3.1.1 Distribution of nutrients
Distribution of the nutrients (folate, vitamin B2, vitamin B6, vitamin B12 and
alcohol) was examined by looking at their histograms (original and transformed
variables if skewed). The distributions of the nutrients under study were skewed and
they were normalised either with square root or with logarithmic transformation
(Table 80).
7.3.1.2 Distribution of nutrients by case control status
Cases reported higher mean crude intakes for folate (p=0.05), vitamin B2 (p=0.0018)
and vitamin B6 (p=0.03). In addition cases reported higher median crude intakes for
vitamin B2 (p=0.005) (Table 81). After energy adjustment (residual energy
adjustment) cases reported lower mean intakes for folate (p=0.0002), vitamin B6
(<5x10⁻⁵) and vitamin B12 (0.0047). In addition cases reported lower median intakes
for folate (p=0.0003), vitamin B6 (<5x10⁻⁵) and vitamin B12 (0.02) (Table 81).
7.3.1.3 Correlations between the nutrients
The highest correlations were observed between folate, vitamin B2 and vitamin B6
with r>0.7. Vitamin B12 was moderately correlated with folate (r=0.56), vitamin B2
(r=0.69) and vitamin B6 (r=0.62). Alcohol was not correlated with any of the
nutrients (r<0.15) (Table 82).
7.3.1.4 Main sources of folate, vitamin B2, vitamin B6, vitamin
B12 and alcohol
The three main food sources (at individual food item level) were: 1) for folate: boiled
or baked potatoes (10.0%), bran flakes and sultana bran and All Bran (4.9%) and
regular tea (3.7%); 2) for vitamin B2: semi-skimmed milk (14.0%), full fat milk
(4.5%) and corn flakes, Special K and Rice Krispies (4.1%); 3) for vitamin B6:

Chapter seven Results: Additional dietary risk factors and colorectal cancer
267
boiled or baked potatoes (14.4%), bananas (4.9%) and mixed vegetable dishes
(4.3%); 4) for vitamin B12: fried oily fish (12.9%), liver, liver sausage or liver pate
(8.4%) and semi-skimmed milk (8.3%). The three alcoholic drinks that were the
main sourced of the total grams of consumed alcohol were: spirits or liqueurs
(28.2%), red wine (23.7%) and white wine (17.3%) (Table 83).
One thousand six hundred and sixty participants reported consumption of supplement
products and 461 of them reported consumption of supplements that contributed to
the daily intake of the nutrients involved in the one-carbon metabolic pathway (433
reported intakes of supplements that contributed in the folate dietary intake, 429 in
the B2 dietary intake, 445 in the B6 dietary intake and 411 in the B12 intake). We
identified the exact nutrient composition of these dietary supplements and added the
supplement nutrients to the dietary ones.
7.3.2 Associations between folate, vitamin B2, vitamin B6,
vitamin B12, alcohol and colorectal cancer risk
7.3.2.1 Main logistic regression models
In model I, dietary intake of vitamin B2 was positively associated with colorectal
cancer (high vs. low intake: OR (95% CI), p-value: 1.21 (1.03, 1.42), 0.02) (Table
84). Associations between total intakes (from diet and supplements) of the nutrients
and colorectal cancer were not examined in model I, since intake from supplements
was added to the energy-adjusted nutrients. After energy adjustment (Model II), both
dietary and total intakes of folate, vitamin B6 and vitamin B12 were significantly and
inversely associated with colorectal cancer (high vs. low dietary intake: OR (95%
CI), p-value: 0.80 (0.68, 0.94), 0.003; 0.71 (0.60, 0.83), 7.1x10⁻⁶
; 0.80 (0.68, 0.95),
0.02; respectively) (Table 84). In model III dietary and total vitamin B12 was
inversely associated with colorectal cancer risk (high vs. low dietary intake: OR
(95% CI), p-value: 0.80 (0.67, 0.96), 0.04). In addition, an inverse marginally non-
significant association between dietary vitamin B6 and colorectal cancer was
observed (high vs. low intake: OR (95% CI), p-value: 0.85 (0.69, 1.04), 0.09) (Table
84). Regarding alcohol intake, when divided in quartiles, a significant inverse and
dose-dependent association was observed when applying model III (high vs. low
intake: OR (95% CI), p-value: 0.83 (0.68, 1.00), 0.03) (Table 84). However, when
alcohol was divided into categories according to the level of intake, individuals with

Chapter seven Results: Additional dietary risk factors and colorectal cancer
268
an intake of more than 60g/day were associated with a non dose-dependent increased
colorectal cancer risk, which was statistically significant only when applying model I
(high vs. low dietary intake: OR (95% CI), p-value for trend: 1.70 (1.11, 2.60), 0.28)
(Table 84).
7.3.2.2 Multiple testing corrections
Bonferroni correction for multiple testing
The adjusted level of significance after having controlled for multiple testing was: a)
0.003 using the Bonferroni correction for 19 independent tests, b) 0.003 using the
Bonferroni correction for 15 tests conducted in hypothesis 3 and c) 0.0005 for the
individual compound analysis after having corrected for 93 tests conducted in all 4
hypotheses. Here we report only associations between dietary intakes and colorectal
cancer. In model II the associations between colorectal cancer and vitamin B6
(p=7.1x10⁻⁶
) remained significant at all three levels of correction, whereas
associations with folate (p=0.001) remained significant at the second level of
significance (Table 84).
FDR correction for multiple testing
After correcting for multiple testing using the FDR method by taking into account
the number of tests that were conducted in hypothesis 3 (15 tests) or the number of
tests that were conducted in all 4 hypotheses (93 tests in the individual compound
analysis), model II associations between dietary intakes of vitamin B6 (p=7.1x10⁻⁶)
and folate (p=0.001) and colorectal cancer remained significant (Table 84).
7.3.2.3 Associations between colorectal cancer and main food
sources of folate, vitamin B6 and vitamin B12
Intakes of the following food groups were tested: boiled or baked potatoes, bran
flakes, bananas, fried oily fish and liver, liver sausage or liver pate. Results from
model III, showed that comparison of highest versus lowest quartile (tertile) intakes
of these foods showed ORs for colorectal cancer risk of 1.13 (95% CI 0.93, 1.37; p-
value for trend 0.38) for boiled or baked potatoes; 1.15 (95% CI 0.98, 1.35; p-value
for trend 0.17) for bran flakes; 0.82 (95% CI 0.67, 0.99; p-value for trend 0.06) for
bananas; 0.74 (95% CI 0.61, 0.91; p-value for trend 0.20) for fried oily fish; and 0.98
(95% CI 0.81, 1.18; p-value for trend 0.86) for liver, liver sausage or liver pate
(Table 85).

Chapter seven Results: Additional dietary risk factors and colorectal cancer
269
7.3.2.4 Associations between folate, vitamin B2, vitamin B6,
vitamin B12, alcohol and colorectal cancer after sex, age and
cancer site stratification
Associations between each nutrient and colorectal cancer risk were tested after sex,
age and cancer site stratification by applying model III (data not shown) for both
dietary and total intakes. Sex-specific associations were similar for almost all
nutrients and for alcohol. However, high intakes of both dietary and total vitamin B6
and B12 were associated with a stronger decrease in colorectal cancer risk for
women (high vs. low dietary intake OR (95% CI), p-value for trend: 0.75 (0.53,
1.05), 0.08; 0.75 (0.56, 0.99), 0.04, respectively), than for men (data not shown).
Regarding age-specific differences, high intakes of vitamin B6 (dietary and total) and
alcohol (when divided in quartiles) was significantly and dose-dependently
associated with a decreased risk of colorectal cancer for the individuals younger than
55 years old (high vs. low dietary intake: OR (95% CI), p-value for trend: 0.59 (0.39,
0.89), 0.005; 0.63 (0.43, .93), 0.006; respectively), whereas high intake of both
dietary and total vitamin B12 was associated with a significant and dose-dependent
decreased risk of colorectal cancer for the individuals older than 55 years old (high
vs. low dietary intake: OR (95% CI), p-value for trend: 0.80 (0.64, 0.98), 0.05) (data
not shown). Finally, after cancer site stratification, the relationships of all the
nutrients with colon and rectal cancer were similar. Regarding alcohol, intake when
divided into quartiles, it was inversely associated with colon cancer (high vs. low
intake: OR (95% CI), p-value: 0.72 (0.57, 0.91), 0.003) but not with rectal cancer. In
contrast, when divided into categories according to the level of intake, high intake of
alcohol (>60 g/day) was positively associated only with rectal cancer (OR (95% CI):
1.81 (0.99, 3.29)) (data not shown).
7.3.2.5 Interaction relationships with variants of genes involved
in the one-carbon metabolic pathway
The genotypic effects of 3 polymorphic genes involved in the one-carbon metabolic
pathway on colorectal cancer risk were examined. In particular the genetic variants
that were examined were rs1801133 (MTHFR C677T), rs1801131 (MTHFR
A1298C), rs1805087 (MTR A2756G) and rs1801394 (MTRR A66G). The variant
Chapter seven Results: Additional dietary risk factors and colorectal cancer
270
allele frequencies of the four polymorphisms in the control sample were under
Hardy-Weinberg equilibrium (rs1801133 11.6%, rs1801131, 10.0%, rs1805087
19.6%, rs1801394 3.0%).
The associations between colorectal cancer risk and each of the four SNPs were
tested by applying one unadjusted and one simply adjusted (for age, sex and
deprivation score) logistic regression model (data not shown). In addition, ORs and
95% CI for dietary intakes of the nutrients were calculated in stratified groups
according to the rs1801133, rs1801131, rs1805087 and rs1801394 genotypes by
applying the multivariable model III adjusted for age, sex, deprivation score, family
history of cancer, BMI, physical activity, smoking, dietary energy intake (residual
method), fibre intake (energy adjusted), alcohol intake (energy adjusted), NSAIDs
intake (data not shown). Finally, interaction associations were examined by
investigating the combined effects of the genotypes and nutrient intakes. Interaction
was tested by examining the deviance of two different nested models; an interactive
model and its nested multiplicative one. The referent category used was
homozygotes of the wild type allele and of the lowest dietary nutrient intake quartile
(data not shown).
None of the four examined SNPs was significantly associated with colorectal cancer
risk (data not shown). However, a not statistically significant increased risk was
observed for the GG genotype of the rs1805087 (crude model: OR (95% CI), p-value
for trend: 1.30 (0.79, 2.12), 0.19) (data not shown). In addition, there was no clear
trend for the associations between colorectal cancer and folate, vitamin B2, vitamin
B6, vitamin B12 and alcohol after stratification according to the genotypes of
rs1801133, rs1801131, rs1805087 or rs1801394 (data not shown). Finally, our data
did not support the hypothesis that folate or any of the vitamins B2, B6, B12 interacts
with the rs1801133 (MTHFR 677TT) variant or with any of the rs1801131 (MTHFR
A1298G), rs1805087 (MTR A2756G) or rs1801339 (MTRR A66G) variants (data not
shown).
7.3.3 Summary of results
Inverse associations which showed dose response relationships were found: 1) in
model II: between colorectal cancer risk and the dietary intakes of folate (p=0.003),
vitamin B6 (p=7.1x10⁻⁶) and vitamin B12 (p=0.02) (Table 84); 2) in model III:

Chapter seven Results: Additional dietary risk factors and colorectal cancer
271
between colorectal cancer and vitamin B12 (p=0.05) and alcohol (p=0.03) (Table
84). When alcohol intakes were divided in six categories (instead of quartiles), no
association was observed for an intake of less than 60 g/day, whereas a positive non-
significant association was observed for an alcohol intake of more than 60 g/day
(Table 84). Regarding the analysis of the main food sources of folate, vitamin B6 and
vitamin B12, results suggest that there is some evidence in favour of a significant
inverse association between colorectal cancer and intakes of bananas (dietary source
of vitamin B6) and fried oily fish (dietary source of vitamin B12) (Table 85). Finally,
regarding the genetic analysis, none of the four examined SNPs was significantly
associated with colorectal cancer risk. Furthermore, there was no clear trend for the
associations between colorectal cancer and folate, vitamin B2, vitamin B6, vitamin
B12 and alcohol after stratification according to the genotypes of the aforementioned
variants (data not shown).

Chapter seven Results: Additional dietary risk factors and colorectal cancer
272
Table 80 Nutrients involved in the one-carbon metabolic pathway that were elected to be included in the analysis
Nutrients included in the analysis Transformation
Individual compounds
Folate logarithmic
Vitamin B2 logarithmic
Vitamin B6 logarithmic
Vitamin B12 logarithmic
Alcohol square root
Table 81 Descriptive report of crude and energy-adjusted nutrients involved in the one-carbon metabolic pathway
Nutrients All subjects
(n=4837)
Cases
(n=2061)
Controls
(n=2776)
T-test Wilcoxon
rank test
Mean
(SD)
Median
(IQR)
Mean
(SD)
Median
(IQR)
Mean
(SD)
Median
(IQR)
p-value p-value
Folate
(µg/day)
343.2
(131.1)
322.0
(256.0, 400.0)
346.1
(128.0)
324.0
(260.0, 402.0)
341.1
(133.2)
321.0
(253.0, 399.0)
0.05 0.10
Energy-adjusted
folate (µg/day)
329.3
(71.5)
325.9
(282.6, 370.8)
324.9
(68.2)
321.3
(280.5, 365.7)
332.7
(73.6)
328.9
(283.8, 374.7)
0.0002 0.0003
Vitamin B2
(mg/day)
2.2
(0.9)
2.1
(1.6, 2.6)
2.3
(0.9)
2.1
(1.7, 2.7)
2.2
(0.9)
2.1
(1.6, 2.6)
0.0018 0.005
Energy-adjusted
vitamin B2 (mg/day)
2.1
(0.5)
2.1
(1.8, 2.4)
2.1
(0.5)
2.1
(1.8, 2.4)
2.1
(0.5)
2.1
(1.8, 2.4)
0.09 0.13
Vitamin B6
(mg/day)
3.0
(1.2)
2.8
(2.2, 3.5)
3.0
(1.2)
2.8
(2.2, 3.5)
3.0
(1.2)
2.8
(2.2, 3.5)
0.03 0.15
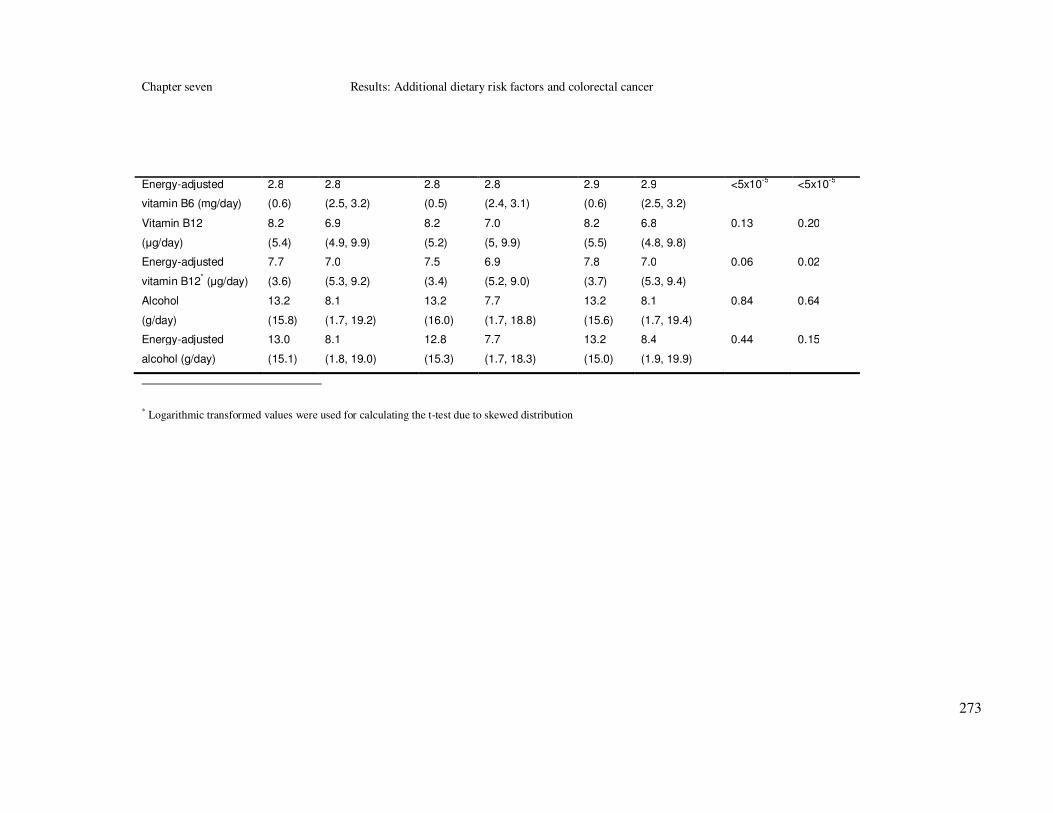
Chapter seven Results: Additional dietary risk factors and colorectal cancer
273
Energy-adjusted
vitamin B6 (mg/day)
2.8
(0.6)
2.8
(2.5, 3.2)
2.8
(0.5)
2.8
(2.4, 3.1)
2.9
(0.6)
2.9
(2.5, 3.2)
<5x10⁻⁵
<5x10⁻⁵
Vitamin B12
(µg/day)
8.2
(5.4)
6.9
(4.9, 9.9)
8.2
(5.2)
7.0
(5, 9.9)
8.2
(5.5)
6.8
(4.8, 9.8)
0.13 0.20
Energy-adjusted
vitamin B12* (µg/day)
7.7
(3.6)
7.0
(5.3, 9.2)
7.5
(3.4)
6.9
(5.2, 9.0)
7.8
(3.7)
7.0
(5.3, 9.4)
0.06 0.02
Alcohol
(g/day)
13.2
(15.8)
8.1
(1.7, 19.2)
13.2
(16.0)
7.7
(1.7, 18.8)
13.2
(15.6)
8.1
(1.7, 19.4)
0.84 0.64
Energy-adjusted
alcohol (g/day)
13.0
(15.1)
8.1
(1.8, 19.0)
12.8
(15.3)
7.7
(1.7, 18.3)
13.2
(15.0)
8.4
(1.9, 19.9)
0.44 0.15
* Logarithmic transformed values were used for calculating the t-test due to skewed distribution

Chapter seven Results: Additional dietary risk factors and colorectal cancer
274
Table 82 Spearman rank correlation coefficients between nutrients involved in the one-carbon
metabolic pathway (all p-values<5x10⁻⁵)
Nutrients folate B2 B6 B12 alcohol
folate 1.00
vitamin B2 0.82 1.00
vitamin B6 0.92 0.79 1.00
vitamin B12 0.56 0.69 0.62 1.00
alcohol 0.14 0.08 0.16 0.15 1.00
Table 83 Three main dietary (food) sources of nutrients involved in the one-carbon metabolic
pathway in our population
Nutrients Main sources
Folate Boiled or baked potatoes (10.0%)
Bran flakes, Sultana Bran and All Bran (4.9%)
Tea (3.7%)
Vitamin B2 Semi-skimmed milk (14.0%)
Full fat milk (4.5%)
Corn Flakes, Special K and Rice Krispies (4.1%)
Vitamin B6 Boiled or baked potatoes (14.4%)
Bananas (4.9%)
Mixed vegetable dishes (4.3%)
Vitamin B12 Fried oily fish (12.9%)
Liver, liver sausage or liver pate (8.4%)
Semi-skimmed milk (8.3%)
Alcohol Spirits or liqueurs (28.2%)
Red wine (23.7%)
White wine (17.3%)

Chapter seven Results: Additional dietary risk factors and colorectal cancer
275
Table 84 Association between the nutrients involved in the one-carbon metabolic pathway and colorectal cancer risk in the whole sample (3 main
unconditional logistic regression models)
Nutrients Quartiles* Frequency Model I
† Model II
‡ Model III
§
cases controls OR 95% CI OR 95% CI OR 95% CI
Folate
(µg/day)
0-282.65 533 677 1.00 1.00 1.00
282.65-325.89 546 663 1.17 0.99, 1.37 1.05 0.89, 1.23 1.22 1.01, 1.46
325.89-370.81 515 694 1.13 0.96, 1.33 0.94 0.80, 1.11 1.14 0.94, 1.39
≥370.81 467 742 1.15 0.98, 1.35 0.80 0.68, 0.94 1.03 0.82, 1.29
p-value for trend (quartiles) 0.14 0.003 0.92
p-value for trend (continuous) 0.19 0.0002 0.73
Folate
(total) (µg/day)
0-286.24 532 678 1.00 1.00
286.24-332.60 566 643 1.12 0.96, 1.32 1.31 1.09, 1.58
332.60-386.03 488 721 0.86 0.73, 1.01 1.07 0.88, 1.30
≥386.03 475 734 0.82 0.70, 0.97 1.06 0.85, 1.31
p-value for trend (quartiles) 0.001 0.84
p-value for trend (continuous) 0.42 0.36
Vitamin B2
(mg/day)
0-1.80 522 688 1.00 1.00 1.00
1.80-2.10 537 672 1.03 0.88, 1.22 1.05 0.90, 1.24 1.06 0.88, 1.26
2.10-2.42 511 698 1.11 0.94, 1.30 0.96 0.82, 1.13 1.00 0.83, 1.20
≥2.42 491 718 1.21 1.03, 1.42 0.90 0.77, 1.06 0.87 0.72, 1.05
p-value for trend (quartiles) 0.02 0.13 0.12
p-value for trend (continuous) 0.006 0.09 0.13
Vitamin B2
(total) (mg/day)
0-1.83 519 691 1.00 1.00
1.83-2.15 536 673 1.06 0.90, 1.24 1.04 0.87, 1.24

Chapter seven Results: Additional dietary risk factors and colorectal cancer
276
2.15-2.53 510 699 0.97 0.83, 1.14 0.97 0.81, 1.17
≥2.53 496 713 0.93 0.79, 1.09 0.93 0.77, 1.17
p-value for trend (quartiles) 0.22 0.35
p-value for trend (continuous) 0.63 0.81
Vitamin B6
(mg/day)
0-2.47 547 663 1.00 1.00 1.00
2.47-2.83 555 654 1.17 1.00, 1.38 1.03 0.88, 1.21 1.14 0.95, 1.37
2.83-3.21 514 695 1.05 0.89, 1.24 0.90 0.76, 1.05 1.04 0.86, 1.26
≥3.21 445 764 1.12 0.95, 1.31 0.71 0.60, 0.83 0.85 0.69, 1.04
p-value for trend (quartiles) 0.38 7.1x10⁻⁶
0.09
p-value for trend (continuous) 0.10 2.9x10⁻⁵
0.13
Vitamin B6
(total) (mg/day)
0-2.51 555 655 1.00 1.00
2.51-2.90 541 668 0.96 0.81, 1.12 1.08 0.90, 1.30
2.90-3.32 494 715 0.81 0.69, 0.96 1.00 0.82, 1.21
≥3.32 471 738 0.75 0.64, 0.89 0.91 0.74, 1.11
p-value for trend (quartiles) 0.0001 0.25
p-value for trend (continuous) 0.10 0.43
Vitamin B12
(µg/day)
0-5.27 538 672 1.00 1.00 1.00
5.27-6.96 516 693 1.05 0.89, 1.23 0.93 0.79, 1.09 0.95 0.79, 1.14
6.96-9.21 533 676 1.20 1.02, 1.41 0.98 0.84, 1.16 1.00 0.84, 1.20
≥9.21 474 735 1.12 0.95, 1.31 0.80 0.68, 0.95 0.80 0.67, 0.97
p-value for trend (quartiles) 0.06 0.02 0.05
p-value for trend (continuous) 0.73 0.005 0.003
Vitamin B12
(total) (µg/day)
0-5.35 543 667 1.00 1.00
5.35-7.09 515 694 0.91 0.78, 1.07 0.90 0.75, 1.08

Chapter seven Results: Additional dietary risk factors and colorectal cancer
277
7.09-9.41 527 682 0.95 0.81, 1.11 0.95 0.80, 1.14
≥9.41 476 733 0.80 0.68, 0.94 0.80 0.67, 0.96
p-value for trend (quartiles) 0.01 0.04
p-value for trend (continuous) 0.71 0.81
Alcohol
(g/day)
0-1.70 526 696 1.00 1.00 1.00
1.70-8.10 534 692 1.02 0.87, 1.20 1.05 0.89, 1.22 1.07 0.89, 1.28
8.10-19.2 501 681 0.97 0.83, 1.14 0.95 0.80, 1.11 0.94 0.78, 1.13
>19.20 500 707 0.94 0.80, 1.10 0.88 0.75, 1.03 0.83 0.68, 1.00
p-value for trend (quartiles) 0.34 0.06 0.03
p-value for trend (continuous) 0.98 0.44 0.24
Alcohol
(g/day)
0 291 427 1.00 1.00 1.00
0-15 1125 1473 1.12 0.95, 1.33 1.09 0.92, 1.29 1.10 0.91, 1.33
15-30 393 548 1.05 0.86, 1.28 1.00 0.82, 1.23 1.02 0.81, 1.29
30-45 139 202 1.01 0.78, 1.31 0.94 0.72, 1.22 0.97 0.72, 1.32
45-60 61 81 1.11 0.77, 1.59 1.00 0.69, 1.44 0.97 0.65, 1.46
>60 52 45 1.70 1.11, 2.60 1.47 0.96, 2.27 1.37 0.84, 2.22
p-value for trend 0.28 0.89 0.91
*Based on the distribution of the energy adjusted variable
†Model I: Crude analysis
‡Model II: Adjusted for total energy intake (residual method)
§Model III: Adjusted for age, sex, deprivation score, family history of cancer, BMI, physical activity, smoking, total energy intake (residual method), fibre intake (energy adjusted),
alcohol intake (energy adjusted), NSAIDs intake

Chapter seven Results: Additional dietary risk factors and colorectal cancer
278
Table 85 Association between boiled or baked potatoes, bran flakes, bananas, fried oily fish, liver sausage or liver pate and colorectal cancer risk in the whole
sample (3 main unconditional logistic regression models)
Food sources Quartiles* Frequency Model I
† Model II
‡ Model III
§
cases controls OR 95% CI OR 95% CI OR 95% CI
Baked or boiled potatoes
(m/day**)
0-0.42 583 888 1.00 1.00 1.00
0.42-0.85 702 845 1.27 1.09, 1.46 1.21 1.05, 1.40 1.22 1.04, 1.44
0.85-1.28 197 427 1.06 0.88, 1.27 1.00 0.83, 1.20 1.08 0.88, 1.32
>1.28 479 616 1.18 101, 1.39 1.06 0.90, 1.25 1.13 0.93, 1.37
p-value for trend (quartiles) 0.14 0.93 0.38
p-value for trend (continuous) 0.53 0.31 0.82
Bran flakes (m/day) 0 1533 2079 1.00 1.00 1.00
0-0.05 54 97 0.75 0.54, 1.06 0.75 0.54, 1.06 0.72 0.49, 1.07
>0.05 474 600 1.07 0.93, 1.23 1.06 0.93, 1.22 1.15 0.98, 1.35
p-value for trend (quartiles) 0.51 0.56 0.17
p-value for trend (continuous) 0.47 0.65 0.31
Bananas (m/day) 0-0.14 645 845 1.00 1.00 1.00
0.14-0.42 621 735 1.11 0.95, 1.28 1.09 0.94, 1.26 1.13 0.96, 1.33
0.42-0.71 400 511 1.02 0.87, 1.21 0.99 0.83, 1.17 1.07 0.89, 1.30
>0.71 395 685 0.75 0.64, 0.89 0.70 0.60, 0.83 0.82 0.67, 0.99
p-value for trend (quartiles) 0.001 3.6x10⁻⁵
0.06
p-value for trend (continuous) 0.0003 2.5x10⁻⁶
0.02
Fried oily fish (m/day) 0 1148 1524 1.00 1.00 1.00
0-0.14 659 832 1.05 0.92, 1.19 1.05 0.92, 1.19 1.09 0.94, 1.26

Chapter seven Results: Additional dietary risk factors and colorectal cancer
279
>0.14 254 420 0.80 0.67, 0.95 0.73 0.61, 0.87 0.74 0.61, 0.91
p-value for trend (quartiles) 0.20 0.05 0.20
p-value for trend (continuous) 0.02 0.001 0.001
Liver, liver sausage
or liver pate (m/day)
0 1450 1990 1.00 1.00 1.00
0-0.05 299 417 0.98 0.84, 1.16 0.98 0.83, 1.15 1.00 0.83, 1.20
>0.05 312 369 1.16 0.98, 1.37 1.07 0.91, 1.27 0.98 0.81, 1.18
p-value for trend (quartiles) 0.18 0.58 0.86
p-value for trend (continuous) 0.33 0.92 0.29
*Based on the distribution of the crude variable
†Model I: Crude analysis
‡Model II: Adjusted for total energy intake (standard method)
§Model III: Adjusted for age, sex, deprivation score, family history of cancer, BMI, physical activity, smoking, total energy intake (residual method), fibre intake (energy adjusted),
alcohol intake (energy adjusted), NSAIDs intake
** m/day: measures per day

Chapter seven Results: Additional dietary risk factors and colorectal cancer
280
7.4 Vitamin D and calcium
This analysis describes the distribution and correlation of vitamin D and calcium. In
addition, the differences in crude and energy-adjusted nutrient intakes between cases
and controls and the unadjusted and adjusted association between nutrient intakes
and colorectal cancer are presented.
7.4.1 Descriptive analysis
7.4.1.1 Distribution of vitamin D and calcium intakes
Distributions of vitamin D and calcium were examined by looking at their
histograms (original and transformed variables if skewed). The distributions of the
nutrients under study were skewed and they were normalised either with square root
or with logarithmic transformation (Table 86).
7.4.1.2 Distribution of vitamin D and calcium intakes by case
control status
For crude nutrient intakes, cases reported statistically significant higher mean and
median intakes of calcium (p-values: 0.0002 and 0.0005, respectively) than controls.
After residual energy adjustment cases reported lower mean and median vitamin D
intakes (p-values: 0.001 and 0.001 respectively) than controls (Table 87).
7.4.1.3 Correlations between vitamin D and calcium
The Spearman rank correlation coefficient (r) was used to test the correlation
between vitamin D and calcium (Table 88) and they were found to be moderately
correlated (r<0.50).
7.4.1.4 Main sources of vitamin D and calcium
The three main food sources (at individual food item level) were: 1) for vitamin D
fried oily fish (22.9%), smoked oily fish (10.0%) and grilled, poached, baked or
pickled oily fish (6.7%); and 2) for calcium: semi-skimmed milk (17.8%), full fat
hard cheese (8.7%) and full fat milk (5.9%) (Table 89).
One thousand six hundred and sixty participants reported consumption of supplement
products and 1,255 of them reported consumption of supplements that contributed to
the daily intake of vitamin D (1,212 participants) and calcium (260 participants). The
exact nutrient composition of these dietary supplements was identified and added to
the dietary ones.

Chapter seven Results: Additional dietary risk factors and colorectal cancer
281
7.4.2 Associations between vitamin D, calcium and
colorectal cancer risk
7.4.2.1 Main logistic regression models
In model I, intakes of calcium were positively associated with colorectal cancer (high
vs. low intake: OR (95% CI), p-value: 1.33 (1.13, 1.57), 0.001) (Table 90).
Associations between total intakes (from diet and supplements) of vitamin D and
calcium and colorectal cancer were not examined in model I, since intake from
supplements was added to the energy-adjusted nutrients. After energy adjustment
(Model II), both dietary and total vitamin D intakes were significantly and inversely
associated with colorectal cancer (high vs. low dietary intake: OR (95% CI), p-value
for trend: 0.83 (0.70, 0.97), 0.01; high vs. low total intake: OR (95% CI), p-value for
trend: 0.80 (0.68, 0.95), 0.003) (Table 90). Finally, in model III an inverse
statistically significant association between dietary vitamin D and colorectal cancer
(high vs. low dietary intake: OR (95% CI), p-value for trend: 0.83 (0.69, 0.99), 0.03)
was observed, whereas association with total vitamin D and colorectal cancer was
marginally not statistically significant (high vs. low total intake: OR (95% CI), p-
value for trend: 0.88 (0.73, 1.06), 0.14) (Table 90).
7.4.2.2 Additional logistic regression models
The associations between vitamin D, calcium and colorectal cancer were tested in
one additional model (Model IV). Model IV was corrected for the confounding
factors of model III and further adjusted ω3PUFAs intake, since ω3PUFAs share the
same main food source with vitamin D (Table 91). The inverse association between
vitamin D intakes (dietary and total) and colorectal cancer was diluted and was no
longer statistically significant after adjusting for ω3PUFAs intake (p- value for trend:
0.51 and 0.41 respectively) (Table 91).
7.4.2.3 Multiple testing corrections
Bonferroni correction for multiple testing
The adjusted level of significance after having controlled for multiple testing was: 1)
0.002 using the Bonferroni correction for 21 independent tests, 2) 0.006 using the
Bonferroni correction for 8 tests conducted in hypothesis 4 and 3) 0.0005 for the
individual compound analysis after having corrected for 93 tests conducted in all 4

Chapter seven Results: Additional dietary risk factors and colorectal cancer
282
hypotheses. Here we report only associations between dietary intakes and colorectal
cancer. In model I, the association between colorectal cancer and calcium (p=0.001)
remained significant at the first and second level of significance (Table 90).
FDR correction for multiple testing
After correcting for multiple testing using the FDR method by taking into account
the number of tests that were conducted in hypothesis 4 (8 tests) or the number of
tests that were conducted in all 4 hypotheses (93 tests in the individual compound
analysis), associations between dietary intakes of calcium (p= 0.001; model I) and
vitamin D (p=0.01; model II) remained statistically significant (Table 90).
7.4.2.4 Associations between colorectal cancer and main food
sources of vitamin D and calcium
Intakes of the following food groups were tested: fried oily fish, smoked oily fish,
semi-skimmed milk and full fat hard cheese. Results from model III, showed that
comparison of highest versus lowest tertile intakes of these foods showed ORs for
colorectal cancer risk of 0.74 (95% CI 0.61, 0.91; p-value for trend 0.20) for fried
oily fish; 0.85 (95% CI 0.73, 1.00; p-value for trend 0.07) for smoked oily fish; 0.93
(95% CI 0.76, 1.14, p-value for trend 0.48); and 1.23 (95% CI 1.01, 1.49, p-value for
trend 0.009) for full fat hard cheese (Table 92).
7.4.2.5 Associations between vitamin D, calcium and colorectal
cancer after sex, age and cancer site stratification
Associations between vitamin D, calcium and colorectal cancer risk were tested after
sex, age and cancer site stratification by applying model III (data not shown). Sex-
specific associations were similar for dietary vitamin D intake and dietary and total
calcium intakes, with dietary vitamin D being inversely, but not significantly
associated with both male and female colorectal cancer (data not shown). In addition,
total vitamin D intake was associated with a decreased colorectal cancer risk
(marginally not statistically significant) for men, but not for women (data not
shown). Regarding age-specific differences, high intake of dietary and total vitamin
D was significantly and dose-dependently associated with a decreased risk of
colorectal cancer for the individuals older than 55 years old (high vs. low dietary
intake: OR (95% CI), p-value for trend: 0.80 (0.65, 0.99), 0.05), but not for the ones
younger than 55 years old (data not shown). Finally, after cancer site stratification,

Chapter seven Results: Additional dietary risk factors and colorectal cancer
283
both colon and rectal cancer were similarly associated with vitamin D (dietary and
total). Regarding calcium, high intakes of both dietary and total calcium were
inversely but not statistically significantly associated only with rectal cancer (high
vs. low intake: OR (95% CI), p-value: 0.83 (0.65, 1.07), 0.21) (data not shown).
7.4.2.6 Interaction relationships with variants of vitamin D
receptor gene
The genotypic effect of four SNPs of VDR (FokI (rs10735810), BsmI (rs1544410),
rs11568820 and ApaI (rs7975232)) on colorectal cancer risk was examined (data not
shown). The variant allele frequencies in the control sample of three of the four SNPs
(FokI (rs10735810), ApaI (rs7975232) and rs11568820) were under Hardy-Weinberg
equilibrium (p>0.05), but BsmI (rs1544410) was not (p= 0.01).
The associations between colorectal cancer risk and each of the four SNPs were
tested by applying one unadjusted and one simply adjusted (for age, sex and
deprivation score) logistic regression model (data not shown). ORs and 95% CI for
vitamin D and calcium dietary intakes were calculated in stratified groups according
to the rs10735810, rs1544410, rs11568820 and rs7975232 genotypes by applying the
multivariable adjusted model III (adjusted for age, sex, deprivation score, family
history of cancer, BMI, physical activity, smoking, dietary energy intake (residual
method), fibre intake (energy adjusted), alcohol intake (energy adjusted), NSAIDs
intake) (data not shown). In addition, interaction associations were examined by
investigating the combined effects of the genotypes and nutrient intakes. Interaction
was tested by examining the deviance of two different nested models; an interactive
model and its nested multiplicative one. The referent category used was
homozygotes of the wild type allele being at greatest risk (low dietary nutrient
intake).
None of the four examined SNPs was associated with colorectal cancer (data not
shown). The inverse association between vitamin D and colorectal cancer was more
profound for individuals of the rs10735810 CC genotype than for individuals of the
CT or TT genotypes (data not shown). Furthermore, calcium intake was inversely
though not significantly associated with colorectal cancer for the rs10735810 CC
individuals, whereas it was positively associated for the TT individuals (data not
shown). Finally, there was some evidence that rs10735810 interacts with dietary

Chapter seven Results: Additional dietary risk factors and colorectal cancer
284
vitamin D (p for interaction 0.06) and calcium intakes (p for interaction 0.13) (data
not shown).
7.4.3 Summary of results
Significant dose-dependent associations were observed: 1) in model I: between
colorectal cancer and dietary calcium (p=0.001); 2) in model II: between colorectal
cancer and dietary vitamin D (p=0.01); 3) in model III: between colorectal cancer
and dietary vitamin D (p=0.03) (Table 90). Regarding the analysis of the main food
sources of vitamin D and calcium, there is some evidence in favour of a significant
inverse association between colorectal cancer and intakes of fried and smoked oily
fish and a positive association between colorectal cancer and intakes of full fat hard
cheese (Table 92). In addition, none of the four examined SNPs was associated with
colorectal cancer (data not shown). Finally, there was some evidence that
rs10735810 interacts with vitamin D (p for interaction 0.06) and calcium dietary
intakes (p for interaction 0.13) (data not shown).

Chapter seven Results: Additional dietary risk factors and colorectal cancer
285
Table 86 Vitamin D and calcium transformation
Nutrients included in the analysis Transformation
Individual compounds
Vitamin D logarithmic
Calcium logarithmic
Table 87 Descriptive report of crude and energy-adjusted intakes of vitamin D and calcium
Nutrients All subjects
(n=4837)
Cases
(n=2061)
Controls
(n=2776)
T-test Wilcoxon
rank test
Mean
(SD)
Median
(IQR)
Mean
(SD)
Median
(IQR)
Mean
(SD)
Median
(IQR)
p-value p-value
Vitamin D
(µg/day)
4.8
(3.7)
3.9
(2.5,
5.8)
4.8
(3.4)
3.9
(2.54,
5.8)
4.8
(3.9)
3.9
(2.5,
5.8)
0.53 0.44
Energy-adjusted
vitamin D*
(µg/day)
4.5
(2.7)
3.9
(2.7,
5.5)
4.3
(2.5)
3.8
(2.7, 5.4)
4.6
(2.8)
3.9
(2.8,
5.6)
0.007 0.009
Calcium
(mg/day)
1158.3
(461.3)
1089.0
(840.0,
1391.0)
1183.3
(460.8)
1114.0
(860.0,
1424.0)
1139.7
(461.0)
1074.0
(824.0,
1365.5)
0.0002 0.0005
Energy-adjusted
calcium (g/day)
1108.2
(270.6)
1091.1
(924.4,
1269.7)
1105.3
(260.9)
1091.5
(926.6,
1268.3)
1110.3
(277.6)
1091.0
(923.3,
1270.9)
0.53 0.81
Table 88 Spearman rank correlation coefficients between nutrients (p-values<5x10⁻⁵)
Nutrients vitamin D calcium
vitamin D 1.00
calcium 0.45 1.00
Table 89 Three main dietary (food) sources of vitamin D and calcium in our population
Nutrients Main sources
Vitamin D Fried oily fish (22.9%)
Smoked oily fish (10.0%)
Grilled, poached, baked or pickled oily fish (6.7%)
Calcium Semi-skimmed milk (17.8%)
Full fat hard cheese (8.7%)
Full fat milk (5.9%)
* Logarithmic transformed values were used for calculating the t-test due to skewed distribution

Chapter seven Results: Additional dietary risk factors and colorectal cancer
286
Table 90 Association between vitamin D, calcium and colorectal cancer risk in the whole sample (3 main unconditional logistic regression models)
Nutrients Quartiles* Frequency Model I
† Model II
‡ Model III§
cases controls OR 95% CI OR 95% CI OR 95% CI
Vitamin D
(µg/day)
0-2.74 538 672 1.00 1.00 1.00
2.74-3.86 535 674 0.94 0.80, 1.11 0.99 0.84, 1.16 1.00 0.83, 1.20
3.86-5.47 506 703 1.04 0.89, 1.23 0.90 0.77, 1.06 0.93 0.77, 1.11
≥5.47 482 727 0.98 0.84, 1.16 0.83 0.70, 0.97 0.83 0.69, 0.99
p-value for trend (quartiles) 0.83 0.01 0.03
p-value for trend (continuous) 0.58 0.001 0.002
Vitamin D
(total) (µg/day)
0-3.03 528 682 1.00 1.00
3.03-4.64 554 655 1.09 0.93, 1.28 1.06 0.88, 1.27
4.64-7.48 515 694 0.96 0.82, 1.13 1.00 0.84, 1.20
≥7.48 464 745 0.80 0.68, 0.95 0.88 0.73, 1.06
p-value for trend (quartiles) 0.003 0.14
p-value for trend (continuous) 8.7x10⁻⁵
0.008
Calcium
(mg/day)
0-924.53 511 699 1.00 1.00 1.00
924.53-1091.09 519 690 1.16 0.99, 1.36 1.03 0.88, 1.21 0.93 0.78, 1.12
1091.09-1269.60 520 689 1.12 0.95, 1.32 1.03 0.88, 1.21 0.97 0.81, 1.17
≥1269.60 511 698 1.33 1.13, 1.57 1.00 0.85, 1.18 0.96 0.80, 1.15
p-value for trend (quartiles) 0.001 0.98 0.76
p-value for trend (continuous) 0.001 0.53 0.53
Calcium
(total) (mg/day)
0-931.59 511 699 1.00 1.00
931.59-1100.64 521 688 1.04 0.88, 1.22 0.94 0.78, 1.13
1100.64-1284.65 530 679 1.07 0.91, 1.25 1.00 0.83, 1.20
≥1284.65 499 710 0.96 0.82, 1.13 0.93 0.77, 1.12
p-value for trend (quartiles) 0.74 0.59
p-value for trend (continuous) 0.32 0.46

Chapter seven Results: Additional dietary risk factors and colorectal cancer
287
*Based on the distribution of the energy adjusted variable
†Model I: Crude analysis
‡Model I: Adjusted for total energy intake
§Model III: Adjusted for age, sex, deprivation score, family history of cancer, BMI, physical activity, smoking, total energy intake (residual method), fibre intake (energy
adjusted), alcohol intake (energy adjusted), NSAIDs intake

Chapter seven Results: Additional dietary risk factors and colorectal cancer
288
Table 91 Association between vitamin D, calcium and colorectal cancer risk in the whole sample
(additional unconditional logistic regression models)
Nutrients Quartiles* Frequency Model IV
†
cases controls OR 95% CI
Vitamin D
(µg/day)
0-2.74 538 672 1.00
2.74-3.86 535 674 1.05 0.87, 1.26
3.86-5.47 506 703 1.04 0.86, 1.26
≥5.47 482 727 1.10 0.86, 1.41
p-value for trend (quartiles) 0.51
p-value for trend (continuous) 0.71
Vitamin D
(total) (µg/day)
0-3.03 528 682 1.00
3.03-4.64 554 655 1.13 0.94, 1.36
4.64-7.48 515 694 1.14 0.94, 1.38
≥7.48 464 745 1.09 0.88, 1.36
p-value for trend (quartiles) 0.41
p-value for trend (continuous) 0.66
Calcium
(mg/day)
0-924.53 511 699 1.00
924.53-1091.09 519 690 0.95 0.79, 1.13
1091.09-1269.60 520 689 1.00 0.84, 1.20
≥1269.60 511 698 0.96 0.80, 1.16
p-value for trend (quartiles) 0.87
p-value for trend (continuous) 0.60
Calcium
(total) (mg/day)
0-931.59 511 699 1.00
931.59-1100.64 521 688 0.95 0.80, 1.14
1100.64-1284.65 530 679 1.03 0.86, 1.23
≥1284.65 499 710 0.94 0.78, 1.13
p-value for trend (quartiles) 0.70
p-value for trend (continuous) 0.55
* Based on the distribution of the energy adjusted variable
† Model IV: Adjusted for age, sex, deprivation score, family history of cancer, BMI, physical activity, smoking,
total energy intake (residual method), fibre intake (energy adjusted), alcohol intake (energy adjusted), NSAIDs
intake, ω3PUFAs (energy adjusted)

Chapter seven Results: Additional dietary risk factors and colorectal cancer
289
Table 92 Association between fried oily fish, smoked oily fish, semi-skimmed milk and full fat hard cheese and colorectal cancer risk in the whole sample (3
main unconditional logistic regression models)
Food sources Quartiles* Frequency Model I
† Model II
‡ Model III
§
cases controls OR 95% CI OR 95% CI OR 95% CI
Fried oily fish
(m/day**)
0 1148 1524 1.00 1.00 1.00
0-0.14 659 832 1.05 0.92, 1.19 1.05 0.92, 1.19 1.09 0.94, 1.26
>0.14 254 420 0.80 0.67, 0.95 0.73 0.61, 0.87 0.74 0.61, 0.91
p-value for trend (quartiles) 0.20 0.05 0.20
p-value for trend (continuous) 0.02 0.001 0.001
Smoked oily
fish (m/day)
0 1258 1628 1.00 1.00 1.00
0-0.05 324 446 0.94 0.80, 1.10 0.95 0.81, 1.11 0.97 0.81, 1.16
>0.05 479 702 0.88 0.77, 1.01 0.82 0.72, 0.95 0.85 0.73, 1.00
p-value for trend (quartiles) 0.07 0.01 0.07
p-value for trend (continuous) 0.003 5.0x10⁻⁵
0.001
Semi-skimmed
milk (m/day)
0 687 905 1.00 1.00 1.00
0-1 555 800 0.91 0.79, 1.06 0.94 0.81, 1.09 0.91 0.77, 1.08
1-2 509 670 1.00 0.86, 1.16 1.00 0.86, 1.16 0.95 0.80, 1.12
>2 310 401 1.02 0.85, 1.22 0.96 0.81, 1.15 0.93 0.76, 1.14
p-value for trend (quartiles) 0.74 0.84 0.48
p-value for trend (continuous) 0.78 0.71 0.30
Full fat hard
cheese (m/day)
0-0.05 462 754 1.00 1.00 1.00
0.05-0.28 533 769 1.13 0.97, 1.33 1.13 0.96, 1.32 1.11 0.93, 1.33
0.28-0.71 550 646 1.39 1.18, 1.63 1.34 1.14, 1.58 1.31 1.09, 1.57

Chapter seven Results: Additional dietary risk factors and colorectal cancer
290
>0.71 516 607 1.39 1.18, 1.64 1.26 1.07, 1.50 1.23 1.01, 1.49
p-value for trend (quartiles) 6.2x10⁻⁶
0.001 0.009
p-value for trend (continuous) 0.04 0.68 0.85
*Based on the distribution of the energy adjusted variable
†Model I: Crude analysis
‡Model II: Adjusted for total energy intake, standard method
§Model III: Adjusted for age, sex, deprivation score, family history of cancer, BMI, physical activity, smoking, total energy intake (residual method), fibre intake (energy adjusted),
alcohol intake (energy adjusted), NSAIDs intake
** m/d: measure per day

Chapter seven Results: Additional dietary risk factors and colorectal cancer
291
7.5 Summary of results of chapter 7
In this chapter the results of the unmatched analysis of the additional dietary risk factors
(folate, vitamin B2, vitamin B6, vitamin B12, alcohol, vitamin D and calcium) that
comprised the last two hypotheses, were presented. In particular, one crude and three
multivariable unconditional logistic regression models were applied in the whole
sample, whereas one unconditional multivariable model adjusted for the main potential
confounding factors was applied after sex, age and cancer site stratification.
7.5.1 Folate, vitamin B2, vitamin B6, vitamin B12 and alcohol
Inverse associations, which showed dose response relationships, were found in the
energy-adjusted conditional logistic regression model (model II) between colorectal
cancer risk and the dietary intakes of folate (p=0.003), vitamin B6 (p=7.1x10⁻⁶
) and
vitamin B12 (p=0.02) (Table 84). After adjusting for the main potential confounding
factors (model III), only the inverse associations between colorectal cancer and vitamin
B12 (p=0.05) remained statistically significant (Table 84). Alcohol intake when divided
in quartiles was associated with a decreased colorectal cancer risk, and the association
was statistically significant in model III (p=0.03) (Table 84). However, when divided
into categories, no association was observed for an intake of less than 60 g/day, whereas
a positive not statistically significant association was observed for an alcohol intake of
more than 60 g/day (Table 84). Regarding the analysis of the main food sources of
folate, vitamin B6 and vitamin B12, results suggest that there is some evidence in favour
of a significant inverse association between colorectal cancer and intakes of bananas
(dietary source of vitamin B6) and fried oily fish (dietary source of vitamin B12) (Table
85). Finally, regarding the genetic analysis, none of the four examined SNPs was
significantly associated with colorectal cancer risk (data not shown). Furthermore, there
was no clear trend for the associations between colorectal cancer and folate, vitamin B2,
vitamin B6, vitamin B12 and alcohol after stratification according to the aforementioned
genotypes (data not shown).

Chapter seven Results: Additional dietary risk factors and colorectal cancer
292
7.5.2 Vitamin D and calcium
Regarding vitamin D, significant inverse dose-dependent associations were observed
between colorectal cancer and dietary vitamin D in both models II (p=0.01) and III
(p=0.03) (Table 90). In marked contrast, dietary and total calcium intakes were not
associated with colorectal cancer risk in any of the adjusted models, whereas high
dietary calcium intake was associated with a significant increased colorectal cancer risk
(p=0.001) in model I (Table 90). Regarding the analysis of the main food sources of
vitamin D and calcium, there is some evidence in favour of a significant inverse
association between colorectal cancer and intakes of fried and smoked oily fish and a
positive association between colorectal cancer and intakes of full fat hard cheese (Table
92). None of the four examined SNPs was associated with colorectal cancer (data not
shown), but there was some evidence that rs10735810 interacts with vitamin D (p for
interaction 0.06) and calcium dietary intakes (p for interaction 0.13) (data not shown).

Chapter eight Results: Overall and stepwise regression analysis
293
8 RESULTS: Overall and stepwise regression
analysis
8.1 Introduction
This analysis describes the overall analysis as well as the application of forward and
backward stepwise regression. The study sample included in this analysis is the same
as the sample that was included in the unmatched analysis of the additional dietary
factors. Therefore, the presentation of the study sample will be omitted, since it has
been described in detail in the first part of Chapter 7 (on page 260).
The explanatory variables that were included in the overall and stepwise regression
models consist of demographic factors, lifestyle variables, foods and nutrients. In the
first part of the chapter, distributions and correlations of all the explanatory variables,
as well as univariable logistic regression of colorectal cancer on each explanatory
variable are presented (overall analysis). In the second part of the chapter, results of
the forward and backward stepwise regression applied in three different sets of
explanatory variables are presented for the whole sample and separately for males
and females.
8.2 Overall analysis
8.2.1 Distribution of explanatory variables by case control
status
Numbers and percentages of all categorical explanatory variables as well as mean
(with standard deviations) and median intakes (with interquartile ranges) of all
continuous explanatory variables are presented in Table 93 and Table 94. The tests
chi-square (categorical variables), t-test (continuous variables) and the Wilcoxon
rank-sum (continuous variables) were used to test for differences between cases and
controls.
Regarding the categorical explanatory variables, significant differences were
observed for family history of colorectal cancer (p<0.0005), physical activity
(p=0.04), NSAIDs intake (p<0.0005) and HRT intake (p<0.0005) (Table 93).
Regarding the continuous explanatory variables, cases when compared to controls

Chapter eight Results: Overall and stepwise regression analysis
294
reported higher mean intakes of dietary energy (p<5x10⁻⁵
), eggs (p<5x10⁻⁵
), sweets1
(p=0.0001), fruit/ vegetable juice (p<5x10⁻⁵), SFAs (p<5x10⁻⁵), MUFAs (p=0.04),
tFAs (p=0.002), tMUFAs (p=0.0004), cholesterol (p=0.0001), starch (p=0.04) and
vitamin A (p=0.0001) (Table 94). In addition cases reported higher median intakes of
dietary energy (p<5x10⁻⁵
), breads (p=0.05), eggs (p<5x10⁻⁵
), sweets (p<5x10⁻⁵
), fruit/
vegetable juice (p<5x10⁻⁵
), SFAs (p<5x10⁻⁵
), MUFAs (p=0.01), tFAs (p=0.0004),
tMUFAs (p<5x10⁻⁵), cholesterol (p<5x10⁻⁵), starch (p=0.05) and vitamin A
(p=0.0001) (Table 94).
On the other hand, cases when compared to controls reported lower mean intakes of
oily fish (p<5x10⁻⁵
), fruits (p=0.006), vegetables (p<5x10⁻⁵
), savoury foods2
(p=0.02), coffee (p=0.001), ω3PUFAs (p<5x10⁻⁵
), quercetin (p=0.0006), catechin
(p=0.03), protein (p=0.004), fibre (p<5x10⁻⁵
), calcium (p<5x10⁻⁵
), magnesium
(p<5x10⁻⁵), phosphorus (p=0.0002), iron (p=0.0004), copper (p<5x10⁻⁵), zinc
(0.003), manganese (p<5x10⁻⁵), selenium (p=0.0002), carotenes (p=0.0007), vitamin
D (p=0.007), vitamin B1 (p=0.03), potential niacin (p=0.004), niacin (p<5x10⁻⁵
),
vitamin B6 (p<5x10⁻⁵
), folate (0.0002), biotin (p<5x10⁻⁵
), vitamin C (p=0.001)
(Table 94).
In addition cases reported lower median intakes of oily fish (p=0.0003), fruits
(p=0.004), vegetables (p<5x10⁻⁵), savoury foods (p=0.01), coffee (p=0.001),
ω3PUFAs (p<5x10⁻⁵), quercetin (p=0.001), catechin (p=0.008), phytoestrogens
(p=0.04), protein (p=0.0004), fibre (p<5x10⁻⁵
), calcium (p<5x10⁻⁵
), magnesium
(p<5x10⁻⁵
), phosphorus (p=0.0001), iron (p<5x10⁻⁵
), copper (p<5x10⁻⁵
), zinc
(0.0001), manganese (p<5x10⁻⁵
), selenium (p=0.005), carotenes (p<5x10⁻⁵
), vitamin
D (p=0.001), vitamin B1 (p=0.01), potential niacin (p=0.0006), niacin (p<5x10⁻⁵
),
vitamin B6 (p<5x10⁻⁵), vitamin B12 (p=0.02), folate (0.0003), pantothenic acid
(p=0.006), biotin (p=0.0001), vitamin C (p=0.0001) (Table 94).
1 Sweets: Summary variable of puddings and deserts; chocolates, sweets, nuts and crisps; biscuits; and cakes
2 Savoury foods: Summary variable of savoury foods, soups and sauces

Chapter eight Results: Overall and stepwise regression analysis
295
Table 93 Descriptive report of all explanatory variables (categorical variables)
All subjects (n=4837) Cases (n=2061) Controls (n=2776) χ2-test
Demographic factors Number % Number % Number % p-value
Sex
Males 2762 57.1% 1180 57.2% 1582 57.0%
Females 2075 42.9% 881 42.8% 1194 43.0% 0.85
Family history*
Low 4305 92.2% 1610 82.9% 2695 98.9%
Medium/ high 363 7.8% 333 17.1% 30 1.1% <0.0005
Deprivation score
1 452 9.3% 194 9.4% 258 9.3%
2 1002 20.7% 434 21.1% 568 20.5%
3 1290 26.7% 532 25.8% 758 27.3%
4 1133 23.4% 488 23.7% 645 23.2%
5 511 10.6% 218 10.6% 293 10.6%
6 318 6.6% 140 6.8% 178 6.4%
7 130 2.7% 54 2.6% 76 2.7% 0.95
Lifestyle variables
Smoking
Never 2074 43.3% 874 42.9% 1200 43.5%
Former 1867 38.9% 818 40.2% 1049 38.0%
Current 852 17.8% 343 16.9% 509 18.5% 0.20
Alcohol (g/day)
0 718 14.8% 291 14.1% 427 15.4%
0-15 2598 53.7% 1125 54.6% 1473 53.1%
15-30 941 19.4% 393 19.1% 548 19.7%
30-45 341 7.1% 139 6.7% 202 7.3%
45-60 142 2.9% 61 3.0% 81 2.9%
>60 97 2.0% 52 2.5% 45 1.6% 0.20
Physical activity
(hours/week)
0 2595 53.6% 1139 55.3% 1456 52.4%
0-3.5 1189 24.6% 486 23.6% 703 25.3%
3.5-7 544 11.2% 205 9.9% 339 12.2%
>7 318 6.6% 133 6.5% 185 6.7% 0.04
NSAIDs
No 3206 66.3% 1449 70.3% 1757 63.3%
Yes 1605 33.2% 605 29.4% 1000 36.0% <0.0005
HRT†
No 1487 73.6% 666 77.8% 821 70.5%
Yes 533 26.4% 190 22.2% 343 29.5% <0.0005
* High/moderate vs. low family history risk
† HRT: Hormone Replacement Therapy; Intake of 6 months or more vs. no intake/ intake of less than 6 months

Chapter eight Results: Overall and stepwise regression analysis
296
Table 94 Descriptive report of all explanatory variables (continuous variables)
All subjects (n=4837) Cases (n=2061) Controls (n=2776) t test rank test
Demographic factors Mean (SD) Median (IQR) Mean (SD) Median (IQR) Mean (SD) Median (IQR) p-value p-value
Age 62.2 (10.6) 63.0 (55.0, 71.0) 62.0 (10.8) 63.0 (54.0, 71.0) 62.4 (10.5) 63.0 (55.0, 71.0) 0.14 0.25
Lifestyle variables
BMI 26.7 (4.5) 26.1 (23.7, 29.1) 26.6 (4.4) 26.1 (23.6, 29.0) 26.7 (4.6) 26.1 (23.7, 29.1) 0.41 0.68
Dietary energy (MJ/day) 10.9 (4.1) 10.2 (8.2, 12.7) 11.3 (4.4) 10.5 (8.4, 13.1) 10.7 (3.9) 9.9 (8.1, 12.5) <5x10⁻⁵
<5x10⁻⁵
Foods (m/day*)
Breads 2.8 (1.3) 2.7 (1.9, 3.6) 2.8 (1.2) 2.7 (1.9, 3.6) 2.7 (1.3) 2.6 (1.8, 3.6) 0.15 0.05
Cereals† 1.2 (0.9) 1.1 (0.4, 1.7) 1.2 (0.9) 1.0 (0.5, 1.6) 1.2 (1.0) 1.1 (0.4, 1.8) 0.21 0.78
Milk 2.0 (1.2) 1.9 (1.1, 2.4) 2.0 (1.3) 1.9 (1.1, 2.5) 1.9 (1.2) 1.8 (1.1, 2.4) 0.45 0.46
Cream† 0.5 (0.6) 0.3 (0.0, 0.8) 0.5 (0.6) 0.3 (0.0, 0.8) 0.5 (0.7) 0.3 (0.0, 0.8) 0.21 0.47
Cheese† 0.8 (0.8) 0.6 (0.3, 1.1) 0.8 (0.7) 0.6 (0.3, 1.1) 0.8 (0.8) 0.6 (0.3, 1.1) 0.59 0.16
Eggs† 0.5 (0.4) 0.4 (0.2, 0.7) 0.5 (0.4) 0.5 (0.2, 0.7) 0.5 (0.4) 0.4 (0.2, 0.6) <5x10⁻⁵
<5x10⁻⁵
Poultry† 0.4 (0.3) 0.3 (0.2, 0.6) 0.4 (0.3) 0.3 (0.2, 0.5) 0.4 (0.4) 0.3 (0.1, 0.6) 0.16 0.12
Red meat† 1.3 (0.8) 1.3 (0.8, 1.7) 1.4 (0.8) 1.3 (0.8, 1.7) 1.3 (0.8) 1.2 (0.8, 1.8) 0.14 0.20
Processed meat† 1.0 (0.8) 0.9 (0.5, 1.4) 1.0 (0.7) 0.9 (0.5, 1.4) 1.0 (0.8) 0.9 (0.5, 1.4) 0.63 0.72
White fish† 0.3 (0.3) 0.3 (0.2, 0.5) 0.4 (0.3) 0.3 (0.2, 0.5) 0.3 (0.3) 0.3 (0.1, 0.5) 0.25 0.09
Oily fish† 0.2 (0.3) 0.1 (0.0, 0.3) 0.2 (0.3) 0.1 (0.0, 0.3) 0.2 (0.3) 0.1 (0.0, 0.3) <5x10⁻⁵ 0.0003
Potatoes/
Pasta/ Rice
2.4 (1.0) 2.3 (1.7, 2.9) 2.4 (1.0) 2.3 (1.7, 2.9) 2.4 (1.0) 2.3 (1.7, 2.9) 0.96 0.77
Fruit† 2.9 (2.2) 2.5 (1.4, 3.8) 2.8 (2.1) 2.4 (1.4, 3.7) 3.0 (2.2) 2.5 (1.5, 4.0) 0.006 0.004
Vegetables† 5.6 (3.4) 4.9 (3.3, 7.0) 5.2 (3.1) 4.6 (3.1, 6.5) 5.9 (3.6) 5.1 (3.4, 7.4) <5x10⁻⁵
<5x10⁻⁵
Savoury†‡ 2.8 (1.4) 2.5 (1.8, 3.4) 2.7 (1.4) 2.5 (1.8, 3.3) 2.8 (1.5) 2.6 (1.8, 3.5) 0.02 0.01
Sweets§ 4.7 (2.5) 4.4 (3.0, 6.1) 4.9 (2.5) 4.3 (2.9, 6.0) 4.6 (2.5) 4.6 (3.1, 6.3) 0.0001 <5x10
-5

Chapter eight Results: Overall and stepwise regression analysis
297
Tea** 2.7 (1.8) 3.0 (1.0, 4.0) 2.6 (1.8) 3.0 (1.0, 4.0) 2.7 (1.8) 3.0 (1.0, 4.0) 0.70 0.55
Coffee** 1.6 (1.7) 1.0 (0.1, 3.0) 1.5 (1.7) 1.0 (0.0, 2.4) 1.7 (1.7) 1.0 (0.1, 3.0) 0.001 0.001
fruit/ vegetable juice † 1.0 (1.1) 0.8 (0.1, 1.4) 1.1 (1.2) 0.9 (0.2, 1.6) 1.0 (1.1) 0.8 (0.1, 1.4) <5x10⁻⁵
<5x10⁻⁵
Fizzy drinks† 0.4 (0.8) 0.0 (0.0, 0.4) 0.4 (0.8) 0.0 (0.0, 0.4) 0.3 (0.8) 0.0 (0.0, 0.4) 0.11 0.13
Fatty acids (g/day)
SFAs 37.4 (9.1) 37.0 (31.5, 43.3) 38.1 (8.7) 37.7 (32.3, 43.9) 36.9 (9.3) 36.6 (30.9, 42.7) <5x10⁻⁵
<5x10⁻⁵
MUFAs 32.3 (6.1) 32.6 (28.6, 36.2) 32.5 (5.7) 32.8 (29.0, 36.3) 32.1 (6.4) 32.4 (28.2, 36.1) 0.04 0.01
ω6PUFAs 11.3 (3.5) 10.7 (8.9, 13.2) 11.4 (3.6) 10.7 (8.9, 13.2) 11.3 (3.5) 10.7 (8.9, 13.1) 0.58 0.81
ω3PUFAs 2.4 (0.9) 2.2 (1.8, 2.7) 2.3 (0.8) 2.2 (1.8, 2.7) 2.4 (0.9) 2.3 (1.8, 2.8) <5x10⁻⁵
<5x10⁻⁵
tFAs 3.6 (1.1) 3.5 (2.9, 4.2) 3.7 (1.1) 3.6 (3.0, 4.3) 3.6 (1.2) 3.5 (2.8, 4.2) 0.002 0.0004
tMUFAs 2.7 (0.8) 2.7 (2.2, 3.2) 2.8 (0.8) 2.7 (2.2, 3.2) 2.7 (0.8) 2.6 (2.1, 3.2) 0.0004 <5x10⁻⁵
Flavonoids (mg/day)
Quercetin 17.2 (7.7) 17.4 (11.2, 22.6) 16.8 (7.5) 16.9 (10.9, 22.1) 17.5 (7.8) 17.6 (11.4, 22.1) 0.0006 0.001
Catechin† 7.4 (3.8) 7.2 (4.8, 9.4) 7.3 (3.8) 7.0 (4.6, 9.1) 7.5 (3.8) 7.4 (4.9, 9.5) 0.03 0.008
Epicatechin 22.9 (11.9) 23.3 (12.7, 32.3) 22.6 (11.6) 23.0 (12.6, 31.8) 23.1 (12.0) 23.6 (12.8, 32.8) 0.12 0.13
Flavones 1.3 (1.2) 1.0 (0.5, 1.8) 1.3 (1.2) 1.0 (0.5, 1.8) 1.3 (1.1) 1.0 (0.5, 1.8) n/a 0.55
Procyanidins 30.8 (17.3) 31.7 (16.0, 44.7) 30.3 (17.0) 31.3 (15.8, 43.6) 31.1 (17.5) 32.0 (16.1, 45.5) 0.09 0.09
Flavanones† 29.1 (31.1) 20.6 (7.4, 40.6) 28.3 (29.8) 20.2 (8.5, 39.1) 29.7 (32.0) 20.9 (6.7, 41.2) 0.55 0.82
Phytoestrogens††
(µg/day)
1058.1
(3644.0)
575.3
(400.0, 846.2)
917.6
(2311.9)
561.5
(397.8, 821.6)
1162.4
(4375.9)
585.5
(401.7, 869.8)
0.15 0.04
Macronutrients (g/day)
Protein 101.3 (17.5) 101.3 (90.6, 112.3) 100.5 (17.1) 100.3 (89.9, 111.0) 101.9 (17.7) 102.1 (91.3, 113.1) 0.004 0.0004
Cholesterol 369.2 (111.8) 362.0 (296.2, 430.1) 376.5 (107.3) 367.2 (306.7, 438.3) 363.7 (114.8) 358.3 (290.2, 424.6) 0.0001 <5x10⁻⁵
Sugars†† 137.5 (46.1) 132.7 (109.4, 158.5) 136.8 (41.8) 132.2 (109.9, 157.8) 138.0 (43.9) 132.9 (109.2, 159.6) 0.56 0.63
Starch 163.3 (33.2) 164.6 (143.3, 184.5) 164.4 (31.0) 165.6 (145.5, 184.1) 162.5 (34.8) 163.7 (141.7, 184.9) 0.04 0.05
Fibre 21.4 (6.0) 21.0 (17.3, 24.9) 20.9 (5.7) 20.5 (17.1, 24.4) 21.7 (6.2) 21.3 (17.6, 25.4) <5x10⁻⁵
<5x10⁻⁵

Chapter eight Results: Overall and stepwise regression analysis
298
Minerals (mg/day)
Sodium 3462.8
(638.9)
3450.9
(3065.8, 3849.0)
3466.7
(618.5)
3470.4
(3086.1, 3843.3)
3459.9
(653.8)
3436.5
(3048.3, 3853.6)
0.72 0.50
Potassium 4284.2
(793.4)
4274.8
(3789.2, 4760.3)
4208.5
(751.3)
4185.4
(3747.7, 4668.4)
4340.3
(818.8)
4331.9
(3827.6, 4830.8)
<5x10⁻⁵
<5x10⁻⁵
Calcium 1108.2
(270.6)
1091.1
(924.4, 1269.7)
1105.3
(260.9)
1091.5
(926.6, 1268.3)
1110.3
(277.6)
1091.0
(923.3, 1270.9)
0.53 0.80
Magnesium 384.6 (67.7) 383.3 (340.3, 428.4) 376.8 (64.4) 375.6 (335.4, 418.3) 390.4 (69.6) 390.2 (344.6, 334.3) <5x10⁻⁵
<5x10⁻⁵
Phosphorus 1748.1
(280.8)
1750.5
(1573.9, 1931.4)
1730.9
(270.1)
1728.0
(1561.4, 1906.7)
1760.9
(287.9)
1763.3
(1579.2, 1947.8)
0.0002 0.0001
Iron 15.4 (2.9) 15.3 (13.6, 17.1) 15.2 (2.8) 15.1 (13.3, 16.9) 15.5 (2.9) 15.4 (13.7, 17.3) 0.0004 <5x10⁻⁵
Copper 1.6 (0.4) 1.5 (1.4, 1.8) 1.6 (0.3) 1.5 (1.3, 1.7) 1.6 (0.4) 1.6 (1.4, 1.8) <5x10⁻⁵
<5x10⁻⁵
Zinc 12.0 (2.4) 11.3 (10.5, 13.4) 11.9 (2.3) 11.7 (10.4, 13.2) 12.1 (2.4) 12.1 (10.6, 13.5) 0.003 0.0001
Chloride 5290.6
(957.7)
5285.5
(4705.0, 5872.5)
5288.5
(930.1)
5297.4
(4726.2, 5858.0)
5292.2
(977.9)
5276.0
(4691.3, 5883.6)
0.90 0.90
Manganese 3.9 (1.2) 3.8 (3.0, 4.7) 3.8 (1.2) 3.7 (3.0, 4.5) 4.0 (1.2) 3.9 (3.1, 4.7) <5x10⁻⁵
<5x10⁻⁵
Selenium (µg/day) 83.1 (32.4) 79.0 (63.2, 96.4) 81.1 (29.4) 78.0 (61.8, 95.0) 84.6 (34.4) 79.9 (63.9, 97.5) 0.0002 0.005
Iodine†† (µg/day) 202.9 (77.8) 190.2 (149.8, 240.7) 200.3 (73.7) 188.6 (149.8, 237.7) 204.7 (80.6) 191.4 (149.8, 243.5) 0.19 0.19
Vitamins (mg/day)
Vitamin A†† (Retinol)
(µg/day)
642.3
(530.2)
496.5
(348.1, 752.6)
654.6
(482.9)
518.1
(363.4, 758.0)
633.2
(562.6)
480.4
(336.1, 749.3)
0.0001 0.0001
Carotenes†† (µg/day) 3973.6
(2399.3)
3519.5
(2405.8, 4953.3)
3800.7
(2237.6)
3352.8
(2330.1, 4712.9)
4102.1
(2505.4)
3628.4
(2464.1, 127.5)
0.0007 <5x10⁻⁵
Vitamin D†† (µg/day) 4.5 (2.7) 3.9 (2.7, 5.5) 4.3 (5.5) 3.8 (2.7, 5.4) 4.6 (2.8) 3.9 (2.8, 5.6) 0.007 0.001
Vitamin E†† 9.1 (3.5) 8.3 (6.8, 10.4) 9.1 (3.5) 8.2 (6.8, 10.4) 9.1 (3.4) 8.3 (6.8, 10.5) 0.87 0.54
Vitamin B1††
(Thiamine) 2.1 (0.8) 2.0 (1.8, 2.3) 2.1 (0.6) 2.0 (1.8, 2.3) 2.1 (0.8) 2.0 (1.8, 2.3) 0.03 0.01

Chapter eight Results: Overall and stepwise regression analysis
299
Vitamin B2 2.1 (0.5) 2.1 (1.8, 2.4) 2.1 (0.5) 2.1 (1.8, 2.4) 2.1 (0.5) 2.1 (1.8, 2.4) 0.09 0.13
Potential niacin 21.1 (3.6) 21.1 (18.8, 23.4) 20.9 (3.5) 20.9 (18.7, 23.1) 21.2 (3.7) 21.3 (19.9, 23.5) 0.004 0.0006
Niacin 24.2 (5.3) 24.0 (20.6, 27.5) 23.8 (5.3) 23.5 (20.3, 26.9) 24.5 (5.4) 24.3 (20.8, 27.9) <5x10⁻⁵
<5x10⁻⁵
Vitamin B6 2.8 (0.6) 2.8 (2.5, 3.2) 2.8 (0.5) 2.8 (2.4, 3.1) 2.9 (0.6) 2.9 (2.5, 3.2) <5x10⁻⁵
<5x10⁻⁵
Vitamin B12†† (µg/day) 7.7 (3.6) 7.0 (5.3, 9.2) 7.5 (3.4) 6.9 (5.2, 9.0) 7.8 (3.7) 7.0 (5.3, 9.4) 0.06 0.02
Folic acid (µg/day) 329.4 (71.5) 325.9 (282.6, 370.8) 324.9 (68.2) 321.3 (280.5, 365.7) 332.7 (73.6) 328.9 (283.8, 374.7) 0.0002 0.0003
Pantothenic acid 7.8 (5.3) 6.6 (5.9, 7.6) 7.8 (5.5) 6.6 (5.8, 7.5) 7.8 (5.2) 6.7 (5.9, 7.6) 0.26 0.006
Biotin (µg/day) 49.6 (10.0) 49.3 (43.4, 55.7) 48.9 (9.7) 48.9 (42.9, 55.0) 50.2 (10.3) 49.8 (43.6, 56.1) <5x10⁻⁵
0.0001
Vitamin C 125.3 (63.1) 114.2 (81.2, 156.1) 120.5 (58.5) 111.2 (78.8, 147.8) 128.9 (66.2) 117.6 (83.0, 161.4) 0.001 0.0001
* m/d: measures per day
† Square root transformed values were used for calculating the t-test due to skewed distribution
‡ Savoury foods: Summary variable of savoury foods, soups and sauces
§Sweets: Summary variable of pudding and deserts; chocolates, sweets, nuts and crisps; biscuits; and cakes
** Not energy adjusted
†† Logarithmic transformed values were used for calculating the t-test due to skewed distribution

Chapter eight Results: Overall and stepwise regression analysis
300
8.2.2 Correlation matrix for the explanatory variables
Correlation coefficients that were ≥0.70 are highlighted in Table 95 (divided in three
categories: 0.70-0.80, 0.80-0.90, ≥0.90) The variables that were highly correlated were:
1) oily fish consumption with ω3PUFAs and vitamin D intakes; ω3PUFAs with vitamin
D intakes; and vitamin D with vitamin B12 intakes; 2) tea consumption with quercetin,
epicatechin and procyanidin intakes; quercetin with epicatechin and procyanidin
intakes; catechin with epicatechin and procyanidin intakes; and epicatechin with
procyanidin intakes 3) vegetable consumption with carotene intakes; 4) fruit
consumption with vitamin C intakes; and vitamin C with flavanone intakes; 5) SFA
with tFA intakes, and tFA with tMUFA intakes; 6) protein with phosphorus, zinc,
potential niacin and niacin intakes; magnesium with phosphorus and iron intakes;
phosphorus with zinc, vitamin B2 and potential niacin intakes; and zinc with potential
niacin intakes 7) fibre with potassium and magnesium intakes; potassium with
magnesium, vitamin B6 and folic acid intakes; vitamin B6 with folic acid intakes; and
vitamin B6 with thiamine intakes; 8) sodium with chloride intakes; 9) calcium with
phosphorus and vitamin B2 intakes (Table 95).

Chapter eight Results: Overall and stepwise regression analysis
301
Table 95 Correlation matrix of the explanatory variables (demographic factors, lifestyle factors, foods and nutrients)
Variables age deprivat. alcohol BMI energy breads cereals milk cream cheese eggs
age 1.00
deprivation -0.06 1.00
alcohol -0.14 -0.08 1.00
BMI -0.04 0.10 0.01 1.00
energy -0.11 0.02 0.21 0.08 1.00
breads 0.10 0.04 -0.07 0.03 0.07 1.00
cereals 0.18 -0.03 -0.13 -0.02 0.03 -0.03 1.00
milk 0.03 0.00 -0.13 -0.01 0.02 0.02 0.24 1.00
cream -0.03 -0.12 -0.07 0.00 0.04 -0.12 0.13 0.07 1.00
cheese 0.00 -0.10 0.05 -0.03 0.04 -0.04 -0.03 0.01 0.12 1.00
eggs 0.11 0.09 0.04 0.06 0.00 0.04 -0.06 0.01 -0.07 0.06 1.00
poultry -0.20 -0.06 0.06 0.05 0.02 -0.10 -0.02 -0.03 0.09 -0.02 -0.08
processed meat -0.18 0.10 0.07 0.13 0.04 0.09 -0.14 -0.07 -0.11 -0.04 0.11
red meat 0.00 0.08 0.09 0.11 0.04 0.00 -0.17 -0.09 -0.18 -0.04 0.24
white fish 0.19 -0.01 -0.02 0.01 0.02 -0.05 0.08 -0.01 0.05 0.02 0.11
oily fish 0.16 -0.11 0.08 -0.05 0.05 -0.10 0.09 -0.04 0.16 0.08 0.02
potatoes/pasta/rice -0.12 0.02 0.05 0.02 0.07 -0.02 -0.07 -0.08 -0.11 -0.07 -0.05
savoury -0.10 -0.04 0.07 0.00 0.05 -0.10 -0.05 -0.07 0.03 0.04 -0.05
sweets 0.10 0.00 -0.21 0.02 0.08 -0.12 -0.05 -0.06 -0.02 -0.02 -0.08
tea 0.10 0.02 -0.10 -0.07 0.10 0.11 0.08 0.10 -0.03 -0.05 0.02
coffee -0.06 -0.11 0.12 0.02 0.08 -0.07 -0.04 0.03 0.09 0.13 -0.04
fruit/ vegetable juice -0.07 -0.09 -0.01 0.02 0.04 -0.06 0.06 0.03 0.15 0.05 -0.08
fizzy drinks -0.24 0.09 0.03 0.18 0.05 -0.07 -0.11 -0.10 0.01 -0.06 0.00
vegetables -0.10 -0.08 0.01 0.00 0.04 -0.14 -0.01 -0.08 0.14 0.05 -0.11
fruit 0.10 -0.10 -0.17 -0.02 0.01 -0.12 0.17 0.02 0.23 0.01 -0.16
SFAs 0.05 0.01 -0.10 -0.04 0.17 0.04 -0.13 0.11 -0.01 0.27 0.18

Chapter eight Results: Overall and stepwise regression analysis
302
Variables age deprivat. alcohol BMI energy breads cereals milk cream cheese eggs
MUFAs -0.01 0.01 -0.05 -0.01 0.23 0.06 -0.18 -0.04 -0.05 0.17 0.22
ω6PUFAs -0.12 -0.01 -0.04 0.00 0.15 0.11 -0.06 -0.13 -0.01 0.00 0.01
ω3PUFAs 0.00 -0.10 0.04 -0.01 0.13 -0.07 0.00 -0.11 0.14 0.08 0.01
tFAs 0.00 -0.01 -0.09 -0.07 0.13 0.15 -0.11 0.09 -0.01 0.22 0.11
tMUFAs 0.11 -0.02 -0.07 -0.07 0.13 0.26 -0.06 0.14 0.01 0.30 0.17
Quercetin 0.13 -0.03 -0.10 -0.06 0.03 0.03 0.08 0.05 -0.01 -0.04 -0.05
Catechin 0.00 -0.13 0.21 -0.10 0.04 -0.08 0.04 0.00 0.06 0.01 -0.10
Epicatechin 0.09 -0.03 -0.09 -0.08 0.02 0.06 0.09 0.08 -0.03 -0.06 -0.05
Flavones 0.10 -0.03 0.03 0.01 0.36 -0.05 0.05 -0.06 0.10 0.06 -0.03
Procyanidins 0.10 -0.04 0.01 -0.07 0.03 0.07 0.08 0.07 -0.03 -0.03 -0.02
Flavanones 0.01 -0.09 -0.04 0.00 0.02 -0.06 0.09 0.00 0.14 0.05 -0.09
Phytoestrogens 0.09 -0.04 -0.09 -0.01 0.01 0.59 0.03 -0.01 0.03 0.01 -0.05
Protein 0.10 0.02 -0.10 -0.07 0.10 0.11 0.08 0.10 -0.03 -0.05 0.02
Cholesterol 0.14 0.06 0.01 0.04 0.11 -0.02 -0.12 0.04 -0.05 0.13 0.73*
Sugars -0.03 -0.05 -0.17 0.03 0.12 -0.18 0.12 0.13 0.23 -0.10 -0.20
Starch 0.04 0.04 -0.16 0.03 0.17 0.47 0.20 -0.05 -0.18 -0.13 -0.08
Fibre 0.01 -0.11 -0.14 -0.02 0.11 0.04 0.24 -0.04 0.13 -0.02 -0.22
Na -0.02 0.05 -0.02 0.09 0.21 0.32 0.11 0.03 -0.05 0.10 0.16
K -0.03 -0.11 -0.02 0.00 0.17 -0.16 0.14 0.18 0.19 -0.02 -0.15
Ca 0.03 -0.08 -0.15 -0.03 0.13 0.00 0.22 0.67 0.33 0.36 0.00
Mg -0.08 -0.13 0.06 -0.02 0.18 -0.01 0.27 0.18 0.19 0.04 -0.18
P 0.00 -0.09 -0.07 0.02 0.21 -0.05 0.26 0.44 0.30 0.24 0.03
Fe 0.05 -0.11 0.05 -0.02 0.18 0.05 0.44 -0.03 0.10 -0.01 -0.06
Cu -0.13 -0.08 0.11 0.04 0.18 -0.02 0.01 -0.14 0.04 0.00 -0.09
Zn 0.01 -0.05 -0.01 0.05 0.18 -0.01 0.13 0.17 0.10 0.12 0.07
Cl -0.03 0.04 -0.01 0.08 0.21 0.35 0.13 0.06 -0.03 0.11 0.14
Mn 0.12 -0.11 -0.12 -0.06 0.08 0.25 0.22 0.02 0.09 0.00 -0.18

Chapter eight Results: Overall and stepwise regression analysis
303
Variables age deprivat. alcohol BMI energy breads cereals milk cream cheese eggs
Se 0.00 -0.01 -0.02 0.04 0.09 0.27 -0.04 -0.03 0.05 0.06 0.08
I 0.11 -0.08 -0.06 -0.01 0.08 -0.11 0.14 0.31 0.39 0.14 0.15
Retinol 0.12 -0.03 -0.02 -0.02 0.08 0.01 -0.06 0.12 0.06 0.21 0.28
Carotenes -0.06 -0.10 -0.01 -0.01 0.07 -0.12 0.00 -0.06 0.12 0.04 -0.11
Vitamin D 0.12 -0.06 0.02 -0.02 0.07 -0.08 0.11 -0.02 0.09 0.06 0.19
Vitamin E -0.07 -0.04 -0.11 -0.02 0.12 -0.03 0.06 -0.06 0.07 0.02 -0.07
Thiamine 0.10 -0.04 -0.13 0.04 0.17 0.13 0.36 0.11 0.03 -0.08 -0.05
Vitamin B2 0.03 -0.06 -0.10 -0.01 0.12 -0.09 0.45 0.62 0.33 0.12 0.06
Pot Niacin -0.04 -0.03 0.01 0.08 0.21 0.00 0.05 0.22 0.13 0.21 0.18
Niacin -0.13 -0.04 0.09 0.08 0.15 0.05 0.22 -0.03 0.04 -0.03 -0.08
Vitamin B6 -0.01 -0.05 0.00 0.04 0.18 -0.10 0.31 0.09 0.06 -0.05 -0.09
Vitamin B12 0.13 -0.06 0.03 0.01 0.08 -0.12 0.10 0.17 0.14 0.12 0.18
Folic acid 0.03 -0.09 -0.03 -0.01 0.15 0.05 0.36 0.13 0.14 0.06 -0.03
Pantoth. acid 0.06 -0.05 0.15 0.02 0.15 -0.03 0.14 0.27 0.04 0.01 0.15
Biotin 0.10 -0.12 0.08 -0.05 0.13 -0.08 0.25 0.29 0.17 0.09 0.20
Vitamin C -0.02 -0.14 -0.08 -0.02 0.04 -0.15 0.10 -0.02 0.22 0.05 -0.17

Chapter eight Results: Overall and stepwise regression analysis
304
Variables poultry process.
meat
red
meat
white
fish
oily
fish
potatoes
pasta
rice
savoury sweets tea coffee fruit/
vegetable
juice
fizzy Vegs fruit
poultry 1.00
processed meat 0.03 1.00
red meat -0.02 0.41 1.00
white fish 0.04 -0.02 0.04 1.00
oily fish 0.06 -0.13 -0.09 0.27 1.00
potatoes/pasta/rice 0.09 0.09 0.13 -0.01 -0.11 1.00
savoury 0.06 0.01 -0.01 0.00 0.01 0.15 1.00
sweets -0.12 -0.06 -0.13 -0.09 -0.14 -0.18 -0.13 1.00
tea -0.05 -0.03 0.00 0.05 0.02 0.00 -0.01 0.05 1.00
coffee 0.06 -0.04 -0.04 -0.02 0.07 -0.03 0.04 0.00 -0.43 1.00
fruit/ vegetable juice 0.04 -0.07 -0.10 0.01 0.08 -0.04 0.05 -0.01 -0.09 0.06 1.00
fizzy drinks 0.06 0.14 0.04 -0.08 -0.12 0.01 0.00 0.02 -0.13 0.01 -0.02 1.00
vegetables 0.18 -0.11 -0.15 0.04 0.16 0.12 0.35 -0.19 0.00 0.08 0.11 -0.05 1.00
fruit 0.09 -0.23 -0.28 0.08 0.20 -0.13 0.03 -0.01 0.03 0.03 0.20 -0.09 0.35 1.00
SFAs -0.18 0.11 0.24 -0.05 -0.12 -0.12 -0.12 0.27 0.03 0.02 -0.09 -0.08 -0.29 -0.26
MUFAs -0.07 0.20 0.30 0.06 0.08 -0.08 -0.03 0.19 0.03 0.03 -0.10 -0.09 -0.18 -0.26
ω6PUFAs 0.08 0.12 0.02 -0.01 -0.03 0.01 0.14 0.10 0.00 0.04 0.00 -0.03 0.10 -0.06
ω3PUFAs 0.21 -0.01 0.00 0.29 0.70* 0.00 0.21 -0.16 0.02 0.07 0.05 -0.12 0.38 0.17
tFAs -0.17 0.11 0.18 -0.10 -0.17 -0.08 -0.08 0.14 0.00 0.03 -0.07 -0.05 -0.27 -0.26
tMUFAs -0.19 0.09 0.20 -0.05 -0.12 -0.06 -0.05 0.01 0.06 0.02 -0.06 -0.13 -0.23 -0.24
Quercetin 0.01 -0.10 -0.05 0.06 0.08 0.02 0.15 -0.06 0.80** -0.32 -0.03 -0.15 0.29 0.25
Catechin 0.06 -0.14 -0.13 0.03 0.13 -0.06 0.02 -0.05 0.58 -0.18 0.06 -0.13 0.17 0.32
Epicatechin -0.03 -0.08 -0.07 0.03 0.03 -0.04 -0.03 0.06 0.87** -0.37 -0.02 -0.13 0.04 0.20
Flavones 0.04 -0.08 -0.04 0.10 0.13 0.01 0.35 -0.08 0.06 0.05 0.06 -0.04 0.29 0.16
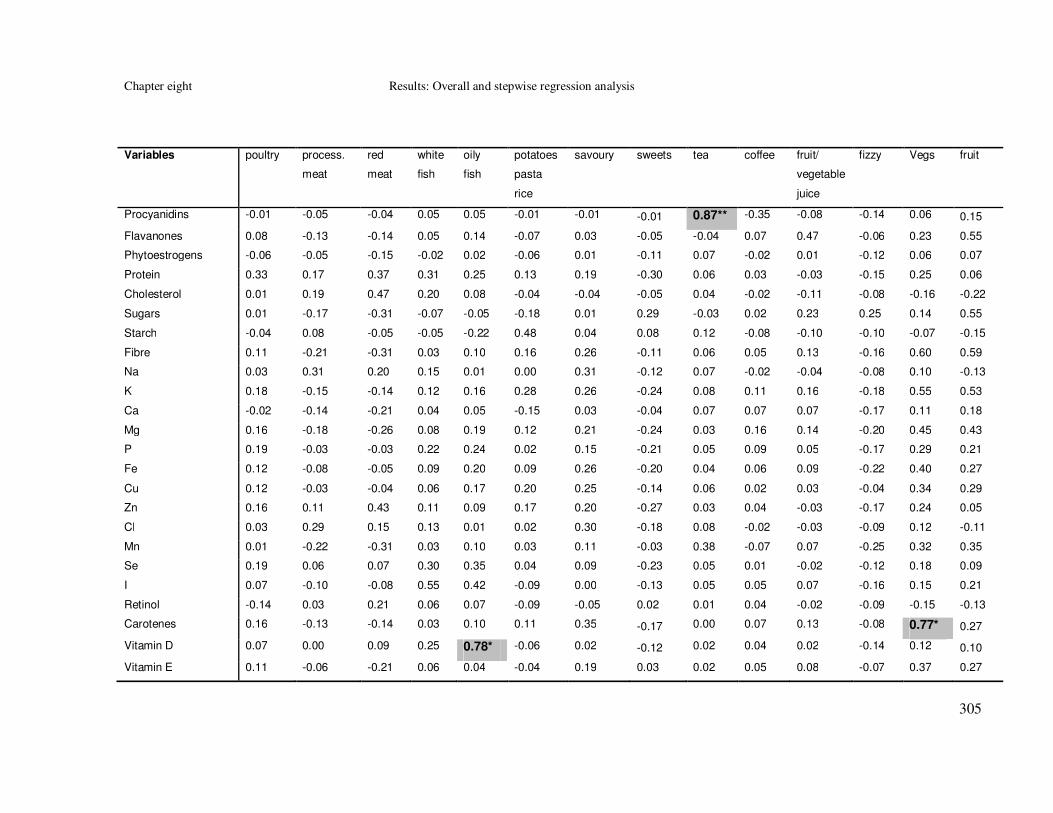
Chapter eight Results: Overall and stepwise regression analysis
305
Variables poultry process.
meat
red
meat
white
fish
oily
fish
potatoes
pasta
rice
savoury sweets tea coffee fruit/
vegetable
juice
fizzy Vegs fruit
Procyanidins -0.01 -0.05 -0.04 0.05 0.05 -0.01 -0.01 -0.01 0.87** -0.35 -0.08 -0.14 0.06 0.15
Flavanones 0.08 -0.13 -0.14 0.05 0.14 -0.07 0.03 -0.05 -0.04 0.07 0.47 -0.06 0.23 0.55
Phytoestrogens -0.06 -0.05 -0.15 -0.02 0.02 -0.06 0.01 -0.11 0.07 -0.02 0.01 -0.12 0.06 0.07
Protein 0.33 0.17 0.37 0.31 0.25 0.13 0.19 -0.30 0.06 0.03 -0.03 -0.15 0.25 0.06
Cholesterol 0.01 0.19 0.47 0.20 0.08 -0.04 -0.04 -0.05 0.04 -0.02 -0.11 -0.08 -0.16 -0.22
Sugars 0.01 -0.17 -0.31 -0.07 -0.05 -0.18 0.01 0.29 -0.03 0.02 0.23 0.25 0.14 0.55
Starch -0.04 0.08 -0.05 -0.05 -0.22 0.48 0.04 0.08 0.12 -0.08 -0.10 -0.10 -0.07 -0.15
Fibre 0.11 -0.21 -0.31 0.03 0.10 0.16 0.26 -0.11 0.06 0.05 0.13 -0.16 0.60 0.59
Na 0.03 0.31 0.20 0.15 0.01 0.00 0.31 -0.12 0.07 -0.02 -0.04 -0.08 0.10 -0.13
K 0.18 -0.15 -0.14 0.12 0.16 0.28 0.26 -0.24 0.08 0.11 0.16 -0.18 0.55 0.53
Ca -0.02 -0.14 -0.21 0.04 0.05 -0.15 0.03 -0.04 0.07 0.07 0.07 -0.17 0.11 0.18
Mg 0.16 -0.18 -0.26 0.08 0.19 0.12 0.21 -0.24 0.03 0.16 0.14 -0.20 0.45 0.43
P 0.19 -0.03 -0.03 0.22 0.24 0.02 0.15 -0.21 0.05 0.09 0.05 -0.17 0.29 0.21
Fe 0.12 -0.08 -0.05 0.09 0.20 0.09 0.26 -0.20 0.04 0.06 0.09 -0.22 0.40 0.27
Cu 0.12 -0.03 -0.04 0.06 0.17 0.20 0.25 -0.14 0.06 0.02 0.03 -0.04 0.34 0.29
Zn 0.16 0.11 0.43 0.11 0.09 0.17 0.20 -0.27 0.03 0.04 -0.03 -0.17 0.24 0.05
Cl 0.03 0.29 0.15 0.13 0.01 0.02 0.30 -0.18 0.08 -0.02 -0.03 -0.09 0.12 -0.11
Mn 0.01 -0.22 -0.31 0.03 0.10 0.03 0.11 -0.03 0.38 -0.07 0.07 -0.25 0.32 0.35
Se 0.19 0.06 0.07 0.30 0.35 0.04 0.09 -0.23 0.05 0.01 -0.02 -0.12 0.18 0.09
I 0.07 -0.10 -0.08 0.55 0.42 -0.09 0.00 -0.13 0.05 0.05 0.07 -0.16 0.15 0.21
Retinol -0.14 0.03 0.21 0.06 0.07 -0.09 -0.05 0.02 0.01 0.04 -0.02 -0.09 -0.15 -0.13
Carotenes 0.16 -0.13 -0.14 0.03 0.10 0.11 0.35 -0.17 0.00 0.07 0.13 -0.08 0.77* 0.27
Vitamin D 0.07 0.00 0.09 0.25 0.78* -0.06 0.02 -0.12 0.02 0.04 0.02 -0.14 0.12 0.10
Vitamin E 0.11 -0.06 -0.21 0.06 0.04 -0.04 0.19 0.03 0.02 0.05 0.08 -0.07 0.37 0.27

Chapter eight Results: Overall and stepwise regression analysis
306
Variables poultry process.
meat
red
meat
white
fish
oily
fish
potatoes
pasta
rice
savoury sweets tea coffee fruit/
vegetable
juice
fizzy Vegs fruit
Thiamine 0.09 -0.02 0.07 0.09 0.04 0.35 0.23 -0.20 0.12 -0.05 0.05 -0.17 0.31 0.20
Vitamin B2 0.07 -0.09 -0.06 0.12 0.15 -0.10 0.07 -0.15 0.18 -0.01 0.06 -0.19 0.15 0.23
Pot Niacin 0.31 0.19 0.36 0.27 0.20 0.13 0.15 -0.29 0.01 0.09 -0.05 -0.15 0.21 0.00
Niacin 0.44 0.18 0.21 0.17 0.25 0.17 0.19 -0.33 -0.05 0.13 0.06 -0.09 0.33 0.15
Vitamin B6 0.22 0.00 0.04 0.15 0.13 0.40 0.17 -0.29 0.05 -0.01 0.08 -0.14 0.41 0.31
Vitamin B12 0.08 0.01 0.23 0.36 0.67 -0.07 0.05 -0.20 0.02 0.04 0.01 -0.15 0.11 0.10
Folic acid 0.09 -0.13 -0.15 0.09 0.11 0.24 0.18 -0.25 0.17 -0.03 0.15 -0.19 0.52 0.38
Pantoth. acid 0.15 0.06 0.16 0.14 0.16 0.11 0.07 -0.26 0.12 0.01 0.01 -0.21 0.22 0.13
Biotin 0.04 -0.14 -0.07 0.28 0.28 -0.13 0.02 -0.15 0.18 0.21 0.06 -0.27 0.17 0.22
Vitamin C 0.16 -0.20 -0.24 0.05 0.19 0.06 0.17 -0.13 -0.01 0.08 0.44 -0.10 0.62 0.73*

Chapter eight Results: Overall and stepwise regression analysis
307
Variables SFAs MUFAs ω6PUFAs ω3PUFAs tFAs tMUFAs Quercetin Catechin Epicatechin Flavones Procyanid. Flavan. Phytoestr.
SFAs 1.00
MUFAs 0.67 1.00
ω6PUFAs -0.01 0.42 1.00
ω3PUFAs -0.08 0.34 0.30 1.00
tFAs 0.74* 0.59 0.10 -0.07 1.00
tMUFAs 0.68 0.59 0.10 -0.01 0.83** 1.00
Quercetin -0.12 -0.10 -0.01 0.12 -0.11 -0.03 1.00
Catechin -0.09 -0.12 -0.06 0.10 -0.06 -0.11 0.65 1.00
Epicatechin -0.01 -0.05 -0.03 0.01 0.02 -0.02 0.87** 0.77* 1.00
Flavones -0.07 -0.04 0.03 0.21 0.00 0.07 0.26 0.04 0.02 1.00
Procyanidins -0.04 -0.05 -0.02 0.04 -0.05 0.00 0.87** 0.79* 0.96*** 0.03 1.00
Flavanones -0.17 -0.16 -0.03 0.13 -0.15 -0.13 0.12 0.19 0.09 0.12 0.05 1.00
Phytoestrogens -0.07 0.00 0.16 0.07 0.02 0.11 0.06 0.03 0.05 0.01 0.06 0.06 1.00
Protein 0.05 0.23 0.12 0.50 0.01 0.10 0.15 0.01 0.02 0.23 0.06 0.06 0.04
Cholesterol 0.51 0.51 0.02 0.16 0.33 0.40 -0.04 -0.12 -0.05 0.05 -0.02 -0.13 -0.13
Sugars -0.09 -0.20 -0.04 -0.05 -0.09 -0.22 0.07 0.14 0.12 0.04 0.02 0.28 -0.05
Starch -0.04 0.05 0.22 -0.06 0.03 0.11 0.06 -0.12 0.05 0.03 0.06 -0.12 0.32
Fibre -0.36 -0.25 0.13 0.28 -0.27 -0.23 0.31 0.23 0.16 0.29 0.15 0.37 0.35
Na 0.11 0.30 0.29 0.30 0.12 0.23 0.06 -0.10 -0.02 0.08 0.02 -0.07 0.25
K -0.31 -0.21 0.02 0.34 -0.27 -0.22 0.32 0.28 0.16 0.29 0.17 0.33 0.03
Ca 0.18 0.05 -0.05 0.08 0.15 0.22 0.08 0.05 0.07 0.05 0.06 0.11 0.05
Mg -0.30 -0.16 0.12 0.34 -0.23 -0.19 0.22 0.26 0.11 0.21 0.12 0.29 0.32
P 0.00 0.10 0.09 0.41 -0.02 0.07 0.15 0.07 0.05 0.21 0.07 0.14 0.13
Fe -0.23 -0.06 0.16 0.39 -0.17 -0.09 0.19 0.23 0.06 0.32 0.10 0.20 0.31
Cu -0.19 0.03 0.20 0.38 -0.12 -0.14 0.20 0.24 0.11 0.26 0.11 0.16 0.17

Chapter eight Results: Overall and stepwise regression analysis
308
Variables SFAs MUFAs ω6PUFAs ω3PUFAs tFAs tMUFAs Quercetin Catechin Epicatechin Flavones Procyanid. Flavan. Phytoestr.
Zn 0.05 0.16 0.10 0.32 0.06 0.14 0.15 0.02 0.01 0.26 0.04 0.04 0.10
Cl 0.09 0.26 0.28 0.29 0.12 0.23 0.06 -0.08 -0.01 0.07 0.03 -0.05 0.29
Mn -0.22 -0.13 0.17 0.20 -0.15 -0.07 0.49 0.41 0.43 0.17 0.44 0.20 0.56
Se -0.06 0.20 0.22 0.48 -0.06 0.01 0.10 0.04 0.03 0.09 0.06 0.08 0.28
I 0.03 0.11 -0.03 0.46 -0.05 0.02 0.09 0.08 0.05 0.10 0.06 0.13 -0.05
Retinol 0.53 0.36 -0.05 0.05 0.36 0.45 -0.05 -0.07 -0.05 0.05 -0.03 -0.06 -0.06
Carotenes -0.22 -0.14 0.08 0.34 -0.17 -0.13 0.23 0.11 0.02 0.37 0.03 0.18 0.04
Vitamin D 0.04 0.30 0.08 0.74* -0.07 -0.02 0.05 0.05 0.00 0.07 0.03 0.08 0.00
Vitamin E -0.17 0.10 0.67 0.29 -0.12 -0.12 0.14 0.07 0.06 0.15 0.05 0.17 0.11
Thiamine -0.19 -0.08 0.11 0.22 -0.15 -0.05 0.22 0.04 0.09 0.22 0.10 0.16 0.25
Vitamin B2 0.02 -0.01 -0.05 0.21 -0.01 0.06 0.21 0.15 0.18 0.08 0.18 0.12 0.02
Pot Niacin 0.08 0.24 0.12 0.44 0.04 0.13 0.08 -0.04 -0.04 0.19 0.00 0.02 0.01
Niacin -0.23 0.03 0.17 0.49 -0.21 -0.15 0.07 0.03 -0.05 0.15 -0.01 0.14 0.15
Vitamin B6 -0.29 -0.16 0.03 0.32 -0.27 -0.19 0.21 0.09 0.06 0.22 0.09 0.19 -0.02
Vitamin B12 0.07 0.25 0.01 0.65 -0.01 0.06 0.07 0.05 0.00 0.15 0.03 0.07 -0.07
Folic acid -0.28 -0.20 0.05 0.25 -0.24 -0.14 0.33 0.21 0.19 0.22 0.20 0.34 0.21
Pantoth. acid -0.06 0.04 0.03 0.27 -0.07 0.04 0.20 0.12 0.11 0.16 0.15 0.12 0.03
Biotin -0.01 0.14 0.14 0.32 -0.07 0.02 0.26 0.29 0.22 0.10 0.26 0.18 0.14
Vitamin C -0.30 -0.26 -0.01 0.28 -0.27 -0.24 0.25 0.30 0.12 0.26 0.09 0.70* 0.07

Chapter eight Results: Overall and stepwise regression analysis
309
Variables Protein Cholest. Sugars Starch Fibre Na K Ca Mg P Fe Cu Zn Cl Mn Se I
Protein 1.00
Cholesterol 0.43 1.00
Sugars -0.10 -0.24 1.00
Starch 0.05 -0.11 -0.14 1.00
Fibre 0.21 -0.31 0.33 0.27 1.00
Na 0.48 0.24 -0.15 0.34 0.14 1.00
K 0.47 -0.13 0.33 0.12 0.73* 0.15 1.00
Ca 0.37 0.08 0.29 -0.04 0.16 0.24 0.37 1.00
Mg 0.42 -0.21 0.27 0.15 0.77* 0.23 0.79* 0.38 1.00
P 0.77* 0.20 0.18 0.04 0.42 0.42 0.62 0.73* 0.70* 1.00
Fe 0.45 -0.03 0.06 0.28 0.68 0.40 0.56 0.16 0.70* 0.53 1.00
Cu 0.32 -0.04 0.16 0.17 0.53 0.20 0.51 0.02 0.61 0.39 0.58 1.00
Zn 0.84** 0.34 -0.08 0.08 0.31 0.36 0.46 0.31 0.49 0.70* 0.56 0.41 1.00
Cl 0.47 0.19 -0.14 0.36 0.18 0.98*** 0.20 0.28 0.29 0.44 0.42 0.22 0.35 1.00
Mn 0.14 -0.26 0.13 0.33 0.67 0.21 0.43 0.15 0.67 0.36 0.57 0.41 0.25 0.25 1.00
Se 0.55 0.21 -0.14 0.11 0.20 0.35 0.23 0.08 0.33 0.40 0.31 0.39 0.39 0.36 0.24 1.00
I 0.53 0.28 0.14 -0.18 0.11 0.23 0.38 0.51 0.32 0.62 0.19 0.12 0.30 0.25 0.07 0.39 1.00
Retinol 0.09 0.51 -0.13 -0.09 -0.21 0.09 -0.14 0.18 -0.16 0.10 -0.02 0.17 0.10 0.07 -0.15 0.04 0.16
Carotenes 0.26 -0.11 0.14 -0.01 0.58 0.16 0.54 0.16 0.43 0.31 0.45 0.34 0.27 0.17 0.30 0.13 0.14
Vitamin D 0.44 0.37 -0.07 -0.13 0.05 0.18 0.15 0.07 0.15 0.33 0.27 0.18 0.25 0.16 0.03 0.46 0.46
Vitamin E 0.13 -0.10 0.19 0.08 0.43 0.20 0.32 0.11 0.33 0.22 0.29 0.25 0.10 0.21 0.30 0.18 0.12
Thiamine 0.47 -0.02 0.06 0.48 0.56 0.44 0.62 0.21 0.55 0.49 0.61 0.37 0.51 0.47 0.43 0.27 0.18
Vitamin B2 0.52 0.15 0.24 -0.05 0.24 0.27 0.48 0.75* 0.49 0.78* 0.40 0.20 0.48 0.30 0.21 0.18 0.56
Pot Niacin 0.98*** 0.47 -0.11 0.03 0.16 0.47 0.44 0.42 0.41 0.78* 0.39 0.29 0.83** 0.47 0.08 0.51 0.52
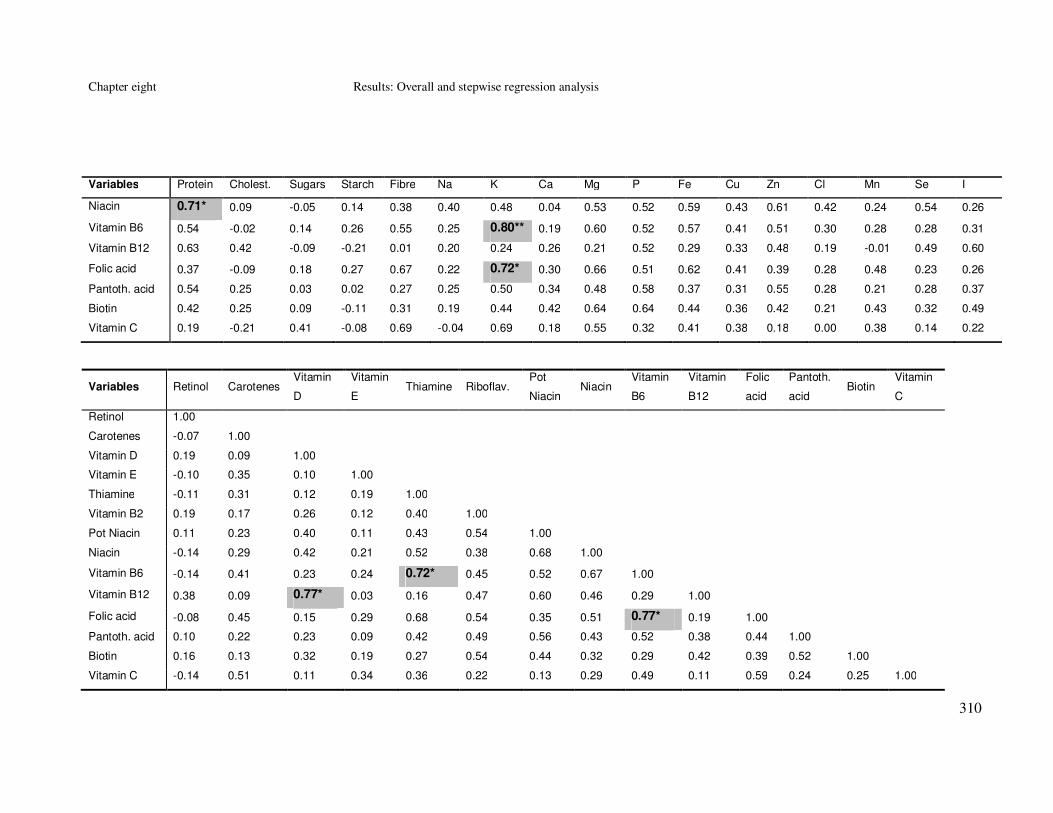
Chapter eight Results: Overall and stepwise regression analysis
310
Variables Protein Cholest. Sugars Starch Fibre Na K Ca Mg P Fe Cu Zn Cl Mn Se I
Niacin 0.71* 0.09 -0.05 0.14 0.38 0.40 0.48 0.04 0.53 0.52 0.59 0.43 0.61 0.42 0.24 0.54 0.26
Vitamin B6 0.54 -0.02 0.14 0.26 0.55 0.25 0.80** 0.19 0.60 0.52 0.57 0.41 0.51 0.30 0.28 0.28 0.31
Vitamin B12 0.63 0.42 -0.09 -0.21 0.01 0.20 0.24 0.26 0.21 0.52 0.29 0.33 0.48 0.19 -0.01 0.49 0.60
Folic acid 0.37 -0.09 0.18 0.27 0.67 0.22 0.72* 0.30 0.66 0.51 0.62 0.41 0.39 0.28 0.48 0.23 0.26
Pantoth. acid 0.54 0.25 0.03 0.02 0.27 0.25 0.50 0.34 0.48 0.58 0.37 0.31 0.55 0.28 0.21 0.28 0.37
Biotin 0.42 0.25 0.09 -0.11 0.31 0.19 0.44 0.42 0.64 0.64 0.44 0.36 0.42 0.21 0.43 0.32 0.49
Vitamin C 0.19 -0.21 0.41 -0.08 0.69 -0.04 0.69 0.18 0.55 0.32 0.41 0.38 0.18 0.00 0.38 0.14 0.22
Variables Retinol Carotenes Vitamin
D
Vitamin
E Thiamine Riboflav.
Pot
Niacin Niacin
Vitamin
B6
Vitamin
B12
Folic
acid
Pantoth.
acid Biotin
Vitamin
C
Retinol 1.00
Carotenes -0.07 1.00
Vitamin D 0.19 0.09 1.00
Vitamin E -0.10 0.35 0.10 1.00
Thiamine -0.11 0.31 0.12 0.19 1.00
Vitamin B2 0.19 0.17 0.26 0.12 0.40 1.00
Pot Niacin 0.11 0.23 0.40 0.11 0.43 0.54 1.00
Niacin -0.14 0.29 0.42 0.21 0.52 0.38 0.68 1.00
Vitamin B6 -0.14 0.41 0.23 0.24 0.72* 0.45 0.52 0.67 1.00
Vitamin B12 0.38 0.09 0.77* 0.03 0.16 0.47 0.60 0.46 0.29 1.00
Folic acid -0.08 0.45 0.15 0.29 0.68 0.54 0.35 0.51 0.77* 0.19 1.00
Pantoth. acid 0.10 0.22 0.23 0.09 0.42 0.49 0.56 0.43 0.52 0.38 0.44 1.00
Biotin 0.16 0.13 0.32 0.19 0.27 0.54 0.44 0.32 0.29 0.42 0.39 0.52 1.00
Vitamin C -0.14 0.51 0.11 0.34 0.36 0.22 0.13 0.29 0.49 0.11 0.59 0.24 0.25 1.00

Chapter eight Results: Overall and stepwise regression analysis
311
8.2.3 Univariable logistic regression of the explanatory
variables
Univariable logistic regression models were fitted for each explanatory variable.
Odds ratios and 95% CI were calculated for each quartile of the continuous variables
and each category of the categorical variables (Table 96). P-values for trend were
calculated for the quartile form of the quantitative explanatory variables (Table 96).
For the regression of food and nutrient variables, their residual energy adjusted form
was used (except for the food groups: tea and coffee and the nutrient flavones).
For the demographic and lifestyle factors significant (at a p≤0.05 level) associations
were observed between colorectal cancer and family history of cancer (p=1.1x10-51),
NSAIDs intake (p=7.3x10⁻⁷
), dietary energy intake (p=2.0x10⁻⁵
), HRT intake
(p=0.0003) and physical activity (p=0.02) (Table 96). For the food group variables
significant associations were observed between colorectal cancer and intakes of
vegetables (p=2.4x10⁻⁸
), eggs (p=4.0x10⁻⁷
), sweets (p=7.9x10⁻⁷
), fruit/ vegetable
juice (p=1.7x10⁻⁶), oily fish (p=0.001), coffee (p=0.001), fruit (p=0.009), savoury
foods (p=0.009) and white fish (p=0.04) (Table 96). For the nutrient variables
significant associations were observed between colorectal cancer and intakes of the
fatty acids: tMUFAs (p=6.7x10⁻⁶
), ω3PUFAs (p=1.3x10⁻⁵
), SFAs (p=0.0001), tFAs
(p=0.001) and MUFAs (p=0.01); of the flavonoids: quercetin (p=0.001), catechin
(p=0.001) and phytoestrogens (p=0.04); of the macronutrients: cholesterol
(p=1.4x10⁻⁵), fibre (p=3.3x10⁻⁵), protein (p=0.001) and starch (p=0.05); of the
minerals: magnesium (p=2.7x10⁻¹¹
), potassium (p=9.1x10⁻⁸
), manganese (p=1.8x10-
7), copper (p=2.0x10
-6), iron (p=1.3x10
-5), zinc (p=4.6x10
-5), phosphorus (p=0.0001),
selenium (p=0.009); and of the vitamins: niacin (p=8.2x10⁻⁷
), vitamin B6 (p=7.1x10-
6), carotenes (p=2.6x10
-5), vitamin C (p=4.6x10
-5), vitamin A (p=0.001), potential
niacin (p=0.001), biotin (p=0.001), folate (p=0.003), pantothenic acid (p=0.006),
vitamin D (p=0.01), vitamin B1 (p=0.02) and vitamin B12 (p=0.02) (Table 96).

Chapter eight Results: Overall and stepwise regression analysis
312
Table 96 Univariable logistic regression of colorectal cancer on each explanatory variable
included in the stepwise regression (2061 cases; 2776 controls)
Variables Quartiles Frequency Model II
Cases Controls OR 95% CI p-value
for trend
Demographic factors
Age (years) 21-55 632 760 1.00
55-63 401 627 0.77 0.65, 0.91
63-71 583 761 0.92 0.79, 1.07
>71 445 626 0.85 0.73, 1.00 0.18
Sex males 1180 1582 1.00
females 881 1194 0.99 0.88, 1.11 0.85
Family history low 1610 2695 1.00
moderate/ high 333 30 18.58 12.72, 27.13 1.1x10-51
Deprivation score 1 194 258 1.00
2 434 568 1.02 0.81, 1.27
3 532 758 0.96 0.75, 1.16
4 488 645 1.01 0.81, 1.25
5 218 293 0.99 0.77, 1.28
6 140 178 1.05 0.78, 1.40
7 54 76 0.94 0.64, 1.40 0.94
Lifestyle variables
Smoking No 874 1200 1.00
Former 818 1049 1.07 0.94, 1.21
Current 343 509 0.93 0.79, 1.09 0.63
Alcohol (g/day) 0-1.70 526 696 1.00
1.70-8.10 534 692 1.02 0.87, 1.20
8.10-19.2 501 681 0.97 0.83, 1.14
>19.20 500 707 0.94 0.80, 1.10 0.34
Alcohol (g/day)
0 291 427 1.00
0-15 1125 1473 1.12 0.95, 1.33
15-30 393 548 1.05 0.86, 1.28
30-45 139 202 1.01 0.78, 1.31
45-60 61 81 1.11 0.77, 1.59
>60 52 45 1.70 1.11, 2.60 0.28
BMI (kg/m2) <23.71 523 673 1.00
23.71-26.11 499 702 0.91 0.78, 1.07
26.11-29.09 515 675 0.98 0.83, 1.15

Chapter eight Results: Overall and stepwise regression analysis
313
>29.09 503 692 0.94 0.79, 1.10 0.62
Physical activity 0 1139 1456 1.00
0-3.5 486 703 0.88 0.77, 1.02
3.5-7 205 339 0.77 0.64, 0.93
>7 133 185 0.92 0.73, 1.16 0.02
Dietary energy
intake* (KJ/day)
0- 8.25 478 733 1.00
8.25-10.17 483 725 1.02 0.87, 1.20
10.17- 12.73 529 680 1.19 1.01, 1.40
>12.73 571 638 1.37 1.17, 1.61 2x10⁻⁵
NSAIDs no 1449 1757 1.00
yes 605 1000 0.73 0.65, 0.83 7.3x10⁻⁷
HRT no 666 821 1.00
yes 190 343 0.68 0.56, 0.84 0.0003
Foods (m/day)
Breads 0-1.89 475 735 1.00
1.89-2.66 518 691 1.16 0.99, 1.36
2.66-3.59 563 646 1.35 1.15, 1.58
>3.59 505 704 1.11 0.94, 1.31 0.08
Cereals 0-0.45 457 753 1.00
0.45-1.06 584 625 1.54 1.31, 1.81
1.06-1.71 534 675 1.30 1.11, 1.53
>1.71 486 723 1.11 0.94, 1.30 0.62
Milk 0-1.08 511 699 1.00
1.08-1.86 495 714 0.95 0.81, 1.11
1.86-2.44 528 681 1.06 0.90, 1.25
>2.44 527 682 1.06 0.90, 1.24 0.28
Cream 0-0.18 501 709 1.00
0.18-0.34 529 680 1.10 0.94, 1.29
0.34-0.81 555 654 1.20 1.02, 1.41
>0.81 476 733 0.92 0.78, 1.08 0.53
Cheese 0-0.28 472 738 1.00
0.28-0.60 530 679 1.22 1.04, 1.43
0.60-1.07 550 659 1.30 1.11, 1.53
>1.07 509 700 1.14 0.97, 1.34 0.09
Eggs 0-0.22 452 758 1.00
0.22-0.43 504 705 1.20 1.02, 1.41
0.43-0.68 533 676 1.32 1.12, 1.56
>0.68 572 637 1.51 1.28, 1.77 4.0x10⁻⁷

Chapter eight Results: Overall and stepwise regression analysis
314
Poultry 0-0.16 508 702 1.00
0.16-0.30 571 638 1.24 1.05, 1.45
0.30-0.56 495 714 0.96 0.81, 1.13
>0.56 487 722 0.93 0.79, 1.10 0.07
Red meat 0-0.82 490 720 1.00
0.82-1.26 517 692 1.10 0.93, 1.29
1.26-1.75 544 665 1.20 1.02, 1.41
>1.75 510 699 1.07 0.91, 1.26 0.25
Processed meat 0-0.50 502 708 1.00
0.50-0.88 523 686 1.08 0.92, 1.26
0.88-1.38 526 683 1.09 0.92, 1.28
>1.38 510 699 1.03 0.87, 1.21 0.71
White fish 0-0.16 492 718 1.00
0.16-0.29 521 688 1.10 0.94, 1.30
0.29-0.47 494 715 1.01 0.86, 1.19
>0.47 554 655 1.23 1.05, 1.45 0.04
Oily fish 0-0.01 524 686 1.00
0.01-0.13 570 639 1.17 0.99, 1.37
0.13-0.31 507 702 0.95 0.80, 1.12
>0.31 460 749 0.80 0.68, 0.95 0.001
Potatoes/ Pasta/
Rice
0-1.69 518 692 1.00
1.69-2.27 525 684 1.02 0.87, 1.20
2.27-2.94 515 694 0.99 0.84, 1.16
>2.94 503 706 0.95 0.81, 1.12 0.48
Fruit 0-1.43 528 682 1.00
1.43-2.47 544 665 1.06 0.90, 1.24
2.47-3.84 520 689 0.97 0.83, 1.14
>3.84 469 740 0.82 0.70, 0.96 0.009
Vegetables 0-3.31 569 641 1.00
3.31-4.92 537 672 0.90 0.77, 1.06
4.92-7.03 526 683 0.87 0.74, 1.02
>7.03 429 780 0.62 0.53, 0.73 2.4x10⁻⁸
Savoury† 0-1.82 524 686 1.00
1.82-2.55 549 660 1.09 0.93, 1.28
2.55-3.44 523 686 1.00 0.85, 1.17
>3.44 465 744 0.82 0.70, 0.96 0.009
Sweets‡ 0-2.98 454 756 1.00
2.98-4.44 498 711 1.17 0.99, 1.37

Chapter eight Results: Overall and stepwise regression analysis
315
4.44-6.10 544 665 1.36 1.16, 1.60
>6.10 565 644 1.46 1.24, 1.72 7.9x10⁻⁷
Tea§ 0-1 527 683 1.00
1-3 509 700 0.97 0.84, 1.12
3-4 534 675 1.03 0.87, 1.23
>4 491 718 0.91 0.78, 1.07 0.38
Coffee§ 0-0.1 567 691 1.00
0.1-1 571 714 0.97 0.83, 1.14
1-3 550 769 0.87 0.75, 1.02
>3 373 602 0.75 0.64, 0.89 0.001
Fruit/ vegetable
juice
0-0.14 439 771 1.00
0.14-0.82 532 677 1.38 1.17, 1.62
0.82-1.45 527 682 1.36 1.15, 1.60
>1.45 563 646 1.53 1.30, 1.80 1.7x10⁻⁶
Fizzy drinks 0-0.01 495 715 1.00
0.01-0.02 515 694 1.07 0.91, 1.26
0.02-0.38 522 687 1.10 0.93, 1.29
>0.38 529 680 1.12 0.96, 1.32 0.15
Nutrients
Fatty acids (g/day)
SFAs 0-31.48 466 739 1.00
31.48-37.03 512 692 1.17 1.00, 1.38
37.03-43.30 523 681 1.22 1.04, 1.43
>43.30 560 644 1.38 1.17, 1.62 0.0001
MUFAs 0-28.57 467 738 1.00
28.57-32.56 529 675 1.24 1.05, 1.46
32.56-36.18 539 665 1.28 1.09, 1.51
>36.18 526 678 1.23 1.04, 1.44 0.01
ω6PUFAs 0-8.92 515 690 1.00
8.92-10.73 519 685 1.02 0.86, 1.19
10.73-13.19 510 694 0.98 0.84, 1.16
>13.19 517 687 1.01 0.86, 1.18 0.98
ω3PUFAs 0-1.83 557 648 1.00
1.83-2.22 538 666 0.94 0.80, 1.10
2.22-2.74 513 691 0.86 0.73, 1.01
>2.74 453 751 0.70 0.60, 0.83 1.3x10⁻⁵
tFAs 0-2.86 453 752 1.00
2.86-3.53 526 678 1.29 1.09, 1.52

Chapter eight Results: Overall and stepwise regression analysis
316
3.53-4.24 552 652 1.40 1.19, 1.65
>4.24 530 674 1.30 1.11, 1.54 0.001
tMUFAs 0-2.17 448 757 1.00
2.17-2.68 505 699 1.22 1.04, 1.44
2.68-3.19 565 639 1.49 1.27, 1.76
>3.19 543 661 1.39 1.18, 1.63 6.7x10⁻⁶
Flavonoids (mg/day)
Quercetin 0-11.20 541 669 1.00
11.20-17.38 528 681 0.96 0.82, 1.13
17.38-22.65 538 671 0.99 0.84, 1.16
>22.65 454 755 0.74 0.63, 0.87 0.001
Catechin 0-4.81 548 662 1.00
4.81-7.21 535 674 0.96 0.82, 1.13
7.21-9.39 504 705 0.86 0.73, 1.01
>9.39 474 735 0.78 0.66, 0.92 0.001
Epicatechin 0-12.71 522 688 1.00
12.71-23.34 528 681 1.02 0.87, 1.20
23.34-32.28 534 675 1.04 0.89, 1.22
>32.28 477 732 0.86 0.73, 1.01 0.10
Flavones§
0-0.5 607 806 1.00
0.5-1 460 621 0.94 0.80, 1.10
1-1.8 481 698 0.85 0.73, 1.00
>1.8 513 651 0.90 0.76, 1.07 0.12
Procyanidins 0-15.98 523 687 1.00
15.98-31.72 527 682 1.02 0.86, 1.19
31.72-44.66 534 675 1.04 0.88, 1.22
>44.66 477 732 0.86 0.73, 1.01 0.09
Flavanones 0-7.42 478 732 1.00
7.42-20.57 563 646 1.33 1.14, 1.57
20.57-40.61 526 683 1.18 1.00, 1.39
>40.61 494 715 1.06 0.90, 1.24 0.87
Phytoestrogens
(µg/day)
0-400.1 522 688 1.00
400.1-575.3 551 658 1.10 0.94, 1.30
575.3-845.7 504 705 0.94 0.80, 1.11
>845.7 484 725 0.88 0.75, 1.03 0.04
Macronutrients (g/day)
Protein 0-90.60 554 656 1.00
90.60-101.3 526 683 0.91 0.78, 1.07

Chapter eight Results: Overall and stepwise regression analysis
317
101.3-112.3 510 699 0.86 0.74, 1.01
>112.3 471 738 0.76 0.64, 0.89 0.001
Cholesterol 0-296.3 453 757 1.00
296.3-362.0 533 676 1.32 1.12, 1.55
362.0-430.1 500 709 1.18 1.00, 1.39
>430.1 575 634 1.52 1.29, 1.78 1.4x10⁻⁵
Sugars 0-109.4 507 703 1.00
109.4-132.7 535 674 1.10 0.94, 1.29
132.7-158.5 519 690 1.04 0.89, 1.22
>158.5 500 709 0.98 0.83, 1.15 0.64
Starch 0-143.3 463 747 1.00
143.3-164.6 537 672 1.29 1.10, 1.52
164.6-184.5 554 655 1.36 1.16, 1.60
>184.5 507 702 1.16 0.99, 1.37 0.05
Fibre 0- 17.34 549 661 1.00
17.34-20.97 542 667 0.98 0.83, 1.15
20.97-24.94 521 688 0.91 0.78, 1.01
>24.94 449 760 0.71 0.60, 0.84 3.3x10⁻⁵
Minerals (mg/day)
Sodium 0-3065.8 496 714 1.00
6065.8-3450.9 514 695 1.06 0.91, 1.25
3450.9-3848.8 543 666 1.17 1.00, 1.38
>3848.8 508 701 1.04 0.89, 1.23 0.39
Potassium 0-3789.3 557 653 1.00
3789.3-4274.8 567 642 1.03 0.88, 1.21
4274.8-4759.8 493 716 0.81 0.69, 0.95
>4759.8 444 765 0.68 0.58, 0.80 9.1x10⁻⁸
Calcium 0-924.5 511 699 1.00
924.5-1091.1 519 690 1.03 0.88, 1.21
1091.1-1269.6 520 689 1.03 0.88, 1.21
>1269.6 511 698 1.00 0.85, 1.18 0.98
Magnesium 0-340.36 578 632 1.00
340.36-383.26 558 651 0.94 0.80, 1.10
383.26-428.36 499 710 0.77 0.65, 0.90
>428.36 426 783 0.59 0.50, 0.70 2.7x10⁻¹¹
Phosphorus 0-1574.1 545 665 1.00
1574.1-1750.5 544 665 1.00 0.85, 1.17
1750.5-1931.4 518 691 0.91 0.78, 1.07

Chapter eight Results: Overall and stepwise regression analysis
318
>1931.4 454 755 0.73 0.62, 0.86 0.0001
Iron 0-13.56 567 643 1.00
13.56-15.28 525 684 0.87 0.74, 1.02
15.28-17.15 509 700 0.82 0.70, 0.97
>17.15 460 749 0.70 0.59, 0.82 1.3x10⁻⁵
Copper 0-1.37 573 637 1.00
1.37-1.54 536 673 0.88 0.75, 1.04
1.54-1.76 484 725 0.74 0.63, 0.87
>1.76 468 741 0.70 0.60, 0.82 2.0x10⁻⁶
Zinc 0-10.48 556 654 1.00
10.48-11.94 548 661 0.97 0.83, 1.14
11.94-13.37 485 724 0.79 0.67, 0.93
>13.37 472 737 0.75 0.64, 0.88 4.6x10⁻⁵
Chloride 0-4705.2 499 711 1.00
4705.2-5285.5 517 692 1.06 0.91, 1.25
5285.5-5872.4 540 669 1.15 0.98, 1.35
>5872.4 505 704 1.02 0.87, 1.20 0.58
Manganese 0-3.04 573 637 1.00
3.04-3.79 542 667 0.90 0.77, 1.06
3.79-4.67 490 719 0.76 0.64, 0.89
>4.67 456 753 0.67 0.57, 0.79 1.8x10⁻⁷
Selenium
(µg/day)
0-63.25 542 668 1.00
63.25-78.96 529 680 0.96 0.82, 1.13
78.96-96.43 509 700 0.90 0.76, 1.05
>96.43 481 728 0.81 0.69, 0.96 0.009
Iodine (µg/day) 0-149.78 515 695 1.00
149.78-190.19 540 669 1.09 0.93, 1.28
190.19-240.72 516 693 1.00 0.85, 1.18
>242.72 490 719 0.92 0.78, 1.08 0.20
Vitamins (mg/day)
Vitamin A
(µg/day)
0-348.35 461 749 1.00
348.35-496.55 499 710 1.14 0.97, 1.34
496.55-752.52 579 630 1.49 1.27, 1.76
>752.52 522 687 1.23 1.04, 1.45 0.001
Carotenes
(µg/day)
0-2406.1 544 666 1.00
2406.1-3519.5 556 653 1.04 0.89, 1.22
3519.5-4952.1 510 699 0.89 0.76, 1.05
>4952.1 451 758 0.73 0.62, 0.86 2.6x10⁻⁵

Chapter eight Results: Overall and stepwise regression analysis
319
Vitamin D
(µg/day)
0-2.74 538 672 1.00
2.74-3.86 535 674 0.99 0.84, 1.16
3.86-5.47 506 703 0.90 0.76, 1.06
>5.47 482 727 0.83 0.70, 0.97 0.01
Vitamin E 0-6.83 532 678 1.00
6.83-8.26 510 699 0.93 0.79, 1.09
8.26-10.42 511 698 0.93 0.79, 1.10
>10.42 508 701 0.92 0.79, 1.08 0.37
Vitamin B1 0-1.80 537 673 1.00
1.80-2.03 526 683 0.96 0.82, 1.13
2.03-2.28 523 686 0.95 0.81, 1.12
>2.28 475 734 0.81 0.69, 0.95 0.02
Vitamin B2 0-1.80 522 688 1.00
1.80-2.10 537 672 1.05 0.90, 1.24
2.10-2.42 511 698 0.96 0.82, 1.13
>2.42 491 718 0.90 0.77, 1.06 0.13
Potential niacin 0-18.82 543 667 1.00
18.82-21.11 542 667 1.00 0.85, 1.17
21.11-23.37 507 702 0.89 0.75, 1.04
>23.37 469 740 0.78 0.66, 0.91 0.001
Niacin 0-20.64 566 644 1.00
20.64-23.98 550 659 0.95 0.81, 1.11
23.98-27.47 484 725 0.76 0.65, 0.89
>27.47 461 748 0.70 0.60, 0.82 8.2x10⁻⁷
Vitamin B6 0-2.47 547 663 1.00
2.47-2.83 555 654 1.03 0.88, 1.21
2.83-3.21 514 695 0.90 0.76, 1.05
>3.21 445 764 0.71 0.60, 0.83 7.1x10⁻⁶
Vitamin B12
(µg/day)
0-5.27 538 672 1.00
5.27-6.96 516 693 0.93 0.79, 1.09
6.96-9.21 533 676 0.98 0.84, 1.16
>9.21 474 735 0.80 0.68, 0.95 0.02
Folic acid
(µg/day)
0-282.65 533 677 1.00
282.65-325.89 546 663 1.05 0.89, 1.23
325.89-370.81 515 694 0.94 0.80, 1.11
>370.81 467 742 0.80 0.68, 0.94 0.003
Pantothenic acid 0-5.90 454 665 1.00
5.90-6.65 534 675 0.96 0.82, 1.13

Chapter eight Results: Overall and stepwise regression analysis
320
6.65-7.58 494 715 0.84 0.72, 0.99
>7.58 488 721 0.83 0.70, 0.97 0.006
Biotin (µg/day) 0-43.38 549 661 1.00
43.38-49.35 529 680 0.94 0.80, 1.10
49.35-55.69 519 690 0.91 0.77, 1.06
>55.69 464 745 0.75 0.64, 0.88 0.001
Vitamin C 0-81.20 553 657 1.00
81.20-114.17 528 681 0.91 0.78, 1.08
114.17-156.03 534 675 0.94 0.80, 1.10
>156.03 446 763 0.69 0.59, 0.82 4.6x10⁻⁵
* Intakes divided into quartiles
† Summary variable of savoury foods, soups and sauces
‡ Summary variable of pudding and deserts; chocolates, sweets, nuts and crisps; biscuits; and cakes
§ Not energy adjusted

Chapter eight Results: Overall and stepwise regression analysis
321
8.3 Stepwise regression analysis
Stepwise regression (both forward and backward) was applied to three different set
of variables: 1) Set 1 consisted of the demographic factors, lifestyle variables and
foods; 2) Set 2 consisted of the demographic factors, lifestyle variables and nutrients;
and 3) Set 3 consisted of the demographic factors, lifestyle variables, foods and
nutrients. The p-value threshold for a variable to enter the model (forward stepwise
regression) or to remain in the model (backward stepwise regression) was 0.10.
Forward and backward stepwise regression for all three sets of variables using the
quartile form of continuous variables was initially applied in the whole sample
(Tables 97-101) and then separately for females and males (data not shown). In the
female datasets the HRT lifestyle variable was included.
In order to examine the stability of the selected models (of the whole sample only),
the bootstrap method was used. In particular, 100 bootstrap samples were randomly
drawn from the original sample. Then, each bootstrap sample was used to apply
forward and backward stepwise regression for each set of variables (set 1, 2 and 3).
8.3.1 Set 1: Demographic factors, lifestyle variables and
foods
The explanatory factors that were included in set 1 were the demographic risk factors
(age, sex, family history and deprivation score), the lifestyle variables (smoking,
alcohol, BMI, physical activity, dietary energy, NSAIDs and HRT only for the
female analysis) and the food variables (breads, cereals, milk, cream, cheese, eggs,
poultry, red meat, processed meat, white fish, oily fish, potatoes/ pasta/ rice, fruit,
vegetables, savoury, sweets, tea, coffee, fruit/ vegetable juice and fizzy drinks) (30
risk factors in total). Forward and backward stepwise regression was applied in the
whole sample and separately for males and females.
8.3.1.1 Whole sample (Set 1)
Findings from the original sample
Forward and backward stepwise regression using the quartile form of the continuous
variables resulted in two identical models, which included the following 13 risk
factors: family history (p=3.6x10-49), sweets (p=4.4x10⁻⁸), eggs (p=1.7x10⁻⁷),
NSAIDs (p=1.3x10⁻⁵
), fruit/ vegetable juice (p=1.0x10⁻⁵
), dietary energy (p=0.001),

Chapter eight Results: Overall and stepwise regression analysis
322
coffee (p=0.001), white fish (p=0.001), vegetables (p=0.004), tea (p=0.006), physical
activity (p=0.01), breads (p=0.02) and oily fish (p=0.07) (Table 97). The risk factors
family history, sweets, eggs, fruit/ vegetable juice, dietary energy intake, white fish
and breads were associated with an increased colorectal cancer risk, whereas
NSAIDs, coffee, physical activity, tea, vegetables and oily fish were associated with
a decreased risk (Table 97).
Findings from the 100 bootstrap samples
The main findings after applying forward and backward stepwise regression to the
100 bootstrap samples were:
- Forward stepwise regression applied to 100 bootstrap samples resulted in 100
unique regression models (i.e. all 100 models were chosen only once).
- Backward stepwise regression applied to 100 bootstrap samples resulted also in
100 unique regression models.
- Over the 100 bootstrap samples, the variables selected by backward selection
were identical to those selected by forward selection in 65 of the bootstrap
samples. For 25 bootstrap samples the agreement between the variables selected
by backward and forward selection was over 90%, whereas for the remaining five
bootstrap samples the agreement was between 84% and 88% (mean percentage of
agreement (SD): 96.97% (4.56%)).
- Forward and backward stepwise regression resulted in a final model with 11-20
variables (mean (SD): 15.43 (1.89), median (IQR): 15 (14, 17)) and 12-20
variables (mean (SD): 16.01 (1.86), median (IQR): 16 (15, 17)) respectively in
the 100 samples. Furthermore, the distribution of the number of variables in the
resultant models is close to normal, with the mean of the number of the included
variables in backward regression models to be significantly larger than the mean
of the number of the included variables in forward regression models (t-test p-
value: 0.03).
- The variables: family history, NSAIDs, eggs and sweets were selected to be
included in built models of all 100 bootstrap samples using either forward or
backward stepwise regression. The variables dietary energy, and fruit/ vegetable
juice were selected to be included in the 98% of the built models of the 100
bootstrap samples using each of the two methods. The variables coffee and white

Chapter eight Results: Overall and stepwise regression analysis
323
fish were selected to be included in 92-94% of the built models of the 100
bootstrap samples using each of the two methods. Finally, the remaining 21
variables were selected in <90% of the bootstrap samples using either selection
method.
8.3.1.2 Females (Set 1)
Findings from the original sample
Forward stepwise regression using the quartile form of the continuous variables
resulted in a model including the following nine risk factors: family history
(p=1.9x10⁻²⁵), fruit/ vegetable juice (p=0.0002), sweets (p=0.0003), vegetables
(p=0.002), breads (p=0.002), NSAIDs (p=0.002), white fish (p=0.01), eggs (p=0.06)
and HRT (p=0.09) (data not shown). Backward stepwise regression using the quartile
form of the continuous variables resulted in a model including the following 10 risk
factors: family history (p=1.3x10⁻²⁵
), fruit/ vegetable juice (p=0.0002), sweets
(p=0.0002), vegetables (p=0.002), breads (p=0.002), white fish (p=0.007), NSAIDs
(p=0.001), coffee (p=0.04), tea (p=0.05) and eggs (p=0.08) (data not shown). In
summary, forward and backward stepwise regression using the quartile form of the
continuous variables resulted in similar models, with the common variables being
family history, fruit/ vegetable juice, sweets, vegetables, breads, NSAIDs and white
fish (data not shown).
8.3.1.3 Males (Set 1)
Findings from the original sample
Forward stepwise regression using the quartile form of the continuous variables
resulted in a model including the following eight risk factors: family history
(p=4.0x10⁻²⁵
), eggs (p=8.3x10⁻⁸
), dietary energy (p=3.1x10⁻⁵
), sweets (p=0.0002),
NSAIDs (p=0.006), fruit/ vegetable juice (p=0.008), savoury (p=0.02) and physical
activity (p=0.02) (data not shown). Backward stepwise regression using the quartile
form of the continuous variables resulted in a model including the following 10 risk
factors: family history (p=7.4x10⁻²⁵
), eggs (p=1.0x10⁻⁷
), dietary energy (p=4.8x10⁻⁶
),
sweets (p=0.0001), NSAIDs (p=0.005), fruit/ vegetable juice (p=0.01), savoury
(p=0.02), coffee (p=0.02), physical activity (p=0.02) and tea (p=0.04) (data not
shown). In summary, forward and backward stepwise regression using the quartile
form of the continuous variables resulted in almost identical models, with the

Chapter eight Results: Overall and stepwise regression analysis
324
common variables being family history, eggs, dietary energy, sweets, NSAIDs, fruit/
vegetable juice, savoury and physical activity (data not shown).
8.3.1.4 Summary (Set 1)
Original sample
Briefly, the variables of set 1 that were selected to be included in all six resultant
models after application of forward and backward stepwise regression in the whole,
female and male samples were: family history (p-value range: 3.6x10-49
to 7.4x10⁻²⁵
),
NSAIDs (p-value range: 1.3x10⁻⁵ to 0.006), eggs (p-value range: 8.3x10⁻⁸ to 0.08),
sweets (p-value range: 4.4x10⁻⁸ to 0.0003) and fruit/ vegetable juice (p-value range:
1.0x10⁻⁵
to 0.01) (Table 97). In contrast, the variables vegetables (p-value range:
0.001 to 0.002) and white fish (p-value range: 0.001 to 0.01) were only included in
the models derived from the whole and female samples (Table 97), the variables
dietary energy intake (p-value range: 4.8x10⁻⁶
to 0.001) and physical activity (p-
value range: 0.01 to 0.02) were included only in the models derived from the whole
and male samples (Table 97), and the variable savoury intake was included only in
the models derived from the male sample (p-value range: 0.02) (data not shown).
Regarding the direction of the associations, the risk factors family history, sweets,
eggs, fruit/ vegetable juice, white fish and dietary energy intake were associated with
an increased colorectal cancer risk, whereas NSAIDs, vegetables, physical activity
and savoury were associated with a decreased risk (Table 97). Finally, a matrix of the
selected variables of the set 1 after applying forward and backward stepwise
regression in the whole, female and male samples is presented in Table 102 (in the
end of this chapter).
Bootstrap samples
Results from the bootstrap method (whole sample) showed that all 100 resultant
models after applying forward stepwise regression were chosen only once and the
same after applying backward stepwise regression. Within the same bootstrap sample
application of either forward or backward stepwise regression resulted in the same
model in 65 cases. Regarding the number of the included variables, it ranged from 11
to 20 and application of the backward stepwise regression resulted in models with
slightly more variables. In addition, the variables family history, NSAIDs, eggs and
sweets were included in the models derived either from forward or backward

Chapter eight Results: Overall and stepwise regression analysis
325
stepwise regression, in all 100 bootstrap samples. Furthermore, the variables energy,
fruit/ vegetable juice, coffee and white fish were included in more than 90% of the
built models. These results are in accordance with the findings of the analysis of the
original sample, which suggested that the risk factors of set 1 more strongly
associated with colorectal cancer were family history, NSAIDs, eggs, sweets and
fruit/ vegetable juice (Table 97).

Chapter eight Results: Overall and stepwise regression analysis
326
Table 97 Set 1: Stepwise regression built model* using the quartile form of the continuous
variables (Whole sample; forward and backward stepwise regression resulted to the same
model)
Included
variables
Number (%) or median (IQR) OR 95% CI p-value
Cases Controls
Family history
Low
Medium/high
1610 (82.9%)
333 (17.1%)
2695 (98.9%)
30 (1.1%) 19.66 13.22, 29.21 3.6x10-49
Sweets† (m/day
‡) 4.3 (2.9, 6.0) 4.6 (3.1, 6.3) 1.19 1.12, 1.27 4.4x10
-8
Eggs (m/day) 0.5 (0.2, 0.7) 0.4 (0.2, 0.6) 1.17 1.10, 1.24 1.7x10⁻⁷
NSAIDs
No
Yes
3206 (66.3%)
1605 (33.2%)
1449 (70.3%)
605 (29.4%)
0.73
0.64, 0.84
1.3x10⁻⁵
fruit/ vegetable juice
(m/day)
0.9 (0.2, 1.6) 0.8 (0.1, 1.4) 1.14 1.08, 1.21 1.0x10⁻⁵
Dietary energy
(MJ/day§)
10.5 (8.4, 13.1) 9.9 (8.1, 12.5) 1.11 1.05, 1.18 0.001
Coffee (m/day) 1.0 (0.0, 2.4) 1.0 (0.1, 3.0) 0.90 0.84, 0.96 0.001
White fish (m/day) 0.3 (0.2, 0.5) 0.3 (0.1, 0.5) 1.11 1.04, 1.17 0.001
Vegetables (m/day) 4.6 (3.1, 6.5) 5.1 (3.4, 7.4) 0.92 0.86, 0.97 0.004
Tea (m/day) 3.0 (1.0, 4.0) 3.0 (1.0, 4.0) 0.91 0.86, 0.97 0.006
Physical activity
(h/week**)
0.0 (0.0, 2.0) 0.0 (0.0, 3.0) 0.91 0.85, 0.98 0.01
Breads (m/day) 2.7 (1.9, 3.6) 2.6 (1.8, 3.6) 1.08 1.01, 1.14 0.02
Oily fish (m/day) 0.1 (0.0, 0.3) 0.1 (0.0, 0.3) 0.95 0.89, 1.01 0.07
* McFadden’s pseudo R2 for the model: 0.099
† Summary variable of puddings and deserts; chocolates, sweets, nuts and crisps; biscuits; and cakes
‡ m/day: measures/day
§ MJ/day: 1000 Joules/day
** h/week: hours/week

Chapter eight Results: Overall and stepwise regression analysis
327
8.3.2 Set 2: Demographic factors, lifestyle variables and
nutrients
The explanatory factors that were included in set 2 were the demographic risk factors
(age, sex, family history and deprivation score), the lifestyle variables (smoking,
alcohol, BMI, physical activity, dietary energy, NSAIDs and HRT only for the
female analysis) and the nutrients (SFAs, MUFAs, ω6PUFAs, ω3PUFAs, tFAs,
tMUFAs, quercetin, catechin, epicatechin, flavones, procyanidins, flavanones,
phytoestrogens, protein, cholesterol, sugars, starch, fibre, sodium, potassium,
calcium, magnesium, phosphorus, iron, copper, zinc, manganese, selenium, iodine,
vitamin A, carotenes, vitamin D, vitamin E, vitamin B1, vitamin B2, niacin, vitamin
B6, vitamin B12, folate, pantothenic acid, biotin and vitamin C) (52 risk factors in
total). Chloride and potential niacin intakes were excluded from the stepwise
regression, since they were very highly correlated with other nutrients (r>0.95).
Forward and backward stepwise regression was applied in the whole sample and
separately for males and females.
8.3.2.1 Whole sample (Set 2)
Findings from the original sample
Forward stepwise regression using the quartile form of the continuous variables
resulted in a model including the following 15 risk factors: family history (p=1.8x10-
49), dietary energy (p=1.1x10
-5), cholesterol (p=1.5x10
-5), NSAIDs (p=2.3x10
-5),
magnesium (p=3.8x10⁻⁵), protein (p=0.01), starch (p=0.01), flavanones (p=0.02),
ω3PUFAs (p=0.02), fibre (p=0.02), iodine (p=0.02), quercetin (p=0.03), copper
(p=0.06), physical activity (p=0.07) and alcohol (p=0.07) (Table 98). The risk factors
family history, cholesterol, dietary energy, fibre, starch, iodine and flavanones were
associated with an increased colorectal cancer risk, whereas NSAIDs, magnesium,
protein, ω3PUFAs, copper, quercetin and physical activity were associated with a
decreased risk (Table 98).
Backward stepwise regression using the quartile form of the continuous variables
resulted in a model including the following 14 risk factors: family history (p=3.3x10-
49), dietary energy (p=4.6x10
-7), NSAIDs (p=2.4x10
-5), cholesterol (p=6.4x10
-5),
magnesium (p=0.0002), tMUFAs (p=0.002), zinc (p=0.002), flavanones (p=0.004),
fibre (p=0.004), ω3PUFAs (p=0.005), quercetin (p=0.01), tFAs (p=0.01), vitamin C

Chapter eight Results: Overall and stepwise regression analysis
328
(p=0.05) and physical activity (p=0.07) (Table 99). The risk factors family history,
dietary energy, tMUFAs, cholesterol, fibre and flavanones were associated with an
increased colorectal cancer risk, whereas NSAIDs, magnesium, tFAs, zinc, vitamin
C, ω3PUFAs, physical activity and quercetin were associated with a decreased risk
(Table 99).
In summary, forward and backward stepwise regression using the quartile form of
the continuous variables resulted in similar models, with the common variables
including family history, dietary energy, cholesterol, NSAIDs, magnesium,
flavanones, ω3PUFAs, fibre, quercetin and physical activity (Table 98, Table 99).
Findings from the 100 bootstrap samples
The main findings after applying forward and backward stepwise regression to the
100 bootstrap samples were:
- Forward stepwise regression applied to 100 bootstrap samples resulted in 100
unique regression models (i.e. all 100 models were chosen only once).
- Backward stepwise regression applied to 100 bootstrap samples resulted also in
100 unique regression models.
- Over the 100 bootstrap samples, the variables selected by backward selection
were identical to those selected by forward selection in two of the bootstrap
samples. For 30 bootstrap samples the agreement between the variables selected
by backward and forward selection was over 90%, whereas for the remaining 68
bootstrap samples the agreement was between 58% and 89% (mean percentage of
agreement (SD): 84.36% (9.08%)).
- Forward and backward stepwise regression resulted in a final model with 10-27
variables (mean (SD): 19.29 (3.34), median (IQR): 19 (17, 22)) and 16-31
variables (mean (SD): 22.18 (3.25), median (IQR): 22 (20, 25)) respectively in
the 100 samples. Furthermore, the mean of the number of the included variables
in backward regression models was significantly larger than the mean of the
number of the included variables in forward regression models (t-test p-value:
<5x10⁻⁵
).
- Only the variable family history was selected to be included in built models of all
100 bootstrap samples using either forward or backward stepwise regression. The
variables dietary energy and NSAIDs were selected to be included in the 99% of

Chapter eight Results: Overall and stepwise regression analysis
329
the built models of the 100 bootstrap samples using either of the two methods.
For forward stepwise regression models, the variables cholesterol and
magnesium were selected to be included in 91% and 90% of the built models,
respectively, whereas for backward stepwise regression models, the variables
cholesterol and fibre were selected to be included in 94% and 90% of the built
models, respectively. Finally, the remaining 47 variables were selected in <90%
of the bootstrap samples using either selection.
8.3.2.2 Females (Set 2)
Findings from the original sample
Forward stepwise regression using the quartile form of the continuous variables
resulted in a model including the following 10 risk factors: family history (p=2.3x10-
25), tMUFAs (p=0.0001), zinc (p=0.001), NSAIDs (p=0.008), cholesterol (p=0.01),
starch (p=0.02), sugars (p=0.04), HRT (p=0.05), ω3PUFAs (p=0.06) and tFAs (0.08)
(data not shown). Backward stepwise regression using the quartile form of the
continuous variables resulted in a model including the following 13 risk factors:
family history (p=7.2x10⁻²⁶
), tMUFAs (p=3.9x10⁻⁵
), NSAIDs (p=0.004), sodium
(p=0.005), fibre (p=0.01), magnesium (p=0.01), niacin (p=0.02), iodine (p=0.03),
sugars (p=0.04), carotenes (p=0.05), calcium (p=0.06), ω3PUFAs (p=0.06), tFAs
(p=0.08) and HRT (p=0.08) (data not shown). In summary, forward and backward
stepwise regression using the quartile form of the continuous variables resulted in
similar models, with the common variables being family history, tMUFAs, NSAIDs,
sugars, HRT, ω3PUFAs and tFAs (data not shown).
8.3.2.3 Males (Set 2)
Findings from the original sample
Forward stepwise regression using the quartile form of the continuous variables
resulted in a model including the following 10 risk factors: family history (p=1.8x10-
24), dietary energy (p=1.2x10⁻⁸), magnesium (p=4.6x10⁻⁵), cholesterol (p=0.004),
NSAIDs (p=0.007), flavanones (p=0.009), quercetin (p=0.02), tMUFAs (p=0.02),
zinc (p=0.06) and physical activity (p=0.07) (data not shown). Backward stepwise
regression using the quartile form of the continuous variables resulted in a model
including the following 16 risk factors: family history (p=1.6x10⁻²⁴
), dietary energy
(p=2.6x10⁻⁸), cholesterol (p=0.004), NSAIDs (p=0.006), magnesium (p=0.01),

Chapter eight Results: Overall and stepwise regression analysis
330
phosphorus (p=0.01), vitamin D (p=0.02), copper (p=0.02), biotin (p=0.02),
flavanones (p=0.02), starch (p=0.03), quercetin (p=0.05), tMUFAs (p=0.05),
manganese (p=0.06), fibre (p=0.06) and vitamin B12 (p=0.06) (data not shown). In
summary, forward and backward stepwise regression using the quartile form of the
continuous variables resulted in similar models, with the common variables being
family history, dietary energy, magnesium, cholesterol, NSAIDs, flavanones,
quercetin and tMUFAs (data not shown).
8.3.2.4 Summary (Set 2)
Original sample
Briefly, the variables of set 2 that were included in all six resultant models after
application of forward and backward stepwise regression in the whole, female and
male samples were: family history (p-value range: 1.8x10-49
to 1.8x10⁻²⁴
) and
NSAIDs (p-value range: 2.3x10⁻⁵
to 0.008), whereas the variables cholesterol (p-
value range: 1.5x10⁻⁵ to 0.01) and magnesium (p-value range: 3.8x10⁻⁵ to 0.01) were
included in five of the six resultant models (Table 98, Table 99). In marked contrast,
the variable ω3PUFAs (p-value range: 0.005 to 0.06) was only included in the
models derived from the whole and female samples (Table 98, Table 99), the
variables dietary energy intake (p-value range: 1.2x10⁻⁸
to 1.1x10⁻⁵
) and quercetin
intake (p-value range: 0.01 to 0.05) were included only in the models derived from
the whole and male samples (Table 98, Table 99), the variable tMUFA intake (p-
value range: 3.9x10⁻⁵ to 0.05) was included only in the models derived from the
female and male samples (data not shown) and the variables tFA intake (p-value
range: 0.08) and sugar intake (p-value range: 0.04 to 0.08) were included only in the
models derived from the female sample (data not shown). Regarding the direction of
the associations, the risk factors family history, cholesterol and dietary energy were
associated with an increased colorectal cancer risk, whereas NSAIDs, magnesium,
ω3PUFAs, quercetin, tFAs and sugars were associated with a decreased risk (Table
98, Table 99). The variable tMUFAs was associated with an increased colorectal
cancer risk in the whole and female sample analysis, whereas it was associated with a
decreased risk in the male sample analysis. A matrix of the selected variables of the
set 2 after applying forward and backward stepwise regression in the whole, female
and male samples is presented in Table 102 (in the end of this chapter).

Chapter eight Results: Overall and stepwise regression analysis
331
Bootstrap samples
Results from the bootstrap method (whole sample) showed that all 100 resultant
models after applying forward stepwise regression were chosen only once and the
same after applying backward stepwise regression. Within the same bootstrap sample
application of either forward or backward stepwise regression resulted in the same
model in only two cases. Regarding the number of the included variables, it ranged
from 10 to 27 for forward and from 16 to 31 for backward stepwise regression (p-
value of difference of number of variables selected from forward and backward
stepwise regression: <5x10⁻⁵
) (data not shown). In addition, only the variable family
history was selected to be included in the models derived either from forward or
backward stepwise regression in all 100 bootstrap samples (data not shown).
Furthermore, the variables energy, NSAIDs, cholesterol, magnesium and fibre were
included in more than 90% of the built models (data not shown). These results are in
accordance with the findings of the analysis of the original sample, which suggested
that the risk factors of set 2 more strongly associated with colorectal cancer were
family history, NSAIDs, cholesterol and magnesium (Table 98, Table 99).

Chapter eight Results: Overall and stepwise regression analysis
332
Table 98 Set 2: Forward stepwise regression built model* using the quartile form of the
continuous variables (Whole sample)
Included
variables
Number (%) or median (IQR) OR 95% CI p-value
Cases Controls
Family history
Low
Medium/high
1610 (82.9%)
333 (17.1%)
2695 (98.9%)
30 (1.1%) 19.75 13.30, 29.33 1.8x10-49
Dietary energy
(MJ/day†)
10.5 (8.4, 13.1) 9.9 (8.1, 12.5) 1.15 1.08, 1.22 1.1x10
-5
Cholesterol
(g/day‡)
367.2 (306.7, 438.3) 358.3 (290.2, 424.6) 1.17 1.09, 1.25 1.5x10⁻⁵
NSAIDs
No
Yes
3206 (66.3%)
1605 (33.2%)
1449 (70.3%)
605 (29.4%) 0.74 0.65, 0.85 2.3x10⁻⁵
Magnesium
(mg/day§)
375.6 (335.4, 418.3) 390.2 (344.6, 334.3) 0.81 0.73, 0.90 3.8x10⁻⁵
Protein (g/day) 100.3 (89.9, 111.0) 102.1 (91.3, 113.1) 0.90 0.83, 0.97 0.01
Starch (g/day) 165.6 (145.5, 184.1) 163.7 (141.7, 184.9) 1.09 1.02, 1.16 0.01
Flavanones
(mg/day)
20.2 (8.5, 39.1) 20.9 (6.7, 41.2) 1.08 1.0, 1.15 0.02
ω3PUFAs
(g/day)
2.2 (1.8, 2.7) 2.3 (1.8, 2.8) 0.92 0.86, 0.99 0.02
Fibre (g/day) 20.5 (17.1, 24.4) 21.3 (17.6, 25.4) 1.12 1.02, 1.24 0.02
Iodine (µg/day**) 188.6 (149.8, 237.7) 191.4 (149.8, 243.5) 1.09 1.02, 1.17 0.02
Quercetin
(mg/day)
16.9 (10.9, 22.1) 17.6 (11.4, 22.1) 0.93 0.88, 0.99 0.03
Copper (mg/day) 1.5 (1.3, 1.7) 1.6 (1.4, 1.8) 0.93 0.86, 1.00 0.06
Physical activity
(h/week††
)
0.0 (0.0, 2.0) 0.0 (0.0, 3.0) 0.94 0.87, 1.01 0.07
Alcohol (g/day) 7.7 (1.7, 18.3) 8.4 (1.9, 19.9) 1.06 0.99, 1.14 0.07
* McFadden’s pseudo R2 for model: 0.096
† MJ/day: 1000 Joules/day
‡ g/day: grams/day
§ mg/day: milligrams/day
** µg/day: micrograms/day
†† h/week: hours/week

Chapter eight Results: Overall and stepwise regression analysis
333
Table 99 Set 2: Backward stepwise regression built model* using the quartile form of the
continuous variables (Whole sample)
Included
variables
Number (%) or median (IQR) OR 95% CI p-value
Cases Controls
Family history
Low
Medium/high
1610 (82.9%)
333 (17.1%)
2695 (98.9%)
30 (1.1%) 19.61 13.21, 29.13 3.3x10-49
Dietary energy
(MJ/day†)
10.5 (8.4, 13.1) 9.9 (8.1, 12.5) 1.17 1.10, 1.24 4.6x10
-7
NSAIDs
No
Yes
3206 (66.3%)
1605 (33.2%)
1449 (70.3%)
605 (29.4%) 0.74 0.65, 0.85 2.4x10⁻⁵
Cholesterol
(g/day‡)
367.2
(306.7, 438.3)
358.3
(290.2, 424.6)
1.15 1.08, 1.24 6.4x10⁻⁵
Magnesium
(mg/day§)
375.6
(335.4, 418.3)
390.2
(344.6, 334.3)
0.84 0.76, 0.92 0.0002
tMUFAs (g/day) 2.7 (2.2, 3.2) 2.6 (2.1, 3.2) 1.17 1.06, 1.29 0.002
Zinc (mg/day) 11.7 (10.4, 13.2) 12.1 (10.6, 13.5) 0.89 0.83, 0.96 0.002
Flavanones
(mg/day)
20.2 (8.5, 39.1) 20.9 (6.7, 41.2) 1.12 1.03, 1.21 0.004
Fibre (g/day) 20.5 (17.1, 24.4) 21.3 (17.6, 25.4) 1.15 1.05, 1.26 0.004
ω3PUFAs (g/day) 2.2 (1.8, 2.7) 2.3 (1.8, 2.8) 0.91 0.86, 0.97 0.005
Quercetin
(mg/day)
16.9 (10.9, 22.1) 17.6 (11.4, 22.1) 0.93 0.87, 0.98 0.01
tFAs (g/day) 3.6 (3.0, 4.3) 3.5 (2.8, 4.2) 0.88 0.80, 0.97 0.01
Vitamin C
(mg/day)
111.2
(78.8, 147.8)
117.6
(83.0, 161.4)
0.91 0.83, 1.00 0.05
Physical activity
(h/week**)
0.0 (0.0, 2.0) 0.0 (0.0, 3.0) 0.93 0.87, 1.00 0.07
* McFadden’s pseudo R2 for model: 0.096
† MJ/day: 1000 Joules/day
‡ g/day: grams/day
§ mg/day: milligrams/day
** h/week: hours/week

Chapter eight Results: Overall and stepwise regression analysis
334
8.3.3 Set 3: Demographic factors, lifestyle variables, foods
and nutrients
The explanatory factors that were included in set 3 were the demographic risk factors
(age, sex, family history and deprivation score), the lifestyle variables (smoking,
alcohol, BMI, physical activity, dietary energy, NSAIDs and HRT for the female
analysis), the foods (breads, cereals, milk, cream, cheese, eggs, poultry, red meat,
processed meat, white fish, oily fish, potatoes/ pasta/ rice, fruit, vegetables, savoury,
sweets, tea, coffee, fruit/ vegetable juice, fizzy drinks) and the nutrients (SFAs,
MUFAs, ω6PUFAs, ω3PUFAs, tFAs, tMUFAs, quercetin, catechin, epicatechin,
flavones, procyanidins, flavanones, phytoestrogens, protein, cholesterol, sugars,
starch, fibre, sodium, potassium, calcium, magnesium, phosphorus, iron, copper,
zinc, manganese, selenium, iodine, vitamin A, carotenes, vitamin D, vitamin E,
vitamin B1, vitamin B2, niacin, vitamin B6, vitamin B12, folate, pantothenic acid,
biotin, vitamin C) (82 risk factors in total). Chloride and potential niacin intakes were
excluded from the stepwise regression, since they were very highly correlated with
other nutrients (r>0.95). Forward and backward stepwise regression was applied in
the whole sample and separately for males and females.
8.3.3.1 Whole sample (Set 3)
Findings from the original sample
Forward stepwise regression using the quartile form of the continuous variables
resulted in a model including the following 19 risk factors: family history (p=3.6x10-
50), sweets (p=1.1x10⁻⁶), eggs (p=3.9x10⁻⁶), fruit/ vegetable juice (p=3.9x10⁻⁶),
NSAIDs (p=6.4x10⁻⁶
), magnesium (p=1.6x10⁻⁵
), white fish (p=5.4x10⁻⁵
), dietary
energy (p=0.0001), tMUFAs (p=0.0005), fibre (p=0.001), alcohol (p=0.003),
quercetin (p=0.003), coffee (p=0.01), cereals (p=0.02), ω3PUFAs (p=0.02), tFAs
(p=0.02), iron (p=0.04), breads (p=0.07) and physical activity (p=0.08) (Table 100).
The risk factors family history, tMUFAs, fibre, sweets, eggs, fruit/ vegetable juice,
white fish, dietary energy, alcohol, cereals and breads were associated with an
increased colorectal cancer risk, whereas NSAIDs, magnesium, tFAs, quercetin, iron,
ω3PUFAs, coffee and physical activity were associated with a decreased risk (Table
100).
Backward stepwise regression using the quartile form of the continuous variables
resulted in a model including the following 21 risk factors: family history (p=3.1x10-

Chapter eight Results: Overall and stepwise regression analysis
335
50), fruit/ vegetable juice (p=1.3x10
-6), sweets (p=1.5x10
-6), eggs (p=3.4x10
-6),
NSAIDs (p=6.1x10⁻⁶), magnesium (p=6.1x10⁻⁵), white fish (p=0.0001), fibre
(p=0.0003), tMUFAs (p=0.001), dietary energy (p=0.002), quercetin (p=0.002),
alcohol (p=0.003), coffee (p=0.01), cereals (p=0.02), ω3PUFAs (p=0.02), tFAs
(p=0.02), iron (p=0.02), physical activity (p=0.08), breads (p=0.10), vitamin C
(p=0.10) and flavones (p=0.10) (Table 101). The risk factors family history, fibre,
fruit/ vegetable juice, tMUFAs, sweets, eggs, white fish, dietary energy, alcohol,
cereals, flavones and breads were associated with an increased colorectal cancer risk,
whereas NSAIDs, magnesium, tFAs, quercetin, iron, ω3PUFAs, coffee, vitamin C
and physical activity were associated with a decreased risk (Table 101).
In summary, forward and backward stepwise regression using the quartile form of
the continuous variables resulted in almost identical models, with the common
variables being family history, sweets, eggs, fruit/ vegetable juice, NSAIDs,
magnesium, white fish, dietary energy, tMUFAs, fibre, alcohol, quercetin, coffee,
cereals, ω3PUFAs, tFAs, iron, breads and physical activity (Table 100, Table 101).
Findings from the 100 bootstrap samples
The main findings after applying forward and backward stepwise regression to the
100 bootstrap samples were:
- Forward stepwise regression applied to 100 bootstrap samples resulted in 100
unique regression models (i.e. all 100 models were chosen only once).
- Backward stepwise regression applied to 100 bootstrap samples resulted also in
100 unique regression models.
- Over the 100 bootstrap samples, the variables selected by backward selection
were identical to those selected by forward selection in five of the bootstrap
samples. For 17 bootstrap samples the agreement between the variables selected
by backward and forward selection was over 90%, whereas for the remaining 78
bootstrap samples the agreement was between 58% and 89% (mean percentage of
agreement (SD): 83.12% (9.38%)).
- Forward and backward stepwise regression resulted in a final model with 15-34
variables (mean (SD): 25.34 (3.87), median (IQR): 25 (23, 28)) and 19-39
variables (mean (SD): 29.43 (4.17), median (IQR): 30 (27, 32)) respectively in
the 100 samples. Furthermore, the distribution of the number of variables in the
resultant models was close to normal, with the mean of the included variables in

Chapter eight Results: Overall and stepwise regression analysis
336
backward regression models to be significantly larger than the mean of the
included variables in forward regression models (t-test p-value: <5x10⁻⁵)
- Only the variable family history was selected to be included in built models of all
100 bootstrap samples using either forward or backward stepwise regression. The
variables fruit/ vegetable juice, and NSAIDs were selected to be included in more
than 99% of the built models of the 100 bootstrap samples using either of the two
methods (with the fruit/ vegetable juice variable being included in 100% of the
backward stepwise regression models). For forward stepwise regression models,
the variables energy, sweets, white fish and eggs were selected to be included in
97-98% of the built models, whereas for backward stepwise regression models,
the variables sweets, white fish, energy, fibre and eggs were selected to be
included in 91-99% of the built models, respectively. Finally, the remaining 64
variables were selected in <90% of the bootstrap samples using either selection
method.
8.3.3.2 Females (Set 3)
Findings from the original sample
Forward stepwise regression using the quartile form of the continuous variables
resulted in a model including the following 14 risk factors: family history (p=1.0x10-
25), fruit/ vegetable juice (p=2.7x10⁻⁵), tMUFAs (p=0.0005), white fish (p=0.002),
NSAIDs (p=0.002), fibre (p=0.003), sweets (p=0.005), biotin (p=0.007), niacin
(p=0.02), tFAs (p=0.03), vitamin C (p=0.04), cholesterol (p=0.04), vegetables
(p=0.09) and HRT (p=0.09) (data not shown). Backward stepwise regression using
the quartile form of the continuous variables resulted in a model including the
following 13 risk factors: family history (p=5.6x10⁻²⁶
), tMUFAs (p=4.1x10⁻⁶
), fruit/
vegetable juice (p=1.7x10⁻⁵), sweets (p=0.001), white fish (p=0.001), NSAIDs
(p=0.002), fibre (p=0.004), vitamin C (p=0.005), ω3PUFAs (p=0.02), magnesium
(p=0.03), tFAs (p=0.04), coffee (p=0.06) and tea (p=0.06) (data not shown).
In summary, forward and backward stepwise regression using the quartile form of
the continuous variables resulted in similar models, with the common variables being
family history, fruit/ vegetable juice, tMUFAs, white fish, NSAIDs, fibre, sweets
tFAs and vitamin C (data not shown).
8.3.3.3 Males (Set 3)
Findings from the original sample

Chapter eight Results: Overall and stepwise regression analysis
337
Forward stepwise regression using the quartile form of the continuous variables
resulted in a model including the following 17 risk factors: family history (p=7.8x10-
25), dietary energy (p=9.3x10⁻⁹), eggs (p=2.5x10⁻⁶), sweets (p=6.9x10⁻⁵), magnesium
(p=0.003), fruit/ vegetable juice (p=0.003), sugars (p=0.003), NSAIDs (p=0.006),
white fish (p=0.02), fruit (p=0.02), MUFAs (p=0.04), cereals (p=0.04), vitamin D
(p=0.05), quercetin (p=0.06), manganese (p=0.06), coffee (p=0.08) and physical
activity (p=0.09) (data not shown). Backward stepwise regression using the quartile
form of the continuous variables resulted in a model including the following 19 risk
factors: family history (p=3.0x10⁻²⁵
), dietary energy (p=5.4x10⁻⁹
), eggs (p=3.8x10⁻⁶
),
sweets (p=5.3x10⁻⁵
), manganese (p=0.0001), fruit/ vegetable juice (p=0.005),
NSAIDs (p=0.009), phosphorus (p=0.01), white fish (p=0.01), MUFAs (p=0.02),
sugars (p=0.02), vitamin C (p=0.02), copper (p=0.06), fibre (p=0.04), coffee
(p=0.06), fruit (p=0.08), physical activity (p=0.09), cheese (p=0.09) and flavanones
(p=0.10) (data not shown).
In summary, forward and backward stepwise regression using the quartile form of
the continuous variables resulted in similar models, with the common variables being
family history, dietary energy, eggs, sweets, fruit/ vegetable juice, sugars, NSAIDs,
white fish, fruit, MUFAs, manganese, coffee and physical activity (data not shown).
8.3.3.4 Summary (Set 3)
Original sample
Briefly, the variables of set 3 that were included in all six resultant models after
application of forward and backward stepwise regression in the whole, female and
male samples were: family history (p-value range: 3.1x10-50
to 7.8x10⁻²⁵
), NSAIDs
(p-value range: 6.1x10⁻⁶
to 0.009), white fish (p-value range: 5.4x10⁻⁵
to 0.02),
sweets (p-value range: 1.1x10⁻⁵ to 0.005) and fruit/ vegetable juice (p-value range:
1.3x10⁻⁶ to 0.005), whereas coffee (p-value range: 0.01 to 0.08) and fibre (p-value
range: 0.0003 to 0.01) were included in five of the six resultant models (Table 100,
Table 101). In contrast, the variables dietary energy intake (p-value range: 5.4x10⁻⁹
to 0.002) and physical activity (p-value range: 0.08 to 0.09) were included only in the
models derived from the whole and male samples (Table 100, Table 101) and the
variables fruit (p-value range: 0.02 to 0.08), MUFA intake (p-value range: 0.02 to
0.04), sugar intake (p-value range: 0.003 to 0.02) and manganese intake (p-value
range: 0.0001 to 0.06) were included only in the models derived from the male

Chapter eight Results: Overall and stepwise regression analysis
338
sample (data not shown). Regarding the direction of the associations, the risk factors
family history, white fish, sweets, fruit/ vegetable juice, fibre, dietary energy and
fruit were associated with an increased colorectal cancer risk, whereas NSAIDs,
coffee, physical activity, sugars, manganese and MUFAs were associated with a
decreased risk (Table 100, Table 101). A matrix of the selected variables of the set 2
after applying forward and backward stepwise regression in the whole, female and
male samples is presented in Table 102 (in the end of the chapter).
Bootstrap samples
Results from the bootstrap method (whole sample) showed that all 100 resultant
models after applying forward stepwise regression were chosen only once and the
same after applying backward stepwise regression. Within the same bootstrap sample
application of either forward or backward stepwise regression resulted in the same
model in only five cases. The number of the included variables ranged from 15 to 34
for forward and from 19 to 39 for backward stepwise regression (p-value of
difference of number of variables selected from forward and backward stepwise
regression: <5x10⁻⁵
) (data not shown). In addition, only the variable family history
was selected to be included in the models derived either from forward or backward
stepwise regression in all 100 bootstrap samples (data not shown). Furthermore, the
variables fruit/ vegetable juice, NSAIDs, dietary energy, sweets, white fish, eggs and
fibre were included in more than 90% of the built models (data not shown). These
results are in accordance with the findings of the analysis of the original sample,
which suggested that the risk factors of set 3 more strongly associated with colorectal
cancer were family history, NSAIDs, white fish, sweets, fruit/ vegetable juice, coffee
and fibre (Table 100, Table 101).

Chapter eight Results: Overall and stepwise regression analysis
339
Table 100 Set 3: Forward stepwise regression built model* using the quartile form of the
continuous variables
Included
variables
Number (%) or median (IQR) OR 95% CI p-value
Cases Controls
Family history
Low
Medium/high
1610 (82.9%)
333 (17.1%)
2695 (98.9%)
30 (1.1%) 20.59 13.83, 30.65 3.6x10-50
Sweets† (m/day
‡) 4.3 (2.9, 6.0) 4.6 (3.1, 6.3) 1.17 1.10, 1.25 1.1x10
-6
Eggs (m/day) 0.5 (0.2, 0.7) 0.4 (0.2, 0.6) 1.15 1.09, 1.23 3.9x10⁻⁶
fruit/ vegetable juice
(m/day)
0.9 (0.2, 1.6) 0.8 (0.1, 1.4) 1.15 1.08, 1.22 3.9x10⁻⁶
NSAIDs
No
Yes
3206 (66.3%)
1605 (33.2%)
1449 (70.3%)
605 (29.4%) 0.73 0.63, 0.83 6.4x10⁻⁶
Magnesium
(mg/day§)
375.6 (335.4, 418.3) 390.2 (344.6, 334.3) 0.81 0.74, 0.89 1.6x10⁻⁵
White fish (m/day) 0.3 (0.2, 0.5) 0.3 (0.1, 0.5) 1.14 1.07, 1.21 5.4x10⁻⁵
Dietary energy
(MJ/day**)
10.5 (8.4, 13.1) 9.9 (8.1, 12.5) 1.13 1.06, 1.21 0.0001
tMUFAs (g/day††
) 2.7 (2.2, 3.2) 2.6 (2.1, 3.2) 1.19 1.08, 1.32 0.0005
Fibre (g/day) 20.5 (17.1, 24.4) 21.3 (17.6, 25.4) 1.18 1.07, 1.30 0.001
Alcohol (g/day) 7.7 (1.7, 18.3) 8.4 (1.9, 19.9) 1.11 1.04, 1.20 0.003
Quercetin (mg/day) 16.9 (10.9, 22.1) 17.6 (11.4, 22.1) 0.90 0.85, 0.96 0.003
Coffee (m/day) 1.0 (0.0, 2.4) 1.0 (0.1, 3.0) 0.92 0.86, 0.98 0.01
Cereals (m/day) 1.0 (0.5, 1.6) 1.1 (0.4, 1.8) 1.08 1.01, 1.16 0.02
ω3PUFAs (g/day) 2.2 (1.8, 2.7) 2.3 (1.8, 2.8) 0.92 0.86, 0.98 0.02
tFAs (g/day) 3.6 (3.0, 4.3) 3.5 (2.8, 4.2) 0.89 0.81, 0.98 0.02
Iron (mg/day) 15.1 (13.3, 16.9) 15.4 (13.7, 17.3) 0.91 0.83, 1.00 0.04
Breads (m/day) 2.7 (1.9, 3.6) 2.6 (1.8, 3.6) 1.06 1.00, 1.13 0.07
Physical activity
(h/week‡‡)
0.0 (0.0, 2.0) 0.0 (0.0, 3.0) 0.94 0.87, 1.01 0.08
* McFadden’s pseudo R2 for model: 0.108
† Summary variable of puddings and deserts; chocolates, sweets, nuts and crisps; biscuits; and cakes
‡ m/day: measures/day
§ mg/day: milligrams/day
** MJ/day: 1000 Joules/day
†† g/day: grams/day
‡‡ h/week: hours/week

Chapter eight Results: Overall and stepwise regression analysis
340
Table 101 Set 3: Backward stepwise regression built model* using the quartile form of the
continuous variables
Included
variables
Number (%) or median (IQR) OR 95% CI p-value
Cases Controls
Family history
Low
Medium/high
1610 (82.9%)
333 (17.1%)
2695 (98.9%)
30 (1.1%) 20.67 13.88, 30.78 3.1x10-50
fruit/ vegetable juice
(m/day†)
0.9 (0.2, 1.6) 0.8 (0.1, 1.4) 1.18 1.10, 1.26 1.3x10⁻⁶
Sweets‡ (m/day) 4.3 (2.9, 6.0) 4.6 (3.1, 6.3) 1.17 1.10, 1.25 1.5x10
-6
Eggs (m/day) 0.5 (0.2, 0.7) 0.4 (0.2, 0.6) 1.16 1.09, 1.23 3.4x10⁻⁶
NSAIDs
No
Yes
3206 (66.3%)
1605 (33.2%)
1449 (70.3%)
605 (29.4%) 0.72 0.63, 0.83 6.1x10⁻⁶
Magnesium (mg/day§) 375.6 (335.4, 418.3) 390.2 (344.6, 334.3) 0.82 0.75, 0.90 6.1x10
-5
White fish (m/day) 0.3 (0.2, 0.5) 0.3 (0.1, 0.5) 1.13 1.06, 1.20 0.0001
Fibre (g/day**) 20.5 (17.1, 24.4) 21.3 (17.6, 25.4) 1.22 1.09, 1.35 0.0003
tMUFAs (g/day) 2.7 (2.2, 3.2) 2.6 (2.1, 3.2) 1.18 1.07, 1.30 0.001
Dietary energy
(MJ/day ††
)
10.5 (8.4, 13.1) 9.9 (8.1, 12.5) 1.11 1.04, 1.19 0.002
Quercetin (mg/day) 16.9 (10.9, 22.1) 17.6 (11.4, 22.1) 0.90 0.84, 0.96 0.002
Alcohol (g/day) 7.7 (1.7, 18.3) 8.4 (1.9, 19.9) 1.11 1.04, 1.19 0.003
Coffee (m/day) 1.0 (0.0, 2.4) 1.0 (0.1, 3.0) 0.92 0.86, 0.98 0.01
Cereals (m/day) 1.0 (0.5, 1.6) 1.1 (0.4, 1.8) 1.09 1.01, 1.16 0.02
ω3PUFAs (g/day) 2.2 (1.8, 2.7) 2.3 (1.8, 2.8) 0.92 0.87, 0.99 0.02
tFAs (g/day) 3.6 (3.0, 4.3) 3.5 (2.8, 4.2) 0.89 0.81, 0.98 0.02
Iron (mg/day) 15.1 (13.3, 16.9) 15.4 (13.7, 17.3) 0.90 0.82, 0.98 0.02
Physical activity
(h/week‡‡
)
0.0 (0.0, 2.0) 0.0 (0.0, 3.0) 0.94 0.87, 1.01 0.08
Breads (m/day) 2.7 (1.9, 3.6) 2.6 (1.8, 3.6) 1.06 0.99, 1.12 0.09
Vitamin C (mg/day) 111.2 (78.8, 147.8) 117.6 (83.0, 161.4) 0.93 0.85, 1.01 0.10
Flavones (mg/day) 1.0 (0.5, 1.8) 1.0 (0.5, 1.8) 1.06 0.99, 1.13 0.10
* McFadden’s pseudo R2 for model: 0.109
† m/d: measures/day
‡ Summary variable of puddings and deserts; chocolates, sweets, nuts and crisps; biscuits; and cakes
§ mg/day: milligrams/day
** g/day: grams/day
†† MJ/day: 1000 Joules/day
‡‡ h/week: hours/week

Chapter eight Results: Overall and stepwise regression analysis
341
Table 102 Matrix of the variables included in the three sets and finally selected into the forward or backward
stepwise regression models in the whole sample and after sex stratification (original sample)
Variables Set 1 Set 2 Set 3
Whole
sample
Female
sample
Male
sample
Whole
sample
Female
sample
Male
sample
Whole
sample
Female
sample
Male
sample
F B F B F B F B F B F B F B F B F B
Demographic
Sex
Age x x x
Family history x x x x x x x x x x x x x x x x x x
Deprivation score
Lifestyle
BMI
Dietary energy x x x x x x x x x x x x
Smoking
Alcohol x x x
Physical activity x x x x x x x x x x
NSAIDs x x x x x x x x x x x x x x x x x x
HRT x x x x
Foods
Breads x x x x
Cereals x x
Milk
Cream
Cheese x
Eggs x x x x x x x x x
Poultry
Red meat
Processed meat
White fish x x x x x x x x x x
Oily fish x x x
Potatoes/
Pasta/ Rice
Fruit x x
Vegetables x x x x x x
Savoury x x
Sweets x x x x x x x x x x x x
Tea x x x x x
Coffee x x x x x x x x x
fruit/ vegetable juice x x x x x x x x x x x x
Fizzy drinks
Nutrients
SFAs
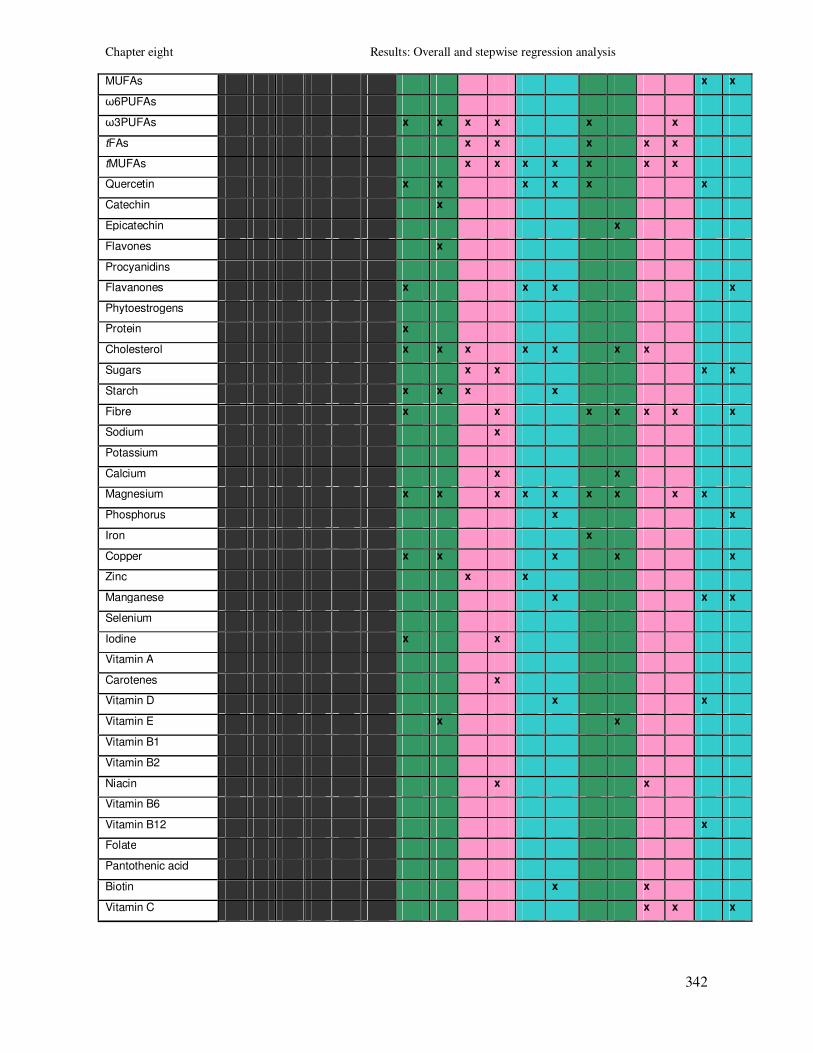
Chapter eight Results: Overall and stepwise regression analysis
342
MUFAs x x
ω6PUFAs
ω3PUFAs x x x x x x
tFAs x x x x x
tMUFAs x x x x x x x
Quercetin x x x x x x
Catechin x
Epicatechin x
Flavones x
Procyanidins
Flavanones x x x x
Phytoestrogens
Protein x
Cholesterol x x x x x x x
Sugars x x x x
Starch x x x x
Fibre x x x x x x x
Sodium x
Potassium
Calcium x x
Magnesium x x x x x x x x x
Phosphorus x x
Iron x
Copper x x x x x
Zinc x x
Manganese x x x
Selenium
Iodine x x
Vitamin A
Carotenes x
Vitamin D x x
Vitamin E x x
Vitamin B1
Vitamin B2
Niacin x x
Vitamin B6
Vitamin B12 x
Folate
Pantothenic acid
Biotin x x
Vitamin C x x x

Chapter eight Results: Overall and stepwise regression analysis
343
8.4 Summary of results of chapter 8
In this chapter the overall and stepwise regression analysis of the study was
presented. The explanatory variables that were investigated in the overall analysis
and included in the stepwise regression models consisted of demographic factors,
lifestyle variables, food variables and nutrients. The overall analysis was conducted
for the quartile, standardised and continuous forms of the continuous variables.
Finally stepwise regression analysis was conducted for the quartile form of the
continuous variables in the whole sample and then separately for men and women.
8.4.1 Overall analysis
In the overall analysis of the study, distributions and correlations of all the
explanatory variables, as well as univariable logistic regression of colorectal cancer
on each explanatory variable were investigated.
The risk factors that were significantly associated with colorectal cancer, according
to the results of the univariable logistic regression were: 1) the demographic and
lifestyle factors: family history of cancer, NSAIDs intake, dietary energy intake,
HRT intake and physical activity (Table 96); 2) the food group variables: vegetables,
eggs, sweets, fruit/ vegetable juice, oily fish, coffee, fruit, savoury foods and white
fish (Table 96); and 3) the nutrient variables: tMUFAs, ω3PUFAs, SFAs, tFAs and
MUFAs (fatty acids); quercetin, catechin and phytoestrogen (flavonoids);
cholesterol, fibre, protein and starch (macronutrients); magnesium, potassium,
manganese, copper, iron, zinc, phosphorus, selenium (minerals); niacin, vitamin B6,
carotenes, vitamin C, vitamin A, potential niacin, biotin, folate, pantothenic acid,
vitamin D, vitamin B1 and vitamin B12 (vitamins) (Table 96).
8.4.2 Stepwise regression analysis
8.4.2.1 Original sample
Forward and backward stepwise regression models were applied in three different
sets of variables using the quartile form of the continuous variables in the whole
sample (Tables 97-101) and after sex stratification (data not shown). In Table 102, a
matrix of the variables included in the three different sets and finally selected into the
forward or backward stepwise regression models for the whole, female and male
sample is presented. The variables that were included in 100% of the models derived

Chapter eight Results: Overall and stepwise regression analysis
344
from the whole, female and male analysis of all three sets were: family history,
NSAIDs, sweets and fruit/ vegetable juice. The following variables were included in
models derived from the female sample, but not in models derived from the male
samples: tFAs (100% of the models), vegetables (75%), ω3PUFAs (75%), HRT
(67%), breads (50%) and niacin (50%). In addition, the following variables were
included in models derived from the male sample, but not in models derived from the
female sample: dietary energy intake (100% of models), physical activity (83%),
quercetin (75%), flavanones (75%), manganese (75%), fruit (50%), savoury (50%),
MUFAs (50%), phosphorus (50%), copper (50%) and vitamin D (50%) (Table 102).
8.4.2.2 Bootstrap samples
The bootstrap method was applied to investigate the stability of the models and it
was applied for forward and backward stepwise regression of all three sets of
variables (whole sample). In particular, 100 bootstrap samples were randomly drawn
from the original sample. Then, each bootstrap sample was used to apply forward
and backward stepwise regression for each set of variables (set 1, 2 and 3).
According to the findings of this analysis, all 100 models derived after forward
stepwise regression were chosen once (for all sets of variables), and the same was
observed for the 100 models derived after applying backward stepwise regression.
The agreement between the models derived from forward and backward stepwise
regression within the same bootstrap sample was high for the analysis of the set 1
variables (mean percentage of agreement (SD): 96.97% (4.56%)), whereas it was
lower for the analysis of the set 2 and set 3 variables (mean percentage of agreement
(SD): 84.36% (9.08%), 83.12% (9.38%); respectively). Furthermore, the number of
variables that were selected to be included in the models of the 100 bootstrap
samples was smaller for the set 1 analysis (11-20 variables), than for the set 2 and set
3 analysis (10-31 and 15-39 variables respectively) (data not shown). In addition, for
set 1, 2 and 3, more variables were selected to be included in models derived from
backward stepwise regression (mean number of selected variables (SD): 22.54
(6.37)) than in models derived from forward stepwise regression (mean number of
selected variables (SD): 20.02 (5.15)). Finally, the variables that were selected to be
included in models for the majority of the bootstrap samples (more than 90%) were:
1) family history, NSAIDs and dietary energy, if we consider all three sets of

Chapter eight Results: Overall and stepwise regression analysis
345
variables; 2) family history, NSAIDs, dietary energy, eggs, sweets, fruit/ vegetable
juice and white fish, if we consider set 1 and set 3; and 3) family history, NSAIDs
and dietary energy, if we consider set 2 and 3 (data not shown).

Chapter nine Discussion
346
9 DISCUSSION
9.1 Introduction
In the first three chapters of this thesis background information regarding colorectal
cancer and its main risk factors was given and the aims and objectives of the current
thesis were presented. In chapter four, all the aspects regarding the design of the study
this thesis was based on and the applied analytical methods were described. Finally, in
the four following chapters the results of the dietary analysis of the SOCCS study were
presented, with the most important findings being summarised in the end of each
chapter.
In this chapter, which is divided in three parts, the main issues of this thesis will be
described. In the first part of the discussion, issues regarding the methodological and
analytical aspects of this thesis will be presented. In particular, the strengths and
limitations of the study design and of the employed analytical methods will be addressed
and evaluated. In the second part of the study the most important findings and principal
results of the analysis will be discussed and compared with findings from previous
published studies. Finally, in the last part of the discussion, the main conclusions that are
drawn from this thesis as well as suggestions for future research will be presented.
9.2 Methodological and analytical issues
In this part of the chapter the following issues will be presented and discussed: 1)
epidemiological issues, including description of the main study designs of observational
analytical epidemiology together with their main advantages and disadvantages (bias
and confounding); 2) nutritional issues, including methods of diet assessment, diet
validation and energy adjustment; and 3) analytical issues including study power
calculations (for the matched and the unmatched datasets), methods of multiple testing
correction and issues regarding the stepwise regression and bootstrap sampling methods.
The main strengths and limitations of the current study regarding the above
methodological and analytical issues will also be summarised and discussed.

Chapter nine Discussion
347
9.2.1 Epidemiological issues
Epidemiological studies are used in order to investigate the distribution and the main
determinants of a particular disease in different populations. They are divided in
experimental (like randomised clinical trials) and observational studies. Observational
studies can then further divided according to whether the unit of the study is a
population (ecological studies) or an individual (descriptive: case series; analytical:
cross-sectional, case-control, cohort studies).
Large cohort studies of diet and colorectal cancer
Some of the main cohort studies that have investigated associations between specific
nutrients, food items or food groups and colorectal cancer, include:
1) Cohort studies conducted in the USA and Canada:
- Women’s Health Study (USA): 37,547 female participants
- New York’s University Health Study (USA): 14,727 female participants
- Iowa’s Women’s Health Study (USA): 32,215 female participants
- Nurses' Health Study (USA): 87,733 female participants
- Health Professionals Follow-up Study (USA): 47,949 male participants
- Physicians' Health Study (USA): 22,071 male participants
- NHANES I Epidemiologic Follow-up Study (USA): 14,407 male and female
participants
- Multiethnic cohort study (USA): 191,011 male and female participants
- Cancer Prevention Study II Nutrition (USA): 127,749 male and female participants
- Breast Cancer Detection Demonstration Project (USA): 45,354 female participants
- Canadian National Breast Screening Study (Canada): 5,629 female participants
2) Cohort studies conducted in Europe:
- European Prospective Investigation into Cancer and Nutrition (Denmark, France,
Germany, Greece, Italy, The Netherlands, Norway, Spain, Sweden and the United
Kingdom): 520,000 male and female participants
- Netherlands Cohort Study (The Netherlands): 120,852 male and female participants
- Finnish Mobile Clinic Health Examination Survey (Finland): 9,959 male and female
participants

Chapter nine Discussion
348
- Alpha-Tocopherol, Beta-Carotene Cancer Prevention Study (Finland): 27,111 male
participants
- Swedish Mammography Cohort Study (Sweden): 61,433 female participants
- Cohort of Swedish Men (Sweden): 45,306 male participants
- Cohort Study in Norway (Norway): 50,535 male and female participants
3) Cohort studies conducted in Asia:
- Japan Public Health Centre-based Study (Japan): 95,376 male and female
participants
- Shanghai Women's Health Study (Shanghai): 73,314 female participants
Large case-control studies of diet and colorectal cancer
Some of the main and largest case-control studies that have investigated associations
between specific nutrients, food items or food groups and colorectal cancer, include:
1) Case-control studies conducted in the USA and Canada:
- Ontario Familial Colon Cancer Registry (Canada): 2,985 male and female
participants
- A population-based case-control study of colon cancer conducted in Northern
California, Utah, and the 'Twin Cities' area of Minnesota (USA): 4,403 male and
female participants
- Oahu (Hawaii) case-control study (USA): 2,384 male and female participants
- A population-based case-control study in Massachusetts (USA): 2,394 male and
female participants
- A population-based case-control study of rectal cancer conducted in Northern
California and Utah (USA): 1,730 male and female participants
- North Carolina Colon Cancer Study (USA): 1,609 male and female participants
2) Case-control studies conducted in Europe:
- Scottish Colorectal Cancer Study (current study; Scotland): 4,837 male and female
participants
- A multi-centre Italian study (Italy): 6,107 male and female participants
3) Case-control studies conducted in Asia and Australia:
- Fukuoka Colorectal Cancer Study (Japan): 1,575 male and female participants

Chapter nine Discussion
349
- Hospital-based Epidemiologic Research Program at Aichi Cancer Centre (Japan):
2,535 male and female participants
- Melbourne Colorectal Cancer Study (Australia): 1,442 male and female participants
9.2.1.1 Strengths and limitations of the current study
(epidemiological issues)
Strengths
Case and control selection
One of the main strengths of this colorectal cancer study is its careful design regarding
the selection and recruitment of the study participants (cases and controls). A careful
recruitment strategy both for cases and controls was developed, which involved the set
up of a firm recruitment protocol covering all the main steps of the participant’s study
entry.
In particular, regarding case recruitment, strict criteria were applied in order to avoid
misclassification bias and only incident cases of colorectal adenocarcinoma were
included in the study. In addition, correct diagnosis was ensured by careful examination
of the pathological reports and was histologically confirmed. An attempt was made to
keep the time between diagnosis and recruitment short by developing a recruiting
network of well-trained nurses, by placing recruitment staff in hospitals and by
establishing close cooperation with clinical staff. From data provided from the Scottish
Cancer Registry, we were able to calculate that the median time between date of
recruitment and date of cancer diagnosis (incidence) was 150 days. Incidence date was
reported as the date of the first pathology report for the particular colorectal cancer and
often pre-dates the date of hospital admission. We also compared basic information on
age, gender and place of residence of the cases included in our study with data
aggregated over a five year period (1999-2003) from the Scottish Cancer Registry. There
was a slight over-representation of male cases but the distribution among the 15 boards
of Scotland was similar to that from the Cancer Registry.
Controls were randomly selected from the CHI, which is a national register of all
individuals who are registered with a GP in Scotland and represents an ideal sampling
frame for the selection of population based controls (95% completeness). In addition,

Chapter nine Discussion
350
controls were closely matched to cases by age, sex, and area of residence. In particular,
strict matching criteria were applied and selected controls were individually matched to
cases according to sex, age (+/- 1 year) and health board area. The main advantages of a
matched case-control study are that cases and controls are more comparable, that
confounding from the matched factors is accounted for and usually study precision and
power is increased.
Confounding factors selection
An attempt was made to minimise the confounding effect by careful selection of the
confounding factors, which were chosen according to findings of previous studies. In
particular, we chose to adjust the observed associations (of the four hypotheses of the
first part of the thesis) for the following factors: family history of cancer, BMI, physical
activity (hours of cycling and of doing other sport activities per week; proxy of total
leisure physical activity), smoking (never and ever smokers), energy intake, fibre intake
(energy adjusted), alcohol intake (energy adjusted) and NSAIDs intake. In addition, age,
sex, deprivation score (proxy of the social-economic status) were included as
confounding factors in the analysis of the unmatched dataset, but not in the analysis of
the matched dataset, since age, sex and health board area were the matching risk factors.
Univariable analysis of the confounding factors showed that the following factors were
not statistically significant with colorectal cancer in our study population: for the
matched dataset BMI (p=0.38) and smoking (p=0.51) (Table 63) and for the unmatched
dataset sex (p=0.85), deprivation score (p=0.94), BMI (p=0.42) and smoking (p=0.63)
(Table 79). The selection of the confounding factors was made prior to any analyses and
therefore even the factors that were found not to be significantly associated with
colorectal cancer were included in the multivariable analyses. However, results from
multivariable regression analysis models that did not include BMI and smoking
(matched analysis) and sex, deprivation score, BMI and smoking (unmatched analysis)
were similar to the ones that included these confounding factors.
Limitations
Case and control selection

Chapter nine Discussion
351
It is inevitable that this study, despite close cooperation with clinical staff, was unable to
recruit patients who died soon after diagnosis or who were seriously ill at presentation or
in the post-operative period. There is, therefore, an under-representation of cases that
were very ill at time of presentation to hospital, which might affect the external validity
of the study. In addition, there might be a possibility that early stage of disease may be
due to more frequent screening of more health conscious cases, which also had a
healthier lifestyle. We were not given ethical approval to collect data from the
participants that refused or were not able to be included in the study and therefore we
cannot identify whether there are any significant differences. Regarding the matching
procedure, even if 2,062 cases and 2,776 controls had complete and valid FFQ and LCQ
data and could be included in the analysis, for some cases no controls that fulfilled all
the matching criteria were identified. Therefore when the fine matching was kept, 573
cases and 1,287 controls needed to be excluded from the analysis (1,489 matched pairs
were included in the matched analysis).
Despite the careful design of this case-control study, many cases and controls refused to
take part in the study and participation rates were 52% for cases and 39% for controls.
Participation rates for both cases and controls differ according to area of residence and
age. In particular, subjects from the Health Boards of Grampian, Highland and Lothian
were more likely to participate, whereas subjects from Greater Glasgow Health Board
were less likely to participate (Table 33, Table 35). In addition, both cases and controls
that refused to participate were significantly older than the ones that agreed to participate
(p<5x10⁻⁵
) (Table 33, Table 35), which is in accordance with findings from other
population-based case-control studies suggesting that younger individuals are more
likely to participate (277;278). Furthermore, participation rates in our study differ
according to disease status with fewer controls having agreed to participate than cases
(39% vs. 52%). This is a common problem of population-based case-control studies,
with other case-control studies also reporting lower participation rates for controls than
for cases (277-279). The difference in participation rates between cases and controls
might be due to the fact that cases are more eager than population controls to take part in
a study that investigates their disease. Therefore in our case, the controls that agreed to

Chapter nine Discussion
352
participate might have had a healthier diet and lifestyle and therefore were more eager to
participate in a case-control study asking about their lifestyle choices and dietary habits
(participation bias). This fact is also supported by the lower participation rates of
controls with high deprivation (deprivation scores of 6 and 7; Table 35).
A direct comparison of participation rates in our study and similar population-based
case-control studies may not be straight forward mainly due to not
reporting or
inconsistently reporting of participation rates from case-control studies (280). In
particular, a recent review demonstrated that more than 50% of published case-control
studies failed to report any information regarding participation rates (280). Generally, it
has been observed, that participation rates of population-based case-control studies
conducted after 1990 were considerably lower than those of studies conducted between
1970 and 1990 (280). Although the exact reasons for this decline are not fully
understood, possible explanations include changes in study design and in methods of
recruitment, as well as differences in social and lifestyle factors (280). An additional
explanation might be that many recent case-control studies include collection of
biological specimens, such as blood (like in our study), which may also have an effect
on participation rates (280). Median participation rates of 34 population-based case-
control studies conducted from January 1 to April 30, 2003 and published in 10 high
impact epidemiology, public health and medical journals was 84% (range: 44%-99%)
for cases and 74% (range: 41%-88%) for controls (280). In addition, participation rates
of a large population-based case-control study of colon cancer conducted in USA were
approximately 76% and 64% for cases and controls, respectively (278). Therefore
participation rates of both cases and controls in our study were lower than the
aforementioned, with one possible explanation being that collection of biological
specimens was required. In addition, lower participation rates in controls might be due to
the recruitment procedure. In particular, eligible controls were contacted only via mail
by their GPs, since we did not have ethical approval to contact them directly by phone. It
has been shown that population-based case-control studies that use letters as the only
contact mode have lower participation rates (279). In addition, in case of no reply, we
had ethical approval to contact GPs or controls only once more. It has been suggested

Chapter nine Discussion
353
though that in order to obtain high control participation rates a number of contacts as
high as 14 may be required (281). Given these lower than usual participation rates for
both cases and controls of our study, participation bias cannot be ruled out and therefore
results should be interpreted with caution.
An alternative case-control design that tends to overcome the low participation problem
is the hospital-based case-control study, where controls are selected from hospitals
(patients with a disease other than the one under investigation). Hospital-based case-
control studies have usually higher participation rates than the population-based ones
and in some cases they can be as high as 95% (282). Median participation rates of 33
hospital-based case-control studies conducted from January 1 to April 30, 2003 and
published in 10 high impact epidemiology, public health and medical journals was 92%
(range: 74%-99%) for cases and 86% (range: 60%-99%) for controls (280). In addition,
participation rate of a large hospital-based multi-centre case-control study of colorectal
cancer conducted in Italy was approximately 96% for both cases and controls (282).
However, the hospital based design is usually not preferred, mainly because hospital
controls may have a condition that is also influenced by the risk factor under
investigation or because they may come from different populations, which will affect the
representativeness of the case-control study.
Finally, when no ideal control group is identified, then a possible strategy is to have
more than one control groups (i.e. one hospital-based and one population-based) and
compare results obtained from different control groups.
Bias and confounding
Since cases were aware of their disease status when completed the questionnaires, it is
likely that they recalled their dietary and lifestyle habits differently than controls (recall
bias). In addition, completion rates in cases were lower than completion rate in controls
(65.7% vs. 83.9%), which is likely to be due to cases being re-admitted to hospital or
otherwise too ill to fully cooperate in the study.
Regarding confounding, we tried to minimise the confounding effects by measuring and
adjusting for the majority of the potential confounding factors. However, the possibility
of residual confounding due to not controlling for unknown or unmeasured confounding

Chapter nine Discussion
354
factors or due to measurement errors of the accounted confounding factors can not be
ruled out.
9.2.2 Nutritional epidemiology issues
Nutritional epidemiology is based on the application of experimental or observational
epidemiological studies in order to investigate the effects of particular nutrients, food
items or food groups on a disease. Even if randomised clinical trials are considered as
the gold standard in order relationships between nutritional factors and diseases to be
established, there are many cases where only observational studies can be applied (283).
In the following sections issues regarding diet assessment, validation and energu
adjustment methods of the observational studies will be presented and discussed. Weight
will be given to the description of the FFQ, since this was the diet assessment method
used in the current study.
9.2.2.1 Diet assessment
The main diet assessment methods are Diet Recalls, Food Records, Diet Histories and
FFQs. Diet Recalls and Food Records methods are based on recording the foods that are
consumed by the individual at one or more days, whereas Diet Histories and FFQs are
used in order to measure long-term dietary intakes.
Diet Recalls and Food Records
Diet Recalls are usually based on a 24-hour level and are normally conducted by a
trained interviewer. The interviewer asks the participant about the foods and drinks that
he/ she consumed during the previous day as well as details about the used food
preparation methods. This method is relatively quick, but it relies on the short term
memory abilities of each individual. On the other hand, Food Records are based on the
recording of consumed foods and drinks at the actual time of the consumption.
Therefore, this method does not rely on the individual’s memory abilities, but it requires
more time and effort than the Diet Recall method. The main advantages of these two
methods are that they can be used in order to estimate absolute intakes of foods, energy,
macro- and micro-nutrients and that due to the fact that they contain open-ended
questions they can be very specific regarding the consumed food types and the food
preparation methods. The main disadvantage of these methods is that they do not capture

Chapter nine Discussion
355
the usual dietary habits of the individuals, unless multiple recalls or records are to be
collected, which is not an efficient process for large epidemiological studies due to the
effort and cost that are required (283).
Diet Histories and Food Frequency Questionnaires
The main characteristic of the Diet History is that it captures quantitative information
about the individual’s usual diet using a fixed food item list, but information regarding
frequencies and portions are obtained from the individual. Whereas the first Diet History
developed by Burke in 1947 was menu-based, the most recent ones are initially list-
based and then the individual reports frequencies and portion of only the foods that he/
she usually consumes (284).
Food frequency questionnaire, which is the most widely used diet assessment method,
measures long-term dietary intakes like Diet History, but their main difference is that in
addition to the fixed food list it also has a fixed frequency. FFQs can be administered by
interview (personal or by telephone) or they can be completed by the study participants
(self-administered). The food list section of the FFQs can be long or short depending on
the purpose of the study and the hypothesis that is to be tested, but generally a
comprehensive assessment of the diet by including a wide range of foods and drinks is
preferred. In addition, the food-list should consist of foods that are relevant to the usual
diet of the particular population that the study results will be applied to. The frequency
section usually has a multiple-choice format and the individuals can choose how often
they consume the reported food item (never, once a month, two days per week, etc.).
Finally, the portion section is optional and when portion information is recorded (semi-
quantitative FFQ) the individuals report how often they consume a specific portion of
the food item (rather than reporting how often they consume a food item). For some
food items that come in natural portions (such as milk or bread) adding portions is
straightforward and also sometimes adds clarity. For food items that do not come in
natural portions (such as meat or rice) a typical portion can be specified and subjects are
expected to double the frequency of consumption when their usual portion is twice the
specified one. However, that practice might introduce bias if not all the participants
adjust the consumption frequency according to their usual portion (283;284).

Chapter nine Discussion
356
The FFQ method is relatively easy (even when the FFQ is self-administered), fully
computerised, inexpensive and quick making it one of the most popular ways to assess
the usual and long-term dietary intakes, especially for studies that include large numbers
of study participants. However, there are limitations of the FFQ method, with one of
them being that the derived quantitative estimates of the food and nutrient intakes cannot
be used as absolute intakes and should only be used to rank individuals into categories
(e.g. quartiles of intakes). In addition, the participants are required to report their usual
intakes of generally more than 100 different foods for a specific past period of time. This
task, which relies on the memory abilities of each individual, might be complex for
some participants (especially ones with particular disabilities or of an advanced age).
Finally, since the FFQ has a certain list of foods, a particular questionnaire can not be
applied in different populations or different times and therefore results from studies
using different FFQs are not always comparable (285).
Nutrient assessment
The immediate outcome of all the diet assessment methods is data about the food group
and item intakes. However, many hypotheses are about the investigation of the
associations between intakes of particular nutrients and disease. In order to convert food
intakes to nutrient intakes, a nutrient database and an analysis programme are necessary.
Regarding the conversion of foods measured by an FFQ in nutrients, if portion sizes
have been specified (semi-quantitative FFQ), the nutrient values can be estimated
according to that portion sizes. However, if no portion sizes have been specified, then a
typical or average portion size is used in order to estimate the nutrient intakes. Finally,
for open-ended questions, specific data for each reported response need to be obtained
(283).
The nutrient databases used by nutritional observational studies are normally nationally
based. For the estimation of total energy and the main macro- and micro-nutrients the
most commonly used database in the UK is the McCance and Widdowson's
Composition of Foods (5th Edition plus related supplements). For specific nutrients
(such as flavonoids, specific fatty acids, etc.) supplementary nutrient databases need to
be used. For example for estimating flavonoid intakes a flavonoid composition database

Chapter nine Discussion
357
containing entries from fruit, vegetables, beverages, jams, chocolate and herbs was
developed in Scotland and was used for estimating flavonoid intakes in the current study
(274).
Measurement error at diet assessment
When assessing diet two types of measurement error can occur: random or systematic.
When assessing diet by using either Diet Recalls or Food Records, within-person
random errors reflect the day-to-day variations in dietary intakes and they can usually be
accounted for and corrected by using two or more dietary measurements for each
participant. On the other hand, when assessing diet by using either Diet Histories or
FFQs, within-person random errors can occur due to true changes of diet over time,
which is particularly important for a disease that has a long latent period (e.g. cancer).
To be more specific, usually cases of a case-control study are asked to complete an FFQ
for a reference period of approximately a year prior to their diagnosis. However, their
dietary habits for even up to 10 years prior to their diagnosis might have affected
initiation and progression of a disease with a long latent period, and therefore true
changes (that are not captured by the FFQ) within this 10 year period can lead to
measurement errors. Within-person systematic errors mainly occur when a participant
deliberately over- or under-reported the intake of a particular food (when Diet Recalls or
Food Records are used) or when an important food for one or more participants (but not
for others) has been omitted from the fixed food list of a Diet History or an FFQ.
Between-person random error happens when for example there is a random over-
reporting of a food item from some participants and a random under-reporting of the
same food item from some other participants. In that case, the mean of the intake of the
food item will be correct, but there will be an over-estimation of the standard deviation.
Finally, between-person systematic error occurs when the over- or under-reporting is not
random and some examples are the omission of an important food item from the FFQ,
inaccurate compositional databases, or under- or over reporting according to the disease
status in a case-control study (recall bias). Usually random errors (both within- and
between-persons) tend to attenuate the relationships between nutrients and disease.
However, effects of systematic errors on observed associations are generally

Chapter nine Discussion
358
unpredictable and can bias the results of a study. Measurement errors when assessing
diet with an FFQ can be derived by the fixed food list, by the memory abilities of the
participants and by wrong interpretation of the food portions (for a semi-quantitative
FFQ) (283;286).
9.2.2.2 Diet validation
As we described in the previous sections each diet assessment method has specific
strengths and limitations. Whichever method is chosen, validation of its performance in
assessing dietary intakes is required. In the following chapter, we will discuss about
reproducibility and validity methods of the FFQ.
Reproducibility
Reproducibility of a questionnaire is estimated by administering the same questionnaire
to a specific number of participants in two or more different occasions and then
examining the consistency of the measurements. The interval between the two different
administrations should be neither too short, since then participants will probably
remember their previous responses, nor too long, since true changes in dietary habits
may decrease the questionnaire’s reproducibility. Finally, whereas a questionnaire with
low reproducibility should not be considered as a valid method of assessing long-term
diet, a questionnaire with high reproducibility does not necessarily mean that is a diet
assessment method of high validity (283).
Reproducibility is also a way to account for the random measurement errors. For
categorical variables, it is usually addressed by calculating the kappa or the weighed
kappa statistic, which is equivalent to the measurement of the proportion of agreement
between the measurements in the two different time points. For continuous variables,
reproducibility is usually estimated by calculating the interclass correlation coefficient,
which represents the reliability of a measurement (286).
Validity
On the other hand the relative validity of a questionnaire is estimated by comparing
nutrient intakes measured by the FFQ with intakes measured using another diet
assessment method (external standard method). It is preferred to use a method that its
limitations (errors) are of different type than the errors produced by the FFQ. Usually,
Chapter nine Discussion
359
the validation method that is used for an FFQ is diet assessment by Food Records, since
these two methods have different types of limitations (FFQ: fixed food, frequency and
portion questions, rely on memory, rely on the way a question is interpreted vs. Food
Records: open-ended questions, do not rely on memory, no questions). However, in
order to represent average dietary intakes, multiple Food Records need to be obtained. In
addition, 24-hour Diet Recalls can be used to validate FFQs. Even though, these two
methods share similar sources of measurement errors (both depend on memory),
validation using Diet Recalls might be the only option in cases of illiterate or less
motivated participants (283).
Alternatively, an FFQ can be validated by comparing nutrient intakes estimated by the
FFQ with measurements of an appropriate biomarker of the particular nutrient. The
advantage of this validation method is that FFQ and biomarker errors are not correlated
and therefore spurious validation results can be avoided. However, there are specific
limitations of applying this validation method. In particular, usually biomarker levels of
a particular nutrient do not depend only on dietary intakes, but also on other lifestyle
choices, physiological characteristics and genetic variants. In addition, biomarker
measurements are subject to laboratory and technical errors as well as to daily dietary
intake variations. Generally, the effect of these limitations is to attenuate the correlations
between the questionnaire and biomarker measurements, a fact that should be accounted
for at the interpretation of the results. Finally, appropriate biomarkers are only available
for a few specific nutrients and therefore, by applying this validation method intakes of
several nutrients can not be validated (283).
Validation studies are usually conducted in a subset of the study population and the
usual size of the subset lies between 100 and 200 individuals. The two main methods
that are used to assess the validity of the FFQ are calculation of the Pearson correlation
coefficient (for normally distributed variables) and the Spearman rank correlation
coefficient (for not normally distributed variables) between the FFQ and the validation
method measurements. Alternatively, the kappa and weighed kappa statistics can be
calculated in order to measure misclassification when measurements of both methods are
divided into different intake categories. It has been suggested that: 1) correlations of 0.5-

Chapter nine Discussion
360
0.7 between the FFQ and the validation method’s measurements, 2) more than 50% of
subjects classified in the correct category (tertile, quartile, etc.) and less than 10% of
subjects classified into a wrong category (tertile, quartile, etc.) and 3) weighed kappa
values above 0.4 indicate that the FFQ has the ability to correctly rank individuals
according to their dietary intakes (270).
9.2.2.3 Energy adjustment
Analysis of nutritional observational studies require controlling for dietary energy intake
in order to ensure that observed associations are not due to a higher or lower total energy
intake between cases and controls. This requirement is more important when energy
intake is highly correlated with both the nutrient under investigation and the disease. The
main energy-adjustment methods are: the residual energy adjustment method, the
standard multivariable method, the energy partition method, the nutrient density method
and the multivariable nutrient density method.
Residual energy adjustment method
This method is based on the regression of the nutrient on total energy intake and then
inclusion of the residuals of this regression in the model with disease as the dependent
variable. This method has been thought to be an equivalent of a study that examines the
effect of particular nutrients by keeping total energy intake constant. In the case that
total energy intake is also an important and recognised risk factor of the disease, it has
been suggested that total energy intake should also be included in the disease-model (as
a co-variable together with the nutrient residuals variable).
Standard multivariable method
The standard multivariable method is based on the inclusion of total energy and the
nutrient intakes in the same model. The residual energy adjustment method and the
standard multivariable method give usually similar coefficients for the association
between the nutrient and the disease. However, the main difference between these two
models is about the interpretation of the coefficient of the total energy intake term. In the
residual method the coefficient of this term represents the association between energy
intake and the disease, whereas in the multivariable method the coefficient represents the

Chapter nine Discussion
361
association between energy intake from other nutrients than the one under examination
and disease.
Energy partition method
For the partition method of energy adjustment, energy intake from the nutrient under
investigation and energy intake from other sources are entered in the model separately.
Using this method, the association between the particular nutrient and the disease are
protected from the confounding effect of energy intake from other sources. However,
any observed association might be due to the energy contribution of the nutrient on the
total energy intake. Another limitation of this method is that it can not be directly
applied for nutrients that do not contribute to total energy intake.
Nutrient density methods
The simple nutrient density method is based on directly dividing the nutrient intakes
with total energy intake. This is a convenient method that provides simplicity and
practicality, especially when somebody needs to describe food or diets in a comparable
way. However, this method does not protect from the confounding effect of total energy.
In particular when energy intake is associated with the disease, then nutrient densities
(nutrient/ total energy) tend to be associated with disease in the opposite way to total
energy. On the other hand, if energy intake is not associated with the disease and it is
only weakly correlated with the nutrient intakes, then by dividing nutrient intakes with
total energy, variation might be added in the nutrient densities. Increased variation will
be added to the nutrient densities, also when energy intake is measured inaccurately. A
way to use the nutrient densities, without having to deal with the limitations mentioned
above, is to include together total energy and nutrient densities as covariables in a model
with disease as dependent variable (Multivariable nutrient density method).
9.2.2.4 Strengths and limitations of the current study (issues
regarding collection of nutritional, lifestyle and other data)
Strengths
Diet assessment, nutrient assessment and diet validation
To assess dietary intakes in the current study a semi-quantitative FFQ listing 150 food
items was employed (Scottish Collaborative Group FFQ, Version 6.41), which also

Chapter nine Discussion
362
included images of portion sizes and careful instructions in order to improve accuracy of
diet reporting. In addition, this questionnaire was developed for studies of diet and
health in Scotland containing the vast majority of food items that are frequently
consumed from the Scottish population.
Further more, the nutrient databases that were used for estimating nutrient intakes were
of UK (McCance and Widdowson's Composition of Foods) or Scottish level (flavonoid
database). In addition, for some nutrients (e.g. specific fatty acids), food preparation and
method of cooking (e.g. frying, grilling, oven-baking etc) could affect the amount of
nutrient that was actually ingested. It is worth saying therefore that foods on this
questionnaire were grouped with consideration of their fat content and method of
cooking (e.g. oven chips are separate from home-cooked chips, and grilled fish is
separate from fried fish). Furthermore, for foods which were home-cooked, the oil used
for nutrient calculations was the one that was listed by the subject, whereas for foods
cooked outside home an average of commonly-used fats was assumed. For bread, the
spread(s) listed by the subject were used, taking into consideration the thickness of the
spread (a scrape, a thin layer or a thick layer) as selected by the subject, with the aid of a
colour photograph illustrating a thin layer.
Relative validity of the current FFQ was also assessed by comparing its nutrient intakes
(total energy, main macro- and micro-nutrients and flavonoid subgroups) with those
obtained from 4-day weighed Diet Records, in a sample of 41 men (mean age 36 years
old) and 40 women (mean age 33 years old) (270;271).
Energy adjustment
We tried to minimise the confounding effect of total energy by carefully adjusting each
nutrient intakes using the residual method. The alternative standard energy adjustment
method was used for nutrients that were not normally distributed (even after
transformation), since linear regression (first step of residual energy adjustment)
between the nutrient (dependent variable) and total energy (independent variable) could
not be applied.
Lifestyle and cancer questionnaire
Chapter nine Discussion
363
Regarding the Lifestyle and Cancer Questionnaire, it was made up from questions from
other standard questionnaires and we sought to employ validated instruments, where
possible. In particular, the questions about physical exercise derived from the short
version of the EPIC questionnaire. Reproducibility and relative validity of this
questionnaire were checked in two different studies and it was found that although this
physical activity index is not suitable for estimating energy expenditure at an absolute
level, it can successfully rank participants according to their activity and cardio-
respiratory fitness (287;288). Regarding other parts of the Lifestyle and Cancer
Questionnaire, the questions about Women’s reproduction history came from the Million
Women Study’s Questionnaire and the Employment section was based on the Census
2001 questions.
Limitations
We attempted to limit the common problems of nutritional epidemiology by adopting
identical study procedures in cases and controls, use of validated questionnaires, use of
images of portion sizes, use of careful instructions to improve accuracy of reporting diet
and lifestyle habits and adoption of a recall period one year before diagnosis or
recruitment date to reduce recall bias. However, recognised limitations of case-control
studies employing questionnaires including recall bias, misclassification bias due to
imprecise measurements (random measurement errors) and residual confounding after
attempts to control for confounders might have affected the current study.
Diet assessment, nutrient assessment and diet validation
Variation due to random measurement error tends to attenuate the true associations
between the risk factor and colorectal cancer risk, a bias called regression dilution. In
order to account for regression dilution bias, dietary and other measurements should be
obtained more than once for at least a subsample of the study sample. Interclass
correlation coefficients between measurements can then be used to adjust the regression
coefficients. In our study, dietary measurements were obtained only once for the
majority of the study participants, whereas we obtained a second measurement of the
diet for 44 population controls. The size of the subsample with duplicate dietary data
was not large enough to accurately estimate the size of random measurement error and

Chapter nine Discussion
364
to check the reproducibility of the questionnaire. Given the available resources, we were
not able to collect duplicate data for more population controls and therefore we were not
able to correct the regression coefficients for the effect of regression dilution bias.
However, this type of error would have probably led to reporting underestimated rather
than biased associations.
Regarding the FFQ validation studies, we cannot be sure of the exact validity of the
estimate of nutrient intakes in our age group as the validity study was carried out in
younger subjects (270). Furthermore, results of validation of this FFQ for ranking
individuals according to specific fatty acid intakes were not available at the time that
analysis of this thesis was conducted.
Energy adjustment
Regarding confounding, although adjusting for energy by using the residual method
should have reduced the confounding effect of total energy, probably it would not
eliminate it, since measurements of both energy and the nutrient would be subject to
measurement error. On the other hand, for nutrients highly correlated with total energy
intake, such as fatty acid intakes, the application of the residual adjustment method
could have led to over-adjustment and this could have masked significant associations
between these nutrients and colorectal cancer. In order to investigate this further,
associations between colorectal cancer and intakes of subgroup and individual fatty
acids obtained from multivariable logistic regression models (model III) using different
energy adjustment methods were compared (residual, standard, simple nutrient density
and multivariable nutrient density methods). Models using either method of energy
adjustment produced similar findings, with high intakes of ω3PUFAs, EPA and DHA
being associated with a statistically significant and dose-dependent decreased colorectal
cancer risk. However, associations derived from models using the multivariable nutrient
density method were slightly stronger with lower p-values. The only difference between
findings after applying different energy adjustment methods was for stearic acid intakes.
In particular, high intakes of stearic acid were found to be significantly and dose-
dependently associated with an increased colorectal cancer risk, when applying the
residual, the standard and the simple nutrient density methods, but not when applying

Chapter nine Discussion
365
the multivariable nutrient density method. Regarding the other fatty acid subgroups and
individual compounds, there were no differences in the observed associations no matter
what energy adjustment method was used.
Lifestyle and cancer questionnaire
Regarding the Lifestyle and Cancer questionnaire, measurements were also obtained
only once and therefore random measurement errors due to within-subject variation
could not be estimated and reproducibility of the questionnaire was not measured. In
addition, a limitation of the occupational part of the physical activity questionnaire was
that it was designed for younger individuals than the participants of the current study
with no proper separation for retired and unemployed individuals. Therefore, the retired
participants of our study were misclassified as unemployed and their occupational
physical activity was not reported (48% of the cases and 47% of the controls were
classified as unemployed; Table 42). In order, to account for this limitation, we decided
not to use data on occupational physical activity and use a physical activity measurement
based only on leisure time activities. In addition, in order to reduce the number of
individuals that should be omitted due to missing data, we chose to use information only
for two leisure time activities: cycling and other physical exercise. It has been suggested,
that higher-intensity physical activities are reported with greater accuracy (288) and
therefore we believe that this limited physical activity measurement will be an
acceptable approximation of the general physical activity status of the study participants
for the purposes of providing a rank distribution of physical activity in the study sample.
9.2.3 Issues on applied analytical methods
In this section, we will briefly describe the main issues about the applied analytical
methods and the way they could have influenced the results of the current thesis. In
particular, issues regarding the power of the study (matched and unmatched dataset), the
effect of multiple testing and the stepwise regression methods will be presented.
9.2.3.1 Power calculation
Power, sample size and hypothesis tests
“The power of a test is equal to the probability that a study of a given sample size can
detect an effect size of a particular magnitude as statistically significant” (definition

Chapter nine Discussion
366
taken from (289)). In order to calculate the power of a test we need to know the level of
significance (α, usually 0.05), the size of the study and the size of the effect that we want
to detect. The power calculation can be carried out either a priori (during the design
stage of the study) or post hoc (after the end of the study). A priori power analysis is
usually preferable, since it determines from the beginning the scale of effect sizes the
particular study can detect. Post hoc power analysis is usually conducted in order to
explain the inability of a particular study to detect statistically significant results. The
power of a test can be increased by: 1) increasing the sample size, 2) increasing the
significance level (i.e. from α=0.05 to 0.10), 3) aiming to detect larger effect sizes and 4)
decreasing the measurement error (and therefore decreasing the standard deviations)
(286).
Power calculations of the current study (matched and unmatched
datasets)
As it has been already described, in the end of the study 2,062 cases and 2,776 controls
had complete and valid FFQ and LCQ data and could be included in the analysis
(unmatched dataset). However, for some cases no controls that fulfilled all the matching
criteria were identified. Therefore, when the fine matching was kept 573 cases needed to
be excluded from the analysis, leaving the matched dataset with 1,489 cases and 1,489
controls.
Power calculations were conducted using the software NQuery Advisors (version 6.0).
The formulas that the power calculations were based on are presented in Appendix V.
The matched dataset of 1,489 pairs of cases and controls had a 97% power to detect an
effect size of 0.1 per SD at a significance level of 0.05 (paired 2-sided t-test). On the
other hand the unmatched dataset (2,062 cases and 2,776 controls) had a 93% power to
detect an effect size of 0.1 per SD at a significance level of 0.05 (student’s 2-sided t-
test). In addition, power calculations for weak, moderate and strong effect sizes
(measured by the OR) showed that the matched dataset of 1,489 pairs of cases and
controls had 44%, 78% and more than 99% power to detect ORs of 0.93, 0.85 and 0.43,
respectively (McNemar’s chi-square test). On the other hand, the unmatched dataset of

Chapter nine Discussion
367
2,062 cases and 2,776 controls had 27%, 78% and more than 99% power to detect ORs
of 0.93, 0.85 and 0.43, respectively (normal chi-square test).
Therefore, according to the above calculations, the matched analysis had slightly greater
power to detect weaker associations, whereas both the matched and unmatched dataset
had the same power to detect moderate and strong associations. Even if a study with a
44% power is not considered as sufficiently powered to detect a particular effect size, we
decided to use the matched dataset for the analysis of the first two hypotheses
(flavonoids and fatty acids), in case the associations between these novel dietary risk
factors and colorectal cancer were weak. For the analysis of the additional risk factors
(folate, vitamin B2, vitamin B6, vitamin B12, alcohol, vitamin D and calcium), where
we expected slightly larger ORs we chose to use the unmatched dataset. The main
reason for this choice was that we wished to include all cases with environmental and
genetic data, since for the additional hypotheses specific gene-environment interactions
as well as stratified analyses according to genotypes of particular SNPs were selected to
be investigated.
9.2.3.2 Multiple testing
Multiple testing methods
The possibility of finding significant results by chance increases, when in a single
dataset multiple tests are performed (Type I error). Therefore it is necessary to correct
the p-value significance level according to the number of performed tests. Different
types of multiple testing correction have been developed and they can be roughly
divided in the traditional methods and a more recent alternative one, known as the False
Discovery Rate (FDR) method (290).
Bonferroni correction and similar methods
The Bonferroni method is the most simple though the most conservative method and it is
based on setting a new level of significance by dividing the initial p-value level (α,
usually 0.05) with the total number of tests performed (new p-value threshold = α/n,
where n is the total number of performed tests). The null hypotheses are then rejected
according to the new significance level. Similar methods based on the Bonferroni

Chapter nine Discussion
368
method have been developed, which tend to be less conservative (e.g. the Holm’s
method, the Hochberg’s method) (290).
False discovery rate
A quite different and far less conservative approach was introduced by Benjamini and
Hochberg in 1995. The method was based on the fact that false positive results will
occur in every study, but they tried to develop a method that identifies false positives
without failing to reject false null hypotheses. This method is a three-step procedure,
with the first step being the ascending ranking of the k observed p-values. The adjusted
level of significance is then calculated separately for each p-value according to the
formula: α*i/k, with i=1, 2, 3, …, k (the ranking position of the unadjusted p-value).
Finally, each null hypothesis, for which corresponding unadjusted p-value is smaller
than the new individual significance level, is rejected (290;291).
Multiple testing corrections in the current study
Part 1 of the study (aim 1, hypotheses 1-4): Bonferroni correction and FDR
For the first part (aim 1, hypotheses 1-4) of the current study, we corrected the observed
p-values for multiple testing using the Bonferroni correction in three different ways.
Initially, the p-values were corrected according to the number of the performed
independent tests (of the current and previous hypotheses). In particular, for the analysis
of the first hypothesis (flavonoids), p-values were corrected for six independent tests
(new level of significance 0.008); for the analysis of the second hypothesis (fatty acids)
p-values were corrected for 14 independent tests (new level of significance 0.004); for
the analysis of the third hypothesis (folate, vitamin B2, vitamin B6, vitamin B12 and
alcohol) p-values were corrected for 19 independent tests (new level of significance
0.003); and finally for the analysis of the fourth hypothesis (vitamin D and calcium) p-
values were corrected for 21 independent tests (new level of significance 0.002).
The second way that was used in order to account for multiple testing was by adjusting
the p-values according to the number of tests conducted in each hypothesis (using both
the Bonferroni correction and the less conservative FDR method). In particular, for
hypothesis 1, we corrected the flavonoid subgroup p-values for 30 tests and the
individual flavonoid p-values for 25 tests. For hypothesis 2, we corrected the fatty acid

Chapter nine Discussion
369
subgroup p-values for 39 tests and the individual fatty acid p-values for 45 tests. For
hypothesis 3, we corrected the observed p-values for 15 tests and finally, for hypothesis
4, we corrected the observed p-values for eight tests.
Finally, the third way that we used in order to correct for the number of performed tests
was to correct for the total number of tests performed in all four hypotheses, applying
both the Bonferroni and the FDR method. In the subgroup level, we corrected for 69
independent tests, whereas in the individual nutrient level we corrected for 93 tests.
Part 2 of the study (aim 2, overall and stepwise regression analysis)
The purpose of the overall and stepwise analysis was not to draw any specific
conclusions about the strength of the associations between the risk factors and colorectal
cancer. Instead, the purpose was to identify risk factors that seemed to be associated
with the disease in order to generate new hypotheses, which could be then properly
checked in other prospective or retrospective studies. Therefore, we thought that we
would not need to correct for multiple testing, but we would take care to interpret these
present findings appropriately within this context.
9.2.3.3 Stepwise regression
Forward and backward stepwise regression
The simplest data-driven model building approach is the forward stepwise regression. In
this approach, variables are added to the model one at a time, and at each step each
variable that is not already included in the model is tested for inclusion. The most
significant of these variables is added to the model, as long as its p-value is below some
pre-set significance level. Thus the first variable to be included in the model is the one
that was the most significant in the initial analysis. The procedure of adding variables
continues until all the variables are added in the model or none of the remaining
variables has a p-value below the pre-set level when added to the model (292).
However, forward stepwise regression has drawbacks, including the fact that each
addition of a new variable may render one or more of the already included variables
non-significant or that one variable might be significantly associated with the outcome
only when a group of other variables is also in the model. An alternative approach,
which avoids these limitations, is backward stepwise regression. Under this approach, all

Chapter nine Discussion
370
the variables of interest are fitted in the model and the least significant variable is
dropped, as long as it is not significant at our chosen pre-set significance level. Reduced
models are successively re-fitted and the same rule is applied until all remaining
variables are statistically significant. Backward stepwise regression has also drawbacks.
For instance, variables that may be dropped could have been significant if added to the
final reduced model. In addition, backward stepwise regression should not be used when
the sample size is small considering the number of independent variables that are
included or when there might be issues of multicollinearity. Since in backward stepwise
regression all variables are included in the initial model, an unstable initial model (either
due to small sample size or multicollinearity) might produce spurious results (292).
In general both forward and backward stepwise regression methods are not used in cases
when there is a clear hypothesis with already selected confounding factors. In contrast,
they are mainly used in two other research settings: 1) To predict the likelihood of a
particular outcome using several explanatory variables, when the predictive accuracy of
the constructed model is more important than the risk factors that were chosen to be
entered in the model; 2) To construct regression models that generate new hypotheses
(explanatory analysis), which can then be tested as prior hypotheses in future studies
(293). However, the models that derive from stepwise regression will possibly contain
either variables, for which associations with the outcome are genuine or variables that
have wrongly been identified as significant risk factors of the outcome (false positives).
Therefore, to draw specific conclusions and to avoid reporting spurious findings, it is
necessary to investigate the accuracy of the models, which are produced, either by
comparing the final model with other models reported in the literature or by validating it
in an independent dataset (293).
Bootstrap sampling method
An alternative method to explore the stability of the selected model is to apply the
bootstrap sampling method. A bootstrap sample is a sample of the same size as the
original sample chosen with replacement. Thus, a given subject in the original sample
may occur multiple times, only once, or not at all in a specific bootstrap sample. This
method is commonly used to estimate the sampling distribution of a particular test

Chapter nine Discussion
371
statistic. In 2004, Austin and Tu proposed to use bootstrap sampling in order to evaluate
the models produced by either forward or backward stepwise regression, by estimating
the likelihood that a candidate variable is indeed an independent risk factor for a
particular outcome (294).
Application of stepwise regression and bootstrap sampling method in the
current study
In the current study we applied forward and backward stepwise regression models in
three different sets of variables in the whole sample and after sex stratification, in order
to investigate which of the explanatory factors were more strongly associated with
colorectal cancer. All three sets included the main demographic and lifestyle variables.
In addition, set 1 included food variables, set 2 included nutrient variables and set 3
included both food and nutrient variables. However, as already mentioned the goal of
this part of the study was not to draw any specific conclusions about the risk factors
identified, but instead to generate new hypotheses that could be studied in more detail in
future observational studies.
Having identified the instability and general limitations of the stepwise regression
models, we tested the reproducibility of the selected models by applying the bootstrap
sampling method in the whole sample. One hundred bootstrap samples were selected
and on each one forward and backward stepwise regression models were applied.
Findings of the above analysis will be discussed in detail below.
Usually, when the bootstrap sampling method is employed, at least 1,000 to 10,000
bootstrap samples are produced. Therefore, the number of 100 bootstrap samples that
was used in the current study is possibly not large enough to draw any specific
conclusions about the stability of the selected models. However, the computing power
and available time, when this thesis was conducted, did not allow us to perform this
analysis in a larger number of samples. For future purpose and beyond the scope of the
current PhD study we are planning to write a specific programme to perform the
bootstrap sampling analysis in 1,000 to 10,000 samples.

Chapter nine Discussion
372
9.3 Main findings
In this part of this chapter the main findings of the hypothesis driven analysis as well as
of the overall and stepwise regression analysis will be discussed. In addition, results of
the current study will be presented in relation to previous findings of other studies.
9.3.1 Main findings of part 1: Hypothesis driven analysis
9.3.1.1 Introduction
In this part of the chapter the main results of the matched analysis of the novel dietary
risk factors (flavonoid and fatty acid subgroups and individual compounds) that
comprised the first two hypotheses, and the main results of the unmatched analysis of
the additional dietary risk factors (folate, vitamin B2, vitamin B6, vitamin B12, alcohol,
vitamin D and calcium) that comprised the last two hypotheses, will be presented and
discussed.
In addition, results of this study will be compared with findings from previous studies in
order to investigate the current causal evidence for each particular nutrient. As it has
been suggested by Hill (295), to draw causal conclusions for a particular risk factor, nine
criteria should be fulfilled that are related to:
1) Consistency of association across populations, study designs and statistical methods;
2) Strength of association (with a 20% change in risk to be considered as a positive
association and a more than 40% change to be considered as a strong association);
3) Dose response (with greater amounts of a substance giving more protection/ risk and
less amounts less protection/ risk);
4) Biological plausibility (i.e. existence of a plausible biological mechanism that
explains an observed association; evidence usually collected from animal, in vitro and
clinical studies);
5) Temporality (with the exposure to the risk factor preceding the onset of the disease);
6) Experimentation (i.e. evidence from randomised clinical trials);
7) Analogy (i.e. similar associations to be observed for similar diseases);
8) Specificity (i.e. the particular risk factor raises the risk of the particular disease and
not generally of any disease);

Chapter nine Discussion
373
9) Coherence (i.e. the possibility of causation of one risk factor is in accordance with
other known facts).
However, in nutritional epidemiology a subset of the above criteria (consistency,
strength, dose response, biological plausibility and temporality) is usually used in order
to form specific nutrition recommendations and to draw causal conclusions. In addition,
failure to fulfil a particular criterion does not always reflects to a lack of an association
(296). In particular, lack of consistency might be due to different levels of intakes across
the studies or due to noncomparability of the dietary assessment methods. Weak
associations might be due to attenuation of true stronger effects by measurement errors.
Lack of dose response might be due to lack of variation of intake or due to a threshold
effect. Biological plausibility can not be always ascertained especially for novel dietary
factors or for diseases that are not well described. Finally, temporality is sometimes
difficult to be established. For cohort studies exposure assessment precedes the
diagnosis, but it is possible that disease was already present when long latency diseases
(e.g. cancer) are investigated. On the other hand, in case-control studies diagnosis
precedes exposure assessment and therefore cases and controls are asked to report their
dietary habits for a specific time period before diagnosis. However, for diseases of long
latency, this time period might not be long enough. If evidence for the association
between a particular dietary factor and a disease is in conflict with all five criteria, then
public recommendation and causal conclusions for this dietary factor are not suggested.
On the other hand, if evidence is in accordance with all five criteria then one can argue
that this particular dietary factor is likely to be causally related with the disease and a
public recommendation regarding its intake is desirable. However, it is unlikely in
nutritional epidemiology to report a perfect agreement or disagreement with all five
criteria and sometimes dietary recommendations can be made even if some of the
aforementioned criteria are not perfectly fulfilled (296).
9.3.1.2 Flavonoids
Introduction
The recent increase in published data on flavonoid content of foods has
enabled the development of databases which can be linked to FFQs and provided us with

Chapter nine Discussion
374
the opportunity to investigate the flavonoid chemoprotective effects, which have been
reported in vitro and animal in vivo studies. In this study the 150 foods listed in the FFQ
included all the most important sources of flavonoids. A number of different foods
contributed to the intake of the five flavonoid subgroups and phytoestrogens in our study
and the results were not determined by one major food category (major sources
included: regular tea, onions, soups- home made, apples, oranges, satsumas or
grapefruits and soya milk; Table 67). In addition, the main sources found in our
population were similar to the main sources found from the flavonoid validation study
(274). Median and range estimations of flavonoid intakes in the Scottish population as
they were estimated from the 4-day weighed record data validation study (271), were:
18.9 mg/day (range: 1.9 - 58.0 mg/day) for flavonols and flavones, 59.0 mg/day (range:
1.8 - 263.3 mg/day) for flavan3ols, 22.5 mg/day (range 0-144.5 mg/day) for
procyanidins and 1.2 mg/day (range: 0 – 238.6 mg/day) for flavanones. Finally, the
estimates of this FFQ for flavonol, flavan3ol and procyanidin dietary intakes have been
shown to be strongly correlated (r=0.70, 0.94 and 0.73 respectively) with 4 day weighed
record estimates in the Scottish population, whereas FFQ estimates for flavones and
flavanones were only poorly correlated (0.12, 0.33, respectively) (271).
Main findings
Regarding the main findings of the flavonoid analysis of the current thesis, whereas no
statistically significant associations were observed in the crude model (model I),
moderately strong inverse associations that showed dose response relationships were
found in the energy-adjusted conditional logistic regression model II between colorectal
cancer risk and intakes of the subgroups flavonols (p=0.02) and procyanidins (p=0.04)
and the individual flavonoid compounds quercetin (p=0.002), catechin (p=0.0001) and
epicatechin (p=0.04) (Table 68). After adjusting for the main potential confounding
factors (model III), only the inverse associations between colorectal cancer and intakes
of quercetin (p=0.04) and catechin (p=0.02) remained statistically significant (Table 68).
We investigated the existence of collinearity effects by correcting for overall fruit and
vegetable intake and for intakes of other individual flavonoids and the observed
associations became more clearly defined (especially for model V, which was further

Chapter nine Discussion
375
corrected for intakes of other flavonoids) (Table 69). According to our results the
direction of the associations of flavonols, procyanidins, quercetin, catechin and
epicatechin remained similar in all four models, although the effect sizes changed. It is
difficult to be certain about which model shows the true associations, since there is
limited knowledge on the biological mechanism of flavonoids. Therefore it might be
possible that the very strong associations reported in model V were due to instability
because of the highly correlated variables.
After correcting for multiple testing using either the Bonferroni or the FDR method, the
inverse associations that remained significant were: with catechin (p=0.0001) and
quercetin (p=0.002) in model II (Table 68) and with flavonols (p=0.0001) and catechin
(p=0.007) in model V (Table 69). Therefore for the flavonoid subclass flavonols and for
the individual compounds quercetin and catechin the direction of the associations
remained constant in all five models and in addition their associations with colorectal
cancer remained statistically significant after correcting for multiple testing.
In marked contrast there were no statistically significant associations between colorectal
cancer and intakes of the other four of the six flavonoid subgroups (flavones, flavan3ols,
flavanones and phytoestrogens; Table 68, Table 69). The association with catechin and
epicatechin but the lack of association with the flavan3ol subgroup (comprising
catechin, epicatechin and gallates) may be explained by our inability to study the other
main representatives of flavan3ols – the gallates (epigallocatechin, epicatechin-3 gallate,
epigallocatechin-3 gallate, and gallocatechin) as described previously. The lack of
association between colorectal cancer and the other three subgroups (flavones,
flavanones and phytoestrogens) could be explained by different biological action of
these flavonoid subgroups, limited dietary sources (celery and herbs for flavones, citrus
fruit for flavanones and soya products for phytoestrogens), low levels of dietary intake
of these subgroups in Scotland across all population groups (e.g. soya and soya products
are not commonly consumed in Scotland) leading to insufficient variation in intake
across the population to permit their study, or less complete nutritional database
information on these subgroups leading to greater misclassification and loss of study
power. In addition, results from the flavonoid validation study showed that FFQ

Chapter nine Discussion
376
estimates for flavones and flavanones did not correlate closely (r=0.12 and 0.33,
respectively) with results from 4 day weighed records (271) and so interpretation of the
findings for these compounds is problematic and results may represent false negative
findings.
We also explored associations between colorectal cancer risk and the intakes of foods
that were the main sources of the flavonoids with statistically significant associations
(regular tea, onions, apples and red wine). Comparison of the highest versus the lowest
quartile of intake of these foods suggested that there is some evidence in favour of an
inverse association but this is less well defined than in the analysis of the association of
flavonol, procyanidins, quercetin, catechin or epicatechin intakes and colorectal cancer
risk (Table 70).
Findings from the current study in relation to previous studies
Most of previous cohort studies reporting associations between colorectal cancer and
flavonoids were either much smaller in scale (118;128;129;134) or did not investigate all
six subgroups of flavonoids (125;132;133;139) (Table 4). In a recent analysis of the
Iowa Women’s Health study, associations between the main subgroups (flavonols,
flavones, flavan3ols, anthocyanidins, procyanidins, flavanones and isoflavones) and
incidence of several types of cancer (including colorectal) were examined, but neither
intakes of total flavonoids nor intakes of any of the main subgroups were found to be
significantly associated with colorectal cancer (131).
On the other hand, three of the four identified case-control studies reported significant
inverse associations between flavonoid subgroups or compounds and colorectal cancer
(Table 5). The Canadian and Chinese case-control studies examined the associations
between colorectal cancer and only specific flavonoids, with the Canadian study
reporting statistically significant and dose-dependent associations with lignans,
isoflavones and phytoestrogens (137;138). In the Italian case-control study the effect of
the main six flavonoid subgroups was examined and the authors have reported a
significant inverse association for flavonols, flavones, anthocyanidins, and isoflavones
(135). Associations between colorectal cancer and intakes of flavonols and
anthocyanidins were similar in strength to the associations reported from the current

Chapter nine Discussion
377
study (results published in (136)). However, the inverse association for flavones and
isoflavones, which was reported in the Italian case-control study, was not replicated
from our study. This may be due to the lower validity of our questionnaire for flavones
and the fact that we studied phytoestrogens rather than isoflavones which represent a
subgroup of phytoestrogens. In addition the main differences between our and the Italian
study were that the controls that were included in our study were closely matched
population-based rather than hospital-based controls. In addition FFQ flavonoid
estimations were calculated from a nutrient database developed for this study
population, whereas in the Italian study the flavonoid database of U.S. Department of
Agriculture was utilised (135).
Some animal and cell-line studies have reported chemoprotective effects of flavonoids,
with possible biological mechanisms being inhibition of DNA oxidation (297;298),
alteration of phase I and II drug metabolising enzymes (299-301), inhibition of protein
kinases, blocking of receptor-mediated functions, alteration of cell-cycle checkpoints
apoptosis, inhibition of angiogenesis, invasion and metastasis and epigenetic changes in
promoter methylation and chromatin remodelling (302). An alternative theory for the
protective effect of flavonoids is through their regulation of the COX-2 gene. Increased
expression of COX-2 enzyme provides survival advantage to cancer cells through high
cell proliferation and angiogenesis. Results from recent laboratory and mechanistic
studies show that flavonoids inhibit the expression of COX-2 both on mRNA and
protein levels by inhibit signalling of the ERK and Akt pathways (303).
For quercetin in particular, which is the major representative of flavonols in diet, several
animal and cell line studies have demonstrated that it might have certain
anticarcinogenic effects. Possible mechanisms of actions might be the inhibition of the
β-catenin/ Tcf signalling via the decrease of nuclear β-catenin/ Tcf-4 proteins (304). In
other studies quercetin has been found to inhibit cell growth and to induce apoptosis in
colon cancer cells, by downregulating the Akt pathway and ErbB2/ ErbB3 (receptor
tyrosine kinases) signalling (305;306).
Summary

Chapter nine Discussion
378
A few observational studies have investigated the associations between colorectal cancer
and intakes of flavonoids. The null and inconsistent findings from cohort studies
provided no evidence for an inverse association. However, the majority of the cohort
studies were possibly underpowered to detect a significant association (<150 cases). On
the other hand, results from case-control studies were more consistent reporting
statistically significant and dose dependent associations of moderate strength for some
flavonoid subgroups. In addition, there is some biological evidence mainly supporting
the inverse association with flavonols (and quercetin in particular). However, taking into
consideration the null findings from the cohort studies, conclusions of a causal effect of
flavonoids can not be drawn and their associations with colorectal cancer should be
further studied in large prospective studies.
9.3.1.3 Fatty acids
Introduction
Results from ecological studies indicated that fats from different sources might affect
colorectal carcinogenesis in opposite directions, with diets high in animal fat increasing
colorectal cancer risk and diets high in fish-derived fat reducing risk (146). The
development of a database, which was linked to the FFQ used in the current study,
enabled us to investigate how different types of fatty acids are associated with colorectal
cancer. All the main food sources of the fatty acids were included in the 150-item FFQ
list, and each food and drink item was assessed, manually checked and corrected in
order to estimate its fatty acid contribution. A number of different foods contributed to
the intake of the fatty acid subgroups and the results were not determined by one main
food category (major sources included: meat and meat products, spreads and cooking
oils, fish and fish dishes and confectionery and savoury snacks; Table 74). Median and
range estimations of fatty acid intakes in the Scottish population as they were estimated
from the population-based controls that participated in the current study were: 80.0
mg/day (62.5 - 105.3 mg/day) for total FAs, 34.7 mg/day (26.5 - 46.8 mg/day) for SFAs,
30.6 mg/day (23.2 - 40.5 mg/day) for MUFAs, 13.8 mg/day (10.4 - 18.1 mg/day) for
PUFAs, 10.5 mg/day (7.8 - 14.0 mg/day) for ω6PUFAs, 2.2 mg/day (1.6 - 3.0 mg/day)
for ω3PUFAs, 3.3 mg/day (2.4 - 4.5 mg/day) for tFAs and 2.6 mg/day (1.8 - 3.4 mg/day)

Chapter nine Discussion
379
for tMUFAs (Table 72). In addition, nutrient data from supplements were extracted for
the subgroups ω6PUFAs and ω3PUFAs and the individual compounds linoleic, γ-
linolenic, α-linolenic, EPA and DHA and they were added to the daily dietary intakes
(after energy adjustment) of total FAs, of the subgroups PUFAs, ω6PUFAs and
ω3PUFAs and of the individual fatty acids linoleic, γ-linolenic, α-linolenic, EPA and
DHA. Finally, we can not be sure about the accuracy of the FFQ estimates for the
intakes of the specific fatty acid subgroups and individual compounds since this
validation had not been finished by the time the thesis was written. However, the FFQ
estimates of saturated, mono-unsaturated and poly-unsaturated fat have been compared
with 4 day weighed record estimates in the Scottish population and the Spearman rank
correlations were: 0.59, -0.07 and 0.36 for men, and 0.71, 0.58 and 0.66 for women,
respectively (270).
Main findings
Regarding the main findings of the fatty acid analysis of the current thesis, in the crude
model high intakes of total FAs, SFAs, MUFAs, ω6PUFAs, tFAs, tMUFAs and the
individual fatty acids palmitic, stearic and oleic were associated with an increased
colorectal cancer risk (Table 75). After residual energy-adjustment (model II) a dose-
dependent increase in risk was observed for intake of total FAs (p=0.001), SFAs
(p=0.001), MUFAs (p=0.01) tFAs (p=0.002) and tMUFAs (p=0.0003) and for the
individual fatty acids palmitic (p=0.001), stearic (p=7.9x10⁻⁶
) and oleic (p=0.001). In
contrast, significant inverse dose-dependent associations were observed between
colorectal cancer and the dietary intakes of the fatty acid subgroup ω3PUFAs (p=9.3x
10-6
) and the individual compounds EPA (p=0.0001) and DHA (p=0.0002) (Table 75).
However after further adjustment for potential confounding factors (model III), only the
positive association between colorectal cancer and stearic acid (p=0.01) and the inverse
associations between colorectal cancer and dietary ω3PUFAs (p=0.01), EPA (p=0.02)
and DHA (p=0.02) remained significant (Table 75). Fatty acid intakes are highly
correlated with dietary energy intake and as suggested by Willet to adjust more
efficiently for energy intake, dietary energy intake was also added as a covariable
together with the residually energy-adjusted variables and the potential confounding

Chapter nine Discussion
380
factors (model IV). In that model only intakes of stearic acid were positively associated
with colorectal cancer, whereas intakes of ω3PUFAs, EPA and DHA were negatively
associated with colorectal cancer (Table 76). In marked contrast, the subgroup of
PUFAs, and the individual fatty acids linoleic, γ-linolenic, arachidonic and α-linolenic
were not associated with colorectal cancer risk in any of the adjusted logistic regression
models (Table 75, Table 76). After correcting for multiple testing using the FDR method
and taking into account either the tests that were conducted in hypothesis 2 (39 tests for
the subgroup analysis and 45 tests in the individual compound analysis), or taking into
account the tests that were conducted in all 4 hypotheses (69 tests for the subgroup
analysis and 93 tests in the individual compound analysis) all the associations between
the dietary intakes and colorectal cancer that their observed p-values were ≤0.01
remained significant (Table 75, Table 76).
Furthermore intakes of fatty acids from dietary supplements and diet were investigated
for the following variables: total FAs, ω6PUFAs, ω3PUFAs, linoleic, γ-linolenic, α-
linolenic, EPA and DHA and the reported associations were of similar direction and size
as for the dietary variables (Table 75 and Table 76). Finally, we also explored
associations between colorectal cancer risk and the intakes of the foods that were the
main sources of the fatty acids with the significant associations (meat and meat products,
confectionery and savoury snacks, fish and fish dishes). Results showed that comparison
of highest versus lowest quartile intakes of confectionery and savoury snacks (main
sources of tFAs and tMUFAs) were associated with an increased risk of colorectal
cancer (model III: p=0.002), whereas high intakes of fish and fish dishes (main source of
ω3PUFAs) were associated with a decreased colorectal cancer risk (model III: p=0.07)
(Table 77). Associations between colorectal cancer and the food group spreads
(including butter, margarine, jam, honey, marmalade, yeast or meat extract, peanut
butter, and chocolate spread) were not investigated. The main reason was that intakes of
margarine and cooking oils, which would be the food items of this food group that
contributed the most in fatty acid intake, could not be estimated.
Findings from the current study in relation to previous studies
Saturated and mono-unsaturated fatty acids
Chapter nine Discussion
381
It has been suggested that red and processed meat (one of the main sources of saturated
and mono-unsaturated fat) as well as animal fat (which consists mainly of cholesterol,
saturated and mono-unsaturated fat), may increase colorectal cancer risk (30). However,
results from studies included in our literature review, which investigated the associations
between saturated fat (or SFAs), mono-unsaturated fat (or MUFAs) and colorectal
cancer provided little evidence that these particular types of fat are linked with colorectal
cancer risk (Table 6, Table 7, Table 8, and Table 9). The reported associations from the
majority of the studies were with energy-adjusted variables. Therefore the lack of
statistically significant associations might be due to the fact that both saturated and
mono-unsaturated fats are highly correlated with dietary energy intake with energy
adjustment causing fat intakes to be over-controlled for. Findings of the current study
suggest that there might be a positive association between colorectal cancer and intakes
of SFAs and MUFAs, however these associations were diluted in the multivariable
models.
Regarding potential biological mechanisms of SFAs and MUFAs affecting colorectal
carcinogenesis, experimental data support the hypothesis of an increased colorectal
cancer risk due to high intakes of SFAs. Some of the reported tumour enhancing effects
of SFAs include alteration of the hormonal status and modification of cell membranes
structure and function (307). On the other hand, experimental data regarding the effect
of MUFAs are not as conclusive. In particular it has been shown that MUFAs and
especially oleic acid may enhance oxidative stress and/ or disturb the membrane
enzymes. However, oleic acid has also been found to improve the secondary bile acid
patterns in the colon, which probably leads to a decreased colorectal cancer risk (142).
The current and previous studies do not support a direct effect of SFAs and MUFAs on
colorectal cancer (after adjustment for various confounding factors). However, these two
types of fat are mainly found in red and processed meat and they also contribute greatly
to the dietary energy intake. Increased intakes of red and processed meat as well as of
dietary energy have been linked to colorectal carcinogenesis. Particularly for red and
processed meat public recommendations for low intakes have been made (30). Therefore

Chapter nine Discussion
382
high intakes of SFAs or MUFAs should still be considered as important risk factors for
colorectal carcinogenesis.
Omega-3 and omega-6 poly-unsaturated fatty acids
Regarding the two classes of PUFAs, ω3 and ω6, it has been suggested that they play an
important though opposite role in colorectal carcinogenesis, with ω3PUFAs decreasing
and ω6PUFAs increasing colorectal cancer risk (169). Regarding previous studies on
ω3PUFAs, the results of a recent systematic review of clinical trials and cohort studies
for their effect on cardiovascular risk and cancer indicated that these fatty acids have no
effect on either diseases (308). However, the design of the systematic review had several
limitations (309). With respect to cancer most of the studies had very small numbers of
cancer cases and did not distinguish between types of cancer. The two largest studies
(310;311) were originally designed to examine the effect of ω3PUFAs on cardiovascular
mortality and did not have cancer as a primary study outcome. Results from a recent
meta-analysis of prospective studies that investigated the associations between fish (19
prospective studies) and/ or marine ω3PUFA intakes (three prospective studies) and
colorectal cancer, suggested a statistically significant inverse association between fish
intake and colorectal cancer (combined RR (95% CI): 0.88 (0.78, 1.00)), and a not
statistically significant inverse association between marine ω3PUFA intakes and
colorectal cancer (combined RR (95% CI): 0.91 (0.70, 1.19)) (312). Finally results from
both cohort and case-control studies as summarised in Table 12 and Table 13 regarding
the effect of ω3PUFAs are inconsistent. In particular, from the identified prospective
studies only the Health Professional’s Study (2008) reported a statistically significant
and dose dependent inverse association of moderate strength between colorectal cancer
and marine ω3PUFAs intakes in male individuals (170), whereas other large cohort
studies (including the Women’s Health Study, the Japan Public Health Centre-based
Study, the Alpha-Tocopherol, Beta-Carotene Cancer Prevention Study and the Iowa’s
Women’s Health Study) reported null associations (Table 12). Results from case-control
studies were more consistent. In particular, most of the studies reported inverse
associations of similar magnitude as the ones observed in the current study (40-30%
reduction in risk) and four studies reported dose dependent and statistically significant

Chapter nine Discussion
383
associations (158;161;164;172) (Table 13). This inconsistency regarding the ω3PUFAs
associations especially between studies might be due to different habits of the
populations regarding the amount and duration of fish intake. It has also been proposed
that ω3PUFA significant inverse associations might be confounded by a vitamin D
effect, since these two nutrients share common sources. However, when we further
adjusted the associations of the current study for vitamin D intakes, high intakes of
ω3PUFAs were still associated with a reduced colorectal cancer risk though not
statistically significant (high vs. low quartile of intake OR (95% CI), p-value for trend:
0.84 (0.61, 1.18), 0.18).
Regarding the ω6PUFAs, results from animal studies showing an increase in colorectal
cancer incidence, led to the investigation of the hypothesis that high intakes of
ω6PUFAs are associated with a high colorectal cancer risk. However, according to
findings of the literature review intakes of ω6PUFAs were not associated with colorectal
cancer in prospective studies (Table 14). In addition, the majority of case-control studies
(including ours) reported null associations with ω6PUFAs, whereas a small number of
retrospective studies reported inverse not statistically significant or dose-dependent
associations of moderate strength between high intakes of ω6PUFAs and colorectal
cancer (Table 15).
The significant association between colorectal cancer and ω3PUFAs and on the other
hand the lack of any association between ω6PUFAs and colorectal cancer that were
observed in the current and previous studies can be explained by the different biological
action of the ω3 and the ω6PUFAs. Omega 3 PUFAs have been found to rapidly
incorporate into cell membranes and affect several anti-carcinogenic biological
responses (313-315). The main biological mechanism of ω3PUFAs has been suggested
to be the inhibition of the COX-2 enzyme and the production of eicosanoids that have
anti-inflammatory and antiproliferative properties. In addition, several other mechanisms
by which ω3PUFAs may decrease the risk of colorectal cancer have been proposed,
including inhibition of bile acid excretion, altered protein kinase C activity, decreased
NFκB activity, activation of PPARα and γ and decreased nitric oxide production (169).
Regarding ω6PUFAs, it has been suggested that they enhance the production of
Chapter nine Discussion
384
eicosanoids that promote inflammation and carcinogenesis by using the same enzymatic
system as ω3PUFAs. Therefore, changes in the ω3/ ω6 ratio may contribute to the early
stages of carcinogenesis (316). In addition, other studies report that ω6PUFAs promote
colorectal carcinogenesis by influencing the protein kinase C pathway (141).
Evidence from the current and previous studies suggest that ω3PUFAs operate
differently than the other types of fat, decreasing colorectal cancer risk. However, results
from prospective studies are not as consistent as results from case-control studies. In
addition ω3PUFAs share common sources (main food source: oily fish) with other
nutrients that may affect colorectal carcinogenesis (vitamin B12, vitamin D) and
therefore these inverse associations might be confounded. Therefore, specific
recommendations regarding intakes ω3PUFAs are not suggested. In contrast further
investigation of their associations with colorectal cancer in large prospective
observational studies is proposed.
Trans fatty acids
Trans fatty acids are unsaturated fatty acids that are formed during hydrogenation and
instead of the natural occurring cis form, they have a trans form (176). It has been
reported that tFAs increase the risk of various chronic diseases, including ischemic heart
disease, diabetes and obesity (317). Due to the fact that tFAs might be causally link with
several chronic diseases, the major UK retailers announced that they will stop adding
tFAs in their products by the end of 2007 (British Retail Consortium, 2007). Regarding
colorectal cancer, a limited amount of observational studies (3 cohort and 3 case-control
studies) have investigated the associations between tFAs and colorectal cancer risk
(Error! Reference source not found., Table 17). None of the cohort studies reported
statistically significant associations. However, two of the three cohort studies were not
large enough (in terms of cases) and therefore might have been underpowered to detect a
significant association (141;162). Regarding case-control studies, results from the
current study and from one more case-control study suggested a positive association
especially among females with a 40 and 50% increase in risk, respectively (164;175).
Regarding biological mechanisms of tFAs, it has been suggested that some of their
properties can affect colorectal cancer carcinogenesis. In particular, it has been

Chapter nine Discussion
385
suggested that high consumption of tFAs may alter bile acid and other fatty acid
concentration of the large bowel, which can then lead to increased mucosa inflammation
and oxidative stress (318). Indeed, tFAs have been found to be associated with markers
of oxidative stress and inflammation (319;320). In addition, some studies have reported
that high consumption of tFAs is associated with insulin resistance, which may enhance
colorectal carcinogenesis due to increased cell proliferation (318).
To draw specific causal conclusions about tFAs, further investigation regarding their
association with colorectal cancer is necessary. However, this type of fat has been
recognised as an important risk factor for other chronic diseases (ischemic heart disease,
diabetes and obesity) and action has already been taken by reducing its amounts in
several products.
Summary
To summarise, according to the findings of the current study different types of fatty
acids were found to be associated differently with colorectal cancer. In particular, SFAs,
MUFAs, tFAs and tMUFAs were positively associated with colorectal cancer (though
not in all multivariable models), ω3PUFAs were inversely associated with colorectal
cancer and ω6PUFAs were not associated with colorectal cancer (in any of the adjusted
models). When considering other retrospective and large prospective studies, findings
regarding intakes of SFAs, MUFAs and tFAs were generally consistent with null
associations. However, since null associations might be due to over-correction after
energy adjustment and since these fatty acids are found in foods that have been linked to
colorectal cancer, it is recommended that high intakes should be avoided. On the other
hand, findings regarding intakes of ω3PUFAs are more consistent with a statistically
significant and dose-dependent decreased colorectal cancer risk. It has been suggested
though, that these inverse associations might be confounded by other nutrients like
vitamin D, since they share common food sources. Evidence from large prospective
studies might be therefore necessary in order to further investigate the ω3PUFAs effect
on colorectal cancer. However, application of alternative study designs (e.g. Mendelian
randomisation, described below) might be required in order to be able to isolate the
effect of ω3PUFAs from the effect of other nutrients.

Chapter nine Discussion
386
9.3.1.4 Folate, vitamin B2, vitamin B6, vitamin B12 and alcohol
Introduction
Folate, vitamin B2, vitamin B6 and vitamin B12 have important roles in the one-carbon
metabolic pathway, which is essential for DNA synthesis, repair and methylation. In
addition, alcohol may have an indirect effect on the one-carbon pathway via its own
metabolic pathway. The role of folate against the NTD syndrome is well established and
in order to reduce the amount of newborns with this disease mandatory folic acid
fortification has been introduced in several countries (including the USA and Canada).
However, folic acid fortification in the UK has been suspended in order to better
investigate the folic acid effects on cancer (including colorectal cancer). In this study the
150 food and drink items listed in the FFQ included all the most important sources of
folate as well as of vitamin B2, vitamin B6, vitamin B12 and alcohol. A number of
different foods contributed to the intake of the four nutrients in our study and the results
were not determined by one major food category including baked or boiled potatoes,
bran flakes, bananas and fried oily fish (Table 83). Median and range estimations of
these nutrients and alcohol in the Scottish population as they were estimated from the
population-based controls that participated in the current study were: 321.0 µg/day
(253.0 - 399.0 µg/day) for folate, 2.1 mg/day (1.6 - 2.6 mg/day) for vitamin B2, 2.8
mg/day (2.2 - 3.5 mg/day) for vitamin B6, 6.8 µg/day (4.8 - 9.8 µg/day) for vitamin B12
and 8.1 g/day (1.7 - 19.4 g/day) for alcohol (Table 81). In addition, nutrient data from
supplements were extracted for folate, vitamin B2, vitamin B6 and vitamin B12 and they
were added to their daily dietary intakes (after energy adjustment). Finally, the FFQ
estimates for folate, vitamin B2, vitamin B6, vitamin B12 and alcohol intakes have been
compared with 4 day weighed record estimates in the Scottish population and the
Spearman rank correlations were: 0.55, 0.69, 0.33, 0.25 and 0.72 for men, and 0.73,
0.69, 0.48, 0.31 and 0.79 for women, respectively (270).
Main findings
Regarding the main findings of the analyses of folate, vitamin B2, vitamin B6, vitamin
B12 and alcohol, inverse associations which showed dose response relationships were
observed in the energy-adjusted logistic regression model (model II) between colorectal

Chapter nine Discussion
387
cancer risk and the dietary intakes of folate (p=0.003), vitamin B6 (p=7.1x10⁻⁶
) and
vitamin B12 (p=0.02) (Table 84). After adjusting for the main potential confounding
factors (model III), only the inverse associations between colorectal cancer and vitamin
B12 (p=0.05) remained statistically significant, with the vitamin B6 associations being
of similar direction as in model II though borderline not statistically significant (p=0.09)
(Table 84). In contrast, the association between folate and colorectal cancer followed a
bell-shaped pattern with individuals of the second quartile of intake having the greatest
colorectal cancer risk (Table 84). After correcting for multiple testing using the FDR
method by taking into account the tests that were conducted in hypothesis 3 (15 tests) or
the tests that were conducted in all 4 hypotheses (93 tests in the individual compound
analysis), model II associations between dietary intakes of vitamin B6 (p=7.1x10⁻⁶
) and
folate (p=0.001) and colorectal cancer remained statistically significant (Table 84).
Regarding the analysis of the main food sources of folate, vitamin B6 and vitamin B12,
results suggest that there is some evidence in favour of a significant inverse association
between colorectal cancer and intakes of bananas (dietary source of vitamin B6) and
fried oily fish (dietary source of vitamin B12) (Table 85).
Alcohol intake when divided in quartiles was associated with a decreased colorectal
cancer risk, and this association was statistically significant in model III (p=0.03) (Table
84), which was in the opposite direction when compared to previous findings (83).
However, it has been proposed that alcohol intakes of less than 30 g/day are either
weakly or not at all associated with colorectal cancer (82). In our study the cut-off point
of the highest quartile was 19.4 g/day and this might be the reason, why we did not
observe an increased colorectal cancer risk with high alcohol intakes. When we divided
alcohol intake into categories (cut off points: 0, 0-15, 15-30, 30-45, 45-60, >60 g/day),
we did not observe an increased risk for intakes of more than 30 g/day but we did
observe a significant increased risk for intakes of more than 60g/day, which was
statistically significant for model I (p=0.02) but not statistically significant for models II
(p=0.08) and III (p=0.21) (Table 84).
Regarding the genetic findings of the current study, none of the four examined SNPs
was associated with colorectal cancer (data not shown). In addition, our data did not

Chapter nine Discussion
388
support the hypothesis that folate or any of the vitamins B2, B6, B12 interacts with the
rs1801133 (MTHFR 677TT) variant or with any of the rs1801131 (MTHFR A1298G),
rs1805087 (MTR A2756G) or rs1801339 (MTRR A66G) variants (data not shown).
Findings from the current study in relation to previous studies
Folate
A substantial body of observational studies investigating the association between
colorectal cancer and dietary intakes, total intakes or plasma measurements of folate
have been conducted. Ten of 14 cohort and 13 of 24 case-control studies that were
identified from the literature review reported statistically significant or statistically non-
significant inverse associations between folate and colorectal cancer with an average
30% decrease in risk (Table 18, Table 19). In addition, two recent meta-analyses
(published in 2001 and 2005) reported a 20 to 25% reduction in colorectal cancer risk
with high intakes of dietary folate (184;321). In some studies these inverse associations
were attenuated after adjustment for confounding factors (e.g. fibre) or were observed
only between intakes of dietary folate and colorectal cancer and in some other studies
inverse associations were not replicated at all (30). Furthermore, results from two recent
studies showed a positive effect of folate on colorectal cancer risk, which followed a
bell-shaped pattern similar to the one that was observed in the current study (212;216)
and a third study reported a not statistically significant positive association (196).
The inconsistency between different studies, with some studies reporting a positive
association, other studies reporting a negative association and other no significant
association might be due to failing to adequately control for particular confounding
factors such as fibre. Differences in the median and range of folate intakes might also
explain the inconsistent findings. In particular for our study population, folate intakes
were lower than the ones reported in other studies (193;195;198), but they were similar
to intakes of a recent Scottish study, with this study also reporting a bell-shaped
relationship between folate and colorectal cancer (212). In addition, failure of observing
an association might be due to low variability in intakes between the participants of a
study. Indeed, the variability in intakes in our study was low with 75.5% of the control
reporting intakes between 0 and 200 µg/day, and that might explain why we did not

Chapter nine Discussion
389
observe a significant association between high folate intakes and colorectal cancer.
Furthermore, it has been suggested that a total folate intake of more than 600 µg/day
may be required in order to observe a preventive effect against colorectal cancer.
However, when we focused our analysis on subjects with high dietary or total folate
intake, we did not observe any significant associations. In particular, the new cut-off
points for total (dietary and from supplements) folate intakes were: 0-200 µg/day (45
cases, 58 controls), 200-400 µg/day (1,629 cases, 2,096 controls), 400-600 µg/day (330
cases, 532 controls), >600 µg/day (57 cases, 90 controls). The OR (95% CI) of the 4th
versus the 1st category was 1.26 (0.69, 2.29) with a p-value for trend of 0.14 (model III;
data not shown). Finally, another possible explanation might be that folate acts in a dual
way during colorectal carcinogenesis, reducing risk for healthy individuals but
promoting progression of colorectal adenomas or neoplasms for individuals that have
already developed colorectal cancer (321).
The main biological mechanism of folate is its involvement in the one-carbon metabolic
pathway, which leads to the synthesis of certain nucleotides (purines and thymidilate)
and provides the methyl groups for DNA methylation (321;322). It has been
hypothesised, therefore that high folate intakes will protect against colorectal
carcinogenesis, maintaining a healthy colorectal epithelium. However, on the other hand
it has been suggested that folate may assist in the progression of existing preneoplastic
or neoplastic lesions, by providing the highly proliferative cancerous cells with
nucleotides. Therefore, there is a possibility of a dual role of folate on colorectal cancer
depending on the status of the colorectal epithelium (321;322).
The evidence that folate protects against colorectal cancer has been convincing for
several years. However, reports of positive associations between folate and colorectal
cancer as well as the biological plausibility of an increased risk have challenged its
chemoprotective role. Therefore, further investigation of the role of folate in prospective
observational studies and examination of the results of two clinical trials investigating
the folate effect on cancer (including colorectal) is recommended prior to the mandatory
folic acid fortification in the UK.
Vitamin B6

Chapter nine Discussion
390
Regarding vitamin B6, results from published cohort and case-control studies showed
inverse associations between colorectal cancer and dietary or total (including
supplements) vitamin B6 intake (Table 22, Table 23). Three cohort studies reported
statistically significant and dose-dependent inverse associations with a 30 to 35%
reduction in colorectal cancer risk. In particular, in the Swedish Mammography Cohort
both colon and rectal cancer were inversely associated with vitamin B6, in the Japan
Public Health Centre-based
Prospective Study statistically significant inverse
associations were reported only for males and in the Women’s Health Study dietary but
not total vitamin B6 intake was associated with a decreased risk of colorectal cancer. In
contrast, the Iowa Women’s Health Study reported a significant positive association for
rectal cancer and no association for colon cancer. Regarding the case-control studies, of
the 11 identified studies, one nested case-control (Nurses’ Health study) and four case-
control studies reported inverse associations with colorectal cancer (Table 23). However,
even if most of the studies investigating the vitamin B6 effects reported statistically
significant findings, since most studies of dietary factors of one-carbon metabolic
pathway were focused on folate, non-significant findings for vitamin B6 could have
been omitted from publications. Therefore the results of this literature review might be
subject to publication bias. It has also been proposed that vitamin B6 effects might be
modified by the intake of other nutrients, such as alcohol and folate (223) but our data
showed no evidence of this. From the three published studies that investigated alcohol
and vitamin B6 (223;225;323), only one found a clear interaction especially among
women with high alcohol intake (>30g/day) (223). In addition, all three studies that
investigated plasma or dietary folate and B6 (195;225;323) failed to show significant
interactions. Finally, in our population, when we further adjusted for folate intakes the
associations between colorectal cancer and vitamin B6 remained constant (high versus
low quartile: OR (95% CI), p-value for trend: 0.80 (0.62, 1.03), 0.06) (data not shown).
Vitamin B6 plays a key role in the one-carbon metabolic pathway as a co-enzyme of the
cystathionine β-synthase, which converts homocysteine into cystathionine (324). In
addition, its role as a co-enzyme in the synthesis of 5,10MTHF might be critical for
synthesis, repair and methylation of DNA and inhibition of single and double DNA

Chapter nine Discussion
391
breaks (325-327). Further more, laboratory studies on mice suggest that high intake of
pyridoxine (vitamin B6) has other anticarcinogenic effects by reducing cell proliferation,
oxidative stress, nitric oxide production and angiogenesis (328;329) and a cultured
human lymphocyte study reported a protective action against chromosomal damage
(330). Finally, it has been proposed that vitamin B6’s inhibition of DNA polymerases
and steroid receptors may be useful and vitamin B6 might be a promising adjuvant in
cancer chemotherapy (331).
High intakes of vitamin B6 have been found to be associated with a decreased colorectal
cancer both in the current and previous studies. However, vitamin B6 intakes were
attenuated and became marginally not statistically significant after further adjustment
(model III). In addition, even if the majority of the published prospective and
retrospective studies support an inverse association, the possibility of publication bias
cannot be ruled out. Therefore, specific recommendations regarding intakes of vitamin
B6 are not suggested. In contrast, further investigation of their associations with
colorectal cancer in prospective observational studies is proposed.
Vitamins B2 and B12
Few studies have investigated the association between colorectal cancer and intakes of
vitamin B2 or vitamin B12, even if they are important co-enzymes in the one-carbon
metabolic pathway. Regarding vitamin B2, we identified only one case-control study
that reported a significant inverse association between high intakes of vitamin B2 and
colorectal cancer (Table 20, Table 21), findings that were not replicated in our study.
Regarding vitamin B12, one cohort study reported a significant increased colorectal
cancer risk with high intakes of dietary vitamin B12, but they suggested that this finding
might be confounded by smoking (196). The majority of the case-control studies
reported either non-significant inverse or null associations (Table 24, Table 25), whereas
in our analysis we observed an inverse and dose-dependent association that remained
constant in models II, III and after further adjusting for folate (high versus low quartile:
OR (95% CI), p-value for trend: 0.80 (0.66, 0.97), 0.05) (data not shown). However, the
main source of vitamin B12 was oily fish, therefore the observed inverse association
might be due to a confounding effect from either ω3PUFAs or vitamin D, which main

Chapter nine Discussion
392
source is also oily fish. Indeed, when we further controlled for either ω3PUFAs or
vitamin D intakes the inverse association between vitamin B12 and colorectal cancer
was diluted (high vs. low quartile: OR (95% CI), p-value for trend: 1.01 (0.80, 1.27),
0.62; 0.95 (0.75, 1.22), 0.94; respectively). However, vitamin B12 intakes were highly
correlated with both ω3PUFAs (r=0.79) and vitamin D (r=0.85), and therefore it is very
difficult to know whether the inverse association with colorectal cancer is driven by
vitamin B12, ω3PUFAs or vitamin D. According though to the findings from previous
studies, it is more likely that the inverse association between vitamin B12 and colorectal
cancer observed in model II and III is confounded by either ω3PUFAs or vitamin D
intakes.
Alcohol
High alcohol intake has been considered as an important risk factor for colorectal
cancer. However, it has been suggested that this positive association is not dose-
dependent. In particular, evidence suggest that alcohol intake of 30 g/day or lower are
not associated with colorectal cancer, whereas alcohol intake of more than 30g/d is
linked with male colorectal cancer and probably linked with female colorectal cancer
(30). Results from the EPIC study (80) as well as from two pooled meta-analyses
(81;82) support this finding suggesting alcohol consumption of more than 30 g/day is
significantly associated with an increased colorectal cancer risk.
In our study, when alcohol intake was divided into quartiles, high alcohol consumption
was associated with a significant and dose-dependent decreased colorectal cancer risk.
However, the cut-off point of the highest quartile (19.20 g/day) was lower than the 30
g/day threshold. Therefore, we divided alcohol intake in categories (0, 0-15, 15-30, 30-
45, 45-60, >60 g/day) and we observed an increased colorectal cancer risk for intakes of
higher than 60 g/day. One possible reason why the threshold of an increased colorectal
cancer risk in our study was 60 instead of 30 g/day might be that the study participants
underreported their alcohol intakes.
The reference category used in the latter analysis included subjects reporting that they
had never consumed any alcoholic beverage weekly. This might be a limitation since
complete abstainers may not be a representative group of subjects and therefore not an

Chapter nine Discussion
393
ideal reference group. However, subjects that had consumed less than one measure a
week of any alcoholic beverage were also asked to circle 0. Therefore the reference
category probably included both complete abstainers and occasional drinkers. When
alcohol intake was divided in new categories using as reference group the low alcohol
consumers (0-15g/day) an increased colorectal cancer risk for intakes higher than 60 g/
day was still observed (OR (95% CI), p-value: Model I 1.55 (1.03, 2.32), 0.03; Model II
1.37 (0.91, 2.07), 0.13; Model III 1.26 (0.80, 2.00)) (data not shown).
Associations with genetic variants, gene-nutrient interactions
Two previous meta-analyses (332;333) have reported inverse associations between the
MTHFR 677TT genotype and colorectal cancer risk. Therefore lack of a statistically
significant association in our study might be either a chance finding or due to limited
power. A smaller number of observational studies have investigated the associations
between colorectal cancer and the other genetic variants: rs1801131 (MTHFR A1298C),
rs1805087 (MTR A2756G) and rs1801339 (MTRR A66G). Regarding the rs1801131
(MTHFR A1298C) variant, a decreased though not statistically significant association
between the CC genotype and colorectal cancer is reported in the majority of the studies
(178). However, since rs1801133 (MTHFR C677T) and rs1801131 (MTHFR A1298C)
are in strong linkage disequilibrium and the pattern of association between the MTHFR
1298CC genotype and colorectal cancer is similar to the pattern of association MTHFR
677TT and colorectal cancer, it raises the possibility that the rs1801131-cancer relation
is actually due to the rs1801133 variant. Studies about associations between rs1805087
(MTR A2756G) and colorectal cancer and between rs1801339 (MTRR A66G) and
colorectal cancer have reported null or not statistically significant associations (178).
Regarding gene-nutrient interactions, it has been suggested that the decreased colorectal
cancer risk for the MTHFR 677TT individuals is not apparent when folate or methionine
intakes are low or when alcohol intakes are high (216). However, this hypothesis was
not replicated by the current study and also results from observational studies examining
these interactions are inconsistent suggesting that further investigation might be
necessary (216). In addition, some observational studies have investigated interaction
relationships between MTHFR 1298CC genotype and folate intakes. Similarly to the
Chapter nine Discussion
394
MTHFR 677TT interactions, results are inconsistent and might be driven by the
rs1801133 (MTHFR C677T) variant due to the strong linkage disequilibrium (216).
Furthermore, at least three studies reported a lower risk of colorectal cancer (334;335)
and adenomas (336) in subjects of the MTHFR 677TT genotype and reporting high
vitamin B6 intake.
In addition to individual effects and specific gene-nutrient interactions, several previous
prospective and retrospective studies have investigated combinations of dietary factors
and/ or the genetic factors involved in one-carbon metabolism and their association with
colorectal cancer risk. Results tend to support an inverse association between a high
methyl-donor diet (high folate and in some cases high vitamin B6 and vitamin B12
intakes, high methionine intakes and low alcohol intakes) even in studies where
individual effects were not significant (226).
Summary
To summarise, according to the findings of the current study, folate intakes were not
associated with a decreased colorectal cancer, but instead a bell-shaped relationship was
observed. Even if the majority of the published studies support a protective effect of
folate, the possibility of a dual folate role (protecting against colorectal cancer onset but
enhancing colorectal cancer progression) needs further investigation from observational
studies. Vitamin B2 was not associated with colorectal cancer, but both vitamin B6 and
vitamin B12 were found to decrease colorectal cancer risk. However, inverse
associations with vitamin B6 were attenuated after applying the multivariable model and
similarly inverse association with vitamin B12 were found to be confounded by
ω3PUFAs or vitamin D intakes. Vitamin B6 can act as an important chemopreventive
agent, but further investigation of its effect on colorectal cancer would need to be
conducted. Similarly, even if vitamin B12 findings are interesting, they might be
confounded, especially if we consider the published evidence regarding the effects of
ω3PUFAs and/ or of vitamin D. Finally, when alcohol intake was divided into quartiles,
high alcohol consumption was associated with a significant and dose-dependent
decreased colorectal cancer risk. However, when alcohol intake was divided in

Chapter nine Discussion
395
categories an increased colorectal cancer risk for intakes of higher than 60 g/day was
observed.
9.3.1.5 Vitamin D and calcium
Introduction
A protective effect of vitamin D on colorectal cancer has been initially proposed in 1980
by Garland and Garland, who suggested that different incident and mortality rates of
colorectal cancer, could be explained by the different sunlight exposure according to the
geographic latitude (337). Since then, several ecological studies investigated the
association between UVB exposure and colorectal cancer, with most of them confirming
the initial observation (338). However, results from prospective or retrospective studies
investigating the association between mainly dietary intakes of vitamin D and colorectal
cancer are not as strong (338), whereas the epidemiological evidence regarding calcium
intake and its effect on colorectal cancer is relatively stronger (339). In the current study
we used estimates obtained from the FFQ, in order to investigate the associations
between colorectal cancer, vitamin D and calcium. The foods that contributed to the
intake of the vitamin D and calcium in our study included oily fish (fried, smoked or
grilled), milk and cheese (Table 89). Median and range estimations of vitamin D and
calcium in the Scottish population as they were estimated from the population-based
controls that participated in the current study were: 3.9 mg/d (2.5 - 5.8mg/d) for vitamin
D and 1.1 g/d (0.8 -1.4 g/d) for calcium (Table 87). In addition, nutrient data from
supplements were extracted for vitamin D and calcium and they were added to their
daily dietary intakes (after energy adjustment). Finally, the estimates of this FFQ for
vitamin D and calcium intakes have been compared with 4 day weighed record estimates
in the Scottish population and the Spearman rank correlations were: 0.38 and 0.49 for
men, and 0.37 and 0.75 for women, respectively (270).
Main findings
Regarding vitamin D, significant inverse dose-dependent associations were observed
between colorectal cancer and dietary vitamin D in both models II (p=0.01) and III
(p=0.03) (Table 90). However, when we further adjusted for ω3PUFAs, since they share
common food sources (oily fish), this inverse association between vitamin D and

Chapter nine Discussion
396
colorectal cancer was attenuated (Table 91). Regarding calcium, high dietary intakes
were associated with an increased colorectal cancer risk in the crude model (model I),
whereas dietary and total calcium intakes were not associated with colorectal cancer risk
in any of the other models (Table 90 and Table 91). After correcting for multiple testing
using the FDR method by taking into account the tests that were conducted in hypothesis
4 (eight tests) or the tests that were conducted in all four hypotheses (93 tests in the
individual compound analysis), associations between dietary intakes of calcium (p=
0.001; model I) and vitamin D (p=0.01; model II) remained significant (Table 90).
Finally, analysis of the main food sources of vitamin D and calcium, suggested that there
is some evidence in favour of a significant inverse association between colorectal cancer
and intakes of fried and smoked oily fish (vitamin D sources), whereas there is some
evidence of a positive association between colorectal cancer and full fat hard cheese
(calcium source) (Table 92).
Regarding the genetic findings of the current study, none of the four SNPs examined
was associated with colorectal cancer (data not shown). In addition, we investigated the
associations between colorectal cancer, vitamin D and calcium after genotype
stratification to test whether their associations are modified according to the particular
genotype (data not shown). We observed that the inverse association between vitamin D
and colorectal cancer was more profound for individuals of the rs10735810 CC
genotype than for individuals of the CT or TT genotypes. Furthermore, calcium intake
was inversely though not significantly associated with colorectal cancer for the
rs10735810 CC individuals, whereas it was positively associated for the TT individuals
(data not shown). Finally, there was some evidence that rs10735810, a SNP that affects
VDR function, interacts with vitamin D (p for interaction 0.06) and calcium dietary
intakes (p for interaction 0.13) (data not shown). However, given the multiple
interactions examined, we can not rule out the possibility that the observed interaction
between rs10735810, vitamin D and calcium might be due to chance.
Findings from the current study in relation to previous studies
Vitamin D

Chapter nine Discussion
397
A recent clinical trial of vitamin D (10 µg/day) and calcium supplementation (1000
mg/day) for seven years in post-menopausal women did not show any association with
colorectal cancer (234). However, a large proportion of women assigned to vitamin D/
calcium supplementation or of women assigned to placebo were also taking supplements
on their own and the authors suggested that this may have limited their ability to affect
the rates of colorectal cancer further. In addition, this finding might be due to
insufficient time for vitamin D to affect colorectal carcinogenesis, since it has been
proposed that vitamin D may require at least 10 years to act. Furthermore, this finding
might be due to low dosage of vitamin D supplementation and therefore the contrast
between the treatment participants and the control ones might not have been adequate.
Evidence from observational studies measuring serum (plasma) vitamin D (25(OH)D)
was strong and statistically significant, suggesting an average 40% reduction in
colorectal cancer (Table 28). In addition, results from a meta-analysis combining seven
nested case-control studies investigating the association between 25(OH)D in the blood
and colorectal cancer showed a significant inverse association with a combined OR of
0.70 (95% CI 0.56, 0.87) (250). Regarding dietary and total vitamin D, numerous case-
control and cohort studies have examined vitamin D intake in relation to risk of
colorectal cancer (Table 26, Table 27) and findings from most of them have been
discussed in detail in recent review articles (338;340;341). Whereas, some cohort
(including the Nurses’ Health Study, the Health Professionals’ study and the Iowa
Women’s Health Study) and some case-control studies reported statistically significant
and dose dependent inverse associations between vitamin D intakes and colorectal
cancer, other studies reported no associations. In addition, results of two meta-analyses
combining 11 cohort and nine case-control studies showed a weak statistically
significant inverse association for the cohort studies and a weak statistically non-
significant inverse association for the case-control studies (combined RR=0.91, 95% CI
0.84, 1.00; combined OR=0.90, 95% CI 0.80, 1.02; respectively) (250). These
inconsistent and weak associations might be due to the fact that the studies included in
the meta-analyses did not capture total vitamin D intake (dietary intake, supplementary

Chapter nine Discussion
398
intake and skin production) coupled to the measurement error in dietary measures of
vitamin D intake.
Regarding the current study, it is worth mentioning that only dietary and supplementary
vitamin D intake was considered, since we did not have information regarding vitamin D
skin production by UV sunlight. Therefore, the possibility of misclassification due to the
lack of measuring sunshine-produced vitamin D can not be ruled out. It has been
suggested though that a UVB irradiation threshold of 20mJ/cm
2 is required to induce the
vitamin D3 skin production and apparently this threshold is not reached for countries
above latitude 40o during the winter months (342). Since Scotland’s latitude is 55
o, the
sun exposure, especially during the winter months, is relatively low and this will
probably make diet a more important contributor. Finally, the inverse association that
was observed between vitamin D and colorectal cancer in our study was attenuated after
further adjustment for ω3PUFAs. However, these two nutrients were highly correlated
with each other (r=0.82, p-value<0.00005) and therefore it is very difficult to know
whether the inverse association with colorectal cancer is driven by vitamin D and/or by
ω3PUFAs or whether the dilution of the association might be due to an over-control of
the vitamin D intake.
Vitamin D has been suggested to affect colorectal cancer carcinogenesis mainly through
the binding of 1α,25(OH)2D3 (vitamin’s D most active form) on VDR (343). In vitro
laboratory studies suggest that the main anti-neoplastic activities of vitamin D include
inhibition of cell proliferation, induction of differentiation and apoptosis, inhibition of
growth effects and modulation of the signalling pathway of particular cytokines. If
vitamin D is proved to be truly linked with colorectal cancer, then it could be a very
promising chemopreventive agent for colorectal cancer. However, adverse side-effects
of natural vitamin D (in high doses), such as hypocalcaemia, should be overcome (227).
Calcium
Results from several animal studies have suggested that calcium has a protective effect
against colorectal carcinogenesis. In addition, results from a recent Cochrane systematic
review (including findings from two clinical trials) and a meta-analysis based on three
randomised
controlled trials, studying the effect of calcium supplementation on
Chapter nine Discussion
399
colorectal adenoma incidence and recurrence respectively, suggested that daily intake of
calcium (dietary or from supplements) may have a moderate protective effect on
development or recurrence of colorectal adenomas (344;345). However as it has been
already mentioned, the randomised clinical trial from the Women's Health Initiative
found no effect of calcium plus vitamin D supplementation among postmenopausal
women. Regarding observational studies, results from cohort and case-control studies
are inconsistent (Table 29, Table 30). In particular for the prospective studies, some of
the large cohort studies (including the Multiethnic cohort study, the Breast Cancer
Detection Demonstration Project, Professionals Follow-Up Study, the Swedish
Mammography Cohort Study and the Iowa Women’s Health Study) support an inverse
association between either dietary or total calcium intake with an average 30% reduction
in colorectal cancer risk, whereas some others (including the Netherlands Cohort Study,
the Nurses Health Study and the E3N-EPIC prospective study) failed to replicate these
findings (Table 29).
A possible reason for this inconsistency regarding the associations between calcium
intakes and colorectal cancer might be the fact that many studies did not account for
calcium intake from supplements, which might be important contributors of total daily
intakes. An alternative possible explanation of this difference might be the different
levels of calcium intake. In particular, some investigators have suggested that calcium
affects colorectal cancer at the low range of intake with some studies suggesting a cut-
off at 600-800 mg/day where there is no further benefit (261). However, when we
limited our analysis to subjects with a dietary calcium intake of ≤1000 mg, we did not
find a significant association between calcium intake and colorectal cancer. The cut-off
points for the new categories were: 0-600 mg/day (36 cases, 55 controls), 600-800
mg/day (194 cases, 249 controls), 800-900 mg/day (208 cases, 307 controls) and 900-
1000 mg/day (295 cases, 402 controls). After applying model III for the 4th versus the 1
st
category the reported OR (95% CI) was 1.37 (0.81, 2.32) with a p-value for trend 0.98
(data not shown). In contrast, other investigators have suggested that a total calcium
intake of more than 1,200 mg/day may be required in order to observe a preventive
effect against colorectal cancer (346). When we focused our analysis on subjects with

Chapter nine Discussion
400
high dietary or total calcium intake, inverse associations for intakes of more than
1500mg/day were observed. In particular the new cut-off points for total (dietary and
from supplements) calcium intakes were: 0-1000 mg/day (708 cases, 978 controls),
1000-1250 mg/day (773 cases, 975 controls), 1250-1500 mg/day (414 cases, 539
controls), 1500-1750 mg/day (127 cases, 197 controls), >1750 mg/day (39 cases, 87
controls). The results after applying model III for the 4th versus the 1
st category and for
the 5th
versus the 1st category were OR (95% CI): 0.82 (0.62, 1.09) and 0.63 (0.41, 0.97)
respectively with a p-value for trend 0.14 (data not shown). Therefore, a possible
explanation of the inconsistency between different studies might be that like in our study
high intakes of dietary or supplementary calcium (of more than 1500mg/day) might be
necessary, before a protective effect could take place.
Calcium has also been evaluated as a possible chemopreventive agent against colorectal
cancer mainly due to its anti-inflammatory and anti-proliferative properties (343).
Calcium mainly exerts its chemopreventive actions through activation of a calcium-
sensing receptor. This leads to an increase in the levels of intracellular calcium, inducing
a wide range of biological effects including the restrain and differentiation of neoplastic
colon cells (347). Finally, it has also been proposed that calcium can bind on bile and
fatty acids in the colonic lumen reducing the toxicity of these agents (339).
Associations with VDR variants, gene-nutrient interactions
Regarding previous studies on the genetic variants of the VDR in agreement with the
findings of the current study, the combined analysis of five case-control studies
investigating the effect of the VDR rs10735810 variant on colorectal cancer showed no
significant associations (250). However the variant genotype of rs1544410 GG was
found to be significantly associated with colorectal cancer in a meta-analysis of four
studies (combined OR=1.18, 95% CI 1.04, 1.33) (250). We did not replicate this finding,
possibly because rs1544410 was not in Hardy Weinberg equilibrium in our study. In
addition, the few studies that have performed stratified and interaction analyses by
vitamin D and/ or calcium status suggest that the effect of VDR variants might depend
on the intake of these nutrients (250).

Chapter nine Discussion
401
The F (C) allele of FokI (rs10735810) has been found to result in a 3 amino acid shorter
version of the VDR protein that is more efficient in binding vitamin D than the longer
version coded by the f (T) allele. Therefore higher vitamin D or calcium intake might
enhance its activity (348). Both vitamin D and calcium interact biologically with VDR
and it has been suggested that they act together in their anticarcinogenic properties, with
their effects being mainly at the earlier stages of carcinogenesis (adenomas) (349).
Ingles et al (350) showed that the f (T) allele was inversely associated with large
colorectal adenomas (>1cm in diameter; more likely to progress to adenocarcinomas)
among individuals with low vitamin D and calcium intake and concluded that the
association between VDR variants and colorectal adenoma risk are modified by vitamin
D and calcium intake; findings which are in accordance with our results.
Summary
Findings from the current and previous studies suggest an inverse association between
vitamin D intakes and colorectal cancer. Associations in the current study though were
attenuated after adjusting for ω3PUFAs (common food source). These nutrients are
highly correlated and it is therefore difficult to draw specific conclusions regarding
which nutrient is truly associated with colorectal cancer and which not. Vitamin D might
be a particularly useful chemopreventive agent against colorectal cancer (considering
that its main side effects will be prevented) and therefore further investigation of the
vitamin D effect on colorectal cancer by prospective and retrospective studies is very
important. In addition, alternative analytical approaches (e.g. Mendelian randomisation)
that overcome the problems of traditional epidemiological methods (such as
confounding and reverse causation) might be useful in order to establish the relationship
between vitamin D and colorectal cancer. Regarding calcium, high intakes (when
divided into quartiles) were not found to be associated with colorectal cancer. However,
calcium intakes of more than 1500mg/day were significantly associated with a decreased
risk. In addition, results from prospective and retrospective studies are inconsistent and
this inconsistency might be due to different levels of calcium intake. Therefore, based on
the current findings as well as on the inconsistent results from previous studies, the
Chapter nine Discussion
402
effect of calcium should be further investigated in observational studies, considering that
high intakes of calcium could be required for a protective effect to be apparent.
9.3.1.6 Summary
Main findings of part 1 of the currents thesis
To summarise, the main findings of the first part of the current thesis support the overall
evidence that lifestyle and in particular dietary exposures are linked with colorectal
cancer either by increasing or decreasing risk.
The particular dietary factors that were found to be inversely associated with colorectal
cancer after applying several multivariable logistic regression models and after
controlling for multiple testing error were the following subgroups and individual
compounds: flavonols, quercetin, catechin, ω3PUFAs, EPA, DHA, vitamin B6 and
vitamin B12. In addition, high intakes of stearic acid were found to be positively
associated with colorectal cancer and this association persisted even after further energy
or total fatty acids adjustment. In contrast, high intakes of dietary and total folate were
associated with a decreased colorectal cancer risk in the energy-adjusted model, but
these inverse associations were attenuated and a bell shaped association was observed
after further adjustment for several confounding factors including fibre. Regarding
alcohol intake, when it was divided into quartiles, high alcohol consumption was
associated with a significant and dose-dependent decreased colorectal cancer risk.
However, when alcohol intake was divided in categories an increased colorectal cancer
risk for intakes of higher than 60 g/day was observed. Furthermore, high intakes of
vitamin D were also inversely associated with colorectal cancer after applying model II
and III, but the effect was diluted after further adjusting for ω3PUFAs. Finally, it was
observed that for calcium intakes to be inversely associated with colorectal cancer, a
dosage of 1500mg/day or higher was necessary.
Finally, in the current study high BMI (≥30kg/m2) versus normal BMI (18.5-25 kg/m
2)
was associated with a not statistically significant decreased colorectal cancer risk in both
the matched and unmatched analysis (OR (95% CI), p-value: matched dataset 0.87
(0.71, 1.07), 0.14; unmatched dataset 0.92 (0.78, 1.08), 0.30). These results are not in
accordance with the findings of the associations between colorectal cancer, physical

Chapter nine Discussion
403
activity and dietary energy intake from the current study. In particular, since high levels
of physical activity and low levels of dietary energy intake were associated with a
decreased colorectal cancer risk, it would be expected that high BMI would be
associated with an increased colorectal cancer risk. In addition, the inverse association
between BMI and colorectal cancer is not consistent with many observational studies
that have concluded that obesity is an important risk factor for colorectal cancer (71)
(summarised on page 54). One possible reason for this inconsistent finding might be a
weight underreporting from the cases or a weight misreporting due to their weight
change after their cancer diagnosis. The validity of the LCQ regarding the weight and
height report will be checked in healthy controls by comparing self reported
measurements with measurements conducted from a trained research nurse.
General comments
Observational analytical studies examining the associations between the nutrients of our
primary hypotheses (flavonoids, fatty acids, folate, vitamin B2, vitamin B6, vitamin
B12, alcohol, vitamin D and calcium) and colorectal cancer reported generally
inconsistent results. Many possible explanations for these inconsistent findings have
been suggested. In particular, the inconsistent findings might be due to different levels of
intakes (resulting in different median and range of intakes) of the nutrients under
investigation among the populations, which might be particularly important for nutrients
that have an effect threshold (as for example it has been suggested for alcohol or calcium
intake). However, it is more likely that most of the inconsistent findings are due to
several methodological issues that could affect the accuracy of the reported results.
Generally, case-control studies are more prone to report biased results mainly due to
recall bias. However, other methodological problems including measurement errors, lack
of controlling for all confounding factors and/ or residual confounding can affect equally
results from both case-control and cohort studies.
One of the most important limitations of the majority of the published observational
studies is their inability to detect small effect sizes due to small sample sizes and
therefore limited power. Therefore, for a study to have 80% power to detect a difference
of 20%, which are similar to the effect sizes observed in the current study, a sample size

Chapter nine Discussion
404
of at least 2,500 cases and controls is required (α=0.05). And if we wish to increase the
power to 90% then the study sample of the observational study should be up to at least
3,400 cases and controls. Furthermore, for a study to have 80% power to detect even
smaller effects (e.g. OR=0.90) then a sample size as large as 11,324 may be required.
However, a sample size of more than 11,000 individuals according to the above
traditional power calculations is based on ideal study settings and probably is an
underestimate of the true required sample size. In particular according to a recent
publication, traditional power calculations fail to consider several key elements of the
analysis complexity including for example errors in disease assessment and
measurement errors of the explanatory variables (351).
Observational epidemiology has identified several important risk factors that have been
verified to be causally linked with a disease. A few examples are the effects of smoking
on lung cancer, lipids on coronary disease, high blood pressure on stroke and aspirin or
NSAIDs use on colorectal cancer (352). However, there are many other examples that
findings from observational studies were proven (mainly from randomised clinical trials)
to be false, like the effects of anti-oxidant beta carotene on smoking related cancers,
vitamin E and vitamin C on coronary heart disease. Observational epidemiology though
is an important tool for medical research of disease causes, especially since it is not
possible to conduct randomised clinical trials (which are considered as the gold
standard) for all the potential risk factors and in some cases it is not possible to conduct
a randomised clinical trial at all due to ethical reasons. Therefore, effort to improve the
design of the case-control and cohort studies is essential. In addition, for researchers to
be able to judge and draw conclusions about published studies, the reported results
should be transparent and complete. One way to do that is by applying the STROBE
(Strengthening the Reporting of Observational Studies in Epidemiology) criteria, which
is a guidance of how researchers should report findings from observational studies (353).

Chapter nine Discussion
405
9.3.2 Main findings of part 2: Overall and stepwise
regression analysis
9.3.2.1 Introduction
In this part of the chapter the main results of the overall and stepwise regression analysis
will be presented and discussed. Regarding the overall analysis, univariable logistic
regression models were fitted for the selected demographic, lifestyle, food and nutrient
variables and OR, 95% CI and p-values for trend were calculated for each quartile of the
continuous variables and each category of the categorical variables (Table 96).
Regarding the stepwise regression analysis, forward and backward stepwise regression
models were applied in the whole sample for three different sets of variables using the
quartile form of the continuous variables (Table 97, Table 98, Table 99, Table 100,
Table 101) and this procedure was repeated in sex stratified samples (data not shown).
The explanatory variables that were included in the stepwise regression models
consisted of selected demographic, lifestyle, food and nutrient variables.
9.3.2.2 Main results from overall analysis
The risk factors that were found to be significantly associated with colorectal cancer
were: the demographic and lifestyle risk factors: family history of cancer (p=1.1x10-51
),
NSAIDs intake (p=7.3x10⁻⁷
), dietary energy intake (p=2.0x10⁻⁵
), HRT intake (p=0.0003)
and physical activity (p=0.02) (Table 96); the food group variables: vegetables
(p=2.4x10⁻⁸
), eggs (p=4.0x10⁻⁷
), sweets (p=7.9x10⁻⁷
), fruit/ vegetable juice (p=1.7x10⁻⁶
),
oily fish (p=0.001), coffee (p=0.001), fruit (p=0.009), savoury foods (p=0.009) and
white fish (p=0.04) (Table 96); and the nutrient variables: tMUFAs (p=6.7x10⁻⁶
),
ω3PUFAs (p=1.3x10⁻⁵
), SFAs (p=0.0001), tFAs (p=0.001) and MUFAs (p=0.01);
quercetin (p=0.001), catechin (p=0.001) and phytoestrogen (p=0.04); cholesterol
(p=1.4x10⁻⁵
), fibre (p=3.3x10⁻⁵
), protein (p=0.001) and starch (p=0.05); magnesium
(p=2.7x10⁻¹¹
), potassium (p=9.1x10⁻⁸
), manganese (p=1.8x10⁻⁷
), copper (p=2.0x10⁻⁶
),
iron (p=1.3x10⁻⁵
), zinc (p=4.6x10⁻⁵
), phosphorus (p=0.0001) and selenium (p=0.009);
niacin (p=8.2x10⁻⁷
), vitamin B6 (p=7.1x10⁻⁶
), carotenes (p=2.6x10⁻⁵
), vitamin C
(p=4.6x10⁻⁵
), vitamin A (p=0.001), potential niacin (p=0.001), biotin (p=0.001), folate

Chapter nine Discussion
406
(p=0.003), pantothenic acid (p=0.006), vitamin D (p=0.01), vitamin B1 (p=0.02) and
vitamin B12 (p=0.02) (Table 96).
9.3.2.3 Main results from stepwise regression - Original sample
Whole, female and male samples
After applying forward and backward stepwise regression using three different sets of
variables in the whole sample, the variables that were included: 1) in all models were
family history (6/6 of models), dietary energy (6/6 of models), NSAIDs (6/6 of models),
white fish (4/4 of models) sweets (4/4 models), coffee (4/4 models), fruit/ vegetable
juice (4/4 models) and magnesium (4/4 of models) and 2) in more than 75% of models
were: physical activity (5/6 of models), eggs (3/4 of models), oily fish (3/4 of models),
vegetables (3/4 of models), ω3PUFAs (3/4 of models), quercetin (3/4 of models),
cholesterol (3/4 of models), fibre (3/4 of models) and copper (3/4 of models) (Table
102).
After sex stratification, the following variables were included: 1) in all female and male
derived models: family history (12/12 of models), NSAIDs (12/12 of models), sweets
(8/8 of models) and fruit/ vegetable juice (8/8 of models) and 2) in more than 75% of
female and male models: eggs (6/8 of models), white fish (6/8 of models) and tMUFAs
(6/8 of models) (Table 102). However, few risk factors were included only in female or
male derived models. In particular, the following variables were included only in at least
75% of the models derived from the female sample: tFAs (4/4 of the female models),
vegetables (3/4 of the female models), ω3PUFAs (3/4 of the female models) and HRT
(4/6 of the female models) (Table 102). In addition, the following variables were
included only in at least 75% of the models derived from the male sample: dietary
energy intake (6/6 of the male models), physical activity (5/6 of the male models),
quercetin (3/4 of the male models), flavanones (3/4 of the male models) and manganese
(3/4 of the male models) (Table 102).
To summarise, the variables that were included in all models derived from the whole,
female and male analysis of the original sample for all three sets of variables were
family history, NSAIDs, sweets and fruit/ vegetable juice and the variables that were
included in at least 75% of the models were: eggs and white fish. In addition, the

Chapter nine Discussion
407
variables vegetables and ω3PUFAs were selected to be included in the vast majority of
the models derived from the whole and female samples and similarly, dietary energy and
physical activity were selected to be included in the vast majority of the models derived
from the whole and male samples (Table 102).
The variables with the strongest and most significant associations were among the ones
that were included in the majority of the models. In particular, the lowest p-values were
observed for associations between colorectal cancer and family history (p-value range:
3.6x10-50
to 1.8x10⁻²⁴
), NSAIDs (p-value range: 6.1x10⁻⁶
to 0.009), dietary energy intake
(p-value range: 4.6x10⁻⁷
to 0.002), sweets (p-value range: 4.4x10⁻⁸
to 0.005), fruit/
vegetable juice (p-value range: 1.3x10⁻⁶
to 0.01), eggs (p-value range: 8.3x10⁻⁸
to 0.08)
and white fish (p-value range: 5.4x10⁻⁵
to 0.02) (Table 97, Table 98, Table 99, Table
100, Table 101). In addition, regarding the direction of the associations, the variables
family history, dietary energy, sweets, fruit/ vegetable juice, eggs and white fish were
associated with an increased colorectal cancer risk, whereas the variable NSAIDs was
associated with a decreased risk. Finally, regarding the size of the associations, family
history was observed to have the strongest associations with colorectal cancer (OR
range: 14.68 to 29.53), followed by NSAIDs intake (OR range: 0.68 to 0.79). For the
remaining variables (dietary energy, sweets, fruit/ vegetable juice, eggs and white fish)
the observed association were moderate or weak, with ORs ranging from 1.09 to 1.26
(Table 97, Table 98, Table 99, Table 100, Table 101). However, these observed ORs
might not be accurate since stepwise regression either forward or backward, is not an
appropriate method to draw conclusions regarding effect sizes.
9.3.2.4 Main results from stepwise regression - Bootstrap samples
The bootstrap method was applied to investigate the stability of the models and it was
applied for forward and backward stepwise regression of all three sets of variables
(whole sample). One hundred bootstrap samples were randomly drawn from the original
sample. Then, each bootstrap sample was used to apply forward and backward stepwise
regression for each set of variables (set 1, 2 and 3).
The variables that were selected to be included in the final models using forward
stepwise regression were highly dependent on the subjects that were included in each

Chapter nine Discussion
408
bootstrap sample, since all 100 models were chosen once (for all sets of variables) and
the same was observed for the 100 models derived after applying backward stepwise
regression.
Our findings suggest that the number of noise (false positive) variables that were
selected to be included in the models increased as the number of candidate variables
increased. In particular, the agreement between the models derived from forward and
backward stepwise regression within the same bootstrap sample decreased as the number
of the potential risk factors (number of variables for each set of variables) increased. The
mean percentage of agreement for the analysis of set 1 (30 variables), set 2 (52
variables) and set 3 (82 variables) was 96.97%, 84.36%, 83.12%, respectively. The
number of variables that were selected to be included in the models of the 100 bootstrap
samples was smaller for the set 1 analysis (11-20 variables), than for the set 2 and set 3
analyses (10-31 and 15-39 variables respectively) (data not shown). Finally, for all sets
of variables, more variables were selected to be included in models derived from
backward stepwise regression than in models derived from forward stepwise regression
(mean number of selected variables: 22.54, 20.02; respectively).
Regarding the variables that were selected to be included in the majority (more than
90%) of the models derived from the bootstrap samples were: 1) family history
(600/600 of models), NSAIDs (596/600 of models) and dietary energy (587/600 of
models), for variables that were included in all three sets of variables (3 sets of
variables*2 types of stepwise regression*100 bootstrap samples = 600 models); and 2)
sweets (397/400 of models), fruit/ vegetable juice (395/400 of models), eggs (388/400 of
models), and white fish (381/400), for variables that were included in set 1 and 3 (2 sets
of variables*2 types of stepwise regression*100 bootstrap samples = 400 models) (data
not shown).
Therefore, most of the variables that were selected to be included in the majority (more
than 90%) of the models derived from of the bootstrap samples are similar to the ones
that were selected to be included in the majority (more than 90%) of the models derived
from the original sample and these were: family history, NSAIDs, dietary energy intake,
sweets, fruit/ vegetable juice, eggs and white fish. However, the variables coffee and

Chapter nine Discussion
409
magnesium that were included in all 4 models derived from the original sample were
included in 88.8% (355/400) and 77.8% (311/400) of the models derived from the
bootstrap samples.
9.3.2.5 Comment on main findings of overall and stepwise
regression analysis
Demographic and lifestyle factors
After applying forward and backward stepwise regression, some of the explanatory risk
factors that were found to be associated with colorectal cancer in the majority of the
selected models (>90% of the models derived from the original and bootstrap samples)
were risk factors that have been found to affect colorectal cancer in many published
observational studies. In particular, these factors included family history and dietary
energy intake, which were associated with an increased colorectal cancer risk and
NSAIDs, which was associated with a decreased colorectal cancer risk.
Family history has been considered as one of the main risk factors of colorectal cancer
and for individuals that are in moderate or high family history risk colorectal cancer
screening is offered. According to the findings of a recent meta-analysis (2006), which
was summarised in the Introduction section (on page 48), the pooled colorectal cancer
relative risk estimate when at least one first degree relative was affected was 2.24 (95%
CI 2.06, 2.43) and it rose to 3.97 (95% CI 2.60, 6.06) when there were at least two
affected relatives (47). In addition, the effect of NSAIDs on colorectal cancer has been
investigated in numerous randomised clinical trials and observational studies
(summarised in Introduction, on page 57), with the majority of the results suggesting
that regular use of NSAIDs is associated with a reduced risk of colorectal cancer. On the
other hand, even though the effect of dietary energy intake on colorectal cancer has been
investigated in several observational studies (summarised in Introduction, on page 53)
findings are generally inconsistent, with the case-control studies suggesting a significant
inverse association, whereas cohort studies showing weaker or null associations (61). It
is worth mentioning that findings of the current study suggest that dietary energy intakes
is mainly associated with male colorectal cancer rather than with female colorectal
cancer. An attractive hypothesis of this sex difference would be that high intakes of

Chapter nine Discussion
410
dietary energy only affect male colorectal cancer. Indeed, sex is a factor that has been
hypothesised to be an important effect modulator for several risk factors. However,
many of the claimed sex differences have been proven to be spurious and failed to get
replicated (354). Therefore, an alternative explanation of this finding might be that men
and women misreported their dietary energy intakes in different ways. In particular,
findings from previous studies support the hypothesis that under-reporting of dietary
energy intake is unevenly distributed according to sex with women being more likely to
underreport their dietary energy intakes (355-357).
Food groups
In addition to the widely studied risk factors a few less studied ones were found to be
associated with colorectal cancer in the majority of the resultant models (>90% of the
models derived from the original and bootstrap samples), which included the food
groups sweets, fruit/ vegetable juice, eggs and white fish (with high intakes of all these
food groups being associated with an increased colorectal cancer risk). In addition,
coffee was selected to be included in >90% of the models derived from the original
sample, but this finding was not replicated after applying the bootstrap sampling
method, where coffee was selected to be included in 88.8% of the resultant models
derived from the bootstrap samples. In the following paragraphs evidence from
observational studies regarding the associations between colorectal cancer and these
food groups (sweets, fruit/vegetable juice, eggs, white fish and coffee) will be briefly
summarised.
Sweets
Sweets is a summary variable of high-fat and high-sugar foods, including pudding and
deserts, chocolates, sweets, nuts and crisps, biscuits and cakes. This summary variable
represents an unhealthy dietary pattern and it is moderately correlated with dietary
energy intake (r=0.61, p-value<10-5
). Several observational studies have investigated the
associations between colorectal cancer and dietary (food) patterns, which involves the
joint analyses of foods that are consumed together by forming clusters of individuals
with similar dietary habits (cluster analysis) (358). The two patterns that appear in the
majority of the studies are: 1) a pattern of high intakes in fruit, vegetables and other

Chapter nine Discussion
411
healthy foods (“healthy” pattern) and 2) a pattern of high intakes in meat, high fat and
high sugar foods (“western” pattern) (358). In most of the studies the “healthy” dietary
pattern was found to be associated with a decreased colorectal cancer risk (358-362),
whereas the “western” dietary pattern has been found to be associated with an increased
risk (359;363;364).
Fruit/ vegetable juice
The finding of the positive association between fruit/ vegetable juice and colorectal
cancer is difficult to explain. Generally fruit and vegetable juices have different
properties than the whole fruit or vegetable they come from, since juices contain limited
amount of fibre and the majority of them contain sugars, preservatives and other
additives (30). However, in many studies juice intakes are combined with fruit and
vegetable intakes and their association with colorectal cancer is rarely investigated
independently (365). Fruit and vegetable juices might affect colorectal cancer due to
their high sugar content, however association between sugar intakes (as nutrient) and
colorectal cancer are also inconsistent (30).
Eggs
Eggs are a food group that contains mainly protein, fat (saturated and mono-unsaturated
fat) and cholesterol and are good sources of vitamin D, vitamin A, vitamin B2 and
iodine. High consumption of them has been hypothesised to be associated with an
increased colorectal cancer risk mainly due to their high content in fat and cholesterol.
However, the results from case-control and cohort studies have been inconsistent. In the
first AICR/WCRF report (1997) after reviewing 16 case-control studies, eggs were
classified as a possible risk factor of colorectal cancer (58). However, in the second
WCRF/AICR report (2007), the association between eggs and colorectal cancer was not
investigated (30). In a recent population based case-control study (Shangai, China) an
increased risk of colorectal cancer was reported for the ones of the highest intake of eggs
versus the ones of the lowest (OR (95% CI): 1.4 (1.0, 1.9) for men and 1.3 (0.9, 1.9) for
women) (366). However, results from a recent prospective study failed to replicate this
inverse association (157). Finally, a review that summarised findings regarding the
associations between colorectal cancer and various food groups, concluded that there is

Chapter nine Discussion
412
some though inconsistent evidence that high consumption of eggs is associated with an
increased colorectal cancer risk (367).
White fish
The finding of the positive association between high intakes of white fish and colorectal
cancer is also difficult to explain. The majority of observational studies have
investigated the associations between total fish intake (white fish, oily fish and shellfish)
(368). The AICR/WCRF second report (2007) summarised the findings of 55 case-
control studies and 19 cohort studies and concluded that even if there is some evidence
supporting an inverse association between fish consumption and colorectal cancer the
results are inconsistent and findings might be residually confounded by other food
groups (e.g. meat) (30). In addition a meta-analysis of prospective cohort studies
published in 2007 reported high fish consumption was associated with a borderline
significant decreased colorectal cancer (312). These observed inverse associations
between fish and colorectal cancer might be mainly due to high intakes of oily fish,
which are rich sources of ω3PUFAs, vitamin D and vitamin A. However, it is unlikely
that high intakes of white fish increase colorectal cancer risk. A possible explanation of
the current study’s findings is that 64.3% of the white fish intakes were from fried,
cooked in butter or smoked white fish, whereas only 24.3% were from grilled or
poached white fish. Fried and cooked in butter foods generally have a high content in fat
(both saturated and trans fat) and in heterocyclic amines, which are formed during the
frying process. And therefore fried fish might be positively associated with colorectal
cancer due to these compounds (368). In addition smoked fish is rich in N-nitroso
compounds, which also have been hypothesised to be positively associated with
colorectal cancer (368;369). Therefore, the observed increased risk might be associated
with the cooking preparation rather than the intake of the white fish itself.
Coffee
Finally, coffee may be associated with a decreased colorectal cancer risk either because
it contains particular anticarcinogenic substances, such as phenolic compounds, or
because it increases the motility of the large bowel (370). Some case-control and a few
cohort studies have investigated the association between coffee consumption and

Chapter nine Discussion
413
colorectal cancer. Findings from the majority of the case-control studies, as they were
summarised in a review and a meta-analysis, suggest that coffee may be inversely
associated with colorectal cancer risk, with those that consume four or more cups per
day to have a 24% lower colorectal cancer risk (371;372). However, findings from
cohort studies are less consistent, with the majority of them reporting no significant
associations (370;373).
Nutrients
In marked contrast resultant models after using the set of variables that included
nutrients (set 2 and 3) were not as stable as the derived models after using the sets of
variables that included food groups. Only magnesium was selected to be included in the
majority of the resultant models (>90% of the models derived from the original sample),
but this finding was not replicated after applying the bootstrap sampling method, where
magnesium was selected to be included in 77.8% of the resultant models derived from
the bootstrap samples. One possible explanation of the limited number of nutrients that
were selected to be included in the resultant models might be that nutrients are usually
highly correlated with each other. Therefore multi-collinearity issues, when attending to
fit highly correlated variables in the same model, might lead to unstable resultant
models. Regarding the observed inverse association between magnesium and colorectal
cancer, it has been supported by findings from a few other observational studies (374-
376), whereas some other reported null associations (377-379). One possible reason for
the different findings among these studies might be the different levels of magnesium
intakes between the different populations.
Regarding the nutrients that were investigated in the first part of the thesis (flavonoids,
fatty acids, folate, vitamin B2, vitamin B6, vitamin B12, alcohol, vitamin D and
calcium) the ones that were found to be associated in some of the selected models were
the nutrients: tMUFAs (found in 3/4 of the models derived from the original sample and
in 73.0% of the models derived from the bootstrap samples), tFAs (found in 3/4 of the
models derived from the original sample and in 52.8% of the models derived from the
bootstrap samples), quercetin (found in 3/4 of the models derived from the original
sample and in 47.5% of the models derived from the bootstrap samples) and ω3PUFAs

Chapter nine Discussion
414
(found in 3/4 of the models derived from the original sample and in 47.3% of the models
derived from the bootstrap samples). After sex stratification, tFAs and ω3PUFAs were
found to be inversely associated with female but not male colorectal cancer and similarly
quercetin was found to be inversely associated with male but not female colorectal
cancer. However, similarly to the explanation provided for the finding that high dietary
energy intakes were found to be associated with male and not female colorectal cancer,
these sex specific differences for tFAs, ω3PUFAs and quercetin might be due to
measurement errors with men and women misreporting the intakes of these particular
nutrients.
9.3.2.6 Summary
In the overall analysis several risk factors were found to be significantly associated with
colorectal cancer including demographic and lifestyle factors (family history of cancer,
NSAIDs intake, dietary energy intake, HRT intake and physical activity), food group
variables (vegetables, eggs, sweets, fruit/ vegetable juice, oily fish, coffee, fruit, savoury
foods and white fish) and nutrient variables (tMUFAs, ω3PUFAs, SFAs, tFAs, MUFAs,
quercetin, catechin, phytoestrogen, cholesterol, fibre, protein, starch, magnesium,
potassium, manganese, copper, iron, zinc, phosphorus, selenium, niacin, vitamin B6,
carotenes, vitamin C, vitamin A, potential niacin, biotin, folate, pantothenic acid,
vitamin D, vitamin B1 and vitamin B12).
Regarding forward and backward stepwise regression models, the variables that were
selected to be included in 100% of the models derived from the whole, female and male
analysis of all three sets were family history, NSAIDs, sweets and fruit/ vegetable juice.
In contrast, the variables tFAs, vegetables and ω3PUFAs were selected to be included in
models derived from the female sample, but not in models derived from the male
samples. Similarly, the variables dietary energy intake, physical activity, quercetin,
flavanones and manganese were selected to be included in models derived from the male
sample, but not in models derived from the female sample
Finally, the bootstrap method was applied to investigate the stability of the models of the
whole sample and it was applied for forward and backward stepwise regression of all
three sets of variables. The variables that were selected to be included in models for the

Chapter nine Discussion
415
majority of the bootstrap samples (more than 90%) were: 1) family history, NSAIDs and
dietary energy, if we consider all three sets of variables; 2) family history, NSAIDs,
dietary energy, eggs, sweets, fruit/ vegetable juice and white fish, if we consider set 1
and set 3; and 3) family history, NSAIDs and dietary energy, if we consider set 2 and 3.
9.4 Conclusions and recommendations
In this last part of the chapter, the main conclusions and the hypotheses that were
generated will be outlined. In addition, recommendations for future studies according to
the findings of the present study will be presented and discussed.
9.4.1 Conclusions
Analysis of the current thesis was divided in two parts. The first part was focused on the
analysis of specific hypotheses using logistic regression models adjusted for several
confounding factors, whereas the second part consisted of the overall and stepwise
regression analysis of a number of demographic, lifestyle and dietary risk factors.
9.4.1.1 Main conclusions of first part of the thesis
The main conclusions derived from the analysis of the first part of the thesis (analysis of
hypotheses 1-4) are described below.
1. The flavonoid subgroups flavonols and procyanidins and the flavonoid individual
compounds quercetin and catechin were inversely and dose dependently associated with
colorectal cancer risk after applying the energy-adjusted model (model II). After
applying the full multivariable conditional logistic regression model (model III) the
inverse association with intakes of quercetin and catechin remained statistically
significant, whereas the inverse associations with intakes of flavonols and procyanidins
was marginally not statistically significant (at p=0.05 level). In addition, the associations
with flavonols and catechin remained significant and became stronger after mutually
adjusting between flavonoid categories (model V of flavonoid analysis). Finally, the
associations between colorectal cancer and the intakes of quercetin and catechin (model
II) and the intakes of flavonols and catechin (model V) remained statistically significant
after correcting the p-values for multiple testing using either the Bonferroni or the FDR
method.

Chapter nine Discussion
416
2. Crude intakes of total FAs, of the subgroups SFAs, MUFAs, PUFAs, ω6PUFAs,
tFAs, tMUFAs, and of the individual fatty acids palmitic, stearic, oleic, linoleic, γ-
linolenic and arachidonic were associated with an increased colorectal cancer (model I).
After applying the energy-adjusted model (model II), the fatty acid subgroup ω3PUFAs
and the fatty acid compounds EPA and DHA were inversely associated with colorectal
cancer whereas total FAs, the fatty acid subgroups SFAs, MUFAs, tFAs, tMUFAs, and
the individual fatty acids palmitic, stearic and oleic were positively associated with
colorectal cancer. Furthermore, the associations that remained statistically significant
after applying the full multivariable conditional logistic regression model (model III),
after further energy adjustment (model IV of fatty acid analysis) and after total fatty acid
intake adjustment (model V of fatty acid analysis) were the inverse associations with
high intakes of ω3PUFAs, EPA and DHA and the positive association with high intakes
of stearic acid. Finally, all the aforementioned associations except for the associations
with linoleic and γ-linolenic acids (model I) remained statistically significant after
correcting the p-values for multiple testing using either the Bonferroni or the FDR
method.
3. High intakes of folate and of vitamin B6 were associated with a decreased
colorectal cancer risk in the energy-adjusted model (model II), and these associations
remained statistically significant after correcting the p-values for multiple testing using
either the Bonferroni or the FDR method. In the full multivariable model (model III)
though, the inverse association between folate and colorectal cancer was attenuated and
a bell shaped association with an increased colorectal cancer risk for medium folate
intakes was observed. In addition, the association between vitamin B6 and colorectal
cancer was slightly attenuated and became marginally not statistically significant (at the
p=0.05 level). Regarding vitamin B12, high intakes were associated with a decreased
colorectal cancer risk after applying both model II and III. However, the associations
were not statistically significant after correcting the p-values for multiple testing and
they were diluted after further adjusting for ω3PUFAs.
4. High intakes of calcium were associated with an increased colorectal cancer after
applying the unadjusted crude model (model I), but no statistically significant

Chapter nine Discussion
417
associations were observed after further adjustment. However, higher intakes of calcium
of more than 1500mg/day were associated with a statistically significant decreased
colorectal cancer risk (after applying model III). High intakes of vitamin D were
inversely associated with colorectal cancer in the energy-adjusted model (model II) and
the full multivariable logistic regression model (model III). This inverse association
though was diluted after further adjusting for ω3PUFAs (model IV of vitamin D
analysis). Finally, the associations between colorectal cancer and intakes of calcium
(model I) and vitamin D (model II) remained statistically significant after correcting the
p-values for multiple testing using either the Bonferroni or the FDR method.
5. Finally, analysis of the main food sources of the aforementioned nutrients
generally confirmed these findings, even if in most cases the associations between
colorectal cancer and food group or item intakes were less clear. Briefly, the food groups
or items that were investigated included: the food items regular tea, onions, apples and
red wine for the flavonoids, the food groups meat and meat products, confectionery and
savoury snacks, fish and fish products for the fatty acids, the food items baked or boiled
potatoes, bran flakes, bananas, fried oily fish and liver or liver products for folate,
vitamin B6 and vitamin B12 and fried oily fish, smoked oily fish, semi-skimmed milk
and full fat cheese for vitamin D and calcium.
9.4.1.2 Main conclusions of second part of the thesis
The main conclusions derived from the analysis of the second part of the thesis (overall
and stepwise regression analyses) are described below.
1. The risk factors that were found to be statistically significantly associated with
colorectal cancer in the overall analysis after applying univariable logistic regression
model (residually energy-adjusted) were:
a. The demographic and lifestyle factors: family history of cancer, NSAIDs intake,
dietary energy intake, HRT intake and physical activity;
b. The food group variables: vegetables, eggs, sweets, fruit/ vegetable juice, oily fish,
coffee, fruit, savoury foods and white fish;
c. The nutrient variables: tMUFAs, ω3PUFAs, SFAs, tFAs, MUFAs, quercetin,
catechin, phytoestrogen, cholesterol, fibre, protein, starch, magnesium, potassium,

Chapter nine Discussion
418
manganese, copper, iron, zinc, phosphorus, selenium, niacin, vitamin B6, carotenes,
vitamin C, vitamin A, potential niacin, biotin, folate, pantothenic acid, vitamin D,
vitamin B1 and vitamin B12.
2. Regarding stepwise regression analysis, the variables family history, NSAIDs,
sweets and fruit/ vegetable juice were selected to be included in all models derived from
the whole, female and male analysis of all three sets of variables after applying forward
and backward stepwise regression. In contrast, the variables tFAs, vegetables and
ω3PUFAs, were selected to be included in models derived from the female sample, and
similarly the variables dietary energy intake, physical activity, quercetin, flavanones,
and manganese were selected to be included in models derived from the male sample.
3. The main conclusions of the bootstrap sampling analysis, which was applied in
order to check the stability of the derived models are:
a. All 100 models derived after forward stepwise regression were chosen once (for all
sets of variables), and the same was observed for the 100 models derived after applying
backward stepwise regression.
b. The agreement between the models derived from forward and backward stepwise
regression within the same bootstrap sample was high for the analysis of the set 1
variables, whereas it was lower for the analysis of the set 2 and set 3 variables.
c. The number of variables that were selected to be included in the models of the 100
bootstrap samples was smaller for the set 1 analysis, than for the set 2 and set 3 analyses.
d. More variables were selected to be included in models derived from backward
stepwise regression than in models derived from forward stepwise regression.
e. The variables that were selected to be included in models for the majority of the
bootstrap samples (more than 90%) were: i) family history, NSAIDs and dietary energy,
if we consider all three sets of variables; ii) family history, NSAIDs, dietary energy,
eggs, sweets, fruit/ vegetable juice and white fish, if we consider set 1 and set 3; and iii)
family history, NSAIDs and dietary energy, if we consider set 2 and 3.

Chapter nine Discussion
419
9.4.2 Recommendations
The recommendations that are derived from the findings of the current thesis can be
divided in two parts: 1) recommendations regarding the specific findings of the current
study and 2) general recommendations regarding methodological and analytical issues.
9.4.2.1 Recommendations regarding findings of the current thesis
1. The findings of the current study suggest that high intakes of the subgroups
flavonols and procyanidins and of the individual compounds quercetin and catechin
might be inversely and dose dependently associated with colorectal cancer risk.
However, specific recommendation regarding the intakes of these particular flavonoids
is not suggested, mainly because the observed associations were not statistically
significant in all applied models and also because there are inconsistent findings from
previous studies. On the other hand, the subgroups flavones, flavan3ols, flavanones and
phytoestrogens were not associated with colorectal cancer in any of the applied models.
However, interpretation of the findings for these compounds is problematic due to: a)
limited ability of the FFQ to rank individuals according to flavones and flavanones
intakes (based on the validation study results), b) problematic distribution of flavan3ols
intakes (except for catechin and epicatechin intakes) and c) low levels of dietary intake
of phytoestrogens in Scotland leading to insufficient variation. Therefore, further
investigation of the associations between colorectal cancer and intakes of flavonoid
subgroups and individual compounds in future observational studies is recommended.
2. High intakes of SFAs, MUFAs, tFAs and tMUFAs were found to be associated
with an increased colorectal cancer in the current study. However, these associations
were attenuated after further adjustment for various confounding factors. These fatty
acids are mainly found in red and processed meat and they also contribute highly to the
dietary energy intake, which has been found to increase colorectal cancer risk in the
current and other observational studies. Therefore, they still should be considered as
important colorectal cancer risk factors even if they were not found to be statistically
significantly associated with colorectal cancer in all applied models. Health promotion
policies should consider including recommendations for low intakes of these types of fat
or their food sources. One such example is the recommendations published from

Chapter nine Discussion
420
AICR/WCRF report (2007), where it has been suggested that intakes of red meat should
be limited to less than 300g/week and intakes of processed meats should be completely
avoided.
3. In contrast high intakes of ω3PUFAs were found to be inversely and dose
dependently associated with colorectal cancer risk in all applied models (except for the
crude one). It is suggested therefore that ω3PUFAs operate differently than the other
types of fat, decreasing colorectal cancer risk. However, ω3PUFAs share common
sources (main food source: oily fish) with other nutrients that may affect colorectal
carcinogenesis (vitamin B12, vitamin D) and therefore these inverse associations might
be confounded. Therefore, specific recommendations regarding intakes ω3PUFAs are
not suggested. In contrast further investigation of their associations with colorectal
cancer in prospective observational studies is proposed.
4. The findings of the current study suggest that high intakes of folate are not
associated with an increased or decreased colorectal cancer risk. A bell shaped
relationship was observed instead with those of medium folate intakes being at higher
risk. Mandatory folic acid fortification has been introduced in several countries
(including USA and Canada) and has been decided but suspended in the UK.
Considering the findings of the current study as well as the possibility of folate
enhancing colorectal cancer risk, further investigation of the role of folate in prospective
observational studies and examination of the results of two clinical trials investigating
the folate effect on cancer (including colorectal) is recommended prior to the mandatory
folic acid fortification in the UK.
5. High intakes of vitamin B6 and vitamin B12, which act as coenzymes in the one-
carbon metabolic pathway have been found to be associated with a decreased colorectal
cancer risk. However, vitamin B6 intakes were attenuated and became marginally not
statistically significant after further adjustment (model III). Similarly, association
between high intakes of vitamin B12 and colorectal cancer was found to be confounded
by ω3PUFAs (common food source). Therefore, specific recommendations regarding
intakes of vitamin B6 or vitamin B12 are not suggested. In contrast, further

Chapter nine Discussion
421
investigation of their associations with colorectal cancer in prospective observational
studies is proposed.
6. Folate, vitamin B2, vitamin B6 and vitamin B12 are all involved in the one-
carbon metabolic pathway. In addition, the enzymes MTHFR, MTR and MTRR are also
involved in this pathway and are coded from polymorphic genes. All these factors have
been proposed to be independently linked to colorectal cancer risk, however results from
the current and other observational studies failed to replicate these associations.
Combined analysis of these factors allowing for possible genetic and environmental
effects on intermediate phenotypes, together with gene-gene and gene-environment
interactions is therefore recommended, in order to further investigate associations
between these risk factors and colorectal cancer. Both conventional (such as stepwise
regression) and more novel analytical methods are proposed to be applied. An example
of a novel analytical model for investigating both the independent associations as well as
various combinations (nutrient-nutrient, gene-gene and gene-nutrient interactions) of
risk factors of a particular pathway, is an approximate method known as Variational
Bayes (380-382). One of the main advantages of the Variational Bayes algorithm is that
it allows effects unsupported by the data to be "switched off" (automatic relevance
determination) and can then prune the developed models to the simplest form that is
supported by the data.
7. Whereas calcium intakes (when divided into quartiles) were not found to be
associated with colorectal cancer, calcium intakes of more than 1500mg/day were
significantly associated with a decreased risk. In addition, results from prospective and
retrospective studies are inconsistent and this inconsistency might be due to different
levels of calcium intake. A current systematic review of two clinical trials investigating
the effect of calcium supplementation on colorectal polyps reported a moderate
reduction in risk of colorectal polyps. However, it concluded that there is not enough
evidence to recommend general use of calcium supplements to prevent colorectal cancer
(344). Based on the current findings as well as on the inconsistent results of previous
studies, the effect of calcium should be further investigated in observational studies,
Chapter nine Discussion
422
considering that high intakes of calcium could be required for a protective effect to be
apparent.
8. Association between vitamin D intakes and colorectal cancer were statistically
significant, however they were attenuated after further adjusting for ω3PUFAs (common
food source). However, due to the fact that these nutrients are highly correlated it is
difficult to draw specific conclusions regarding which nutrient is truly associated with
colorectal cancer and which not. Vitamin D might be a particularly useful
chemopreventive agent against colorectal cancer (considering that its main side effects
will be prevented) and therefore further investigation of the vitamin D effect on
colorectal cancer by prospective and retrospective studies is very important. In addition,
alternative analytical approaches that overcome the problems of traditional
epidemiological methods (such as confounding and reverse causation) might be used in
order to establish the relationship between vitamin D and colorectal cancer. One such
method is the Mendelian randomisation approach, where a genetic variant is treated as
an instrument which is assumed to be associated with the disease only through its
association with the intermediate phenotype (383;384). Finally, given the fact that
prevalence of vitamin D deficiency is high in Scotland (due to high latitude and low
sunshine exposure), if vitamin D will be proven to be significantly linked to colorectal
cancer, health promotion policies should consider including recommendations for an
increase in vitamin D intake by the general public (especially during the winter months).
9. Results from the overall and stepwise regression analysis supported previous
findings of an increased colorectal cancer risk due to a high or moderate family history
risk. Therefore, colorectal cancer screening is recommended for individuals with a high
family history risk. In the current thesis, individuals with moderate and high family
history risk were compared to individuals with low family history risk. However,
investigation of the association between colorectal cancer and a more detailed family
history score is recommended. An example of a comprehensive family history score for
a particular individual is one that takes into consideration the actual number of first,
second and other-degree affected relatives assigning a specific number of points. This or

Chapter nine Discussion
423
similar family history scoring systems will probably make risk assessment and
development of screening programs easier (385).
10. High intakes of dietary energy were found to be positively associated with
increased colorectal cancer risk in the overall analysis and in addition dietary energy was
selected to be included in the majority of the stepwise regression models. Increased
dietary energy intake, when combined to limited physical activity, is one of the main
risk factors of obesity, which is considered as one of the established colorectal cancer
risk factors (even if high BMI was not found to be associated with colorectal cancer in
the current study). Taking all these into consideration, health promotion policies should
possibly include recommendations for limiting dietary energy intakes in order to prevent
colorectal carcinogenesis and other chronic diseases.
11. Regular intake of NSAIDs was found to be inversely associated with colorectal
cancer risk in the overall analysis and in the majority of the stepwise regression models.
This finding is supported by findings of a significant amount of observational studies
and randomised clinical trials. NSAIDs can be considered and recommended as
chemopreventive agents against colorectal carcinogenesis. However, their
gastrointestinal side effects mainly due to reduction of the prostaglandins that protect the
gastric epithelium should be overcome and also an assessment regarding of their other
effects should be evaluated.
12. The overall and stepwise regression analyses generated a few new hypotheses
suggesting that low intakes of fruit/ vegetable juice, eggs, white fish and sweets (a
combined variable of high-fat and high-sugar foods) and high intakes of coffee and
magnesium were associated with a decreased colorectal cancer. Further investigation of
the associations between the aforementioned risk factors and colorectal cancer in future
prospective and retrospective studies is recommended.
13. Finally, in the current study, the associations between particular nutrients and
food groups/ items were examined. A small amount of studies suggest that dietary
pattern analysis should be also conducted investigating the associations between clusters
of particular foods and colorectal cancer. Therefore, application of dietary pattern
analysis on the data of the current thesis is suggested.

Chapter nine Discussion
424
9.4.2.2 General recommendations regarding methodological and
analytical issues
1. According to the findings of the current thesis as well as of other observational
studies, it is clear that establishing causal relationships between environmental
exposures and common diseases using conventional methods of observational
epidemiology is usually problematic. Particular examples include the collinearity issues
between nutrients that have common dietary sources, not allowing to identify the
nutrient that is truly associated with a disease (as for example with ω3PUFAs, vitamin
B12 and vitamin D), or limited power of observational studies to detect gene-
environment interactions. Therefore, the application of novel analytical methods, such as
the already mentioned Mendelian randomisation method or the Variational Bayes
method, might be a way to overcome these limitations. Funding from CR-UK (36-month
CR-UK Population and Behavioural Science Training Fellowship) and CSO (27-month
CSO research grant) has been already secured for exploring these novel methodologies
(Mendelian randomisation and Variational Bayes) using the current dataset (SOCCS
study).
2. Additionally, one of the most problematic areas of observational epidemiology is
the limited power to detect weak and sometimes even moderate associations. Traditional
power calculations tend to underestimate sample size requirements and therefore it has
been suggested that the majority of observational studies is under-powered.
Considerable effort should be made to improve measurement procedures in order to
increase the accuracy and precision of a study, to increase the sample size of individual
studies and to set specific protocols of collaboration and data sharing.
3. Energy adjustment is one of the main issues of nutritional epidemiology,
particularly when investigating associations with nutrients that highly contribute to the
total dietary energy intake. We elected to use the residual energy adjustment method, as
this method is considered to be analogous to a study in which total dietary energy intake
remains constant, whereas the amount of nutrients (composition of diet) varies between
groups. However, to be able to apply this method the nutrient under investigation should
be normally distributed (with or without transformation). For a few nutrients, which

Chapter nine Discussion
425
distributions were not normal even after data transformation, we elected to apply the
standard method of energy adjustment, which is the method that is more closely related
to the residual energy adjustment. In addition, it has been suggested that application of
the residual energy adjustment results to over-correcting and attenuating any statistically
significant associations. However, when we compared four different energy adjustment
methods for the investigation of the associations between specific fatty acids (subgroups
or individual compounds) and colorectal cancer, we did not observe any significant
differences between the different methods. According to this finding, the application of
residual energy adjustments is recommended in all cases, except for when the nutrient
under investigation is not normally distributed, where an alternative method should be
used like the standard method.
4. Matching for particular risk factors is a way to control for the confounding effect
of these risk factors. In addition, it generally increases the precision and power of the
study. However, important limitations include that cases with no controls fulfilling the
matching criteria need to be excluded from the analysis and that recruitment of controls
that are finely matched to the cases is a time consuming and expensive procedure. In our
study, the matched and unmatched datasets were similarly powered to detect moderate
and strong associations, even if the matched dataset included fewer cases and controls.
In addition, we compared the associations between specific fatty acids (subgroups or
individual compounds) and colorectal cancer after applying logistic regression models
on the matched and unmatched datasets and we did not observe any significant
differences. Even if the increase in precision and power is significant when a matching
protocol is employed, future case-control studies should decide whether the effort and
costs of a matched design are necessary by considering the type of their research
questions and how important matching will be in order to address them.
5. According to the findings from the overall and stepwise regression analyses high
intakes of fruit/ vegetable juice were associated with an increased colorectal cancer risk.
Just a few studies though have reported separate associations between colorectal cancer
and intakes of fruit/ vegetable juice and raw fruit or vegetables. Fruit/ vegetable juice
consists of many other ingredients (including sugars, preservatives, etc.) apart from the

Chapter nine Discussion
426
nutrients that are found in the fruit and vegetables they come from. Therefore, it is
recommended that fruit/ vegetable juice should be studied separately from raw fruit or
vegetables.
6. Similarly, in many studies white and oily fish intakes are grouped together when
investigating colorectal cancer risk. However, according to the findings of the current
thesis high intakes of white fish were associated with an increased colorectal cancer risk,
whereas high intakes of oily fish were associated with a decreased colorectal cancer risk.
It is therefore recommended that white and oily fish should be studied separately. In
addition, weight should be given for selecting information regarding the ways of both
food preparation and cooking methods, since they might be equally important for
colorectal carcinogenesis as the foods and nutrients themselves.
7. As it has been shown from the stepwise regression and bootstrap sampling
results, both forward and backward stepwise regression does not produce very stable
models. In addition, the agreement between the models derived from forward and
backward stepwise regression within the same bootstrap sample decreased as the number
of the potential risk factors increased. This finding suggests that the number of noise
variables that were selected to be included in the models increased as the number of
candidate variables increased. Therefore, it might be necessary that the number of the
candidate variables needs to be kept relatively small for the production of more reliable
models.
8. Furthermore, high correlation between the candidate variables can affect the
reliability of the selected models. According to our findings, when stepwise regression
was applied on sets of highly correlated variables (nutrients), then the resultant models
were less stable than when stepwise regression was applied on sets of less correlated
variables (food groups). Multicollinearity issues are particularly important when
applying backward stepwise regression, since the first step of the backward procedure is
to include all the risk factors in the model. However, inclusion of highly correlated
variables in the same model will probably result to spurious findings. Therefore, it is
recommended that when applying stepwise regression models, and backward stepwise
Chapter nine Discussion
427
regression in particular, to avoid including variables that are highly correlated with each
other.
9. Finally, findings from the bootstrap sampling method indicated that the stability
of the stepwise regression models, either forward or backward is generally low.
Therefore, results derived after applying these methods should be treated with caution.
In addition, efforts for replication of any positive findings should be made, either by
applying the selected model to an independent dataset or by examining the stability of
the model with the bootstrap sampling method. In the current study, the stability of the
selected models was tested in 100 bootstrap samples due to time and computer power
issues, however ideally 1,000 to 10,000 samples should be used for adequately
examining the validity of the stepwise regression procedure.

References
428
Reference List
(1) Ponz de LM, Di GC. Pathology of colorectal cancer. Dig Liver Dis 2001; 33(4):372-388.
(2) Cruz-Bustillo CD. Molecular genetics of colorectal cancer. Rev Esp Enferm Dig 2004; 96(1):48-59.
(3) Mitchell RJ, Farrington SM, Dunlop MG, Campbell H. Mismatch repair genes hMLH1 and
hMSH2 and colorectal cancer: a HuGE review. Am J Epidemiol 2002; 156(10):885-902.
(4) Dunlop MG, Farrington SM, Nicholl I et al. Population carrier frequency of hMSH2 and
hMLH1 mutations. Br J Cancer 2000; 83(12):1643-1645.
(5) Aarnio M, Sankila R, Pukkala E et al. Cancer risk in mutation carriers of DNA-mismatch-repair
genes. Int J Cancer 1999; 81(2):214-218.
(6) Millar AL, Pal T, Madlensky L et al. Mismatch repair gene defects contribute to the genetic
basis of double primary cancers of the colorectum and endometrium. Hum Mol Genet 1999;
8(5):823-829.
(7) Diergaarde B, van Geloof WL, van Muijen GN, Kok FJ, Kampman E. Dietary factors and the
occurrence of truncating APC mutations in sporadic colon carcinomas: a Dutch population-based study. Carcinogenesis 2003; 24(2):283-290.
(8) Senda T, Iizuka-Kogo A, Onouchi T, Shimomura A. Adenomatous polyposis coli (APC) plays
multiple roles in the intestinal and colorectal epithelia. Med Mol Morphol 2007; 40(2):68-81.
(9) Segditsas S, Tomlinson I. Colorectal cancer and genetic alterations in the Wnt pathway.
Oncogene 2006; 25(57):7531-7537.
(10) Olschwang S, Serova-Sinilnikova OM, Lenoir GM, Thomas G. PTEN germ-line mutations in
juvenile polyposis coli. Nat Genet 1998; 18(1):12-14.
(11) Howe JR, Bair JL, Sayed MG et al. Germline mutations of the gene encoding bone
morphogenetic protein receptor 1A in juvenile polyposis. Nat Genet 2001; 28(2):184-187.
(12) Gustafson S, Zbuk KM, Scacheri C, Eng C. Cowden syndrome. Semin Oncol 2007; 34(5):428-
434. (13) McGarrity TJ, Kulin HE, Zaino RJ. Peutz-Jeghers syndrome. Am J Gastroenterol 2000;
95(3):596-604.
(14) Xu Y, Pasche B. TGF-beta signaling alterations and susceptibility to colorectal cancer. Hum
Mol Genet 2007; 16 Spec No 1:R14-R20.
(15) Laken SJ, Petersen GM, Gruber SB et al. Familial colorectal cancer in Ashkenazim due to a
hypermutable tract in APC. Nat Genet 1997; 17(1):79-83.
(16) White S, Bubb VJ, Wyllie AH. Germline APC mutation (Gln1317) in a cancer-prone family that
does not result in familial adenomatous polyposis. Genes Chromosomes Cancer 1996;
15(2):122-128.
(17) Chen SP, Tsai ST, Jao SW et al. Single nucleotide polymorphisms of the APC gene and
colorectal cancer risk: a case-control study in Taiwan. BMC Cancer 2006; 6:83.
(18) Al-Tassan N, Chmiel NH, Maynard J et al. Inherited variants of MYH associated with somatic G:C-->T:A mutations in colorectal tumors. Nat Genet 2002; 30(2):227-232.
(19) Sieber OM, Lipton L, Crabtree M et al. Multiple colorectal adenomas, classic adenomatous
polyposis, and germ-line mutations in MYH. N Engl J Med 2003; 348(9):791-799.
(20) Kury S, Buecher B, Robiou-du-Pont S et al. The Thorough Screening of the MUTYH Gene in a
Large French Cohort of Sporadic Colorectal Cancers. Genet Test 2007.
(21) Shaheen NJ, Silverman LM, Keku T et al. Association between hemochromatosis (HFE) gene
mutation carrier status and the risk of colon cancer. J Natl Cancer Inst 2003; 95(2):154-159.
(22) David SS, O'Shea VL, Kundu S. Base-excision repair of oxidative DNA damage. Nature 2007;
447(7147):941-950.
(23) Cheadle JP, Sampson JR. MUTYH-associated polyposis--from defect in base excision repair to
clinical genetic testing. DNA Repair (Amst) 2007; 6(3):274-279. (24) Ilyas M, Straub J, Tomlinson IP, Bodmer WF. Genetic pathways in colorectal and other cancers.
Eur J Cancer 1999; 35(14):1986-2002.
(25) Weitz J, Koch M, Debus J, Hohler T, Galle PR, Buchler MW. Colorectal cancer. Lancet 2005;
365(9454):153-165.

References
429
(26) Harvey NT, Ruszkiewicz A. Serrated neoplasia of the colorectum. World J Gastroenterol 2007;
13(28):3792-3798.
(27) Speake D, Biyani D, Frizelle FA, Watson AJ. Flat adenomas. ANZ J Surg 2007; 77(1-2):4-8.
(28) Martin ES, Tonon G, Sinha R et al. Common and distinct genomic events in sporadic colorectal
cancer and diverse cancer types. Cancer Res 2007; 67(22):10736-10743.
(29) Souglakos J. Genetic alterations in sporadic and hereditary colorectal cancer: implementations for screening and follow-up. Dig Dis 2007; 25(1):9-19.
(30) Food, Nutrition, Physical Activity and the Prevention of Cancer. 2007. American Institute for
Cancer Research, World Cancer Research Fund.
(31) Ferlay J, Autier P, Boniol M, Heanue M, Colombet M, Boyle P. Estimates of the cancer
incidence and mortality in Europe in 2006. Ann Oncol 2007; 18(3):581-592.
(32) Berrino F, De AR, Sant M et al. Survival for eight major cancers and all cancers combined for
European adults diagnosed in 1995-99: results of the EUROCARE-4 study. Lancet Oncol 2007;
8(9):773-783.
(33) Gatta G, Faivre J, Capocaccia R, Ponz de LM. Survival of colorectal cancer patients in Europe
during the period 1978-1989. Eur J Cancer 1998; 34(14):2176-2183.
(34) Gatta G, Capocaccia R, Sant M et al. Understanding variations in survival for colorectal cancer
in Europe: a EUROCARE high resolution study. Gut 2000; 47(4):533-538. (35) Sant M, Aareleid T, Berrino F et al. EUROCARE-3: survival of cancer patients diagnosed 1990-
94--results and commentary. Ann Oncol 2003; 14 Suppl 5:v61-118.
(36) Sant M, Capocaccia R, Coleman MP et al. Cancer survival increases in Europe, but international
differences remain wide. Eur J Cancer 2001; 37(13):1659-1667.
(37) Winawer S, Fletcher R, Rex D et al. Colorectal cancer screening and surveillance: clinical
guidelines and rationale-Update based on new evidence. Gastroenterology 2003; 124(2):544-
560.
(38) Rex DK, Kahi CJ, Levin B et al. Guidelines for colonoscopy surveillance after cancer resection:
a consensus update by the American Cancer Society and the US Multi-Society Task Force on
Colorectal Cancer. Gastroenterology 2006; 130(6):1865-1871.
(39) Bouvier AM, Latournerie M, Jooste V, Lepage C, Cottet V, Faivre J. The lifelong risk of metachronous colorectal cancer justifies long-term colonoscopic follow-up. Eur J Cancer 2008;
44(4):522-527.
(40) Enblad P, Adami HO, Glimelius B, Krusemo U, Pahlman L. The risk of subsequent primary
malignant diseases after cancers of the colon and rectum. A nationwide cohort study. Cancer
1990; 65(9):2091-2100.
(41) Hoar SK, Wilson J, Blot WJ, McLaughlin JK, Winn DM, Kantor AF. Second cancer following
cancer of the digestive system in Connecticut, 1935-82. Natl Cancer Inst Monogr 1985; 68:49-
82.
(42) Slattery ML, Mori M, Gao R, Kerber RA. Impact of family history of colon cancer on
development of multiple primaries after diagnosis of colon cancer. Dis Colon Rectum 1995;
38(10):1053-1058.
(43) Teppo L, Pukkala E, Saxen E. Multiple cancer--an epidemiologic exercise in Finland. J Natl Cancer Inst 1985; 75(2):207-217.
(44) Mitchell PJ, Haboubi NY. The malignant adenoma: when to operate and when to watch. Surg
Endosc 2008; 22(7):1563-1569.
(45) Rapuri S, Spencer J, Eckels D. Importance of postpolypectomy surveillance and
postpolypectomy compliance to follow-up screening--review of literature. Int J Colorectal Dis
2008; 23(5):453-459.
(46) Neugut AI, Jacobson JS, De V, I. Epidemiology of colorectal adenomatous polyps. Cancer
Epidemiol Biomarkers Prev 1993; 2(2):159-176.
(47) Butterworth AS, Higgins JP, Pharoah P. Relative and absolute risk of colorectal cancer for
individuals with a family history: a meta-analysis. Eur J Cancer 2006; 42(2):216-227.
(48) Xie J, Itzkowitz SH. Cancer in inflammatory bowel disease. World J Gastroenterol 2008; 14(3):378-389.
(49) Eaden JA, Abrams KR, Mayberry JF. The risk of colorectal cancer in ulcerative colitis: a meta-
analysis. Gut 2001; 48(4):526-535.
(50) von Roon AC, Reese G, Teare J, Constantinides V, Darzi AW, Tekkis PP. The risk of cancer in
patients with Crohn's disease. Dis Colon Rectum 2007; 50(6):839-855.

References
430
(51) Ryan-Harshman M, Aldoori W. Diet and colorectal cancer: Review of the evidence. Can Fam
Physician 2007; 53(11):1913-1920.
(52) Larsson SC, Wolk A. Meat consumption and risk of colorectal cancer: a meta-analysis of
prospective studies. Int J Cancer 2006; 119(11):2657-2664.
(53) Cross AJ, Leitzmann MF, Gail MH, Hollenbeck AR, Schatzkin A, Sinha R. A prospective study
of red and processed meat intake in relation to cancer risk. PLoS Med 2007; 4(12):e325. (54) Burkitt DP. Related disease--related cause? Lancet 1969; 2(7632):1229-1231.
(55) Park Y, Hunter DJ, Spiegelman D et al. Dietary fiber intake and risk of colorectal cancer: a
pooled analysis of prospective cohort studies. JAMA 2005; 294(22):2849-2857.
(56) Nomura AM, Hankin JH, Henderson BE et al. Dietary fiber and colorectal cancer risk: the
multiethnic cohort study. Cancer Causes Control 2007; 18(7):753-764.
(57) Bingham SA, Norat T, Moskal A et al. Is the association with fiber from foods in colorectal
cancer confounded by folate intake? Cancer Epidemiol Biomarkers Prev 2005; 14(6):1552-
1556.
(58) Food, Nutrition and the Prevention of Cancer: a global prospective. 1997. American Institute
for Cancer Research, World Cancer Research Fund.
(59) Park Y, Subar AF, Kipnis V et al. Fruit and vegetable intakes and risk of colorectal cancer in the
NIH-AARP diet and health study. Am J Epidemiol 2007; 166(2):170-180. (60) Beresford SA, Johnson KC, Ritenbaugh C et al. Low-fat dietary pattern and risk of colorectal
cancer: the Women's Health Initiative Randomized Controlled Dietary Modification Trial.
JAMA 2006; 295(6):643-654.
(61) Satia-Abouta J, Galanko JA, Potter JD, Ammerman A, Martin CF, Sandler RS. Associations of
total energy and macronutrients with colon cancer risk in African Americans and Whites: results
from the North Carolina colon cancer study. Am J Epidemiol 2003; 158(10):951-962.
(62) Franceschi S, La VC, Russo A et al. Macronutrient intake and risk of colorectal cancer in Italy.
Int J Cancer 1998; 76(3):321-324.
(63) Gaard M, Tretli S, Loken EB. Dietary factors and risk of colon cancer: a prospective study of
50,535 young Norwegian men and women. Eur J Cancer Prev 1996; 5(6):445-454.
(64) Giovannucci E, Goldin B. The role of fat, fatty acids, and total energy intake in the etiology of human colon cancer. Am J Clin Nutr 1997; 66(6 Suppl):1564S-1571S.
(65) Kato I, Akhmedkhanov A, Koenig K, Toniolo PG, Shore RE, Riboli E. Prospective study of diet
and female colorectal cancer: the New York University Women's Health Study. Nutr Cancer
1997; 28(3):276-281.
(66) Levi F, Pasche C, Lucchini F, La VC. Macronutrients and colorectal cancer: a Swiss case-
control study. Ann Oncol 2002; 13(3):369-373.
(67) Slattery ML, Caan BJ, Potter JD et al. Dietary energy sources and colon cancer risk. Am J
Epidemiol 1997; 145(3):199-210.
(68) Stemmermann GN, Nomura AM, Heilbrun LK. Cancer risk in relation to fat and energy intake
among Hawaii Japanese: a prospective study. Princess Takamatsu Symp 1985; 16:265-274.
(69) West DW, Slattery ML, Robison LM et al. Dietary intake and colon cancer: sex- and anatomic
site-specific associations. Am J Epidemiol 1989; 130(5):883-894. (70) Slattery ML, Potter J, Caan B et al. Energy balance and colon cancer--beyond physical activity.
Cancer Res 1997; 57(1):75-80.
(71) Pendyala S, Holt P. Obesity and colorectal cancer risk. Gastroenterology 2008; 134(3):896.
(72) Pischon T, Lahmann PH, Boeing H et al. Body size and risk of colon and rectal cancer in the
European Prospective Investigation Into Cancer and Nutrition (EPIC). J Natl Cancer Inst 2006;
98(13):920-931.
(73) Larsson SC, Wolk A. Obesity and colon and rectal cancer risk: a meta-analysis of prospective
studies. Am J Clin Nutr 2007; 86(3):556-565.
(74) Moghaddam AA, Woodward M, Huxley R. Obesity and risk of colorectal cancer: a meta-
analysis of 31 studies with 70,000 events. Cancer Epidemiol Biomarkers Prev 2007;
16(12):2533-2547. (75) Renehan AG, Tyson M, Egger M, Heller RF, Zwahlen M. Body-mass index and incidence of
cancer: a systematic review and meta-analysis of prospective observational studies. Lancet
2008; 371(9612):569-578.

References
431
(76) Howard RA, Freedman DM, Park Y, Hollenbeck A, Schatzkin A, Leitzmann MF. Physical
activity, sedentary behavior, and the risk of colon and rectal cancer in the NIH-AARP Diet and
Health Study. Cancer Causes Control 2008.
(77) Friedenreich C, Norat T, Steindorf K et al. Physical activity and risk of colon and rectal cancers:
the European prospective investigation into cancer and nutrition. Cancer Epidemiol Biomarkers
Prev 2006; 15(12):2398-2407. (78) Samad AK, Taylor RS, Marshall T, Chapman MA. A meta-analysis of the association of
physical activity with reduced risk of colorectal cancer. Colorectal Dis 2005; 7(3):204-213.
(79) Toriola AT, Kurl S, Laukanen JA, Mazengo C, Kauhanen J. Alcohol consumption and risk of
colorectal cancer: the Findrink study. Eur J Epidemiol 2008; 23(6):395-401.
(80) Ferrari P, Jenab M, Norat T et al. Lifetime and baseline alcohol intake and risk of colon and
rectal cancers in the European prospective investigation into cancer and nutrition (EPIC). Int J
Cancer 2007; 121(9):2065-2072.
(81) Moskal A, Norat T, Ferrari P, Riboli E. Alcohol intake and colorectal cancer risk: a dose-
response meta-analysis of published cohort studies. Int J Cancer 2007; 120(3):664-671.
(82) Cho E, Smith-Warner SA, Ritz J et al. Alcohol intake and colorectal cancer: a pooled analysis of
8 cohort studies. Ann Intern Med 2004; 140(8):603-613.
(83) Bongaerts BW, van den Brandt PA, Goldbohm RA, de Goeij AF, Weijenberg MP. Alcohol consumption, type of alcoholic beverage and risk of colorectal cancer at specific subsites. Int J
Cancer 2008.
(84) Longnecker MP, Orza MJ, Adams ME, Vioque J, Chalmers TC. A meta-analysis of alcoholic
beverage consumption in relation to risk of colorectal cancer. Cancer Causes Control 1990;
1(1):59-68.
(85) Botteri E, Iodice S, Raimondi S, Maisonneuve P, Lowenfels AB. Cigarette smoking and
adenomatous polyps: a meta-analysis. Gastroenterology 2008; 134(2):388-395.
(86) Giovannucci E. An updated review of the epidemiological evidence that cigarette smoking
increases risk of colorectal cancer. Cancer Epidemiol Biomarkers Prev 2001; 10(7):725-731.
(87) Paskett ED, Reeves KW, Rohan TE et al. Association between cigarette smoking and colorectal
cancer in the Women's Health Initiative. J Natl Cancer Inst 2007; 99(22):1729-1735. (88) Doll R, Peto R, Boreham J, Sutherland I. Mortality from cancer in relation to smoking: 50 years
observations on British doctors. Br J Cancer 2005; 92(3):426-429.
(89) Ho JW, Lam TH, Tse CW et al. Smoking, drinking and colorectal cancer in Hong Kong
Chinese: a case-control study. Int J Cancer 2004; 109(4):587-597.
(90) Slattery ML, Edwards S, Curtin K, Schaffer D, Neuhausen S. Associations between smoking,
passive smoking, GSTM-1, NAT2, and rectal cancer. Cancer Epidemiol Biomarkers Prev 2003;
12(9):882-889.
(91) Luchtenborg M, Weijenberg MP, Kampman E et al. Cigarette smoking and colorectal cancer:
APC mutations, hMLH1 expression, and GSTM1 and GSTT1 polymorphisms. Am J Epidemiol
2005; 161(9):806-815.
(92) Ghadirian P, Maisonneuve P, Perret C, Lacroix A, Boyle P. Epidemiology of sociodemographic
characteristics, lifestyle, medical history, and colon cancer: a case-control study among French Canadians in Montreal. Cancer Detect Prev 1998; 22(5):396-404.
(93) Diergaarde B, Vrieling A, van Kraats AA, van Muijen GN, Kok FJ, Kampman E. Cigarette
smoking and genetic alterations in sporadic colon carcinomas. Carcinogenesis 2003; 24(3):565-
571.
(94) Baron JA, Cole BF, Sandler RS et al. A randomized trial of aspirin to prevent colorectal
adenomas. N Engl J Med 2003; 348(10):891-899.
(95) Benamouzig R, Deyra J, Martin A et al. Daily soluble aspirin and prevention of colorectal
adenoma recurrence: one-year results of the APACC trial. Gastroenterology 2003; 125(2):328-
336.
(96) Sandler RS, Halabi S, Baron JA et al. A randomized trial of aspirin to prevent colorectal
adenomas in patients with previous colorectal cancer. N Engl J Med 2003; 348(10):883-890. (97) Bertagnolli MM, Eagle CJ, Zauber AG et al. Celecoxib for the prevention of sporadic colorectal
adenomas. N Engl J Med 2006; 355(9):873-884.
(98) Arber N, Eagle CJ, Spicak J et al. Celecoxib for the prevention of colorectal adenomatous
polyps. N Engl J Med 2006; 355(9):885-895.

References
432
(99) Baron JA, Sandler RS, Bresalier RS et al. A randomized trial of rofecoxib for the
chemoprevention of colorectal adenomas. Gastroenterology 2006; 131(6):1674-1682.
(100) Chan AT, Giovannucci EL, Meyerhardt JA, Schernhammer ES, Wu K, Fuchs CS. Aspirin dose
and duration of use and risk of colorectal cancer in men. Gastroenterology 2008; 134(1):21-28.
(101) Gann PH, Manson JE, Glynn RJ, Buring JE, Hennekens CH. Low-dose aspirin and incidence of
colorectal tumors in a randomized trial. J Natl Cancer Inst 1993; 85(15):1220-1224. (102) Cook NR, Lee IM, Gaziano JM et al. Low-dose aspirin in the primary prevention of cancer: the
Women's Health Study: a randomized controlled trial. JAMA 2005; 294(1):47-55.
(103) Flossmann E, Rothwell PM. Effect of aspirin on long-term risk of colorectal cancer: consistent
evidence from randomised and observational studies. Lancet 2007; 369(9573):1603-1613.
(104) Peto R, Gray R, Collins R et al. Randomised trial of prophylactic daily aspirin in British male
doctors. Br Med J (Clin Res Ed) 1988; 296(6618):313-316.
(105) Farrell B, Godwin J, Richards S, Warlow C. The United Kingdom transient ischaemic attack
(UK-TIA) aspirin trial: final results. J Neurol Neurosurg Psychiatry 1991; 54(12):1044-1054.
(106) Dube C, Rostom A, Lewin G et al. The use of aspirin for primary prevention of colorectal
cancer: a systematic review prepared for the U.S. Preventive Services Task Force. Ann Intern
Med 2007; 146(5):365-375.
(107) Grodstein F, Newcomb PA, Stampfer MJ. Postmenopausal hormone therapy and the risk of colorectal cancer: a review and meta-analysis. Am J Med 1999; 106(5):574-582.
(108) McMichael AJ, Potter JD. Reproduction, endogenous and exogenous sex hormones, and colon
cancer: a review and hypothesis. J Natl Cancer Inst 1980; 65(6):1201-1207.
(109) Calle EE, Miracle-McMahill HL, Thun MJ, Heath CW, Jr. Estrogen replacement therapy and
risk of fatal colon cancer in a prospective cohort of postmenopausal women. J Natl Cancer Inst
1995; 87(7):517-523.
(110) Farquhar CM, Marjoribanks J, Lethaby A, Lamberts Q, Suckling JA. Long term hormone
therapy for perimenopausal and postmenopausal women. Cochrane Database Syst Rev
2005;(3):CD004143.
(111) Hodis HN, Mack WJ, Lobo RA et al. Estrogen in the prevention of atherosclerosis. A
randomized, double-blind, placebo-controlled trial. Ann Intern Med 2001; 135(11):939-953. (112) Grady D, Applegate W, Bush T, Furberg C, Riggs B, Hulley SB. Heart and Estrogen/progestin
Replacement Study (HERS): design, methods, and baseline characteristics. Control Clin Trials
1998; 19(4):314-335.
(113) Espeland MA, Bush TL, Mebane-Sims I et al. Rationale, design, and conduct of the PEPI Trial.
Postmenopausal Estrogen/Progestin Interventions. Control Clin Trials 1995; 16(4 Suppl):3S-
19S.
(114) Chlebowski RT, Wactawski-Wende J, Ritenbaugh C et al. Estrogen plus progestin and
colorectal cancer in postmenopausal women. N Engl J Med 2004; 350(10):991-1004.
(115) Heiss G, Wallace R, Anderson GL et al. Health risks and benefits 3 years after stopping
randomized treatment with estrogen and progestin. JAMA 2008; 299(9):1036-1045.
(116) Heim KE, Tagliaferro AR, Bobilya DJ. Flavonoid antioxidants: chemistry, metabolism and
structure-activity relationships. J Nutr Biochem 2002; 13(10):572-584. (117) Arts IC, Hollman PC. Polyphenols and disease risk in epidemiologic studies. Am J Clin Nutr
2005; 81(1 Suppl):317S-325S.
(118) Knekt P, Kumpulainen J, Jarvinen R et al. Flavonoid intake and risk of chronic diseases. Am J
Clin Nutr 2002; 76(3):560-568.
(119) Neuhouser ML. Dietary flavonoids and cancer risk: evidence from human population studies.
Nutr Cancer 2004; 50(1):1-7.
(120) Peterson J, Lagiou P, Samoli E et al. Flavonoid intake and breast cancer risk: a case--control
study in Greece. Br J Cancer 2003; 89(7):1255-1259.
(121) Yao LH, Jiang YM, Shi J et al. Flavonoids in food and their health benefits. Plant Foods Hum
Nutr 2004; 59(3):113-122.
(122) Liggins J, Grimwood R, Bingham SA. Extraction and quantification of lignan phytoestrogens in food and human samples. Anal Biochem 2000; 287(1):102-109.
(123) Moon YJ, Wang X, Morris ME. Dietary flavonoids: effects on xenobiotic and carcinogen
metabolism. Toxicol In Vitro 2006; 20(2):187-210.

References
433
(124) Volate SR, Davenport DM, Muga SJ, Wargovich MJ. Modulation of aberrant crypt foci and
apoptosis by dietary herbal supplements (quercetin, curcumin, silymarin, ginseng and rutin).
Carcinogenesis 2005; 26(8):1450-1456.
(125) Arts IC, Jacobs DR, Jr., Gross M, Harnack LJ, Folsom AR. Dietary catechins and cancer
incidence among postmenopausal women: the Iowa Women's Health Study (United States).
Cancer Causes Control 2002; 13(4):373-382. (126) De Stefani E, Boffetta P, Deneo-Pellegrini H, et al. Dietary antioxidants and lung cancer risk: a
case control study in Uruguay. Nutr Cancer 1999; 34:100-110.
(127) Garcia-Closas R, Agudo A, Gonzalez CA, Riboli E. Intake of specific carotenoids and
flavonoids and the risk of lung cancer in women in Barcelona, Spain. Nutr Cancer 1998;
32(3):154-158.
(128) Hirvonen T, Virtamo J, Korhonen P, Albanes D, Pietinen P. Flavonol and flavone intake and the
risk of cancer in male smokers (Finland). Cancer Causes Control 2001; 12(9):789-796.
(129) Knekt P, Jarvinen R, Seppanen R et al. Dietary flavonoids and the risk of lung cancer and other
malignant neoplasms. Am J Epidemiol 1997; 146(3):223-230.
(130) Le Marchand L, Murphy SP, Hankin JH, Wilkens LR, Kolonel LN. Intake of flavonoids and
lung cancer. J Natl Cancer Inst 2000; 92(2):154-160.
(131) Cutler GJ, Nettleton JA, Ross JA et al. Dietary flavonoid intake and risk of cancer in postmenopausal women: the Iowa Women's Health Study. Int J Cancer 2008; 123(3):664-671.
(132) Goldbohm RA, Hertog MGL, Brants HAM, van Poppel G, van der Brandt PA. Intake of
flavonoids and cancer risk: a prospective cohort study. In: Armado R, Andersson H, Bardσcz S,
Serra F, editors. Polyphenols in foods. Luxembourg: Office for Official Publications of the
European Community, 1998: 159-166.
(133) Lin J, Zhang SM, Wu K, Willett WC, Fuchs CS, Giovannucci E. Flavonoid Intake and
Colorectal Cancer Risk in Men and Women. Am J Epidemiol 2006; 164:644-651.
(134) Mursu J, Nurmi T, Tuomainen TP, Salonen JT, Pukkala E, Voutilainen S. Intake of flavonoids
and risk of cancer in Finnish men: The Kuopio Ischaemic Heart Disease Risk Factor Study. Int J
Cancer 2008; 123(3):660-663.
(135) Rossi M, Negri E, Talamini R et al. Flavonoids and colorectal cancer in Italy. Cancer Epidemiol Biomarkers Prev 2006; 15(8):1555-1558.
(136) Theodoratou E, Kyle J, Cetnarskyj R et al. Dietary flavonoids and the risk of colorectal cancer.
Cancer Epidemiol Biomarkers Prev 2007; 16(4):684-693.
(137) Yuan JM, Gao YT, Yang CS, Yu MC. Urinary biomarkers of tea polyphenols and risk of
colorectal cancer in the Shanghai Cohort Study. Int J Cancer 2007; 120(6):1344-1350.
(138) Cotterchio M, Boucher BA, Manno M, Gallinger S, Okey A, Harper P. Dietary phytoestrogen
intake is associated with reduced colorectal cancer risk. J Nutr 2006; 136(12):3046-3053.
(139) Oba S, Nagata C, Shimizu N et al. Soy product consumption and the risk of colon cancer: a
prospective study in Takayama, Japan. Nutr Cancer 2007; 57(2):151-157.
(140) Berg JM, Tymoczko JL, Stryer L. The Molecular Design of Life. In: Freeman WH, editor.
Biochemistry. 2002.
(141) Lin J, Zhang SM, Cook NR, Lee IM, Buring JE. Dietary fat and fatty acids and risk of colorectal cancer in women. Am J Epidemiol 2004; 160(10):1011-1022.
(142) Nkondjock A, Shatenstein B, Maisonneuve P, Ghadirian P. Specific fatty acids and human
colorectal cancer: an overview. Cancer Detect Prev 2003; 27(1):55-66.
(143) Larsson SC, Kumlin M, Ingelman-Sundberg M, Wolk A. Dietary long-chain n-3 fatty acids for
the prevention of cancer: a review of potential mechanisms. Am J Clin Nutr 2004; 79(6):935-
945.
(144) MacLean CH, Newberry SJ, Mojica WA et al. Effects of omega-3 fatty acids on cancer risk: a
systematic review. JAMA 2006; 295(4):403-415.
(145) Wynder EL, Kajitani T, Ishikawa S, Dodo H, Takano A. Environmental factors of cancer of the
colon and rectum. II. Japanese epidemiological data. Cancer 1969; 23(5):1210-1220.
(146) Reddy BS. Omega-3 fatty acids in colorectal cancer prevention. Int J Cancer 2004; 112(1):1-7. (147) Bostick RM, Potter JD, Kushi LH et al. Sugar, meat, and fat intake, and non-dietary risk factors
for colon cancer incidence in Iowa women (United States). Cancer Causes Control 1994;
5(1):38-52.
(148) Brink M, Weijenberg MP, de Goeij AF et al. Fat and K-ras mutations in sporadic colorectal
cancer in The Netherlands Cohort Study. Carcinogenesis 2004; 25(9):1619-1628.

References
434
(149) Giovannucci E, Rimm EB, Stampfer MJ, Colditz GA, Ascherio A, Willett WC. Intake of fat,
meat, and fiber in relation to risk of colon cancer in men. Cancer Res 1994; 54(9):2390-2397.
(150) Le Marchand L, Wilkens LR, Hankin JH, Kolonel LN, Lyu LC. A case-control study of diet and
colorectal cancer in a multiethnic population in Hawaii (United States): lipids and foods of
animal origin. Cancer Causes Control 1997; 8(4):637-648.
(151) Trichopoulou A, Tzonou A, Hsieh CC, Toupadaki N, Manousos O, Trichopoulos D. High protein, saturated fat and cholesterol diet, and low levels of serum lipids in colorectal cancer. Int
J Cancer 1992; 51(3):386-389.
(152) Weijenberg MP, Luchtenborg M, de Goeij AF et al. Dietary fat and risk of colon and rectal
cancer with aberrant MLH1 expression, APC or KRAS genes. Cancer Causes Control 2007;
18(8):865-879.
(153) Ghadirian P, Lacroix A, Maisonneuve P et al. Nutritional factors and colon carcinoma: a case-
control study involving French Canadians in Montreal, Quebec, Canada. Cancer 1997;
80(5):858-864.
(154) De SE, Mendilaharsu M, eo-Pellegrini H, Ronco A. Influence of dietary levels of fat,
cholesterol, and calcium on colorectal cancer. Nutr Cancer 1997; 29(1):83-89.
(155) Goldbohm RA, van den Brandt PA, van ', V et al. A prospective cohort study on the relation
between meat consumption and the risk of colon cancer. Cancer Res 1994; 54(3):718-723. (156) Flood A, Velie EM, Sinha R et al. Meat, fat, and their subtypes as risk factors for colorectal
cancer in a prospective cohort of women. Am J Epidemiol 2003; 158(1):59-68.
(157) Jarvinen R, Knekt P, Hakulinen T, Rissanen H, Heliovaara M. Dietary fat, cholesterol and
colorectal cancer in a prospective study. Br J Cancer 2001; 85(3):357-361.
(158) Kimura Y, Kono S, Toyomura K et al. Meat, fish and fat intake in relation to subsite-specific
risk of colorectal cancer: The Fukuoka Colorectal Cancer Study. Cancer Sci 2007; 98(4):590-
597.
(159) Kojima M, Wakai K, Tokudome S et al. Serum levels of polyunsaturated fatty acids and risk of
colorectal cancer: a prospective study. Am J Epidemiol 2005; 161(5):462-471.
(160) Kuriki K, Wakai K, Hirose K et al. Risk of colorectal cancer is linked to erythrocyte
compositions of fatty acids as biomarkers for dietary intakes of fish, fat, and fatty acids. Cancer Epidemiol Biomarkers Prev 2006; 15(10):1791-1798.
(161) Nkondjock A, Shatenstein B, Maisonneuve P, Ghadirian P. Assessment of risk associated with
specific fatty acids and colorectal cancer among French-Canadians in Montreal: a case-control
study. Int J Epidemiol 2003; 32(2):200-209.
(162) Pietinen P, Malila N, Virtanen M et al. Diet and risk of colorectal cancer in a cohort of Finnish
men. Cancer Causes Control 1999; 10(5):387-396.
(163) Slattery ML, Potter JD, Duncan DM, Berry TD. Dietary fats and colon cancer: assessment of
risk associated with specific fatty acids. Int J Cancer 1997; 73(5):670-677.
(164) Theodoratou E, McNeill G, Cetnarskyj R et al. Dietary fatty acids and colorectal cancer: a case-
control study. Am J Epidemiol 2007; 166(2):181-195.
(165) Zaridze D, Filipchenko V, Kustov V, Serdyuk V, Duffy S. Diet and colorectal cancer: results of
two case-control studies in Russia. Eur J Cancer 1992; 29A(1):112-115. (166) Wakai K, Hirose K, Matsuo K et al. Dietary risk factors for colon and rectal cancers: a
comparative case-control study. J Epidemiol 2006; 16(3):125-135.
(167) Senesse P, Meance S, Cottet V, Faivre J, Boutron-Ruault MC. High dietary iron and copper and
risk of colorectal cancer: a case-control study in Burgundy, France. Nutr Cancer 2004; 49(1):66-
71.
(168) Chyou PH, Nomura AM, Stemmermann GN. A prospective study of colon and rectal cancer
among Hawaii Japanese men. Ann Epidemiol 1996; 6(4):276-282.
(169) Hall MN, Campos H, Li H et al. Blood levels of long-chain polyunsaturated fatty acids, aspirin,
and the risk of colorectal cancer. Cancer Epidemiol Biomarkers Prev 2007; 16(2):314-321.
(170) Hall MN, Chavarro JE, Lee IM, Willett WC, Ma J. A 22-year Prospective Study of Fish, n-3
Fatty Acid Intake, and Colorectal Cancer Risk in Men. Cancer Epidemiol Biomarkers Prev 2008; 17(5):1136-1143.
(171) Kobayashi M, Tsubono Y, Otani T, Hanaoka T, Sobue T, Tsugane S. Fish, long-chain n-3
polyunsaturated fatty acids, and risk of colorectal cancer in middle-aged Japanese: the JPHC
study. Nutr Cancer 2004; 49(1):32-40.

References
435
(172) Tavani A, Pelucchi C, Parpinel M et al. n-3 polyunsaturated fatty acid intake and cancer risk in
Italy and Switzerland. Int J Cancer 2003; 105(1):113-116.
(173) Terry P, Bergkvist L, Holmberg L, Wolk A. No association between fat and fatty acids intake
and risk of colorectal cancer. Cancer Epidemiol Biomarkers Prev 2001; 10(8):913-914.
(174) Koh WP, Yuan JM, van den BD, Lee HP, Yu MC. Interaction between cyclooxygenase-2 gene
polymorphism and dietary n-6 polyunsaturated fatty acids on colon cancer risk: the Singapore Chinese Health Study. Br J Cancer 2004; 90(9):1760-1764.
(175) Slattery ML, Benson J, Ma KN, Schaffer D, Potter JD. Trans-fatty acids and colon cancer. Nutr
Cancer 2001; 39(2):170-175.
(176) Limburg PJ, Liu-Mares W, Vierkant RA et al. Prospective evaluation of trans-fatty acid intake
and colorectal cancer risk in the Iowa Women's Health Study. Int J Cancer 2008.
(177) Kim YI. Folate and DNA methylation: a mechanistic link between folate deficiency and
colorectal cancer? Cancer Epidemiol Biomarkers Prev 2004; 13(4):511-519.
(178) Sharp L, Little J. Polymorphisms in genes involved in folate metabolism and colorectal
neoplasia: a HuGE review. Am J Epidemiol 2004; 159(5):423-443.
(179) Choi SW, Mason JB. Folate status: effects on pathways of colorectal carcinogenesis. J Nutr
2002; 132(8 Suppl):2413S-2418S.
(180) Mason JB, Dickstein A, Jacques PF et al. A temporal association between folic acid fortification and an increase in colorectal cancer rates may be illuminating important biological principles: a
hypothesis. Cancer Epidemiol Biomarkers Prev 2007; 16(7):1325-1329.
(181) De Wals P, Tairou F, Van Allen MI et al. Reduction in neural-tube defects after folic acid
fortification in Canada. N Engl J Med 2007; 357(2):135-142.
(182) Smith AD, Kim YI, Refsum H. Is folic acid good for everyone? Am J Clin Nutr 2008;
87(3):517-533.
(183) Hubner RA, Houlston RD, Muir KR. Should folic acid fortification be mandatory? No. BMJ
2007; 334(7606):1253.
(184) Sanjoaquin MA, Allen N, Couto E, Roddam AW, Key TJ. Folate intake and colorectal cancer
risk: a meta-analytical approach. Int J Cancer 2005; 113(5):825-828.
(185) Benito E, Stiggelbout A, Bosch FX et al. Nutritional factors in colorectal cancer risk: a case-control study in Majorca. Int J Cancer 1991; 49(2):161-167.
(186) Boutron-Ruault MC, Senesse P, Faivre J, Couillault C, Belghiti C. Folate and alcohol intakes:
related or independent roles in the adenoma-carcinoma sequence? Nutr Cancer 1996; 26(3):337-
346.
(187) Brink M, Weijenberg MP, de Goeij AF et al. Dietary folate intake and k-ras mutations in
sporadic colon and rectal cancer in The Netherlands Cohort Study. Int J Cancer 2005;
114(5):824-830.
(188) Coogan PF, Rosenberg L. The use of folic acid antagonists and the risk of colorectal cancer.
Pharmacoepidemiol Drug Saf 2007; 16(10):1111-1119.
(189) de Vogel S, van EM, Luchtenborg M et al. Dietary folate and APC mutations in sporadic
colorectal cancer. J Nutr 2006; 136(12):3015-3021.
(190) Ferraroni M, La VC, D'Avanzo B, Negri E, Franceschi S, Decarli A. Selected micronutrient intake and the risk of colorectal cancer. Br J Cancer 1994; 70(6):1150-1155.
(191) Flood A, Caprario L, Chaterjee N, Lacey JV, Jr., Schairer C, Schatzkin A. Folate, methionine,
alcohol, and colorectal cancer in a prospective study of women in the United States. Cancer
Causes Control 2002; 13(6):551-561.
(192) Freudenheim JL, Graham S, Marshall JR, Haughey BP, Cholewinski S, Wilkinson G. Folate
intake and carcinogenesis of the colon and rectum. Int J Epidemiol 1991; 20(2):368-374.
(193) Giovannucci E, Stampfer MJ, Colditz GA et al. Multivitamin use, folate, and colon cancer in
women in the Nurses' Health Study. Ann Intern Med 1998; 129(7):517-524.
(194) Glynn SA, Albanes D, Pietinen P et al. Colorectal cancer and folate status: a nested case-control
study among male smokers. Cancer Epidemiol Biomarkers Prev 1996; 5(7):487-494.
(195) Harnack L, Jacobs DR, Jr., Nicodemus K, Lazovich D, Anderson K, Folsom AR. Relationship of folate, vitamin B-6, vitamin B-12, and methionine intake to incidence of colorectal cancers.
Nutr Cancer 2002; 43(2):152-158.
(196) Ishihara J, Otani T, Inoue M, Iwasaki M, Sasazuki S, Tsugane S. Low Intake of Vitamin B-6 Is
Associated with Increased Risk of Colorectal Cancer in Japanese Men. J Nutr 2007;
137(7):1808-1814.

References
436
(197) Jiang Q, Chen K, Ma X et al. Diets, polymorphisms of methylenetetrahydrofolate reductase, and
the susceptibility of colon cancer and rectal cancer. Cancer Detect Prev 2005; 29(2):146-154.
(198) Kato I, Dnistrian AM, Schwartz M et al. Serum folate, homocysteine and colorectal cancer risk
in women: a nested case-control study. Br J Cancer 1999; 79(11-12):1917-1922.
(199) Konings EJ, Goldbohm RA, Brants HA, Saris WH, van den Brandt PA. Intake of dietary folate
vitamers and risk of colorectal carcinoma: results from The Netherlands Cohort Study. Cancer 2002; 95(7):1421-1433.
(200) Kune G, Watson L. Colorectal cancer protective effects and the dietary micronutrients folate,
methionine, vitamins B6, B12, C, E, selenium, and lycopene. Nutr Cancer 2006; 56(1):11-21.
(201) La VC, Negri E, Pelucchi C, Franceschi S. Dietary folate and colorectal cancer. Int J Cancer
2002; 102(5):545-547.
(202) Larsson SC, Giovannucci E, Wolk A. A prospective study of dietary folate intake and risk of
colorectal cancer: modification by caffeine intake and cigarette smoking. Cancer Epidemiol
Biomarkers Prev 2005; 14(3):740-743.
(203) Le Marchand L., Donlon T, Hankin JH, Kolonel LN, Wilkens LR, Seifried A. B-vitamin intake,
metabolic genes, and colorectal cancer risk (United States). Cancer Causes Control 2002;
13(3):239-248.
(204) Levi F, Pasche C, Lucchini F, La VC. Selected micronutrients and colorectal cancer. a case-control study from the canton of Vaud, Switzerland. Eur J Cancer 2000; 36(16):2115-2119.
(205) Meyer F, White E. Alcohol and nutrients in relation to colon cancer in middle-aged adults. Am J
Epidemiol 1993; 138(4):225-236.
(206) Murtaugh MA, Curtin K, Sweeney C et al. Dietary intake of folate and co-factors in folate
metabolism, MTHFR polymorphisms, and reduced rectal cancer. Cancer Causes Control 2007;
18(2):153-163.
(207) Otani T, Iwasaki M, Hanaoka T et al. Folate, vitamin B6, vitamin B12, and vitamin B2 intake,
genetic polymorphisms of related enzymes, and risk of colorectal cancer in a hospital-based
case-control study in Japan. Nutr Cancer 2005; 53(1):42-50.
(208) Otani T, Iwasaki M, Sasazuki S, Inoue M, Tsugane S. Plasma folate and risk of colorectal
cancer in a nested case-control study: the Japan Public Health Center-based prospective study. Cancer Causes Control 2008; 19(1):67-74.
(209) Pufulete M, Al-Ghnaniem R, Leather AJ et al. Folate status, genomic DNA hypomethylation,
and risk of colorectal adenoma and cancer: a case control study. Gastroenterology 2003;
124(5):1240-1248.
(210) Rossi E, Hung J, Beilby JP, Knuiman MW, Divitini ML, Bartholomew H. Folate levels and
cancer morbidity and mortality: prospective cohort study from Busselton, Western Australia.
Ann Epidemiol 2006; 16(3):206-212.
(211) Satia-Abouta J, Galanko JA, Martin CF, Potter JD, Ammerman A, Sandler RS. Associations of
micronutrients with colon cancer risk in African Americans and whites: results from the North
Carolina Colon Cancer Study. Cancer Epidemiol Biomarkers Prev 2003; 12(8):747-754.
(212) Sharp L, Little J, Brockton NT et al. Polymorphisms in the methylenetetrahydrofolate reductase
(MTHFR) gene, intakes of folate and related B vitamins and colorectal cancer: a case-control study in a population with relatively low folate intake. Br J Nutr 2008; 99(2):379-389.
(213) Slattery ML, Potter JD, Coates A et al. Plant foods and colon cancer: an assessment of specific
foods and their related nutrients (United States). Cancer Causes Control 1997; 8(4):575-590.
(214) Su LJ, Arab L. Nutritional status of folate and colon cancer risk: evidence from NHANES I
epidemiologic follow-up study. Ann Epidemiol 2001; 11(1):65-72.
(215) Terry P, Jain M, Miller AB, Howe GR, Rohan TE. Dietary intake of folic acid and colorectal
cancer risk in a cohort of women. Int J Cancer 2002; 97(6):864-867.
(216) Van Guelpen B, Hultdin J, Johansson I et al. Low folate levels may protect against colorectal
cancer. Gut 2006; 55(10):1461-1466.
(217) Wei EK, Giovannucci E, Wu K et al. Comparison of risk factors for colon and rectal cancer. Int
J Cancer 2004; 108(3):433-442. (218) Zhang SM, Moore SC, Lin J et al. Folate, vitamin B6, multivitamin supplements, and colorectal
cancer risk in women. Am J Epidemiol 2006; 163(2):108-115.
(219) White E, Shannon JS, Patterson RE. Relationship between vitamin and calcium supplement use
and colon cancer. Cancer Epidemiol Biomarkers Prev 1997; 6(10):769-774.

References
437
(220) Sellers TA, Bazyk AE, Bostick RM et al. Diet and risk of colon cancer in a large prospective
study of older women: an analysis stratified on family history (Iowa, United States). Cancer
Causes Control 1998; 9(4):357-367.
(221) La Vecchia C., Braga C, Negri E et al. Intake of selected micronutrients and risk of colorectal
cancer. Int J Cancer 1997; 73(4):525-530.
(222) Shin A, Li H, Shu XO, Yang G, Gao YT, Zheng W. Dietary intake of calcium, fiber and other micronutrients in relation to colorectal cancer risk: Results from the Shanghai Women's Health
Study. Int J Cancer 2006; 119(12):2938-2942.
(223) Larsson SC, Giovannucci E, Wolk A. Vitamin B6 intake, alcohol consumption, and colorectal
cancer: a longitudinal population-based cohort of women. Gastroenterology 2005; 128(7):1830-
1837.
(224) Theodoratou E, Farrington SM, Tenesa A et al. Dietary vitamin B6 intake and the risk of
colorectal cancer. Cancer Epidemiol Biomarkers Prev 2008; 17(1):171-182.
(225) Wei EK, Giovannucci E, Selhub J, Fuchs CS, Hankinson SE, Ma J. Plasma vitamin B6 and the
risk of colorectal cancer and adenoma in women. J Natl Cancer Inst 2005; 97(9):684-692.
(226) Dahlin AM, Van GB, Hultdin J, Johansson I, Hallmans G, Palmqvist R. Plasma vitamin B12
concentrations and the risk of colorectal cancer: a nested case-referent study. Int J Cancer 2008;
122(9):2057-2061. (227) Jimenez-Lara AM. Colorectal cancer: potential therapeutic benefits of Vitamin D. Int J Biochem
Cell Biol 2007; 39(4):672-677.
(228) Hypponen E, Power C. Hypovitaminosis D in British adults at age 45 y: nationwide cohort
study of dietary and lifestyle predictors. Am J Clin Nutr 2007; 85(3):860-868.
(229) Burleigh E, Potter J. Vitamin D deficiency in outpatients:--a Scottish perspective. Scott Med J
2006; 51(2):27-31.
(230) Larsson SC, Bergkvist L, Rutegard J, Giovannucci E, Wolk A. Calcium and dairy food intakes
are inversely associated with colorectal cancer risk in the Cohort of Swedish Men. Am J Clin
Nutr 2006; 83(3):667-673.
(231) Park SY, Murphy SP, Wilkens LR, Nomura AM, Henderson BE, Kolonel LN. Calcium and
vitamin D intake and risk of colorectal cancer: the Multiethnic Cohort Study. Am J Epidemiol 2007; 165(7):784-793.
(232) Gross MD. Vitamin D and calcium in the prevention of prostate and colon cancer: new
approaches for the identification of needs. J Nutr 2005; 135(2):326-331.
(233) Slattery ML, Samowitz W, Hoffman M, Ma KN, Levin TR, Neuhausen S. Aspirin, NSAIDs,
and colorectal cancer: possible involvement in an insulin-related pathway. Cancer Epidemiol
Biomarkers Prev 2004; 13(4):538-545.
(234) Wactawski-Wende J, Kotchen JM, Anderson GL et al. Calcium plus vitamin D supplementation
and the risk of colorectal cancer. N Engl J Med 2006; 354(7):684-696.
(235) Bostick RM, Potter JD, Sellers TA, McKenzie DR, Kushi LH, Folsom AR. Relation of calcium,
vitamin D, and dairy food intake to incidence of colon cancer among older women. The Iowa
Women's Health Study. Am J Epidemiol 1993; 137(12):1302-1317.
(236) Jarvinen R, Knekt P, Hakulinen T, Aromaa A. Prospective study on milk products, calcium and cancers of the colon and rectum. Eur J Clin Nutr 2001; 55(11):1000-1007.
(237) Kearney J, Giovannucci E, Rimm EB et al. Calcium, vitamin D, and dairy foods and the
occurrence of colon cancer in men. Am J Epidemiol 1996; 143(9):907-917.
(238) Kesse E, Boutron-Ruault MC, Norat T, Riboli E, Clavel-Chapelon F. Dietary calcium,
phosphorus, vitamin D, dairy products and the risk of colorectal adenoma and cancer among
French women of the E3N-EPIC prospective study. Int J Cancer 2005; 117(1):137-144.
(239) Lin J, Zhang SM, Cook NR, Manson JE, Lee IM, Buring JE. Intakes of calcium and vitamin D
and risk of colorectal cancer in women. Am J Epidemiol 2005; 161(8):755-764.
(240) Martinez ME, Giovannucci EL, Colditz GA et al. Calcium, vitamin D, and the occurrence of
colorectal cancer among women. J Natl Cancer Inst 1996; 88(19):1375-1382.
(241) McCullough ML, Robertson AS, Rodriguez C et al. Calcium, vitamin D, dairy products, and risk of colorectal cancer in the Cancer Prevention Study II Nutrition Cohort (United States).
Cancer Causes Control 2003; 14(1):1-12.
(242) Terry P, Baron JA, Bergkvist L, Holmberg L, Wolk A. Dietary calcium and vitamin D intake
and risk of colorectal cancer: a prospective cohort study in women. Nutr Cancer 2002; 43(1):39-
46.

References
438
(243) Zheng W, Anderson KE, Kushi LH et al. A prospective cohort study of intake of calcium,
vitamin D, and other micronutrients in relation to incidence of rectal cancer among
postmenopausal women. Cancer Epidemiol Biomarkers Prev 1998; 7(3):221-225.
(244) Boutron MC, Faivre J, Marteau P, Couillault C, Senesse P, Quipourt V. Calcium, phosphorus,
vitamin D, dairy products and colorectal carcinogenesis: a French case--control study. Br J
Cancer 1996; 74(1):145-151. (245) Kampman E, Slattery ML, Caan B, Potter JD. Calcium, vitamin D, sunshine exposure, dairy
products and colon cancer risk (United States). Cancer Causes Control 2000; 11(5):459-466.
(246) Marcus PM, Newcomb PA. The association of calcium and vitamin D, and colon and rectal
cancer in Wisconsin women. Int J Epidemiol 1998; 27(5):788-793.
(247) Peters RK, Pike MC, Garabrant D, Mack TM. Diet and colon cancer in Los Angeles County,
California. Cancer Causes Control 1992; 3(5):457-473.
(248) Pritchard RS, Baron JA, Gerhardsson d, V. Dietary calcium, vitamin D, and the risk of
colorectal cancer in Stockholm, Sweden. Cancer Epidemiol Biomarkers Prev 1996; 5(11):897-
900.
(249) Slattery ML, Neuhausen SL, Hoffman M et al. Dietary calcium, vitamin D, VDR genotypes and
colorectal cancer. Int J Cancer 2004; 111(5):750-756.
(250) Theodoratou E, Farrington SM, Tenesa A et al. Modification of the inverse association between dietary vitamin D intake and colorectal cancer risk by a FokI variant supports a chemoprotective
action of Vitamin D intake mediated through VDR binding. Int J Cancer 2008; 123(9):2170-
2179.
(251) Braun MM, Helzlsouer KJ, Hollis BW, Comstock GW. Colon cancer and serum vitamin D
metabolite levels 10-17 years prior to diagnosis. Am J Epidemiol 1995; 142(6):608-611.
(252) Feskanich D, Ma J, Fuchs CS et al. Plasma vitamin D metabolites and risk of colorectal cancer
in women. Cancer Epidemiol Biomarkers Prev 2004; 13(9):1502-1508.
(253) Otani T, Iwasaki M, Sasazuki S, Inoue M, Tsugane S. Plasma vitamin D and risk of colorectal
cancer: the Japan Public Health Center-Based Prospective Study. Br J Cancer 2007; 97(3):446-
451.
(254) Tangrea J, Helzlsouer K, Pietinen P et al. Serum levels of vitamin D metabolites and the subsequent risk of colon and rectal cancer in Finnish men. Cancer Causes Control 1997;
8(4):615-625.
(255) Wu K, Feskanich D, Fuchs CS, Willett WC, Hollis BW, Giovannucci EL. A nested case control
study of plasma 25-hydroxyvitamin D concentrations and risk of colorectal cancer. J Natl
Cancer Inst 2007; 99(14):1120-1129.
(256) Gorham ED, Garland CF, Garland FC et al. Optimal vitamin D status for colorectal cancer
prevention: a quantitative meta analysis. Am J Prev Med 2007; 32(3):210-216.
(257) Cho E, Smith-Warner SA, Spiegelman D et al. Dairy foods, calcium, and colorectal cancer: a
pooled analysis of 10 cohort studies. J Natl Cancer Inst 2004; 96(13):1015-1022.
(258) Flood A, Peters U, Chatterjee N, Lacey JV, Jr., Schairer C, Schatzkin A. Calcium from diet and
supplements is associated with reduced risk of colorectal cancer in a prospective cohort of
women. Cancer Epidemiol Biomarkers Prev 2005; 14(1):126-132. (259) Kampman E, Goldbohm RA, van den Brandt PA, van ', V. Fermented dairy products, calcium,
and colorectal cancer in The Netherlands Cohort Study. Cancer Res 1994; 54(12):3186-3190.
(260) Stemmermann GN, Nomura A, Chyou PH. The influence of dairy and nondairy calcium on
subsite large-bowel cancer risk. Dis Colon Rectum 1990; 33(3):190-194.
(261) Wu K, Willett WC, Fuchs CS, Colditz GA, Giovannucci EL. Calcium intake and risk of colon
cancer in women and men. J Natl Cancer Inst 2002; 94(6):437-446.
(262) Arbman G, Axelson O, Ericsson-Begodzki AB, Fredriksson M, Nilsson E, Sjodahl R. Cereal
fiber, calcium, and colorectal cancer. Cancer 1992; 69(8):2042-2048.
(263) Freudenheim JL, Graham S, Marshall JR, Haughey BP, Wilkinson G. A case-control study of
diet and rectal cancer in western New York. Am J Epidemiol 1990; 131(4):612-624.
(264) Kampman E, van ', V, Hiddink GJ, van Aken-Schneijder P, Kok FJ, Hermus RJ. Fermented dairy products, dietary calcium and colon cancer: a case-control study in The Netherlands. Int J
Cancer 1994; 59(2):170-176.
(265) Ma J, Giovannucci E, Pollak M et al. Milk intake, circulating levels of insulin-like growth
factor-I, and risk of colorectal cancer in men. J Natl Cancer Inst 2001; 93(17):1330-1336.

References
439
(266) Negri E, La VC, D'Avanzo B, Franceschi S. Calcium, dairy products, and colorectal cancer.
Nutr Cancer 1990; 13(4):255-262.
(267) Slattery ML, Potter JD, Sorenson AW. Age and risk factors for colon cancer (United States and
Australia): are there implications for understanding differences in case-control and cohort
studies? Cancer Causes Control 1994; 5(6):557-563.
(268) Garton MJ, Abdalla MI, Reid DM, Russell IT. Estimating the point accuracy of population registers using capture-recapture methods in Scotland. J Epidemiol Community Health 1996;
50(1):99-103.
(269) Bolton-Smith C, Smith WC, Woodward M, Tunstall-Pedoe H. Nutrient intakes of different
social-class groups: results from the Scottish Heart Health Study (SHHS). Br J Nutr 1991;
65(3):321-335.
(270) Masson LF, McNeill G, Tomany JO et al. Statistical approaches for assessing the relative
validity of a food-frequency questionnaire: use of correlation coefficients and the kappa statistic.
Public Health Nutr 2003; 6(3):313-321.
(271) Kyle J, Masson LF, Grubb DA, Duthie GG, McNeill G. Estimating dietary flavonoid intake:
comparison of a semi-quantitative food frequency questionnaire with 4-day weighed diet
records in a Scottissh population. Proc.Nutr.Soc. 61[3], 69A. 2002.
Ref Type: Abstract (272) Heald CL, Bolton-Smith C, Ritchie MR, Morton MS, Alexander FE. Phyto-oestrogen intake in
Scottish men: use of serum to validate a self-administered food-frequency questionnaire in older
men. Eur J Clin Nutr 2006; 60(1):129-135.
(273) Ainsworth BE, Haskell WL, Whitt MC et al. Compendium of physical activities: an update of
activity codes and MET intensities. Med Sci Sports Exerc 2000; 32(9 Suppl):S498-S504.
(274) Kyle JAM, Duthie GG. Flavonoids in Foods. In: Taylor & Francis, editor. Flavonoids:
Chemistry, Biochemistry and Applications. 2006.
(275) Ritchie MR. Phyto-oestrogen database. http://medicine.st-andrews.ac.uk/research/docs/ritchie .
2004.
Ref Type: Electronic Citation
(276) Willett W, Stampfer MJ. Total energy intake: implications for epidemiologic analyses. Am J Epidemiol 1986; 124(1):17-27.
(277) Moorman PG, Newman B, Millikan RC, Tse CK, Sandler DP. Participation rates in a case-
control study: the impact of age, race, and race of interviewer. Ann Epidemiol 1999; 9(3):188-
195.
(278) Slattery ML, Edwards SL, Caan BJ, Kerber RA, Potter JD. Response rates among control
subjects in case-control studies. Ann Epidemiol 1995; 5(3):245-249.
(279) Stang A, Ahrens W, Jockel KH. Control response proportions in population-based case-control
studies in Germany. Epidemiology 1999; 10(2):181-183.
(280) Morton LM, Cahill J, Hartge P. Reporting participation in epidemiologic studies: a survey of
practice. Am J Epidemiol 2006; 163(3):197-203.
(281) Rogers A, Murtaugh MA, Edwards S, Slattery ML. Contacting controls: are we working harder
for similar response rates, and does it make a difference? Am J Epidemiol 2004; 160(1):85-90. (282) Franceschi S, Favero A, La VC et al. Food groups and risk of colorectal cancer in Italy. Int J
Cancer 1997; 72(1):56-61.
(283) Willett W. Nutritional Epidemiology. Second Edition ed. USA: Oxford University Press, 1998.
(284) Moon TE, Micozzi MS. Nutrition and Cancer Prevention: Investigating the Role of
Micronutrients. CRC Press, 1989.
(285) Berdanier CD. Handbook of nutrition and food. CRC Press, 2002.
(286) Kirkwood BR, Sterne JA. Essential medical statistics. Blackwell Publishing, 2003.
(287) Pols MA, Peeters PH, Ocke MC, Slimani N, Bueno-de-Mesquita HB, Collette HJ. Estimation of
reproducibility and relative validity of the questions included in the EPIC Physical Activity
Questionnaire. Int J Epidemiol 1997; 26 Suppl 1:S181-S189.
(288) Wareham NJ, Jakes RW, Rennie KL et al. Validity and repeatability of a simple index derived from the short physical activity questionnaire used in the European Prospective Investigation
into Cancer and Nutrition (EPIC) study. Public Health Nutr 2003; 6(4):407-413.
(289) Altman DG. Practical Statistics for Medical Research. London, UK: Chapman & Hall, 1991.
(290) False Discovery Rate Methods for Multiple Comparisons: Utility for Sociology. ASA Annual
Meeting; 2004.

References
440
(291) Benjamini Y, Hochberg Y. Controlling the False Discovery Rate: a Practical and Powerful
Approach to Multiple Testing. Journal of the Royal Statistical Society Series B
(Methodological) 1995; 57(1):289-300.
(292) Katz MH. Multivariable Analysis: A Practical Guide for Clinicians. Second Edition ed.
Published by Cambridge University Press, 2006.
(293) Austin PC, Tu JV. Automated variable selection methods for logistic regression produced unstable models for predicting acute myocardial infarction mortality. J Clin Epidemiol 2004;
57(11):1138-1146.
(294) Austin PC, Tu JV. Bootstrap Methods for Developing Predictive Models. American Statistician
2004; 58:131-137.
(295) HILL AB. The environment and disease: Association or causation? Proc R Soc Med 1965;
58:295-300.
(296) Potischman N, Weed DL. Causal criteria in nutritional epidemiology. Am J Clin Nutr 1999;
69(6):1309S-1314S.
(297) Faria A, Calhau C, de Freitas V, Mateus N. Procyanidins as antioxidants and tumor cell growth
modulators. J Agric Food Chem 2006; 54(6):2392-2397.
(298) Hoensch HP, Kirch W. Potential role of flavonoids in the prevention of intestinal neoplasia: a
review of their mode of action and their clinical perspectives. Int J Gastrointest Cancer 2005; 35(3):187-195.
(299) Hoensch HP, Kirch W. Potential role of flavonoids in the prevention of intestinal neoplasia: a
review of their mode of action and their clinical perspectives. Int J Gastrointest Cancer 2005;
35(3):187-195.
(300) Luceri C, Caderni G, Sanna A, Dolara P. Red wine and black tea polyphenols modulate the
expression of cycloxygenase-2, inducible nitric oxide synthase and glutathione-related enzymes
in azoxymethane-induced f344 rat colon tumors. J Nutr 2002; 132(6):1376-1379.
(301) Veeriah S, Kautenburger T, Habermann N et al. Apple flavonoids inhibit growth of HT29
human colon cancer cells and modulate expression of genes involved in the biotransformation of
xenobiotics. Molecular Carcinogenesis 2006; 45(3):164-174.
(302) Handayani R, Rice L, Cui Y et al. Soy Isoflavones Alter Expression of Genes Associated with Cancer Progression, Including Interleukin-8, in Androgen-Independent PC-3 Human Prostate
Cancer Cells. J Nutr 2006; 136(1):75-82.
(303) Peng G, Dixon DA, Muga SJ, Smith TJ, Wargovich MJ. Green tea polyphenol (-)-
epigallocatechin-3-gallate inhibits cyclooxygenase-2 expression in colon carcinogenesis. Mol
Carcinog 2006; 45(5):309-319.
(304) Park CH, Chang JY, Hahm ER, Park S, Kim HK, Yang CH. Quercetin, a potent inhibitor
against beta-catenin/Tcf signaling in SW480 colon cancer cells. Biochem Biophys Res Commun
2005; 328(1):227-234.
(305) Kim WK, Bang MH, Kim ES et al. Quercetin decreases the expression of ErbB2 and ErbB3
proteins in HT-29 human colon cancer cells. J Nutr Biochem 2005; 16(3):155-162.
(306) Mouat MF, Kolli K, Orlando R, Hargrove JL, Grider A. The effects of quercetin on SW480
human colon carcinoma cells: a proteomic study. Nutr J 2005; 4:11. (307) Escrich E, Moral R, Grau L, Costa I, Solanas M. Molecular mechanisms of the effects of olive
oil and other dietary lipids on cancer. Mol Nutr Food Res 2007; 51(10):1279-1292.
(308) Hooper L, Thompson RL, Harrison RA et al. Risks and benefits of omega 3 fats for mortality,
cardiovascular disease, and cancer: systematic review. BMJ 2006; 332(7544):752-760.
(309) He K, Song Y. Risks and benefits of omega 3 fats: A few thoughts on systematic review. BMJ
2006; 332(7546):915-91a.
(310) Burr ML, shfield-Watt PA, Dunstan FD et al. Lack of benefit of dietary advice to men with
angina: results of a controlled trial. Eur J Clin Nutr 2003; 57(2):193-200.
(311) GISSI-Prevenzione Investigators. Dietary supplementation with n-3 polyunsaturated fatty acids
and vitamin E after myocardial infarction: results of the GISSI-Prevenzione trial. Gruppo
Italiano per lo Studio della Sopravvivenza nell'Infarto miocardico. Lancet 1999; 354(9177):447-455.
(312) Geelen A, Schouten JM, Kamphuis C et al. Fish consumption, n-3 fatty acids, and colorectal
cancer: a meta-analysis of prospective cohort studies. Am J Epidemiol 2007; 166(10):1116-
1125.
(313) Grimble RF. Nutritional modulation of immune function. Proc Nutr Soc 2001; 60(3):389-397.

References
441
(314) Grant WB. Fish consumption, cancer, and Alzheimer disease. Am J Clin Nutr 2000; 71(2):599-
600.
(315) Rose DP, Connolly JM. Omega-3 fatty acids as cancer chemopreventive agents. Pharmacol Ther
1999; 83(3):217-244.
(316) Larsson SC, Kumlin M, Ingelman-Sundberg M, Wolk A. Dietary long-chain n-3 fatty acids for
the prevention of cancer: a review of potential mechanisms. Am J Clin Nutr 2004; 79(6):935-945.
(317) Stender S, Dyerberg J. Influence of trans fatty acids on health. Ann Nutr Metab 2004; 48(2):61-
66.
(318) Vinikoor LC, Schroeder JC, Millikan RC et al. Consumption of trans-fatty acid and its
association with colorectal adenomas. Am J Epidemiol 2008; 168(3):289-297.
(319) Kuhnt K, Wagner A, Kraft J, Basu S, Jahreis G. Dietary supplementation with 11trans- and
12trans-18:1 and oxidative stress in humans. Am J Clin Nutr 2006; 84(5):981-988.
(320) Mozaffarian D, Pischon T, Hankinson SE et al. Dietary intake of trans fatty acids and systemic
inflammation in women. Am J Clin Nutr 2004; 79(4):606-612.
(321) Kim YI. Folate and colorectal cancer: an evidence-based critical review. Mol Nutr Food Res
2007; 51(3):267-292.
(322) Sanderson P, Stone E, Kim YI et al. Folate and colo-rectal cancer risk. Br J Nutr 2007; 98(6):1299-1304.
(323) Slattery ML, Schaffer D, Edwards SL, Ma KN, Potter JD. Are dietary factors involved in DNA
methylation associated with colon cancer? Nutr Cancer 1997; 28(1):52-62.
(324) Sharp L, Little J. Polymorphisms in genes involved in folate metabolism and colorectal
neoplasia: a HuGE review. Am J Epidemiol 2004; 159(5):423-443.
(325) Blount BC, Mack MM, Wehr CM et al. Folate deficiency causes uracil misincorporation into
human DNA and chromosome breakage: implications for cancer and neuronal damage. Proc
Natl Acad Sci U S A 1997; 94(7):3290-3295.
(326) Larsson SC, Giovannucci E, Wolk A. Vitamin B6 intake, alcohol consumption, and colorectal
cancer: a longitudinal population-based cohort of women. Gastroenterology 2005; 128(7):1830-
1837. (327) Blount BC, Mack MM, Wehr CM et al. Folate deficiency causes uracil misincorporation into
human DNA and chromosome breakage: implications for cancer and neuronal damage. Proc
Natl Acad Sci U S A 1997; 94(7):3290-3295.
(328) Komatsu SI, Watanabe H, Oka T, Tsuge H, Nii H, Kato N. Vitamin B-6-supplemented diets
compared with a low vitamin B-6 diet suppress azoxymethane-induced colon tumorigenesis in
mice by reducing cell proliferation. J Nutr 2001; 131(8):2204-2207.
(329) Komatsu S, Yanaka N, Matsubara K, Kato N. Antitumor effect of vitamin B6 and its
mechanisms. Biochim Biophys Acta 2003; 1647(1-2):127-130.
(330) Takeuchi PL, Antunes LM, Takahashi CS. Evaluation of the clastogenicity and
anticlastogenicity of vitamin B(6) in human lymphocyte cultures. Toxicol In Vitro 2007.
(331) Bolander FF. Vitamins: not just for enzymes. Curr Opin Investig Drugs 2006; 7(10):912-915.
(332) Huang Y, Han S, Li Y, Mao Y, Xie Y. Different roles of MTHFR C677T and A1298C polymorphisms in colorectal adenoma and colorectal cancer: a meta-analysis. J Hum Genet
2007; 52(1):73-85.
(333) Hubner RA, Houlston RS. MTHFR C677T and colorectal cancer risk: A meta-analysis of 25
populations. Int J Cancer 2007; 120(5):1027-1035.
(334) Slattery ML, Potter JD, Samowitz W, Schaffer D, Leppert M. Methylenetetrahydrofolate
reductase, diet, and risk of colon cancer. Cancer Epidemiol Biomarkers Prev 1999; 8(6):513-
518.
(335) Le Marchand L., Donlon T, Hankin JH, Kolonel LN, Wilkens LR, Seifried A. B-vitamin intake,
metabolic genes, and colorectal cancer risk (United States). Cancer Causes Control 2002;
13(3):239-248.
(336) Ulrich CM, Kampman E, Bigler J et al. Colorectal adenomas and the C677T MTHFR polymorphism: evidence for gene-environment interaction? Cancer Epidemiol Biomarkers Prev
1999; 8(8):659-668.
(337) Garland CF, Garland FC. Do sunlight and vitamin D reduce the likelihood of colon cancer? Int J
Epidemiol 1980; 9(3):227-231.

References
442
(338) Giovannucci E. Epidemiological evidence for vitamin D and colorectal cancer. J Bone Miner
Res 2007; 22 Suppl 2:V81-V85.
(339) Holt PR. New insights into calcium, dairy and colon cancer. World J Gastroenterol 2008;
14(28):4429-4433.
(340) Gorham ED, Garland CF, Garland FC et al. Vitamin D and prevention of colorectal cancer. J
Steroid Biochem Mol Biol 2005; 97(1-2):179-194. (341) Grant WB, Garland CF. A critical review of studies on vitamin D in relation to colorectal
cancer. Nutr Cancer 2004; 48(2):115-123.
(342) Hollis BW. Circulating 25-hydroxyvitamin D levels indicative of vitamin D sufficiency:
implications for establishing a new effective dietary intake recommendation for vitamin D. J
Nutr 2005; 135(2):317-322.
(343) Das D, Arber N, Jankowski JA. Chemoprevention of colorectal cancer. Digestion 2007;
76(1):51-67.
(344) Weingarten MA, Zalmanovici A, Yaphe J. Dietary calcium supplementation for preventing
colorectal cancer and adenomatous polyps. Cochrane Database Syst Rev 2008;(1):CD003548.
(345) Shaukat A, Scouras N, Schunemann HJ. Role of supplemental calcium in the recurrence of
colorectal adenomas: a metaanalysis of randomized controlled trials. Am J Gastroenterol 2005;
100(2):390-394. (346) Wallace K, Baron JA, Cole BF et al. Effect of calcium supplementation on the risk of large
bowel polyps. J Natl Cancer Inst 2004; 96(12):921-925.
(347) Lamprecht SA, Lipkin M. Chemoprevention of colon cancer by calcium, vitamin D and folate:
molecular mechanisms. Nat Rev Cancer 2003; 3(8):601-614.
(348) Uitterlinden AG, Fang Y, Van Meurs JB, Pols HA, Van Leeuwen JP. Genetics and biology of
vitamin D receptor polymorphisms. Gene 2004; 338(2):143-156.
(349) Grau MV, Baron JA, Sandler RS et al. Vitamin D, calcium supplementation, and colorectal
adenomas: results of a randomized trial. J Natl Cancer Inst 2003; 95(23):1765-1771.
(350) Ingles SA, Wang J, Coetzee GA, Lee ER, Frankl HD, Haile RW. Vitamin D receptor
polymorphisms and risk of colorectal adenomas (United States). Cancer Causes Control 2001;
12(7):607-614. (351) Burton PR, Hansell AL, Fortier I et al. Size matters: just how big is BIG?: Quantifying realistic
sample size requirements for human genome epidemiology. Int J Epidemiol 2008.
(352) Rothwell PM, Bhatia M. Reporting of observational studies. BMJ 2007; 335(7624):783-784.
(353) von Elm E, Altman DG, Egger M, Pocock SJ, Gotzsche PC, Vandenbroucke JP. Strengthening
the Reporting of Observational Studies in Epidemiology (STROBE) statement: guidelines for
reporting observational studies. BMJ 2007; 335(7624):806-808.
(354) Patsopoulos NA, Tatsioni A, Ioannidis JP. Claims of sex differences: an empirical assessment in
genetic associations. JAMA 2007; 298(8):880-893.
(355) Mendez MA, Wynter S, Wilks R, Forrester T. Under- and overreporting of energy is related to
obesity, lifestyle factors and food group intakes in Jamaican adults. Public Health Nutr 2004;
7(1):9-19.
(356) Tomoyasu NJ, Toth MJ, Poehlman ET. Misreporting of total energy intake in older men and women. J Am Geriatr Soc 1999; 47(6):710-715.
(357) Bazelmans C, Matthys C, De HS et al. Predictors of misreporting in an elderly population: the
'Quality of life after 65' study. Public Health Nutr 2007; 10(2):185-191.
(358) Wirfalt E, Midthune D, Reedy J et al. Associations between food patterns defined by cluster
analysis and colorectal cancer incidence in the NIH-AARP diet and health study. Eur J Clin
Nutr 2008.
(359) Slattery ML, Boucher KM, Caan BJ, Potter JD, Ma KN. Eating patterns and risk of colon
cancer. Am J Epidemiol 1998; 148(1):4-16.
(360) Terry P, Hu FB, Hansen H, Wolk A. Prospective study of major dietary patterns and colorectal
cancer risk in women. Am J Epidemiol 2001; 154(12):1143-1149.
(361) Harnack L, Nicodemus K, Jacobs DR, Jr., Folsom AR. An evaluation of the Dietary Guidelines for Americans in relation to cancer occurrence. Am J Clin Nutr 2002; 76(4):889-896.
(362) Mizoue T, Yamaji T, Tabata S et al. Dietary patterns and colorectal adenomas in Japanese men:
the Self-Defense Forces Health Study. Am J Epidemiol 2005; 161(4):338-345.
(363) Fung T, Hu FB, Fuchs C et al. Major dietary patterns and the risk of colorectal cancer in
women. Arch Intern Med 2003; 163(3):309-314.

References
443
(364) Dixon LB, Balder HF, Virtanen MJ et al. Dietary patterns associated with colon and rectal
cancer: results from the Dietary Patterns and Cancer (DIETSCAN) Project. Am J Clin Nutr
2004; 80(4):1003-1011.
(365) Smith-Warner SA, Elmer PJ, Fosdick L et al. Fruits, vegetables, and adenomatous polyps: the
Minnesota Cancer Prevention Research Unit case-control study. Am J Epidemiol 2002;
155(12):1104-1113. (366) Chiu BC, Ji BT, Dai Q et al. Dietary factors and risk of colon cancer in Shanghai, China. Cancer
Epidemiol Biomarkers Prev 2003; 12(3):201-208.
(367) Marques-Vidal P, Ravasco P, Ermelinda CM. Foodstuffs and colorectal cancer risk: a review.
Clin Nutr 2006; 25(1):14-36.
(368) Engeset D, Andersen V, Hjartaker A, Lund E. Consumption of fish and risk of colon cancer in
the Norwegian Women and Cancer (NOWAC) study. Br J Nutr 2007; 98(3):576-582.
(369) Knekt P, Jarvinen R, Dich J, Hakulinen T. Risk of colorectal and other gastro-intestinal cancers
after exposure to nitrate, nitrite and N-nitroso compounds: a follow-up study. Int J Cancer 1999;
80(6):852-856.
(370) Larsson SC, Bergkvist L, Giovannucci E, Wolk A. Coffee consumption and incidence of
colorectal cancer in two prospective cohort studies of Swedish women and men. Am J
Epidemiol 2006; 163(7):638-644. (371) Tavani A, La VC. Coffee, decaffeinated coffee, tea and cancer of the colon and rectum: a
review of epidemiological studies, 1990-2003. Cancer Causes Control 2004; 15(8):743-757.
(372) Giovannucci E. Meta-analysis of coffee consumption and risk of colorectal cancer. Am J
Epidemiol 1998; 147(11):1043-1052.
(373) Michels KB, Willett WC, Fuchs CS, Giovannucci E. Coffee, tea, and caffeine consumption and
incidence of colon and rectal cancer. J Natl Cancer Inst 2005; 97(4):282-292.
(374) Folsom AR, Hong CP. Magnesium intake and reduced risk of colon cancer in a prospective
study of women. Am J Epidemiol 2006; 163(3):232-235.
(375) van den Brandt PA, Smits KM, Goldbohm RA, Weijenberg MP. Magnesium intake and
colorectal cancer risk in the Netherlands Cohort Study. Br J Cancer 2007; 96(3):510-513.
(376) Larsson SC, Bergkvist L, Wolk A. Magnesium intake in relation to risk of colorectal cancer in women. JAMA 2005; 293(1):86-89.
(377) Lin J, Cook NR, Lee IM, Manson JE, Buring JE, Zhang SM. Total magnesium intake and
colorectal cancer incidence in women. Cancer Epidemiol Biomarkers Prev 2006; 15(10):2006-
2009.
(378) Yang CY, Chiu HF. Calcium and magnesium in drinking water and risk of death from rectal
cancer. Int J Cancer 1998; 77(4):528-532.
(379) Yang CY, Chiu HF, Chiu JF, Tsai SS, Cheng MF. Calcium and magnesium in drinking water
and risk of death from colon cancer. Jpn J Cancer Res 1997; 88(10):928-933.
(380) Beal MJ. Variational Algorithms for Approximate Bayesian Inference. 2003.
(381) Jordan MI, Ghahramani Z, Jaakkola TS, Saul LK. An introduction to variational methods for
graphical models. Machine Learning 1999; 37:183-233.
(382) Winn J. Variational Message Passing and its Applications. 2004. (383) Lawlor DA, Harbord RM, Sterne JA, Timpson N, Davey SG. Mendelian randomization: Using
genes as instruments for making causal inferences in epidemiology. Stat Med 2007.
(384) Didelez V, Sheehan N. Mendelian randomization as an instrumental variable approach to causal
inference. Stat Methods Med Res 2007; 16(4):309-330.
(385) Church JM. A scoring system for the strength of a family history of colorectal cancer. Dis Colon
Rectum 2005; 48(5):889-896.