Colorado Springs Air Quality Overview: SO Focus · – Commercial cooking & construction ... –...
17
Colorado Springs Air Quality Overview: SO 2 Focus Slide 1 Colorado Springs City Council February 28, 2017
Transcript of Colorado Springs Air Quality Overview: SO Focus · – Commercial cooking & construction ... –...

Colorado Springs Air Quality Overview:
SO2 Focus
Slide 1Colorado Springs City CouncilFebruary 28, 2017

Slide 2
PollutantAveraging
Time Level FormCarbon Monoxide (CO)
8 hours 9 ppmNot to be exceeded more than once per year
1 hour 35 ppmNitrogen Dioxide (NO2)
1 hour 0.1 ppm 98th percentile of 1-hour daily maximum concentrations, averaged over 3 years
Ozone (O3) 8 hours 0.070 ppm Annual fourth-highest daily maximum 8-hour concentration, averaged over 3 years
Sulfur Dioxide (SO2) 1 hour 0.075 ppm 99th percentile of 1-hour daily maximum concentrations, averaged over 3 years
LeadRolling 3 month average
0.15 μg/m3 Not to be exceeded
Particle Pollution (PM)
PM2.5
1 year 12.0 μg/m3 annual mean, averaged over 3 years
24 hours 35 μg/m3 98th percentile, averaged over 3 years
PM10 24 hours 150 μg/m3 Not to be exceeded more than once per year on average over 3 years
Primary National Ambient Air Quality Standards (NAAQS) Table
Colorado Springs City CouncilFebruary 28, 2017

Air Quality Monitors
in Colorado Springs Region
Slide 3Colorado Springs City CouncilFebruary 28, 2017
Current monitors: GreenHistoric monitors: Red
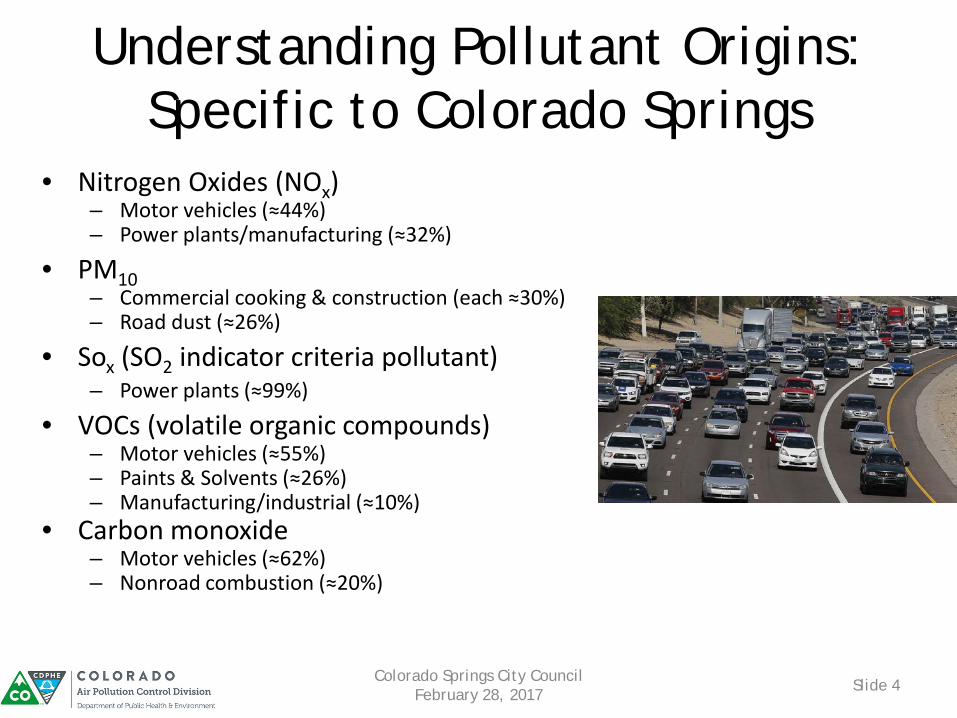
Understanding Pollutant Origins: Specific to Colorado Springs
Slide 4Colorado Springs City CouncilFebruary 28, 2017
• Nitrogen Oxides (NOx)– Motor vehicles (≈44%)– Power plants/manufacturing (≈32%)
• PM10– Commercial cooking & construction (each ≈30%)– Road dust (≈26%)
• Sox (SO2 indicator criteria pollutant)– Power plants (≈99%)
• VOCs (volatile organic compounds)– Motor vehicles (≈55%)– Paints & Solvents (≈26%) – Manufacturing/industrial (≈10%)
• Carbon monoxide– Motor vehicles (≈62%)– Nonroad combustion (≈20%)

Specific Sources of Pollution
Slide 5Colorado Springs City CouncilFebruary 28, 2017
• Motor vehicles largest source of NOx, VOCs, and CO
• Nixon and Drake are largest SO2 sources– 2013 Regional Haze plan requires stringent
limits by end of 2017– Both facilities are regulated and inspected
annually– Drake SO2 Status:
• Neumann scrubber system SO2 controls installed and operational on Units 6 & 7 as of September 2016, currently in testing phase
• Unit 5 shut down in 2016: new permit issued effective December 27, 2016
• Major source permit (Title V) renewal anticipated in 2017
– Nixon SO2 Status:• Dry Flue Gas Desulfurization system installation
underway and on schedule to be installed in spring 2017 and testing to start in summer 2017
Great Sand Dunes National Park & Preserve, closest Class I area for
Regional Haze visibility considerations

Regional SO2 Emissions
Slide 6Colorado Springs City CouncilFebruary 28, 2017

Wintertime Inversions
Slide 7Colorado Springs City CouncilFebruary 28, 2017
Salt Lake Citycourtesy Jude Tibway
Pikes Peak as seen from north
Grand Junction

Air Quality Designations
• Geographic areas are designated as:– Attainment (meeting a standard)– Nonattainment (failing to meet a standard)– Unclassifiable (not enough information to classify)
• Designations are pollutant-specific– Areas can have different designations for different pollutants
• Colorado makes recommendations, EPA makes final designations
Slide 8Colorado Springs City CouncilFebruary 28, 2017
SO2 Standard Designation Process
Slide 9Colorado Springs City CouncilFebruary 28, 2017
• Federal Consent Decree set SO2 designation deadlines for several Colorado power plants– Designation takes into consideration multiple
factors, including monitoring, modeling, and permit requirements
– Multiple rounds of designations • Martin Drake area designated
“unclassifiable” in 2016 round• Nixon and Drake are subject to 2017 round• EPA allows 2017 SO2 designations to utilize
air quality monitoring or modeling– Sources can also take specified emission limit
(<2,000 tpy) to meet requirements. Limits do not automatically make an area attainment.

Drake SO2 Modeling Process
Slide 10Colorado Springs City CouncilFebruary 28, 2017
• Colorado Springs Utilities constructed & operated on-site meteorological tower– Finished collecting data end of Jan 2017– Currently being validated
• Modeling for Drake will be conducted by Colorado Springs Utilities
• CDPHE oversight• Model will use realistic permitted emission limits &
validated on-site meteorological data• EPA and public input on modeling protocol• Modeling results expected summer 2017

Questions?Lisa Devore – Colorado Department of Public Health and
Environment, Air Pollution Control [email protected] or 303-692-3117
Slide 11Colorado Springs City CouncilFebruary 28, 2017

Slide 12
• State Implementation Plan (SIP) due to EPA within 18 months– Public notice and opportunity for comment– EPA may sanction Colorado for failure to submit
approvable SIP– EPA may impose federal plan
• SIP must demonstrate attainment within 5 years after final designation– Take credit for existing rules– Adopt regulations to require reasonable controls on
contributing sources• After attaining standard, Colorado must uphold a
maintenance SIP for about 20 years (requires monitoring, additional plans)
Nonattainment Designation Consequences: SO2
Colorado Springs City CouncilFebruary 28, 2017

Colorado Springs Ozone Trends
Slide 13Colorado Springs City CouncilFebruary 28, 2017

Carbon Monoxide Trends
Slide 14Colorado Springs City CouncilFebruary 28, 2017

Sulfur Dioxide Trends
Slide 15Colorado Springs City CouncilFebruary 28, 2017

PM10 Trends
Slide 16Colorado Springs City CouncilFebruary 28, 2017

PM2.5 Trends
Slide 17Colorado Springs City CouncilFebruary 28, 2017