Colorado River Jackson Symposium poster 2016
1
Using Detrital Zircon U-Pb Geochronology to Quantify the Disrupted Flow of Sediment Down the Colorado River by Texas Hill Country Dams Laura N. Dafov , Daniel F. Stockli , David Mohrig The University of Texas at Austin, Jackson School of Geosciences, Austin, TX, 78712, US Discussion and Conclusions Acknowledgements Results Geologic Setting and Background Introduction and Purpose This project was inspired by a faculty presentation Dr. David Mohrig gave where he was talking about how stream profiles below dams along the Trinity have plenty of sand coming out of the river that’s supposed to be trapped behind the dam. The measured river profiles imply quite a lot of re-incision below the dams. Our project is aimed at quantifying the disrupted flow of sediment down the Colorado River by Texas Hill Country dams by combining detrital zircon U-Pb geochronology and sedimentology methods from Dr. Daniel Stockli’s and Dr. Mohrigs’ research groups.The purpose of studying the Colorado River of Texas is: 1) Understand sedimentary source-to-sink dynamics: Erosional and depositional landscapes are linked by the sediment-routing system. Observations over a wide range of timescales might show how these landscapes are translated into the narrative of geological history. 2) Elucidate on the exact boundaries between sub-units of the Wilcox formation which is still poorly constrained. 3) Quantify the anthropogenic effect on sedimentation rate and lag time observed in the system. The authors would like to thank GSEC and Conocophillips for the opportunity to present at the 5th Annual Jackson School Research Symposium, Dr. Mark Helper for helping with ArcGIS and GPS before sample collection, Dr. Cornel Olariu for helping with Wilcox sample collection and Wilcox related figures, and Jasmine Mason for helping get access to field work tools such as a canoe, oars, and car mounts. JACKSON SCHOOL OF GEOSCIENCES U chron 5-Park, Hooper Sand 4-Kay cli ff , Simboro Sand 1-gulf course, 2-Red bluff , 3-CVS, Calvert Bluff Modified from Crabaugh, 2000, STGS 5-Park, Hooper Sand 4-Kay cli ff , Simboro Sand 1-gulf course, 2-Red bluff , 3-CVS, Calvert Bluff -0.4 -0.3 -0.2 -0.1 0 0.1 0.2 0.3 0.4 -0.3 -0.2 -0.1 0 0.1 0.2 0.3 LD1 LD6 LD7 WKC WHP WCVF PBS PBC 0 200 400 600 800 1000 1200 1400 1600 1800 2000 0 1 2 3 4 5 6 7 8 0 200 400 600 800 1000 1200 1400 1600 1800 2000 0 1 2 3 4 5 6 7 8 9 0 200 400 600 800 1000 1200 1400 1600 1800 2000 0 1 2 3 4 5 6 7 8 0 200 400 600 800 1000 1200 1400 1600 1800 2000 0 4 8 12 17 0 200 400 600 800 1000 1200 1400 1600 1800 2000 0 1 2 3 4 5 6 7 8 0 200 400 600 800 1000 1200 1400 1600 1800 2000 0 3 7 11 15 0 200 400 600 800 1000 1200 1400 1600 1800 2000 0 6 13 19 26 0 200 400 600 800 1000 1200 1400 1600 1800 2000 0 4 9 14 19 Post Wilcox (0-50 Ma) Wilcox Group (50-60 Ma) W. Cordillera (50-275 Ma) E. Mexico Mag m a c Arc (230-290 Ma) Appalachian (275-500 Ma) A m arillo-Witchita (500-550 Ma) Gondwana (550-770 Ma) Grenville (950-1350 Ma) Mid-Con nent (1350-1550 Ma) Yavapai (1600-1800 Ma) Trans-Hudson (1800-2000 Ma) Wopm ay (2000-2300 Ma) Superior, Wyom ing, Slave (2450-3050 Ma) Key LD1 KDE (n=87) LD= modern river sediment collected upstream of dams n= number of grains KDE= kernel density esmaon W= Wilcox sub-units PB= point bars collected downstream of dams 0% 0% 4% 1% 5% 1% 6% 75% 4% 1% 0% 1% 2% LD1 n= 85 1% 0% 0% 0% 8% 2% 4% 73% 11% 1% 0% 0% 0% LD6 n= 115 LD6 KDE (n=115) 0% 0% 4% 1% 4% 1% 2% 75% 4% 3% 2% 2% 2% LD7 n= 105 0% 2% 61% 2% 1% 0% 4% 9% 7% 12% 2% 0% 0% WKC n= 123 0% 0% 69% 4% 7% 0% 1% 6% 6% 5% 2% 0% 0% WHP n= 114 0% 6% 44% 1% 4% 1% 2% 6% 9% 15% 8% 0% 4% WCVF n= 118 9% 7% 30% 2% 5% 0% 2% 29% 6% 7% 2% 0% 1% PBC n= 119 0% 1% 41% 2% 2% 0% 0% 32% 7% 7% 7% 1% 0% PBS n= 120 PBS KDE (n=109) WCVF KDE (n=106) WHP KDE (n=111) PBC KDE (n=109) LD7 KDE (n=100) WKC KDE (n=118) Detrital Zircon Age (Ma) Detrital Zircon Age (Ma) Detrital Zircon Age (Ma) Detrital Zircon Age (Ma) Detrital Zircon Age (Ma) Detrital Zircon Age (Ma) Detrital Zircon Age (Ma) Detrital Zircon Age (Ma) Frequency Multidimensional Scaling Plot Llano Basement Terrane KDEs Frequency Frequency Frequency Frequency Frequency Frequency Frequency Colorado River Basin contribution Colorado River City San Antonio Sample location Dam Geologic Map of Texas Dams, Samples, and River Properties Austin Bastrop Abundant point bars Wilcox sample locations and respective geologic sub-unit Columbus Dallas 50 52 54 56 58 60 Detrital Zircon Age (Ma) Mean = 56.43±0.72 [1.3%] 95% conf. Wtd by data-pt errs only, 0 of 4 rej. MSWD = 0.47, probability = 0.70 box heights are 2σ WCVF Weighted Mean- Max Deposional Age (MDA) WCVF max depositional age ~56 Ma WKC max depositional age ~58 Ma Figure C. Figure A. For the final point bar age rao of 46% Wilcox to 53% Llano, approximately 2 mes the volume of sediment from the Wilcox formaon must be contribung to the system than Llano, following the dams. Wilcox: Llano ~2:1 rao. Even farther downstream, there are 35 Ma grains which cannot come from Llano nor from Wilcox, but likely from Oligocene sands. (See geologic map of Texas in background info.). What’s next? 1) Collect more detrital zircon age data, particularly of the Wilcox sub-units and of samples collected further downstream such as the modern delta to find out whether the young (Oligocene) signal in PBC is present further down the system. 2) Do mass sediment budget measurements; look at the incision and then compare that to the discharge over time. We can couple that with the DZ data. For now we have done a zircon mixing mass balance study. Pre-Llano Uplift Dam 1 Dam 2 Dam 3 Dam 4 Dam 5 Dam 6 Wilcox Formation Re-incision Point Bars Llano Basement rock A) There is very little Grenville ages in the Wilcox samples, meaning that Llano basement terrane was not sub-aerially exposed during deposition of the Wilcox. B) You would expect the river to look mostly like the modern river samples collected upstream from the Texas Hill Country dams, but downstream you see a lot of re-incision and remobilization below the dams that generates sands out of the Wilcox. The sand you are seeing in the current downstream section of the Colorado River is mostly re-excavated. That is why you don’t see any sand below the dams for quite some time. You are generating the sand further down from the dams. The change of age populations is approximately 4% to 40% for Wilcox, and from 70% to 40% for Llano. C) Depositional ages here give a chronostratigraphic age constraint on the Wilcox samples. Figure B.
-
Upload
laura-dafov -
Category
Documents
-
view
80 -
download
1
Transcript of Colorado River Jackson Symposium poster 2016
Using Detrital Zircon U-Pb Geochronology to Quantify the Disrupted Flow of Sediment Down the Colorado River by Texas Hill Country DamsLaura N. Dafov, Daniel F. Stockli, David Mohrig
The University of Texas at Austin, Jackson School of Geosciences, Austin, TX, 78712, US
Discussion and Conclusions
Acknowledgements
Results
Geologic Setting and Background
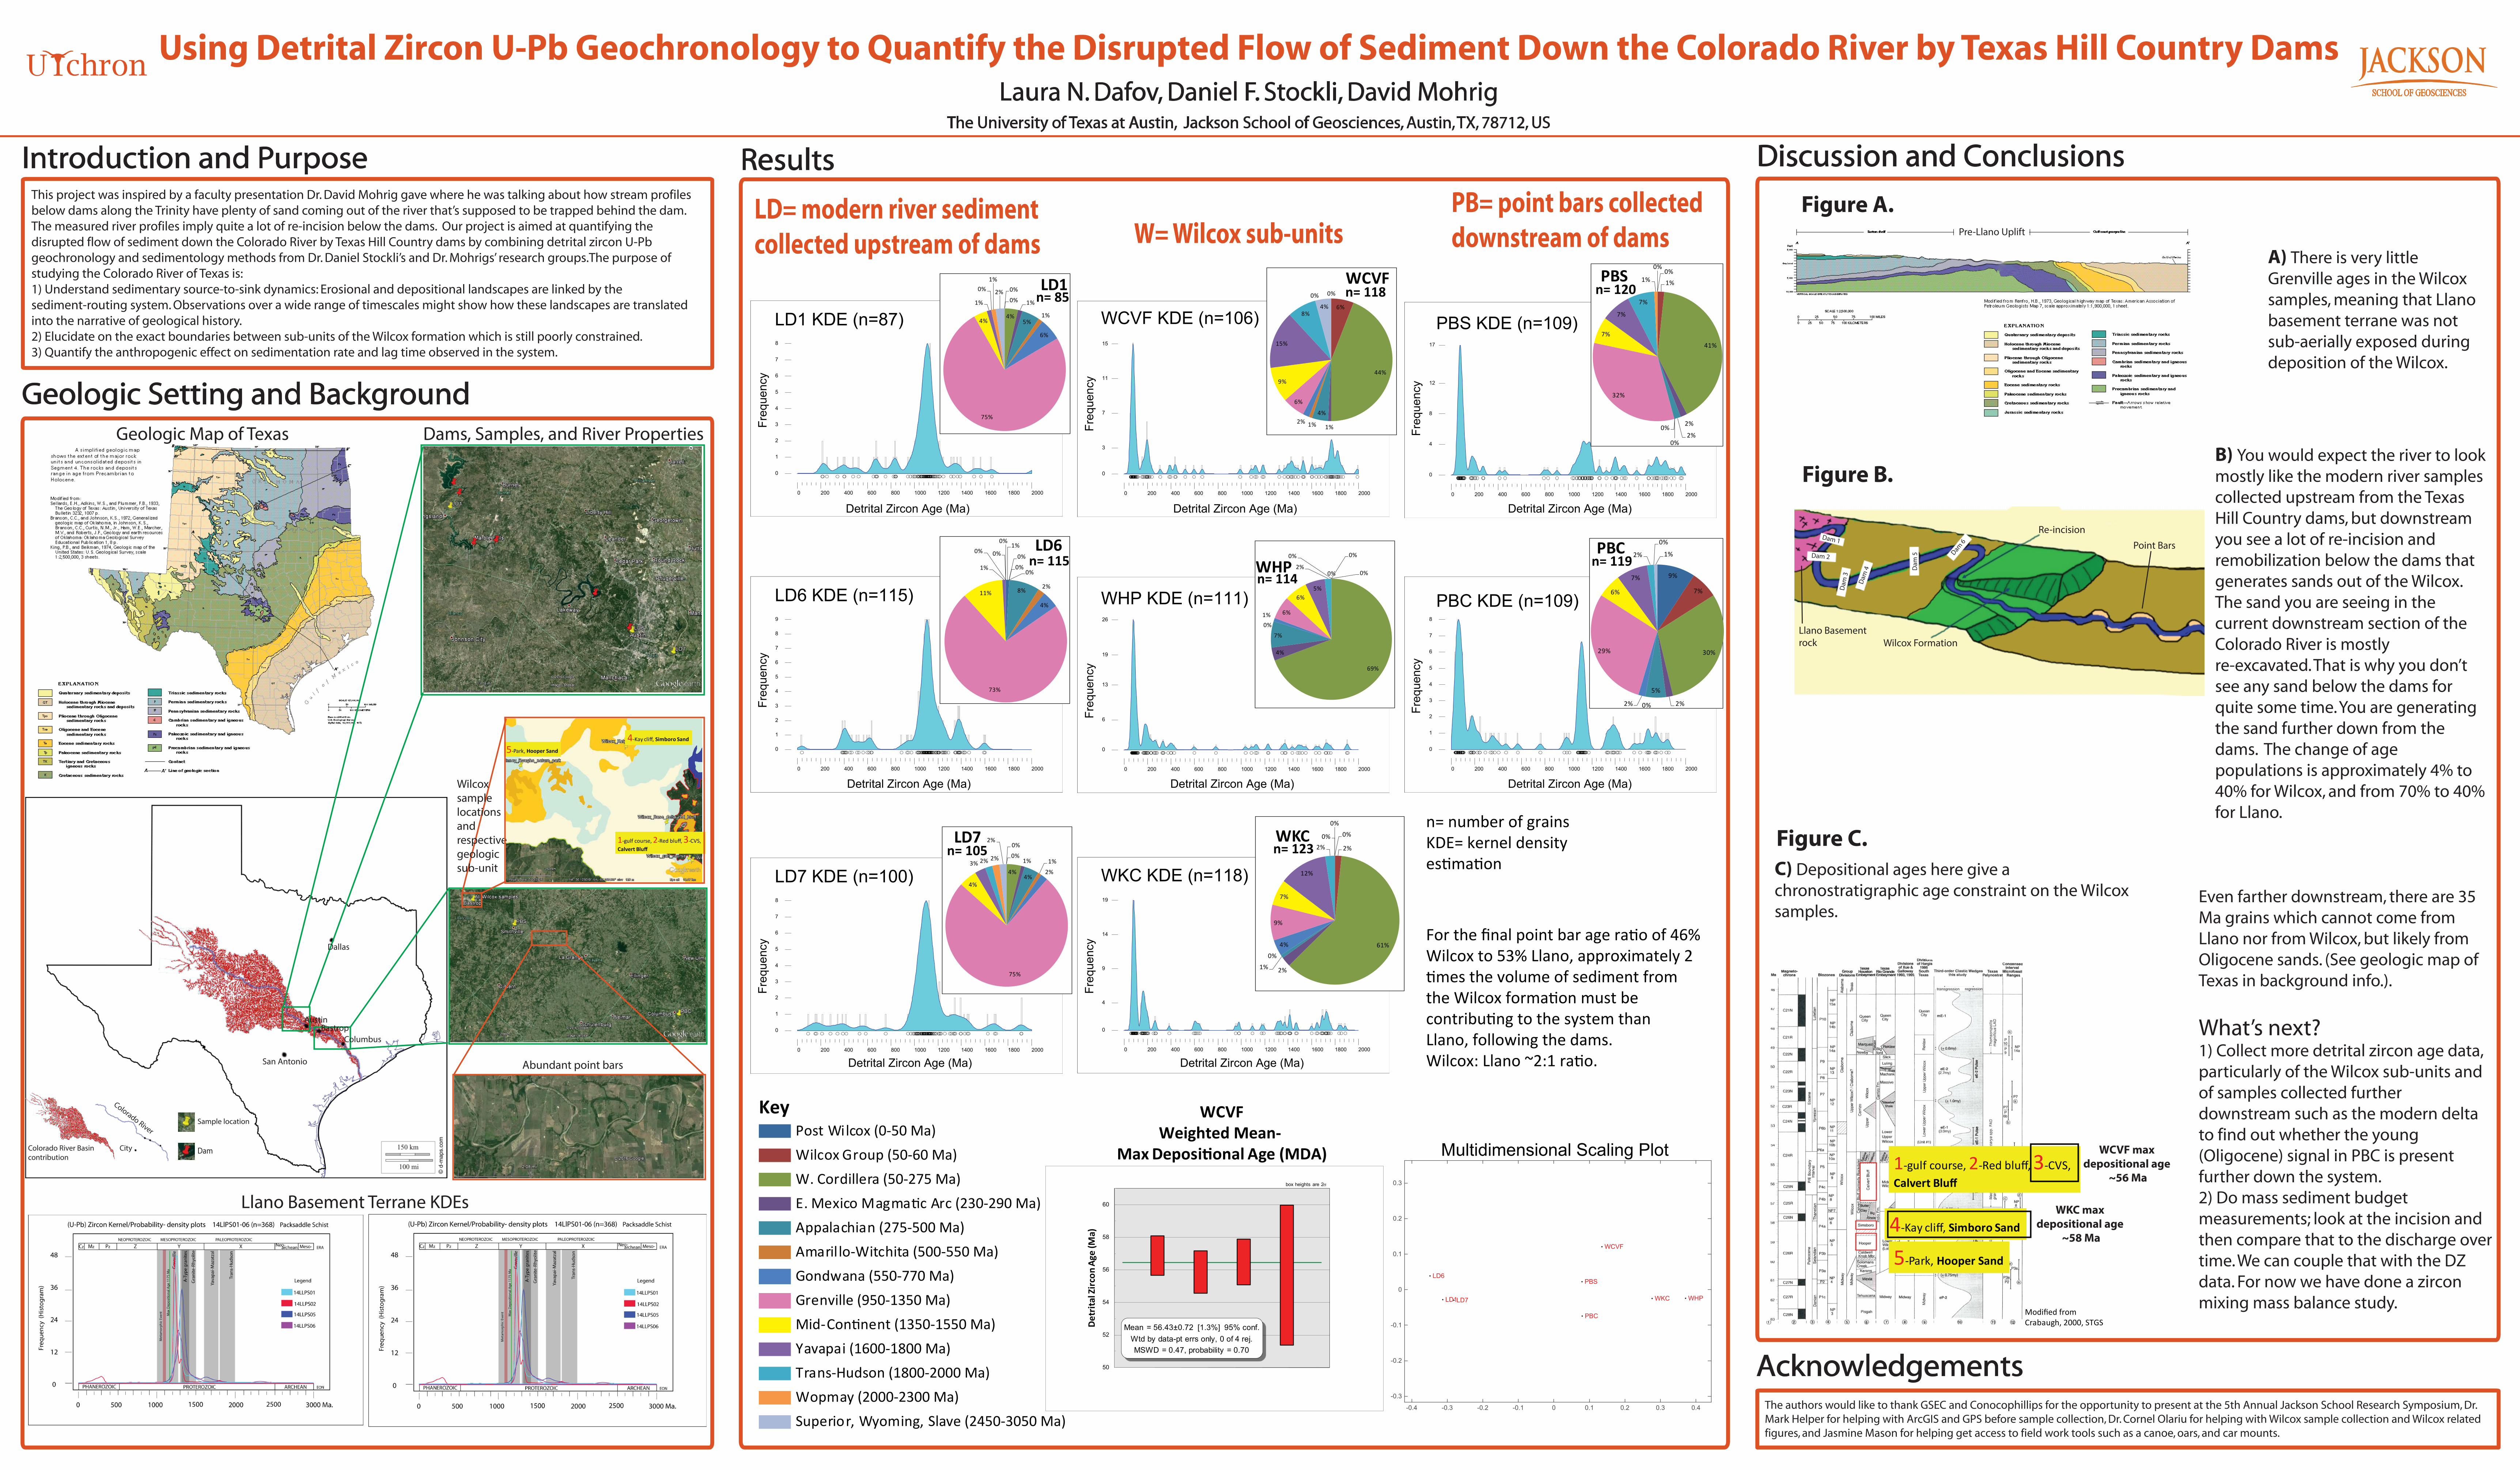
Introduction and PurposeThis project was inspired by a faculty presentation Dr. David Mohrig gave where he was talking about how stream profiles below dams along the Trinity have plenty of sand coming out of the river that’s supposed to be trapped behind the dam. The measured river profiles imply quite a lot of re-incision below the dams. Our project is aimed at quantifying the disrupted flow of sediment down the Colorado River by Texas Hill Country dams by combining detrital zircon U-Pb geochronology and sedimentology methods from Dr. Daniel Stockli’s and Dr. Mohrigs’ research groups.The purpose of studying the Colorado River of Texas is: 1) Understand sedimentary source-to-sink dynamics: Erosional and depositional landscapes are linked by the sediment-routing system. Observations over a wide range of timescales might show how these landscapes are translated into the narrative of geological history.2) Elucidate on the exact boundaries between sub-units of the Wilcox formation which is still poorly constrained.3) Quantify the anthropogenic effect on sedimentation rate and lag time observed in the system.
The authors would like to thank GSEC and Conocophillips for the opportunity to present at the 5th Annual Jackson School Research Symposium, Dr. Mark Helper for helping with ArcGIS and GPS before sample collection, Dr. Cornel Olariu for helping with Wilcox sample collection and Wilcox related figures, and Jasmine Mason for helping get access to field work tools such as a canoe, oars, and car mounts.
JACKSONSCHOOL OF GEOSCIENCES
U chron
5-Park, Hooper Sand
4-Kay cliff, Simboro Sand
1-gulf course, 2-Red bluff, 3-CVS, Calvert Bluff
Modified from Crabaugh, 2000, STGS
5-Park, Hooper Sand
4-Kay cliff, Simboro Sand
1-gulf course, 2-Red bluff, 3-CVS, Calvert Bluff
-0.4 -0.3 -0.2 -0.1 0 0.1 0.2 0.3 0.4
-0.3
-0.2
-0.1
0
0.1
0.2
0.3
LD1
LD6
LD7 WKC WHP
WCVF
PBS
PBC
0 200 400 600 800 1000 1200 1400 1600 1800 2000
0
1
2
3
4
5
6
7
8
0 200 400 600 800 1000 1200 1400 1600 1800 2000
0
1
2
3
4
5
6
7
8
9
0 200 400 600 800 1000 1200 1400 1600 1800 2000
0
1
2
3
4
5
6
7
8
0 200 400 600 800 1000 1200 1400 1600 1800 2000
0
4
8
12
17
0 200 400 600 800 1000 1200 1400 1600 1800 2000
0
1
2
3
4
5
6
7
8
0 200 400 600 800 1000 1200 1400 1600 1800 2000
0
3
7
11
15
0 200 400 600 800 1000 1200 1400 1600 1800 2000
0
6
13
19
26
0 200 400 600 800 1000 1200 1400 1600 1800 2000
0
4
9
14
19
Post Wilcox (0-50 Ma)Wilcox Group (50-60 Ma)W. Cordillera (50-275 Ma)E. Mexico Magma c Arc (230-290 Ma)Appalachian (275-500 Ma)Amaril lo-Witchita (500-550 Ma)Gondwana (550-770 Ma)Grenville (950-1350 Ma)Mid-Con nent (1350-1550 Ma)Yavapai (1600-1800 Ma)Trans-Hudson (1800-2000 Ma)Wopmay (2000-2300 Ma)Superior, Wyoming, Slave (2450-3050 Ma)
Key
LD1 KDE (n=87)
LD= modern river sediment collected upstream of dams
n= number of grainsKDE= kernel density estimation
W= Wilcox sub-unitsPB= point bars collected downstream of dams
0%
0%
4%
1%
5%1%
6%
75%
4%
1%
0%1%
2% LD1n= 85
1%
0%
0%0%
8% 2%
4%
73%
11%
1%
0% 0%
0% LD6n= 115
LD6 KDE (n=115)
0%
0%
4%
1%
4%
1%
2%
75%
4%
3% 2% 2%
2%LD7n= 105
0%
2%
61%
2%1%
0%
4%
9%
7%
12%
2%0%
0%
WKCn= 123
0% 0%
69%
4%
7%
0%1% 6%
6%5%
2%
0% 0%
WHPn= 114
0%
6%
44%
1%
4%
1%2%
6%
9%
15%
8%
0%
4%
WCVFn= 118
9%
7%
30%
2%
5%
0%2%
29%
6%
7%
2%
0%
1%PBCn= 119
0%
1%
41%
2%
2%0%
0%
32%
7%
7%
7%
1%
0%
PBSn= 120
PBS KDE (n=109)WCVF KDE (n=106)
WHP KDE (n=111) PBC KDE (n=109)
LD7 KDE (n=100) WKC KDE (n=118)
Detrital Zircon Age (Ma) Detrital Zircon Age (Ma)
Detrital Zircon Age (Ma)Detrital Zircon Age (Ma)Detrital Zircon Age (Ma)
Detrital Zircon Age (Ma)
Detrital Zircon Age (Ma)Detrital Zircon Age (Ma)
Freq
uenc
y
Multidimensional Scaling Plot
Llano Basement Terrane KDEs
Freq
uenc
y
Freq
uenc
yFr
eque
ncy
Freq
uenc
y
Freq
uenc
yFr
eque
ncy
Freq
uenc
y
Colorado River Basin contribution
Colorado River
City
San Antonio
Sample location
Dam
Geologic Map of Texas Dams, Samples, and River Properties
AustinBastrop
Abundant point bars
Wilcoxsamplelocationsand respectivegeologic sub-unit
Columbus
Dallas
50
52
54
56
58
60
Detr
ital Z
ircon
Age
(Ma)
Mean = 56.43±0.72 [1.3%] 95% conf.Wtd by data-pt errs only, 0 of 4 rej.MSWD = 0.47, probability = 0.70
box heights are 2σ
WCVFWeighted Mean-
Max Depositional Age (MDA) WCVF max depositional age
~56 Ma
WKC max depositional age
~58 Ma
Figure C.
Figure A.
For the final point bar age ratio of 46%Wilcox to 53% Llano, approximately 2times the volume of sediment from the Wilcox formation must be contributing to the system than Llano, following the dams.Wilcox: Llano ~2:1 ratio.
Even farther downstream, there are 35 Ma grains which cannot come from Llano nor from Wilcox, but likely from Oligocene sands. (See geologic map of Texas in background info.).
What’s next?1) Collect more detrital zircon age data, particularly of the Wilcox sub-units and of samples collected further downstream such as the modern delta to find out whether the young (Oligocene) signal in PBC is present further down the system. 2) Do mass sediment budget measurements; look at the incision and then compare that to the discharge over time. We can couple that with the DZ data. For now we have done a zircon mixing mass balance study.
Pre-Llano Uplift
Dam 1
Dam 2
Dam
3
Dam
4 Dam
5 Dam 6
Wilcox Formation
Re-incision
Point Bars
Llano Basementrock
A) There is very little Grenville ages in the Wilcox samples, meaning that Llano basement terrane was not sub-aerially exposed during deposition of the Wilcox.
B) You would expect the river to look mostly like the modern river samples collected upstream from the Texas Hill Country dams, but downstream you see a lot of re-incision and remobilization below the dams that generates sands out of the Wilcox. The sand you are seeing in the current downstream section of the Colorado River is mostly re-excavated. That is why you don’t see any sand below the dams for quite some time. You are generating the sand further down from the dams. The change of age populations is approximately 4% to 40% for Wilcox, and from 70% to 40% for Llano.
C) Depositional ages here give a chronostratigraphic age constraint on the Wilcox samples.
Figure B.