Colorado Aquifer Management Conference American Ground ...
24
The Why and How of Colorado Aug. Plan Decrees—Maintaining Historic Return Flows Colorado Aquifer Management Conference American Ground Water Trust Nov. 28-29, 2012 Jon Altenhofen, PE South Platte Projects Manager (Projects: ARA, PRRIP, ADI)
Transcript of Colorado Aquifer Management Conference American Ground ...
The Why and How of Colorado Aug. Plan
Decrees—Maintaining Historic Return Flows
Colorado Aquifer Management Conference
American Ground Water Trust
Nov. 28-29, 2012
Jon Altenhofen, PE
South Platte Projects Manager
(Projects: ARA, PRRIP, ADI)

THE WHY and HOW:
The WHY is the GOAL of maintaining historic return flows-
Returnflows to the river (river gains from groundwater
inflows) supply downstream senior surface rights and the
junior tributary irrigation wells deplete these returnflows.
The HOW is a Colorado Water Court approved
Augmentation Plan. Numerous Terms and Conditions
with much emphasis on:
(a) Tributary Aquifer Response Functions for lagging
activities at wells/recharge ponds to future
depletions/accretions at the river in terms of amount,
timing and location.
(b) Water Balance Accounting (for actual and projections) at
the river listing ALL depletions versus replacement
supplies so negative effects are fully augmented/replaced
so no shortages to demands of senior downstream rights.

Historical South Platte River Flows—
Pre-Irrigation John Charles Fremont, Explorer, July 1842
”six miles from our resting place near Julesburg we crossed the bed of a considerable stream, now entirely dry ---a bed of sand.”
Post-Irrigation Ralph Parshall, Colorado A&M College Report, 1922
“The practice of irrigating … maintains a constant return flow … beyond all expectations … Perhaps no other Colorado stream has such an abundant return flow as the South Platte River.”
Post- Well Irrigation Ralph Parshall, Talk to Ft. Collins Rotary Club, Aug. 29, 1956 titled “The
Water Problem”
“…the area north and south of the river between Kersey and Julesburg, more than 4000 irrigation wells are being pumped…we cannot continue this practice of depleting the underground reservoir at the present rate….The depletion of the return flow to the river is going to have a marked effect upon … senior rights along the South Platte.”

South Platte Basin
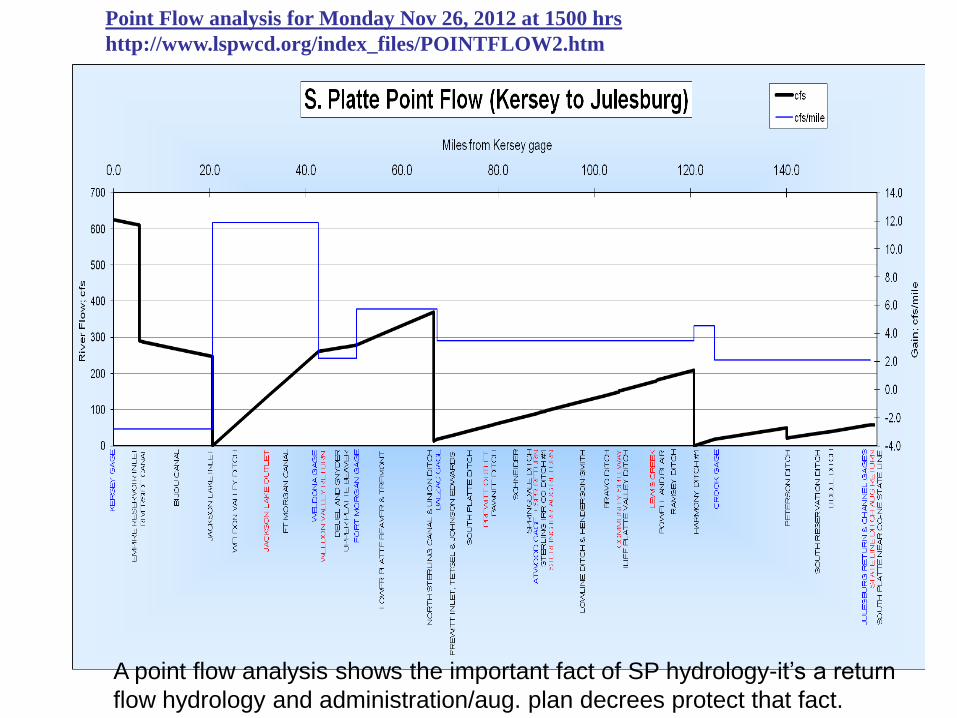
Point Flow analysis for Monday Nov 26, 2012 at 1500 hrs
http://www.lspwcd.org/index_files/POINTFLOW2.htm
A point flow analysis shows the important fact of SP hydrology-it’s a return
flow hydrology and administration/aug. plan decrees protect that fact.

South Platte Tributary Alluvial
gains/returnflows to the lower river of about
2 cfs/mile on June 15, 1994
S. Platte at Tamarack
from Red Lion Bridge
June 15, 1994; 25 cfs
I&PV
60 cfs
& call
Hmy1
34 cfs
Peter
41 cfs
Divs. drying
the river
25 cfs at StLi
Compact Call
Pic
Looking west
upstream

--The South Platte tributary aquifer is an
“unconfined Valley Fill surficial aquifer”; an
alluvial aquifer made up of sands and gravels.
USGS estimated volume of groundwater storage at
about 8 MAF.
--USGS estimated 1 MAF annually of recharge to
the aquifer from canal/reservoir seepage and on-
farm deep percolation.
--The South Platte River forms a natural drain for
the alluvial aquifer. Groundwater seepage to S.
Platte River averages about 515,000 af/yr (USGS).
Some Groundwater Numbers for the
South Platte in Colorado
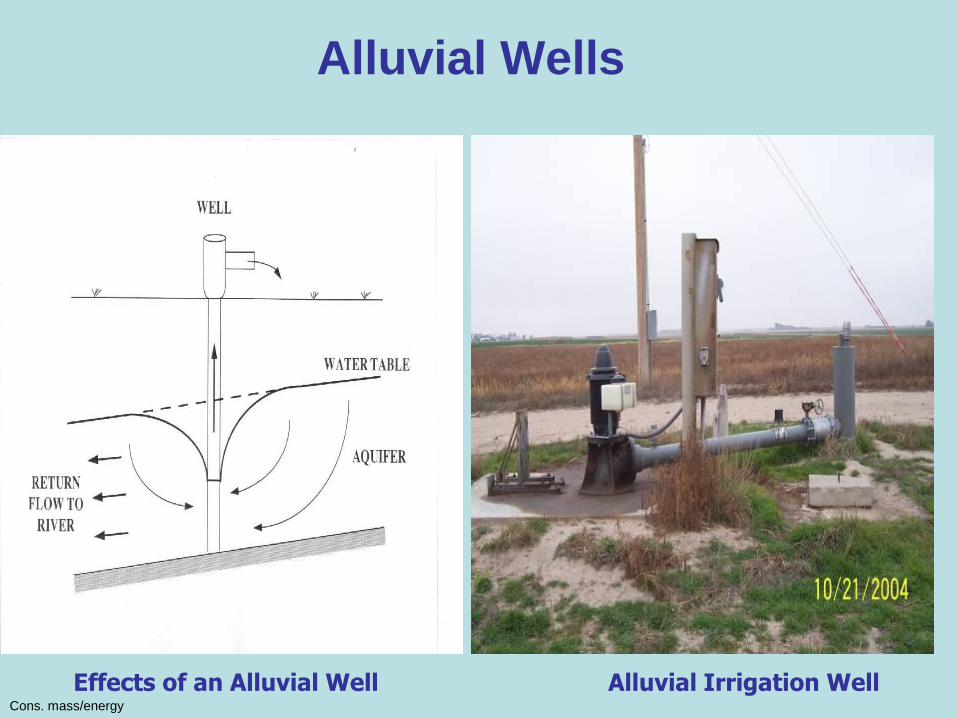
Alluvial Wells
Effects of an Alluvial Well Alluvial Irrigation Well Cons. mass/energy
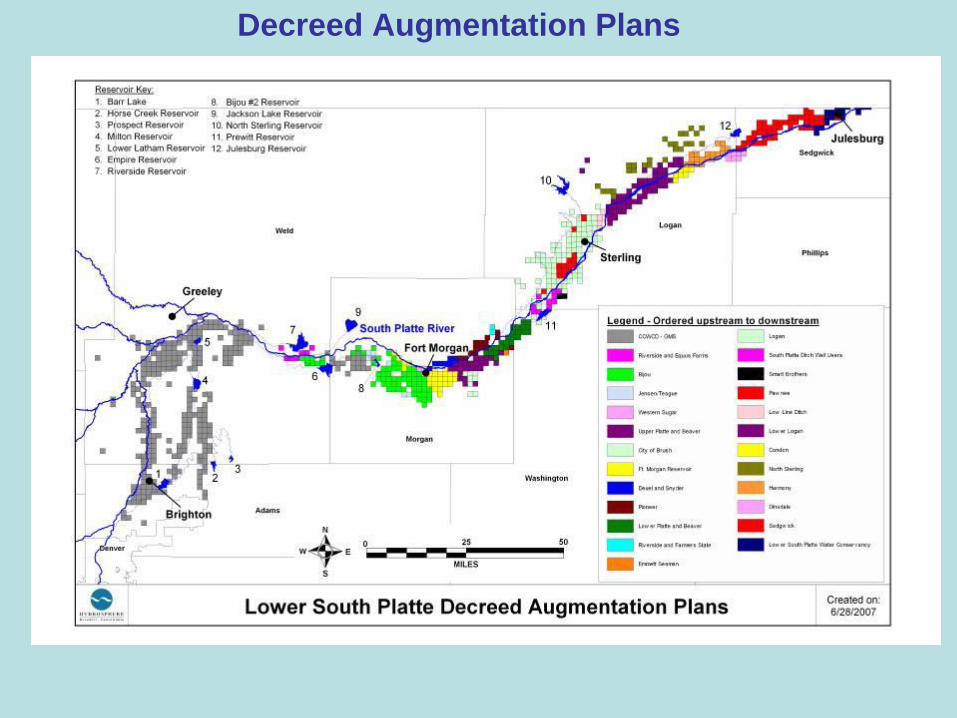
Decreed Augmentation Plans

USGS in cooperation with
the Colorado Water
Conservation Board
(CWCB)
Six S. Platte Reaches
(Brighton, Greeley,
Weldona, Brush, Sterling,
Julesburg)
Six Maps each Reach
(well locations, bedrock and
water table contours,
saturated thickness,
transmissivity, and Stream
Depletion Factor; SDF in
days)

Timing of Lagged Groundwater Response at River
AWAS Computation Options (Alluvial Water Accounting System)
--- SDF (Effective Stream Depletion Factors via Jenkins)
– Glover Methods (i.e., alluvial aquifer-no flow boundary
condition)
– URFs via Numerical Groundwater Model (ie; MODFLOW)
http://www.ids.colostate.edu/projects.php and go to ‘IDS AWAS’
Timing
example
using
SDF
Method
(Days)

USGS SDF contour lines
(one-pt calibration at
28% effect)

Alluvial Aquifer Grid for T, X, W

• Appendix C
• Tamarack Ranch State Wildlife Area Recharge Project
• Unit Replacement Factors for All Recharge Ponds
• Month Pond 1 Pond 2 Pond 3 Pond 4
•
• 1 0.1012 0.2477 0.1005 0.0264
• 2 0.2213 0.2815 0.2217 0.1281
• 3 0.1459 0.1250 0.1542 0.1509
• 4 0.1000 0.0744 0.1062 0.1289
• 5 0.0748 0.0521 0.0783 0.1035
• 6 0.0589 0.0397 0.0608 0.0831
• 7 0.0465 0.0306 0.0472 0.0653
• 8 0.0383 0.0247 0.0383 0.0531
• 9 0.0314 0.0200 0.0309 0.0428
• 10 0.0260 0.0163 0.0252 0.0348
• 11 0.0238 0.0155 0.0227 0.0284
• 12 0.0201 0.0131 0.0189 0.0231
• 13 0.0172 0.0113 0.0160 0.0191
• 14 0.0149 0.0098 0.0136 0.0158
• 15 0.0129 0.0085 0.0116 0.0131
• 16 0.0112 0.0075 0.0100 0.0128
• 17 0.0098 0.0065 0.0087 0.0109
• 18 0.0087 0.0058 0.0077 0.0095
• 19 0.0078 0.0052 0.0068 0.0084
• 20 0.0070 0.0048 0.0059 0.0073
• 21 0.0063 0.0054 0.0065
• 22 0.0057 0.0049 0.0058
• 23 0.0054 0.0045 0.0053
• 24 0.0049 0.0048
• 25 0.0044
• 26 0.0040
• 27 0.0039
• 28
• 29
• 30
• 31
•
• Total 1.0000 1.0000 1.0000 1.0000
URFs (Unit Response
Functions) developed
for Tamarack from
MODFLOW numerical
model

http://dwrweblink.state.co.us/dwr
weblink/search.aspx

Table 1-1
Lower Logan Well Users (LLWU) Inc.03CW208 UPDATED ACCOUNTING THROUGH AUGUST 2012
MONTHLY ACCOUNTING FORM / TABLE
Depletions and Augmentation Supplies
Water Year: 2012
Nov11 Dec Jan12 Feb Mar April May June July Aug Sept Oct Totals
Days in month 30 31 31 28 31 30 31 30 31 31 30 31 for Wtr Yr
DEPLETIONS(a) Irrigation Well Depletions for senior wells (senior to 2-28-1972, #44618); 1974-Current Pumping -987 -868 -785 -721 -667 -640 -868 -1483 -1657 -1888 -2049 -1495 -14108
(b) Irrigation Well Depletions for 2 most junior wells with No Court Decree; 1974-Current Pumping -45 -53 -59 -63 -68 -56 -35 -27 -36 -38 -31 -39 -550
(c) Augmentation Well Depletions above the Harmony #1 -- Due to Aug Well use thru Previous WY (App Date 6-15-2004, #56414) -5 -5 -5 -4 -4 -4 -4 -4 -3 -3 -3 -3 -47
(d) Historic Return Flows -- Due to Prewitt Res. releases thru Previous WY (App Date 4-30-2003, #56002) -9 -8 -8 -8 -8 -7 -7 -7 -7 -6 -6 -6 -87
(e) Recharge Well Depletions -- Total through current pumping (App Date 4-30-2003, #56002) -38 -1487 -2777 -2945 -2657 -1308 -165 -74 -56 -47 -40 -35 -11629
The net effect below Harmony #1 is added in below
W = Total Depletions Above Harmony #1 -1084 -2421 -3634 -3741 -3404 -2015 -1079 -1595 -1759 -1982.2 -2128.8 -1578 -26421
AUGMENTATION REPLACEMENT SUPPLIESRecharge Accretions Occurring above the Harmony #1
Bravo Ditch areas and Bravo recharge sites 384 451 562 673 818 806 756 578 561 474 414 392 6869
Iliff & Platte Valley Ditch areas and IPV recharge sites 76 77 75 69 73 70 72 70 72 72 69 71 866
Harmony #2 Ditch areas and UHD recharge sites 4 5 5 5 6 6 6 6 6 7 6 7 69
Powell Ditch areas and PWC recharge sites 0 0 0 0 0 0 0 0 0 0 0 0 0
SLC recharge sites 540 533 510 467 507 514 559 560 583 574 540 536 6423
SSLC recharge sites 96 88 102 180 301 299 248 189 164 138 113 98 2016
StLC recharge sites 164 160 170 184 226 238 244 217 202 183 163 157 2308
LC recharge sites 107 105 101 95 107 111 121 119 121 116 108 106 1317
KF recharge sites 0 0 0 0 0 0 0 0 0 0 0 0 0
Ramsey recharge sites 39 40 16 9 8 35 37 15 10 8 7 6 230
Golden Eagle's use of Rech Acc -6.19 -4.80 -1.36 -0.57 -0.46 -0.36 -9.55 -2.37 -0.68 -0.46 -0.34 -7.76 -34.9
The net effect below Harmony #1 is added in below
Total Accretions Above Harmony #1 (A) 1403.81 1454.2 1539.64 1681.43 2045.54 2078.64 2033.45 1751.63 1718.32 1571.54 1419.7 1365.24 20063
Other Aug Credits
Harris 00CW181 Decree Computations -24.7 -16.5 -10.5 -5.9 -10.8 6.2 -4.1 -25.1 -0.2 -25.6 -41.7 -41.6 -200
Net Credit from Other Sources Above Harmony #1 (B) -25 -17 -11 -6 -11 6 -4 -25 0 -26 -42 -42 -200
Prewitt Reservoir releases and augmentation well pumping done on days of river call.
Call Analysis and resulting Net Shortage/Excess on Call days Monthly Call Records: NO CALLS in Nov-Dec 2011 & Jan-Feb 2012Senior call; 25.33 days May, 30 days June, 31 days July, 31 days Aug
6 days of senior and 4 days of junior calls in April 2012
Days of Senior River Call above the Harmony #1 0 0 0 0 0 6 25.33 30 31 31 30 31 184
W1 = Net Shortage/Excess on Senior call days above Harmony #1 (W+A+B)*%call days 0 0 0 0 0 14 777 132 -41 -436 -751 -254 -560
Days of Junior Call above the Harmony #1 0 0 0 0 0 4 0 0 0 0 0 0 4
W1 = Net Shortage/Excess on Junior call days [(Sum rows b thru e above)+A+B]*%call days 0 0 0 0 0 95 0 0 0 0 0 0 95
Which of rows b thru e above are summed depends upon which junior call Projections in Red Julesburg Res Junior Call Mar 27-31, 2012 and Res full Mar 31
Prewitt Reservoir Releases in WY2012
Gross Credit=Release minus river shrink 0 0 0 0 0 0 0 0 89 650 413 0 1152
Depletions from Release (Replace Historic Returns) on days of call (App Date 4-30-2003, #56002) 0 0 0 0 0 0 0 0 -10 -73 -72 -33 -188
Net Credit from Release (C) 0 0 0 0 0 0 0 0 79 577 341 -33 964
Projections in Red
Augmentation Well Pumping in WY2012
Total Pumping for credit (at average aug well and 95% conveyance to river for projection) 620 470 1090
Depletions from this Pumping on days of call (App Date 6-15-2004, #56414) 0 0 0 0 0 0 0 0 0 0 -21 -92 -113
Net Credit Aug Wells (D) 0 0 0 0 0 0 0 0 0 0 599 378 977
Exchange Operations Nov Dec Jan Feb Mar Apr May Jun Jul Aug Sep Oct
Y = Total Diversions (See Table 1-2C) 0 0 0 0 0 0 0 0 0 0 0 0 0
NET EFFECT ABOVE HARMONY #1 (X = W1+C+D-Y) ON CALL DAYS (Senior and Junior) 0 0 0 0 0 109 777 132 38 141 189 91 1475
Senior call; 17.16 days May, 30 days June, 31 days July, 31 days Aug
Affects Occurring Below the Harmony No. 1 Headgate Senior Call Admin #= No Senior Calls Nov11-Apr. 2012
Days of Senior River Call below the Harmony #1 0 0 0 0 0 0 17.16 30 31 31 30 15 154
Irrigation Well Depletions for senior wells Occurring below the Harmony #1 (senior to 2-28-1972, #44618); 1974-Current Pumping -206 -176 -156 -140 -128 -120 -127 -167 -230 -286 -316 -289 -2341
Augmentation Well Depletions below the Harmony #1 -- Due to Aug Well use thru Previous WY (App Date 6-15-2004, #56414) -1 -1 -1 -1 -1 -1 -1 -1 -1 -1 -1 -1 -12
Augmentation Well Depletions below the Harmony #1 -- Due to Aug Well use in Current WY (App Date 6-15-2004, #56414) 0 0 0 0 0 0 0 0 0 0 0 0 0
UHD and Svoboda Recharge Site 128 117 133 208 291 317 315 247 197 159 131 118 2361
Z = Net Effect Below Harmony No. 1 on call days 0 0 0 0 0 0 104 79 -34 -128 -186 -83 -249
cfs for Augmentation below Hmy #1= 0.6 2.1 3.1 2.8
NET EFFECT (X+Z) ON CALL DAYS (Senior and Junior) 0 0 0 0 0 109 880 211 4 13 3 7 1227
Row AA; Net Effect for Entire Month if Positive 266 1137 211 1614
If there is no call or compact condition below the Harmony #1 then amount Z does not have to be replaced and is not included in this Final NET EFFECT Row.
Recharge well depletions in a month when recharge wells are pumped in-priority after call comes off based on recharge well pumping thru prior month.
Accounting Forms prepared by Jon Altenhofen, NCWCD; Joe Frank, LSPWCD; and TZA Water Engineers, Inc.

Augmentation Challenge—
Replacement of ALL “out of priority” junior well depletions to a downstream senior (calling) right in time, location, and amount
Passive Augmentation Supply – Less Control on augmentation credit at the river
• Managed Groundwater Recharge
Active Augmentation Supply – More Control over augmentation credit at the river – BUT cause an additional depletion / return flow replacement
• Augmentation Wells
• Reservoir Release to River
• Ditch Bypass at River Headgate

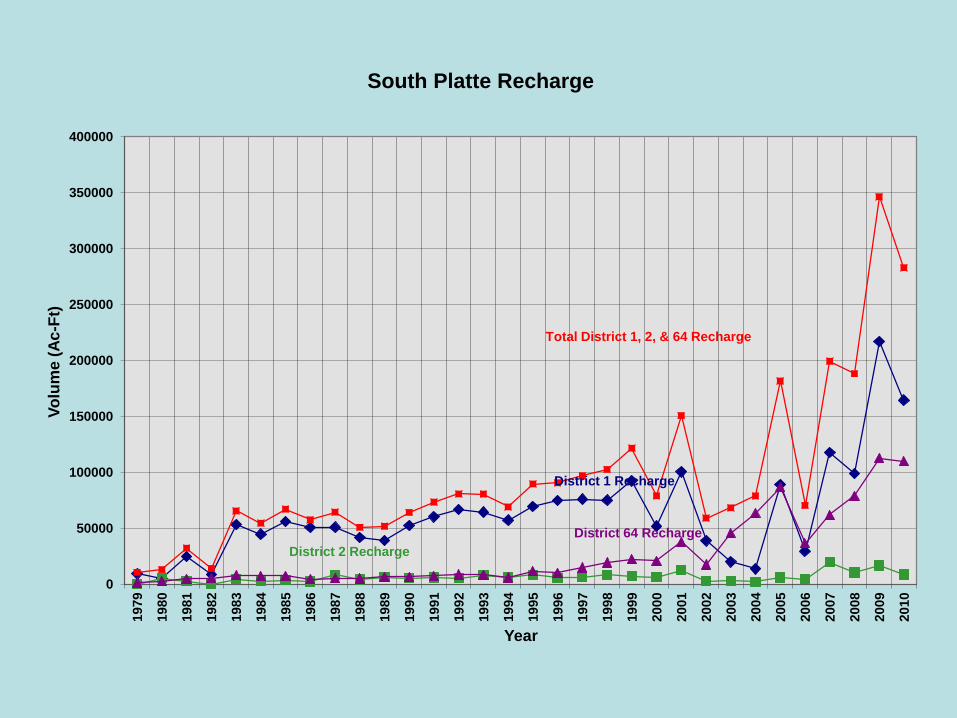
Managed Groundwater Recharge
Effects of Groundwater Recharge (both managed and unmanaged)
Managed Groundwater Recharge Site
0
50000
100000
150000
200000
250000
300000
350000
400000 1979
1980
1981
1982
1983
1984
1985
1986
1987
1988
1989
1990
1991
1992
1993
1994
1995
1996
1997
1998
1999
2000
2001
2002
2003
2004
2005
2006
2007
2008
2009
2010
Vo
lum
e (
Ac
-Ft)
Year
South Platte Recharge
Total District 1, 2, & 64 Recharge
District 1 Recharge
District 64 Recharge
District 2 Recharge
http://www.ids.colostate.edu/projects/awas/files/Recharge_as_Augmentation_in_SP.pdf
This TR-21 is 2nd
Edition from 1994;
1st Edition was TR-13
from 1986

Recharge and Augmentation Well System near
Sedgwick, CO

SUMMARY: A sustainable S. Platte alluvial aquifer has developed
through irrigation and this aquifer has enhanced Colorado
irrigation and water use through return flows and
groundwater pumping.
The challenge is to continue to utilize the aquifer through
droughts, growing demands, and increased legal
augmentation requirements while maintaining historic
return flows.
Maximizing the aquifer storage potential through such
activities as managed groundwater recharge and
augmentation wells (i.e., with proper analysis/accounting for
net river effects) can meet current and future challenges
to maintain/maximize beneficial use without injury.

Recharge at Sunset
on the Overland
Trail Ranch
Recharge pond with
snow geese at
Condon Ranch
The End
Questions/Comments

Prepare for drought continuing
in 2013—
Wells will be essential but their
effects on river returnflows
must be augmented else
downstream seniors see a
compounded drought effect