
IFT3355: Infographie Animation © Victor Ostromoukhov Dép. I.R.O. Université de Montréal.

Color
Wojciech Matusik MIT EECS Many slides courtesy of Victor Ostromoukhov, Leonard McMillan, Bill Freeman, Fredo Durand
Image courtesy of Chevre on Wikimedia Commons. License: CC-BY-SA. This content is excluded fromour Creative Commons license. For more information, see http://ocw.mit.edu/help/faq-fair-use/.
1

Does color puzzle you?
2

Answer
• It’s all linear algebra
3
• Spectra • Cones and spectral response • Color blindness and metamers • Color matching • Color spaces
Plan
4

Color
5
Image courtesy of Zátonyi Sándor, (ifj.) Fizped on Wikimedia Commons.License: CC-BY-SA. This content is excluded from our Creative Commonslicense. For more information, see http://ocw.mit.edu/help/faq-fair-use/.

Spectrum
6
Light is a wave Visible: between 450 and 700nm

Spectrum
7
Light is characterized by its spectrum: the amount of energy at each wavelength This is a full distribution: one value per wavelength (infinite number of values)

Light-Matter Interaction
8
Where spectra come from: - light source spectrum - object reflectance (aka spectral albedo) get multiplied wavelength by wavelength There are different physical processes that explain this multiplication e.g. absorption, interferences
.* =
Foundations of Vision, by Brian Wandell, Sinauer Assoc., 1995
© Sinauer Associates, Inc. All rights reserved. This content is excluded from our CreativeCommons license. For more information, see http://ocw.mit.edu/help/faq-fair-use/.

Spectrum demo
• Diffraction grating: – shifts light as a function of
wavelength – Allows you to see spectra – In particular, using a slit light
source, we get a nice band showing the spectrum
• See the effect of filters • See different light source
spectra
9
Image courtesy of Cmglee on Wikimedia Commons. License:CC-BY-SA. This content is excluded from our CreativeCommons license. For more information,see http://ocw.mit.edu/help/faq-fair-use/.
This image is in the public domain. Source: Wikimedia Commons.

So far, physical side of colors: spectra
an infinite number of values (one per wavelength)
Questions?
10
© Sinauer Associates, Inc. All rights reserved. This content isexcluded from our Creative Commons license. For moreinformation, see http://ocw.mit.edu/help/faq-fair-use/.

• Spectra • Cones and spectral response
• Color blindness and metamers • Color matching • Color spaces
Plan
11

What is Color?
12
Light
Object
Observer

What is Color?
13
Illumination
Reflectance
Stimulus
Cone responses
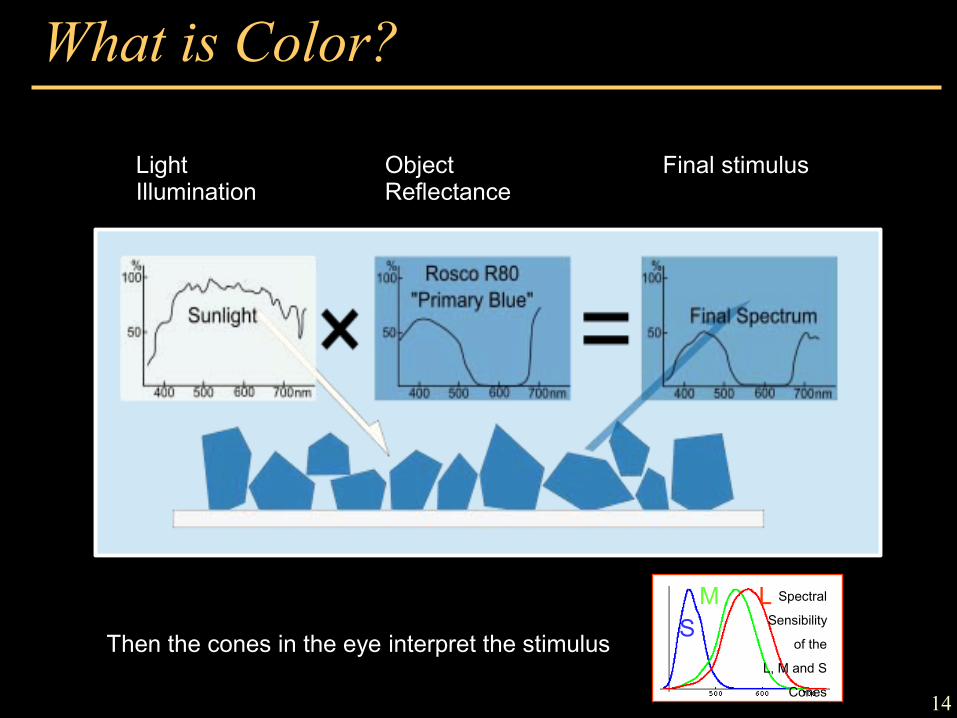
What is Color?
14
Light Illumination
Object Reflectance
Final stimulus
Spectral
Sensibility
of the
L, M and S
Cones
S M L
Then the cones in the eye interpret the stimulus

Cones
• We focus on low-level aspects of color – Cones and early processing in the retina
• We won’t talk about rods (night vision)
15
Spectral
Sensibility
of the
L, M and S
Cones
S M L
This image is in the public domain. Source: Wikimedia Commons.
Image courtesy of Ivo Kruusamägi on WikimediaCommons. License: CC-BY-SA. This content isexcluded from our Creative Commons license. Formore information, see http://ocw.mit.edu/help/faq-fair-use/.
Summary (and time for questions)
• Spectrum: infinite number of values – can be multiplied – can be added
• Light spectrum multiplied by reflectance spectrum – spectrum depends on illuminant
• Human visual system is complicated
16

• Short, Medium and Long wavelength • Response for a cone
= ∫ λ stimulus(λ) * response(λ) dλ
17
Cone spectral sensitivity

Cone response Start from infinite number of values (one per wavelength)
End up with 3 values (one per cone type)
Cone responses
Stimulus
Multiply wavelength by wavelength
Integrate
1 number 1 number 1 number 18
© source unknown. All rights reserved. This content is excluded from our CreativeCommons license. For more information, see http://ocw.mit.edu/help/faq-fair-use/.

For matrix lovers
• Spectrum: big long vector size N where N=∞ • Cone response: 3xN matrix of individual
responses
S
L M
cone spectral response
kind of RGB
observed spectrum
19

20
Big picture
• It’s all linear! Light reflectance
Cone responses
Stimulus
multiply
Multiply wavelength by wavelength
Integrate 20 © source unknown. All rights reserved. This content is excluded from our Creative
Commons license. For more information, see http://ocw.mit.edu/help/faq-fair-use/.
21
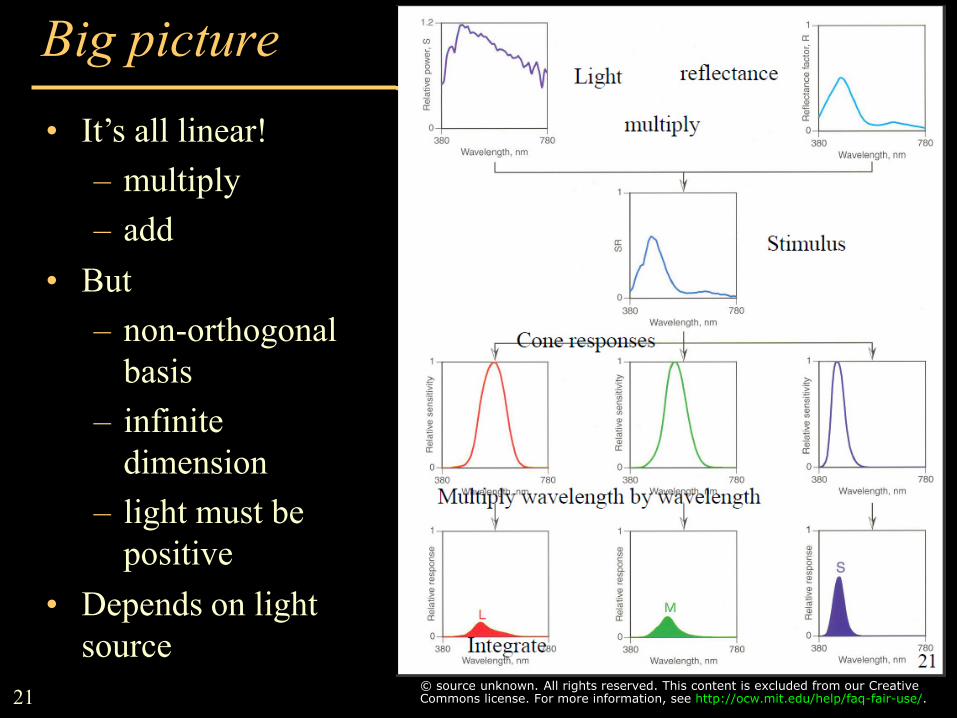
Big picture
• It’s all linear! – multiply – add
• But – non-orthogonal
basis – infinite
dimension – light must be
positive • Depends on light
source
Light reflectance
Cone responses
Stimulus
multiply
Multiply wavelength by wavelength
Integrate © source unknown. All rights reserved. This content is excluded from our CreativeCommons license. For more information, see http://ocw.mit.edu/help/faq-fair-use/.

22
Questions? reflectance
Cone responses
Stimulus
multiply
Multiply wavelength by wavelength
Integrate 22

• Different wavelength, different intensity • Same response
A cone does not “see” colors
23

• Different wavelength, different intensity • But different response for different cones
Response comparison
24
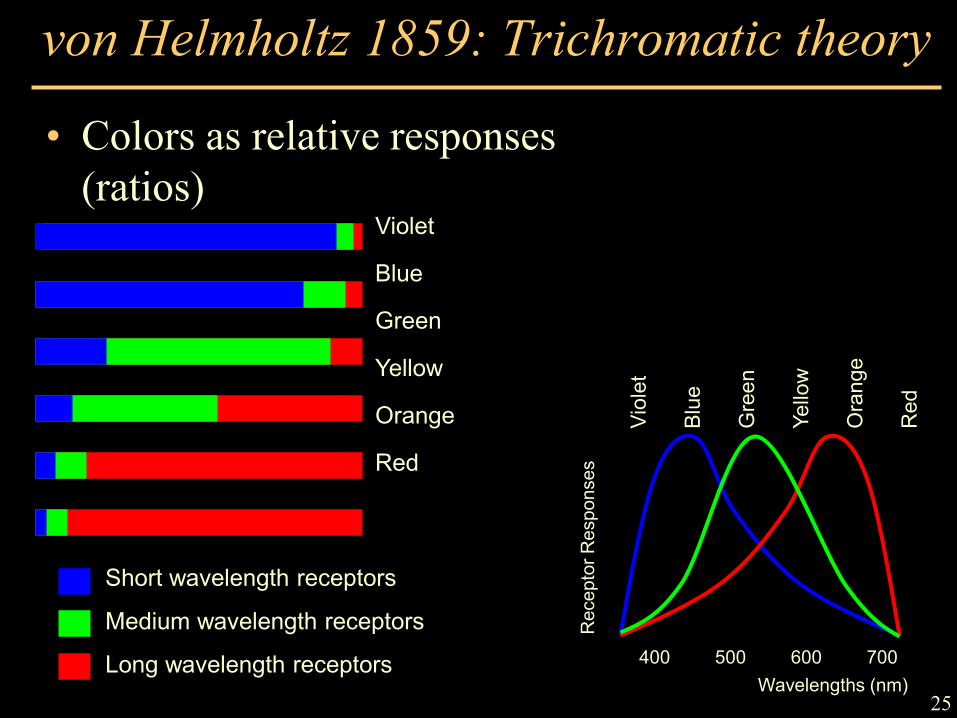
• Colors as relative responses (ratios)
von Helmholtz 1859: Trichromatic theory
Violet
Blue
Green
Yellow
Orange
Red
Short wavelength receptors
Medium wavelength receptors
Long wavelength receptors
Rec
epto
r Res
pons
es
Wavelengths (nm) 400 500 600 700
Viol
et
Blu
e
Gre
en
Yello
w
Ora
nge
Red
25

Questions?
26

• Spectra • Cones and spectral response • Color blindness and metamers
• Color matching • Color spaces
Plan
27

• Classical case: 1 type of cone is missing (e.g. red) • Makes it impossible to distinguish some spectra
Color blindness
differentiated Same responses 28

• Dalton • 8% male, 0.6% female • Genetic • Dichromate (2% male)
– One type of cone missing – L (protanope), M (deuteranope),
S (tritanope) • Anomalous trichromat
– Shifted sensitivity
Color blindness – more general
29

Color blindness test
30
© source unknown. All rights reserved. This content isexcluded from our Creative Commons license. For more
information, see http://ocw.mit.edu/help/faq-fair-use/.
Image courtesy of Eddau processed File: Ishihara 2.svg by User:Sakurambo, with
http://www.vischeck.com/vischeck/vischeckURL.php on Wikimedia Commons.
License: CC-BY-SA. This content is excluded from our Creative Commons license.For more information, see http://ocw.mit.edu/help/faq-fair-use/.

• Maze in subtle intensity contrast • Visible only to color blinds • Color contrast overrides intensity otherwise
Color blindness test
31 © source unknown. All rights reserved. This content is excluded from our Creative
Commons license. For more information, see http://ocw.mit.edu/help/faq-fair-use/.

Questions?
• Links: – Vischeck shows you what an image looks like to
someone who is colorblind. – http://www.vischeck.com/vischeck/ – Daltonize, changes the red/green variation to
brightness and blue/yellow variations. – http://www.vischeck.com/dalton – http://www.vischeck.com/daltonize/runDaltonize.php
32

33
Metamers
• We are all color blind! • These two different
spectra elicit the same cone responses
• Called metamers
33
© source unknown. All rights reserved. This content is excluded from our Creative
Commons license. For more information, see http://ocw.mit.edu/help/faq-fair-use/.

Good news: color reproduction
• 3 primaries are (to a first order) enough to reproduce all colors
34
Image courtesy of Martin Apolin on Wikimedia Commons. License: CC-BY-SA. This content is excluded
from our Creative Commons license. For more information, see http://ocw.mit.edu/help/faq-fair-use/.

Recap
• Spectrum: infinite number of values • projected according to cone spectral response
=> 3 values • metamers: spectra that induce the same response
(physically different but look the same) • Questions?
35
• Metamers under a given light source • May not be metamers under a different lamp
Metamerism & light source
36

Illuminant metamerism example
• Two grey patches in Billmeyer & Saltzman’s book look the same under daylight but different under neon or halogen (& my camera agrees ;-)
Daylight Scan (neon) Hallogen
37 © source unknown. All rights reserved. This content isexcluded from our Creative Commons license. For moreinformation, see http://ocw.mit.edu/help/faq-fair-use/.
Bad consequence: cloth matching
• Clothes appear to match in store (e.g. under neon) • Don’t match outdoor
38

Recap
• Spectrum is an infinity of numbers • Projected to 3D cone-response space
– for each cone, multiply per wavelength and integrate – a.k.a. dot product
• Metamerism: infinite-D points projected to the same 3D point (different spectrum, same perceived color) – affected by illuminant – enables color reproduction with only 3 primaries
39

Questions?
40

Analysis & Synthesis
• Now let’s switch to technology • We want to measure & reproduce color
as seen by humans • No need for full spectrum • Only need to match up to metamerism
41

Analysis & Synthesis
• Focus on additive color synthesis • We’ll use 3 primaries (e.g. red green and blue) to
match all colors • What should those primaries be? • How do we tell the amount of each primary
needed to reproduce a given target color? 42
Image courtesy of Pengo on Wikimedia Commons. License: CC-BY-SA.This content is excluded from our Creative Commons license. For moreinformation, see http://ocw.mit.edu/help/faq-fair-use/.

Tricky thing with spectra & color: • Spectrum for the stimulus / synthesis
– Light, monitor, reflectance • Response curve for receptor /analysis
– Cones, camera, scanner They are usually not the same There are good reasons for this
Warning
43
This image is in the public domain. Source:http://openclipart.org/detail/34051/digicam-
by-thesaurus.
Image courtesy of Pengo on Wikimedia Commons. License: CC-BY-SA.This content is excluded from our Creative Commons license. For moreinformation, see http://ocw.mit.edu/help/faq-fair-use/.

• Take a given stimulus and the corresponding responses s, m, l (here 0.5, 0, 0)
Additive Synthesis - wrong way
44

Additive Synthesis - wrong way
• Use it to scale the cone spectra (here 0.5 * S) • You don’t get the same cone response!
(here 0.5, 0.1, 0.1)
45

What’s going on?
• The three cone responses are not orthogonal • i.e. they overlap and “pollute” each other
46

• Spectra are infinite-dimensional • Only positive values are allowed • Cones are non-orthogonal/overlap
Fundamental problems
47
• Physical color – Spectrum – multiplication of light & reflectance spectrum
• Perceptual color – Cone spectral response: 3 numbers – Metamers: different spectrum, same responses
• Color matching, enables color reproduction with 3 primaries • Fundamental difficulty
– Spectra are infinite-dimensional (full function) – Projected to only 3 types of cones – Cone responses overlap / they are non-orthogonal
• Means different primaries for analysis and synthesis – Negative numbers are not physical
Summary
48

Questions?
49

• We need a principled color space • Many possible definition
– Including cone response (LMS) – Unfortunately not really used,
(because not known at the time)
• The good news is that color vision is linear and 3-dimensional, so any new color space based on color matching can be obtained using 3x3 matrix – But there are also non-linear color spaces
(e.g. Hue Saturation Value, Lab)
Standard color spaces
50

• Most standard color space: CIE XYZ • LMS and the various flavor of RGB are just
linear transformations of the XYZ basis – 3x3 matrices
Overview
51

Why not measure cone sensitivity?
• Less directly measurable – electrode in photoreceptor? – not available when color spaces were defined
• Most directly available measurement: – notion of metamers & color matching – directly in terms of color reproduction:
given an input color,
how to reproduce it with 3 primary colors?
– Commission Internationale de l’Eclairage (International Lighting Commission)
– Circa 1920
Spectral
Sensibility
of the
L, M and S
Cones
S M L
52

• Choose 3 synthesis primaries • Seek to match any monochromatic light (400 to 700nm)
– Record the 3 values for each wavelength
• By linearity, this tells us how to match any light
CIE color matching
53

• Primaries (synthesis) at 435.8, 546.1 and 700nm – Chosen for robust reproduction, good separation in red-green – Don’t worry, we’ll be able to convert it to any other set of
primaries (Linear algebra to the rescue!)
• Resulting 3 numbers for each input wavelength are called tristimulus values
CIE color matching
54

Now, our interactive
feature!
You are...
THE LAB RAT 55

56

• Some colors cannot be produced using only positively weighted primaries
• Solution: add light on the other side!
Color Matching Problem
57
© source unknown. All rights reserved. This content is excluded from our Creative
Commons license. For more information, see http://ocw.mit.edu/help/faq-fair-use/.

• Meaning of these curves: a monochromatic wavelength λ can be reproduced with b(λ) amount of the 435.8nm primary, +g(λ) amount of the 546.1 primary, +r(λ) amount of the 700 nm primary
• This fully specifies the color
perceived by a human • Careful: this is not your usual rgb
CIE color matching
58

• Meaning of these curves: a monochromatic wavelength λ can be reproduced with b(λ) amount of the 435.8nm primary, +g(λ) amount of the 546.1 primary, +r(λ) amount of the 700 nm primary
• This fully specifies the color
perceived by a human • However, note that one of
the responses can be negative
Those colors cannot be reproduced by those 3 primaries.
CIE color matching
59

• If I have a given spectrum X • I compute its response to the 3 matching curves
(multiply and integrate) • I use these 3 responses to
scale my 3 primaries (435.8, 546.1 and 700nm)
• I get a metamer of X (perfect color reproduction)
CIE color matching: what does it mean?
60

Relation to cone curves
• Project to the same subspace – b, g, and r are linear combinations of S, M and L
• Related by 3x3 matrix. • Unfortunately unknown at that time. This would
have made life a lot easier!
61

Recap
• Spectra : infinite dimensional • Cones: 3 spectral responses • Metamers: spectra that look the same
(same projection onto cone responses) • CIE measured color response:
– chose 3 primaries – tristimulus curves to reproduce any wavelength
• Questions?
62

How to build a measurement device?
• Idea: – Start with light sensor sensitive to all wavelength – Use three filters with spectra b, r, g – measure 3 numbers
• This is pretty much what the eyes do!
63

CIE’s problem
• Idea: – Start with light sensor sensitive to all wavelength – Use three filters with spectra b, r, g – measure 3 numbers
• But for those primaries, we need negative spectra
64

CIE’s problem
• Obvious solution: use cone response! – but unknown at the time
• =>new set of tristimulus curves – linear combinations of b, g, r – pretty much add enough b and g
until r is positive
65
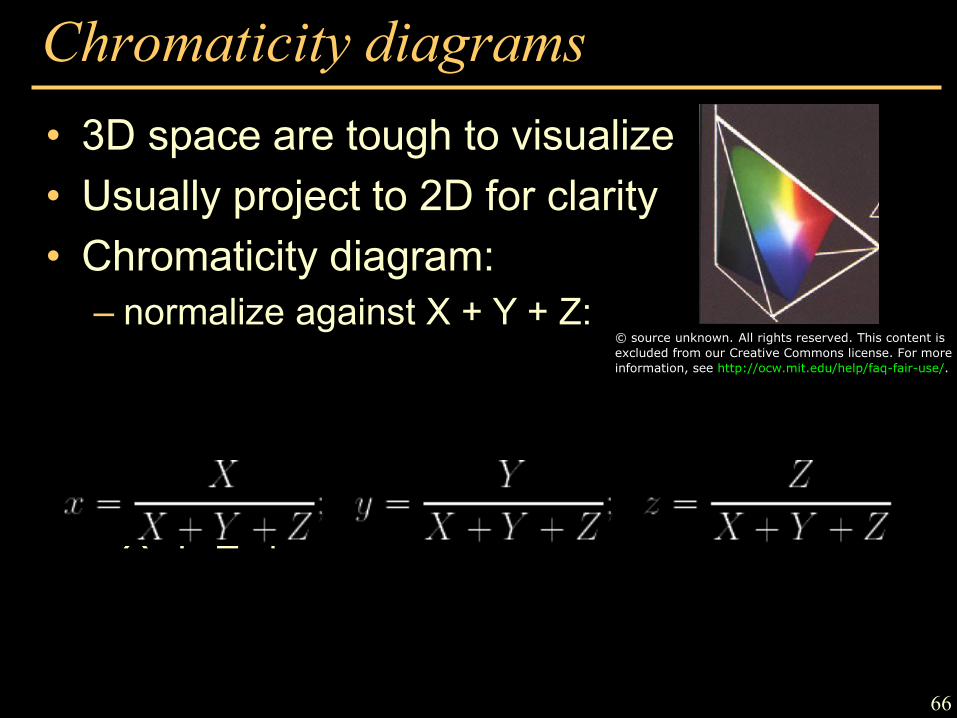
Chromaticity diagrams
• 3D space are tough to visualize • Usually project to 2D for clarity • Chromaticity diagram:
– normalize against X + Y + Z:
– Perspective projection to plane X+Y+Z=1
66
© source unknown. All rights reserved. This content isexcluded from our Creative Commons license. For more
information, see http://ocw.mit.edu/help/faq-fair-use/.

• THE standard for color specification • Lots of legacy decision - I wish it were LMS • Based on color matching
– 3 monochromatic primaries – Subjects matched every wavelength – Tricks to avoid negative numbers – These 3 values “measure”
or describe a perceived color.
CIE XYZ -recap
67

Questions?
68

Other primaries
• We want to use a new set of primaries – e.g. the spectra of R, G & B in a projector or monitor
• By linearity of color matching, can be obtained from XYZ by a 3x3 matrix
one example RGB space 69

Other primaries
• We want to use a new set of primaries – e.g. the spectra of R, G & B in a projector or monitor
• By linearity of color matching, can be obtained from XYZ by a 3x3 matrix
• This matrix tells us how to match the 3 primary spectra from XYZ using the new 3 primaries
one example RGB space 70

XYZ to RGB & back
• e.g. http://www.brucelindbloom.com/index.html?Eqn_RGB_XYZ_Matrix.html
• sRGB to XYZ XYZ to sRGB • Adobe RGB to XYZ XYZ to Adobe RGB • NTSC RGB to XYZ XYZ to NTSC RGB
0.412424 0.212656 0.0193324 0.357579 0.715158 0.119193 0.180464 0.0721856 0.950444
3.24071 -0.969258 0.0556352 -1.53726 1.87599 -0.203996 0.498571 0.0415557 1.05707
0.576700 0.297361 0.0270328 0.185556 0.627355 0.0706879 0.188212 0.0752847 0.991248
2.04148 -0.969258 0.0134455 -0.564977 1.87599 -0.118373 -0.344713 0.0415557 1.01527
0.606734 0.298839 0.000000 0.173564 0.586811 0.0661196 0.200112 0.114350 1.11491
1.91049 -0.984310 0.0583744 -0.532592 1.99845 -0.118518 -0.288284 -0.0282980 0.898611 71
72
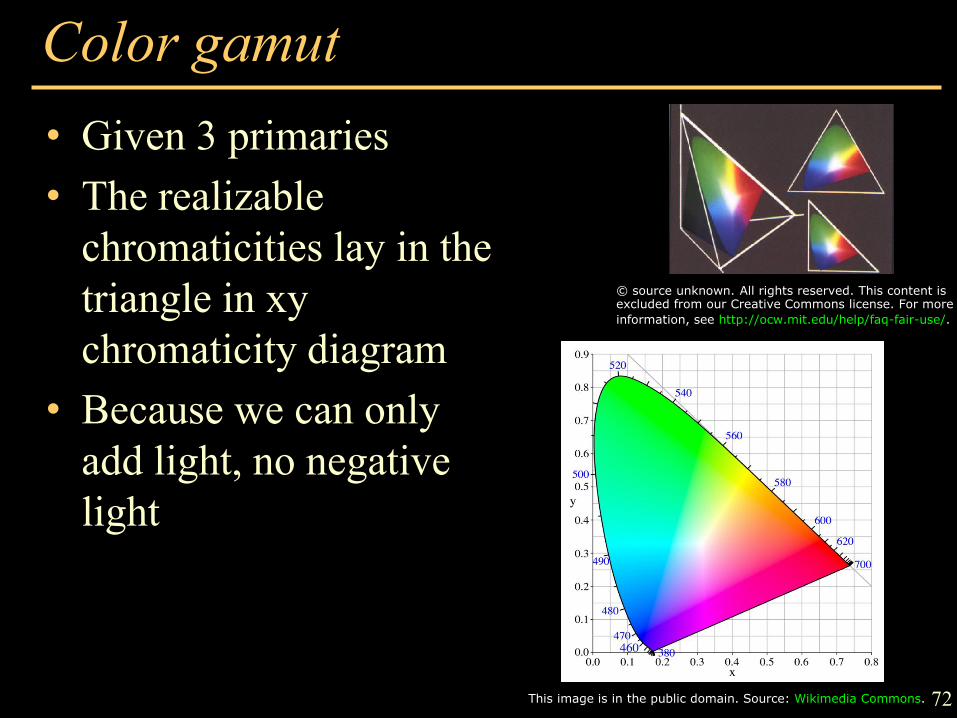
Color gamut
• Given 3 primaries • The realizable
chromaticities lay in the triangle in xy chromaticity diagram
• Because we can only add light, no negative light
C
© source unknown. All rights reserved. This content isexcluded from our Creative Commons license. For more
information, see http://ocw.mit.edu/help/faq-fair-use/.
This image is in the public domain. Source: Wikimedia Commons.

73
Image courtesy of Cpesacreta on Wikimedia Commons. License: CC-BY. Thiscontent is excluded from our Creative Commons license. For more
information, see http://ocw.mit.edu/help/faq-fair-use/.
Image courtesy of Spigget on Wikimedia Commons. License: CC-BY-SA.This content is excluded from our Creative Commons license. For more
information, see http://ocw.mit.edu/help/faq-fair-use/.

• It’s all about linear algebra – Projection from infinite-dimensional spectrum to a 3D
response – Then any space based on color matching and
metamerism can be converted by 3x3 matrix • Complicated because
– Projection from infinite-dimensional space – Non-orthogonal basis (cone responses overlap) – No negative light
• XYZ is the most standard color space • RGB has many flavors
In summary
74

Questions?
75
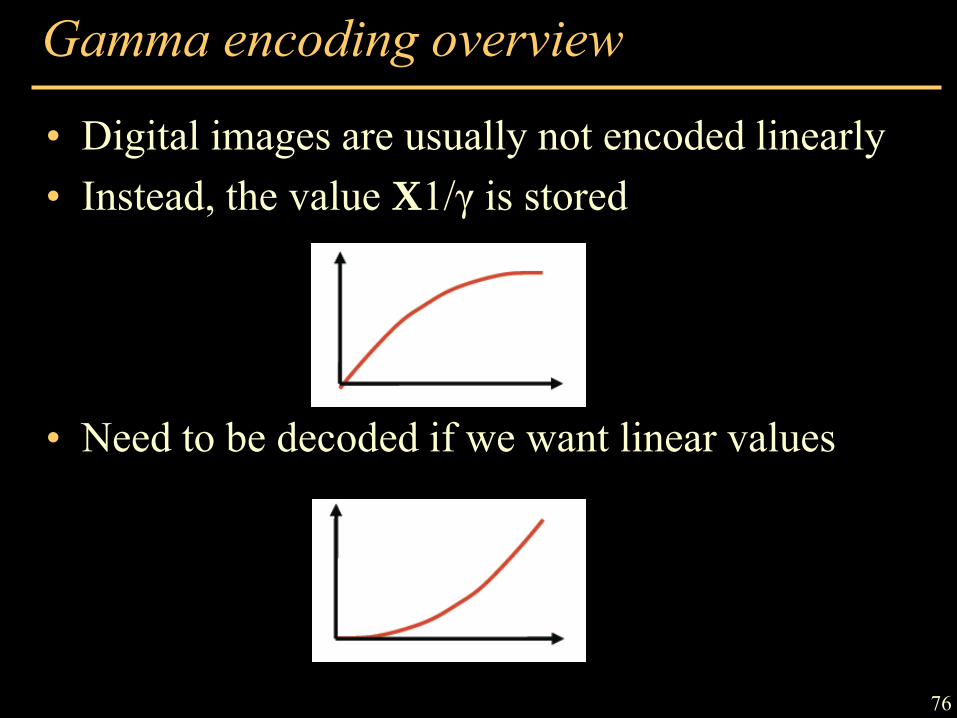
• Digital images are usually not encoded linearly • Instead, the value X1/γ is stored • Need to be decoded if we want linear values
Gamma encoding overview
76

• The human visual system is more sensitive to ratios – Is a grey twice as bright as another one?
• If we use linear encoding, we have tons of information between 128 and 255, but very little between 1 and 2!
• Ideal encoding? Log • Problems with log? Gets crazy around zero Solution: gamma
Color quantization gamma
77

• The human visual system is more sensitive to ratios – Is a grey twice as bright as another one?
• If we use linear encoding, we have tons of information between 128 and 255, but very little between 1 and 2!
• This is why a non-linear gamma remapping of about 2.0 is applied before encoding
• True also of analog imaging to optimize signal-noise ratio
Color quantization gamma
78
• The human visual system is more sensitive to ratios – Is a grey twice as bright as another one?
• If we use linear encoding, we have tons of information between 128 and 255, but very little between 1 and 2!
• This is why a non-linear gamma remapping of about 2.0 is applied before encoding
• True also of analog imaging to optimize signal-noise ratio
Color quantization gamma
79

• From Greg Ward • Only 6 bits for emphasis
Gamma encoding
80
• Digital images are usually gamma encoded – Often γ = 2.2 (but 1.8 for Profoto RGB)
• To get linear values, you must decode – apply x => xγ
Important Message
81

Questions?
82
Selected Bibliography
Vision and Art : The Biology of Seeing by Margaret Livingstone, David H. Hubel Harry N Abrams; ISBN: 0810904063 208 pages (May 2002)
Vision Science by Stephen E. Palmer MIT Press; ISBN: 0262161834 760 pages (May 7, 1999)
Billmeyer and Saltzman's Principles of Color Technology, 3rd Edition
by Roy S. Berns, Fred W. Billmeyer, Max Saltzman Wiley-Interscience; ISBN: 047119459X 304 pages 3 edition (March 31, 2000)
83
The Reproduction of Color by R. W. G. Hunt Fountain Press, 1995
Color Appearance Models by Mark Fairchild Addison Wesley, 1998
Color for the Sciences, by Jan Koenderink MIT Press 2010.

Questions?
84
Image courtesy of SharkD on Wikimedia Commons. License: CC-BY. This content is excluded from
our Creative Commons license. For more information, see http://ocw.mit.edu/help/faq-fair-use/.

MIT OpenCourseWarehttp://ocw.mit.edu
6.837 Computer GraphicsFall 2012
For information about citing these materials or our Terms of Use, visit: http://ocw.mit.edu/terms.