Color Image Segmentation Based on Mean Shift and …yiminzhang.com/pdf/tao07.pdf · 2007-10-08 ·...
8
1382 IEEE TRANSACTIONS ON SYSTEMS, MAN, AND CYBERNETICS—PART B: CYBERNETICS, VOL. 37, NO. 5, OCTOBER 2007 Color Image Segmentation Based on Mean Shift and Normalized Cuts Wenbing Tao, Hai Jin, Senior Member, IEEE, and Yimin Zhang, Senior Member, IEEE Abstract—In this correspondence, we develop a novel approach that provides effective and robust segmentation of color images. By incor- porating the advantages of the mean shift (MS) segmentation and the normalized cut (Ncut) partitioning methods, the proposed method requires low computational complexity and is therefore very feasible for real-time image segmentation processing. It preprocesses an image by using the MS algorithm to form segmented regions that preserve the desirable discontinuity characteristics of the image. The segmented regions are then represented by using the graph structures, and the Ncut method is applied to perform globally optimized clustering. Because the number of the segmented regions is much smaller than that of the image pixels, the proposed method allows a low-dimensional image clustering with significant reduction of the complexity compared to conventional graph- partitioning methods that are directly applied to the image pixels. In addition, the image clustering using the segmented regions, instead of the image pixels, also reduces the sensitivity to noise and results in enhanced image segmentation performance. Furthermore, to avoid some inappro- priate partitioning when considering every region as only one graph node, we develop an improved segmentation strategy using multiple child nodes for each region. The superiority of the proposed method is examined and demonstrated through a large number of experiments using color natural scene images. Index Terms—Color image segmentation, graph partitioning, mean shift (MS), normalized cut (Ncut). I. I NTRODUCTION Image segmentation is a process of dividing an image into different regions such that each region is nearly homogeneous, whereas the union of any two regions is not. It serves as a key in image analysis and pattern recognition and is a fundamental step toward low-level vision, which is significant for object recognition and tracking, image re- trieval, face detection, and other computer-vision-related applications [1]. Color images carry much more information than gray-level ones [24]. In many pattern recognition and computer vision applications, the color information can be used to enhance the image analysis process and improve segmentation results compared to gray-scale-based ap- proaches. As a result, great efforts have been made in recent years to investigate segmentation of color images due to demanding needs. Existing image segmentation algorithms can be generally classified into three major categories, i.e., feature-space-based clustering, spa- tial segmentation, and graph-based approaches. Feature-space-based clustering approaches [12], [13] capture the global characteristics of the image through the selection and calculation of the image features, which are usually based on the color or texture. By using a specific distance measure that ignores the spatial information, the feature Manuscript received August 3, 2006; revised December 10, 2006. This work was supported by the National Natural Science Foundation of China under Grant 60603024. This paper was recommended by Associate Editor I. Bloch. W. Tao and H. Jin are with the Cluster and Grid Computing Laboratory, School of Computer Science and Technology, Huazhong University of Science and Technology, Wuhan 430074, China, and also with the Service Computing Technology and System Laboratory, School of Computer Science and Technol- ogy, Huazhong University of Science and Technology, Wuhan 430074, China (e-mail: [email protected]; [email protected]). Y. Zhang is with the Center for Advanced Communications, Villanova University, Villanova, PA 19085 USA (e-mail: [email protected]). Color versions of one or more of the figures in this paper are available online at http://ieeexplore.ieee.org. Digital Object Identifier 10.1109/TSMCB.2007.902249 samples are handled as vectors, and the objective is to group them into compact, but well-separated clusters [7]. Although the data clustering approaches are efficient in finding salient image features, they have some serious drawbacks as well. The spatial structure and the detailed edge information of an image are not preserved, and pixels from disconnected regions of the image may be grouped together if their feature spaces overlap. Given the importance of edge information, as well as the need to preserve the spatial relation- ship between the pixels on the image plane, there is a recent tendency to handle images in the spatial domain [11], [28]. The spatial segmen- tation method is also referred to as region-based when it is based on region entities. The watershed algorithm [19] is an extensively used technique for this purpose. However, it may undesirably produce a very large number of small but quasi-homogenous regions. Therefore, some merging algorithm should be applied to these regions [20], [28]. Graph-based approaches can be regarded as image perceptual grouping and organization methods based on the fusion of the feature and spatial information. In such approaches, visual group is based on several key factors such as similarity, proximity, and continuation [3], [5], [21], [25]. The common theme underlying these approaches is the formation of a weighted graph, where each vertex corresponds to n image pixel or a region, and the weight of each edge connecting two pixels or two regions represents the likelihood that they belong to the same segment. The weights are usually related to the color and texture features, as well as the spatial characteristic of the corresponding pixels or regions. A graph is partitioned into multiple components that minimize some cost function of the vertices in the components and/or the boundaries between those components. So far, several graph cut-based methods have been developed for image segmentations [8], [14], [22], [23], [27], [30], [31]. For example, Shi and Malik [23] proposed a general image segmentation approach based on normalized cut (Ncut) by solving an eigensystem, and Wang and Siskind [8] developed an image-partitioning approach by using a complicated graph reduction. Besides graph-based approaches, there are also some other types of image segmentation approaches that mix the feature and spatial information [4], [29]. This correspondence concerns a Ncut method in a large scale. It has been empirically shown that the Ncut method can robustly generate balanced clusters and is superior to other spectral graph- partitioning methods, such as average cut and average association [23]. The Ncut method has been applied in video summarization, scene detection [17], and cluster-based image retrieval [18]. However, image segmentation approaches based on Ncut, in general, require high computation complexity and, therefore, are not suitable for real-time processing [23]. An efficient solution to this problem is to apply the graph representation strategy on the regions that are derived by some region segmentation method. For example, Makrogiannis et al. [20] developed an image segmentation method that incorporates region- based segmentation and graph-partitioning approaches. This method first produces a set of oversegmented regions from an image by using the watershed algorithm, and a graph structure is then applied to represent the relationship between these regions. Not surprisingly, the overall segmentation performance of the region-based graph-partitioning approaches is sensitive to the region segmentation results and the graph grouping strategy. The inherent oversegmentation effect of the watershed algorithm used in [20] and [28] produces a large number of small but quasi-homogenous regions, which may lead to a loss in the salient features of the overall image and, therefore, yield performance degradation in the consequent region grouping. To overcome these problems, we propose in this correspondence a novel approach that provides effective and robust image segmentation 1083-4419/$25.00 © 2007 IEEE
-
Upload
truongxuyen -
Category
Documents
-
view
226 -
download
0
Transcript of Color Image Segmentation Based on Mean Shift and …yiminzhang.com/pdf/tao07.pdf · 2007-10-08 ·...

1382 IEEE TRANSACTIONS ON SYSTEMS, MAN, AND CYBERNETICS—PART B: CYBERNETICS, VOL. 37, NO. 5, OCTOBER 2007
Color Image Segmentation Based onMean Shift and Normalized Cuts
Wenbing Tao, Hai Jin, Senior Member, IEEE, andYimin Zhang, Senior Member, IEEE
Abstract—In this correspondence, we develop a novel approach thatprovides effective and robust segmentation of color images. By incor-porating the advantages of the mean shift (MS) segmentation and thenormalized cut (Ncut) partitioning methods, the proposed method requireslow computational complexity and is therefore very feasible for real-timeimage segmentation processing. It preprocesses an image by using theMS algorithm to form segmented regions that preserve the desirablediscontinuity characteristics of the image. The segmented regions arethen represented by using the graph structures, and the Ncut methodis applied to perform globally optimized clustering. Because the numberof the segmented regions is much smaller than that of the image pixels,the proposed method allows a low-dimensional image clustering withsignificant reduction of the complexity compared to conventional graph-partitioning methods that are directly applied to the image pixels. Inaddition, the image clustering using the segmented regions, instead of theimage pixels, also reduces the sensitivity to noise and results in enhancedimage segmentation performance. Furthermore, to avoid some inappro-priate partitioning when considering every region as only one graph node,we develop an improved segmentation strategy using multiple child nodesfor each region. The superiority of the proposed method is examined anddemonstrated through a large number of experiments using color naturalscene images.
Index Terms—Color image segmentation, graph partitioning, mean shift(MS), normalized cut (Ncut).
I. INTRODUCTION
Image segmentation is a process of dividing an image into differentregions such that each region is nearly homogeneous, whereas theunion of any two regions is not. It serves as a key in image analysis andpattern recognition and is a fundamental step toward low-level vision,which is significant for object recognition and tracking, image re-trieval, face detection, and other computer-vision-related applications[1]. Color images carry much more information than gray-level ones[24]. In many pattern recognition and computer vision applications, thecolor information can be used to enhance the image analysis processand improve segmentation results compared to gray-scale-based ap-proaches. As a result, great efforts have been made in recent years toinvestigate segmentation of color images due to demanding needs.
Existing image segmentation algorithms can be generally classifiedinto three major categories, i.e., feature-space-based clustering, spa-tial segmentation, and graph-based approaches. Feature-space-basedclustering approaches [12], [13] capture the global characteristics ofthe image through the selection and calculation of the image features,which are usually based on the color or texture. By using a specificdistance measure that ignores the spatial information, the feature
Manuscript received August 3, 2006; revised December 10, 2006. This workwas supported by the National Natural Science Foundation of China underGrant 60603024. This paper was recommended by Associate Editor I. Bloch.
W. Tao and H. Jin are with the Cluster and Grid Computing Laboratory,School of Computer Science and Technology, Huazhong University of Scienceand Technology, Wuhan 430074, China, and also with the Service ComputingTechnology and System Laboratory, School of Computer Science and Technol-ogy, Huazhong University of Science and Technology, Wuhan 430074, China(e-mail: [email protected]; [email protected]).
Y. Zhang is with the Center for Advanced Communications, VillanovaUniversity, Villanova, PA 19085 USA (e-mail: [email protected]).
Color versions of one or more of the figures in this paper are available onlineat http://ieeexplore.ieee.org.
Digital Object Identifier 10.1109/TSMCB.2007.902249
samples are handled as vectors, and the objective is to group them intocompact, but well-separated clusters [7].
Although the data clustering approaches are efficient in findingsalient image features, they have some serious drawbacks as well. Thespatial structure and the detailed edge information of an image are notpreserved, and pixels from disconnected regions of the image may begrouped together if their feature spaces overlap. Given the importanceof edge information, as well as the need to preserve the spatial relation-ship between the pixels on the image plane, there is a recent tendencyto handle images in the spatial domain [11], [28]. The spatial segmen-tation method is also referred to as region-based when it is based onregion entities. The watershed algorithm [19] is an extensively usedtechnique for this purpose. However, it may undesirably produce a verylarge number of small but quasi-homogenous regions. Therefore, somemerging algorithm should be applied to these regions [20], [28].
Graph-based approaches can be regarded as image perceptualgrouping and organization methods based on the fusion of the featureand spatial information. In such approaches, visual group is based onseveral key factors such as similarity, proximity, and continuation [3],[5], [21], [25]. The common theme underlying these approaches is theformation of a weighted graph, where each vertex corresponds to nimage pixel or a region, and the weight of each edge connecting twopixels or two regions represents the likelihood that they belong to thesame segment. The weights are usually related to the color and texturefeatures, as well as the spatial characteristic of the correspondingpixels or regions. A graph is partitioned into multiple componentsthat minimize some cost function of the vertices in the componentsand/or the boundaries between those components. So far, several graphcut-based methods have been developed for image segmentations [8],[14], [22], [23], [27], [30], [31]. For example, Shi and Malik [23]proposed a general image segmentation approach based on normalizedcut (Ncut) by solving an eigensystem, and Wang and Siskind [8]developed an image-partitioning approach by using a complicatedgraph reduction. Besides graph-based approaches, there are also someother types of image segmentation approaches that mix the feature andspatial information [4], [29].
This correspondence concerns a Ncut method in a large scale.It has been empirically shown that the Ncut method can robustlygenerate balanced clusters and is superior to other spectral graph-partitioning methods, such as average cut and average association [23].The Ncut method has been applied in video summarization, scenedetection [17], and cluster-based image retrieval [18]. However, imagesegmentation approaches based on Ncut, in general, require highcomputation complexity and, therefore, are not suitable for real-timeprocessing [23]. An efficient solution to this problem is to apply thegraph representation strategy on the regions that are derived by someregion segmentation method. For example, Makrogiannis et al. [20]developed an image segmentation method that incorporates region-based segmentation and graph-partitioning approaches. This methodfirst produces a set of oversegmented regions from an image by usingthe watershed algorithm, and a graph structure is then applied torepresent the relationship between these regions.
Not surprisingly, the overall segmentation performance of theregion-based graph-partitioning approaches is sensitive to the regionsegmentation results and the graph grouping strategy. The inherentoversegmentation effect of the watershed algorithm used in [20] and[28] produces a large number of small but quasi-homogenous regions,which may lead to a loss in the salient features of the overall imageand, therefore, yield performance degradation in the consequent regiongrouping.
To overcome these problems, we propose in this correspondence anovel approach that provides effective and robust image segmentation
1083-4419/$25.00 © 2007 IEEE

IEEE TRANSACTIONS ON SYSTEMS, MAN, AND CYBERNETICS—PART B: CYBERNETICS, VOL. 37, NO. 5, OCTOBER 2007 1383
with low computational complexity by incorporating the mean shift(MS) and the Ncut methods. In the proposed method, we first performimage region segmentation by using the MS algorithm [4], and wethen treat these regions as nodes in the image plane and apply a graphstructure to represent them. The final step is to apply the Ncut methodto partition these regions.
The MS algorithm is a robust feature-space analysis approach [4]which can be applied to discontinuity preserving smoothing and imagesegmentation problems. It can significantly reduce the number of basicimage entities, and due to the good discontinuity preserving filteringcharacteristic, the salient features of the overall image are retained. Thelatter property is particularly important in the partitioning of naturalimages, in which only several distinct regions are used in representingdifferent scenes such as sky, lake, sand beach, person, and animal,whereas other information within a region is often less important andcan be neglected. However, it is difficult to partition a natural imageinto significative regions to represent distinct scenes, depending onlyon the MS segmentation algorithm. The main reason is that the MSalgorithm is an unsupervised clustering-based segmentation method,where the number and the shape of the data cluster are unknowna priori. Moreover, the termination of the segmentation process isbased on some region-merging strategy applied to the filtered imageresult, and the number of regions in the segmented image is mainlydetermined by the minimum number of pixels in a region, which isdenoted as M (i.e., regions containing less than M pixels will beeliminated and merged into its neighboring region). In our proposedapproach, therefore, an appropriate value of M is chosen to yield agood region representation in the sense that the number of segmentedregions is larger than the number of typical scenes, but is much smallerthan the number of pixels in the image, and the boundary informationof the typical scenes is retained by the boundaries of the regions.
The Ncut method [23], on the other hand, can be considered as aclassification method. In most image segmentation applications, theNcut method is applied directly to the image pixels, which are typicallyof very large size and thus require huge computational complexity.For example, to use the Ncut method in [26], a gray image has to bedecimated into a size of 160 × 160 pixels or smaller. In summary, itis difficult to get real-time segmentation using the Ncut method. Inthe proposed method, the Ncut method is applied to the segmentedregions instead of the raw image pixels. As such, it eliminates themajor problem of the Ncut method that requires prohibitively highcomplexity. By applying the Ncut method to the preprocessed regionsrather than the raw image pixels, the proposed method achieves asignificant reduction of the computational cost and, therefore, rendersreal-time image segmentation much more practically implemental.On the other hand, due to some approximation in the implementationof the Ncut method, the segmentation processing of a graph exploitingthe lower dimensional region-based weight matrix also provides moreprecise and robust partitioning performance compared to that based onthe pixel-based weight matrix.
This correspondence is organized as follows. In Section II, weintroduce the background of the proposed method. In Section III, theproposed algorithm is described for effective color image partition-ing. In Section IV, we demonstrate the superiority of the proposedmethod by comparing the performance of the proposed approach toexisting methods using a variety of color natural scene images. Finally,Section V concludes this correspondence.
II. MS AND GRAPH PARTITIONING
A. Image Region Segmentation Based on MS
The computational module based on the MS procedure is an ex-tremely versatile tool for feature-space analysis. In [4], two applica-
tions of the feature-space analysis technique are discussed based on theMS procedure: discontinuity preserving filtering and the segmentationof gray-level or color images. In this section, we present a briefreview of the image segmentation method based on the MS procedure[4], [9], [10].
We consider radially symmetric kernels satisfying K(x) =ck,dk(‖x‖2), where constant ck,d > 0 is chosen such that∫ ∞0
K(x)dx =∫ ∞0
ck,dk(‖x‖2)dx = 1 [note that k(x) is definedonly for x ≥ 0]. k(x) is a monotonically decreasing functionand is referred to as the profile of the kernel. Given the functiong(x) = −k
′(x) for profile, the kernel G(x) is defined as
G(x) = cg,dg(‖x‖2). For n data points xi, i = 1, . . . , n, in thed-dimensional space Rd, the MS is defined as
mh,G(x) =
n∑i=1
xig(∥∥x−xi
h
∥∥2)
n∑i=1
g(∥∥x−xi
h
∥∥2) − x (1)
where x is the center of the kernel (window), and h is a bandwidthparameter. Therefore, the MS is the difference between the weightedmean, using kernel G as the weights and x as the center of the kernel(window). The MS method is guaranteed to converge to a nearby pointwhere the estimate has zero gradient [4]. Regions of low-density valuesare of no interest for the feature-space analysis, and in such regions, theMS steps are large. On the other hand, near local maxima, the steps aresmall, and the analysis is more refined. The MS procedure, thus, is anadaptive gradient ascent method [6]. The center position of kernel Gcan be updated iteratively by
yj+1 =
n∑i=1
xig
(∥∥∥ yj−xi
h
∥∥∥2)
n∑i=1
g
(∥∥∥ yj−xi
h
∥∥∥2) , j = 1, 2, . . . (2)
where y1 is the center of the initial position of the kernel.Based on the above analysis, the MS image filtering algorithm
can be obtained. First, an image is represented as a 2-D lattice ofp-dimensional vectors (pixels), where p = 1 for gray-level images,p = 3 for color images, and p > 3 for multispectral images. The spaceof the lattice is known as the spatial domain, while the graph leveland the color of spectral information are represented in the rangedomain. For both domains, the Euclidean metric is assumed. Let xi
and zi, i = 1, . . . , n, respectively, be the d-dimensional (d = p + 2)input and the filtered image pixels in the joint spatial-range domain.
The segmentation is actually a merging process performed on aregion that is produced by the MS filtering. The use of the MS seg-mentation algorithm requires the selection of the bandwidth parameterh = (hr, hs), which, by controlling the size of the kernel, determinesthe resolution of the mode detection.
B. Spectral Graph Partitioning
Among many graph theoretic algorithms, spectral graph-partitioning methods have been successfully applied to many areas incomputer vision, including motion analysis [16], image segmentation[8], [23], [27], [31], image retrieval [18], video summarization [17],and object recognition [15]. In this correspondence, we use one ofthese techniques, namely, the Ncut method [23], for region clustering.Next, we briefly review the Ncut method based on the studies in [14],[23], and [27].
Roughly speaking, a graph-partitioning method attempts to organizenodes into groups such that the intragroup similarity is high and the

1384 IEEE TRANSACTIONS ON SYSTEMS, MAN, AND CYBERNETICS—PART B: CYBERNETICS, VOL. 37, NO. 5, OCTOBER 2007
Fig. 1. (a) Original image. (b) Result image after using the MS segmentation algorithm. (c) Labeled regions. (d) RAGs produced by the node space relation, witha region corresponding to a node. (e) Final region-partitioning result using the Ncut method on the RAG in (d).
intergroup similarity is low. Given a graph G = (V,E,W), where Vis the set of nodes, and E is the set of edges connecting the nodes.A pair of nodes u and ν is connected by an edge and is weightedby w(u, ν) = w(ν, u) ≥ 0 to measure the dissimilarity between them.W is an edge affinity matrix with w(u, ν) as its (u, ν)th element. Thegraph can be partitioned into two disjoint sets A and B = V −Aby removing the edges connecting the two parts. The degree ofdissimilarity between the two sets can be computed as a total weight ofthe removed edges. This closely relates to a mathematical formulationof a cut [22]
cut(A,B) =∑
u∈A,ν∈B
w(u, ν). (3)
This problem of finding the minimum cut has been well studied[22], [23], [27]. However, the minimum cut criterion favors groupingsmall sets of isolated nodes in the graph because the cut definedin (3) does not contain any intragroup information [23]. In otherwords, the minimum cut usually yields overclustered results when itis recursively applied. This motivates several modified graph partitioncriteria, including the Ncut [23]
Ncut(A,B) =cut(A,B)
assoc(A,V)+
cut(A,B)
assoc(B,V)(4)
where assoc(A,V) denotes the total connection from nodes in A toall nodes in the graph, and asso(B,V) is similarly defined. Unlike thecut criterion that has a bias in favor of cutting small sets of nodes, theNcut criterion is unbiased.
III. PROPOSED APPROACH
A. Description of the Algorithm Scheme
We now describe our proposed algorithm. From a data-flow pointof view, the outline of the proposed algorithm can be characterizedas the following. First, an image is segmented into multiple separatedregions using the MS algorithm. Second, the graph representation ofthese regions is constructed, and the dissimilarity measure between theregions is defined. Finally, a graph-partitioning algorithm based on theNcut is employed to form the final segmentation map.
The regions produced by the MS segmentation can be representedby a planar weighted region adjacency graph (RAG) G = (V,E,W)that incorporates the topological information of the image structureand region connectivity. The majority of region-merging algorithmsdefine the region dissimilarity metric as the distance between twoadjacent regions in an appropriate feature space. This dissimilaritymetric plays a decisive role in determining the overall performance of
the image segmentation process. To define the measure of dissimilaritybetween neighboring regions, we first define an appropriate featurespace. Features like color, texture, statistical characteristics, and 2-Dshape are useful for segmentation purposes and can be extracted froman image region. We adopt the color feature in this paper because itis usually the most dominant and distinguishing visual feature andadequate for a number of segmentation tasks. The average colorcomponents are computed over a region’s pixels and are describedby a three-element color vector. When an image is segmented basedon the MS method into n regions Ri, i = 1, . . . , n, the mean vectorX̄Ri
= {x̄1i, x̄2i, x̄3i} is computed for each region, where x̄1i, x̄2i,and x̄3i are the mean pixel intensities of the ith region in the threedifferent color spaces, respectively.
Proper selection of the color spaces is important to the developmentof a good region-merging algorithm. To obtain meaningfulsegmentation results, the perceived color difference should beassociated with the Euclidean distance in the color space. The spacesL∗u∗v∗ and L∗a∗b∗ have been particularly designed to closelyapproximate the perceptually uniform color spaces. In both cases, L∗,which is the lightness (relative brightness) coordinate, is defined in thesame way. The two spaces differ only in the chromaticity coordinates,and in practice, there is no clear advantage of using one over the other.In this paper, we employed L∗u∗v∗ motivated by its linear mappingproperty [2].
By defining the color space, we can compute the weight matrixW of all regions. The weight w(u, ν) between regions u and ν isdefined as
w(u, ν) =
{e−[
‖F(u)−F(ν)‖22
dI
], if u and ν are adjacent
0, otherwise(5)
where F(u) = {L(u),u(u),v(u)} is the color vector of region u, and‖ · ‖2 denotes the vector norm operator. In addition, dI is a positivescaling factor that determines the sensitivity of w(u, ν) to the colordifference between nodes u and ν.
Under a graph representation, region grouping can be naturallyformulated as a graph-partitioning problem. In the proposed method,the Ncut algorithm is used to solve such a problem. The majordifference between the proposed method and the conventional Ncutalgorithm is that the construction of the weight matrix is based not onthe pixels of the original image but rather on the segmentation result ofthe MS algorithm. The advantages of using regions instead of pixels inconstructing the weight matrix are twofold: 1) It offers a considerablereduction of computational complexity, since the number of basicimage entities is by far smaller than that of the pixels. Thus, the sizeof the weight matrix and, subsequently, the complexity of the graph

IEEE TRANSACTIONS ON SYSTEMS, MAN, AND CYBERNETICS—PART B: CYBERNETICS, VOL. 37, NO. 5, OCTOBER 2007 1385
TABLE IWEIGHT MATRIX W OF ALL REGION NODES
TABLE IIWEIGHT MATRIX W OF ALL THE CHILD NODES OF REGIONS 1–4
structure employed for image representation are significantly reduced.As a result, the bottleneck problem of computation and storage require-ments in applying the Ncut algorithm is solved. 2) It achieves improvedsegmentation performance. Although the implementation strategy ofusing the Ncut method to partition a graph based on region nodes is thesame as that based on pixel nodes, the feature difference between theregion nodes formed by the MS algorithm is larger and more robustthan that between the pixel nodes. Therefore, the partitioning of thegraph based on regions using the Ncut method is easier and moreaccurate than that based on pixels. Moreover, the MS algorithm notonly removes noise, which limits the accuracy of graph partitioning inthe Ncut method, but also adaptively reduces the amount of smoothingnear abrupt changes in the edges and, as such, retains the salientfeatures of the overall image.
B. Illustration of the Implementation Procedure
In order to illustrate the implementation process of the proposedalgorithm, we use the example of a mountain image under sky, asdepicted in Fig. 1. The image size is 256 × 384. Fig. 1(a) shows theoriginal image, and Fig. 1(b) depicts the resultant image after applyingthe MS segmentation algorithm, with the white contours depicting theboundaries between the regions. We set h = (hr, hs) = (6, 8) andM = 2000. As a result, the MS segmentation algorithm produces 14regions. Fig. 1(c) shows the labeled region result, and Fig. 1(d) is theRAG derived from the labeled regions, where only the neighboringregions have weighted edges. Then, the weight matrix W of all regionnodes is computed, and the results are summarized in Table I. Fig. 1(e)depicts the region-partitioning result using the Ncut algorithm, withpartitioning class k = 4. The resulting four eigenvalues, the corre-sponding eigenvectors, and the discretized eigenvectors are used topartition the region nodes. Based on the discrete eigenvectors, thefollowing four clusters are formed: Regions 1 and 2 are merged to
Fig. 2. (a) RAGs produced by the node space relations, with a regioncorresponding to three nodes. (b) Final region-partitioning result using theNcut method on the RAG in (a). (c) Partitioning result using the Ncut methodimplemented by Cour et al. [26].
form the first cluster, regions 3–5 the second cluster, regions 6–12 thethird cluster, and regions 13 and 14 the fourth cluster.
C. Segmentation Improvement Using Multiple Child Nodes
Although the graph-partitioning process merges the regions gener-ated by the MS algorithm into four clusters, the final region segmen-tation result in Fig. 1(e) is not perfect because the sky and the topregion of the mountain near the sky are merged into the same cluster.The grouping of the other regions is not satisfactory either. It is well
1386 IEEE TRANSACTIONS ON SYSTEMS, MAN, AND CYBERNETICS—PART B: CYBERNETICS, VOL. 37, NO. 5, OCTOBER 2007
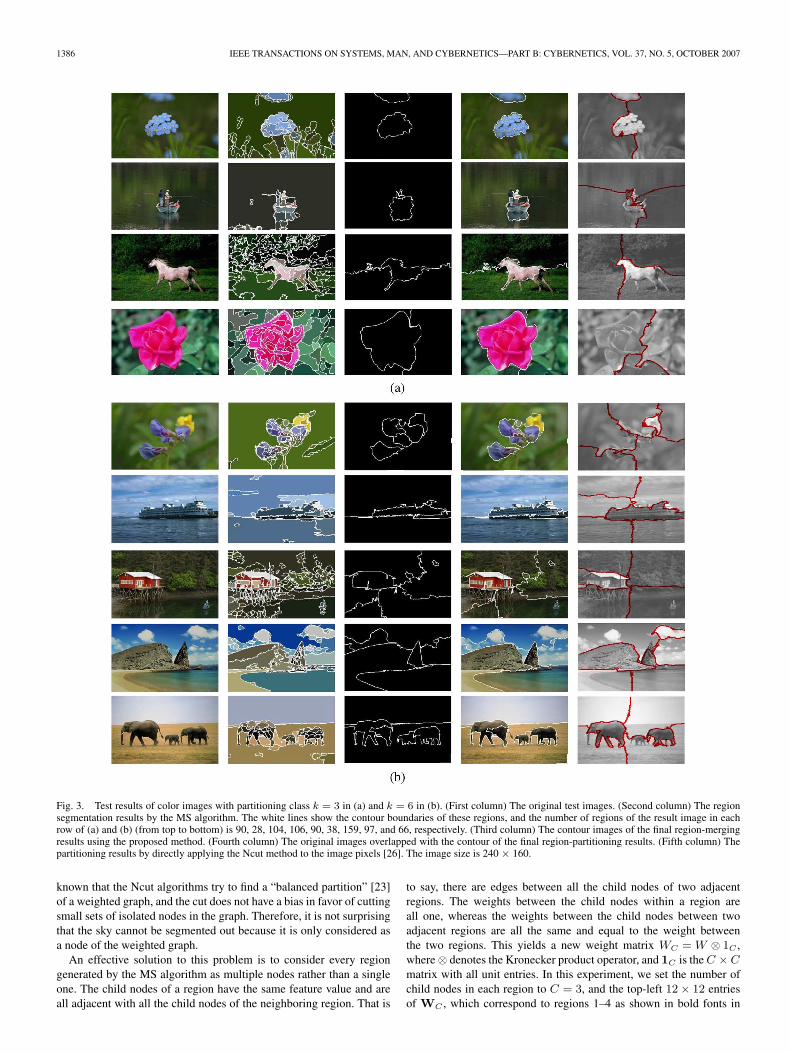
Fig. 3. Test results of color images with partitioning class k = 3 in (a) and k = 6 in (b). (First column) The original test images. (Second column) The regionsegmentation results by the MS algorithm. The white lines show the contour boundaries of these regions, and the number of regions of the result image in eachrow of (a) and (b) (from top to bottom) is 90, 28, 104, 106, 90, 38, 159, 97, and 66, respectively. (Third column) The contour images of the final region-mergingresults using the proposed method. (Fourth column) The original images overlapped with the contour of the final region-partitioning results. (Fifth column) Thepartitioning results by directly applying the Ncut method to the image pixels [26]. The image size is 240 × 160.
known that the Ncut algorithms try to find a “balanced partition” [23]of a weighted graph, and the cut does not have a bias in favor of cuttingsmall sets of isolated nodes in the graph. Therefore, it is not surprisingthat the sky cannot be segmented out because it is only considered asa node of the weighted graph.
An effective solution to this problem is to consider every regiongenerated by the MS algorithm as multiple nodes rather than a singleone. The child nodes of a region have the same feature value and areall adjacent with all the child nodes of the neighboring region. That is
to say, there are edges between all the child nodes of two adjacentregions. The weights between the child nodes within a region areall one, whereas the weights between the child nodes between twoadjacent regions are all the same and equal to the weight betweenthe two regions. This yields a new weight matrix WC = W ⊗ 1C ,where ⊗ denotes the Kronecker product operator, and 1C is the C × Cmatrix with all unit entries. In this experiment, we set the number ofchild nodes in each region to C = 3, and the top-left 12 × 12 entriesof WC , which correspond to regions 1–4 as shown in bold fonts in

IEEE TRANSACTIONS ON SYSTEMS, MAN, AND CYBERNETICS—PART B: CYBERNETICS, VOL. 37, NO. 5, OCTOBER 2007 1387
Fig. 4. Test results of color images with the variable partitioning class. The partitioning class k of each row (from top to bottom) is 4, 6, 8, 10, and 12, respectively.The number of regions of the result image in the second column is (from top to bottom) 49, 117, 92, 128, and 98, respectively. The size of the image is 160 × 240for the first row and 240 × 160 for other rows.
TABLE IIICOMPARED COMPUTATIONAL COST BETWEEN THE PROPOSED METHOD AND THE Ncut METHOD
Table I, are depicted in Table II. The adjacent graph of all the childnodes of regions 1–4 is shown in Fig. 2(a).
Fig. 2(b) illustrates the final region-partitioning result using the Ncutalgorithm based on the new weight matrix WC , where the partitioningclass remains k = 4. In the modified scheme, region 1 alone forms a
cluster, regions 2–5 are merged to form the second cluster, regions6–13 as the third cluster, and region 14 forms the fourth cluster. Notethat the sky and the mountain are now separated into different clusters.Evidently, the final region segmentation result shown in Fig. 2(b) isbetter than that shown in Fig. 1(e). For comparison, Fig. 2(c) also

1388 IEEE TRANSACTIONS ON SYSTEMS, MAN, AND CYBERNETICS—PART B: CYBERNETICS, VOL. 37, NO. 5, OCTOBER 2007
shows the segmentation results of the Ncut method implemented byCour et al. [26] where the sky is separated into two parts.
IV. EXPERIMENTAL RESULTS
We have applied the proposed algorithm for the segmentation of aset of color images with natural scenes. In this section, we present theexperimental results, indicating the different stages of the method. Thecontrastive experiment results using the Ncut method implemented byCour et al. [26] are also presented for comparison. The sizes of allthe test images are either 240 × 160 or 160 × 240. The parametersof the MS segmentation algorithm are set to h = (hr, hs) = (6, 8)and M = 50. With this parameter setting, the number of the regionsproduced by the MS algorithm is less than 200 regions (i.e., the RAGhas less than 200 nodes) for all the test images we used. Therefore,the dimension of the weight matrix is dramatically reduced from thenumber of image pixels to the number of regions, and subsequently, thecomplexity of the graph structure employed for image representationis also reduced. To retain the advantage of the balanced partition of theNcut method, we use C = 3 to construct the weight matrix WC .
The test examples include three image sets. The results of the firstset of examples are shown in Fig. 3(a), where the partitioning classk is three. The results of the second set of examples are shown inFig. 3(b), where k = 6. The results of the third set of examples areshown in Fig. 4 with varying values of k. In each figure, the fivecolumns respectively show, from left to right, the original test image,the resultant image after applying the MS segmentation algorithm,the contour image of the final region partitioning, the original imagesoverlapped with the final partitioning contour, and the partitioningresult using the Ncut method implemented by Cour et al. [26].
As discussed in Section III-C, considering a region produced by theMS algorithm as several identical child nodes can prevent the pixels inthis region from being divided into several parts when the Ncut methodis applied. For example, in the second row of Fig. 3(a), the imageincludes the fisher in the foreground and the lake in the background.Therefore, an effective segmentation method should distinguish thefisher from the lake background. However, when the Ncut method isdirectly applied to the image pixels, the image is partitioned into threeregions where each region includes one part of the lake. If we firstprocess the image using the MS segmentation algorithm, then the mostpixels of the lake background are formed into a region. The proposedmethod treats this region as several nodes with the identical charac-teristic and, as such, avoids partitioning the lake into several differentparts. The experimental results of the second and fifth rows in Fig. 3(b)and the third and fifth rows in Fig. 4 also support the same claim.
For all the experimental results shown in Figs. 3 and 4, the proposedmethod effectively partitions the natural scenes into several mean-ingful regions and provides an improved performance compared tothe Ncut method, which does not always yield meaningful regions.Fig. 3(a) shows images with relatively simple scene, and thus, a smallpartitioning class of k = 3 is chosen. The test sets in Figs. 3(b) and 4include more complicated color natural scenes, and thus, a larger valueof k is used.
Finally, we consider the computational cost of the proposed methodand compare it with that of the Ncut method. A PC, which is equippedwith a 2.0-GHz Pentium CPU and 512-MB memory, is used. The maincomputational cost of the Ncut method is to compute the eigenvectorsof the source image. In the experiments used in this paper, the Ncutmethod [26] requires 30–50 s to compute the eigenvectors of the grayimage of 240 × 160 pixels. The computation of the proposed methodconsists of two sections. The first section is to segment the original im-age using the MS segmentation algorithm, which takes approximately2 s to process an image. The second section is to partition the region
nodes produced by the MS segmentation algorithm using the Ncutmethod, which depends on the number of the initial region nodes andthe requested final regions. In the experiments performed in this paper,the number of the regions is less than 200, and for C = 3, the numberof the child nodes is less than 600. The computation of partitioningthe regions using the Ncut method takes less than 300 ms. Table IIIcompares the computational cost between the proposed method and theNcut method for the images depicted in Figs. 3 and 4. The significantreduction of the computational cost by using the proposed method isevident.
Moreover, we notice that the MS algorithm is more feasible forparallel operations than the Ncut method because the complicatedeigendecomposition problem in the Ncut method is difficult to be par-allelized. In the proposed method, the main computational cost is theregion segmentation, whereas the computational cost of partitioningthe region nodes using the Ncut method is negligibly small. Thus, theproposed method is more feasible to real-time image processing, suchas content-based image retrieval, particularly when parallel processingis used.
V. CONCLUSION
In this correspondence, we have developed a new algorithm forthe segmentation of color images. The proposed algorithm takes theadvantages of the MS segmentation method and the Ncut groupingmethod, whereas their drawbacks are avoided. The use of the MSmethod permits the formation of segments that preserve discontinuitycharacteristic of an image. On the other hand, the application of theregion adjacent graph and Ncut methods to the resulting segments,rather than directly to the image pixels, yields superior image segmen-tation performance. The proposed method requires significantly lowercomputational complexity and, therefore, is feasible to real-time imageprocessing.
ACKNOWLEDGMENT
The authors would like to thank the anonymous reviewers for theirvaluable comments.
REFERENCES
[1] N. Pal and S. Pal, “A review on image segmentation techniques,” PatternRecognit., vol. 26, no. 9, pp. 1277–1294, Sep. 1993.
[2] G. Wyszecki and W. S. Stiles, Color Science: Concepts and Methods,Quantitative Data and Formulae, 2nd ed. New York: Wiley, 1982.
[3] G. Kanizsa, Grammatica del Vedere. Bologna, Italy, 1980.[4] D. Comaniciu and P. Meer, “Mean shift: A robust approach toward feature
space analysis,” IEEE Trans. Pattern Anal. Mach. Intell., vol. 24, no. 5,pp. 603–619, May 2002.
[5] B. Caselles, B. Coll, and J.-M. Miorel, “A Kanisza programme,” Progr.Nonlinear Differential Equations Appl., vol. 25, pp. 35–55, 1996.
[6] R. van den Boomgaard and J. van de Weijer, “On the equivalenceof local-mode finding, robust estimation and mean-shift analysis asused in early vision tasks,” in Proc. Int Conf. Pattern Recog., 2002,pp. 30 927–30 930.
[7] R. O. Duda, P. E. Hart, and D. G. Sork, Pattern Classification. New York:Wiley-Interscience, 2000.
[8] S. Wang and J. M. Siskind, “Image segmentation with ratio cut,” IEEETrans. Pattern Anal. Mach. Intell., vol. 25, no. 6, pp. 675–690, Jun. 2003.
[9] Y. Cheng, “Mean shift, mode seeking, and clustering,” IEEE Trans. Pat-tern Anal. Mach. Intell., vol. 17, no. 8, pp. 790–799, Aug. 1995.
[10] D. Comaniciu, “An algorithm for data-driven bandwidth selection,” IEEETrans. Pattern Anal. Mach. Intell., vol. 25, no. 2, pp. 281–288, Feb. 2003.
[11] V. Grau, A. U. J. Mewes, M. Alcaniz, R. Kikinis, and S. K. Warfield,“Improved watershed transform for medical image segmentation usingprior information,” IEEE Trans. Image Process., vol. 23, no. 4, pp. 447–458, Apr. 2004.
[12] D. W. Jacobs, D. Weinshall, and Y. Gdalyahu, “Classification with non-metric distances: Image retrieval and class representation,” IEEE Trans.Pattern Anal. Mach. Intell., vol. 22, no. 6, pp. 583–600, Jun. 2000.

IEEE TRANSACTIONS ON SYSTEMS, MAN, AND CYBERNETICS—PART B: CYBERNETICS, VOL. 37, NO. 5, OCTOBER 2007 1389
[13] A. K. Jain and D. Zongker, “Representation and recognition of handwrit-ten digits using deformable templates,” IEEE Trans. Pattern Anal. Mach.Intell., vol. 19, no. 12, pp. 1386–1391, Dec. 1997.
[14] S. X. Yu and J. Shi, “Multiclass spectral clustering,” in Proc. Int. Conf.Comput. Vis., 2003, pp. 313–319.
[15] S. Sarkar and P. Soundararajan, “Supervised learning of large percep-tual organization: Graph spectral partitioning and learning automata,”IEEE Trans. Pattern Anal. Mach. Intell., vol. 22, no. 5, pp. 504–525,May 2000.
[16] J. Costeira and T. Kanade, “A multibody factorization method for motionanalysis,” in Proc. Int. Conf. Comput. Vis., 1995, pp. 1071–1076.
[17] C.-W. Ngo, Y.-F. Ma, and H.-J. Zhang, “Video summarization and scenedetection by graph modeling,” IEEE Trans. Circuits Syst. Video Technol.,vol. 15, no. 2, pp. 296–305, Feb. 2005.
[18] Y. Chen, J. Z. Wang, and R. Krovetz, “CLUE: Cluster-based retrieval ofimages by unsupervised learning,” IEEE Trans. Image Process., vol. 14,no. 8, pp. 1187–1201, Aug. 2005.
[19] L. Vincent and P. Soille, “Watersheds in digital spaces: An efficient algo-rithm based on immersion simulation,” IEEE Trans. Pattern Anal. Mach.Intell., vol. 13, no. 6, pp. 583–597, Jun. 1991.
[20] S. Makrogiannis, G. Economou, and S. Fotopoulos, “A region dissim-ilarity relation that combines feature-space and spatial information forcolor image segmentation,” IEEE Trans. Syst., Man, Cybern. B, Cybern.,vol. 35, no. 1, pp. 44–53, Feb. 2005.
[21] M. Wertheimer, “Laws of organization in perceptual forms (partial trans-lation),” in Sourcebook of Gestalt Psychology, W. B. Ellis, Ed. Orlando,FL: Harcourt Brace Jovanovich, 1938, pp. 71–88.
[22] Z.-Y. Wu and R. Leahy, “An optimal graph theoretic approach to data clus-tering: Theory and its application to image segmentation,” IEEE Trans.Pattern Anal. Mach. Intell., vol. 15, no. 11, pp. 1101–1113, Nov. 1993.
[23] J. Shi and J. Malik, “Normalized cuts and image segmentation,” IEEETrans. Pattern Anal. Mach. Intell., vol. 22, no. 8, pp. 888–905, Aug. 2000.
[24] H. D. Cheng, X. H. Jiang, Y. Sun, and J. Wang, “Color image seg-mentation: Advances and prospects,” Pattern Recognit., vol. 34, no. 12,pp. 2259–2281, Dec. 2001.
[25] O. J. Morris, J. Lee, and A. G. Constantinides, “Graph theory for imageanalysis: An approach based on the shortest spanning tree,” Proc. Inst.Electr. Eng., F, vol. 133, no. 2, pp. 146–152, 1986.
[26] T. Cour, S. Yu, and J. Shi, Normalized cuts Matlab code [Online]. Avail-able: http://www.cis.upenn.edu/~jshi/software
[27] Y. Weiss, “Segmentation using eigenvectors: A unifying view,” in Proc.Int. Conf. Comput. Vis., 1999, pp. 957–982.
[28] K. Haris, S. N. Efstratiadis, N. Maglaveras, and A. K. Katsaggelos, “Hy-brid image segmentation using watersheds and fast region merging,” IEEETrans. Image Process., vol. 7, no. 12, pp. 1684–1699, Dec. 1998.
[29] S. C. Zhu and A. Yuille, “Region competition: Unifying snakes, regiongrowing, and Bayes/MDL for multi-band image segmentation,” IEEETrans. Pattern Anal. Mach. Intell., vol. 18, no. 9, pp. 884–900, Sep. 1996.
[30] B. Sumengen and B. S. Manjunath, “Graph partitioning active contours(GPAC) for image segmentation,” IEEE Trans. Pattern Anal. Mach. In-tell., vol. 28, no. 4, pp. 509–521, Apr. 2006.
[31] I. H. Jermyn and H. Ishikawa, “Globally optimal regions and bound-aries as minimum ratio cycles,” IEEE Trans. Pattern Anal. Mach. Intell.,vol. 23, no. 10, pp. 1075–1088, Oct. 2001.