Color Code: Red Indicators: April 2018 Industry ... · and management meetings. This efficiency...
47
© 2017 Nuclear Energy Institute The Nuclear Energy Institute is the nuclear energy industry’s policy organization. This bulletin and additional information about nuclear energy are available at nei.org. 1201 F Street, NW Washington, DC 20004 NEI.org Color Code: Red Indicators: April 2018 Software: March 2019 Dec. 18, 2017 Efficiency Bulletin: 17-24 Industry Standardized Performance Indicators Implement common industry standardized performance indicators that provide an accurate, comprehensive perspective of industry performance. Also, streamline and reduce the number of indicators. Addressees: Chief Nuclear Officers, NEI APCs and INPO APCs Issue: OA 2.B.1, Establish a common set of standardized performance indicators to monitor and compare performance across the industry and support oversight and management meetings. This efficiency bulletin (EB) is a companion to EB 17-17 that establishes the performance indicator central database. Summary of Efficiency Opportunity Desired end-state—A hierarchy of industrywide performance indicators is established that collectively provides an accurate and comprehensive perspective of industry performance. The set includes higher tiered indicators controlled by the U.S. NRC, INPO, and WANO to measure overall station performance; middle tiered indicators used by utility and INPO employees for monitoring functional area performance; and lower tiered indicators that address unique station or fleet performance monitoring needs. An industry procedure will be put in place to control the standardized performance indicators. The indicator data will be maintained and managed in a central data management system when it becomes available. Value proposition—Establishing an optimum set of common performance indicators will enable consistencies in measuring and comparing industry performance, decrease the number of performance indicators, and reduce the administrative burden and costs associated with maintaining indicators. Implementing a common process, including an industry oversight panel, will provide effective governance and oversight for these performance indicators. Why it is important?—A common set of indicators ensures effective monitoring of performance and provides a solid foundation to compare performance across the industry.
Transcript of Color Code: Red Indicators: April 2018 Industry ... · and management meetings. This efficiency...

© 2017 Nuclear Energy Institute
The Nuclear Energy Institute is the nuclear energy industry’s policy organization. This bulletin and additional information about nuclear energy are available at nei.org. 1201 F Street, NW Washington, DC 20004 NEI.org
Color Code: Red Indicators: April 2018 Software: March 2019
Dec. 18, 2017 Efficiency Bulletin: 17-24
Industry Standardized Performance Indicators Implement common industry standardized performance indicators that provide an accurate, comprehensive perspective of industry performance. Also, streamline and reduce the number of indicators. Addressees: Chief Nuclear Officers, NEI APCs and INPO APCs Issue: OA 2.B.1, Establish a common set of standardized
performance indicators to monitor and compare performance across the industry and support oversight and management meetings.
This efficiency bulletin (EB) is a companion to EB 17-17 that establishes the performance indicator central database.
Summary of Efficiency Opportunity
Desired end-state—A hierarchy of industrywide performance indicators is established that collectively provides an accurate and comprehensive perspective of industry performance. The set includes higher tiered indicators controlled by the U.S. NRC, INPO, and WANO to measure overall station performance; middle tiered indicators used by utility and INPO employees for monitoring functional area performance; and lower tiered indicators that address unique station or fleet performance monitoring needs. An industry procedure will be put in place to control the standardized performance indicators. The indicator data will be maintained and managed in a central data management system when it becomes available.
Value proposition—Establishing an optimum set of common performance indicators will enable consistencies in measuring and comparing industry performance, decrease the number of performance indicators, and reduce the administrative burden and costs associated with maintaining indicators. Implementing a common process, including an industry oversight panel, will provide effective governance and oversight for these performance indicators.
Why it is important?—A common set of indicators ensures effective monitoring of performance and provides a solid foundation to compare performance across the industry.

2 © 2017 Nuclear Energy Institute
Measures of effectiveness:
o There are no unidentified or untimely recognition of performance declines in station performance resulting from the implementation and use of the new indicators.
o Reduction in the required resources assigned to data input and performance indicator reviews.
Background Performance indicators are used extensively in the industry to monitor the safe and reliable operation of nuclear
power plants. Over the past several decades, the number of industry indicators has grown substantially to the point where some indicators provide duplicative information or are no longer important or necessary for monitoring activities. This bulletin streamlines and reduces the number of existing indicators. Additionally, it establishes an indicator hierarchy and the processes for governing future indicator development, modification, and deletion.
There are four levels of indicators–Level A through Level D. Refer to Attachment 1, “Indicator Level Definitions,” for further details.
o Level A are controlled by the U.S. NRC, INPO, and WANO. Examples include the NRC Reactor Oversight Process performance indicators, the INPO Index, and the WANO Chemistry Performance Indicator.
o Level B represents the industry’s selection of standardized performance indicators that provide a comprehensive perspective of station performance in key functional areas (see Attachment 2, “Indicator Development Contact Matrix”). These indicators are listed in Attachment 4, “Industry Standardized Performance Indicators.”
o Level C are controlled by INPO to support ongoing oversight programs, such as continuous monitoring of station and industry performance in order to quickly identify and arrest plant declines. It is recognized that efforts by INPO and the industry to reduce Level C indicators will be undertaken after this bulletin is issued.
o Level D are unique and discretionary indicators developed by a utility—for a utility—and are not shared across the industry. These indicators provide flexibility to use the central data management system when it becomes available rather than maintaining desired indicators in utility databases. Piloted indicators are also considered Level D. The number of Level D indicators should be limited to minimize the burden of customized indicators.
Controlling procedure NISP-PI-01, “Control of Standardized Performance Indicators,” addresses the hierarchy of indicators and provides the administrative controls for Level B and D indicators. Level A and Level C indicators are not controlled by this governing document.
All indicators will eventually reside in a central data management system that will become operational in March 2019 as described by Efficiency Bulletin 17-17, “Standard Indicator: Central Database.” Bridging strategy options in Attachment 3 were developed to maintain industry alignment with Level B indicators while providing flexibility for the industry to efficiently manage the administrative workload associated with performance indicators.
Relevant Standards INPO 12-013, “Performance Objective and Criteria,” Monitoring - criteria 8 through 14 INPO “Portfolio of Indicators Summary” World Association of Nuclear Operators (WANO) MN 2014-2, “WANO Performance Indicator Programme
Reference Manual” INPO 04-004, “CDE Data Element Manual”
Key to Color Codes: Red: NSIAC initiative – full participation required for viability Blue: Action expected at all sites, but is not needed for broad industry viability Green: Utility discretion to implement, consistent with its business environment

3 © 2017 Nuclear Energy Institute
Relevant Regulatory Requirements NRC Regulatory Issue Summary 2000-08, Revision 1, “Voluntary Submission of Performance Indicator Data” NEI 99-02, “Regulatory Assessment Performance Indicator Guideline” Guidance Efficiency Bulletin 17-17 (OA-2B3), “Standard Indicator: Central Database” NISP-PI-01, “Control of Standardized Performance Indicators” Recommended Industry Actions Adopt the Level B Standardized Performance Indicators (Attachment 4) as the industry’s primary set of metrics
for monitoring plant performance. Minimize or eliminate the use of additional indicators where possible. Transition to the central data management system when it becomes available.
Change Management Considerations Industry Activities Conduct regional webcasts to provide an overview of this efficiency bulletin, “Industry Standardized
Performance Indicators,” and the related nuclear industry process NISP-PI-01, “Control of Standardized Performance Indicators.”
Conduct oversight of the Standardized Performance Indicators in accordance with the industry procedure NISP-PI-01, “Control of Standardized Performance Indicators.” This procedure will be periodically updated to reflect operating experience.
Company Actions Utilize the applicable change management process to ensure integration of the Standardized Performance
Indicators into applicable procedures, processes and meeting forums, as appropriate. Select the bridging strategy (Attachment 3) appropriate for your company until the central data management system is available for use.
Managers and supervisors monitor for unrecognized or untimely identification of performance declines associated with the implementation of this efficiency bulletin.
Managers and supervisors should closely monitor the transition points in this efficiency bulletin where errors could be introduced (i.e., changing from existing indicators to those established by this efficiency bulletin and transitioning to the central data management system).
INPO Actions Initiate review and disposition of remaining Level C performance indicators upon approval and implementation
of the new Level B performance indicators.
Guiderails Assess effectiveness of new indicators in management meetings when performance indicators are reviewed. If
not effective, contact utility DNP Coordinator to share concern with the industry and notify the Standardized Performance Indicator Panel.
Managers and supervisors monitor for unrecognized or untimely identification of performance declines associated with the implementation of this efficiency bulletin. Utilities should immediately report problems in the timely recognition of performance declines to utility DNP Coordinators and the Standardized Performance Indicator Panel.
Utility oversight and performance improvement personnel should focus on behaviors and human performance during implementation of bridging strategies identified in Attachment 3 as the bridging period poses increased vulnerability to data review input errors.

4 © 2017 Nuclear Energy Institute
INPO performs continuous monitoring of station and industry performance in order to quickly identify and arrest plant declines that may not have been detected by the indicators established in this efficiency bulletin.
Report Your Site’s Results Please report your company’s implementation of this improvement opportunity, including the date of completion. Send this information along with your company point of contact to [email protected]. Industry Contacts Industry Champion for this Issue: Darin Benyak, (724) 650-7320, [email protected] INPO Contact: Gary Waldrep, (770) 644-8626, [email protected] NEI Contact: Chris Earls, (202) 739-8078, [email protected] On the web: http://www.nei.org/bulletin1724 Industry Approval: Mano K. Nazar, CNO Lead
David P. Igyarto, Institute of Nuclear Power Operations
John W. Pitesa, Nuclear Energy Institute

5 © 2017 Nuclear Energy Institute
Attachment 1 Indicator Level Definitions Attachment 2 Indicator Development Contact Matrix Attachment 3 Bridging Strategy Attachment 4 Industry Standardized Performance Indicators

6 © 2017 Nuclear Energy Institute
Attachment 1, Indicator Level Definitions
1. Level A Performance Indicator – An indicator that is not within the control and scope of this document. Level A Performance Indicators and their respective inputs are defined by and governed by:
a. U.S. NRC Regulatory Oversight Process (ROP) controlled by NEI 99-02, “Regulatory Assessment Performance Indicator Guideline”
b. Institute of Nuclear Power Operations (INPO) governed by INPO’s “Portfolio of Indicators Summary.” This includes the set of Industry Indexes that INPO maintains for select industry working groups.
c. World Association of Nuclear Operators (WANO) governed by MN 2014-2, “WANO Performance Indicator Programme Reference Manual”
2. Level B Performance Indicator – An indicator that is within the control and scope of this document. Level B Performance Indicators are selected and developed by Corporate Functional Area Managers (CFAMs), Peer Groups, and others to provide an accurate and comprehensive perspective of performance. Inputs to Level B indicators are included in the Level B classification. The Standardized Performance Indicator Panel approves additions, modification, and deletions of Level B indicators.
3. Level C Performance Indicator – An indicator that does not meet the criteria for Level A, B, or D indicator, and is not within the control and scope of this document. These indicators are controlled by INPO to support ongoing oversight programs, such as continuous monitoring of station performance that is intended to quickly identify and arrest plant declines. Level C Performance Indicators are maintained in accordance with the Consolidated Data Entry (CDE), Data Element Manual (INPO 04-004), and INPO Consolidated Event System (ICES) Reporting Requirements and Standards (INPO 12-009) requirements.
4. Level D Performance Indicator – An indicator within the control and scope of this document that each company may enter into the performance indicator system on an individual basis. Level D Performance Indicators are controlled by each company to monitor sensitive or site-specific performance indicators such as economic or company-specific indicators. The data and output reports are available only to the company that entered the data and is not available for comparison across the industry. Indicators that are being piloted are also considered Level D Performance Indicators. The number of Level D Performance Indicators should be limited to minimize the burden of customized indicators.

7 © 2017 Nuclear Energy Institute
Attachment 2, Indicator Development Contact Matrix
Functional Area Industry Lead Industry Group INPO
Representative DNP
Representative Operations Scott Plymale/
FENOC Ops CFAM group Tom Tynan Charles Morris/
Duke Maintenance Mitch Taggart/
TVA Tony Mueller/ FENOC
Maintenance CFAM group Work
Greg Ruppert Darin Benyak/ FENOC
Work Management Mitch Taggart/ TVA Tony Mueller/ FENOC
Management CFAM group
Greg Ruppert Darin Benyak/ FENOC
Radiation Protection Roy Miller/ PSEG
Radiation Protection CFAMs
Paul McNulty Pete Tocci/PSEG
Chemistry Joe Chamy/ PSEG
Chemistry CFAMs Ron Chrzanowski Pete Tocci/PSEG
Equipment Reliability Scott Midgett/ NextEra
Equipment Reliability Working Group, Equipment Reliability Index Subcommittee
Jeff Bramblett Pam Metz/ NextEra
Engineering Scott Midgett/ NextEra
Engineering CFAMs group
Terry Schuster Pam Metz/ NextEra
Training Marios Kafantaris/ formerly PSEG
Training Directors group
George Manaskie Adam Alberty/ STARS
Regulatory Justin Wheat/ Southern
Regulatory Issues Task Force
N/A Tim Steele/ Southern
Human Performance Brandon Marlow, Southern
Human Performance Working Group
Amanda Donges Tim Steele/ Southern
Safety Darin Benyak/ FENOC
NISHA Paul McNulty Darin Benyak/ FENOC
Performance Improvement Kevin Rackley/ TVA
Corrective Action Program Owner’s Group (CAPOG)
Amanda Donges Tim Steele/ Southern
Emergency Preparedness Aldo Capristo/ South Texas Project
NEI Emergency Preparedness Working Group
Dane Williams Darin Benyak/ FENOC

8 © 2017 Nuclear Energy Institute
Attachment 3, Bridging Strategy Purpose: To provide options that can be used by the industry to manage Level B Standardized Performance
Indicators until a central data management system is available to maintain the indicators. To describe the actions that will be necessary to transition to the central data management system
during the implementation of this new system. Background: This Efficiency Bulletin and NISP-PI-01, “Control of Standardized Performance Indicators,” define a
hierarchy of performance indicators (i.e., Level A, B, C, and D) that reflect a common, standardized set of performance indicators, indicators maintained by INPO, and indicators deemed necessary by individual stations or fleets, as needed. A central data management system to contain these performance indicators is being developed in accordance with Efficiency Bulletin 17-17; however, there is a gap of approximately one year between implementation of the Level B Standardized Performance Indicators and the availability of the central data management system.
During this interim period, each company must choose how to efficiently and effectively maintain
Level B Standardized Performance Indicators. This attachment provides several options to handle this issue. Utilities may implement one of these options or choose another means to maintain the Level B Standardized Performance Indicators.
Option 1 Incorporate the Level B Standardized Performance Indicators into the Existing
Performance Indicator System
Summary Perform a gap assessment of existing performance indicators against the Level B Standardized Performance Indicators and identify those Level B indicators that are not already captured and add these to the existing performance indicator system. Details 1. Obtain the list of existing performance indicators at your company. 2. Obtain the list of Level B Standardized Performance Indicators. 3. Compare the lists to identify any Level B Standardized Performance Indicators that are not
already included in the company list. 4. Enter each Level B Standardized Performance Indicator not already captured into the existing
performance indicator system. 5. Assess the remaining list of existing performance indicators and eliminate as many as possible to
leverage the benefit of the Level B Standardized Performance Indicators. 6. Modify existing performance indicator reports to include the Level B Standardized Performance
Indicators and remove any existing performance indicators that will be discontinued.
Advantages Leverages existing performance indicator system and reporting tools. Minimal change management once Level B Standardized Performance Indicators are
incorporated. Supports future data migration to the central data management system.
Disadvantages Resources required to create new indicators and modify existing reports.

9 © 2017 Nuclear Energy Institute
Option 2 Maintain the Level B Standardized Performance Indicators in a Separate Database or
Spreadsheet
Summary Perform a gap assessment of existing performance indicators against the Level B Standardized Performance Indicators and identify those Level B indicators that are not already captured. Create a spreadsheet or database to maintain the Level B indicators that are not already captured. Details 1. Obtain the list of existing performance indicators at your company. 2. Obtain the list of Level B Standardized Performance Indicators. 3. Compare the lists to identify any Level B Standardized Performance Indicators that are not
already captured. 4. Enter each Level B Standardized Performance Indicator into a spreadsheet or database. 5. Develop a report from the spreadsheet or database that contains the Level B Standardized
Performance Indicators not already captured in the existing performance indicator system.
Advantages Avoids modifications to the existing performance indicator system which may be costly or tie
consuming.
Disadvantages Resources required to create a spreadsheet or database. Performance indicator reports will be from two different systems and may require additional
administrative burden (e.g., copying, manipulating electronic files).

10 © 2017 Nuclear Energy Institute
Attachment 4, Industry Standardized Performance Indicators Selected Standardized Indicators Below are the performance indicators selected to provide an accurate and comprehensive perspective of plant performance.
Operations Indicator name Level Description Reactivity Management
A The number of events that challenge reactivity management using tiered significance levels that are defined in the applicable owner's group documents.
Clearance and Tagging
B The number of events that challenge worker protection using tiered severity levels to classify events and near misses based on the number of barriers remaining.
Component Mispositioning
B An index that reflects the frequency and significance of mispositioning events at a station.
Unplanned Shutdown LCOs
A All unplanned entries into a technical specification (TS) limiting condition for operation (LCO) or an Administrative Technical Requirements (ATR), Technical Requirements Manual (TRM), or Offsite Dose Calculation Manual (ODCM) action requirement when the required action includes a power reduction or mode change if the issue is not corrected within 72 hours.
Control Room Deficiencies
B The number of equipment deficiencies that degrade the performance of an indication, switch, or controller in the Control Room.
Operator Workarounds
A The number of equipment deficiencies that may require operators to take some form of compensatory action during plant transients.
Operator Burdens B The number of deficiencies that place an unreasonable burden on operators or require significant compensatory actions that challenge operators.
Maintenance Indicator name Level Description On-Line Corrective Critical (CC) Maintenance
B The number of On-Line Corrective Critical items in the maintenance backlog for which the field work and testing are not complete.
On-Line Corrective Non-Critical (CN) Maintenance
B The number of On-Line Corrective Non-Critical items in the maintenance backlog for which the field work and testing are not complete.
On-Line Deficient Critical (DC) Maintenance
A The number of On-Line Deficient Critical items in the maintenance backlog for which the field work and testing are not complete.
On-Line Deficient Non-Critical (DN) Maintenance
B The number of On-Line Deficient Non-Critical items in the maintenance backlog for which the field work and testing are not complete.
Rework A The average of monthly weighted rework issues classified by Event Level for the period normalized by the number of units at the station, for station and supplemental personnel (ICES).
FIN Effectiveness B The percentage of corrective and deficient maintenance completed by FIN and the percentage of high priority work completed by completed by FIN.

11 © 2017 Nuclear Energy Institute
Indicator name Level Description Maintenance Efficiency
B The percentage of work complete as Minor Maintenance.
Maintenance Consequential Errors
A The sum of all significant and noteworthy-consequential events in the INPO Consolidated Event System (ICES) caused by utility or contractor maintenance personnel for a 12-month rolling period.
Work Management Indicator name Level Description On line Critical Scope Survival (Work Order Level)
A The percentage of critical work orders identified for inclusion in the workweek at scope freeze and completed by end of execution week. Critical work orders include all orders performed on a critical component.
On-Line Critical PMs Open in Second Half of Grace
A The number of On-Line Critical preventive maintenance (PM) tasks that are open in the second half of grace.
On-Line Critical PMs Deferred
B The number of On-Line Critical preventive maintenance (PM) tasks for which a deferral has been approved.
On-Line Late PMs B The number of On-Line Critical and Non-Critical preventive maintenance (PM) tasks that exceeded their late date.
On-Line Schedule Completion
B The percentage of the work items scheduled at the beginning of execution week that were completed.
LCO Execution B The percentage of the actual LCO duration used compared to the scheduled duration.
Outage Outage Corrective Critical (OCC) Maintenance
B The number of corrective maintenance items on critical components that cannot be performed with the main generator connected to the grid.
Outage Deficient Critical (ODC) Maintenance
B The number of deficient maintenance items on critical components that cannot be performed with the main generator connected to the grid.
Outage Critical PMs Deferred
B The number of Outage Critical preventive maintenance (PM) tasks for which a deferral has been approved.
Outage Late PMs B The number of Outage Critical and Non-Critical preventive maintenance (PM) tasks that exceeded their late date.
Percent Refueling Outage Scope Completions
B The number of refueling outage parent work orders that were in scope at the outage start (breakers open) and were completed, divided by the number of refueling outage parent work orders that were in scope at the outage start (breakers open).
Loss of Shutdown Cooling
B The number of events reported in the INPO Consolidated Event System (ICES) where the capability to remove decay heat using installed equipment is lost.
Radiation Protection Indicator name Level Description Radiation Protection Index
A An index that uses a composite of several indicators in the areas of collective radiation exposure, dose control, and radioactive material control.

12 © 2017 Nuclear Energy Institute
Chemistry
Indicator name Level Description Chemistry Effectiveness Indicator - R
A Encompasses chemistry control issues that have led to plant equipment corrosion issues and have affected equipment reliability or resulted in station shutdowns. The Chemistry Effectiveness Indicator includes four separate conditions: soluble impurity excursions, metal transport, reactor coolant corrosion parameters, and chronic contaminants.
Engineering Indicator name Level Description
Design/Config Mgt Temporary Modifications
B Measures the total number of installed Temporary Modifications and those open greater than one refueling cycle to gauge adherence to effective configuration control practices.
Reactor Engineering Sustained Fuel Reliability PII
A A measure of the total number of INPO Performance Indicator Index points due to not having any Fuel Failures during a Two Fuel Cycle period and not having an active Fuel Failures.
Plant Engineering Unit Capability Factor A The ratio of the energy generation produced over a given time
period to the reference energy generation (potential energy generation) over the same time, expressed as a percentage.
Emergency AC Power Unavailability
A The ratio of the hours the train/system was unavailable to perform its intended function due to planned, unplanned and fault exposure unavailability, resulting from train failure when the system is required to be available for service.
Engineered Safety Feature (ESF) Actuation
B The number of engineered safety feature actuations as reported to the NRC through event notifications.
Heat Removal Unavailability
A The ratio of the hours the train/system was unavailable to perform its intended function due to planned, unplanned and fault exposure unavailability, resulting from train failure when the system is required to be available for service.
High Pressure Injection Unavailability
A The ratio of the hours the train/system was unavailable to perform its intended function due to planned, unplanned and fault exposure unavailability, resulting from train failure when the system is required to be available for service.
Operational Loss Events
A The number of events (transients) that require prompt operator response and result in a forced downpower > 20%, forced shutdowns (excluding scrams), or full loss of off-site power while shutdown that have occurred
Safety System Functional Failures (NRC)
A The number of events or conditions that prevented, or could have prevented, the fulfillment of the safety function of structures or systems that are needed to shut down the reactor and maintain it in a safe shutdown condition; remove residual heat; control the release of radioactive material; or mitigate the consequences of an accident.
Equipment Reliability Equipment Reliability Index
A An indicator that uses a composite of several indicators to measure the longer-term trend of improvements and adherence

13 © 2017 Nuclear Energy Institute
Indicator name Level Description to the principle areas of AP-913 for sustainability over the long term. In addition, key leading indicators are used for projecting degradation in plant operations or reliability of key station equipment.
On-Line Reliability Loss Factor
A The ratio of all energy generation losses to the reference energy generation both corrected for refueling outage and exempt activity losses during the same period, expressed as a percentage.
Consequential Equipment Failures
A The number of consequential equipment failures, regardless of component classification, that results in power reductions, unplanned entry into a technical specification shutdown limiting condition for operation (LCO) less than or equal to 72 hours, failure to meet or control a critical safety function, unplanned initiation of engineered safeguards features, or an MSPI monitored component failure. Defined in INPO 12-009.
Training
Indicator name Level Description Simulator Index B A composite index to indicate overall simulator health based on
simulator reliability, maintenance health, and testing status in accordance with regulatory documents. Reported quarterly.
Accreditation Health B This indicator is uses a series of questions tied to the accreditation criteria that will assess a program’s compliance with the accreditation objectives.
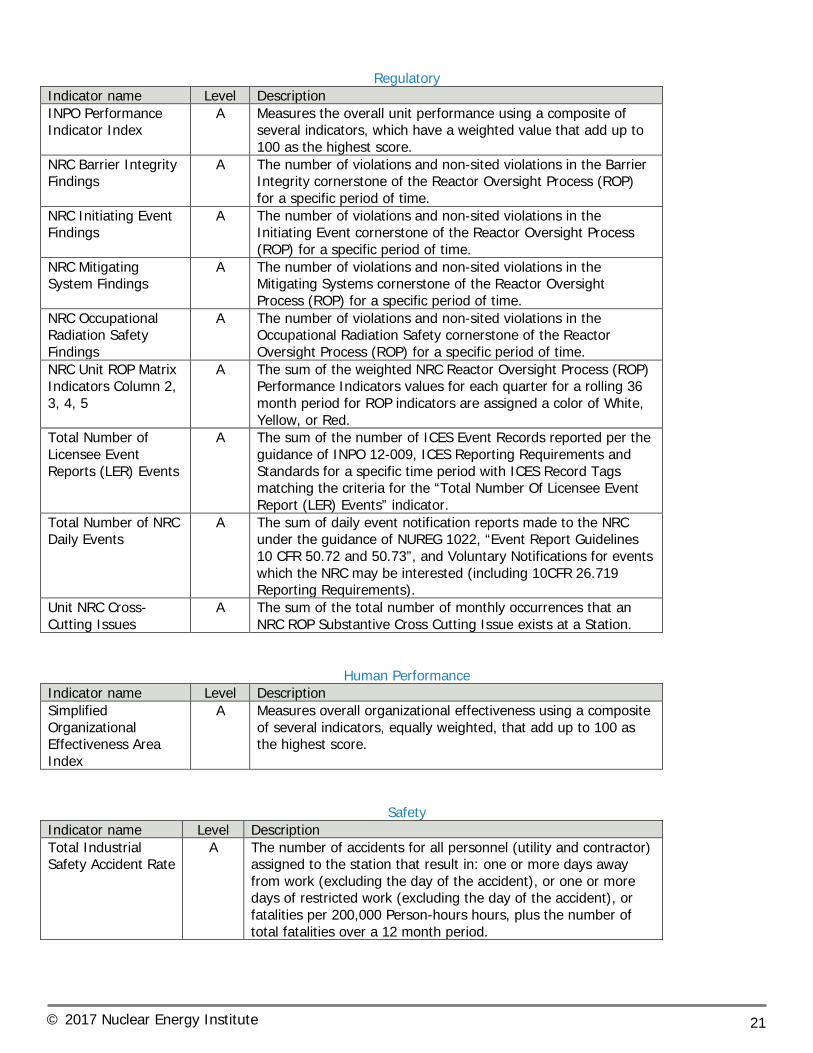
Regulatory Indicator name Level Description INPO Performance Indicator Index
A Measures the overall unit performance using a composite of several indicators, which have a weighted value that add up to 100 as the highest score.
Human Performance Indicator name Level Description Site Clock Resets B The number of site clock resets. Human Performance Event Rate
B The number of Human Performance events divided total person-hours worked (including supplemental workers) for a period of time.
Safety Indicator name Level Description Total Industrial Safety Accident Rate
A The number of accidents for all personnel (utility and contractor) assigned to the station that result in: one or more days away from work (excluding the day of the accident), or one or more days of restricted work (excluding the day of the accident), or fatalities per 200,000 Person-hours hours, plus the number of total fatalities over a 12 month period.

14 © 2017 Nuclear Energy Institute
Emergency Preparedness
Indicator name Level Description Drill/Exercise Performance (NRC)
A The percentage of all drill, exercise, and actual opportunities that were performed timely and accurately during the previous eight quarters.
Emergency Response Organization (ERO) Drill Participation (NRC)
A The percentage of key ERO members that have participated in a drill, exercise, or actual event during the previous eight quarters, as measured on the last calendar day of the quarter.
Alert and Notification System (ANS) Reliability (NRC)
A The percentage of ANS sirens that are capable of performing their function, as measured by periodic siren testing during the previous 12 months. Periodic tests are the regularly scheduled tests that are conducted to actually test the ability of the sirens to perform their function (e.g., silent, growl, siren sound test).

15 © 2017 Nuclear Energy Institute
Attachment 4 A. Level A Performance Indicators This attachment contains all Level A Performance Indicators listed on INPO’s Portfolio of Indicators contained on the INPO PIC database.
Operations Indicator name Level Description Reactivity Management
A The number of events that challenge reactivity management using tiered significance levels that are defined in the applicable owner's group documents.
BWR Severe Reactivity Management Event – SL 1
A A Reactivity Management Event that results in a severe adverse effect on plant safety or indicates a high potential for future significant events.
BWR Severe Reactivity Management Event – SL 2
A A Reactivity Management Event that places the plant outside of the Design or Licensing Basis or significant events that compromise fuel related limits, or directly result in fuel failure.
BWR Severe Reactivity Management Event – SL 3
A A Reactivity Management Event that represents a violation of process or procedures.
BWR Severe Reactivity Management Event – SL 4
A A Reactivity Management Event that indicates degradation of a barrier to proper Reactivity Management or creates an elevated potential for the occurrence of a Reactivity Management Event.
BWR Severe Reactivity Management Event – SL 5
A A Reactivity Management Event that indicates less than optimal Reactivity Management but is not classified as a SL 1 through SL 4 reactivity event.
PWR Severe Reactivity Management Event – SL 1
A A Reactivity Management Event that results in a severe adverse effect on plant safety or indicates a high potential for future significant events.
PWR Severe Reactivity Management Event – SL 2
A A Reactivity Management Event that places the plant outside of the Design or Licensing Basis or significant events that compromise fuel related limits, or directly result in fuel failure.
PWR Severe Reactivity Management Event – SL 3
A A Reactivity Management Event that represents a violation of process or procedures.
PWR Severe Reactivity Management Event – SL 4
A A Reactivity Management Event that indicates degradation of a barrier to proper Reactivity Management or creates an elevated potential for the occurrence of a Reactivity Management Event.
PWR Severe Reactivity Management Event – SL 5
A A Reactivity Management Event that indicates less than optimal Reactivity Management but is not classified as a SL 1 through SL 4 reactivity event.
Unplanned Shutdown LCOs
A All unplanned entries into a technical specification (TS) limiting condition for operation (LCO) or an Administrative Technical Requirements (ATR), Technical Requirements Manual (TRM), or Offsite Dose Calculation Manual (ODCM) action requirement when the required action includes a power reduction or mode change if the issue is not corrected within 72 hours.
Operator Workarounds
A The number of equipment deficiencies that may require operators to take some form of compensatory action during plant transients.
Simplified Operations Area Index
A Measures the overall performance in the Operations area using a composite of several indicators, which have a weighted value that add up to 100 as the highest score.
Operations Fundamental Events
A A 12-month rolling average that measures the industry trend in events caused or complicated by weaknesses in operator
16 © 2017 Nuclear Energy Institute
fundamentals. Unplanned Scrams (NRC) (WANO)
A The number of unplanned scrams during the previous four quarters, both manual and automatic, while critical per 7,000 hours. The scram rate is calculated per 7,000 critical hours because that value is representative of the critical hours of operation in a year for a typical plant.
Unplanned Power Changes (NRC)
A The number of unplanned changes in reactor power of greater than 20-percent full-power, per 7,000 hours of critical operation, excluding manual and automatic scrams.
Unplanned Scrams with Complications (NRC)
A The number of unplanned scrams while critical, both manual and automatic, during the previous four quarters require additional operator actions as defined by the flowchart in NEI 99-02, "Regulatory Assessment Performance Indicator Guideline."
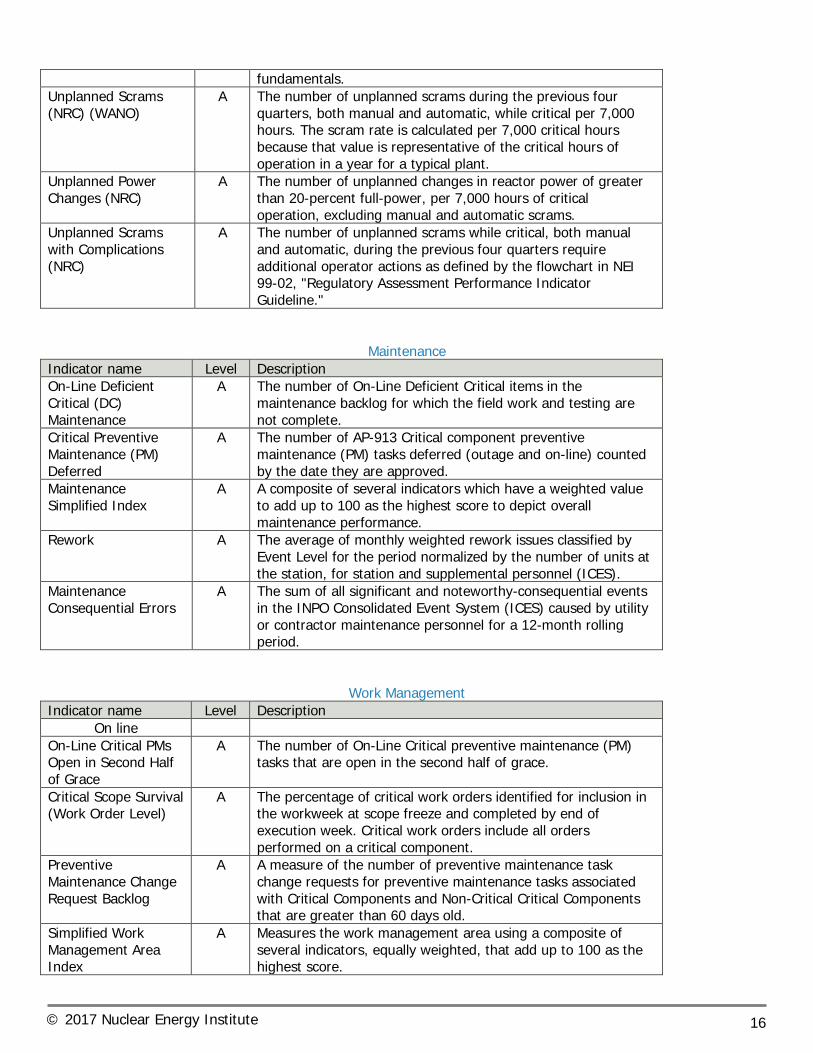
Maintenance Indicator name Level Description On-Line Deficient Critical (DC) Maintenance
A The number of On-Line Deficient Critical items in the maintenance backlog for which the field work and testing are not complete.
Critical Preventive Maintenance (PM) Deferred
A The number of AP-913 Critical component preventive maintenance (PM) tasks deferred (outage and on-line) counted by the date they are approved.
Maintenance Simplified Index
A A composite of several indicators which have a weighted value to add up to 100 as the highest score to depict overall maintenance performance.
Rework A The average of monthly weighted rework issues classified by Event Level for the period normalized by the number of units at the station, for station and supplemental personnel (ICES).
Maintenance Consequential Errors
A The sum of all significant and noteworthy-consequential events in the INPO Consolidated Event System (ICES) caused by utility or contractor maintenance personnel for a 12-month rolling period.
Work Management Indicator name Level Description
On line On-Line Critical PMs Open in Second Half of Grace
A The number of On-Line Critical preventive maintenance (PM) tasks that are open in the second half of grace.
Critical Scope Survival (Work Order Level)
A The percentage of critical work orders identified for inclusion in the workweek at scope freeze and completed by end of execution week. Critical work orders include all orders performed on a critical component.
Preventive Maintenance Change Request Backlog
A A measure of the number of preventive maintenance task change requests for preventive maintenance tasks associated with Critical Components and Non-Critical Critical Components that are greater than 60 days old.
Simplified Work Management Area Index
A Measures the work management area using a composite of several indicators, equally weighted, that add up to 100 as the highest score.

17 © 2017 Nuclear Energy Institute
Indicator name Level Description Outage
None
Radiation Protection Indicator name Level Description Radiation Protection Index
A An index that uses a composite of several indicators in the areas of collective radiation exposure, dose control, and radioactive material control.
Collective Radiation Exposure (WANO)
A The sum of the most recent completed refueling outage exposure (external plus internal) plus the sum of the last 24 months of on-line operating exposure (external plus internal) divided by two to report an annualized value.
Occupational Exposure Control Effectiveness (NRC)
A An indicator that sums the number of Technical specification high radiation area occurrences, very high radiation area occurrences, and unintended exposure occurrences.
Radiological Effluent Technical Specifications/Offsite Dose Calculation Manual (RETSs/ODCM) Radiological Effluent Occurrence (NRC)
A Radiological effluent release occurrences per reactor unit that exceed the values pre-established liquid and gaseous effluent values.
Tech Spec High Radiation Area Occurrences
A The number of occurrences in which radiological controls for a locked high radiation area were compromised.
Very High Radiation Area Controls
A The number of occurrences in which radiological controls for a very high radiation area were compromised.
Unintended Exposure Occurrences
A The number of occurrences of degradation or failure of one or more radiation safety barriers that results in unintended occupational exposure(s).
High Radiation Area Controls
A The number of non-conformances with technical specifications or procedures involving a high radiation area that results in the loss of radiological control over access or work activities within the area.
Total Unplanned Exposure Internal and External
A The number of occurrences of internal unplanned exposure (CEDE) or external unplanned exposure (exceeding electronic dosimeter dose alarm set point) of 10 millirem or greater.
Radioactive Material Control inside the Protected Area
A The number of occurrences of uncontrolled radioactive material found outside of the radiological controlled area but inside the protected area.
Radioactive Material Control outside the Protected Area
A The number of occurrences of uncontrolled radioactive material found outside of the radiological controlled area outside of the protected area.
Chemistry Indicator name Level Description Chemistry Effectiveness Indicator - R
A Encompasses chemistry control issues that have led to plant equipment corrosion issues and have affected equipment reliability or resulted in station shutdowns. The Chemistry

18 © 2017 Nuclear Energy Institute
Indicator name Level Description Effectiveness Indicator includes four separate conditions: soluble impurity excursions, metal transport, reactor coolant corrosion parameters, and chronic contaminants.
Chemistry Effectiveness Indicator-R, Condition 1
A A calculated value associated with excursions of specific elements in the primary and secondary water systems of a Pressurized Water Reactor (PWR) and the reactor coolant system of a Boiling Water Reactor (BWR).
Chemistry Effectiveness Indicator-R, Condition 2
A Monitors the effectiveness of the secondary chemistry corrosion control program by trending corrosion products, e.g., iron and copper, in feedwater.
Chemistry Effectiveness Indicator-R, Condition 3
A Monitors station reactor coolant chemistry controls.
Chemistry Effectiveness Indicator-R, Condition 4
A Monitors chronic contamination control; reactor coolant system chlorides for BWRs, steam generator sodium for PWRs with recirculation steam generators, and feedwater sodium for PWRs with once through steam generators.
Chemistry Performance Indicator (CPI) (WANO)
A Compares the concentration of selected impurities and corrosion products to corresponding limiting values. Each parameter is divided by its limiting value, and the sum of these ratios is normalized to 1.0.
Engineering Indicator name Level Description
Design/Config Mgt None Reactor Engineering
Sustained Fuel Reliability PII
A A measure of the total number of INPO Performance Indicator Index points due to not having any Fuel Failures during a Two Fuel Cycle period and not having an active Fuel Failures.
Fuel Reliability Index (WANO)
A A measure of the fission product activities present in the reactor coolant.
Plant Engineering Unit Capability Factor (WANO)
A The ratio of the energy generation produced over a given time period to the reference energy generation (potential energy generation) over the same time, expressed as a percentage.
Unit Capability Loss Factor (UCLF) (WANO)
A The ratio of the unplanned energy losses during a given period of time, to the reference energy generation, expressed as a percentage.
Grid-Related Loss Factor (WANO)
A The ratio of energy losses due to grid instability or a loss of electrical grid due to causes not under plant management control during a given period of time, to the reference energy generation, during the same period, expressed as a percentage.
Emergency AC Power Unavailability (WANO)
A The ratio of the hours the train/system was unavailable to perform its intended function due to planned, unplanned and fault exposure unavailability, resulting from train failure when the system is required to be available for service.
Emergency AC Power Systems (NRC)
A The sum of the unavailability of the emergency AC power plus the unreliability for the emergency AC power system during the
19 © 2017 Nuclear Energy Institute
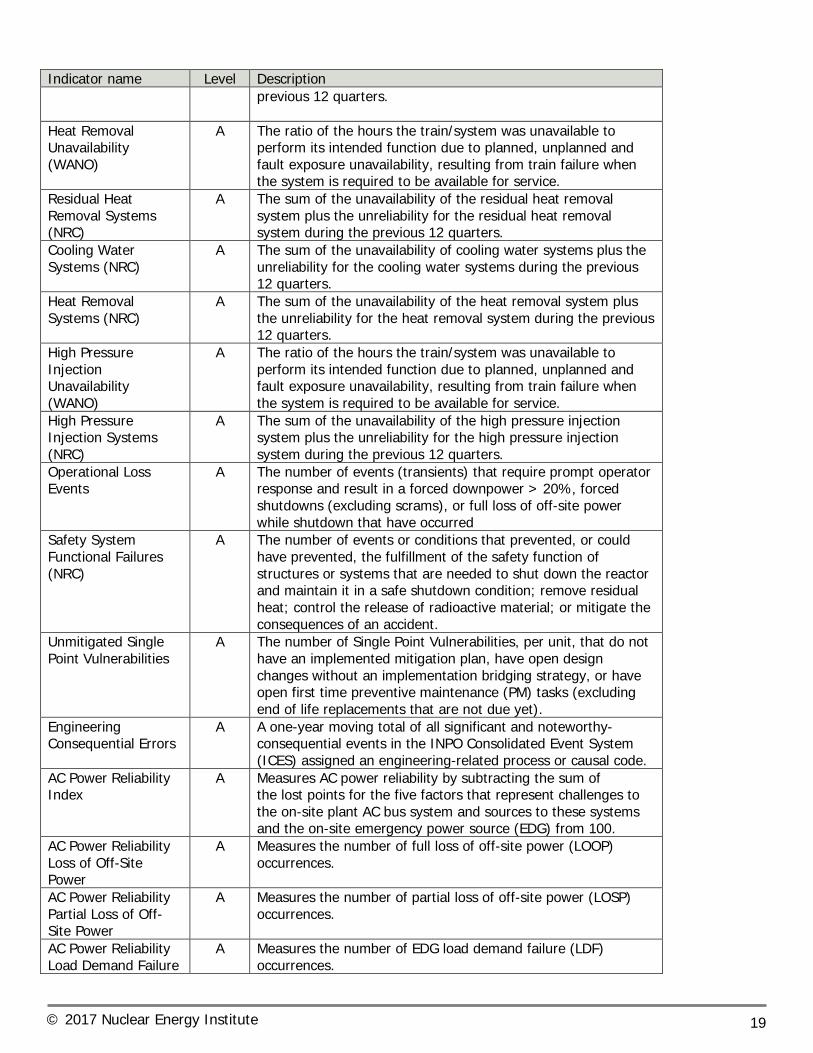
Indicator name Level Description previous 12 quarters.
Heat Removal Unavailability (WANO)
A The ratio of the hours the train/system was unavailable to perform its intended function due to planned, unplanned and fault exposure unavailability, resulting from train failure when the system is required to be available for service.
Residual Heat Removal Systems (NRC)
A The sum of the unavailability of the residual heat removal system plus the unreliability for the residual heat removal system during the previous 12 quarters.
Cooling Water Systems (NRC)
A The sum of the unavailability of cooling water systems plus the unreliability for the cooling water systems during the previous 12 quarters.
Heat Removal Systems (NRC)
A The sum of the unavailability of the heat removal system plus the unreliability for the heat removal system during the previous 12 quarters.
High Pressure Injection Unavailability (WANO)
A The ratio of the hours the train/system was unavailable to perform its intended function due to planned, unplanned and fault exposure unavailability, resulting from train failure when the system is required to be available for service.
High Pressure Injection Systems (NRC)
A The sum of the unavailability of the high pressure injection system plus the unreliability for the high pressure injection system during the previous 12 quarters.
Operational Loss Events
A The number of events (transients) that require prompt operator response and result in a forced downpower > 20%, forced shutdowns (excluding scrams), or full loss of off-site power while shutdown that have occurred
Safety System Functional Failures (NRC)
A The number of events or conditions that prevented, or could have prevented, the fulfillment of the safety function of structures or systems that are needed to shut down the reactor and maintain it in a safe shutdown condition; remove residual heat; control the release of radioactive material; or mitigate the consequences of an accident.
Unmitigated Single Point Vulnerabilities
A The number of Single Point Vulnerabilities, per unit, that do not have an implemented mitigation plan, have open design changes without an implementation bridging strategy, or have open first time preventive maintenance (PM) tasks (excluding end of life replacements that are not due yet).
Engineering Consequential Errors
A A one-year moving total of all significant and noteworthy-consequential events in the INPO Consolidated Event System (ICES) assigned an engineering-related process or causal code.
AC Power Reliability Index
A Measures AC power reliability by subtracting the sum of the lost points for the five factors that represent challenges to the on-site plant AC bus system and sources to these systems and the on-site emergency power source (EDG) from 100.
AC Power Reliability Loss of Off-Site Power
A Measures the number of full loss of off-site power (LOOP) occurrences.
AC Power Reliability Partial Loss of Off-Site Power
A Measures the number of partial loss of off-site power (LOSP) occurrences.
AC Power Reliability Load Demand Failure
A Measures the number of EDG load demand failure (LDF) occurrences.
20 © 2017 Nuclear Energy Institute
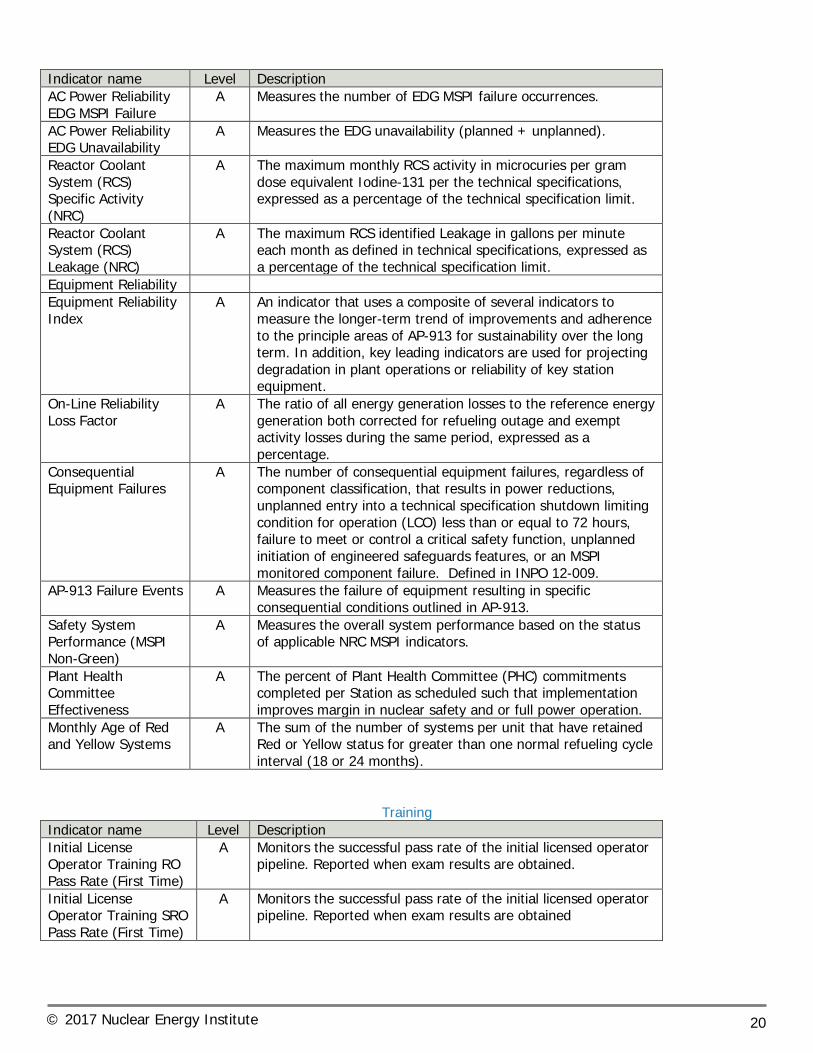
Indicator name Level Description AC Power Reliability EDG MSPI Failure
A Measures the number of EDG MSPI failure occurrences.
AC Power Reliability EDG Unavailability
A Measures the EDG unavailability (planned + unplanned).
Reactor Coolant System (RCS) Specific Activity (NRC)
A The maximum monthly RCS activity in microcuries per gram dose equivalent Iodine-131 per the technical specifications, expressed as a percentage of the technical specification limit.
Reactor Coolant System (RCS) Leakage (NRC)
A The maximum RCS identified Leakage in gallons per minute each month as defined in technical specifications, expressed as a percentage of the technical specification limit.
Equipment Reliability Equipment Reliability Index
A An indicator that uses a composite of several indicators to measure the longer-term trend of improvements and adherence to the principle areas of AP-913 for sustainability over the long term. In addition, key leading indicators are used for projecting degradation in plant operations or reliability of key station equipment.
On-Line Reliability Loss Factor
A The ratio of all energy generation losses to the reference energy generation both corrected for refueling outage and exempt activity losses during the same period, expressed as a percentage.
Consequential Equipment Failures
A The number of consequential equipment failures, regardless of component classification, that results in power reductions, unplanned entry into a technical specification shutdown limiting condition for operation (LCO) less than or equal to 72 hours, failure to meet or control a critical safety function, unplanned initiation of engineered safeguards features, or an MSPI monitored component failure. Defined in INPO 12-009.
AP-913 Failure Events A Measures the failure of equipment resulting in specific consequential conditions outlined in AP-913.
Safety System Performance (MSPI Non-Green)
A Measures the overall system performance based on the status of applicable NRC MSPI indicators.
Plant Health Committee Effectiveness
A The percent of Plant Health Committee (PHC) commitments completed per Station as scheduled such that implementation improves margin in nuclear safety and or full power operation.
Monthly Age of Red and Yellow Systems
A The sum of the number of systems per unit that have retained Red or Yellow status for greater than one normal refueling cycle interval (18 or 24 months).
Training Indicator name Level Description Initial License Operator Training RO Pass Rate (First Time)
A Monitors the successful pass rate of the initial licensed operator pipeline. Reported when exam results are obtained.
Initial License Operator Training SRO Pass Rate (First Time)
A Monitors the successful pass rate of the initial licensed operator pipeline. Reported when exam results are obtained
21 © 2017 Nuclear Energy Institute
Regulatory Indicator name Level Description INPO Performance Indicator Index
A Measures the overall unit performance using a composite of several indicators, which have a weighted value that add up to 100 as the highest score.
NRC Barrier Integrity Findings
A The number of violations and non-sited violations in the Barrier Integrity cornerstone of the Reactor Oversight Process (ROP) for a specific period of time.
NRC Initiating Event Findings
A The number of violations and non-sited violations in the Initiating Event cornerstone of the Reactor Oversight Process (ROP) for a specific period of time.
NRC Mitigating System Findings
A The number of violations and non-sited violations in the Mitigating Systems cornerstone of the Reactor Oversight Process (ROP) for a specific period of time.
NRC Occupational Radiation Safety Findings
A The number of violations and non-sited violations in the Occupational Radiation Safety cornerstone of the Reactor Oversight Process (ROP) for a specific period of time.
NRC Unit ROP Matrix Indicators Column 2, 3, 4, 5
A The sum of the weighted NRC Reactor Oversight Process (ROP) Performance Indicators values for each quarter for a rolling 36 month period for ROP indicators are assigned a color of White, Yellow, or Red.
Total Number of Licensee Event Reports (LER) Events
A The sum of the number of ICES Event Records reported per the guidance of INPO 12-009, ICES Reporting Requirements and Standards for a specific time period with ICES Record Tags matching the criteria for the “Total Number Of Licensee Event Report (LER) Events” indicator.
Total Number of NRC Daily Events
A The sum of daily event notification reports made to the NRC under the guidance of NUREG 1022, “Event Report Guidelines 10 CFR 50.72 and 50.73”, and Voluntary Notifications for events which the NRC may be interested (including 10CFR 26.719 Reporting Requirements).
Unit NRC Cross-Cutting Issues
A The sum of the total number of monthly occurrences that an NRC ROP Substantive Cross Cutting Issue exists at a Station.
Human Performance Indicator name Level Description Simplified Organizational Effectiveness Area Index
A Measures overall organizational effectiveness using a composite of several indicators, equally weighted, that add up to 100 as the highest score.
Safety Indicator name Level Description Total Industrial Safety Accident Rate
A The number of accidents for all personnel (utility and contractor) assigned to the station that result in: one or more days away from work (excluding the day of the accident), or one or more days of restricted work (excluding the day of the accident), or fatalities per 200,000 Person-hours hours, plus the number of total fatalities over a 12 month period.

22 © 2017 Nuclear Energy Institute
Emergency Preparedness Indicator name Level Description Drill/Exercise Performance (NRC)
A The percentage of all drill, exercise, and actual opportunities that were performed timely and accurately during the previous eight quarters.
Emergency Response Organization (ERO) Drill Participation (NRC)
A The percentage of key ERO members that have participated in a drill, exercise, or actual event during the previous eight quarters, as measured on the last calendar day of the quarter.
Alert and Notification System (ANS) Reliability (NRC)
A The percentage of ANS sirens that are capable of performing their function, as measured by periodic siren testing during the previous 12 months. Periodic tests are the regularly scheduled tests that are conducted to actually test the ability of the sirens to perform their function (e.g., silent, growl, siren sound test).
Security
Indicator name Level Description Protected Area (PA) Security Equipment (NRC)
A An index that compares the amount of the time specific security equipment is unavailable, as measured by compensatory hours, to the total hours in the period. A normalization factor is used to take into account site variability in the size and complexity of the systems.

23 © 2017 Nuclear Energy Institute
Attachment 4 B. Level B Performance Indicators This attachment reflects the indicators determined to be Level B Performance Indicators.
Operations Indicator name Level Description Clearance and Tagging
B The number of events that challenge worker protection using tiered severity levels to classify events and near misses based on the number of barriers remaining.
Component Mispositioning
B An index that reflects the frequency and significance of mispositioning events at a station.
Control Room Deficiencies
B The number of equipment deficiencies that degrade the performance of an indication, switch, or controller in the Control Room.
Operator Burdens B The number of deficiencies that place an unreasonable burden on operators or require significant compensatory actions that challenge operators.
Maintenance Indicator name Level Description On-Line Corrective Critical (CC) Maintenance
B The number of On-Line Corrective Critical items in the maintenance backlog for which the field work and testing are not complete.
On-Line Corrective Non-Critical (CN) Maintenance
B The number of On-Line Corrective Non-Critical items in the maintenance backlog for which the field work and testing are not complete.
On-Line Deficient Non-Critical (DN) Maintenance
B The number of On-Line Deficient Non-Critical items in the maintenance backlog for which the field work and testing are not complete.
FIN Effectiveness B The percentage of corrective and deficient maintenance completed by FIN and the percentage of high priority work completed by completed by FIN.
Maintenance Efficiency
B The percentage of work complete as Minor Maintenance.
Work Management Indicator name Level Description On line On-Line Critical PMs Deferred
B The number of On-Line Critical preventive maintenance (PM) tasks for which a deferral has been approved.
On-Line Late PMs B The number of On-Line Critical and Non-Critical preventive maintenance (PM) tasks that exceeded their late date.
On-Line Schedule Completion
B The percentage of the work items scheduled at the beginning of execution week that were completed.
LCO Execution B The percentage of the actual LCO duration used compared to the scheduled duration.
Outage Outage Corrective Critical (OCC) Maintenance
B The number of corrective maintenance items on critical components that cannot be performed with the main generator connected to the grid.
Outage Deficient Critical (ODC)
B The number of deficient maintenance items on critical components that cannot be performed with the main generator

24 © 2017 Nuclear Energy Institute
Indicator name Level Description Maintenance connected to the grid. Outage Critical PMs Deferred
B The number of Outage Critical preventive maintenance (PM) tasks for which a deferral has been approved.
Outage Late PMs B The number of Outage Critical and Non-Critical preventive maintenance (PM) tasks that exceeded their late date.
Percent Refueling Outage Scope Completions
B The number of refueling outage parent work orders that were in scope at the outage start (breakers open) and were completed, divided by the number of refueling outage parent work orders that were in scope at the outage start (breakers open).
Loss of Shutdown Cooling
B The number of events reported in the INPO Consolidated Event System (ICES) where the capability to remove decay heat using installed equipment is lost.
Radiation Protection
Indicator name Level Description None
Chemistry Indicator name Level Description None
Engineering Indicator name Level Description Design/Config Mgt Temporary Modifications
B Measures the total number of installed Temporary Modifications and those open greater than one refueling cycle to gauge adherence to effective configuration control practices.
Reactor Engineering None Plant Engineering Engineered Safety Feature (ESF) Actuation
B The number of engineered safety feature actuations as reported to the NRC through event notifications.
Equipment Reliability None
Training Indicator name Level Description Simulator Index B A composite index to indicate overall simulator health based on
simulator reliability, maintenance health, and testing status in accordance with regulatory documents. Reported quarterly.
Accreditation Health B This indicator is uses a series of questions tied to the accreditation criteria that will assess a program’s compliance with the accreditation objectives.
Regulatory
Indicator name Level Description None
Human Performance
Indicator name Level Description Site Clock Resets B The number of site clock resets.
25 © 2017 Nuclear Energy Institute
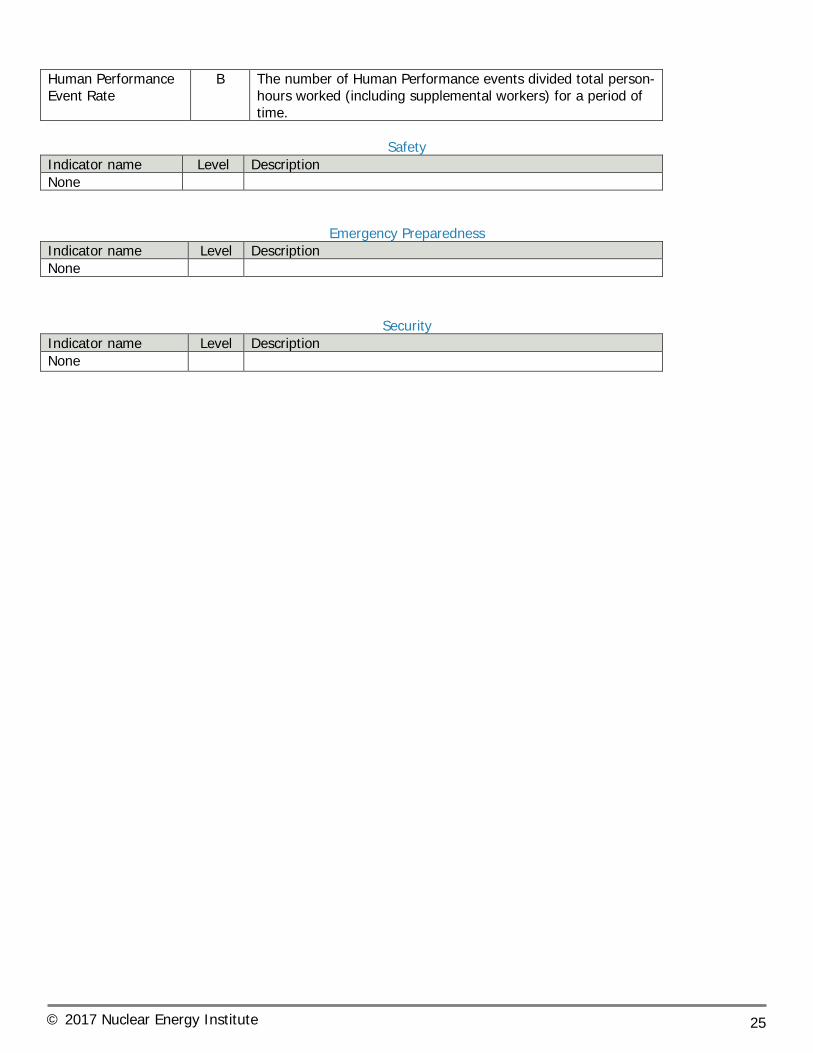
Human Performance Event Rate
B The number of Human Performance events divided total person-hours worked (including supplemental workers) for a period of time.
Safety
Indicator name Level Description None
Emergency Preparedness Indicator name Level Description None
Security Indicator name Level Description None

26 © 2017 Nuclear Energy Institute
Attachment 4 C. Level A and B Performance Indicator Inputs This is a listing of Performance Indicators by Parent Indicator and Indicator title that support Level A indicators. (Level B indicators TBD) Parent Indicator Name Indicator Name # NRC Evnts Not Retracted # NRC Evnts Retracted # NRC Evnts Not Retracted Total # NRC Daily Events AC Power Reliability Index AC Power Reliability Loss of Offsite Power
AC Power Reliability Index AC Power Reliability Partial Loss of Offsite Power
AC Power Reliability Index AC Power Reliability Load Demand Failures AC Power Reliability Index AC Power Reliability EDG MSPI Failures AC Power Reliability Index AC Power Reliability EDG Unavailability All Total - Recordable Accident Rate Total - Fatality Rate All Total - Recordable Accident Rate Utility – Fatality Rate All Total - Recordable Accident Rate Contractor Fatality Rate All Total - Recordable Accident Rate Total - Hours Worked All Total - Recordable Accident Rate Utility – Hours Worked All Total - Recordable Accident Rate Contractor Work Hours All Total - Recordable Accident Rate Total - Lost-time Acc Rate All Total - Recordable Accident Rate Utility – Lost-time Acc Rate All Total - Recordable Accident Rate Contractor – Lost-time Acc Rate All Total - Recordable Accident Rate Total - Work Rest Acc Rate All Total - Recordable Accident Rate Utility – Work Rest Acc Rate All Total - Recordable Accident Rate Contractor – Work Rest Acc Rate All Total - Recordable Accident Rate Total Industrial Safety Accident Rate Chemistry Effectiveness Indicator CEI Water Chemistry – Condition 1 Cycle Chemistry Effectiveness Indicator CEI Water Chemistry – Condition 2 Cycle Chemistry Effectiveness Indicator CEI Water Chemistry – Condition 3 Cycle Chemistry Effectiveness Indicator CEI Water Chemistry – Condition 4 Cycle Chemistry Effectiveness Indicator CEI Water Chemistry – Condition 5 Cycle Chemistry Effectiveness Indicator Revised CEIR Water Chemistry – Condition 1 Cycle Chemistry Effectiveness Indicator Revised CEIR Water Chemistry – Condition 2 Cycle Chemistry Effectiveness Indicator Revised CEIR Water Chemistry – Condition 3 Cycle Chemistry Effectiveness Indicator Revised CEIR Water Chemistry – Condition 4 Cycle Chemistry Performance Indicator Chloride Chemistry Performance Indicator Sulfate Chemistry Performance Indicator Iron

27 © 2017 Nuclear Energy Institute
Parent Indicator Name Indicator Name Chemistry Performance Indicator Sodium Chemistry Performance Indicator Copper Chemistry Performance Indicator Days Greater than 30% PWR Chemistry Performance Indicator Days Greater than 10% BWR Collective Rad Expos External Exposure Collective Rad Expos Internal Exposure Collective Rad Expos Refuel Out Rad Exposure 2020 PII Collective Rad Expos Operating Rad Exposure 2020 PII Consequential Equipment Failures ICES Event Records Contractor Fatality Rate Contract Work Hours Contractor ISA Rate Contract Work Hours Contractor ISA Rate Contract WR Rate Contractor ISA Rate Contractor Fatality Rate Contractor ISA Rate Contractor Loss TA Rate Critical Hours Total Hours Current Non Failed Fuel Months with Fuel Failures
Emergency AC Power Fault Exposure - Cycle Emergency AC Power Required Hours - Cycle
Emergency AC Power Fault Exposure - Cycle Emergency AC Power System Number of Trains
Emergency AC Power Planned Unavailability - Cycle Emergency AC Power Required Hours - Cycle
Emergency AC Power Planned Unavailability - Cycle Emergency AC Power System Number of Trains
Emergency AC Power Unplanned Unavail. - Cycle Emerg AC Pwr Unavail - Cycle
Emergency AC Power Unplanned Unavail. - Cycle Emergency AC Power Fault Exposure - Cycle
Emergency AC Power Unplanned Unavail. - Cycle Emergency AC Power Planned Unavailability - Cycle
Emergency AC Power Unplanned Unavail. - Cycle Emergency AC Power Required Hours - Cycle
Emergency AC Power Unplanned Unavail. - Cycle Emergency AC Power System Number of Trains
Emergency Plan Entry E-Plan Alert Emergency Plan Entry E-Plan General Emg Emergency Plan Entry E-Plan Site Area Emg Emergency Plan Entry E-Plan Unusal Event Engineering Consequential Errors Number Engineering Consequential Errors Equation 1 Krypton 85 Equation 1 Krypton 87

28 © 2017 Nuclear Energy Institute
Parent Indicator Name Indicator Name Equation 1 Krypton 88 Equation 1 Xenon 133 Equation 1 Xenon 135 Equation 1 Xenon 138 Equation 2 Xenon 133 Equation 2 Xenon 135 Equation 2 Xenon 138 Equipment Reliability Index Online Reliability Loss Factor for ERI
Equipment Reliability Index Unplanned Pwr Change 7000 Hrs for 12 Months
Equipment Reliability Index Operational Loss Events for ERI
Equipment Reliability Index Quarterly Unplanned Shutdown LCO Entries for ERI
Equipment Reliability Index Monthly ERI Operator Workaround Equipment Reliability Index Quarterly ERI AP-913 Failure Events Equipment Reliability Index MSPI Non-Green Safety System Perf. Equipment Reliability Index EAC MSPI Non- Green Performance Equipment Reliability Index HPI MSPI Non- Green Performance Equipment Reliability Index HR MSPI Non-Green Performacne Equipment Reliability Index RHR MSPI Non- Green Performance Equipment Reliability Index CW MSPI Non- Green Performance Equipment Reliability Index Unmitigated Single Point Vulnerabilities Equipment Reliability Index Rework Index for ERI Equipment Reliability Index Monthly Online Deficient Critical Maint (DC) Equipment Reliability Index Critical Deferred PMs Equipment Reliability Index Critical PMs Open in Second Half of Grace Equipment Reliability Index Critical Scope Survival Equipment Reliability Index Plant Health Committee Effectiveness Equipment Reliability Index Monthly Red-Yellow Systems Age
Equipment Reliability Index Chemistry Effectiveness revised Indicator for ERI
Equipment Reliability Index Monthly PM Change Request Backlog Equipment Reliability Index Equipment Reliability Index Lost Points Equipment Reliability Index Online Reliability Loss Factor for ERI LP Equipment Reliability Index Unplanned Pwr Changes for 12 Mn LP Equipment Reliability Index Operational Loss Events for ERI Lost Points Equipment Reliability Index Quarterly Unplanned Shutdown LCO LP Equipment Reliability Index Monthly ERI Operator Workaround LP

29 © 2017 Nuclear Energy Institute
Parent Indicator Name Indicator Name Equipment Reliability Index Quarterly ERI AP-913 failure Events LP Equipment Reliability Index MSPI Non-Green Safety Sys. Perf. LP Equipment Reliability Index Single Point Vulnerabilities Lost points Equipment Reliability Index Rework Index for ERI lost Points Equipment Reliability Index Monthly Critical Comp. Non Outage DC LP Equipment Reliability Index Quarterly Sum Critical PMs Deferred LP Equipment Reliability Index Critical PMs in 2nd Half of Grace Lost Points Equipment Reliability Index Quarterly work Week Scope Survival LP Equipment Reliability Index Plant Health Committee Effectiveness LP Equipment Reliability Index Monthly Red-Yellow Systems Age LP Equipment Reliability Index Chem Eff. Revised IND. For ERI lost Points Equipment Reliability Index Monthly PM Change request Backlog LP Events # NRC Evnts Not Retracted Events All Total - Recordable Accident Rate Events Pwr Change 7000 Hrs Forced Loss Rate (WANO) Planned Loss Forced Loss Rate (WANO) Unplanned Loss Forced Loss Rate (WANO) Outage Extension Loss Forced Loss Rate (WANO) Reference energy Generation Fuel Reliability Defect (FRD) Equation 1 Fuel Reliability Defect (FRD) Fuel Reliability Ind (BWR) Fuel Reliability Defect (FRD) Fuel Reliability Ind (PWR) Fuel Reliability Defect (FRD) Xenon 133 Fuel Reliability Ind (BWR) Equation 1 Fuel Reliability Ind (BWR) Equation 2 Fuel Reliability Ind (PWR) IOD134 Fuel Reliability Ind (PWR) Iodine 131 Heat Removal Fault Exposure - Cycle Heat Removal Required Hours - Cycle Heat Removal Fault Exposure - Cycle Heat Remove Trains Heat Removal Planned Unavailability - Cycle Heat Removal Required Hours - Cycle Heat Removal Planned Unavailability - Cycle Heat Remove Trains Heat Removal Unplanned Unavailability - Cycle Heat Removal Fault Exposure - Cycle Heat Removal Unplanned Unavailability - Cycle Heat Removal Planned Unavailability - Cycle Heat Removal Unplanned Unavailability - Cycle Heat Removal Required Hours - Cycle Heat Removal Unplanned Unavailability - Cycle Heat Remove Trains High Pressure Injection Fault Exposure - Cycle HP Inj. Trains - Cycle High Pressure Injection Fault Exposure - Cycle Required Hours

30 © 2017 Nuclear Energy Institute
Parent Indicator Name Indicator Name High Pressure Injection Planned Unavail - Cycle Required Hours
High Pressure Injection Unplanned Unavail - Cycle High Pressure Injection Fault Exposure - Cycle
High Pressure Injection Unplanned Unavail - Cycle High Pressure Injection Planned Unavail - Cycle
High Pressure Injection Unplanned Unavail - Cycle High Pressure Injection Unavailability - Cycle
High Pressure Injection Unplanned Unavail - Cycle HP Inj. Trains - Cycle High Pressure Injection Unplanned Unavail - Cycle Required Hours Hours Critical Breaker Open Critical Hours Hours Critical Breaker Open Hours Critical Breaker Closed INPO 2020 PI Index Lost Points UCF Lost Points INPO 2020 PI Index Lost Points Online Reliability Loss Factor Lost Points INPO 2020 PI Index Lost Points Operational Loss Events Lost Points INPO 2020 PI Index Lost Points Unplan M&A Scrams Lost Points INPO 2020 PI Index Lost Points High Pressure Injection Lost Points INPO 2020 PI Index Lost Points Heat Removal Lost Points INPO 2020 PI Index Lost Points Emergency AC Power Lost Points INPO 2020 PI Index Lost Points Sustained Fuel Reliability Lost Points INPO 2020 PI Index Lost Points Chemistry effectiveness Ind. Revised LP INPO 2020 PI Index Lost Points Collective Radiation exposure Lost Points INPO 2020 PI Index Lost Points Total Ind Safety ACC Index Lost Points INPO 2020 PI Index Lost Points INPO Forced Loss Rate Lost Points INPO 2020 PI Index Lost Points INPO Forced Loss Events Lost Points INPO 2020 PI Index Lost Points Chemistry effectiveness Ind Lost Points INPO 2020 PI Index Lost Points Fuel reliability Defect Lost Points INPO 2020 PI Index Lost Points Industrial Safety Accident Rate Lost Points INPO 2020 PI Index Lost Points Chemistry Performance Ind Lost Points INPO 2020 PI Index Lost Points Unplanned Auto Scram Rate Lost Points INPO 2020 PI Index Lost Points INPO Forced Loss Rate Unplanned Loss (INPO) INPO Forced Loss Rate Planned Loss (INPO) INPO Forced Loss Rate Outage Extension (INPO) INPO Forced Loss Rate Reference Energy Ggeneration INPO/Utility Interactions NANT Course Participation INPO/Utility Interactions Peer Participation INPO/Utility Interactions Workshop Participation IOD134 Power Level > 85%

31 © 2017 Nuclear Energy Institute
Parent Indicator Name Indicator Name IOD134 Purif. Rate Constant Iodine 131 Power Level > 85% Iodine 131 Purif. Rate Constant ISA Rate Utility – Fatality Rate ISA Rate Utility – Lost-time Acc Rate ISA Rate Utility –Work Rest Acc Rate ISA Rate Utility –Hours Worked ISA Rate Industrial Safety Accident Rate Lost Points Krypton 85 Linear heat gen rate Krypton 85 Power Level > 85% Krypton 87 Linear heat gen rate Krypton 87 Power Level > 85% Krypton 88 Linear heat gen rate Krypton 88 Power Level > 85% Maintenance Consequential Errors Number Maint. Consequential Errors Mgmt Challenges Accreditation Visits (ACCV) Mgmt Challenges Discretion Enforce Mgmt Challenges Emergency Plan Entry Mgmt Challenges Enforcement Actions Mgmt Challenges LCO Events Mgmt Challenges Net Open Positions Mgmt Challenges Non-Green Findings Mgmt Challenges Non-Green ROP Ind Mgmt Challenges NRC Allegations Mgmt Challenges NRC Cross Cutting Iss Mgmt Challenges NRC ROP Matrix Mgmt Challenges Operating License Renewal Mgmt Challenges Operator-Owner Change
Mgmt Challenges Station Loss of Shutdown Cooling ICES Events
Mgmt Challenges Station Senior Management Changes Mgmt Challenges Unit Power Uprate Mgmt Challenges Unit Reactor Critical Scram ICES Events Mgmt Challenges Worker Fatalities Mgmt Challenges Months with Fuel Failures Number of Reported Fuel Failures NANT Course Participation CEO Seminar

32 © 2017 Nuclear Energy Institute
Parent Indicator Name Indicator Name NANT Course Participation Eng Sup. PD Seminar NANT Course Participation First Line Leader Seminar NANT Course Participation Human Perfor Fundamentals NANT Course Participation Maint FLPD Seminar NANT Course Participation Maint Manager Seminar NANT Course Participation Maint Sup. PD Seminar NANT Course Participation NANT Dir Course NANT Course Participation New Chem Manager Seminar NANT Course Participation New Eng Manager Seminar NANT Course Participation New Human Perfor. Lead NANT Course Participation New Maint Manager Seminar NANT Course Participation New Mgr. Seminar NANT Course Participation New Ops Manager Seminar NANT Course Participation New Plant Manager Seminar NANT Course Participation New Rad Pro Mgr. Seminar NANT Course Participation New Training Mgr. Seminar NANT Course Participation Next Level Leader Seminar NANT Course Participation Ops Sup. PD Seminar NANT Course Participation POC Orientation Training NANT Course Participation RP & Chem Mgr. PD Seminar NANT Course Participation Rx Tech Nuc Exec Course NANT Course Participation Shift Man PD Seminar NANT Course Participation Sr. Nuc Exec Seminar NANT Course Participation Sr. Nuc Plant Mgr. Course NANT Course Participation Training Sup. PD Seminar Net Open Positions Net Open Positions CHEM Net Open Positions Net Open Positions ENG Net Open Positions Net Open Positions MAINT Net Open Positions Net Open Positions OPS Net Open Positions Net Open Positions RP Net Open Positions Net Open Positions TRAIN Net Open Positions Net Open Positions WORK MAG Non-Green Findings NRC Red Findings Non-Green Findings NRC White Findings Non-Green Findings NRC Yellow Findings Non-Green ROP Ind Red ROP Ind Non-Green ROP Ind White ROP Ind

33 © 2017 Nuclear Energy Institute
Parent Indicator Name Indicator Name Non-Green ROP Ind Yellow ROP Ind NRC Allegations Allegations Substantiated NRC Allegations Allegations with Enforce NRC Allegations Avg Open Allegations NRC Allegations Discrimination Allegation NRC Allegations Off Site Allegations NRC Allegations On Site Allegations NRC Barrier Findings NRC Findings - Barrier Integrity – Red/SL-I
NRC Barrier Findings NRC Findings - Barrier Integrity – White/SL-III
NRC Barrier Findings NRC Findings - Barrier Integrity – Yellow/SL-II
NRC Barrier Findings NRC Findings - BI – Green/SL-IV/Other NRC Cross Cutting Iss Cross Cutting Human Perf NRC Cross Cutting Iss Cross Cutting PI&R NRC Cross Cutting Iss Cross Cutting SCWE NRC Green Findings NRC White Findings NRC Green Findings NRC Yellow Findings NRC Green Findings NRC Red Findings NRC Green ROP Indicators White ROP Ind. NRC Green ROP Indicators Yellow ROP Ind. NRC Green ROP Indicators Red ROP Ind. NRC Initiating Event Findings NRC Findings - IE – Green/SL-IV/Other NRC Initiating Event Findings NRC Findings - Initiating Event – Red/SL-I
NRC Initiating Event Findings NRC Findings - Initiating Event – White/SL-III
NRC Initiating Event Findings NRC Findings - Initiating Event – Yellow/SL-II
NRC Mitigating Systems Findings NRC Findings - Mitigating Systems – Red/SL-I
NRC Mitigating Systems Findings NRC Findings - Mitigating Systems – White/SL-III
NRC Mitigating Systems Findings NRC Findings - Mitigating Systems – Yellow/SL-II
NRC Mitigating Systems Findings NRC Findings -MS – Green/SL-IV/Other NRC Occupational Radiation Safety Findings NRC Findings - OR – Green/SL-IV/Other NRC Occupational Radiation Safety Findings NRC Findings - OR – Red/SL-I NRC Occupational Radiation Safety Findings NRC Findings - OR – White/SL-III NRC Occupational Radiation Safety Findings NRC Findings - OR – Yellow/SL-II

34 © 2017 Nuclear Energy Institute
Parent Indicator Name Indicator Name NRC ROP Matrix ROP Matrix Col 2 NRC ROP Matrix ROP Matrix Col 3 NRC ROP Matrix ROP Matrix Col 4 NRC ROP Matrix ROP Matrix Col 5 Occup Exposure Occur TS High Rad Area Occur Occup Exposure Occur Unintended Exposure Occur Occup Exposure Occur Very High Rad Area Occur Online Deficient Critical Maintenance Backlog Number Deficient Critical Maint Activities Online Reliability Loss Factor Unplanned Loss Online Reliability Loss Factor Planned Loss Online Reliability Loss Factor Outage extension Loss Online Reliability Loss Factor RFO Loss Online Reliability Loss Factor Exempt Loss Online Reliability Loss Factor Reference Unit Power Online Reliability Loss Factor Total Hours Open Critical PM Activities in 2nd Half of Grace Number Open PMs in 2nd Half of Grace Operating Rad Exposure Collective Rad Expos Operating Rad Exposure External Exposure Operating Rad Exposure Internal Exposure Operational Focus Clearance and Tagging Events Operational Focus Component Mispositioning Events Operational Focus LCO Entries Operational Focus Operational Decision Making Events Operational Focus Operations Personnel-Related Events Operational Focus Pwr Change 7000 Hrs Operational Focus Scram with Complications Operational Loss Events ICES Event Record Operations Fundamental Events Number Operations fundamental events Operations Personnel-Related Events Operations Fundamentals Events
Operations Personnel-Related Events Operations Personnel-Procedure-Related Events
Peer Participation Host Peers Peer Participation Total Peer Participation
Percent Total RCS Operational Leakage Total Reactor Coolant System Operational Leakage
Personnel Safety NRC Occupational Radiation Safety Findings Personnel Safety Occup Exposure Occur

35 © 2017 Nuclear Energy Institute
Parent Indicator Name Indicator Name Personnel Safety Operating Rad Exposure Personnel Safety Refuel Out Rad Exposure Personnel Safety Total - Fatality Rate
Plant Equipment Chemistry Condition 5 Cycle - Dose Mitigation
Plant Equipment Consequential Equipment Failures Plant Equipment ESF Actuation Plant Equipment Fuel Reliability Defect (FRD) Plant Equipment Functional Equipment Failures Plant Equipment Grid-Related Generation Loss Plant Equipment NRC Barrier Findings Plant Equipment NRC Initiating Event Findings Plant Equipment NRC Mitigating Systems Findings Plant Equipment RCS Percent Leakage Plant Equipment Safety System Functional Failures Plant Equipment Sustained Fuel Reliability Pwr Change 7000 Hrs Critical Hours Pwr Change 7000 Hrs Unplanned Critical Scram Pwr Change 7000 Hrs Unplanned Power Change RCS Percent Leakage RCS Leakage RCS Percent Leakage RCS Leakage TSL Radiation Protection Index (RPI) Collective Rad Exposure for RPI Radiation Protection Index TS High Rad Area Occur for RPI Radiation Protection Index Very High Rad Area Occur for RPI Radiation Protection Index Unintended Exposure Ocurr for RPI Radiation Protection Index Total High Rad Area Controls for RPI Radiation Protection Index Total Unplanned Exposure for RPI Radiation Protection Index Protected Area Rad Material Control for RPI Radiation Protection Index Other Rad Material Control for RPI Reactivity Management BWR Severe Reactivity Mgmt. Event SL1 Reactivity Management BWR Major Reactivity Mgmt. Event SL2 Reactivity Management BWR Minor Reactivity Mgmt. Event SL3 Reactivity Management BWR Reactivity Mgmt. Precursors SL4 Reactivity Management BWR Reactivity Mgmt. Concerns SL5 Reactivity Management PWR Severe Reactivity Mgmt. Event SL1 Reactivity Management PWR Major Reactivity Mgmt. Event SL2 Reactivity Management PWR Minor Reactivity Mgmt. Event SL3
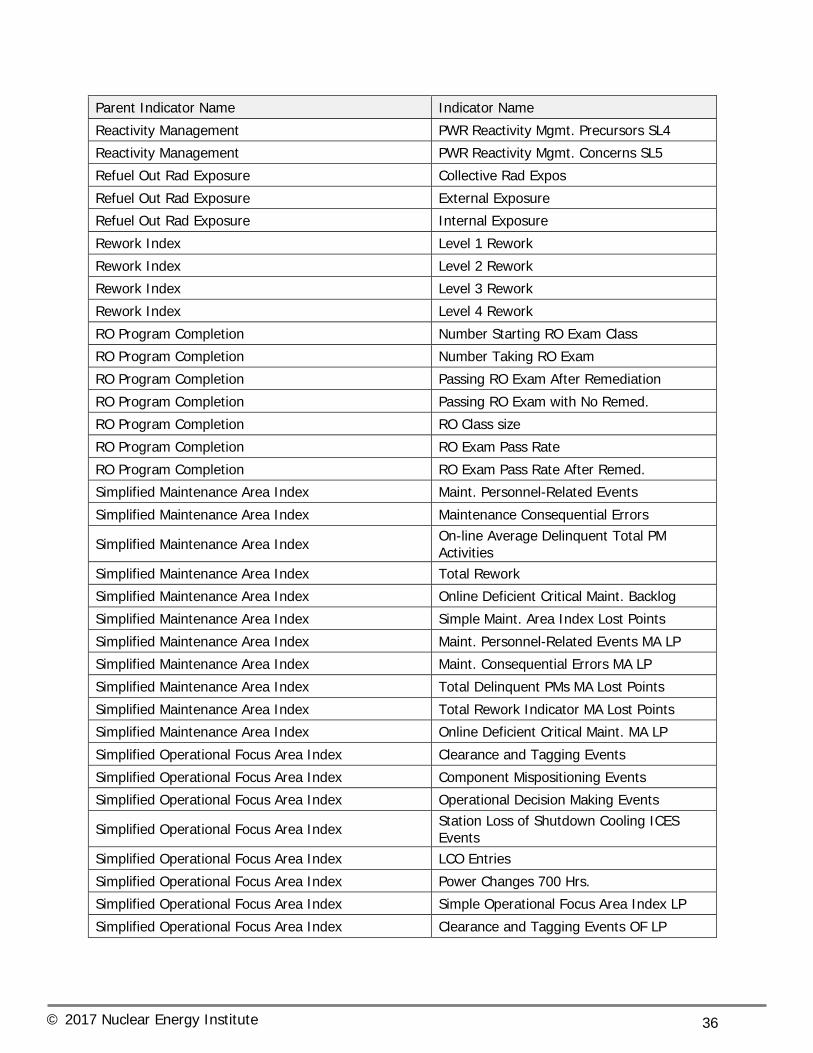
36 © 2017 Nuclear Energy Institute
Parent Indicator Name Indicator Name Reactivity Management PWR Reactivity Mgmt. Precursors SL4 Reactivity Management PWR Reactivity Mgmt. Concerns SL5 Refuel Out Rad Exposure Collective Rad Expos Refuel Out Rad Exposure External Exposure Refuel Out Rad Exposure Internal Exposure Rework Index Level 1 Rework Rework Index Level 2 Rework Rework Index Level 3 Rework Rework Index Level 4 Rework RO Program Completion Number Starting RO Exam Class RO Program Completion Number Taking RO Exam RO Program Completion Passing RO Exam After Remediation RO Program Completion Passing RO Exam with No Remed. RO Program Completion RO Class size RO Program Completion RO Exam Pass Rate RO Program Completion RO Exam Pass Rate After Remed. Simplified Maintenance Area Index Maint. Personnel-Related Events Simplified Maintenance Area Index Maintenance Consequential Errors
Simplified Maintenance Area Index On-line Average Delinquent Total PM Activities
Simplified Maintenance Area Index Total Rework Simplified Maintenance Area Index Online Deficient Critical Maint. Backlog Simplified Maintenance Area Index Simple Maint. Area Index Lost Points Simplified Maintenance Area Index Maint. Personnel-Related Events MA LP Simplified Maintenance Area Index Maint. Consequential Errors MA LP Simplified Maintenance Area Index Total Delinquent PMs MA Lost Points Simplified Maintenance Area Index Total Rework Indicator MA Lost Points Simplified Maintenance Area Index Online Deficient Critical Maint. MA LP Simplified Operational Focus Area Index Clearance and Tagging Events Simplified Operational Focus Area Index Component Mispositioning Events Simplified Operational Focus Area Index Operational Decision Making Events
Simplified Operational Focus Area Index Station Loss of Shutdown Cooling ICES Events
Simplified Operational Focus Area Index LCO Entries Simplified Operational Focus Area Index Power Changes 700 Hrs. Simplified Operational Focus Area Index Simple Operational Focus Area Index LP Simplified Operational Focus Area Index Clearance and Tagging Events OF LP

37 © 2017 Nuclear Energy Institute
Parent Indicator Name Indicator Name Simplified Operational Focus Area Index Comp. Mispositioning events OF Lost Points
Simplified Operational Focus Area Index Operational Decision Making Events OF Lost Points
Simplified Operational Focus Area Index Loss of SD Cooling events OF Lost Points Simplified Operational Focus Area Index Limited Condition of Operation OF LP Simplified Operational Focus Area Index Unplanned Pwr Changes Simplified Operations Area Index Ops Pers. Events – SNC Simplified Operations Area Index Ops Pers. Events - NNC Simplified Operations Area Index SRO Exam Pass Rate Simplified Operations Area Index RO Exam Pass Rate Simplified Operations Area Index Simplified Operations Area Index Simplified Operations Area Index Simplified Ops Area Index Lost Points
Simplified Operations Area Index SNC Ops Personnel-Related Events OP Lost Points
Simplified Operations Area Index NNC Ops Personnel-Related evens OP Lost Points
Simplified Operations Area Index NRC SRO Exam Pass Rate OP Lost Points Simplified Operations Area Index NRC RO Exam Pass Rate Lost Points Simplified Organizational Effectiveness Area Index Accreditation Visits Simplified Organizational Effectiveness Area Index Management events – SNC Simplified Organizational Effectiveness Area Index Net Open Positions Simplified Organizational Effectiveness Area Index Net Open Positions CHEM Simplified Organizational Effectiveness Area Index Budgeted Positions CHEM Simplified Organizational Effectiveness Area Index Open Positions CHEM Simplified Organizational Effectiveness Area Index Net Open Positions ENG Simplified Organizational Effectiveness Area Index Budgeted Positions ENG Simplified Organizational Effectiveness Area Index Open Positions ENG Simplified Organizational Effectiveness Area Index Net Open Positions MAINT Simplified Organizational Effectiveness Area Index Budgeted Positions MAINT Simplified Organizational Effectiveness Area Index Open Positions MAINT Simplified Organizational Effectiveness Area Index Net Open Positions OPS Simplified Organizational Effectiveness Area Index Budgeted Positions OPS Simplified Organizational Effectiveness Area Index Open Positions OPS Simplified Organizational Effectiveness Area Index Net Open Positions RP Simplified Organizational Effectiveness Area Index Budgeted Positions RP Simplified Organizational Effectiveness Area Index Open Positions RP Simplified Organizational Effectiveness Area Index Net Open Positions TRAIN Simplified Organizational Effectiveness Area Index Budgeted Positions TRAIN

38 © 2017 Nuclear Energy Institute
Parent Indicator Name Indicator Name Simplified Organizational Effectiveness Area Index Open Positions TRAIN Simplified Organizational Effectiveness Area Index Net Open Positions WORK MAG Simplified Organizational Effectiveness Area Index Budgeted Positions WORK MAG Simplified Organizational Effectiveness Area Index Open Positions WORK MAG Simplified Organizational Effectiveness Area Index Pwr Change 7000 Hrs Simplified Organizational Effectiveness Area Index Station Senior Management Changes Simplified Organizational Effectiveness Area Index NRC Cross Cutting Issue Simplified Organizational Effectiveness Area Index Non-Green Findings Simplified Organizational Effectiveness Area Index Non-Green ROP Ind Simplified Organizational Effectiveness Area Index NRC ROP Matrix Simplified Organizational Effectiveness Area Index Days to First Shutdown Simplified Organizational Effectiveness Area Index Organizational Eff. Area Lost Points Simplified Organizational Effectiveness Area Index Accreditation Visits OR Lost Points Simplified Organizational Effectiveness Area Index Management-Related Events OR Lost Points Simplified Organizational Effectiveness Area Index Net Open Positions OR Lost Points Simplified Organizational Effectiveness Area Index Unplanned Pwr Change 7000 Hrs OR LP Simplified Organizational Effectiveness Area Index Senior Management Changes OR LP Simplified Organizational Effectiveness Area Index NRC Cross Cutting Issues OR Lost Points Simplified Organizational Effectiveness Area Index NRC Non-Green Findings OR Lost Points Simplified Organizational Effectiveness Area Index NRC Non-Green ROP Ind. OR Lost Points Simplified Organizational Effectiveness Area Index NRC ROP Matrix Col 2, 3, 4, 5 OR LP Simplified Organizational Effectiveness Area Index Days to First Shutdown OR Lost Points Simplified Work Management Area Index Online Corrective Critical Maintenance Simplified Work Management Area Index Online Average Deferred Critical PM Act. Simplified Work Management Area Index Online Average Delinquent Critical PM Act Simplified Work Management Area Index Open critical PM Act. In 2nd Half of Grace Simplified Work Management Area Index Online Deficient Critical Maint. Backlog Simplified Work Management Area Index Open Total PM Act. In 2nd Half of Grace Simplified Work Management Area Index Critical Scope Survival Simplified Work Management Area Index Outage Corrective Critical Maintenance Simplified Work Management Area Index Outage Deficient Critical Maintenance Simplified Work Management Area Index Percentage of RFO Scope Completions Simplified Work Management Area Index Simple WM Area Index Lost Points Simplified Work Management Area Index Online Corrective Critical Maint. WM LP Simplified Work Management Area Index Deferred Critical PMs WM Lost Points Simplified Work Management Area Index Delinquent Critical PMs WM Lost Points Simplified Work Management Area Index Critical PMs in 2nd Half of Grace WM LP

39 © 2017 Nuclear Energy Institute
Parent Indicator Name Indicator Name Simplified Work Management Area Index Online Deficient Critical Maint. WM LP Simplified Work Management Area Index Total PMs in 2nd Half of Grace WM LP Simplified Work Management Area Index Critical Scope Survival WM Lost Points Simplified Work Management Area Index Outage corrective Critical Maint. WM LP Simplified Work Management Area Index Outage Deficient critical Maint. WM LP Simplified Work Management Area Index Percent RFO Scope Completion WM LP SRO Program Completion Number Starting SRO Exam Class SRO Program Completion Number Taking SRO Exam SRO Program Completion Passing SRO Exam After Remediation SRO Program Completion Passing SRO Exam with No Remed. SRO Program Completion SRO Class size SRO Program Completion SRO Exam Pass Rate SRO Program Completion SRO Exam Pass Rate After Remed. Sustained Failure Free Fuel Perf Months Operating with Fuel Failures Sustained Fuel Reliability Current Non Failed Fuel PII Sustained Fuel Reliability Sustained Failure Free Fuel Perf PII Sustained Fuel Reliability Months with Fuel Failures PII Sustained Fuel Reliability Number of Reported Fuel Failures PII Total - Fatality Rate Contractor Fatality Rate Total - Fatality Rate Total - Hours Worked Total - Fatality Rate Utility - Fatality Rate Total - Hours Worked Contract Work Hours Total - Hours Worked Utility - Hours Worked Total - Lost-time Acc Rate Contractor Loss TA Rate Total - Lost-time Acc Rate Total - Hours Worked Total - Lost-time Acc Rate Utility - Lost-time Acc Rate Total - Work Rest Acc Rate Contract WR Rate Total - Work Rest Acc Rate Total - Hours Worked Total - Work Rest Acc Rate Utility - Work Rest Acc Rate Total High Radiation Area Control Events Number HRA Control Occurrences Total Industrial Safety Accident Rate Total - Hours Worked Total Peer Participation Chemistry Peers Total Peer Participation Corporate Eval Peers Total Peer Participation Engineering Peers Total Peer Participation Equip Perform Peers Total Peer Participation Maintenance Peers Total Peer Participation Operations Peers

40 © 2017 Nuclear Energy Institute
Parent Indicator Name Indicator Name Total Peer Participation Org and Admin Peers Total Peer Participation Other Peers Total Peer Participation Plant Evaluation Peers Total Peer Participation Plant Evolution Observ Total Peer Participation Rad Protection Peers Total Peer Participation Simulator Peers Total Peer Participation Training Peers Total Peer Participation Work Management Peers Unit Capability Factor Planned Loss Unit Capability Factor Unplanned Loss Unit Capability Factor Outage Extension Loss Unit Capability Factor Reference Energy Generation Unplanned Weighted Manual & Automatic Scrams Unplanned Manual Scrams Unplanned Weighted Manual & Automatic Scrams Unplanned Automatic Scram Utility - Fatality Rate Utility - Hours Worked Utility - Lost-time Acc Rate Utility - Hours Worked Work Managment Other Performance Indicator Index On-Line Corrective Critical Maintenance
Work Managment Other Performance Indicator Index
On-Line Deficient Critical Maintenance Backlog
Work Managment Other Performance Indicator Index
Open Critical PM Activities in 2nd Half of Grace
Work Managment Other Performance Indicator Index
Open Total PM Activities in 2nd Half of Grace
Work Managment Other Performance Indicator Index Outage Corrective Critical Maintenance
Work Managment Other Performance Indicator Index Outage Deficient Critical Maintenance
Work Managment Other Performance Indicator Index Percentage of RFO Scope Completions
Worker Fatalities Contract Fatalities Worker Fatalities Utility Fatalities Xenon 133 Linear heat gen rate Xenon 133 Power Level > 85% Xenon 135 Linear heat gen rate Xenon 135 Power Level > 85% Xenon 138 Linear heat gen rate Xenon 138 Power Level > 85%
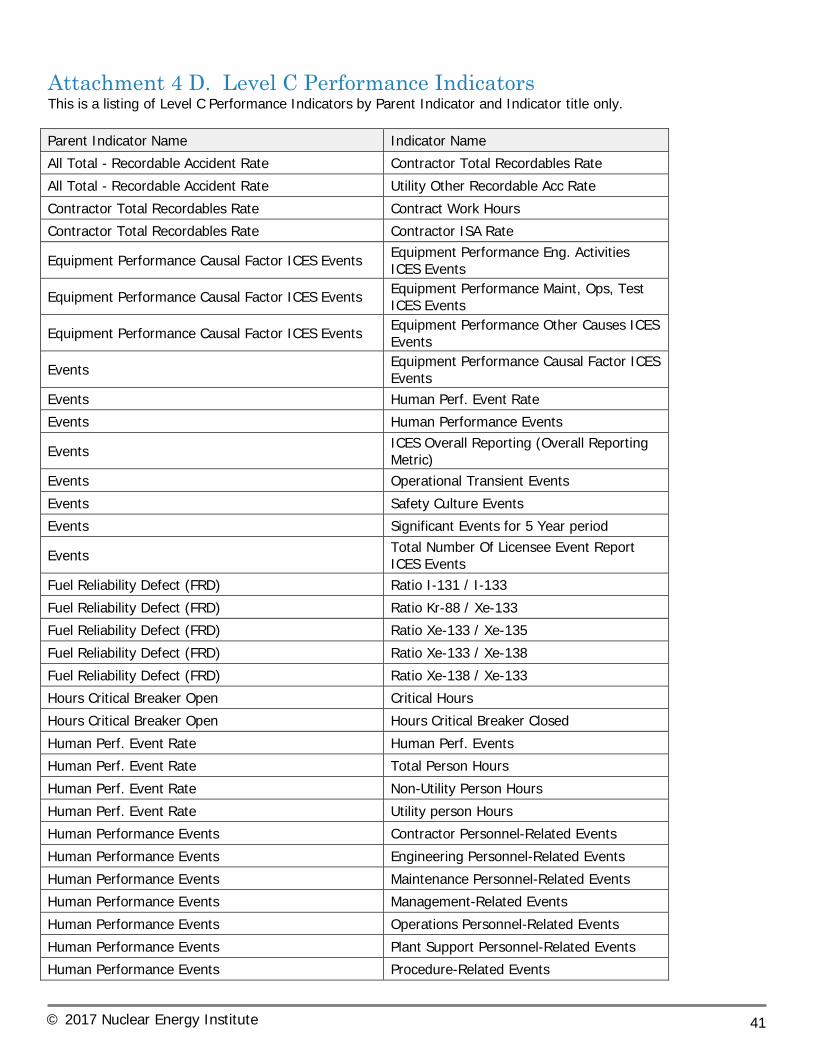
41 © 2017 Nuclear Energy Institute
Attachment 4 D. Level C Performance Indicators This is a listing of Level C Performance Indicators by Parent Indicator and Indicator title only. Parent Indicator Name Indicator Name All Total - Recordable Accident Rate Contractor Total Recordables Rate All Total - Recordable Accident Rate Utility Other Recordable Acc Rate Contractor Total Recordables Rate Contract Work Hours Contractor Total Recordables Rate Contractor ISA Rate
Equipment Performance Causal Factor ICES Events Equipment Performance Eng. Activities ICES Events
Equipment Performance Causal Factor ICES Events Equipment Performance Maint, Ops, Test ICES Events
Equipment Performance Causal Factor ICES Events Equipment Performance Other Causes ICES Events
Events Equipment Performance Causal Factor ICES Events
Events Human Perf. Event Rate Events Human Performance Events
Events ICES Overall Reporting (Overall Reporting Metric)
Events Operational Transient Events Events Safety Culture Events Events Significant Events for 5 Year period
Events Total Number Of Licensee Event Report ICES Events
Fuel Reliability Defect (FRD) Ratio I-131 / I-133 Fuel Reliability Defect (FRD) Ratio Kr-88 / Xe-133 Fuel Reliability Defect (FRD) Ratio Xe-133 / Xe-135 Fuel Reliability Defect (FRD) Ratio Xe-133 / Xe-138 Fuel Reliability Defect (FRD) Ratio Xe-138 / Xe-133 Hours Critical Breaker Open Critical Hours Hours Critical Breaker Open Hours Critical Breaker Closed Human Perf. Event Rate Human Perf. Events Human Perf. Event Rate Total Person Hours Human Perf. Event Rate Non-Utility Person Hours Human Perf. Event Rate Utility person Hours Human Performance Events Contractor Personnel-Related Events Human Performance Events Engineering Personnel-Related Events Human Performance Events Maintenance Personnel-Related Events Human Performance Events Management-Related Events Human Performance Events Operations Personnel-Related Events Human Performance Events Plant Support Personnel-Related Events Human Performance Events Procedure-Related Events

42 © 2017 Nuclear Energy Institute
Parent Indicator Name Indicator Name Human Performance Events Training or Qualification-Related Events
Human Performance Events Work Planning or Scheduling-Related Events
Human Performance Events Work Practice-Related Events ICES Reactivity and Fuel Hand Events ICES Fuel Handling Events ICES Reactivity and Fuel Hand Events ICES Reactivity Management Events INPO Gov & Advisory INPO Advisory Part INPO Gov & Advisory INPO Governance Part INPO Visits Assistance Visits INPO Visits Chemistry Visits INPO Visits Corporate Eval Visits INPO Visits Engineering Visits INPO Visits Equip Perform Visits INPO Visits INPO Eval Train Visits INPO Visits Maintenance Review Visits INPO Visits OE Review Visits INPO Visits Operations Review Visits INPO Visits Org & Admin Review Visits INPO Visits Other Assist. or Review INPO Visits Plant Eval / Accred Visit INPO Visits Plant Evaluation Visits INPO Visits Rad Prot Review Visits INPO Visits Senior Rep Visits INPO Visits Sr. Plant Mgr. Course INPO Visits Training Review Visits INPO Visits Work Mgmt Review Visits INPO/Utility Interactions INPO Gov & Advisory INPO/Utility Interactions INPO Visits INPO/Utility Interactions Loaned Employee Summary INPO/Utility Interactions Workshop Participation Loaned Employee Summary Empl. Loaned to Utility Loaned Employee Summary Empl. Loaned Utility ST Loaned Employee Summary Employees Loaned to INPO Mgmt Challenges Corp. Construction Mgmt Challenges Extended Pwr Reduct/Rest Mgmt Challenges On-Site Construction Mgmt Challenges Outage Extension Mgmt Challenges Shutdown > 100 days Mgmt Challenges Station INPO Significant ICES Events

43 © 2017 Nuclear Energy Institute
Parent Indicator Name Indicator Name Mgmt Challenges Station Loss of Offsite Power Events
Mgmt Challenges Station Loss of Rx Vessel Level Control Events
Mgmt Challenges Station Safety Culture Events Mgmt Challenges Unit Maint. Shutdown Mgmt Challenges Unit Reactor Critical Scram ICES Events Operational Focus Control Room Deficiencies Operational Focus Hours Critical Breaker Open Operational Focus ICES Reactivity and Fuel Hand Events Operational Focus Operational Transient Events Operational Focus Operator Workarounds Operational Focus Outage Risk Level Changes
Operational Focus Percent Tech Spec Primary to Secondary Leakage
Operational Focus Percent Tech Spec Unidentified Leakage Operational Focus Percent Total RCS Operational Leakage Operational Focus RO Program Completion
Operational Focus Safety System Unplanned Unavailability Index
Operational Focus Scram with Complications Operational Focus SRO & RO Class Completions Operational Focus SRO Program Completion Operational Focus Unplanned SD LCO Operator Workarounds Non-Out Ops Workarounds Operator Workarounds Outage Ops Workarounds Outage Contam Pers. Outage Outage Contam Pers. Monthly Outage High Rad Area Controls Outage Outage High Rad Area Controls Monthly Outage Risk Level Changes Containment Risk Level Changes Outage Risk Level Changes Electrical Power Risk Level Changes Outage Risk Level Changes Heat Removal Risk Level Changes Outage Risk Level Changes Inventory Risk Level Changes Outage Risk Level Changes Reactivity Risk Level Changes Outage Unplanned Exposure Outage Outage Unplanned Exposure Monthly Percent Station Key Depart. Open Positions Budgeted Positions Station Key Depart. Percent Station Key Depart. Open Positions Open Positions Station Key Depart.
Percent Tech Spec Primary to Secondary Leakage Minimum Detectable Primary to Secondary Leakage
Percent Tech Spec Primary to Secondary Leakage Primary to Secondary Leakage
Percent Tech Spec Primary to Secondary Leakage Tech Spec Limit Primary to Secondary Leakage
Percent Tech Spec Unidentified Leakage Reactor Coolant System Unidentified

44 © 2017 Nuclear Energy Institute
Parent Indicator Name Indicator Name Leakage
Percent Tech Spec Unidentified Leakage Tech Spec Limit Unidentified Leakage Percentage Station Open Chemistry Budgeted Positions Chemistry Percentage Station Open Chemistry Open Positions Chemistry Percentage Station Open Engineering Budgeted Positions Engineering Percentage Station Open Engineering Open Positions Engineering Percentage Station Open Maintenance Budgeted Positions Maintenance Percentage Station Open Maintenance Open Positions Maintenance Percentage Station Open OPS Budgeted Positions OPS Percentage Station Open OPS Open Positions OPS Percentage Station Open RP Budgeted Positions RP Percentage Station Open RP Open Positions RP Percentage Station Open Training Budgeted Positions Training Percentage Station Open Training Open Positions Training Percentage Station Open Work Mgnt. Budgeted Positions Work Mgnt. Percentage Station Open Work Mgnt. Open Positions Work Mgnt. Personnel Safety Contractor Oth. Rec. Rate Personnel Safety Contractor Total Recordables Rate Personnel Safety Radiation Protection Events Personnel Safety Total Contam Pers. Personnel Safety Total High Radiation Area Control Events Personnel Safety Total Rad Mat Control Personnel Safety Total Unplanned Exposure Personnel Safety Utility Other Recordable Acc Rate Personnel Safety Utility Total Recordable Acc Rate Plant Equipment Consequential Equipment Failures Plant Equipment Days to First Shutdown
Plant Equipment Equipment Performance Causal Factor ICES Events
Plant Equipment Fuel Reliability Defect Plant Equipment Functional Equipment Failures Plant Equipment ICES Event Related Generation Loss
Plant Equipment ICES Events with Generation Loss >20% of a RUP-Hr
Plant Equipment Risk-Significant Or MSPI Component Failures
Plant Equipment Safety System Unplanned Unavailability Index
Plant Equipment Unit Shutdowns Ratio I-131 / I-133 IOD134 Ratio I-131 / I-133 Iodine 131

45 © 2017 Nuclear Energy Institute
Parent Indicator Name Indicator Name Ratio Kr-88 / Xe-133 Krypton 88 Ratio Kr-88 / Xe-133 Xenon 133 Ratio Xe-133 / Xe-135 Xenon 133 Ratio Xe-133 / Xe-135 Xenon 135 Ratio Xe-133 / Xe-138 Xenon 133 Ratio Xe-133 / Xe-138 Xenon 138 Ratio Xe-138 / Xe-133 Xenon 133 Ratio Xe-138 / Xe-133 Xenon 138
Safety System Unplanned Unavailability Index Emergency AC Power Unplanned Unavail. – Cycle
Safety System Unplanned Unavailability Index Heat Removal Unplanned Unavailability – Cycle
Safety System Unplanned Unavailability Index High Pressure Injection Unplanned Unavail – Cycle
Significant Events for 5 Year period Significant and Noteworthy Consequential Events
Significant Events for 5 Year period Significant and Noteworthy Events SRO & RO Class Completions SRO Program Completion Staffing Percent Station Key Depart. Open Positions Staffing Percentage Station Open Chemistry Staffing Open Positions Chemistry Staffing Budgeted Positions Chemistry Staffing Percentage Station Open Engineering Staffing Open Positions Engineering Staffing Budgeted Positions Engineering Staffing Percentage Station Open Maintenance Staffing Open Positions Maintenance Staffing Budgeted Positions maintenance Staffing Percentage Station Open OPS Staffing Open Positions OPS Staffing Budgeted Positions OPS Staffing Percentage Station Open RP Staffing Open Positions RP Staffing Budgeted Positions RP Staffing Percentage Station Open Training Staffing Open Positions Training Staffing Budgeted Positions Training Staffing Percentage Station Open Work Mgnt. Staffing Open Positions Work Mgnt. Staffing Budgeted Positions Work mgnt. Total Contam Pers. Non-Out Contam Pers.

46 © 2017 Nuclear Energy Institute
Parent Indicator Name Indicator Name Total Contam Pers. Outage Contam Pers. Outage Total Contam Pers. Outage Contam Pers. Monthly Total High Radiation Area Control Events Non-Outage High Rad Area Controls Total High Radiation Area Control Events Outage High Rad Area Controls Outage Total High Radiation Area Control Events Outage High Rad Area Controls Monthly Total Person Hours Non-Utility Person Hour Total Person Hours Utility Person Hours Total Rad Mat Control Protected Area Rad Mat Control Total Unplanned Exposure Non-Outage Unplanned Exposure Total Unplanned Exposure Outage Unplanned Exposure Outage Total Unplanned Exposure Outage Unplanned Exposure Monthly Utility Other Recordable Acc Rate Utility - Hours Worked Work Managment Other Performance Indicator Index Deferred Critical PM Activities
Work Managment Other Performance Indicator Index Deferred Total PM Activities
Work Managment Other Performance Indicator Index Delinquent Critical PM Activities
Work Managment Other Performance Indicator Index Delinquent Total PM Activities
Work Managment Other Performance Indicator Index On-Line Corrective Noncritical Maintenance
Work Managment Other Performance Indicator Index On-Line Deficient Noncritical Maintenance
Work Managment Other Performance Indicator Index Outage Corrective Noncritical Maintenance
Work Managment Other Performance Indicator Index Outage Deficient Noncritical Maintenance
Work Managment Other Performance Indicator Index
Percentage Change in RFO Scope After Freeze
Work Managment Other Performance Indicator Index Percentage of On-line Carryover Work
Work Managment Other Performance Indicator Index Percentage of On-line Emergent Work
Work Managment Other Performance Indicator Index Quarterly Work Week Schedule Completion
Workshop Participation Chemistry Working Mtgs Workshop Participation Engineering Working Mtgs Workshop Participation Events Analy Meeting Workshop Participation Maintenance Working Mtgs Workshop Participation OE Working Meetings Workshop Participation Operations Working Mtgs Workshop Participation Org & Admin Working Mtgs Workshop Participation Plant Managers Workshops

47 © 2017 Nuclear Energy Institute
Parent Indicator Name Indicator Name Workshop Participation Process Mgmt Working Mtgs Workshop Participation Rad Protection Workshops Workshop Participation Special Working Grp Mtgs Workshop Participation Training Working Meetings


![DPE RHO Visual Assessment Report 170614 - Amazon S3...J=CKFQR@A Eb`a Eb`a ni Ji\]lXn] Ji\]lXn] Ji\]lXn] ni IiqIiq K]`eb`bZe] Eb`a Eb`a bgjX[n Eb`a FgjX[n Ji\]lXn] Eb`a Ji\]lXn] Eb`a](https://static.fdocuments.net/doc/165x107/6127f826dfe2eb21db79cba4/dpe-rho-visual-assessment-report-170614-amazon-s3-jckfqra-eba-eba-ni-jilxn.jpg)