
Collision Cascade and Sputtering Process in a...
13
Collision Cascade and Sputtering Process in a Polymer A. Delcorte* and P. Bertrand PCPM, UniVersite Catholique de LouVain, 1 Croix du Sud, B1348, LouVain-la-NeuVe, Belgium B. J. Garrison Department of Chemistry, The PennsylVania State UniVersity, 152 DaVey Lab, UniVersity Park, PennsylVania 16802 ReceiVed: March 22, 2001; In Final Form: June 13, 2001 The particle induced fragmentation and sputtering of a ∼7.5 kilodalton organic sample is modeled using molecular dynamics (MD) simulations. The model system consists of a polystyrene coil containing 61 styrene repeat units adsorbed on Ag(111). It is bombarded by 500 eV Ar projectiles. To obtain a realistic picture of the dynamics for an organic material, we used the new adaptative AIREBO potential developed by Stuart, Tutein, and Harrison, which includes long-range van der Waals forces in the reactive potential created by Brenner (REBO) for hydrocarbon systems. Significant differences between the results obtained with and without the long-ranged interaction are identified. The development of the collision cascade in the organic medium is analyzed in detail using collision trees and movies of the results from the simulation. In addition to fast atomic collision processes, we show the existence of long-lived vibrational excitations and demonstrate their importance for the emission of kilodalton chain segments. Recombined and rearranged fragments are emitted, but their contribution to the mass spectrum is insignificant beyond 40 Da. Delayed emission via vibration-induced bond scission is also observed. Finally, we compare the MD results with new ToF-SIMS measurements performed in the context of this study. 1. Introduction Organic surfaces, encompassing synthetic polymers, additives, molecular overlayers, biological molecules and tissues, are involved in a large number of technologically and medically important applications. The design and control of these systems require analysis techniques that are sensitive to the chemistry of the outermost surface layer and, if possible, are quantitative. In the past two decades, static secondary ion mass spectrometry (SSIMS), has been successfully applied to solve a variety of problems related to such surfaces, as witnessed by the success of the major conference in the field. 1 Future improvement of the method, however, requires a better understanding of the physics of organic sputtering. 2 Using molecular dynamics (MD) simulations, a good founda- tion of knowledge about the emission processes has been built for many systems, including organic overlayers on inorganic substrates. 3-9 Submonolayers of limited size molecules on heavy metal substrates, even though they constitute rather specific systems, set the stage for examining organic crystals, large molecular adsorbates, or thick polymer layers. 10 A key difference with these systems is the two distinct strengths of the interaction at play, that is, strong intramolecular chemical bonds versus weak intermolecular van der Waals forces. In this new context, using the Brenner potential functions (REBO 11 ) for the C-C and C-H interactions is a significant approximation because this potential does not include long-range interactions. Recently, Stuart, Tutein, and Harrison developed the adaptative inter- molecular REBO potential (AIREBO), including both the reactivity of the REBO potential and the long-range van der Waals interactions. 12 This sophisticated potential has already been used to model the sputtering of solid benzene samples. 13 Another implementation of the long-range forces in the frame of the REBO potential has been developed by Beardmore and Smith. This potential has been applied to model the fullerene- induced ejection of molecular species from graphite. 14,15 In this paper, we take avantage of the new AIREBO potential to address various issues related to the sputtering of bulk organic materials. These are, for instance, the development of a collision cascade in a coiled polymeric chain, the possible energy transfer into the vibrational modes of the molecule after a stage of high energy collisions, the expansion of the excited molecule toward the vacuum, 16 the direct or delayed fragmentation processes, the possible chemical reactions in the excited volume. In practice, we model the bombardment of a polystyrene (PS) sample adsorbed on silver by 500 eV Ar atoms. The size of the PS sample, comprising 61 styrene repeat units, has been chosen so that collision cascades can develop in its bulk, with a reduced influence of the underlying silver substrate. On the other hand, this size is sufficiently limited to be computationally tractable. The MD simulation results are compared to new experimental data and simulations conducted in the binary collision ap- proximation. 2. Methods 2.1. Molecular Dynamics Simulation. The Ar bombardment of a sec-butyl terminated polystyrene oligomer (Figure 1) adsorbed on a Ag(111) surface is modeled using molecular dynamics (MD) computer simulations. The MD scheme has been described in extensive detail elsewhere. 8,17-21 It consists of integrating Hamilton’s equations of motion to determine the * Corresponding author. Phone: 32-10-473582; fax: 32-10-473452; e-mail: [email protected]. 9474 J. Phys. Chem. B 2001, 105, 9474-9486 10.1021/jp011099e CCC: $20.00 © 2001 American Chemical Society Published on Web 09/11/2001
Transcript of Collision Cascade and Sputtering Process in a...

Collision Cascade and Sputtering Process in a Polymer
A. Delcorte* and P. BertrandPCPM, UniVersite Catholique de LouVain, 1 Croix du Sud, B1348, LouVain-la-NeuVe, Belgium
B. J. GarrisonDepartment of Chemistry, The PennsylVania State UniVersity, 152 DaVey Lab,UniVersity Park, PennsylVania 16802
ReceiVed: March 22, 2001; In Final Form: June 13, 2001
The particle induced fragmentation and sputtering of a∼7.5 kilodalton organic sample is modeled usingmolecular dynamics (MD) simulations. The model system consists of a polystyrene coil containing 61 styrenerepeat units adsorbed on Ag(111). It is bombarded by 500 eV Ar projectiles. To obtain a realistic picture ofthe dynamics for an organic material, we used the new adaptative AIREBO potential developed by Stuart,Tutein, and Harrison, which includes long-range van der Waals forces in the reactive potential created byBrenner (REBO) for hydrocarbon systems. Significant differences between the results obtained with andwithout the long-ranged interaction are identified. The development of the collision cascade in the organicmedium is analyzed in detail using collision trees and movies of the results from the simulation. In additionto fast atomic collision processes, we show the existence of long-lived vibrational excitations and demonstratetheir importance for the emission of kilodalton chain segments. Recombined and rearranged fragments areemitted, but their contribution to the mass spectrum is insignificant beyond 40 Da. Delayed emission viavibration-induced bond scission is also observed. Finally, we compare the MD results with new ToF-SIMSmeasurements performed in the context of this study.
1. Introduction
Organic surfaces, encompassing synthetic polymers, additives,molecular overlayers, biological molecules and tissues, areinvolved in a large number of technologically and medicallyimportant applications. The design and control of these systemsrequire analysis techniques that are sensitive to the chemistryof the outermost surface layer and, if possible, are quantitative.In the past two decades, static secondary ion mass spectrometry(SSIMS), has been successfully applied to solve a variety ofproblems related to such surfaces, as witnessed by the successof the major conference in the field.1 Future improvement ofthe method, however, requires a better understanding of thephysics of organic sputtering.2
Using molecular dynamics (MD) simulations, a good founda-tion of knowledge about the emission processes has been builtfor many systems, including organic overlayers on inorganicsubstrates.3-9 Submonolayers of limited size molecules on heavymetal substrates, even though they constitute rather specificsystems, set the stage for examining organic crystals, largemolecular adsorbates, or thick polymer layers.10 A key differencewith these systems is the two distinct strengths of the interactionat play, that is, strong intramolecular chemical bonds versusweak intermolecular van der Waals forces. In this new context,using the Brenner potential functions (REBO11) for the C-Cand C-H interactions is a significant approximation becausethis potential does not include long-range interactions. Recently,Stuart, Tutein, and Harrison developed the adaptative inter-molecular REBO potential (AIREBO), including both thereactivity of the REBO potential and the long-range van der
Waals interactions.12 This sophisticated potential has alreadybeen used to model the sputtering of solid benzene samples.13
Another implementation of the long-range forces in the frameof the REBO potential has been developed by Beardmore andSmith. This potential has been applied to model the fullerene-induced ejection of molecular species from graphite.14,15
In this paper, we take avantage of the new AIREBO potentialto address various issues related to the sputtering of bulk organicmaterials. These are, for instance, the development of a collisioncascade in a coiled polymeric chain, the possible energy transferinto the vibrational modes of the molecule after a stage of highenergy collisions, the expansion of the excited molecule towardthe vacuum,16 the direct or delayed fragmentation processes,the possible chemical reactions in the excited volume. Inpractice, we model the bombardment of a polystyrene (PS)sample adsorbed on silver by 500 eV Ar atoms. The size of thePS sample, comprising 61 styrene repeat units, has been chosenso that collision cascades can develop in its bulk, with a reducedinfluence of the underlying silver substrate. On the other hand,this size is sufficiently limited to be computationally tractable.The MD simulation results are compared to new experimentaldata and simulations conducted in the binary collision ap-proximation.
2. Methods
2.1. Molecular Dynamics Simulation.The Ar bombardmentof a sec-butyl terminated polystyrene oligomer (Figure 1)adsorbed on a Ag(111) surface is modeled using moleculardynamics (MD) computer simulations. The MD scheme hasbeen described in extensive detail elsewhere.8,17-21 It consistsof integrating Hamilton’s equations of motion to determine the
* Corresponding author. Phone: 32-10-473582; fax: 32-10-473452;e-mail: [email protected].
9474 J. Phys. Chem. B2001,105,9474-9486
10.1021/jp011099e CCC: $20.00 © 2001 American Chemical SocietyPublished on Web 09/11/2001
position and velocity of each particle as a function of time. Theenergy and forces in the system are described by many-bodyinteraction potentials. Experimentally observable properties arecalculated from the final positions, velocities, and masses ofall the ejected species. Mechanistic information is obtained bymonitoring the time evolution of relevant collisional events.
The blend of empirical pairwise and many-body potentialenergy functions used to represent the forces among the variousatoms has been described in previous papers,4,7 except for theadaptative intermolecular potential, AIREBO, developed byStuart and co-workers.12 This potential is based on the reactiveempirical bond-order (REBO) potential developed by Brennerfor hydrocarbon molecules.22,23 To overcome the limitation ofthe REBO potential to short-range interactions, the AIREBOpotential introduces nonbonding interactions through an ad-aptative treatment, which conserves the reactivity of the REBOpotential. In the AIREBO potential, the strength of the inter-molecular forces depends on the local chemical environmentof the atoms. For instance, the repulsive wall that constitutes abarrier for reaction between two methane molecules is loweredor even absent for the corresponding methyl radicals, whichallows them to react. The AIREBO potential has been used inour recent MD studies of the sputtering of solid benzene.13
In the model, two samples of polystyrene oligomers contain-ing 61 repeat units (PS1, PS2) have been synthesized with
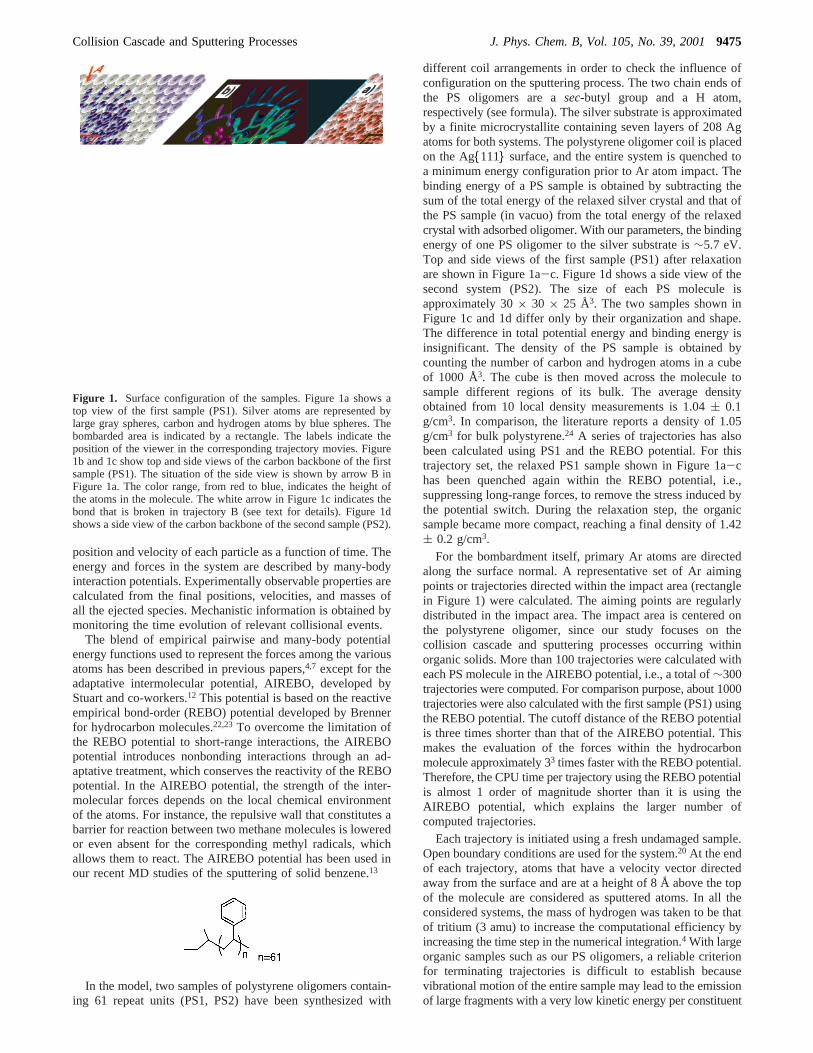
different coil arrangements in order to check the influence ofconfiguration on the sputtering process. The two chain ends ofthe PS oligomers are asec-butyl group and a H atom,respectively (see formula). The silver substrate is approximatedby a finite microcrystallite containing seven layers of 208 Agatoms for both systems. The polystyrene oligomer coil is placedon the Ag{111} surface, and the entire system is quenched toa minimum energy configuration prior to Ar atom impact. Thebinding energy of a PS sample is obtained by subtracting thesum of the total energy of the relaxed silver crystal and that ofthe PS sample (in vacuo) from the total energy of the relaxedcrystal with adsorbed oligomer. With our parameters, the bindingenergy of one PS oligomer to the silver substrate is∼5.7 eV.Top and side views of the first sample (PS1) after relaxationare shown in Figure 1a-c. Figure 1d shows a side view of thesecond system (PS2). The size of each PS molecule isapproximately 30× 30 × 25 Å3. The two samples shown inFigure 1c and 1d differ only by their organization and shape.The difference in total potential energy and binding energy isinsignificant. The density of the PS sample is obtained bycounting the number of carbon and hydrogen atoms in a cubeof 1000 Å3. The cube is then moved across the molecule tosample different regions of its bulk. The average densityobtained from 10 local density measurements is 1.04( 0.1g/cm3. In comparison, the literature reports a density of 1.05g/cm3 for bulk polystyrene.24 A series of trajectories has alsobeen calculated using PS1 and the REBO potential. For thistrajectory set, the relaxed PS1 sample shown in Figure 1a-chas been quenched again within the REBO potential, i.e.,suppressing long-range forces, to remove the stress induced bythe potential switch. During the relaxation step, the organicsample became more compact, reaching a final density of 1.42( 0.2 g/cm3.
For the bombardment itself, primary Ar atoms are directedalong the surface normal. A representative set of Ar aimingpoints or trajectories directed within the impact area (rectanglein Figure 1) were calculated. The aiming points are regularlydistributed in the impact area. The impact area is centered onthe polystyrene oligomer, since our study focuses on thecollision cascade and sputtering processes occurring withinorganic solids. More than 100 trajectories were calculated witheach PS molecule in the AIREBO potential, i.e., a total of∼300trajectories were computed. For comparison purpose, about 1000trajectories were also calculated with the first sample (PS1) usingthe REBO potential. The cutoff distance of the REBO potentialis three times shorter than that of the AIREBO potential. Thismakes the evaluation of the forces within the hydrocarbonmolecule approximately 33 times faster with the REBO potential.Therefore, the CPU time per trajectory using the REBO potentialis almost 1 order of magnitude shorter than it is using theAIREBO potential, which explains the larger number ofcomputed trajectories.
Each trajectory is initiated using a fresh undamaged sample.Open boundary conditions are used for the system.20 At the endof each trajectory, atoms that have a velocity vector directedaway from the surface and are at a height of 8 Å above the topof the molecule are considered as sputtered atoms. In all theconsidered systems, the mass of hydrogen was taken to be thatof tritium (3 amu) to increase the computational efficiency byincreasing the time step in the numerical integration.4 With largeorganic samples such as our PS oligomers, a reliable criterionfor terminating trajectories is difficult to establish becausevibrational motion of the entire sample may lead to the emissionof large fragments with a very low kinetic energy per constituent
Figure 1. Surface configuration of the samples. Figure 1a shows atop view of the first sample (PS1). Silver atoms are represented bylarge gray spheres, carbon and hydrogen atoms by blue spheres. Thebombarded area is indicated by a rectangle. The labels indicate theposition of the viewer in the corresponding trajectory movies. Figure1b and 1c show top and side views of the carbon backbone of the firstsample (PS1). The situation of the side view is shown by arrow B inFigure 1a. The color range, from red to blue, indicates the height ofthe atoms in the molecule. The white arrow in Figure 1c indicates thebond that is broken in trajectory B (see text for details). Figure 1dshows a side view of the carbon backbone of the second sample (PS2).
Collision Cascade and Sputtering Processes J. Phys. Chem. B, Vol. 105, No. 39, 20019475
atom and for extremely long ejection times in comparison withsmaller adsorbed molecules such as benzene.4 On the other hand,considering that a 3 pstrajectory calculated with the AIREBOpotential generally takes 24 h on a IBM-SP node, it would beunreasonable to let all trajectories run for longer time limit.Therefore, we decided to run all trajectories for a minimumduration of 2.5 ps and to monitor the number of atoms abovethe 8 Å boundary as a function of time. Those trajectories forwhich the number of ejected atoms did not saturate after thefirst 2.5 ps were restarted with a longer time. This stepwiseprocedure allows us to run trajectories over a time rangeencompassing the end of the ejection process, yet not computefor lengthy times when no ejection is occurring.
2.2. Secondary Ion Mass Spectrometry (SIMS).Samplesof sec-butyl terminated, deuterated PS oligomers (Mn ) 5300Da) are dissolved in toluene with a concentration of 3× 10⁻³
M. The samples are prepared as thin films cast on 0.25 cm2
silver foils (Goodfellow; 99.95+ % purity), by depositing adroplet of the solution on the supports. Prior to deposition, thesubstrates are etched in 30% highest purity grade sulfuric acid(Vel) for 3 min, then rinsed in water of high-performance liquidchromatography (HPLC) grade from a milli-Q system (Milli-pore) and p.a. grade 2-propanol (Vel).
The secondary ion mass analyses and the KED measurementsare performed in a PHI-EVANS time-of-flight SIMS (TRIFT1) using a 15 keV Ga+ beam.25 The details of the experimentalsetup are described elsewhere. In this particular series ofexperiments, the secondary ions are post-accelerated by a 7.5kV voltage in front of the detector to improve the measuredintensities. ToF-SIMS spectra in the mass range 0< m/z <10000 are obtained from 1200 s acquisitions on a 130× 130µm2 sample area, which corresponds to a fluence of 1.1× 10¹²
ions/cm2, ensuring static bombardment conditions.
3. Results and Discussion
The scope of this article is the elucidation of the collisioncascade, fragmentation and sputtering mechanisms induced byfast atoms in organic materials. The following discussion startswith the description of a typical trajectory. Then, we show theinfluence of the long-range forces and the effect of the moleculeconfiguration on the molecular dynamics. The main section ofthis article is devoted to the explanation of the differentmechanisms inducing PS fragmentation and sputtering. Thesubstrate effect is also investigated. Finally, the simulationresults are compared to recent experimental findings.
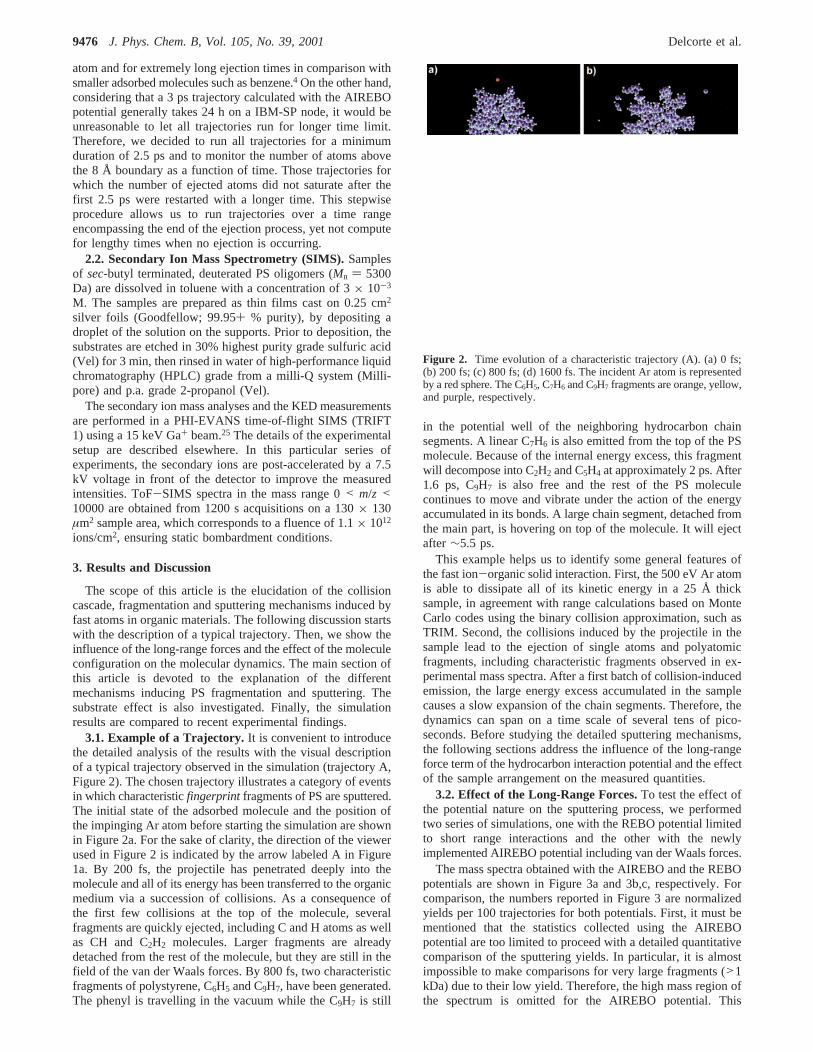
3.1. Example of a Trajectory. It is convenient to introducethe detailed analysis of the results with the visual descriptionof a typical trajectory observed in the simulation (trajectory A,Figure 2). The chosen trajectory illustrates a category of eventsin which characteristicfingerprint fragments of PS are sputtered.The initial state of the adsorbed molecule and the position ofthe impinging Ar atom before starting the simulation are shownin Figure 2a. For the sake of clarity, the direction of the viewerused in Figure 2 is indicated by the arrow labeled A in Figure1a. By 200 fs, the projectile has penetrated deeply into themolecule and all of its energy has been transferred to the organicmedium via a succession of collisions. As a consequence ofthe first few collisions at the top of the molecule, severalfragments are quickly ejected, including C and H atoms as wellas CH and C2H2 molecules. Larger fragments are alreadydetached from the rest of the molecule, but they are still in thefield of the van der Waals forces. By 800 fs, two characteristicfragments of polystyrene, C6H5 and C9H7, have been generated.The phenyl is travelling in the vacuum while the C9H7 is still
in the potential well of the neighboring hydrocarbon chainsegments. A linear C7H6 is also emitted from the top of the PSmolecule. Because of the internal energy excess, this fragmentwill decompose into C2H2 and C5H4 at approximately 2 ps. After1.6 ps, C9H7 is also free and the rest of the PS moleculecontinues to move and vibrate under the action of the energyaccumulated in its bonds. A large chain segment, detached fromthe main part, is hovering on top of the molecule. It will ejectafter ∼5.5 ps.
This example helps us to identify some general features ofthe fast ion-organic solid interaction. First, the 500 eV Ar atomis able to dissipate all of its kinetic energy in a 25 Å thicksample, in agreement with range calculations based on MonteCarlo codes using the binary collision approximation, such asTRIM. Second, the collisions induced by the projectile in thesample lead to the ejection of single atoms and polyatomicfragments, including characteristic fragments observed in ex-perimental mass spectra. After a first batch of collision-inducedemission, the large energy excess accumulated in the samplecauses a slow expansion of the chain segments. Therefore, thedynamics can span on a time scale of several tens of pico-seconds. Before studying the detailed sputtering mechanisms,the following sections address the influence of the long-rangeforce term of the hydrocarbon interaction potential and the effectof the sample arrangement on the measured quantities.
3.2. Effect of the Long-Range Forces.To test the effect ofthe potential nature on the sputtering process, we performedtwo series of simulations, one with the REBO potential limitedto short range interactions and the other with the newlyimplemented AIREBO potential including van der Waals forces.
The mass spectra obtained with the AIREBO and the REBOpotentials are shown in Figure 3a and 3b,c, respectively. Forcomparison, the numbers reported in Figure 3 are normalizedyields per 100 trajectories for both potentials. First, it must bementioned that the statistics collected using the AIREBOpotential are too limited to proceed with a detailed quantitativecomparison of the sputtering yields. In particular, it is almostimpossible to make comparisons for very large fragments (>1kDa) due to their low yield. Therefore, the high mass region ofthe spectrum is omitted for the AIREBO potential. This
Figure 2. Time evolution of a characteristic trajectory (A). (a) 0 fs;(b) 200 fs; (c) 800 fs; (d) 1600 fs. The incident Ar atom is representedby a red sphere. The C6H5, C7H6 and C9H7 fragments are orange, yellow,and purple, respectively.
9476 J. Phys. Chem. B, Vol. 105, No. 39, 2001 Delcorte et al.

limitation is only due to the large amount of CPU time requiredper trajectory calculated with the AIREBO potential, preventinglarger numbers of trajectories to be run. Even for the low massregion shown in Figure 3a and 3b, some of the yield numbersquoted in the following paragraphs for this potential must beconsidered as indicative oftrends rather than precise values.Nevertheless, beside the absolute yield issue, thenature andeven therelatiVe yieldsof fragments detected in both cases arequite similar, as witnessed by the overall shape of the spectrapresented in Figure 3a and 3b. In both cases, the low massfragments (m < 30 Da) dominate strongly, hydrocarbon seriesare observed up to at least 120 Da, and the dominant fragmentin the range 30 Da< m < 120 Da is the phenyl radical, C6H5.
The information concerning the yields of fragments isgathered in Table 1. The values reported in Table 1 (and Figure3a,b) correspond to a truncation of all the trajectories at 2.5 ps.This truncation in time is necessary because the two sets ofsimulations have not been conducted over identical time ranges.To assess the accuracy of the AIREBO values, the convergenceof the yields as a function of the number of trajectories hasbeen tested in each case. Partial and complete results, i.e., theyields for 50, 100, and for the total number of trajectories arereported in Table 1 for the two configurations (PS1 and PS2).In this section, only the yields calculated for the first config-uration (PS1) will be discussed. For the AIREBO/PS1 set, theyield values are almost stable after 100 trajectories (within a10% variation range).
As indicated by the reasonable convergence of the yieldsdescribed above, the smaller statistics with the AIREBOpotential is not the major factor explaining the yield differencebetween the two potentials. For small fragments such as H, C,and C2H2, which exhibit high emission yields, the statistics arecertainly sufficient for a quantitative comparison to be per-formed. Except for hydrogen, the sputtering yield is generallyhigher with the REBO potential. The difference is particularlysignificant for C2H2, whose intensity is reduced by 60% usingthe AIREBO potential. An important reduction (79%) is alsoobserved for C6H5, though the statistics are more questionable.This trend is reflected by the total mass and total number offragments ejected per primary particle (columns 1 and 2 in Table1). Indeed, switching from the REBO potential to the AIREBOpotential reduces the total number of fragments by 28% andthe total mass by 53%, i.e., the change in number correspondsto a much larger change in mass. This observation confirmsthat the yield loss affects mostly high mass fragments. Moreover,our results also show that the dynamics of emission of smallfragments is indeed affected by the choice of the potential, eventhough such fragments mainly result from high-energy colli-sional processes, as will be shown in section 3.4.
The difference between the two potential functions might bedue either to the different structural properties of the moleculeas relaxed in the REBO potential or to the increased intermo-lecular attractive forces themselves. On one hand, the PS1molecule relaxed in the REBO potential (density) 1.42( 0.2g/cm3) is significantly denser than that relaxed in the AIREBOpotential (density) 1.04( 0.1 g/cm3). Because the moleculeis more compact using the REBO potential, the energy deposi-tion in the surface region might be affected, as well as the
TABLE 1: Influence of the Potentials and Initial Conditions on the Yields of Secondary Speciesa
yieldsnumberof traj.
totalmass
totalnumber H C C2H2 C3H3 C6H5
REBOPS11068 117.3 (a) 5.0 (a) 2.1 (a) 0.49 (a) 0.67 (a) 0.04 (a) 0.12 (a)
AIREBOPS1164 55.3 (b) 3.6 (b) 2.2 (b) 0.38 (b) 0.27 (b) 0.02 (b) 0.02 (b)100 58.1 3.8 2.2 0.41 0.26 0.02 0.0250 52.9 3.2 1.9 0.28 0.26 0.0 0.0Diff. %b -53 -28 +2 -23 -60 -56 -79
PS2134 87.2 (c) 4.3 (c) 2.3 (c) 0.31 (c) 0.38 (c) 0.04 (c) 0.08 (c)100 90.2 4.4 2.3 0.32 0.40 0.06 0.0950 83.0 4.3 2.4 0.32 0.36 0.08 0.06PS1+PS2 69.6 3.9 2.2 0.35 0.32 0.03 0.05Diff. %c +58 +17 +4 -17 +41 +145 +237
a The second and third columns indicate the average mass and number of fragments sputtered per incident particle, respectively.b Derived by(b-a)/a× 100. c Derived by (c-b)/b × 100.
Figure 3. Calculated mass spectrum of asec-butyl terminated PS 61-mer adsorbed on Ag{111} under 500 eV Ar atom bombardment(normalized yields per 100 trajectories): (a) low-mass range of thespectrum obtained after 2.5 ps using the AIREBO potential; (b) low-mass range of the spectrum obtained after 2.5 ps using the Brenner(REBO) potential; (c) high-mass range of the spectrum obtained after6 ps using the REBO potential. Although the mass of hydrogen is 3Da (tritium) in the simulation, it is considered as equal to 1 forcomparison with experimental spectra of regular polystyrene.
Collision Cascade and Sputtering Processes J. Phys. Chem. B, Vol. 105, No. 39, 20019477

ejection probability. On the other hand, the sum of the bindingenergies in the relaxed molecule is 2 % larger with the AIREBOthan the REBO potential. This difference might seem negligiblein terms of total potential energy, but we believe it is significantconsidering the sputtering process of polyatomic fragments.Indeed, the emission of fragments generally requires one or twosingle covalent bond-breaking events, for which the bindingenergy increase is actually 2% using the AIREBO potential.But, in addition to the covalent bond(s), the fragment formedin the AIREBO potential has to overcome several additionalvan der Waals interactions, the number of which increases withthe fragment size. In these conditions, the energy required toliberate the fragment can be much larger than that needed inthe REBO potential. This explanation also accounts for theobserved mass effect through the proportional number of vander Waals interactions that must be overcome in order to ejectthe fragment. In that sense, the intermolecular forces act like asupplementary glue between neighboring chain segments in theorganic solid.
3.3. Effect of the Initial Conditions. In this section, weexplore the influence of the PS sample configuration on thenature and yield of sputtered species. The modification of themolecular area scanned by the primary particles for a givensample configuration should also be relevant, but the informationprovided would be redundant. Indeed, with our system, a changeof the impact area also corresponds to scanning a region of thesample that has a different molecular arrangement. Therefore,a pronounced sensitivity to one of these parameters should implya significant sensitivity to the other one as well.
Table 1 compares the yields of fragments measured for thetwo PS arrangements (Figure 1c and 1d). The overall yieldvalues for the two systems (PS1+PS2) in the AIREBO potentialare indicated for information. The convergence of the yieldshas been also tested for the second configuration, PS2. Again,most of the yields converge quickly, despite the small numberof trajectories calculated. The yields obtained for the first 50trajectories are indeed very close to the final values. Therefore,we believe that the differences observed between PS1 and PS2are significant in most cases and that they relate to the differentarrangements of the two samples with respect to the target area.
Hydrogen atoms exhibit similar yields, irrespective of themolecular arrangement. In the case of C atoms, a definitiveconclusion cannot be drawn because the convergence is not verygood for PS1. In addition to these two atomic species, all thespecific yields of fragments as well as the total number offragments and the total mass per primary particle are signifi-cantly different for the two molecular configurations. Forinstance, the ejected mass is 58% higher with the second system.These numbers show that the emission of fragments is largelydependent on the molecular configuration sampled by theprimary particle. A practical consequence is that the SIMSrelative intensities should be different for samples made ofidentical molecules adsorbed with different orientations ondifferent substrates.26
Another indication of the influence of the molecule shapeon the surface is given by the high mass range of the spectrumof PS1 obtained using the REBO potential (Figure 3c). Beyond0.5 kDa, there is only one series of peaks, in the range 1-1.5kDa, with a significant intensity. The mass analysis shows thatthese peaks correspond mostly to the formulas Mx and Mx(CHwith 11 e x e 14 and M being the styrene repeat unit. A closerlook at the PS1 sample arrangement on the surface (Figure 1band 1c) indicates that the precursor of these fragments is thetop segment of the oligomer, containing the chain end. This
segment forms a half ring lying on top of the sample (blue-green). The other end of the segment is located in the bombardedregion. Following the chosen aiming point, the primary particlebreaks C-C bonds in this chain segment to form fragmentswith 11 to 14 styrene repeat units. In contrast, large fragmentswith less than 11 or more than 14 repeat units are almost absentof the spectrum, mainly because the C-C bond that must bebroken to release them is not directly located in the target area.Our analysis of the high mass fragments thus shows that boththe particular chain arrangement and the target area play a majorrole concerning the nature of the observed fragments.
3.4. Mechanisms.According to their characteristic time andenergy, the processes occurring in the bombarded PS samplebelong to two categories, an early atomic-like collision cascadephase and a late molecular motion phase. The existence of bothtypes of processes has been suggested in the first place by thedescription of trajectory A. The first category covers what isusually referred to as thecollision cascadeitself in the literatureand the ejection of fragments directly induced by fast movingatoms. Themolecularprocesses take place at longer times, whenthe primary particle energy is distributed almost equally amonga large number of atoms in the molecule, i.e., after cooling ofthe atomic cascade. After the analysis of these categories ofmechanisms, the influence of the silver substrate on thedynamics is considered.
3.4.1. Atomic Collision Cascade.The first part of the fastatom-organic target interaction corresponds to the developmentof the atomic collision cascade in the solid. In relation withorganic materials, atomic collision cascade and collision inducedejection have been observed for overlayers of various moleculeson metal surfaces.4-8 In contrast to these samples in which themajority of the collision cascade takes place in the substrate, inour system the collision cascade develops directly in the organicmedium. Fingerprints of characteristic collision cascades areillustrated in Figure 4, using “collision trees”.9,27 In thisrepresentation, the atoms at rest are represented by black dots
Figure 4. Collision trees of the first 100 fs of the interaction for fourcharacteristic trajectories. The successive positions of the recoil atomsare indicated by colored spheres, provided that they are set in motionwith more than 10 eV of energy. They are turned off when their energydrops below 5 eV.
9478 J. Phys. Chem. B, Vol. 105, No. 39, 2001 Delcorte et al.
and the atoms that receive 10 eV or more kinetic energy via acollision are shown as colored spheres. The colored spheres areturned off when the kinetic energy of the atoms drops below 5eV. The collision trees summarize the successive positions ofthe moving atoms over the first 100 fs of the interaction. Theoverall aspect of the trees is not strongly dependent on theconsidered interaction time beyond 100 fs. Therefore, 100 fscan be considered as a characteristic time for the developmentof atomic cascades in the case of 500 eV Ar bombardment ofpolystyrene.
The collision trees illustrated in the four vignettes of Figure4 exhibit common as well as distinctive features. The firstvignette corresponds to trajectory A, described in section 3.1and Figure 2. For 500 eV Ar bombardment, Figure 4 showsthat the cascades are mostly composed of atoms hit directly bythe primary Ar atom (yellow spheres) with a small fraction ofatoms subsequently hit. In comparison, collision trees observedunder 5 keV bombardment exhibit, on average, much morebranching.9 In contrast with heavy metal targets, one of thecommon characteristics of these four trees is that the trajectoryof the argon atom (yellow sphere) is essentially not deflectedby the numerous collisions with carbon and hydrogen atoms,which is an effect of the mass ratio between the projectile andthe target atoms. As a consequence, there is no backscatteringdue to the organic material and the reflection of energy towardthe surface, if any, is not operated via the primary particle. Thecollision cascade keeps the memory of the projectile trajectoryin that most of the subcascades are downward directed. In somecases, the atomic collision cascade is even unable to providethe upward momentum required for fragment ejection. For thisreason, we can already state that the efficiency of 500 eV Aratom bombardment for organic material sputtering is relativelylow. The lateral orientation observed for several recoil atomtracks and the ejection of atoms through the sides of the samplesuggests that lateral motion is an important factor. In fact, fora molecule with this shape, we observe more lateral ejection offragments than “true” sputtering, i.e., emission toward thevacuum.
In addition to common features, the trajectories related toFigure 4 also exhibit specifics. For instance, branching can occureither at the top (tree A) or at the bottom of the PS sample(tree C). A quick partitioning of the energy at the top of thesample (A) may lead to the efficient emission of smallpolyatomic fragments, as seen in section 3.1, while branchingat the bottom of the sample (C) induces lateral ejection,disintegration of the sample, and, sometimes, large backbonesegment ejection (see section 3.4.3, Table 2). In comparison,tree B shows very few atomic displacements. We describe insection 3.4.2 why these are good conditions for the emissionof very large fragments. Finally, tree D indicates that efficientreflection of the energy via the cascade can occur when itreaches the silver substrate (see section 3.4.5). These specificsof the atomic collision cascades are detailed along the discussion.
The comparison between the snapshots of the simulationdescribed in Figure 2 and tree A provides information aboutthe emission of fragments induced by the atomic cascade. Inthis trajectory, the Ar atom dissipates about 220 eV in the first15 fs, through the first series of collisions occurring in the toppart of the sample, which is a quite unique situation with respectto the other cases shown in Figure 4. This important energytransfer induces multiple bond-breaking and leads to bothsideways and upward ejection of fragments. In that sense,trajectory A constitutes an exception to the generally lowsputtering efficiency mentioned in the previous paragraph. The
sputtered C6H5 and C9H7 (Figure 2c and 3d) leave with 2.5 and4.1 eV of kinetic energy, respectively, while the atomic andsmall molecular species ejected sideways carry more kineticenergy. Details concerning the ejected fragments are summarizedin Table 2. The movie of the simulation shows quite clearlythat the ejection of such polyatomic fragments is a byproductof the hard collision between the primary particle and a directneighbor of the fragment to be ejected. In other words, theprimary Ar atom kicks off a carbon atom of the chain and, viathis interaction, the fragment is set free (at least on one end)with only a few eV of kinetic energy. This mechanism is quitesimilar to that already reported for small polystyrene tetramersadsorbed on silver.8
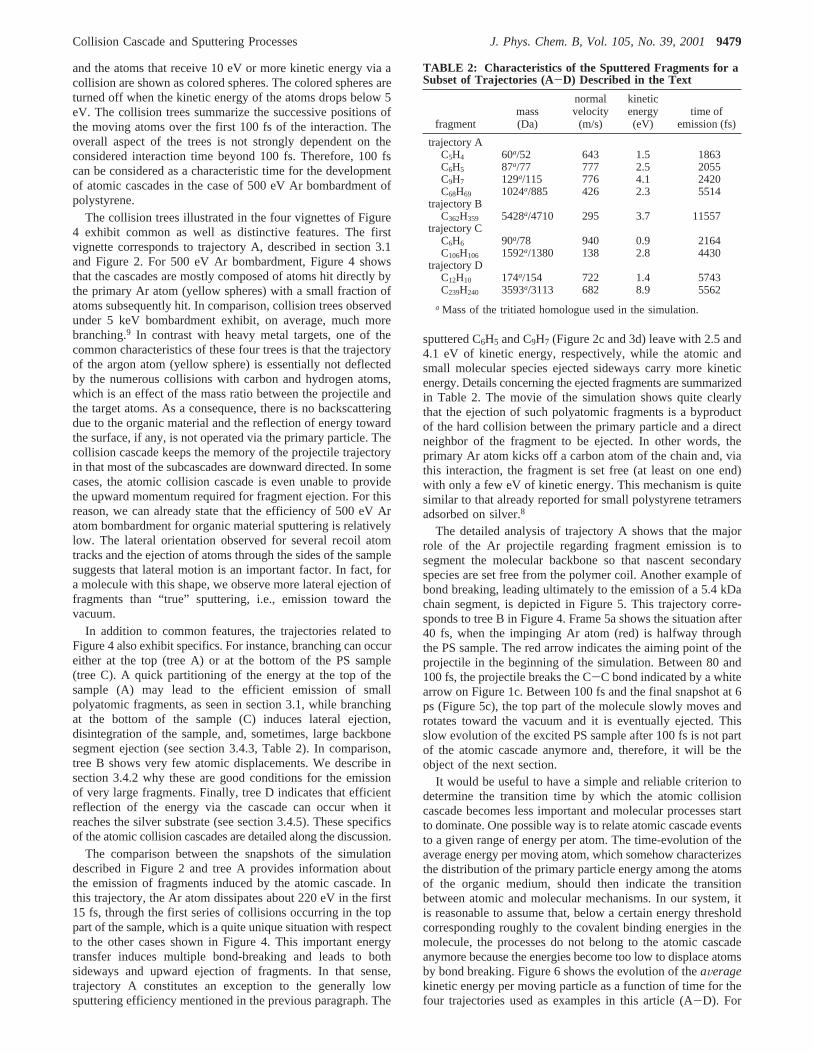
The detailed analysis of trajectory A shows that the majorrole of the Ar projectile regarding fragment emission is tosegment the molecular backbone so that nascent secondaryspecies are set free from the polymer coil. Another example ofbond breaking, leading ultimately to the emission of a 5.4 kDachain segment, is depicted in Figure 5. This trajectory corre-sponds to tree B in Figure 4. Frame 5a shows the situation after40 fs, when the impinging Ar atom (red) is halfway throughthe PS sample. The red arrow indicates the aiming point of theprojectile in the beginning of the simulation. Between 80 and100 fs, the projectile breaks the C-C bond indicated by a whitearrow on Figure 1c. Between 100 fs and the final snapshot at 6ps (Figure 5c), the top part of the molecule slowly moves androtates toward the vacuum and it is eventually ejected. Thisslow evolution of the excited PS sample after 100 fs is not partof the atomic cascade anymore and, therefore, it will be theobject of the next section.
It would be useful to have a simple and reliable criterion todetermine the transition time by which the atomic collisioncascade becomes less important and molecular processes startto dominate. One possible way is to relate atomic cascade eventsto a given range of energy per atom. The time-evolution of theaverage energy per moving atom, which somehow characterizesthe distribution of the primary particle energy among the atomsof the organic medium, should then indicate the transitionbetween atomic and molecular mechanisms. In our system, itis reasonable to assume that, below a certain energy thresholdcorresponding roughly to the covalent binding energies in themolecule, the processes do not belong to the atomic cascadeanymore because the energies become too low to displace atomsby bond breaking. Figure 6 shows the evolution of theaVeragekinetic energy per moving particle as a function of time for thefour trajectories used as examples in this article (A-D). For
TABLE 2: Characteristics of the Sputtered Fragments for aSubset of Trajectories (A-D) Described in the Text
fragmentmass(Da)
normalvelocity(m/s)
kineticenergy(eV)
time ofemission (fs)
trajectory AC5H4 60a/52 643 1.5 1863C6H5 87a/77 777 2.5 2055C9H7 129a/115 776 4.1 2420C68H69 1024a/885 426 2.3 5514
trajectory BC362H359 5428a/4710 295 3.7 11557
trajectory CC6H6 90a/78 940 0.9 2164C106H106 1592a/1380 138 2.8 4430
trajectory DC12H10 174a/154 722 1.4 5743C239H240 3593a/3113 682 8.9 5562
a Mass of the tritiated homologue used in the simulation.
Collision Cascade and Sputtering Processes J. Phys. Chem. B, Vol. 105, No. 39, 20019479
one of the trajectories, the maximum kinetic energy possessedby any atom is represented by vertical bars. Assuming that thethreshold for individual atomic motion is of the order of thebond strength in the molecule, e.g.∼5 eV, we estimate the timeto be 100-300 fs. During this time period, the collision cascadeis transforming from a regime dominated by atomic-likecollisions into one that is controlled by molecular motions.
3.4.2. Molecular Motion and Vibrations.The movies of thetrajectories and the kinetic energy curves of Figure 6 indicatethat molecular processes dominate after 300 fs. Trajectory Bconstitutes a good basis to explore such processes. Between thebond scission at∼100 fs, already described in section 3.4.1,and the state of the sample after 1 ps (Figure 5b), very little
change occurs, other than the slow rotation of the energizedchain end generated by the bond breaking. During the nextpicoseconds, the large chain segment drifts slowly toward thevacuum without any more bond scission. The slow upwardmotion is accompanied by a marked change of the fragmentshape. This large fragment corresponds to the formula C362H359,and its mass, considering that we used tritium instead ofhydrogen in the simulation, is 5428 Da (Table 2). The emissionof large-chain segments is commonly observed in other trajec-tories and the measured kinetic energies are, in general,comparable. Nevertheless, the genesis of such fragment ejectionis unclear. Indeed, the collision that causes the bond breakingat 100 fs is not the driving force of the ejection because theinternal energy of the fragment is∼120 eV, which is more than1 order of magnitude greater than the energy transferred in thatparticular collision (6 eV).
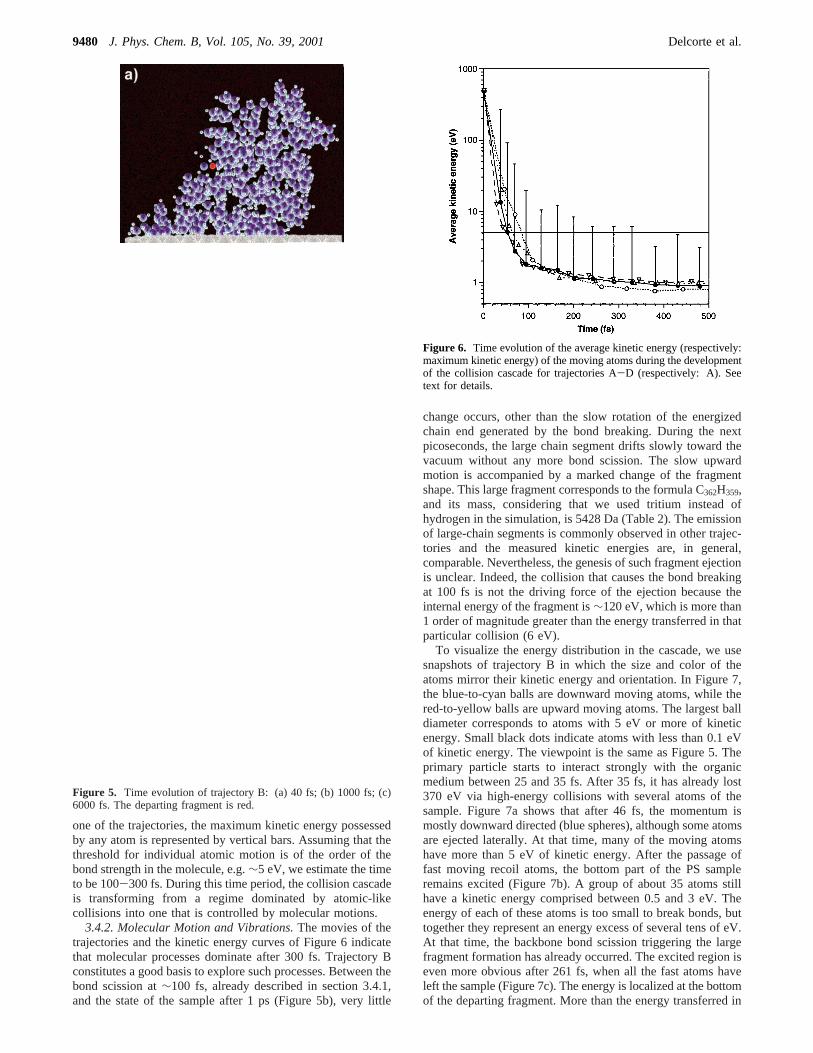
To visualize the energy distribution in the cascade, we usesnapshots of trajectory B in which the size and color of theatoms mirror their kinetic energy and orientation. In Figure 7,the blue-to-cyan balls are downward moving atoms, while thered-to-yellow balls are upward moving atoms. The largest balldiameter corresponds to atoms with 5 eV or more of kineticenergy. Small black dots indicate atoms with less than 0.1 eVof kinetic energy. The viewpoint is the same as Figure 5. Theprimary particle starts to interact strongly with the organicmedium between 25 and 35 fs. After 35 fs, it has already lost370 eV via high-energy collisions with several atoms of thesample. Figure 7a shows that after 46 fs, the momentum ismostly downward directed (blue spheres), although some atomsare ejected laterally. At that time, many of the moving atomshave more than 5 eV of kinetic energy. After the passage offast moving recoil atoms, the bottom part of the PS sampleremains excited (Figure 7b). A group of about 35 atoms stillhave a kinetic energy comprised between 0.5 and 3 eV. Theenergy of each of these atoms is too small to break bonds, buttogether they represent an energy excess of several tens of eV.At that time, the backbone bond scission triggering the largefragment formation has already occurred. The excited region iseven more obvious after 261 fs, when all the fast atoms haveleft the sample (Figure 7c). The energy is localized at the bottomof the departing fragment. More than the energy transferred in
Figure 5. Time evolution of trajectory B: (a) 40 fs; (b) 1000 fs; (c)6000 fs. The departing fragment is red.
Figure 6. Time evolution of the average kinetic energy (respectively:maximum kinetic energy) of the moving atoms during the developmentof the collision cascade for trajectories A-D (respectively: A). Seetext for details.
9480 J. Phys. Chem. B, Vol. 105, No. 39, 2001 Delcorte et al.
the bond scission described above, the energy stored in the bondsof the nascent fragment is the actual driving force of the ejectionprocess. The last vignette (d) of Figure 7 shows that, after 2.9ps, the internal excitation distributes over the entire fragment,which is nearly ejected.
This analysis allows us to identify the atomic collision cascadeas the trigger for fragmentation and energy distribution in theorganic sample, and subsequent collective motions at themolecular scale as the medium by which fragments aretransferred from the surface to the vacuum. The physical linkbetween the atomic cascade stage and the molecular motionstage, and the exact nature of the collective interaction involved,however, remains elusive. In their recent paper concerning thebombardment of crystalline benzene, the results of Krantzmanet al.13 suggest that the initial atomic cascade becomes amolecular cascade after the first few hundred femtoseconds, atime at which entire benzene molecules and fragments seem toplay the role of recoil particles in the cascade. In comparisonwith solid benzene, our system is different in that the entireorganic material is interconnected via covalent C-C bonds.Even though they are very similar to benzene molecules fromthe chemical viewpoint, the phenyl building blocks of ourpolystyrene are all strongly attached to the flexible backboneof the molecule. Therefore, the physics underlying polyatomicspecies emission might be different in our system.
In addition to a molecular cascade where, as defined above,small quasi-molecular entities transfer their energy via collisionswith their neighbors, another extreme case of interaction wouldbe a purely vibrational excitation of the molecular bonds,eventually leading to fragment ejection through action/reactionbetween the excited entity and the surrounding medium. Incontrast with the concept of molecular cascade, a purelyvibrational excitation is characterized by the collective butdissimilar motion of several atoms. In turn, the instant velocityvectors of moving neighbor atoms should not have the same
orientation and amplitude. Also, as a function of time, thevariation of these velocity vectors should be out-of-phase. Thisdefinition suggests that the study of the atom velocities in thesample constitutes an adequate means to reveal the physicalmechanism of the molecular stage of organic sputtering.
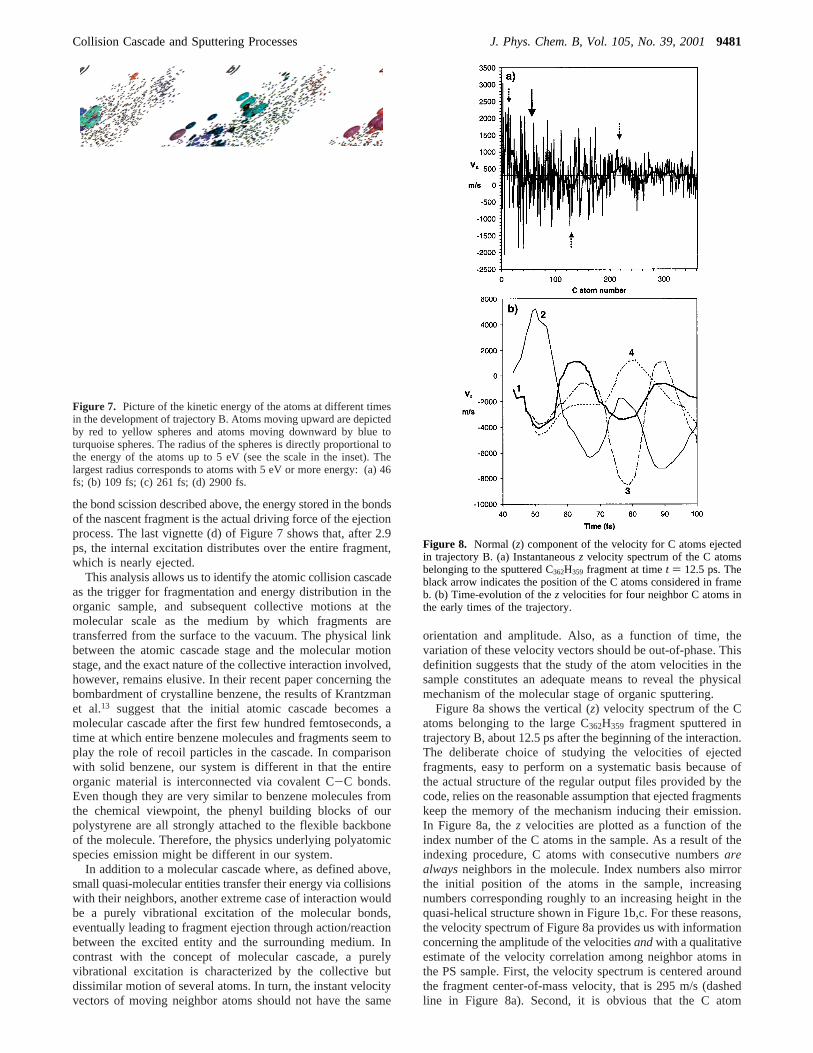
Figure 8a shows the vertical (z) velocity spectrum of the Catoms belonging to the large C362H359 fragment sputtered intrajectory B, about 12.5 ps after the beginning of the interaction.The deliberate choice of studying the velocities of ejectedfragments, easy to perform on a systematic basis because ofthe actual structure of the regular output files provided by thecode, relies on the reasonable assumption that ejected fragmentskeep the memory of the mechanism inducing their emission.In Figure 8a, thez velocities are plotted as a function of theindex number of the C atoms in the sample. As a result of theindexing procedure, C atoms with consecutive numbersarealwaysneighbors in the molecule. Index numbers also mirrorthe initial position of the atoms in the sample, increasingnumbers corresponding roughly to an increasing height in thequasi-helical structure shown in Figure 1b,c. For these reasons,the velocity spectrum of Figure 8a provides us with informationconcerning the amplitude of the velocitiesandwith a qualitativeestimate of the velocity correlation among neighbor atoms inthe PS sample. First, the velocity spectrum is centered aroundthe fragment center-of-mass velocity, that is 295 m/s (dashedline in Figure 8a). Second, it is obvious that the C atom
Figure 7. Picture of the kinetic energy of the atoms at different timesin the development of trajectory B. Atoms moving upward are depictedby red to yellow spheres and atoms moving downward by blue toturquoise spheres. The radius of the spheres is directly proportional tothe energy of the atoms up to 5 eV (see the scale in the inset). Thelargest radius corresponds to atoms with 5 eV or more energy: (a) 46fs; (b) 109 fs; (c) 261 fs; (d) 2900 fs.
Figure 8. Normal (z) component of the velocity for C atoms ejectedin trajectory B. (a) Instantaneousz velocity spectrum of the C atomsbelonging to the sputtered C362H359 fragment at timet ) 12.5 ps. Theblack arrow indicates the position of the C atoms considered in frameb. (b) Time-evolution of thez velocities for four neighbor C atoms inthe early times of the trajectory.
Collision Cascade and Sputtering Processes J. Phys. Chem. B, Vol. 105, No. 39, 20019481

velocities are often much larger than the center-of-mass velocity,especially in the lower-half of the fragment, where they can bealmost an order of magnitude higher. Third, and most impor-tantly, the spectrum is characterized by a very pronouncedvariation of thez velocities between neighbors, most of thepaired neighbors moving in opposite directions with respect tothe z axis. Fourth, the decreasing amplitude of the oscillationswith increasing index number indicates that the delocalizationof the internal energy is still incomplete after 12.5 ps, the bottompart of the fragment remaining more excited than the top part.Finally, the moving average of the velocities (thick line) pointsto the existence of domains in the molecule whose local centers-of-mass are slower or faster than the overall center-of-massvelocity (dashed arrows). However, the second and thirdcomments also apply to these restricted domains.
The second and third observations suggest that the nature ofthe collective motion giving rise to large fragment ejectionrelates more to the above concept of vibrational excitation asopposed to that of molecular cascade. Nevertheless, the finalobservation supports the idea that there is a weak correlationbetween atomic motions in several parts of the molecule. Forinstance, this is true for the rotating chain end of the fragment(Figure 5). Similar observations and conclusions are generallytrue for large fragments sputtered in the simulation.
For trajectory B, we also analyzed the initial state of thedeparting fragment. Figure 8b shows the time evolution of thez velocity vectors of four C atoms that are neighbors in thenascent fragment, from the time they are set in motion (40 fs)until a time of 100 fs. Geometrically, atoms 1-4 are aligned ina row in the sample, so that atom 2 is surrounded by atoms 1and 3 and atom 3 by atoms 2 and 4. They all start moving at anapproximate time of 42 fs, as a result of the passage of the Aratom in their vicinity (see the description of Figure 7). Atoms1, 3, and 4 first move downward while atom 2 moves upward.Over the time span encompassed in Figure 8b, these atomvelocities oscillate between positive and negative values, withthe velocity of direct neighbors almost being of opposite phase.Therefore, we can state that the vibrational nature of thecollective motion is established in the first few femtosecondsfollowing its induction by the atomic collision cascade. As wasassumed, the final state of the ejected fragment mirrors the earlystage of collective motion in the bombarded molecule.
The exact shape of the collision tree (Figure 4) and the sizeof the ejected fragments vary for different trajectories (seeFigures 2 and 5 and Table 2). Regardless of the specifics, thebombardment generally induces a localized vibrational excitationof the molecular bonds after the atomic cascade phase of theatom-solid interaction. This excitation is long-lived, becausethe energy excess per bond is generally too low to be releasedvia bond breaking. With time, the excitation energy tends todelocalize over the whole PS sample or fragment, provided thatit constitutes an interconnected network of covalent bonds. Theenergy stored in the sample or fragment leads oftentimes to itsswelling or even to its ejection. In some instances, it can alsoinduce unimolecular decomposition reactions, as described inthe next section.
3.4.3. Unimolecular Decomposition Reactions.In SIMS oforganic materials, unimolecular decomposition of ejected frag-ments is a well-established phenomenon. Metastable decay ofexcited secondary ionsin theVacuumis experimentally observedin time-of-flight spectrometers including either ion mirrors orelectrostatic analyzers.28-31 On the other hand, the decomposi-tion of excited organic moleculeson the surfacecannot be
assessed by experimental means. In this domain, MD simula-tions provide useful predictions and insights.
Figure 9 describes a trajectory in which a linear C6H6
fragment is formed via unimolecular dissociation of the excitedPS sample (trajectory C) before the larger fragment ejects (Table2). The collision tree of trajectory C is depicted in Figure 4.Figure 9a presents a close-up view of the sample top left partat 750 fs. This region has been damaged by the projectile anda linear chain segment is dangling into the vacuum. The whitearrow in Figure 9a points to the C-C bond that is going tobreak between 750 fs and 1 ps. After 1 ps, the linear C6H6
fragment is ejected but unstable,8 with 14.2 eV of internal energy(Figure 9b). To our knowledge, it is the first time that theformation of secondary species via unimolecular dissociationof excited moleculesbeforeejection is reported. Such a processcould not be identified in our previous study of small polystyrenetetramers, where the ejection of fragments was mostly due toatomic collision mechanisms.8 This result allows us to predictthat vibration-induced fragmentation, caused by an energyexcess in the backbone bonds, should be significant for largeorganic molecules and polymers bombarded by keV ions.
3.4.4. Recombination and Rearrangement Reactions.Otherreaction pathways might coexist in addition to vibration-induceddecomposition of the organic sample on the surface andmetastable decay of ejected fragments. Of crucial importancefor SIMS analysis are the possible recombination and rear-rangement reactions supposed to occur through the emissionprocess.32-34 In particular, extensive recombination reactionswould be a major problem since such reactions scramble thestructural information provided by the mass spectrum. Below
Figure 9. Close-up views of the time evolution of trajectory C. (a)750 fs; the white arrow points to the C-C bond that will be severedby vibrations. (b) 1000 fs. The nascent C6H6 is red.
9482 J. Phys. Chem. B, Vol. 105, No. 39, 2001 Delcorte et al.

we delineate these issues using the detailed information onejected fragments present in the simulation results.
To perform a systematic study of the recombination andrearrangement reactions occurring in the course of the emissionprocess, the lists of neighbors of each C atom belonging to thesputtered fragments are compared to their original neighborsin the relaxed PS sample, prior to emission. Hydrogen captureor hydrogen exchange reactions are not discussed here for tworeasons. First, they have already been investigated in previouspapers for the cases of adsorbed alkyl chains35 and styrenetetramers8 and, second, their consequences for the interpretationof experimental mass spectra are much less dramatic. Changesin the C atom neighbor lists can either show the association ofatoms or fragments that were initially apart in the sample(recombination) or the exchange of atomic positions in theconsidered molecular segments (rearrangement), possibly lead-ing to a different structure.
The information concerning recombination reactions is sum-marized in Table 3 for the results using the AIREBO interactionpotential. When it is appropriate, the fraction assigned to eachfragment shows the number of those species formed via arecombination process divided by their total number in thesimulation set. There are also fragments for which no recom-bination reactions are observed (“none” in Table 3). The resultsindicate that recombination reactions are significant for verysmall fragments (C2-C2H2), and more so for hydrogen-deficientfragments. Beyond 40 Da, they constitute rare events. In therange 100-200 Da, only one fragment out of twelve arises froma recombination process involving two smaller fragments. Inthat particular case, the final product is a C9H7, formed by theassociation of a C2H2 and a C7H5. The initial and final situationsare depicted in Scheme 1. The hatched spheres correspond toC atoms that do not belong to the final fragment. Note that theformation of this C9H7 fragment requires four C-C bondscissions, the elimination of a H atom and the creation of anew C-C bond. The dynamics of the trajectory shows that therecombination reaction occurs at a time when the two fragmentsare still within the interaction range of the remaining system.
Although rearrangement reactions are not predominant, theyalso occur during the cascade development, the sputteringprocess or even after emission. In this context, a rearrangementreaction is defined by a change of the neighbor lists of C atomsthat were already interconnected in the sample prior to emission,but with a different order. An example of rearrangement reactionconcomitant with emission is described in Scheme 2. The initialchain segment comprises four styrene repeat units bound to the
rest of the molecule at both ends. In the course of the sputteringprocess, one carbon atom and one phenyl ring are eliminated,and the two C-C bonds linking the segment to the sample aresevered. Furthermore, in parallel with the bond scissions, atom1 and the atom pair 2-3 swap positions in the chain, whereasthe phenyl-containing atom 5 disconnects from atom 4 and bindswith atom 6. Such a gross structural change is possible onlybecause the internal energy of the chain segment is high. Dueto its internal excitation, the fragment described in Scheme 2has a very low probability to survive beyond a nanosecondwithout undergoing further fragmentation reaction.
In conclusion, recombination and rearrangement reactions areobserved in the simulation. Nevertheless, for the SIMS user,the fact that very few fragments with a mass of more than 40Da arise from such reactions is reassuring. In this respect, MDsimulations support the concept of structural specificity of theSIMS analysis.
3.4.5. Substrate Effect.It has been mentioned that the collisioncascade caused by the Ar projectile could in some instances bepartially reflected by the silver substrate. This mechanism isillustrated by the collision tree of trajectory D (Figure 4). Inthis trajectory, the primary particle plunges through the top partof the polystyrene sample without strong interaction with thesurrounding medium and dissipates most of its energy a fewAngstroms above the metal surface. Several of the recoil carbonatoms are backscattered by the silver plane, and a few silveratoms are displaced in the process. Figure 10 shows threesnapshots of trajectory D. The influence of the momentumreflection at the PS-metal interface is not yet obvious at 750fs. Nevertheless, at this time, the energy is already stored inthe right part of the PS sample which starts moving upward.After 2 ps, the influence of the reflected energy is evident andthe organic material is expanding toward the vacuum. As wasobserved for trajectory B, the early collision-induced bondscissions lead to the sputtering of the top part of the sampleafter a few picoseconds (Figure 10c).
Because of the relatively small number of calculated trajec-tories, it is difficult to extract quantitative information on theinfluence of the PS-silver interface using MD simulations. Toobtain complementary statistics concerning the effect of theinterface, TRIM calculations36,37 have been performed using asample constituted of a 25 Å overlayer of hydrocarbon materialmimicking polystyrene on top of a thicker layer of silver. Thepseudo-organic layer, provided by the compound library of the
TABLE 3: Fraction of the Ejected Fragments Formed via Recombination Reactions
C2 C2H C2H2 C5H C5H3 C4H4 C5H5 C6H5 C6H6 C7H6 100-200 Da > 500 Da
5/10 12/48 5/952/10 none none none none none none 1/12 none
(50%) (25%) (5%)
SCHEME 1: Recombination Reaction Leading to theFormation of a C9H7 Fragment
SCHEME 2: Rearrangement Reaction in a C24H18Fragment
Collision Cascade and Sputtering Processes J. Phys. Chem. B, Vol. 105, No. 39, 20019483
software, has the stoichiometric C:H ratio and the density (1.06g/cm3) of PS. TRIM assumes different displacement energiesfor the C, H, and Ag atoms, which mirror the bond strengths inthe solid. Of course, due to the binary collision approximation,cooperative and vibrational effects are completely neglected.Therefore, TRIM gives, at best, a frozen image of the sampleafter the atomic cascade stage of the interaction. This partialview is reasonable if the atomic and collective motion stagesof the interaction are decoupled. Out of prudence, we limit ouranalysis of the TRIM results to the depth distribution ofprojectiles and recoil atoms in the solid. The collision trees(Figure 4) and the average energy vs time curves (Figure 6)show that these distributions are established in the first fewhundred femtoseconds of the interaction, mostly before the onsetof collective vibrational motions.
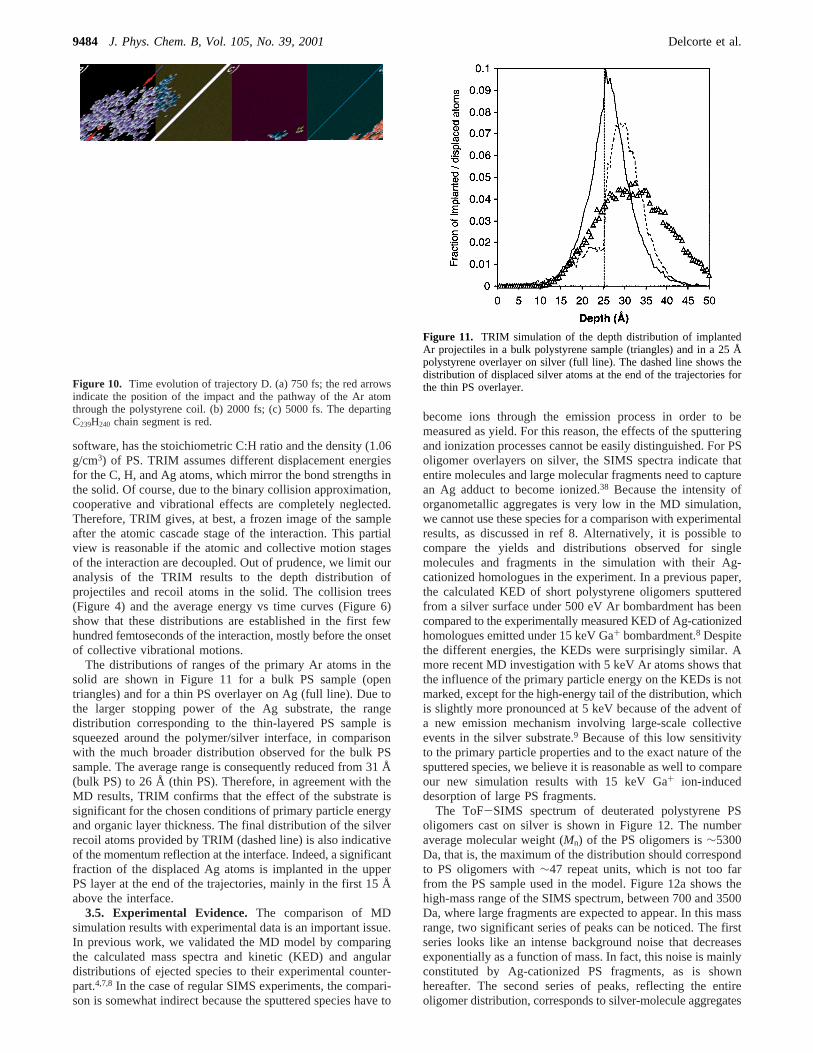
The distributions of ranges of the primary Ar atoms in thesolid are shown in Figure 11 for a bulk PS sample (opentriangles) and for a thin PS overlayer on Ag (full line). Due tothe larger stopping power of the Ag substrate, the rangedistribution corresponding to the thin-layered PS sample issqueezed around the polymer/silver interface, in comparisonwith the much broader distribution observed for the bulk PSsample. The average range is consequently reduced from 31 Å(bulk PS) to 26 Å (thin PS). Therefore, in agreement with theMD results, TRIM confirms that the effect of the substrate issignificant for the chosen conditions of primary particle energyand organic layer thickness. The final distribution of the silverrecoil atoms provided by TRIM (dashed line) is also indicativeof the momentum reflection at the interface. Indeed, a significantfraction of the displaced Ag atoms is implanted in the upperPS layer at the end of the trajectories, mainly in the first 15 Åabove the interface.
3.5. Experimental Evidence. The comparison of MDsimulation results with experimental data is an important issue.In previous work, we validated the MD model by comparingthe calculated mass spectra and kinetic (KED) and angulardistributions of ejected species to their experimental counter-part.4,7,8 In the case of regular SIMS experiments, the compari-son is somewhat indirect because the sputtered species have to
become ions through the emission process in order to bemeasured as yield. For this reason, the effects of the sputteringand ionization processes cannot be easily distinguished. For PSoligomer overlayers on silver, the SIMS spectra indicate thatentire molecules and large molecular fragments need to capturean Ag adduct to become ionized.38 Because the intensity oforganometallic aggregates is very low in the MD simulation,we cannot use these species for a comparison with experimentalresults, as discussed in ref 8. Alternatively, it is possible tocompare the yields and distributions observed for singlemolecules and fragments in the simulation with their Ag-cationized homologues in the experiment. In a previous paper,the calculated KED of short polystyrene oligomers sputteredfrom a silver surface under 500 eV Ar bombardment has beencompared to the experimentally measured KED of Ag-cationizedhomologues emitted under 15 keV Ga+ bombardment.8 Despitethe different energies, the KEDs were surprisingly similar. Amore recent MD investigation with 5 keV Ar atoms shows thatthe influence of the primary particle energy on the KEDs is notmarked, except for the high-energy tail of the distribution, whichis slightly more pronounced at 5 keV because of the advent ofa new emission mechanism involving large-scale collectiveevents in the silver substrate.9 Because of this low sensitivityto the primary particle properties and to the exact nature of thesputtered species, we believe it is reasonable as well to compareour new simulation results with 15 keV Ga+ ion-induceddesorption of large PS fragments.
The ToF-SIMS spectrum of deuterated polystyrene PSoligomers cast on silver is shown in Figure 12. The numberaverage molecular weight (Mn) of the PS oligomers is∼5300Da, that is, the maximum of the distribution should correspondto PS oligomers with∼47 repeat units, which is not too farfrom the PS sample used in the model. Figure 12a shows thehigh-mass range of the SIMS spectrum, between 700 and 3500Da, where large fragments are expected to appear. In this massrange, two significant series of peaks can be noticed. The firstseries looks like an intense background noise that decreasesexponentially as a function of mass. In fact, this noise is mainlyconstituted by Ag-cationized PS fragments, as is shownhereafter. The second series of peaks, reflecting the entireoligomer distribution, corresponds to silver-molecule aggregates
Figure 10. Time evolution of trajectory D. (a) 750 fs; the red arrowsindicate the position of the impact and the pathway of the Ar atomthrough the polystyrene coil. (b) 2000 fs; (c) 5000 fs. The departingC239H240 chain segment is red.
Figure 11. TRIM simulation of the depth distribution of implantedAr projectiles in a bulk polystyrene sample (triangles) and in a 25 Åpolystyrene overlayer on silver (full line). The dashed line shows thedistribution of displaced silver atoms at the end of the trajectories forthe thin PS overlayer.
9484 J. Phys. Chem. B, Vol. 105, No. 39, 2001 Delcorte et al.
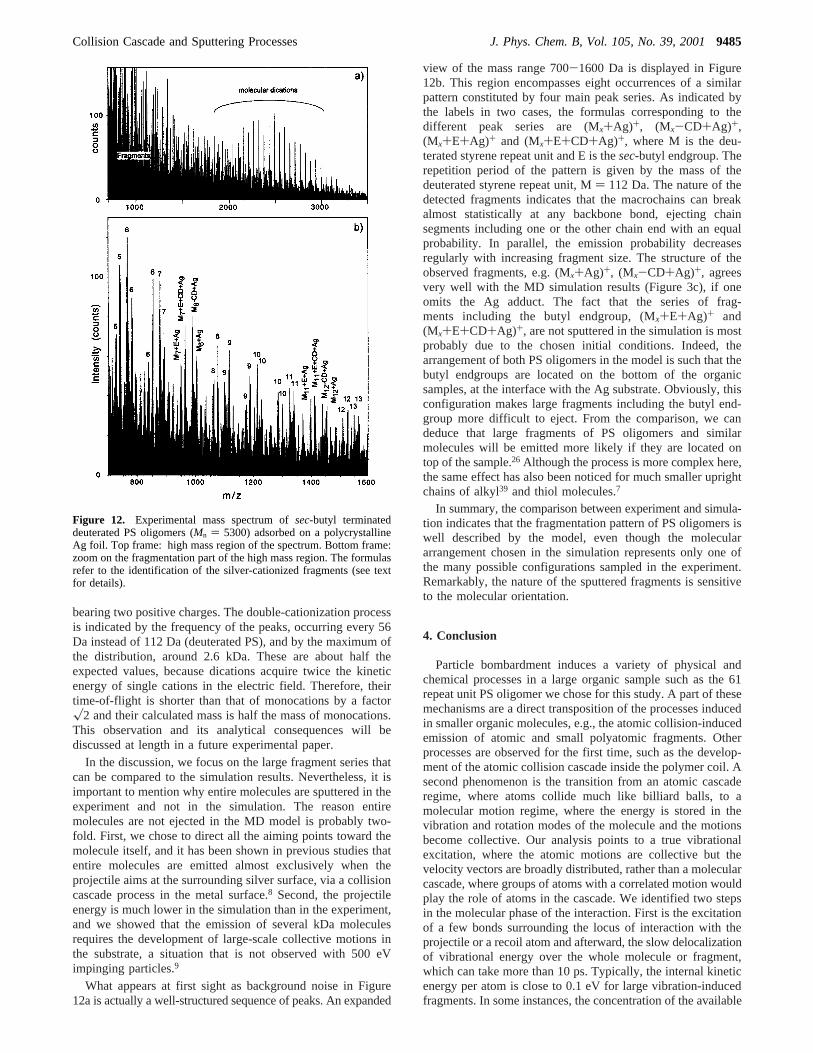
bearing two positive charges. The double-cationization processis indicated by the frequency of the peaks, occurring every 56Da instead of 112 Da (deuterated PS), and by the maximum ofthe distribution, around 2.6 kDa. These are about half theexpected values, because dications acquire twice the kineticenergy of single cations in the electric field. Therefore, theirtime-of-flight is shorter than that of monocations by a factorx2 and their calculated mass is half the mass of monocations.This observation and its analytical consequences will bediscussed at length in a future experimental paper.
In the discussion, we focus on the large fragment series thatcan be compared to the simulation results. Nevertheless, it isimportant to mention why entire molecules are sputtered in theexperiment and not in the simulation. The reason entiremolecules are not ejected in the MD model is probably two-fold. First, we chose to direct all the aiming points toward themolecule itself, and it has been shown in previous studies thatentire molecules are emitted almost exclusively when theprojectile aims at the surrounding silver surface, via a collisioncascade process in the metal surface.8 Second, the projectileenergy is much lower in the simulation than in the experiment,and we showed that the emission of several kDa moleculesrequires the development of large-scale collective motions inthe substrate, a situation that is not observed with 500 eVimpinging particles.9
What appears at first sight as background noise in Figure12a is actually a well-structured sequence of peaks. An expanded
view of the mass range 700-1600 Da is displayed in Figure12b. This region encompasses eight occurrences of a similarpattern constituted by four main peak series. As indicated bythe labels in two cases, the formulas corresponding to thedifferent peak series are (Mx+Ag)+, (Mx-CD+Ag)+,(Mx+E+Ag)+ and (Mx+E+CD+Ag)+, where M is the deu-terated styrene repeat unit and E is thesec-butyl endgroup. Therepetition period of the pattern is given by the mass of thedeuterated styrene repeat unit, M) 112 Da. The nature of thedetected fragments indicates that the macrochains can breakalmost statistically at any backbone bond, ejecting chainsegments including one or the other chain end with an equalprobability. In parallel, the emission probability decreasesregularly with increasing fragment size. The structure of theobserved fragments, e.g. (Mx+Ag)+, (Mx-CD+Ag)+, agreesvery well with the MD simulation results (Figure 3c), if oneomits the Ag adduct. The fact that the series of frag-ments including the butyl endgroup, (Mx+E+Ag)+ and(Mx+E+CD+Ag)+, are not sputtered in the simulation is mostprobably due to the chosen initial conditions. Indeed, thearrangement of both PS oligomers in the model is such that thebutyl endgroups are located on the bottom of the organicsamples, at the interface with the Ag substrate. Obviously, thisconfiguration makes large fragments including the butyl end-group more difficult to eject. From the comparison, we candeduce that large fragments of PS oligomers and similarmolecules will be emitted more likely if they are located ontop of the sample.26 Although the process is more complex here,the same effect has also been noticed for much smaller uprightchains of alkyl39 and thiol molecules.7
In summary, the comparison between experiment and simula-tion indicates that the fragmentation pattern of PS oligomers iswell described by the model, even though the moleculararrangement chosen in the simulation represents only one ofthe many possible configurations sampled in the experiment.Remarkably, the nature of the sputtered fragments is sensitiveto the molecular orientation.
4. Conclusion
Particle bombardment induces a variety of physical andchemical processes in a large organic sample such as the 61repeat unit PS oligomer we chose for this study. A part of thesemechanisms are a direct transposition of the processes inducedin smaller organic molecules, e.g., the atomic collision-inducedemission of atomic and small polyatomic fragments. Otherprocesses are observed for the first time, such as the develop-ment of the atomic collision cascade inside the polymer coil. Asecond phenomenon is the transition from an atomic cascaderegime, where atoms collide much like billiard balls, to amolecular motion regime, where the energy is stored in thevibration and rotation modes of the molecule and the motionsbecome collective. Our analysis points to a true vibrationalexcitation, where the atomic motions are collective but thevelocity vectors are broadly distributed, rather than a molecularcascade, where groups of atoms with a correlated motion wouldplay the role of atoms in the cascade. We identified two stepsin the molecular phase of the interaction. First is the excitationof a few bonds surrounding the locus of interaction with theprojectile or a recoil atom and afterward, the slow delocalizationof vibrational energy over the whole molecule or fragment,which can take more than 10 ps. Typically, the internal kineticenergy per atom is close to 0.1 eV for large vibration-inducedfragments. In some instances, the concentration of the available
Figure 12. Experimental mass spectrum ofsec-butyl terminateddeuterated PS oligomers (Mn ) 5300) adsorbed on a polycrystallineAg foil. Top frame: high mass region of the spectrum. Bottom frame:zoom on the fragmentation part of the high mass region. The formulasrefer to the identification of the silver-cationized fragments (see textfor details).
Collision Cascade and Sputtering Processes J. Phys. Chem. B, Vol. 105, No. 39, 20019485

energy in a small set of C-C bonds also leads to thedecomposition of the molecule, through the delayed emissionof excited fragments. Recombination reactions are also observed,but they mainly affect very small hydrogen-deficient species,and not larger fragments. The ejection of large molecularsegments can also be assisted by the reflection of the projectileand recoil atom energy on the silver substrate.
More technically, the comparison of the REBO and AIREBOpotentials has been performed and the sputtering results aresignificantly dependent on the choice of potential. In particular,the sputtering yield of polyatomic fragments is reduced by theintroduction of long-range attractive forces. The arrangementof the molecule on the surface and the choice of the target areaalso affect the sputtering yields.
Although the mass spectrum provided by the model istruncated with respect to the real SIMS spectrum, the largefragment peaks observed in the simulation have their homologuein the experiment. In comparison, the simulation data are partialbecause a limited set of molecular orientations and aiming pointshave been investigated, while the experiment statisticallysamples the whole set of possible configurations. For a furthercomparison involving energy distributions, the projectile energyand the number of calculated trajectories should be increasedby an order of magnitude in the simulation, which involvesprohibitive CPU time costs with the AIREBO potential. Theimplementation of ionization schemes in the MD model is alsodesirable, but it remains very difficult to achieve and can onlybe seen as a long-term goal. In future works, we plan to varythe sputtering parameters, e.g., different projectile energy andincidence angle, polyatomic projectiles, and to study otherhydrocarbon systems. For instance, in parallel with the develop-ment of matrix-enhanced SIMS, we plan to model the ejectionof PS oligomers embedded in a low molecular weight organicmatrix.
Acknowledgment. The authors thank Kristin Krantzman(College of Charleston, USA) for helpful discussion and adviceas well as Karsten Reihs (Bayer Ag, Leverkusen, Germany) whokindly provided the deuterated PS sample. Steve Stuart providedthe source code for the AIREBO potential and has answerednumerous questions about it. The financial support of theNational Science Foundation through the Chemistry Division,the CRIF program, and the MRI program is gratefully acknowl-edged by A.D. and B.J.G. Additional computational resourceswere provided in part by the IBM Selected University ResourceProgram and the Center for Academic Computing of Penn StateUniversity. We are also indebted to the Center for AcademicComputing staff for helping us use the IBM SP computer andfor the development of a new graphics software for animationand presentation. A.D. also acknowledges the BelgianFondsNational pour la Recherche Scientifiquefor financial sup-port. The ToF-SIMS equipment was acquired with the supportof the Region Wallonne and FRFC-Loterie NationaleofBelgium.
References and Notes
(1) Secondary Ion Mass Spectrometry, SIMS XII Proceedings; Ben-ninghoven, A., Bertrand, P., Migeon, H.-N., Werner, H., Eds; Elsevier:Amsterdam, 2000.
(2) Delcorte, A. Fundamental Aspects of Organic SIMS inToF-SIMS: Surface Analysis by Mass Spectrometry; Vickerman, J. C., Briggs,D., Eds.; SurfaceSpectra/IM Publications: Manchester, in press.
(3) Garrison, B. J.; Delcorte, A.; Krantzman, K. D.Acc. Chem. Res.2000, 33, 69.
(4) Chatterjee, R.; Postawa, Z.; Winograd, N.; Garrison, B. J.J. Phys.Chem. B1999, 103, 151.
(5) Townes, J. A.; White, A. K.; Wiggins, E. N.; Krantzman, K. D.;Garrison, B. J.; Winograd, N.J. Phys. Chem. B1999, 103, 4587.
(6) Taylor, R. S.; Garrison, B. J.Langmuir1995, 11, 1220.(7) Liu, K. S. S.; Yong, C. W.; Garrison, B. J.; Vickerman, J. C. J.
Phys. Chem. B1999, 103, 3195.(8) Delcorte, A.; Vanden Eynde, X.; Bertrand, P.; Vickerman, J. C.;
Garrison, B. J.J. Phys. Chem. B2000, 104, 2673.(9) Delcorte, A.; Garrison, B. J.J. Phys. Chem. B2000, 104, 6785.
(10) Beardmore, K.; Smith, R.Nucl. Instrum. Methods B1995, 102,223.
(11) Brenner, D. W.Phys. ReV. B 1990, 42, 9458.(12) Stuart, S. J.; Tutein, A. B.; Harrison, J. A.J. Chem. Phys.2000,
112, 6472.(13) Krantzman, K. D.; Postawa, Z.; Garrison, B. J.; Winograd, N.;
Stuart, S.; Harrison, J. A.Nucl. Instrum. Methods B2001, 180, 159.(14) Kerford, M.; Webb, R. P.Nucl. Instrum. Methods B2001, 180,
44.(15) Complementary information concerning these simulations can be
found at the following Internet address: http://www.ee.surrey.ac.uk/SCRIBA/simulations/
(16) Williams, P.; Sundqvist, B. U. R.Phys. ReV. Lett.1987, 58, 1031.(17) Harrison, D. E., Jr.CRC Crit. ReV. Solid State Mater. Sci.1988,
14, S1.(18) Garrison, B. J.; Winograd, N.; Harrison, D. E., Jr.J. Chem. Phys.
1978, 69, 1440.(19) Winograd, N.; Garrison, B. J. InIon Spectroscopies for Surface
Analysis; Czanderna, A. W., Hercules, D. M., Eds.; Plenum Press: NewYork, 1991; p 45.
(20) Garrison, B. J.J. Chem. Soc. Rev. 1992, 21, 155.(21) Bernardo, D. N.; Bhatia, R.; Garrison, B. J.Comput. Phys. Commun.
1994, 80, 259.(22) Brenner, D. W.Phys. ReV. B 1990, 42, 9458.(23) Brenner, D. W.; Harrison, J. A.; White, C. T.; Colton, R. J.Thin
Solid Films1991, 206, 220.(24) Daniels, C. A.Polymers: Structure and Properties; Technomic
Publishing: Lancaster, Pennsylvania, 1989.(25) Schueler, B. W.Microsc. Microanal. Microstruct.1992, 3, 119.(26) Pacholski, M. L.; Cannon, D. M.; Ewing, A. G.; Winograd, N.J.
Am. Chem. Soc.1999, 121, 4716.(27) Delcorte, A.; Garrison, B. J.Nucl. Instrum. Methods B2001, 180,
37.(28) Delcorte, A.; Bertrand, P.Int. J. Mass Spectrom.1999, 184, 217.(29) Schueler, B.; Beavis, R.; Ens, W.; Main, D. E.; Tang, X.; Standing,
K. G. Int. J. Mass Spectrom. Ion Processes1989, 92, 185.(30) Feld, H.; Leute, A.; Rading, D.; Benninghoven, A.; Chiarelli, D.;
Hercules, D. M.Anal. Chem.1993, 65, 1947.(31) Gilmore, I.; Seah, M. P.Appl. Surf. Sci.1999, 144/145, 26.(32) Murray, P. T.; Rabalais, J. W.J. Am. Chem. Soc.1981, 103, 1007.(33) Michl, J. Int. J. Mass Spectrom. Ion Phys.1983, 53, 255.(34) Snowdon, K.Nucl. Instrum. Methods B1985, 9, 132.(35) Taylor, R. S.; Garrison, B. J.J. Am Chem. Soc.1994, 116, 4465.(36) Biersack, J. P. inIon Beam Modification of Materials; Mazzoldi,
P., Arnold, G. W., Eds.; Elsevier: Amsterdam, 1987; p 648.(37) Information concerning this program can be found at the following
Internet address: http://www.research.ibm.com/ion-beams/SRIM/(38) Delcorte, A.; Bertrand, P.Surf. Sci.1998, 412/413, 97.(39) Taylor, R. S.; Garrison, B. J.Chem. Phys. Lett.1994, 230, 495.
9486 J. Phys. Chem. B, Vol. 105, No. 39, 2001 Delcorte et al.
![Sputtering: survey of observations and derived principles papers/Baragiola [r] review sputtering...Sputtering: survey of observations and derived principles By Ra´ul A. Baragiola](https://static.fdocuments.net/doc/165x107/5af974577f8b9abd588ce807/sputtering-survey-of-observations-and-derived-papersbaragiola-r-review-sputteringsputtering.jpg)