College Success Program Fall 2009 Annual Report. Fall 2009 Cohort For comparative analysis, the...
16
College Success Program Fall 2009 Annual Report
-
Upload
amber-williamson -
Category
Documents
-
view
214 -
download
0
Transcript of College Success Program Fall 2009 Annual Report. Fall 2009 Cohort For comparative analysis, the...

College Success Program
Fall 2009 Annual Report
Fall 2009 Cohort• For comparative analysis, the cohort of Clermont students
whose first enrolled term at the university equals 09A was selected.
• The CSP Participants, Non-participants and College Ready are defined as follows:
– CSP Participants are students who placed into 2 or 3 developmental courses and participated in the CSP program
• CSP Participants have been divided into 2 subgroups: – CSPA are students who had ongoing visits during 09A and additional support during 10W
& 10S in some cases.– CSPB are students who registered for CSP and had one meeting during 09A.
– Non-participants are students who placed into 2 or 3 developmental courses and did not participate in the CSP program
– College Ready are students who have placement test scores on file in one or more areas, placed into fewer than 2 developmental courses and did not participate in the CSP program
• The 09A Total in the demographic section reflects the composition of all Clermont students enrolled in 09A.

Fall 2009 DemographicsCSP
Participants(N=42)
Non-Participants
(N=90)
College Ready(N=588)
08A Total(N=3,990)
# % # % # % # %
Freshmen 42 100% 90 100% 588 100% 2,378 60%
Male 15 36% 35 39% 262 45% 1,680 42%
Female 27 64% 55 61% 326 55% 2,310 58%
Full-time (12+) 29 69% 59 66% 470 80% 2,521 63%
Half-time (6-11) 10 24% 24 27% 90 15% 1,111 28%
Part-time (1-5) 3 7% 7 8% 28 5% 358 9%
Percentages may not equal 100% due to rounding
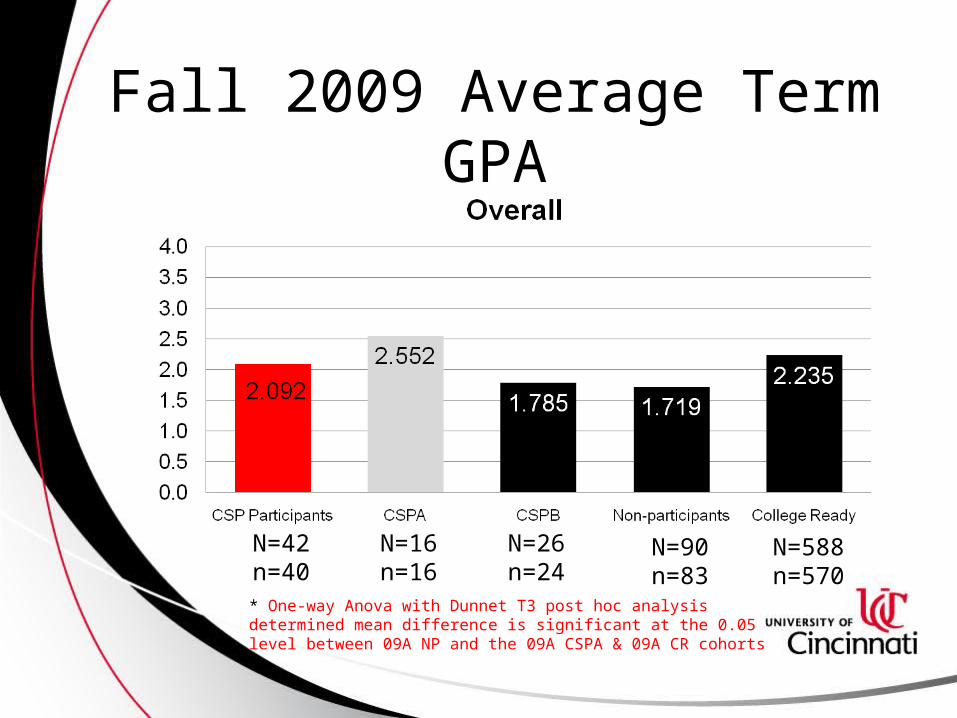
Fall 2009 Average Term GPA
N=42n=40
N=26n=24
N=588n=570
* One-way Anova with Dunnet T3 post hoc analysis determined mean difference is significant at the 0.05 level between 09A NP and the 09A CSPA & 09A CR cohorts
N=16n=16
N=90n=83
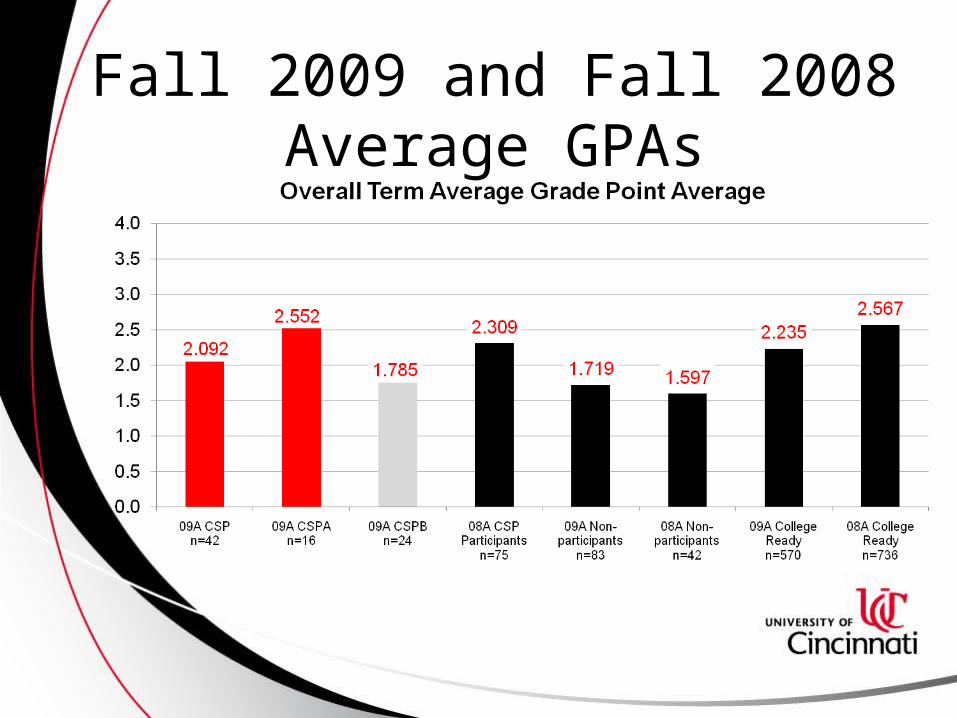
Fall 2009 and Fall 2008 Average GPAs

Fall 2009 Course CompletionHours
CarriedHours Earned
% Carried Hours Earned
CSP Participants 433 339 78%
CSPA 183 165 90%
CSPB 250 174 70%
Non-participants 933 631 68%
College Ready 7036 5643 80%
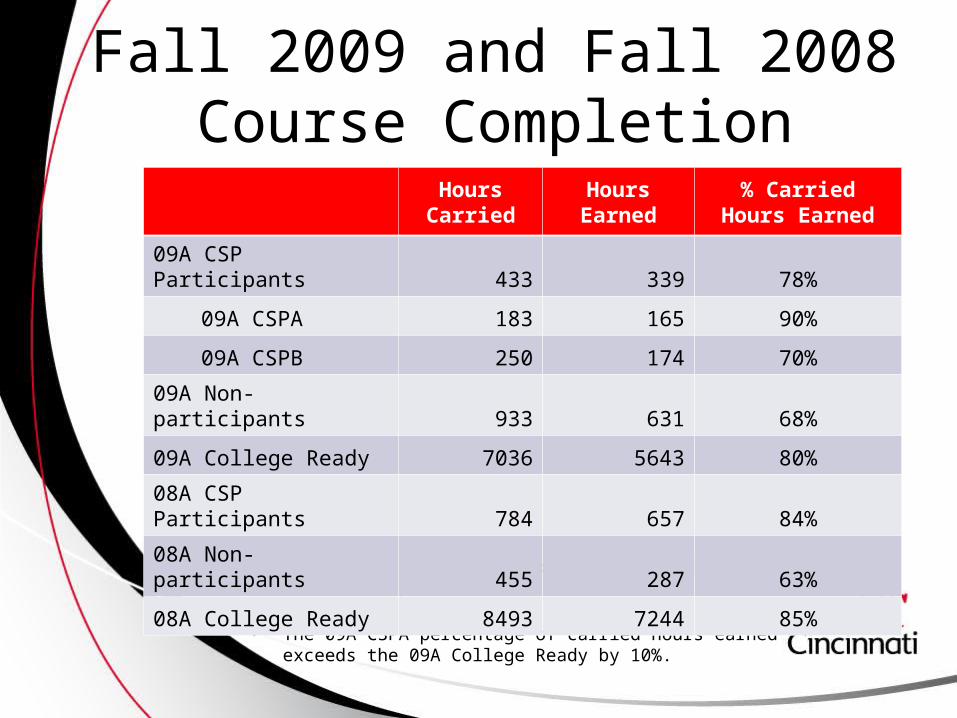
Fall 2009 and Fall 2008Course Completion
• The percentage of carried hours earned by 09A CSP Participants exceeds 09A Non-participants and is comparable to 09A College Ready.
• The 09A CSPA percentage of carried hours earned exceeds the 09A College Ready by 10%.
Hours Carried
Hours Earned
% Carried Hours Earned
09A CSP Participants 433 339 78%
09A CSPA 183 165 90%
09A CSPB 250 174 70%
09A Non-participants 933 631 68%
09A College Ready 7036 5643 80%
08A CSP Participants 784 657 84%
08A Non-participants 455 287 63%
08A College Ready 8493 7244 85%
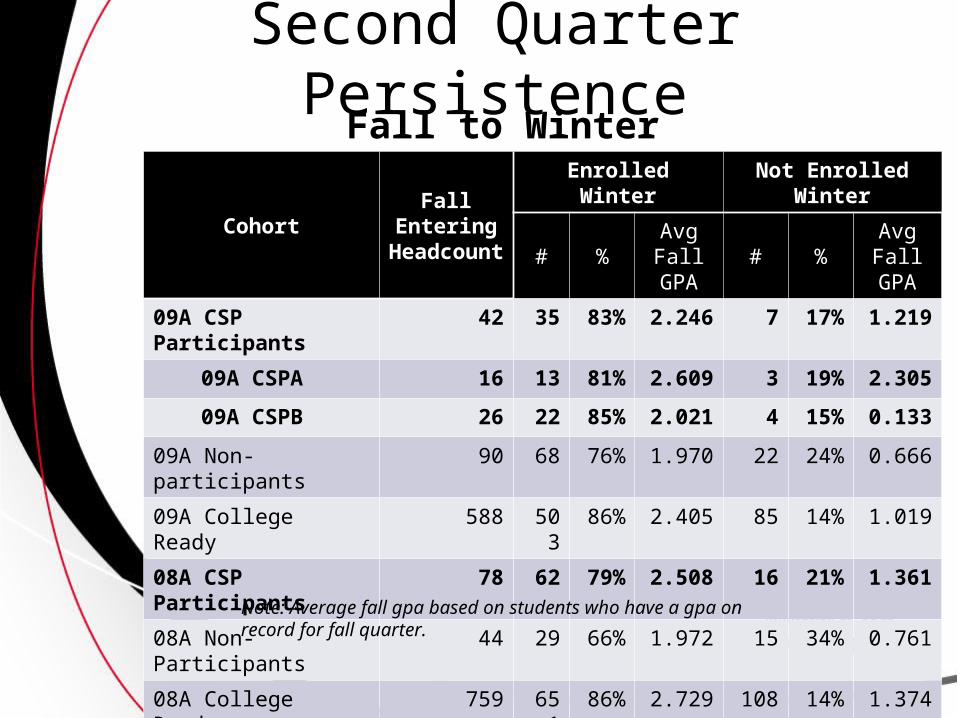
Second Quarter Persistence
CohortFall
Entering Headcount
Enrolled Winter Not Enrolled Winter
# %Avg Fall GPA
# %Avg Fall GPA
09A CSP Participants 42 35 83% 2.246 7 17% 1.219
09A CSPA 16 13 81% 2.609 3 19% 2.305
09A CSPB 26 22 85% 2.021 4 15% 0.133
09A Non-participants 90 68 76% 1.970 22 24% 0.666
09A College Ready 588 503 86% 2.405 85 14% 1.019
08A CSP Participants 78 62 79% 2.508 16 21% 1.361
08A Non-Participants 44 29 66% 1.972 15 34% 0.761
08A College Ready 759 651 86% 2.729 108 14% 1.374
Fall to Winter
Note: Average fall gpa based on students who have a gpa on record for fall quarter.

Second Quarter Average GPAs
* One-way Anova with Dunnet T3 post hoc analysis determined mean difference is significant at the 0.05 level between the 09A NP and 09A CR cohorts.
Note: Reflects second quarter persistence of students who were enrolled fall and winter quarters and have a gpa on record for both quarters.

Winter 2010 Course CompletionHours
CarriedHours Earned
% Carried Hours Earned
CSP Participants 347 235 68%
CSPA 140 121 86%
CSPB 207 114 55%
Non-participants 706 528 75%
College Ready 5624 4576 81%

Winter 2010 and Winter 2009Course Completion
• The winter quarter percentage of carried hours earned by 09A CSPA Participants exceeds 09A College Ready.
Hours Carried
Hours Earned
% Carried Hours Earned
09A CSP Participants 347 235 68%
09A CSPA 140 121 86%
09A CSPB 207 114 55%
09A Non-participants 706 528 75%
09A College Ready 5624 4576 81%
08A CSP Participants 711 589 83%
08A Non-participants 266 193 73%
08A College Ready 7277 6364 87%

Third Quarter Persistence
Cohort
Entering Cohort
Enrolled Spring Not Enrolled Spring
Fall Winter #% of Wtr ret’d
Avg Winter GPA
#% of Wtr ret’d
Avg Winter GPA
09A CSP Participants 42 35 32 91% 1.818 3 9% .2333
09A CSPA 16 13 12 92% 2.297 1 8% 0.700
09A CSPB 26 22 20 91% 1.523 2 9% 0.000
09A Non-Participants 90 68 56 82% 1.987 12 18% 0.587
09A College Ready 588 503 406 81% 2.520 95 19% 0.516
08A CSP Participants 78 62 55 89% 2.309 6 11% 1.128
08A Non-participants 44 29 19 62% 2.354 8 34% 0.731
08A College Ready 759 651 566 86% 2.720 72 13% 1.621
Winter to Spring
Note: Reflects third quarter persistence of students who were enrolled both fall and winter quarters. Students who were enrolled fall, stopped out winter, then enrolled spring quarter are not included. Average winter gpa based on students who have a gpa on record for winter quarter.

Third Quarter Average GPAs
Reflects students who were enrolled fall, winter and spring quarters and have a gpa on record for all three quarters.
* One-way Anova with Dunnet T3 post hoc analysis determined mean difference is significant at the 0.05 level between 09A CSPB and 09A CR & between 09A NP and 09A CR cohorts.
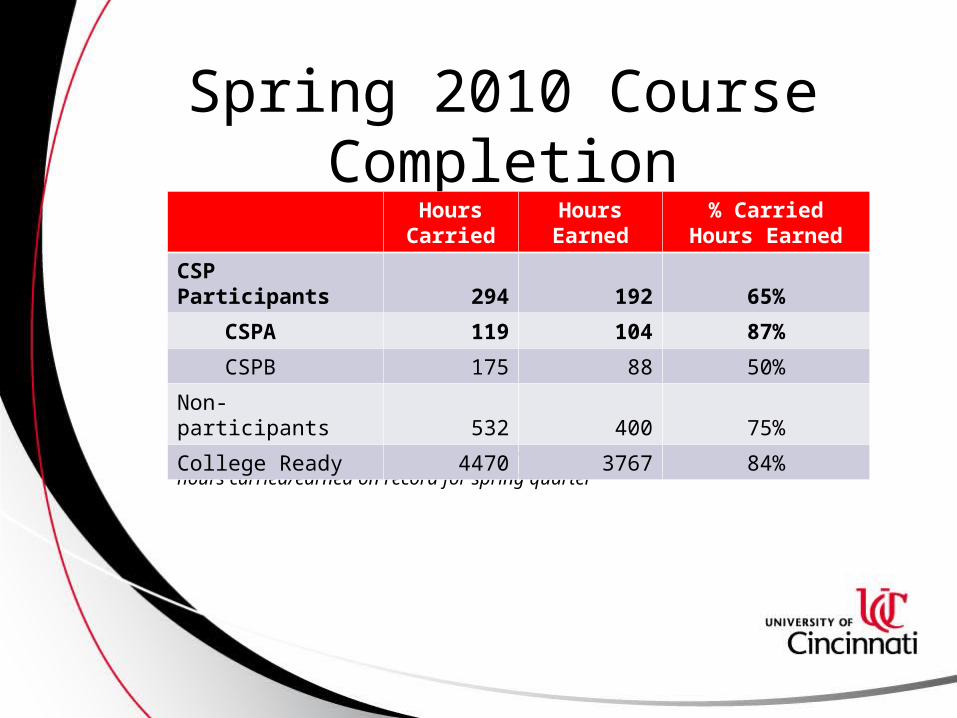
Spring 2010 Course Completion
Reflects students who were enrolled fall, winter and spring quarters and have hours carried/earned on record for spring quarter
Hours Carried
Hours Earned
% Carried Hours Earned
CSP Participants 294 192 65%
CSPA 119 104 87%
CSPB 175 88 50%
Non-participants 532 400 75%
College Ready 4470 3767 84%
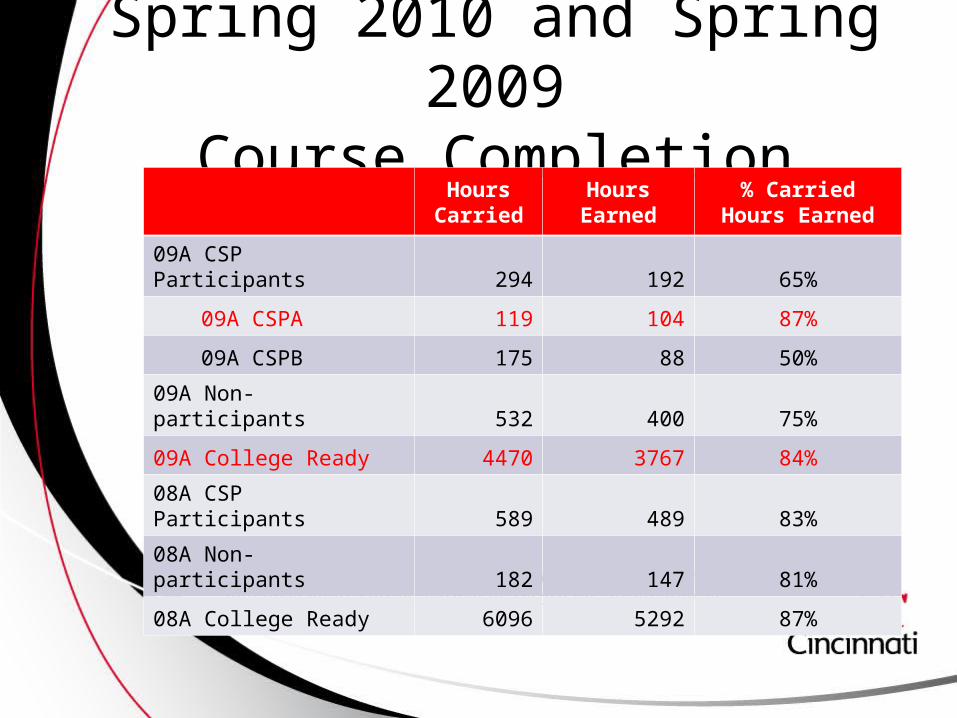
Spring 2010 and Spring 2009Course Completion
Reflects students who were enrolled fall, winter and spring quarters and have hours carried/earned on record for spring quarter
Hours Carried
Hours Earned
% Carried Hours Earned
09A CSP Participants 294 192 65%
09A CSPA 119 104 87%
09A CSPB 175 88 50%
09A Non-participants 532 400 75%
09A College Ready 4470 3767 84%
08A CSP Participants 589 489 83%
08A Non-participants 182 147 81%
08A College Ready 6096 5292 87%
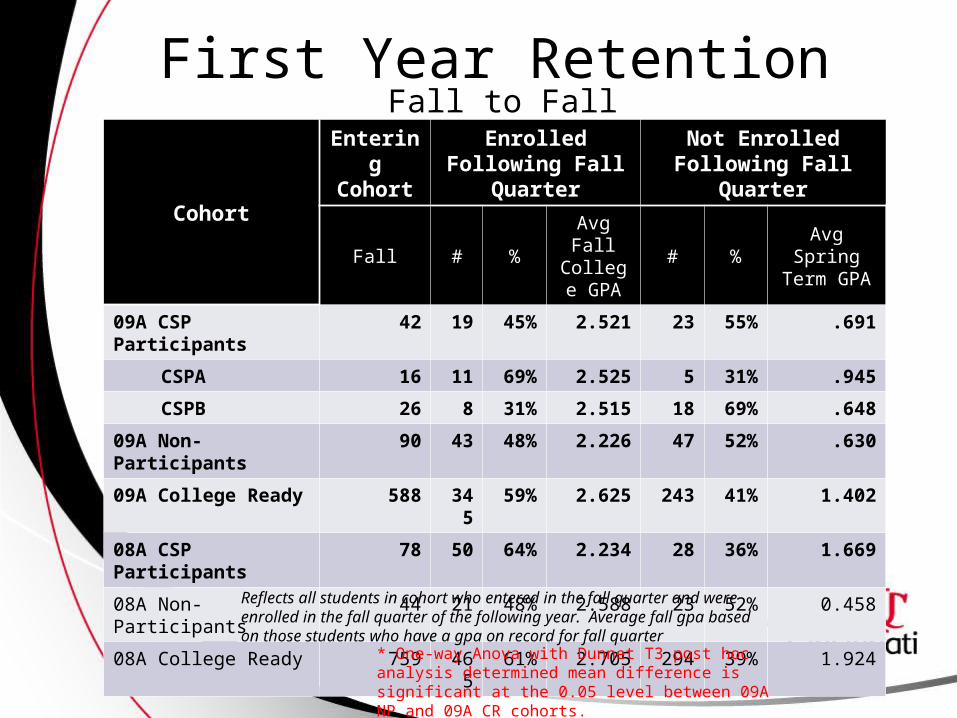
First Year Retention
Cohort
Entering Cohort
Enrolled Following Fall Quarter
Not Enrolled Following Fall Quarter
Fall # %Avg Fall College
GPA# %
AvgSpring
Term GPA
09A CSP Participants 42 19 45% 2.521 23 55% .691
CSPA 16 11 69% 2.525 5 31% .945
CSPB 26 8 31% 2.515 18 69% .648
09A Non-Participants 90 43 48% 2.226 47 52% .630
09A College Ready 588 345 59% 2.625 243 41% 1.402
08A CSP Participants 78 50 64% 2.234 28 36% 1.669
08A Non-Participants 44 21 48% 2.588 23 52% 0.458
08A College Ready 759 465 61% 2.705 294 39% 1.924
Fall to Fall
Reflects all students in cohort who entered in the fall quarter and were enrolled in the fall quarter of the following year. Average fall gpa based on those students who have a gpa on record for fall quarter
* One-way Anova with Dunnet T3 post hoc analysis determined mean difference is significant at the 0.05 level between 09A NP and 09A CR cohorts.