college rankings was found that worldwide rankings have a much higher weighting on research ......
63
Project Number: IQP-CEW-1401 COLLEGE RANKINGS An Interactive Qualifying Project Report submitted to the Faculty of the WORCESTER POLYTECHNIC INSTITUTE in partial fulfillment of the requirements for the Degree of Bachelor of Science by ______________________________ Xiaoyu Wang and ______________________________ Yifan Zhao Date: May 1, 2014 ______________________________ Professor Craig E. Wills, Project Advisor
Transcript of college rankings was found that worldwide rankings have a much higher weighting on research ......
Project Number: IQP-CEW-1401
COLLEGE RANKINGS
An Interactive Qualifying Project Report
submitted to the Faculty
of the
WORCESTER POLYTECHNIC INSTITUTE
in partial fulfillment of the requirements for the Degree of Bachelor of Science
by
______________________________
Xiaoyu Wang
and
______________________________
Yifan Zhao
Date: May 1, 2014
______________________________
Professor Craig E. Wills, Project Advisor

ii
Abstract
Many college rankings exist, each based on a set of factors determined by publishers of the
rankings. People considering colleges often use college rankings as a tool to aid them in their search.
This project compares the methodology of rankings by organizing the factors of each into six categories.
It was found that worldwide rankings have a much higher weighting on research than U.S.-only rankings.
In addition a survey was conducted over different demographic groups. From the survey results an ideal
ranking was constructed for different groups and compared to existing rankings. All demographic groups
examined seek a better mix of categorized factors than any existing ranking provides.
iii
Table of Contents Abstract ......................................................................................................................................................... ii
1. Introduction .............................................................................................................................................. 5
1.1 Road Map ............................................................................................................................................ 7
2. Background ............................................................................................................................................... 8
2.1 Impact of College Rankings ................................................................................................................. 8
2.2 Data Sources used by College Rankings .............................................................................................. 8
2.3 College Resources ............................................................................................................................. 10
2.4 Summary ........................................................................................................................................... 11
3. Approach ................................................................................................................................................. 12
3.1 Justification of the Rankings Selected ............................................................................................... 12
3.2 Classification of Factors into Categories ........................................................................................... 13
3.2.1 Initial Categories: Input, Output, University .............................................................................. 13
3.2.2 Division of University Category .................................................................................................. 14
3.2.3 Creation of the Research Category ............................................................................................ 14
3.2.4 Removal of Faculty Category ..................................................................................................... 14
3.2.5 Final Categories .......................................................................................................................... 15
3.3 Subjective vs. Objective Factors ........................................................................................................ 16
3.4 Summary ........................................................................................................................................... 16
4. Ranking Results ....................................................................................................................................... 17
4.1 Analysis of Factors in Rankings against the Combination of Categories and Subjective versus
Objective Measures ................................................................................................................................ 17
4.1.1 Category 1: Student Body .......................................................................................................... 17
4.1.2 Category 2: Research ................................................................................................................. 17
4.1.3 Category 3: Academics ............................................................................................................... 19
4.1.4 Category 4: Student Life ............................................................................................................. 21
4.1.5 Category 5: Finance .................................................................................................................... 21
4.1.6 Category 6: Post-Graduation Success ........................................................................................ 22
4.2 Summary of Ranking Results ............................................................................................................. 23
4.2.1 Distribution of Six Categories in U.S.-only College Rankings ..................................................... 23
4.2.2 Distribution of Six Categories in World College Rankings .......................................................... 24
4.2.3 Distribution of Subjective versus Objective Factors in U.S.-only College Rankings ................... 25
4.2.4 Distribution of Subjective versus Objective Factors in World College Rankings ....................... 26

iv
4.3 Summary ........................................................................................................................................... 27
5. Survey ...................................................................................................................................................... 29
5.1 Motivation for Producing a Survey ................................................................................................... 29
5.2 Survey Design .................................................................................................................................... 29
5.3 Summary of Survey Responses .......................................................................................................... 30
5.4 Summary ........................................................................................................................................... 38
6. Analysis of Survey Results ....................................................................................................................... 39
6.1 Comparison of Responses between United States and non-United States Residents ....................... 39
6.1.1 Importance of Six Categories ...................................................................................................... 40
6.1.2 Importance of Subjective versus Objective Factors .................................................................... 41
6.2 Comparison of Responses between Respondents below 26 and above 35 ...................................... 41
6.2.1 Importance of Six Categories ...................................................................................................... 41
6.2.2 Importance of Subjective versus Objective Factors .................................................................... 42
6.3 Comparison of Responses between Male and Female Respondents ................................................ 42
6.3.1 Importance of Six Categories ...................................................................................................... 43
6.3.2 Importance of Subjective versus Objective Factors .................................................................... 43
6.4 Comparison of Responses between Current Students and Parents ................................................. 44
6.4.1 Importance of the Six Categories ............................................................................................... 44
6.4.2 Importance of Subjective versus Objective Factors ................................................................... 45
6.5 Comparison of Responses between Future Students and Parents................................................... 45
6.5.1 Importance of Six Categories ..................................................................................................... 46
6.5.2 Importance of Subjective versus Objective Factors ................................................................... 47
6.6 Summary ........................................................................................................................................... 47
7. Comparing Ranking and Survey Results .................................................................................................. 48
7.1 Comparisons for U.S.-only Rankings ................................................................................................. 48
7.2 Comparisons for World Rankings ...................................................................................................... 49
7.3 Summary ........................................................................................................................................... 50
8. Conclusion ............................................................................................................................................... 51
8.1 Summary ........................................................................................................................................... 51
8.2 Future Work ...................................................................................................................................... 52
Works Cited ................................................................................................................................................. 53
Appendix ..................................................................................................................................................... 57

5
1. Introduction
President Obama has recently announced an initiative to grade colleges based on their
performance [1] in terms of financial cost and expected return. The idea behind this initiative is to hold
colleges accountable for the financial costs they incur on students. The College Board reported for the
2013-2014 school year that the average tuition for students attending in-state four-year schools was
$8,893, out-of-state schools $22,203, and private schools $30,094 [2]. With such a high financial cost, it
is imperative that students choose the best college available to them at a reasonable financial cost.
There are many resources available to assist students in this endeavor. In addition to President
Obama’s initiative to grade colleges based on their performance, there are college rankings released by
organizations such as Forbes [3] and U.S. News and World Report [4] consider various factors when
generating a ranking of colleges. Each ranking assigns different weights to various factors. Depending on
which factors they consider and how important each factor is to a college’s score, the rankings can differ
significantly.
Consider for example, two rankings previously mentioned, Forbes and US News and World
Report. Not only do their rankings differ, they also have different criteria for including or excluding
schools from their rankings. US News and World Report generates two separate rankings, one for what
they call National Universities [5] and another for what they call National Liberal Arts Colleges [6] while
Forbes generates a single ranking [7] for all colleges in the United States. Naturally, one would expect
the rankings to be significantly different. However, if only the institutions presented in the Forbes
rankings that are present in the U.S. News and World Report National University Rankings are
considered, discrepancies between their relative rankings with respect to each other would be present.
Forbes has Stanford University as the top school, followed by Princeton University, Yale University,
Columbia University, and Harvard University. The National University Rankings by U.S. News and World
Report has Princeton University as the top institution, followed by Harvard University, Yale University,
Columbia University, and Stanford University. This is only comparing the top five schools in the Forbes
Top Colleges List that are also present in the National University Rankings generated by U.S. News and
World Report.
Upon examination of multiple rankings, commonalities between the rankings can be
documented. The factors under consideration tend to group into six broad categories. These six
categories can be defined as Student Body, Research, Academics, Student Life, Finances, and Post-
Graduation Success. The Student Body category is a grouping of factors measuring aspects of the
6
general student body at a college or university. For the Research category all factors measuring the
research output of the university and faculty research are included. Factors measuring faculty teaching
and salary were excluded from Research and placed in the Academics category instead. In the
Academics category all factors relating to the quality of education received are included. For Student
Life those factors relating to daily quality of life at the college or university are considered. In the
Finance category only factors relating to the financial status of the student are considered. Factors such
as tuition and average financial aid package are considered to be part of this category. However, factors
such as the endowment of the school are not considered to be part of this category. For Post-
Graduation success factors that measure the success of graduates from the school are included.
In addition to college rankings, college guidebooks like the Princeton Review [8], and other
college resources such as College Confidential [9] and College Prowler [10] are also looked at. While the
guidebooks do not contain an explicit ranking, some do rate schools based on a variety of factors.
Although they are not rankings, they are still useful since the factors that the guidebooks consider can
be compared to those of the rankings. The website called College Prowler permits the user to generate
their own importance for each factor, then create a customized ranking based on those factors. The
College Prowler ranking is not considered an actual ranking to be analyzed since the rankings will differ
from user to user.
This project hopes to discover which of the college rankings is most relevant to people looking at
colleges. To begin, different college rankings including both U.S.-only and worldwide rankings were
searched for through popular search engines. Then, through reading the methodologies, we compared
the factors each ranking considers, and categorized those factors into six broad categories. Furthermore,
we calculated the proportion of the six categories for each ranking to have a more direct perspective of
what each ranking concentrates on. At the same time, we also looked at the subjective and objective
proportions in each ranking. We regarded the proportion of subjective versus objective factors in
ranking to be important since subjective factors are based on people’s opinions whereas objective
factors are grounded in hard data. That is not to say that objective factors cannot be biased. The
methodology behind interpreting data can affect the results significantly.
When analyzing the different ranking methodologies, it is important to keep in mind the scope
of the ranking itself. In our analysis we looked at both U.S.-only rankings such as U.S. News and World
Report and world rankings such as Times Higher Education [11]. After analyzing our rankings, we found
that the world university rankings tended to consist of different criteria in different proportions than the
U.S.-only rankings.

7
1.1 Road Map The goal of this report is to look at the most commonly referenced rankings and determine the
methodology that they use to rank colleges and universities and determine how they are similar and
different. In order to better understand what most people value more when considering colleges, we
sent out a survey on which rankings people are more familiar with, which categories people value more,
and their demographic information. The survey was used to determine what categories mattered the
most to people so that and “ideal ranking” of colleges and universities could be recommended to them.
In this report, the basic foundations behind college rankings are first discussed. In the chapter
immediately following, a discussion on the impact of college rankings is presented. The data sources
used by the college rankings are discussed, as well as a brief comment on other resources to aid college
seekers aside from rankings.
In Chapter 3 a discussion of the approach in selecting college rankings to analyze is discussed.
Also included is a discussion of the formulation of the six categories used in grouping together factors.
Chapter 4 includes a discussion on the factors that rankings use to determine how to place colleges and
universities within their rankings and in which categories the factors fall within. How much each ranking
considers each of their six categories in their ranking and the proportion of subjective versus objective
factors considered by the rankings is discussed as well.
Chapter 5 opens with the discussion of the survey distributed to determine people’s opinions on
college rankings and the categories of factors that are important to them in considering colleges. The
results of the survey are presented. Comments on the overall scores for the importance of the six
categories are discussed, as well as any additional comments made by respondents.
Chapter 6 makes comparisons between different demographic groups recorded in the survey. A
series of statistical analyses is performed to determine if there are any statistically significant differences
in how different groups of respondent rated the importance of each of the six categories. Chapter 7
further expands on the idea of the six categories and compares the weighted score for the six categories
against the weights of each of the six categories presented in the rankings. Weighed score in context
means the score of the category divided by the sum of scores for all six categories. Chapter 8 concludes
the report with a recommendation for the “ideal ranking” for the population surveyed, as well as a
discussion on the pros and cons of college rankings. A discussion on future work is presented in Chapter
8 as well.
8
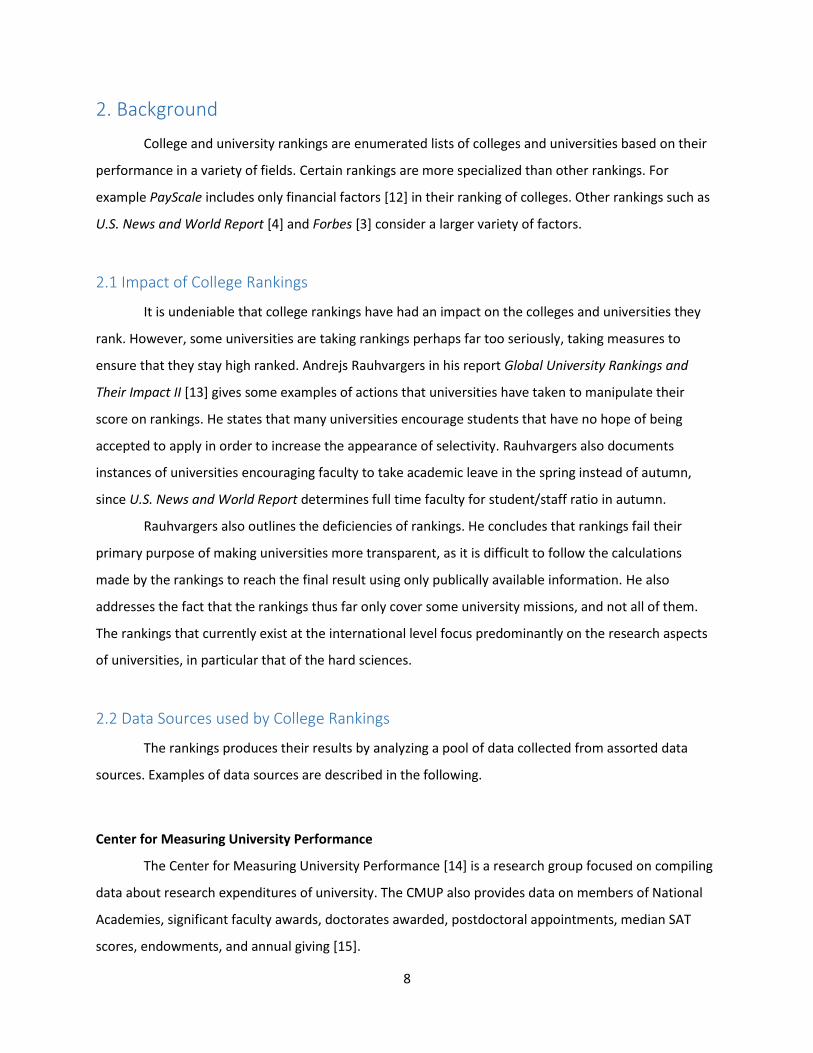
2. Background
College and university rankings are enumerated lists of colleges and universities based on their
performance in a variety of fields. Certain rankings are more specialized than other rankings. For
example PayScale includes only financial factors [12] in their ranking of colleges. Other rankings such as
U.S. News and World Report [4] and Forbes [3] consider a larger variety of factors.
2.1 Impact of College Rankings
It is undeniable that college rankings have had an impact on the colleges and universities they
rank. However, some universities are taking rankings perhaps far too seriously, taking measures to
ensure that they stay high ranked. Andrejs Rauhvargers in his report Global University Rankings and
Their Impact II [13] gives some examples of actions that universities have taken to manipulate their
score on rankings. He states that many universities encourage students that have no hope of being
accepted to apply in order to increase the appearance of selectivity. Rauhvargers also documents
instances of universities encouraging faculty to take academic leave in the spring instead of autumn,
since U.S. News and World Report determines full time faculty for student/staff ratio in autumn.
Rauhvargers also outlines the deficiencies of rankings. He concludes that rankings fail their
primary purpose of making universities more transparent, as it is difficult to follow the calculations
made by the rankings to reach the final result using only publically available information. He also
addresses the fact that the rankings thus far only cover some university missions, and not all of them.
The rankings that currently exist at the international level focus predominantly on the research aspects
of universities, in particular that of the hard sciences.
2.2 Data Sources used by College Rankings
The rankings produces their results by analyzing a pool of data collected from assorted data
sources. Examples of data sources are described in the following.
Center for Measuring University Performance
The Center for Measuring University Performance [14] is a research group focused on compiling
data about research expenditures of university. The CMUP also provides data on members of National
Academies, significant faculty awards, doctorates awarded, postdoctoral appointments, median SAT
scores, endowments, and annual giving [15].
9
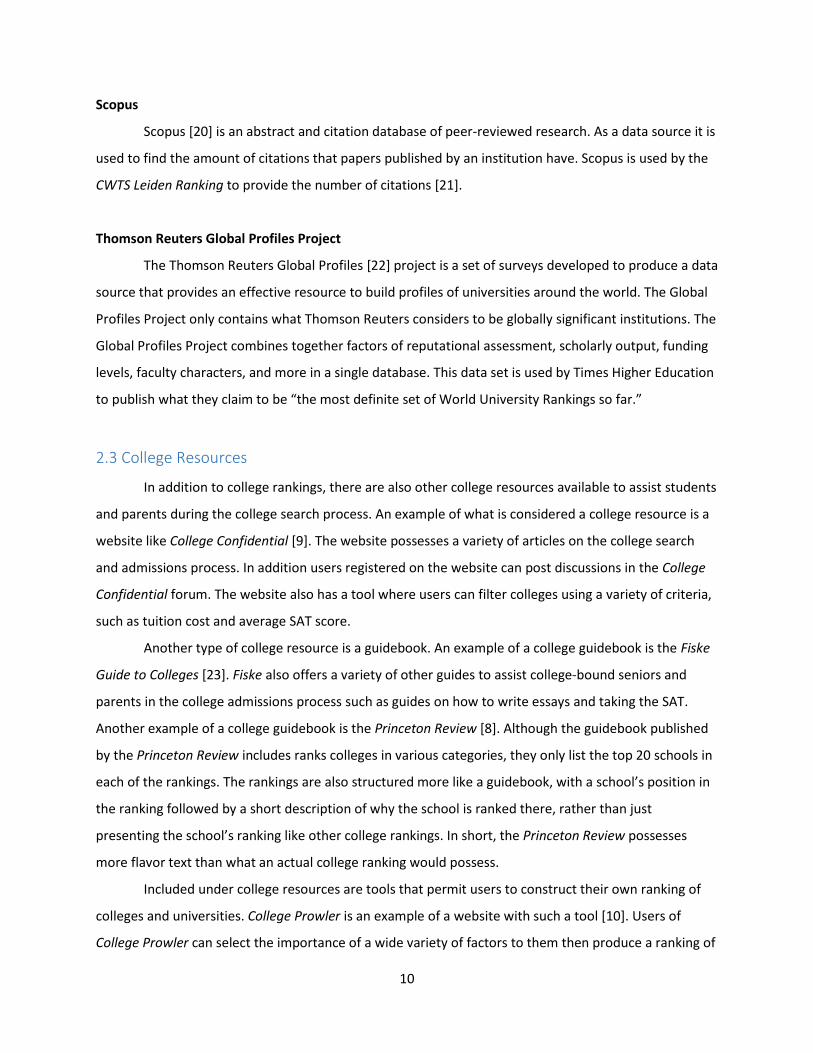
Common Data Set
The Common Data Set (CDS) [16] is a collaborative effort among data providers and publishers
in the higher education community to provide an accurate and high quality source of information to all
involved in a student’s transition into higher education. The CDS is created by a collaborative effort from
the College Board, Peterson’s, and U.S. News and World Report. Data items and definitions used by the
U.S. Department of Education in its higher education surveys serve as a guide for the items included in
the CDS. Data is collected by sending out surveys to target institutions. Information from the CDS is used
by U.S. News and World Report [4] in order to generate its rankings. Items in the CDS undergo review by
the CDS Advisory Board.
Integrated Postsecondary Education Data System
The Integrated Postsecondary Education Data System (IPEDS) is a group of surveys conducted
annually by the U.S. Department of Education’s National Center for Education Statistics (NCES) [17].
IPEDS gathers information from every college, university, and technical and vocational programs that
participate in federal student aid programs. For these institutions participation in the IPEDS survey is
mandatory. IPEDS provides data on number of students enrolled, staff employed, dollars expended, and
degrees earned [17].
Peterson’s
Peterson’s [18] is a set of data collected from surveys sent to accredited colleges and
universities. Peterson’s also contacts college to verify unusual data and resolve discrepancies if they
exist.
SCImago Group
SCImago Group is a group that publishes reports on the research output on universities [19]. The
goal of the report is so that universities can analyze and then improve their research results. Although
institutions are ordered by score, they are not explicitly ranked. Thus it was not considered to be a
ranking but rather part of a data set used to generate a ranking.
10
Scopus
Scopus [20] is an abstract and citation database of peer-reviewed research. As a data source it is
used to find the amount of citations that papers published by an institution have. Scopus is used by the
CWTS Leiden Ranking to provide the number of citations [21].
Thomson Reuters Global Profiles Project
The Thomson Reuters Global Profiles [22] project is a set of surveys developed to produce a data
source that provides an effective resource to build profiles of universities around the world. The Global
Profiles Project only contains what Thomson Reuters considers to be globally significant institutions. The
Global Profiles Project combines together factors of reputational assessment, scholarly output, funding
levels, faculty characters, and more in a single database. This data set is used by Times Higher Education
to publish what they claim to be “the most definite set of World University Rankings so far.”
2.3 College Resources
In addition to college rankings, there are also other college resources available to assist students
and parents during the college search process. An example of what is considered a college resource is a
website like College Confidential [9]. The website possesses a variety of articles on the college search
and admissions process. In addition users registered on the website can post discussions in the College
Confidential forum. The website also has a tool where users can filter colleges using a variety of criteria,
such as tuition cost and average SAT score.
Another type of college resource is a guidebook. An example of a college guidebook is the Fiske
Guide to Colleges [23]. Fiske also offers a variety of other guides to assist college-bound seniors and
parents in the college admissions process such as guides on how to write essays and taking the SAT.
Another example of a college guidebook is the Princeton Review [8]. Although the guidebook published
by the Princeton Review includes ranks colleges in various categories, they only list the top 20 schools in
each of the rankings. The rankings are also structured more like a guidebook, with a school’s position in
the ranking followed by a short description of why the school is ranked there, rather than just
presenting the school’s ranking like other college rankings. In short, the Princeton Review possesses
more flavor text than what an actual college ranking would possess.
Included under college resources are tools that permit users to construct their own ranking of
colleges and universities. College Prowler is an example of a website with such a tool [10]. Users of
College Prowler can select the importance of a wide variety of factors to them then produce a ranking of
11
colleges and universities based on their selection. The factors that users can select include Academics,
Athletics, Campus Dining, Campus Housing, Campus Strictness, Computers, Diversity, Drug Safety,
Facilities, Girls, Guys, Greek Life, Health and Safety, Local Atmosphere, Nightlife, Off-Campus Dining, Off-
Campus House, Parking, Transportation, and Weather. Since College Prowler and websites similar to it
provide no actual college rankings without user input, it is considered to be a college resource rather
than a college ranking.
Introduced in February of 2013, the White House College Scorecard is designed by the U.S.
Department of Education to provide information to students and parents about the affordability of a
college or university and the relative value it provides for the cost [24]. The information provided by the
College Scorecard includes undergraduate enrollment, costs, graduation rate, loan default rate, median
borrowing, and employment. The data displayed by the College Scorecard is collected by the U.S.
Department of Education.
2.4 Summary
In this chapter, a discussion of previous work studying the effects of college rankings was
presented. A summary of the data sources used by college rankings was discussed, and a brief overview
of various college resources was provided. The college resources were overviewed in a way that
outlined their usefulness to people considering colleges.

12
3. Approach
3.1 Justification of the Rankings Selected
College rankings are important for students planning to study at a college. Sometimes, a student
makes his or her choice simply by comparing the candidate colleges in different rankings and reading
comments online. The factors they consider may vary from academic rankings to post-graduation salary
rankings, from campus life to financial aid resources, from faculty resources to reputation, and so on.
Accordingly, rankings composed of different factors are designed to help students make their choices.
So, among all the rankings, which are more popular? What are some representatives? What are their
methodologies? Where do they gather data?
To answer the above questions, we started with the rankings we used when we chose our
colleges. Such examples are U.S. News and World Report National University Rankings, Times Higher
Education World University Rankings, College Guide [25] by Washington Monthly, and Academic Ranking
of World Universities [26] by Shanghai Jiao Tong University. Then, to enlarge the number of rankings we
consider, we searched online to see what additional rankings we could find.
When searching “College Rankings” in Google, the entries come to the top of the page include
college rankings from U.S. News, America’s Top Colleges List from Forbes [7], College Guide from
Washington Monthly [27], College Rankings from Princeton Review [8], and so on. Most of them are
U.S.-only rankings. In the next several pages of search results, most of the rankings are sports rankings,
which do not seem as important as the ones in the first page, since the majority of students would not
consider sports as a factor of vital importance.
When searching “World Rankings”, websites like Times Higher Education World University
Rankings, and QS World University Rankings come out. A link from U.S. News comes out first, but this is
only an article about world universities, rather than a ranking.
With the help of Professor Wills, other rankings were also looked at. A paper called “Global
University Rankings and Their Impact Report II” [13] gave more clues. Therefore rankings based on
research like CWTS [28] and Webometrics [29] were added.
Table 1 summarizes all of the rankings considered.

13
Table 1: University Rankings
Publisher Title Type
Forbes America's Top Colleges U.S.-only
Kiplinger Kiplinger's Best Values in Private Colleges U.S.-only
PayScale College Education Value Rankings U.S.-only
U.S. News National University Rankings U.S.-only
Washington Monthly 2013 National University Rankings U.S.-only
CWTS CWTS Leiden Ranking 2013 World
QS QS World University Rankings - 2012 World
Shanghai Jiao Tong University Academic Ranking of World Universities World
Times Higher Education THE World University Rankings World
Webometrics Ranking Web of Universities World
Overall, both worldwide and U.S.-only rankings were chosen to be studied. They also have
different focuses: some of them focus more on academics and reputation, while others focus more on
campus life and post-graduation success.
Other resources such as College Prowler, Department of Education College Scorecard, and
College Reality Check [30] were also examined. Students can refer to these websites for useful
information relating to their college of choice that is not presented in the rankings.
3.2 Classification of Factors into Categories
To analyze different rankings, a common set of criteria first needs to be defined for the rankings
in order to enable comparisons between many different rankings.
3.2.1 Initial Categories: Input, Output, University
Initially we produced the idea of sorting the factors into the categories of Input, Output, and
University. Input contains factors describing the quality of the incoming student body. Examples of such
factors include student selectivity (from U.S. News and World Report), and proportion of international
students (from QS). Output contains factors describing the quality of life after graduation. Such factors
include quality of education (from ARWU-Shanghai), Forbes America leaders (from Forbes), and service
(from Washington Monthly). University contains factors describing the quality of the university itself, the
resources for students and facility quality. Such factors include quality of faculty (from ARWU-Shanghai),
research output (from ARWU-Shanghai), and student satisfaction (from Forbes). Then we put every
14
factor from each ranking into the corresponding category and calculated the proportion of each
category in a specific ranking.
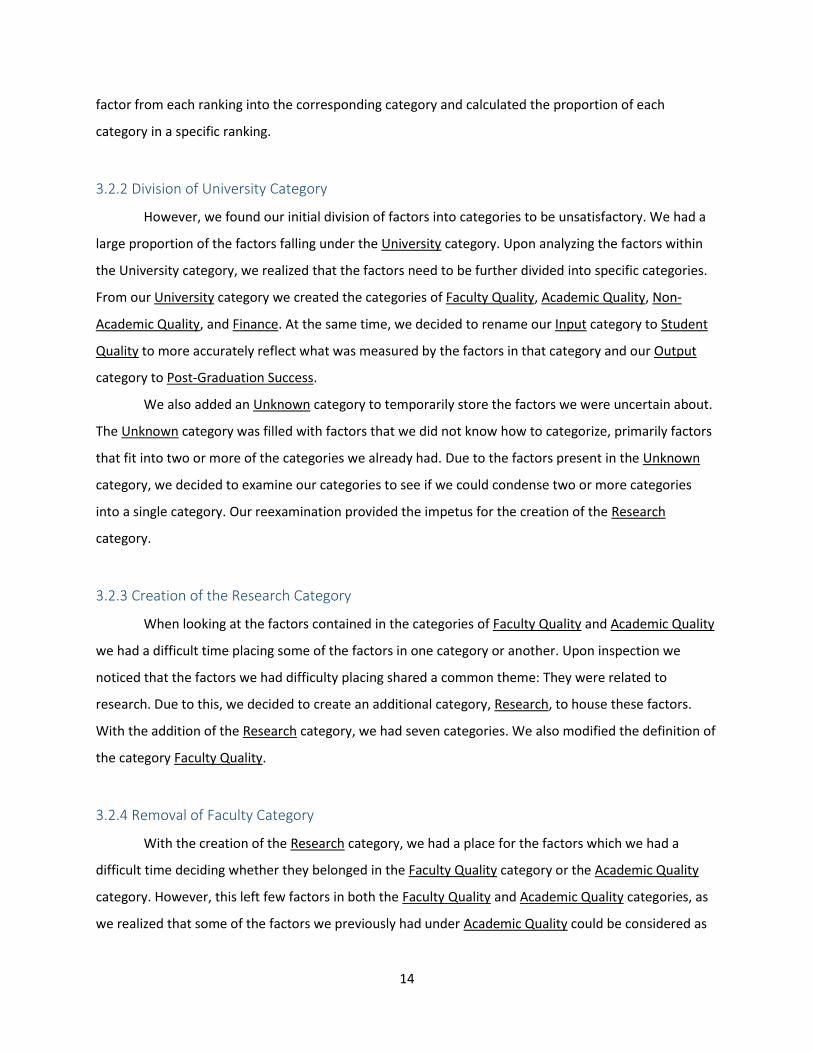
3.2.2 Division of University Category
However, we found our initial division of factors into categories to be unsatisfactory. We had a
large proportion of the factors falling under the University category. Upon analyzing the factors within
the University category, we realized that the factors need to be further divided into specific categories.
From our University category we created the categories of Faculty Quality, Academic Quality, Non-
Academic Quality, and Finance. At the same time, we decided to rename our Input category to Student
Quality to more accurately reflect what was measured by the factors in that category and our Output
category to Post-Graduation Success.
We also added an Unknown category to temporarily store the factors we were uncertain about.
The Unknown category was filled with factors that we did not know how to categorize, primarily factors
that fit into two or more of the categories we already had. Due to the factors present in the Unknown
category, we decided to examine our categories to see if we could condense two or more categories
into a single category. Our reexamination provided the impetus for the creation of the Research
category.
3.2.3 Creation of the Research Category
When looking at the factors contained in the categories of Faculty Quality and Academic Quality
we had a difficult time placing some of the factors in one category or another. Upon inspection we
noticed that the factors we had difficulty placing shared a common theme: They were related to
research. Due to this, we decided to create an additional category, Research, to house these factors.
With the addition of the Research category, we had seven categories. We also modified the definition of
the category Faculty Quality.
3.2.4 Removal of Faculty Category
With the creation of the Research category, we had a place for the factors which we had a
difficult time deciding whether they belonged in the Faculty Quality category or the Academic Quality
category. However, this left few factors in both the Faculty Quality and Academic Quality categories, as
we realized that some of the factors we previously had under Academic Quality could be considered as

15
research. Dissatisfied with the two categories, we examined the factors remaining to see if there was
any way of combining the two categories. We noted that the remaining factors under the category of
Faculty Quality related to the teaching ability of the professors. With this in mind we decided to remove
the Faculty Quality category and merge the contents into Academic Quality. As a result of this change,
we ended up with six categories. We also modified the names of the categories to more accurately
reflect the factors contained within.
3.2.5 Final Categories
Here is a list of categories considered and their definitions correspondingly.
3.2.5.1 Category 1: Student Body
This category contains factors relating to aspects of the student body of the college or
university. This includes factors such as admission rate, average SAT/ACT scores, and student diversity.
3.2.5.2 Category 2: Research
This category contains factors relating to the research output of the college or university. It
includes factors such as the total number of citations for faculty at each university per year and research
funding.
3.2.5.3 Category 3: Academics
This category contains factors relating to the academic quality of the college or university. Such
factors include the reputation of the school, student to faculty ratio, and graduation rate.
3.2.5.4 Category 4: Student Life
This category contains factors relating to the daily life of the students at the college or
university. It includes factors such as athletics, social scene, community service, ROTC size, and so on.
3.2.5.5 Category 5: Finance
This category contains factors relating to finance. Such factors include student debt, average
financial aid, and endowment.
16
3.2.5.6 Category 6: Post-Graduation Success
This category contains factors relating to post-graduation success. Such factors include salary of
graduates and acceptance rate to graduate schools.
3.3 Subjective vs. Objective Factors
At the same time, the proportion of subjective and objective factors in each ranking was also
analyzed. Subjective factors are those related to people’s opinions, such as reputation, while objective
factors are those based on the real numerical data, such as student selectivity, retention rate and
graduation rate, which are calculated based on real data. The proportion of subjective factors versus
objective factors is important because subjective factors can be biased. An example of a possible bias
would be a person rating a school highly because they saw that it was high in a ranking, or if they
graduated from the school in question. Objective factors avoid possible bias by examining quantifiable
measures.
3.4 Summary
This chapter introduced the approach to analyzing rankings. First, through online searching
mainly, several rankings were selected to be examined for this project. The selected rankings are
generated by the following publishers: CWTS, Forbes, Kiplinger [31], PayScale, QS [32], Shanghai Jiao
Tong University, Times Higher Education, U.S. News, Washington Monthly, and Webometrics. The
methodologies of these rankings were studies, and to better analyze the common factors used in these
rankings, six categories were proposed, including Student Body, Research, Academics, Student Life,
Finances, and Post-Graduation Success. Also, the selected rankings were also analyzed based on
whether the factors are subjective and objective. In the next chapter, these rankings will be analyzed by
sorting the factors they consider into categories then comparing the results.
17
4. Ranking Results
4.1 Analysis of Factors in Rankings against the Combination of Categories and Subjective
versus Objective Measures
The tables below summarize the breakdown of factors in consideration by the rankings we
looked at, sorted by category. The table provides information about the factor, whether it is subjective
or objective, which ranking it is from, the weight within the ranking, and the source of data that it comes
from. After each table, ambiguously defined factors are explained.
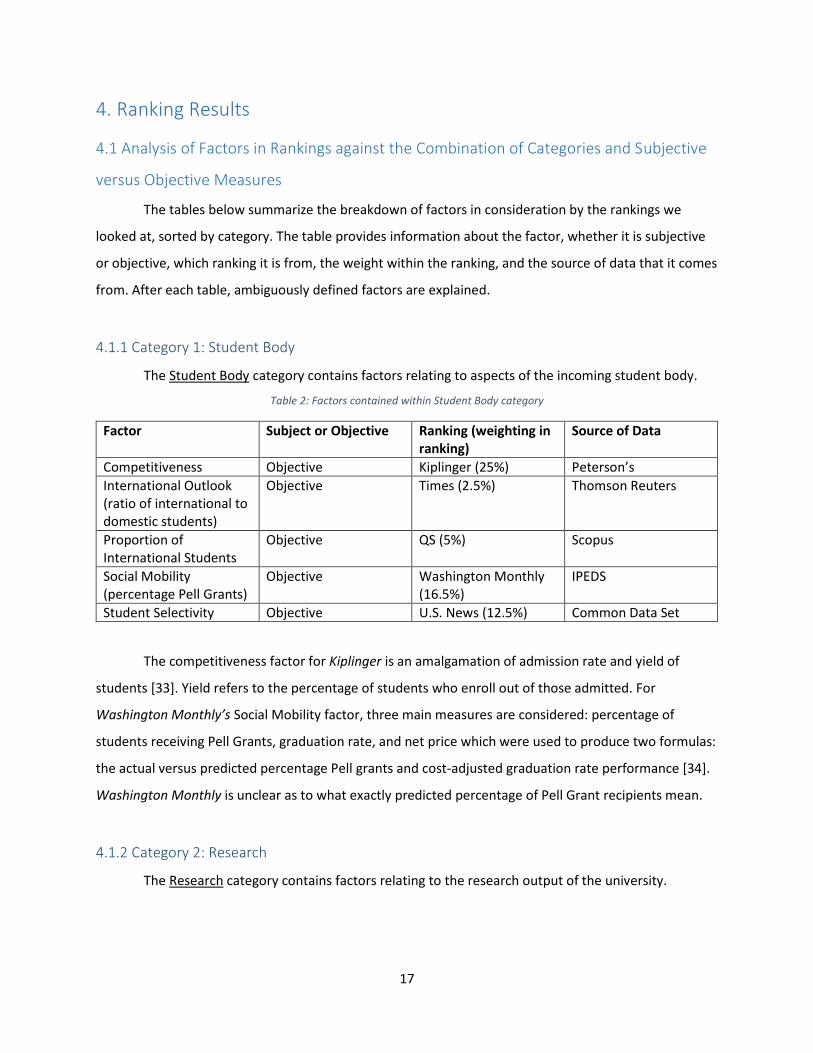
4.1.1 Category 1: Student Body
The Student Body category contains factors relating to aspects of the incoming student body.
Table 2: Factors contained within Student Body category
Factor Subject or Objective Ranking (weighting in ranking)
Source of Data
Competitiveness Objective Kiplinger (25%) Peterson’s
International Outlook (ratio of international to domestic students)
Objective Times (2.5%) Thomson Reuters
Proportion of International Students
Objective QS (5%) Scopus
Social Mobility (percentage Pell Grants)
Objective Washington Monthly (16.5%)
IPEDS
Student Selectivity Objective U.S. News (12.5%) Common Data Set
The competitiveness factor for Kiplinger is an amalgamation of admission rate and yield of
students [33]. Yield refers to the percentage of students who enroll out of those admitted. For
Washington Monthly’s Social Mobility factor, three main measures are considered: percentage of
students receiving Pell Grants, graduation rate, and net price which were used to produce two formulas:
the actual versus predicted percentage Pell grants and cost-adjusted graduation rate performance [34].
Washington Monthly is unclear as to what exactly predicted percentage of Pell Grant recipients mean.
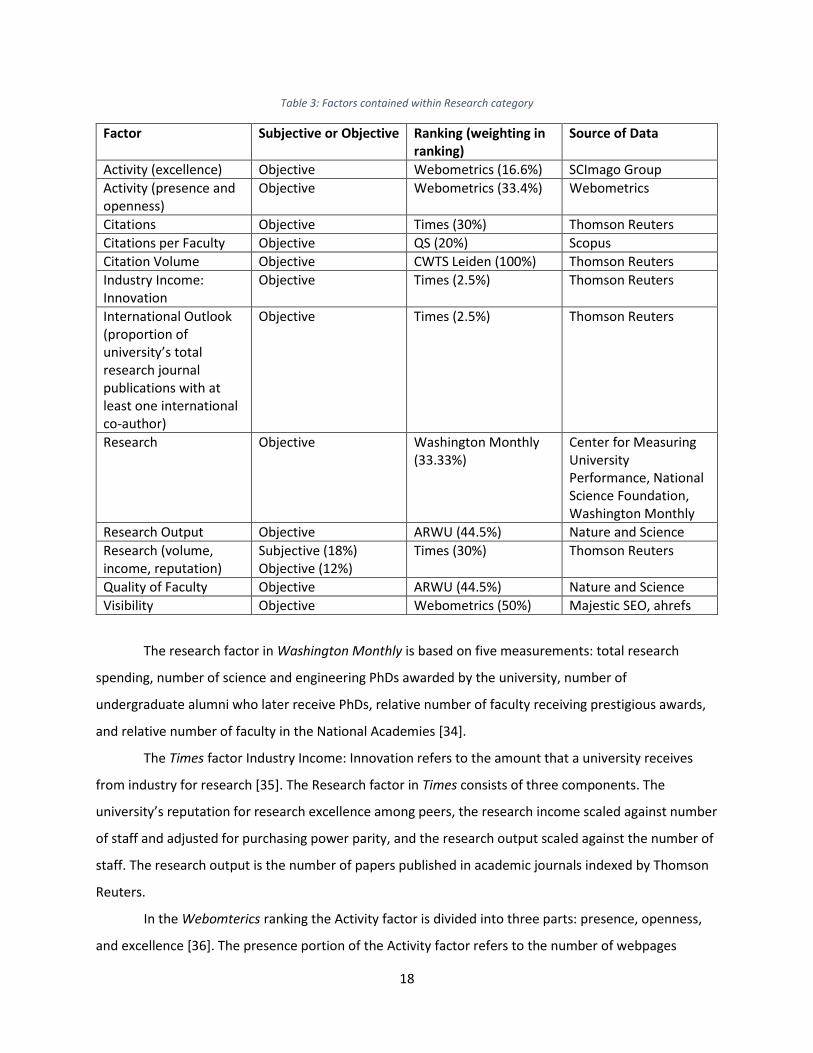
4.1.2 Category 2: Research
The Research category contains factors relating to the research output of the university.
18
Table 3: Factors contained within Research category
Factor Subjective or Objective Ranking (weighting in ranking)
Source of Data
Activity (excellence) Objective Webometrics (16.6%) SCImago Group
Activity (presence and openness)
Objective Webometrics (33.4%) Webometrics
Citations Objective Times (30%) Thomson Reuters
Citations per Faculty Objective QS (20%) Scopus
Citation Volume Objective CWTS Leiden (100%) Thomson Reuters
Industry Income: Innovation
Objective Times (2.5%) Thomson Reuters
International Outlook (proportion of university’s total research journal publications with at least one international co-author)
Objective
Times (2.5%) Thomson Reuters
Research Objective Washington Monthly (33.33%)
Center for Measuring University Performance, National Science Foundation, Washington Monthly
Research Output Objective ARWU (44.5%) Nature and Science
Research (volume, income, reputation)
Subjective (18%) Objective (12%)
Times (30%) Thomson Reuters
Quality of Faculty Objective ARWU (44.5%) Nature and Science
Visibility Objective Webometrics (50%) Majestic SEO, ahrefs
The research factor in Washington Monthly is based on five measurements: total research
spending, number of science and engineering PhDs awarded by the university, number of
undergraduate alumni who later receive PhDs, relative number of faculty receiving prestigious awards,
and relative number of faculty in the National Academies [34].
The Times factor Industry Income: Innovation refers to the amount that a university receives
from industry for research [35]. The Research factor in Times consists of three components. The
university’s reputation for research excellence among peers, the research income scaled against number
of staff and adjusted for purchasing power parity, and the research output scaled against the number of
staff. The research output is the number of papers published in academic journals indexed by Thomson
Reuters.
In the Webomterics ranking the Activity factor is divided into three parts: presence, openness,
and excellence [36]. The presence portion of the Activity factor refers to the number of webpages
19
hosted in the web domain of the university indexed by Google. Openness refers to the number of rich
files published in dedicated websites according to Google Scholar. Excellence is the number of papers
published that are part of the 10% most cited papers in their respective fields. The visibility factor refers
to amount of times webpages on a university’s web domain are linked. ahrefs [37] and Majestic SEO [38]
are tools to display internal and external links.
4.1.3 Category 3: Academics
The Academics category contains factors relating to the academic performance of colleges and
universities.

20
Table 4: Factors contained within Academics category
Factor Subjective or Objective
Ranking (weighting in ranking)
Source of Data
Academic Reputation Subjective QS (40%) Scopus
Academic Reputation Survey (invitation only)
Subjective Times (15%) Thomson Reuters
Academic Support Objective Kiplinger (12.5%) Peterson’s, Kiplinger
Doctoral to Bachelor Degree Ratio
Objective Times (2.25%) Thomson Reuters
Faculty Resources Objective U.S. News (20%) Common Data Set
Freshman Retention Objective Forbes (7.5%) IPEDS
Faculty-Student Ratio Objective QS (20%) Scopus
Graduation Rate Objective Kiplinger (18.75%) Peterson’s, Kiplinger
Graduation Rate Performance
Objective U.S. News (7.5%) Common Data Set
Institutional Income (adjusted for number of academic staff)
Objective Times (2.25%) Thomson Reuters
Proportion of International Faculty
Objective QS (5%) unknown
Ratio of International to Domestic Staff
Objective Times (2.5%) Thomson Reuters
Retention Objective U.S. News (22.5%) Common Data Set
Student Satisfaction (graduation rate)
Objective Forbes (11.25%) IPEDS
Student Satisfaction (RateMyProfessor)
Subjective Forbes (15%) www.ratemyprofessor.com
Student-to-Staff Ratio Objective Times (4.5%) Thomson Reuters
Undergraduate Academic Reputation
Subjective U.S. News (22.5%) U.S. News
Unique Subject Mix (volume of doctoral awards in different disciplines)
Objective Times (6%) Thomson Reuters
Kiplinger’s Academic Support factor is a combination of the graduation rate and the amount of
students per faculty member [33]. The faculty resources factor in U.S. News is an amalgamation of
classes with fewer than 20 students, proportion of classes with 50 or more students, faculty salary,
proportion of professors with the highest degree in their fields, student-faculty ratio, and proportion of
faculty who are full time [4]. The Undergraduate Academic Reputation factor from the same ranking
utilizes responses to a survey sent out to presidents, provosts, and deans of admissions of colleges and
universities asking them to provide and assessment on the academic programs of various schools [4].

21
15% of the Student Satisfaction factor of the Forbes ranking was derived from professor ratings on
RateMyProfesser [39], a website where students review professors [3].
4.1.4 Category 4: Student Life
The Student Life category contains factors relating to the daily life of students at colleges and
universities. While only Washington Monthly was classified as having a factor within the Student Life
category, the do-it-yourself rankings have many factors selectable that are within the category of
Student Life. Do-it-yourself rankings refer to sources like College Prowler, which was discussed in the
previous chapter.
Table 5: Factors contained within Student Life Category
Factor Subjective or Objective Ranking (weighting in ranking)
Source of Data
Service Objective Washington Monthly (33.3%)
unknown
The service factor in Washington Monthly is measured by a combination of the size of the
school’s Air Force, Army, and Navy ROTC programs relative to the size of the school, relative number of
alumni serving in the Peace Corps, percentage of federal work-study grant money spent on community
service projects, the number of students participating in community service and total service hours
performed relative to the size of the school, and the number of academic courses that incorporate
service relative to the size of the school. Also considered was whether or not the school provides
community service scholarships [34].
4.1.5 Category 5: Finance
This category contains factors relating to the financial statues of students and of colleges and
universities.

22
Table 6: Factors contained within Finance category
Factor Subjective or Objective Ranking (weighting in ranking)
Source of Data
Cost and Financial Aid Objective Kiplinger (31.25%) Peterson’s
Financial Resources Objective U.S. News (10%) Common Data Set
Social Mobility (cost-adjusted graduation rate performace)
Objective Washington Monthly (16.5%)
IPEDS
Student Debt Objective Forbes (17.5%) unknown
Student Indebtedness Objective Kiplinger (12.5%) Peterson’s
The Financial Resources factor for U.S. News refers to the spending of a college or university per
student.
4.1.6 Category 6: Post-Graduation Success
This category contains factors such as salary of graduates and acceptance rate to graduate
schools.
Table 7: Factors contained within Post-Graduation Success category
Factor Subjective or Objective Ranking (weighting in ranking)
Source of Data
Alumni Giving Rate Objective U.S. News (5%) unknown
Employer Reputation Subjective QS (10%) QS Survey
Forbes America’s Leaders
Subjective Forbes (22.5%) Forbes
Nationally Competitive Awards
Objective Forbes (11.25%) Forbes
Post-Graduation Salaries
Objective Forbes (15%) Payscale
Quality of Education Objective ARWU (11.11%) Nobel Prize Winners, List of Fields Medalists
Return on Investment Objective PayScale (100%) PayScale
The Quality of Education factor for ARWU refers to the amount of alumni of the institution that
win Nobel Prizes and Fields Medals. The information for winners of Nobel Prizes was obtained from the
Nobel Prize website [40]. The information on Fields medalists was found from the list of Fields medalists
[41]. For this factor alumni are those who obtains bachelor, master, or doctoral degrees from the
institution [42].
23
The Nationally Competitive Awards factor of U.S. News refers to the amount of students who
win prestigious scholarships such as the Rhodes, National Science Foundation, and Fullbright
scholarships [3]. It also includes undergraduate alumni who earn PhDs.
PayScale’s ranking of colleges by return on investment (ROI) uses the 30 year median pay for a
2012 bachelor’s graduate then takes that value and finds the difference between the 30 year median
pay for a bachelor’s graduate in 2012 and the 34-36 year median pay for a 2012 high school graduate
weighted for number of years worked [12]. Then the weighted cost of attending college is subtracted
from the value to find the 30 year return on investment in 2012 dollars. The weighted cost of attending
college refers to the weighted average of the net cost paid by students who graduate in four, five, and
six years. This factor from PayScale was considered to be Post-Graduation Success since although the
financial cost of a college factors into the calculation, the majority of the factor is influenced by the
earnings of the graduate.
4.2 Summary of Ranking Results
Based on the categorization methodology mentioned above, the percentage for each of the six
categories in the rankings was calculated. The percentages of subjective and objective factors in those
rankings were also calculated.
4.2.1 Distribution of Six Categories in U.S.-only College Rankings
The rankings considered here include Forbes, Kiplinger, PayScale, U.S. News, and Washington
Monthly.
Table 8: Category weights for U.S.-only rankings
Forbes Kiplinger PayScale U.S. News
Washington Monthly
Student Body 0% 25% 0% 13% 17%
Research 0% 0% 0% 0% 33%
Academics 34% 31% 0% 73% 0%
Student Life 0% 0% 0% 0% 33%
Finance 18% 44% 0% 10% 17%
Post-Graduation Success
49% 0% 100% 5% 0%
24
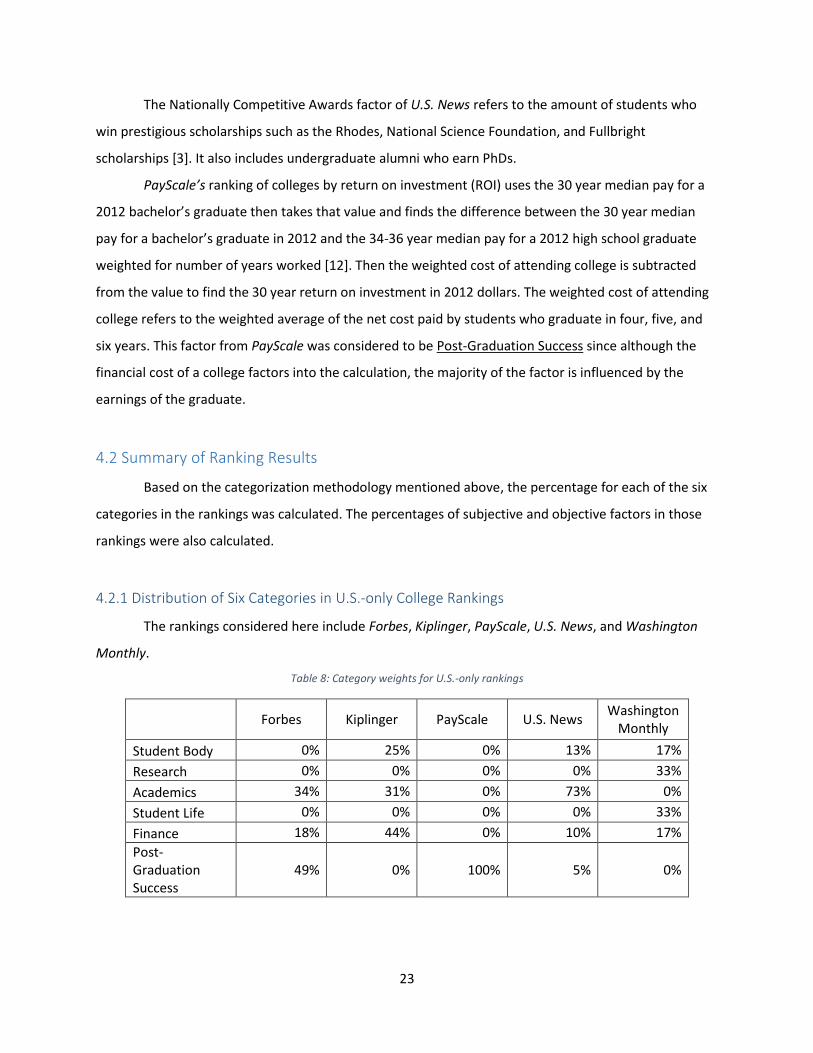
Figure 1: Category weights for U.S.-only college rankings
As shown in Table 8 and Figure 1, none of the rankings consider all of the six categories we
defined. Among all of these rankings, two (U.S. News and Washington Monthly) consider four
categories, another two (Forbes and Kiplinger) consider three categories, and one (PayScale) considers
only one category. Although both consider four categories, Washington Monthly has a more balanced
distribution of categories, while U.S. News heavily focuses on Academics. Considering only three
categories, Forbes tends to focus more on Post-Graduation Success while less on Finance. Kiplinger’s
categories have roughly equal weights, with a little extra focus on the financial aspects of college. On the
other hand, PayScale focused solely on one aspect, Post-Graduation Success.
4.2.2 Distribution of Six Categories in World College Rankings
The rankings considered here include ARWU-Shanghai, CWTS, QS, Times, and Webometrics.
Table 9: Category weights for world college rankings
ARWU-Shanghai CWTS QS Times Webometrics
Student Body 0% 0% 5% 3% 0%
Research 89% 100% 20% 65% 100%
Academics 0% 0% 65% 33% 0%
Student Life 0% 0% 00% 0% 0%
Finance 0% 0% 0% 0% 0%
Post-Graduation Success 11% 0% 10% 0% 0%
0%
10%
20%
30%
40%
50%
60%
70%
80%
90%
100%
Forbes Kiplinger PayScale US News WashingtinMonthly
Category Weights for U.S.-only College Rankings
Post-Graduation Success
Finance
Student Life
Academics
Research
Student Body
25
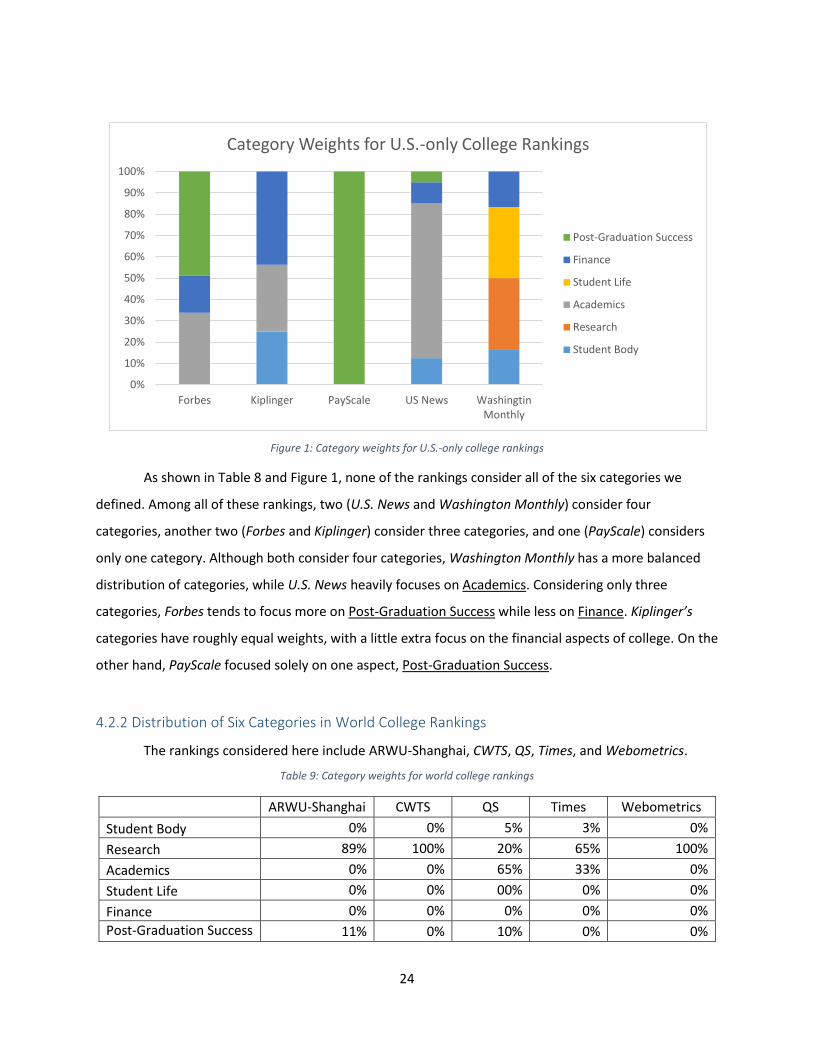
Figure 2: Category weights for world college rankings
As shown in Table 9 and Figure 2, most of the world college rankings focus on research, and
none of them pay attention to the financial aspects of attending a college or university. The funding the
faculty receive for research was counted in the Research category.
4.2.3 Distribution of Subjective versus Objective Factors in U.S.-only College Rankings
Table 10: Proportion of subjective versus objective factors in U.S.-only college rankings
Forbes Kiplinger PayScale U.S. News
Washington Monthly
Subjective 45% 0% 0% 23% 0%
Objective 55% 100% 100% 78% 100%
0%
10%
20%
30%
40%
50%
60%
70%
80%
90%
100%
ARWU-Shanghai CWTS QS Times Webometrics
Category Weights for World College Rankings
Post-Graduation Success
Finance
Student Life
Academics
Research
Student Body
26
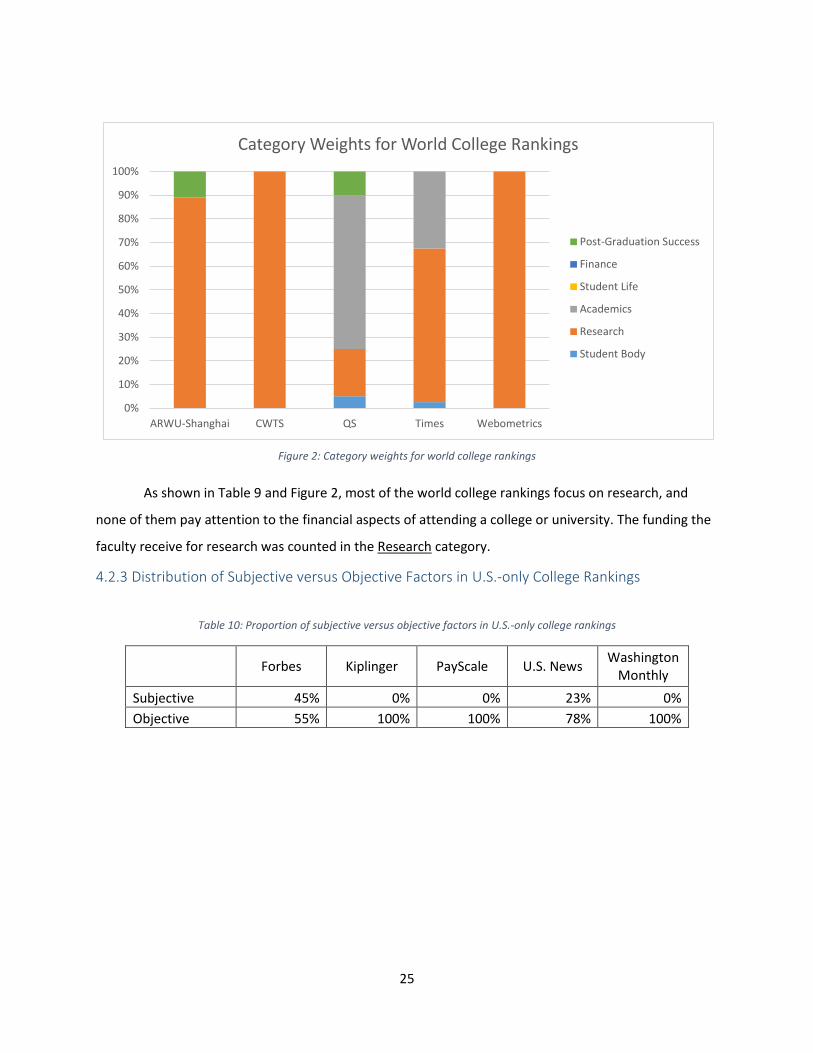
Figure 3: Subjective versus objective factors for U.S.-only college rankings
As the shown in Figure 3 and Table 10, both Forbes and U.S. News have combined the subjective
measurements and objective measurements in designing their rankings, while others, Kiplinger,
PayScale, and Washington Monthly only focus on objective measurements.
4.2.4 Distribution of Subjective versus Objective Factors in World College Rankings
Table 11: Proportion of subjective versus objective factors in world college rankings
ARWU-
Shanghai CWTS QS Times Webometrics
Subjective 0% 0% 50% 33% 0%
Objective 100% 100% 50% 67% 100%
0.00%
10.00%
20.00%
30.00%
40.00%
50.00%
60.00%
70.00%
80.00%
90.00%
100.00%
Distribution of Subjective versus Objective Factors in U.S.-only College Rankings
Student Body Research Academics Student Life
Finance Post-Graduation Success Subjective Objective
27
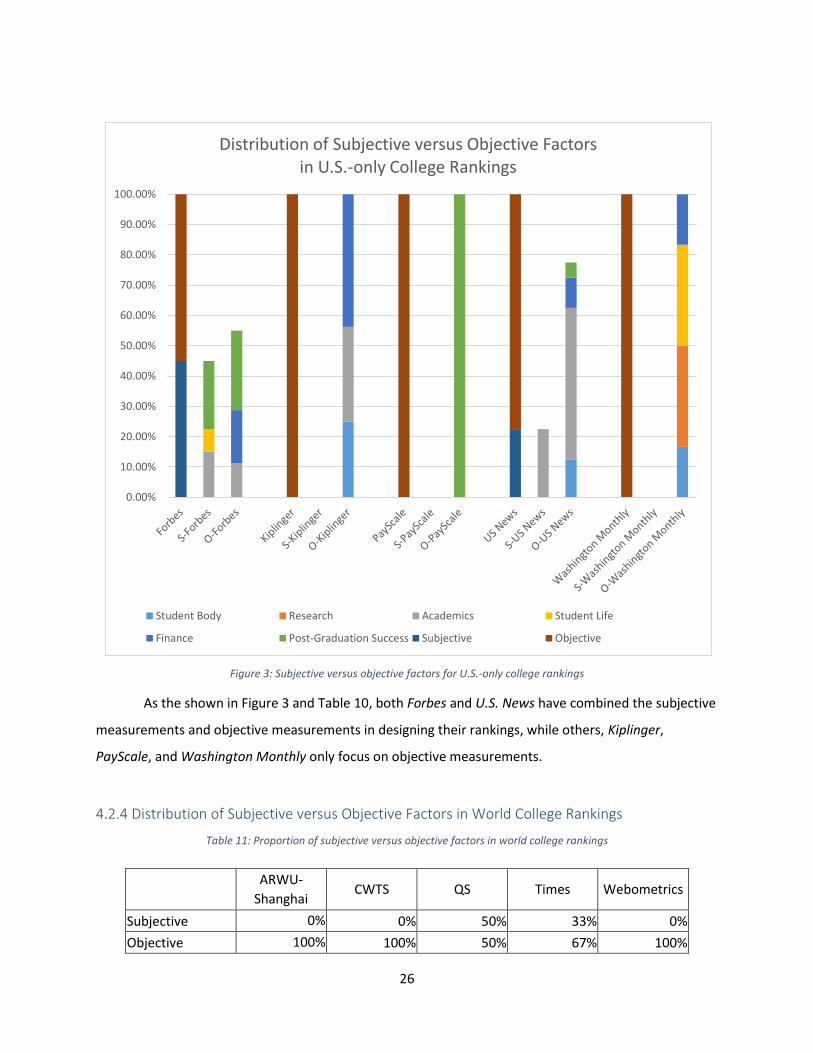
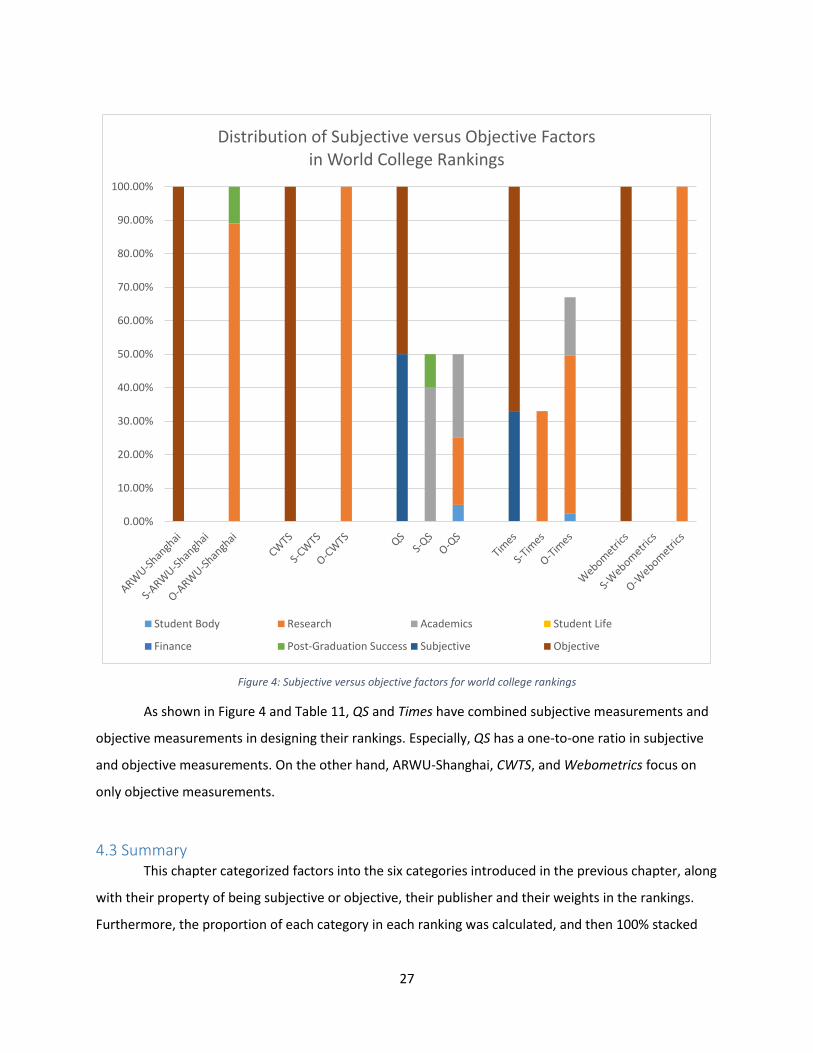
Figure 4: Subjective versus objective factors for world college rankings
As shown in Figure 4 and Table 11, QS and Times have combined subjective measurements and
objective measurements in designing their rankings. Especially, QS has a one-to-one ratio in subjective
and objective measurements. On the other hand, ARWU-Shanghai, CWTS, and Webometrics focus on
only objective measurements.
4.3 Summary This chapter categorized factors into the six categories introduced in the previous chapter, along
with their property of being subjective or objective, their publisher and their weights in the rankings.
Furthermore, the proportion of each category in each ranking was calculated, and then 100% stacked
0.00%
10.00%
20.00%
30.00%
40.00%
50.00%
60.00%
70.00%
80.00%
90.00%
100.00%
Distribution of Subjective versus Objective Factors in World College Rankings
Student Body Research Academics Student Life
Finance Post-Graduation Success Subjective Objective

28
bar graphs were generated to help better understand the composition of each ranking. The proportion
of subjective factors versus objective factors were calculated in a similar way. To compare people’s ideal
composition of rankings with the selected rankings, a survey was conducted to gather information, and
will be described in details in the following chapter.
29
5. Survey
5.1 Motivation for Producing a Survey
How much each of our six categories of factors is considered in various college rankings tells us
what the authors of the rankings to be important aspects of a college. What the authors of rankings
believe to be important aspects of a college differ wildly between the various rankings we examined. We
were curious as to how different the importance on categories placed by rankings were from what
people consider to be important factors in selecting a college for them. In order to determine what
categories people consider to be most important for a college, we designed a survey to be distributed
asking people how important each of our six categories were to them when they were considering
colleges.
The purpose of the survey was to generate data that would enable the determination of what
types of people consider to be important sets of factors in considering colleges. As noted in Chapter 4,
the world rankings tended to place a heavy emphasis on the Research category while the rankings that
only considered colleges in the United States tended to be more widely varied.
5.2 Survey Design
We generated our survey using Google Forms. Our survey was distributed by email to faculty,
graduate students, and a portion of undergraduate students at Worcester Polytechnic Institute. The
survey was also distributed to a small selection of respondents outside of Worcester Polytechnic
Institute, such as the relatives of the group members.
The screenshots of the survey can be found in the Appendix. Here is the URL of the survey:
https://docs.google.com/forms/d/1dYDDDUgJJ6fkTiv2vSac_L0IdlKAkBl3IHMEiPxFtd0/viewform?usp=sen
d_form
After taking the survey, respondents were allowed to see the summary of the responses so far.
In terms of the design of this survey, it was divided into the following five sections.
Section 1: General Familiarity with College Rankings and Related Resources
Section 1 takes one page, and is composed of two questions: one asks the importance of college
rankings, and the other asks the importance of other resources. By comparing the importance of college
rankings to that of other resources, the relevance of college rankings can be discovered.
30
Section 2: Categories
Section 2 takes two pages, and is composed of six questions. Each question asks the importance
of a category previously defined in Chapter 3. We want to know the importance of each of our
categories to our respondents.
Section 3: Importance of Subjective Factors vs. Objective Factors
Section 3 takes one page, and is composed of two questions that ask the respondents the
degree of importance of subjective and objective factors. We want to know how important subjective
and objective factors are to different groups of people.
Section 4: Familiarity with Each Ranking
This section takes one page, and is composed of three questions. Each question asks
respondents to check all of the rankings or online resources listed that they are familiar with. The results
permit the comparison of people’s familiarity with U.S. college rankings to that with world university
rankings, as well as to that with other resources.
Section 5: Demographic Information
This section takes one page, and is composed of eight questions. By gathering the data of age,
gender, region of residence, and whether they are enrolled in a college/university, we can better group
people, so that to analyze the difference of views toward college rankings. There was also a free
response question for people to write comments and thoughts about our survey.
5.3 Summary of Survey Responses
An analysis was performed on the results of the survey to determine the overall response to
each of the questions. Only responses received before April 2, 2014 were considered. We received a
total of 341 responses.
The primary area of interest was how respondents rated the importance of each of the six
categories. In order to produce an average, a numerical value to each possible response to the question
of how important each of the six categories were to them. The response “Not Important” was assigned a
value of 0, “Somewhat Important” a value of 1, “Important” a value of 2, “Very Important” a value of 3,
and “Extremely Important” a value of 4. Using these assigned values, the average value for the
31
importance of each of the six categories was determined. A similar process was performed on the
responses to the importance of Subjective versus Objective factors.
After values were assigned to the responses, those values could be used to compute a numerical
average. The values for the numerical average were used to generate a stacked bar graph in Microsoft
Excel.
Section 1: General Questions
Section 1 of the survey asked two questions. The first question was how important college
rankings are to the respondent in considering colleges. The purpose of this question is to determine just
how important college rankings are in general to respondents and their general familiarity with them.
The second question asks how important other resources to the respondent in considering colleges are.
An example of a resource would be a guidebook such as the Princeton Review.
Question 1: How important are college rankings, such as U.S. News and World Report and Forbes, to
you in considering colleges?
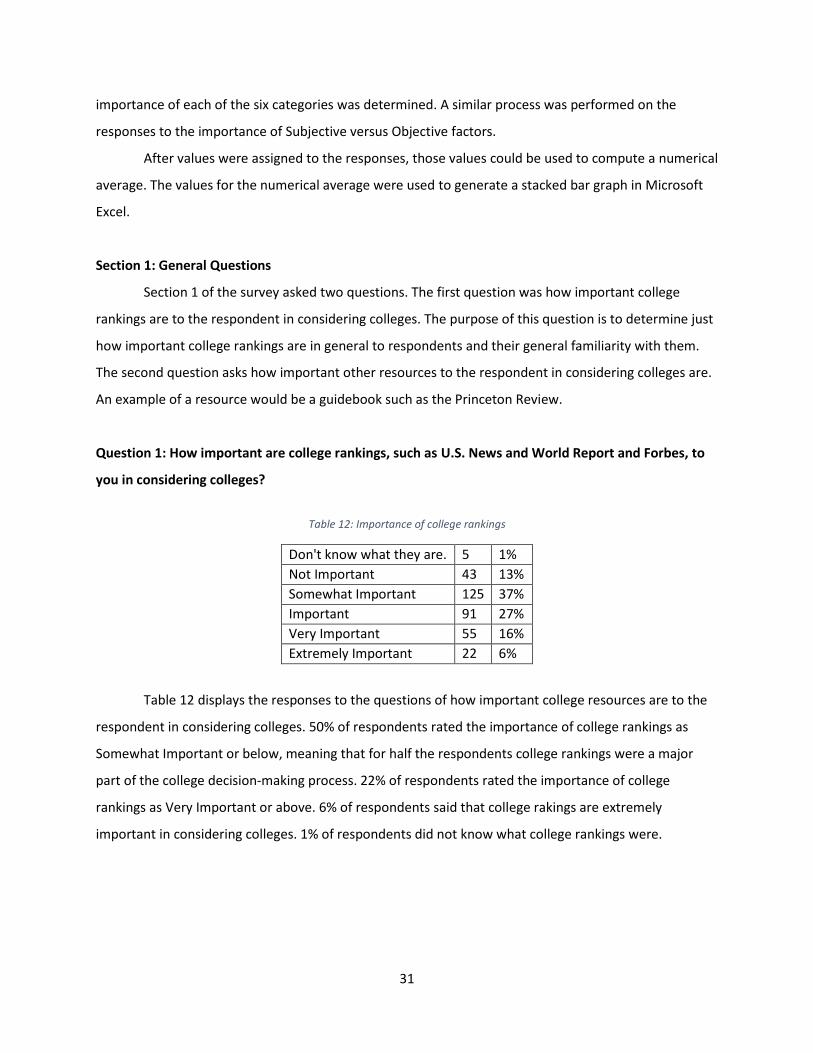
Table 12: Importance of college rankings
Don't know what they are. 5 1%
Not Important 43 13%
Somewhat Important 125 37%
Important 91 27%
Very Important 55 16%
Extremely Important 22 6%
Table 12 displays the responses to the questions of how important college resources are to the
respondent in considering colleges. 50% of respondents rated the importance of college rankings as
Somewhat Important or below, meaning that for half the respondents college rankings were a major
part of the college decision-making process. 22% of respondents rated the importance of college
rankings as Very Important or above. 6% of respondents said that college rakings are extremely
important in considering colleges. 1% of respondents did not know what college rankings were.
32
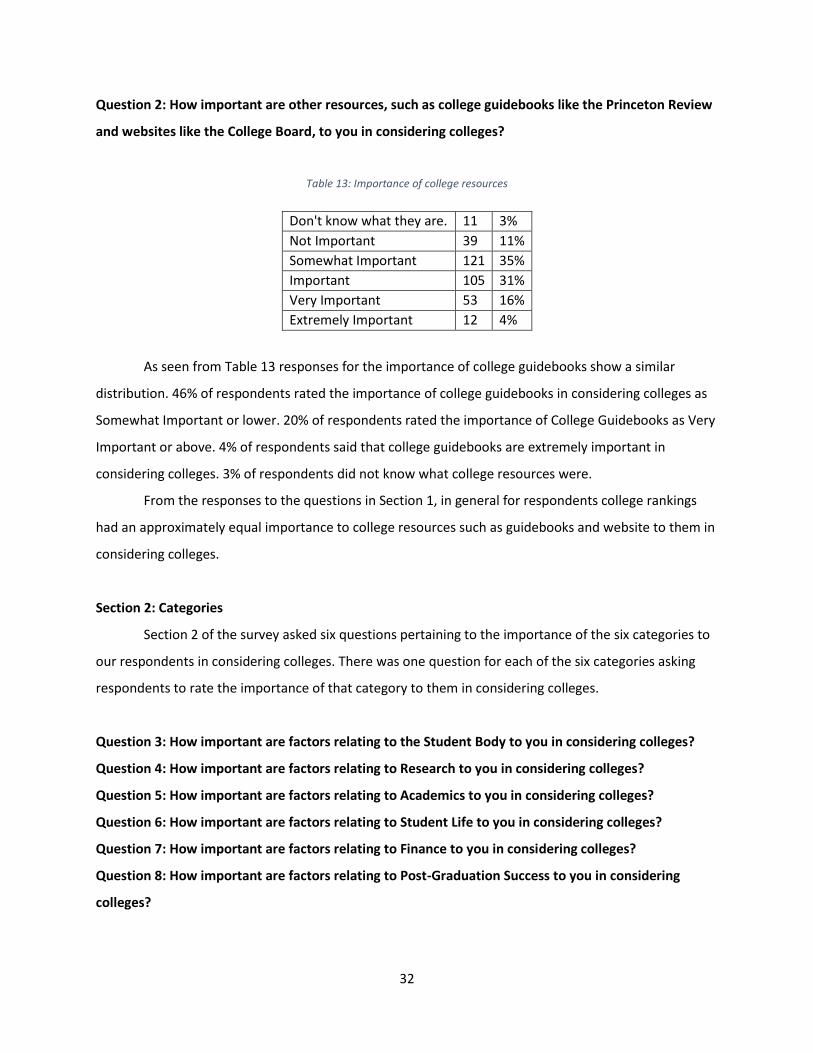
Question 2: How important are other resources, such as college guidebooks like the Princeton Review
and websites like the College Board, to you in considering colleges?
Table 13: Importance of college resources
Don't know what they are. 11 3%
Not Important 39 11%
Somewhat Important 121 35%
Important 105 31%
Very Important 53 16%
Extremely Important 12 4%
As seen from Table 13 responses for the importance of college guidebooks show a similar
distribution. 46% of respondents rated the importance of college guidebooks in considering colleges as
Somewhat Important or lower. 20% of respondents rated the importance of College Guidebooks as Very
Important or above. 4% of respondents said that college guidebooks are extremely important in
considering colleges. 3% of respondents did not know what college resources were.
From the responses to the questions in Section 1, in general for respondents college rankings
had an approximately equal importance to college resources such as guidebooks and website to them in
considering colleges.
Section 2: Categories
Section 2 of the survey asked six questions pertaining to the importance of the six categories to
our respondents in considering colleges. There was one question for each of the six categories asking
respondents to rate the importance of that category to them in considering colleges.
Question 3: How important are factors relating to the Student Body to you in considering colleges?
Question 4: How important are factors relating to Research to you in considering colleges?
Question 5: How important are factors relating to Academics to you in considering colleges?
Question 6: How important are factors relating to Student Life to you in considering colleges?
Question 7: How important are factors relating to Finance to you in considering colleges?
Question 8: How important are factors relating to Post-Graduation Success to you in considering
colleges?
33
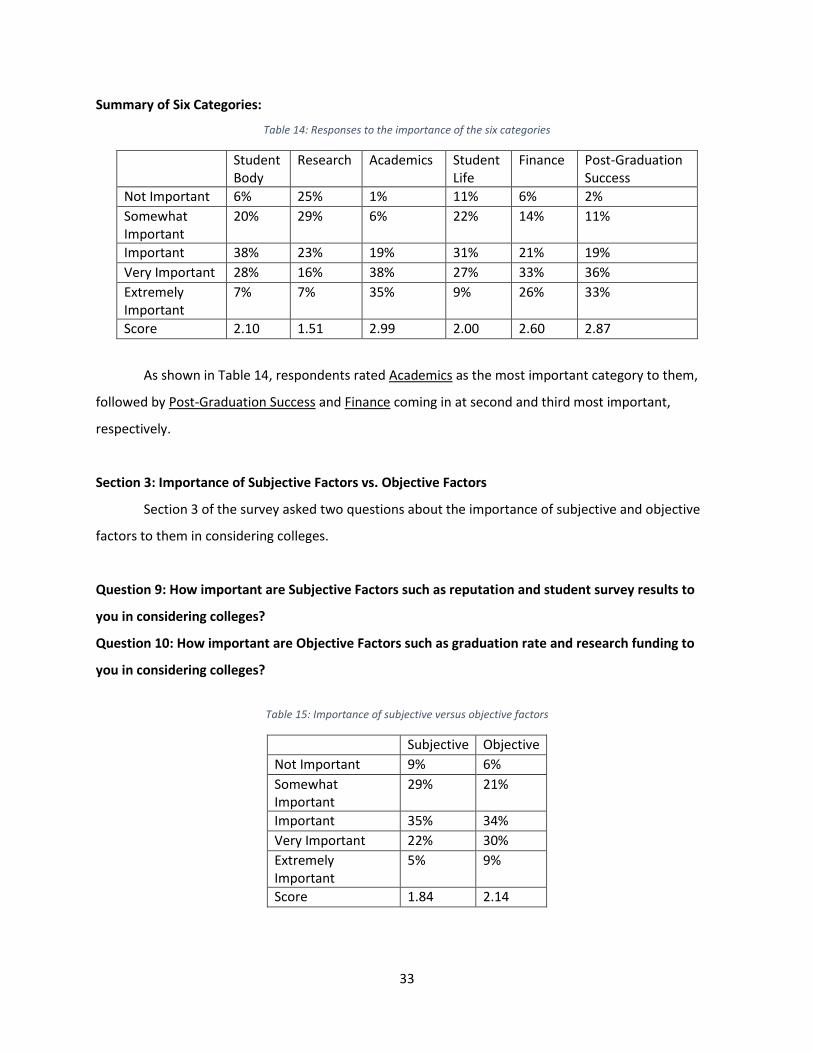
Summary of Six Categories:
Table 14: Responses to the importance of the six categories
Student Body
Research Academics Student Life
Finance Post-Graduation Success
Not Important 6% 25% 1% 11% 6% 2%
Somewhat Important
20% 29% 6% 22% 14% 11%
Important 38% 23% 19% 31% 21% 19%
Very Important 28% 16% 38% 27% 33% 36%
Extremely Important
7% 7% 35% 9% 26% 33%
Score 2.10 1.51 2.99 2.00 2.60 2.87
As shown in Table 14, respondents rated Academics as the most important category to them,
followed by Post-Graduation Success and Finance coming in at second and third most important,
respectively.
Section 3: Importance of Subjective Factors vs. Objective Factors
Section 3 of the survey asked two questions about the importance of subjective and objective
factors to them in considering colleges.
Question 9: How important are Subjective Factors such as reputation and student survey results to
you in considering colleges?
Question 10: How important are Objective Factors such as graduation rate and research funding to
you in considering colleges?
Table 15: Importance of subjective versus objective factors
Subjective Objective
Not Important 9% 6%
Somewhat Important
29% 21%
Important 35% 34%
Very Important 22% 30%
Extremely Important
5% 9%
Score 1.84 2.14
34
Based on the average score, objective factors appear to be more important to respondents in
considering colleges. The difference in average score between subjective and objective factors is
statistically significant at a 95% confidence level.
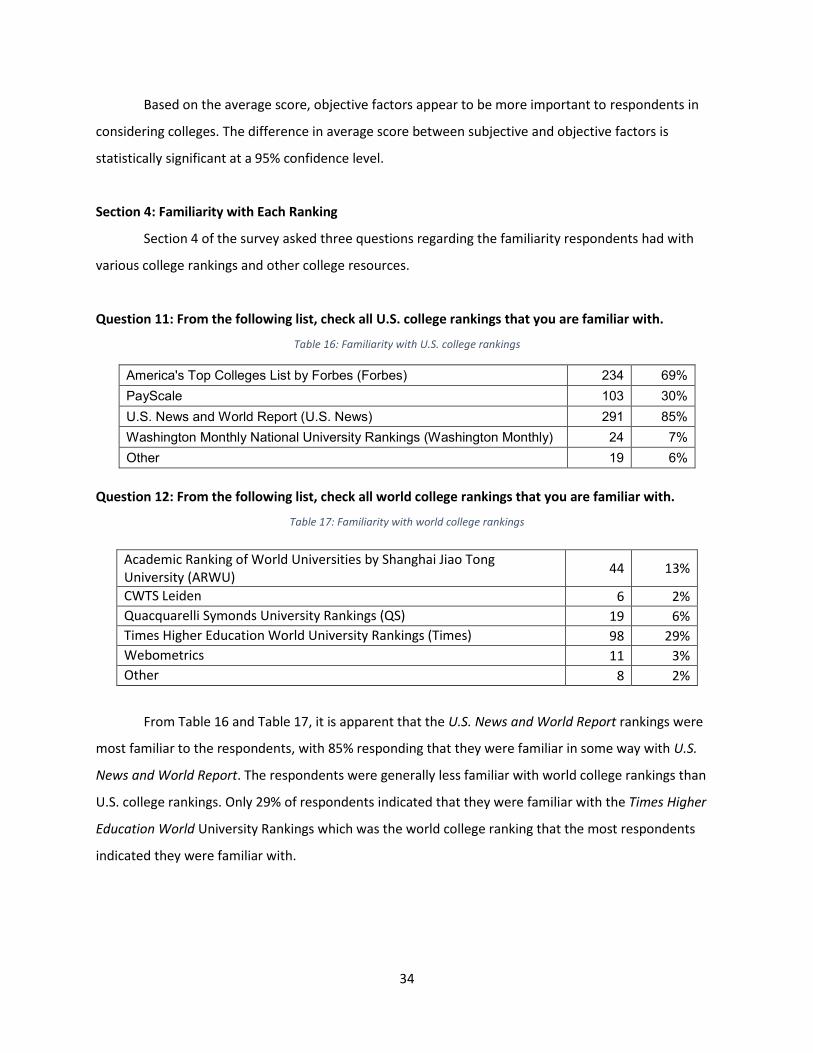
Section 4: Familiarity with Each Ranking
Section 4 of the survey asked three questions regarding the familiarity respondents had with
various college rankings and other college resources.
Question 11: From the following list, check all U.S. college rankings that you are familiar with.
Table 16: Familiarity with U.S. college rankings
America's Top Colleges List by Forbes (Forbes) 234 69%
PayScale 103 30%
U.S. News and World Report (U.S. News) 291 85%
Washington Monthly National University Rankings (Washington Monthly) 24 7%
Other 19 6%
Question 12: From the following list, check all world college rankings that you are familiar with.
Table 17: Familiarity with world college rankings
Academic Ranking of World Universities by Shanghai Jiao Tong University (ARWU)
44 13%
CWTS Leiden 6 2%
Quacquarelli Symonds University Rankings (QS) 19 6%
Times Higher Education World University Rankings (Times) 98 29%
Webometrics 11 3%
Other 8 2%
From Table 16 and Table 17, it is apparent that the U.S. News and World Report rankings were
most familiar to the respondents, with 85% responding that they were familiar in some way with U.S.
News and World Report. The respondents were generally less familiar with world college rankings than
U.S. college rankings. Only 29% of respondents indicated that they were familiar with the Times Higher
Education World University Rankings which was the world college ranking that the most respondents
indicated they were familiar with.
35
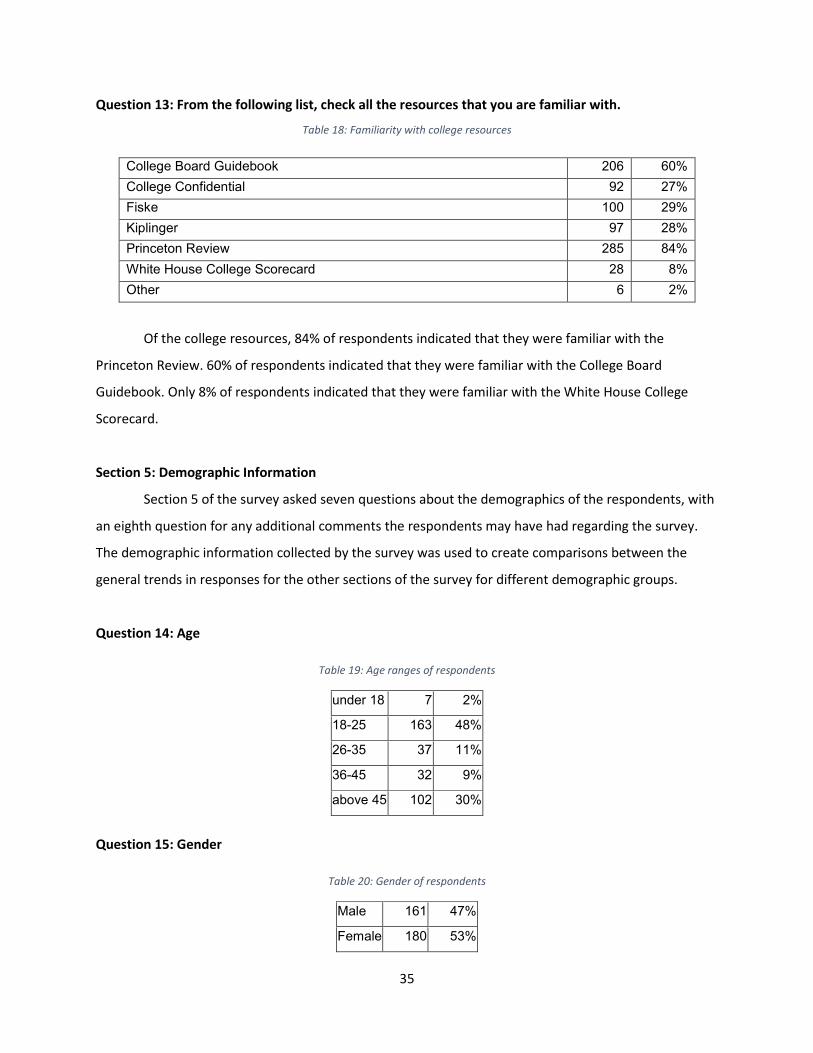
Question 13: From the following list, check all the resources that you are familiar with.
Table 18: Familiarity with college resources
College Board Guidebook 206 60%
College Confidential 92 27%
Fiske 100 29%
Kiplinger 97 28%
Princeton Review 285 84%
White House College Scorecard 28 8%
Other 6 2%
Of the college resources, 84% of respondents indicated that they were familiar with the
Princeton Review. 60% of respondents indicated that they were familiar with the College Board
Guidebook. Only 8% of respondents indicated that they were familiar with the White House College
Scorecard.
Section 5: Demographic Information
Section 5 of the survey asked seven questions about the demographics of the respondents, with
an eighth question for any additional comments the respondents may have had regarding the survey.
The demographic information collected by the survey was used to create comparisons between the
general trends in responses for the other sections of the survey for different demographic groups.
Question 14: Age
Table 19: Age ranges of respondents
under 18 7 2%
18-25 163 48%
26-35 37 11%
36-45 32 9%
above 45 102 30%
Question 15: Gender
Table 20: Gender of respondents
Male 161 47%
Female 180 53%

36
Question 16: In what region of the world is your residence?
Table 21: Residence of respondents
United States 290 85%
Africa 1 0%
Asia 36 11%
Australia/Oceania 4 1%
Europe 7 2%
North America, excluding United States 2 1%
South America 1 0%
Of particular interest are the locations of primary residence indicated by the respondents. 85%
of respondents indicated that their residence was within the United States. 11% of respondents
indicated that their primary residence was in Asia.
Question 17: Are you planning on attending a college/university?
Table 22: Future plans for college or university attendance of respondents
Yes 162 49%
No 172 51%
Question 18: Are you currently enrolled in a college/university?
Table 23: Current college or university attendance of respondents
Yes 177 52%
No 161 48%
Question 19: Have you previously enrolled in a college/university?
Table 24: Previous college or university attendance of respondents
Yes 245 72%
No 94 28%
Question 20: Are you a parent that has a child planning to enroll or are currently enrolled in a
college/university?
37
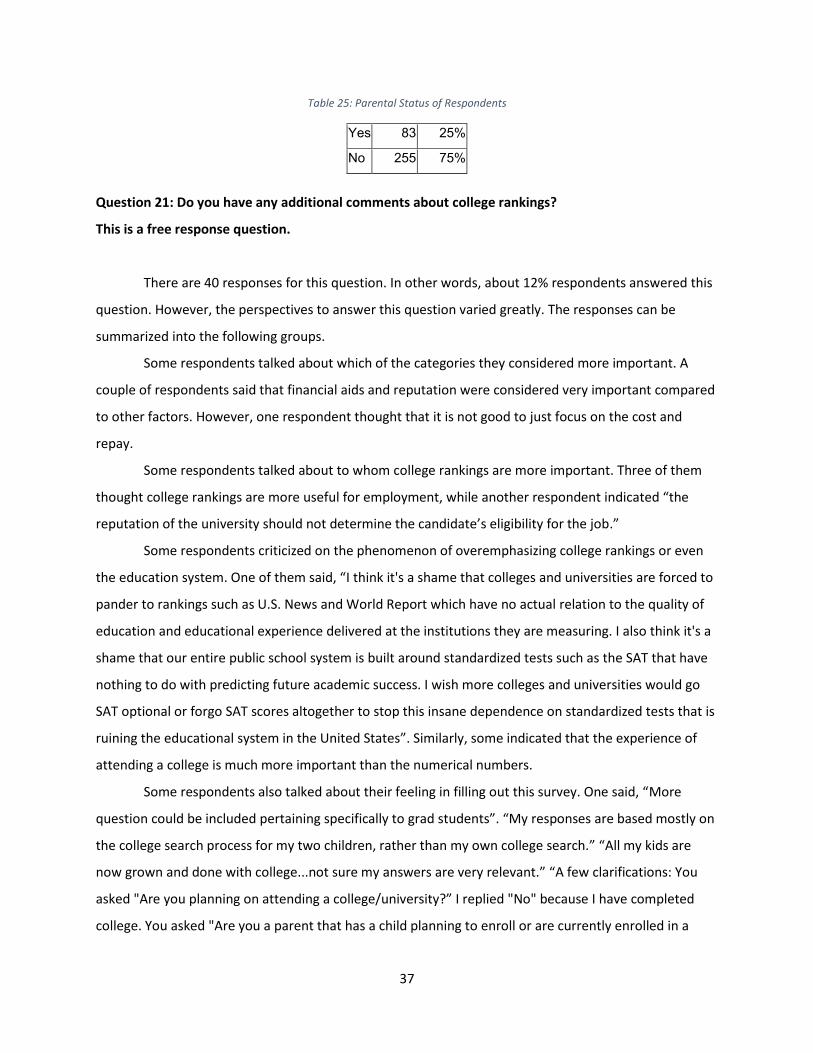
Table 25: Parental Status of Respondents
Yes 83 25%
No 255 75%
Question 21: Do you have any additional comments about college rankings?
This is a free response question.
There are 40 responses for this question. In other words, about 12% respondents answered this
question. However, the perspectives to answer this question varied greatly. The responses can be
summarized into the following groups.
Some respondents talked about which of the categories they considered more important. A
couple of respondents said that financial aids and reputation were considered very important compared
to other factors. However, one respondent thought that it is not good to just focus on the cost and
repay.
Some respondents talked about to whom college rankings are more important. Three of them
thought college rankings are more useful for employment, while another respondent indicated “the
reputation of the university should not determine the candidate’s eligibility for the job.”
Some respondents criticized on the phenomenon of overemphasizing college rankings or even
the education system. One of them said, “I think it's a shame that colleges and universities are forced to
pander to rankings such as U.S. News and World Report which have no actual relation to the quality of
education and educational experience delivered at the institutions they are measuring. I also think it's a
shame that our entire public school system is built around standardized tests such as the SAT that have
nothing to do with predicting future academic success. I wish more colleges and universities would go
SAT optional or forgo SAT scores altogether to stop this insane dependence on standardized tests that is
ruining the educational system in the United States”. Similarly, some indicated that the experience of
attending a college is much more important than the numerical numbers.
Some respondents also talked about their feeling in filling out this survey. One said, “More
question could be included pertaining specifically to grad students”. “My responses are based mostly on
the college search process for my two children, rather than my own college search.” “All my kids are
now grown and done with college...not sure my answers are very relevant.” “A few clarifications: You
asked "Are you planning on attending a college/university?” I replied "No" because I have completed
college. You asked "Are you a parent that has a child planning to enroll or are currently enrolled in a
38
college/university?” I replied "No" because my children have completed college. Of course, your survey
might not have been designed for faculty. But we do respond to surveys. Sometimes.”
There are also three ambiguous responses among the 40 responses. So there are 37 valid
responses for this question.
5.4 Summary
This chapter described the survey used to gather people’s opinions regarding college rankings.
Specifically, the motivation of conducting this survey, the design of this survey, and basic summary of
the survey responses were addressed in this chapter. In the next chapter, the responses will be further
analyzed based on the demographic information.
39
6. Analysis of Survey Results
After getting the raw results, an analysis was performed to see whether the importance of
categories and subjective versus objective factors differ based on demographic. Five pairwise
comparisons were produced. The first comparison was between respondents whose residence was in
the United States and those whose residence was outside of the United States. The second comparison
compared the responses of younger respondents against those of older respondents. The third
comparison was between male and female respondents. The fourth comparison was between
respondents who indicated that they were parents of students planning to enroll or were currently
enrolled in college and students in college. The final comparison was between respondents who were
planning to enroll in college and respondents who indicated that they were parents. A z-test was
performed on the samples in the pairwise comparisons to check if any differences between the two
were statistically significant. A z-test finds the confidence interval for each group then compares the
confidence intervals to see if they overlap or not. If they overlap then the result is not statistically
significant. If they do not overlap the result is statistically significant. The formula for confidence interval
can be found by using the formula
μ ± S ×𝜎
√𝑛
where μ is the mean of the score, S is the test-statistic, n is the sample size of that particular
group. The test-statistic is a constant used to determine the margin of error. For a 95% confidence level
the test-statistic is 1.96 and for a 90% confidence level it is 1.645.
In each of the comparisons, the importance of the six categories was compared first. A stacked
bar graph was generated for each of the sample groups being compared for the importance of the six
categories. The stacked bar graph displays each score as a percentage of the total numerical score for
each sample group, in order to determine percentage-wise how important that category is to them in
considering colleges. Then the importance of subjective versus objective factors was compared. For the
importance of subjective versus objective factors, a stacked bar graph was not generated due to the
small amount of variables.
6.1 Comparison of Responses between United States and non-United States Residents
In Chapter 4 it was noted that the world university rankings tend to place a heavier emphasis on
the research aspect in their rankings than the U.S. college rankings did. To determine if the emphasis on

40
the Research category is justified, a comparison was performed between U.S. and non-U.S. respondents
to determine if the non-U.S. respondents on average rated Research higher than their U.S. counterparts.
6.1.1 Importance of Six Categories
Table 26: Importance of six categories for U.S. versus non-U.S. residents
U.S. non-U.S. Difference
Student Body 2.10 2.12 -0.02
Research 1.39 2.16 -0.77
Academics 3.02 2.80 0.22
Student Life 2.03 1.80 0.23
Finance 2.64 2.31 0.33
Post-Graduation Success 2.91 2.63 0.28
After performing a z-test on the importance of categories for United States residents versus
non-United States residents, only the research category possessed a statistically significant difference
between the two scores at a 95% confidence level. The result proves the initial hypothesis suggested by
the difference in compositions of categories used to generate the U.S.-only versus worldwide rankings
correct, that non-U.S. residents rated Research higher than U.S. residents. However the difference is not
as large as the importance that worldwide university rankings place on Research suggests. Figure 5
displays the importance of the six categories for U.S. and non-U.S. respondents.
Figure 5: Importance of six categories by U.S. versus non-U.S. residents
0%
10%
20%
30%
40%
50%
60%
70%
80%
90%
100%
US non-US
Importance of Six Categories by US vs non-US Residents
Post-Graduation Success
Finance
Student Life
Academics
Research
Student Body
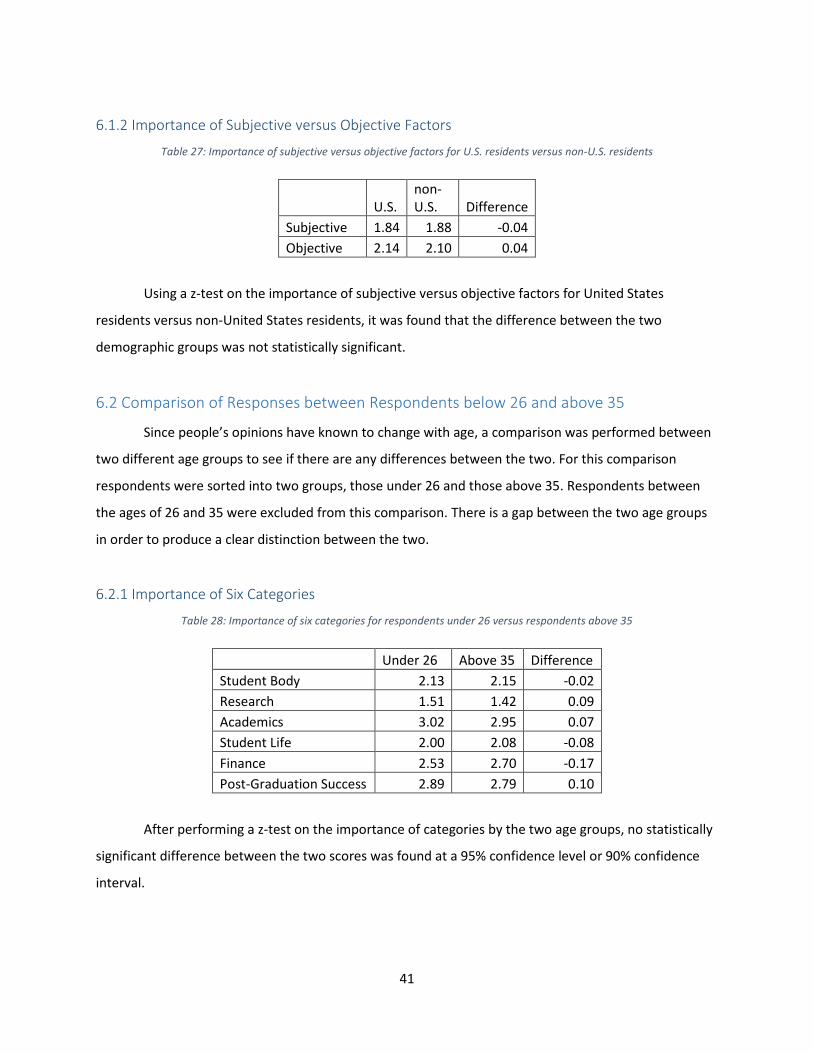
41
6.1.2 Importance of Subjective versus Objective Factors
Table 27: Importance of subjective versus objective factors for U.S. residents versus non-U.S. residents
U.S. non-U.S. Difference
Subjective 1.84 1.88 -0.04
Objective 2.14 2.10 0.04
Using a z-test on the importance of subjective versus objective factors for United States
residents versus non-United States residents, it was found that the difference between the two
demographic groups was not statistically significant.
6.2 Comparison of Responses between Respondents below 26 and above 35
Since people’s opinions have known to change with age, a comparison was performed between
two different age groups to see if there are any differences between the two. For this comparison
respondents were sorted into two groups, those under 26 and those above 35. Respondents between
the ages of 26 and 35 were excluded from this comparison. There is a gap between the two age groups
in order to produce a clear distinction between the two.
6.2.1 Importance of Six Categories
Table 28: Importance of six categories for respondents under 26 versus respondents above 35
Under 26 Above 35 Difference
Student Body 2.13 2.15 -0.02
Research 1.51 1.42 0.09
Academics 3.02 2.95 0.07
Student Life 2.00 2.08 -0.08
Finance 2.53 2.70 -0.17
Post-Graduation Success 2.89 2.79 0.10
After performing a z-test on the importance of categories by the two age groups, no statistically
significant difference between the two scores was found at a 95% confidence level or 90% confidence
interval.
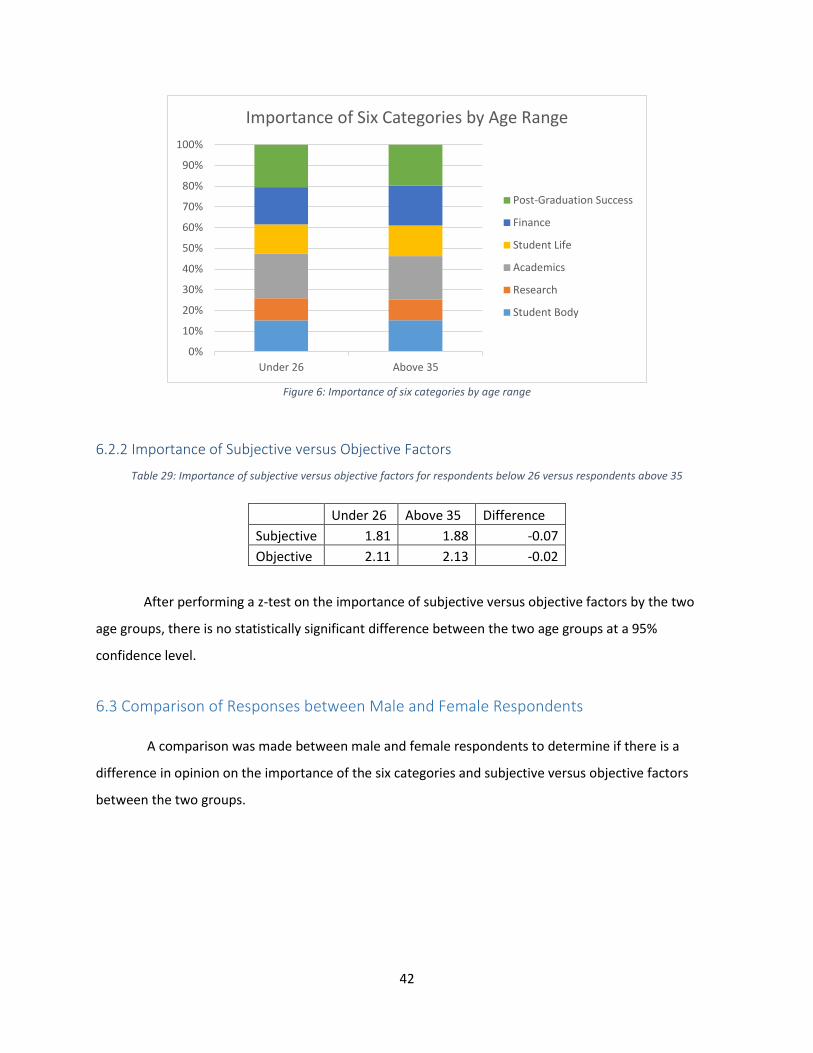
42
Figure 6: Importance of six categories by age range
6.2.2 Importance of Subjective versus Objective Factors
Table 29: Importance of subjective versus objective factors for respondents below 26 versus respondents above 35
Under 26 Above 35 Difference
Subjective 1.81 1.88 -0.07
Objective 2.11 2.13 -0.02
After performing a z-test on the importance of subjective versus objective factors by the two
age groups, there is no statistically significant difference between the two age groups at a 95%
confidence level.
6.3 Comparison of Responses between Male and Female Respondents
A comparison was made between male and female respondents to determine if there is a
difference in opinion on the importance of the six categories and subjective versus objective factors
between the two groups.
0%
10%
20%
30%
40%
50%
60%
70%
80%
90%
100%
Under 26 Above 35
Importance of Six Categories by Age Range
Post-Graduation Success
Finance
Student Life
Academics
Research
Student Body
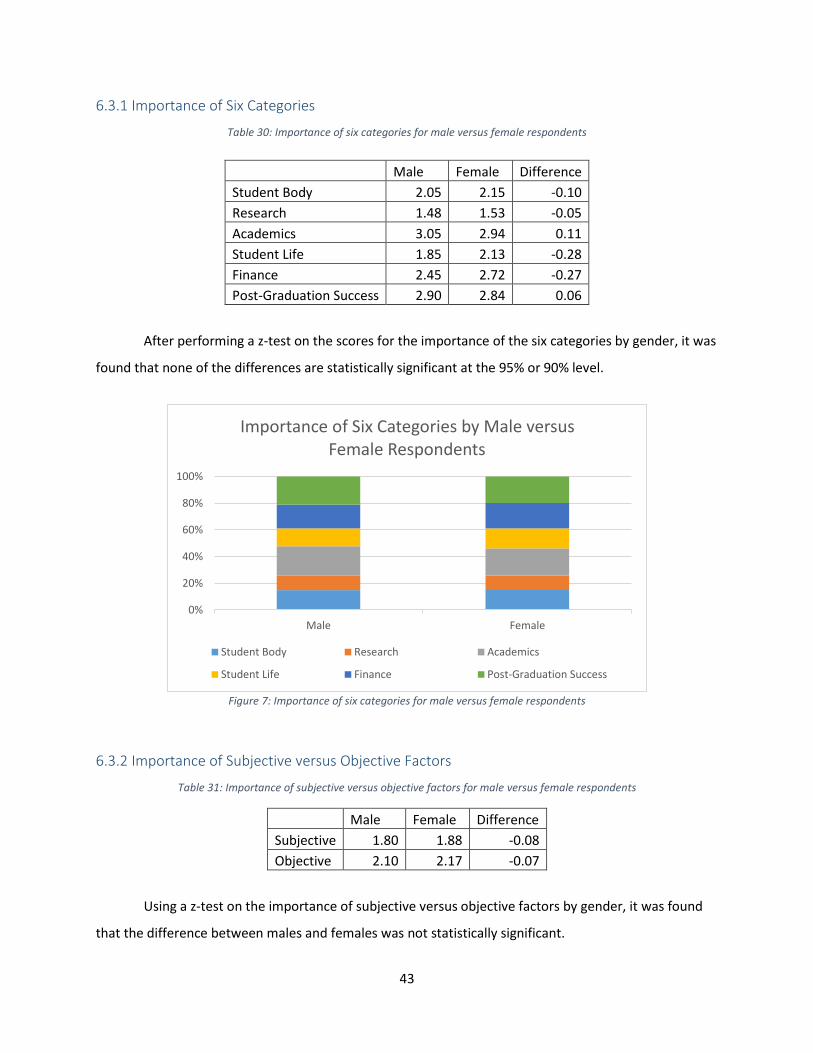
43
6.3.1 Importance of Six Categories
Table 30: Importance of six categories for male versus female respondents
Male Female Difference
Student Body 2.05 2.15 -0.10
Research 1.48 1.53 -0.05
Academics 3.05 2.94 0.11
Student Life 1.85 2.13 -0.28
Finance 2.45 2.72 -0.27
Post-Graduation Success 2.90 2.84 0.06
After performing a z-test on the scores for the importance of the six categories by gender, it was
found that none of the differences are statistically significant at the 95% or 90% level.
Figure 7: Importance of six categories for male versus female respondents
6.3.2 Importance of Subjective versus Objective Factors
Table 31: Importance of subjective versus objective factors for male versus female respondents
Male Female Difference
Subjective 1.80 1.88 -0.08
Objective 2.10 2.17 -0.07
Using a z-test on the importance of subjective versus objective factors by gender, it was found
that the difference between males and females was not statistically significant.
0%
20%
40%
60%
80%
100%
Male Female
Importance of Six Categories by Male versus Female Respondents
Student Body Research Academics
Student Life Finance Post-Graduation Success

44
6.4 Comparison of Responses between Current Students and Parents
This comparison was done between the respondents who said yes for Question 18, (namely they
are currently enrolled in a college) and the respondents who said yes for Question 20, (namely they are
parents that are parents who have children planning to go to college or are currently enrolled).
The hypothesis is that there might be difference between these groups because of their life
status, and therefore this comparison was performed to determine if there was any difference.
6.4.1 Importance of the Six Categories
Table 32: Importance of the six categories for current students versus parents
Current Students Parents Difference
Student Body 2.03 2.24 -0.21
Research 1.58 1.34 0.24
Academics 2.97 2.88 0.09
Student Life 1.81 2.28 -0.47
Finance 2.49 2.57 -0.08
Post-Graduation Success 2.89 2.72 0.17
At a 95% confidence level, there is a statistically significant difference between the scores of
Student Life, which means that parents tend to value more on Student Life than current students.

45
Figure 8: Importance of the six categories for current students versus parents
6.4.2 Importance of Subjective versus Objective Factors
Table 33: Importance of subjective versus objective factors for current students versus parents
Current Students Parents Difference
Subjective 1.76 1.84 -0.08
Objective 2.09 2.07 0.02
A z-test performed on the two samples did not find any statistically significant difference at
either the 95% or 90% confidence level.
6.5 Comparison of Responses between Future Students and Parents
This comparison was done to check whether there existed a difference between respondents
who indicated they were planning to enroll and respondents who indicated that they were parents who
had children planning to enroll or currently enrolled in a college. The comparison determines if there is
any difference between what people planning to enroll in college believe is important in a college and
what parents believe is important.
Similarly to the previous section, it was hypothesized that there might be a difference between
these two groups.
0%
10%
20%
30%
40%
50%
60%
70%
80%
90%
100%
Current Students Parents
Importance of Six Categories for Current Students versus Parents
Post-Graduation Success
Finance
Student Life
Academics
Research
Student Body

46
6.5.1 Importance of Six Categories
Table 34: Importance of six categories for future students versus parents
Future Students Parents Difference
Student Body 2.07 2.24 -0.17
Research 1.51 1.34 0.17
Academics 2.98 2.88 0.10
Student Life 1.93 2.28 -0.35
Finance 2.57 2.57 0.00
Post-Graduation Success 1.94 2.72 -0.78
A z-test was performed to compare the responses of future students against those of parents. It
was found that the average score for the category of Post-Graduation Success showed a statistically
significant difference between the two groups at the 95% confidence level. Parents rated the
importance of Post-Graduation Success higher on average than those that indicated that they were
planning to enroll in the future. At the 90% confidence level the scores for Student Life showed a
statistically significant difference between the two groups. Again, parents on average rated the
importance of Student Life higher than the future students.
Figure 9: Importance of six categories for future students versus parents
0%
10%
20%
30%
40%
50%
60%
70%
80%
90%
100%
Future Students Parents
Importance of Six Categories for Future Students versus Parents
Post-Graduation Success
Finance
Student Life
Academics
Research
Student Body
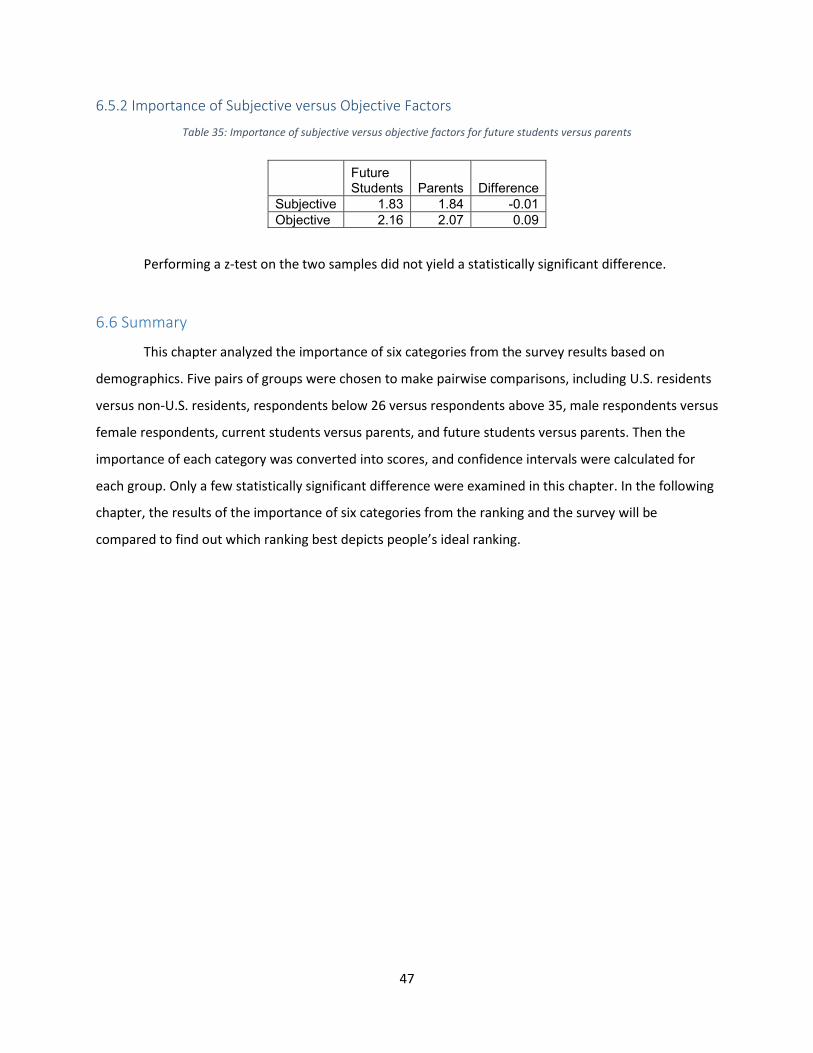
47
6.5.2 Importance of Subjective versus Objective Factors
Table 35: Importance of subjective versus objective factors for future students versus parents
Future Students Parents Difference
Subjective 1.83 1.84 -0.01
Objective 2.16 2.07 0.09
Performing a z-test on the two samples did not yield a statistically significant difference.
6.6 Summary
This chapter analyzed the importance of six categories from the survey results based on
demographics. Five pairs of groups were chosen to make pairwise comparisons, including U.S. residents
versus non-U.S. residents, respondents below 26 versus respondents above 35, male respondents versus
female respondents, current students versus parents, and future students versus parents. Then the
importance of each category was converted into scores, and confidence intervals were calculated for
each group. Only a few statistically significant difference were examined in this chapter. In the following
chapter, the results of the importance of six categories from the ranking and the survey will be
compared to find out which ranking best depicts people’s ideal ranking.
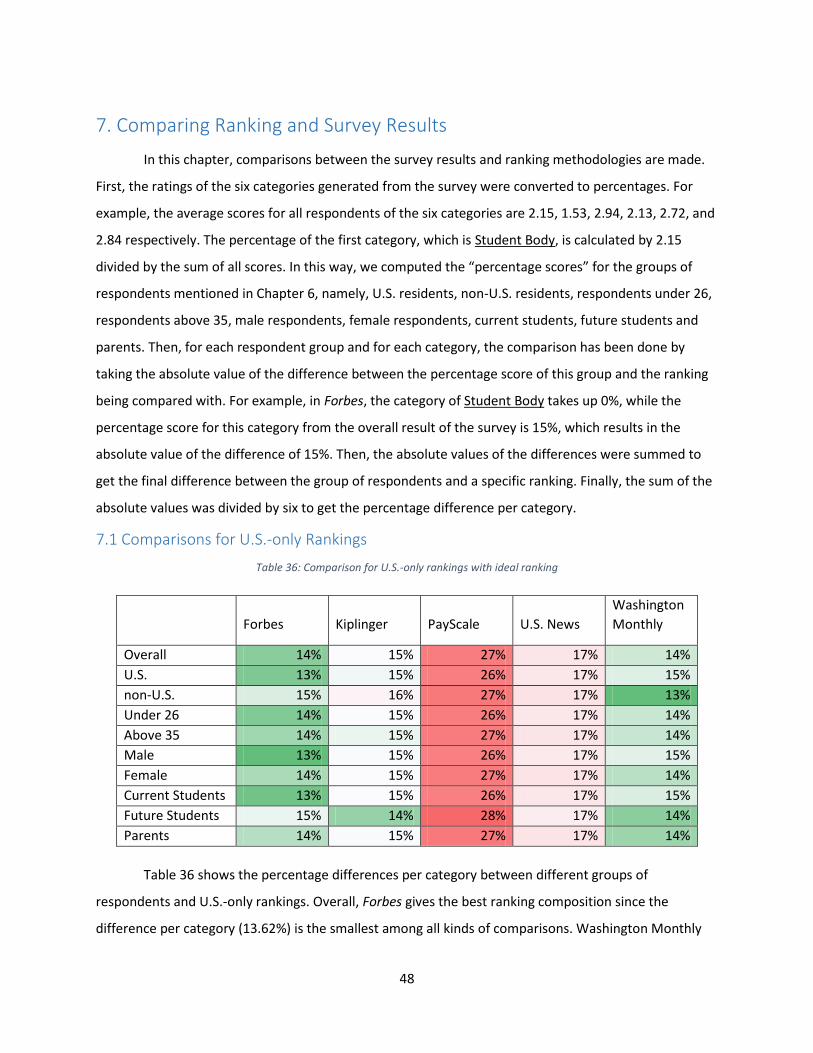
48
7. Comparing Ranking and Survey Results
In this chapter, comparisons between the survey results and ranking methodologies are made.
First, the ratings of the six categories generated from the survey were converted to percentages. For
example, the average scores for all respondents of the six categories are 2.15, 1.53, 2.94, 2.13, 2.72, and
2.84 respectively. The percentage of the first category, which is Student Body, is calculated by 2.15
divided by the sum of all scores. In this way, we computed the “percentage scores” for the groups of
respondents mentioned in Chapter 6, namely, U.S. residents, non-U.S. residents, respondents under 26,
respondents above 35, male respondents, female respondents, current students, future students and
parents. Then, for each respondent group and for each category, the comparison has been done by
taking the absolute value of the difference between the percentage score of this group and the ranking
being compared with. For example, in Forbes, the category of Student Body takes up 0%, while the
percentage score for this category from the overall result of the survey is 15%, which results in the
absolute value of the difference of 15%. Then, the absolute values of the differences were summed to
get the final difference between the group of respondents and a specific ranking. Finally, the sum of the
absolute values was divided by six to get the percentage difference per category.
7.1 Comparisons for U.S.-only Rankings
Table 36: Comparison for U.S.-only rankings with ideal ranking
Forbes Kiplinger PayScale U.S. News
Washington
Monthly
Overall 14% 15% 27% 17% 14%
U.S. 13% 15% 26% 17% 15%
non-U.S. 15% 16% 27% 17% 13%
Under 26 14% 15% 26% 17% 14%
Above 35 14% 15% 27% 17% 14%
Male 13% 15% 26% 17% 15%
Female 14% 15% 27% 17% 14%
Current Students 13% 15% 26% 17% 15%
Future Students 15% 14% 28% 17% 14%
Parents 14% 15% 27% 17% 14%
Table 36 shows the percentage differences per category between different groups of
respondents and U.S.-only rankings. Overall, Forbes gives the best ranking composition since the
difference per category (13.62%) is the smallest among all kinds of comparisons. Washington Monthly

49
comes to the second with a difference per category of 14.49%. For almost all groups, Forbes, Kiplinger,
and Washington Monthly have similar differences per category. The percentage difference per category
of U.S. News is slightly larger (17.08%), and the largest is that of PayScale (26.53%). It is reasonable that
Forbes, Kiplinger and Washington Monthly come to the top because all of them have at least three
categories in their methodologies for rankings. U.S. News results in a bigger difference than these three
because the category of Academics takes up more than half of the weights, and consequently gives a
bigger difference. On the other hand, PayScale gives the largest difference simply because it focuses on
the Post-Graduation Success only.
7.2 Comparisons for World Rankings
Table 37: Comparison for world rankings with ideal ranking
ARWU-Shanghai CWTS QS Times Webometrics
Overall 26% 30% 18% 22% 30%
U.S. 26% 30% 18% 22% 30%
non-U.S. 24% 28% 16% 21% 28%
Under 26 26% 30% 18% 22% 30%
Above 35 26% 30% 18% 22% 30%
Male 26% 30% 17% 22% 30%
Female 26% 30% 18% 22% 30%
Current Students 26% 30% 17% 21% 30%
Future Students 26% 29% 17% 21% 29%
Parents 26% 30% 18% 22% 30%
Table 37 shows the percentage differences per category between different groups of
respondents and world rankings when compared with those of U.S.-only rankings. Overall, all the
rankings differ from respondents’ ideal ranking composition by a large difference. The best match in the
world rankings is QS, which gives about 18% difference, then followed by Times, ARWU-Shanghai, CWTS
and Webometrics. CWTS and Webometrics always have the same difference, because both of them put
100% weight to the Research category.
The result of this chapter doesn’t show the best ranking necessarily. The ranking with the lowest
difference to respondents’ opinions results from a relatively balanced composition of the six categories.
So, we suggest using this ranking to get an overall sense of which college is better, but choosing a
college is way more complicated. Based on how closely the ranking weights match that of weights given
by respondents, Forbes would be the best ranking.
50
7.3 Summary
This chapter compared the survey results to rankings to find out the best ranking in terms of
people’s needs. The ideal proportion of six categories from the five pairs of groups mentioned in the
previous chapter were compared to the real composition of the selected rankings mentioned in Chapter
4. The difference per category was calculated between each group and each ranking. It was found that
the ranking published by Forbes came to the top among all rankings in terms of proportion of six
categories. In the next chapter, final conclusion and future work will be addressed.
51
8. Conclusion
8.1 Summary
According to the survey results, the overall scores for six categories (Student Body, Research,
Academics, Student Life, Finance, and Post-Graduation Success) were 2.1, 1.5, 3.0, 2.0, 2.6, and 2.9,
which showed that for general people, Academics and Post-Graduation Success were the most
important categories of factors, while Research was the least important category among the six.
Although some variations were found from different groups of people, not many of them are statistically
significant. The difference for Research category between U.S. residents and non-U.S. residents, that for
Student Life category between current students and parents, and that for Post-Graduation Success
between future students and parents were found to be statistically significant at a 95% confidence level.
The difference for Student Life category between future students and parents was found to be
statistically significant at a 90% confidence level.
Then after comparing the ideal composition of ranking to the existing rankings, in terms of the
composition of six categories, Forbes was the best ranking with a 13.62% of percentage difference per
category deviated from the ideal composition generated from the survey, and then came the
Washington Monthly, with a 14.49% of percentage difference per category. The comparison based on
subjective versus objective factors was taken away from the research of interest because the results
from Chapter 6 didn’t show any statistically significance.
However, for students who are seeking the best college for themselves, it is suggested to start
with Forbes and U.S. News and World Report, but not limited to these two rankings. For example, if a
student is more interested in Post-Graduation Success, it is recommended to check out PayScale. If a
student is planning to go to graduate school after undergraduate study, then it is recommended to
check out some of the world rankings, like ARWU-Shanghai and Times Higher Education World
University Rankings, which focus more on the Academics category. Combining all kinds of resources is
also helpful: Fiske and Princeton Review are popular guides for college choices.
As a standalone resource, the White House College Scorecard is lacking in some respects. It only
considers colleges in terms of potential financial return without considering other aspects of colleges
that potential students and parents of potential students may be interested in. In terms of the six
categories, the College Scorecard considers Academics, Finance, and Post-Graduation Success. As
previously suggested, it is best to use the College Scorecard in conjunction with other college resources
to provide a complete picture.

52
8.2 Future Work
There are many different directions that future work can branch off into. One possibility is
exploring the methodology behind ranking programs, especially that of graduate programs. The sorting
of factors into categories can also be reexamined in future work and it can be questioned if the
categories defined in this project are what the categories should be.
Another possibility is to explore the idea of asking people through a survey how they would
construct their ideal ranking and comparing it to the existing surveys. A redesigned survey could ask
respondents to grade how important each category is to them using a series of sliders, with the total of
the sliders not exceeding 100%. This future survey could also expand beyond the limited demographic
surveyed in this report, which consisted predominantly of WPI faculty, graduate students, and Computer
Science students.
53
Works Cited
[1] "Obama proposes college-rating system that could increase affordability," Washington Post,
[Online]. Available: http://www.washingtonpost.com/politics/obama-to-propose-college-ranking-
system-that-could-increase-affordability/2013/08/22/73e674c0-0b17-11e3-b87c-
476db8ac34cd_story.html. [Accessed 17 February 2014].
[2] "Average Published Undergraduate Charges by Sector, 2013-14," College Board, [Online].
Available: http://trends.collegeboard.org/college-pricing/figures-tables/average-published-
undergraduate-charges-sector-2013-14. [Accessed 16 January 2014].
[3] C. Howard, "Ranking American's Top Colleges 2013 - Forbes," Forbes, 24 July 2013. [Online].
Available: http://www.forbes.com/sites/carolinehoward/2013/07/24/ranking-americas-top-
colleges-2013/. [Accessed 2 April 2014].
[4] "How U.S. News Calculated the 2014 Best Colleges Rankings," U.S. News & World Report, [Online].
Available: http://www.usnews.com/education/best-colleges/articles/2013/09/09/how-us-news-
calculated-the-2014-best-colleges-rankings. [Accessed 27 January 2014].
[5] "National University Rankings | Top National Universities | US News Best Colleges," U.S. News &
World Report, [Online]. Available: http://colleges.usnews.rankingsandreviews.com/best-
colleges/rankings/national-universities. [Accessed 27 January 2014].
[6] "National Liberal Arts College Rankings | Top Liberal Arts Colleges | US News Best Colleges," U.S.
News & World Report, [Online]. Available: http://colleges.usnews.rankingsandreviews.com/best-
colleges/rankings/national-liberal-arts-colleges. [Accessed 2 April 2014].
[7] "America's Top Colleges List - Forbes," Forbes, [Online]. Available: http://www.forbes.com/top-
colleges/list/. [Accessed 2 April 2014].
[8] "College Rankings," TPR Education IP Holdings, LLC, [Online]. Available:
http://www.princetonreview.com/college-rankings.aspx. [Accessed 2 April 2014].
[9] "College Admissions, Search, and Financial Aid Help from College Confidential," Hobsons Inc,
[Online]. Available: http://www.collegeconfidential.com/. [Accessed 23 April 2014].
[10] "College Rankings - College Rankings - College Prowler," Niche, [Online]. Available:
http://colleges.niche.com/rankings/. [Accessed 2 April 2014].
[11] "Times Higher Education World University Rankings 2013-2014," TSL Education Ltd., [Online].
Available: http://www.timeshighereducation.co.uk/world-university-rankings/2013-14/world-
ranking. [Accessed 27 January 2014].
[12] "Methodology and FAQ 2013-2014 College Salary Report," PayScale, [Online]. Available:
http://www.payscale.com/college-salary-report-2014/methodology. [Accessed 28 February 2014].

54
[13] A. Rauhvargers, "Global University Rankings and Their Impact Report 2," European University
Association, 2013.
[14] "The Center for Measuring University Performance," The Center for Measuring University
Performance, [Online]. Available: http://mup.asu.edu/index.html. [Accessed 6 May 2014].
[15] "Research- The Center for Measuring University Performance," The Center for Measuring
University Performance, [Online]. Available: http://mup.asu.edu/research.html. [Accessed 6 May
2014].
[16] "Common Data Set Initiative," CDS Team, [Online]. Available: http://www.commondataset.org/.
[Accessed 2 April 2014].
[17] "The Integrated Postsecondary Education Data System - About IPEDS," National Center for
Education Statistics, [Online]. Available: http://nces.ed.gov/ipeds/about/. [Accessed 22 March
2014].
[18] "College Data Licensing: College and Graduate Level Data Licensing - Peterson's," Peterson's,
[Online]. Available: http://www.petersonsdata.com/. [Accessed 30 April 2014].
[19] "SIR - SCImago Institution Rankings," SCImago Research Group, [Online]. Available:
http://www.scimagoir.com/. [Accessed 2 April 2014].
[20] "Scopus | Elsevier," Elsevier, [Online]. Available: http://www.elsevier.com/online-tools/scopus.
[Accessed 30 April 2014].
[21] "CWTS Ranking 2013 - Methodology - Data Collection," Centre for Science and Technology Studies,
Leiden University, [Online]. Available:
http://www.leidenranking.com/methodology/datacollection. [Accessed 27 January 2014].
[22] J. Adams, "Fine-tuning for Clarity - IP & Science - Thomson Reuters," Thomson Reuters, [Online].
Available: http://ip-science.thomsonreuters.com/globalprofilesproject/finetune/. [Accessed 24
March 2014].
[23] E. B. Fiske, "FiskGuide.com | Titles," Sourcebooks Inc, [Online]. Available:
http://www.fiskeguide.com/?page_id=40. [Accessed 23 April 2014].
[24] "White House College Scorecard," White House, [Online]. Available:
http://www.whitehouse.gov/issues/education/higher-education/college-score-card. [Accessed 28
January 2014].
[25] "National Universities Rankings 2013," Washington Monthly, [Online]. Available:
http://www.washingtonmonthly.com/college_guide/rankings_2013/national_university_rank.php
. [Accessed 27 January 2014].
[26] "Academic Ranking of World Universities 2013," ShanghaiRanking Consultancy, [Online]. Available:
http://www.shanghairanking.com/ARWU2013.html. [Accessed 28 January 2014].
55
[27] "Washington Monthly College Guide," Washington Monthly, [Online]. Available:
http://www.washingtonmonthly.com/college_guide/. [Accessed 6 May 2014].
[28] "CWTS Leiden Ranking 2013," Centre for Science and Technology Studies, Leiden University,
[Online]. Available: http://www.leidenranking.com/ranking. [Accessed 27 January 2014].
[29] "Welcome to Ranking Web of Universities | Ranking Web of Universities," Consejo Superior de
Investigaciones Científicas, [Online]. Available: http://www.webometrics.info/. [Accessed 24 April
2014].
[30] "College Reality Check," The Chronicle of Higher Education, [Online]. Available:
https://collegerealitycheck.com/en/. [Accessed 7 May 2014].
[31] "College Rankings - Special Report-Kiplinger," Kiplinger, [Online]. Available:
http://www.kiplinger.com/fronts/special-report/college-rankings/index.html?si=1. [Accessed 23
April 2014].
[32] "QS World University Rankings," Quacquarelli Symonds Limited, [Online]. Available:
http://www.topuniversities.com/qs-world-university-rankings. [Accessed 28 January 2014].
[33] "How We Rank the Top Private College Values, 2014 Kiplinger," Kiplinger, 12 2014. [Online].
Available: http://www.kiplinger.com/article/college/T014-C000-S002-how-we-rank-the-top-
private-college-values-2014.html. [Accessed 2 May 2014].
[34] "A Note on Methodology: 4-year Colleges and Universities," Washington Monthly, [Online].
Available:
http://www.washingtonmonthly.com/magazine/september_october_2013/features/a_note_on_
methodology_4year_co_2046455.php#. [Accessed 27 January 2014].
[35] "World University Rankings 2013-2014 methodology," TSL Education Ltd., [Online]. Available:
http://www.timeshighereducation.co.uk/world-university-rankings/2013-14/world-
ranking/methodology. [Accessed 28 January 2014].
[36] "Methodology | Ranking Web of Universities," Consejo Superior de Investigaciones Científicas,
[Online]. Available: http://www.webometrics.info/en/Methodology. [Accessed 3 May 2014].
[37] "Ahrefs Site Explorer & Backlink Checker," Ahrefs Pte Ltd, [Online]. Available: https://ahrefs.com/.
[Accessed 6 May 2014].
[38] "Majestic SEO : Backlink Checker & Site Explorer," Majestic-12 Limited, [Online]. Available:
http://www.majesticseo.com/. [Accessed 6 May 2014].
[39] "Rate My Professoers - Review Professors and Teachers, School Reviews, College Campus Ratings,"
RateMyProfessors.com LLC, [Online]. Available: http://www.ratemyprofessors.com/. [Accessed 2
May 2014].

56
[40] "All Nobel Prizes," Nobel Media AB, [Online]. Available:
http://www.nobelprize.org/nobel_prizes/lists/all/. [Accessed 6 May 2014].
[41] "International Mathematical Union (IMU): Prize Winners," International Mathematical Union,
[Online]. Available: http://www.mathunion.org/general/prizes/fields/prizewinners/. [Accessed 6
May 2014].
[42] "Ranking Methodology of Academic Ranking of World Universities 2013," ShanghaiRanking
Consultancy, [Online]. Available: http://www.shanghairanking.com/ARWU-Methodology-
2013.html. [Accessed 28 January 2014].
[43] "CWTS Ranking 2013 - Methodology - Indicators," 2013 Centre for Science and Technology Studies,
Leiden University, [Online]. Available: http://www.leidenranking.com/methodology/indicators.
[Accessed 27 January 2014].
[44] "QS Stars: Methodology," Quacquarelli Symonds Limited, [Online]. Available:
http://www.topuniversities.com/qs-stars/qs-stars-methodology. [Accessed 28 January 2014].

57
Appendix Survey Page 1
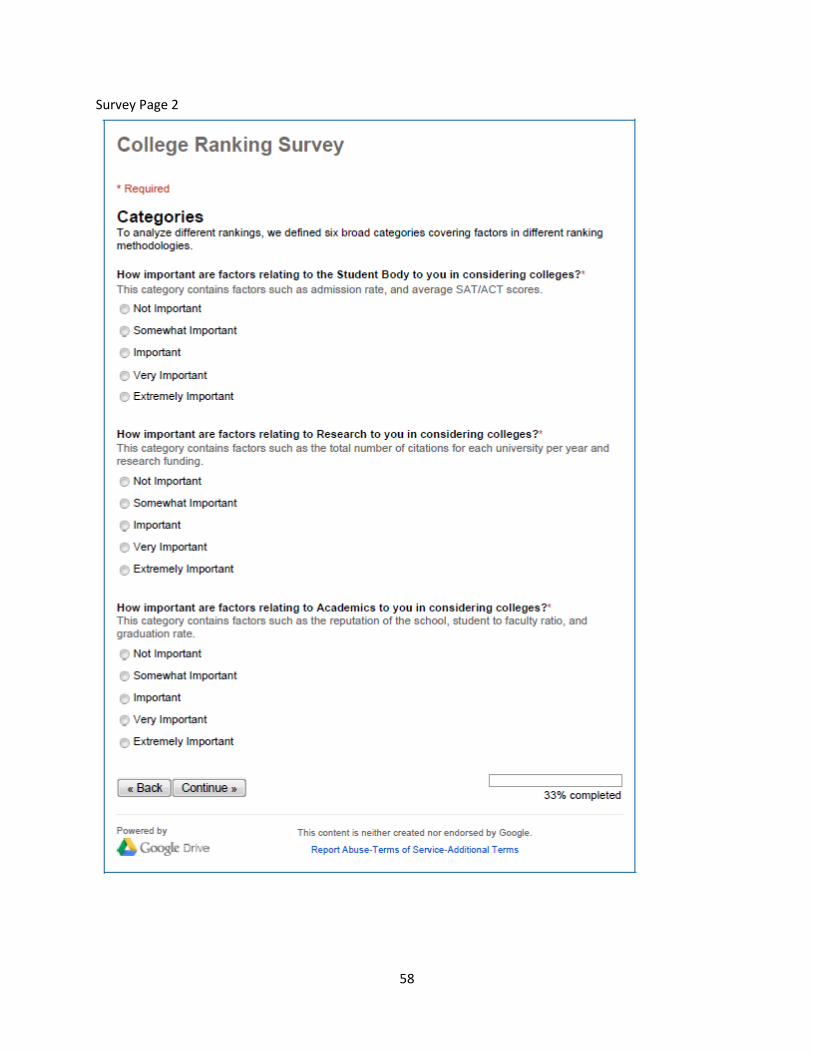
58
Survey Page 2

59
Survey Page 3
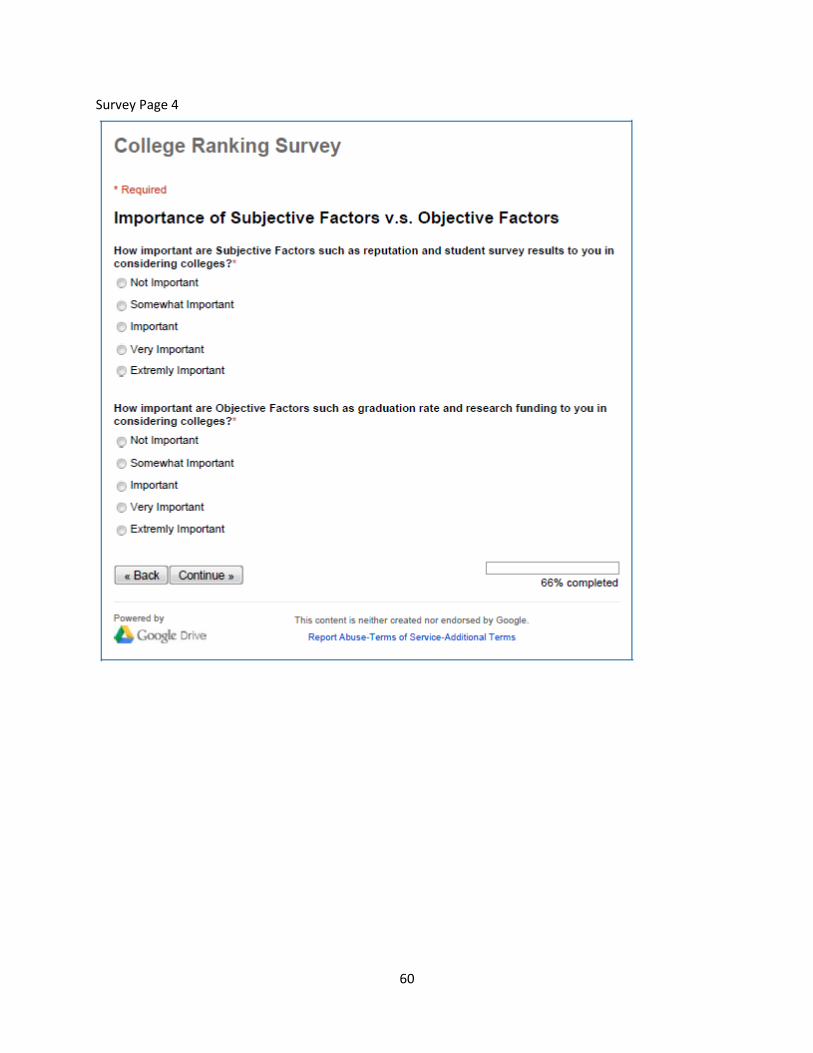
60
Survey Page 4
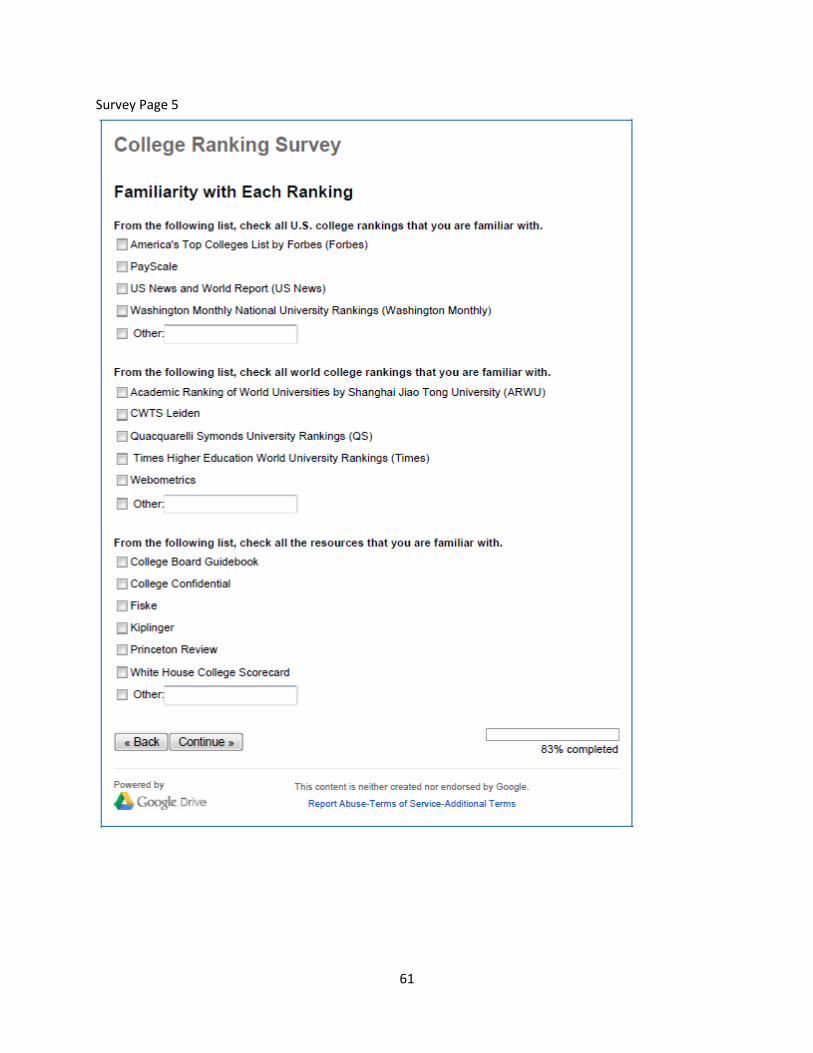
61
Survey Page 5

62
Survey Page 6
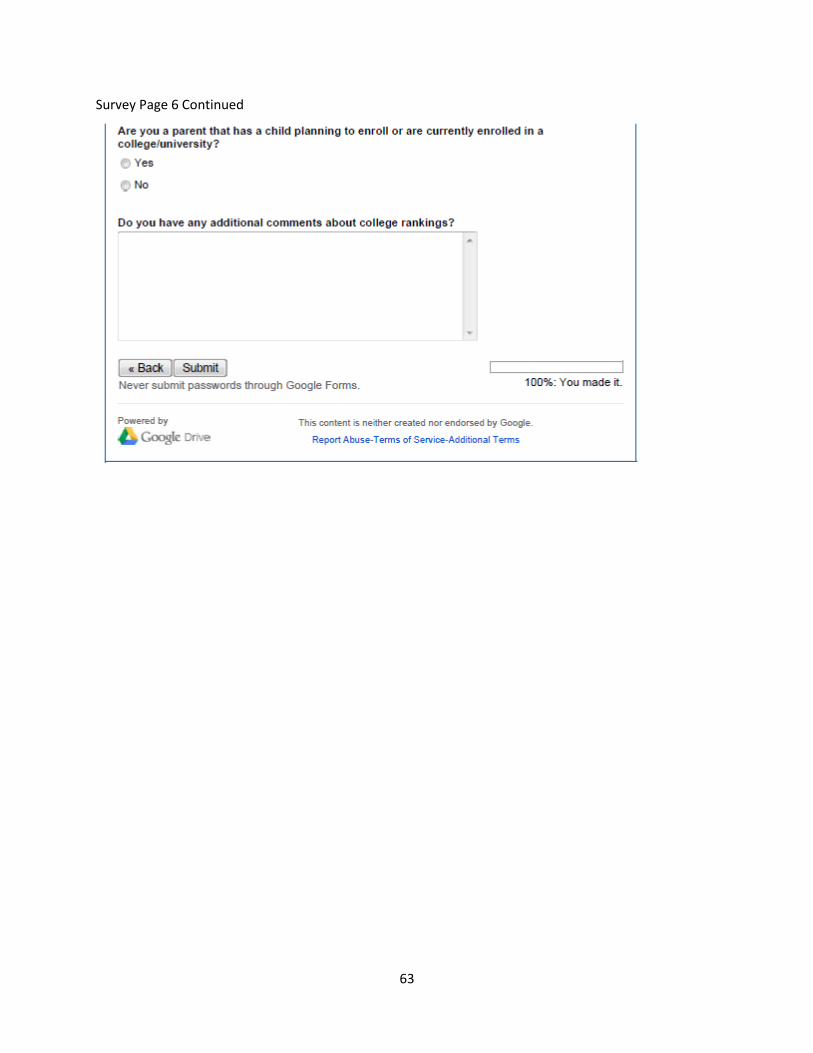
63
Survey Page 6 Continued