College of Arts and Sciences 2011-12 Profile. Table of Contents 1.Executive Summary 2.About the...
32
College of Arts and Sciences 2011-12 Profile
-
Upload
darrell-davidson -
Category
Documents
-
view
217 -
download
5
Transcript of College of Arts and Sciences 2011-12 Profile. Table of Contents 1.Executive Summary 2.About the...

College of Arts and Sciences2011-12 Profile
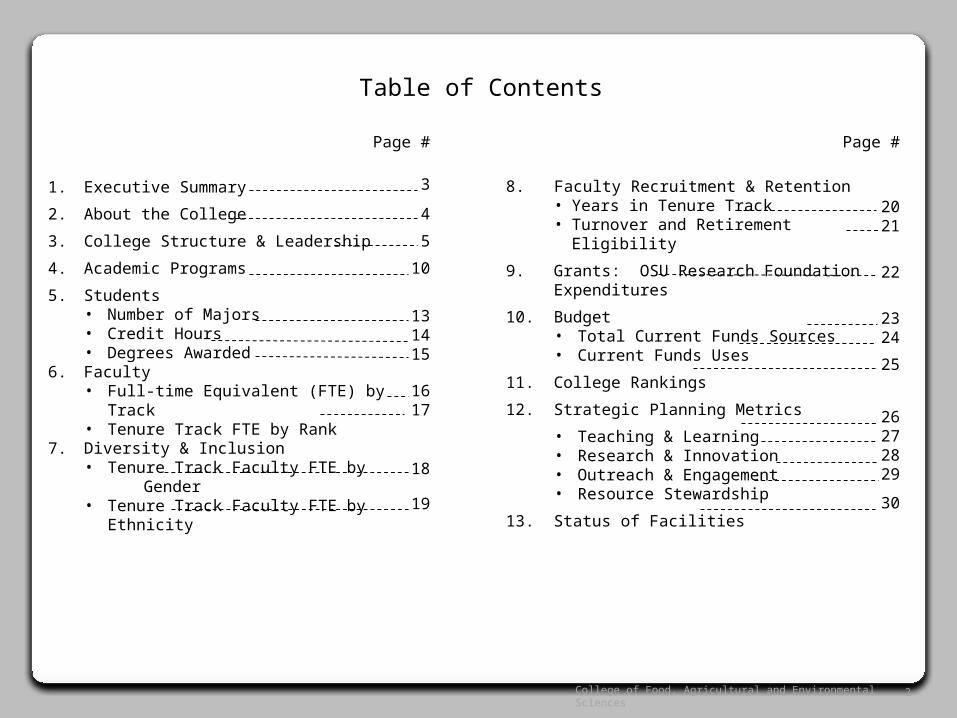
Table of Contents
1. Executive Summary
2. About the College
3. College Structure & Leadership
4. Academic Programs
5. Students• Number of Majors• Credit Hours• Degrees Awarded
6. Faculty• Full-time Equivalent (FTE) by Track• Tenure Track FTE by Rank
7. Diversity & Inclusion• Tenure Track Faculty FTE by
Gender• Tenure Track Faculty FTE by
Ethnicity
8. Faculty Recruitment & Retention• Years in Tenure Track• Turnover and Retirement Eligibility
9. Grants: OSU Research Foundation Expenditures
10. Budget• Total Current Funds Sources• Current Funds Uses
11. College Rankings
12. Strategic Planning Metrics
• Teaching & Learning• Research & Innovation• Outreach & Engagement• Resource Stewardship
13. Status of Facilities
2
Page #
3
4
5
10
131415
1617
18
19
Page #
2021
22
2324
25
26272829
30
College of Food, Agricultural and Environmental Sciences

1. Executive Summary
Weaknesses• Common culture• Comprehensiveness• College branding• Lack of support for the academic arts• Student recruitment, career advising, and
placement• Staffing• Departments and programs that need
improvement
Strengths• Comprehensiveness• Interdisciplinary• High quality programs• Undergraduate & graduate education• Large, diverse and flexible funding
model• Outstanding support services • Ability to restructure units
Opportunities• Collaboration with other colleges• Partnerships with artists and arts
organizations in the community• Replacement of retiring faculty• Many faculty funded by external
granting agencies • Leadership position in defining
contributions by the humanities • Off-campus educational programs
Challenges• Value of liberal arts education increasingly
questioned • Start-up costs for scientists• Performing/visual arts facilities conditions• Best faculty highly recruited by other
institutions• General education courses increasingly
earned through AP and other alternatives• Reward structure not conducive to inter-
disciplinary teaching and research
3College of Arts and Sciences

The College of Arts and Sciences (ASC) was reunified by a unanimous vote of the university’s Board of Trustees on June 18, 2010, incorporating the five legacy colleges of the former Federation of the Colleges of the Arts and Sciences, including Arts, Biological Sciences, Humanities, Mathematical and Physical Sciences, and Social and Behavioral Sciences. Together, the departments and schools, and the many additional centers and institutes within ASC, form the academic core of The Ohio State University, and through the ASC structure have a greater capacity to amplify resources and maximize the potential for excellence in a visible, coherent, effective, and efficient way.
The mission of the College of Arts and Sciences is to achieve excellence in research and other creative endeavors, teaching, and service. Excellence in research and scholarship can be measured by attainment of national and international recognition, as evidenced by publications, citations, external funding, presentations, performances, creation of original art, awards, and honors. Excellence in teaching can be measured by the attainment of local, national, and international recognition, as evidenced by pedagogical publications, awards, honors, and critical student outcomes. Excellence in service involves making available a high level of professional expertise, engagement, and experience to the public, including the university, the Columbus community, the State of Ohio, and the nation, as well as to scholarly professional organizations.
2. About the College
College of Arts and Sciences website: http://artsandsciences.osu.edu/
Strategic Plan website: http://go.osu.edu/ArtsandSciencesStrategicPlan
4College of Arts and Sciences

3. College Structure and Leadership
Chris Andersen, Director, STEM Education InitiativesDan Cloran, Senior Director of Development and Alumni RelationsDiane Dagefoerde, Chief Information OfficerLibby Eckhardt, Chief Communications Officer
Brad Harris, Chief Administrative OfficerChitra Iyer, Chief Human Resources OfficerKatherine Margard, Executive Assistant to Executive DeanAnn Rottersman, Director of Student Programs
Division of Arts and Humanities
Mark Shanda Divisional Dean Garret Heysel Assistant Dean Sebastian Knowles Associate Dean Valarie Williams Associate Dean
Division of Natural and Mathematical Sciences
Peter March Divisional DeanChristopher Hadad Associate DeanAndrea Ward-Ross Assistant Dean
Division of Social and Behavioral Sciences)
Gifford Weary Divisional DeanDeborah Haddad Assistant DeanKathleen McGraw Associate Dean
Joseph SteinmetzExecutive Dean and Vice Provost
For administrative purposes, the members of the ASC faculty are organized into three divisions into which the three schools and 36 departments of the college are distributed.
5
Steve FinkAssociate Executive Dean for Curriculum & InstructionRich HallAssociate Executive Dean for Research & Facilities
Mary Ellen JenkinsAssistant Executive Dean, ASC Advising & Academic ServicesPatrice DickersonAssistant Dean for Diversity & Recruitment
Support Unit Directors
College of Arts and Sciences

3. College Structure and Leadership
Departments (21)
Department of African American and African Studies Chair: H. Ike Okafor-Newsum
Department of Art Chair: Sergio Soave
Department of Art Education Chair: Deborah Smith-Shank
Department of Classics Chair: Ben Acosta-Hughes
Department of Comparative Studies Chair: Eugene Holland
Department of Dance Chair: Susan Petry
Department of Design Chair: Paul Nini
Department of East Asian Languages and Literature Chair: Mari Noda
Department of English Chair: Richard Dutton
Department of French and Italian Chair: Jennifer Willging
Department of Germanic Languages and Literatures Chair: Anna Grotans
Mark ShandaDivisional Dean, Arts and Humanities
Department of History Chair: Peter Hahn
Department of History of Art Chair: Andrew Shelton
Department of Linguistics Chair: Shari Speer
School of Music Director: Richard Blatti
Department of Near Eastern Languages and Cultures Chair: Richard Davis
Department of Philosophy Chair: Don Hubin
Department of Slavic & East European Languages and Cultures Chair: Helena Goscilo
Department of Spanish and Portuguese Chair: Fernando Unzueta
Department of Theatre Chair: Dan Gray
Department of Women’s: Gender and Sexuality Studies Chair: Jill Bystydzienski
6College of Arts and Sciences

3. College Structure and Leadership
Departments(10)
Department of Astronomy Chair: Bradley M Peterson
Department of Biochemistry Chair: Susan Olesik
Department of Chemistry Chair: Susan Olesik
School of Earth Sciences Director: Berry Lyons
Department of Evolution, Ecology and Organismal Biology Chair: Peter Curtis
Peter MarchDivisional Dean, Natural and Mathematical Sciences
Departments
Department of Mathematics Chair: Luis Casian
Department of Microbiology Chair: Tina Henkin
Department of Molecular Genetics Chair: Anita Hopper
Department of Physics Chair: Jim Beatty
Department of Statistics Chair: L. Mark Berliner
7College of Arts and Sciences

3. College Structure and Leadership
Departments(8)
Department of Anthropology Chair: Clark Larsen
School of Communication Director: Carroll Glynn
Department of Economics Chair: Donald Haurin
Department of Geography Chair: Daniel Sui
Gifford Weary Divisional Dean, Social and Behavioral Sciences
Research & Business Partnership Centers (11)
Department of Political Science Chair: Richard Herrmann
Department of Psychology Chair: Richard Petty
Department of Sociology Chair: Zhenchao Qian
Department of Speech and Hearing Science Chair: Robert Fox
8College of Arts and Sciences

3. College Structure and Leadership
Interdisciplinary Centers (39)
Advanced Computing Center for the Arts and Design (AACAD)
African American & African Studies Community Extension Center (AAASCEC)
Center for Applied Plant Sciences (CAPS)Aquatic Ecology LaboratoryArabidposis Biological Resource CenterThe Arts Initiative at Ohio StateBiological Sciences GreenhouseByrd Polar Research CenterClimate, Water and Carbon ProgramCenter for Cognitive and Behavioral Brain
ImagingCenter for Cognitive ScienceCenter for Cosmology and AstroParticle
PhysicsCriminal Justice Research CenterDiversity and Identity Studies Collective at
OSUCenter for Electronic & Magnetic Nanoscale
Composite Multifunctional Materials
Center for Emergent MaterialsCenter for Epigraphical and Palaeographical
StudiesFilm Studies Program
Research & Business Partnership Centers (11)
Center for Folklore StudiesForeign Language Center
Center for Historical ResearchCenter for Human Resource Research
Humanities InstituteInitiative in Population ResearchCenter for Life Science Education Institute for Materials ResearchMathematical Biosciences InstituteCenter for Medieval and Renaissance StudiesMelton Center for Jewish StudiesMuseum of Biological DiversityOhio State University PressOrton Geological MuseumCenter for Spatial Statistics and
Environmental StatisticsSpectroscopy InstituteStatistical Consulting ServicesCenter for the Study of Teaching of WritingCenter for the Study of ReligionCenter for Urban and Regional Analysis
(CURA)Urban Arts Space
9College of Arts and Sciences

4. Academic Programs
• Actuarial Science• African-American and African
Studies• Ancient History and Classics• Anthropological Sciences• Anthropology• Arabic• Art• Art Education• Astronomy• Atmospheric Sciences• Biochemistry• Biology• Chemistry• Chinese• Classics• Communication (Pre-Major)• Comparative Studies• Composition (Music)• Computer and Information
Science• Criminology and Criminal
Justice Studies• Dance• Economics• English• Evolution and Ecology• Film Studies• French
• Geography• Geological Sciences• German• GIS and Spatial Analysis• Globalization Studies• Hebrew• History• History of Art• Honors Contract
(Interdisciplinary)• Industrial Design• Interior Design• International Studies• Islamic Studies• Italian• Japanese• Jazz Studies (Composition;
Performance)• Jewish Studies• Journalism (Pre-Major)• Korean• Linguistics• Mathematics• Medieval and Renaissance
Studies• Microbiology• Middle Childhood Education• Modern Greek• Molecular Genetics
• Music• Music Education
(Instrumental; Vocal; General)
• Music History• Music Theory• Neuroscience• Performance (Piano;
Orchestral Instruments; Voice)
• Personalized Study Program
• Philosophy• Physics• Political Science• Portuguese• Psychology• Russian• Sociology• Spanish• Speech and Hearing
Science• Theatre• Visual Communication
Design• Women’s, Gender and
Sexuality Studies• World Literatures• Zoology
Undergraduate Majors
10College of Arts and Sciences
4. Academic Programs
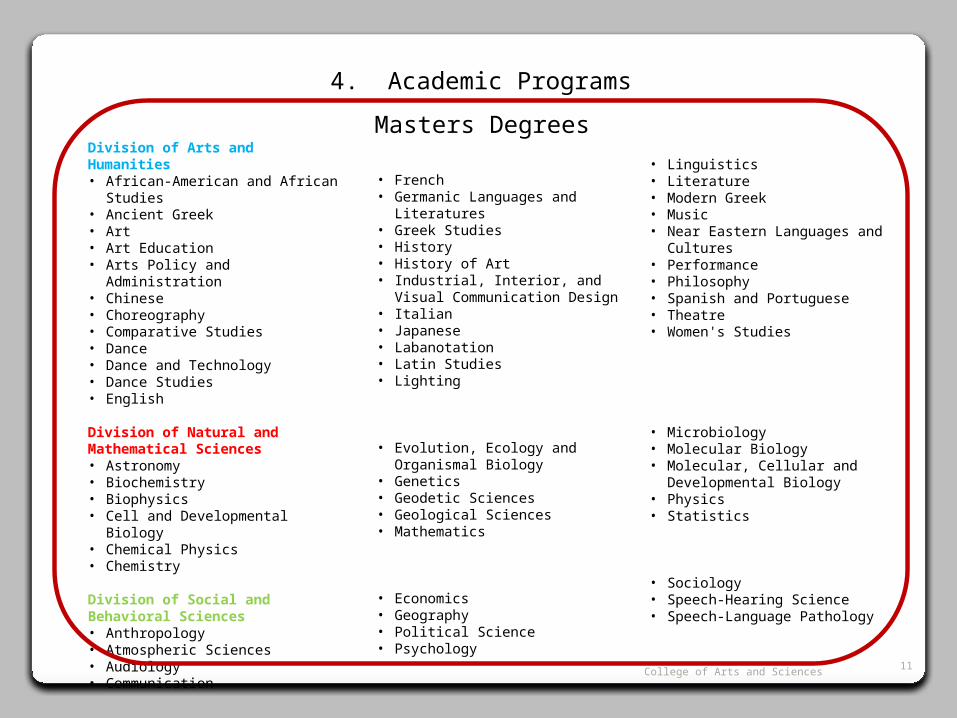
Division of Arts and Humanities• African-American and African
Studies• Ancient Greek• Art• Art Education• Arts Policy and Administration • Chinese• Choreography• Comparative Studies• Dance• Dance and Technology• Dance Studies• English
Division of Natural and Mathematical Sciences• Astronomy• Biochemistry• Biophysics• Cell and Developmental Biology• Chemical Physics• Chemistry
Division of Social and Behavioral Sciences • Anthropology• Atmospheric Sciences• Audiology• Communication
Division of Arts and Humanities• French• Germanic Languages and
Literatures• Greek Studies• History• History of Art• Industrial, Interior, and Visual
Communication Design• Italian• Japanese• Labanotation• Latin Studies• Lighting
Division of Natural and Mathematical Sciences• Evolution, Ecology and
Organismal Biology• Genetics• Geodetic Sciences• Geological Sciences• Mathematics
Division of Social and Behavioral Sciences • Economics• Geography• Political Science• Psychology
• Linguistics• Literature• Modern Greek• Music• Near Eastern Languages and
Cultures• Performance• Philosophy• Spanish and Portuguese• Theatre• Women's Studies
Division of Natural and Mathematical Sciences• Microbiology• Molecular Biology• Molecular, Cellular and
Developmental Biology• Physics• Statistics
Division of Social and Behavioral Sciences • Sociology• Speech-Hearing Science• Speech-Language Pathology
Masters Degrees
11College of Arts and Sciences

4. Academic Programs
Division of Arts and Humanities• Art Education • Chinese; Dance• English• French• Germanic Languages and Literatures• Greek Studies • History• History of Art
Division of Natural and Mathematical Sciences• Astronomy• Biophysics• Biostatistics• Cell and Developmental Biology• Chemical Physics• Chemistry• Evolution, Ecology and Organismal
Biology
Division of Social and Behavioral Sciences• Anthropology• Atmospheric Sciences• Audiology• Behavioral Neuroscience• Clinical Psychology• Cognitive Psychology
• Japanese• Latin Studies• Linguistics• Modern Greek• Music• Near Eastern Languages and Cultures
Division of Natural and Mathematical Sciences
• Genetics• Geological Sciences• Mathematics• Microbiology• Molecular Biology• Molecular, Cellular and
Developmental Biology
Division of Social and Behavioral Sciences• Communication• Developmental Psychology• Economics• Geography• Hearing Science• Mental Retardation and
Developmental Disabilities
• Philosophy• Russian Literature• Slavic linguistics• Spanish and Portuguese• Theatre• Women's Studies
Division of Natural and M
• Ohio State Biochemistry Program
• Physics• Statistics
Division of Social and Be
Sciences
• Neuroscience • Political Science• Quantitative Psychology• Social Psychology• Sociology• Speech-Language Pathology• Speech-Language Science
PhD Degrees
12College of Arts and Sciences

5. Students: Number of Majors
• Undergraduate Student Majors have increased by 14% since 2003.• Graduate Majors have
increased by 7.5% since 2003
20032004
20052006
20072008
20092010
20110
5,000
10,000
15,000
20,000
25,000
Undergraduate Graduate
13
2003 2004 2005 2006 2007 2008 2009 2010 2011Undergraduate 14,536 14,644 14,829 15,106 15,734 16,140 16,617 16,715 16,596
Graduate 2,927 3,005 3,173 3,112 3,172 3,102 3,119 3,213 3,148
Total 17,463 17,649 18,002 18,218 18,906 19,242 19,736 19,928 19,744
% Increase 1.1% 2.0% 1.2% 3.8% 1.8% 2.6% 1.0% -0.9%
College of Arts and Sciences

5. Students: Credit Hours
• Since 2003, undergraduate credit hours have increased by 11%, compared to the overall university increase of 17%.
• Arts and Sciences is responsible for generating nearly 57% of all undergraduate credit hours at OSU.
• By design, graduate credit hours have decreased by 17%, while the university has seen an overall decrease of 3% for graduate credit hours.
*Cross-hatched portion of undergraduate portion of graphs represents credits taken by undergraduates at the 100-level. AP and other credits by examination are increasingly substituting for these courses.**Professional credit hours represent the enrollments of students in both a graduate arts and science program and a professional program such as law and are a very small part of the College’s enrollment.
14
In Thousands 2003 2004 2005 2006 2007 2008 2009 2010 2011Undergraduate 1,189 1,218 1,216 1,228 1,263 1,280 1,299 1,298 1,319Graduate 138 142 146 143 148 145 119 114 114Professional** 0.6 0.8 0.6 0.6 0.5 0.3 0.4 0.4 0.4Total 1,327 1,361 1,363 1,372 1,411 1,425 1,418 1,412 1,433% Increase 2.5% 0.1% 0.7% 2.9% 1.0% -0.5% -0.4% 1.5%
2003 2004 2005 2006 2007 2008 2009 2010 20110.0
200.0
400.0
600.0
800.0
1000.0
1200.0
1400.0
1600.0
Undergraduate Graduate Professional*
2011
College of Arts and Sciences

5. Students: Degrees Awarded
• In 2011, 49% of all baccalaureate degrees awarded by university were awarded by the College of Arts and Sciences.
• 18% of all master’s degrees were awarded by the College of Arts and Sciences.
• 49% of all doctoral degrees were awarded by the College.
15
2003 2004 2005 2006 2007 2008 2009 2010 2011Associate 344 342 340 366 358 435 444 107 101Bachelor 3,785 3,922 3,991 4,315 4,543 4,579 4,558 4,667 5,020Masters 523 568 585 611 552 530 544 504 499Doctoral 277 258 265 278 304 332 340 370 380
Total 4,929 5,090 5,181 5,570 5,757 5,876 5,886 5,648 6,000% Increase 3.3% 1.8% 7.5% 3.4% 2.1% 0.1% -4.0% 6.3%
20032004
20052006
20072008
20092010
20110
1,000
2,000
3,000
4,000
5,000
6,000
7,000
Associate Bachelor Masters Doctoral2011
College of Arts and Sciences

6. Faculty: Full-time Equivalent (FTE) by Track
• Tenure track faculty FTE peaked in 2007, and has dropped by 6% since then.
• Auxiliary faculty have increased by about 50% in ten years.
*Source: Employee Analytics: Position Organization, Includes Regional Campus Faculty and No-Sal Appts
16College of Arts and Sciences
2002 2003 2004 2005 2006 2007 2008 2009 2010 2011Tenure Track Faculty 1095 1097 1125 1136 1141 1163 1145 1149 1132 1099Research Track Faculty 1 3 1 1Auxiliary Faculty 347 380 382 409 441 467 493 477 514 521Total 1,443 1,478 1,507 1,545 1,582 1,631 1,639 1,630 1,647 1,621% Increase 2.4% 2.0% 2.6% 2.4% 3.1% 0.5% -0.5% 1.1% -1.6%
2002 2003 2004 2005 2006 2007 2008 2009 2010 20110
200
400
600
800
1000
1200
1400
1600
1800
Tenure Track Faculty Research Track Faculty Auxiliary Faculty 2011
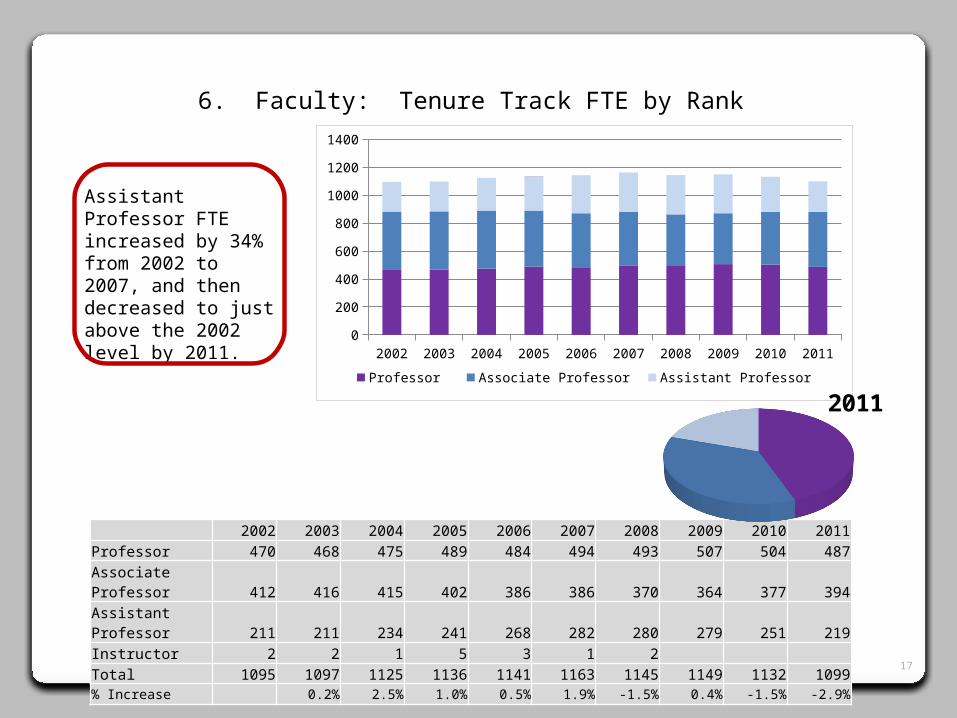
6. Faculty: Tenure Track FTE by Rank
Assistant Professor FTE increased by 34% from 2002 to 2007, and then decreased to just above the 2002 level by 2011.
17College of Arts and Sciences
2002 2003 2004 2005 2006 2007 2008 2009 2010 2011Professor 470 468 475 489 484 494 493 507 504 487Associate Professor 412 416 415 402 386 386 370 364 377 394Assistant Professor 211 211 234 241 268 282 280 279 251 219Instructor 2 2 1 5 3 1 2 Total 1095 1097 1125 1136 1141 1163 1145 1149 1132 1099% Increase 0.2% 2.5% 1.0% 0.5% 1.9% -1.5% 0.4% -1.5% -2.9%
2002 2003 2004 2005 2006 2007 2008 2009 2010 20110
200
400
600
800
1000
1200
1400
Professor Associate Professor Assistant Professor Instructor
2011
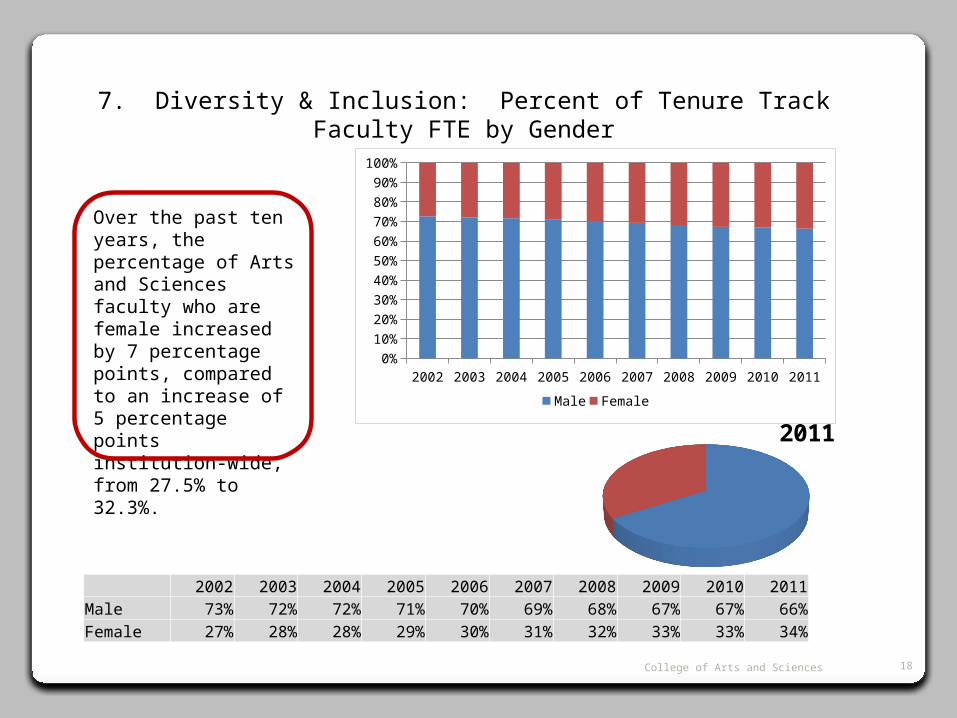
7. Diversity & Inclusion: Percent of Tenure Track Faculty FTE by Gender
Over the past ten years, the percentage of Arts and Sciences faculty who are female increased by 7 percentage points, compared to an increase of 5 percentage points institution-wide, from 27.5% to 32.3%.
18College of Arts and Sciences
2002 2003 2004 2005 2006 2007 2008 2009 2010 2011Male 73% 72% 72% 71% 70% 69% 68% 67% 67% 66%Female 27% 28% 28% 29% 30% 31% 32% 33% 33% 34%
2002 2003 2004 2005 2006 2007 2008 2009 2010 20110%
10%
20%
30%
40%
50%
60%
70%
80%
90%
100%
Male Female
2011

7. Diversity & Inclusion: Percent of Tenure Track Faculty FTE by Ethnicity
*Under-represented Minority: Black, Hispanic, Native American
Underrepresented minority faculty in the College of Arts and Sciences increased to 8%, compared to 7% institution-wide.
19College of Arts and Sciences
2002 2003 2004 2005 2006 2007 2008 2009 2010 2011Asian 8% 8% 8% 9% 9% 9% 9% 9% 9% 9%URM 7% 7% 8% 8% 8% 8% 8% 8% 8% 8%Two or More Races 0% 0% 0% 0% 1% 1% 1% 1% 1% 1%Undisclosed 2% 2% 2% 1% 1% 2% 2% 2% 3% 3%White 83% 83% 82% 82% 81% 80% 81% 80% 80% 79%
2002 2003 2004 2005 2006 2007 2008 2009 2010 20110%
10%20%30%40%50%60%70%80%90%
100%
Asian URM Two or More Races Undisclosed White 2011

8. Faculty Recruitment and Retention: Years in Tenure Track
Source: Faculty Analytics, OHR
The number of late-career faculty, with more than 21 years in the tenure-track, has increased from 309 (27.1%) in 2002 to 352 (30.9%) in 2011.
20College of Arts and Sciences

8. Faculty Recruitment and Retention: Turnover & Retirement Eligibility
Source: Faculty Analytics, OHR *Retirement Eligibility is based on years of service and age
*
275 of the 521 voluntary separations were due to retirement.
662 of the current 1,102 faculty are or will be eligible to retire by 2021.
21
*
College of Arts and Sciences

9. Grants Received: OSU Research Foundation Expenditures
In Thousands 2003 2004 2005 2006 2007 2008 2009 2010 2011Direct Costs $46,291 $52,265 $56,537 $61,098 $67,510 $63,920 $61,322 $63,466 $60,576F&A Costs $14,067 $15,607 $15,872 $17,244 $17,608 $20,169 $19,965 $21,014 $21,314Sponsored Total Cost $60,358 $67,873 $72,409 $78,342 $85,117 $84,089 $81,287 $84,480 $81,889% Increase - 12% 7% 8% 9% -1% -3% 4% -3%
Grant Expenditures have increased by over 30%.
22College of Arts and Sciences
2003 2004 2005 2006 2007 2008 2009 2010 2011 -
10,000,000
20,000,000
30,000,000
40,000,000
50,000,000
60,000,000
70,000,000
80,000,000
90,000,000
Direct Costs F&A Costs
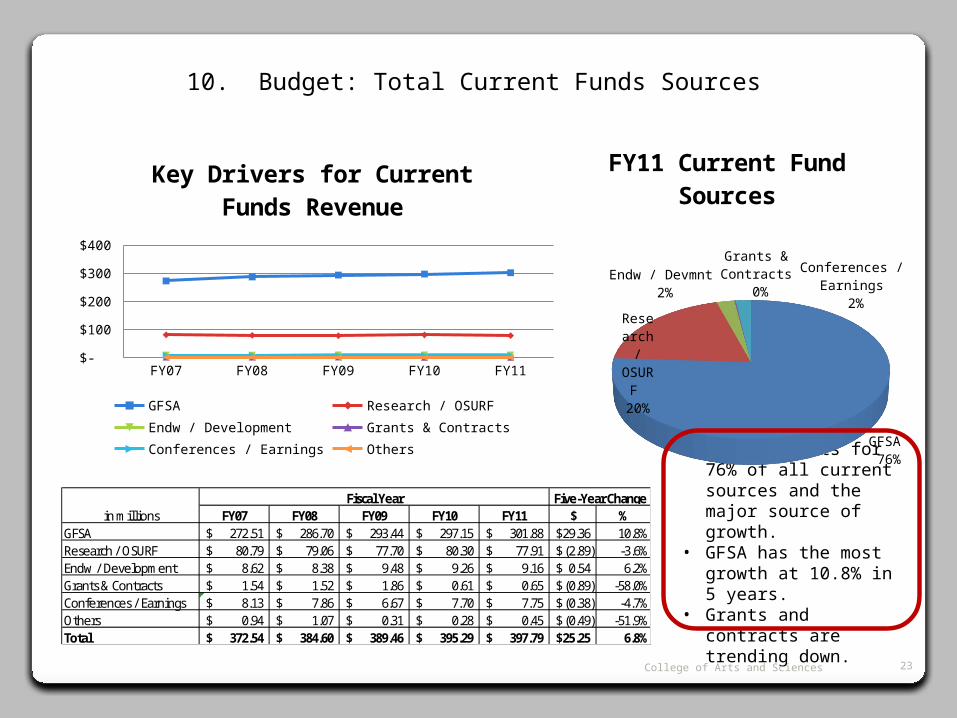
10. Budget: Total Current Funds Sources
• GFSA accounts for 76% of all current sources and the major source of growth.
• GFSA has the most growth at 10.8% in 5 years.
• Grants and contracts are trending down.
23
FY07 FY08 FY09 FY10 FY11 $ %GFSA 272.51$ 286.70$ 293.44$ 297.15$ 301.88$ 29.36$ 10.8%Research / OSURF 80.79$ 79.06$ 77.70$ 80.30$ 77.91$ (2.89)$ -3.6%Endw / Development 8.62$ 8.38$ 9.48$ 9.26$ 9.16$ 0.54$ 6.2%Grants & Contracts 1.54$ 1.52$ 1.86$ 0.61$ 0.65$ (0.89)$ -58.0%Conferences / Earnings 8.13$ 7.86$ 6.67$ 7.70$ 7.75$ (0.38)$ -4.7%Others 0.94$ 1.07$ 0.31$ 0.28$ 0.45$ (0.49)$ -51.9%Total 372.54$ 384.60$ 389.46$ 395.29$ 397.79$ 25.25$ 6.8%
Five-Year ChangeFiscal Yearin millions
GFSA 76%
Re-search / OS-URF 20%
Endw / Devmnt 2%
Grants & Contracts 0% Conferences / Earnings
2%
FY11 Current Fund Sources
FY07 FY08 FY09 FY10 FY11 $-
$50
$100
$150
$200
$250
$300
$350
Key Drivers for Current Funds Revenue
GFSA Research / OSURF Endw / DevelopmentGrants & Contracts Conferences / Earnings Others
College of Arts and Sciences
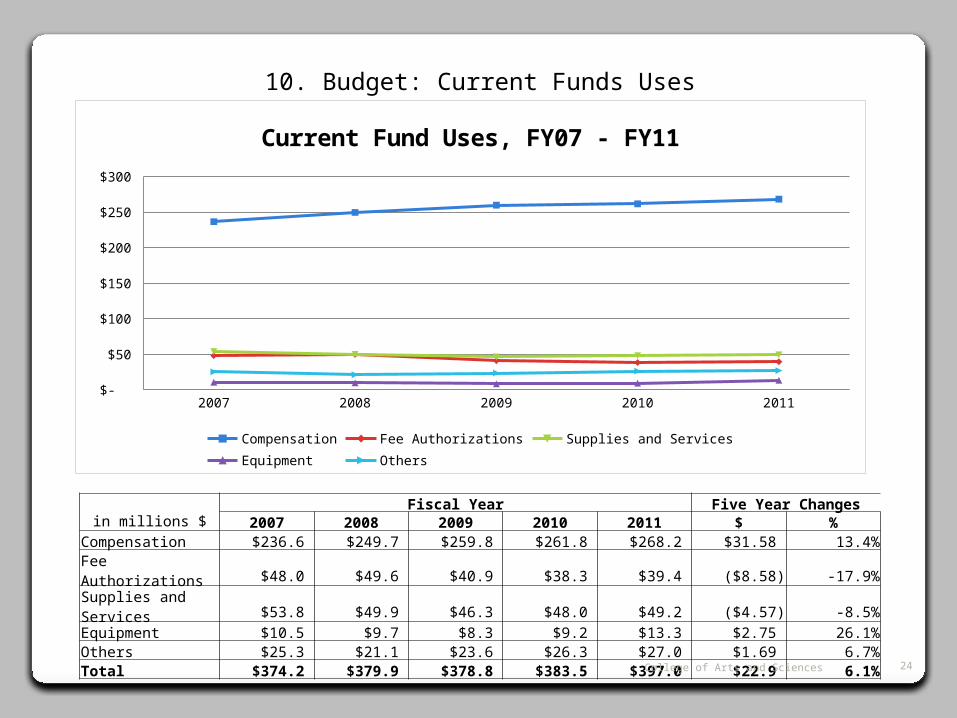
10. Budget: Current Funds Uses
in millions $Fiscal Year Five Year Changes
2007 2008 2009 2010 2011 $ %Compensation $236.6 $249.7 $259.8 $261.8 $268.2 $31.58 13.4%Fee Authorizations $48.0 $49.6 $40.9 $38.3 $39.4 ($8.58) -17.9%Supplies and Services $53.8 $49.9 $46.3 $48.0 $49.2 ($4.57) -8.5%Equipment $10.5 $9.7 $8.3 $9.2 $13.3 $2.75 26.1%Others $25.3 $21.1 $23.6 $26.3 $27.0 $1.69 6.7%Total $374.2 $379.9 $378.8 $383.5 $397.0 $22.9 6.1%
24
2007 2008 2009 2010 2011 $-
$50
$100
$150
$200
$250
$300
Current Fund Uses, FY07 - FY11
Compensation Fee Authorizations Supplies and Services Equipment Others
College of Arts and Sciences
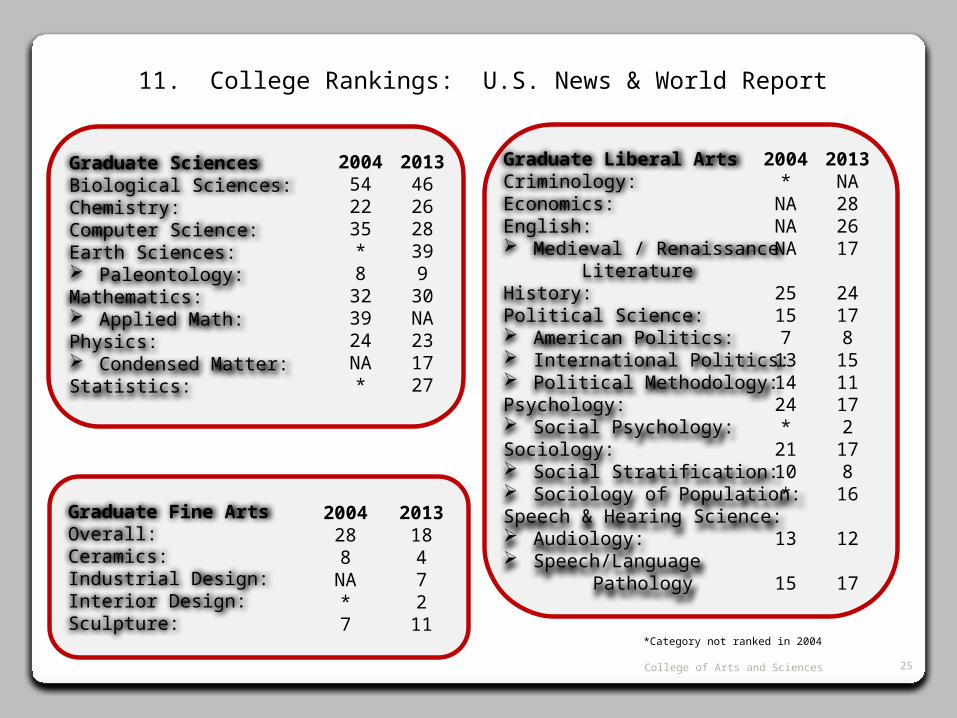
Graduate SciencesBiological Sciences:Chemistry:Computer Science:Earth Sciences: Paleontology: Mathematics: Applied Math:Physics: Condensed Matter:Statistics:
2004542235*8
323924NA*
2013462628399
30NA231727
11. College Rankings: U.S. News & World Report
Graduate Liberal ArtsCriminology:Economics:English: Medieval / Renaissance LiteratureHistory:Political Science: American Politics: International Politics: Political Methodology:Psychology: Social Psychology:Sociology: Social Stratification: Sociology of Population:Speech & Hearing Science: Audiology: Speech/Language Pathology
2004*
NANANA
25157
131424*
2110*
13
15
2013NA282617
24178
1511172
178
16
12
17
*Category not ranked in 2004
25
Graduate Fine ArtsOverall:Ceramics:Industrial Design:Interior Design:Sculpture:
2004288
NA*7
201318472
11
College of Arts and Sciences

12. Strategic Planning Metrics and Targets for 2016: Teaching & Learning
Strategic Plan website: http://go.osu.edu/ArtsandSciencesStrategicPlan
26
Teaching & Learning Scorecard
Provide an unsurpassed, student-centered learning experience led by engaged, world-class faculty and enhanced by a globally diverse student body
Focus Area Metric2011 Baseline
2012 2013 2014 20152016
Target ProgressIncoming Student Quality
U1 Graduate Student Academic Quality Index 73.25
Program Excellence U2 NSSE Enriching Educational Experiences Score 44.3
Program Excellence U3 USNWR Graduate Ranking Among National Universities: ASC programs/specialties* 7 in top 10, 11
in top 157 in top 10, 11 in top 15
Student Outcomes U4 Post-graduation Outcomes IndexMetric under development
Student Outcomes U5 Undergraduate Graduation Rate80%
College Metrics C1-C3
Colleges may add 1-3 metrics relevant to college-specific goals
* Total of 27 Ranked Programs /Specialties for ASC
College of Arts and Sciences

12. Strategic Planning Metrics and Targets for 2016: Research & Innovation
Strategic Plan website: http://go.osu.edu/ArtsandSciencesStrategicPlan
27
Research & Innovation Scorecard
Create distinctive and internationally recognized contributions to the advancement of fundamental knowledge and scholarship and to the solutions of the world's most pressing problems
Focus Area Metric 2011 Baseline
2012 2013 2014 2015
2016 Target
ProgressReputation U6 National Academy / American
Academy of Arts and Sciences Members 6 / 15
Productivity U7 Faculty Scholarly Productivity Index Rating (highest and lowest ratings) Data expected to be available after 3/1/2012.
Productivity U8 Total Research Expenditures$81,889,280
Productivity U9 Commercialization Success IndexMetric under development
College Metrics C1-C3
Colleges may add 1-3 metrics relevant to college-specific goals
College of Arts and Sciences

12. Strategic Planning Metrics and Targets for 2016: Outreach & Engagement
Strategic Plan website: http://go.osu.edu/ArtsandSciencesStrategicPlan
28
Outreach & Engagement Scorecard
Establish mutually beneficial partnerships with the citizens and institutions of Ohio, the nation, and the world so that our communities are actively engaged in the exciting work of The Ohio State University
Focus Area Metric2011 Baseline
2012 2013 2014 20152016
Target ProgressStrategic Partnerships
U10 Industry Research Expenditures$1,892,702
Strategic Partnerships
U11 OSU Publications Cited by Industry Patents Data expected to be available for 2013
Strategic Partnerships
U12 Signed MOUs for Active State, National, and International Partnerships
Critical Workforce Development
U13 % Students Completing an Internship77%
Outreach Programs & Awareness
U14 Patients/Clients Served
Outreach Programs & Awareness
U15 Enrollment in Non-credit Courses and Programs
College Metrics C1-C3
Colleges may add 1-3 metrics relevant to college-specific goals
College of Arts and Sciences

12. Strategic Planning Metrics and Targets for 2016: Resource Stewardship
Strategic Plan website: http://go.osu.edu/ArtsandSciencesStrategicPlan
29
Resource Stewardship Scorecard
Become the model for an affordable public university recognized for financial sustainability, unsurpassed management of human and physical resources, and operational simplicity and effectiveness
Focus Area Metric2011 Baseline
2012 2013 2014 20152016
Target ProgressResources - People U17 Workplace Culture Index
72
Resources - People U19 Non-Retirement Turnover for FacultyMetric under development
Resources - Dollars U20 New Fundraising Activity$19,184,662
Resources - Dollars U21 Efficiency MetricMetric under development
Resources - Facilities U23 Facility Condition Index76.5%
College Metrics C1-C3
Colleges may add 1-3 metrics relevant to college-specific goals
College of Arts and Sciences
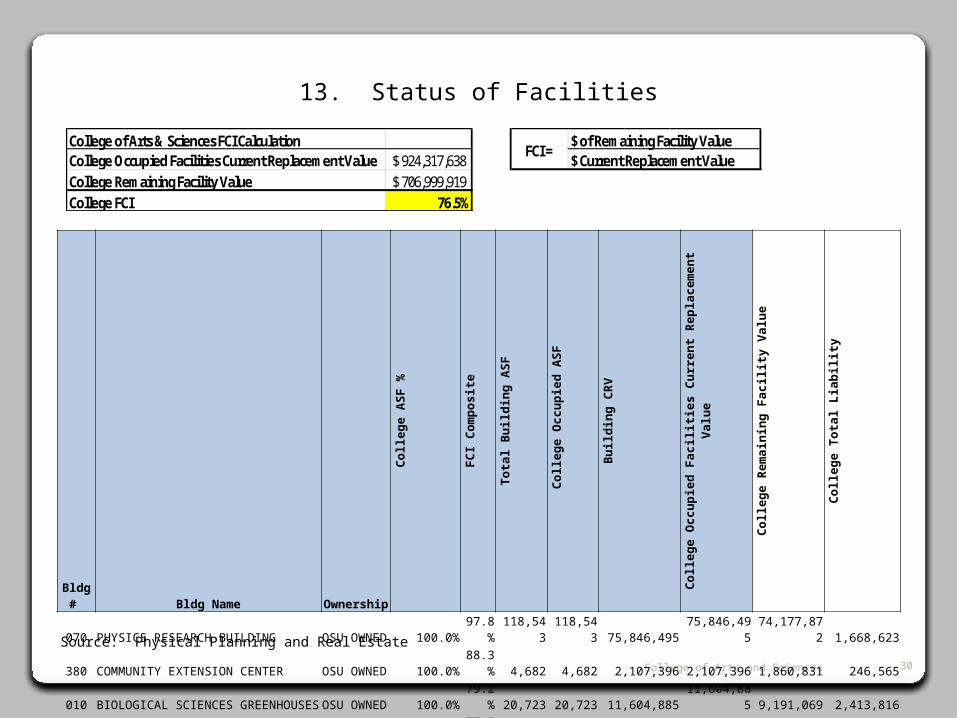
13. Status of Facilities
Source: Physical Planning and Real Estate
College of Arts & Sciences FCI Calculation $ of Remaining Facility ValueCollege Occupied Facilities Current Replacement Value 924,317,638$ $ Current Replacement ValueCollege Remaining Facility Value 706,999,919$ College FCI 76.5%
FCI =
30College of Arts and Sciences
Bldg # Bldg Name OwnershipCollege ASF
%
FCI Composite
Total Building
ASF
College Occupied
ASF Building CRV
College Occupied Facilities Current
Replacement Value
College Remaining
Facility ValueCollege Total
Liability070 PHYSICS RESEARCH BUILDING OSU OWNED 100.0% 97.8% 118,543 118,543 75,846,495 75,846,495 74,177,872 1,668,623380 COMMUNITY EXTENSION CENTER OSU OWNED 100.0% 88.3% 4,682 4,682 2,107,396 2,107,396 1,860,831 246,565010 BIOLOGICAL SCIENCES GREENHOUSES OSU OWNED 100.0% 79.2% 20,723 20,723 11,604,885 11,604,885 9,191,069 2,413,816394 BIOTECHNOLOGY SUPPORT FACILITY OSU OWNED 100.0% 77.5% 13,685 13,685 8,152,909 8,152,909 6,318,505 1,834,405147 NEWMAN & WOLFROM LAB OF CHEMISTRY OSU OWNED 100.0% 74.7% 28,435 28,435 20,533,105 20,533,105 15,338,229 5,194,875355 WEIGEL HALL OSU OWNED 100.0% 67.9% 20,664 20,664 14,078,631 14,078,631 9,559,390 4,519,241358 SHERMAN STUDIO ART CENTER OSU OWNED 100.0% 64.4% 18,877 18,877 7,291,647 7,291,647 4,695,820 2,595,826042 HUGHES HALL OSU OWNED 100.0% 54.7% 34,395 34,395 18,404,734 18,404,734 10,067,389 8,337,344234 ZOOLOGY RESEARCH LABORATORY ANNEX OSU OWNED 100.0% 54.2% 408 408 150,300 150,300 81,463 68,837187 MATHEMATICS BUILDING OSU OWNED 100.0% 53.2% 15,474 15,474 8,886,454 8,886,454 4,727,593 4,158,860231 ZOOLOGY RESEARCH LABORATORY OSU OWNED 100.0% 51.5% 611 611 267,200 267,200 137,608 129,592135 ZOOLOGY STORAGE BUILDING OSU OWNED 100.0% 46.0% 1,899 1,899 649,296 649,296 298,676 350,620007 MATHEMATICS TOWER OSU OWNED 98.6% 71.2% 30,283 29,854 18,698,943 18,434,047 13,125,042 5,309,006131 ARONOFF LABORATORY OSU OWNED 93.6% 95.1% 57,613 53,912 34,362,109 32,154,722 30,579,141 1,575,581371 CELESTE LABORATORY OF CHEMISTRY OSU OWNED 92.6% 75.3% 54,522 50,484 36,438,766 33,740,043 25,406,253 8,333,791063 COCKINS HALL OSU OWNED 91.8% 60.2% 37,051 34,004 18,629,182 17,097,155 10,292,487 6,804,668025 DERBY HALL OSU OWNED 91.6% 75.0% 66,152 60,598 35,091,222 32,145,028 24,108,771 8,036,257
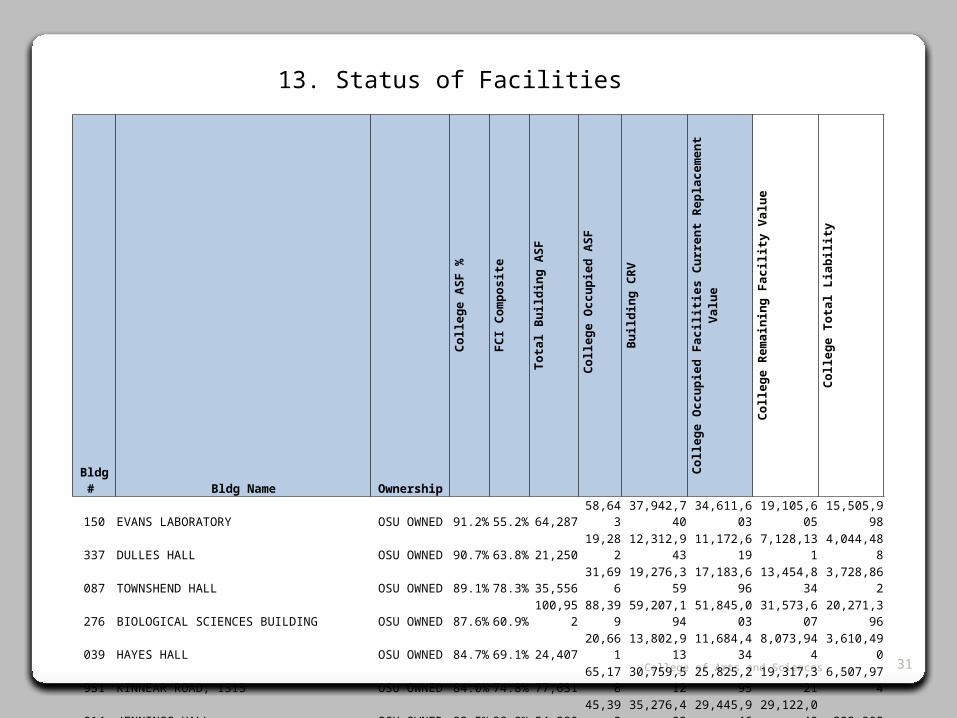
13. Status of Facilities
31College of Arts and Sciences
Bldg # Bldg Name OwnershipCollege ASF %
FCI Compo
site
Total Building
ASF
College Occupie
d ASF Building CRV
College Occupied Facilities Current
Replacement Value
College Remaining
Facility Value
College Total Liability
150 EVANS LABORATORY OSU OWNED 91.2% 55.2% 64,287 58,643 37,942,740 34,611,603 19,105,605 15,505,998337 DULLES HALL OSU OWNED 90.7% 63.8% 21,250 19,282 12,312,943 11,172,619 7,128,131 4,044,488087 TOWNSHEND HALL OSU OWNED 89.1% 78.3% 35,556 31,696 19,276,359 17,183,696 13,454,834 3,728,862276 BIOLOGICAL SCIENCES BUILDING OSU OWNED 87.6% 60.9% 100,952 88,399 59,207,194 51,845,003 31,573,607 20,271,396039 HAYES HALL OSU OWNED 84.7% 69.1% 24,407 20,661 13,802,913 11,684,434 8,073,944 3,610,490951 KINNEAR ROAD, 1315 OSU OWNED 84.0% 74.8% 77,631 65,178 30,759,512 25,825,295 19,317,321 6,507,974014 JENNINGS HALL OSU OWNED 83.5% 98.9% 54,380 45,392 35,276,492 29,445,946 29,122,040 323,905054 MENDENHALL LABORATORY OSU OWNED 82.9% 82.7% 70,328 58,286 38,722,629 32,092,298 26,540,331 5,551,968037 HAGERTY HALL OSU OWNED 82.7% 97.8% 71,255 58,945 42,801,577 35,407,185 34,628,227 778,958041 LAZENBY HALL OSU OWNED 80.7% 68.6% 31,646 25,547 20,768,152 16,765,594 11,501,197 5,264,396144 PSYCHOLOGY BUILDING OSU OWNED 78.5% 97.2% 74,648 58,607 41,076,832 32,249,891 31,346,894 902,997030 DENNEY HALL OSU OWNED 76.0% 67.6% 58,272 44,263 31,386,889 23,841,260 16,116,691 7,724,568053 MCPHERSON CHEMICAL LAB OSU OWNED 74.9% 79.2% 61,847 46,339 36,666,484 27,472,444 21,758,175 5,714,268309 PRESSEY HALL OSU OWNED 65.4% 67.8% 43,367 28,341 23,027,341 15,048,721 10,203,033 4,845,688046 JOURNALISM BUILDING OSU OWNED 64.5% 68.9% 46,316 29,877 25,752,152 16,611,906 11,445,604 5,166,303339 UNIVERSITY HALL OSU OWNED 62.7% 64.6% 46,491 29,140 23,045,005 14,444,332 9,331,038 5,113,294060 ORTON HALL OSU OWNED 60.7% 58.1% 25,682 15,593 12,103,921 7,348,977 4,269,756 3,079,222149 HOPKINS HALL OSU OWNED 59.9% 60.5% 67,705 40,582 34,102,842 20,441,054 12,366,838 8,074,216961 KNIGHT HOUSE OSU OWNED 58.4% 84.9% 4,491 2,621 2,666,358 1,556,118 1,321,144 234,974004 EIGHTEENTH AVENUE, 209 WEST OSU OWNED 55.0% 72.9% 9,568 5,260 7,689,660 4,227,384 3,081,763 1,145,621065 SMITH LABORATORY OSU OWNED 54.3% 72.2% 134,307 72,930 69,734,028 37,866,252 27,339,434 10,526,818296 DRAKE PERFORMANCE AND EVENT CENTER OSU OWNED 51.8% 64.1% 80,110 41,457 34,170,103 17,683,061 11,334,842 6,348,219308 RIGHTMIRE HALL OSU OWNED 44.2% 66.8% 54,933 24,290 31,082,419 13,743,869 9,180,904 4,562,965020 CYCLOTRON N & S OSU OWNED 41.9% 38.0% 5,297 2,220 371,287 155,608 59,131 96,477102 OXLEY HALL OSU OWNED 41.0% 70.5% 17,924 7,353 9,401,033 3,856,606 2,718,907 1,137,699266 RIFFE BUILDING OSU OWNED 29.3% 82.1% 69,190 20,240 40,663,464 11,895,195 9,765,955 2,129,240067 POMERENE HALL OSU OWNED 26.9% 55.7% 45,429 12,223 27,907,608 7,508,743 4,182,370 3,326,373

13. Status of Facilities
32
932 KINNEAR ROAD, 1165 (L) LEASED 61.9% 95,616 2,356 967 CHATHAM LANE, 921 (L) LEASED N/A 19,059 19,059981 KENNY ROAD, 2941 (L) LEASED N/A 2,712 2,712991 URBAN ARTS SPACE (LAZARUS BLDG) LEASED N/A 10,000 10,000
FCI Composite or CRV Not Assessed
College of Arts and Sciences
Bldg # Bldg Name OwnershipCollege ASF %
FCI Compo
site
Total Building
ASF
College Occupie
d ASF Building CRV
College Occupied Facilities Current
Replacement Value
College Remaining
Facility ValueCollege Total
Liability367 KINNEAR ROAD CENTER-BUILDING D OSU OWNED 26.9% 77.4% 6,537 1,756 3,104,656 833,988 645,506 188,481374 KINNEAR ROAD, 1224 BOT PLANT 24.8% 78.2% 33,796 8,365 13,193,676 3,265,626 2,553,720 711,907106 SULLIVANT HALL OSU OWNED 24.5% 63.1% 90,827 22,235 44,861,770 10,982,433 6,929,915 4,052,518073 RESEARCH CENTER OSU OWNED 22.7% 48.3% 75,228 17,066 31,035,334 7,040,583 3,400,602 3,639,982011 ARPS HALL OSU OWNED 22.3% 58.9% 70,228 15,679 38,805,669 8,663,697 5,102,917 3,560,779084 STILLMAN HALL OSU OWNED 12.4% 75.1% 33,445 4,149 20,035,041 2,485,435 1,866,562 618,873055 MERSHON AUDITORIUM OSU OWNED 12.2% 66.1% 51,111 6,234 34,649,673 4,226,215 2,793,528 1,432,687085 ENARSON HALL OSU OWNED 11.6% 73.1% 27,694 3,199 13,851,126 1,599,977 1,169,583 430,394082 OHIO STADIUM OSU OWNED 7.0% 92.7% 202,892 14,110 850,000,000 59,112,730 54,797,501 4,315,229126 KINNEAR RD BLDG, THE 1314 OSU OWNED 6.1% 46.1% 12,663 776 6,436,317 394,423 181,829 212,594311 MOUNT HALL OSU OWNED 4.9% 61.6% 43,745 2,133 22,056,771 1,075,485 662,499 412,986090 RAMSEYER HALL OSU OWNED 3.0% 56.6% 51,749 1,534 26,002,764 770,802 436,274 334,528263 SERVICE BUILDING ANNEX OSU OWNED 1.0% 67.3% 50,524 501 15,278,659 151,504 101,962 49,542310 SCOTT HALL OSU OWNED 0.6% 68.2% 35,217 214 19,887,622 120,849 82,419 38,430271 LINCOLN TOWER OSU OWNED 0.1% 63.7% 212,975 149 92,552,748 64,751 41,246 23,505
2,304,663,037 924,317,638 706,999,919 217,317,719