College of Agriculture and Natural Resource Science ...
116
BU-CANR-SRWM/2012/2020 Page-1 Proposal and Research Writing - Lecture Note (By Ademe T.) College of Agriculture and Natural Resource Science Department: Soil Resource and Watershed Management Degree Program: B.Sc in Soil Resources and Watershed Management (SRWM) Lecture Note on Research Method (MSRWM2102) By: - Ademe T. (MSc. In Soil Science) [email protected] February, 2020 Bonga, Ethiopia ttttt
Transcript of College of Agriculture and Natural Resource Science ...

BU-CANR-SRWM/2012/2020
Page-1
Proposal and Research Writing - Lecture Note (By Ademe T.)
College of Agriculture and Natural Resource Science
Department: Soil Resource and Watershed Management
Degree Program: B.Sc in Soil Resources and Watershed Management (SRWM)
Lecture Note on Research Method (MSRWM2102)
By: - Ademe T. (MSc. In Soil Science) [email protected]
February, 2020
Bonga, Ethiopia
ttttt

BU-CANR-SRWM/2012/2020
Research Method – Lecture Note By Ademe T. (MSc. In Soil Science) 2
Table of Contents
Chapter 1: Introduction ............................................................................................................... 4
1.1. Introduction to scientific research ....................................................................................................... 4
1.2. Quantitative and Qualitative Research ................................................................................................ 5
Chapter 2: Proposal and Research Writing ............................................................................... 9
2.1. Proposal Writing .................................................................................................................................. 9
2.1.1. Definition of proposal .................................................................................................................. 9
2.1.2. Structure/Format for Proposal Writing ........................................................................................ 9
2.1.3. Components of Research Proposal............................................................................................. 10
2.2. Research Report Writing ................................................................................................................... 13
2.2.1. General form of the main research report .................................................................................. 14
2.2.2. Preliminary sections ................................................................................................................... 14
2.2.3. Main body of the report.............................................................................................................. 15
2.3. Reference and citations ..................................................................................................................... 21
2.4. General Formatting Rules ................................................................................................................. 34
Chapter 3: Experimental Research ........................................................................................... 36
3.1. Introduction ....................................................................................................................................... 36
3.2. Basic principles of experimental design ............................................................................................ 41
3.2.1. Replication/Experimental material Experimental unit ............................................................... 41
3.2.2. Randomization ........................................................................................................................... 42
3.2.3. Statistical models ....................................................................................................................... 43
3.2.4. Source of variability ................................................................................................................... 44
3.2.5. ANOVA ..................................................................................................................................... 46
3.3. Overview of some experimental designs ........................................................................................... 46
3.3.1. CRD ........................................................................................................................................... 46
3.3.2. RCBD/LSD/Split plots ............................................................................................................... 50
3.3.3. Factorial experiment................................................................................................................... 90
Chapter 4: Social research methods .......................................................................................... 93
4.1. Introduction of social research methods ............................................................................................ 93

BU-CANR-SRWM/2012/2020
Research Method – Lecture Note By Ademe T. (MSc. In Soil Science) 3
4.2. Social Survey Methods ...................................................................................................................... 95
4.2.1. Introduction to survey research .................................................................................................. 95
4.2.2. The nature and scope of social survey ....................................................................................... 97
4.3. Methods of data collection in social survey ...................................................................................... 98
4.3.1. Types of interviewing technique ................................................................................................ 98
4.3.2. The Interview Method .............................................................................................................. 101
4.3.3. The Questionnaire Method ....................................................................................................... 104
4.3.4. Formulating Questions for a Survey ........................................................................................ 108
4.3.5. Survey Implementation ............................................................................................................ 113
4.3.6. Compilation Editing, Coding and Data Entry .......................................................................... 114
4.4. Analysis of Survey Data .................................................................................................................. 116

BU-CANR-SRWM/2012/2020
Research Method – Lecture Note By Ademe T. (MSc. In Soil Science) 4
Chapter 1: Introduction
1.1. Introduction to scientific research
The philosophy of science is concerned with how science operates, what the goals of science should be, what
relationship it should have with the rest of society, the differences between science and other activities, etc.
Everything in science has some relationship with the philosophy of science and is predicted upon some
philosophical position, even though that may be rarely evident.
The philosophy of science is divided into two areas of concern: the process of scientific research &
discovery and the fruits of that process, the things we discover and the insights we gain. The first is
concerned with the proper procedure for acquiring knowledge which can justifiably be called scientific;
the second is concerned with the ultimate use and purpose of that which is discovered.
What is research?
There are various definitions given for the term ―research‖. However, research is scientifically defined as a
systematic inquiry to describe, explain, predict and control the observed phenomenon. In other words,
research is the systematic process of collecting and analyzing information (data) in order to increase our
understanding of the phenomenon with which we are concerned or interested in. Research involves
inductive and deductive methods. Inductive methods analyze the observed phenomenon and identify the
general principles, structures, or processes underlying the phenomenon observed; deductive methods
verify the hypothesized principles through observations. The purposes are different: one is to develop
explanations (i.e. Inductive methods), and the other is to test the validity of the explanations (i.e. deductive
methods). Research involves three main stages: planning, data collection, and analysis.
Gall, Borg and Gall (1996) proposed four types of knowledge that research contributed to education as
follows:
1. Description: Results of research can describe natural or social phenomenon such as its form,
structure, activity, and change over time and relationship to other phenomena.
2. Prediction: Prediction research is intended to predict a phenomenon that will occur at time Y from
information at an earlier time X.
3. Improvement: This type of research is mainly concerned with the effectiveness of intervention.

BU-CANR-SRWM/2012/2020
Research Method – Lecture Note By Ademe T. (MSc. In Soil Science) 5
4. Explanation: This type research subsumes the other three: if the researchers are able to explain an
educational phenomenon, it means that they can describe, can predict its consequences, and know
how to intervene to change those consequences.
1. Basic Research: The purpose of this research is to understand and explain, i.e. the researcher is interested
in formulating and testing theoretical construct and propositions that ideally generalize across time and
space. This type of research takes the form of a theory that explains the phenomenon under investigation
to give its contribution to knowledge. This research is more descriptive in nature exploring what, why
and how questions.
2. Applied Research: The purpose of this research is to help people understand the nature of human
problems so that human beings can more effectively control their environment. In other words, this type
of research pursues potential solutions to human and societal problems. This research is more
prescriptive in nature, focusing on how questions.
3. Evaluation Research (summative and formative): Evaluation research studies the processes and
outcomes aimed at attempted solution. The purpose of formative research is to improve human
intervention within specific conditions such as activities, time, and groups of people whereas the purpose
of summative evaluation is to judge the effectiveness of a program, policy, or product.
4. Action Research: Action research aims at solving specific problems within a program, organization, or
community. Patton (1990) described that design and data collections in action research tend to be more
informal, and the people in the situation are directly involved in gathering information and studying
themselves.
1.2. Quantitative and Qualitative Research
There are numerous differences between quantitative and qualitative measurement.
Quantitative Research
Quantitative research is a systematic process used to gather and statistically analyze information that has
been objective and measured by an instrument and statistically valid. Instruments are used to convert
information into numbers. It studies only quantifiable concepts (concepts that can be measured and turned
into numbers)." It examines phenomenon through the numerical representation of observations and statistical
analysis. Quantitative research is inclined to be deductive. In other words it tests theory. Quantitative designs
of research tend to produce results that can be generalized. Quantitative research uses data that are structured
BU-CANR-SRWM/2012/2020
Research Method – Lecture Note By Ademe T. (MSc. In Soil Science) 6
in the form of numbers or that can be immediately transported into numbers. A quantitative experimental
design uses deductive reasoning to arrive at a testable hypothesis. The sample size for a survey is calculated
by statisticians using formulas to determine how large a sample size will be needed from a given population
in order to achieve findings with an acceptable degree of accuracy. Generally, researchers seek sample sizes
which yield findings with at least a 95% confidence interval (which means that if you repeat the survey 100
times, 95 times out of a hundred, you would get the same response), plus/minus a margin error of 5
percentage points. Many surveys are designed to produce a smaller margin of error.
Qualitative Research
Qualitative research is collecting, analyzing, and interpreting data by observing what people do and say.
Qualitative research refers to the meanings, concepts, definitions, characteristics, metaphors, symbols, and
descriptions of things. Qualitative research implies a focus on qualities of a process or entity and meanings
that are not examined or measured in terms of quantity, amount, frequency, or intensity. Qualitative research
can mean the analysis of open-ended questions that respondents are asked to write on a survey. It also can
refer to what is thought of as naturalistic research, a general label for qualitative research methods that
involve the researcher going to a natural setting, that is, to where the phenomenon being studied is taking
place. Qualitative research tends to be inductive. In other words it generates theory. Qualitative studies tend
to produce results that are less easy to generalize. This has to do with the problem of the sample used at the
time. If the data cannot be structured in the form of numbers, they are considered qualitative. A qualitative
research designs use inductive reasoning to propose a research statement. Qualitative research is much more
subjective than quantitative research and uses very different methods of collecting information, mainly
individual, in-depth interviews and focus groups. The nature of this type of research is open-ended. Small
numbers of people are interviewed in-depth and/or a relatively small number of focus groups are conducted.
The quality of the finding from qualitative research is directly dependent upon the skills, experience and
sensitive of the interviewer or group moderator. This type of research is often less costly than surveys and is
extremely effective in acquiring information about people‘s communications needs and their responses to
and views about specific communications. In general, qualitative research generates rich, detailed and valid
(process) data that contribute to in-depth understanding of the context. Qualitative analysis involves a
continual interplay between theory and analysis. In analyzing qualitative data, we seek to discover patterns
such as changes over time or possible causal links between variables.
Qualitative research includes many methods and some of them may include:

BU-CANR-SRWM/2012/2020
Research Method – Lecture Note By Ademe T. (MSc. In Soil Science) 7
Phenomenology: the study of lived experiences
Ethnography: systematic study of cultures
Grounded Theory: data are collected, analyzed, and used to develop a theoretical explanation and
generate hypotheses for further research.
Historical method: examines social phenomena by studying their historical context or their past.
Case Study: in-depth description of essential dimensions and processes of the phenomenon being
studied.
The decision of whether to choose a quantitative or a qualitative design is a philosophical question. Which
methods to choose will depend on the nature of the project, the type of information needed the context of the
study and the availability of recourses (time, money, and human). It is important to keep in mind that these
are two different philosophers, not necessarily polar opposites. In fact, elements of both designs can be used
together in mixed-methods studies. Combining of qualitative and quantitative research is becoming more and
more common.
Advantages of combining both types of research include: research development (one approach is used to
inform the other, such as using qualitative research to develop an instrument to be used in quantitative
research), increased validity (confirmation of results by means of different data sources), complementarities
(adding information, i.e. words to numbers and vice versa), creating new lines of thinking by the emergence
of fresh perspectives and contradictions. However, barriers to integration include philosophical differences,
cost, inadequate training and publication bias.
Table 1 Characteristics of quantitative and qualitative research
Quantitative Qualitative
Research questions: How many? Strength of
association?
Research questions: What? Why?
Objective Subjective
"Hard" science "Soft" science Reasoning is deductive Reasoning is inductive
Strives for generalization Strives for uniqueness
Literature review must be done early in study Literature review may be done as study
progresses or afterwards
Generalizations leading to prediction,
explanation, and understanding
Patterns and theories developed for
understanding
Test theory Develops theory
One reality: focus is concise and narrow Multiple realities: focus is complex and broad
Facts are value-free and unbiased Facts are value-laden and biased
Context free Context dependent

BU-CANR-SRWM/2012/2020
Research Method – Lecture Note By Ademe T. (MSc. In Soil Science) 8
Numbers Words
Large sample sizes Smaller sample sizes
Measurable Interpretive
Reduction, control, precision Discovery, description, understanding, shared
interpretation
Hypothesis Research questions
Establishes relationships, causation Describes meaning, discovery
Subjects Participants
Mechanistic: parts equal the whole Organismic: whole is greater than the parts
Reports statistical analysis
Reports rich narrative, individual;
interpretation
Basic element of analysis is numbers Basic element of analysis is words/ideas
Researcher is separate Researcher is part of the process
Uses instruments Uses communications and observation
Highly controlled setting: experimental setting
(outcome oriented)
Flexible approach: natural setting (process
oriented)
Sample size: n Sample size is not a concern; seeks "informal
rich" sample
"Counts the beans" Provides information as to "which beans are
worth counting"
BU-CANR-SRWM/2012/2020
Research Method – Lecture Note By Ademe T. (MSc. In Soil Science) 9
Chapter 2: Proposal and Research Writing
2.1. Proposal Writing
2.1.1. Definition of proposal
A Research Proposal is simply defined as a document that is typically written by a scientist or academician
which describes the ideas for an investigation on a certain topic. In other words, a research proposal is a
document written by a researcher that provides a detailed description of the proposed program. It is like an
outline of the entire research process that gives a reader a summary of the information discussed in a project.
The research proposal outlines the process from beginning to end and may be used to request financing for
the project, certification for performing certain parts of research of the experiment, or as a required task
before beginning a college dissertation. Thus, a research proposal is more formal than research design.
Research proposals are written in future tense and have different points of emphasis.
2.1.2. Structure/Format for Proposal Writing
There is no single format for research proposals. This is because every research project is different. For
example, different disciplines, donor organizations and academic institutions all have different formats and
requirements. There are, however, several key components which must be included in every research
proposal. The specific research problem will dictate what other sections are required.
Research proposals are written for various reasons, such as:
Requesting a budget (grant) for the research they describe,
Certification requirements for research (as from an institutional review board committee if the
experiment is to be done on human beings or animals protected by animal rights laws),
As a task in tertiary education (e.g., before performing research for a dissertation), or
As a condition for employment at a research institution (which usually requires sponsor-approved
research proposals).
Like scientific articles, research proposals have sections describing the research background, statement of the
research problem, research questions, objectives of the study, significance of the study, materials, methods
(i.e. research design, data collection procedures, data analyses), activity schedules, budgetary plans, and
references. The method section of research proposals is far more detailed than those of scientific articles,

BU-CANR-SRWM/2012/2020
Research Method – Lecture Note By Ademe T. (MSc. In Soil Science) 10
allowing profound understanding of the price and risks of the study and the plans for reducing them. Instead
of a section describing the results, research proposals have a section describing the hypotheses or the
expected results. A typical research proposal includes an extensive, but focused literature review.
2.1.3. Components of Research Proposal
Key components are:
1. A description of the research problem.
Before your proposal can make sense to a reader, he or she must understand clearly what the proposed
research will be about. Therefore, you would do well to begin this section with a clear and simple
formulation of your research question. Read the following examples:
This research project explores the extent to which saving is growing within different sectors of the
South African population. In particular, the research focuses on the factors which promote and
maintain saving in our society.
Many community projects in rural areas rely on micro-enterprises (such as community gardens), to
extend the income generating potential of communities. The following is an investigation of the
extent to which these micro-enterprises do actually influence the broader economic position of these
communities.
Flesh out this section with some or all of the following:
If it arises out of a debate in the literature, introduce that debate.
• Clarify or quantify any concepts which may not be clear.
2. An argument as to why that problem is important (i.e. why the research is important).
This section, often referred to as the "rationale" is crucial, because it is one place in which the researcher
tries to convince her/his supervisor/external examiner that the research is worth doing. You can do this by
describing how the results may be used.
Think about how your research:
May resolve theoretical questions in your area;
May develop better theoretical models in your area;
May influence public policy;
May change the way people do their jobs in a particular field, or may change the way people live.

BU-CANR-SRWM/2012/2020
Research Method – Lecture Note By Ademe T. (MSc. In Soil Science) 11
Are there other contributions your research will make? If so, describe them in detail. Look at the following
example:
In the economic example of micro-enterprises in rural communities, the researcher might argue that the
research will:
Provide an understanding of the economic impact of micro-enterprises;
Support the government's plans for start-up loans to micro-enterprises;
Demonstrate the usefulness of micro-enterprises as part of rural development, thereby contributing
to the work of government and non-government rural development organizations.
Detail regarding each of the above three points should be added to produce a convincing argument as to the
usefulness of the research.
3. A review of literature relevant to the research problem.
The literature review presents one of the greatest challenges of the research proposal to both experienced and
inexperienced researchers alike.
The literature review:
Provides a conceptual framework for the reader so that the research question and methodology can be
better understood.
Demonstrates to the expert reader that the researcher is aware of the breadth and diversity of
literature that relates to the research question.
It is important that you are able to provide an integrated overview of your field of study. This means that you
show awareness of the most important and relevant theories, models, studies and methodologies.
4. A description of the proposed research methodology.
This may include:
Research Design: Should the researcher plan to use several groups, or repeated testing to test particular
hypotheses, this should be explained in this section. Most research methodology textbooks discuss the
more commonly used research designs. Research design involves research method. However, research
method is simply a technique for collecting data.
Sampling: Empirical research almost always depends upon a sample which is assumed to accurately
represent a population. Therefore, the techniques by which the sample was chosen are vital to a
discussion the validity of the research findings.

BU-CANR-SRWM/2012/2020
Research Method – Lecture Note By Ademe T. (MSc. In Soil Science) 12
Empirical research methodology measurement instruments: When particular measurement
instruments are used, it is often important to explain how those instruments were developed, where they
have previously been used (if at all), and to what effect.
Data collection procedures: Detailed data collection procedures should also be included so that other
researchers can replicate your method exactly if required.
Data analyses: Various techniques of quantitative and qualitative data analyses exist and should be
described in detail in this section.
5. A description of how the research findings will be used and/or disseminated. Who is going to use the
results of your research results? It should be clearly stated in your proposal.
Caveats
Make sure that you find a proposal structure that suits the needs of your research. If you are submitting to
different organizations, make sure that you find out what those organizations' requirements are. Some
institutions have very rigid formats and often proposals are disadvantaged because they do not conform to
the requirements laid down.
Apart from the sections outlined above, many organizations demand other sections as well. These sections
could include:
Time frames: Inexperienced researchers tend to underestimate the amount of time that the various stages of
the research will take. Be generous when working out time frames and check them with a more experienced
researcher.
In summary, the main components of research proposal may include:
Title of the research study
Introduction – background / information about the study
Statement of research question
Remember to stress why the research problem is important!
Aims and objectives of the study
Hypotheses and predictions
Significance of the study
Materials -used to conduct the study

BU-CANR-SRWM/2012/2020
Research Method – Lecture Note By Ademe T. (MSc. In Soil Science) 13
Methods – description of the study site, research design (e.g. experimental design, survey
questionnaire, in-depth interview, focused group discussion, etc.), techniques used to collect the
research data, sampling procedures used to collect the data, etc.
Data analyses
Activity schedule / Timetable
Budgetary plan
References- consulted materials to enrich the literature part of the proposal.
2.2. Research Report Writing
A report is a formal piece of writing based on research guideline. The following format can be followed to
write research report.
I. Structure:
i. Introduction
Briefly introduce the study and state the purpose/aim of the report, when and how the information was
gathered.
ii. Main Body
All the information collected and analyzed is presented clearly and in detail (break down the respondents
into groups according to sex, age and place of residence, state the main differences between groups). Sub-
headings, numbers or letters can be used to separate each piece of information.
iii. Conclusion
Sum up the points mentioned above. If necessary, a recommendation can be included as well (one way of
summing up is making some general comments).
II. Useful hints and phrases:
Present Tenses, Reported Speech and an impersonal style should be used in survey reports. Use a
variety of reporting verbs such as claim, state, report, agree, complain, suggest, etc.
When reporting the results of a survey, the figures gathered should be given in the form of
percentages and proportions. Expressions such as ―one in four‖ or ―six out of ten‖ can be used, or
exact percentages e.g. 25% of the people questioned, 68% of those who filled in the questionnaire,
etc. Less exact expressions such as: the majority of those questioned, a large proportion of, a
significant number of, etc. can also be used.

BU-CANR-SRWM/2012/2020
Research Method – Lecture Note By Ademe T. (MSc. In Soil Science) 14
2.2.1. General form of the main research report
An objective of organizing a research paper is to allow people to read your work selectively. When we
research a topic, we may be interested in just the methods, a specific result, the interpretation, or perhaps we
just want to see a summary of the paper to determine if it is relevant to our study. To this end, many journals
require the following sections, submitted in the order listed, each section to start on a new page. Of course,
there are variations. Some journals call for a combined results and discussion, for example, or include
materials and methods after the body of the paper (e.g. Journal of Science).
2.2.2. Preliminary sections
a. Title Page
Select an informative title about the research project. Include the name(s) and address(es) of all
authors, and date submitted.
b. Abstract
The summary should be two hundred words or less.
General intent
An abstract is a concise single paragraph summary of completed work or work in progress. In a minute or
less, a reader can learn the rationale behind the study, general approach to the problem, pertinent results, and
important conclusions or new questions.
Writing an abstract
Write your summary after the rest of the paper is completed. After all, how can you summarize something
that is not yet written? Economy of words is important throughout any paper, but especially in an abstract.
However, use complete sentences and do not sacrifice readability for brevity. You can keep it concise by
wording sentences so that they serve more than one purpose
Summarize the study, including the following elements in any abstract. Try to keep the first two items to no
more than one sentence each.
Purpose of the study - hypothesis, overall question, objective
Model organism or system and brief description of the experiment

BU-CANR-SRWM/2012/2020
Research Method – Lecture Note By Ademe T. (MSc. In Soil Science) 15
Results, including specific data - if the results are quantitative in nature, report quantitative data; results
of any statistical analysis should be reported
Important conclusions or questions that follow from the experiment(s)
Style:
Single paragraph, and concise
As a summary of work done, it is always written in past tense
An abstract should stand on its own, and not refer to any other part of the paper such as a figure or table
Focus on summarizing results - limit background information to a sentence or two, if absolutely
necessary
What you report in an abstract must be consistent with what you reported in the paper
Correct spelling, clarity of sentences and phrases, and proper reporting of quantities (proper units,
significant figures) are just as important in an abstract as they are anywhere else
C. ACKNOWLEDGEMENTS
In your research report, you need to kindly acknowledge those people who helped you in one way or in the
other way from the beginning up to the end of the research project. Moreover, you should also thank those
organizations that financially supported your research project, those who gave you a research permit to carry
out the research work, etc. In your research report, especially in the acknowledgements section, you should
not overlook to mention the names of those people or organizations that have merited your research project.
The acknowledgements section may come either at the beginning or at the end of your research report.
Anyway, it depends on the format of the journal style.
D. CONTENTS
The contents of the report should be clearly written containing heading, subheadings, etc. together with
their respective page numbers.
E. Acronyms
If there are acronyms used, they should be included in the research report with enough details.
2.2.3. Main body of the report
The main body of the research should include the followings:
1. Introduction
Your introduction should not exceed two pages (double spaced, typed).
BU-CANR-SRWM/2012/2020
Research Method – Lecture Note By Ademe T. (MSc. In Soil Science) 16
General intent
The purpose of an introduction is to acquaint the reader with the rationale behind the work (i.e. why the work
was done), with the intention of defending it. It places your work in a theoretical context, and enables the
reader to understand and appreciate your objectives.
Writing an introduction
The abstract is the only text in a research paper to be written without using paragraphs in order to separate
major points. Approaches vary widely; however, for our studies the following approach can produce an
effective introduction.
Describe the importance (significance) of the study - why was this worth doing in the first place?
Provide a broad context.
Defend the model - why did you use this particular organism or system? What are its advantages? You
might comment on its suitability from a theoretical point of view as well as indicate practical reasons for
using it.
Provide a rationale. State your specific hypothesis(es) or objective(s), and describe the reasoning that
led you to select them.
Very briefly describe the experimental design and how it accomplished the stated objectives.
Style:
Use past tense except when referring to established facts. After all, the paper will be submitted after all
of the work is completed.
Organize your ideas, making one major point in each paragraph. If you make the four points listed
above, you will need a minimum of four paragraphs.
Present background information only as needed in order to support a position. The reader does not want
to read everything you know about a subject.
State the hypothesis/objective precisely - do not oversimplify.
As always, pay attention to spelling, clarity and appropriateness of sentences and phrases.
2. Materials and Methods
There is no specific page limit, but a key concept is to keep this section as concise as you possibly can.
People will want to read this material selectively. The reader may only be interested in one formula or part of
a procedure. Materials and methods may be reported under separate subheadings within this section or can be
incorporated together.
General intent

BU-CANR-SRWM/2012/2020
Research Method – Lecture Note By Ademe T. (MSc. In Soil Science) 17
This should be the easiest section to write, but many students misunderstand the purpose. The objective is to
document all specialized materials and general procedures, so that another individual may use some or all of
the methods in another study or judge the scientific merit of your work. It is not to be a step by step
description of everything you did, nor is a methods section a set of instructions. In particular, it is not
supposed to tell a story. By the way, your notebook should contain all of the information that you need for
this section.
Writing materials and methods section
Materials:
Describe materials separately only if the study is so complicated that it saves space this way.
Include specialized chemicals, biological materials, and any equipment or supplies that are not
commonly found in laboratories.
Do not include commonly found supplies, such as test tubes, pipet tips, beakers, etc., or standard lab
equipment, such as centrifuges, spectrophotometers, pipettors, etc.
If use of a specific type of equipment, a specific enzyme, or a culture from a particular supplier is
critical to the success of the experiment, then it and the source should be singled out, otherwise no.
Materials may be reported in a separate paragraph or else they may be identified along with your
procedures.
In biosciences, we frequently work with solutions - refer to them by name and describe completely,
including concentrations of all reagents, and pH of aqueous solutions, solvent if non-aqueous.
Methods:
Report the methodology (not details of each procedure that employed the same methodology)
Describe the methodology completely, including such specifics as temperatures, incubation times, etc.
To be concise, present methods under headings devoted to specific procedures or groups of procedures
Generalize - report how procedures were done, not how they were specifically performed on a particular
day. For example, report "samples were diluted to a final concentration of 2 mg/ml protein;" don't report
that "135 microliters of sample one was diluted with 330 microliters of buffer to make the protein
concentration 2 mg/ml." Always think about what would be relevant to an investigator at another
institution, working on his/her own project.
If well documented procedures were used, report the procedure by name, perhaps with reference, and
that's all. For example, the Bradford assay is well known. You need not report the procedure in full - just

BU-CANR-SRWM/2012/2020
Research Method – Lecture Note By Ademe T. (MSc. In Soil Science) 18
that you used a Bradford assay to estimate protein concentration, and identify what you used as a
standard.
Style:
It is awkward or impossible to use active voice when documenting methods without using first person,
which would focus the reader's attention on the investigator rather than the work. Therefore, when
writing up the methods most authors use third person passive voice.
Use normal prose in this and in every other section of the paper – avoid informal lists, and use complete
sentences.
What to avoid
Materials and methods are not a set of instructions.
Omit all explanatory information and background - save it for the discussion.
Omit information that is irrelevant to a third party, such as what color ice bucket you used, or which
individual logged in the data.
3. Results
The page length of this section is set by the amount and types of data to be reported. Continue to be concise,
using figures and tables, if appropriate, to present results most effectively. See recommendations for content,
below.
General intent
The purpose of the results section is to present and illustrate your findings. Make this section a
completely objective report of the results, and save all interpretation for the discussion.
Writing a results section
IMPORTANT: You must clearly distinguish material that would normally be included in a research article
from any raw data or other appendix material that would not be published. In fact, such material should not
be submitted at all unless requested by the instructor.
Content
Summarize your findings in text and illustrate them, if appropriate, with figures and tables.
In text, describe each of your results, pointing the reader to observations that are most relevant.
Provide a context, such as by describing the question that was addressed by making a particular
observation.
Describe results of control experiments and include observations that are not presented in a formal
figure or table, if appropriate.

BU-CANR-SRWM/2012/2020
Research Method – Lecture Note By Ademe T. (MSc. In Soil Science) 19
Analyze your data, then prepare the analyzed (converted) data in the form of a figure (graph), table, or
in text form.
What to avoid
Do not discuss or interpret your results, report background information, or attempt to explain anything.
Never include raw data or intermediate calculations in a research paper.
Do not present the same data more than once.
Text should complement any figures or tables, not repeat the same information.
Please do not confuse figures with tables - there is a difference.
Style
As always, use past tense when you refer to your results, and put everything in a logical order.
In text, refer to each figure as "figure 1," "figure 2," etc.; number your tables as well.
Place figures and tables, properly numbered, in order at the end of the report (clearly distinguish them
from any other material such as raw data, standard curves, etc.)
If you prefer, you may place your figures and tables appropriately within the text of your results
section.
Figures and tables
Either place figures and tables within the text of the result, or include them in the back of the report as
appendix (following Literature Cited) - do one or the other
If you place figures and tables at the end of the report, make sure they are clearly distinguished from
any attached appendix materials, such as raw data
Regardless of placement, each figure must be numbered consecutively and complete with caption
(caption goes under the figure)
Regardless of placement, each table must be titled, numbered consecutively and complete with heading
(title with description goes above the table)
Each figure and table must be sufficiently complete that it could stand on its own, separate from text
4. Discussion
Journal guidelines vary. Space is so valuable in some journals, such as the Journal of Biological Chemistry,
that authors are asked to restrict discussions to four pages or less, double spaced, typed. That works out to
one printed page. While you are learning to write effectively, the limit will be extended to five typed pages.
If you practice economy of words, that should be plenty of space within which to say all that you need to say.

BU-CANR-SRWM/2012/2020
Research Method – Lecture Note By Ademe T. (MSc. In Soil Science) 20
General intent
The objective here is to provide an interpretation of your results and support for all of your conclusions,
using evidence from your research and generally accepted knowledge, if appropriate. The significance of
findings should be clearly described.
Writing a discussion
Interpret your data in the discussion in appropriate depth. This means that when you explain a phenomenon
you must describe mechanisms that may account for the observation. If your results differ from your
expectations, explain why that may have happened. If your results agree, then describe the theory that the
evidence supported. It is never appropriate to simply state that the data agreed with expectations, and let it
drop at that.
Decide if each hypothesis is supported, rejected, or if you cannot make a decision with confidence. Do
not simply dismiss a study or part of a study as "inconclusive."
Research papers are not accepted if the work is incomplete. Draw what conclusions you can base upon
the results that you have, and treat the study as a finished work.
You may suggest future directions, such as how the research might be modified to accomplish another
objective.
Explain all of your observations as much as possible, focusing on mechanisms.
Decide if the research design adequately addressed the hypothesis, and whether or not it was properly
controlled.
Try to offer alternative explanations if reasonable alternatives exist.
One research will not answer an overall question, so keeping the big picture in mind, where do you go
next? The best studies open up new avenues of research. What questions remain?
Recommendations for specific papers will provide additional suggestions.
Style:
When you refer to information, distinguish data generated by your own studies from published
information or from information obtained from other students (verb tense is an important tool for
accomplishing that purpose).
Refer to work done by specific individuals (including yourself) in past tense.
Refer to generally accepted facts and principles in present tense. For example, "Doofus, in a 1989
survey, found that anemia in basset hounds was correlated with advanced age. Anemia is a condition in

BU-CANR-SRWM/2012/2020
Research Method – Lecture Note By Ademe T. (MSc. In Soil Science) 21
which there is insufficient hemoglobin in the blood."
The biggest mistake that students make in discussions is to present a superficial interpretation that more or
less re-states the results. It is necessary to suggest why results came out as they did, focusing on the
mechanisms behind the observations.
2.3. Reference and citations
List all literature cited in your paper, in alphabetical order, by the names of the first author. In a proper
research paper, only primary literature is used (original research articles authored by the original
investigators). Be cautious about using websites as references - anyone can put just about anything on a
website, and you have no sure way of knowing if it is truth or fiction. If you are citing an on line journal, use
the journal citation (name, volume, year, page numbers).
This section is often called "References," "Bibliography," "Works cited," or "Works consulted."
Uses of citation
Broadly, a citation is a reference to a published or unpublished source (not always the original source). More
precisely, a citation is an abbreviated alphanumeric expression embedded in the body of an intellectual work
that denotes an entry in the bibliographic references section of the work for the purpose of acknowledging
the relevance of the works of others to the topic of discussion at the spot where the citation appears.
Generally, the combination of both the in-body citation and the bibliographic entry constitutes what is
commonly thought of as a citation (whereas bibliographic entries by themselves are not).
Citation has several important purposes:
To uphold intellectual honesty (or avoiding plagiarism),
To attribute prior or unoriginal work and ideas to the correct sources,
To allow the reader to determine independently whether the referenced material supports the author's
argument in the claimed way, and
To help the reader gauge the strength and validity of the material the author has used.
Bibliographies and other list-like compilations of references are generally not considered citations because
they do not fulfil the true spirit of the term: deliberate acknowledgement by other authors of the priority of
one's ideas.
Major citation styles

BU-CANR-SRWM/2012/2020
Research Method – Lecture Note By Ademe T. (MSc. In Soil Science) 22
There are three major citation styles. These are: APA (American Psychological Association), Chicago, and
MLA (Modern Language Association). Each of these citation systems has its respective advantages and
disadvantages relative to the trade-offs of being informative (but not too disruptive) and thus are chosen
relative to the needs of the type of publication being crafted. Thus, editors often specify the citation system
to use. Let us briefly discuss each of them as follows.
1. APA (American Psychological Association) Citation Style: implemented in Psychology, Business, and
other Social Sciences. APA Citation Style is a standardized format for writing that has been established
by the American Psychological Association. It is generally used by students and scholars working within
a behavioral science discipline.
2. Chicago Citation Style: implemented in History, Religion & Theology, other Humanities, and some
Sciences. The Chicago Citation Style is a method of documenting one's books, journal articles etc. It
contains two basic documentation systems:
(1) Notes and Bibliography
(2) Author-Date
Selecting which one generally depends on the disciplinary area and the nature of the sources cited. Each
documentation system tends to be used by scholars/students in different subject areas:
1) The notes and bibliography style is preferred by many in the humanities, including those in
literature, history and the arts. This style presents bibliographic information in notes and a
bibliography.
2) The author-date system is often used by those in the physical, natural and social sciences. In this
system, sources are briefly cited in the text, usually in parentheses, by author‘s last name and date of
publication (e.g. Tadesse and Kotler, 2010). The short citations are amplified in a list of references,
where full bibliographic information is provided. Example:
Tadesse, S. A. and Kotler, B. P. 2010. Habitat choices of Nubian Ibex (Capra nubiana) evaluated
with a habitat suitability modeling and isodar analysis. Israel Journal of Ecology and Evolution.
56:55–74.
3. MLA (Modern Language Association) Citation Style: implemented in English Literature, non-
English Literature, Language and other Humanities. MLA Citation Style is a standardized format for
writing that has been established by the Modern Language Association. It is generally used by

BU-CANR-SRWM/2012/2020
Research Method – Lecture Note By Ademe T. (MSc. In Soil Science) 23
students and scholars working within disciplines related to language and literature, but are also used in
many other disciplines of humanities.
End of Text Citation
It is a style of citation in which the author/s name/s and the year of publication appear at the end of the
sentence in the text. Example may include:
Deforestation due to fuel wood collection, clearing of forests for crop cultivation and illegal
commercial logging are the major threats to the Bale Mountains National Park (Hillman, 1993; Tedla,
1995; Stephens et al., 2001; Refera and Bekele, 2004; Evangelista et al., 2007).
Wild animals in the Munessa Forest were subjected to intensive poaching during the civil unrest
following the fall of the Dergue government in 1991 (Hundessa, 1992, 1997; Evangelista et al.,
2007).
In Text Citation
There are several in-text citations. Some of the common ones may include APA (American Psychological
Association) in-text citation, Chicago in-text citation, and MLA (Modern Language Association) in-text
citation. Let us discuss how each of them works with examples.
I. APA in-text citations
APA‘s (American Psychological Association) in-text citations provide at least the author‘s last name and the
year of publication. For direct quotations and some paraphrases, a page number is given as well.
NOTE: APA style requires the use of the past tense or the present perfect tense in signal phrases introducing
cited material. Example: Smith (2005) reported; Smith (2005) has argued. However, APA style requires the
year of publication in an in-text citation. Do not include a month, even if the entry in the reference list
includes the month.
1. Basic format for a quotation. Ordinarily, introduce the quotation with a signal phrase that includes the
author‘s last name followed by the year of publication in parentheses. Put the page number preceded by
"p." (or "pp." for more than one page) in parentheses after the quotation. Example:
Critser (2003) noted that despite growing numbers of overweight Americans, many health care providers still
―remain either in ignorance or outright denial about the health danger to the poor and the young‖ (p. 5).

BU-CANR-SRWM/2012/2020
Research Method – Lecture Note By Ademe T. (MSc. In Soil Science) 24
If the author is not named in the signal phrase, place the author‘s name, the year, and the page number in
parentheses after the quotation: (Critser, 2003, p. 5).
2. Basic format for a summary or a paraphrase. Include the author‘s last name and the year either in a
signal phrase introducing the material or in parentheses following it. Give a page number to help readers
find the passage. Example:
Brown (1969) explained that mountain nyala exhibit a polygynous reproductive strategy, which is common
among non-territorial antelopes where potential mates may be widely distributed (p. 7).
Mountain nyala exhibit a polygynous reproductive strategy, which is common among non-territorial
antelopes where potential mates may be widely distributed (Brown, 1969, p. 7).
3. Work with two authors. Name both authors in the signal phrase or the parentheses each time you cite
the work. In the parentheses, use ―&‖ between the authors‘ names; in the signal phrase, use ―and.‖
Example:
According to Sothern and Gordon (2003), ―Environmental factors may contribute as much as 80% to the
causes of childhood obesity‖ (p. 104). Or
Obese children often engage in limited physical activity (Sothern & Gordon, 2003, p. 104).
4. Work with three to five authors. Identify all authors in the signal phrase or the parentheses the first
time you cite the source. Example:
In 2003, Berkowitz, Wadden, Tershakovec, and Cronquist concluded, ―Sibutramine . . . must be carefully
monitored in adolescents, as in adults, to control increases in [blood pressure] and pulse rate‖ (p. 1811).
In subsequent citations, use the first author‘s name followed by ―et al.‖ in either the signal phrase or the
parentheses. Example:
As Berkowitz et al. (2003) advised, ―Until more extensive safety and efficacy data are available, . . . weight-
loss medications should be used only on an experimental basis for adolescents‖ (p. 1811).

BU-CANR-SRWM/2012/2020
Research Method – Lecture Note By Ademe T. (MSc. In Soil Science) 25
5. Work with six or more authors. Use the first author‘s name followed by ―et al.‖ in the signal phrase or
the parentheses. Example:
McDuffie et al. (2002) tested 20 adolescents, aged 12-16, over a three-month period and found that orlistat,
combined with behavioral therapy, produced an average weight loss of 4.4 kg, or 9.7 pounds (p. 646).
6. Work with unknown author. If the author is unknown, mention the work‘s title in the signal phrase or
give the first word or two of the title in the parenthetical citation. Titles of articles and chapters are put in
quotation marks; titles of books and reports are italicized. Example:
Children struggling to control their weight must also struggle with the pressures of television advertising
that, on the one hand, encourages the consumption of junk food and, on the other, celebrates thin celebrities
(―Television,‖ 2002).
NOTE: In the rare case when ―Anonymous‖ is specified as the author, treat it as if it were a real name:
(Anonymous, 2001). In the list of references, also use the name Anonymous as author.
7. Organization as author. If the author is a government agency or another organization, name the
organization in the signal phrase or in the parenthetical citation the first time you cite the source.
Example:
Obesity puts children at risk for a number of medical complications, including diabetes, hypertension, and
orthopedic problems (Henry J. Kaiser Family Foundation, 2004, p. 1).
If the organization has a familiar abbreviation, you may include it in brackets the first time you cite the
source and use the abbreviation alone in later citations. Example:
FIRST CITATION
(Centers for Disease Control and Prevention [CDC], 2009)
LATER CITATIONS
(CDC, 2009)
8. Authors with the same last name. To avoid confusion, use initials with the last names if your reference
list includes two or more authors with the same last name. Example:
Research by E. Smith (1989) revealed that . . .

BU-CANR-SRWM/2012/2020
Research Method – Lecture Note By Ademe T. (MSc. In Soil Science) 26
9. Two or more works by the same author in the same year. When your list of references includes more
than one work by the same author in the same year, use lowercase letters (―a,‖ ―b,‖ and so on) with the
year to order the entries in the reference list. Use those same letters with the year in the in-text citation.
Example:
Research by Durgin (2003a, b) has yielded new findings about the role of counseling in treating childhood
obesity.
10. Two or more works in the same parentheses. When your parenthetical citation names two or more
works, put them in the same order that they appear in the reference list, separated with semicolons.
Example:
Researchers have indicated that studies of pharmacological treatments for childhood obesity are inconclusive
(Berkowitz et al., 2003; McDuffie et al., 2002).
11. Personal communication. Personal interviews, memos, letters, e-mail, and similar unpublished
communications should be cited in the text only, not in the reference list. (Use the first initial with the
last name in pareAntheses.) Example:
One of Atkinson‘s colleagues, who has studied the effect of the media on children‘s eating habits, has
contended that advertisers for snack foods will need to design ads responsibly for their younger viewers (F.
Johnson, personal communication, October 20, 2009).
12. Electronic source. When possible, cite electronic sources, including online sources, as you would any
other source, giving the author and the year. Example:
Atkinson (2001) found that children who spent at least four hours a day watching TV were less likely to
engage in adequate physical activity during the week.
NOTE: Electronic sources sometimes lack authors‘ names, dates, or page numbers.
Unknown author: Use the first few words of the title as the reference in the text (capitalize all words in
title): Example: ("Structuring Lawmaking", 2002)

BU-CANR-SRWM/2012/2020
Research Method – Lecture Note By Ademe T. (MSc. In Soil Science) 27
Unknown date: When the date is unknown, use the abbreviation ―n.d.‖ (for ―no date‖). Example:
Attempts to establish a definitive link between television programming and children‘s eating habits have
been problematic (Magnus, n.d.).
No page numbers: APA ordinarily requires page numbers for quotations, summaries and paraphrases.
When an electronic source lacks stable numbered pages, include paragraph numbers or headings to
help readers locate the particular passage being cited.
If the source has numbered paragraphs, use the paragraph number preceded by the abbreviation ―para.‖:
(Hall, 2008, para. 5). If the source contains headings, cite the appropriate heading in parentheses; you may
also indicate the paragraph under the heading that you are referring to, even if the paragraphs are not
numbered. Example:
Hoppin and Taveras (2004) pointed out that several other medications were classified by the Drug
Enforcement Administration as having the ―potential for abuse‖ (Weight-Loss Drugs section, para. 6).
NOTE: Electronic files in portable document format (PDF) often have stable page numbers. For such
sources, give the page number in the parenthetical citation.
13. Indirect source. If you use a source that was cited in another source (a secondary source), name the
original source in your signal phrase. List the secondary source in your reference list and include it in
your parenthetical citation, preceded by the words ―as cited in.‖
In the following example, Satcher is the original source, and Critser is the secondary source, given in the
reference list. Example:
Former surgeon general Dr. David Satcher described ―a nation of young people seriously at risk of starting
out obese and dooming themselves to the difficult task of overcoming a tough illness‖ (as cited in Critser,
2003, p. 4).
14. Sacred or classical text. Identify the text, the version or edition you used, and the relevant part (chapter,
verse, line). It is not necessary to include the source in the reference list. Example:
Peace activists have long cited the biblical prophet‘s vision of a world without war: ―And they shall beat
their swords into plowshares, and their spears into pruning hooks; nation shall not lift up sword against
nation, neither shall they learn war any more‖ (Isaiah 2:4, Revised Standard Version).

BU-CANR-SRWM/2012/2020
Research Method – Lecture Note By Ademe T. (MSc. In Soil Science) 28
Group or corporate authors. Use the name of the body in the citation. Example:
(World Bank, 1998)
Author is listed as "Anonymous". Use it as if it were the author's name. Example:
(Anonymous, 2003)
When paraphrasing, APA style does not require page numbers in the in-text citation. However, authors are
encouraged to include page numbers if it will help the reader locate the relevant information in longer texts.
If the reference is to an exact quotation, the author, year and page number must be included. The page
number can be given in parentheses at the end of the exact quotation or incorporated into the in-text citation.
Example:
Newman (1994) concluded "sibling conflict is so common that its occurrence is taken for granted" (p. 123).
Such findings have prompted one researcher to conclude, ―Sibling conflict is so common that its occurrence
is taken for granted‖ (Newman, 1994, p. 123).
For exact quotations from sources without page numbers, use paragraph numbers, if available. If the
paragraphs are not numbered, but there are headings, use the heading name and count the number of
paragraphs after the heading to the paragraph containing the quotation. Examples:
(Smith, 2003, para. 1) (Greene, 2003, Discussion, para. 4)
For citations taken from secondary sources, include the secondary source in the reference list and mention
the original work in the text.
Text citation: Example: Goldman and Goldman's study (as cited in Linebarger, 2001) found ....
II. Chicago: In-Text Citations and Notes
In Chicago style, you use superscript numbers (1) to mark citations in the text. Place the superscript number
for each note near the cited material—at the end of the relevant quotation, sentence, clause, or phrase. Type
the number after any punctuation mark except the dash; do not leave space between the superscript and the
preceding letter or punctuation mark. Number citations should be sequentially throughout the text.

BU-CANR-SRWM/2012/2020
Research Method – Lecture Note By Ademe T. (MSc. In Soil Science) 29
The notes themselves can be footnotes (each typed at the bottom of the page on which the superscript for it
appears in the text) or endnotes (all typed on a separate page at the end of the text under the heading Notes).
The first line of each note is indented like a paragraph (five spaces or one-half inch) and begins with a
number followed by a period and one space before the first word of the entry. All remaining lines of the
entry are typed flush with the left margin. Footnotes should be single-spaced with a double space between
notes. However, all endnotes should be double-spaced.
In the text
Sweig argues that Castro and Che Guevara were not the only key players in the Cuban Revolution of the late
1950s.19
In the first note: Julia Sweig, Inside the Cuban Revolution (Cambridge, MA: Harvard University Press,
2002), 6.
In subsequent notes
After giving complete information the first time you cite a work, shorten any additional references to that
work: list only the author's name followed by a comma, a shortened version of the title followed by a
comma, and the page number. If the reference is to the same source cited in the previous note, you can use
the Latin abbreviation Ibid. (for "in the same place") instead of the name and title. Example:
Julia Sweig, Inside the Cuban Revolution (Cambridge, MA: Harvard University Press, 2002), 9.
Ibid., 13.
An alphabetical list of the sources you use in your paper is usually titled Bibliography in Chicago style. If
Sources Consulted, Works Cited, or Selected Bibliography better describes your list, however, any of these
titles is acceptable.
In the bibliographic entry for a source, include the same information as in the first note for that source, but
omit the specific page reference. However, give the first author's name last name first, followed by a comma
and the first name; separate the main elements of the entry with periods rather than commas; and do not
enclose the publication information for books in parentheses.
In the bibliography
Start the bibliography on a separate page after the main text and any endnotes. Continue the consecutive
numbering of pages. Type the title Bibliography (without italics or quotation marks) and center it below the

BU-CANR-SRWM/2012/2020
Research Method – Lecture Note By Ademe T. (MSc. In Soil Science) 30
top of the page. Begin each entry at the left margin. Indent the second and subsequent lines of each entry five
spaces (or one-half inch) as shown in the following example. Double-space the entire list. Example: Sweig,
Julia. Inside the Cuban Revolution. Cambridge, MA: Harvard University Press, 2002.
NOTE: List sources alphabetically by authors' last names (or by the first major word in the title if the author
is unknown).
III. MLA (Modern Language Association) In-Text Citations
Any time you refer to, comment on, paraphrase, or quote another writer‘s information, you must document
this in your essay through the use of a citation. The purpose of an MLA in-text citation, sometimes called a
parenthetical reference, is to help readers easily find the sources in the Works Cited page that correspond
to your referenced passage. You will want to make this process as easy as possible for the reader, so the
citations are always placed at the end of the sentence and should always correspond with the first word of the
matching Works Cited page entry. Let‘s suppose that this is a sentence from your essay:
The author explains, ―Record deals were usually negotiated by elite businessmen‖ (Hennessey 127).
Your reader should be able to turn to the Works Cited page and easily find the bibliographic information for
this source. It might be listed like this:
Hennessey, William. The Making of Records in Memphis. Atlanta: Capital Book Press, 2001.
Notice that the author‘s name in the citation corresponds to the first word of the Works Cited entry. This
makes it really easy for the reader to find and match up information, which is the purpose of in-text citations.
Two primary elements of a quoted passage should be given to the reader: 1) the author‘s last name and 2)
the page number where the referenced passage is found. The page number is always included in the citation
at the end of the sentence, but the author‘s last name can be placed either in the citation or in the sentence.
Here are a few items to remember concerning in-text citations:
No ―page‖ or ―pg.‖ or ―p.#‖ or any other variant is used to indicate the page number.
End punctuation goes at the end of the citation, not at the end of the passage.
Author‘s name can either be placed in the citation or in the sentence.
No comma or other punctuation mark is needed to separate the author‘s name and the page
number.
Quotation in The Text

BU-CANR-SRWM/2012/2020
Research Method – Lecture Note By Ademe T. (MSc. In Soil Science) 31
When you directly quote the works of others in your paper, you will format quotations differently depending
on their length. Below are some basic guidelines for incorporating quotations into your paper. Please note
that all pages (e.g. in MLA - Modern Language Association) should be double-spaced.
Short quotations
To indicate short quotations (fewer than four typed lines of prose or three lines of verse/poetry) in your
text, enclose the quotation within double quotation marks. Provide the author and specific page citation (in
the case of verse, provide line numbers) in the text, and include a complete reference on the Works Cited
page. Punctuation marks such as periods, commas, and semicolons should appear after the parenthetical
citation. Question marks and exclamation points should appear within the quotation marks if they are a part
of the quoted passage, but after the parenthetical citation if they are a part of your text.
For example, when quoting short passages of prose, use the following examples:
According to some, dreams express "profound aspects of personality" (Foulkes
184), though others disagree.
According to Foulkes's study, dreams may express "profound aspects of
personality" (184).
Is it possible that dreams may express "profound aspects of personality"
(Foulkes 184)?
When short (fewer than three lines of verse) quotations from poetry, mark breaks in short quotations of verse
with a slash, (/), at the end of each line of verse (a space should precede and follow the slash).
Cullen concludes, "Of all the things that happened there / That's all I
remember" (11-12).
Long quotations
For quotations that are more than four lines of prose or three lines of verse, place quotations in a free-
standing block of text and omit quotation marks. Start the quotation on a new line, with the entire quote
indented one inch from the left margin; maintain double-spacing. Only indent the first line of the quotation

BU-CANR-SRWM/2012/2020
Research Method – Lecture Note By Ademe T. (MSc. In Soil Science) 32
by an additional quarter inch if you are citing multiple paragraphs. Your parenthetical citation should come
after the closing punctuation mark. When quoting verse, maintain original line breaks. (You should maintain
double-spacing throughout your essay.)
For example, when citing more than four lines of prose, use the following examples:
Nelly Dean treats Heathcliff poorly and dehumanizes him throughout her narration:
They entirely refused to have it in bed with them, or even in their room, and I
had no more sense, so, I put it on the landing of the stairs, hoping it would be
gone on the morrow. By chance, or else attracted by hearing his voice, it crept
to Mr. Earnshaw's door, and there he found it on quitting his chamber.
Inquiries were made as to how it got there; I was obliged to confess, and in
recompense for my cowardice and inhumanity was sent out of the house.
(Bronte 78)
When citing long sections (more than three lines) of poetry, keep formatting as close to the original as
possible.
In his poem "My Papa's Waltz," Theodore Roethke explores his childhood with his father:
The whiskey on your breath
Could make a small boy dizzy;
But I hung on like death:
Such waltzing was not easy.
We Romped until the pans
Slid from the kitchen shelf;
My mother's countenance
Could not unfrown itself. (quoted in Shrodes, Finestone, and Shugrue 202)
When citing two or more paragraphs, use block quotation format, even if the passage from the paragraphs is
less than four lines. Indent the first line of each quoted paragraph an extra quarter inch.
In "American Origins of the Writing-across-the-Curriculum Movement," David Russell
argues,

BU-CANR-SRWM/2012/2020
Research Method – Lecture Note By Ademe T. (MSc. In Soil Science) 33
Writing has been an issue in American secondary and higher education since
papers and examinations came into wide use in the 1870s, eventually driving
out formal recitation and oral examination. . . .
From its birth in the late nineteenth century, progressive education has
wrestled with the conflict within industrial society between pressure to
increase specialization of knowledge and of professional work (upholding
disciplinary standards) and pressure to integrate more fully an ever-widening
number of citizens into intellectually meaningful activity within mass society
(promoting social equity). . . .
Adding or omitting words in quotations
If you add a word or words in a quotation, you should put brackets around the words to indicate that they are
not part of the original text.
Jan Harold Brunvand, in an essay on urban legends, states, "some individuals [who retell
urban legends] make a point of learning every rumor or tale" (78).
If you omit a word or words from a quotation, you should indicate the deleted word or words by using
ellipsis marks, which are three periods (. . .) preceded and followed by a space. For example:
In an essay on urban legends, Jan Harold Brunvand notes that "some individuals make a point
of learning every recent rumor or tale . . . and in a short time a lively exchange of details
occurs" (78).
Please note that brackets are not needed around ellipses unless adding brackets would clarify your use of
ellipses.
When omitting words from poetry quotations, use a standard three-period ellipses; however, when omitting
one or more full lines of poetry, space several periods to about the length of a complete line in the poem:
These beauteous forms,
Through a long absence, have not been to me
As is a landscape to a blind man's eye:
. . . . . . . . . . . . . . . . . . . .
Felt in the blood, and felt along the heart;
And passing even into my purer mind,
With tranquil restoration . . . (22-24, 28-30)

BU-CANR-SRWM/2012/2020
Research Method – Lecture Note By Ademe T. (MSc. In Soil Science) 34
Listing References
The alphabetical list of references that appears at the end of your paper contains more information about all
of the sources you have used allowing readers to refer to them, as needed.
The main characteristics are:
The list of references must be on a new page at the end of your text;
The word references should be centered at the top of the page;
Entries are arranged alphabetically by the author's last name or by the title if there is no author;
Titles of larger works (i.e. books, journals, encyclopedias) are italicized;
Entries are double-spaced (for the purposes of this handout, single-spacing is used);
For each entry, the first line is typed flush with the left margin. Additional lines are indented as a
group a few spaces to the right of the left margin (hanging indent).
Reference content can vary depending on the type of source and may include:
Book: author(s), book title, publisher, date of publication, and page number(s) if appropriate.
Journal: author(s), article title, journal title, date of publication, and page number(s).
Newspaper: author(s), article title, name of newspaper, section title and page number(s) if desired, date
of publication.
Website: author(s), article and publication title where appropriate, as well as a URL (Uniform
Resource Locator), and a date when the site was accessed.
Poem: spaced slashes are normally used to indicate separate lines of a poem, and parenthetical citations
usually include the line number(s). For example: "For I must love because I live / And life in me is
what you give." (Brennan, lines 15–16).
Interview: name of interviewer, interview descriptor (ex. personal interview) and date of interview.
Reference list for books, articles, media, web/online and unpublished papers are illustrated with
examples in the following tables. However, please note that the reference listing style may differ from
journal to journal.
2.4. General Formatting Rules
Useful language for reports:
To introduce: The purpose/aim of this report, As requested, This survey was carried out/ conducted
by means of…,the questionnaire consisted of etc.

BU-CANR-SRWM/2012/2020
Research Method – Lecture Note By Ademe T. (MSc. In Soil Science) 35
To generalize: In general, generally, on the whole, etc.
To refer to a fact: The fact is that…, In fact, In practice, etc.
To conclude/ summarize: In conclusion, All things considered, To sum up, All in all, It is not easy
to reach any definite conclusions, If any conclusions may be drawn from the data, It is clear that,
The survey shows/indicates/demonstrates, etc.
Specific editorial requirements for submission of a manuscript will always supercede instructions in these
general guidelines.
To make a paper readable
Print or type using a 12 point standard font, such as Times, Geneva, Bookman, Helvetica, etc.
Text should 1.5 inch spaced paper with 1 inch margins, single sided
Number pages consecutively
Start each new section on a new page
Adhere to recommended page limits
Mistakes to avoid
Placing a heading at the bottom of a page with the following text on the next page (insert a page break!)
Dividing a table or figure - confine each figure/table to a single page
Submitting a paper with pages out of order
In all sections of your paper
Use normal prose including articles ("a", "the," etc.)
Stay focused on the research topic of the paper
Use paragraphs to separate each important point (except for the abstract)
Present your points in logical order
Use present tense to report well accepted facts - for example, 'the grass is green'
Use past tense to describe specific results - for example, 'When weed killer was applied, the grass was
brown'
Avoid informal wording, don't address the reader directly, and don't use jargon, slang terms, or
superlatives
Avoid use of superfluous pictures - include only those figures necessary to presenting results

BU-CANR-SRWM/2012/2020
Research Method – Lecture Note By Ademe T. (MSc. In Soil Science) 36
Chapter 3: Experimental Research
3.1. Introduction
An experiment is usually undertaken to study some general topic, such as how nutrients affect plant growth
and yield, how ice forms in clouds, how precipitation forms, or what conditions are required for cloud
formation. The scientific objectives often include discriminating among a set of specific hypotheses,
representing various alternative explanations. The goal in experimental design is usually to find observable
consequences that distinguish among the hypotheses, and then collect measurements that can differentiate
among those possibilities (or perhaps invalidate them all). This is always an interactive process. The
statement of hypotheses must reflect the consequences of the physical processes in the particular application
selected for observation, and the observations must be feasible. The elements in experimental design,
although often presented serially, are almost always developed iteratively as compromises between what is
possible and what would be decisive.
Those elements include:
A set of hypotheses. If the hypotheses can be stated in very specific terms, the experiment often can be
designed to provide critical and convincing tests that distinguish among them. These possibilities may
have testable consequences that can be detected, and the experiment can be designed to ensure that the
hypotheses can be differentiated. It is of course never possible to prove a hypothesis, only to obtain
evidence either consistent or inconsistent with the hypothesis, so the set of hypotheses for an experiment
should include conventional explanations as well as new and more controversial possibilities. Often, a
new hypothesis will arise during the exploratory analysis of data, but the experiment will be more
convincing (and probably better designed) when the hypotheses have been stated explicitly in the
experimental design.
Experimental tests. When the hypotheses lead to different results, key features can be selected that
would serve as tests. The selection of appropriate experimental tests is the key aspect of experimental
design, requiring understanding of practical as well as scientific issues. One must select experimental
conditions that occur with appropriate frequency, that can be recognized and probed with available
instrumentation, and that provide good tests of the hypotheses.
Measurement Strategies. Many consequences that can be hypothesized are outside the capabilities of
current measuring systems, so experiments must consider if the measurement strategy is practical and
must identify the instruments needed to perform the experiment.

BU-CANR-SRWM/2012/2020
Research Method – Lecture Note By Ademe T. (MSc. In Soil Science) 37
Analysis Strategies. An often-neglected component in experimental design is consideration of the
analysis approach. For example, what sample size will be needed to draw conclusions of statistical
significance? What tests will be applied to the data to accept or reject hypotheses? Experiments are
strengthened when these can be specified in advance and considered in the experimental design.
Briefly speaking, components of experiments may include:
Independent and dependent variables
Pre-testing (i.e. the measurement of the dependent variable prior to treatment or intervention) and
post-testing (i.e. measurement of the dependent variable after the treatment/independent variable
has been applied).
Experimental and control groups
Terms useful in experimental design
Balanced design: An experimental design where all cells (i.e. treatment combinations) have the same
number of observations.
Blocking: A schedule for conducting treatment combinations in an experimental study such that any effects
on the experimental results due to a known change in raw materials, operators, machines, etc., become
concentrated in the levels of the blocking variable. The reason for blocking is to isolate a systematic effect
and prevent it from obscuring the main effects. Blocking is achieved by restricting randomization.
Design: A set of experimental runs which allows the fit of a particular model and the estimate of effects.
DOE (Design of experiments): An approach to problem solving involving collection of data that will
support valid, defensible, and supportable conclusions.
Effect: How changing the settings of a factor changes the response. The effect of a single factor is also
called a main effect.
Error: Unexplained variation in a collection of observations. DOE's typically require understanding of both
random error and lack-of-fit error.
Experimental Design: We are concerned with the analysis of data generated from an experiment. It is wise
to take time and effort to organize the experiment properly to ensure that the right type of data, and enough
of it, is available to answer the questions of interest as clearly and efficiently as possible. This process is
called experimental design.

BU-CANR-SRWM/2012/2020
Research Method – Lecture Note By Ademe T. (MSc. In Soil Science) 38
Experimental group: Those who receive the treatment or are exposed to the independent variable under
study.
Experimental level: Implies amount or magnitude of objects in the experiment. Treatments are administered
to experimental units by 'level'. For example, if the experimental units were given 5mg, 10mg, 15mg of a
fertilizer, those amounts would be three levels of the treatment.
Experimental unit: The entity to which a specific treatment combination is applied.
Factors: Process inputs that an experimenter manipulates to cause a change in the output. Or factors are
independent variables whose levels are set by the investigator.
Lack-of-fit error: Error that occurs when the analysis omits one or more important terms or factors from the
process model. Including replication in a DOE allows separation of experimental error into its components:
lack-of-fit and random (pure) error.
Model: Mathematical or statistical relationship which relates changes in a given response to changes in one
or more factors.
Measurement: It is the assignment of numbers to objects or events in the experiment. E.g. height, diameter,
mass, dry matter cuts of plants at beginning, middle, end, etc.
Random error: Error that occurs due to natural variation in the process. Random error is typically assumed
to be normally distributed with zero mean and a constant variance. Random error is also called experimental
error.
Randomization: A schedule for allocating treatment material and for conducting treatment combinations in
a DOE such that the conditions in one run neither depend on the conditions of the previous run nor predict
the conditions in the subsequent runs.
Replication: Performing the same treatment combination more than once. Including replication allows an
estimate of the random error independent of any lack of fit error.
Responses: The output(s) of a process. Sometimes called dependent variable(s).

BU-CANR-SRWM/2012/2020
Research Method – Lecture Note By Ademe T. (MSc. In Soil Science) 39
Treatment: A treatment is a specific combination of factor levels whose effect is to be compared with other
treatments. In short, a treatment means an experimental condition whose effect is to be measured and
compared. E.g. fertilizer application on plant growth.
Experimental procedures: The experimental procedure is the set of steps that you will follow to conduct
your experiment. This should be detailed so that another person would be able to do the research following
your directions. The steps of the procedure should be in numbered or bulleted form, not in a paragraph.
The general procedures for each experiment are briefly outlined below. However, variations which exist
between experiments will be noted.
Materials: List out the appropriate materials needed for the experimentation.
Methods: The methods for the experimentation should be stated clearly and with enough details. You need
also to specify the characters to measure. Sub-sections might be added under the methods section if
necessary. For example, methods for:
2. Planting Seeds
3. Pollinating Seeds
4. Harvesting Seeds
5. Germinating Seeds
Schedule of Activities: The time plan for the experimental activities should be described in full details.
If required, sub-sections might be used to provide enough details. For example, time schedule for:
1. Experiment One
2. Experiment Two
3. Experiment Three
Data Collection: The data collection techniques should be clearly stated.
1. Experiment One
2. Experiment Two
3. Experiment Three
Data Analyses: The details of the data analyses should be clearly stated, including the statistical
software to be used.
Interpretation of the Results: The details used to present the results, such as graphs, tables, etc. should
be stated with enough details.

BU-CANR-SRWM/2012/2020
Research Method – Lecture Note By Ademe T. (MSc. In Soil Science) 40
Report Writing: The report should be clearly written with scientific details and criticism.
Some important things to keep in mind when designing your experiment are:
1. Identify the independent variable, the dependent variable, and the control group.
Independent Variable is the stimulus, an object, idea, event, feeling, time period, manipulation, or
intervention that the researcher creates or delivers to one set of participants or clients. In other words, the
independent variable is the variable whose effect the researcher wants to test on the dependent variable.
An independent variable is the variable you have control over, what you can choose and manipulate.
E.g. may include the effects of spacing, pruning, thinning, etc. on growth rate, diameter increment, yield
and the like characteristics of trees or a forest stand.
Dependent Variable (also known as Response Variable) is the outcome or condition that may change
as a result of being subjected to or exposed to an independent variable or the treatment. E.g. yield can be
affected by the application of fertilizer or management intensity (e.g. weeding, watering, etc.).
Control Group: are those who do not receive the treatment or independent variable under study. Most
experiments need to have an appropriate "control", which is a standard to test your experimental results
against (it is a base treatment for comparisons). A control is a trial taken when the independent variable is
missing or held constant or at a normal level. For example, if you're studying the effects of cold air
temperatures on tropical house plant growth, you will probably put some of the plants outside for some
cold nights. When you take them inside to see how the cold affected their growth, you'll need to have
some plants that were not exposed to the cold to compare them to. The plants that did not get exposed to
the cold temperatures are considered a "control".
2. Sample Size
Your experiment will be much better designed if you have several "subjects" in your experiment. For
example, in a plant experiment, be sure to have many plants in the control group and in the experimental
group.
SS = Z 2 * (p) * (1-p)
c 2
Where:
SS = Sample size
Z = Z value (e.g. 1.96 for 95% confidence level)

BU-CANR-SRWM/2012/2020
Research Method – Lecture Note By Ademe T. (MSc. In Soil Science) 41
p = percentage picking a choice, expressed as decimal
(.5 used for sample size needed)
c = confidence interval, expressed as decimal
(e.g., .04 = ±4)
Generally, sample size increases with the increase in population size and/or confidence level; but sample size
decreases with the increase in confidence interval.
3. Measurements: Explain how you will be measuring your independent and the dependent variables.
4. Trials: Be sure to allow enough time to do many trials. The experiment should be repeated as many
times as possible so that the results might be reliable to draw conclusions.
3.2. Basic principles of experimental design
The basic principles of experimental designs are replication, randomization, and local control. These
principles make a valid test of significance possible. Each of them is described briefly in the following sub-
sections.
3.2.1. Replication/Experimental material Experimental unit
Replication: It is the repetition of an experiment on a large group of subjects. In other words, it is a complete
run for all the treatments to be tested in the experiment. An individual repetition is called a replicate. In all
experiments, some variation is introduced because of the fact that the experimental units, such as individuals
or plots of land in agricultural experiments cannot be physically identical. This type of variation can be
removed by using a number of experimental units. It also provides guarantee against experimental failure
because the researcher considers several experimental replicates in his/her research. It gives confidence to
the results of the experiment as real because the measurements are done and compared among optimal
sample sizes. More replicates are required when there is: higher variability or smaller treatment
differences. Replication reduces variability in experimental results, increasing their significance and the
confidence level with which a researcher can draw conclusions about an experimental factor. If a treatment
is truly effective, the long-term averaging effect of replication will reflect its experimental worth. If it is not
effective, then the few members of the experimental population who may have reacted to the treatment will

BU-CANR-SRWM/2012/2020
Research Method – Lecture Note By Ademe T. (MSc. In Soil Science) 42
be negated by the large numbers of subjects who were unaffected by it. However, the number, the shape and
the size of replicates depend upon the nature of the experimental material.
A replication is used:
i. To secure more accurate estimate of the experimental error, a term which represents the differences that
would be observed if the same treatments were applied several times to the same experimental units;
ii. To decrease the experimental error and thereby to increase precision, which is a measure of the variability
of the experimental error; and
iii. To obtain more precise estimate of the mean effect of a treatment.
Experimental Material: It is what you apply the treatments to. E.g. trees, animals, fertilizers, soil, etc.
considered for the experimental studies. Experimental Unit is the smallest division of the experimental
material. If experimental units are unalike, then any variation between the experimental units may swamp
any differences between the treatments that you are trying to find, especially in a small experiment. If they
are not representative, you cannot extrapolate your conclusions. Thus, the experimental units should be as
optimal as possible to get reliable results.
3.2.2. Randomization
It is the process of assigning the treatments /participants randomly to the experimental units. Because it is
generally extremely difficult for experimenters to eliminate bias using only their expert judgment, the use of
randomization in experiments is common practice. In a randomized experimental design, objects or
individuals are randomly assigned (by chance) to an experimental group so that every possible allotment of
treatments has the same probability (i.e. randomization helps avoid biasness by providing equal chance to
assign the subjects to experimental and control groups). The purpose of randomization is to remove bias and
other sources of extraneous variation, which are not controllable. Another advantage of randomization
(accompanied by replication) is that it forms the basis of any valid statistical test. Hence, the treatments must
be assigned at random to the experimental units. Using randomization is the most reliable method of creating
homogeneous treatment groups, without involving any potential biases or judgments. Random assignment of
subjects to experimental and control groups also allows us to test our hypotheses. Moreover, randomization
is insurance against unknown sources of variation. Although randomization helps ensure that treatment
groups are as similar as possible, the results of a single experiment, applied to a small number of objects or
subjects, should not be accepted without question. Randomization is usually done by drawing numbered

BU-CANR-SRWM/2012/2020
Research Method – Lecture Note By Ademe T. (MSc. In Soil Science) 43
cards from a well-shuffled pack of cards, or by drawing numbered balls from a well-shaken container or by
using tables of random numbers.
Local Control: It has been observed that all extraneous sources of variation are not removed by
randomization and replication. This necessitates a refinement in the experimental technique. In other
words, we need to choose a design in such a manner that all extraneous sources of variation are brought
under control. For this purpose, we make use of local control, a term referring to the amount of balancing,
blocking and grouping of the experimental units. Balancing means that the treatments should he assigned to
the experimental units in such a way that the result is a balanced arrangement of the treatments. The point to
remember here is that the term local control should not be confused with the word control. The word control
in experimental design is used for a treatment. Which does not receive any treatment but we need to find out
the effectiveness of other treatments through comparison.
Blocking: It is the process of grouping of treatments / plots that are more similar. Blocking means that like
experimental units should be collected together to form a relatively homogeneous group. A block is also a
replicate. The main purpose of the principle of local control is to increase the efficiency of an experimental
design by decreasing the experimental error. Blocking increases homogeneity among treatments within
blocks so that it improves comparisons within blocks by reducing spatial variations.
3.2.3. Statistical models
A statistical model is a formalization of relationships between variables in the form of mathematical
equations. A statistical model describes how one or more random variables are related to one or more other
variables. The model is statistical as the variables are not deterministically but stochastically related. In
mathematical terms, a statistical model is frequently thought of as a pair (Y, P) where Y is the set of possible
observations and P is the set of possible probability distributions on Y. It is assumed that there is a distinct
element of P which generates the observed data. Statistical inference enables us to make statements about
which element(s) of this set are likely to be the true one.
Most statistical tests can be described in the form of a statistical model. For example, the Student's t-test for
comparing the means of two groups can be formulated as seeing if an estimated parameter in the model is
different from 0. Another similarity between tests and models is that there are assumptions involved. Error is
assumed to be normally distributed in most models.
Model comparison

BU-CANR-SRWM/2012/2020
Research Method – Lecture Note By Ademe T. (MSc. In Soil Science) 44
Models can be compared to each other. This can either be done when you have done an exploratory data
analysis or a confirmatory data analysis. In an exploratory analysis, you formulate all models you can think
of, and see which describes your data best. However, in a confirmatory analysis, you test which of your
models you have described before the data were collected fits the data best, or test if your only model fits the
data.
In linear regression analysis, you can compare the amount of variance explained by the independent
variables, R2, across the different models.
An example
Height and age are probabilistically distributed over humans. They are stochastically related; when you know
that a person is of age 10, this influences the chance of this person being 6 feet tall. You could formalize this
relationship in a linear regression model of the following form: heighti = b0 + b1agei + εi, where b0 is the
intercept, b1 is a parameter that age is multiplied by to get a prediction of height, ε is the error term, and i is
the subject. This means that height starts at some value, there is a minimum height when someone is born,
and it is predicted by age to some amount. This prediction is not perfect as error is included in the model.
This error contains variance that stems from sex and other variables. When sex is included in the model, the
error term will become smaller, as you will have a better idea of the chance that a particular 16-year-old is 6
feet tall when you know this 16-year-old is a girl. The model would become heighti = b0 + b1agei + b2sexi +
εi, where the variable sex is dichotomous. This model would presumably have a higher R2. The first model is
nested in the second model: the first model is obtained from the second when b2 is restricted to zero.
3.2.4. Source of variability
All experimental data have variability that comes from several sources. Understanding these sources can
lead to improved experimental design and results. Some of the main sources of variability include:
A. Biological Variation: Biological variation depends on the characteristic of the population being studied.
For example, measuring the height of a random group of people will have a larger variability than a study
limited to people of one age or sex. Also, for human gene expression, the coefficient of variation ranges
from 20 to 100%.
B. Process Variation: Process variation refers to variability in the data that is exhibited when the same
sample is run independently multiple times. The scientist may or may not be aware of process variations.
Process variation results from the following:

BU-CANR-SRWM/2012/2020
Research Method – Lecture Note By Ademe T. (MSc. In Soil Science) 45
i. Random (or Common-Cause) Variation: These include unpredictable and natural variations that may
affect some, but not all, samples (e.g., experimental error). Efforts should be made to identify and reduce
them, but they can never be completely eliminated. Taking the most accurate measurements possible and
carefully following the experimental protocol or standard operating procedure are also part of controlling
random variations.
ii. Systemic (or Special) Variation: Systemic variation affects the experimental process, so samples may
be biased. Examples of systemic variation are equipment that is out of calibration and causes a bias, an
unexpected temperature change during the experiment, or a delay from the normal timing that results in a
change to the experimental procedure and affects the samples, process, and outcome.
iii. System Variation. System variation comes from the instrument used to take measurements. The
variability of the measurement system contributes to the process variability and can be a common cause
or a special cause. A standard ruler is an example of a measurement system. Accuracy is usually taken to
be half of the smallest division mark (e.g., ±0.5 mm, if the ruler has 1 mm marks). This is based on the
assumption that estimating halfway between any two marks is relatively easy, while smaller fractions are
not as accurately estimated by eye. Additional implicit assumptions are that the person taking the
measurement has good eyesight and that the ruler markings are accurate. If the ruler manufacturer
mismarked the ruler, the ruler would have a bias.
iv. Experimental Variation. Experimental variation is the total variation seen in an experiment and comes
from both the process and biological population variability.
How to Control Experimental Errors?
Because the ability to detect existing differences among treatments increases as a good experiment
incorporates all the size of the experimental error decreases, possible means of minimizing the experimental
error. Three commonly used techniques for controlling experimental error are:
1. Blocking: By putting experimental units that are as similar as possible together in the same group
(generally referred to as a block) and by assigning all treatments into each block separately and
independently, variation among blocks can be measured and removed from experimental error.
2. Proper plot technique: For almost all types of experiment, it is absolutely essential that all other factors
aside from those considered as treatments be maintained uniformly for in variety trials where the
treatments all experimental units.

BU-CANR-SRWM/2012/2020
Research Method – Lecture Note By Ademe T. (MSc. In Soil Science) 46
Data analysis: In cases where blocking alone may not be able to achieve adequate control of experimental
error, proper choice of data analysis can help greatly. Covariance analysis is most commonly used for this
purpose.
3.2.5. ANOVA
Analysis of variance (ANOVA) is a collection of statistical models used to analyze the differences between
group means and their associated procedures (such as "variation" among and between groups), developed by
R.A. Fisher. In the ANOVA setting, the observed variance in a particular v ariable is partitioned into
components attributable to different sources of variation. In its simplest form, ANOVA provides a statistical
test of whether or not the means of several groups are equal, and therefore generalizes the t-test to more than
two groups. As doing multiple two-sample t-tests would result in an increased chance of committing a
statistical type I error (false positives leading to false scientific claims), ANOVAs are useful in comparing
(testing) three or more means (groups or variables) for statistical significance. You will learn more about
ANOVA and its importance later in this unit as well as in Part II (Chapter 5) of the course.
3.3. Overview of some experimental designs
The common types of experimental designs are discussed below.
3.3.1. CRD
In a completely randomized design, objects or subjects are assigned to groups completely at random. For the
CRD, any difference among experimental units receiving the same treatment is considered as experimental
error. This type of experimental design is appropriate in the laboratory experiments where variations are
easily controlled. However, CDR is rarely used in the field. One standard method for assigning subjects to
treatment groups is to label each subject, then use a table of random numbers to select from the labelled
subjects. This may also be accomplished using a computer through random number.
Randomization and layout in CRD

BU-CANR-SRWM/2012/2020
Research Method – Lecture Note By Ademe T. (MSc. In Soil Science) 47
Analysis of Variance in CRD
There are two sources of variation among the n observations obtained from a CRD trial. One is the treatment
variation, the other is experimental error. The relative size of the two is used to indicate whether the
observed difference among treatments is real or is due to chance. The treatment difference is said to be real
if treatment variation is sufficiently larger than experimental error. A major advantage of the CRD is the
simplicity in the computation of its analysis of variance, especially when the number of replications is not
uniform for all treatments. For most other designs, the analysis of variance becomes complicated when the
loss of data in some plots results in unequal replications among treatments tested.
The steps involved in the analysis of variance for data from a CRD experiment with an equal number of
replications are given below.

BU-CANR-SRWM/2012/2020
Research Method – Lecture Note By Ademe T. (MSc. In Soil Science) 48
STEP 1. Group the data by treatments and calculate the treatment totals (T) and grand total (G).
Total d. f. = (r) (t) – 1
Treatment d. f. = t – 1
Error d. f. = t(r - 1)
The error d. f. can also be obtained through subtraction as:
Error d. f. = Total d. f. – treatment d. f.

BU-CANR-SRWM/2012/2020
Research Method – Lecture Note By Ademe T. (MSc. In Soil Science) 49
Step 4. Calculate the mean square (MS) for each source of variation by dividing each SS by its
corresponding d. f:
Step 5. Calculate the F value for testing significance of the treatement differneces as:
or
Step 6. Compare the calculated F value with the tabulated F value.

BU-CANR-SRWM/2012/2020
Research Method – Lecture Note By Ademe T. (MSc. In Soil Science) 50
Step 7. Calculate the grand mean and the coefficient of variation cv as follows:
The cv indicates the degree of precision with which the treatments are compared and is
a good index for the reliability of the experiment. It expresses the experimental error as
percentage of the mean; thus, the higher the cv value, the lower is the reliability of the
experiment. The cv value is generally placed below the analysis of variance table.
3.3.2. RCBD/LSD/Split plots
RCBD (Randomized Complete Block Design)

BU-CANR-SRWM/2012/2020
Research Method – Lecture Note By Ademe T. (MSc. In Soil Science) 51
If an experimenter is aware of specific differences among groups of subjects or objects within an
experimental group, he or she may prefer a randomized block design to a completely randomized
design. In a block design, experimental subjects are first divided into homogeneous blocks before they are
randomly assigned to a treatment group. If, for instance, an experimenter had reason to believe that age
might be a significant factor in the effect of a given medication, he might choose to first divide the
experimental subjects into age groups, such as under 30 years old, 30-60 years old, and over 60 years old.
Then, within each age level, individuals would be assigned to treatment groups using a completely
randomized design. In a block design, both control and randomization are considered.

BU-CANR-SRWM/2012/2020
Research Method – Lecture Note By Ademe T. (MSc. In Soil Science) 52

BU-CANR-SRWM/2012/2020
Research Method – Lecture Note By Ademe T. (MSc. In Soil Science) 53
Randomization and layout in RCBD
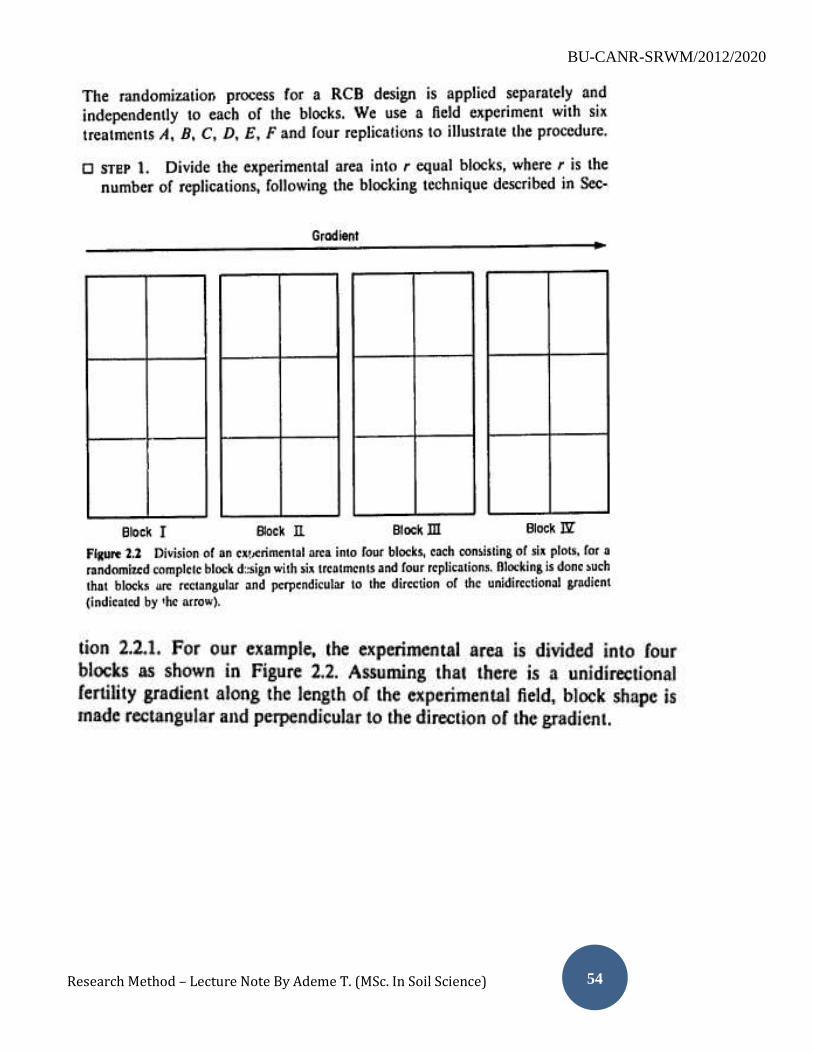
BU-CANR-SRWM/2012/2020
Research Method – Lecture Note By Ademe T. (MSc. In Soil Science) 54

BU-CANR-SRWM/2012/2020
Research Method – Lecture Note By Ademe T. (MSc. In Soil Science) 55

BU-CANR-SRWM/2012/2020
Research Method – Lecture Note By Ademe T. (MSc. In Soil Science) 56

BU-CANR-SRWM/2012/2020
Research Method – Lecture Note By Ademe T. (MSc. In Soil Science) 57
Analysis of Variance in RCBD

BU-CANR-SRWM/2012/2020
Research Method – Lecture Note By Ademe T. (MSc. In Soil Science) 58

BU-CANR-SRWM/2012/2020
Research Method – Lecture Note By Ademe T. (MSc. In Soil Science) 59

BU-CANR-SRWM/2012/2020
Research Method – Lecture Note By Ademe T. (MSc. In Soil Science) 60

BU-CANR-SRWM/2012/2020
Research Method – Lecture Note By Ademe T. (MSc. In Soil Science) 61

BU-CANR-SRWM/2012/2020
Research Method – Lecture Note By Ademe T. (MSc. In Soil Science) 62
Blocking Efficiency

BU-CANR-SRWM/2012/2020
Research Method – Lecture Note By Ademe T. (MSc. In Soil Science) 63

BU-CANR-SRWM/2012/2020
Research Method – Lecture Note By Ademe T. (MSc. In Soil Science) 64
LSD (Latin Square Design)
Blocking in two directions improves design by better control of spatial variations. This is achieved by
replicating both rows and columns.

BU-CANR-SRWM/2012/2020
Research Method – Lecture Note By Ademe T. (MSc. In Soil Science) 65

BU-CANR-SRWM/2012/2020
Research Method – Lecture Note By Ademe T. (MSc. In Soil Science) 66
Randomization and layout in LSD

BU-CANR-SRWM/2012/2020
Research Method – Lecture Note By Ademe T. (MSc. In Soil Science) 67

BU-CANR-SRWM/2012/2020
Research Method – Lecture Note By Ademe T. (MSc. In Soil Science) 68

BU-CANR-SRWM/2012/2020
Research Method – Lecture Note By Ademe T. (MSc. In Soil Science) 69
Analysis of Variance in LSD

BU-CANR-SRWM/2012/2020
Research Method – Lecture Note By Ademe T. (MSc. In Soil Science) 70

BU-CANR-SRWM/2012/2020
Research Method – Lecture Note By Ademe T. (MSc. In Soil Science) 71

BU-CANR-SRWM/2012/2020
Research Method – Lecture Note By Ademe T. (MSc. In Soil Science) 72

BU-CANR-SRWM/2012/2020
Research Method – Lecture Note By Ademe T. (MSc. In Soil Science) 73

BU-CANR-SRWM/2012/2020
Research Method – Lecture Note By Ademe T. (MSc. In Soil Science) 74
Efficiencies of row- and column-blockings

BU-CANR-SRWM/2012/2020
Research Method – Lecture Note By Ademe T. (MSc. In Soil Science) 75

BU-CANR-SRWM/2012/2020
Research Method – Lecture Note By Ademe T. (MSc. In Soil Science) 76
And, the adjusted R. E. value is computed as:
Adjusted R. E. (CRD) = (3.25) (0.93) = 3.02
This indicates that the use of LSD in the present example is estimated to increase the experimental
precision by 202%. This result implies that, if the CRD had been used, an estimated 2.02 times more

BU-CANR-SRWM/2012/2020
Research Method – Lecture Note By Ademe T. (MSc. In Soil Science) 77
replications would have been required to detect the treatment difference of the same magnitude as that
detected with the LSD.

BU-CANR-SRWM/2012/2020
Research Method – Lecture Note By Ademe T. (MSc. In Soil Science) 78
The results indicate that the additional column-blocking, made possible by the use of LSD, is estimated to
have increased the experimental precision over that of the RCBD with columns as blocks by 266%: whereas
the additional row-blocking in the LSD did not increase precision over the RCBD with rows as blocks.
Hence, for this trail, RCBD with rows as blocks would have been as efficient as LSD.
Split Plots

BU-CANR-SRWM/2012/2020
Research Method – Lecture Note By Ademe T. (MSc. In Soil Science) 79

BU-CANR-SRWM/2012/2020
Research Method – Lecture Note By Ademe T. (MSc. In Soil Science) 80
Randomization and layout in split-plot design

BU-CANR-SRWM/2012/2020
Research Method – Lecture Note By Ademe T. (MSc. In Soil Science) 81

BU-CANR-SRWM/2012/2020
Research Method – Lecture Note By Ademe T. (MSc. In Soil Science) 82
Analysis of variance in split-plot design

BU-CANR-SRWM/2012/2020
Research Method – Lecture Note By Ademe T. (MSc. In Soil Science) 83

BU-CANR-SRWM/2012/2020
Research Method – Lecture Note By Ademe T. (MSc. In Soil Science) 84

BU-CANR-SRWM/2012/2020
Research Method – Lecture Note By Ademe T. (MSc. In Soil Science) 85

BU-CANR-SRWM/2012/2020
Research Method – Lecture Note By Ademe T. (MSc. In Soil Science) 86

BU-CANR-SRWM/2012/2020
Research Method – Lecture Note By Ademe T. (MSc. In Soil Science) 87

BU-CANR-SRWM/2012/2020
Research Method – Lecture Note By Ademe T. (MSc. In Soil Science) 88

BU-CANR-SRWM/2012/2020
Research Method – Lecture Note By Ademe T. (MSc. In Soil Science) 89

BU-CANR-SRWM/2012/2020
Research Method – Lecture Note By Ademe T. (MSc. In Soil Science) 90
3.3.3. Factorial experiment
Factorial experiment is an experiment whose design consists of two or more factors, each with discrete
possible values or "levels", and whose experimental units take on all possible combinations of these levels
across all such factors. A factorial design is often used by scientists wishing to understand the effect of two
or more independent variables upon a single dependent variable. A full factorial design may also be called
a fully crossed design. Such an experiment allows the investigator to study the effect of each factor on the
response variable, as well as the effects of interactions between factors on the response variable. See the
example shown in the split plot design above.
Example ―2x3 Factorial‖
• 2 levels of Phosphorus (0, +P)
• 3 levels of Nitrogen (0, +N, +2N)
• 6 treatments (all combinations):
Nil, +P, +N, +P+N, +2N, +P+2N
For the vast majority of factorial experiments, each factor has only two levels. For example, with two factors
each taking two levels, a factorial experiment would have four treatment combinations in total, and is usually
called a 2×2 factorial design. However, if the number of combinations in a full factorial design is too high to
be logistically feasible, a fractional factorial design may be done, in which some of the possible
combinations (usually at least half) are omitted.
The simplest factorial experiment contains two levels for each of two factors. Suppose an engineer wishes to
study the total power used by each of two different motors, A and B, running at each of two different speeds,

BU-CANR-SRWM/2012/2020
Research Method – Lecture Note By Ademe T. (MSc. In Soil Science) 91
2000 or 3000 RPM. The factorial experiment would consist of four experimental units: motor A at 2000
RPM, motor B at 2000 RPM, motor A at 3000 RPM, and motor B at 3000 RPM. Each combination of a
single level selected from every factor is present once.
This experiment is an example of a 22 (or 2x2) factorial experiment, so named because it considers two
levels (the base) for each of two factors (the power or superscript), or levels, producing 22=4 factorial points.
The notation used to denote factorial experiments conveys a lot of information. When a design is denoted a
23 factorial, this identifies the number of factors (3); how many levels each factor has (2); and how many
experimental conditions there are in the design (23=8). Similarly, a 2
5 design has five factors, each with two
levels, and 25=32 experimental conditions; and a 3
2 design has two factors, each with three levels, and 3
2=9
experimental conditions. Factorial experiments can involve factors with different numbers of levels. A 243
design has five factors, four with two levels and one with three levels, and has 16 X 3=48 experimental
conditions.
Implementation of Factorial Experiment
For more than two factors, a 2k factorial experiment can be usually recursively designed from a 2
k-1 factorial
experiment by replicating the 2k-1
experiment, assigning the first replicate to the first (or low) level of the
new factor, and the second replicate to the second (or high) level. This framework can be generalized to, e.g.,
designing three replicates for three level factors, etc.
A factorial experiment allows for estimation of experimental error in two ways (i.e. error for the main effect
and error for the interaction effect; for further information, please see the previous split-plot analysis
section). Replication is more common for small experiments and is a very reliable way of assessing
experimental error. When the number of factors is large (typically more than about 5 factors, but this does
vary by application), replication of the design can become operationally difficult. In these cases, it is
common to only run a single replicate of the design, and to assume that factor interactions of more than a
certain order (say, between three or more factors) are negligible. Under this assumption, estimates of such
high order interactions are estimates of an exact zero, thus really an estimate of experimental error.
When there are many factors, many experimental runs will be necessary, even without replication. For
example, experimenting with 10 factors at two levels each produces 210
=1024 combinations. At some point
this becomes infeasible due to high cost or insufficient resources.

BU-CANR-SRWM/2012/2020
Research Method – Lecture Note By Ademe T. (MSc. In Soil Science) 92
As with any statistical experiment, the experimental runs in a factorial experiment should be randomized to
reduce the impact that bias could have on the experimental results. In practice, this can be a large operational
challenge.
Factorial experiments can be used when there are more than two levels of each factor. However, the number
of experimental runs required for three-level (or more) factorial designs will be considerably greater than for
their two-level counterparts. Factorial designs are therefore less attractive if a researcher wishes to consider
more than two levels.
Advantages and disadvantages of factorial experiment
Analyses
A factorial experiment can be analyzed using ANOVA or regression analysis. It is relatively easy to estimate
the main effect for a factor. Other useful exploratory analysis tools for factorial experiments include main
effects plots, interaction plots, and a normal probability plot of the estimated effects. It is simply done with a
Pascal Triangle as shown below.

BU-CANR-SRWM/2012/2020
Research Method – Lecture Note By Ademe T. (MSc. In Soil Science) 93
Chapter 4: Social research methods
4.1. Introduction of social research methods
Social research is a research involving social scientific methods, theories and concepts, which can
enhance our understanding of the social processes and problems encountered by individuals and groups in
society. It is conducted by sociologists, psychologists, economists, political scientists, and anthropologists.
Social research is a scientific process:
It involves the systematic collection of methods to produce knowledge.
It is subjective.
It can tell you things you do not expect.
It consists of theory and observation.

BU-CANR-SRWM/2012/2020
Research Method – Lecture Note By Ademe T. (MSc. In Soil Science) 94
Sometimes called ‗soft sciences‘ because their subject matter (humans) are fluid and hard to measure
precisely.
It is an empirical research – i.e. facts are assumed to exist prior to the theories that explain them.
Social Research is connected with the social life. The two cannot be separated. Social research is in fact a
part of the scientific study/approach. Social research investigates and verifies social phenomena and social
realities, the facts about social life and formulates laws this regard. After the laws have been formulated,
investigation is carried out and interrelationships between various facts and laws are established. Through
these steps we are able to collect data and knowledge about society. It provides scientific knowledge about
social problems and helps the researcher to find out solutions to them.
In brief, the goal of social research primarily is to explore and gain an understanding of human behavior.
Thus, social research as the following characteristics:
Social research is related to social life;
Social research investigates and verifies facts about the society and social interactions;
Social research formulates laws in regard to different social phenomena and the principles that guide
these phenomena;
It tries to investigate the relationship that exists between various facts and phenomena of social life.
Forms of Social Research
i. Basic or Pure Research: the aim is to develop a body of general knowledge for the understanding of
human social behaviour by means of a combination of empirical enquiry and application of theory. It
is mostly done by academics. Success for basic social researchers is when results are published in a
peer reviewed journal and have an impact on the scientific community.
ii. Applied or Policy Oriented Research: the aim is to provide knowledge and information that can be
used to influence social policy. Applied research is conducted by applied social researchers employed
by sponsors. Success for applied social researchers is that their results are used by their sponsors in
decision making.
What do you need to think about when designing social research?
What is the purpose of the research?
What are your units of analysis?
What are your points of focus?

BU-CANR-SRWM/2012/2020
Research Method – Lecture Note By Ademe T. (MSc. In Soil Science) 95
What is the time dimension? Is it cross-sectional (i.e. taken once in time) or longitudinal (i.e. multiple
time points)?
Designing a research project:
Conceptualization- you must specify the meanings of the concepts and variables to be studied.
Operationalization - how will we actually measure the variables under study?
Reliability - are the results repeatable? – Relevant to quantitative social research.
Replication - can others replicate the results? and
Validity - are the results a true reflection of the world? Internal (are they measuring the underlying
phenomenon) /external (generalize to the population).
4.2. Social Survey Methods
The social survey is one of the best known and most widely used approaches to investigation in the social
sciences. It is normally associated with the questionnaire, the most common technique for data collection
used by surveys. However, the survey is more than a data collection technique. Rather it refers to a research
design and can include a range of research goals. The term social survey also implies interviewing a sample
taken from the general population. Indeed the intention of a survey is usually to generalize from a sample to
a population.
4.2.1. Introduction to survey research
Survey research is one of the most important areas of measurement in applied social research. The broad area
of survey research encompasses any measurement procedures that involve asking questions of respondents.
A "survey" can be anything from a short paper-and-pencil feedback form to an intensive one-on-one in-
depth interview. A defining feature of the survey is that it is a structured method of data collection. Surveys
collect information on the same characteristics or variables about each respondent or case. While surveys are
used to collect information on individuals, groups and organizations (for example, schools), most often it is
individuals who provide information about themselves.
The basic procedure in survey is that people are asked a number of questions on that aspect of behavior
which the sociologist is interested in. A number of people are carefully selected so that their representations
of the population being studied are asked to answer exactly the same question. Thus, the replies to different
categories of respondents may be examined for differences. One type of survey relies on contacting the

BU-CANR-SRWM/2012/2020
Research Method – Lecture Note By Ademe T. (MSc. In Soil Science) 96
respondents by letter and asking them to complete the questionnaire themselves before returning it. These are
called mail questionnaires. Sometimes questionnaires are not completed by individuals separately but by
people in a group under the direct supervision of the research worker. A variation of the procedure can be
that a trained interviewer asks the questions and records the responses on a schedule from each respondent.
Quality in survey research is a state of ―BE-ing‖ that helps you create great questionnaires that greatly
reduces ―measurement error‖. Five simple ―B‘s‖ help refine the art of using survey and avoid the common
pitfalls we often see in ―bad questionnaires.‖
1. Be Well Thought-Out
Avoid placing survey questions out of order or out of context. In general, a funnel approach is advised. Place
broad and general questions at the beginning of the questionnaire as a warm-up, followed by more specific
questions, followed by more general easy to answer questions (like demographics) at the end of the
questionnaire.
2. Be Unbiased
Slight wording changes can produce great differences in survey results. ―Could‖, ―Should‖, and ―Might‖ all
sound almost the same, but may produce a 20% difference in agreement to a question. Strong words that
represent control or action, (such as ―prohibit‖) produce similar survey results.
3. Be Specific
Unclear survey questions produce answers that lack meaning. The question ―Do you like orange juice?‖
produces a less than meaningful answer, but is the respondent referring to taste, texture, nutritional content,
vitamin C, the current price, concentrated, or fresh squeezed? Specific questions produce specific
understanding. Thus, survey questions must be as specific as possible to avoid misunderstanding by the
respondents.
4. Be Exact
Avoid Double Barrelled Questions. The question ―What is the fastest and most economical Internet service
for you?‖ is problematic because the fastest is certainly not the most economical. Two questions should be
asked in one question.

BU-CANR-SRWM/2012/2020
Research Method – Lecture Note By Ademe T. (MSc. In Soil Science) 97
Avoid Overly Compressed Answers. Make sure answers choices are independent and cover the landscape of
possible answers. For example the question ―Do you think of basketball players as being independent agents
or as employees of their team?‖ Some believe that they are both.
Response categories for multiple choice survey questions should be mutually exclusive so that clear
choices can be made. Likewise, questions that do not provide all acceptable or meaningful answers frustrate
the respondent and make interpretation of results difficult at best. If you are unsure, conduct a pre-test using
the ―Other (please specify)‖ option. Then revise the question making sure that you cover at least 90% of the
respondent answers.
5. Be Considerate
Avoid intrusive questions. Respondents may not have access to, remember, or want to provide the
information requested. Likewise, privacy is an increasingly important issue. Questions about finances,
income, occupation, family life, personal hygiene and beliefs (personal, political, religious) can be too
intrusive and rejected by the respondent.
Avoid techno-babble. Caloric content, bits, bytes, MBS, and other industry specific jargon and acronyms
produce confusion. Your audience must understand your language level, terminology and above all, the
question being asked.
Avoid long questions. Multiple choice questions are the longest and most complex to write. Free text
answers are the shortest and easiest to answer. Increasing the length of questions and surveys decreases the
chance of receiving a completed response.
Avoid impossible questions on future intentions. Making predictions is difficult, especially when they are
about the future. Predictions are rarely accurate more than a few weeks or in some case months ahead.
4.2.2. The nature and scope of social survey
The nature and scope social research (survey) as a discipline is a recent phenomenon. With the elevation in
the status of social science research in the post World War II period, the teaching of research methods has
become popular. Since the 1950s, the Social Science Departments in the American Universities have been

BU-CANR-SRWM/2012/2020
Research Method – Lecture Note By Ademe T. (MSc. In Soil Science) 98
offering courses in research methods and over the years they have opened in popularity among the students.
Universities in India have introduced research methodology in Social Science mostly in the 1970s.
The purpose of social science research is to establish scientific and empirical knowledge about the human
society. Thus, the scope of social research centers on the use of scientific method for the establishment of
scientific knowledge of the society. Scientific method is characterized by verifiability, ethical neutrality,
accuracy, precision, objectivity.
The scope and method of social research is both wide and complex because it involves the comprehension
of social reality whose nature is very complex unlike the physical reality.
Since knowledge is a particular kind of power, social research gives a greater power of control over the
social phenomena. Dispelling the trust of outworn assumptions, superstitions and stereotypes by providing
scientific and enlightening knowledge is something, which falls within the scope and domain of social
research. Social research also has a direct implication for social welfare. By virtue of the deeper
understanding of the causal nexus underlying various social maladies (i.e. disorders), social research
provides and can provide a secure basis for effective remedial measures. Thus, social welfare also falls
within the scope of social research. It is also the scope of social research to provide prediction about social
phenomena by way of ascertaining some order among facts. So, by prediction, social research has the effect
of initiating and guiding social life.
4.3. Methods of data collection in social survey
The methods involved in social survey data collection are any of a number of ways in which data can be
collected for a statistical survey. These are methods that are used to collect information from a sample of
individuals in a systematic way. First there was the change from traditional paper-and-pencil interview to
computer-assisted interview. Now, face-to-face surveys, telephone surveys, and mail surveys (using
questionnaires) are increasingly replaced by web surveys.
4.3.1. Types of interviewing technique
Interview techniques are practices used by a social researcher to collect information through face-to-face or
telephone online interview. There are different types of interview techniques. Some of the common ones are
briefly discussed below.

BU-CANR-SRWM/2012/2020
Research Method – Lecture Note By Ademe T. (MSc. In Soil Science) 99
A. Structured Interview
A structured interview (also known as a standardized interview) is a quantitative research method
commonly employed in survey research. The aim of this approach is to ensure that each interview is
presented with exactly the same questions in the same order. Structured interviews allow for replication of
the interview with others. This ensures that answers can be reliably aggregated and that comparisons can be
made with confidence between sample subgroups or between different survey periods. The object of using
structured interview is to standardize the interview as much as possible and thus to reduce the effect that the
interviewer's personal approach or biases may have upon the result. When structured interviews are used,
proper training can do a lot to ensure further the reliability and validity of research. You can then generalize
what you find out to the population from which your interview sample came.
Structured interviews are a means of collecting data for a statistical survey. In this case, the data are collected
by an interviewer. Interviewers read the questions exactly as they appear on the survey questionnaire. The
choice of answers to the questions is often fixed (close-ended) in advance, though open-ended questions can
also be included within a structured interview. The key feature of the structured interview is in the pre-
planning of all the questions asked. Structured interviews are conducted in various modes: face-to-face, by
telephone, videophone and the Internet. Thus, the more use of unplanned questions, the less structured the
interview becomes.
A structured interview also standardizes the order in which questions are asked of survey respondents, so the
questions are always answered within the same context. This is important for minimizing the impact of
context effects, where the answers given to a survey question can depend on the nature of preceding
questions. Though context effects can never be avoided, it is often desirable to hold them constant across all
respondents.
B. Focus Group Interview
A focus group interview is a form of qualitative research in which a group of people are asked about their
perceptions, opinions, beliefs, and attitudes towards a product, service, concept, advertisement, idea, or
packaging. A focus group is a technique involving the use of in-depth group interviews in which participants
are selected because they are a purposive, although not necessarily representative, sampling of a specific
population, this group being ‗focused‘ on a given topic. Participants in this type of research are, therefore,
selected on the criteria that they would have something to say on the topic, are within the age-range, have

BU-CANR-SRWM/2012/2020
Research Method – Lecture Note By Ademe T. (MSc. In Soil Science) 100
similar socio-characteristics and would be comfortable talking to the interviewer and each other. This
approach to selection relates to the concept of ‗applicability’, in which subjects are selected because of their
knowledge of the study area.
Questions are asked in an interactive group setting where participants are free to talk with other group
members. A focus group is an interview, conducted by a trained moderator among a small group of
respondents. The interview is conducted in an informal and natural way where respondents are free to give
views from any aspect. One of the distinct features of focus-group interviews is its group dynamics, hence
the type and range of data generated through the social interaction of the group are often deeper and richer
than those obtained from one-to-one interviews.
Focus groups could provide information about a range of ideas and feelings that individuals have about
certain issues, as well as illuminating the differences in perspective between groups of individuals. For
example, in the social sciences and urban planning, focus groups allow interviewers to study people in a
more natural conversation pattern than typically occurs in a one-to-one interview. In combination with
participant observation, they can be used for learning about groups and their patterns of interaction. An
advantage is their fairly low cost compared to questionnaires, as one can get results relatively quickly and
increase the sample size of a report by talking with several people at once.
C. Unstructured/ Open-Ended Interview
The freer discursive interview (i.e. proceeding by reasoning or argument) is called unstructured interview.
The problem of interviewer's bias in an unstructured interview is much greater. Here the interviewer is left to
his common devices as far as the way he/she approaches a respondent is concerned. There is no fixed list of
questions to work through. Instead the interviewer may work from a guide that will remind him of the topics
he wishes to cover.
The unstructured interview is normally conducted as a preliminary step in the research process to generate
ideas/hypotheses about the subject being investigated so that these might be tested later in the proper survey.
The respondent is encouraged to talk freely about the subject, but is kept to the point on issues of interest to
the researcher. The respondent is encouraged to reveal everything that he/she feels and thinks about these
points. The interviewer must note (or tape-record) all remarks that may be relevant and pursue them until
he/she is satisfied that there is no more to be gained by further probing.

BU-CANR-SRWM/2012/2020
Research Method – Lecture Note By Ademe T. (MSc. In Soil Science) 101
The training of the interviewer is crucial here not simply training in the social skills of keeping the
conversation going on a topic that the respondent may not be very interested in but also in acquiring
sensitivity to those things his respondents tell him which are specially relevant to the theoretical topics he is
pursuing. This means that unstructured interviews can be carried out by people trained in sociological theory.
They are then able to size upon stray comments made by the respondents which can be developed and lead
on to important theoretical insight. Unplanned spontaneous questions are a key feature of the unstructured
interview. Spontaneous questioning is more responsive to the participant. However, spontaneous questioning
does not allow for generalization. Spontaneous questions can also be accused of generating invalid results
and conclusions. Unstructured interviews are difficult to replicate. As a result, an inability to generalize your
findings to a wider population. Also possible interviewer bias in 'selective' use of leading, and spontaneous
questions.
4.3.2. The Interview Method
The interview method of research is a conversation with a purpose and is non-experimental in design. The
interviewer in one-to-one conversation collects detailed personal information from individuals using oral
questions. The interview is used widely to supplement and extend our knowledge about individual(s)
thoughts, feelings and behaviours. Or how they think they feel and behave. Interviews can give us both
quantitative and qualitative data about participants' thoughts, feelings and behaviours. This is due to the
standardization and/or free-ranging nature of questions asked.
a. Single Interview Survey
The single interview survey had its beginnings in market and public opinion research as developed in the
United States prior to and during World War II and was used soon thereafter in Africa and subsequently in
Asia and Latin America. Today, this type of survey is the most frequently used device to obtain information
on vital events for estimating fertility and mortality rates. Its continued use requires that considerable
attention be paid to improving both the method and those indirect techniques that make possible valid
adjusted measures. The single interview survey involves a probability sample of households and an ad hoc
one-time interview that distinguishes it from other efforts, such as the multi-round and follow-back surveys,
or the dual record system.

BU-CANR-SRWM/2012/2020
Research Method – Lecture Note By Ademe T. (MSc. In Soil Science) 102
There is great variety among single interview surveys; they range from a relatively uncomplicated procedure
asking a few questions to highly sophisticated and complex undertakings. In developing countries, they have
been primarily helpful in obtaining demographic information where little or no data are available and have
been used with considerable success in supplementing existing data systems. The reasons for the widespread
use of this type of survey area are clear. These are: simplicity of design, flexibility of adaptation to
varying circumstances and cultures, short time of implementation, and ease of administration all
contribute to the comparative lower cost of the single interview survey as opposed to more complex designs.
However, there are serious disadvantages that affect the final product; the surveys have been notorious for
their high rates of error, particularly non-sampling errors. For example, gross errors in reporting (as high as
20% for births and 40% for deaths) have been recorded.
Major sources of bias include: incomplete reporting of vital events, erroneous dating of events,
misstatement of age, and omission of persons. For example, there has been consistent underreporting of
births and infant deaths, and a serious underreporting of deaths to older persons. To correct these faults,
various techniques have been devised for making estimates from surveys in which data are incomplete or
inaccurate. There is considerable room for improvement through the refinement of survey design, sampling,
questionnaire design, quality control, processing and procedures. The importance of full reporting of
experience in the field should be emphasized. All surveys should be critically evaluated to facilitate further
research in a number of required areas: the art of interviewing must be re-examined and more studies
undertaken on factors that produce bias and inconsistencies; means of eliciting detailed information through
pregnancy histories; the effect of recall lapse; counting rules; the use of historical calendars to determine age;
and cost effectiveness. It is obvious that the single interview survey will continue to be widely used on its
own merits to serve as the first round in multi-round surveys, as well as to supplement data from censuses
and registration systems.
b. Frequent Interview Survey
Frequent interview survey is a type of interview survey in which the researcher and/or the interviewer
frequently interviews the interviewee at a predictable or unpredictable interval of time period. Of course, this
kind of interview survey may help the interviewer to collect reliable information from the interviewee
because the interviewer may raise the same or similar type of questions during his/her interviewing time.
However, the disadvantage is that it is a time consuming process because both the interviewer and the
interviewee would spend much time while treating the same type of questions over and over again. Thus, this

BU-CANR-SRWM/2012/2020
Research Method – Lecture Note By Ademe T. (MSc. In Soil Science) 103
type of interview survey might be boring for both the interviewer and the interviewee. The other thing is that
it might be difficult to get the same interviewee several time periods because the interviewee might be
occupied with his/her personal business when the interviewer wants him/her for frequent interview survey.
The other drawback of the frequent interview survey is more costly than the single interview survey because
it will consume much more time than the time needed for the single interview survey.
Interview recording
The entire best interview is useless if it has not been adequately recorded, so it is important to ensure good
recording conditions. In an open-ended interview, it is difficult to make notes on everything during the
interview. The best approach in team-work is to appoint a scribe, i.e. a person whose job is to write
everything down. How long one waits before writing up full field-notes depends on the setting, and the
interviewer's personal style but it should be borne in mind that an interviewer's memory is limited. It is
surprising how facts, ideas and important observations that one thinks one will never forget quickly slip
away. Half of the details from an interview can be forgotten within 24 hours, three-quarters can be lost
within 2 days and after this only skeletal notes can be salvaged. Jotted notes will help prompt memory later,
but it is best to write up interview notes while they are still fresh in the interviewer's mind after the interview
or at the end of the interviewing day.
Use of tape-recorders: A tape recorder can often be useful. It enables the interviewer to give the respondent
his/her full attention during the interview and avoid the need to be constantly scribbling notes. It can also
enable data to be left until such time as analysis can be applied more rigorously and in a more leisurely way.
It should be borne in mind; however, that not everyone likes to be tape-recorded. If taping is contemplated,
the respondents' permission should be sought first.
Closing interview
After all relevant topics have been covered or the respondent's time exhausted, the conversation should be
brought to an end. If the weather is unfavourable (too hot or too wet) or the respondent seems pressed for
time, it is best to prematurely stop the interview. The departure is best done gracefully, naturally and not too
abruptly. The business-like 'Got to go' departure should be avoided. The respondent should be thanked for
his/her time and given the appropriate customary farewell.

BU-CANR-SRWM/2012/2020
Research Method – Lecture Note By Ademe T. (MSc. In Soil Science) 104
4.3.3. The Questionnaire Method
Questionnaires are the most commonly used tool in survey research. However, the results of a particular
survey are worthless if the questionnaire is written inadequately. Questionnaires should produce valid and
reliable demographic variable measures and should yield valid and reliable individual disparities that self-
report scales generate.
A variable category that is often measured in survey research is demographic variables, which are used to
depict the characteristics of the people surveyed in the sample. Demographic variables include such
measures as ethnicity, socio-economic status, race, and age. Surveys often assess the preferences and
attitudes of individuals, and many employ self-report scales to measure people‘s opinions and judgements
about different items presented on a scale. Self-report scales are also used to examine the disparities among
people on scale items. These self-report scales, which are usually presented in questionnaire form, are one of
the most used instruments in psychology, and thus it is important that the measures be constructed carefully,
while also being reliable and valid.
Reliable measures of self-report are defined by their consistency. Thus, a reliable self-report measure
produces consistent results every time it is executed. A test‘s reliability can be measured a few ways. First,
one can calculate test-retest reliability. Test-retest reliability entails conducting the same questionnaire to a
large sample at two different times. For the questionnaire to be considered reliable, people in the sample do
not have to score identically on each test, but rather their position in the score distribution should be similar
for both the test and the retest. Self-report measures will generally be more reliable when they have many
items measuring a construct. Furthermore, measurements will be more reliable when the factor being
measured has greater variability among the individuals in the sample that are being tested. Finally, there will
be greater reliability when instructions for the completion of the questionnaire are clear and when there are
limited distractions in the testing environment. Contrastingly, a questionnaire is valid if what it measures is
what it had originally planned to measure. Construct validity of a measure is the degree to which it measures
the theoretical construct that it was originally supposed to measure.
i. Cross-Sectional and Longitudinal Survey
Cross-Sectional Survey: In cross-sectional studies, a sample (or samples) are drawn from the relevant
population and studied once. A cross-sectional study describes characteristics of that population at one time,

BU-CANR-SRWM/2012/2020
Research Method – Lecture Note By Ademe T. (MSc. In Soil Science) 105
but cannot give any insight as to the causes of population characteristics because it is a predictive,
correlational design.
Longitudinal Survey: Longitudinal studies take measure of the same random sample at multiple time
points. Unlike with a successive independent samples design, this design measures the differences in
individual participants‘ responses over time. This means that a researcher can potentially assess the reasons
for response changes by assessing the differences in respondents‘ experiences. Longitudinal studies are the
easiest way to assess the effect of a naturally-occurring event, such as divorce that cannot be tested
experimentally. However, longitudinal studies are both expensive and difficult to do. It‘s harder to find a
sample that will commit to a months- or years-long study than a 15-minute interview, and participants
frequently leave the study before the final assessment. This attrition of participants is not random, so samples
can become less representative with successive assessments. To account for this, a researcher can compare
the respondents who left the survey to those that did not, to see if they are statistically different populations.
Respondents may also try to be self-consistent in spite of changes to survey answers.
ii. Survey Design
Survey design is critical in determining the quality of research. The potential for poor design is vast -
whether intentionally on the part of the researcher or unintentionally.
Before designing a survey
It can be very tempting to press ahead with designing a survey. But first, be clear about the purpose of the
study and the research methodology.
In designing a survey, don't put the cart before the horse. Before designing a survey, develop a research
proposal which clearly explains the:
1. Research purpose
4. Statements of research problem
5. Research questions
6. Hypotheses
7. Research design: Experimental, quasi-experimental, non-experimental
8. Sampling method and data collection procedures
9. Target constructs - operationally define the:
1. independent variables
2. dependent variables

BU-CANR-SRWM/2012/2020
Research Method – Lecture Note By Ademe T. (MSc. In Soil Science) 106
Have the research proposal peer-reviewed and modify as appropriate. Before designing a survey, it is
helpful, and generally recommended, to clearly establish a research proposal and to get this proposal peer-
reviewed (and/or reviewed by a supervisor). This is because investment in developing the proposal is
generally returned many-fold.
Poor research results and conclusions emerge from poor data, which is often due to poor survey design.
Hence, a well-conducted survey research project should exhibit:
clarity in the project's purposes (and specific research questions and hypotheses)
careful development of well-worded questions with appropriate response formats and/or
a well designed and implemented sampling method
iii. Population and Sample Instrumentation
1. Defining the population- Whether a researcher is drawing a sample or is studying an entire population,
the population needs to be defined. This helps focus the research.
2. Samples and Populations
about whom information is obtained. Thus, a sample is a small number of individuals representing a
larger group. The larger group to whom the information is then generalized is the population.
3. Why use samples
because they are smaller and less unwieldy (i.e. difficult to carry or manage because of size, shape,
weight, or complexity). It can be too time consuming and expensive to study an entire population.
4. Target versus accessible populations
to generalize to. Often this isn‘t possible, so the accessible population is used. For example, a researcher
might want to target all male elementary teachers in Ethiopia, but actually collects data from the male
elementary teachers in Addis Ababa.
5. External validity on,
researchers need to be sure their work actually does represent the population. The extent to which
information can be generalized to a larger population is known as external validity.
6. Representative samples ccurate portrayal of the
population being studied.
7. Instrumentation instrumentation. It involves the
selection of the method by which data will be collected, as well as the procedures and conditions for
collecting them.

BU-CANR-SRWM/2012/2020
Research Method – Lecture Note By Ademe T. (MSc. In Soil Science) 107
8. Different types of instruments
re completed by knowledgeable participants providing information
in addition to that collected by researchers and given by subjects.
9. Selecting instruments
that has been developed by another person, or he/she designs a new one. The advantage of selecting
existing ones is that they have often been field tested for reliability and validity.
10. Reliability refers to consistency of results. If a study is repeated, will it yield similar findings? A good
example of reliability might be having three different people grading students‘ essays. Will all three of
them agree on what constitutes an A, B, C, etc? Or will their scoring vary widely? If there is a large
variety, the grades would not be reliable.
11. Validity refers to the defensibility of the inferences a researcher can make from a study using an
instrument.
12. Researcher instruments
13. Subject instruments -check
14. Data
followed by a plural verb, such as ―Data are‖ or ―Data were‖.
15. Collecting data
or they might perform a task.
16. Measurement scales
male and
an ordinal scale that has the addition of equal distances between the points. IQ is measured using an
interval scale.
17. Rating scales rvation and rating is that when a researcher rates a subject,
he or she is making a judgment of some type. On the other hand, when a researcher makes an
observation, he or she is merely recording behavior and not judging it. For example, a rating might be
that a girl made 3 baskets in 20 attempts, thus scored 2 on a scale of poor to good on free throws, while
an observation would just note the number of baskets/attempts.

BU-CANR-SRWM/2012/2020
Research Method – Lecture Note By Ademe T. (MSc. In Soil Science) 108
18. Objectivity f the researcher. For
example, political analyst with a particular ideological bent might conduct a poll differently from one
who has no affiliation.
19. Ecological generalizability
different set of conditions. For example, researchers studying rural schools might have difficulty in
generalizing their results to urban schools.
4.3.4. Formulating Questions for a Survey
Define Your Survey Goals
First, you need to know what kind of information you want to get from your survey. If you have only a vague
idea of what you‘re trying to find out, your questions will be vague, too, and so will your answers.
Put Easy Questions First
As for ordering the questions, you should put them in a logical order, and group questions on similar topics
together. If possible, easier questions should come earlier in the survey. Again, this makes it easier and more
pleasant for respondents to take the survey, which increases the likelihood that they will actually finish it. In
oral surveys, this also helps the interviewer build rapport with the respondent.
Put Difficult or Sensitive Questions Last
Conversely, put the more difficult questions near the end of the survey. If respondents see a tough question
right at the beginning, for all they know, all the questions could be that difficult, and filling out the survey
starts to look like a real hassle (fight). But if they see it at the end, they may put in the effort since they know
they‘re almost done, or because by this point they like you and trust you.
Even if they quit, at least you will have most or half of a survey to analyze, instead of none. This advice goes
not only for questions that are just difficult, but also for questions that are more sensitive, such as questions
about income level or ethnicity.
Be Careful When Giving Respondents Choices
The next few tips have to do with structured questions, that is, questions in which you provide a choice of
answers. Examples of structured questions include multiple-choice questions, or questions asking
respondents to rate something on a numerical scale.

BU-CANR-SRWM/2012/2020
Research Method – Lecture Note By Ademe T. (MSc. In Soil Science) 109
Cover All Possible Answers
The experts agree that in a multiple choice question, the choices should cover all possible answers.
Sometimes, this will mean including an option for ―Other,‖ or ―Don‘t know,‖ or even ―Don‘t wish to say‖
for sensitive questions. Not only will this get you more accurate data, but it builds trust. If respondents feel
you‘re trying to make them give you an answer they don‘t agree with, they may just skip the question, or
stop answering questions altogether.
Make Sure Answers Don’t Overlap
In addition to providing for all possible answers, the choices in a multiple-choice question with just one
response allowed should be mutually exclusive. They shouldn‘t overlap. For example, if a question asks
which kind of food is your favorite, the answers shouldn‘t include both Thai (e.g. cookies) and vegetarian,
because some food is both. If someone‘s favorite food is vegetarian Thai food, which response is
appropriate?
Ask About One Thing at a Time
You should avoid ―double-barrelled questions,‖ that is, questions that ask about more than one thing at a
time. For example, if you instruct a respondent, ―Please rate your satisfaction with the service and food
quality during your visit,‖ you don‘t know what kind of answer you will get. Will the respondent rate the
service and overlook food quality? Will he or she do the opposite, or maybe just report whichever rating is
lower, or higher? Instead, break this into two questions, one about the service and one about the food quality.
Avoid Biased Questions
For any kind of question, you should make sure it is not biased to make the respondent more likely to give a
particular answer. At least, this is what you should do if you want as accurate a reading as possible. If, on the
other hand, you‘re a sleazy politician who just wants a survey to make your candidate look as good as
possible, or the other candidate to look as bad as possible, then by all means you should use loaded,
emotional terms, and phrase the questions in ways to get the answers you want. And you should go away.
But if you‘re listening to this podcast for tips on better writing, you‘re clearly not one of those people.

BU-CANR-SRWM/2012/2020
Research Method – Lecture Note By Ademe T. (MSc. In Soil Science) 110
Here‘s just one example of a biased question: ―How much did you like the movie?‖ That question will bias
respondents toward a positive response, even if your answers include a ―Not at all‖ choice. ―How did you
feel about the movie?‖ is more neutral.
There are so many ways to bias a question that I can‘t go into them all. Aside from the words you use, the
order in which you present the answers to the questions, and even the order in which you present the
questions themselves, can affect respondents‘ answers.
In part because it is so easy to bias a question, the sources agree that you should test your survey before you
administer it for real. Have colleagues read it, and have a handful of people take it so you can see where they
get confused, or where any other problems come up.
Finally, you should thank your respondents for helping you!
Questionnaire Development (Content, Format, Wording, Sequencing, Pre-Testing, Revision,
Translation)
Seven steps can be employed to construct a questionnaire that will produce reliable and valid results.
1. One must decide what kind of information should be collected. The information to be collected and
the objectives of the study will affect the content of the questionnaire.
2. One must decide how to conduct the questionnaire.
3. One must construct a first draft of the questionnaire.
4. The questionnaire should be revised.
5. The questionnaire should be pretested.
6. The questionnaire should be edited, revised and the procedures for its use should be specified.
7. If the questionnaire is disseminated to local people whose language is different from the language
used to prepare the questionnaire, it should be translated with great care as it may lose its correct
meaning during translation.
Survey researchers should carefully construct the order of questions in a questionnaire. For
questionnaires that are self-administered, the most interesting questions should be at the beginning of the
questionnaire to catch the respondent‘s attention, while demographic questions should be near the end.
Contrastingly, if a survey is being administered over the telephone or in person, demographic questions
should be administered at the beginning of the interview to boost the respondent‘s confidence.

BU-CANR-SRWM/2012/2020
Research Method – Lecture Note By Ademe T. (MSc. In Soil Science) 111
Guidelines for the effective wording of questions
The way that a question is phrased can have a large impact on how a research participant will answer the
question. Thus, survey researchers must be conscious of their wording when writing survey questions. It is
important for researchers to keep in mind that different individuals, cultures, and subcultures can interpret
certain words and phrases differently from one another. There are two different types of questions that
survey researchers use when writing a questionnaire: free response questions and closed questions. Free
response questions are open-ended, whereas closed questions are usually multiple choice.
Free response questions are beneficial because they allow the responder greater flexibility, but they are also
very difficult to record and score, requiring extensive coding. Contrastingly, closed questions can be scored
and coded much easier, but they diminish expressivity and spontaneity of the responder. In general, the
vocabulary of the questions should be very simple and direct, and most should be less than twenty words.
Each question should be edited for "readability" and should avoid leading or loaded questions. Finally, if
multiple items are being used to measure one construct, the wording of some of the items should be worded
in the opposite direction to evade response bias.
Ask on direct experience
If you ask on some experience in your questionnaire with which your respondent does not have any
experience, it will be hard for him/her to respond. If he does, the answer won´t be relevant. Another mistake
usually done is the use of the hypothetical questions (what if?). These questions are not suitable in terms of
the quality of obtained data.
Ask only one question at a time
If you ask about more then one issue in your question, the respondent might get confused. There is the
danger again that the answers you will receive will be poor quality and irrelevant ones. If your topic that you
need answers for is more complicated – split it into more individual questions. Thus your survey will be
more clear and easily understandable
Use comprehensible terms and commonly known words
Comprehensible terms are a very important factor in obtaining good quality answers. If your respondent
does not understand some words, most likely he/she will not answer truly but he/she will estimate or even

BU-CANR-SRWM/2012/2020
Research Method – Lecture Note By Ademe T. (MSc. In Soil Science) 112
make things up. Therefore, do not overuse any complicated or foreign expressions that you think your
respondents may not know.
Ask simple questions
When forming questions you have to pay attention to their simplicity. Too complicated or extensive answers
may confuse or discourage the respondents.
Example:
Wrong: How do you feel after you have had your procedure here at our newly opened relaxation-massage
centre on Relax Street in Addis Ababa, which should help your head pain and tiredness?
Correct: How do you feel after your head massage?
Make sure every question ends with a question mark?
Always check that the questions in your questionnaire end with a question mark. Although it is only a small
punctuation mark, it has great influence on the whole process of completing a questionnaire. The credibility
of a survey is also affected by grammatical and factual errors.
How to handle the questions order?
The correct structure of a survey will help you to obtain better quality answers from your respondents and
get a higher response rate. If you put the questions in a wrong order, the respondent may get discouraged and
will not fill the questionnaire.
Introductory questions
Introductory questions should be:
Comfortable
Interesting
Simple
These types of questions are meant to guarantee respondent‘s attention and make them feel easy about the
entire survey.
Sensitive topics
The questions of sensitive nature should be placed very carefully and sensibly. Under no circumstances they
can be placed at the beginning of a survey. The best solution is to gradually keep increasing the level of
sensitivity of the questions, from the least sensitive to the most sensitive. The respondent‘s confidence will
be higher and he/she will more likely complete the full questionnaire.

BU-CANR-SRWM/2012/2020
Research Method – Lecture Note By Ademe T. (MSc. In Soil Science) 113
Example:
Qn. 1 – What is your religion?
Qn. 2 – Do you financially support any political party?
Note: Following these questions which are placed at the beginning of a questionnaire only few
respondents will complete the whole document. Always pair your sensitive questions with the same context-
related ones.
Closing questions
Personal and demographic data such as, age, gender, location, etc. are usually placed at the end of a
questionnaire. Sometimes they follow questions associated with personal data.
The overall concept of a survey
We recommend alternating the types of questions: To make completing the questionnaire as pleasant as
possible, try to alternate the types of the questions. The questionnaire will then be more interesting and
easy to complete.
Put the similar questions together: Always put thematically similar questions close together.
Respondents will have a clearer image and will orient better in the whole questionnaire. It is a big
mistake to place questions on similar subject randomly.
4.3.5. Survey Implementation
These guidelines operate as a portal, and follow the structure of the Generic Statistical Business Process
Model (GSBPM), which describes statistical processes—such as the implementation of a survey—in a
coherent way. The GSBPM contains nine phases, each divided into sub-processes. In this section, we provide
a brief description of each phase (adapted from the GSBPM model description), followed by recommended
related resources (i.e., documents, tools, and links).
The 9 GSBPM phases are the following:
1. Specify the data needs
2. Design of the survey
3. Build the data collection
4. Collect (includes data entry)
5. Process (includes data editing)
6. Analyze
7. Disseminate
8. Archive
9. Evaluate

BU-CANR-SRWM/2012/2020
Research Method – Lecture Note By Ademe T. (MSc. In Soil Science) 114
4.3.6. Compilation Editing, Coding and Data Entry
A. Data Compilation: is taking survey or evaluation answers, gathering them into a database, and
analyzing the results for further suggestions, improvements, and/or recommendations.
B. Data Editing is defined as the process involving the review and adjustment of collected survey data.
The purpose is to control the quality of the collected data. Data editing can be performed manually,
with the assistance of a computer or a combination of both.
Data editing methods
1. Interactive editing. The term interactive editing is commonly used for modern computer-assisted
manual editing. Most interactive data editing tools applied at National Statistical Institutes (NSIs)
allow one to check the specified edits during or after data entry, and if necessary to correct erroneous
data immediately. Several approaches can be followed to correct erroneous data:
Re-contact the respondent;
Compare the respondent's data to his data from previous year;
Compare the respondent's data to data from similar respondents;
Use the subject matter knowledge of the human editor;
Interactive editing is a standard way to edit data. It can be used to edit both categorical and continuous
data. Interactive editing reduces the time frame needed to complete the cyclical process of review and
adjustment.
2. Selective editing. Selective editing is an umbrella term for several methods to identify the influential
errors, and outliers. Selective editing techniques aim to apply interactive editing to a well-chosen
subset of the records, such that the limited time and resources available for interactive editing are
allocated to those records where it has the most effect on the quality of the final estimates of
publication figures. In selective editing, data is split into two streams:
The critical stream
The non-critical stream
The critical stream consists of records that are more likely to contain influential errors. These critical
records are edited in a traditional interactive manner. The records in the non-critical stream which are
unlikely to contain influential errors are not edited in a computer assisted manner.

BU-CANR-SRWM/2012/2020
Research Method – Lecture Note By Ademe T. (MSc. In Soil Science) 115
3. Macro editing. There are two methods of macro editing:
Aggregation method. This method is followed in almost every statistical agency before
publication: verifying whether figures to be published seem plausible. This is accomplished by
comparing quantities in publication tables with same quantities in previous publications. If an
unusual value is observed, a micro-editing procedure is applied to the individual records and fields
contributing to the suspicious quantity.
Distribution method. Data available is used to characterize the distribution of the variables. Then
all individual values are compared with the distribution. Records containing values that could be
considered uncommon (given the distribution) are candidates for further inspection and possibly for
editing.
4. Automatic editing. In automatic editing records are edited by a computer without human
intervention. Prior knowledge on the values of a single variable or a combination of variables can be
formulated as a set of edit rules which specify or constrain the admissible values.
C. Data Coding: is an analytical process in which data, in both quantitative form (such as, questionnaire
results) and qualitative (such as, interview transcripts) are categorised to facilitate analysis. Coding
means the transformation of data into a form understandable by computer software. The classification
of information is an important step in preparation of data for computer processing with statistical
software. One code should apply to only one category and categories should be comprehensive. For
example, you can use 1 code for ―Yes‖ and 0 for ―No‖. There should be clear guidelines for coders
(individual who do the coding) so that code is consistent. However, some studies will employ multiple
coders working independently on the same data. This minimizes the chance of errors from coding and
increases the reliability of data.
Quantitative approach. For quantitative analysis, data are coded usually into measured and
recorded as nominal (e.g. ―female‖ = 1; ―male‖ = 0) or ordinal (e.g. ―most‖ = 2; ―moderate‖ = 1;
―least‖ = 0) variables. Questionnaire data can be pre-coded (process of assigning codes to
expected answers on designed questionnaire), field-coded (process of assigning codes as soon as
data are available, usually during fieldwork), post-coded (coding of open questions on completed
questionnaires) or office-coded (done after fieldwork). Note that some of the above are not

BU-CANR-SRWM/2012/2020
Research Method – Lecture Note By Ademe T. (MSc. In Soil Science) 116
mutually exclusive. In social sciences, spread sheets, such as Excel and more advanced software
packages, such as SPSS (Statistical Package for Social Studies) are often used for data coding.
Qualitative approach. For disciplines in which a qualitative format is preferential, including
ethnography, humanistic geography or phenomenological psychology a varied approach to coding
can be applied. For example, Iain Hay (2005) outlines a two-step process beginning with basic
coding in order to distinguish overall themes, followed by a more in depth, interpretive code in
which more specific trends and patterns can be interpreted. The process can be done manually,
which can be as simple as highlighting different concepts with different colours, or fed into a
software package.
Mixed methods. For those interested in mixed methods and both qualitative and quantitative
analysis, the RQDA package within R (programming language) is a potential resource. Operating
its own Graphical User Interface (GUI) in a separate window from R, RQDA can be used to
perform character level coding. Through traditional R commands, some of this data can be
analyzed using quantitative tools.
Data Entry: is the act of transcribing some form of information into another medium, usually through
input into a computer program. Forms of data that people might transcribe include handwritten
documents, information spread sheets, and sequences of numbers, as well as computer code and even
names and addresses. Some careers are exclusively involved in data entry, while certain workers, like
programmers, might have to occasionally enter data while performing other tasks.
4.4. Analysis of Survey Data
Once the survey data are entered into the computer, you can use spread sheets, such as excel or various
advanced statistical software packages, such as SPSS, R, SYSTAT, MATLAB, SAS, STATISTICA, etc.
to analyze the data and interpret the results. For example, you can develop a regression model from
quantitative data to quantify how the independent variable affects the dependent variable. However, the
appropriate analysis method will depend on the type of the data and the skill of the researcher.