College Choice: Psychological Factors Influencing ...
273
Louisiana State University LSU Digital Commons LSU Historical Dissertations and eses Graduate School 1999 College Choice: Psychological Factors Influencing *Postsecondary Aspirations and Expectations of Ninth-Grade Students. Stuart Earle Johnson Louisiana State University and Agricultural & Mechanical College Follow this and additional works at: hps://digitalcommons.lsu.edu/gradschool_disstheses is Dissertation is brought to you for free and open access by the Graduate School at LSU Digital Commons. It has been accepted for inclusion in LSU Historical Dissertations and eses by an authorized administrator of LSU Digital Commons. For more information, please contact [email protected]. Recommended Citation Johnson, Stuart Earle, "College Choice: Psychological Factors Influencing *Postsecondary Aspirations and Expectations of Ninth- Grade Students." (1999). LSU Historical Dissertations and eses. 7096. hps://digitalcommons.lsu.edu/gradschool_disstheses/7096
Transcript of College Choice: Psychological Factors Influencing ...

Louisiana State UniversityLSU Digital Commons
LSU Historical Dissertations and Theses Graduate School
1999
College Choice: Psychological Factors Influencing*Postsecondary Aspirations and Expectations ofNinth-Grade Students.Stuart Earle JohnsonLouisiana State University and Agricultural & Mechanical College
Follow this and additional works at: https://digitalcommons.lsu.edu/gradschool_disstheses
This Dissertation is brought to you for free and open access by the Graduate School at LSU Digital Commons. It has been accepted for inclusion inLSU Historical Dissertations and Theses by an authorized administrator of LSU Digital Commons. For more information, please [email protected].
Recommended CitationJohnson, Stuart Earle, "College Choice: Psychological Factors Influencing *Postsecondary Aspirations and Expectations of Ninth-Grade Students." (1999). LSU Historical Dissertations and Theses. 7096.https://digitalcommons.lsu.edu/gradschool_disstheses/7096

INFORMATION TO USERS
This manuscript has been reproduced from the microfilm master. UMI films the text directly from the original or copy submitted. Thus, som e thesis and dissertation copies are in typewriter face, while others may be from any type of computer printer.
The quality of th is reproduction is dependent upon th e quality of the copy subm itted. Broken or indistinct print, colored or poor quality illustrations and photographs, print bieedthrough, substandard margins, and improper alignment can adversely affect reproduction.
In the unlikely event that the author did not send UMI a complete manuscript and there are missing pages, these will be noted. Also, if unauthorized copyright material had to be removed, a note will indicate the deletion.
Oversize materials (e.g., maps, drawings, charts) are reproduced by sectioning the original, beginning at the upper left-hand comer and continuing from left to right in equal sections with small overlaps.
Photographs included in the original manuscript have been reproduced xerographically in this copy. Higher quality 6” x 9” black and white photographic prints are available for any photographs or illustrations appearing in this copy for an additional charge. Contact UMI directly to order.
Bell & Howell Information and Learning 300 North Zeeb Road, Ann Arbor, Ml 48106-1346 USA
800-521-0600
Reproduced with permission of the copyright owner. Further reproduction prohibited without permission.

Reproduced with permission of the copyright owner. Further reproduction prohibited without permission.

COLLEGE CHOICE:PSYCHOLOGICAL FACTORS INFLUENCING POSTSECONDARY
ASPIRATIONS AND EXPECTATIONS OF NINTH-GRADE STUDENTS
A Dissertation
Submitted to the Graduate Faculty of the Louisiana State University and
Agricultural and Mechanical College in partial fulfillment o f the
requirements for the degree of Doctor o f Philosophy
in
The Department o f Educational Leadership, Research and Counseling
byStuart Earle Johnson
B.A., University o f California at Santa Barbara, 1975 M.B.A., Loyola University, New Orleans, 1978
December, 1999
Reproduced with permission of the copyright owner. Further reproduction prohibited without permission.

UMI Number 9960067
•%
___ _ ®
UMIUMI Microform 9960067
Copyright 2000 by Bell & Howell Information and Learning Company. All rights reserved. This microform edition is protected against
unauthorized copying under Title 17, United States Code.
Bell & Howell Information and Learning Company 300 North Zeeb Road
P.O. Box 1346 Ann Arbor, Ml 48106-1346
Reproduced with permission of the copyright owner. Further reproduction prohibited without permission.

ACKNOWLEDGMENTS
When I began working on this dissertation many veterans o f the process warned
that I would experience many emotional peaks and valleys. They did not exaggerate.
As new avenues of inquiry opened and inspirations o f thought dawned, I felt motivated
and excited. More often, as writing bogged down, analyses failed to support original
hypotheses or the drudgery o f endless trips to the library set in, the completion of this
document seemed to only be a distant dream. I often wondered i f the end result was
really worth all the work or whether I was toiling in vain. Fortunately, whenever I hit
low points a supportive network o f teachers, family, friends and co-workers seemed to
take hold and give me the encouragement necessary to continue. Although it is
impossible for me to acknowledge all who have shown me support, there are a special
few I wish to mention here.
First and foremost I thank my wife Sharon and my daughter Lauren. They
encouraged me with their love and support, and, in many ways, sacrificed more than I
did to see this dissertation completed. Without them, I would not have been successful
in achieving this dream.
My parents, Oliver and Carol Johnson, raised me in a household where
education was revered and gave me, along with my sisters, Julie, Elizabeth and
Melinda, the understanding that becoming an educated person is a distinction of
unequaled importance. Their modeling and encouragement helped me develop strong
personal beliefs o f academic self-efficacy which, if my research is accurate, helped
carry me through the dissertaion process. My love for them is not spoken often, but
always deeply felt.
ii
Reproduced with permission of the copyright owner. Further reproduction prohibited without permission.

Dr. Chad Ellett, chairman of my doctoral committee, has been not only a mentor
but also a friend. He inspires me with his intellect and astounds me with his generosity
and patience. When the completion o f this document was in doubt, Dr. Ellett and his
wife Bert took me into their home and provided me the support and environment needed
to finish.
I am also grateful to the other members o f my committee, Professors Brian
Bomstein, William Davis, Richard Fossey and Terry Geske. Their scrutiny and
scholarly contributions added a great deal to the quality o f this document. Also, my
fellow doctoral student John Rugutt provided invaluable assistance in the analysis o f the
data collected for this study.
The host o f friends and relatives who supported my efforts cannot all be
mentioned, but have been "families” to me. Sharon’s parents, sisters, brother’s-in-law,
nieces and nephews have been my immediate family in Louisiana, as my own parents
live in California and the rest o f my family is dispersed throughout the country. For
nineteen years I worked at the University o f Southwestern Louisiana (now the
University o f Louisiana at Lafayette). My colleagues in the Student Affairs area o f the
university were more than co-workers and friends, but also a family. Now I am part o f
the State Park’s family. While it may seem trite to refer to colleagues as family, those
who know the two individuals who head these entities, Raymond Blanco at U.L. and
Lieutenant Governor Kathleen Blanco at State Parks, know this not to be the case.
Their genuine care and support for those with whom they work, myself included,
transcends professional relationships to a unified feeling o f family.
iii
Reproduced with permission of the copyright owner. Further reproduction prohibited without permission.

TABLE OF CONTENTS
ACKNOWLEDGMENTS ................................................................................................ ii
LIST OF TABLES ........................................................................................................... vii
LIST OF FIGURES ......................................................................................................... xii
ABSTRACT ....................................................................................................................... xiii
CHAPTER 1: INTRODUCTION...................................................................................... 1Overview ................................................................................................................. 1Study Context ......................................................................................................... 1
Participation of Minority Groups in Higher Education ........................ 3Statement o f the Problem ...................................................................................... 6Theoretical Construct ............................................................................................ 8
Self-Efficacy .............................................................................................. 8Locus o f Control ...................................................................................... 12Distinction Between Constructs ............................................................ 15An Expanded College Choice Model ................................................... 16
Purpose ................................................................................................................. 22Significance of the Study .................................................................................... 23Research Hypotheses and Q uestions................................................................... 24
Research Hypotheses ............................................................................. 24Research Questions ................................................................................. 25
Definition o f T e rm s .............................................................................................. 30Self-Efficacy ............................................................................................ 30Locus of Control ...................................................................................... 31College A spirations................................................................................. 31College Expectations ............................................................................. 32Parental Encouragement ......................................................................... 32Parental Education Level ....................................................................... 33Academic Achievement ......................................................................... 33Academic Track ...................................................................................... 33Participation in Extracurricular Activities ........................................... 33
Limitations ........................................................................................................... 34Chapter Summary ................................................................................................ 34
CHAPTER 2: REVIEW OF RELATED LITERATURE AND RESEARCH ........... 35Introduction ........................................................................................................... 35Overview of the College Choice Process .......................................................... 35
College Choice M o d els ........................................................................... 36Phases of the College Choice Process ................................................. 38
iv
Reproduced with permission of the copyright owner. Further reproduction prohibited without permission.

Predictive Variables ............................................................................................ 40College Choice Process for Minority Groups .................................................... 59Psychological Factors .......................................................................................... 61
Self-Efficacy ............................................................................................ 61Locus of Control ...................................................................................... 69
Chapter Summary ................................................................................................ 75
CHAPTER 3: METHODOLOGY AND PROCEDURES ........................................... 76Research Design ................................................................................................... 76Target Population for the Study ......................................................................... 76Instrumentation and Measures ............................................................................ 79
Pilot Testing ............................................................................................. 79Internal-External Locus o f Control Scale ............................................. 81Children’s Self-Efficacy Scale ............................................................... 84National Education Longitudinal Study o f 1988 ................................. 86
Data Collection Procedures.................................................................................. 87Packaging and Distribution Procedures ................................................ 87Data Collection Time Lines ................................................................... 88
Data Analyses ....................................................................................................... 89Descriptive S tatistics................................................................................ 89Factor A nalyses........................................................................................ 90Reliability Analyses ................................................................................ 90Correlation A nalyses................................................................................ 91Regression Analyses ................................................................................ 91Partial Correlation Analyses ................................................................... 91
Supplemental Data Set ........................................................................................ 92
CHAPTER 4: SUMMARY OF RESULTS ................................................................... 94Summary o f Descriptive Statistics for Survey S a m p le ..................................... 94Summary o f Descriptive Statistics for Measurement Instrument Items . . . . 102Summary of Results of Factor A nalyses.......................................................... 106
Locus o f Control Factor Analyses ...................................................... 106Self-Efficacy Factor Analyses ............................................................. 113Summary o f Factor Analyses ............................................................... 118
Summary o f Results of Reliability Analyses .................................................. 118Locus o f Control Reliability Analyses ................................................ 120Academic Self-Efficacy Reliability A nalyses..................................... 120Reliability Analyses by Racial Subgroups ......................................... 120Reliability Analyses by S c h o o l............................................................. 121Rationale for Final Structure o f Measures ......................................... 121
Summary o f Analyses for Primary Research Hypotheses............................... 122Bivariate Correlation Analyses ............................................................. 122Regression Analyses .............................................................................. 128
v
Reproduced with permission of the copyright owner. Further reproduction prohibited without permission.

Summary o f Analyses for Supplemental Research Questions ...................... 131Summary o f Analyses o f Supplemental Data Set ........................................... 147
Factor A na ly ses...................................................................................... 148Reliability Analyses .............................................................................. 149Correlation A nalyses.............................................................................. 149Partial Correlation Analyses ................................................................. 150Student Interview s.................................................................................. 151
Structural Equation Model A nalyses................................................................. 151
CHAPTER 5: CONCLUSIONS, DISCUSSION, IMPLICATIONS ........................ 153Overview o f the Study ...................................................................................... 153Major Findings and Conclusions ..................................................................... 159
Major Finding Number One ................................................................. 160Major Finding Number Two ................................................................. 160Major Finding Number T h re e ............................................................... 161Major Finding Number F o u r ................................................................. 161Major Finding Number Five ................................................................. 161Major Finding Number S i x ................................................................... 162Major Finding Number Seven ............................................................. 162
Discussion and Implications of Major Findings .............................................. 162Theoretical Implications ........................................................................ 163Implications for Future Research ......................................................... 171Practical Implications ............................................................................ 179
Chapter Summary ............................................................................................... 184Dissertation S um m ary ........................................................................................ 184
REFERENCES ................................................................................................................ 186
APPENDIX A: INSTRUMENT SET AND COVER L ET TE R S............................... 201
APPENDIX B: SUMMARY OF DESCRIPTIVE STATISTICS ............................. 211
APPENDIX C: SUPPLEMENTAL FACTOR STRUCTURES FOR LOCUS OFCONTROL AND ACADEMIC SELF-EFFICACY MEASURES .......................... 222
APPENDIX D: ITEM LOCATION INDEX FOR FACTORED SUBSCALES FORLOCUS OF CONTROL AND ACADEMIC SELF-EFFICACY M EASURES 242
APPENDIX E: RELIABILITY ANALYSES BY RACIAL SUBGROUPS ........... 245
APPENDIX F: SUMMARY OF DATA ANALYSES PERFORMEDUSING LOUISIANA DATA SET ................................................................... 249
VITA .................................................................................................................................. 254
vi
Reproduced with permission of the copyright owner. Further reproduction prohibited without permission.

LIST OF TABLES
3.1 Profile o f Population by School and Race .......................................................... 78
4.1 Profile o f Sample by Personal Characteristics o f Respondents ....................... 96
4.2 Profile o f Sample by Race, Age, Gender and Socioeconomic S ta tu s .............. 99
4.3 Summary o f Item Means for All Continuous, Rank and CategoricalMeasures and Subscales by Race ..................................................................... 104
4.4 Summary o f Item Standard Deviations for All Continuous, Rank andCategorical Measures and Subscales by Race ................................................ 105
4.5 Summary o f the Factor Structure Coefficients for Items Retained for the One-Factor Solution for the Internal-External Locus o fControl S c a le ....................................................................................................... 107
4.6 Summary o f the Rotated Factor Structure Coefficients for Items Retained for the Four-Factor Orthogonal Solution for the Internal-External Locus o f Control Scale ...................................................................................... 109
4.7 Summary o f the Factor Structure Coefficients for Items Retained for the One-Factor Solution for the Self-EfficacyScale .................................................................................................................... 114
4.8 Summary o f the Rotated Factor Structure Coefficients for Items Retained for the Four-Factor Orthogonal Solution for theSelf-Efficacy Scale ............................................................................................ 116
4.9 Summary o f Standardized Cronbach Alpha Reliability Coefficientsfor Locus o f Control and Academic Self-Efficacy Subscales........................ 119
4.10 Summary o f Intercorrelations of College Aspirations and College Expectations with Other Study Variables ........................................................ 123
4.11 Summary o f Intercorrelations of Academic Self-Efficacy Subscaleswith Other Study V ariab les................................................................................ 124
4.12 Summary o f Intercorrelations of Locus o f Control Subscales with OtherStudy Variables ................................................................................................... 125
vii
Reproduced with permission of the copyright owner. Further reproduction prohibited without permission.

4.13 Summary o f Intercorrelations o f the Traditional Variables of CollegeChoice ................................................................................................................. 126
4.14 Stepwise Regression of College Aspirations Against the Traditional Variables o f College Choice and Locus o f Control and Academic Self-Efficacy Subscales...................................................................................... 130
4.15 Stepwise Regression of College Expectations Against the Traditional Variables o f College Choice and Locus o f Control and Academic Self-Efficacy Subscales...................................................................................... 132
4.16 Partial Correlations Between the Global Academic Achievement Index and College Aspirations, Controlling for the Effects of the Academic Self-Efficacy Measures ...................................................................................... 134
4.17 Partial Correlations Between the Global Academic Achievement Index and College Expectations, Controlling for the Effects o f the Academic Self-Efficacy M easures...................................................................................... 135
4.18 Partial Correlations Between the Global Academic Achievement Index and College Aspirations, Controlling for the Effects o f the Locus ofControl Measures .............................................................................................. 137
4.19 Partial Correlations Between the Global Academic Achievement Index and College Expectations, Controlling for the Effects of the Locus ofControl Measures .............................................................................................. 139
4.20 Summary o f Intercorrelations Among the Independent Variables andCollege Aspirations and College Expectations, African American Subsample ........................................................................................................... 140
4.21 Summary o f Intercorrelations Among the Independent Variables andCollege Aspirations and College Expectations, Hispanic Subsample ......... 141
4.22 Summary o f Intercorrelations Among the Independent Variables andCollege Aspirations and College Expectations, White Subsample ............. 142
4.23 Summary o f Intercorrelation Coefficients for Items on the AcademicSelf-Efficacy Scale ............................................................................................ 146
A.l Instrument Set Administered to all Student Samples ..................................... 202
Reproduced with permission of the copyright owner. Further reproduction prohibited without permission.

A.2 Instruction Letter to Teachers ............................................................................. 208
A.3 Parental Consent Form ........................................................................................ 209
B. 1 Summary o f Descriptive Statistics for Each Item for the AcademicSelf-Efficacy Scale ............................................................................................ 212
B.2 Summary o f Frequency Distributions of Internal-External Locus ofControl S c a le ....................................................................................................... 213
B.3 Summary o f Descriptive Statistics for Academic A chievem ent.................... 215
B.4 Summary o f Descriptive Statistics for College Aspirations .......................... 216
B.5 Summary o f Descriptive Statistics for College Expectations ........................ 217
B.6 Summary o f Frequency Distributions for Parental Expectations.................... 218
B.7 Summary o f Frequency Distributions for Parents’ Level o f Education . . . . 219
B.8 Summary o f Frequency Distributions for Participation inExtracurricular Activities ................................................................................. 220
B.9 Summary o f Frequency Distributions for High School AcademicTrack .................................................................................................................... 221
C. 1 Summary o f the Rotated Factor Structure Coefficients for ItemsRetained for the Three-Factor Orthogonal Solution for the Internal-External Locus of Control Scale ...................................................................................... 223
C.2 Summary o f the Rotated Factor Structure Coefficients for ItemsRetained for the Five-Factor Orthogonal Solution for the Internal-External Locus o f Control Scale ...................................................................................... 225
C.3 Summary o f the Rotated Factor Structure Coefficients for ItemsRetained for the Four-Factor Orthogonal Solution for the Internal-External Locus o f Control Scale, African American Sub-Sample .............................. 227
C.4 Summary o f the Rotated Factor Structure Coefficients for ItemsRetained for the Four-Factor Orthogonal Solution for the Internal-External Locus o f Control Scale, Hispanic Sub-Sam ple................................................ 229
ix
Reproduced with permission of the copyright owner. Further reproduction prohibited without permission.

C.5 Summary o f the Rotated Factor Structure Coefficient for ItemsRetained for the Four-Factor Orthogonal Solution for the Internal-External Locus o f Control Scale, White Sub-Sample .................................................... 231
C.6 Summary of the Rotated Factor Structure Coefficient for ItemsRetained for the Four-Factor Orthogonal Solution for the Internal-External Locus o f Control Scale, Male Sub-Sam ple...................................................... 233
C.7 Summary of the Rotated Factor Structure Coefficient for ItemsRetained for the Four-Factor Orthogonal Solution for the Internal-External Locus o f Control Scale, Female Sub-Sample .................................................. 235
C.8 Summary o f the Rotated Factor Structure Coefficients for ItemsRetained for the Four-Factor Orthogonal Solution for the Self-Efficacy Scale, African American Subsample ............................................................... 237
C.9 Summary o f the Rotated Factor Structure Coefficients for ItemsRetained for the Four-Factor Orthogonal Solution for the Self-Efficacy Scale, Hispanic Subsample ................................................................................ 238
C. 10 Summary of the Rotated Factor Structure Coefficients for ItemsRetained for the Four-Factor Orthogonal Solution for the Self-Efficacy Scale, White Subsample .................................................................................... 239
C. 11 Summary of the Rotated Factor Structure Coefficients for ItemsRetained for the Four-Factor Orthogonal Solution for the Self-Efficacy Scale, Male Subsample ...................................................................................... 240
C. 12 Summary o f the Rotated Factor Structure Coefficients for ItemsRetained for the Four-Factor Orthogonal Solution for the Self-Efficacy Scale, Female Subsample .................................................................................. 241
D. 1 Item Location Index for Factor Subscales of the Internal-ExternalLocus o f Control Scale ...................................................................................... 243
D.2 Item Location Index for Factor Subscales o f the Academic Self-EfficacyScale ..................................................................................................................... 244
E. 1 Summary o f Standardized Cronbach Alpha Reliability Coefficients forLocus o f Control and Academic Self-Efficacy Subscales,African American Subsample ........................................................................... 246
x
Reproduced with permission of the copyright owner. Further reproduction prohibited without permission.

E.2 Summary o f Standardized Cronbach Alpha Reliability Coefficients for Locus o f Control and Academic Self-Efficacy Subscales,Hispanic Subsample ........................................................................................... 247
E.3 Summary o f Standardized Cronbach Alpha Reliability Coefficients for Locus o f Control and Academic Self-Efficacy Subscales,White Subsample ............................................................................................... 248
F. 1 Summary o f the Rotated Factor Structure Coefficients for ItemsRetained for the Five-Factor Orthogonal Solution for the Internal-External Locus o f Control Scale, Louisiana Data Set .................................................... 250
F.2 Summary o f the Rotated Factor Structure Coefficients for ItemsRetained for the Two-Factor Orthogonal Solution for the Self-Efficacy Scale, Louisiana Data Set .................................................................................. 252
F.3 Summary o f Intercorrelations o f College Aspirations and CollegeExpectations with Other Study Variables, Louisiana Data S e t ...................... 253
xi
Reproduced with permission of the copyright owner. Further reproduction prohibited without permission.

LIST OF FIGURES
1. Alwin and Otto’s Sociological Model o f College Choice ............................... 17
2. Hossler and Stage’s Combined College Choice Model ................................... 18
3. Expanded College Choice Model with Psychological Factors ......................... 19
Reproduced with permission of the copyright owner. Further reproduction prohibited without permission.

ABSTRACT
The purpose o f this study was to explore relationships between several variables
which help to explain the process by which adolescents decide to pursue a college
education. Previous models were enhanced by including important theoretical
constructs well documented in social cognitive and attributional theories as elements of
human agency. The psychological constructs, self-efficacy and locus o f control were
the primary focus o f attention as independent variables and for their significance as
mediating variables affecting the relationship between previously identified factors
attributed to students’ postsecondary attendance decisions, and students’ college
aspirations and expectations. Particular attention was given to the college choice
process for members o f minority groups, as previous research has not adequately
identified the variables which motivate these individuals to pursue a college education.
The study also explored the conceptualization o f self-efficacy to provide a better
understanding o f the construct’s generalizing nature and to discern the relationship
between the capabilities and the persistence notions o f the construct.
The study sample consisted of 1076 ninth-grade students attending public high
schools in the Miami-Dade County Public Schools. Parts o f three measures were used
for data collection: the Internal External Locus o f Control Scale (Rotter, 1966), the
academic sections o f the Children’s Self-Efficacv Scale. (Bandura, 1989), and the
National Education Longitudinal Study of 1988 (U.S. Department o f Education, 1992).
Major findings o f the study showed that: a) locus o f control is not a significant
factor in the college choice process although low reliability in the data made this finding
xiii
Reproduced with permission of the copyright owner. Further reproduction prohibited without permission.

inconclusive; b) there is evidence that academic self-efficacy is both directly related to
college aspirations and expectations and mediates the linkages between academic
achievement and aspirations and expectations; c) the models o f college choice are
different for members o f minority groups than for White students; d) to some extent an
individual’s self-efficacy can be generalized both across academic domains and within
academic domains; and e) self-efficacy beliefs about capabilities to execute academic
behaviors and beliefs about academic task persistence can be independently measured
and are moderately related within self-efficacy theory.
xiv
Reproduced with permission of the copyright owner. Further reproduction prohibited without permission.

CHAPTER 1: INTRODUCTION
Overview
This study explores relationships between several variables which help to
explain the process by which adolescents decide to pursue a college education.
Specifically, psychological factors are examined for their significance in this aspect o f
the college choice process, adding to existing models which have typically focused only
on sociological or economic variables. For this study, the constructs o f self-efficacy
and locus o f control are the primary focus o f attention as independent variables. These
constructs also are examined for their significance as mediating variables associated
with the relationship between previously identified factors attributed to students’
postsecondary attendance decisions, and students’ college aspirations and expectations.
Particular attention is given to the college choice process for members o f minority
groups, as previous research has not adequately identified the variables which motivate
these individuals to pursue a college education. Chapter 1 provides a discussion o f the
rationale and background for the study followed by the statement of the problem, an
examination of the conceptual framework guiding the inquiry and a delineation o f study
variables. Primary research hypotheses, as well as supplemental research questions, are
also included.
Study Context
Previous research on the college choice process is generally categorized into one
o f three approaches: the econometrics approach, the sociological approach or the
combined approach (Hossler et al., 1989). Researchers using the econometrics
1
Reproduced with permission of the copyright owner. Further reproduction prohibited without permission.

2
approach typically endeavor to explain the decision process in terms o f personal
economic advantages which accrue to the student through college attendance. The
student, it is argued, attends based on the best return on their investment relative to the
best non-college alternatives (Bishop, 1977; Fuller et al., 1982; Kohn et al., 1976; Nolfi,
1978; Manski and Wise, 1983; Geske, 1990). Proponents o f the sociological approach
typically examine college attendance as part of a status attainment process for the
individual. The prestige which a student expects from postsecondary attendance and
how prestige translates into employment upon graduation are studied in relation to the
decision to enroll (Blau and Duncan, 1967; Sewell and Shah, 1978; Sewell and Hauser,
1975; Alwin and Otto, 1977). Researchers using the combined approach integrate the
other two approaches, examining the decision process from a sequential perspective.
Students’ decisions to attend college evolve over a period o f time often as long as four
or five years, thus necessitating a longitudinal analysis of the factors involved in the
choice process (Hossler et al., 1989; Stage and Hossler, 1989; Hossler and Gallegher,
1987).
These approaches have contributed greatly to our understanding o f differences
between individuals who decide to attend or not to attend college; however, they do not
adequately explain the process for all members of society. The variables found to be
most significantly correlated with college attendance for White middle-class individuals
are not as closely related to postsecondary decision making for African Americans and
Hispanics (Bateman and Hossler, 1996; Portes and Wilson, 1976; Kerckhoff and
Campbell, 1977). For members o f these groups, and for many White adolescents as
Reproduced with permission of the copyright owner. Further reproduction prohibited without permission.

3
well, additional information is needed to more fully understand the college choice
process.
Participation o f Minority Groups in Higher Education
Higher education in the United States has been touted as the best in the world,
the most accessible, the most diverse and o f the highest quality. Henry Rosovsky, while
serving as the Dean o f the Faculty o f Arts and Sciences at Harvard University, observed
that “fully two thirds to three quarters o f the best universities in the world are located in
the United States.” (1990, p.29)
While many might take exception to the quality claim, certainly access and
diversity are attributes unequaled by other nations. According to the Census Bureau, in
1994, 45.2% o f the adults in this country had attended or were attending college (1994).
There are 4,096 institutions o f higher education in this country, ranging from small
liberal arts colleges to massive multiversities, from junior colleges focused on teaching
to Research One, Doctoral granting institutions (Chronicle of Higher Education, 1999).
Higher education in the United States is, on the surface, very accessible and diverse.
Our colleges and universities may not be as diverse as we think, however; and for some
members o f minority groups, access to higher education may not be readily available.
When studying the participation o f minority groups in higher education,
enrollment trends give mixed information. Data show that of the 14,305,658 college
students attending in 1994, 74.14% were White, 9.86% were African American, 6.91%
were Hispanic, 5.06% were Asian American and .85% were Native American (National
Center for Educational Statistics, 1994). Since corresponding census figures for 1990
Reproduced with permission of the copyright owner. Further reproduction prohibited without permission.

4
list Whites as comprising 80.3% o f the nation’s population, African Americans 12.1%,
Hispanics 9%, Asian Americans 2.9% and Native Americans .8%, equal access varies
by group (Bureau o f the Census, 1994). Asian Americans comprise a greater portion of
those attending than their corresponding percentage of the population, while Whites,
African Americans and Hispanics comprise less. Further, during the past decade,
minority groups have experienced increases in their relative participation. A decade
earlier in 1984, 80.22% of all college students were White, 8.79% were African
American, 4.37% were Hispanic, 3.19% were Asian American and .69% were Native
American (Chronicle o f Higher Education, 1995). In the ten year period between 1984
and 1994, all groups other than Whites increased in their relative participation.
For policy makers concerned with the participation of minority groups in higher
education, these figures are encouraging. Although enrollment figures for African
Americans and Hispanics fall short o f national demographics, these two groups are
increasing their relative numbers. These data, however, still do not give a complete
picture o f access to college. Within the general categories discussed, subgroups exist
which are not participating at representative rates, and, in some cases, are losing ground.
One such subgroup is African American males.
In 1976, African American males made up 4.4% of the college population, but in
1988 their numbers had fallen to 3.5%. In the decade of the 1990's, the participation of
African American males has slightly increased to 3.8%, but this subgroup is clearly still
under-represented in relation to their total population (National Center for Educational
Statistics, 1994).
Reproduced with permission of the copyright owner. Further reproduction prohibited without permission.
5
Lost talent is a term first introduced by Hanson (1994) to characterize students
whose educational attainment falls short o f their expectations or aspirations. According
to Hanson, this occurs when students who demonstrate signs o f initial talent, have
educational expectations which are less than those to which they aspire, have reduced
expectations over time, or are unable to achieve their initial expectations. Batemen and
Kennedy (1997) identify African American males as the population which may most
illustrate the concept o f lost talent. Research indicates that African American males
differ little from White males in their aspirations to attend college (Hauser and
Anderson, 1991). Yet, when attendance figures are studied, it is clear that this
population does not attend college with the same frequency as their White counterparts.
For many in this group, aspirations remain unfulfilled.
Mickelson (1990) provides an insight into the lack o f fulfillment o f college
aspirations for members o f minority groups with her discussion o f the dichotomy
between the abstract and concrete attitudes which many o f these individuals may have
toward education. From the abstract perspective, education has been historically viewed
as a means o f self-improvement. Thus, past oppression, poverty, and social exclusion
can be overcome by educational attainment. From the more concrete perspective,
minorities have experienced the realities o f racial prejudice, either personally or
vicariously, which negate the premise that education is the panacea for social injustices.
When members o f these groups become educated and still face oppression and
exclusion, the value o f a college education becomes somewhat diminished. Because o f
the abstract views, many members o f minority groups aspire to attend college; however,
the concrete realities may act as a deterrent to actual matriculation.
Reproduced with permission of the copyright owner. Further reproduction prohibited without permission.

6
Statement o f the Problem
The problem addressed by this study was three-fold. First, as previously stated,
existing models which have been developed to explain factors which influence youths to
pursue a college education have typically focused on economic and sociological aspects
of the college choice process. Variables such as parental encouragement, parental
education level, student’s academic achievement, high school academic track and
participation in extracurricular activities (Hossler et al., 1989; Paulsen, 1990) have all
been identified by previous research as being correlated with aspirations and
expectations o f adolescents to attend college. A relationship exists between these
variables and students’ desires to attain a postsecondary education, but existing research
has not demonstrated how these factors actually influence the individual in the decision
making process. In what ways are students’ psyches effected that result in students
being motivated to want to attend college? We have yet to fully understand the
cognitive and affective processes which students undergo when considering
postsecondary school attendance. More particularly, there have been no known studies
that examined the relationship o f theory-based psychological variable such as self-
efficacy and locus o f control with student aspirations and expectations to attend college.
Thus, there was a need to identify and study student personal/psychological variables to
develop a more comprehensive theory of the college choice process.
As previously stated, a second problem with existing models explaining college
choice is that they are not sufficient to explain this complex process for minority youth.
Research has identified the five variables listed above as being significantly correlated
Reproduced with permission of the copyright owner. Further reproduction prohibited without permission.

7
with higher education aspirations and expectations of White adolescents. However,
these factors do not correlated as strongly when members o f minority groups are studied
(Hossler and Maple, 1992; Batemen and Hossler, 1996). There is, then, a paucity o f
information about the college choice process for minorities. There was not adequate
information describing the factors which influence members o f these groups to pursue a
postsecondary education.
A third problem was the conceptual gaps in our understanding o f the self-
efficacy construct. Early conceptual discussions o f self-efficacy held the construct to be
completely situation or task specific with little possibility o f competency beliefs
crossing from one domain to the next or occurring at a general level (Bandura, 1977).
More recent research, however, has begun to recognize situations where self-efficacy
does generalize across behavior domains (Pajares, 1996). As will be discussed later,
Bandura (1997) now recognizes processes through which mastery experiences can
produce some degree o f generality in personal efficacy. Further, two sub-constructs o f
self-efficacy have been identified in the literature surrounding the construct, one
addressing specific capabilities and the other addressing persistency (Bandura, 1982).
Capabilities are an individual’s judgment about one’s ability to execute courses o f
action required to deal with specific situations, while persistence involves the length o f
time an individual will continue in performing a specific behavior when faced with
aversive experiences (Bandura, and Schunk, 1981). There was a need, then, to further
explore the conceptualization of self-efficacy to better understand the generalizing
nature of the construct and to discern the relationship between the construct’s
capabilities and the persistence notions.
Reproduced with permission of the copyright owner. Further reproduction prohibited without permission.

8
Theoretical Constructs
Although no study had yet been conducted examining the relationship between
self-efficacy and locus o f control, and college aspirations and expectations, research has
closely linked self-efficacy and locus o f control to academic achievement (Thomas et
al., 1987; Wilhite, 1990; Lent et al., 1986; Mickelson, 1990; Pajares, 1996). Academic
achievement, in turn, has been found to be a correlate o f college aspirations and
expectations (Manski and Wise, 1983; Peters, 1977; Jackson, 1978; Yang, 1981;
Carpenter and Fleishman, 1987; Tuttle, 1981; Hossler and Stage, 1992). This strongly
suggests that relationships exists between self-efficacy and locus o f control, and
postsecondary aspirations and expectations. An elaboration o f the rationale behind
these relationships follows in the discussion o f self-efficacy and locus o f control as
major theoretical constructs framing this study.
Self-Efficacv
Self-efficacy is defined as individual’s judgment o f how well one can execute
courses o f action required to deal with prospective situations (Bandura, 1997). It is a
self-system which serves a regulatory function for behavior by providing individuals
with the ability to alter their environments and influence their own courses o f action
(Pajares, 1996). Theoretically, self-efficacy is a primary mediator o f behavior and
behavioral change, determining whether a given behavior will be initiated, the amount
o f effort to be expended, and how long a behavior will be maintained. Low self-
efficacy regarding a specific task or behavior often will lead to avoidance of the task or
behavior, while high self-efficacy will usually lead to increases in the frequency a task
Reproduced with permission of the copyright owner. Further reproduction prohibited without permission.

9
or behavior is attempted (Bandura, 1977). By undertaking activities and selecting
situations we judge to be within our capabilities to successfully complete and avoiding
those where we expect failure, we make life decisions according to our perceived self-
efficacy (Bandura, 1993). Conceptually, the strong interaction between behavior and
life plans, and self-efficacy would lead one to expect that students’ decisions to attend
college would be significantly affected by their beliefs in their abilities to succeed
academically. Thus, the greater an individual’s efficacy for college success, the greater
the likelihood one would aspire to attend.
Some empirical evidence also suggests a connection between self-efficacy and
the college choice process. The larger career decision process, for instance, has been
positively correlated with self-efficacy (Betz and Hackett, 1981; Taylor and Betz, 1983;
Lent et al., 1986; Brooks, 1990). If college attendance is considered a career decision,
then this research gives strong support to the argument that self-efficacy and the choice
process are related. This study, therefore, analyzed self-efficacy as an independent
variable in the college choice process. This study also analyzed self-efficacy as a
mediating variable influencing the relationships between variables identified by
previous research as being related to postsecondary attendance decisions (i.e. academic
achievement, parental expectations, parent’s level of education, participation in
extracurricular activities and high school track), and college aspiration and expectations.
Bandura (1997) has identified four main sources o f information which are the
basis for the development o f personal efficacy: enactive mastery experiences, vicarious
experiences, verbal persuasion, and physiological and affective states. Enactive mastery
Reproduced with permission of the copyright owner. Further reproduction prohibited without permission.

10
experiences are an individual’s own experiences of performing a task or behavior, with
success or failure contributing to one’s expectation for future outcomes. Vicarious
experiences are an individual’s exposure to others’ modeling the performance o f a task
or behavior, which impacts the individual’s belief in personal abilities to duplicate the
performance. Verbal persuasion is the feedback given by others regarding an
individual’s ability to perform a task or behavior. Physiological and affective states
represent somatic information associated with performance outcomes that serves to
enhance the strength of efficacy beliefs. Increased emotional arousal can also lead to
stress that is detrimental to performance accomplishments.
How, then, do these sources o f information for developing efficacy relate to the
other independent variables in the college choice process? High school achievement,
academic track and participation in extracurricular activities, three o f the previously
identified factors associated with college aspirations and expectations, are performance
accomplishments which one would expect to effect students’ perceptions o f their ability
to succeed in performing college work. Parental education levels, another factor
associated with college choice, serve as modeling resources for students, and can be
viewed as important sources o f vicarious experience. Parental encouragement, the fifth
factor identified with college aspirations and expectations, serves as a clear example of
verbal persuasion for the student to achieve in college. Thus, these five factors appear
to manifest sources o f information which can foster the development o f self-efficacy in
students. The most significant factors contributing to a student’s decision to pursue a
college education are also likely to be closely associated with the development o f
Reproduced with permission of the copyright owner. Further reproduction prohibited without permission.

11
self-efficacy. From this information one can posit that the existence and enactment o f
the five traditional variables are associated with an individual’s efficacy beliefs about
college success, which in turn is associated with the desire to attend college.
Generalized Self-Efficacv
An additional area o f inquiry for this study regarding the construct self-efficacy
was the examination o f the potential generalization o f the variable across performance
domains and from specific to more general academic tasks. Initially Bandura
conceptualized the construct as task and situation specific. Thus, an individual makes a
judgement about effort and personal ability in reference to some closely defined goal
(Bandura, 1986). But does self-efficacy also have a generalized nature as well?
Recently Bandura (1997) has acknowledged the existence of generality o f efficacy
beliefs. “Efficacy beliefs are structured by experience and reflective thought rather than
being simply a disjoined collection o f highly specific self-beliefs.” (p. 51) He indicates
that the development and utilization o f an individual’s capabilities would be severely
hampered i f feelings o f efficacy could not be transferred across activities or settings.
Adaptability would become impossible i f people had to establish their sense o f efficacy
with each new endeavor. Bandura recognizes five processes through which mastery
experiences can produce some degree o f generality in personal efficacy: when similar
subskills are present, when competencies co-develop, when self-regulatory or coping
skills are involved, when commonalities are cognitively structured across domains and
when powerful performance attainments result in transforming experiences (these
processes are further discussed in Chapter 2).
Reproduced with permission of the copyright owner. Further reproduction prohibited without permission.
12
For the purposes of this study the first process, similar subskills, was the basis
for the examination of the generalization o f efficacy. Students’ efficacy in different
academic disciplines and at different levels o f specificity within disciplines was
examined to ascertain if efficacious beliefs generalize across domains. More
specifically, does an individual’s efficacy in a variety of different academic subjects
have an additive property where the summation o f different efficacies results in an
overall, generalized academic self-efficacy? Further, is there a correlation between the
very specific efficacy an individual has in a particular academic subject with more
general notions o f efficacy held by the individual? For example, within the context of
mathematics, does one’s efficacy for solving a particular algebra problem generalize to
one’s self-efficacy to do algebra and then to one’s self-efficacy to do other kinds o f
mathematics?
Locus o f Control
Locus o f control is defined as the extent o f one’s belief that personal behavior is
caused by internal or external factors. Internal control or intemality refers to an
individual’s belief that events are contingent on one’s own behavior or ability. External
control or externality refers to the belief that events are caused by factors beyond an
individual’s control. (Rotter, 1966)
For years scholars have been concerned with the apparent paradox between the
aspirations o f members of minority groups to become better educated and the academic
achievement o f the groups (Mickelson, 1990). On the one hand, education has
traditionally been viewed as a means to overcome the past effects o f poverty and
Reproduced with permission of the copyright owner. Further reproduction prohibited without permission.

13
oppression; and on the other, many minorities have not translated the desire for
education into corresponding levels o f school achievement (Coleman et al., 1966; Ogbu,
1978; Patchen, 1982; Crichlow, 1986; Sleeter and Grant, 1987). As previously noted,
Mickelson (1990) explains this paradox as being the result o f the dichotomy between
abstract and concrete attitudes which many members o f these groups have toward
education.
In industrial societies, value systems frequently are multilayered, containing
both dominant and subordinate beliefs (Parkin, 1976). Most individuals hold duel
systems, one which reflects society’s abstract norms and another which is based on the
everyday experiences o f their lives. For individuals in a subordinate position in society
(i.e. lower social-class or minority groups) the interaction of these duel systems often
results in a value stretch as conflicting values compete with one another (Rodman,
1963: Dillingham, 1980). Abstract beliefs typically reflect the dominant ideology o f
society while concrete beliefs are the product o f an individual’s own reality (Mickelson,
1990).
In terms o f attitudes toward the value o f education, abstract beliefs usually
reflect the American Dream concept that education provides opportunity. As such,
education fosters social mobility and can be viewed as a remedy for poverty,
unemployment and past oppression (Mickelson, 1990). These beliefs mirror a
traditional view o f our society, and reflect an ideology that hard work and perseverance
will ultimately result in success.
Reproduced with permission of the copyright owner. Further reproduction prohibited without permission.

14
Concrete attitudes toward education, on the other hand, are not grounded in
ideological beliefs or hopes for the future; they are the result o f personal or vicarious
experiences. For minorities, education has not always meant greater social mobility or
an escape from poverty, unemployment or oppression. Ogbu (1978) argues that a job
ceiling exists that excludes members of these groups from competing for jobs for which
they are qualified or being confined to the least desirable jobs. On the concrete level,
education may not be the panacea for all the inequities faced by members o f minority
groups.
The extent to which individuals believe in abstract o r concrete views o f
education largely determines how much effort they will put forth in school and,
therefore, the level of academic achievement they will experience (Mickelson, 1990). It
is from this perspective that an individual’s locus of control becomes important. An
individual’s orientation toward intemality or externality will largely determine the
extent to which one views education from either an abstract o r a concrete perspective.
Individuals with a strong internal locus o f control will tend to hold a personal view o f
being in control of their future and thus, be apt to believe educational achievement will
produce social and economic rewards. Conversely, people with an external locus o f
control will tend to see others as controlling their destiny, therefore increasing the
likelihood o f discounting the potential positive impact o f education (Mickelson, 1990).
For members o f minority groups involved in the college choice process, the
implications are readily apparent. One would expect that a strong relationship exists
between individuals’ beliefs in the value o f an education, their locus of control, and
Reproduced with permission of the copyright owner. Further reproduction prohibited without permission.

15
their aspirations to attend college. Those who have an internal locus o f control and
view education as a means to social mobility and personal success are likely to have
high aspirations and expectations to get a college education. Those who have an
external locus o f control and discount the benefits o f an education are likely to have
reduced aspirations and expectations.
Distinction Between Constructs
It is important to make clear the distinction between the constructs locus o f
control and self-efficacy, to avoid the appearance o f a tautology. The two constructs
have some commonality in that both deal with personal belief systems. Locus o f
control reflects beliefs about causal attributions for behavior. Self-efficacy reflects
beliefs about executing courses of action to accomplish performance outcomes.
Additionally, self-efficacy is assessed at a microanalytic level, while locus of control is
more global and deals with general self-perceptions (Pajares, 1996). Self-efficacy is
generally considered to be more situation and task specific than locus o f control. Thus,
an individual may be very efficacious about one endeavor, but have low self-efficacy
about another. A student may have strong efficacy beliefs about the capability to
successfully do mathematics, but very weak efficacy beliefs about ability to do English.
An individual's belief about internal or external factors o f control tend to be more
universal (Lefcourt, 1982). The control we feel over our own lives crosses over from
one situation or task to another.
The conceptual distinction between self-efficacy and locus of control has
recently been clarified by Bandura (1997). Beliefs that one can produce certain actions
Reproduced with permission of the copyright owner. Further reproduction prohibited without permission.

16
(perceived self-efficacy) are clearly distinct from beliefs about whether actions affect
outcomes (locus o f control). Bandura (1997) provides considerable empirical evidence
that perceived self-efficacy and locus of control have little or no relationship to one
another.
An Expanded College Choice Model
Figure 1 provides a diagram of Alwin and Otto’s (1977) sociological model
which recognizes academic and social influences as mediating other variables’
influences on aspirations. Hossler and Stage’s (1992) model, which emphasizes
parental and peer encouragement, ability and high school experiences, is presented in
Figure 2. Neither o f these models, however, accounts for possible influences o f
students’ personal/psychological factors. Therefore, the conceptual framework
presented in Figure 3 is an expanded model o f college choice.
In this expanded college choice model, the factors identified by previous
research - parental encouragement, parents’ level of education, academic achievement,
academic track and participation in extracurricular activities - are used as independent
variables along with the addition of potentially important personal/psychological
variables, self-efficacy and locus o f control. Combined, these factors are posited to be
closely correlated with the dependent variables, college aspirations and college
expectations. Self-efficacy and locus of control are also shown as mediating variables
linking the relationships o f the other five independent variables with college aspirations
and expectations. This suggests that the strength o f the relationships between variables
in the expanded college choice model increases when these two psychological variables
are considered.
Reproduced with permission of the copyright owner. Further reproduction prohibited without permission.

Sex
AcademicAbility
SchoolContext
SocioeconomicBackground
Figure 1Alwin and Otto’s Sociological Model of College Choice
AcademicCertification
Aspirations
SocialInfluences

Reproduced
with perm
ission of the
copyright ow
ner. Further
reproduction prohibited
without
permission.
DemographicCharacteristics
Socio Economic Variables
StudentPredisposition
Ability/ High School Experiences
Parental/PeerExpectations
andEncouragement
Figure 2Hossler and Stage’s Combined College Choice Model 00

Locus o f Control
Self-efficacy
AcademicAchievement
College Aspirations
College Expectation
Participation in Extracurricular
Activities
AcademicTrack
Parents’ Level o f Education
ParentalEncouragement
Figure 3Expanded College Choice Model with Psychological Factors

20
Thus, the constructs self-efficacy and locus o f control were considered in two
ways as variables in this study. First they were analyzed, along with the other
independent variables, for possible relationships with the dependent variables, college
aspirations and college expectations. Second, the contributions of self-efficacy and
locus o f control as mediating variables for the other independent variables and the
dependent variables were explored.
Researchers have divided the college choice process into numerous stages
(Kotler, 1976, Hanson and Litten, 1982; Litten, 1982; Jackson, 1982; Hossler and
Gallegher, 1987). Because o f its wide application and its elaboration o f previous
models, the three-phase model of Hossler and Gallagher (1987) was used as a basis for
this study. This model divides college choice into a) the predisposition phase, b) the
search phase and c) the choice phase. During the predisposition phase individuals make
tentative decisions whether or not to continue their formal education by attending
college. During the search phase individuals investigate and evaluate schools in which
they are interested. During the choice phase individuals develop a choice set of
institutions to which they apply and make a final matriculation decision (Bateman and
Hossler, 1996).
It is during the predisposition phase that aspirations and expectations of
postsecondary attendance reach fruition. Typically this phase begins when students are
in the eighth or ninth grade, although for many individuals the decision to attend college
is made at a much earlier age. Previous research has identified thirteen factors which
influence students in formulating postsecondary aspirations and expectations (see
Reproduced with permission of the copyright owner. Further reproduction prohibited without permission.
21
Chapter 2 for a full discussion of these factors); however, five emerge as the most
influential. These are a student’s academic ability, parents’ level of education, parental
encouragement and support, academic track and participation in extracurricular
activities. For expediency these five are referred to in this study as the traditional
factors or variables. The traditional factors were used as independent variables in this
study along with self-efficacy and locus o f control.
College aspirations and college expectations serve as dependent variables for
this study. These constructs represent the primary components o f postsecondary
educational plan formulation during the predisposition phase o f the college choice
process. Although the majority of the literature treats these factors as analogous, or
considers only one o f the factors, this study will treat these constructs as distinct. The
differences in the two are apparent in their definitions.
College aspiration is defined as the education that individuals hope to achieve
upon graduation from high school (Hanson, 1994). Here the significant word is hope.
Student aspirations need not necessarily be realistic, nor do they have to be goals which
students believe they can achieve. None the less, they are the goals which students hope
to attain. College aspirations are analogous to the desires o f a child viewing candy in a
store window. The child wants the candy regardless of whether or not the money is
available to buy it, or permission is given to make the purchase. Students aspire to go
to college regardless o f their skills, finances or opportunity to attend.
College expectation is defined as the education that individuals expect to
achieve upon graduation from high school (Hanson, 1994). Expect is the significant
Reproduced with permission of the copyright owner. Further reproduction prohibited without permission.

22
word here, as individuals’ expectations reflect the assumed belief that they will attend
college. Expectations are much more realistic than aspirations and are framed by the
constraints o f social forces which “identify, select, process, classify and assign
individuals according to externally imposed criteria” (Kerckhoff, 1976, p.369). In terms
of the candy store analogy, although the child hopes to get some candy, actual
expectations are delineated by the constraints o f money and parental approval. The
child does not really expect to get any candy unless the child feels these obstacles can
be overcome. Students do not expect to go to college unless they feel they have the
skills, finances or opportunity to attend.
It should be noted that college aspirations and expectations are conceptually
distinct from the locus of control and self-efficacy constructs. Locus o f control and self-
efficacy both represent belief systems that are grounded in human motivation theory.
For aspirations and expectations, there is no extant literature connecting either to
concepts of attribution or social cognition. Like locus o f control and self-efficacy,
expectations are beliefs; however expectations are an outcome rather than a motivator o f
human behavior. Aspirations simply are the desires, hopes or dreams o f individuals and
do not represent any type of belief system.
Purpose
The purpose o f this study was to expand existing models previously developed
in the literature pertaining to the college choice precess, particularly adolescents’
aspirations and expectations to attend college. Existing models were enhanced by
including important theoretical constructs well documented in social cognitive
Reproduced with permission of the copyright owner. Further reproduction prohibited without permission.

23
(self-efficacy) and attributional (locus o f control) theories as elements o f human agency.
Of particular interest was the extent to which these theoretical constructs were related to
students’ aspirations and expectations, and the role these constructs play in mediating
linkages between traditional college choice variables and aspirations and expectations.
The primary focus o f the study was directed toward minority students in a large urban
school district.
Significance o f the Study
This study was designed to provide evidence to test existing theories regarding
the way in which the constructs o f self-efficacy and locus o f control are related to
human behavior and behavioral change. It examined the role which these psychological
factors play in the decision making process. As previously stated, the existing literature
examining the choice process for all populations is incomplete, and earlier models do
not do an adequate job o f explaining the factors which influence members o f minority
groups to attend college. The discussion o f self-efficacy and locus o f control in this
study add a new approach to the literature on college choice since no known studies
have attempted to link these psychological constructs to the predisposition stage o f the
college choice process. Conceptually, these constructs appear to be relevant to the
choice process for all populations. Thus, a secondary significance of this study was the
examination o f the relationship between the traditional variables, the psychological
variables and college aspirations and expectations for all racial groups. However, since
previous research (Bateman and Kennedy, 1996b; Portes and Wilson, 1976; KerckhofT
and Campbell, 1977) has demonstrated that the traditional variables are particularly
Reproduced with permission of the copyright owner. Further reproduction prohibited without permission.

24
deficient in explaining the process for minorities, this study contributes to the literature
for this group.
Research Hypotheses and Questions
Both formal research hypotheses and exploratory research questions were used
to frame this study. Predictive hypotheses were formulated for relationships between
the independent and dependent variables where theoretical justifications could be made.
Exploratory research questions were developed for other variables o f interest when
insufficient, past research findings or theoretical justifications were considered
inadequate for the development o f more formal hypotheses.
Research Hypotheses
The following primary hypotheses relative to the role o f the locus o f control and
self-efficacy constructs in the college choice process framed this study.
Hypothesis 1
There is a statistically significant, positive relationship between adolescents’
levels o f academic self-efficacy and their aspirations to attend college.
Hypothesis 2
There is a statistically significant, positive relationship between adolescents’
levels o f academic self-efficacy and their expectations to attend college.
Hypothesis 3
There is a statistically significant, positive relationship between adolescents’
internal locus o f control and their aspirations to attend college.
Reproduced with permission of the copyright owner. Further reproduction prohibited without permission.

25
Hypothesis 4
There is a statistically significant, positive relationship between adolescents’
internal locus o f control and their expectations to attend college.
Hypothesis 5
The psychological constructs of self-efficacy and locus o f control account for a
statistically significant amount of variation in students’ college aspirations beyond that
accounted for by the five traditional variables o f college choice.
Hypothesis 6
The psychological constructs o f self-efficacy and locus o f control account for a
statistically significant amount o f variation in students’ college expectations beyond that
accounted for by the five traditional variables o f college choice.
Rationale
The rationale supporting the inclusion o f self-efficacy and locus o f control as
independent variables in the college choice model has already been thoroughly
discussed. In summary, there is a strong conceptual basis for these hypotheses, as well
as, empirical evidence linking these psychological constructs to other factors which
have, in turn, been linked to college aspirations and expectations. Further, previous
research has demonstrated a relationship between locus o f control and self-efficacy and
similar decision processes such as the career decision making.
Research Questions
In addition to the primary research hypotheses, a number o f supplemental
research questions were also addressed by this study. Primary among these questions
Reproduced with permission of the copyright owner. Further reproduction prohibited without permission.

26
were four questions which addressed one o f the major focuses o f the study, the possible
mediating roles o f locus o f control and self-efficacy between the traditional factors o f
college choice and college aspirations and expectations. Another research question
addressed by the study was whether differences exist between minority and other
students in the college choice process. Additionally, two research questions pertaining
to the theoretical understanding o f the self-efficacy construct were explored. The first
addressed the generalization of self-efficacy beliefs across academic domains, and the
second explored the competency and persistence notions o f the self-efficacy construct.
Question 1
Does the academic self-efficacy construct serve a mediating role in the
relationship between the traditional variables o f college choice and college aspirations?
Question 2
Does the academic self-efficacy construct serve a mediating role in the
relationship between the traditional variables o f college choice and college
expectations?
Previous research has reasonably well documented the significance o f
sociological and economic factors in the college choice process. A student’s academic
ability, parents’ level o f education, parental encouragement, academic track and
participation in extracurricular activities have all been shown to be positively correlated
with college aspirations and expectations. These relationships exist; however, the
dynamics of these relationships are not clear.
Reproduced with permission of the copyright owner. Further reproduction prohibited without permission.

27
As previously stated, self-efficacy is developed through enactive mastery
experiences, vicarious experiences and verbal persuasion (Bandura, 1977). Three o f the
traditional variables - high school achievement, school track and participation in
extracurricular activities - can be viewed as enactive mastery experiences. Parental
education levels serve as performance models for students and can be considered to be a
vicarious experience. Parental encouragement can be viewed as persuasion. Thus, the
five traditional variables related to students’ aspirations and expectations for college
attendance were considered to also have the potential to affect the development o f self-
efficacy. It, therefore, is likely that self-efficacy has a significant role in the college
choice process as a factor mediating linkages between the traditional variables and
students’ college aspirations and expectations.
Question 3
Does the locus o f control construct serve a mediating role in the relationship
between the traditional variables o f college choice and college aspirations?
Question 4
Does the locus o f control construct serve a mediating role in the relationship
between the traditional variables o f college choice and college expectations?
The construct, locus o f control, was also considered to be conceptually linked to
the five traditional variables and likely to serve a mediating role in the college choice
process. To understand this relationship it is necessary to first discuss Rotter’s (1966)
social learning theory and the relationship of his theory to locus o f control. According
to Rotter, a reinforcement acts to strengthen an expectancy that a particular behavior or
Reproduced with permission of the copyright owner. Further reproduction prohibited without permission.

28
event will be followed by that reinforcement in the future. For example, if a student
studies diligently for an examination and subsequently receives a good grade, it might
be expected that studying hard in the future will result in additional good grades.
Likewise, if a behavior is not followed by reinforcement, then the expectation for future
reinforcements will diminish. When the reinforcement occurs as the result o f the
individual’s efforts, the individual will tend to view the reinforcement to be contingent
on one’s efforts. When it does not occur, the individual will tend to view personal
efforts as unproductive.
Turning to the five traditional variables, all represent the potential for
adolescents to receive reinforcements to their behavior. Academic achievement,
academic track and participation in extracurricular activities usually are contingent on
some level o f performance or commitment by the individual and, thus, also represent
situations where a student’s level of effort will result in a corresponding level o f
reinforcement. Parental encouragement does not give direct reinforcement for behavior,
however, one would expect the support, or lack o f support, given by parents would
impact a student’s expectations for reinforcements. Finally, the success, or lack o f
success which parents have in school, model for students a level o f attainment which
can be expected and, thus, reinforce the students’ own expectations.
The five traditional variables, then, all represent to a certain degree behavior
which can act to strengthen or weaken the expectancy for reinforcements in the future.
When a student expends the effort necessary to achieve academically or in related
school activities, receives encouragement from parents, or has parents who model
Reproduced with permission of the copyright owner. Further reproduction prohibited without permission.

29
academic success and then achieves success, the student will tend to expect further
success and attribute the reinforcements to personal actions. Conversely, when the
student expends the effort or receives parental feedback and does not achieve positive
results, further successes will not be expected nor will the reinforcements be attributed
to personal efforts. When the student receives positive reinforcements in the area o f the
five traditional variables he or she will tend towards a greater degree o f intemality and,
thus, have greater aspirations or expectations for college attendance. When the student
fails to receive positive reinforcement, however, he or she will tend towards a greater
degree of externality and have diminished aspirations or expectations for college
attendance.
Question 5
Do significant differences exist in the model o f college choice based on race?
In addition to providing information regarding the college choice process by
examining psychological factors, this study examined the possibility that motivators to
attend college are different for different racial groups. Since little is known about the
college choice process for minority groups, this study examined the college aspirations
and college expectations o f African American, Hispanic and White students separately,
as well as in the aggregate.
Question 6
To what extent can an individual’s self-efficacy beliefs be generalized?
Two parts to this question were addressed in this study. First, do self-efficacy
beliefs generalize across academic domains; and second, do sub-categories o f self-
efficacy beliefs contribute to a more generalized notion of self-efficacy. Although the
Reproduced with permission of the copyright owner. Further reproduction prohibited without permission.

30
self-efficacy construct was first conceptualized as situation or task specific (Bandura,
1977), recent research has suggested that efficacy beliefs may, in some cases, transfer
across activities or settings and the construct has some cumulative properties (Bandura,
1997).
Question 7
What is the relationship between self-efficacy beliefs and students’ estimates o f
persistence motivation related to academic tasks?
Bandura (1997) defines perceived self-efficacy beliefs in terms o f one’s
capabilities to organize and execute courses o f action required to produce given
attainments. Further, he explains that efficacy beliefs have diverse effects including
persistence in the face o f obstacles and failures. The strength o f self-efficacy beliefs
also determines the length o f time an individual will persist in performing a specific
behavior when beset with obstacles and aversive experiences (Bandura and Schunk,
1981). The relationship between efficacy beliefs and academic persistence was
explored in this study as well.
Definition o f Terms
The section that follows provides conceptual and operational definitions for the
major variables o f the study.
Self-Efficacv
Conceptual Definition
Self-efficacy, as a theoretical construct o f human behavior, was defined as an
individual’s “beliefs in one’s capabilities to organize and execute the courses o f action
required to produce given attainments” (Bandura, 1997, p.3).
Reproduced with permission of the copyright owner. Further reproduction prohibited without permission.

31
Operational Definition
Self-efficacy will be measured by the academic section o f Bandura’s (1989)
Children’s Self-Efficacv Scale (Appendix 2, questions 4, 5, 8, 9, 10, 11, 12 and 13). In
addition to the questions asked by Bandura, five additional questions were added to
allow for the measurement o f generalized self-efficacy and persistence.
Locus o f Control
Conceptual Definition
Locus o f control was conceptually defined as the extent to which one believes
that internal or external determinants control life experiences. It is the degree to which
an individual perceives that the reward o f an event or activity follows from, or is
contingent upon, one’s own behavior or attributes versus the degree to which the
individual feels the reward is controlled by forces outside one’s self or may occur
independently of one’s own actions (Rotter, 1966).
Operational Definition
Locus o f control was operationally defined by the Rotter (1966) Internal-
External Locus o f Control Scale (Appendix 2, questions 17-45).
College Aspirations
Conceptual Definition
College aspirations are the educational attainments which individuals hope to
achieve after leaving high school (Hanson, 1994). Aspirations may not necessarily be
based on a realistic appraisal o f one’s academic talents or on the belief that one will
actually be able to attend college. They are, instead, the hopes, desires or dreams o f an
individual to one day have the opportunity to attain a postsecondary education.
Reproduced with permission of the copyright owner. Further reproduction prohibited without permission.

32
Operational Definition
Aspirations were measured by asking students to respond to a question asking if
they want to attend college (Appendix 2, question 47).
College Expectations
Conceptual Definition
College expectations were conceptualized as the continued education that
individuals expect to achieve upon graduation from high school (Hanson, 1994).
Expectations are grounded in a practical assessment o f one’s academic talents and are
raised or lowered over time as adolescents experience successes or failures. They are
what an individual considers reasonable, due or necessary (Guralnick, 1990).
Operational Definition
Expectations were operationalized by asking students to indicate if they expect
to attend college (Appendix 2, question 48).
Parental Encouragement
Operational Definition
The level o f parental encouragement was ascertained by asking students to
report their perceptions o f their parents’ expectations for them attend college using a
question (Appendix 2, question 50) taken from the National Education Longitudinal
Study of 1988 User’s Manuel (U.S. Department o f Education, Office o f Educational
Research and Improvement, 1992).
Reproduced with permission of the copyright owner. Further reproduction prohibited without permission.
33
Parental Educational Level
Operational Definition
Parental educational level was ascertained by asking students to respond a
question (Appendix 2, question 51) taken from the National Education Longitudinal
Study of 1988 User’s Manuel (U.S. Department o f Education, Office of Educational
Research and Improvement, 1992).
Academic Achievement
Operational Definition
Academic achievement was measured by the students self reported grades in all
academic subjects using a question (Appendix 2, question 46) taken from the National
Education Longitudinal Study o f 1988 User’s Manuel (U.S. Department of Education,
Office of Educational Research and Improvement, 1992).
Academic Track
Operational Definition
High school academic track was ascertained by asking students to respond to a
question (Appendix 2, question 53) taken from the National Education Longitudinal
Study of 1988 User’s Manuel (U.S. Department o f Education, Office of Educational
Research and Improvement, 1992).
Participation in Extracurricular Activities
Operational Definition
Students were asked to indicate the extent o f their involvement in different types
o f extracurricular activities using a question (Appendix 2, question 52) taken from the
Reproduced with permission of the copyright owner. Further reproduction prohibited without permission.

34
National Education Longitudinal Study o f 1988 User’s Manuel (U.S. Department of
Education, Office o f Educational Research and Improvement, 1992).
Limitations
1. Since this study utilized ninth-grade students as the primary sample (see
Sample Design in Chapter 3), the accuracy o f the responses may be o f concern. The
knowledge level o f the students and the seriousness with which they completed the
measures may have limited the reliability o f the data. Further, the study may have been
limited by the use o f volunteers.
2. The generalizing of the study findings may be limited to populations
similar to those used in the study.
Chapter Summary
This chapter provided an overview o f the study, a brief review o f pertinent
literature defining the study variables and their posited relationships, the problem(s)
addressed by the study, the significance/importance o f the study, the formal hypotheses
tested and research questions explored and conceptual and operational definitions o f the
study variables. Chapter 2 provides a more detailed review o f the literature that serves
as the foundation for the study.
Reproduced with permission of the copyright owner. Further reproduction prohibited without permission.

CHAPTER 2: REVIEW OF RELATED LITERATURE AND RESEARCH
Introduction
Chapter 2 reviews related literature and research pertinent to the college choice
process and the variables discussed in the conceptual framework presented in Chapter 1.
Included in this chapter is a) an overview o f the college choice process, b) a review o f
the variables previously identified as predictive o f post secondary attendance, c) a
review o f the variables and models associated with the choice process for minority
groups, d) a discussion o f human behavior theory and the role of self-efficacy in the
college choice process, and e) a discussion o f social learning theory and the role o f
locus o f control in the college choice process.
Overview of the College Choice Process
The college choice process has received considerable attention during the past
thirty years as governmental policy makers, institutional recruiters and educational
leaders have labored to discern how students decide about college attendance.
Educational researchers have also examined the topic and in the past fifteen years have
made great strides in extending our understanding o f the process. Research on college
choice can be divided into three categories o f study, that which takes an econometrics
approach, that which take a sociological approach, and that which combines the two
approaches (Jackson, 1982).
35
Reproduced with permission of the copyright owner. Further reproduction prohibited without permission.

36
College Choice Models
The Econometrics Approach
The econometrics approach to college choice examines the economic benefits o f
college attendance. Students, it is postulated, weigh the personal economic advantages
o f attaining a college degree against the cost o f attendance and other foregone
opportunities. (Bishop, 1977; Fuller et al., 1982; Kohn et al., 1976; Nolfi, 1978;
Manski and Wise, 1983). “A youth attends college if, relative to the best non college
alternative, there is at least one college that is simultaneously desired and possible to
finance.” (Bishop, 1977, p.287) Students are perceived as consumers who strive to
maximize the expected utility o f the choice they make (Hossler, et al., 1989). The
differential in future earnings expected from a college education as opposed to those
expected from a non-college alternative are also considered by the prospective student
(Bishop, 1977; Fuller et al.; 1982, Nolfi, 1978). The costs o f college attendance have
also been examined in relation to the risk one takes in choosing to attend (Young and
Reyes, 1987). Both costs and risks have monetary and non-monetary components, and
the perspective student seeks the enrollment opportunity which minimizes both o f these
factors.
The Sociological Approach
The sociological approach to college choice identifies a variety o f social and
individual factors which influence aspiration for college attendance. Based on Blau and
Duncan’s (1967) path model of the occupational attainment process, the sociological
approach is primarily concerned with status attainment. Within this framework, status
Reproduced with permission of the copyright owner. Further reproduction prohibited without permission.

37
attainment is the role played by the various factors in the allocation o f individual
positions or occupations o f varying degrees o f prestige or status (Sewell and Shah,
1978; Alexander, Eckland and Griffin, 1975). Family socioeconomic status, student
academic ability, parental encouragement, high school academic performance and the
influences o f significant others (parents, teachers and peers) are examined for their
effect on aspirations to attend college (Blau and Duncan, 1967; Sewell and Shah, 1978;
Sewell and Hauser, 1975). A causal relationship has been found to exist between these
factors and the student’s perceptions o f prestige associated with college attendance.
High school performance and the socioeconomic status o f one’s family exert a positive
influence on the perceptions o f significant others and the expectations o f parents, which,
in turn, influence a student’s aspirations to achieve the status commensurate with
college attendance (Hossler et al. 1989). Alwin and Otto (1977) also emphasize the
importance o f significant others in the formulation of aspirations for college. They
argue that a student’s high school academic performance directs the expectations o f
others which direct the student’s desire to pursue a college education.
The Combined Approach
The combined approach to college choice expands the econometrics and
sociological approaches’ focus on student decision making to a longitudinal analysis o f
the decision process. The decision to attend college is viewed as sequential, involving
stages o f students’ involvement ultimately, resulting in the decision to enroll or pursue
other interests. Here, the most powerful factors o f the first two approaches are
integrated, constructing a framework through which the decision making process can be
Reproduced with permission of the copyright owner. Further reproduction prohibited without permission.

38
addressed from a policy perspective (Hossler et al. 1989). The combined approach
attempts to describe the various economic and social forces that effect student decision
making in order to identify opportunities to intervene in the college choice process.
Phases o f the College Choice Process
The college choice process itself has been divided into a number o f phases,
beginning with the initial decision to attend and ending with registration at a particular
institution. Kotler (1976) has described the process as consisting o f seven steps: a) the
decision to attend, b) information seeking and receiving, c) specific college inquiries, d)
application(s), e) admission(s), f) college choice, g) registration. A parallel track for the
application for financial assistance, encompassing the decision to apply for aid, the
application for aid and the granting o f aid, can be added to these seven stages (Hanson
and Litten, 1982). Several authors have developed abbreviated versions o f Kotler’s
multistage process, combining the seven steps into broader categories. Litten (1982)
outlines a three phase model beginning with the decision to attend, followed by the
investigation o f institutions, which leads to application, admission and enrollment.
Jackson (1982) also posits three stages, starting with the preference to attend, then the
exclusion o f inappropriate institutions and the formulation o f a choice set, then finally
the evaluation o f the set and the selection o f a school. Perhaps the most widely used
delineation o f steps is the three stage process offered by Hossler and Gallegher (1987).
Borrowing from Litten and Jackson, their process is divided into the predisposition
phase, followed by the search process, concluding with the formulation o f a choice.
Because o f its wide application, this process shall be used as the basis for this study and
deserves further elaboration.
Reproduced with permission of the copyright owner. Further reproduction prohibited without permission.

39
The Predisposition Phase
During the predisposition phase, students arrive at the tentative conclusion to
continue or not continue their formal education beyond high school. Although for many
young people the assumption o f college attendance begins at a very early age,
frequently this phase will begin when students are in the eighth or ninth grades, when
curriculum decisions effect their ability to attend college. The decisions reached at this
time usually remain stable across a student’s high school career (Schmit and Hossler,
1995). Research on the predisposition phase has identified a number o f factors which
influence student’s desire to attend postsecondary institutions. They are: a) family
socioeconomic status, b) student academic ability, c) gender, d) parental levels of
education, e) family residence, f) parental encouragement and support, g) peer
encouragement, h) encouragement from high school counselors and teachers, i) student
educational aspirations and career plans, (j) quality of high school and academic track,
k) the labor market and increased rates o f return, 1) family structure, and m) race and
ethnicity (Hossler et al., 1989). Each o f these shall be discussed in turn.
The Search Phase
During the second phase o f the college choice process, the search phase,
students collect and evaluate information about colleges and universities before
selecting institutions to which to apply. Here, students are viewed as searching for the
attributes and values of institutions which most closely match their educational needs
(Hossler et al., 1989). Unfortunately, little research has been conducted about this
phase. The information which is available, however, can be divided into three
Reproduced with permission of the copyright owner. Further reproduction prohibited without permission.

40
categories, the timing o f the search process, how information is obtained and the
methods students use to eliminate schools from their list.
The Choice Phase
The final phase o f the college choice process is the choice phase. Generally
concluded during the senior year of high school, this phase encompasses two stages, the
selection o f an applicant set o f institutions and the final matriculation decision (Hossler
et al., 1989). Single institution studies dominate the research conducted in this area, as
institutional administrators have endeavored to learn what attracts students to their
particular schools. There are, however, a few studies which utilize large samples to
determine how students choose a postsecondary institution.
Predictive Variables
Predisposition Phase
As stated above, thirteen different variables have been identified as factors
influencing students’ aspirations and expectations to attend postsecondary institutions.
The research for each is be discussed below.
Socioeconomic Status
Research has positively associated socioeconomic status with a student’s
aspirations to attend college. In Australia, for example, two studies found that
socioeconomic status explained a significant amount o f variance in postsecondary
participation for young adults in that country (Elsworth et al., 1982; Ekstrom, 1985). In
the United States, Tuttle (1981), using the 1980 High School and Beyond study,
reported that 6.8% of the variance in college attendance was explained by this factor. A
Reproduced with permission of the copyright owner. Further reproduction prohibited without permission.

41
qualitative study o f postsecondary plans o f high school seniors in Pennsylvania
indicated that as family income and the educational level of parents increased, students
began to think about their college plans earlier (Gilmour et al., 1978). In her study,
Hansen (1994) found that students from lower socioeconomic families were more likely
to become “lost talent” casualties than students from higher socioeconomic families.
Not all research has found family socioeconomic status to have a direct impact
on post secondary participation rates. Using multiple-regression techniques, Jackson
(1986) conducted a comparison o f postsecondary rates from the National Longitudinal
Study (NLS) o f 1972 and the 1980 High School and Beyond (HBS) study. He found
socioeconomic status to explain a less significant 3% of the variance in the NLS sample,
and 4.4% in the HSB study. Similarly, Yang (1981) found this factor to be less
significant when parental educational background and parental encouragement were
controlled, and interviews conducted by Leslie et al. (1977) found that socioeconomic
status was not closed related to student plans to attend college.
The discrepancy in the research results may be explained by Hossler et al.
(1989) who write “that SES does have an impact on predisposition; however, the impact
may not be direct.” (P. 252) This is supported by studies using causal modeling
techniques. In a path analysis study, Marini and Greenberger (1978) found that
socioeconomic status explained 8.9% of the variance o f college ambition in young men
and 12.2% o f the variance of academic achievement for young women. Carpenter and
Fleishman (1987), also using path analysis, reported that socioeconomic status,
mediated through parental encouragement, was indirectly related to student plans to
Reproduced with permission of the copyright owner. Further reproduction prohibited without permission.
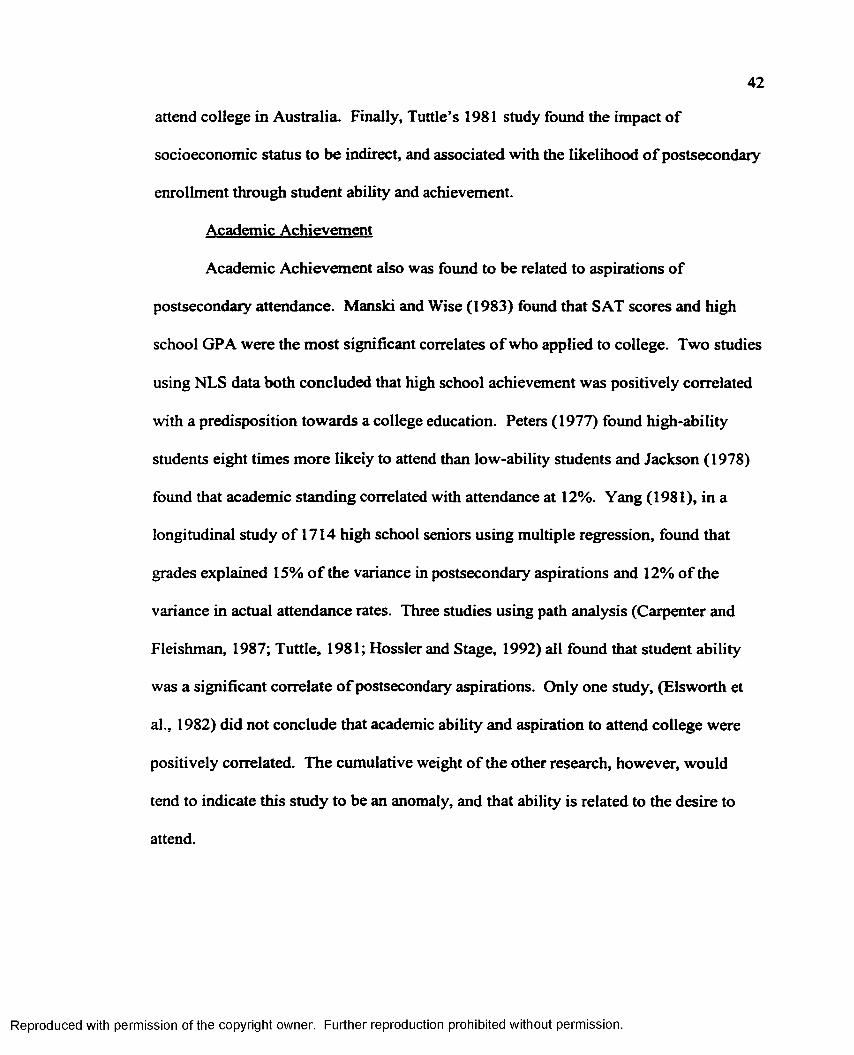
42
attend college in Australia. Finally, Tuttle’s 1981 study found the impact o f
socioeconomic status to be indirect, and associated with the likelihood o f postsecondary
enrollment through student ability and achievement.
Academic Achievement
Academic Achievement also was found to be related to aspirations o f
postsecondary attendance. Manski and Wise (1983) found that SAT scores and high
school GPA were the most significant correlates o f who applied to college. Two studies
using NLS data both concluded that high school achievement was positively correlated
with a predisposition towards a college education. Peters (1977) found high-ability
students eight times more likely to attend than low-ability students and Jackson (1978)
found that academic standing correlated with attendance at 12%. Yang (1981), in a
longitudinal study o f 1714 high school seniors using multiple regression, found that
grades explained 15% o f the variance in postsecondary aspirations and 12% o f the
variance in actual attendance rates. Three studies using path analysis (Carpenter and
Fleishman, 1987; Tuttle, 1981; Hossler and Stage, 1992) all found that student ability
was a significant correlate o f postsecondary aspirations. Only one study, (Elsworth et
al., 1982) did not conclude that academic ability and aspiration to attend college were
positively correlated. The cumulative weight o f the other research, however, would
tend to indicate this study to be an anomaly, and that ability is related to the desire to
attend.
Reproduced with permission of the copyright owner. Further reproduction prohibited without permission.

43
Gender
Mixed results have been identified when gender has been studied for its
relationship with enrollment patterns. In two studies using correlation analysis and
LISREL path analytic techniques, women were found to have greater aspirations to
attend college than men (Hossler and Stage, 1987; Stage and Hossler, 1989). Ironically,
these studies found that women’s aspirations remained high even though they were less
likely to receive family encouragement to pursue a college education. In another study,
Hanson (1994) also found that young men were more likely to have reduced or
unrealized educational expectations than young women. Females, however, were found
to drop out o f the college choice process earlier than males, but the cumulative lost
talent effect was much greater for male students. Other research has not found gender to
be a factor in the college choice process. In Australia, no difference was found between
men and women in postsecondary aspirations and participation (Carpenter and
Fleishman, 1987; Elsworth, et al., 1982). Tuttle (1981) discovered the same results in
his path analytic study.
Parental Education Level
There is a substantial evidence to suggest that the level o f parental education is
strongly related to the aspirations o f students to attend college. Studying NLS and HSB
data, Jackson (1986) found that, for each additional year o f parental education, the
likelihood o f the student attending a postsecondary institution increased by 6%.
Carpenter and Fleishman (1987) found that a strong relation exists between the father’s
education and a student’s enrollment in college. Yang (1981) also found the father’s
Reproduced with permission of the copyright owner. Further reproduction prohibited without permission.

44
education level to be significant. In his study using qualitative data and multivariate
analysis, he discovered that the father’s level of education had a stronger relationship to
student aspiring to attend college than the mother’s, but that the mother’s education
level was more closely associated with actual enrollment. Parental educational levels
were found to have both a direct and an indirect relationship with postsecondary plans.
In one study, parents’ education explained 9.5% of the variance in students’ educational
aspirations and 43.5% o f the variance in the amount o f encouragement that parents gave
to their children to attend college (Hossler and Stage, 1992). These authors also found
that the level o f parents’ education was the greatest correlate of students’ GPAs which,
in turn, were positively correlated with post secondary plans (Stage and Hossler, 1989).
These findings were supported by the research o f Manski and Wise (1983), who found
in most income brackets, students of parents with a college education were more than
twice as likely to apply to college. Only Tuttle (1981) did not find parental educational
levels to be significant.
Location o f Residence
The location o f the family residence has also been studied with some evidence
indicating it has a relationship with postsecondary participation rates. The distance one
lives from a higher education institution was found to be some what significant, with
students living within twenty miles of a school being more likely to attend than those
living further away (Astin, 1980; Willingham, 1970; Anderson et al., 1972). The
amount o f variance explained by nearness, however, was found to be small in all o f
these studies. Anderson et al. (1972) also found that students living in urban areas were
Reproduced with permission of the copyright owner. Further reproduction prohibited without permission.

45
more likely to attend college than those from rural areas. His findings are supported by
Dahl (1982) who conducted a longitudinal study o f Kentucky high school seniors and
Lam and Hoffman (1979) who studied enrollment trends at a single Canadian
university. Residence characteristics are related to the college choice process but when
compared to other factors, such as parental encouragement or parental education levels,
their significance is minimal.
Parental Encouragement
Parental encouragement, on the other hand, has been shown to be a strong
correlate in the college choice process. In a descriptive study o f high school seniors and
parents, Murphy (1981) found that 42.6% o f the students and half o f the parents
indicated that the idea to attend college was first introduced by the parents. A number
of other descriptive studies also point to a strong positive relationship between parental
expectations and students’ aspirations (Ekstrom, 1985; Russell, 1980; Soper, 1971;
Tillery, 1973).
As was the case with parental education levels, much o f the relationship between
parental encouragement and postsecondary plans was found to be indirect. Carpenter
and Fleishman (1987) found that parental expectations o f their children influenced
students’ perceptions o f what others thought they should do, which in turn strongly
influenced their decisions to pursue a college education. Hossler et al. (1989) elaborates
on this indirect association, pointing to a reciprocal relationship where parental
encouragement spawns achievement, which fosters a predisposition towards college,
which leads to better academic performance, which motivates further parental
Reproduced with permission of the copyright owner. Further reproduction prohibited without permission.

46
encouragement. Thus, parental encouragement has been found to serve as a mediating
variable through which other variables, parents’ education levels, gender and ethnicity,
have an indirect relationship with students’ educational plans (Hossler and Stage, 1992).
Other studies have also emphasized the importance o f parental encouragement.
One longitudinal study o f students from their sophomore to senior years o f high school
found that as parental levels o f encouragement increased, students were more likely to
attend four year colleges and more selective institutions. This study also found that
parental encouragement is often not verbalized, that the parents’ assumption that their
children will attend college is communicated indirectly through the social interaction of
the family (Conklin and Dailey, 1981). Sewell and Shah (1978), using NLS data found
parental encouragement to be more closely associated to postsecondary aspirations than
any other factor, explaining 37% o f the variance.
Peer Encouragement
When compared with parental encouragement, peer encouragement and support
appear not to be as strongly associated with predisposition toward college attendance
(Kandel and Lesser, 1968; Hossler et al., 1989). Studies show, however, that the
attitudes o f one’s contemporaries do have some relationship to postsecondary
aspirations. Russell (1980), Colemen et al. (1966), Tillery (1973), and Jackson (1986)
all found peer encouragement to be an inportant correlate to educational plans. Hossler
and Stage (1987), in their study o f ninth-grade students in Indiana, on the other hand,
found that individuals who were not planning to attend college were much more likely
to consult their peers than those who were planning to attend. This suggests that peer
Reproduced with permission of the copyright owner. Further reproduction prohibited without permission.

47
influence may not be as closely associated with the decision to pursue a college degree
as it is with the decision to pursue other options. With one group o f students, however,
peer encouragement has been shown to be closely related to the college choice process.
For students attending private schools, the postsecondary aspirations o f friends was
found to be one o f the most closely correlated factors associated with a student’s college
plans (Falsey and Heyns, 1984).
Influence o f Counselors and Teachers
It might be expected that high school counselors and teachers have a significant
impact on students’ predisposition to attend college, but research indicates that this is
not the case. A number o f studies found that counselors and teachers had little effect on
students’ decisions in this area (Ekstrom, 1985, Falsey and Heyns, 1984, Lewis and
Morrison, 1975, Tillery, 1973). Three studies did find that for low-income and minority
students, the reliance on counselors or teachers was higher than for other students
(Ekstrom, 1985; Hossler and Stage, 1987; Lewis and Morrison, 1975). Even with these
groups, however, the actual percentage of students who consulted with a counselor or
teacher was far below 50%.
Student’s Career Plans
Students’ career plans and aspirations have been found to be closely associated
with enrollment in college, however, it is questionable if they are factors in their own
right, or simply are reflective o f other factors. Dahl (1982), Hilton (1982), Peters
(1977), and Trent and Medsker (1967) all report that over 80% of high school students
who indicate they plan to enroll actually follow through with their plans. Causal
Reproduced with permission of the copyright owner. Further reproduction prohibited without permission.

48
models, on the other hand, indicate that student’s plans merely are the results o f other,
more significant influences, such as socioeconomic status, parental expectations and
parental education levels (Carpenter and Fleishman, 1987; Corazzini et al., 1972). From
student career plans and aspirations it appears we can gain an understanding o f students’
likelihood to pursue a postsecondary education, but not what is influencing them to do
so.
Participation in Extracurricular Activities
Participation in Extracurricular Activities is supported by research as playing a
significant roll in adolescents’ desires to attend college. Stage and Hossler (1989), for
instance, found involvement in high school activities to be the third strongest correlate
o f the predisposition to attend. Using multivariate statistical techniques, Spady (1975)
found that involvement in athletics and service activities increased the likelihood male
high school seniors would formulate post secondary educational plans. Likewise, Otto
(1976) found that extracurricular activities increased social interaction which, in turn,
raised students’ aspirations to attend college. Involvement in leadership positions and
artistic and athletic accomplishments were found by Willingham (1970) to be related to
success in college. The findings o f Hearn (1984), however, were less conclusive. In a
study using multiple regression techniques, he found that some extracurricular activities
support educational attainment while others detract from college aspirations. Overall,
he does conclude that involvement in student government, debating clubs, drama and
journalism were positively related to aspirations to attend college.
Reproduced with permission of the copyright owner. Further reproduction prohibited without permission.

49
High School Quality and Academic Track
Research on the predisposition phase o f college choice indicates that the quality
o f one’s high school is not very significant in the decision process, but the academic
track taken by the student is quite significant. In other words, differences among
schools are generally less important than factors which vary within schools (Alwin and
Otto, 1977). There are indications, however, that school quality is somewhat related to
a student’s predisposition (Elsworth, 1982; Falsey and Heyns, 1984). The Elsworth
study was conducted in Australia and the Falsey and Heynes study examined students
attending private high schools, which raises some questions whether either can be
generalized to the public high school student in this country. Conversely, Kolstad
(1979), using multiple regression analysis o f NLS data, found that high school quality
was only weakly correlated to college enrollment when socioeconomic and other
background characteristics were held constant. A student’s academic track, on the other
hand, was found to have a role in the predisposition phase o f college choice. Jackson
(1986), Kolstad (1979) and Peters (1977) all ascertained its importance in their studies,
although Kolstad’s research found less significance than the other two studies.
Rates o f Return
According to the human capital concept o f educational benefit, the investment
an individual makes in education will give one the ability to be a better worker when
entering the labor market, and hence the ability to command higher earnings (Cohn and
Geske, 1990). As a result, it would be expected that adolescents would consider the rate
o f return relative to a college education when deciding whether or not to attend college.
Reproduced with permission of the copyright owner. Further reproduction prohibited without permission.

50
Two important questions have been asked to determine if the labor market and
rates o f return have an effect on the predisposition stage o f college choice. First, do
opportunities for employment impact students’ decisions to attend postsecondary
educational institutions? Second, are students concerned with the economic rate of
return they can potentially receive from attending college? Generally, research on these
factors indicates that the answer to both questions is no. The labor market and rates o f
return are not closely associated with the decision process o f students to attend college.
A comparison o f enrollment patterns and trends in the labor market since the
1930's by Adkins (1975) shows that enrollments have increased steadily regardless of
labor market trends. Other studies have found that during times o f high unemployment
or recession, students have been more likely to attend college (Chressanthis, 1986;
Hossler, 1984). During the 1970's, when a decline occurred in the rate o f return for a
college education, postsecondary enrollments increased (Bird, 1975; Mattila, 1982;
Freeman, 1976). Both Bishop (1977) and Campbell and Siegel (1967) have concluded
that high school students are either unaware o f return rates for college attendance or
they simply ignore them when making their future plans.
Family Structure
Family structure, whether the prospective student resides in a single-parent or
two-parent household, has been found to impact educational attainment. Children from
single parent houses have lower levels o f educational attainment and are more likely to
leave school before the completion of the 12th grade, than children from two-parent
families (Hauser and Featherman, 1977; Keith and Finlay, 1988). These lower levels o f
Reproduced with permission of the copyright owner. Further reproduction prohibited without permission.

51
attainment, surprisingly have not been found to be associated with college aspirations.
Although more research is needed in this area, preliminary research discerns little
difference between the two groups in the desire to pursue a postsecondary education
(Bateman and Kennedy, 1997).
Race and Ethnicity
Comparisons by race and ethnicity on the disposition to attend college is
somewhat difficult to capture since attendance rates o f minority students have fluctuated
over the past thirty years. The sixties and seventies saw an unprecedented increase in
minority student attendance, especially with African American students who tripled
their numbers between 1966 and 1977 (Chronicle of Higher Education, 1978). From
1977 to 1985, however, the numbers slowly declined, only to rebound since 1986
(National Center for Educational Statistics, 1994). This fluctuation in enrollment makes
studying the impact o f race and ethnicity difficult since the factors influencing
participation rates o f minority groups have changed (Hossler et al., 1989). Some
literature, however, is available on the subject.
Four studies which analyzed o f racial differences on postsecondary participation
rates all initially found race to be significant, but when socioeconomic status was
controlled, the effects virtually disappeared (Ekstrom, 1985; Tuttle, 1981; Manski and
Wise, 1983; Jackson, 1986). These results indicate that White students and minority
students from the same income levels aspire to and pursue a college education at similar
levels. Only Hanson’s (1994) research demonstrated different results. She writes
“Although some o f the effects o f race worked through the different effects of [family,
Reproduced with permission of the copyright owner. Further reproduction prohibited without permission.

52
individual, and school] resources on the loss of talent, race continued to have an effect
on the loss o f talent when differences in levels o f resources were taken into account.”
(P. 180)
Other studies have indicated there exist a disturbing gap between minority
students’ aspirations and their actual attendance. Hossler and Stage (1987) found that
ninth-grade minority students reported thinking more about postsecondary education
than their White counterparts, but White students were 4% more likely to indicate they
planned to attend. Brown (1982), using NLS and HSB data, found that the number o f
African American students aspiring to go to college increased between 1972 and 1980
but fewer actually attended. In a study of African American males, Hauser and
Anderson (1991) found that African American and White male students had similar
plans and aspirations to attend college, but actual attendance rates indicate the African
Americans are more likely to alter their plans away from enrollment. Again, Hanson’s
(1994) research had contradictory results. She found that White high school seniors
were more likely to experience reduced or unrealized educational expectations. This
difference may be explained, in part, by the fluctuations in enrollment rates o f African
Americans. The Hossler and Stage, and Brown studies were conducted when
enrollments were declining for this group and Hauser and Anderson looked at African
American males only, a group which has continued to experience low enrollments rates.
Hanson’s study was conducted in the early 1990s when the enrollment of African
Americans, in the aggregate, was increasing.
Reproduced with permission of the copyright owner. Further reproduction prohibited without permission.

53
From the research conducted on the predisposition phase, five factors emerge as
the ones most significantly related to students’ decisions to pursue a college education.
They are: student academic ability, academic track, parental levels o f education,
parental encouragement, and participation in extracurricular activities. Two factors,
educational and career aspirations and socioeconomic status, are closely correlated to
postsecondary plans; but when other variables are controlled, the relationships diminish.
The influence o f peer encouragement was found to be only moderately correlated to
college plans. The other factors, gender, family residence, influence o f high school
faculty, labor market and return rates, high school quality and race, have less
significance in the decisions o f students whether or not to go to college.
Search Phase
Research has pinpointed the junior year o f high school as the time when students
are most active in the search phase of the college choice process. At this time, most
have decided whether or not they want to pursue their education beyond high school;
and those who do, begin looking at possible schools. Stewart et al. (1987) found that
80% of the students attending Michigan State University had begun their investigation
of colleges during their junior year. Another study found that, as juniors, 72% of
Pittsburgh high school students had developed their list o f schools from which to choose
(Gilmour et al., 1978). For African Americans, the search process generally begins
later, finishes later and involves the consideration o f more schools than for White
prospective students (Litten, 1982).
Reproduced with permission of the copyright owner. Further reproduction prohibited without permission.

54
Other research concurs with these findings but indicates that the search phase
often extends into the first part o f the senior year as well. Lewis and Morrison (1975),
in a series o f interviews with high school seniors, found that many were adding to their
list o f potential schools as late as October o f their senior year. Gilmour et al.’s (1978)
study found students concluding their search earlier, but also found the search did not
usually finish before the beginning o f the senior year.
Where students receive their information about potential schools has also been
studied. Sadly, research suggests that students frequently are never well informed about
their potential choices and much o f the search process is haphazard (Jackson, 1982;
Lewis and Morrison, 1975; Litten, 1982). In one study of high school seniors, Cibik
(1982) found that students first learn about colleges from friends (50.6%), a campus
visit (12.7%) or a campus publication (11.7%). The most frequently used sources of
information, according to Lewis and Morrison (1975), are a) catalogs, b) campus visits,
c) guidance counselors, d) students attending a college and e) admissions officers. They
also found that the measures taken by students to acquire information were (in order of
rank): writing away for catalogues, campus visits and interviews, talking to guidance
counselors, using catalogues available at their schools, and talking to college students.
There are indications that the search process differs, depending upon a student’s
socioeconomic class. Tierney (1980) found that students from families with high
socioeconomic status had access to more information sources than students from
families with low socioeconomic status. Ekstrom (1985) found that students in college
preparatory high schools tracks consulted with parents, counselors and friend about
Reproduced with permission of the copyright owner. Further reproduction prohibited without permission.

55
potential college choices, while students in vocational tracks tended to talk only with
friends. Litten (1982) also found that students from families with lower socioeconomic
status have access to less information, are less likely to have college educated parents
and have fewer contacts with well educated role models. Another study found that
colleges contribute to the lack of information to less affluent students by excluding
students who reside in low income zip code areas from their mailing lists (Miller, 1983).
Unfortunately, no research is available which examines the lack of information
available to students with low socioeconomic backgrounds and their subsequent
progress through the search phase. Also missing is information about students based on
their racial or ethnic backgrounds.
Three studies have briefly addressed the process students use in eliminating
institutions from their lists o f schools to attend. Geographic location and cost
considerations are the first factors students use to eliminate schools, according to
Gilmour et al. (1978), followed by the academic programs offered (or not offered) by
the institution. The other two studies also found that location and cost were the most
considered factors used in culling down a list of potential schools (Tierney, 1980; Astin,
1980).
Choice Phase
Many of the factors related to students’ decisions during the predisposition
phase have also been studied for the choice phase, however, the factors which were
most closely were associated with students’ selection o f an institution differ from those
which were significant earlier. The significance o f academic ability and parental
Reproduced with permission of the copyright owner. Further reproduction prohibited without permission.
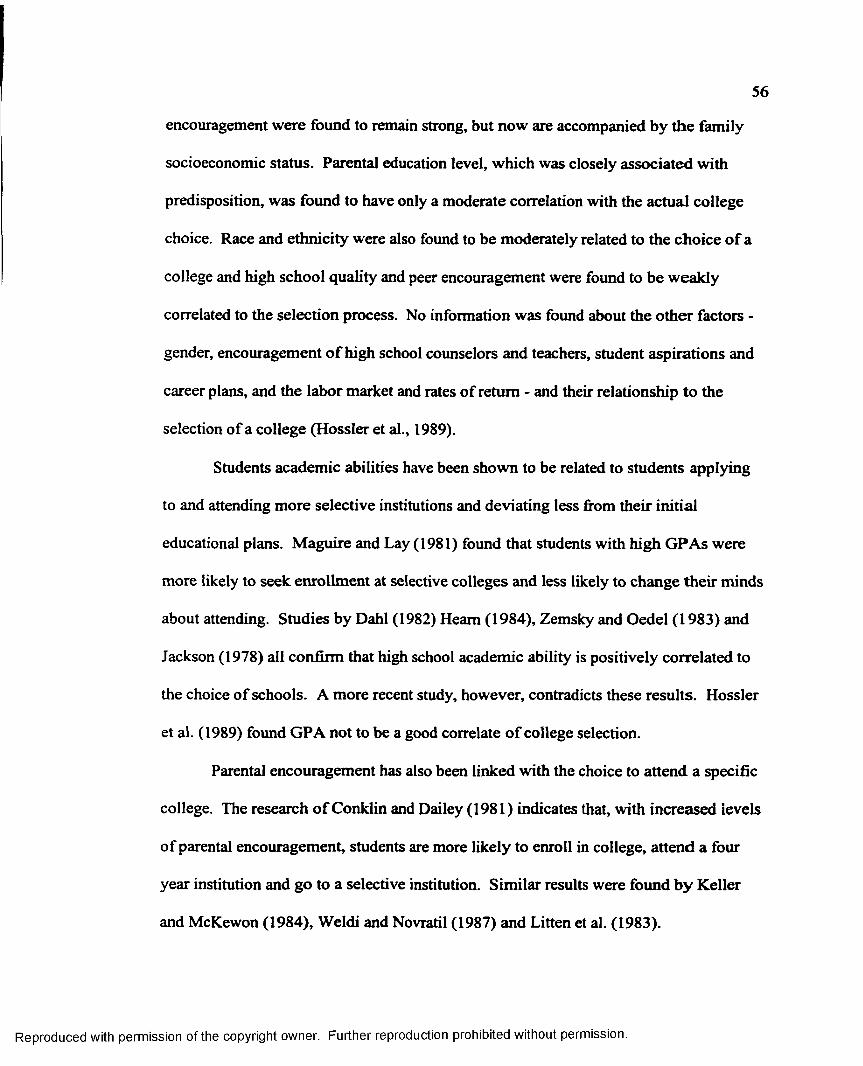
56
encouragement were found to remain strong, but now are accompanied by the family
socioeconomic status. Parental education level, which was closely associated with
predisposition, was found to have only a moderate correlation with the actual college
choice. Race and ethnicity were also found to be moderately related to the choice o f a
college and high school quality and peer encouragement were found to be weakly
correlated to the selection process. No information was found about the other factors -
gender, encouragement o f high school counselors and teachers, student aspirations and
career plans, and the labor market and rates of return - and their relationship to the
selection of a college (Hossler et al., 1989).
Students academic abilities have been shown to be related to students applying
to and attending more selective institutions and deviating less from their initial
educational plans. Maguire and Lay (1981) found that students with high GPAs were
more likely to seek enrollment at selective colleges and less likely to change their minds
about attending. Studies by Dahl (1982) Hearn (1984), Zemsky and Oedel (1983) and
Jackson (1978) all confirm that high school academic ability is positively correlated to
the choice of schools. A more recent study, however, contradicts these results. Hossler
et al. (1989) found GPA not to be a good correlate o f college selection.
Parental encouragement has also been linked with the choice to attend a specific
college. The research o f Conklin and Dailey (1981) indicates that, with increased levels
of parental encouragement, students are more likely to enroll in college, attend a four
year institution and go to a selective institution. Similar results were found by Keller
and McKewon (1984), Weldi and Novratil (1987) and Litten et al. (1983).
Reproduced with permission of the copyright owner. Further reproduction prohibited without permission.

57
Socioeconomic status, which was found to have a moderate correlation with
college aspirations during the predisposition phase, appears to be closely related to the
selection o f a particular postsecondary institution. Five studies all indicate that students
from high socioeconomic status families are more likely to apply to high status or more
selective schools than those from middle and lower income level families (Hearn, 1984;
Spies, 1978; Maguire and Lay, 1981; Chapman, 1979; Zemsky and Oedel, 1983).
Although family income is related to students’ selection o f colleges, it appears to have
little relation to students’ concerns for the cost o f attendance. Leslie et al. (1977),
Tiemey (1980), and Maguire and Lay (1981) found only moderate correlations between
socioeconomic status and institutional cost.
The research on parental levels o f education indicates that as parents’ education
increases, students tend to enter the choice stage earlier and are more likely to attend
selective institutions. There is little evidence, however, that this factor is significantly
related to the likelihood o f attendance. Litten et al. (1983), studying six market regions,
(Baltimore/Washington, Chicago, Dallas/Ft. Worth, Minneapolis/St. Paul,
Denver/Bolder, and San Francisco/Oakland) found that levels o f parental education
were positively associated with the preference o f high-ability students for exclusive,
private colleges. In another study, Hearn (1984) also found that parental education was
positively correlated to students attending more selective institutions. Two qualitative
studies utilizing student interviews showed that students with college educated parents
applied earlier, applied to more colleges and selected their institutions earlier than those
who’s parents did not attend (Lewis and Morrison, 1975, Gilmour et al. 1978).
Reproduced with permission of the copyright owner. Further reproduction prohibited without permission.

Research has demonstrated the correlation o f race and ethnicity with
postsecondary educational plans to be moderate although too few studies have been
conducted to reach any definitive conclusions. Heam (1984) conducted a longitudinal
study using PS AT, SAT, ACT and CIRP data and found that African American students
were less likely to apply to more selective institutions. Stewart et al. (1987), in his
study o f Michigan State students, found that African American students were more
concerned with financial aid awards than college status. Neither o f these studies
controlled for the effects o f ability or socioeconomic status, so it is uncertain that they
lend accurate information about the relationship between race and ethnic background
and the choice process. Another study found college plans o f White and African
American high school seniors to follow similar paths (Hauser and Anderson, 1991).
Few studies also are available addressing the relationships o f peer
encouragement and the quality o f the high school attended with college choice. In both
cases, what information is available indicates that these factors have little correlation
with the matriculation decisions made during the choice phase. Both Jackson (1978), in
his analysis o f NLS data, and Gilmour et al. (1978), in their longitudinal study o f high
school seniors, found that peers did not have any influence on the decision to attend a
specific college. Although Falsey and Heynes (1984) conclude that students attending
private high schools were more likely to attend selective colleges, they fail to control for
ability, socioeconomic status and parental encouragement. Without this information,
little reliance can be put on their results.
Reproduced with permission of the copyright owner. Further reproduction prohibited without permission.

59
From the research discussed above, it is apparent the knowledge o f the college
choice process is extensive. Certainly, there is a fairly thorough understanding o f the
factors which are associated with an individual’s desires to addend college, from which
policy decisions can be made. However, the information presented so far, while
depicting how the typical individual may be influenced, is deficient in exploring the
relationships o f the choice process for specific populations. The literature examines
race and gender variables and their interplay on student aspirations, college search and
college selection, but it does not examine the relationship o f the other variables in the
process for the different groups. For instance, during the predisposition phase, we know
student academic ability, academic track, parental levels o f education, parental
encouragement and participation in extracurricular activities are correlates o f college
aspirations for the typical student, but are these factors related to the postsecondary
desires o f special populations, especially for minority groups and women? Recent
research indicates that for African Americas, in particular, they are not.
College Choice Process for Minority Groups
The literature examining the college choice process for members o f minority
groups is somewhat limited, and in fact, has examined the process only for African
Americans. Further, it has focused on testing the appropriateness of existing models
rather than developing new theories. Researchers have yet to examine the development
o f aspirations and expectations for post secondary attendance amongst Hispanics,
Native Americans and Asian Americans. For African Americans we know the
traditional factors are not strong correlates o f postsecondary aspirations, but researchers
are only now beginning to investigate new descriptors for this population and others.
Reproduced with permission of the copyright owner. Further reproduction prohibited without permission.

60
In the 1970's, two studies (Portes and Wilson, 1976; Kerckhoff and Campbell,
1977) reexamined the findings o f the sociological models o f college aspiration using
African Americans and Whites as separate groups. The independent variables,
socioeconomic status, academic performance, influence o f significant others, ambition
and educational attainment were all found to be correlated to White students’ post
secondary aspirations. For African Americans, however, this was not the case. The
models proved to be much looser or less coherent for African Americans (Kerckhoff
and Campbell, 1977).
More recently, the combined models have been reexamined as well (Bateman
and Hossler, 1996). Parents’ expectations were found to remain as a strong correlates of
college aspirations for African Americans; and student ability was also found to be
significant. For African American females, the educational level o f their mothers was
also positively associated with the development o f post secondary plans. None the less,
the total variance explained by the models remained small. For African American
females a R2 o f .41 was found and for males, a R2 of .36. When compared to variance
levels o f .54 and .63 for White females and males respectively, these results indicate
that the models are less significant for African Americans.
The models account for less correlation between variables when family structure
is considered. For African Americans males from single parent households, parental
factors, including parental income and education and to a certain extent, parental
expectations, were less significant in the development o f college aspirations (Bateman
and Kennedy, 1997). Not surprisingly, young men living in households headed by
Reproduced with permission of the copyright owner. Further reproduction prohibited without permission.

61
females were found to be influenced by the expectations o f the mother but not the
father. In fact, school grades were more significantly correlated to college aspirations
than parental factors.
It is necessary then, to look elsewhere for information regarding behavior
patterns for minority groups. The current college choice models have been shown to be
lacking in providing an understanding o f the process for African Americans and no
information is available for other groups. New models must be developed, taking into
account new variables if we are to better understand the process for these groups.
The traditional college choice literature reviewed to this point has dealt with
models o f choice based upon sociological and/or economic variables. An examination
of the possible contribution of theory-based, psychological factors to the process has not
occurred prior to this study. Therefore, an examination o f the literature surrounding
human behavior theory is presented with implications which suggest a relationship
between the locus o f control and academic self-efficacy constructs and college
aspirations and expectations.
Psychological Factors
As indicated in Chapter 1, self-efficacy and locus o f control were examined in
this study for their significance to the college aspirations and expectations o f
adolescents, particularly for minority groups. At this point it is necessary to review the
most significant literature surrounding these constructs.
Self-Efficacv
Human behavior theory has received significant attention in recent years, with
new models being developed to explain the interaction between behavior, the
Reproduced with permission of the copyright owner. Further reproduction prohibited without permission.

62
environment and cognition. Lewin’s (1947) force-field theory provides the initial
theoretical framework from which later discussions o f the interaction between these
constructs developed. According to Lewin, B=f (P, E), where an individuals behavior
(B) is a function o f personal variables (P) and environmental variables (E). Later
theorists expand on this model by positing an interaction between personal and
environmental variables where B=f (P«E) (Bowers, 1973; Endler and Magnusson,
1975). Bandura’s (1978) theory o f reciprocal determinism adds further maturity to the
model. According to Bandura, an individual’s behavior is not simply the product o f
environmental experiences or one’s interpretation o f these experiences, but a result o f
the reciprocal interaction o f cognitive, behavioral and environmental factors.
Reciprocal determinism posits the three constructs as forming an interlocking system
with each factor influencing the other two. The environment and our cognitive
perceptions o f the environment interact with each other to effect our behavior.
Behavior, however, is not simply exogenous, but also an interactive variable in the
process. Our behavior effects both the environment and our cognitive process in a
circular model o f causation. (Bandura, 1997).
Self-efficacy is an important part o f the cognitive aspect o f reciprocal
determinism. In explaining the potency o f self-efficacy beliefs Bandura (1997) states:
such beliefs influence the courses o f action people choose to pursue, how much effort they put forth in given endeavors, how long they will persevere in the face of obstacles and failures, their resilience to adversity, whether their thought patterns are self-hindering or self-aiding, how much stress and depression they experience in coping with taxing environmental demands, and the level of accomplishments they realize.(p.3)
Reproduced with permission of the copyright owner. Further reproduction prohibited without permission.

63
Components o f Self-Efficacv
There are two aspects o f self-efficacy which are the focus o f this review:
efficacy beliefs about personal capabilities to effect specific outcomes and persistence
and motivation in pursuing performance outcomes. Although these two aspects are
somewhat interrelated, they are addressed as separate items. According to Bandura
(1977), perceived self-efficacy refers to beliefs in one’s capabilities to organize and
execute the courses o f action required to produce given alternatives. Persistence relative
to self-efficacy beliefs involves the length o f time individuals will persist in performing
specific behaviors in the face o f obstacles and adverse experiences. When beset with
difficulties individuals who seriously doubt their capabilities tend to slacken their
efforts or give up entirely, but those who possess strong feelings o f efficacy tend to
exert a greater effort to succeed (Bandura, and Schunk, 1981). The stronger one’s
perceived efficacy, the more likely an individual is to persist in one’s efforts until
mastering the challenges with which one is faced (Bandura, 1982).
Self-efficacy beliefs and persistence determine the course o f action one chooses.
Perceptions o f low self-efficacy are likely to lead to the avoidance o f specific tasks,
whereas high self-efficacy perceptions are likely to lead to more frequent undertakings
o f a task (Bandura, 1977). By undertaking activities and selecting situations we judge
are within our capabilities to successfully handle and avoiding those where we expect
failure, our life plans are impacted by our self-efficacy (Bandura, 1993). Thus, in terms
o f aspirations and, more importantly, expectations o f college attendance, an individual’s
belief in one’s ability to perform will greatly shape his or her decision to pursue a
postsecondary education.
Reproduced with permission of the copyright owner. Further reproduction prohibited without permission.

64
Determinants o f Self-Efficacv
Self efficacy is enhanced or reduced by four principle sources o f stimuli:
enactive mastery experiences, vicarious experiences, verbal persuasion and
physiological and affective states (Bandura, 1997). Performance accomplishments are
based on personal mastery experiences. When an individual experiences success in
performing a task, expectations o f future success increases, and hence the development
of greater self-efficacy. Conversely, repeated failures reduce expectations o f success
and decrease self-efficacy. Once strong efficacy expectations are developed through
repeated success, however, the negative effects o f occasional failures are reduced.
Further, if the occasional failures are overcome by persistent efforts, self-efficacy is
increased to an even greater extent (Bandura, 1997).
Vicarious experience occurs when an individual observes someone else
successfully perform a task. Seeing another achieve, can generate expectations in the
observer that one’s own efforts and persistence will also result in the successful
completion o f the task. This stimulus is dependent on inferences of social comparison
and is less dependable in its influence on self-efficacy than direct personal
accomplishments. Efficacy appraisals are partly influenced by vicarious experiences
mediated through modeled attainments. Efficacy expectations induced by modeling
alone are usually weaker and more vulnerable to change (Bandura, 1997).
Through verbal persuasion, individuals are led to believe by suggestion, that
they can successfully perform a given task. Although when taken alone, this stimulus to
the enhancement o f self-efficacy beliefs has definite limitations. When used in
Reproduced with permission of the copyright owner. Further reproduction prohibited without permission.

65
conjunction with performance accomplishments or vicarious experiences, however, it
can result in even greater effort and persistence by the individual. Social evaluation, in
the form o f performance feedback, for example, combines one’s own experiences with
verbal persuasion to have a significant impact on efficacy (Bandura, 1977). According
to Bandura (1997), ‘Teople who are persuaded verbally that they possess the
capabilities to master given tasks are likely to mobilize greater effort and sustain it than
if they harbor self doubts and dwell on personal deficiencies when difficulties arise.”
(p.101)
Bandura (1997) explains that people rely partly on somatic information derived
from physiological and emotional states in judging their capabilities. Thus, behavioral
outcomes associated with positive somatic states enhance self-efficacy strength.
Emotional arousal can also be detrimental to performance accomplishments as well as
to the development o f self-efficacy. When faced with stressful or taxing situations,
one’s anxiety increases, which in turn can be debilitating to the successful completion
of a task. Individuals are more likely to expect success when not forced to cope with
aversive arousal in attempting to perform a given task. Perceived efficacy to exercise
control over anxiety can mitigate the effects of emotional arousal and increase the
likelihood o f performance achievement (Bandura, 1977).
Self-Efficacv and College Choice
In examining the factors which have been found to be associated with college
choice - parental encouragement, parental education levels, academic achievement,
academic track and participation in extracurricular activities - the potential significance
Reproduced with permission of the copyright owner. Further reproduction prohibited without permission.

66
of self-efficacy to the process emerges. High school achievement, academic track and
participation in extracurricular activities all involve enactive mastery experiences which
affect a student’s perception o f one’s ability to succeed in an academic setting. Parental
educational levels model for the student the accomplishments o f family members which
serve as a vicarious experience. Parental encouragement frequently is manifested in the
form of verbal persuasion. Thus, the most significant factors related to a student’s
decision to pursue a college education are also likely to be closely associated with
stimuli with impact a student’s self-efficacy.
This theoretical connection between efficacy and college choice has some
empirical support. Betz and Hackett (1981), in a study o f the role o f self-efficacy in the
career decision process, found that self-efficacy expectations were related to both the
type and number o f occupations young adults considered. Further, individuals who
were less confident in their ability to complete the tasks and behaviors needed to make
effective career decisions were more likely to experience difficulties in making career
decisions (Taylor and Betz, 1983). If college attendance is considered a career decision,
then this research gives strong support to the argument that self-efficacy is related to the
college choice process. Indeed, as previously indicated, a high school graduate’s
occupational preferences have a significant relationship with the decision to pursue a
postsecondary education (Manski and Wise, 1983; Dahl, 1982; Hilton, 1982; Peters,
1977; Trent and Medsker, 1967).
Self-Efficacv Generalization
The literature surrounding the generalization o f efficacy beliefs is extremely
sparse, as this is an area o f new’ concern for researchers. However, some preliminary
Reproduced with permission of the copyright owner. Further reproduction prohibited without permission.

67
information is available. Bandura (1997) has identified five processes through which
mastery experiences can produce some degree o f generalized self-efficacy. These occur
when similar sub-skills are present, when competencies co-develop, when self-
regulatory or coping skills are involved, when commonalities are cognitively structured
across domains and when powerful performance attainments result in transform in g
experiences.
When different tasks share similar sub-skills for their completion, it can be
expected that individuals will judge their capabilities to successfully accomplish the
tasks in a like manner. For example, one would expect an athlete who possesses
extraordinary physical abilities to have high levels o f efficacy towards a variety o f
sports. Although different sports require some skills which are different, there is
enough commonality in athletic endeavors that individuals with natural athletic talent
would be expected to have higher expectations for success than those not possessing
such talent.
Even when the sub-skills for tasks are different, the perceived efficacy o f an
individual in developing competencies is affected when the skills are acquired at the
same time. In other words, when learning for different activities happens
simultaneously, the efficacy one develops tends to reflect on all the activities learned.
For example, in the school setting when both language and mathematics are taught with
equal competency within a relatively short time period o f each other, the efficacy
students have for learning both subjects is generally related. Empirically, there is
evidence demonstrating this notion o f co-development as well as the concept o f
common sub-skills (Ewart et al., 1986).
Reproduced with permission of the copyright owner. Further reproduction prohibited without permission.

68
The possession o f both self-regulatory skills and coping skills can also permit
individuals to improve their expected performances across a variety o f activities. When
one can diagnose task demands, construct and evaluate alternative courses o f action, set
proximal goals to guide efforts, create self-incentives to continue persistence in
challenging activities, and manage stress and debilitating thoughts, an individual is
much more likely to have greater efficacious beliefs across domains. Likewise, when
individuals have a heightened ability to cope, can exercise control over diverse threats,
they are more likely to have greater degrees o f generalized efficacy (Bandura, 1997).
Self-efficacy also tends to generalize across domains when commonalities are
cognitively structured across activities. If an individual realizes that increased effort
and persistence results in greater success in one area, one is likely to expect similar
effort and persistence in other areas to cause similar outcomes. This is particularly
salient in academic areas. Success achieved through effort and persistence in one
subject will tend to lead to the belief that effort and persistence in another subject will
yield the same type o f results.
Finally, Bandura (1997) indicates that transforming experiences that come as the
result o f significant performance attainments can serve to strengthen beliefs in our
abilities to achieve success in diverse areas even when these areas are unrelated.
Transforming experiences often come in the form of personal triumphs leading one to
believe in one’s ability to mobilize the effort needed to succeed in different
undertakings. These triumphs tend to leave an individual with a top o f the world
feeling, having the efficacy to surmount almost any obstacle and best almost any
challenge.
Reproduced with permission of the copyright owner. Further reproduction prohibited without permission.

69
The self-efficacy literature reviewed above focuses on variables and concerns
most pertinent to this study. An extensive documentation o f the theoretical basis of
self-efficacy and an extensive review o f empirical support for the viability of the self-
efficacy construct in human agency in multiple contexts can be found in Bandura
(1997).
Locus o f Control
Locus o f control refers to the extent to which we believe we are in control o f the
events which shape our lives. According to Julian Rotter (1966), locus o f control is “the
degree to which the individual perceives that the reward [of an event or activity] follows
from, or is contingent upon, his own behavior or attributes versus the degree to which
he feels the reward is controlled by forces outside o f himself and may occur
independently o f his own actions.” (p. 1) An individual is termed to be internal if the
individual perceives that events are contingent on one’s own behavior or relatively
permanent characteristics. An individual is termed to be external if the individual
perceives that events are the result o f luck, chance, fate or the work o f powerful others.
Social learning theory provides the conceptual background to the locus of
control construct (Rotter, 1966). According to this theory, reinforcements act to
strengthen an expectancy that a particular behavior or event will be followed by the
same reinforcement in the future. If the reinforcement does not occur with subsequent
enactments o f the behavior or event, then the expectancy is reduced or extinguished.
During our early development, we acquire experiences that differentiate events which
are causally related to preceding events and those which are not. When we perceive that
Reproduced with permission of the copyright owner. Further reproduction prohibited without permission.

70
the reinforcement is not contingent upon our own behavior, our expectancy for the
reinforcement to again occur is less than when we perceive it to be contingent. Further,
when the reinforcement fails to reoccur, our expectancy is reduced to a greater extent
than when we perceive it to be contingent upon our behavior (Rotter, 1966).
According to Rotter’s theory, an individual’s actions can be predicted on the
basis o f one’s values, expectations and the circumstances o f the situation. His social
learning theory is summarized in the following formula: NP = f(FM & NV). Need
potential (NP) or the potential for the occurrence o f a set o f behaviors that lead to the
satisfaction of a need is a function o f the expectancy that these behaviors will lead to
reinforcement (Freedom of Movement: FM) and the strength or value o f these
reinforcements (Need Value: NV). It is through freedom o f movement that the
construct, locus o f control, becomes a factor in Rotter’s theory (Rotter, 1954).
Rotter conceptualizes freedom of movement as:
the mean expectancy o f obtaining positive satisfactions as a result o f a set o f related behaviors directed toward the accomplishment o f a group o f functionally related reinforcements. A person’s freedom o f movement is low if he has a high expectancy of failure or punishment as a result of the behaviors with which he tries to obtain the reinforcements that constitute a particular need. (p. 194)
Freedom o f movement, then, is a generalized expectancy o f success resulting from an
individual’s ability to remember and reflect upon previous expectancy-behavior-
outcome sequences (Lefcourt, 1982). Success and failure experiences however, do not
affect the expectancy-behavior-outcome sequence alone, but rather an individual’s
interpretation o f the causes o f these experiences is equally important. The degree to
which an individual attributes the outcome o f an experience as being the result o f one’s
Reproduced with permission of the copyright owner. Further reproduction prohibited without permission.

71
own actions or caused by external forces effects the strength of one’s expectancy for
repeated experiences o f a similar nature and, hence, one’s behavior. No matter what
experiences one has, unless they are perceived as the results of one’s own actions, they
will not be effective in altering the ways in which one sees things and consequently the
way one functions. Experiences attributed to external forces will be viewed as beyond
the control o f the individual, and therefore unlikely to reoccur regardless o f the
individual’s efforts. Consequently, the individual is unlikely to expend any amount o f
significant effort toward the recurrence of the experience.
Locus o f Control and Human Behavior Studies
Extensive empirical evidence for the linkage between locus of control and
human behavior has been generated over the past forty years. In experiments involving
individuals attempting to complete routine tasks while subjected to loud distracting
noises, researchers found when the participants could anticipate the noises and thus
prepare for the distractions, they were far more successful in completing the assigned
tasks ( Glass, Reim and Singer, 1971; Glass and Singer, 1972; Glass, Singer and
Friedman, 1969; Reim, Glass and Singer, 1971). By having the ability to anticipate the
distractions and preparing for the intrusions, individuals demonstrated a higher level o f
perceived personal control over the situation. Similar studies have been able to replicate
these findings (Blechman and Dannimiller, 1976; Sherrod, 1974; Sherrod and Cohen,
1978). Experiments using shock to individuals as a negative stimulus, demonstrated
that uncontrolled shock has more deleterious effects upon complex learning task
performances than controllable shock (Golin, 1974). In studies of social situations,
Reproduced with permission of the copyright owner. Further reproduction prohibited without permission.

72
greater perceived control resulted in more positive interactions. Senior citizens in
nursing homes, who were allowed to determine the time of visits by volunteers were
found to be more active than those who could not control visitation hours (Schulz,
1976). Students living in residence halls with predictable, controllable traffic patterns
expressed a more positive attitude toward their college experiences than those who lived
in situations where traffic patterns were sporadic and uncontrollable (Baum, Aiello and
Calesnick, 1978).
Locus of Control and Adolescent Academic Achievement
Several decades o f research has demonstrated that locus o f control and academic
achievement among adolescents are closely linked. The perceptions students maintain
about the amount o f control they have over academic successes and failures contribute
significantly to their subsequent school performance (Skinner, Wellborn and Connell,
1990). Students who display initiative, intrinsic motivation and personal responsibility
tend to achieve greater academic achievement than those who attribute achievement to
factors beyond their personal control (Zimmerman, 1990). Thus, an internally-oriented
locus o f control has been found to more likely to result in success in school than an
externally-oriented locus o f control (Clarke-Stewart and Friedman, 1983; Seligman,
1975, Skinner, Wellborn, and Connell, 1990). Adolescents who think they are
personally responsible for their successes have been found to spend more time doing
homework, try longer to solve complex problems and get higher grades than students
who think events are beyond their personal control (Crandall, Katkovsky, and Crandall,
1965; Franklin, 1963; McGhee and Crandall, 1968). In fact, one study found school
Reproduced with permission of the copyright owner. Further reproduction prohibited without permission.

73
achievement to correlate more highly with locus o f control than with measures of
intelligence (Nowiski and Strickland, 1973).
Locus o f control as a factor o f academic success has been examined in a variety
of educational settings. Students with stronger beliefs in fate or chance determining
outcomes have been found to be less motivated to achieve success than students with
stronger beliefs in internal controls in both cooperative and competitive learning
settings (Lester, 1992). Students with an external locus of control have also been found
to set less difficult goals for themselves when given the opportunity (Benham, 199S).
Adolescents tend to subconsciously create impediments to their own performance or
self-handicap themselves when academic performance is attributed to external factors
(Murray, 1992).
Measures o f Locus o f Control
Early efforts at developing measures o f individual differences in a generalized
belief in internal and external sources o f psychological control were undertaken by
Phares (1957) and James (1957). In his study o f chance and skill effects on
expectancies for reinforcement, Phares developed a Likert-type scale with 26 items, half
stated to reflect external attitudes and half stated to reflect internal attitudes. James
employed a similar approach using 26 items evenly divided between external and
internal orientations, but added filler items to mask the intentions o f the test. The work
of Phares and James was followed by Rotter (1966) who undertook the construction o f a
100 item, forced choice scale which developed specific subscales to measure areas such
as achievement, affection and general social and political attitudes. This scale was then
Reproduced with permission of the copyright owner. Further reproduction prohibited without permission.

74
item analyzed and factor analyzed and reduced to a 60 item scale based on internal
consistency criteria. By correlating the subscales o f the 60 item scale with the
Marlowe-Crowne Social Desirability Scale (Crowne and Marlowe, 1964) and
conducting tests for item validity, the scale was reduced to 23 items. By adding seven
filler items, also to mask the intent of the measure, the final version o f the Internal-
External Locus o f Control Scale was developed.
Although the I-E Scale was designed to incorporate specific subscales, Rotter
reports that factor analyses “indicate that much o f the variance was included in a general
factor” (Rotter, 1966, p. 16). In his study o f Ohio State undergraduate students he finds
only a small degree o f variance attributed to factor subscales. Similar results were
ascertained by Franklin (1963) in his study o f 1000 high school students. Here
moderate loadings were found for the subscales but 53% of the total scale variance was
attributed to the general factor. Subsequent studies have determined quite different
results with the factor analysis o f the Internal-External Locus o f Control Scale.
Typically when two or more factors are identified they correspond to the following
constructs: general luck, control ideology, political control, success via personal
initiative, interpersonal control, control in an academic situation, and control in an
occupational setting (Marsh and Richards, 1984). Mirels (1970) found general control
and political control to be evident in a two-factor solution, and most other studies also
identify these sub-scales. In addition to these two factors, Gurin et al. (1969) and
Sanger and Alker (1972) also identified a personal control factor in their studies.
Abrahamson et al. (1973), on the other hand, report an interpersonal or social factor as a
Reproduced with permission of the copyright owner. Further reproduction prohibited without permission.

75
third factor along with general control and political control in a three-factor solution.
When more than three factor emerge, an academic control factor is often identified
(Garza and Widlak, 1977; Little, 1977; Watson, 1981; and O’Brian and Kabanoff,
1981), or an occupational factor (Gurin et al., 1978). Another approach to factor
analyzing Rotter’s Scale has been to convert the scale to a 46 Likert-type scale. In
studies utilizing this approach multiple factors have been identified. Zuckerman and
Gerbasi (1977) report the extraction of four factors in their study and Collins (1974)
describes four separate components to the scale, the belief in a difficult world, a just
world, a predictable world and a politically responsive world.
Summarizing the numerous factor analyses o f the I-E Scale, Marsh and Richards
(1984) note that in most studies the loadings found are small, some items do not load
substantially on any factor and some items load on more than one factor.
Chapter Summary
This chapter provides a review of literature pertinent to understanding college
choice and college choice models, with a particular concern for minority students and
psychological constructs which have previously been excluded from consideration into
the models.
Reproduced with permission of the copyright owner. Further reproduction prohibited without permission.
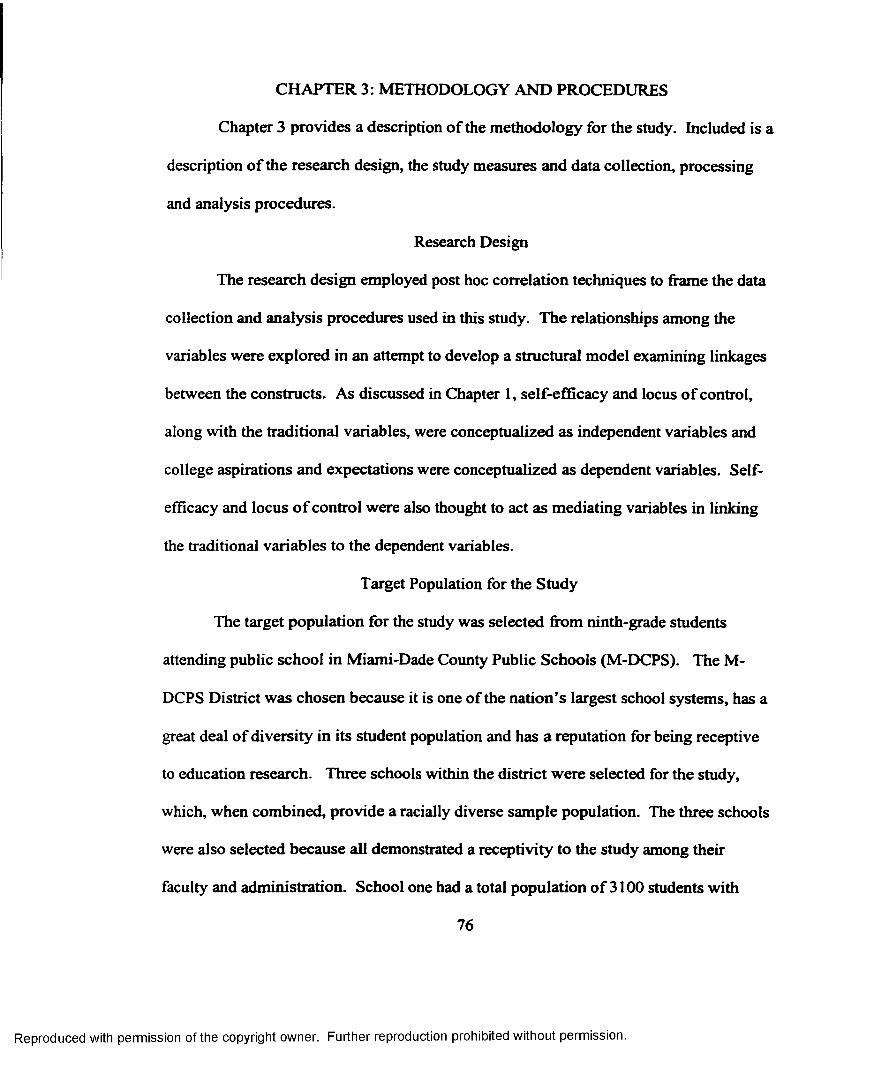
CHAPTER 3: METHODOLOGY AND PROCEDURES
Chapter 3 provides a description o f the methodology for the study. Included is a
description o f the research design, the study measures and data collection, processing
and analysis procedures.
Research Design
The research design employed post hoc correlation techniques to frame the data
collection and analysis procedures used in this study. The relationships among the
variables were explored in an attempt to develop a structural model examining linkages
between the constructs. As discussed in Chapter 1, self-efficacy and locus o f control,
along with the traditional variables, were conceptualized as independent variables and
college aspirations and expectations were conceptualized as dependent variables. Self-
efficacy and locus o f control were also thought to act as mediating variables in linking
the traditional variables to the dependent variables.
Target Population for the Study
The target population for the study was selected from ninth-grade students
attending public school in Miami-Dade County Public Schools (M-DCPS). The M-
DCPS District was chosen because it is one of the nation’s largest school systems, has a
great deal o f diversity in its student population and has a reputation for being receptive
to education research. Three schools within the district were selected for the study,
which, when combined, provide a racially diverse sample population. The three schools
were also selected because all demonstrated a receptivity to the study among their
faculty and administration. School one had a total population o f 3100 students with
76
Reproduced with permission of the copyright owner. Further reproduction prohibited without permission.

77
55% White, 18% African American and 23% Hispanic. The ninth-grade class at school
one had an enrollment o f 959 students, with 50% White, 22% African American and 23
% Hispanic. School two had a total population o f 3031 students with 19% White, 53%
African American and 25% Hispanic. The ninth-grade class at school two was
comprised o f 750 students, 10% White, 62% African American and 24% Hispanic.
School three had a total population o f4204 students with 4% White, 6% African
American and 88% Hispanic. The ninth-grade class at school three was comprised of
1513 students, 5% White, 4% and 91% Hispanic. Taken together, the three schools
provided a target population o f 3222 ninth-grade students. O f these, 19.5% were White,
24.5% were African American and 54.7% were Hispanic (Miami-Dade County Public
Schools, 1998). Figure 3.1 provides the profile of the population by school and race.
The questionnaire was administered to ninth-grade students at the three schools in
language arts class.
Ninth-grade students were selected for the study since, at this stage of a
student’s development, postsecondary plans have been, or are being, developed. In an
extensive review o f the college choice literature, Hossler et al.(1989) report that most
high school students have already made their decisions about going to college by the
freshman or sophomore years. Further, plans made by students during the ninth-grade
have been found to be relatively stable throughout a student’s high school career
(Schmit and Hossler, 1995).
Reproduced with permission of the copyright owner. Further reproduction prohibited without permission.

78
Table 3.1
Profile o f Population bv School and Race
Race School 1 Frequency Percent
School 2 Frequency Percent
School 3 Frequency Percent
All Grades
African American 549 18 1595 53 247 6
Asian American 136 4 115 4 55 1
Hispanic 699 23 745 25 3720 88
Native American 7 0 3 0 0 0
White 1692 55 569 19 182 4
Other 17 1 4 0 0 0
Total 3100 100 3031 100 4204 100
Race School I Frequency Percent
School 2 Frequency Percent
School 3 Frequency Percent
9th Grade
African American 207 22 464 62 58 4
Asian American 42 4 27 4 15 1
Hispanic 218 23 177 24 1370 19
Native American 2 0 3 0 0 0
White 482 50 77 10 70 5
Other 8 1 2 0 0 0
Total 959 100 750 100 1513 100
Note: Due to rounding percentages may not total to 100.
Reproduced with permission of the copyright owner. Further reproduction prohibited without permission.

79
Instrumentation and Measures
A student questionnaire containing three instruments, all adaptations o f existing
measures, was used for data collection (See Appendix A for a copy o f the instruments).
To provide data about the five traditional factors related to college aspirations and
expectations - parental encouragement, parental education level, student’s academic
achievement, high school track and participation in extracurricular activities - questions
taken from the National Education Longitudinal Study o f 1988 (U.S. Department of
Education, Office of Educational Research and Improvement, 1992) were used. Self-
efficacy data were collected by using an adapted version o f the academic section o f
Bandura’s (1989) Children’s Self-Efficacv Scale. The instrument was adapted by the
addition o f five questions, two designed to measure generalized self-efficacy and three
others to provide further insight into persistence as a component o f academic self-
efficacy. Locus of control data was collected using Rotter’s (1966) Internal-External
Locus of Control Scale. In addition to these instruments, college aspirations and
expectations were ascertained by asking two questions, one directed at each concept.
Students were also asked to respond to demographic questions to delineate race, gender,
age and socioeconomic status. Socioeconomic status was determined by asking
students whether or not they participated in the district’s free or reduced lunch program.
Pilot Testing
Prior to administering the questionnaire to the target population, a pilot test was
conducted with a class o f ninth-grade students attending a public high school in a rural
Louisiana community. The pilot test was designed to examine the readability o f the
Reproduced with permission of the copyright owner. Further reproduction prohibited without permission.

80
questionnaire, the length o f time needed for its completion and to identify any general
problems which students might encounter in answering the questions. The test was
administered by a teacher to her algebra class comprised o f 20 regular track students, 10
of whom were White, 8 African American and 2 Asian American (Vietnamese). The
time that it took the students to complete the questionnaire was recorded by the teacher,
and the following questions were asked o f the class and discussed in an open forum: a)
What difficulties did you have in completing the questionnaire? b) Were the verbal
instructions for completing the questionnaire adequate and easy to understand? c) Were
the written directions adequate and easy to understand? d) Did you have any difficulties
with any particular section o f the questionnaire? e) Did you have any difficulties with
any particular question on the questionnaire? and f) Do you have any recommendations
on how the questionnaire can be improved?
Generally, the students who participated in the pilot test o f the questionnaire
were able to answer the questions on the instrument without significant difficulty. The
instruments required between 15 and 19 minutes for the students to complete, and no
substantive problems were encountered. Only a few modifications were necessary to
make the instrument more readable and easier to understand. For example, the
instructions for answering questions 17-45 were shortened and simplified to provide
more clarity, and further elaboration was added to question 50. With these
modifications, the final instrument was developed and administered to the study’s target
population.
Reproduced with permission of the copyright owner. Further reproduction prohibited without permission.

81
Internal-External Locus o f Control Scale
The Internal-External Locus o f Control Scale was designed to ascertain the
subjects’ belief about the nature o f the world particularly with expectations about how
reinforcements are controlled. It is a measure o f generalized expectancy, addressing the
value the subject places on internal control but does not directly address the preferences
for internal or external control (Rotter, 1966).
Structure/Scoring
The Scale followed earlier efforts by Phares (1957) and James (1957) to develop
measures o f generalized expectancy or belief in external control as a psychological
variable. Initially a questionnaire with a hundred forced-choice items, Rotter’s measure
was factor analyzed and reduced to a 60 item scale and then reduced further to 23 items
after correlation with the Marlowe-Crowne Social Desirability Scale (Crowne and
Marlowe, 1964). The final version o f the scale is a 29 item, forced-choice test which
includes 6 filler items for the purpose of making the test less susceptible to response set.
For each item, subjects are instructed to choose between two statements, indicating
which one most closely corresponds with their beliefs. One statement corresponds to an
internal orientation, and the other corresponds to an external orientation.
The Scale is scored in the direction o f external control; the higher the score, the
greater the external orientation o f the individual. For each choice of a statement which
indicates an external orientation one point is given, but no points are given for the
choice of an internally oriented statement. Thus, the individual who chooses a greater
number o f external statements than internal statements will have a higher score on the
scale.
Reproduced with permission of the copyright owner. Further reproduction prohibited without permission.

82
Validity
The validity o f Rotter’s scale was ascertained by Rotter both by studying
predicted differences in behavior o f individuals above and below the median o f the scale
and from correlations with other locus of control measures. The scale has been
administered to numerous groups including Peace Corps trainees (Rotter, 1966), African
American inmates (Lefcourt and Ladwig, 1965) and high school seniors (Franklin,
1963). Given these different populations certain pre-testing assumptions are possible
about expected outcomes based on the conceptualization o f the construct, locus o f
control. One would expect Peace Corps trainees to exhibit a much greater internal
frame o f reference than African American inmates. Individuals would not volunteer for
the Peace Corps unless they have a relatively high expectation that their efforts overseas
would have a positive impact on the lives of the people with whom they work. In other
words, they have a great deal o f confidence that they control the outcomes o f their
efforts. Conversely, inmates are incarcerated into a prison system which is nearly in
total control o f every aspect o f their lives and very few actions they undertake impact
the outcomes they experience. It would be expected that prisoners would have
relatively high external frames o f reference. The frame o f reference for high school
seniors, in all likelihood, would be spread across the range from highly internal to
highly external based on the life experiences o f the individuals.
In the studies involving these groups, the conceptual assumptions as to their
levels o f internal or external orientation were confirmed. The mean score for Peace
Corps trainees on the Scale was 5.94 (Rotter, 1966) while African American inmates
Reproduced with permission of the copyright owner. Further reproduction prohibited without permission.

83
recorded a much higher mean score o f 8.97 (Lefcourt and Ladwig, 1965). When the
Scale was given to high school seniors, a mean score o f 8.5 was derived; but those
students who intended to go on to college were found to be significantly more internal
than those who did not intend to extend their education beyond high school (Franklin,
1963). Since the higher one scores on the scale the greater the belief in external control,
the findings o f these studies do validate the conceptualization o f the construct.
The validity o f the scale was also ascertained by comparisons with a number of
other locus o f control instruments. The early 60 item version o f the Scale was compared
with the James-Phares measure producing correlations between .55 and .60 (Blackman,
1962; Johnson, 1961). The final version o f Rotter’s scale was found to have a biserial
correlation o f .61 when compared to a measure of internal-external control used in a
study of academic failure (Cardi, 1962).
Reliability
The reliability o f the Internal-External Locus o f Control Scale was tested for
both internal consistency, using Kuder-Richardson and Spearman-Brown split half
reliabilities, and test-test reliabilities. In a study o f Ohio State University elementary
psychology students, an r value of .73 was calculated for both the Spearman-Brown and
the Kuder-Richardson tests for the Scale (Rotter, 1966). Franklin (1963) derived a r
value of .69 when applying the Kuder-Richardson test to his data collected from high
school seniors.
When analyzing test-retest information from his data collected from Ohio State
students, Rotter (1966) derived an r value o f .72 with a retest after one month and an r
Reproduced with permission of the copyright owner. Further reproduction prohibited without permission.

84
value o f .55 with a two month retest. In an administering o f the Scale to prisoners in a
Colorado reformatory, a r value o f .78 was calculated for a one month test-retest of the
measure Rotter (1966).
Children’s Self-Efficacv Scale
Bandura’s Children’s Self-Efficacv Scale was developed as an applied
application o f the theoretical self-efficacy construct. It is designed to measure nine
different aspects o f a child’s perceived ability to successfully perform specific tasks: a)
enlisting social resources, b) achieving academically, c) self-regulating learning, d)
applying leisure time skills and participating in extracurricular activities, e) general self
regulation, f) meeting others’ expectations, g) functioning socially, h) self-assertiveness
and i) enlisting parental and community support. For the purposes o f this study only the
academic achievement section o f the Scale was used.
Structure/Scoring
The academic achievement section o f the scale is comprised o f nine questions
relating to various academic disciplines. Respondents are asked to select, using a four
point Likert type scale, how well they can learn in the disciplines. They must choose
whether they can leam not well at all, not too well, pretty well, or very well. The
measure is scored one through four with one indicating a response o f not well at all and
four indicating a response o f very well.
Validity
No information is available regarding the validity o f the academic achievement
section o f the Children’s Self-efficacv Scale by itself, although the entire instrument has
Reproduced with permission of the copyright owner. Further reproduction prohibited without permission.

85
been tested. Williams and Coombs (1996) found divergent and construct validity
results which indicate that the general theoretical framework, and the scales designed to
assess it, were valid. In a study of 500 junior and senior students attending public high
schools, they examined correlations coefficients between the nine subscale pairs and
found fairly low rates o f measurement overlap with a range of 2% to 31% o f shared
variance. They also factor analyzed all 57 items on the Scale, identifying eight factors
with eigenvalues greater than one and approximately 89% o f the total variance
accounted for by the eight-factor solution.
Reliability
The Williams and Coombs’ (1996) study also examined the reliability o f the
scale which yielded a Cronbach Alpha reliability coefficient of .92 for the entire
measure. For academic self-efficacy, the Cronbach Alpha coefficient was .74.
Additional Questions
In addition to the nine measures of academic self-efficacy five additional
questions, developed by this researcher, were added to the student questionnaire, two to
derive data regarding the generalizability o f the self-efficacy construct and three to
provide further insight into students’ persistence in the school environment. These final
three questions were added due to a lack o f attention to the concept o f persistence with
the initial nine questions. As Bandura indicates, one o f the key consequences o f self-
efficacy is how long an individual will persist in the face o f obstacles and aversive
experiences (1978). No measure o f persistence is included in the Children’s Self-
Efficacv Scale. Questions 14, 15, and 16 on the student questionnaire were added for
this purpose.
Reproduced with permission of the copyright owner. Further reproduction prohibited without permission.

86
National Education Longitudinal Study o f 1988
The National Education Longitudinal Study o f 1988 was a major study
conducted by the National Center for Educational Statistics using longitudinal
information about the achievement and characteristics o f elementary and secondary
school students. NELS:88 began with a base year survey in 1988 of 26,200 eighth-
grade students from 800 public and 200 private schools, followed up at 2-year intervals
in 1990, 1992, and 1994. Selected questions from the study were used in this study to
ascertain information from the target population about the traditional factors which have
been identified with the college choice process. Questions 46, 50, 51, 52 and 53 were
all taken from the NELS:88.
Validity
Little validity information is available for the NELS:88 study, and what is
available does not fully address the all items on the instrument. Nonetheless, the
validity of the some o f the measures used in this study has received the attention o f
researchers. Kaufman and Rasinski (1991) provide information about the quality o f
data collected for parents’ education levels and parental expectations by comparing the
students’ responses with those of parents in matched pairs. This test o f concurrent
validity resulted in a correlation between responses o f .82 with father’s education level,
.76 with mother’s education level, .41 with father’s expectations and .43 with mother’s
expectations. Another similar study, including data from the follow-up studies in 1990,
1992 and 1994 with the base year information, found the correlation for father’s
education level to be .88, mother’s education to be .84, father’s expectations to be .51
and mother’s expectations to be .50 (McLaughlin, 1997).
Reproduced with permission of the copyright owner. Further reproduction prohibited without permission.

87
The data for participation in extracurricular activities was also analyzed for
concurrent validity. By comparing student responses about the activities in which they
were involved with responses from school administrators about extracurricular
offerings, some validation o f student data was obtained. The following correlations
were found between student and administrator responses for the following activities:
Math Club: .53, Science Club: .75, Drama Club .64, Computer Club: .63 and Academic
Honors Club: .69 (Kaufman and Rasinski, 1991)
Reliability
The information available about the reliability o f the NELS:88 is even more
sparse than the validity information. McLaughlin (1997) analyzed the degree to which
the data were free of measurement errors for parental expectations and for participation
in extracurricular activities by comparing information provided in the 1988 base study
with information from the first follow-up study in 1990. This analysis resulted in a
correlation coefficient of .47 for father’s expectations and .43 for mother’s expectations.
When the two data sets were compared for participation in extracurricular activities the
following correlation coefficients were derived: Intramural Sports, .25; Interscholastic
Sports, .46; Cheerleading, .53; Drama Club, .27; Student Government, 34; Honors
Clubs, .42; and Career Clubs, .14.
Data Collection Procedures
Packaging and Distribution Procedures
Data for the study were collected with the assistance o f Miami-Dade County
Public Schools personnel. After receiving permission from the district’s central office
Reproduced with permission of the copyright owner. Further reproduction prohibited without permission.

88
to proceed with the study, the principal at one o f the sites selected for data collection
was contacted to assist with the administering o f the questionnaire. After instructing the
principal in the process, he then became the lead individual in collecting the data from
all three schools. The principal arranged for the administering o f the questionnaire at
the other two schools and instructed the principals at these sites on the methods for data
collection.
The questionnaires were packaged into packets o f thirty with a cover letter
instructing teachers about administering the instrument to their students (see Appendix
A for a copy o f the cover letter). The principal at each school distributed the packets to
teachers who administered the instrument in their language arts classes. The completed
questionnaires were returned to the principals via the packets and then returned to the
principal at the first school for shipment back to the researcher.
O f primary consideration during the data collection process was the protection
o f the anonymity o f the participants. At no time was the identity o f the individual
respondent, teacher or class attached to any questionnaire; and the packets were
separated only by school, so that interscholastic comparisons could be made.
Participation in the study was voluntary and, prior to inclusion, all students were given a
release form (see Appendix A) to be taken home for parental or guarding approval.
Data Collection Time Lines
The packets containing the questionnaires were sent to the lead principal during
the early part o f January, 1999, and administered at each o f the three schools during the
months of February and March. All questionnaires were completed and returned to the
Reproduced with permission of the copyright owner. Further reproduction prohibited without permission.

89
researcher by April 10, 1999, and delivered to the Measurement and Evaluation Center
at Louisiana State University on April 12, 1999, to be scanned.
Data Analyses
After the completion of data collection procedures and the construction of
various data files, a variety of analyses was completed to examine characteristics o f the
sample, the various measures used and to test the formal hypotheses and questions
posed. These analyses were: a) descriptive statistical analyses of all demographic and
instrument items as well as composite variables; b) factor analyses o f the sections used
to measure locus o f control and self-efficacy; c) Cronbach Alpha internal consistency
reliability analyses o f subscales and/or total scores; d) bivariate correlations among all
instrument subscales and instrument totals; e) multiple regression analyses to examine
the relative contribution and combination o f variables explaining variance in college
expectations and aspirations; and f) partial correlations between study variables while
controlling for the effects o f locus o f control and academic self-efficacy to explore
linkages between the traditional variables, locus o f control and self-efficacy, and college
aspirations and college expectations.
Descriptive Statistics
For all demographic variables and for the dependent and independent variables
summary statistics were completed including means, standard deviations, ranges of
scores, and means expressed as percentages o f the maximum possible scores for each
factored subscale o f the independent measures. These statistics were complied and
reported for the total sample and by school.
Reproduced with permission of the copyright owner. Further reproduction prohibited without permission.
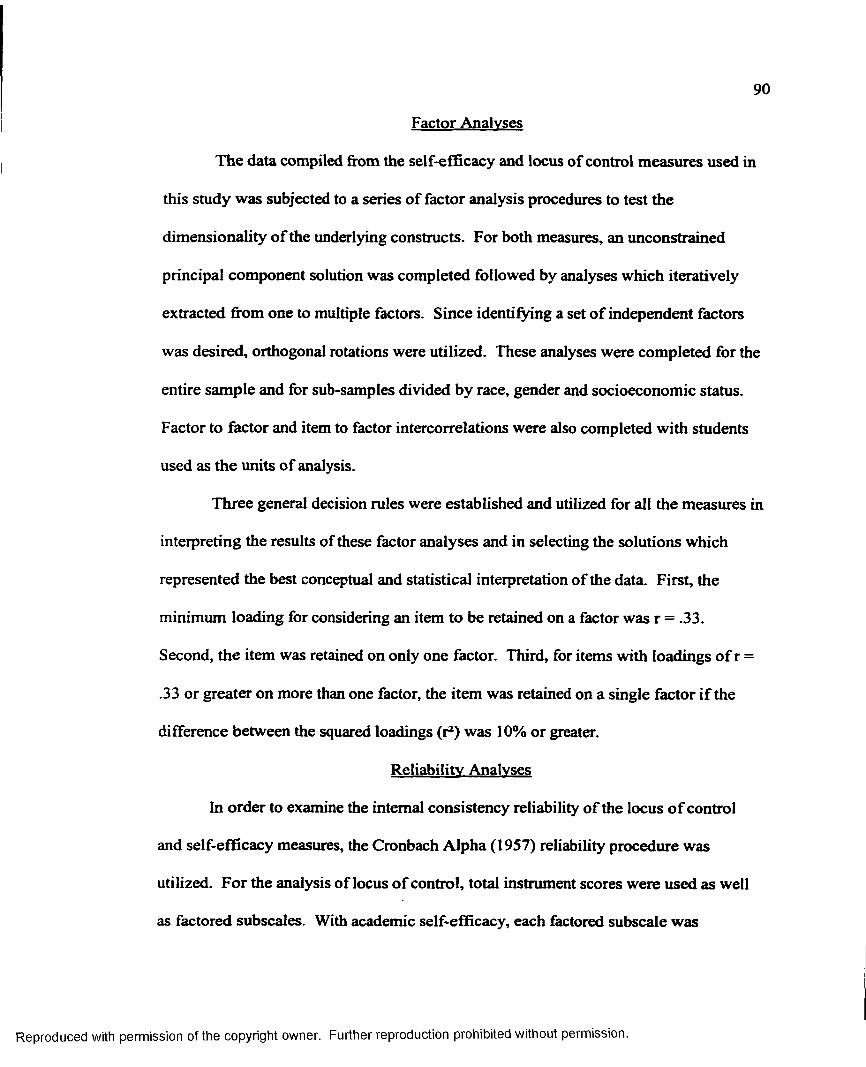
90
Factor Analyses
The data compiled from the self-efficacy and locus o f control measures used in
this study was subjected to a series o f factor analysis procedures to test the
dimensionality o f the underlying constructs. For both measures, an unconstrained
principal component solution was completed followed by analyses which iteratively
extracted from one to multiple factors. Since identifying a set o f independent factors
was desired, orthogonal rotations were utilized. These analyses were completed for the
entire sample and for sub-samples divided by race, gender and socioeconomic status.
Factor to factor and item to factor intercorrelations were also completed with students
used as the units o f analysis.
Three general decision rules were established and utilized for all the measures in
interpreting the results of these factor analyses and in selecting the solutions which
represented the best conceptual and statistical interpretation of the data. First, the
minimum loading for considering an item to be retained on a factor was r = .33.
Second, the item was retained on only one factor. Third, for items with loadings o f r =
.33 or greater on more than one factor, the item was retained on a single factor if the
difference between the squared loadings (r2) was 10% or greater.
Reliability Analyses
In order to examine the internal consistency reliability o f the locus o f control
and self-efficacy measures, the Cronbach Alpha (1957) reliability procedure was
utilized. For the analysis of locus o f control, total instrument scores were used as well
as factored subscales. With academic self-efficacy, each factored subscale was
Reproduced with permission of the copyright owner. Further reproduction prohibited without permission.

91
examined for reliability. Alpha reliability statistics were also computed for each o f
these measures, by racial subgroups (African American, Hispanic and White).
Correlation Analyses
A series o f bivariate and multivariate correlation analyses was completed to
examine relationships between the various independent variables and factored
subscales, and the dependent variables. In addition to the five traditional variables,
locus o f control and academic self-efficacy were treated as independent variables. For
locus o f control, two variables were utilized, all 23 items as a single combined measure,
and the subscale Academic Control identified by a four-factor, factor analyzed solution
of the scale (see Chapter 4 for elaboration). All four subscales identified in the four-
factor solution for academic self-efficacy were utilized, as well as three factors from a
factor analyzed solution o f only Bandura’s (1989) items in the scale. Pearson product
moment correlations were computed among the independent and dependent variables.
Regression Analyses
In order to provide additional information regarding relationships between locus
of control, self-efficacy, the traditional variables and college aspirations and
expectations, a series o f multiple regression analyses was computed. For these
analyses, the dependent variables (college aspirations and college expectations) were
regressed on the traditional variables and the locus o f control and self-efficacy variables.
Partial Correlation Analyses
To examine whether the constructs, academic self-efficacy and locus o f control
serve as mediating variables between the five traditional factors o f college choice and
Reproduced with permission of the copyright owner. Further reproduction prohibited without permission.

92
college aspirations and expectations, a series o f partial correlation analyses was
computed. For these analyses, each traditional variable was correlated with each
dependent variable while statistically controlling separately for the effects o f academic
self-efficacy and locus o f control.
Supplemental Data Set
The computation o f reliability statistics for the data set collected from M-DCPS
resulted in rather low coefficients which raised concern about the reliability o f the data.
In order to address possible causes for the low reliability coefficients, an additional data
set was collected for comparison purposes. As a result, the Student Questionnaire was
administered to a hold out sample o f ninth-grade students attending a public high school
in south-central Louisiana. Rather than relying on teachers to administer the
questionnaire, this researcher personally conducted the collection o f data and answered
any questions that arose from the participants. This sample consisted o f 131 students,
38 African Americans (29%), 1 Hispanic (.08%), 2 Native Americans (1.6%) and 86
Whites (65.6%).
The data pertaining to the measures o f locus o f control and academic self-
efficacy for the hold out sample were factor analyzed and the factors providing the best
statistical and conceptual interpretation o f the data were subjected to Cronbach Alpha
internal consistency reliability analysis. Also, the factors selected as representative
measures o f locus o f control and academic self-efficacy were correlated with the other
study variables.
Reproduced with permission of the copyright owner. Further reproduction prohibited without permission.

93
In addition to collecting the additional data, four students, an African American
male, an African American female, a White male and a White female were interviewed
to determine if any difficulties were encountered in completing the questionnaire. The
following questions were asked o f each student: a) Was the questionnaire difficult to
complete and, if so, why? b) Were there any sections o f the questionnaire that you had
trouble completing and, if so, why? c) Were there any questions that were hard to
understand and, if so, why? d) Did you complete all the questions and, if not, which
ones didn’t you complete and why? e) Did you guess on any questions and, if so, which
ones and why? and f) How seriously did you take the questionnaire?
Reproduced with permission of the copyright owner. Further reproduction prohibited without permission.
CHAPTER 4: SUMMARY OF RESULTS
Chapter 4 describes the results o f the data analyses for the study. The following
are provided in this chapter: a) descriptive statistics for the sample; b) descriptive
statistics for the independent and dependent variables; c) factor analyses of the locus of
control and academic self-efficacy measures; d) analyses o f internal consistency
reliability for the locus of control and academic self-efficacy measures; e) summary of
the intercorrelations among the instrument measures and subscales; f) analyses pertinent
to the major research hypotheses; and g) analyses pertinent to the supplemental research
questions.
The study variables analyzed in this chapter are measured in a variety o f ways.
The independent variables, participation in extracurricular activities, academic
achievement and academic track, and dependent variables, college aspirations and
college expectations are treated as one-factor, one-dimensional measures. Parental
encouragement and parents’ level o f education are measured separately for the male and
female parent or guardian. For locus o f control and academic self-efficacy, multi-factor
subscales are incorporated into the analyses.
Summary o f Descriptive Statistics for Survey Sample
The sample for the study consisted o f ninth-grade students attending one o f three
public senior high schools in the Miami-Dade County Public School system. A total of
1139 students participated in completing the survey packet, with usable data received
from 1076 students. Those surveys which were not included in the data analysis were
excluded for a variety of reason, primarily for non completion o f items. If a student
94
Reproduced with permission of the copyright owner. Further reproduction prohibited without permission.

95
completed 51 o f the 55 items, the data from the survey was included. If five or more
items were skipped, however, the survey was excluded. Multiple responses on items
where only one response was appropriate were treated as non responses. Surveys were
also excluded for obvious failure on the part of the student to complete the instrument in
an honest manner. For example, surveys which had all possible school activities
checked on item 52 were scrutinized carefully and discarded if other questionable
answering patterns were evident. All survey instruments were examined individually.
Table 4.1 provides a profile o f personal characteristics for the sample. The age
o f respondents ranged from 13 to 19 years with the majority o f the students 14 (21.4%),
15 (36.5%), 16 (19%) or 17 (13.8%) years o f age. Thirteen and nineteen year old
students accounted for only 0.6% o f the sample and those 18 years o f age accounted for
6.9%. More females (53%) participated in the study than males (43.3%). Hispanics
comprised the largest sub-sample according to race with 41.8%, followed by Whites at
29.3%, African Americans at 18.1%, Asian Americans at 5.3% and Native Americans at
1.3%. Participation in the free or reduced lunch program was the method used to
identify students from families with low socioeconomic status. Slightly less than a
quarter o f the participants (23.7%) indicated that they participated in this lunch
program. Thus, 67.9% o f the sample was from families with higher socioeconomic
status. It should be noted that the percentages for the entire population do not total to
100% due to missing frequencies.
The demographic breakdown for the sample was compared with the personal
characteristics o f all ninth-grade students attending school in the Miami-Dade County
Reproduced with permission of the copyright owner. Further reproduction prohibited without permission.

96
Table 4.1
Profile o f Sample bv Personal Characteristics o f Respondents (n=1076)
Characteristic_________________ Frequency____________Percentage o f Total
Age13 6 0.6
14 234 21.4
15 393 36.5
16 204 19.0
17 148 13.8
18 74 6.9
19 6 0.6
Frequency Missing 11 1.0
GenderMale 466 43.3
Female 570 53.0
Frequency Missing 40 3.7
RaceAfrican American 195 18.1
Asian American 57 5.3
Hispanic 450 41.8
Native American 14 1.3
White 315 29.3
Frequency Missing 45 4.2(table continues)
Reproduced with permission of the copyright owner. Further reproduction prohibited without permission.

97
Characteristic Frequency Percentage o f Total
Socioeconomic StatusFree/Reduced Lunch 255 23.7
No Free/Reduced Lunch 731 67.9
Frequency Missing 80 7.4
Reproduced with permission of the copyright owner. Further reproduction prohibited without permission.

98
Public School System (Miami-Dade County Public Schools, 1998). This comparison
revealed that some moderate differences existed between the sample and the entire
population o f students within the district. More ninth-grade males were in attendance
than females in the M-DCPS system (52.6% males, 47.4% females) but the sample had
more females (53%) than males (43.3%). While the sample percentage o f Hispanics
(41.8%) was a good approximation o f the population in the district (50.8%), the sample
varied more for the African American and White subgroups. District-wide there were
33.9% African Americans and 13.9% Whites in attendance, but the sample population
was comprised o f 18.1 African Americans and 29.3 whites. No demographic
information was available for the age range o f ninth-grade students or the number on the
reduced or free lunch program, so direct comparisons on these variables were not
possible. For all high school students in the M-DCPS system, however, 28.9%
participated in the reduced or free lunch program which corresponds well with the
23.7% sample in this study.
For comparison purposes, the demographic information was examined according
to the three predominant racial subgroups, African Americans, Hispanics and Whites.
Table 4.2 present this information. In comparing the personal characteristics of the
subgroups, few significant differences emerge. The age o f the students in all the groups
was very close to that o f the entire sample with the African American subsample being
close in age, the Hispanic subsample being slightly younger and the White subsample
being slightly older. While the White subsample had slightly more males than the entire
sample, the Hispanic subsample was very close in gender distribution to the total
Reproduced with permission of the copyright owner. Further reproduction prohibited without permission.

99
Table 4.2
Profile o f Sample bv Race. Age. Gender and Socioeconomic Status
Characteristic__________________________ Frequency_______ Percentage o f Total
African Americans (n=195)Age
13 4 2.1
14 39 20.0
15 81 41.5
16 31 15.9
17 26 13.3
18 7 3.6
19 2 1.0
Frequency Missing 5 2.6
GenderMale 80 41.0
Female 108 58.4
Frequency Missing 7 3.6
Socioeconomic Status Free/Reduced Lunch 51 26.2
No Free/Reduced Lunch 123 63.1
Frequency Missing 21 10.8
(table continues)
Reproduced with permission of the copyright owner. Further reproduction prohibited without permission.

100
Characteristic Frequency Percentage o f Total
Hispanics (n = 450)Age
13
14
15
16
17
18
19
Frequency Missing
GenderMale
Female
Frequency Missing
Socioeconomic Status Free/Reduced Lunch
No Free/Reduced Lunch
Frequency Missing
Whites (n = 315)Age
13
14
1
130
168
87
41
20
1
2
194
245
11
166
254
30
1
32
0.2
28.9
37.3
19.3
9.2
4.4
0.2
0.4
43.1
54.4
2.4
36.9
56.4
6.7
.3
10.2
(table continues)
Reproduced with permission of the copyright owner. Further reproduction prohibited without permission.

101
Characteristic Frequency Percentage o f Total
15 107 34.0
16 70 22.2
17 62 19.7
18 40 12.7
19 3 1.0
Frequency Missing 0 0.0
GenderMale 142 45.1
Female 161 51.1
Frequency Missing 12 3.8
Socioeconomic Status Free/Reduced Lunch 24 7.6
No Free/Reduced Lunch 275 87.3
Frequency Missing 16 5.1
Reproduced with permission of the copyright owner. Further reproduction prohibited without permission.

102
population and the African American subsample had a slightly larger number of
females. The only apparent differences emerged with those participating in the reduced
or free lunch program. There was little difference in the percentage o f African
Americans enrolled in the program than those enrolled from the entire sample, but a
significantly higher number o f Hispanics indicated they received either free or reduced
lunches (36.9% compared to 26.6% for the entire sample). Conversely, a smaller
percentage o f Whites participated in the program (7.6%) than the whole population.
The demographic differences between the sample population and M-DCPS can
largely be accounted for by the use of three schools in the study. Schools in the M-
DCPS vary dramatically in their racial makeup and an effort was made to select three
schools which would balance each other and provide a representative sample
population. Since similar results were found (see Chapter 4 for elaboration) when the
data were compared by race and school and the results o f the data analyses for a hold
out sample in another state were similar, the disparities between the sample and the
entire district did not effect the results of the study.
Summary o f Descriptive Statistics for Measurement Instrument Items
Descriptive statistics were calculated for each measure used to operationalize the
dependent and independent variables in the study. For the measures o f academic self-
efficacy, academic achievement, college aspirations and college expectations the means,
standard deviations and the percentages of the maximum possible score for each item
were computed. For the measures o f locus o f control, parental expectations, parents’
level o f education, participation in extracurricular activities and academic track,
Reproduced with permission of the copyright owner. Further reproduction prohibited without permission.

103
frequency distributions were calculated. Tables o f these descriptive statistics are
located in Appendix B.
The actual number o f responses varied for each measure and for each item on the
multiple item measures. The raw data were examined prior to analyses for missing
responses and, in order to maximize the number o f useable responses for the
computation o f descriptive statistics, the item grand means were substituted for missing
responses for measures where a mean was calculated. When a mean score was not
calculated the number o f missing responses is shown (see Appendix B).
The range in item means and standard deviations for each instrument and
subscale are reported in Tables 4.3 and 4.4. For the academic self-efficacy scale the
range in the means and standard deviations o f the subscales varied little although with
the fourth factor, Persistence, the means were slightly lower. The low mean score for
all subjects reported under the Academic Achievement measure were accounted for by
the African American subsample, while the White subsample accounted for the high
mean score for all subjects. The difference in the standard deviation for Academic
Achievement was the least for Whites and greatest for African Americans, except for
science, where Hispanics accounted for the highest standard deviation.
For both the College Aspiration and College Expectation measures, the White
subsample recorded the highest mean score and the lowest standard deviation. African
Americans had the lowest mean score for College Aspirations but Hispanics had the low
score for College Expectations. The highest standard deviation for College Aspirations
and College Expectations was accounted for by the African American subsample.
Reproduced with permission of the copyright owner. Further reproduction prohibited without permission.

104
Table 4.3
Summary of Item Means for All Continuous. Rank and Categorical Measures and Subscales bv Race (n = 1076)
Instrument/ Maximum Subscale Item Rating African
Americans
Means Hispanics Whites Total
Sample
Self-efficacv 4 2.68-3.46 2.73-3.43 2.68-3.30 2.72-3.35
Mathematics 4 2.80-3.03 2.73-2.94 3.07-3.22 2.92-3.00
General Subjects 4 2.68-3.46 3.01-3.43 2.71-3.30 2.84-3.35
Science/Biology 4 2.89-3.12 2.91-3.15 3.14-3.25 2.98-3.18
Persistence 4 2.73-2.86 2.74-2.90 2.68-3.04 2.72-2.96
Academic Achievement
English 5 3.73 3.75 4.31 3.94
Mathematics 5 3.25 3.47 4.02 3.64
Science 5 3.57 3.74 4.23 3.89
Social Studies 5 3.65 3.75 4.22 3.90
Colleee Aspirations 4 3.62 3.63 3.68 3.70
Colleee Expectations 4 3.57 3.51 3.77 3.61
Reproduced with permission of the copyright owner. Further reproduction prohibited without permission.

105
Table 4.4
Summary o f Item Standard Deviations for All Continuous. Rank and Categorical Measures and Subscales bv Race (n = 1076)
Instrument/ Maximum Subscale Item Rating African
Americans
Means Hispanics Whites Total
Sample
Self-efficacv 4 0.67-0.98 0.67-0.92 0.68-0.95 0.67-0.94
Mathematics 4 0.81-0.98 0.81-0.92 0.82-0.87 0.82-0.94
General Subjects 4 0.66-0.84 0.67-0.77 0.69-0.95 0.67-0.86
Science/Biology 4 0.70-0.79 0.71-0.80 0.68-0.75 0.70-0.79
Persistence 4 0.78-0.89 0.74-0.87 0.70-0.76 0.75-0.83
Academic Achievement
English 5 1.01 .91 .78 .92
Mathematics 5 1.25 1.01 .87 1.06
Science 5 .93 .94 .79 .93
Social Studies 5 1.09 1.00 .77 .97
Colleee Aspirations 4 .65 .67 .44 .61
Colleee Expectations 4 .67 .68 .48 .63
Reproduced with permission of the copyright owner. Further reproduction prohibited without permission.

106
Summary of Results o f Factor Analyses
Prior to conducting the analyses relevant to the primary research hypotheses and
secondary research questions in the study, a series o f factor analysis procedures was
completed for the self-efficacy and locus of control measures in order to determine
empirically identifiable conceptual dimensions o f the measures. The results o f these
analyses are reported in the section that follows.
Locus o f Control Factor Analyses
For this study, an exploratory factor analysis was completed for the 23 items on
the Rotter Locus o f Control scale to further test the dimensionality o f the locus o f
control construct. An unconstrained solution was computed followed by solutions
systematically extracting from one to nine factors. These procedures were completed
for the entire sample and separately for subsamples based on race and gender. Table 4.5
provides a summary o f the one-factor, principal components solution for the Internal-
External Locus of Control scale. Items were retained on factors given the decision rules
outlined in Chapter HI (p.91). Factor loadings for items retained ranged from a low o f
.38 to a high o f .46. Twelve items failed to demonstrate loadings meeting the minimum
criteria for retention in the one-factor solution. A rather low total o f 9.93% o f the
variance in the data was explained by the one-factor solution.
The results of the four-factor, orthogonal solution (Table 4.6) were ultimately
determined to be the most acceptable multiple factor representation o f the data. Both
the three and the five-factor orthogonal solutions also provided reasonable conceptual
fits with the findings o f the previous factor analysis o f the I-E scale. However, they had
Reproduced with permission of the copyright owner. Further reproduction prohibited without permission.

107
Table 4.5
Summary o f the Factor Structure Coefficients for Items Retained for the One-Factor Solution for the Internal-External Locus o f Control Scale (n = 1076)
I-ELOC Item _________________ 1 Factor*_
18 .27
19 .19
20 .25
21 .27
22 .19
23 .14
25 .20
26 .46
27 .38
28 .44
29 .41
31 .43
32 .41
33 .38
34 .39
36 .03
37 .09
38 .29(table continues)
Reproduced with permission of the copyright owner. Further reproduction prohibited without permission.

108
I-ELOC Item 1 Factor
39 .38
41 .44
42 .03
44 .38
45 .07
Variance Explained6 = 9.93%
Bold type indicates item loadings which meet criteria established for item retentiona. Principal components solutionb. Percentage o f item variance explained by the one-factor solution
Reproduced with permission of the copyright owner. Further reproduction prohibited without permission.

109
Table 4.6
Summary o f the Rotated Factor Structure Coefficients for Items Retained for the Four- Factor Orthogonal Solution for the Internal-External Locus o f Control Scale (n = 1076)
I-ELOCItem
CommunalityEstimates3 I
Factor Coefficientsn ffl IV
*18 .13 .09 .04 .29 .20
19 .15 -.02 .38 -.01 .10
*20 .12 .27 .18 .03 -.12
21 .25 .47 .07 -.16 -.05
22 .23 -.12 .24 .38 -.01
23 .26 -.07 .05 .01 .50
*25 .09 .07 .11 .02 .27
26 .35 .54 .24 i o -.02
27 .44 .23 -.01 .61 -.14
28 .42 .24 .58 .10 -.13
29 .22 .44 .02 .12 .11
31 .41 .55 -.16 .29 0
32 .51 .12 -.05 .70 .08
33 .50 -.08 .66 .19 .15
34 .29 .34 .01 .02 .42
36 .15 -.05 -.08 -.04 .37
37 .22 -.06 .01 -.03 .43
(table continues)
Reproduced with permission of the copyright owner. Further reproduction prohibited without permission.

110
I-ELOCItem
CommunalityEstimates I
Factor Coefficients II m IV
38 .44 .17 .60 -.23 -.03
* 3 9 .17 .15 .26 . 2 0 . 2 0
41 .39 .35 . 0 2 .03 .52
42 .23 .14 0 -.36 .28
44 . 2 0 .38 0 . 2 2 .07
45 . 2 1 -.30 . 2 2 .09 .41
Variance Explained11 7.78% 6.97% 6.73% 6.67%
Total Variance Explained0 28.15%
Bold type indicates item/factor location* Item loadings do not meet criteria established for item retention on factora. Sum o f squared loadings for this four-factor solutionb. Percentage o f item variance explained by each factorc. Percentage o f total item variance explained by the four-factor solution.
Reproduced with permission of the copyright owner. Further reproduction prohibited without permission.

I l l
inherent problems which render them less desirable. Seven o f the twenty-three items
identified in the three factor solution did not load, and the solution accounted for only
22.6% o f the total item variance. The five-factor solution, on the other hand, accounted
for 33.55% o f the total item variance, but had two items which did not load and one
which had multiple loadings. Table C .l and C.2 in Appendix C contain the three and
five-factor solutions calculated for the Locus o f Control Scale.
A total o f nineteen items loaded on the four-factor orthogonal solution; five on
Factor I, four on Factors II and HI, and six on Factor IV. Factor I , identified as
Academic Control, was comprised o f items pertaining to students’ perceived abilities to
regulate personal outcomes in the school setting. Factor I accounted for 7.78% o f the
variance in the data for the four-factor solution. Factor II was labeled Politics/World
Affairs and accounted for 6.97% of the variance in the data for the solution. Items
loading on this factor represent students’ feelings regarding their potential to make a
difference in the events occurring throughout the world, particularly in the political
arena. The third factor, Leadership and Success combined students’ conceptions of
what is required to lead their peers and the degree to which luck or fate effects personal
success. This factor accounted for 6.73% of the variance in the data for this solution.
The items loading on Factor IV, labeled as Interpersonal Relations/Influence, suggest
students’ perceived control over their relationships with peers and the ability to direct
the daily events o f their own lives. Factor IV accounted for 6.67% of the variance in the
data for the four-factor solution.
Reproduced with permission of the copyright owner. Further reproduction prohibited without permission.

112
The Factor structure coefficients for this four-factor solution ranged from -.36 to
.70 with four items having loadings insufficient to be retained. The total variance
explained in the data for this solution was 28.15%. Table D. 1 in Appendix D gives an
item location index for the factored subscales o f the Internal-External Locus o f Control
Scale. Item numbers can be cross referenced with items 18 through 45 o f the Student
Questionnaire included in Appendix A.
All o f the intercorrelations between the subscales identified in the four-factor
solution proved to be positive in direction and minimal in magnitude. These
correlation were as follows: Academic Control and Politics/World Affairs, r = .16
(p<.01); Academic Control and Leadership and Success, r= .19 (p<.01); Academic
Control and Interpersonal Relations/Influence, r = .10 (p<.01); Politics/World Affairs
and Leadership and Success, r = .09 (p<.01); Politics/World Affairs and Interpersonal
Relations/Influence, r = .12 (p<.01); and Leadership and Success and Interpersonal
Relations/Influence, r = .08 (p>.01).
A four-factor solution was also calculated for three of the racial subgroups,
African Americans, Hispanics and Whites, and for males and female groups, to compare
these analysis results with the factor solution for the entire sample. Tables C.3, C.4,
C.5, C.6 and C.7 in Appendix C contain these solutions. The pattern o f item/factor
loadings for the four-factor solution for the African American subgroup was patterned
differently from the solution for the entire group, with the factor loadings which meet
the criteria established for retention changing to different factors on all but four items.
The solution for Hispanics also exhibited substantial differences in the patterning o f
Reproduced with permission of the copyright owner. Further reproduction prohibited without permission.

113
item/factor loadings. Here, thirteen of the 23 items exhibited changes in the location of
the loadings which meet the retention criteria. For Whites, the differences were less
obvious but still noteworthy, with nine items demonstrating changes in the patterning of
item/factor loadings.
The pattern of item/factor loadings for males and females also differed
significantly from the solution computed for the entire sample. For males, eighteen of
the 23 items exhibited changes in the location o f the loadings meeting the retention
criteria and for females, changes occurred in seventeen items.
Self-Efficacv Factor Analyses
A review o f previous factor analysis of the Children’s Self-efficacy scale would
have little relevance to this study since only the academic component o f the scales is
used here and additional items have been incorporated into the scale. Previous factor
analyses have been completed using the entire scale which is comprised of 57 items
with preassigned subscales for a) enlisting social resources, b) academic achievement, c)
self-regulated learning, d) leisure time skills and extracurricurlar activities, e) self
regulation, f) meeting others’ expectations, g) social settings, h) self-assertiveness and i)
enlisting parental and community support.
As was done with the locus of control measure, an exploratory principal
components analysis was also conducted for the self-efficacy scale to determine the
dimensionality o f the measure. Multiple factor solutions were computed and reviewed.
Table 4.7 summarizes the results o f the one-factor solution. A total o f twelve of the
thirteen self-efficacy items loaded on a single factor with item loadings ranging from a
low of .39 to a high of .70. This solution explained 27.02% o f the variance in the data.
Reproduced with permission of the copyright owner. Further reproduction prohibited without permission.

114
Table 4.7
Solution for the Self-Efficacv Scale (n = 10761
Self-Efficacy Item 1 Factor*
4 .70
5 .60
6 .62
7 .58
8 .58
9 .58
10 .50
11 .39
12 .39
13 .53
14 .18
15 .42
16 .48
Variance Explained1* = 27.02%
Bold type indicates item loadings which meet criteria established for item retentiona. Principal components solutionb. Percentage o f item variance explained by the one-factor solution
Reproduced with permission of the copyright owner. Further reproduction prohibited without permission.

115
A review of the multi-factor solutions for the self-efficacy scale suggested that a
four-factor, orthogonal solution represented the best statistical and conceptual
interpretation of the data. Table 4.8 summarizes the results o f this solution. The
percentage o f the total item variance explained by the four-factor solution was 58.9%
with item loadings ranging form a low o f .47 to a high o f .88. All but item number four
o f the thirteen items in the self-efficacy scale were retained in the four-factor solution
and only one retained item had a loading below .50. Item four was not retained because
it was cross loaded.
Factor I, Mathematics, consisted o f three items and accounted for 18% o f the
variance for the solution. This factor pertained to students’ beliefs in their abilities to
learn general mathematics and algebra, and their abilities to perform a specific algebraic
computation. The items which were retained on Factor II, General Subjects, depicted
students’ beliefs in their abilities to learn four diverse academic subjects: English
grammar, language skills, computers and foreign languages. The amount o f variance
for the solution accounted for by this factor was 15.67%. The third factor,
Science/Biology was comprised o f two items which accounted for 14.14% o f the
variance for the four-factor solution. Here, the perceptions o f students regarding their
ability to learn general science and biology were measured. Factor IV, Persistence
consisted o f three items which measured students’ resolve to attempt and complete
mathematic problems when faced with difficulties. This factor accounted for 11.09% of
the variance for the four-factor solution. Table D.2 in Appendix D presents an item
location index for the academic self-efficacy factored subscales and can be cross-
referenced with items 4-16 on the original instrument items presented in Appendix A.
Reproduced with permission of the copyright owner. Further reproduction prohibited without permission.

116
Table 4.8
Summary o f the Rotated Factor Structure Coefficients for Items Retained for the Four-Factor Orthogonal Solution for the Self-Efficacv Scale (n = 1076)
Self-EfficacyItem
CommunalityEstimates2 I
Factor Coefficientsn in IV
4 .51 .33 .35 .45 .28
5 .73 .84 .05 .06 .12
6 .79 .88 .05 .07 .10
7 .58 .74 .10 .13 .08
8 .80 .08 .15 .88 .03
9 .81 .09 .15 .88 .03
10 .68 -.08 .78 .12 .22
11 .33 .14 .55 .08 -.06
12 .38 .09 .59 .11 -.11
13 .61 .03 .75 .11 .18
14 .65 -.10 -.04 -.02 .80
15 .46 .28 .02 .07 .61
16 .35 .28 .20 .10 .47
Variance Explained6 Total Variance Explained1: 58.9%
18% 15.67% 14.14% 11.09%
Bold type indicates item/factor locationa. Sum of squared loadings for this four-factor solutionb. Percentage o f item variance explained by each factorc. Percentage o f total item variance explained
Reproduced with permission of the copyright owner. Further reproduction prohibited without permission.

117
The intercorrelations among the academic self-efficacy subscales were as
follows: Mathematics and General Subjects: r = .17 (p < .01); Mathematics and
Science/Biology: r = .22 (p < .01); Mathematics and Persistence: r = .31 (p < .01);
General Subjects and Science/Biology: r = .33 (p < .01); General Subjects and
Persistence: r = .20 (p < .01); and Science/Biology and Persistence: r = .16 (p < .01).
As with the Internal-External Locus o f Control Scale, a four-factor solution was
computed for the African American, Hispanic and White subgroups in the sample for
academic self-efficacy, as well as for males and females. These solutions are shown in
Tables C.8, C.9 C.10, C .l 1 and C.12 o f Appendix C.
Unlike the four-factor solutions by race and gender for the locus of control scale,
these subgroups demonstrated only moderate differences from the entire group in how
the items loaded on the various factors. With the White subsample the location of the
factor loadings, which met the criteria established for retention, remained essentially
unchanged. For the Hispanic subsample, the only demonstrated difference occurred
with item sixteen (If you can’t solve a particular kind of math problem how likely are
you to attempt to solve a similar problem?) which did not have a sufficient loading on
any one factor. The differences were slightly greater for the African American
subsample with changes in the pattern of loadings for five items. Here, item four
demonstrated a significant loading on factor two but with the entire sample, failed to
meet the criteria for item/factor retention; items eleven and twelve loaded on factor four
instead o f factor two; and items fifteen and sixteen loaded on factor one instead o f factor
four. For the male subsample, the only difference from the entire sample was that item
Reproduced with permission of the copyright owner. Further reproduction prohibited without permission.

118
seven did not load on the first factor and item 16 loaded on Factor I instead o f Factor
IV. The only difference between the female subsample and the total sample was in item
four which loaded on the third factor rather than having multiple loadings.
A series o f factor analyses was also completed for the items on the academic
self-efficacy scale which were taken from the Bandura scale (Bandura, 1989). No
appreciable differences were found in these analyses from those previously
demonstrated by the factor analysis o f all 13 o f the academic self-efficacy items.
Summary o f Factor Analyses
The factor analyses o f the measures for locus o f control and academic self-
efficacy resulted in quite different results. While a four-factor orthogonal solution was
deemed to be most representative solution for both measures, the strength o f the factor
loadings for locus o f control were much lower than those for the academic self-efficacy
measure. The total variance explained for locus o f control was relatively low at 28.15%
but considerably higher for academic self-efficacy at 58.9%. Also, when the factor
structures o f the race and gender subsamples were compared with the entire sample, the
results for the locus o f control measure differed substantially, while the results for
academic self-efficacy remained relatively stable.
Summary of Results o f Reliability Analyses
Cronbach Alpha internal consistency reliability coefficients were computed for
the locus o f control and academic self-efficacy subscales identified through the various
factor analyses. Table 4.9 contains a summary o f these coefficients.
Reproduced with permission of the copyright owner. Further reproduction prohibited without permission.

119
Table 4.9
Summary o f Standardized Cronbach Alpha Reliability Coefficients for Locus o f Controland Academic Self-Efficacv Subscales (n = 1076)
Instrument/Subscale Alpha Coefficient
Locus o f Control (23YSubscales
Combined 23 Items .54
Academic Control (5)b .41
Politics/World Affairs (4) .42
Leadership and Success (4) .17
Interpersonal Relations/Influence (6) .34
Academic Self-efficacv fl31Subscales
Mathematics (3) .80
General Subjects (4) .63
Science/Biology (2) .79
Persistence (3) .43
a. Total number o f items for the factor-analyzed version o f the instrument in this studyb. Number o f items on the subscale
Reproduced with permission of the copyright owner. Further reproduction prohibited without permission.

120
Locus o f Control Reliability Analyses
Alpha coefficients were computed for the four factored subscales and for all 23
items on the Internal-External Locus o f Control Scale as a single measure. The
resulting coefficients were all quite low, especially for the subscales identified in the
four-factor solution. The highest coefficient was for Politics/World Affairs (Alpha =
.42) and the lowest was with Leadership and Success (Alpha = .17). For Academic
Control the Alpha coefficient was .41 and for Interpersonal Relations/Influence Alpha =
.34. The Alpha coefficient for the 23 items combined into a single item measure,
increased to only .54.
Academic Self-Efficacv Reliability Analyses
Alpha coefficients were also computed for the four subscales identified in the
four-factor solution for the measures o f academic self-efficacy. These results were
higher than those computed for locus o f control ranging from a high o f .80 for
Mathematics to a low o f .43 for Persistence. Although this latter reliability coefficient
is rather low, the other two subscales demonstrated much higher coefficients with
Science/Biology at .79 and General Subjects at .63. This information is also shown in
Table 4.9
Reliability Analyses bv Racial Subgroups
Cronbach Alpha internal consistency reliability coefficients were also computed
for the subscales o f various measures by racial subsamples which are reported in Tables
E .l, E.2 and E.3. In most cases, the reliability coefficients for the African American
and Hispanic subsamples were lower and the coefficients computed for the White
subsample were higher than those computed for the entire sample.
Reproduced with permission of the copyright owner. Further reproduction prohibited without permission.

121
Reliability Analyses bv School
In order to provide information about possible inconsistencies in data collection
between the three schools used in the study, Cronbach Alpha internal consistency
reliability coefficients were computed for the data sets from each school. There were no
appreciable differences in the magnitude and direction of these coefficients when
compared to the coefficients calculated for the entire sample indicating little systematic
between school error.
Rationale for Final Structure o f Measures
Prior to submitting the study measures to analyses pertinent to the primary
research hypotheses and the secondary research questions, certain decisions were made
regarding the structure o f the measures used in the analyses. First, it was determined
that locus o f control would be represented by two measures, one measure for the
combined 23 items o f the Internal-External Locus o f Control Scale, and one measure for
the first factor identified in the four-factor orthogonal solution, Academic Control. The
combined 23 item measure was deemed more desirable than the four factors of the four-
factor solution because the internal consistency reliability coefficient for this measure
was higher than the coefficients calculated for the four subscales. The subscale,
Academic Control, was added to the analyses because this factor provides the best
conceptual fit with the focus of the study, determining motivators for continued
academic pursuit.
The second decision was to utilize the four factors identified in the four-factor
orthogonal solution for academic self-efficacy. This solution provided four clear
Reproduced with permission of the copyright owner. Further reproduction prohibited without permission.

122
subscales for the construct, three o f which exhibited reasonably high internal
consistency reliability coefficients. Although the reliability for the fourth factor,
Persistence, was relatively low, this measure was included in the study due to the need
to explore the conceptual significance o f this aspect o f the total efficacy construct.
Summary o f Analyses for Primary Research Hypotheses
The six primary research hypotheses o f the study all posit a statistically
significant (p<.01; one-tailed tests) relationship between the measures o f locus o f
control and self-efficacy and the measures o f college aspirations and expectations. The
first four hypothesize that statistically significant correlations exist between the locus of
control and self-efficacy measures and the dependent variables. Hypotheses five and
six, expand upon the relationship by postulating that locus o f control and self-efficacy
account for a statistically significant amount o f variation in students’ college aspirations
and expectations beyond that accounted for by the five traditional variables. The more
conservative .01 level o f significance was chosen for this study to decrease the
possibility o f correlations occurring by chance being selected as significant, given the
large sample size.
Bivariate Correlation Analyses
To address Hypotheses 1-4, bivariate correlation analyses were conducted
between the study variables and these correlations are shown in tables 4.10-4.13. In
addressing each o f these hypotheses, in turn, reference is made to these tables.
Research Hypothesis 1: There is a statistically significant, positive relationship
between adolescents’ levels o f academic self-efficacy and their aspirations to attend
college.
Reproduced with permission of the copyright owner. Further reproduction prohibited without permission.

123
Table 4.10
Summary o f Intercorrelations o f College Aspirations and College Expectations withOther Study Variables
Instrument/Measure Aspirations Expectationsr n r n
Academic Self-efficacyMathematics .19* 1065 .20* 1063
General Subjects .21* 1065 .18* 1063
Science/Biology .24* 1065 .21* 1063
Persistence .18* 1065 .17* 1063
Locus o f Control23 Combined Items -.09** 892 -.10** 890
Academic Control -.11* 1000 -.11* 999
Parental ExpectationsFather/Male Guardian .25* 778 .24* 778
Mother/Female Guardian .29* 813 .24* 814
Parents’ Education LevelFather/Male Guardian .27* 880 .23* 880
Mother/Female Guardian .21* 899 .23* 900
Academic Achievement .33* 1017 .41* 1017
Extracurricular Activities .18* 924 .20* 927
High School Track -.07 721 .01 724
* p<.001, ** p<.01
Reproduced with permission of the copyright owner. Further reproduction prohibited without permission.

124
Table 4.11
Summary o f Intercorrelations o f Academic Self-Efficacv Subscales with Other Study Variables
Instrument/Measure Math G.S. S/B Pers.________________________________r n r n r n r n
Locus o f Control23 Combined Items -.13* 895 -.13* 895 -.09** 895 -.11* 895
Academic Control -.15* 1008 -.16* 1008 -.10** 1008 -.13* 1008
Parental Expectations Father/Male Guardian .25* 781 .14* 781 .15* 781 .10**781
Mother/Female Guardian .22* 819 .16* 819 .13* 819 .11**819
Parents’ Education Level Father/Male Guardian .20* 883 .01 883 .15* 883 .06 883
Mother/Female Guardian .14* 915 .02 905 .10** 905 .04 905
Academic Achievement .44* 1023 .20* 1023 .38* 1023 .26* 1023
Extracurricular Activities .21* 932 .18* 932 .14* 932 .09**932
High School Track .05 729 .03 729 .03 729 .01 729
College Aspirations .19* 1065 .21* 1065 .24* 1065 .18* 1065
College Expectations .20* 1063 .18* 1063 .21* 1063 .17* 1063
Note: The following abbreviations are utilized to facilitate formatting: Math = Mathematics subscale from Academic Self-efficacy scale; G.S. = General Subjects subscale from the Academic Self-efficacy scale; S/B = Science/Biology subscale from the Academic Self-efficacy scale; and Pers. = Persistence subscale from the Academic Self-efficacy scale.
* p<.001, **p<.01
Reproduced with permission of the copyright owner. Further reproduction prohibited without permission.

125
Table 4.12
Summary o f Intercorrelations of Locus o f Control Subscales with Other Study Variables
Instrument/Measure 23 Items Academicr n r n
Academic Self-efficacy Mathematics -.13* 895 -.15* 1008
General Subjects -.13* 895 -.16* 1008
Science/Biology -.09** 895 -.10** 1008
Persistence -.11* 895 -.13* 1008
Parental Expectations Father/Male Guardian -.04 662 -.09** 734
Mother/Female Guardian -.04 694 -.08** 770
Parents’ Education Level Father/Male Guardian .02 752 -.06 832
Mother/Female Guardian .01 767 -.05 855
Academic Achievement -.07** 861 -.17* 963
Extracurricular Activities -.02 779 -.10** 872
High School Track • © Ui 615 .03 687
College Aspirations -.09** 892 -.11* 1000
College Expectations -.09** 890 -.11* 999
*p<.001,**p<.01,
Reproduced with permission of the copyright owner. Further reproduction prohibited without permission.

126
Table 4.13
Summary o f Intercorrelations o f the Traditional Variables of College Choice
Instrument/Measure 1 2 3 4 5 6 7
Parental Expectations 1. Father/Male Guardian
2. Mother/Female Guardian .73* —
Parents’ Education Level 3. Father/Male Guardian .35* .28* —
4. Mother/Female Guardian .27* .34* .60* —
5. Academic Achievement .31* .35* .36* .32* —
6. Extracurricular Activities .21* .21* .18* .17* .26*
7. High School Track -.03 .00 .04 .01 .04 .04 —
Note: The number preceding the measure in the Instrument/Measure column corresponds to the number listed at the top o f the matrix indicating the horizontal position o f the variable in the matrix. The number o f respondents reporting was different for each variable ranging from a low o f 576 to a high o f 803.
* p<.001
Reproduced with permission of the copyright owner. Further reproduction prohibited without permission.

127
To address this hypothesis, Pearson product moment correlation analyses were
completed using individual student responses as the units o f analysis. Correlation
coefficients were computed between the four factored subscales o f academic self-
efficacy and question 47 on the survey relating to students’ aspirations to attend college.
Although the correlations between all the efficacy subscales and college aspirations
proved to be statistically significant (p<.001), the magnitude o f the correlations was
relatively low. These correlations with aspirations ranged from a high o f .24 for the
Science/Biology subscale to a low o f .18 for the Persistence subscale.
Research Hypothesis 2: There is a statistically significant, positive relationship
between adolescents’ levels o f academic self-efficacy and their expectations to attend
college.
This hypothesis was examined in a manner similar to the first hypothesis, with
Pearson product moment correlations computed between the four factored subscales
from the academic self-efficacy measure and question 48 on the survey pertaining to
students’ expectations to attend college. The results of this analysis also demonstrated
correlations o f a relatively low magnitude although all the relationships were
statistically significant (p<.001) and positive in direction. Two subscales, Mathematics
and Science/Biology had the highest correlation with College Expectations at .20. The
subscale with the lowest correlation with College Expectations was Persistence (r= .17).
Research Hypothesis 3: There is a statistically significant, positive relationship
between adolescents’ internal locus o f control and their aspirations to attend college.
Reproduced with permission of the copyright owner. Further reproduction prohibited without permission.

128
To ascertain the relationship between the college aspirations and the locus of
control o f adolescents, the 23 questions measure o f the independent variable and the
Academic Control subscale identified in the four-factor orthogonal solution were
correlated with item 47 on the survey using Pearson product moment correlation
analyses. These correlations were rather negligible and were negative in direction. The
correlation between the 23 combined item measure and College Aspirations was r = -.10
and the correlation between Academic Control and College Aspirations was r = -. 11.
Since the items on the Internal-External Locus o f Control Scale are scored in the
external direction (the higher the score the greater the externality o f the participants),
these results indicated a negative relationship between an external orientation and
College Aspirations.
Research Hypothesis 4: There is a statistically significant, positive relationship
between adolescents’ internal locus of control and their expectations to attend college.
Again, correlation analyses were used to provide information regarding this
hypothesis. To test this hypothesis, the 23 combined item measure for locus o f control
and the Academic Control subscale were correlated to College Expectations. As with
the correlations with College Aspirations, the two independent variables both
demonstrated quite modest correlations with College Expectations. The correlation for
the 23 item measure was r = -.10 and the correlation for Academic Control was r = -. 11.
Regression Analyses
In addition to bivariate correlation analyses, both standard multiple and step
wise regression analyses were computed to ascertain possible multivariate relationships
Reproduced with permission of the copyright owner. Further reproduction prohibited without permission.

129
between the dependent and independent variables. These results were used to determine
if the inclusion o f the measures for locus o f control and academic self-efficacy into the
college choice model significantly increase the strength o f the relationships in the
model. For these analyses, College Aspirations and College Expectations were treated
as criterion variables and regressed on the five traditional variable of college choice and
the locus o f control and self-efficacy subscales.
Research Hypothesis 5: The psychological constructs o f self-efficacy and locus
of control account for a statistically significant amount o f variation in students’ college
aspirations beyond that accounted for by the five traditional variables o f college choice.
To address this hypothesis, a regression o f College Aspirations on the traditional
variables o f college choice and the locus of control and academic self-efficacy subscales
was completed. Table 4.14 summarizes the results o f these analyses.
For this analyses, after entering the predictor variable which correlated the
highest with the criterion variable, all subsequent variables entered contributed rather
minimally to the magnitude o f the multivariate relationships explored. In this
regression analysis, Mother’s Expectations was identified as the first predictor variable
(R2 = .1155) followed by Academic Achievement (R2 = .0338) and Extracurricular
Activities (R2 = .009). Although the latter two variables are statistically significant at
p<.0001 and p<.05 respectively, both added little to the magnitude of the multiple
correlations. None o f the academic self-efficacy or locus o f control measures met the
.01 significance level for entry into the model. For this three variable model, the
multiple correlation was R = .3977.
Reproduced with permission of the copyright owner. Further reproduction prohibited without permission.

130
Table 4.14
Stepwise Regression o f College Aspirations Against the Traditional Variables o f College Choice and Locus o f Control and Academic Self-Efficacv Subscales
Step Variable Entered R R2 aR2 F P
1 Mother’s Expectations .3399 .1155 .1155 59.54 .0001
2 Academic Achievement .3864 .1493 .0338 18.06 .0001
3 Extracurricular Activities .3977 .1582 .0090 4.84 .0282
No other variable met the .01 significance level for entry into the model.
Reproduced with permission of the copyright owner. Further reproduction prohibited without permission.

131
Research Hypothesis 6: The psychological constructs o f self-efficacy and locus
o f control account for a statistically significant amount o f variation is students’
expectations beyond that accounted for by the five traditional variables o f college
choice.
To address Hypothesis 6, the regression o f College Expectations on the
traditional variables o f college choice and the locus o f control and academic
self-efficacy subscales was utilized This regression is reported in table 4.15.
The R2 o f the first variable, Academic Achievement, in the regression o f College
Expectations against the traditional variables and the locus o f control and academic self-
efficacy subscales, was .1404. Only one additional variable, Mother’s Expectations (R2
= .03) demonstrated statistical significance (p<.01) to be included given the level o f
significance established for the study. Extracurricular Activities (R2 = .0129) is also
shown in the table although it did not demonstrate statistical significance at the .01
level. For this three variable model, the final multiple correlation was R = .4283.
Summary o f Analyses for Supplemental Research Questions
In addition to the examination o f the primary research hypotheses, data analyses
was also conducted to address the seven supplemental research questions identified in
Chapter 1. These results are presented here.
Research Question 1: Does the construct academic self-efficacy serve a
mediating role in the relationship between the traditional variables of college choice and
College Aspirations?
Reproduced with permission of the copyright owner. Further reproduction prohibited without permission.

132
Table 4.15
Steowise Regression o f College Expectations Against the Traditional Variables of College Choice and the Locus o f Control and Academic Self-Efficacv Subscales
Step Variable Entered R R2 aR2 F P
1 Academic Achievement .3747 .1404 .1404 78.92 .0001
2 Mother’s Expectations .4128 .1704 .0300 17.43 .0001
3 Extracurricular Activities .4283 .1834 .0129 7.60 .0060
No other variable met the .01 significance level for entry into the model.
Reproduced with permission of the copyright owner. Further reproduction prohibited without permission.

133
To address this hypothesis, partial correlation analyses were completed between
Academic Achievement and College Aspirations while controlling for the effects o f the
four academic self-efficacy variables. Since Academic Achievement was the
independent variable which demonstrated the strongest correlation with College
Aspirations, it was determined that this variable would be studied first, followed by
analyses using the other independent variables only if significant results were found for
Academic Achievement. This approach was also utilized for the subsequent research
questions related to the partial correlation analyses.
When controlling for the academic self-efficacy variables, the bivariate
correlation o f r = .33 was reduced as follows: Mathematics Self-Efficacy, r = .27;
General Subjects Self-Efficacy, r = .30; Science/Biology Self-Efficacy, r = .27; and
Persistence Self-Efficacy, r = .30. These results are shown in Table 4.16. The change
in the magnitude o f the original correlation between Academic Achievement and
College Expectations accounted for by the four academic self-efficacy variables in these
analyses ranged from .03 to .05.
Research Question 2: Does the construct academic self-efficacy serve a
mediating role in the relationship between the traditional variables o f college choice and
College Expectations?
Similar to the analyses used for the previous research question, the partial
correlations between Academic Achievement and College Expectations were computed
while controlling for the effects o f the four academic self-efficacy variables and are
reported in Table 4.17. These analyses produced the following partial correlation
Reproduced with permission of the copyright owner. Further reproduction prohibited without permission.

134
Table 4.16
Partial Correlations Between the Global Academic Achievement Index and College Aspiration. Controlling for the Effects o f the Academic Self-Efficacv Measures
Academic Self-Efficacy Measure
r* Partial Correlation Coefificientsb
A f0
Mathematics .33 .27 .05
General Subjects .33 .30 .03
Science/Biology .33 .27 .05
Persistence .33 .30 .03
a. Correlations in column are between Academic Achievement and College Aspirations
b. Partial correlations between Academic Achievement and College Aspirations controlling for the effects o f each Academic Self-Efficacy measure
c. Change in original (.41) correlation between Academic Achievement and College Aspirations
Reproduced with permission of the copyright owner. Further reproduction prohibited without permission.

135
Table 4.17
Partial Correlations Between the Global Academic Achievement Index and College Expectation. Controlling for the Effects of the Academic Self-Efficacv Measures
Academic Self-Efficacy Measure
i* Partial Correlation Coefficientsb
Mathematics .41 .36 .05
General Subjects .41 .38 .03
Science/Biology .41 .37 .04
Persistence .41 .38 .03
a. Correlations in column are between Academic Achievement and College Expectations
b. Partial correlations between Academic Achievement and College Expectations controlling for the effects o f each Academic Self-Efficacy measure
c. Change in original (.41) correlation between Academic Achievement and College Expectations
Reproduced with permission of the copyright owner. Further reproduction prohibited without permission.

136
results: Mathematics/College Expectation, r = .36, General Subjects/College
Expectations, r = .38, Science/Biology/College Expectations, r = .37, and
Persistence/College Expectations, r = .38. Since the bivariate correlation between
Academic Achievement and College Expectations was .41, the change in the magnitude
of the original correlation accounted for by the academic self-efficacy variables also
ranged from .03 to .05.
Research Question 3: Does the construct locus of control serve a mediating role
in the relationship between the traditional variables o f college choice and College
Aspirations?
Partial correlation analyses were computed between Academic Achievement and
College Aspirations controlling separately for the effects o f the 23 item locus of control
measure and the factored subscale Academic Control to address this hypothesis (Table
4.18). When controlling for the effects o f the 23 item measure, the partial correlation
between the two variables was r = .31 and when controlling for the effects of Academic
Control, the partial correlation was r = .33. Since the bivariate correlations between
Academic Achievement and College Aspirations was r = .33, reduction in the
magnitude o f the correlation between these variables for the 23 item measure was .02
and for Academic Control, .00.
Research Question 4: Does the construct locus o f control serve a mediating role
in the relationship between the traditional variables o f college choice and College
Expectations?
Reproduced with permission of the copyright owner. Further reproduction prohibited without permission.

137
Table 4.18
AsDirations. Controlline for the Effects o f the Locus o f Control Measures
Locus of Control Measure
i* Partial Correlation Coefficients6
AI*
23 Item Measure .33 .31 .02
Academic Control .33 .33 .00
a. Correlations in column are between Academic Achievement and College Aspirations
b. Partial correlations between Academic Achievement and College Aspirations controlling for the effects o f each Academic Self-Efficacy measure
c. Change in original (-41) correlation between Academic Achievement and College Aspirations
Reproduced with permission of the copyright owner. Further reproduction prohibited without permission.

138
Again, partial correlation analyses were used to address Question 4, with partial
correlations computed for the relationship between Academic Achievement and College
Expectations while controlling for the effects o f the 23 item measure o f locus o f control
and the Academic Control subscale. Table 4.19 reports a su m m ary of these analyses.
In both analyses, the correlation between the two variables was found to be r = .39
which, when compared to the bivariate correlation o f r = .41 between the two, showed a
reduction in the magnitude o f the original correlation o f only .02.
Since only minimal amounts o f the variance were explained by the measures for
locus o f control and academic self-efficacy in the partial correlation analyses with
Academic Achievement and College Aspirations and College Expectations, the decision
was made to terminate any further partial correlation analyses with the other traditional
variables.
Research Question 5: Do significant differences exist in the model o f college
choice based on race?
To ascertain if any significant differences exist between African Americans,
Hispanic and White subgroups, Pearson product moment correlation analyses were
computed by race for the study variables. The results the these analyses are presented
in Tables 4.20, 4.21 and 4.22.
The most significant differences in the results were found for the African
American subgroup. In the analyses using College Aspirations and College
Expectations as the dependent variables, the bivariate correlation coefficients computed
for this group differed from those computed for the entire group b y . 10 or greater for the
Reproduced with permission of the copyright owner. Further reproduction prohibited without permission.

139
Table 4.19
Expectations. Controlling for the Effects o f the Locus o f Control Measures
Locus o f Control Measure
r* Partial Correlation Coefficients6
AI*
23 Item Measure .41 .39 .02
Academic Control .41 .39 .02
a. Correlations in column are between Academic Achievement and College Expectations
b. Partial correlations between Academic Achievement and College Expectations controlling for the effects of each Academic Self-Efficacy measure
c. Change in original (.41) correlation between Academic Achievement and College Expectations
Reproduced with permission of the copyright owner. Further reproduction prohibited without permission.

140
Table 4.20
Summary o f Intercorrelations Among the Independent Variables and CollegeAspirations and College Expectations. African American Subsample (n = 46)
Instrument/Measure Aspirations Expectations
Academic Self-efficacy Mathematics .30 .24
General Subjects .34 .17
Science/Biology .41** -.08
Persistence .40** .23
Locus o f Control 23 Combined Items -.30 -.39**
Academic Control -.22 -.22
Parental Expectations Father/Male Guardian .22 .15
Mother/Female Guardian .04 -.02
Parents’ Education Level Father/Male Guardian .11 .01
Mother/Female Guardian .12 .08
Academic Achievement .28 .26
Extracurricular Activities .21 .16
High School Track .13 -.09
** p<.01,
Reproduced with permission of the copyright owner. Further reproduction prohibited without permission.

141
Table 4.21
Summary o f Intercorrelations Among the Independent Variables and CollegeAspirations and College Expectations. Hispanic Subsample (n = 156)
Instrument/Measure Aspirations Expectations
Academic Self-efficacy Mathematics .12 .08
General Subjects .27* .21**
Science/Biology .21** .14
Persistence .25* .21**
Locus o f Control 23 Combined Items -.10 -.12
Academic Control -.22** -.21**
Parental Expectations Father/Male Guardian .36* 00 «
Mother/Female Guardian .46* .41*
Parents’ Education Level Father/Male Guardian .19** .06
Mother/Female Guardian .24** .21**
Academic Achievement .25** .42*
Extracurricular Activities .20 .21**
High School Track -.05 -.08
*p<.001,**p<.01,
Reproduced with permission of the copyright owner. Further reproduction prohibited without permission.
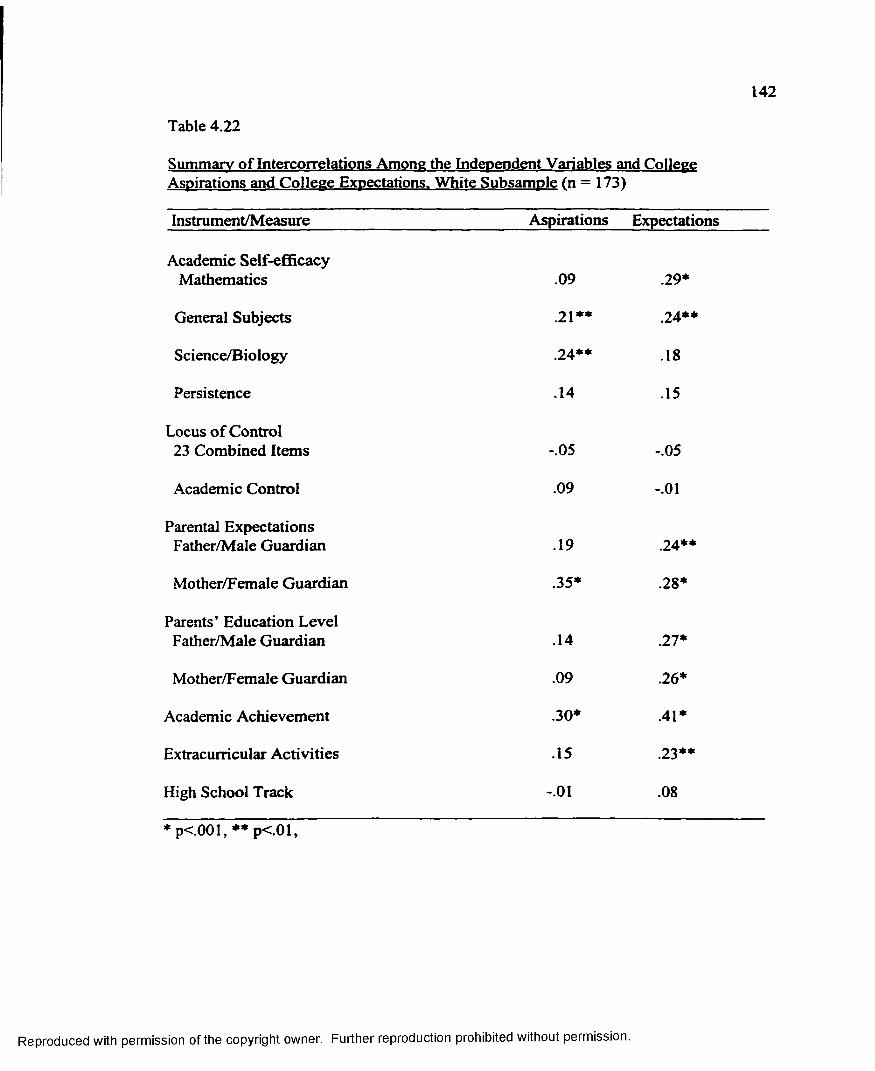
142
Table 4.22
Summary of Intercorrelations Among the Independent Variables and CollegeAspirations and College Expectations. White Subsample (n = 173)
Instrument/Measure Aspirations Expectations
Academic Self-efficacy Mathematics .09 .29*
General Subjects .21** .24**
Science/Biology .24** .18
Persistence .14 .15
Locus o f Control 23 Combined Items -.05 -.05
Academic Control .09 -.01
Parental Expectations Father/Male Guardian .19 .24**
Mother/Female Guardian .35* .28*
Parents’ Education Level Father/Male Guardian .14 .27*
Mother/Female Guardian .09 .26*
Academic Achievement .30* .41*
Extracurricular Activities .15 .23**
High School Track -.01 .08
* p<.001, ** p<.01,
Reproduced with permission of the copyright owner. Further reproduction prohibited without permission.

143
majority o f the independent variables. Most notable were the correlations between the
academic self-efficacy measures and College Aspirations. For the African American
subgroup, Mathematics correlated with College Aspirations, r = .30, General Subjects
correlated with College Aspirations, r = .34, Science/Biology correlated with College
Aspirations, r = .41 and Persistence correlated with College Aspirations, r = .40. These
were noticeably greater in magnitude than the corresponding correlations for the entire
sample which were as follows: Mathematics and College Aspirations, r = .19, General
Subjects and College Aspirations, r = .21, Science/Biology and College Aspirations, r =
.24, Persistence and College Aspirations, r = .18.
For the Hispanic subgroup, the most notable differences in the bivariate
correlations when comparisons were made with the total group occurred between the
measures o f Parental Expectations and College Aspirations. The correlation between
Father’s Expectations and College Aspiration for Hispanics was r = .36, compared to a
coefficient o f .25 for the entire sample. The correlations between Mother’s
Expectations and College Aspirations for this subgroup and the total sample were r =
.46 and r = .29, respectively.
The one notable difference from the total sample in the bivariate correlations for
the White subgroup was in the relationship between parents’ education level and
College Aspirations. Both the correlation coefficient for Fathers’ Education Level and
College Aspirations, and Mothers’ Education Level and College Aspirations were less
significant in magnitude for the White subgroup than for the total sample. For Whites a
coefficient o f .14 was found for Fathers’ Education Level, and .09 for Mothers’
Reproduced with permission of the copyright owner. Further reproduction prohibited without permission.

144
Education Level when the two were separately correlated with College Aspirations
Corresponding coefficients o f .27 and .21 resulted for the entire sample.
Research question 6: To what extent can an individual’s self-efficacy be
generalized?
As stated in Chapter 1, there are two parts to this question. The first part is the
extent to which feelings o f self-efficacy cross behavior domains, and the second reflects
the contribution o f sub-categories to a generalized notion of the self-efficacy construct.
To address both parts of this question, an examination of some o f the data analyses
previously presented, particularly the correlation analyses and the factor analysis o f the
academic self-efficacy instrument, is necessary.
If, as Bandura (1977) initially postulated, the construct of self-efficacy is domain
specific, the efficacy expressed by an individual to successfully complete work in one
academic subject would show little relationship to efficacy the individual would express
toward completing work in another academic discipline. Hence, the separate items on
the Academic Self-efficacy Scale would be distinct from each other and not empirically
verified on a common factor. The factor analysis o f the academic self efficacy items
conducted in this study, however, produced distinct factors (see Table 4.8). The four-
factor solution resulted in the subscales Mathematics which accounted for 18% o f the
variance, General Subjects accounting for 15.67% of the variance, Science/Biology
accounting for 14.14% of the variance and Persistence, accounting for 11.09% o f the
variance. O f particular significance in these results were those for the General Subjects
subscale which demonstrated a common factor crossing academic domains.
Reproduced with permission of the copyright owner. Further reproduction prohibited without permission.

145
The factoring o f the self-efficacy scale also provides information regarding the
relationship o f sub-categories o f self-efficacy with a more general notion o f the
construct. The Mathematics factor linked a students’ efficacy to successfully complete
an algebra problem with efficacy to leam algebra and efficacy to leam mathematics in
general. Likewise, the Science/Biology factor tied efficacy for learning biology with
the more general efficacy to leam science.
The information provided by the simple correlation analyses of the thirteen
items on the academic self-efficacy scale demonstrated only moderate relationships
between the variables. Table 4.23 provides a summary o f the correlation coefficients
for these items. The correlation coefficients between the mathematics item, the algebra
item and the algebra problem were all relatively low with only the mathematics/algebra
problem (r =.08) correlation demonstrating statistical significance (p<.01). The
correlation coefficient between the science item and the biology item resulted in the
coefficient with the greatest magnitude (r = .70). The coefficients for the items which
factored together into the General Subjects were all relatively low in magnitude except
the coefficient for the correlation between the computer item and the foreign language
item which was r = .65. The coefficient with the greatest magnitude for the correlations
among the persistence items was r = .19.
Research Question 7: What is the relationship between self-efficacy beliefs and
students’ estimates o f persistence motivation related to academic tasks?
The factor analysis o f the academic self-efficacy items (see Table 4.8) provides
information regarding the relationship between the capabilities and the persistence
Reproduced with permission of the copyright owner. Further reproduction prohibited without permission.

146
Table 4.23
Summary o f Intercorrelation Coefficients for Items on the Academic Self-Efficacv Scale
Item Number 4 5 6 7 8 9 10 11 12 13 14 15 16
4 -
5 -.09 —
6 .19 -.03 —
7 -.06 .08 .06 —
8 -.03 -.03 .01 .34 —
9 .07 .00 .07 .32 .70 -
10 .16 .02 .15 .31 .46 .56 -
11 .03 -.02 .06 .40 .15 .16 .17 —
12 .12 .01 .12 .37 .14 .16 .20 .66 —
13 -.04 .19 -.07 .34 .03 .05 .08 .23 .23 —
14 -.09 -.07 .00 .19 .12 .12 .10 .19 .17 .23 —
15 -.02 .13 -.01 .20 .08 .08 .12 .17 .22 .24 .29 -
16 -.01 .13 -.06 .33 .11 .12 .15 .24 .22 .59 .20 .23 -
Critical value: r = .07, (p.<.01)
Reproduced with permission of the copyright owner. Further reproduction prohibited without permission.

147
elements o f self-efficacy. The four-factor orthogonal solution identified four distinct
factors, three o f which related to efficacy capabilities beliefs and a fourth relating to
persistence. The three persistence items demonstrated relatively high factor loadings
(.80, .61 and .47) and explained 11.09% o f the variance in the four-factor solution. The
bivariate correlation analyses (see Table 4.23) provide additional information regarding
the relationships o f the persistence items. In these analyses, the correlation coefficient
between items 14 and 15 was r = .29, between items 14 and 16, r = .20 and between
items 15 and 16, r = .23.
Summary o f Analyses o f Supplemental Data Set
During the analyses o f the data collected for this study, an additional question
emerged pertaining to the Cronbach Alpha internal consistency reliability coefficients
computed for the locus o f control and academic self-efficacy measures. As previously
reported, these coefficients were of a particularly low magnitude for the locus o f control
measures raising concern about the reliability o f the data. Although not included with
the formal research questions, it must be asked if these low reliability coefficients are
indicative o f the locus o f control scale being inappropriate for the study population or if
other problems, such as poor data collection techniques, hamper reliability. To provide
information to help determine the source o f the reliability problems, a supplemental set
of data was collected from 131 ninth-grade students attending a public high school in
south-central Louisiana. The data from this set pertaining to the locus o f control and
academic self-efficacy scales were factor analyzed and the factor structures providing
the best statistical and conceptual interpretation o f the data were tested for reliability
Reproduced with permission of the copyright owner. Further reproduction prohibited without permission.

and correlated with the other study variables. At this point it must be acknowledged
that the sample size for these analyses was smaller than desired but the information
from this data provides a basis o f comparison with the original data set.
Factor Analyses
The factor structure which provided the best interpretation o f the data for the
locus o f control scale was deemed to be the five-factor solution shown in Table F.l of
Appendix F. In this solution 21 o f the 23 items demonstrated loadings on factors
meeting the criteria established for retention, and the five factors combined to account
for 41.42% o f the total variance. The four-factor solution was not selected because it
had more multiple loadings and accounted for a lower amount o f variance (34.86%)
than the five-factor solution. Significantly, both the four-factor and the five-factor
solutions for this data set differed substantially in structure from the four-factor solution
o f the data collected from students attending school in the M-DCPS (see Table 4.6).
The factor structure selected for the items on the academic self-efficacy scale
was the two-factor solution (see Table F.2 in Appendix F). Factor 1, comprised of 7
items, accounted for 24% of the variance in the solution and Factor 2, comprised of 5
items, accounted for 20.34% of the variance. Item 7, the question asking students to
indicate how well the feel they can successfully complete an algebra problem, was
excluded from these analyses because a number of students had not yet taken algebra
and those currently enrolled in algebra had not yet been taught the information
necessary to solve the problem. Although a two-factor solution was selected for this
data set as opposed to a four-factor solution selected for the previous (M-DCPS) data
Reproduced with permission of the copyright owner. Further reproduction prohibited without permission.
149
set, the item loading did not differ substantially between the two solutions. Items
tended to load with the same items in the factor analyses for both data sets (see Tables
4.7 and 4.8).
Reliability Analyses
Cronbach Alpha internal consistency reliability coefficients were computed for
the five locus o f control factors and the two academic self-efficacy factors. The results
for the locus o f control factors revealed the following reliability coefficients: Factor 1,
Alpha = .56; Factor 2, Alpha = .20; Factor 3, Alpha = .49, Factor 4, Alpha = -.16; and
Factor 5, Alpha = .24. For the academic self-efficacy factors, an Alpha o f .75 was
computed for Factor 1 and an Alpha o f .66 was computed for Factor 2.
The data collected in Louisiana was also tested for reliability using the factored
subscales identified in the analyses o f the M-DCPS data set. In other words, reliability
coefficients were computed for the four locus o f control factors and the four self-
efficacy factors selected for analyses o f the original data set. For both the locus o f
control and academic self-efficacy subscales, little appreciable difference was
demonstrated by these analyses.
Correlation Analyses
Table F.3 in Appendix F reports the Pearson product moment correlations
between the study variables utilizing the Louisiana data set. Here again, little
appreciable difference was evident between these correlation coefficients and those
calculated for the M-DCPS data set, although some coefficients o f a greater magnitude
for some study variables were noted in the Louisiana sample. Academic Achievement
Reproduced with permission of the copyright owner. Further reproduction prohibited without permission.
150
correlated .19 higher with College Aspirations and .14 higher with College Expectations
with the new data set. Also for the new data set, High School Track correlated .40
higher with College Aspirations and .36 higher with College Expectations than with the
initial data set. The academic self-efficacy subscales selected to represent the data
collected in Louisiana demonstrated correlation coefficients o f a greater magnitude with
College Aspirations and College Expectations than those computed for the subscales for
the M-DCPS data set. Using the Louisiana data set, the first self-efficacy factor
correlated with College Aspirations at r = .55 and with College Expectations at r = .53,
and the second self-efficacy factor correlated with College Aspirations at r = .35 and
with College Expectations at r = .34. The M-DCPS data set did not have a correlation
coefficient between the self-efficacy subscale and College Aspirations and College
Expectations greater than r = .24.
Partial Correlation Analyses
As was done with the M-DCPS data set, partial correlation analyses were
computed using the Louisiana data set. For these analyses, correlations were computed
between the measures o f Academic Achievement and the dependent variables while
separately controlling for the effects o f the academic self-efficacy subscales. The partial
correlation procedure statistically controlling for the effects o f the first academic self-
efficacy measure reduced the correlation coefficient between Academic Achievement
and College Aspirations from r = .52 to r = .27. The same procedure controlling for the
effects o f the second academic self-efficacy measure reduced the correlation coefficient
between the two variables from r = .52 to r = .43. When the partial correlation
Reproduced with permission of the copyright owner. Further reproduction prohibited without permission.

151
procedure controlling for the effects o f the first academic self-efficacy measure was
computed for the Academic Achievement and College Expectations variables, the
coefficient was reduced from r = .55 to r = .32. The partial correlation procedure
statistically controlling for the effects o f the second academic self-efficacy measure
reduced the correlation coefficient between Academic Achievement and College
Expectations from r = .55 to r = .47.
Student Interviews
For the most part, the four students interviewed after completing the
questionnaire indicated that they had little difficulty in answering the questions or
selecting between responses. The only two items which were mentioned as being
confusing were items 50, dealing with parent’s expectations for their child’s educational
attainment and 51, parent’s level of education. None o f the four indicated that the
section containing the locus o f control scale was difficult to understand.
Structural Equation Model Analyses
One o f the original intents of this study was to use statistical causal modeling
procedures (e.g., LISREL, EQS) to develop a more comprehensive picture o f factors
related to college aspirations and expectations than those currently represented in the
extant literature. The bivariate correlation coefficients among the academic efficacy and
locus o f control variables and the aspirations and expectations variables were rather
moderate in magnitude. In addition, the analyses regressing the aspirations and
expectations variables on the traditional college choice, efficacy and locus of control
variables yielded rather small and varied multiple correlation coefficients. The rather
Reproduced with permission of the copyright owner. Further reproduction prohibited without permission.

152
low reliability o f some of the measures used (e.g., locus o f control) is believed to have
contributed to the relatively weak relationships observed among the variables in the
study. These results suggested that subsequent analyses o f the data using multivariate
procedures such as LISREL would yield little information useful in developing a
statistical model to better understand the predicted complex linkages among the study
variables.
Reproduced with permission of the copyright owner. Further reproduction prohibited without permission.

CHAPTER 5: CONCLUSIONS, DISCUSSION, IMPLICATIONS
This chapter begins with a brief overview of the study, reiterating its importance,
purpose and intended contributions. A summary of the study’s major findings and
conclusions follows, including a discussion o f the implications o f these findings and
conclusions as they related to theory, future research and practical application. The
chapter concludes with a summary o f the study.
Overview o f the Study
This study was designed to explore relationships between several variables
believed to relate to the decision process in which adolescents engage relative to
pursuing a college education. Psychological factors were examined for their
significance during the predisposition phase o f the college choice process, the time
when adolescents are deciding whether or not they will go to college. Two
psychological constructs, locus o f control and self-efficacy, were studied to determine a)
if they had a direct relationship to students’ disposition to attend college and b) if they
serve a mediating role for other factors which have been identified by previous research
as influencing the college choice process. It was postulated that the two psychological
constructs are related to the aspirations and expectations o f adolescents toward college,
both directly and as mediators o f other influences.
The design o f the study was initially prompted by a lack o f information about
the college choice process for members o f minority groups. Extensive research has
been conducted about college choice, but this research has focused predominately on
White students and has not adequately identified factors influencing minority students
153
Reproduced with permission of the copyright owner. Further reproduction prohibited without permission.

154
to pursue a college education. This study was initiated to provide additional
information in this area.
A review o f the college choice literature revealed another area o f inquiry for the
study. Previous research on the subject has generally focused on one o f three
approaches: viewing the process from an econometric perspective, viewing the process
from a sociological perspective, or viewing the process by combining the two
perspectives (Hossler et al., 1989). While this line o f inquiry has been useful, little
attention has been given to the possibility that psychological factors may also be
involved in influencing a student to decide to attend college. Cognitive and affective
processes which students undergo when considering postsecondary school attendance
have gone relatively unexplored. Consequently, an examination o f psychological
constructs and their relationship to the desire to attend college was undertaken.
The constructs, locus of control and self-efficacy were selected for examination
in the study because o f linkages to other factors which have, in turn, been linked to
college choice, empirical evidence suggesting a connection between these constructs
and similar decision processes, and by conceptual analysis. Previous research has
identified locus o f control and self-efficacy as important correlates o f academic
achievement (Thomas et al., 1987; Wilhite, 1990; Lent et al. 1986; Mickelson, 1990;
Pajares; 1996; Clarke-Stewart and Friedmen, 1983; Seiligmen, 1979; Skinner, Welbom
and Connell, 1990); and academic achievement has been linked to college aspirations
and expectations ( Manski and Wise, 1983; Peters, 1977; Jackson, 1978; Yang, 1981;
Carpenter and Fleishmen, 1987; Tuttle, 1981; Hossler and Stage, 1992). Empirically,
Reproduced with permission of the copyright owner. Further reproduction prohibited without permission.

155
self-efficacy and locus o f control have been correlated with the career decision process
of adolescents (Betz and Hackett, 1981; Taylor and Betz, 1983; Lent et al. 1986;
Brooks, 1990; Rotter and Mulry, 1965; Stipek and Weisz).
Conceptually, self-efficacy and locus o f control can be linked to the college
choice process. Self-efficacy has been clearly identified in the psychology literature as
a primary mediator o f behavior and behavioral change (Bandura, 1997), influencing
whether a behavior will be initiated, the amount o f effort expended on the behavior, and
the length o f time devoted to the behavior. High self-efficacy regarding a behavior will
usually lead to an increased frequency o f attempting the behavior and greater effort and
perseverance. Low self-efficacy, on the other hand, will usually lead to the avoidance
o f a particular behavior (Bandura, 1977). By attempting behaviors we judge to be
within our capabilities to successfully complete and avoiding behaviors where we
expect failure, we are prone to make life decisions according to our perceived self-
efficacy (Bandura, 1993). This strong conceptual interaction between self-efficacy,
behavior and life plans would lead to the conclusion that the decisions o f students to
attend or not attend college would be significantly influenced by their self perceived
abilities to succeed academically.
Locus o f control also can be conceptually linked to the college choice process.
The extent to which the outcome of an experience is attributed to being the result o f
one’s own actions, rather than caused by external forces, effects the strength of one’s
expectancy for repeated experiences o f a similar nature. No matter what the experience,
unless it is perceived to be the result o f one’s own actions, it will not be significant in
Reproduced with permission of the copyright owner. Further reproduction prohibited without permission.

156
altering the ways in which one sees things and consequently the way one functions.
Experiences attributed to external forces will be viewed as beyond an individual’s
control, and therefore unlikely to reoccur regardless o f the individual’s efforts. The
individual, therefore, is unlikely to expend any amount o f significant effort toward
making the experience reoccur since such effort is perceived as pointless (Lefcourt,
1982).
Thus, an individual with an external orientation would tend to view life’s
rewards as being beyond one’s personal control and the result o f fate, luck or powerful
others (Rotter, 1996). Becoming better prepared for life through education would not
be seen as significant since one’s own resources are not likely to return rewards. An
individual with an internal orientation, on the other hand, would view education as
beneficial since education increases one’s abilities and one’s own abilities lead to
rewards.
In addition to examining the contribution o f psychological variables in the
college choice process, this study also explored specific aspects o f the self-efficacy
construct. The generalizing nature of self-efficacy was investigated and the relationship
between self-efficacy capability and persistence elements o f the construct were studied.
The initial conceptualization o f self-efficacy by Bandura (1966) identified the
construct as situation or task specific. In other words, an individual’s efficacy is limited
to a single endeavor and does not cross behavioral or task domains. Further, an
aggregate notion o f efficacy is not cumulatively developed from subcategories o f
efficacy. In academic terms, the efficacy individual’s have for their ability to leam a
Reproduced with permission of the copyright owner. Further reproduction prohibited without permission.

157
particular subject does not effect the efficacy they have to leam other subjects. Further,
efficacy in specific disciplines, such as algebra and geometry, does not contribute to a
general efficacy for a subject such as mathematics. Recent research, however, has
acknowledged that efficacy beliefs may, in fact, transfer across activities or settings and
may have some cumulative properties (Bandura, 1997). Recognizing that adaptability
would become impossible if individuals have to establish a sense o f efficacy for each
new endeavor, Bandura has identified five processes through which mastery experiences
can produce a certain degree o f generality in personal efficacy. These are: when similar
subskills are present, when competencies co-develop, when self-regulatory or coping
skills are involved, when commonalities are cognitively structured across domains and
when powerful performance attainments result in transforming experiences.
In his most recent discussion of self-efficacy Bandura (1997) defined perceived
self- efficacy in terms o f an individual’s beliefs in personal capabilities to organize and
execute actions required to produce given attainments. He also stated that efficacy
beliefs have a variety o f predictable psychological and behavioral effects such as how
long individuals will persevere in the face o f obstacles and failures. According to
Bandura, strong self-efficacy beliefs lead to greater perseverance and strengthen the
likelihood that activities will be successful and positive performance outcomes will be
attained. Thus, self-efficacy theory encompasses the conceptual definition o f efficacy
as part o f the human belief system, as well as the affective and behavioral consequences
of efficacy beliefs. Both o f these components o f self-efficacy theory were addressed in
this study.
Reproduced with permission of the copyright owner. Further reproduction prohibited without permission.

158
To operationalize the constructs identified in the study and to exam ine their
relationships, a student questionnaire was developed. The questionnaire contained
measures o f locus o f control, academic self-efficacy, and the five factors identified by
previous research as the strongest correlates in the college choice process. Rotter’s
(1966) Internal-External Locus o f Control Scale was used to measure the locus o f
control construct. The academic section o f Bandura’s (1989) Children’s Self-Efficacv
Scale was used to measure self-efficacy, with additional questions developed and
incorporated to measure concepts o f generalized efficacy and persistence. The five
factors associated with college choice in previous research were operationalized using
questions from the National Educational Longitudinal Study o f 1988 (U.S. Department
o f Education, Office o f Education Research and Improvement, 1992).
The college aspirations and college expectations constructs were used in the
study as the primary components o f postsecondary educational plan formulation during
the predisposition phase o f the college choice process. Although similar in concept,
these two constructs represent different elements o f students’ desires to pursue a
postsecondary education, and they were treated as such. College aspirations represent
the hopes which an individual has to attend college. These hopes may not be realistic,
nor is it necessary that the individual actually believes they can be achieved. They are,
none the less, the goals the student hopes to attain. College expectations, on the other
hand, are more realistic and represent the level o f education which an individual expects
to pursue upon graduation from high school (Hanson, 1994).
The data for the study were collected from 1076 ninth-grade students attending
one o f three public high schools in the Miami-Dade County Public School System,
Reproduced with permission of the copyright owner. Further reproduction prohibited without permission.

159
Miami, Florida. Ninth-grade students were chosen since the literature shows that, by
this time, most students have made the determination whether or not they will attempt to
attend college (Hossler et al., 1989) and such plans remain relatively stable throughout a
student’s high school career (Schmit and Hossler, 1995). Schools in Miami-Dade
County, Florida were selected primarily because the district has a great deal o f racial
diversity. Since the choice process for members o f minority groups was a major focus
of the study and the M-DCPS has large numbers o f African Americans and Hispanics as
well as Whites in attendance, the racial profile o f the district matched the objectives of
the study.
In addition to drawing specific conclusions about the college choice process, the
intent o f the study was to identify theoretical, methodological and practical implications
which will contribute to the existing knowledge base and will help direct policy
decisions. From a theoretical perspective, the information gained in the study added to
our understanding o f the locus o f control and self-efficacy constructs. Methodologically,
additional information was gained regarding the measures used to operationalize these
constructs. Finally, a better understanding o f how the college choice process works
allows for the formulation o f plans to increase the participation o f adolescents in higher
education. The section that follows summarizes the major findings and conclusions
from the study.
Major Findings and Conclusions
A large number o f statistical findings from the exploration o f relationships
among the study variables and comparisons o f subgroups were reported in Chapter 4 o f
Reproduced with permission of the copyright owner. Further reproduction prohibited without permission.
160
this study. From these findings conclusions can be made relative to the purpose o f the
study and the additional areas o f inquiry identified during the course o f the study.
Presented below are the findings and conclusions which are considered most significant
for subsequent discussion.
Maior Finding Number One
The locus o f control construct does not appear to be a significant correlate of
college aspirations and expectations. However, the academic self-efficacy construct
appears to mediate the linkage between students’ academic achievement and their
aspirations and expectations.
• Conclusion: The development o f future conceptual models addressing factors
that influence the processes by which adolescents decide whether or not they
will attend college should take into consideration human development theory
and the concept o f self-efficacy.
Maior Finding Number Two
With the exception of academic achievement, the traditionally examined
variables associated with the college choice process are not as closely related to
students’ college aspirations and expectations as the literature has previously
suggestsed.
• Conclusion: The results o f this study are inconsistent with the conclusions of
previous studies, necessitating further analysis o f additional factors contributing
to the college choice process.
Reproduced with permission of the copyright owner. Further reproduction prohibited without permission.

161
Maior Finding Number Three
There is some evidence to suggest that the construct o f academic self-efficacy
serves a mediating linkage between the traditional variables and college aspirations and
expectations. However, there is no evidence to suggest the same relationship exists for
the locus o f control construct.
• Conclusion: The mechanisms by which adolescents are motivated to go to
college are complex, involving many school-related experiences, school
environment and family culture, and are interwoven with academic self-efficacy
beliefs.
Maior Finding Number Four
There is a generalized nature to the construct o f self-efficacy where beliefs of
efficacy can develop across similar topics within curriculum domains. These
efficacious beliefs, on the other hand, do not generalize across dissimilar curriculum
domains.
• Conclusion: There are skills within academic domains that are similar and can
be developed within school experiences that bind the subskills and potentially
academic domains together.
Maior Finding Number Five
Perceived self-efficacy beliefs about capabilities to execute academic behaviors
and beliefs about academic task persistence can be independently measured and are
moderately related within the larger context o f self-efficacy theory.
Reproduced with permission of the copyright owner. Further reproduction prohibited without permission.

162
• Conclusion: Any comprehensive theory o f human efficacy needs to be able to
explain and predict how specific beliefs about personal capabilities are linked
with varying strengths to specific affective and behavioral outcomes in differing
contexts.
Maior Finding Number Six
The locus o f control instrument used in the study was unreliable for this group
of adolescents.
• Conclusion: The locus of control measure is not appropriate for adolescents in
this kind o f multi-cultural context which contains students who speak many
languages and who come from diverse cultural backgrounds that shape their core
personal understandings and beliefs.
Maior Finding Number Seven
There were some observed differences among relationships between variables by
racial groups.
• Conclusion: There are numerous factors associated with the family/home
environment that differ for adolescents from diverse cultures and racial groups.
For any model o f college choice to be meaningful, it must account for these
factors and multi-cultural diversity.
Discussion and Implication o f Major Findings
This section provides a discussion of the major findings and conclusions listed
above within the context o f theoretical concerns, implications for future research and
practical application.
Reproduced with permission of the copyright owner. Further reproduction prohibited without permission.

163
Theoretical Implications
The importance o f this study to theory lie in two realms. First, are the
implications o f the information obtained for the conceptual development o f a more
comprehensive model o f college choice and, second, the are contributions to a fuller
understanding o f the self-efficacy construct and human development theory. These are
discussed in turn below.
The College Choice Model
The results o f this study suggest that existing models of college choice are
deficient in providing an understanding the o f the cognitive and affective processes by
which adolescents make the determination to attend or not attend college. This decision
process not only involves factors such as academic success and parental encouragement
but also the deep-seated psychological belief systems framing an individual’s self-
efficacy. The extent to which the individual believes in his or her ability to successfully
complete academic work and the willingness o f the individual to persist academically
when faced with obstacles and barriers to learning and achievement, is related to one’s
aspirations and expectations. Both the simple correlations of the efficacy measures with
college aspirations and expectations using the data collected in the Miami-Dade County
Public Schools and those using the data from the Louisiana sample support the
argument that academic self-efficacy plays an important role in the college choice
process.
For African Americans, academic self-efficacy as a consideration in the choice
process is even more significant than for other racial groups. The correlations o f the
Reproduced with permission of the copyright owner. Further reproduction prohibited without permission.

164
efficacy variables with college aspirations and expectations for this subgroup resulted in
coefficients which were significantly higher than those computed for the Hispanic and
White subgroups. Although beyond the immediate scope o f this study, the family
structure/environment in the households o f the African Americans participating in this
study might well contribute to a greater need for this group to develop efficacious
beliefs toward academic work in order to develop the desire to attend college. Factors
such as single parent households and low socioeconomic status conceivably create an
environment lacking in enrichments necessary for the development o f strong academic
self-efficacy beliefs. This interpretation seems consistent with Bandura’s (1997)
explanation o f factors that contribute to the development o f self-efficacy beliefs in home
and school environments.
There are suggestions in this study that self-efficacy also plays an indirect role in
the process o f college choice by mediating the effects o f other variables, particularly
academic achievement, on the aspirations and expectations o f adolescents to attend
college. Major reviews o f the literature demonstrate well the positive linkage between
self-efficacy and academic achievement (Pajares, 1996), and research has demonstrated
that performance accomplishments based on mastery experiences are the most
significant builder o f efficacious beliefs (Bandura, 1997). Conceptually, then, it is
logical that positive academic achievement experiences are related to a student’s level
of academic self-efficacy; and this study and others (Manski and Wise, 1983; Peters,
1977; Jackson, 1978; Yang, 1981; Carpenter and Fleishmen, 1987; Tuttle, 1981;
Hossler and Stage, 1992) demonstrate that academic achievement is a correlate of
Reproduced with permission of the copyright owner. Further reproduction prohibited without permission.

165
college aspirations and expectations. The collective results o f the partial correlation
analyses completed in this study indicate that academic self-efficacy, to some extent,
mediates the relationship between academic achievement and college aspirations and
expectations.
In addition to rethinking the college choice model to include students’ academic
self-efficacy beliefs, the model also needs reevaluation to assess the role o f traditionally
included variables. The results of this study provide no strong indorsement that all five
variables contribute significantly to the decision process. The collective results o f the
correlation analyses o f the two data sets collected in this study suggest that academic
achievement is the traditional variable most strongly associated with college aspirations
and expectations. Although less notable, the parental expectations and parent’s level o f
education variables are also related to students’ aspirations and expectations to attend
college. The variables, participation in extracurricular activities and high school
academic track, were shown to be relatively insignificant factors related to college
aspirations and expectations.
Thus the Expanded College Choice Model with Psychological Variables
presented in Figure 3 on page 19, may still be a viable conceptual framework for future
research. However, it needs further exploration. Future studies with more reliable
measurement might shed further light on the complex relationships among the
traditional and psychological variables in this conceptual framework.
Self-Efficacv Theory
The results o f this study provide information that has several implications for
theories o f self-efficacy. O f particular note are the contributions which can be made to
Reproduced with permission of the copyright owner. Further reproduction prohibited without permission.

166
a ) our understanding o f the generalization o f self-efficacy beliefs across academic
contexts, b) the relationship between persistence and self-efficacy beliefs, and c) the
source o f efficacy building in different contexts.
In this study there are indications that the self-efficacy construct can be
generalized both across domains and within domains as suggested by Bandura (1997).
The factor analyses o f the M-DCPS data set grouped items into factors which
conceptually were related to each other within similar academic disciplines. The three
items relating to efficacious beliefs in mathematics were represented by one factor, the
two items relating to science were represented by a second factor, a third factor
represented the academic subjects outside the math/science disciplines, and the fourth
factor consisted of the three academic persistence items. Bandura (1997) suggests that
mastery experiences can produce some degree o f generalized self-efficacy beliefs and
that the primary mastery experience is the presence o f similar sub-skills. Certainly
similar sub-skills, such as adding, subtracting, multiplying, dividing, etc. would be
needed to do general mathematics, algebra, and specific algebra problems. Likewise,
skills inherent in both general science and biology can be identified. In this study the
four subjects represented by the General Subjects factor were less closely related than
the subjects in the Mathematics and Science/Biology factors, yet they had enough
commonality that similar sub-skills could be identified. English grammar, reading and
writing, and foreign languages were all based on language skills and the fourth item in
this factor, computers, also had a strong, yet not so obvious connection, to these skills.
At the ninth- grade level, the primary focus o f computer training is on teaching
Reproduced with permission of the copyright owner. Further reproduction prohibited without permission.

167
keyboarding skills and the use o f the computer as a word processing instrument. These
skills, it can be argued are, in fact, language skills. Thus, the academic domains which
factored together in this study have similar sub-skills, which supports Bandura’s
premise.
There is also evidence from the results of this study that self-efficacy beliefs can
be generalized within academic domains that have cumulative properties where sub-
categories contribute to a more general notion x>f the construct. This was demonstrated,
for example, by the factor analyses o f the academic self-efficacy items with the
grouping o f the algebra problem with algebra and mathematics in general, and the factor
grouping o f biology with general science. These findings are consistent with current
views about how efficacy beliefs develop within and across domains (Bandura, 1997).
Thus, the efficacy one feels in one’s ability to do the algebra problem contributes to the
efficacy one feels toward algebra, and both of these contribute to the efficacy one feels
towards doing mathematics. Likewise, the efficacy one has toward biology contributes
toward a more general notion o f efficacy about science capabilities. The correlation
analyses also supported this explanation with biology and science having a significantly
high coefficient. On the other hand, the three items comprising the Mathematics factor
did not correlate highly with each other.
These results o f this study fit well with the position taken by Bandura (1997)
regarding the generality of efficacy beliefs. He cautions that a failure to recognize the
transfer o f efficacy beliefs across activities or settings would constrict people to having
to establish their sense of efficacy anew with each activity attempted, acknowledging no
Reproduced with permission of the copyright owner. Further reproduction prohibited without permission.

168
ability to adapt. On the other hand, a universal embracing o f efficacy transferal would
undermine the conceptual definition of the construct and be contrary to the genesis of
efficacy beliefs. Efficacy beliefs are structured by experience with specific experiences
contributing to the development o f specific efficacious beliefs. When experiences
contribute to the development o f multiple efficacy beliefs, then a generalized notion of
efficacy can be identified which crosses capabilities and performance domains
surrounding those beliefs.
The results o f this study also provide some insights into the measurement o f
self- efficacy capabilities on the one hand, and the measurement o f beliefs about
possible consequences o f efficacy strengths on the other hand. The factor analysis
results showed that these are two elements o f a larger efficacy theory and can be
measured independently. However, the relationships between these elements o f
efficacy are positive in direction (as predicted by the theory), but only moderate in
magnitude. The items from the survey in this study taken from Bandura’s (1989)
Children’s Self-Efficacv Scale (items 4, 5, 6, 8, 9, 10, 11, 12 and 13 on the Student
Questionnaire! all related to the perceived capabilities element o f self-efficacy. Items
14-16 measured students’ beliefs about the predicted consequences o f various strengths
in efficacy beliefs (i.e., how long and hard students work when trying to complete a
difficult mathematics problem), and these items collectively defined an efficacy
academic task motivation/persistence construct.
Another contribution o f this study to efficacy theory is a better understanding of
the dynamics o f efficacy development within diverse populations. Considered
Reproduced with permission of the copyright owner. Further reproduction prohibited without permission.

169
collectively, the results o f this study demonstrated that a positive (though moderately
strong) relationship exists between academic self-efficacy and college aspirations and
expectations. When data from the sample were partitioned by race, however, the
importance o f academic self-efficacy was significantly greater for the African American
subgroup than for the Hispanic or White subgroups. For the African American
subgroup, the measures o f academic self-efficacy were the variables most strongly
correlated with College Aspirations. These results suggest that academic self-efficacy
beliefs may play a more important role in academic task effort and persistence for
African American adolescents than for Hispanic or White adolescents. This finding
seems consistent with recent large-scale reviews o f research on factors contributing to
school learning that point out the importance o f classroom and home learning
environments to strengthening academic task engagement and subsequent learning,
particularly for disadvantaged students (Wang, Haertel, and Walberg, 1993). It may be
that the contribution of within school learning experiences, to the development of
academic self-efficacy beliefs that strengthen task persistence, is particularly important
for students from poor families, and from home environments with single and/or
minimally educated parents.
Locus o f Control Theory
It is difficult from the results o f this study to develop an understanding o f the
role that locus o f control might well play in the development o f adolescents’ aspirations
and expectations to attend college. The unreliability o f the locus o f control data limits
any strong interpretation of the findings. Language difficulties were noted as one
Reproduced with permission of the copyright owner. Further reproduction prohibited without permission.

170
possible, important source o f unreliability for the locus o f contol data. It seems rather
intuitive that adolescents with an external locus of control, developed over many life
experiences, should have lower college aspirations and expectations than adolescents
with an internal locus o f control. However, a closer examination o f the meaning o f locus
o f control in view o f the self-efficacy construct, may counter such intuitions.
The identification o f academic self-efficacy rather than locus o f control as a
factor in the college choice process is consistent with the conceptual understanding of
these constructs. Both deal with personal belief systems, however, locus o f control is a
more global concept reflecting beliefs about causal attributions for behavior (Lefcourt,
1982). This global nature does not allow for significant distinctions to be made in the
orientation o f an individual at the microanalytic level. The degree to which an
individual is internal or external in orientation, does not vary from one domain to the
next. Beliefs such as I control my own destiny, Much o f what happens in life is the
result o f luck or You can V fight City Hall all reflect universal beliefs o f control. Thus,
locus o f control would not be expected to distinguish between the beliefs o f control an
individual has toward going to college from beliefs relative to pursuing other career
paths. One would consider to have similar levels of control in both circumstances.
Locus o f control, as a motivator o f human behavior, should act as an inducement or
detractor o f actions across domains.
Self efficacy, on the other hand, is microanalytic and more situation or task
specific than locus o f control. Thus, distinctions between an individual’s academic self-
efficacy might vary considerably from one discipline to the next. It would, therefore, be
Reproduced with permission of the copyright owner. Further reproduction prohibited without permission.

171
expected that the efficacy beliefs one has for academics might differ from one’s efficacy
beliefs in other areas, thereby delineating clear distinctions in choice processes. For the
college choice process, a student’s academic self-efficacy would provide information
necessary to making decisions, whereas, locus o f control would not.
Recently Bandura (1997) provided conceptual and empirical differentiation
between the efficacy and locus o f control constructs. He argues that ‘‘beliefs about
whether one can produce certain actions (perceived self-efficacy) cannot, by any stretch
of the imagination, be considered the same as beliefs about whether actions affect
outcomes (locus o f control)” p.20.
Implications for Future Research
The first significant implication which this study suggests for future research
deals with the measures used to operationalize the constructs locus o f control and
academic self-efficacy. The locus of control scale proved to have considerable
shortcomings and the academic self-efficacy scale appears to need of further
development and refinement.
Locus o f Control Scale
From the study findings, it was concluded that the locus of control measure is
not appropriate for the population used in the study and may be deficient in adequately
measuring the construct for other populations as well. The locus of control reliability
statistics for the M-DCPS sample were so low that the Student Questionnaire was
administered to a hold out sample in Louisiana, to determine if faulty data collection
procedures might have contributed to the low reliability o f the measure. This researcher
Reproduced with permission of the copyright owner. Further reproduction prohibited without permission.

172
personally administered the instrument during the collection o f the second data set.
Since the reliability coefficients were again low, it was concluded that the locus of
control scale is unreliable for students like those in this study.
Prior to selecting the Internal-External Locus o f Control Scale as the
measurement for the construct, a review of the scale’s reliability was completed. A
number of studies with varied populations reported reliability coefficients ranging from
r = .69 to r = .78. These studies, however, involved samples o f high school seniors,
college students, and adults (incarcerated prisoners) and not ninth-grade students from
diverse racial backgrounds.
There appear to be two problems with the locus o f control measure. First, the
dichotomous format does not adequately differentiate between sources o f external
control and it can lead to an internal response when actually an external response
reflects the beliefs o f the respondent. There are at least two distinct dimensions along
which respondents may differ in causal attributions (Collins, 1974). They may differ in
the extent to which the consequences of behavior can be attributed to chance
occurrences or luck, or they may differ in the extent to which consequences can be
attributed to the influence o f powerful others. Item 21 on the questionnaire, for
example, asks students to select between the following two statements: “The idea that
teachers are unfair to students is nonsense.” and “Most students don’t realize to extent
to which their grades are influenced by accidental happenings.” A respondent with an
external orientation derived from a strong sense o f fatalism would probably select the
second statement since it reflects a belief that luck plays a key role in the assignment of
Reproduced with permission of the copyright owner. Further reproduction prohibited without permission.

173
grades. A respondent, however, with an external orientation based on a sense that
powerful others are directing the events o f one’s life would probably not believe that
luck or fate played a role in the assignment o f grades. Thus the second statement might
be selected because o f a stronger belief that teachers exert a dominant controlling
influence. This question and others as well appear to mix the dimensions o f external
control, which could lead to responses which do not reflect the locus o f control beliefs
o f the respondents. This disparity, in all likelihood, contributed significantly to the low
reliability coefficients computed for the measures o f locus o f control in this study.
The second difficulty with the locus o f control measure relates to the age o f the
study participants and their diverse backgrounds. Although the Louisiana students who
were interviewed after completing the questionnaire did not indicate difficulties with
this measure, these students all resided in English speaking households. The sample
from the M-DCPS, however, was much more diverse with many o f participants coming
from households where Spanish is spoken. This language difference, coupled with
inherent cultural differences in the meaning o f language and the interpretation o f life
events, more than likely made the instrument difficult for many o f the participants to
understand. The relatively young age o f the sample may also well have had a negative
effect on students’ comprehension o f the questionnaire.
Future studies o f young adolescents like those in this study should use other
measures o f locus o f control than the standard Rotter (1966) scale. A number o f studies
have modified the forced choice, dichotomous format o f the Rotter scale into a Likert-
type scale where respondents are asked to rate their level o f agreement with each
Reproduced with permission of the copyright owner. Further reproduction prohibited without permission.
174
individual statement contained in the scale (Zuckerman and Gerbasi, 1997; Collins,
1974). This modification eliminates the potential mixing o f dimensions for an external
orientation. However, it does not address the potential problems o f written language
being misunderstood, giving consideration to the age and ethnicity o f the respondents.
Another scale which deserves consideration for populations similar to the one
used in this study is the Nowicki-Strickland Locus o f Control Scale (Nowicki &
Strickland, 1973). This scale was specifically written to be readable at the fifth-grade
level yet is also considered appropriate for older students. Internal consistency
reliabilies for the scale were reported by Nowicki and Strickland to be r = .63 for grades
3-5, r = .68 for grades 6-8, r = .74 for grades 9-11, and r = .81 for grade 12. The lower
readability level o f this scale when compared to the Rotter (1966) scale, would
predictably result in greater reliability with a diverse sample o f adolescents like those
that participated in this study. Increased reliability o f measurement o f the locus of
control construct would, in turn, lead to better estimates of the true relationship between
locus o f control and adolescents’ aspirations and expectations to attend college.
Academic Self-Efficacv Scale
The academic self-efficacy scale used in this study combined the academic
section o f Bandura’s (1989) Children’s Self-Efficacv Scale with items developed to test
the academic persistence of the respondents. Initially, there was some concern that the
items from Bandura’s scale somewhat lacked face validity, and conceptually did not
address the most important factors leading to efficacy development. Asking students
how well they leam various academic subjects may not accurately identify efficacious
Reproduced with permission of the copyright owner. Further reproduction prohibited without permission.

175
beliefs. Students who indicate they can learn a subject well may do so because they
receive good grades in the subject, because they know the teacher provides support or
because they truly understand the material and believe they can personally learn and
apply it. Bandura acknowledges that saying that one is capable o f doing something is
not necessarily self-convincing or the same as believing in one’s ability to actually
accomplish the task or behavior (1997). Similarly, attestations that one can do
something are not a direct measure of the strength o f efficacy beliefs. Alternatively, one
might ask respondents how strongly they believe in their capabilities to do something.
To address this apparent shortcoming and to add additional depth to the
measurement o f elements of self-efficacy beliefs theory, three items reflecting beliefs
about task persistence were added to the measurement system. Bandura writes, “the
stronger the sense o f personal efficacy...the greater the perseverance and the higher the
likelihood that the chosen activity will be performed successfully” (1997, p.43). This
study identified persistence to be a separate sub-construct within the conceptual
framework o f self-efficacy theory. Thus, adding questions about students’ willingness
to continue in an endeavor when faced with obstacles and/or failure, was viewed as
providing a more global view o f self efficacy beliefs relative to the total strength of
efficacy and its potential behavioral consequences.
Factor analyses of the total set of self-efficacy beliefs items identified three
academic self-efficacy components from the pool o f items used that were originally
developed by Bandura (1989). Alpha reliabilities for these three sub-constructs were
.63, .79 and .80. However, the efficacy persistence sub-construct Alpha reliability was
Reproduced with permission of the copyright owner. Further reproduction prohibited without permission.

176
rather low (.43). Thus, in this study, both measures o f self-efficacy capability and
academic task perseverance were of concern. This latter measure appears to need
revision to enhance the reliability of measurement.
Additionally, and following this logic, future studies might be well advised to
also include measurement items tapping the efficacy theory sub-construct o f outcome
expectation. Thus, a more comprehensive measurement system for future research could
include items addressing self-efficacy beliefs about capabilities to organize and execute
corses o f action, efficacy outcome expectations, and task persistence. This approach to
the measurement o f elements o f self-efficacy theory can seemingly provide more
breadth and depth o f theoretical understanding than a singular focus on self-efficacy
capabilities beliefs. The vast majority o f studies o f self-efficacy beliefs in the extant
literature focus only on the measurement o f the self-efficacy capabilities construct as the
key element o f the larger theory.
Culturally Sensitive Instrument Design
Another facet o f instrument design which this study identifies, is the need to
develop measures o f locus o f control and academic self-efficacy which are culturally
sensitive. Asking ninth-grade students living in a Spanish speaking household or a low
socioeconomic neighborhood to select between locus o f control alternatives relating to
politics or world affairs and expecting reliable results, is problematic. For these
individuals, other cultural or experiential factors may determine their levels o f perceived
control such as strong religious beliefs or fear o f a racially biased police force.
Reproduced with permission of the copyright owner. Further reproduction prohibited without permission.

177
Likewise, the academic self-efficacy measures concentrate on efficacy beliefs
which are most closely associated with one aspect o f efficacy development, enactive
mastery experiences. Students were asked “How well can you learn...?” For members
of minority groups who may not have experienced the same levels o f academic
accomplishments as White adolescents, other determinates o f efficacy may be more
appropriate. For these individuals, the modeling o f others or verbal encouragement may
have a more significant role in enhancing efficacy beliefs.
There is, therefore, a great need for further research into the design o f measures
of these psychological constructs for ethnically and racially diverse populations. To
assume that the same instruments used for White, middle-class populations will
adequately operationalize these constructs seems rather short-sighted. It may well be
that measures o f locus o f control and self-efficacy have to be individually and uniquely
developed for each sample population.
Development o f Self-Efficacv Beliefs
Bandura (1997) elaborates four essential factors that contribute to the
development o f individual’s self-efficacy beliefs: a) enactive mastery experiences, b)
vicarious experiences, c) verbal persuasion and d) psychological and affective states.
Enactive mastery experiences are typically described as the most potent source for the
development o f self-efficacy beliefs. However, the literature is relatively silent as
regards the strength and contributions o f these four factors to the development o f self-
efficacy in different contexts. This raises a considerable number of questions that might
be answered through future research. For example, which o f these factors is the most
Reproduced with permission of the copyright owner. Further reproduction prohibited without permission.

178
potent source for the development of self-efficacy strengths in the home environment....
in the classroom environment? Do these factors contribute differently to self-efficacy
beliefs for students who vary in terms of abilities, developmental levels, socioeconomic
status, etc.? Are there combinations of these factors that build greater efficacy strengths
in some performance domains than in others (e.g., athletics vs. academics)?
Development o f More Construct Valid Measures
Additionally, there is a need to develop more comprehensive self-efficacy
measures around the theoretical assumptions underlying the construct. For example,
Bandura (1997) makes the argument that self-efficacy measures would ideally be
structured within performance domains, with items addressing efficacy beliefs about
tasks varying in graded difficulties within these domains. Such measures would yield
data having more sensitivity to variations in self-efficacy, and probably demonstrate
greater reliability than those used in this study. As well, these kinds of measures would
better operationalize the theoretical conceptualization o f the self-efficacy construct and
might better correlate with a variety of potential criterion measures, such as the college
aspirations and expectations measures used in this study. Extending the self-efficacy
beliefs line o f inquiry, with better measurement systems, can also lead to the
development o f a more robust nomological net (Cronbach & Meehl, 1955) to support
self-efficacy theory.
Replication of the Study
It should be recognized that the findings of this study are far from conclusive
and that additional research is needed into the role o f psychological variables in the
Reproduced with permission of the copyright owner. Further reproduction prohibited without permission.

179
college choice process. Because o f the low reliability coefficients calculated for some
of the study variables, caution should be exercised to avoid broad generalizations based
upon the study results. Further, the sample used in the study included populations with
unique cultural identities which make the generalizing o f the results to other populations
difficult. For example, 41.8 percent o f the respondents indicated their race to be
Hispanic yet this segment only make up 9% o f the total population o f the country
(Bureau o f the Censes, 1994). The finding for the Hispanic subgroup should probably
not be generalized to Hispanics in other areas o f the country. The Miami sample was
comprised largely of individuals from Cuban, Puerto Rican or Haitian backgrounds. It
would be erroneous to generalize the findings from this group to other Hispanic students
in different areas o f the country such as Chicanos in California or Mexican Americans
in New Mexico, because significant cultural differences exist within the broad Hispanic
racial category. Thus, home learning environments and sources of efficacy
development related to college aspirations and expectations might vary considerably
among these different Hispanic groups.
Practical Implications
There are numerous implications for practice which the results o f this study
suggest. These implications are primarily centered around strategies which can be
applied in the school setting but are not only limited to the classroom. A holistic
approach should be employed which encompasses the entire learning environment
including strategies involving parents and/or guardians.
Reproduced with permission of the copyright owner. Further reproduction prohibited without permission.

180
Teachers
It is important that teachers recognize the importance o f efficacy beliefs and are
sensitive to individual differences among students. It may not be enough to develop
classroom strategies which unilaterally build adolescents’ academic self-efficacies.
The development o f mastery experiences may be the most powerful determinant o f
efficacy and should be an important component o f any approach, but other components
must also be employed. Some students may be more inclined to develop positive
efficacious beliefs through modeling (vicarious experiences) or encouragement (verbal
persuasion).
The development o f mastery experiences, however, is a comer stone o f self-
efficacy development and should be carefully addressed. It is unrealistic to expect
adolescents to develop positive beliefs o f academic self-efficacy if presented with tasks
which are so difficult that a high potential for failure exists. In fact, repeated failures
have a deleterious effect on building self-efficacy (Bandura, 1997). Pedagogically,
learning and efficacy building should take place simultaneously using small incremental
steps allowing all students to progress. This o f course, raises significant issues about
the proper pacing o f educational development given students with varying degrees o f
academic attainment and diverse intellectual capabilities, which are beyond the scope o f
this study. Thus, the building o f academic self-efficacy is an important element o f
pedagogy and a significant concern in the development o f optimally functioning school
and classroom environments for students.
Reproduced with permission of the copyright owner. Further reproduction prohibited without permission.

181
The interplay o f persistence, as recognized by Bandura (1997) and identified in
this study as a important behavioral effect o f efficacy beliefs, also deserves mention in
terms o f practical application. Not only is persistence an outcome o f self-efficacy
beliefs, it also reciprocally can produce the highest, strongest and most generalized
increases in efficacy (Bandura, 1982). When an individual is able to master a difficult
situation, the influences in creating strong self-percepts o f efficacy are greater than
those produced by persuasion or vicarious experiences. This seems particularly
important as we address ways to develop efficacious beliefs in our youth. Recognizing
that persistence resulting in achievement positively impacts an individual's self-efficacy
greater than any other source, strategies can be developed to strengthen students’
academic self-efficacy beliefs in our schools.
It should further be noted that school faculty and staff need training about
efficacy issues for it cannot be assumed that school officials are knowledgeable in this
area. This study demonstrates that self-efficacy is a very complex, multifaceted
construct which continues to reach conceptual maturity. Although it is not necessary for
teachers to be thoroughly familiar with the literature regarding self-efficacy, a
rudimentary working knowledge o f efficacy, built upon a sound theoretical base is
needed. Many erroneous conceptions surround the construct (e.g. that it is equivalent to
self-concept or self-esteem) which can easily lead to well-intentioned, but misguided
practical applications. In-service education for teachers and school leadership personnel
and the careful development and monitoring o f efficacy building strategies by
knowledgeable practitioners are important pedagogical concerns.
Reproduced with permission of the copyright owner. Further reproduction prohibited without permission.

182
School Environment
The environment o f the school, both within the confines o f the classroom and
throughout the halls must also support self-efficacy development. One fundamental goal
of education reflecting efficacy theory is to equip students with self-regulatory
capabilities that enable them to educate themselves. “Self-regulation encompasses
skills for planning, organizing and managing instructional activities; enlisting resources;
regulating one’s own motivation; and applying metacognitive skills to evaluate the
adequacy o f one’s knowledge and strategies.” (Bandura, 1997, p. 175) A strong belief
in self-regulatory efficacy contributes to success in academic subject matter by building
a sense o f cognitive efficacy and raising academic aspirations (Zimmerman, Bandura
and Martinez-Pons, 1992).
Home Environment
Inclusion o f parents or guardians in efficacy building is also o f critical
importance because the home environment may be more significant in the development
of positive efficacious beliefs than experiences in the school setting (Wang, Haertel and
Walberg, 1993). Preschool children, for instance, who have been taught how their
actions can be causative have been shown to be more cognitively competent in
childhood than those who have not had the benefit o f early mastery experiences (Ramey
et al., 1982). The development o f self-efficacy at home may be particularly significant
for children growing up in less affluent environments. Ramsey and Ramsey (1992)
report that intensive preschool programs that provide rich mastery experiences
permanently raise the intellectual and academic attainments o f children from
Reproduced with permission of the copyright owner. Further reproduction prohibited without permission.

183
economically impoverished families. The dynamics o f self-efficacy building in the
home environment also can result in a process o f reciprocal causation where parents
work with children whose efficacy increases, causing the parents in turn to have greater
beliefs o f parenting efficacy, which in turn leads to increased effort on the part o f the
parents to work with their children (Bradley, Caldwell and Elardo, 1979).
Incorporating parents or guardians into the efficacy building process may seem
like a monumental challenge especially in single parent, non-English speaking or low
socioeconomic households. Programs exist, however, which must be utilized. The
Parents As Teachers program, for instance, is a national program targeted at low
income, single parents. It is designed to instruct parents on activities in which they can
engage with their preschool children to develop early cognitive processes. The
activities themselves are mastery experiences, and built into parent-child interactions are
modeling scenarios and effiisive positive reinforcements. Each of these elements is
consistent with factors important for strengthening self-efficacy beliefs (Bandura, 1997).
In discussing these practical application no mention has yet been made regarding
the development o f college aspirations and expectations. Attention has been focused
instead on the building o f self-efficacy holistically within the school and home
environments. Although by no means conclusive, the results o f this study indicate that
academic self-efficacy is positively related to college aspirations and expectations o f
adolescents. It is therefore, appropriate that the previous discussion take place
regarding the development of academic self-efficacy. As this study suggests, if we are
better able to develop the academic self-efficacy beliefs in our youth, it is likely we will
Reproduced with permission of the copyright owner. Further reproduction prohibited without permission.

184
be able increase their aspirations and expectations to attend college. This seems a
worthwhile endeavor for parents and educators alike, particularly for those working
with minority and disadvantaged youth in need o f strengthening academic self-efficacy
beliefs.
Chapter Summary
Following a general overview of the study, Chapter 5 presented a summary and
discussion o f the study’s major findings and conclusion. The discussion included
implications for theory, future research and practical application.
Dissertation Summary
This document describes a study o f 1076 ninth-grade students attending public
high schools in an urban environment in the southeastern United States. The study
described was designed to determine factors which motivate adolescents to attend
college. Previous research had developed models o f college choice which incorporated
econometric and sociological factors. The conceptual framework to guiding this study
identified two additional factors in the process, the psychological constructs o f locus o f
control and academic self-efficacy. These constructs were posited to be linked to
adolescents’ aspirations and expectations to attend college, as well as, playing a
mediating role between traditionally identified college choice variables, and college
aspirations and expectations. Particular attention was given to members of minority
groups since previous research has not adequately explained the processes by which
members o f these groups are motivated to attend or not attend college.
Reproduced with permission of the copyright owner. Further reproduction prohibited without permission.

185
A variety o f statistical procedures was used to derive information regarding the
relationships between study variables. These procedures included a) a factor analyses
of the locus o f control and academic self-efficacy instrument items; b) Cronbach Alpha
internal consistency reliability analyses o f instrument scores and subscales; and c)
correlation analyses o f study variables including bivariate correlations, multiple
regressions and partial correlations.
The major findings of the study showed that: a) locus o f control is not a
significant factor in the college choice process although low reliability in the data made
this finding rather inconclusive; b) there is evidence that academic self-efficacy is both
directly related to college aspirations and expectations and mediates linkages between
academic achievement and aspirations and expectations; and c) models o f college
choice are different for members o f minority groups (African Americans and Hispanics)
than for White students. The study also provided additional empirical and conceptual
information about the academic self-efficacy construct.
These findings were synthesized in terms o f a set o f major findings and
conclusions and were discussed in view o f their implications for theory, future research
and practical application.
Reproduced with permission of the copyright owner. Further reproduction prohibited without permission.

REFRENCES
Abrahamson, D. Schuldermann, S. and Schuldermann, E. (1973). Replication o f dimensions o f locus o f control. Journal of Consulting and Clinical Psychology. 41. 320.
Adkins, D. L. (1975). The great American degree machine. New York: McGraw-Hill.
Alexander, K. L., Eckland, B. K. and Griffin, L. J. (1975). The Wisconsin model of socioeconomic achievement: A replication. American Journal o f Sociology 8L (2), 325-42.
Alwin, D. and Otto, L. (1977). High school context effects on aspirations. Sociology of Education. 50. 259-73.
Anderson, C., Bowman, M. and Tinto, V. (1972). Where colleges are and who attends. New York: McGraw-Hill.
Astin, A. (1980). The impact of student financial aid programs on student college choice. Washington, DC: Office o f Planning.
Bandura, A. (1977). Self-efficacy: Toward a unifying theory of behavioral change. Psychological Review. 84. (21. 191-215.
Bandura, A. (1978). The self system in reciprocal determinism. American Psychologist. 344-358.
Bandura, A. (1982). Self-efficacy mechanism in human agency. American psychologist. 37. (2), 122-147.
Bandura, A. (1986). Social foundations of thought and action: A social cognitive theory. Englewood Cliffs, NJ: Prentice Hall.
Bandura, A. (1989). Children’s self-efficacv scale. Unpublished Manuscript.
Bandura, A. (1993). Perceived self-efficacy in cognitive development and functioning. Educational Psychologist. 28. (21. 117-148.
Bandura, A. (1997). Self-efficacv: The exercise of control. New York:Freeman.
Bandura, A. and Schunk, D. H. (1981). Cultivating competence, self-efficacy, and intrinsic interest through proximal self-motivation. Journal o f Personality and Social Psychology. 41. 586-598.
186
Reproduced with permission of the copyright owner. Further reproduction prohibited without permission.

187
Bateman, M. and Hossler, D. (1996). Exploring the Development o f Postsecondary Education Plans Among African American and White Students. College and University. 72. (1), 2-9.
Bateman, M. and Kennedy, E. (1997). Male African Americans, Single Parent Homes, and Educational Plans: Implications for Educators and Policymakers. Journal o f Education for Students Placed at Risk. 2. (3), p.229-50.
Baum, A., Aiello, J. R. and Calesnick, L. E. (1978). Crowding and personal control: social density and the development o f learned helplessness. Jou rna l o f Personality and Social Psychology. 36. 1000-1011.
Beasley, S. And Sease, W. (1974). Using biographical data as a predictor of academic success for black university students. Journal o f College Student Personnel. 15, 201-206.
Benham, J. M. (1995). Fostering self-motivation behavior, personal responsibility and internal locus o f control in school settings. (ERIC Document Reproduction Service No. ED 386 621)
Betz, N. E. and Hackett, G. (1981). The relationship of career-related self- efficacy expectations to perceived career options in college women and men. Journal o f Counseling Psychology. 23. 399-410.
Bird, C. (1975). The case against college. New York: David McKay.
Bishop, J. (1977). The effects of public policy on the demand for higher education. Journal o f Human Resources. 5. (4), 285-307.
Blackman, S. (1962). Some factors affecting the perception o f events as chance determined. Journal o f Psychology. 54. 197-202.
Blau, P. and Duncan, O. (1967). The American occupational structure. New York: Wiley.
Blechman, E. A. and Dannemiller, E. A. (1976). Effects on performance o f perceived control over noxious noise. Journal o f Consulting and Clinical Psychology. 44,601-607.
Bloom, B. S. et al. (1956). Taxonomy o f educational objectives. Handbook I: Cognitive domain. New York: Longmans, Green.
Reproduced with permission of the copyright owner. Further reproduction prohibited without permission.

188
Bowers, K. S. (1973). Situationalism in psychology: An analysis and critique. Psychological Review. 80. 307-336.
Bradley, R. H., Caldwell, B. M. and Elardo, R. (1979). Home environment and cognitive development in the first two years: A cross-lagged panel analysis. Developmental Psychology. 15,246-250.
Brooks, L. (1990). Recent developments in theory building. In D. Brown, L. Brooks, & Associates (Eds.), Career Choice and Development: Applying Contemporary Theories to Practice, (pp. 364-394). San Francisco, Jossey-Bass.
Brown, K. G. (1982). Postsecondary plans o f high school seniors in 1972 and 1980: Implications for student quality. Paper presented at the AIR Forum, Denver,May.
Bureau o f the Census. (1994). Statistical abstract o f the United States. Washington, DC: United States Department o f Commerce.
Campbell, R. and Siegal, B. (1967). The demand for higher education in the United States, 1919-1964. American Economic Review. 57. 453-99.
Cardi, M. (1962). An examination of internal versus external control in relation to academic failures. Unpublished master’s thesis, Ohio State University, Columbus.
Carpenter, P. and Fleishman, J. (1987). Linking intentions and behavior: Australian students’ college plans and college attendance. American Educational Research Journal. 24. (1), 79-105.
Chapman, R. C. (1979). Pricing policy and the college choice process.Research in Higher Education. 10. 37-57.
Chressanthis, G. A. (1986). The impact o f tuition rate changes on college graduate head counts and credit hours over time and a case study. Economics of Education. 5. (2), 205-17.
Chronical o f Higher Education. (1978). 16 5, November 13, 8.
Chronicle o f Higher Education. (1995). 42 1, September 1, 14.
Chronicle o f Higher Education. (1999). Almanac.
Cibik, M. A. (1982). College information needs. College and University. 57.97-102.
Reproduced with permission of the copyright owner. Further reproduction prohibited without permission.

189
Clark, B. (1987). The academic life. Princeton, NJ: The Carnegie Foundation for the Advancement o f Teaching.
Clark, K. B. and Plotkin, L. (1964). The Negro student at integrated colleges. New York: National Scholarship Service and Fund for Negro Students.
Clarke-Stewart, A. and Friedman, S. (1983). Cognitive development. Child development: Infancy through adolescence. New York: John Wiley and Sons.
Cohn, E. and Geske, T. G. (1990). The Economics o f Education. 3rd Ed. Oxford: Pergamon Press.
Coleman, J. S. (1966). Peer culture and education in modem society. In T. M. Newcomb and E. K. Wilson (eds.) College peer groups: Problems and prospects for research. Chicago: Aldine.
Coleman, J., Campbell, E., Hobson, C., McPartland, J., Mood, A., Weinfeld, F., and York, R. (1966). Equality of educational opportunity. Washington, DC: U.S. Government Printing Office.
Collins, B. E. (1974). Four separate components o f the Rotter I-E scale: Belief in a difficult world, a just world, a predictable world and a politically responsive world. Journal o f Social Psychology. 29. 381-391.
Conklin, M. and Dailey, A. (1981). Does consistency o f parental encouragement matter for secondary students? Sociology o f Education. 54. 254-62.
Corazzini, A. J., Dugan, D. J. and Grabowski, H. G. (1972). Determinants and distribution aspects o f enrollment in U.S. higher education. Journal o f Human Resources. 7. 39-59.
Crandall, V. C., Katkovsky, W. and Crandall, V. J. (1965). Children’s belief in their own control o f reinforcements in intellectual-academic achievement situations. Child Development. 36. 91-109.
Crichlow, W. (1986). Responses to Afro-American students to processes of education in an urban high school. Paper presented at the meetings o f American Educational Research Association, San Francisco, CA.
Cronbach, L. J. and Meehl, P. E. (1955). Construct validity in psychological tests. American Psychologist. 52. 281-302.
Crowne, D. P. and Marlowe, D. (1964). The Approval Motive. New York:Wiley.
Reproduced with permission of the copyright owner. Further reproduction prohibited without permission.

190
Dahl, D. W. (1982). College attendance and institutional choice. Results from the Kentucky longitudinal study. Paper presented at the Annual Forum of the Association o f Institutional Research, Denver, June.
Dillingham, G. (1980). The value stretch: An empirical test. Sociology and Social Research. 64. 121-137.
Ekstrom, R. B. (1985). A descriptive study o f public high school guidance: Report to the Commission for the Study o f Precollegiate Guidance and Counseling. Princeton, NJ: Eductional Testing Service.
Elsworth, G., Day, N., Harworth, R. and Andrews, J. (1982). From high school to tertiary studv: Transition to college and university in Victoria. Hawthorn, Victoria: Australian Council on Education.
Endler, N. S. and Magnusson, D. (1975). Interactional psychology and personality. Washington, DC: Hemisphere.
Ewart, C. K., Setwart, K. J., Gillilan, R. E. and Kelemen, M. H. (1986). Self- efficacy mediates strength gains during circuit weight training in men with coronary artery disease. Medicine and Science in Sports and Exercise. 18. 531-540.
Falsey, B. And Heyns, B. (1984). The college channel: Private and public schools reconsidered. Sociology o f Education. 57. 111-22.
Franklin, R. D. (1963). Youth’s expectations about internal versus external control reinforcements related to N variables. Dissertation Abstracts. 24. 1684.
Freeman, R. (1976). The over-educated America. New York: Academic Press.
Fuller, W., Manski, C. and Wise, D. (1982). New evidence on the economic determinants o f postsecondary schooling choices. Journal o f Human Resources. 17. (4), 472-98.
Gall, M., Borg, W. and Gall, J. (1996). Educational research: An introduction (6th ed.). White Plains, NY: Longman.
Garza, R. T. and Widlak, F. (1977). The valididy o f locus o f control dimensions for Chicano populations. Journal o f Personality Assessment. 41. 635-643.
Gibbs, J. T. (1973). Black students/white university: Different expectations. Personnel and Guidance Journal. 51 .463-469.
Reproduced with permission of the copyright owner. Further reproduction prohibited without permission.

191
Gilmour, J., Jr., Spiro, L. M. and Dolich, I. S. (1978). How high school students select a college. Philadelphia: Pennsylvania State University.
Glass, D. C., Reim, B, and Singer, J. E. (1971). Behavioral consequences of adaptation to controllable and uncontrollable noise. Journal o f Experimental Social Psychology. 7 .244-257.
Glass, D. C., Singer, J. E., and Friedman, L. N. (1969). Psychic cost o f adaptation to an environmental stressor. Journal o f Personality and social Psychology. 12, 200-210.
Glass, D. C. and Singer, J. E. (1972). Urban stress. New York: Academic Press.
Golin, S. (1974). The effects o f stress on the performance o f normal and high anxious subjects under chance and skill conditions. Journal o f Abnormal Psychology. 83, 466-472.
Graavetter, F. And Wallnau, L. (1992). Statistics for the behavioral sciences (3rd ed.). St. Paul MN: West Publishing Company.
Guralnick, M. J. (1990). Social competence and early intervention. Journal o f Early Intervention. 14. (1), 3-14.
Gurin, P., Gurin, G., Lao, R. C. and Beatie, M. (1969). Internal-external control in the motivational dynamics o f Negro youth. Journal o f Social Issues. 25. 29-53.
Gurin, P., Gurin, G., and Morrison, B. M. (1978). Personal and ideological aspects o f internal and external control. Social Psychology. 41. 275-296.
Hanson, S. L. (1994). Lost talent: Unrealized educational aspirations and expectations among U.S. youths. Sociology o f Education. 67. 159-183.
Hanson, K. and Litten, L. (1982). Mapping the road to academia: A review of research on women, men and the college selection process. In P. Perun (ed.) The Undergraduate Woman: Issues in Education. Lexington, MA: Lexington Books.
Hauser, R. and Anderson, D. (1991). Post-high school plans and aspirations of Black and White high school seniors: 1976-86. Sociology o f Education. 64. 263-77.
Hauser, R. and Featheiman, D. (1977). The process o f stratification treads and analysis. New York: Academic Press.
Heam, J. (1984). The relative roles o f academic ascribed and socioeconomic characteristics in college destinations. Sociology o f Education. 57. 22-30.
Reproduced with permission of the copyright owner. Further reproduction prohibited without permission.

192
Hilton, T. L. (1982). Persistence in higher education. New York: The CollegeBoard.
Hossler, D. (1984). Enrollment management: an integrated approach. New York: The College Board.
Hossler, D. and Gallagher, K. (1987). Studying student college choice: A three- phase model and the implications for policy-makers. College and University. 2. (3), 207-21.
Hossler, D. and Maple, S. (1993, Spring). Being undecided about postsecondary education. The Review o f Higher Education. 287-307.
Hossler, D. and Stage, F. (1987). An analysis o f student and parent data from the pilot year o f Indiana college placement and assessment center. Bloomington:Indiana College Placement and Assessment Center.
Hossler, D. and Stage, F. (1992). Family and high school experience influences on the postsecondary educational plans o f ninth-grade students. American Educational Research Journal. 29. (2), 425-51.
Hossler, D., Braxton, J. and Coopersmith, G. (1989). Higher education: Handbook o f theory and research. New York: Agatha Press.
Jackson, G. A. (1978). Financial aid and student enrollment. Journal o f Higher Education. 49. 548-74.
Jackson, G. A. (1982). Public efficiency and private choice in higher education. Educational Evaluation and Policy Analysis. 4. (2), 237-47.
Jackson, G. A. (1986). MISS A. the fall o f Siagon. and college choice: 1972 to 1980. Paper presented at the Annual Meeting o f the Association for the Study o f Higher Education, San Diego, February.
James, W. H. (1957). Internal versus external control of reinforcements as a basic variable in learning theory. Unpublished doctoral dissertation, Ohio State University.
Johnson, F. Y. (1961). Political atitudes as related to internal and external control. Unpublished master’s thesis, Ohio State University, Columbus.
Joreskog, G. and Sorbom, D. (1988). LISREL 7: A guide to the program and applications. SPSS.
Reproduced with permission of the copyright owner. Further reproduction prohibited without permission.

193
Kandel, D. B. and Lesser, G. S. (1968). Parental and peer influences on educational plans o f adolescents. Paper presented at the Annual Meeting o f the American Sociological Association, Boston, August.
Kaufman, P. and Rasinski, K. A. (1991). Quality o f the responses o f eighth- grade students in NELS:88. National Education Longitudinal Study o f 1988. Technical Report. (ERIC Document Reproduction Service No. ED339 722)
Keith, V. and Finlay, B. (1988). The impact o f parental divorce on children’s educational attainment, marital timing and likelihood o f divorce. Journal o f Marriage and Family. 50. 796-809.
Keller, M. and McKewon, M. (1984). Factors contributing to posts econdarv enrollment decisions o f Maryland National Merit Scholarship semifinalists. Paper presented at the Annual Meeting o f the Association for the Study o f Higher Education, Chicago.
Kerkhoff, A. (1976). The status attachment process: Socialization or allocation? Social Forces. 55. 368-81.
Kerckhoff, A. and Campbell, R. (1977). Black-White differences in the educational attainment process. Sociology o f Education. 5 0 .15-27.
Kohn, M., Manski, C. and Mundel, D. (1976). An empirical investigation of factors influencing college going behaviors. Annuals o f Economic Social Measurement. 5 (41. 391-419.
Kolstad, A. J. (1979). The influence o f high school type and curriculum on enrollment in higher education and posts econdarv training. Paper presented at the Annual Meeting o f the American Educational Research Association, San Francisco, April.
Kotler, P. (1976). Applying marketing theory to college admissions. In A Role for Marketing in College Admissions. New York: The College Entrance Examination Board.
Lam, J. and Hoffinen, D. (1979). The study o f sequential student participation in university in a changing environment. Manitoba, Canada: Brandon University.
Lefcourt, H. M. (1982). Locus of control. New York: John Wiley & Sons.
Lefcourt, H. M. and Ladwig, G. W. (1965). The American Negro: A problem in expectancies. Journal o f Personality and Social Psychology. 1. 377-380.
Reproduced with permission of the copyright owner. Further reproduction prohibited without permission.

194
Lent, R., Brown, S. And Larkin, K. (1986). Self-efficacy in the prediction of academic performance and perceived career options. Journal o f Counseling psychology. 33. (3), 265-269.
Leslie, L., Johnson, G. and Carlson, J. (1977). The impact o f need-based student aid upon the college attendance decision. Journal o f Education Finance. 2 .269-86.
Lester, D. (1992). Cooperative/Competative strategies and locus o f control. Psychological Reports. 71. 594.
Lewin, K. (1947). Frontiers in group dynamics. Human Relations. 1. 5-41.
Lewis, G. and Morrison, J. (1975). A longitudinal study o f college selection. Tech. Report No. 2 Pittsburgh: School o f Urban Public Affairs, Camegie-Mellon University.
Litten, L. H. (1982). Different strokes in the applicant pool: Some refinements in a model o f student college choice. Journal of Higher Education. 53. (4), 383-402.
Litten, L. H., Sullivan, D. and Brodigan, D. (1983). Applying market research in college adm issions. New York: The College Board.7.
Little, C. B. (1977). Dimensionality of the Internal-External Control scale:Some further evidence. Journal o f Genetic Psychology. 131. 329-330.
M aguire, J. and Lay, R. (1981). Modeling the college choice process. College and University. 56. (2), 123-39.
Manski, C. and Wise, D. (1983). College choice in America. Cambridge, MA: Harvard University Press.
Marini, M. and Greenberger, E. (1978). Sex differences in educational aspirations and expectations. American Education Research Journal. 15. (1), 67-79.
Marsh, H. W. and Richards, G. E. (1984). The multidimensionality o f the Rotter I-E scale: An application of confirmatory factor analysis. (ERIC Document Reproduction Service No. ED 253 569)
Mattila, J. P. (1982). Determinants o f male school enrollment: A time series analysis. Review o f Economics and Statistics. 64. 242-51.
McGhee, P. E. and Crandall, V. C. (1968). Belief in internal-external control of reinforcements and academic performance. Child Development. 39. 91-102.
Reproduced with permission of the copyright owner. Further reproduction prohibited without permission.

195
McLaughlin, D. H. (1997). NELS:88 survey item evaluation report. National Education Longitudinal Study o f 1988. Technical Report. (ERIC Document Reproduction Service No. ED408 365)
Messick, S. (1997). Potential uses o f noncognitive measurement in education. Journal o f Educational Psychology. 71. (3), 281-292.
Miami-Dade County Pub he Schools. (1998). [FTE membership for October, 1998]. Unpublished raw data.
Mickelson, R. A. (1990). The attitudes-achievement paradox among Black adolescents. Sociology o f Education. 63. 44-61.
Miller, I. (1983). Higher education: The demography o f opportunity. Journal o f College Admissions. 101. 10-13.
Mirels, H. L. (1970). Dimensions o f internal versus external control as measured by the Rotter scale. Journal of Consulting and Clinical Psychology. 34. 226- 228.
Murphy, P. E. (1981). Consumer buying roles in college choice. College and University. 57. 141-50.
Murray, C. B. (1992). Implications o f self-handicapping strategies for academic achievement: A reconceptualization. Journal o f Social Psychology. 132. (1), 23-37.
National Center for Educational Statistics (1994). Digest o f Educational Statistics. Washington, DC: U.S. Department o f Education, Office o f Educational Statistics.
Nettles, M., Thoeny, A. and Gosman, E. (1986). Comparative and predictive analyses o f Black and White students’ college achievement and experiences. Journal o f Higher Education. 57. (3), 289-318.
Nolfi, G. J. (1978). Experiences o f recent high school graduates. Lexington, MA: Lexington Books.
Nowicki, S and Strickland, B. R. (1973). A locus o f control scale for children. Journal o f Clinical Psychology. 40. 148-154.
O’Brian, G. E. and Kabanoff, B. (1981). Australian norms and factor analysis o f Rotter’s Internal-External Control scale. Australian Psychologist. 16. 184-202.
Reproduced with permission of the copyright owner. Further reproduction prohibited without permission.

196
Ogbu, J. V. (1978). Minority education and caste. New York: Academic Press.
Otto, L., (1976). Social integration and the status attainment process. American Journal o f Sociology. 81. 1360-1383.
Pajares, F. (1996). Self-efficacy beliefs in academic settings. Review o f Educational Research. 66 (4), 543-578.
Parkin, F. (1976). Class, inequality and political order. New York: Praeger.
Patchen, M. (1982). Black-White contact in schools: Its social and academic effects. West Lafayette IN: Purdue University Press.
Paulsen, M. B. (1990). College Choice: Understanding Student Enrollment Behavior. ASHE-ERIC Higher Education Report No. 6. Washington, D.C.:Association for the Study of Higher Education.
Peters, W.B. (1977). Fulfillment o f short-term educational plans and continuance in education. Washington, DC: National Center o f Educational Statistics.
Phares, J. E. (1957). Expectancy changes in skill and chance situations. Journal o f Psychology. 54. 339-342.
Phares, J. E. (1976). Locus o f control in personality. Morristown, NJ: LearningPress.
Portes, A. and Wilson, K. (1976). Black-White differences in educational attainment. American Sociological Review. 41. 414-431.
Pruitt, A. S. (1973). Minority admissions to large universities: A response. Journal o f College Student Personnel. 14. 22-24.
Ramey, C. T., McGinnes, G. D., Cross, L., Collier, A. M. and Barrie-Blackley,S. (1982). The Abecedarian approach to social competency: Cognitive and linguistic intervention for disadvantaged preschoolers. In K. Borman (Ed.), The Social Life o f Children in a Changing Society. Hillsdale, N.J.: Erlbaum.
Ramey, C. T. and Ramey, S. L. (1992). At risk does not mean doom. National Health/Education Consortium Occasional Paper No. 4. National Commission to Prevent Infant Mortality, Institute for Educational Leadership, Washington D. C.
Reim, B, Glass, D.C. and Singer, J. E. (1971). Behavioral consequences o f exposure to uncontrolled and unpredictable noise. Journal o f Applied Social Psychology. 1 .44-56.
Reproduced with permission of the copyright owner. Further reproduction prohibited without permission.

197
Rodman, H. (1963). The lower class value stretch. Social Forces. 42. 205-215.
Rosovsky, H. (1990). The university: An owners manual. New York: Norton.
Rotter, J. B. (1954). Social learning and clinical psychology. Englewood Cliffs, NJ: Prentice Hall.
Rotter, J. B. (1966). Generalized expectancies for internal versus external control o f reinforcement. Psychological Monographs: General and Applied. 80 ( 11. 1-28.
Rotter, J. B. (1995). Some problems and misconceptions related to the construction o f internal versus external control o f reinforcements. Journal o f Consulting and Clinical Psychology. 43. 56-67.
Rotter, J. B. and Mulry, R. (1965). Internal versus external control of reinforcements and decision time. Journal o f Personality and Social Psychology. 2. 599-604.
Rotter, J. B., Seeman, M., and Liverant, S. (1962). Internal versus external control of reinforcements: A major variable in behavior theory. In N.F. Washbume (ed.) Decisions. Values and Groups. Pergamon Press. New York.
Russell, C. N. (1980). Survey o f grade 12 students’ postsecondarv plans and aspirations. Manitoba, Canada: Department o f Education.
Sanger, S. S. and Alker, H. A. (1972). Dimensions of internal-external locus of control and the women’s liberation movement. Journal o f Social Issues. 28. 115-129.
Schmit, J. and Hossler, D. (1995). Were are they now? A nine year longitudinal study of student college choice. Paper presented at the annual meeting o f the American Educational Research Association, San Francisco, CA.
Schulz, R. (1976). Effects o f control and predictability on the physical and psychological well-being o f the institutionalized aged. Journal o f Personality and Social Psychology. 33. 563-573.
Sedlacek, W. and Brooks, G. (1976). Racism in American education: a model for change. Chicago: Nelson-Hall.
Seligman, M. E. P. (1975). Helplessness: On depression, development and death. San Francisco: Freeman.
Sewell, W. and Hauser, R. (1975). Education, occupation and earnings: Achievements in earlv career. New York: Academic Press.
Reproduced with permission of the copyright owner. Further reproduction prohibited without permission.

198
Sewell, W. and Shah, V. (1978). Social class, parental encouragement, and educational aspirations. American Journal o f Sociology. 3. 559-72.
Sherrod, D. R. (1974). Crowding, perceived control, and behavioral after effects. Journal o f Applied Social Psychology. 4. 171-186.
Sherrod, D. R. and Cohen, S. (1978). Density, perceived control, and design. In J.R. Aiello, and A. Baum (eds.), Residential crowding and design. New York, Plenum.
Skinner, E., Wellborn, J., and Connell, J. (1990). What it takes to do well in school and whether I’ve got it: A process model o f perceived control and children’s engagement and achievement in school. Journal o f Educational Psychology. 82. (1), 22- 32.
Sleeter, C. and Grant, C. (1987). Race. Class and Gender and Abandoned Dreams. Paper presented at the meetings o f American Educational Research Association, Washington, DC.
Soper, E. L. (1971). A study of factors influencing the postsecondarv educational plans o f Utah high school students. Washington, DC: National Center for Educational Statistics.
Spady, W. G. (1975). Lament for the letterman: Effects of peer status and extracurricular activities on goals and achievement. American Journal o f Sociology. 75. 680-702.
Spies, R. (1978). The effects o f rising costs on college choice: A study o f the application decision o f high ability students. New York: The College Board.
Stage, F. and Hossler, D. (1989). Differences in family influences on college attendance plans for male and female ninth graders. Research in Higher Education. 30. (3), 301-315.
Stewart, N. et al. (1987). Counselor impact on college choice. Paper presented at the Annual Meeting o f the American Educational Research Association, Washington, DC.
Stipek, D. and Weisz, J. (1981). Perceived personal control and academic achievement. Review o f Educational Research. 51. 101-137.
Taylor, K. And Betz, N. (1983). Applications o f self-efficacy theory to the understanding and treatment o f career indecision. Journal o f Vocational Behavior. 22. 63-81.
Reproduced with permission of the copyright owner. Further reproduction prohibited without permission.

199
Thomas, J., Iventosch, L., and Rohwer, W. (1987). Relationships among student characteristics, study activities, and achievement as a function o f course characteristics. Contemporary Educational Psychology. 12. 344-364.
Tierney, M. (1980). Student college choice sets: Toward an empirical characterization. Paper presented at the Annual Meeting o f the Association for the Study of Higher Education, Washington, DC, March.
Tillery, D. (1973). Distribution and differentiation o f vouth: A study o f transition from school to college. Cambridge, MA: Ballinger.
Tracey, T. and Sedlacek, W. (1984). Noncognitive variables in predicting academic success by race. Measurement and Evaluation in Guidance. 16. 171-178.
Tracey, T. and Sedlacek, W. (1985). The relationship o f noncognitive Variables to academic success: A longitudinal comparison by race. Journal o f College Student Personnel. 26. (5), 405-10.
Tracey, T. and Sedlacek, W. (1987). A comparison of White and Black student academic success using noncognitive variables: A LISREL analysis. Research in Higher Education. 27. (4), 333-348.
Trent, J. and Medsker, L. (1967). Bevond high school: A psychological study of 10.000 high school graduates. San Francisco: Jossey-Bass.
Tuttle, R. (1981). A path analytical model o f the college going decision. Boon, NC: Appalachian State University.
United States Department o f Education, Office o f Educational Research and Improvement. (1992). National Education Longitudinal Study of 1988 User’s Manuel. Washington DC: U.S. Government Printing Office.
Wang, .C., Haertel, G.D, & Walberg, H.J. (1993). Toward a knowledge base for school learning, Review o f Educational Research. 63. 249-294.
Watson, J. M. (1981). A note on the dimensionality of the Rotter Locus o f Control scale. Australian Journal o f Psychology. 33. 319-330.
Weldi, A. and Novratil, F. (1987). The role o f applicant’s perceptions in the choice of college. College and University. 62. (2), 147-60.
Wilhite, S. C. (1990). Self-efficacy, locus o f control, self-assessment of memory ability and study activities as predictors o f college course achievement.Journal of Educational Psychology. 82. (4), 696-700.
Reproduced with permission of the copyright owner. Further reproduction prohibited without permission.
200
Williams, J. E. and Coombs, W. T. (1996). An analysis of the reliability and validity o f Bandura’s multidimensional scales o f perceived self-efficacv. Paper presented at the Annual Meeting o f the American Educational Research Association, New York, April.
Willingham, W. W. (1970). Free access to higher education. New York: The College Board.
Yang, S. W. (1981). Rural youth’s decisions to attend college: Aspirations and realizations. Paper presented at the Annual Meeting o f the Rural Sociological Association, Guelph, Ontario, July.
Young, M. and Reyes, P. (1987). Conceptualizing enrollment behavior. Journal of Student Financial Aid. 17. (3), 41-49.
Zemsky, R. and Oedel, P. (1983). The structure o f college choice. New York: The College Board.
Zimmerman, B. J. (1990). Self-regulated learning and academic achievement:An overview. Educational Psychology. 25. 3-17.
Zimmerman, B. J., Bandura, A. and Martinez Pons, M. (1992). Self-motivation for academic attainment: The role o f self-efficacy beliefs and personal goal-setting. American Educational Research Journal. 23. 614-628.
Zuckerman, M. and Gerbasi, K. C. (1977). Dimensions o f the I-E scale and the relationship to other personality measures. Educational and Psychological Measurement. 37. (1), 157-75.
Reproduced with permission of the copyright owner. Further reproduction prohibited without permission.

APPENDIX A:
INSTRUMENT SET AND COVER LETTERS
201
Reproduced with permission of the copyright owner. Further reproduction prohibited without permission.

202
Table A.l
Instrument Set Administered to all Student Samples
Note: The original instrument was to be electronically scanned and was printed on three legal size pages. The questionnaire is formatted here to integrate with the entire document.
Student Questionnaire
For the first three questions please fill in the best response to describe yourself.
1. Age: 0 13 0 14 0 15 0 16 0 17 0 18 0 19 0 202. Race: O African American O Asian American O Hispanic
O Native American O White3. Gender: O Female O Male
For the next thirteen questions please fill in the number which best answers each question.
1 = not well at all 3 = pretty well2 = not too well 4 = very well
4. How well can you leam in school? ® ® ®5. How well can you leam mathematics? ® ® ®6. How well can you leam algebra? ® ® ®7. How well do you feel you could do in solving the ® ® ®
following problem? Solve the quadratic equation by factoring: 6x2 + 17x + 12 = 0. Don't spend time actually solving the equation.
8. How well can you leam science? ® ® ® ®9. How well can you leam biology? ® ® <D ®10. How well can you leam reading and writing language
skills?® ® ® ®
11. How well can you leam to use computers? ® ® ® ®12. How well can you leam a foreign language? ® ® ® ®13. How well can you leam English grammar? ® ® ® ®14. How hard do you work to solve math problems? ® ® ® ®
1=1 don’t try 2 = not too hard 3 = pretty hard 4 = very hard15. When you encounter a difficult problem in math, how long (D ® ® ®
do you keep trying to solve the problem?1=1 skip it 2 = not too long 3 = until I ’ve given it a good try 4 = until it’s solved
Reproduced with permission of the copyright owner. Further reproduction prohibited without permission.

203
16. If you can’t solve a particular kind o f math problem how <2> ® <D © likely are you to attempt to solve a similar problem?1 = not at all likely 2 = not too likely 3 = likely 4 = very likely
For the next set o f questions you must choose between two statements. Read both statements carefully and then fill in the bubble for the statement with which you most agree. Only fill in one bubble for each question.
17. ® Children get into trouble because their parents punish them too much.® The trouble with most children nowadays is that their parents are too
easy with them.18. ® Many o f the unhappy things in people’s lives are partly due to bad luck.
® People’s misfortunes result from the mistakes they make.19. <X> One o f the major reasons why we have wars is because people don’t take
enough interest in politics.® There will always be wars, no matter how hard people try to prevent
them.20. ® In the long run people get the respect they deserve in this world.
® Unfortunately, an individual’s worth often passes unrecognized nomatter how hard he tries.
21. ® The idea that teachers are unfair to students is non-sense.® Most students don’t realize the extent to which their grades are
influenced by accidental happenings.22. ® Without the right breaks one cannot be an effective leader.
® Capable people who fail to become leaders have not taken advantage o ftheir opportunities.
23. ® No matter how hard you try some people just don’t like you.® People who can’t get others to like them don’t understand how to get
along with others.24. ® Heredity plays the major role in determining one’s personality.
® It is one’s experiences in life which determine what they’re like.25. ® I have often found that what is going to happen will happen.
® Trusting to fate has never turned out as well for me as making a decisionto take a definite course o f action.
26. ® In the case of the well prepared student there is rarely if ever such a thingas an unfair test.
® Many times exam questions tend to be so unrelated to course work thatstudying is really useless.
27. ® Becoming a success is a matter o f hard work, luck has little or nothing todo with it.
® Getting a good job depends mainly on being in the right place at the righttime.
Reproduced with permission of the copyright owner. Further reproduction prohibited without permission.

204
28. ®®
29. ®®
30. ®®
31. ®®
32. ®
33. ®
®
34. ®
®35. ®
®36. ®
®37. ®
®
38. ®®
39. ®
®
40. ®
®41. ®
®
The average citizen can have an influence in government decisions.This world is run by the few people in power, and there is not much the little guy can do about it.When I make plans, I am almost certain that I can make them work.It is not always wise to plan too far ahead because many things turn out to be a matter o f good or bad fortune anyhow.There are certain people who are just no good.There is some good in everybody.In my case getting what I want has little or nothing to do with luck.Many times we might just as well decide what to do by flipping a coin. Who gets to be the boss often depends on who was lucky enough to be in the right place first.Getting people to do the right thing depends upon ability, luck has little or nothing to do with it.As far as world affairs are concerned, most o f us are the victims o f forces we can neither understand, nor control.By taking an active part in political and social affairs the people can control world events.Most people don’t realize the extent to which their lives are controlled by accidental happenings.There really is no such thing as luck.One should always be willing to admit mistakes.It is usually best to cover up one’s mistakes.It is hard to know whether or not a person really likes you.How many friends you have depends upon how nice a person you are.In the long run the bad things that happen to us are balanced by the good ones.Most misfortunes are the result o f lack of ability, ignorance, laziness or all three.With enough effort we can wipe out political corruption.It is difficult for people to have much control over the things politicians do in office.Sometimes I can’t understand how teachers arrive at the grades they give.There is a direct connection between how hard I study and the grades I get.A good leader expects people to decide for themselves what they should do.A good leader makes it clear to everybody what their jobs are.Many times I feel that I have little influence over the things that happen to me.It is impossible for me to believe that chance or luck plays an important role in my life.
Reproduced with permission of the copyright owner. Further reproduction prohibited without permission.

205
42. (D People are lonely because they don’t try to be friendly.© There’s not much use in trying too hard to please people, if they like you,
they like you.43. (D There is too much emphasis on athletics in high school.
® Team sports are an excellent way to build character.44. (D What happens to me is my own doing.
® Sometimes I feel that I don’t have enough control over the direction mylife is taking.
45. ® Most o f the time I can’t understand why politicians behave the way theydo.
® In the long run the people are responsible for bad government on anational as well as on a local level.
46. For each o f the school subjects listed below, mark the circle that best describes your grades from the sixth grade up till now.
mostly A ’s mostly B’s mostly C ’s mostly D’s mostly F’:English O O O O OMath O O O O OScience O O O o OSocial O O O o OStudies
47. How strongly do you want to attend college? (select only one)O I would very much like to attend college.O I would like to attend college.O Attending college would be ok, but it is not a priority for me.O I do not want to attend college.
48. How strong are your expectations to be able to attend college? (select only one)O I definitely will attend college.O I probably will attend college.O I probably will not attend college.O I definitely will not attend college.
49. At what age did you begin to think about going to college?O I have never considered going to college.O while in grade school (Kindergarten-5th grade)O while in Junior High (6th-8th grade)O during the ninth gradeO I have always known that I would go to college.
Reproduced with permission of the copyright owner. Further reproduction prohibited without permission.

206
50. How far in school do you think your parents want you to get? (Answer only once for each parent by indicating the furthest you think they want you to go)
Father Motheror male or femaleguardian guardian
less than high school graduation O Ograduate from high school but not go any further O Ogo to vocational, trade or business school after high school O oattend college O ograduate from college O oattend higher level o f school after graduating from college O odon’t know O o
51. How far in school did your parents go? (answer once for each parent)Father Mother
or male or femaleguardian guardian
did not finish high school O Ograduated from high school or equivalent (GED) O Oattended vocational school but did not graduate o ograduated from vocational school o oattended college but did not graduate o ograduated from college o oattended graduate or professional school o oreceived a graduate or professional degree o o
52. Fill in the school activities in which you have participated.o science fairso school sports (playing against teams from other schools)o intramural sports (playing against teams from your own school)o cheerleadingo band or orchestrao chorus or choiro danceo history clubo science clubo math clubo foreign language clubo other subject matter clubo debate or speech teamo drama clubo academic honors society, Beta Club or National Honor Societyo student newspaper
Reproduced with permission of the copyright owner. Further reproduction prohibited without permission.

207
o student yearbooko student councilo computer clubo vocational education clubo 4-Ho scoutingo other
In which school program are you enrolled (check one)?O general high school programO vocational, technical or business and careero college prep, academic or specialized academic (such as science or math)o other specialized high school program (such as fine arts)o othero don’t know
Do you participate in the free or reduced lunch program? (select one)O yes O no
Please indicate the other people who live in your household. (Select as many as apply)O motherO fathero step-mothero step-fathero brothers (indicate number o f brothers including step-brothers and half-
brothers in your household)O 1 0 2 0 3 0 4 0 5 0 6+
o sisters (indicate number o f sisters including step-sisters and half-sisters in your household)O l 0 2 0 3 0 4 0 5 0 6+
o relatives (indicate the number o f other relatives living in your household) O l 0 2 0 3 0 4 0 5 0 6+
Reproduced with permission of the copyright owner. Further reproduction prohibited without permission.

208
Table A.2
Instruction Letter to Teachers
December 9, 1998
Dear Colleague:
Thank you for participating in this college choice research study. The purpose of this inquiiy is to examine the factors which motivate students to go to college and hopefully, develop strategies which can be used to increase the number o f young adults who aspire to a college education.
Please have your students use a # 2 pencil to complete the questionnaire. It is relatively straight forward and should take about fifteen minutes to complete. The directions for each section should be easy for your students to understand and the entire questionnaire was successfully tested with a pilot group o f ninth-grade students from diverse backgrounds. The only section which may need clarification deals with questions 17 through 45. Here the students are asked to choose between two statements, selecting the one with which they most agree. The students might indicate they agree with both statements but should be directed to select only one statement, the one they agree with most.
After your students have completed the questionnaire, please return the forms to the envelope in which they came, write the name o f your school and grade level o f your class on the envelope, and return it to your principal or the principal’s designee. The information contained in the questionnaire is to be anonymous so do not indicate any additional information on the questionnaires or the envelope. A full report o f the results o f the survey for your school will be shared with your principal once the study is complete.
Again, thank you for your time and assistance.
Sincerely,
Stuart Johnson
Reproduced with permission of the copyright owner. Further reproduction prohibited without permission.

209
Table A.3
Parental Consent FormNote: This form was contained on a single page when distributed. Inclusion here haslengthened it to two pages.
Consent Form
Purpose o f the Study: You are being asked to give permission for your child toparticipate in a research study examining the factors which motivate students to go to college. Please read the details o f the study. If you do not wish your child to participate in the study, please complete the bottom part o f the form, sign and return to school.
Title o f Research Study: College Choice: Psychological Factors Influencing Postsecondary Aspirations and Expectations o f Ninth-Grade Students
Project Directors: Principal Investigator: Dr. Chad Ellett, 113 Peabody Hall, LouisianaState University, Baton Rouge LA (504) 388-3488Student Investigator: Stuart Johnson (504) 342-8109
Procedures and Data: During English class, the students will be asked to complete a questionnaire answering questions related to their interest in going to college. Students will also be asked to indicate their age, race and sex. The questionnaire takes about 20 minutes to complete.
Potential Benefits and Risks: By identifying factors which motivate students to attend college, teachers and school officials can develop strategies to increase the number o f students that decide to go to college. There are no apparent risks to the students who participate in this study.
Protection o f Confidentiality: The project director will pass out and collect thequestionnaires without looking at the answers. After all the questionnaires are completed, only the project directors will review the completed questionnaires. No identifying marks will be on the questionnaires and no effort will be made to identify the students participating in the study.
Student Agreement to Participate in the Study: The study will be explained to the students and volunteers will be asked to participate. No student will have to participate if they do not want to and no student will participate if the parents does not wish the student to participate.
Reproduced with permission of the copyright owner. Further reproduction prohibited without permission.

210
I do not wish to have my child participate in the study.
student’s name parent's signature date
Reproduced with permission of the copyright owner. Further reproduction prohibited without permission.
APPENDIX B:
SUMMARY OF DESCRIPTIVE STATISTICS
211
Reproduced with permission of the copyright owner. Further reproduction prohibited without permission.

212
Table B.l
Summary of Descriptive Statistics for Each Item for the Academic Self-Efficacv Scale(n = 1076)
Item M S.D. %Max*
4 3.23 .60 80.85 3.00 .82 75.06 2.98 .85 74.57 2.92 .94 73.08 3.18 .70 79.59 2.98 .79 74.5
10 3.32 .67 83.011 3.35 .74 83.812 2.84 .86 71.013 3.17 .70 79.314 2.85 .77 71.315 2.96 .83 74.016 2.72 .75 68.0
* Percentage o f maximum is calculated by dividing the item mean score by the maximum possible score for the item. All Academic Self-Efficacy items have a maximum possible score o f four (4).
Reproduced with permission of the copyright owner. Further reproduction prohibited without permission.

213
Table B.2
Summary o f Frequency Distributions o f Internal-External Locus of Control Scale(n = 1076)
Item Frequency Percentage of Total Frequency Missing
18a* 951 88.418b 120 11.2 5
19a 234 21.719b* 827 76.9 15
20a 462 42.920b* 599 55.7 15
21a 384 35.721b* 670 62.3 22
22a* 293 27.222b 763 70.9 20
23a* 638 59.323b 424 39.4 14
25a* 484 45.025b 573 53.3 19
26a 539 50.126b* 522 48.5 15
27a 784 72.927b* 266 24.7 26
28a 569 52.928b* 496 46.1 11
29a 538 50.029b* 530 49.3 8
(table continues)
Reproduced with permission of the copyright owner. Further reproduction prohibited without permission.

214
Item Frequency Percentage o f Total Frequency Missing
31a 725 67.431b* 333 30.9 18
32a* 189 17.632b 880 81.8 7
33a* 573 53.333b 483 44.9 20
34a* 657 61.134b 400 37.2 19
36a* 652 61.636b 400 37.2 24
37a* 528 49.137b 531 49.3 17
38a 355 33.038b* 702 65.2 19
39a* 379 35.239b 681 63.3 16
41a* 569 52.941b 476 44.2 31
42a 354 32.942b* 706 65.6 16
44a 637 59.244b* 414 38.5 25
45a* 607 56.445b 443 41.2 26
* Indicates choice with external orientationNote: Items 17,24, 30, 35,40 and 43 are filler items and therefore not included
Reproduced with permission of the copyright owner. Further reproduction prohibited without permission.

215
Table B.3
Summary o f Descriptive Statistics for Academic Achievement
Subject M S.D. %Max*
Total Sample <n = 1061English 3.94 .92 78.8Mathematics 3.64 1.06 72.8Science 3.89 .93 77.8Social Studies 3.90 .97 78.0
African Americans (n = 195)English 3.73 1.01 74.6Mathematics 3.26 1.25 65.2Science 3.57 .93 71.4Social Studies 3.65 1.09 73.0
Hispanics (a = 4501English 3.75 .91 75.0Mathematics 3.47 1.01 69.4Science 3.74 .94 74.8Social Studies 3.75 1.00 75.0
Whites fn = 3151English 4.31 .78 86.2Mathematics 4.02 .87 80.4Science 4.23 .79 84.6Social Studies 4.22 .77 84.4
♦Percentage of maximum is calculated by dividing the item mean score by the maximum possible score for the item. All Academic Achievement items have a maximum possible score o f five (5).
Note: Responses were assigned the following values: A = 5, B = 4 , C = 3, D = 2 and F = 1.
Reproduced with permission of the copyright owner. Further reproduction prohibited without permission.

Table B.4
Summary Descriptive Statistics for College Aspirations
216
Sample N M S.D. %Max*
Total Sample 1076 3.70 .61 92.5African Americans 195 3.62 .65 90.5Hispanics 450 3.63 .67 90.8Whites 315 3.85 .44 96.3
* Percentage of maximum is calculated by dividing the item mean score by the maximum possible score for the item. The maximum possible score for College Aspirations is four (4).
Note: Responses were assigned the following values: Very high aspiration = 4, High aspirations = 3, Moderate aspirations = 2 and Low aspiration = 1.
Reproduced with permission of the copyright owner. Further reproduction prohibited without permission.

Table B.5
Summary Descriptive Statistics for College Expectations
217
Sample N M S.D. %Max*
Total Sample 1076 3.61 .63 90.3African Americans 195 3.57 .67 89.3Hispanics 450 3.51 .68 87.8Whites 315 3.77 .48 94.3
* Percentage o f maximum is calculated by dividing the item mean score by the maximum possible score for the item. The maximum possible score for College Expectations is four (4).
Note: Responses were assigned the following values: Very high expectations = 4, High expectations = 3, Moderate expectations = 2 and Low expectations = 1.
Reproduced with permission of the copyright owner. Further reproduction prohibited without permission.

218
Table B.6
Summary o f Frequency Distributions for Parental Expectations (n = 1076)
Level of Education Frequency Percentage o f Total
Father or Male GuardianLess than high school graduation 12 1.1Graduate from high school 21 2.0Attend voc/tech or business school 23 2.1Attend college 48 4.5Graduate from college 299 27.8Attend post graduate school 378 35.1Don’t know 83 7.7Frequency Missing 212 19.7
Mother or Female GuardianLess than high school graduation 8 0.7Graduate from high school 21 2.0Attend voc/tech or business school 21 2.0Attend college 52 4.8Graduate from college 297 27.6Attend post graduate school 420 39.0Don’t know 53 4.9Frequency Missing 204 19.0
Reproduced with permission of the copyright owner. Further reproduction prohibited without permission.

219
Table B.7
Summary o f Frequency Distributions for Parents’ Level o f Education (n = 1076)
Level o f Education Frequency Percent
Father or Male GuardianDidn’t graduate from high school 128 11.9Graduated from high school 181 16.8Attended voc/tech or business school 14 1.3Graduated from voc/tech/business school 19 1.8Attended college 78 7.2Graduated from college 191 17.8Attended graduate/professional school 60 5.6Received graduate/professional degree 212 19.7Frequency Missing 193 17.9
Mother or Female GuardianDidn’t graduate from high school 115 10.7Graduated from high school 195 18.1Attended voc/tech or business school 9 0.8Graduated from voc/tech/business school 25 2.3Attended college 107 9.9Graduated from college 229 21.3Attended graduate/professional school 47 4.4Received graduate/professional degree 178 16.6Frequency Missing 171 15.9
Reproduced with permission of the copyright owner. Further reproduction prohibited without permission.

220
Table B.8
Summary of Frequency Distributions for Participation in Extracurricular Activities (n =1076)
Activity Frequency
Science fairs 492School sports 462Intramural sports 194Cheerleading 99Band or orchestra 202Chorus or choir 167Dance 196History club 46Science club 123Math club 106Foreign language club 142Other subject matter club 194Debate or speech team 74Drama club 125Honor society/Beta club 177Student newspaper 60Student yearbook 64Student council 92Computer club 77Vocational education club 274-H 17Scouting 76Other 175
Reproduced with permission of the copyright owner. Further reproduction prohibited without permission.

221
Table B.9
Summary o f Frequency Distributions for High School Academic Track (n = 1076)
Track Frequency Percentage of Total
General high school program 528 49.1V oc/tech/business/career 38 3.5College prep 123 11.4Specialized program 40 3.1Other 32 3.0Don’t know 216 20.1Frequency Missing 99 9.2
Reproduced with permission of the copyright owner. Further reproduction prohibited without permission.

APPENDIX C:
SUPPLEMENTAL FACTOR STRUCTURES FOR LOCUS OF CONTROL AND ACADEMIC SELF-EFFICACY MEASURES
222
Reproduced with permission of the copyright owner. Further reproduction prohibited without permission.

223
Table C.l
Summary o f the Rotated Factor Structure Coefficients for Items Retained for the Three-Factor Orthogonal Solution for the Internal-External Locus o f Control Scale (n = 1076)
I-ELOC Communality Factor CoefficientsItem Estimates*________ I___ II___________ in
*18 .10 .27 .03 .17
19 .14 -.07 .35 .13
*20 .11 .17 .26 -.11
*21 .09 .20 .23 -.04
*22 .05 .13 .17 -.02
23 .25 0 -.01
eV)•
*25 .09 .08 .10 .27
26 .25 .30 .40 -.01
27 .36 .56 .03 -.21
28 .41 .13 .63 -.10
29 .19 .40 .14 .09
31 .36 .60 0 -.06
32 .35 .59 -.06 -.01
33 .36 -.02 .57 .19
34 .25 .30 .07 .40
36 .15 -.01 -.11 .37
37 .19 -.02 -.05 .43
(table continues)
Reproduced with permission of the copyright owner. Further reproduction prohibited without permission.

224
I-ELOCItem
CommunalityEstimates I
Factor Coefficientsn m
38 .43 -.14 .64 .04
*39 .16 .22 .27 .20
41 .36 .32 .08 .50
*42 .10 -.12 .04 .31
44 .10 .42 .09 .03
45 .21 -.14 .08 .43
Variance Explained11 8.45% 7.43% 6.73%
Total Variance Explained0 22.6%
Bold type indicates item/factor location* Item loadings do not meet criteria established for item retention on factora. Sum of squared loadings for this four-factor solutionb. Percentage o f item variance explained by each factorc. Percentage o f total item variance explained
Reproduced with permission of the copyright owner. Further reproduction prohibited without permission.

225
Table C.2
Summary o f the Rotated Factor Structure Coefficients for Items Retained for the Five-Factor Orthogonal Solution for the Internal-External Locus o f Control Scale (n = 1076)
I-ELOCItem
CommunalityEstimates3 I
Factor Coefficients II m IV V
18 .19 .07 .02 .25 .35 -.05
19 .15 -.04 .38 -.01 .07 .07
*20 .32 .34 .23 .02 .35 .17
21 .16 .42 .09 -.21 .06 -.18
22 .23 -.07 .24 .40 -.05 .07
23 .44 .03 .09 0 .06 .65
25 .20 .01 .08 -.02 .43 -.06
26 .45 .44 .24 -.12 .26 -.34
27 .45 .26 -.01 .59 .02 -.19
28 .44 .22 .60 .10 -.10 -.09
29 .26 .48 .06 .07 0 .13
31 .41 .59 -.12 .22 -.01 -.01
32 .53 .23 -.04 .68 .07 .09
33 .50 -.09 .65 .20 .11 .13
34 .32 .33 .02 -.05 .43 .14
36 .36 .06 -.04 -.05 -.06 .59
37 .37 -.13 -.03 -.06 .59 .02
(table continues)
Reproduced with permission of the copyright owner. Further reproduction prohibited without permission.
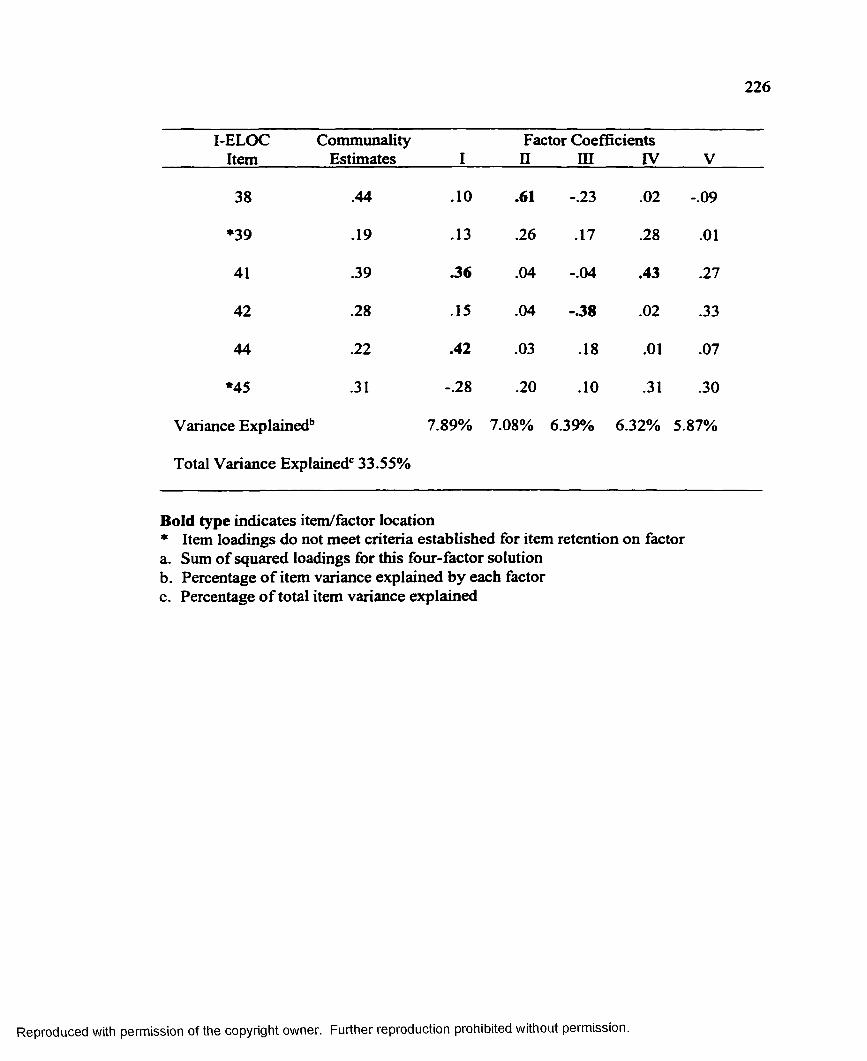
226
I-ELOCItem
CommunalityEstimates I
Factor Coefficients II III IV V
38 .44 .10 .61 -.23 .02 -.09
*39 .19 .13 .26 .17 .28 .01
41 .39 .36 .04 -.04 .43 .27
42 .28 .15 .04 1 • u* 00 .02 .33
44 .22 .42 .03 .18 .01 .07
*45 .31 -.28 .20 .10 .31 .30
Variance Explained15 7.89% 7.08% 6.39% 6.32% 5.87%
Total Variance Explained0 33.55%
Bold type indicates item/factor location* Item loadings do not meet criteria established for item retention on factora. Sum o f squared loadings for this four-factor solutionb. Percentage o f item variance explained by each factorc. Percentage o f total item variance explained
Reproduced with permission of the copyright owner. Further reproduction prohibited without permission.
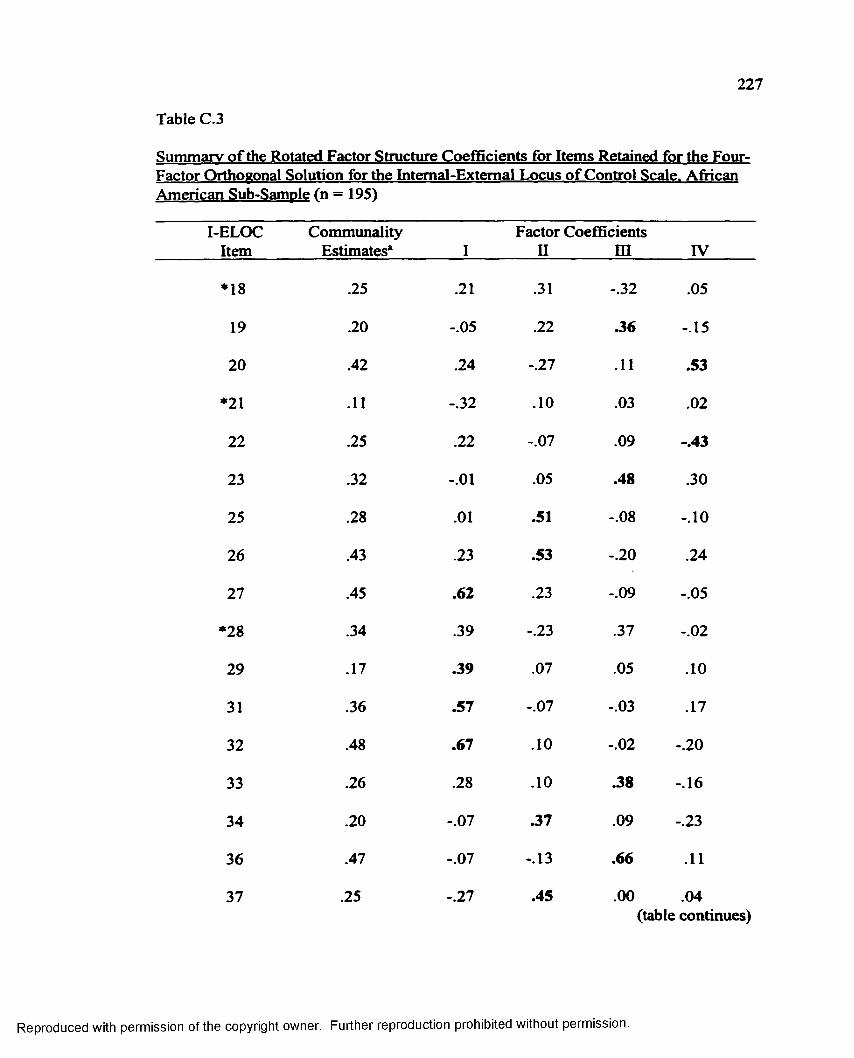
227
Table C.3
Summary o f the Rotated Factor Structure Coefficients for Items Retained for the Four-Factor Orthogonal Solution for the Internal-External Locus o f Control Scale. AfricanAmerican Sub-Sample (n = 195)
I-ELOCItem
CommunalityEstimates* I
Factor Coefficients II m IV
*18 .25 .21 .31 -.32 .05
19 .20 -.05 .22 .36 -.15
20 .42 .24 -.27 .11 .53
*21 .11 -.32 .10 .03 .02
22 .25 .22 -.07 .09 -.43
23 .32 -.01 .05 .48 .30
25 .28 .01 .51 -.08 -.10
26 .43 .23 .53 -.20 .24
27 .45 .62 .23 -.09 -.05
*28 .34 .39 -.23 .37 -.02
29 .17 .39 .07 .05 .10
31 .36 .57 -.07 -.03 .17
32 .48 .67 .10 -.02 -.20
33 .26 .28 .10 • 00 -.16
34 .20 -.07 .37 .09 -.23
36 .47 -.07 -.13 .66 .11
37 .25 -.27 .45 .00 .04(table continues)
Reproduced with permission of the copyright owner. Further reproduction prohibited without permission.

228
I-ELOCItem
CommunalityEstimates I
Factor Coefficients II m IV
*38 .14 -.06 .29 .04 .24
39 .37 .07 .48 .36 -.03
41 .28 .16 .40 .10 .02
42 .40 -.23 .20 .33 .45
44 .31 .28 -.01 .07 .48
45 .50 .00 .07 .44 -.55
Variance Explained1* 9.01% 7.77% 7.46% 7.07%
Total Variance Explained' 31.31%
Bold type indicates item/factor location* Item loadings do not meet criteria established for item retention on factora. Sum o f squared loadings for this four-factor solutionb. Percentage o f item variance explained by each factorc. Percentage o f total item variance explained
Reproduced with permission of the copyright owner. Further reproduction prohibited without permission.

229
Table C.4
Summary o f the Rotated Factor Structure Coefficients for Items Retained for the Four-Factor Orthogonal Solution for the Internal-External Locus o f Control Scale. HispanicSub-Sample (n = 450)
I-ELOCItem
CommunalityEstimates* I
Factor Coefficientsii in IV
18 .25 .42 .12 -.22 -.12
19 .20 -.20 .35 .18 .05
20 .27 -.09 .19 .43 .20
21 .23 .16 .06 .45 .05
*22 .10 .10 .28 -.08 .09
23 .31 -.19 .15 -.16 .47
25 .26 .14 .41 -.23 .15
*26 .23 .32 .17 .31 -.01
27 .38 .60 -.05 .13 -.05
28 .41 .23 .50 .31 -.12
29 .23 .21 .13 .23 .34
31 .37 .44 -.08 .35 .22
32 .33 .52 -.07 -.02 .23
33 .50 .07 .68 -.16 .07
34 .40 .15 .05 .04 .61
36 .23 -.17 -.14 -.16 .39
37 .13 .04 .12 -.34 .05(table continues)
Reproduced with permission of the copyright owner. Further reproduction prohibited without permission.

230
I-ELOCItem
CommunalityEstimates I
Factor Coefficients II in IV
38 .46 -.16 .63 .17 -.09
39 .22 .44 .13 -.07 .07
41 .41 .10 .04 .08 .63
42 .25 -.37 .17 .13 .26
44 .28 .48 .10 .19 -.10
45 .40 .01 .09 -.61 .14
Variance Explainedb 8.69% 7.47% 6.91% 6.79%
Total Variance Explained' 29.86%
Bold type indicates item/factor location* Item loadings do not meet criteria established for item retention on factora. Sum o f squared loadings for this four-factor solutionb. Percentage o f item variance explained by each factorc. Percentage o f total item variance explained
Reproduced with permission of the copyright owner. Further reproduction prohibited without permission.

231
Table C.5
Summary o f the Rotated Factor Structure Coefficients for Items Retained for the Four-Factor Orthogonal Solution for the Internal-External Locus o f Control Scale. WhiteSub-Sample (n = 3151
I-ELOC Communality Factor CoefficientsItem Estimates*________ I________ II________III IV
18 .34 .12 -.07 .14 .55
19 .37 -.25 .47 .17 -.24
20 .17 .05 .09 .40 -.04
21 .22 .45 .10 .06 -.03
22 .28 -.07 -.03 .52 .09
23 .30 -.07 .10 .04 .53
*25 .09 .09 -.02 -.20 .24
26 .34 .48 .32 -.07 0
27 .38 .27 .01 .55 -.09
28 .56 .08 .74 -.02 -.06
29 .33 .51 .11 .24 -.06
31 .27 .50 -.04 .14 -.03
32 .50 .13 .02 .68 .14
33 .47 .03 .67 .14 .10
34 .25 .42 .11 .09 .24
*36 .12 .31 -.07 -.11 .09
37 .42 .02 .03 -.11 .64(table continues)
Reproduced with permission of the copyright owner. Further reproduction prohibited without permission.

232
I-ELOCItem
CommunalityEstimates I
Factor Coefficients II III IV
38 .53 .29 .57 -.23 -.27
39 .22 .07 .35 .19 .23
41 .44 .57 .04 -.03 .34
42 .25 .34 -.19 -.29 .12
44 .21 .22 .18 -.03 .36
45 .27 .14 .34 -.32 .17
Variance Explained1* 8.75% 8.73% 7.45% 7.12%
Total Variance Explained' 32.05%
Bold type indicates item/factor location* Item loadings do not meet criteria established for item retention on factora. Sum of squared loadings for this four-factor solutionb. Percentage of item variance explained by each factorc. Percentage of total item variance explained
Reproduced with permission of the copyright owner. Further reproduction prohibited without permission.

233
Table C.6
Summary o f the Rotated Factor Structure Coefficients for Items Retained for the Four-Factor Orthogonal Solution for the Internal-External Locus o f Control Scale. Male Sub- Sample (n = 466)
I-ELOC Communality Factor CoefficientsItem Estimates3________ I II III_______ TV
18 .25 .04 .50 -.02 .02
*19 .13 .18 -.11 .29 .03
20 .21 .36 -.12 .22 .13
*21 .08 .25 .11 .03 .07
*22 .18 .14 -.16 .33 -.16
23 .41 -.01 .11 .05 .63
25 .25 .01 .35 .17 -.32
26 .37 .16 .56 .08 -.15
27 .42 .56 -.04 .14 -.29
28 .27 .14 .17 .47 .04
29 .27 .46 .19 .08 -.11
31 .41 .61 .14 -.12 .06
32 .35 .58 -.10 -.04 .05
33 .50 .03 .18 .68 .08
34 .14 .34 .03 .15 -.05
36 .44 .20 -.13 -.05 .62
37 .20 -.14 .42 -.02 -.01
(table continues)
Reproduced with permission of the copyright owner. Further reproduction prohibited without permission.

234
I-ELOCItem
CommunalityEstimates I
Factor Coefficientsn m IV
*38 .50 -.13 .07 .69 .04
39 .27 .07 .48 -.01 .19
41 .25 .14 .41 .21 .15
42 .18 -.07 .13 .08 .39
44 .33 .38 .41 -.14 .01
45 .15 -.06 -.07 .25 .28
Variance Explained15 8.23% 7.24% 7.18% 5.92%
Total Variance Explained' 28.57%
Bold type indicates item/factor location* Item loadings do not meet criteria established for item retention on factora. Sum o f squared loadings for this four-factor solutionb. Percentage o f item variance explained by each factorc. Percentage o f total item variance explained
Reproduced with permission of the copyright owner. Further reproduction prohibited without permission.

235
Table C.7
Summary o f the Rotated Factor Structure Coefficients for Items Retained for the Four-Factor Orthogonal Solution for the Internal-External Locus o f Control Scale. FemaleSub-Sample (n = 570)
I-ELOCItem
CommunalityEstimates* I
Factor Coefficientsn m IV
18 .16 .39 .02 .05 .07
19 .28 -.09 -.01 .48 .20
*20 .06 .01 .22 .09 -.09
21 .27 -.06 .27 .28 -.34
22 .18 .38 -.05 .07 .16
23 .38 .09 .22 -.07 .56
25 .11 -.04 .20 .09 .25
26 .41 .07 .28 .47 -.32
27 .44 .60 .05 -.06 -.27
28 .40 .21 .07 .58 -.10
29 .30 .04 .55 0 .01
31 .40 .30 .44 -.03 -.34
32 .48 .67 .16 -.05 .02
33 .39 .14 -.06 .51 .32
34 .35 .02 .55 .13 .18
36 .22 -.05 .14 -.15 .42
*37 .11 .03 -.02 .08 .32(table continues)
Reproduced with permission of the copyright owner. Further reproduction prohibited without permission.

236
I-ELOCItem
CommunalityEstimates I
Factor Coefficients II m IV
38 .39 -.10 .10 .61 -.04
*39 .23 .31 .09 .34 .10
41 .40 .11 .60 0 .17
42 .42 -.50 .40 -.05 .06
44 .13 .39 .28 .02 .02
45 .25 .09 -.09 .16 .46
Variance Explainedb 7.91% 7.73% 7.47% 6.73%
Total Variance Explainedc 29.84%
Bold type indicates item/factor location* Item loadings do not meet criteria established for item retention on factora. Sum o f squared loadings for this four-factor solutionb. Percentage o f item variance explained by each factorc. Percentage o f total item variance explained
Reproduced with permission of the copyright owner. Further reproduction prohibited without permission.

237
Table C.8
Summary o f the Rotated Factor Structure Coefficients for Items Retained for the Four-Factor Orthogonal Solution for the Self-Efficacv Scale. African American Sub-sample(n = 195)
Self-efficacyItem
CommunalityEstimates* I
Factor Coefficientsn m IV
4 .61 .39 .62 .27 .01
5 .66 • 00 -.05 -.06 .01
6 .73 .85 .02 .02 .05
7 .55 .71 .03 .02 .22
8 .79 -.05 .87 .15 .09
9 .74 -.04 .85 .08 .10
10 .73 .01 .17 .83 .09
11 .49 .25 .29 .28 .51
12 .44 .10 .04 .34 .64
13 .68 0 .14 .81 .03
14 .55 .16 -.02 .29 -.66
15 .40 .52 .09 .29 -.20
16 .44 .49 .37 -.03 -.26
Variance Explained11 20.26% 16.49% 13.91% 9.24%
Total Variance Explained' 59.9%
Bold type indicates item/factor location* Item loadings do not meet criteria established for item retention on factora. Sum of squared loadings for this four-factor solutionb. Percentage of item variance explained by each factorc. Percentage of total item variance explained
Reproduced with permission of the copyright owner. Further reproduction prohibited without permission.
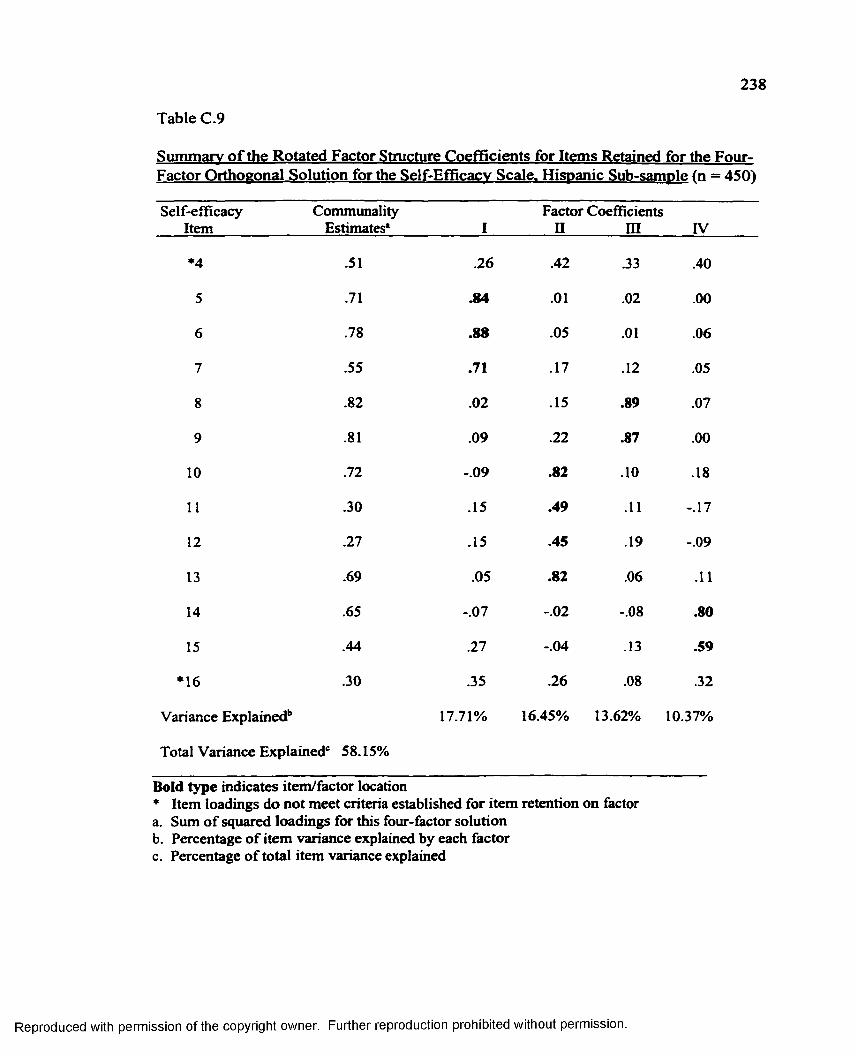
238
Table C.9
Summary o f the Rotated Factor Structure Coefficients for Items Retained for the Four-Factor Orthogonal Solution for the Self-Efficacv Scale. Hispanic Sub-sample (n = 450)
Self-efficacy Communality Factor CoefficientsItem_________ Estimates1___________ I________ II_______ III IV
*4 .51 .26 .42 .33 .40
5 .71 .84 .01 .02 .00
6 .78 .88 .05 .01 .06
7 .55 .71 .17 .12 .05
8 .82 .02 .15 .89 .07
9 .81 .09 .22 .87 .00
10 .72 -.09 .82 .10 .18
11 .30 .15 .49 .11 -.17
12 .27 .15 .45 .19 -.09
13 .69 .05
N00• .06 .11
14 .65 -.07
©i* -.08 .80
15 .44 .27 -.04 .13 .59
*16 .30 .35 .26 .08 .32
Variance Explained11 17.71% 16.45% 13.62% 10.37%
Total Variance Explained6 58.15%
Bold type indicates item/factor location* Item loadings do not meet criteria established for item retention on factora. Sum of squared loadings for this four-factor solutionb. Percentage of item variance explained by each factorc. Percentage of total item variance explained
Reproduced with permission of the copyright owner. Further reproduction prohibited without permission.

239
Table C.10
Summary o f the Rotated Factor Structure Coefficients for Items Retained for the Four-Factor Orthogonal Solution for the Self-Efficacv Scale. White Sub-sample (n = 315)
Self-efficacy Communality Factor CoefficientsItem ____________ Estimates*___________ I________II_______ HI IV
*4 .54 .45 .48 .30 .13
5 .77 .84 .10 .16 .16
6 .78 .86 .08 .15 .09
7 .58 .74 .09 .11 .09
8 .79 .25 .19 .83 -.04
9 .81 .16 .13 .87 .10
10 .63 -.06 .73 .15 .26
11 .40 .24 .58 -.08 -.06
12 .47 .17 .65 .11 -.09
13 .60 -.06 .70 .23 .24
14 .61 -.01 .06 -.13 .77
15 .58 .17 -.03 .16 .72
16 .42 .26 .23 .07 .54
Variance Explainedb 19.07% 16.61% 13.39% 12.33%
Total Variance Explained0 61.6%
Bold type indicates item/factor location* Item loadings do not meet criteria established for item retention on factora. Sum of squared loadings for this four-factor solutionb. Percentage of item variance explained by each factorc. Percentage of total item variance explained
Reproduced with permission of the copyright owner. Further reproduction prohibited without permission.

240
Table C. 11
Summary o f the Rotated Factor Structure Coefficients for Items for the Four-FactorOrthogonal Solution for the Self-Efficacv Scale. Male Sub-sample (n = 466)
Self-efficacy Communality Factor CoefficientsItem_____________ Estimates*___________ I________II________ III_______IV
*4 .52 .38 .43 .41 .15
5 .72 .84 .08 .03 .09
6 .79 .88 .06 .06 .09
7 .61 .76 .04 .18 .00
8 .78 .10 .22 .85 -.01
9 .81 .09 .17 .88 .03
10 .67 -.06 .80 .10 .14
11 .36 .16 .56 .01 -.11
12 .33 .04 .52 .22 -.10
13 .55 .06 .70 .21 .11
14 .66 -.04 .01 -.04 .81
15 .52 .25 -.02 .08 .67
16 .27 35 .28 0 .26
Variance Explainedb 18.82% 15.79% 14.00% 9.79%
Total Variance Explained 58.4%
Bold type indicates item/factor location* Item loadings do not meet criteria established for item retention on factora. Sum of squared loadings for this four-factor solutionb. Percentage of item variance explained by each factorc. Percentage of total item variance explained
Reproduced with permission of the copyright owner. Further reproduction prohibited without permission.

241
Table C.12
Summary o f Rotated Factor Structure Coefficients for Items for the Four-FactorOrthogonal Solution for the Self-Efficacv Scale. Female Sub-sample (n = 570)
Self-efficacy Communality Factor CoefficientsItem_____________ Estimates*___________ I________II________ III_______IV
4 .48 .30 .21 .50 .31
5 .71 .83 .01 .09 .12
6 .78 .88 .03 .08 .05
7 .53 .70 .13 .10 .12
8 .83 .04 .12 .90 .04
9 .78 .10 .10 .88 -.01
10 .66 .11 .73 .18 .29
11 .37 .14 .58 .09 -.09
12 .43 .14 .62 .04 -.17
13 .62 -.01 .74 .08 .26
14 .62 -.09 -.08 -.01 .78
15 .41 .33 .04 .08 .54
16 .41 .28 .18 .10 .54
Variance Explainedb 17.65% 14.78% 14.76% 11.62%
Total Variance Explained0 58.81%
Bold type indicates item/factor location* Item loadings do not meet criteria established for item retention on factora. Sum of squared loadings for this four-factor solutionb. Percentage of item variance explained by each factorc. Percentage of total item variance explained
Reproduced with permission of the copyright owner. Further reproduction prohibited without permission.

APPENDIX D:
ITEM LOCATION INDEX FOR FACTORED SUBSCALES FOR LOCUS OF CONTROL AND ACADEMIC SELF-EFFICACY MEASURES
242
Reproduced with permission of the copyright owner. Further reproduction prohibited without permission.
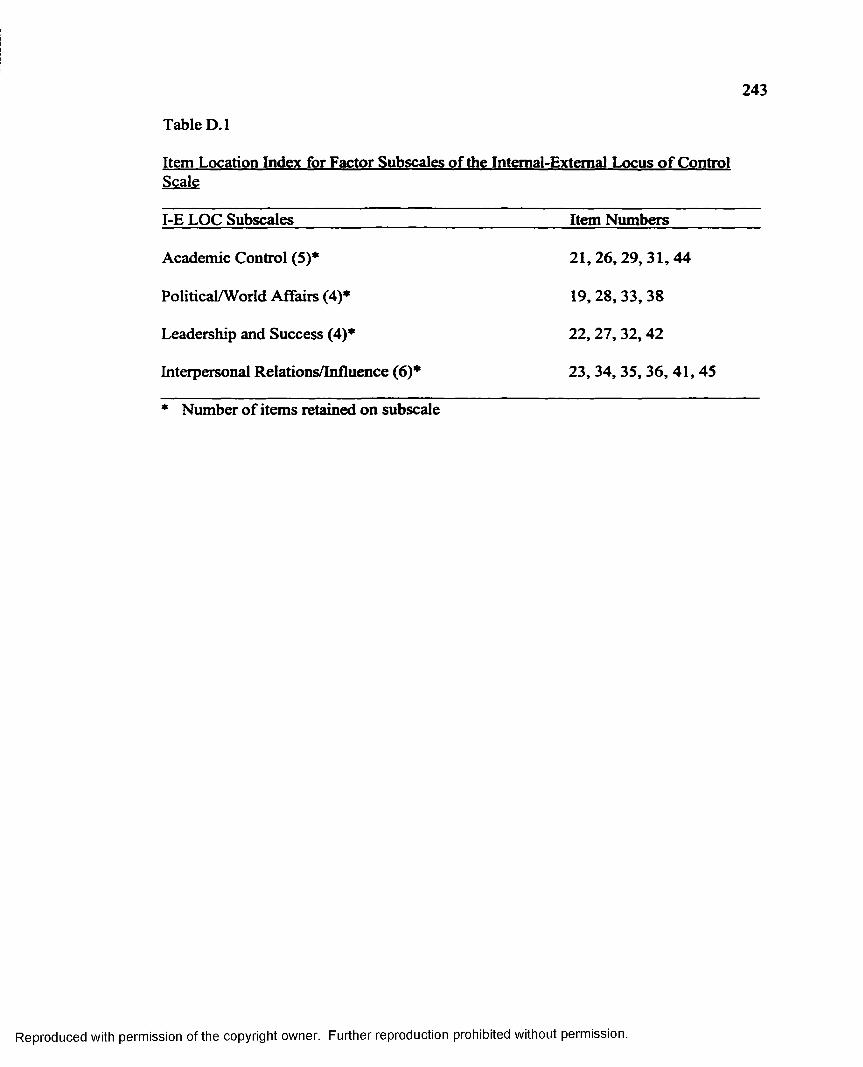
Table D.l
Item Location Index for Factor Subscales of the Internal-External Locus o f ControlScale
I-E LOC Subscales Item Numbers
Academic Control (5)* 2 1 ,2 6 ,2 9 ,3 1 ,4 4
Political/World Affairs (4)* 19, 28, 33, 38
Leadership and Success (4)* 22 ,27 ,32 ,42
Interpersonal Relations/Influence (6)* 23, 34,35, 36 ,41 ,45
* Number o f items retained on subscale
Reproduced with permission of the copyright owner. Further reproduction prohibited without permission.

244
Table D.2
Item Location Index for Factor Subscales o f the Academic Self-Efficacv Scale
Academic Self-Efficacy Subscales Item Number
Mathematics (3)* 5 ,6 ,7
General Subjects (4)* 10, 11, 12, 13
Science/Biology (2)* 8 ,9
Persistence (3)* 14, 15, 16
* Number of items retained on subscale
Reproduced with permission of the copyright owner. Further reproduction prohibited without permission.

APPENDIX E:
RELIABILITY ANALYSES BY RACIAL SUBGROUPS
245
Reproduced with permission of the copyright owner. Further reproduction prohibited without permission.

246
Table E.l
Summary o f Standardized Cronbach Alpha Reliability Coefficients for Locus o f Controland Academic Self-Efficacv Subscales. African American Subsample (n = 195)
Instrument/Subscale Alpha Coefficient
Locus o f Control (23)*Subscales
Combined 23 Items .46
Academic Control (5)b .26
Politics/World Affairs (4) .23
Leadership and Success (4) .09
Interpersonal Relations/Influence (6) .25
Academic Self-Efficacv (13)Subscales
Mathematics (3) .77
General Subjects (4) .62
Science/Biology (2) .81
Persistence (3) .41
a. Total number o f items for the factor-analyzed version o f the instrument in this studyb. Number o f items on the subscale
Reproduced with permission of the copyright owner. Further reproduction prohibited without permission.

247
Table E.2
Summary o f Standardized Cronbach Alpha Reliability Coefficients for Locus of Controland Academic Self-Efficacv Subscales. Hispanic Subsample (n = 450)
Instrument/Subscale Alpha Coefficient
Locus o f Control f23VSubscales
Combined 23 Items .50
Academic Control (5)b .44
Politics/World Affairs (4) .42
Leadership and Success (4) .12
Interpersonal Relations/Influence (6) .33
Academic Self-Efficacv (T3)Subscales
Mathematics (3) .78
General Subjects (4) .62
Science/Biology (2) .80
Persistence (3) .36
a. Total number o f items for the factor-analyzed version o f the instrument in this studyb. Number o f items on the subscale
Reproduced with permission of the copyright owner. Further reproduction prohibited without permission.

248
Table E.3
Summary o f Standardized Cronbach Alpha Reliability Coefficients for Locus o f Control and Academic Self-Efficacv Subscales. White Subsample (n = 315)
Instrument/Subscale_________________________________ Alpha Coefficient
Locus o f Control (23Y Subscales
Combined 23 Items .61
Academic Control (5)b .42
Politics/World Affairs (4) .54
Leadership and Success (4) .21
Interpersonal Relations/Influence (6) .38
Academic Self-Efficacv (13^Subscales
Mathematics (3) .82
General Subjects (4) .64
Science/Biology (2) .79
Persistence (3) .52
a. Total number of items for the factor-analyzed version of the instrument in this studyb. Number o f items on the subscale
Reproduced with permission of the copyright owner. Further reproduction prohibited without permission.

APPENDIX F:
SUMMARY OF DATA ANALYSES PERFORMED USING LOUISIANA DATASET
249
Reproduced with permission of the copyright owner. Further reproduction prohibited without permission.

250
Table F.l
Summary o f the Rotated Factor Structure Coefficients for Items Retained for the Five-Factor Orthogonal Solution for the Internal-External Locus of Control Scale. LouisianaData Set fn = 131)
I-ELOCItem
CommunalityEstimates* I
Factor Coefficients II III IV V
18 .59 .12
©t" .24 .11 .14
19 .24 .27 .35 .11 -.10 -.14
20 .45 .66 .13 -.02 -.02 .01
*21 .42 .02 .35 .25 .40 -.27
*22 .49 -.34 .22 .40 -.04 .40
23 .27 .03 .01 .03 -.52 .02
25 .60 .16 -.18 -.05 -.23 .70
26 .28 .23 -.14 .36 .11 -.26
27 .44 .24 -.46 .33 -.08 -.24
28 .52 .31 .63 .14 .09 .01
29 .47 .15 .09 .14 .64 .11
31 .51 -.18 -.05 .65 .19 -.11
32 .34 -.01 .29 .40 -.27 -.14
33 .35 .57 .09 -.08 .05 .10
34 .25 .04 -.16 .01 .46 .10
36 .49 .67 .01 .18 -.07 .06
37 .16 -.12 .03 .00 .20 .33(table continues)
Reproduced with permission of the copyright owner. Further reproduction prohibited without permission.

251
I-ELOCItem
CommunalityEstimates I
Factor Coefficients II III IV V
38 .37 .50 .06 -.08 .26 -.20
39 .50 .29 -.03 .59 -.26 .02
41 .38 .08 .09 .00 .31 .52
42 .40 .33 .45 -.03 .25 .17
44 .52 .00 -.06 .62 .26 .25
45 .44 .21 .49 .04 -.28 .28
Variance Explained15 9.74% 8.91% 8.41% 7.64% 6.72%
Total Variance Explained' 41.42%
Bold type indicates item/factor location* Item loadings do not meet criteria established for item retention on factora. Sum of squared loadings for this four-factor solutionb. Percentage o f item variance explained by each factorc. Percentage o f total item variance explained
Reproduced with permission of the copyright owner. Further reproduction prohibited without permission.

252
Table F.2
Summary o f the Rotated Factor Structure Coefficients for Items Retained for the Two-Factor Orthogonal Solution for the Self-Efficacv Scale. Louisiana Data Set fn = 131)
Self-EfficacyItem
CommunalityEstimates*
Factor Coefficients I n
4 .63 .71 .35
5 .62 .23 .75
6 .61 .26 .74
*7 .10 .31 .05
8 .42 .65 .04
9 .41 .54 .35
10 .46 .68 -.01
11 .26 .49 -.13
12 .31 .48 .29
13 .50 .67 .23
14 .18 -.13 .41
15 .37 .05 .61
16 .40 .18 .61
Variance Explainedb 24% 20.34%
Total Variance Explainedc 44.34%
Bold type indicates item loadings which meet criteria established for item retention * Item loadings do not meet criteria established for item retention on factora. Sum of squared loadings for this four-factor solutionb. Percentage of item variance explained by each factorc. Percentage of total item variance explained
Reproduced with permission of the copyright owner. Further reproduction prohibited without permission.

253
Table F.3
Summary o f Intercorrelations o f College Aspirations and College Expectations withOther Study Variables. Louisiana Data Set fn = 131)
Instrument/Measure_________________________Aspirations_______ Expectations
Academic Self-efficacy
Factor 1 .55* .53*
Factor 2 .36* .34*
Locus of Control
Factor 1 .00 .00
Factor 2 -.12 -.09
Factor 3 -.28** -.29*
Factor 4 -.09 -.18
Factor 5 -.04 .03
Parental Expectations
Father/Male Guardian .31** .30**
Mother/Female Guardian .20 .24
Parents’ Education Level
Father/Male Guardian .02 .01
Mother/Female Guardian .16 .07
Academic Achievement .52* .55*
Extracurricular Activities .11 .09
High School Track .33* .37*__________
Reproduced with permission of the copyright owner. Further reproduction prohibited without permission.

VITA
Stuart Earle Johnson, son of Oliver A. and Carol Pence Johnson, was bom on
June 27, 1953 in San Francisco, California. On August 1, 1981, Stuart married Sharon
Marie Smith o f Maringouin, Louisiana. He is the father o f one child, Lauren Elizabeth
Johnson.
Stuart graduated in 1971 from John W. North High School in Riverside,
California. He holds a Bachelor o f Arts degree in History from the University of
California at Santa Barbara, which he received in 1975. In 1978, Stuart completed a
Master o f Business Administration degree at Loyola University in New Orleans,
Louisiana.
Stuart’s was employed by the University o f Southwestern Louisiana (now
University o f Louisiana at Lafayette) in a number o f professional positions from 1978 to
1997. In 1978, he came to the university as the Free Time Activities Coordinator. In
1979, he moved to the Dean o f Student Personnel Office as an Assistant Dean. From
1980 to 1983 he was the Assistant Director o f Student Financial Aid, from 1983 to
1984, the Assistant Director o f the Student Union, from 1984 to 1988, the Director of
Campus Programming and Recreation, and from 1988 to 1997, the Director o f the
Student Union. In 1997, Stuart took the position o f Deputy Assistant Secretary with the
Louisiana Office o f State Parks and is currently employed in this position.
254
Reproduced with permission of the copyright owner. Further reproduction prohibited without permission.

DOCTORAL EXAMINATION AND DISSERTATION REPORT
C a n d i d a t e : Stuart Earle Johnson
M a j o r F i e l d : Educational Leadership and Research
T i t l e o f D i s s e r t a t i o n : College Choice: Psychological Factors InfluencingPostsecondary Aspirations and Expectations of Ninth- Grade Students
A p p r o v e d :
f o r P r o f e s s o r
G r a d u a t e S c h o o l
EXAMINING COMMITTEE:
D a t e o f E x a m i n a t i o n :
25 October 1999
Reproduced with permission of the copyright owner. Further reproduction prohibited without permission.