College and Career Readiness Content Mathematics ...literacy.coe.uga.edu/pdtr/FallConf/2017/Math...
25
12 College and Career Readiness Standards-in-Action | | WorkReady U CCRS Math Reference Materials and Career Readiness This document contains the College and Career Readiness (CCR) standards for mathematics — organized by level and by domain—to highlight the important progressions in the standards. 1 The standards most closely associated with the major work of the level (MWOTL) are identified in plain type. The italicized standards support them. Number and Ratios: Understanding and Operations Level A – Number Base Ten 1. NBT.2 Understand that the two digits of a two-digit number represent amounts of tens and ones. Understand the following as special cases: a. 10 can be thought of as a bundle of ten ones — called a “ten.” b. The numbers from 11 to 19 are composed of a ten and one, two, three, four, five, six, seven, eight, or nine ones. c. The numbers 10, 20, 30, 40, 50, 60, 70, 80, 90 refer to one, two, three, four, five, six, seven, eight, or nine tens (and 0 ones). 1.NBT.3 Compare two two-digit numbers based on meanings of the tens and ones digits, recording the results of comparisons with the symbols >, =, and <. 1.NBT.4 Add within 100, including adding a two-digit number and a one-digit number, and adding a two-digit number and a multiple of 10, using concrete models or drawings and strategies based on place value, properties of operations, and/or the relationship between addition and subtraction; relate the strategy to a written method and explain the reasoning used. Understand that in adding two-digit numbers, one adds tens and tens, ones and ones; and sometimes it is necessary to compose a ten. 1.NBT.5 Given a two-digit number, mentally find 10 more or 10 less than the number, without having to count; explain the reasoning used. 1.NBT.6 Subtract multiples of 10 in the range 10-90 from multiples of 10 in the range 10-90 (positive or zero differences), using concrete models or drawings and strategies based on place value, properties of operations, and/or the relationship between addition and subtraction; relate the strategy to a written method and explain the reasoning used. Level B – Number Base Ten 2. NBT.1 Understand that the three digits of a three-digit number represent amounts of hundreds, tens, and ones; e.g., 706 equals 7 hundreds, 0 tens, and 6 ones. Understand the following as special cases: a. 100 can be thought of as a bundle of ten tens — called a “hundred.” b. The numbers 100, 200, 300, 400, 500, 600, 700, 800, 900 refer to one, two, three, four, five, six, seven, eight, or nine hundreds (and 0 tens and 0 ones). 2.NBT.2 Count within 1000; skip-count by 5s, 10s, and 100s. 1 Critical content as defined by the Publishers’ Criteria for the Common Core State Standards for Mathematics. Washington, DC: Author. Accessed January 18, 2015: http://www.corestandards.org/wp-content/uploads/Math_Publishers_Criteria_K-8_ Spring_2013_FINAL1.pdf and http://www.corestandards.org/wp-content/uploads/Math_Publishers_Criteria_HS_Spring_2013_ FINAL1.pdf College Progressions Content
Transcript of College and Career Readiness Content Mathematics ...literacy.coe.uga.edu/pdtr/FallConf/2017/Math...
12 College and Career Readiness Standards-in-Action | | WorkReady U CCRS Math Reference Materials
College and Career Readiness Content Progressions
and Career Readiness
This document contains the College and Career Readiness (CCR) standards for mathematics—
organized by level and by domain—to highlight the important progressions in the standards.1 The
standards most closely associated with the major work of the level (MWOTL) are identified in
plain type. The italicized standards support them.
Number and Ratios: Understanding and Operations
Level A – Number Base Ten
1. NBT.2 Understand that the two digits of a two-digit number represent amounts of tens and ones. Understand the
following as special cases:
a. 10 can be thought of as a bundle of ten ones — called a “ten.”
b. The numbers from 11 to 19 are composed of a ten and one, two, three, four, five, six, seven, eight, or nine ones.
c. The numbers 10, 20, 30, 40, 50, 60, 70, 80, 90 refer to one, two, three, four, five, six, seven, eight, or nine tens
(and 0 ones).
1.NBT.3 Compare two two-digit numbers based on meanings of the tens and ones digits, recording the results of
comparisons with the symbols >, =, and <.
1.NBT.4 Add within 100, including adding a two-digit number and a one-digit number, and adding a two-digit
number and a multiple of 10, using concrete models or drawings and strategies based on place value, properties
of operations, and/or the relationship between addition and subtraction; relate the strategy to a written method
and explain the reasoning used. Understand that in adding two-digit numbers, one adds tens and tens, ones and
ones; and sometimes it is necessary to compose a ten.
1.NBT.5 Given a two-digit number, mentally find 10 more or 10 less than the number, without having to count;
explain the reasoning used.
1.NBT.6 Subtract multiples of 10 in the range 10-90 from multiples of 10 in the range 10-90 (positive or zero
differences), using concrete models or drawings and strategies based on place value, properties of operations,
and/or the relationship between addition and subtraction; relate the strategy to a written method and explain the
reasoning used.
Level B – Number Base Ten
2. NBT.1 Understand that the three digits of a three-digit number represent amounts of hundreds, tens, and ones;
e.g., 706 equals 7 hundreds, 0 tens, and 6 ones. Understand the following as special cases:
a. 100 can be thought of as a bundle of ten tens — called a “hundred.”
b. The numbers 100, 200, 300, 400, 500, 600, 700, 800, 900 refer to one, two, three, four, five, six, seven, eight,
or nine hundreds (and 0 tens and 0 ones).
2.NBT.2 Count within 1000; skip-count by 5s, 10s, and 100s.
1 Critical content as defined by the Publishers’ Criteria for the Common Core State Standards for Mathematics. Washington,
DC: Author. Accessed January 18, 2015: http://www.corestandards.org/wp-content/uploads/Math_Publishers_Criteria_K-8_
Spring_2013_FINAL1.pdf and http://www.corestandards.org/wp-content/uploads/Math_Publishers_Criteria_HS_Spring_2013_
FINAL1.pdf
College Progressions
Content

13 College and Career Readiness Standards-in-Action | | WorkReady U CCRS Math Reference Materials
College and Career Readiness Content Progressions
Level B – Number Base Ten
2.NBT.3 Read and write numbers to 1000 using base-ten numerals, number names, and expanded form.
2.NBT.4 Compare two three-digit numbers based on meanings of the hundreds, tens, and ones digits, using >, =,
and < symbols to record the results of comparisons.
2.NBT.6 Add up to four two-digit numbers using strategies based on place value and properties of operations.
2.NBT.7 Add and subtract within 1000, using concrete models or drawings and strategies based on place value,
properties of operations, and/or the relationship between addition and subtraction; relate the strategy to a written
method. Understand that in adding or subtracting three- digit numbers, one adds or subtracts hundreds and
hundreds, tens and tens, ones and ones; and sometimes it is necessary to compose or decompose tens or hundreds.
2.NBT.8 Mentally add 10 or 100 to a given number 100–900, and mentally subtract 10 or 100 from a given
number 100–900.
2.NBT.9 Explain why addition and subtraction strategies work, using place value and the properties of operations.
3.NBT.1 Use place value understanding to round whole numbers to the nearest 10 or 100.
3.NBT.2 Fluently add and subtract within 1000 using strategies and algorithms based on place value, properties
of operations, and/or the relationship between addition and subtraction.
3.NBT.3 Multiply one-digit whole numbers by multiples of 10 in the range 10–90 (e.g., 9 x 80, 5 x 60) using
strategies based on place value and properties of operations.
Level B – Fractions
3.NF.1 Understand a fraction 1/b as the quantity formed by 1 part when a whole is partitioned into b equal parts;
understand a fraction a/b as the quantity formed by a parts of size 1/b.
3.NF.2 Understand a fraction as a number on the number line; represent fractions on a number line diagram.
3.NF.2a Represent a fraction 1/b on a number line diagram by defining the interval from 0 to 1 as the whole and
partitioning it into b equal parts. Recognize that each part has size 1/b and that the endpoint of the part based at 0
locates the number 1/b on the number line.
3.NF.2b Represent a fraction a/b on a number line diagram by marking off a lengths 1/b from 0. Recognize that
the resulting interval has size a/b and that its endpoint locates the number a/b on the number line.
3.NF.3 Explain equivalence of fractions in special cases, and compare fractions by reasoning about their size.
3.NF.3a Understand two fractions as equivalent (equal) if they are the same size, or the same point on a number
line.
3.NF.3b Recognize and generate simple equivalent fractions, e.g., 1/2 = 2/4, 4/6 = 2/3). Explain why the
fractions are equivalent, e.g., by using a visual fraction model.
3.NF.3c Express whole numbers as fractions, and recognize fractions that are equivalent to whole numbers.
Examples: Express 3 in the form 3 = 3/1; recognize that 6/1 = 6; locate 4/4 and 1 at the same point of a number
line diagram.
3.NF.3d Compare two fractions with the same numerator or the same denominator by reasoning about their size.
Recognize that comparisons are valid only when the two fractions refer to the same whole. Record the results of
comparisons with the symbols >, =, or <, and justify the conclusions, e.g., by using a visual fraction model.

14 College and Career Readiness Standards-in-Action | | WorkReady U CCRS Math Reference Materials
College and Career Readiness Content Progressions
Level C – Number Base Ten
4.NBT.1 Recognize that in a multi-digit whole number, a digit in one place represents ten times what it represents in
the place to its right. For example, recognize that 700 ÷ 70 = 10 by applying concepts of place value and division.
4.NBT.2 Read and write multi-digit whole numbers using base-ten numerals, number names, and expanded form.
Compare two multi-digit numbers based on meanings of the digits in each place, using >, =, and < symbols to
record the results of comparisons.
4.NBT.3 Use place value understanding to round multi-digit whole numbers to any place.
4.NBT.4 Fluently add and subtract multi-digit whole numbers using the standard algorithm.
4.NBT.5 Multiply a whole number of up to four digits by a one-digit whole number, and multiply two two-
digit numbers, using strategies based on place value and the properties of operations. Illustrate and explain the
calculation by using equations, rectangular arrays, and/or area models.
4.NBT.6 Find whole-number quotients and remainders with up to four-digit dividends and one-digit divisors,
using strategies based on place value, the properties of operations, and/or the relationship between multiplication
and division. Illustrate and explain the calculation by using equations, rectangular arrays, and/or area models.
5.NBT.1 Recognize that in a multi-digit number, a digit in one place represents 10 times as much as it represents
in the place to its right and 1/10 of what it represents in the place to its left.
5.NBT.2 Explain patterns in the number of zeros of the product when multiplying a number by powers of 10, and
explain patterns in the placement of the decimal point when a decimal is multiplied or divided by a power of 10.
Use whole-number exponents to denote powers of 10.
5.NBT.3 Read, write, and compare decimals to thousandths.
5.NBT.3a Read and write decimals to thousandths using base-ten numerals, number names, and expanded form,
e.g., 347.392 = 3 x 100 + 4 x 10 + 7 x 1 + 3 x (1/10) + 9 x (1/100) + 2 x (1/1000).
5.NBT.3b Compare two decimals to thousandths based on meanings of the digits in each place, using >, =, and <
symbols to record the results of comparisons.
5.NBT.4 Use place value understanding to round decimals to any place.
5.NBT.5 Fluently multiply multi-digit whole numbers using the standard algorithm. [NOTE: A “standard
algorithm” might be any accepted algorithm that fits the experience and needs of the students.]
5.NBT.6 Find whole-number quotients of whole numbers with up to four-digit dividends and two-digit divisors,
using strategies based on place value, the properties of operations, and/or the relationship between multiplication
and division. Illustrate and explain the calculation by using equations, rectangular arrays, and/or area models.
5.NBT.7 Add, subtract, multiply, and divide decimals to hundredths, using concrete models or drawings
and strategies based on place value, properties of operations, and/or the relationship between addition and
subtraction; relate the strategy to a written method and explain the reasoning used. [NOTE: Applications
involving financial literacy should be used.]
6.NS.2 Fluently divide multi-digit numbers using the standard algorithm.
6.NS.3 Fluently add, subtract, multiply, and divide multi-digit decimals using the standard algorithm for each
operation.
15 College and Career Readiness Standards-in-Action | | WorkReady U CCRS Math Reference Materials
College and Career Readiness Content Progressions
Level C – Number Base Ten
6.NS.4 Find the greatest common factor of two whole numbers less than or equal to 100 and the least common
multiple of two whole numbers less than or equal to 12. Use the distributive property to express a sum of two
whole numbers 1–100 with a common factor as a multiple of a sum of two whole numbers with no common
factor. For example, express 36 + 8 as 4 (9 + 2).
Level C – Fractions
4.NF.1 Explain why a fraction a/b is equivalent to a fraction (n x a)/(n x b) by using visual fraction models, with
attention to how the number and size of the parts differ even though the two fractions themselves are the same
size. Use this principle to recognize and generate equivalent fractions.
4.NF.2 Compare two fractions with different numerators and different denominators, e.g., by creating common
denominators or numerators, or by comparing to a benchmark fraction such as 1/2. Recognize that comparisons
are valid only when the two fractions refer to the same whole. Record the results of comparisons with symbols >,
=, or <, and justify the conclusions, e.g., by using a visual fraction model.
4.NF.3 Understand a fraction a/b with a > 1 as a sum of fractions 1/b.
4.NF.3a Understand addition and subtraction of fractions as joining and separating parts referring to the same
whole.
4.NF.3b Decompose a fraction into a sum of fractions with the same denominator in more than one way,
recording each decomposition by an equation. Justify decompositions, e.g., by using a visual fraction model.
Examples: 3/8 = 1/8 + 1/8 + 1/8 ; 3/8 = 1/8 + 2/8 ; 2 1/8 = 1 + 1 + 1/8 = 8/8 + 8/8 + 1/8.
4.NF.3c Add and subtract mixed numbers with like denominators, e.g., by replacing each mixed number with
an equivalent fraction, and/or by using properties of operations and the relationship between addition and
subtraction.
4.NF.3d Solve word problems involving addition and subtraction of fractions referring to the same whole and having
like denominators, e.g., by using visual fraction models and equations to represent the problem.
4.NF.4 Apply and extend previous understandings of multiplication to multiply a fraction by a whole number.
4.NF.4a Understand a fraction a/b as a multiple of 1/b. For example, use a visual fraction model to represent 5/4
as the product 5 × (1/4), recording the conclusion by the equation 5/4 = 5 × (1/4).
4.NF.4b Understand a multiple of a/b as a multiple of 1/b, and use this understanding to multiply a fraction by
a whole number. For example, use a visual fraction model to express 3 × (2/5) as 6 × (1/5), recognizing this
product as 6/5. (In general, n × (a/b) = (n × a)/b.)
4.NF.4c Solve word problems involving multiplication of a fraction by a whole number, e.g., by using visual
fraction models and equations to represent the problem. For example, if each person at a party will eat 3/8 of
a pound of roast beef, and there will be 5 people at the party, how many pounds of roast beef will be needed?
Between what two whole numbers does your answer lie?
4.NF.6 Use decimal notation for fractions with denominators 10 or 100. For example, rewrite 0.62 as 62/100;
describe a length as 0.62 meters; locate 0.62 on a number line diagram.
4.NF.7 Compare two decimals to hundredths by reasoning about their size. Recognize that comparisons are valid
only when the two decimals refer to the same whole. Record the results of comparisons with the symbols >, =, or
<, and justify the conclusions, e.g., by using a visual model.
16 College and Career Readiness Standards-in-Action | | WorkReady U CCRS Math Reference Materials
College and Career Readiness Content Progressions
Level C – Fractions
5.NF.1 Add and subtract fractions with unlike denominators (including mixed numbers) by replacing given
fractions with equivalent fractions in such a way as to produce an equivalent sum or difference of fractions with
like denominators. For example, 2/3 + 5/4 = 8/12 + 15/12 = 23/12. (In general, a/b + c/d = (ad + bc)/bd.)
5.NF.2 Solve word problems involving addition and subtraction of fractions referring to the same whole, including
cases of unlike denominators, e.g., by using visual fraction models or equations to represent the problem. Use
benchmark fractions and number sense of fractions to estimate mentally and assess the reasonableness of
answers. For example, recognize an incorrect result 2/5 + 1/2 = 3/7, by observing that 3/7 < 1/2.
5.NF.3 Interpret a fraction as division of the numerator by the denominator (a/b = a ÷ b). Solve word problems
involving division of whole numbers leading to answers in the form of fractions or mixed numbers, e.g., by
using visual fraction models or equations to represent the problem. For example, interpret 3/4 as the result of
dividing 3 by 4, noting that 3/4 multiplied by 4 equals 3, and that when 3 wholes are shared equally among 4
people each person has a share of size 3/4. If 9 people want to share a 50-pound sack of rice equally by weight,
how many pounds of rice should each person get? Between what two whole numbers does your answer lie?
5.NF.4 Apply and extend previous understandings of multiplication to multiply a fraction or whole number by a
fraction.
5. NF.5 Interpret multiplication as scaling (resizing), by:
a. Comparing the size of a product to the size of one factor on the basis of the size of the other factor, without
performing the indicated multiplication.
b. Explaining why multiplying a given number by a fraction greater than 1 results in a product greater than the
given number (recognizing multiplication by whole numbers greater than 1 as a familiar case); explaining why
multiplying a given number by a fraction less than 1 results in a product smaller than the given number; and
relating the principle of fraction equivalence a/b = (nxa)/(nxb) to the effect of multiplying a/b by 1.
5.NF.6 Solve real world problems involving multiplication of fractions and mixed numbers, e.g., by using visual
fraction models or equations to represent the problem.
5.NF.7 Apply and extend previous understandings of division to divide unit fractions by whole numbers and
whole numbers by unit fractions.
5.NF.7a Interpret division of a unit fraction by a non-zero whole number, and compute such quotients. For
example, create a story context for (1/3) ÷ 4, and use a visual fraction model to show the quotient. Use the
relationship between multiplication and division to explain that (1/3) ÷ 4 = 1/12 because (1/12) × 4 = 1/3.
5.NF.7b Interpret division of a whole number by a unit fraction, and compute such quotients. For example, create
a story context for 4 ÷ (1/5), and use a visual fraction model to show the quotient. Use the relationship between
multiplication and division to explain that 4 ÷ (1/5) = 20 because 20 × (1/5) = 4.
5.NF.7c Solve real world problems involving division of unit fractions by non-zero whole numbers and division
of whole numbers by unit fractions, e.g., by using visual fraction models and equations to represent the problem.
For example, how much chocolate will each person get if 3 people share 1/2 lb of chocolate equally? How many
1/3-cup servings are in 2 cups of raisins?
6.NS.1 Interpret and compute quotients of fractions, and solve word problems involving division of fractions by
fractions, e.g., by using visual fraction models and equations to represent the problem. For example, create a
story context for (2/3) ÷ (3/4) and use a visual fraction model to show the quotient; use the relationship between
multiplication and division to explain that (2/3) ÷ (3/4) = 8/9 because 3/4 of 8/9 is 2/3. (In general, (a/b) ÷ (c/d)
= ad/bc.) How much chocolate will each person get if 3 people share 1/2 lb of chocolate equally? How many
3/4-cup servings are in 2/3 of a cup of yogurt? How wide is a rectangular strip of land with length 3/4 mi and
area 1/2 square mi?
17 College and Career Readiness Standards-in-Action | | WorkReady U CCRS Math Reference Materials
College and Career Readiness Content Progressions
Level C – Fractions
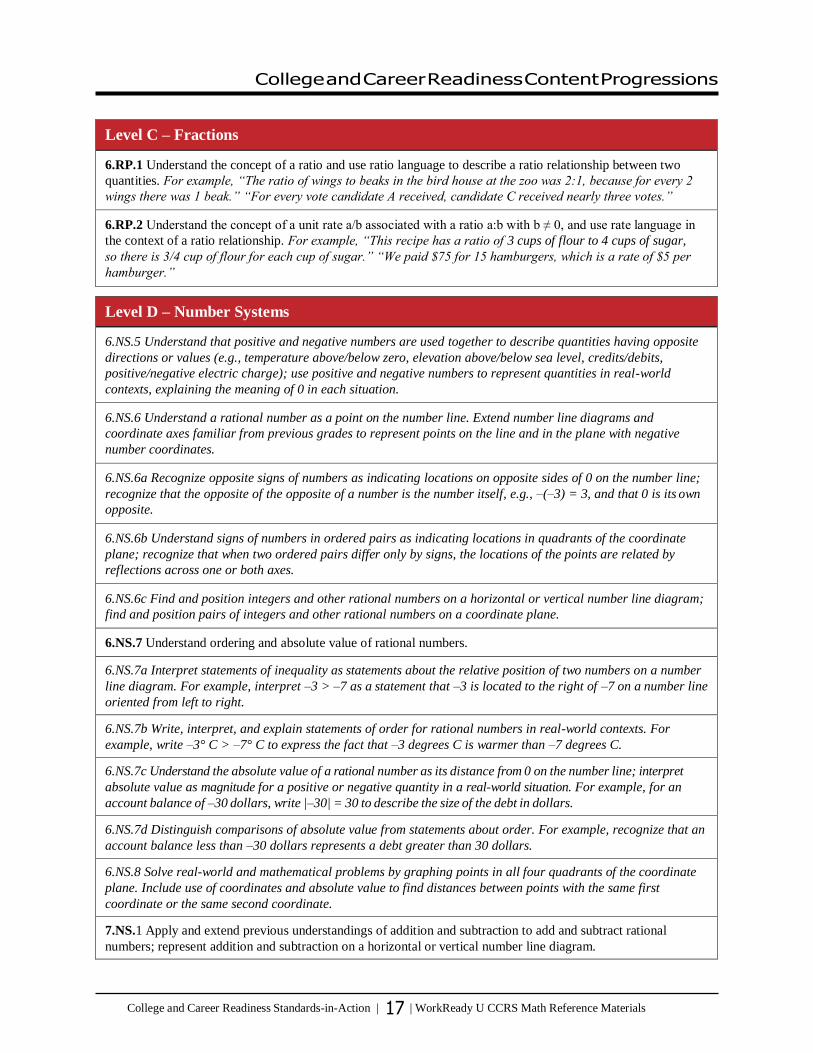
6.RP.1 Understand the concept of a ratio and use ratio language to describe a ratio relationship between two
quantities. For example, “The ratio of wings to beaks in the bird house at the zoo was 2:1, because for every 2
wings there was 1 beak.” “For every vote candidate A received, candidate C received nearly three votes.”
6.RP.2 Understand the concept of a unit rate a/b associated with a ratio a:b with b ≠ 0, and use rate language in
the context of a ratio relationship. For example, “This recipe has a ratio of 3 cups of flour to 4 cups of sugar,
so there is 3/4 cup of flour for each cup of sugar.” “We paid $75 for 15 hamburgers, which is a rate of $5 per
hamburger.”
Level D – Number Systems
6.NS.5 Understand that positive and negative numbers are used together to describe quantities having opposite
directions or values (e.g., temperature above/below zero, elevation above/below sea level, credits/debits,
positive/negative electric charge); use positive and negative numbers to represent quantities in real-world
contexts, explaining the meaning of 0 in each situation.
6.NS.6 Understand a rational number as a point on the number line. Extend number line diagrams and
coordinate axes familiar from previous grades to represent points on the line and in the plane with negative
number coordinates.
6.NS.6a Recognize opposite signs of numbers as indicating locations on opposite sides of 0 on the number line;
recognize that the opposite of the opposite of a number is the number itself, e.g., –(–3) = 3, and that 0 is its own
opposite.
6.NS.6b Understand signs of numbers in ordered pairs as indicating locations in quadrants of the coordinate
plane; recognize that when two ordered pairs differ only by signs, the locations of the points are related by
reflections across one or both axes.
6.NS.6c Find and position integers and other rational numbers on a horizontal or vertical number line diagram;
find and position pairs of integers and other rational numbers on a coordinate plane.
6.NS.7 Understand ordering and absolute value of rational numbers.
6.NS.7a Interpret statements of inequality as statements about the relative position of two numbers on a number
line diagram. For example, interpret –3 > –7 as a statement that –3 is located to the right of –7 on a number line
oriented from left to right.
6.NS.7b Write, interpret, and explain statements of order for rational numbers in real-world contexts. For
example, write –3° C > –7° C to express the fact that –3 degrees C is warmer than –7 degrees C.
6.NS.7c Understand the absolute value of a rational number as its distance from 0 on the number line; interpret
absolute value as magnitude for a positive or negative quantity in a real-world situation. For example, for an
account balance of –30 dollars, write |–30| = 30 to describe the size of the debt in dollars.
6.NS.7d Distinguish comparisons of absolute value from statements about order. For example, recognize that an
account balance less than –30 dollars represents a debt greater than 30 dollars.
6.NS.8 Solve real-world and mathematical problems by graphing points in all four quadrants of the coordinate
plane. Include use of coordinates and absolute value to find distances between points with the same first
coordinate or the same second coordinate.
7.NS.1 Apply and extend previous understandings of addition and subtraction to add and subtract rational
numbers; represent addition and subtraction on a horizontal or vertical number line diagram.
18 College and Career Readiness Standards-in-Action | | WorkReady U CCRS Math Reference Materials
College and Career Readiness Content Progressions
Level D – Number Systems
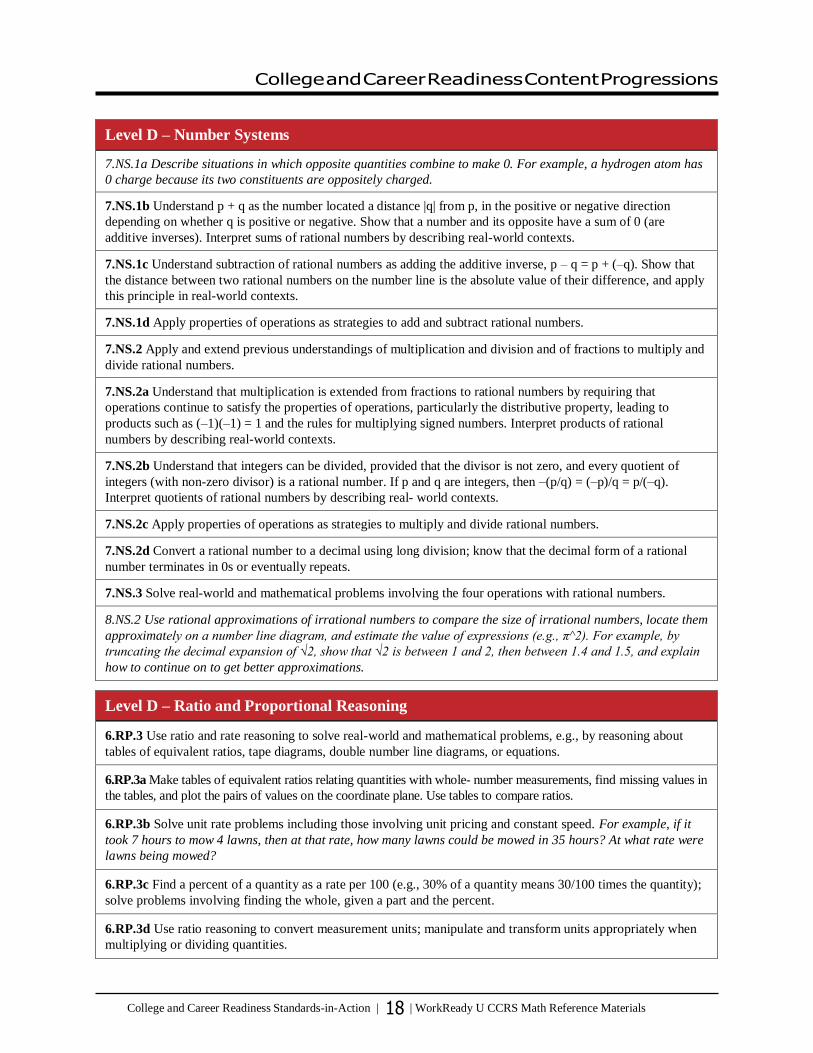
7.NS.1a Describe situations in which opposite quantities combine to make 0. For example, a hydrogen atom has
0 charge because its two constituents are oppositely charged.
7.NS.1b Understand p + q as the number located a distance |q| from p, in the positive or negative direction
depending on whether q is positive or negative. Show that a number and its opposite have a sum of 0 (are
additive inverses). Interpret sums of rational numbers by describing real-world contexts.
7.NS.1c Understand subtraction of rational numbers as adding the additive inverse, p – q = p + (–q). Show that
the distance between two rational numbers on the number line is the absolute value of their difference, and apply
this principle in real-world contexts.
7.NS.1d Apply properties of operations as strategies to add and subtract rational numbers.
7.NS.2 Apply and extend previous understandings of multiplication and division and of fractions to multiply and
divide rational numbers.
7.NS.2a Understand that multiplication is extended from fractions to rational numbers by requiring that
operations continue to satisfy the properties of operations, particularly the distributive property, leading to
products such as (–1)(–1) = 1 and the rules for multiplying signed numbers. Interpret products of rational
numbers by describing real-world contexts.
7.NS.2b Understand that integers can be divided, provided that the divisor is not zero, and every quotient of
integers (with non-zero divisor) is a rational number. If p and q are integers, then –(p/q) = (–p)/q = p/(–q).
Interpret quotients of rational numbers by describing real- world contexts.
7.NS.2c Apply properties of operations as strategies to multiply and divide rational numbers.
7.NS.2d Convert a rational number to a decimal using long division; know that the decimal form of a rational
number terminates in 0s or eventually repeats.
7.NS.3 Solve real-world and mathematical problems involving the four operations with rational numbers.
8.NS.2 Use rational approximations of irrational numbers to compare the size of irrational numbers, locate them
approximately on a number line diagram, and estimate the value of expressions (e.g., π^2). For example, by
truncating the decimal expansion of √2, show that √2 is between 1 and 2, then between 1.4 and 1.5, and explain
how to continue on to get better approximations.
Level D – Ratio and Proportional Reasoning
6.RP.3 Use ratio and rate reasoning to solve real-world and mathematical problems, e.g., by reasoning about
tables of equivalent ratios, tape diagrams, double number line diagrams, or equations.
6.RP.3a Make tables of equivalent ratios relating quantities with whole- number measurements, find missing values in
the tables, and plot the pairs of values on the coordinate plane. Use tables to compare ratios.
6.RP.3b Solve unit rate problems including those involving unit pricing and constant speed. For example, if it
took 7 hours to mow 4 lawns, then at that rate, how many lawns could be mowed in 35 hours? At what rate were
lawns being mowed?
6.RP.3c Find a percent of a quantity as a rate per 100 (e.g., 30% of a quantity means 30/100 times the quantity);
solve problems involving finding the whole, given a part and the percent.
6.RP.3d Use ratio reasoning to convert measurement units; manipulate and transform units appropriately when
multiplying or dividing quantities.
19 College and Career Readiness Standards-in-Action | | WorkReady U CCRS Math Reference Materials
College and Career Readiness Content Progressions
Level D – Ratio and Proportional Reasoning
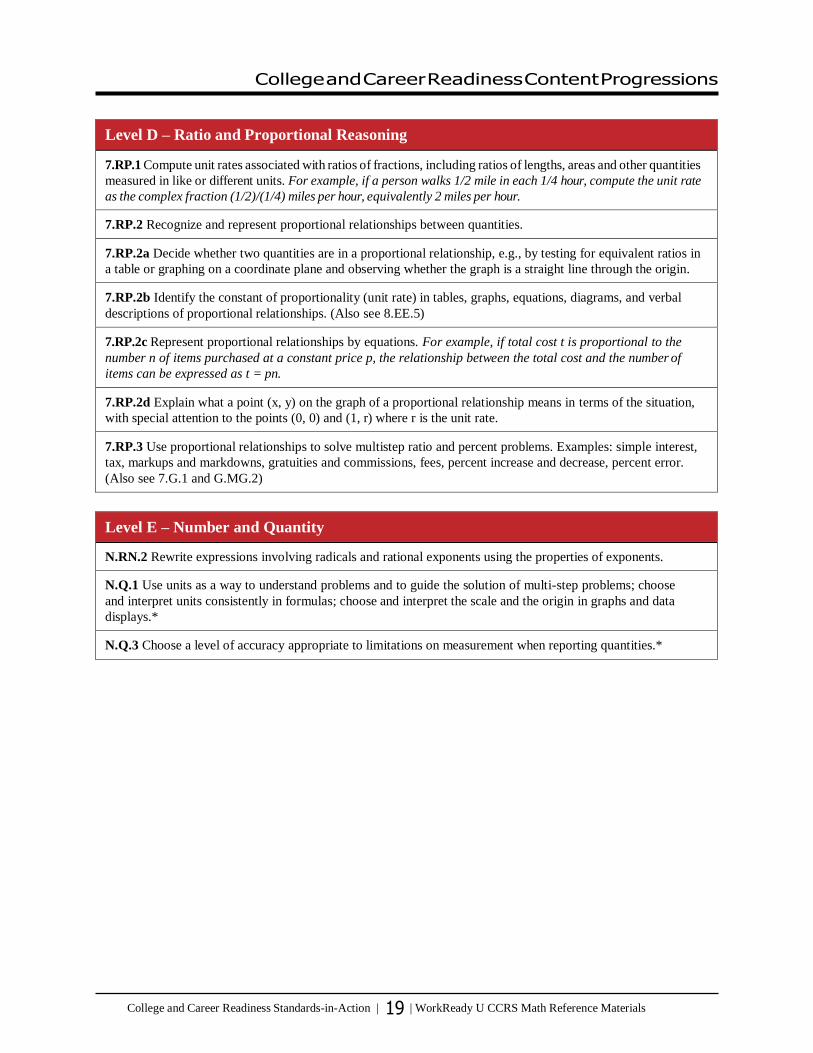
7.RP.1 Compute unit rates associated with ratios of fractions, including ratios of lengths, areas and other quantities
measured in like or different units. For example, if a person walks 1/2 mile in each 1/4 hour, compute the unit rate
as the complex fraction (1/2)/(1/4) miles per hour, equivalently 2 miles per hour.
7.RP.2 Recognize and represent proportional relationships between quantities.
7.RP.2a Decide whether two quantities are in a proportional relationship, e.g., by testing for equivalent ratios in
a table or graphing on a coordinate plane and observing whether the graph is a straight line through the origin.
7.RP.2b Identify the constant of proportionality (unit rate) in tables, graphs, equations, diagrams, and verbal
descriptions of proportional relationships. (Also see 8.EE.5)
7.RP.2c Represent proportional relationships by equations. For example, if total cost t is proportional to the
number n of items purchased at a constant price p, the relationship between the total cost and the number of
items can be expressed as t = pn.
7.RP.2d Explain what a point (x, y) on the graph of a proportional relationship means in terms of the situation,
with special attention to the points (0, 0) and (1, r) where r is the unit rate.
7.RP.3 Use proportional relationships to solve multistep ratio and percent problems. Examples: simple interest,
tax, markups and markdowns, gratuities and commissions, fees, percent increase and decrease, percent error.
(Also see 7.G.1 and G.MG.2)
Level E – Number and Quantity
N.RN.2 Rewrite expressions involving radicals and rational exponents using the properties of exponents.
N.Q.1 Use units as a way to understand problems and to guide the solution of multi-step problems; choose
and interpret units consistently in formulas; choose and interpret the scale and the origin in graphs and data
displays.*
N.Q.3 Choose a level of accuracy appropriate to limitations on measurement when reporting quantities.*
College and Career Readiness Content Progressions
20 College and Career Readiness Standards-in-Action | | Workshop Materials for Aligning Curriculum Resources
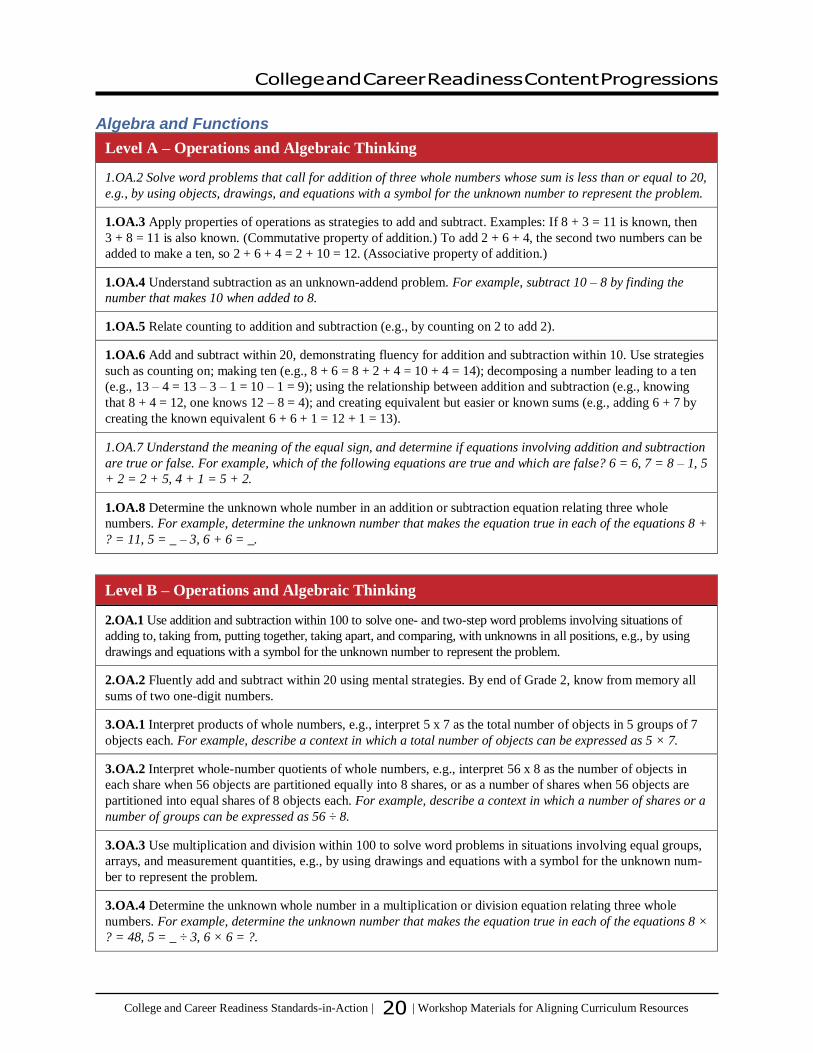
Algebra and Functions
Level A – Operations and Algebraic Thinking
1.OA.2 Solve word problems that call for addition of three whole numbers whose sum is less than or equal to 20,
e.g., by using objects, drawings, and equations with a symbol for the unknown number to represent the problem.
1.OA.3 Apply properties of operations as strategies to add and subtract. Examples: If 8 + 3 = 11 is known, then
3 + 8 = 11 is also known. (Commutative property of addition.) To add 2 + 6 + 4, the second two numbers can be
added to make a ten, so 2 + 6 + 4 = 2 + 10 = 12. (Associative property of addition.)
1.OA.4 Understand subtraction as an unknown-addend problem. For example, subtract 10 – 8 by finding the
number that makes 10 when added to 8.
1.OA.5 Relate counting to addition and subtraction (e.g., by counting on 2 to add 2).
1.OA.6 Add and subtract within 20, demonstrating fluency for addition and subtraction within 10. Use strategies
such as counting on; making ten (e.g., 8 + 6 = 8 + 2 + 4 = 10 + 4 = 14); decomposing a number leading to a ten
(e.g., 13 – 4 = 13 – 3 – 1 = 10 – 1 = 9); using the relationship between addition and subtraction (e.g., knowing
that 8 + 4 = 12, one knows 12 – 8 = 4); and creating equivalent but easier or known sums (e.g., adding 6 + 7 by
creating the known equivalent 6 + 6 + 1 = 12 + 1 = 13).
1.OA.7 Understand the meaning of the equal sign, and determine if equations involving addition and subtraction
are true or false. For example, which of the following equations are true and which are false? 6 = 6, 7 = 8 – 1, 5
+ 2 = 2 + 5, 4 + 1 = 5 + 2.
1.OA.8 Determine the unknown whole number in an addition or subtraction equation relating three whole
numbers. For example, determine the unknown number that makes the equation true in each of the equations 8 +
? = 11, 5 = _ – 3, 6 + 6 = _.
Level B – Operations and Algebraic Thinking
2.OA.1 Use addition and subtraction within 100 to solve one- and two-step word problems involving situations of
adding to, taking from, putting together, taking apart, and comparing, with unknowns in all positions, e.g., by using
drawings and equations with a symbol for the unknown number to represent the problem.
2.OA.2 Fluently add and subtract within 20 using mental strategies. By end of Grade 2, know from memory all
sums of two one-digit numbers.
3.OA.1 Interpret products of whole numbers, e.g., interpret 5 x 7 as the total number of objects in 5 groups of 7
objects each. For example, describe a context in which a total number of objects can be expressed as 5 × 7.
3.OA.2 Interpret whole-number quotients of whole numbers, e.g., interpret 56 x 8 as the number of objects in
each share when 56 objects are partitioned equally into 8 shares, or as a number of shares when 56 objects are
partitioned into equal shares of 8 objects each. For example, describe a context in which a number of shares or a
number of groups can be expressed as 56 ÷ 8.
3.OA.3 Use multiplication and division within 100 to solve word problems in situations involving equal groups,
arrays, and measurement quantities, e.g., by using drawings and equations with a symbol for the unknown num-
ber to represent the problem.
3.OA.4 Determine the unknown whole number in a multiplication or division equation relating three whole
numbers. For example, determine the unknown number that makes the equation true in each of the equations 8 ×
? = 48, 5 = _ ÷ 3, 6 × 6 = ?.

College and Career Readiness Content Progressions
21 College and Career Readiness Standards-in-Action | | Workshop Materials for Aligning Curriculum Resources
Level B – Operations and Algebraic Thinking
3.OA.5 Apply properties of operations as strategies to multiply and divide. Examples: If 6 × 4 = 24 is known, then
4 × 6 = 24 is also known. (Commutative property of multiplication.) 3 × 5 × 2 can be found by 3 × 5 = 15, then
15 × 2 = 30, or by 5 × 2 = 10, then 3 × 10 = 30. (Associative property of multiplication.) Knowing that 8 × 5 =
40 and 8 × 2 = 16, one can find 8 × 7 as 8 × (5 + 2) = (8 × 5) + (8 × 2) = 40 + 16 = 56. (Distributive property.)
3.OA.6 Understand division as an unknown-factor problem. For example, find 32 ÷ 8 by finding the number that
makes 32 when multiplied by 8.
3.OA.7 Fluently multiply and divide within 100, using strategies such as the relationship between multiplication
and division (e.g., knowing that 8 x 5 = 40, one knows 40 x 5 = 8) or properties of operations. By the end of
Grade 3, know from memory all products of two one-digit numbers.
3.OA.8 Solve two-step word problems using the four operations. Represent these problems using equations with
a letter standing for the unknown quantity. Assess the reasonableness of answers using mental computation and
estimation strategies including rounding.
3.OA.9 Identify arithmetic patterns (including patterns in the addition table or multiplication table), and explain
them using properties of operations. For example, observe that 4 times a number is always even, and explain
why 4 times a number can be decomposed into two equal addends.
Level C – Operations and Algebraic Thinking
4.OA.1 Interpret a multiplication equation as a comparison, e.g., interpret 35 = 5 x 7 as a statement that 35 is
5 times as many as 7 and 7 times as many as 5. Represent verbal statements of multiplicative comparisons as
multiplication equations.
4.OA.2 Multiply or divide to solve word problems involving multiplicative comparison, e.g., by using drawings
and equations with a symbol for the unknown number to represent the problem, distinguishing multiplicative
comparison from additive comparison.
4.OA.3 Solve multistep word problems posed with whole numbers and having whole-number answers using the
four operations, including problems in which remainders must be interpreted. Represent these problems using
equations with a letter standing for the unknown quantity. Assess the reasonableness of answers using mental
computation and estimation strategies including rounding.
4.OA.4 Find all factor pairs for a whole number in the range 1–100. Recognize that a whole number is a
multiple of each of its factors. Determine whether a given whole number in the range 1–100 is a multiple of a
given one-digit number. Determine whether a given whole number in the range 1–100 is prime or composite.
4.OA.5 Generate a number or shape pattern that follows a given rule. Identify apparent features of the pattern that
were not explicit in the rule itself. For example, given the rule “Add 3” and the starting number 1, generate terms
in the resulting sequence and observe that the terms appear to alternate between odd and even numbers. Explain
informally why the numbers will continue to alternate in this way.
5.OA.1 Use parentheses, brackets, or braces in numerical expressions, and evaluate expressions with these symbols.
5.OA.2 Write simple expressions that record calculations with numbers, and interpret numerical expressions
without evaluating them. For example, express the calculation “add 8 and 7, then multiply by 2” as 2 × (8 +
7). Recognize that 3 × (18932 + 921) is three times as large as 18932 + 921, without having to calculate the
indicated sum or product.
6.EE.1 Write and evaluate numerical expressions involving whole-number exponents.

College and Career Readiness Content Progressions
22 College and Career Readiness Standards-in-Action | | Workshop Materials for Aligning Curriculum Resources
Level C – Operations and Algebraic Thinking
6.EE.2 Write, read, and evaluate expressions in which letters stand for numbers.
6.EE.2a Write expressions that record operations with numbers and with letters standing for numbers. For
example, express the calculation “Subtract y from 5” as 5 – y.
6.EE.2b Identify parts of an expression using mathematical terms (sum, term, product, factor, quotient, coefficient);
view one or more parts of an expression as a single entity. For example, describe the expression 2 (8 + 7) as a
product of two factors; view (8 + 7) as both a single entity and a sum of two terms.
6.EE.2c Evaluate expressions at specific values of their variables. Include expressions that arise from formulas
used in real-world problems. Perform arithmetic operations, including those involving whole- number exponents,
in the conventional order when there are no parentheses to specify a particular order (Order of Operations). For
example, use the formulas V = s^3 and A = 6 s^2 to find the volume and surface area of a cube with sides of
length s = 1/2.
6.EE.3 Apply the properties of operations to generate equivalent expressions. For example, apply the distributive
property to the expression 3 (2 + x) to produce the equivalent expression 6 + 3x; apply the distributive property
to the expression 24x + 18y to produce the equivalent expression 6 (4x + 3y); apply properties of operations to y
+ y + y to produce the equivalent expression 3y.
6.EE.4 Identify when two expressions are equivalent (i.e., when the two expressions name the same number
regardless of which value is substituted into them). For example, the expressions y + y + y and 3y are equivalent
because they name the same number regardless of which number y stands for.
6.EE.5 Understand solving an equation or inequality as a process of answering a question: which values from a
specified set, if any, make the equation or inequality true? Use substitution to determine whether a given number
in a specified set makes an equation or inequality true.
6.EE.6 Use variables to represent numbers and write expressions when solving a real-world or mathematical
problem; understand that a variable can represent an unknown number, or, depending on the purpose at hand,
any number in a specified set.
6.EE.7 Solve real-world and mathematical problems by writing and solving equations of the form x + p = q and
px = q for cases in which p, q and x are all nonnegative rational numbers.
6.EE.8 Write an inequality of the form x > c or x < c to represent a constraint or condition in a real-world or
mathematical problem. Recognize that inequalities of the form x > c or x < c have infinitely many solutions;
represent solutions of such inequalities on number line diagrams.
6.EE.9 Use variables to represent two quantities in a real-world problem that change in relationship to one
another; write an equation to express one quantity, thought of as the dependent variable, in terms of the
other quantity, thought of as the independent variable. Analyze the relationship between the dependent and
independent variables using graphs and tables, and relate these to the equation. For example, in a problem
involving motion at constant speed, list and graph ordered pairs of distances and times, and write the equation d
= 65t to represent the relationship between distance and time.
Level D – Expressions and Equations
7.EE.1 Apply properties of operations as strategies to add, subtract, factor, and expand linear expressions with
rational coefficients.

College and Career Readiness Content Progressions
23 College and Career Readiness Standards-in-Action | | Workshop Materials for Aligning Curriculum Resources
Level D – Expressions and Equations
7.EE.2 Understand that rewriting an expression in different forms in a problem context can shed light on the
problem and how the quantities in it are related. For example, a + 0.05a = 1.05a means that “increase by 5%”
is the same as “multiply by 1.05.” [Also see A.SSE.2, A.SSE .3, A.SSE .3a, A.CED.4]
7.EE.3 Solve multi-step real-life and mathematical problems posed with positive and negative rational numbers in any form (whole numbers, fractions, and decimals), using tools strategically. Apply properties of operations to calculate with numbers in any form; convert between forms as appropriate; and assess the reasonableness of answers using mental computation and estimation strategies. For example: If a woman making $25 an hour gets a 10% raise, she will make an additional 1/10 of her salary an hour, or $2.50, for a new salary of $27.50. If you want to place a towel bar 9 3/4 inches long in the center of a door that is 27 1/2 inches wide, you will need to place the bar about 9 inches from each edge; this estimate can be used as a check on the exact computation.
7.EE.4 Use variables to represent quantities in a real-world or mathematical problem, and construct simple
equations and inequalities to solve problems by reasoning about the quantities.
7.EE.4a Solve word problems leading to equations of the form px + q = r and p(x + q) = r, where p, q, and
r are specific rational numbers. Solve equations of these forms fluently. Compare an algebraic solution to an
arithmetic solution, identifying the sequence of the operations used in each approach. For example, the perimeter
of a rectangle is 54 cm. Its length is 6 cm. What is its width?
7.EE.4b Solve word problems leading to inequalities of the form px + q > r or px + q < r, where p, q, and r are
specific rational numbers. Graph the solution set of the inequality and interpret it in the context of the problem.
For example: As a salesperson, you are paid $50 per week plus $3 per sale. This week you want your pay to be
at least $100. Write an inequality for the number of sales you need to make, and describe the solutions.
8.EE.1.Know and apply the properties of integer exponents to generate equivalent numerical expressions. For
example, 3^2 × 3^(–5) = 3^(–3) = (1/3)^3 = 1/27.
8.EE.2 Use square root and cube root symbols to represent solutions to equations of the form x^2 = p and x^3 =
p, where p is a positive rational number. Evaluate square roots of small perfect squares and cube roots of small
perfect cubes. Know that √2 is irrational.
8.EE.3 Use numbers expressed in the form of a single digit times an integer power of 10 to estimate very large
or very small quantities, and to express how many times as much one is than the other. For example, estimate the
population of the United States as 3 × 10^8 and the population of the world as 7 × 10^9, and determine that the
world population is more than 20 times larger.
8.EE.4 Perform operations with numbers expressed in scientific notation, including problems where both
decimal and scientific notation are used. Use scientific notation and choose units of appropriate size for
measurements of very large or very small quantities (e.g., use millimeters per year for seafloor spreading).
Interpret scientific notation that has been generated by technology.
8.EE.5 Graph proportional relationships, interpreting the unit rate as the slope of the graph. Compare two
different proportional relationships represented in different ways. For example, compare a distance-time graph
to a distance-time equation to determine which of two moving objects has greater speed. [Also see 7.RP.2b]
8.EE.7 Solve linear equations in one variable.
8.EE.7a Give examples of linear equations in one variable with one solution, infinitely many solutions, or no
solutions. Show which of these possibilities is the case by successively transforming the given equation into simpler
forms, until an equivalent equation of the form x = a, a = a, or a = b results (where a and b are different numbers).
8.EE.7b Solve linear equations with rational number coefficients, including equations whose solutions require
expanding expressions using the distributive property and collecting like terms.

College and Career Readiness Content Progressions
24 College and Career Readiness Standards-in-Action | | Workshop Materials for Aligning Curriculum Resources
Level D – Expressions and Equations
8.EE.8 Analyze and solve pairs of simultaneous linear equations.
8.EE.8a Understand that solutions to a system of two linear equations in two variables correspond to points of
intersection of their graphs, because points of intersection satisfy both equations simultaneously.
8.EE.8b Solve systems of two linear equations in two variables algebraically, and estimate solutions by graphing
the equations. Solve simple cases by inspection. For example, 3x + 2y = 5 and 3x + 2y = 6 have no solution
because 3x + 2y cannot simultaneously be 5 and 6.
8.EE.8c Solve real-world and mathematical problems leading to two linear equations in two variables. For
example, given coordinates for two pairs of points, determine whether the line through the first pair of points
intersects the line through the second pair.
Level D – Functions
8.F.1 Understand that a function is a rule that assigns to each input exactly one output. The graph of a function is
the set of ordered pairs consisting of an input and the corresponding output. [Also see F.IF.1]
8.F.3 Interpret the equation y = mx + b as defining a linear function, whose graph is a straight line; give
examples of functions that are not linear. For example, the function A = s^2 giving the area of a square as a
function of its side length is not linear because its graph contains the points (1,1), (2,4) and (3,9), which are not
on a straight line.
8.F.4 Construct a function to model a linear relationship between two quantities. Determine the rate of change
and initial value of the function from a description of a relationship or from two (x, y) values, including reading
these from a table or from a graph. Interpret the rate of change and initial value of a linear function in terms of
the situation it models, and in terms of its graph or a table of values. [Also see F.BF.1 and F.LE.5]
8.F.5 Describe qualitatively the functional relationship between two quantities by analyzing a graph (e.g.,
where the function is increasing or decreasing, linear or nonlinear). Sketch a graph that exhibits the qualitative
features of a function that has been described verbally. [Also see A.REI.10 and F.IF.7]
Level E – Algebra
A.SSE.1 Interpret expressions that represent a quantity in terms of its context.*
A.SSE.1a Interpret parts of an expression, such as terms, factors, and coefficients.*
A.SSE.2 Use the structure of an expression to identify ways to rewrite it. For example, see x^4 – y^4 as (x^2)^2
– (y^2^2, thus recognizing it as a difference of squares that can be factored as (x^2 – y^2)(x^2 + y^2). [Also see
7.EE.2]
A.SSE.3 Choose and produce an equivalent form of an expression to reveal and explain properties of the
quantity represented by the expression.* [Also see 7.EE.2]
A.SSE.3a Factor a quadratic expression to reveal the zeros of the function it defines.* [Also see 7.EE.2]
A.APR.1 Understand that polynomials form a system analogous to the integers, namely, they are closed under
the operations of addition, subtraction, and multiplication; add, subtract, and multiply polynomials. [NOTE:
Emphasis should be on operations with polynomials.]

College and Career Readiness Content Progressions
25 College and Career Readiness Standards-in-Action | | Workshop Materials for Aligning Curriculum Resources
Level E – Algebra
A.APR.6 Rewrite simple rational expressions in different forms; write a(x)/b(x) in the form q(x) + r(x)/b(x),
where a(x), b(x), q(x), and r(x) are polynomials with the degree of r(x) less than the degree of b(x), using
inspection, long division, or, for the more complicated examples, a computer algebra system.
A.CED.1 Create equations and inequalities in one variable and use them to solve problems. Include equations
arising from linear and quadratic functions, and simple rational and exponential functions.*
A.CED.2 Create equations in two or more variables to represent relationships between quantities; graph
equations on coordinate axes with labels and scales.*
A.CED.3 Represent constraints by equations or inequalities, and by systems of equations and/or inequalities, and
interpret solutions as viable or non- viable options in a modeling context. For example, represent inequalities
describing nutritional and cost constraints on combinations of different foods.*
A.CED.4 Rearrange formulas to highlight a quantity of interest, using the same reasoning as in solving
equations. For example, rearrange Ohm’s law V = IR to highlight resistance R. )* [Also see 7.EE.2 and F.IF.8]
A.REI.1 Explain each step in solving a simple equation as following from the equality of numbers asserted at
the previous step, starting from the assumption that the original equation has a solution. Construct a viable
argument to justify a solution method.
A.REI.2 Solve simple rational and radical equations in one variable, and give examples showing how extraneous
solutions may arise.
A.REI.3 Solve linear equations and inequalities in one variable, including equations with coefficients
represented by letters.
A.REI.4 Solve quadratic equations in one variable.
A.REI.6 Solve systems of linear equations exactly and approximately (e.g., with graphs), focusing on pairs of
linear equations in two variables.
A.REI.10 Understand that the graph of an equation in two variables is the set of all its solutions plotted in the
coordinate plane, often forming a curve (which could be a line). [Also see 8.F.5]
Level E – Functions
F.IF.1 Understand that a function from one set (called the domain) to another set (called the range) assigns to
each element of the domain exactly one element of the range. If f is a function and x is an element of its domain,
then f(x) denotes the output of f corresponding to the input x. The graph of f is the graph of the equation y = f(x).
[Also see 8.F.1]
F.IF.2 Use function notation, evaluate functions for inputs in their domains, and interpret statements that use
function notation in terms of a context.
F.IF.4 For a function that models a relationship between two quantities, interpret key features of graphs and
tables in terms of the quantities, and sketch graphs showing key features given a verbal description of the
relationship. Key features include: intercepts; intervals where the function is increasing, decreasing, positive, or
negative; relative maximums and minimums; symmetries; end behavior; and periodicity.* [NOTE: Key features
to include: intercepts; intervals where the function is increasing, decreasing, positive, or negative; relative
maximums and minimums; symmetries; end behavior; and periodicity.]
College and Career Readiness Content Progressions
26 College and Career Readiness Standards-in-Action | | Workshop Materials for Aligning Curriculum Resources
Level E – Functions
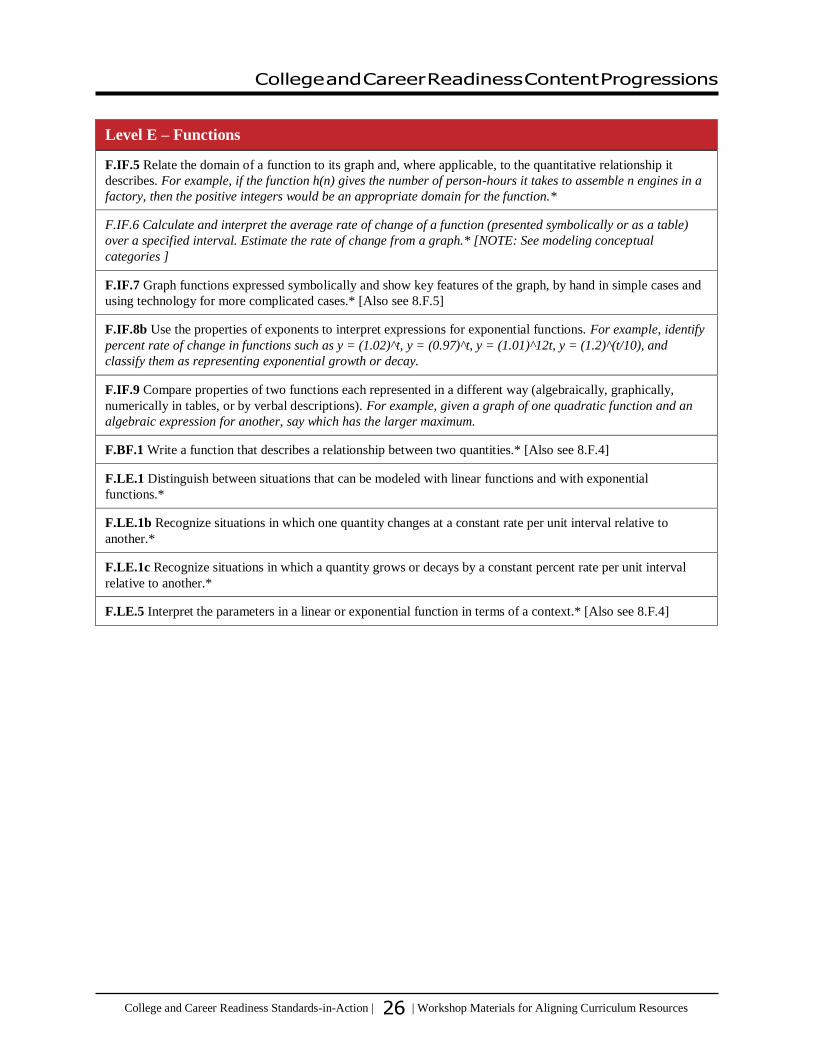
F.IF.5 Relate the domain of a function to its graph and, where applicable, to the quantitative relationship it
describes. For example, if the function h(n) gives the number of person-hours it takes to assemble n engines in a
factory, then the positive integers would be an appropriate domain for the function.*
F.IF.6 Calculate and interpret the average rate of change of a function (presented symbolically or as a table)
over a specified interval. Estimate the rate of change from a graph.* [NOTE: See modeling conceptual
categories ]
F.IF.7 Graph functions expressed symbolically and show key features of the graph, by hand in simple cases and
using technology for more complicated cases.* [Also see 8.F.5]
F.IF.8b Use the properties of exponents to interpret expressions for exponential functions. For example, identify
percent rate of change in functions such as y = (1.02)^t, y = (0.97)^t, y = (1.01)^12t, y = (1.2)^(t/10), and
classify them as representing exponential growth or decay.
F.IF.9 Compare properties of two functions each represented in a different way (algebraically, graphically,
numerically in tables, or by verbal descriptions). For example, given a graph of one quadratic function and an
algebraic expression for another, say which has the larger maximum.
F.BF.1 Write a function that describes a relationship between two quantities.* [Also see 8.F.4]
F.LE.1 Distinguish between situations that can be modeled with linear functions and with exponential
functions.*
F.LE.1b Recognize situations in which one quantity changes at a constant rate per unit interval relative to
another.*
F.LE.1c Recognize situations in which a quantity grows or decays by a constant percent rate per unit interval
relative to another.*
F.LE.5 Interpret the parameters in a linear or exponential function in terms of a context.* [Also see 8.F.4]

College and Career Readiness Content Progressions
27 College and Career Readiness Standards-in-Action | | Workshop Materials for Aligning Curriculum Resources
Geometry
Level A – Geometry and Geometric Measurement
K.G.4 Analyze and compare two- and three-dimensional shapes, in different sizes and orientations, using infor-
mal language to describe their similarities, differences, parts (e.g., number of sides and vertices/“corners”) and
other attributes (e.g., having sides of equal length).
1.G.2 Compose two-dimensional shapes (rectangles, squares, trapezoids, triangles, half-circles, and quarter-circles)
or three-dimensional shapes (cubes, right rectangular prisms, right circular cones, and right circular cylinders) to
create a composite shape, and compose new shapes from the composite shape.
1.MD.2 Express the length of an object as a whole number of length units, by laying multiple copies of a shorter
object (the length unit) end to end; understand that the length measurement of an object is the number of same-
size length units that span it with no gaps or overlaps. Limit to contexts where the object being measured is
spanned by a whole number of length units with no gaps or overlaps.
Level B – Geometry and Geometric Measurement
2.G.1 Recognize and draw shapes having specified attributes, such as a given number of angles or a given
number of equal faces. Identify triangles, quadrilaterals, pentagons, hexagons, and cubes.
2.G.3 Partition circles and rectangles into two, three, or four equal shares, describe the shares using the words
halves, thirds, half of, a third of, etc., and describe the whole as two halves, three thirds, four fourths. Recognize
that equal shares of identical wholes need not have the same shape.
3.G.1 Understand that shapes in different categories (e.g., rhombuses, rectangles, and others) may share
attributes (e.g., having four sides), and that the shared attributes can define a larger category (e.g.,
quadrilaterals). Recognize rhombuses, rectangles, and squares as examples of quadrilaterals, and draw
examples of quadrilaterals that do not belong to any of these subcategories.
3.G.2 Partition shapes into parts with equal areas. Express the area of each part as a unit fraction of the whole.
For example, partition a shape into 4 parts with equal area, and describe the area of each part as 1/4 of the area
of the shape.
2.MD.2 Measure the length of an object twice, using length units of different lengths for the two measurements;
describe how the two measurements relate to the size of the unit chosen.
2.MD.3 Estimate lengths using units of inches, feet, centimeters, and meters.
2.MD.4 Measure to determine how much longer one object is than another, expressing the length difference in
terms of a standard length unit.
2.MD.6 Represent whole numbers as lengths from 0 on a number line diagram with equally spaced points
corresponding to the numbers 0, 1, 2, ..., and represent whole-number sums and differences within 100 on a
number line diagram
3.MD.1 Tell and write time to the nearest minute and measure time intervals in minutes. Solve word problems
involving addition and subtraction of time intervals in minutes, e.g., by representing the problem on a number
line diagram.

College and Career Readiness Content Progressions
28 College and Career Readiness Standards-in-Action | | Workshop Materials for Aligning Curriculum Resources
Level B – Geometry and Geometric Measurement
3.MD.2 Measure and estimate liquid volumes and masses of objects using standard units of grams (g), kilograms
(kg), and liters (l).6 Add, subtract, multiply, or divide to solve one-step word problems involving masses or
volumes that are given in the same units, e.g., by using drawings (such as a beaker with a measurement scale) to
represent the problem.
3. MD.5 Recognize area as an attribute of plane figures and understand concepts of area measurement.
a. A square with side length 1 unit, called “a unit square,” is said to have “one square unit” of area, and can be
used to measure area.
b. A plane figure which can be covered without gaps or overlaps by n unit squares is said to have an area of n
square units.
3.MD.6 Measure areas by counting unit squares (square cm, square m, square in, square ft, and improvised
units).
3.MD.7 Relate area to the operations of multiplication and addition.
3.MD.7a Find the area of a rectangle with whole-number side lengths by tiling it, and show that the area is the
same as would be found by multiplying the side lengths.
3.MD.7b Multiply side lengths to find areas of rectangles with whole- number side lengths in the context of
solving real world and mathematical problems, and represent whole-number products as rectangular areas in
mathematical reasoning.
3.MD.7c Use tiling to show in a concrete case that the area of a rectangle with whole-number side lengths a
and b + c is the sum of a x b and a x c. Use area models to represent the distributive property in mathematical
reasoning.
3.MD.7d Recognize area as additive. Find areas of rectilinear figures by decomposing them into non-
overlapping rectangles and adding the areas of the non-overlapping parts, applying this technique to solve real
world problems.
3.MD.8 Solve real world and mathematical problems involving perimeters of polygons, including finding the
perimeter given the side lengths, finding an unknown side length, and exhibiting rectangles with the same
perimeter and different areas or with the same area and different perimeters.
Level C – Geometry and Geometric Measurement
4.G.1 Draw points, lines, line segments, rays, angles (right, acute, obtuse), and perpendicular and parallel lines.
Identify these in two-dimensional figures.
5.G.1 Use a pair of perpendicular number lines, called axes, to define a coordinate system, with the intersection
of the lines (the origin) arranged to coincide with the 0 on each line and a given point in the plane located by
using an ordered pair of numbers, called its coordinates. Understand that the first number indicates how far
to travel from the origin in the direction of one axis, and the second number indicates how far to travel in the
direction of the second axis, with the convention that the names of the two axes and the coordinates correspond
(e.g., x-axis and x-coordinate, y-axis and y-coordinate).
5.G.2 Represent real world and mathematical problems by graphing points in the first quadrant of the coordinate
plane, and interpret coordinate values of points in the context of the situation.
5.G.3 Understand that attributes belonging to a category of two- dimensional figures also belong to all
subcategories of that category. For example, all rectangles have four right angles and squares are rectangles, so
all squares have four right angles.

College and Career Readiness Content Progressions
29 College and Career Readiness Standards-in-Action | | Workshop Materials for Aligning Curriculum Resources
Level C – Geometry and Geometric Measurement
6.G.1 Find the area of right triangles, other triangles, special quadrilaterals, and polygons by composing into
rectangles or decomposing into triangles and other shapes; apply these techniques in the context of solving real-
world and mathematical problems.
6.G.3 Draw polygons in the coordinate plane given coordinates for the vertices; use coordinates to find the
length of a side joining points with the same first coordinate or the same second coordinate. Apply these
techniques in the context of solving real-world and mathematical problems.
6.G.4 Represent three-dimensional figures using nets made up of rectangles and triangles, and use the nets
to find the surface area of these figures. Apply these techniques in the context of solving real-world and
mathematical problems.
4.MD.2 Use the four operations to solve word problems involving distances, intervals of time, liquid volumes,
masses of objects, and money, including problems involving simple fractions or decimals, and problems that
require expressing measurements given in a larger unit in terms of a smaller unit. Represent measurement
quantities using diagrams such as number line diagrams that feature a measurement scale.
4.MD.3 Apply the area and perimeter formulas for rectangles in real world and mathematical problems. For
example, find the width of a rectangular room given the area of the flooring and the length, by viewing the area
formula as a multiplication equation with an unknown factor.
4. MD.5 Recognize angles as geometric shapes that are formed wherever two rays share a common endpoint, and
understand concepts of angle measurement:
a. An angle is measured with reference to a circle with its center at the common endpoint of the rays, by
considering the fraction of the circular arc between the points where the two rays intersect the circle. An angle
that turns through 1/360 of a circle is called a “one-degree angle,” and can be used to measure angles.
b. An angle that turns through n one-degree angles is said to have an angle measure of n degrees.
4.MD.6 Measure angles in whole-number degrees using a protractor. Sketch angles of specified measure.
4.MD.7 Recognize angle measure as additive. When an angle is decomposed into non-overlapping parts,
the angle measure of the whole is the sum of the angle measures of the parts. Solve addition and subtraction
problems to find unknown angles on a diagram in real world and mathematical problems, e.g., by using an
equation with a symbol for the unknown angle measure.
5.MD.1 Convert among different-sized standard measurement units within a given measurement system (e.g.,
convert 5 cm to 0.05 m), and use these conversions in solving multi-step, real world problems.
5. MD.3 Recognize volume as an attribute of solid figures and understand concepts of volume measurement.
a. A cube with side length 1 unit, called a “unit cube,” is said to have “one cubic unit” of volume, and can be used to
measure volume.
b. A solid figure which can be packed without gaps or overlaps using n unit cubes is said to have a volume of n cubic
units.
5.MD.4 Measure volumes by counting unit cubes, using cubic cm, cubic in, cubic ft, and improvised units.
5.MD.5 Relate volume to the operations of multiplication and addition and solve real world and mathematical
problems involving volume.
5.MD.5a Find the volume of a right rectangular prism with whole-number side lengths by packing it with unit
cubes, and show that the volume is the same as would be found by multiplying the edge lengths, equivalently by
multiplying the height by the area of the base. Represent threefold whole-number products as volumes, e.g., to
represent the associative property of multiplication.

College and Career Readiness Content Progressions
30 College and Career Readiness Standards-in-Action | | Workshop Materials for Aligning Curriculum Resources
Level C – Geometry and Geometric Measurement
5.MD.5b Apply the formulas V = l x w x h and V = b x h for rectangular prisms to find volumes of right rectangular
prisms with whole- number edge lengths in the context of solving real world and mathematical problems.
5.MD.5c Recognize volume as additive. Find volumes of solid figures composed of two non-overlapping right
rectangular prisms by adding the volumes of the non-overlapping parts, applying this technique to solve real
world problems.
Level D – Geometry
7.G.1 Solve problems involving scale drawings of geometric figures, including computing actual lengths and areas
from a scale drawing and reproducing a scale drawing at a different scale. [Also see 7.RP.3]
7.G.4 Know the formulas for the area and circumference of a circle and use them to solve problems; give an
informal derivation of the relationship between the circumference and area of a circle.
7.G.5 Use facts about supplementary, complementary, vertical, and adjacent angles in a multi-step problem to
write and solve simple equations for an unknown angle in a figure.
7.G.6 Solve real-world and mathematical problems involving area, volume and surface area of two- and three-
dimensional objects composed of triangles, quadrilaterals, polygons, cubes, and right prisms.
8.G.2 Understand that a two-dimensional figure is congruent to another if the second can be obtained from the
first by a sequence of rotations, reflections, and translations; given two congruent figures, describe a sequence
that exhibits the congruence between them.
8.G.4 Understand that a two-dimensional figure is similar to another if the second can be obtained from the first
by a sequence of rotations, reflections, translations, and dilations; given two similar two- dimensional figures,
describe a sequence that exhibits the similarity between them.
8.G.5 Use informal arguments to establish facts about the angle sum and exterior angle of triangles, about
the angles created when parallel lines are cut by a transversal, and the angle-angle criterion for similarity of
triangles. For example, arrange three copies of the same triangle so that the sum of the three angles appears to
form a line, and give an argument in terms of transversals why this is so.
8.G.7 Apply the Pythagorean Theorem to determine unknown side lengths in right triangles in real-world and
mathematical problems in two and three dimensions.
8.G.8 Apply the Pythagorean Theorem to find the distance between two points in a coordinate system.
Level E – Geometry
G.CO.1 Know precise definitions of angle, circle, perpendicular line, parallel line, and line segment, based on
the undefined notions of point, line, distance along a line, and distance around a circular arc.
G.SRT.5 Use congruence and similarity criteria for triangles to solve problems and to prove relationships in
geometric figures.
G.GMD.3 Use volume formulas for cylinders, pyramids, cones, and spheres to solve problems.*
G.MG.2 Apply concepts of density based on area and volume in modeling situations (e.g., persons per square
mile, BTUs per cubic foot).* [Also see 7.RP.3]
College and Career Readiness Content Progressions
31 College and Career Readiness Standards-in-Action | | Workshop Materials for Aligning Curriculum Resources
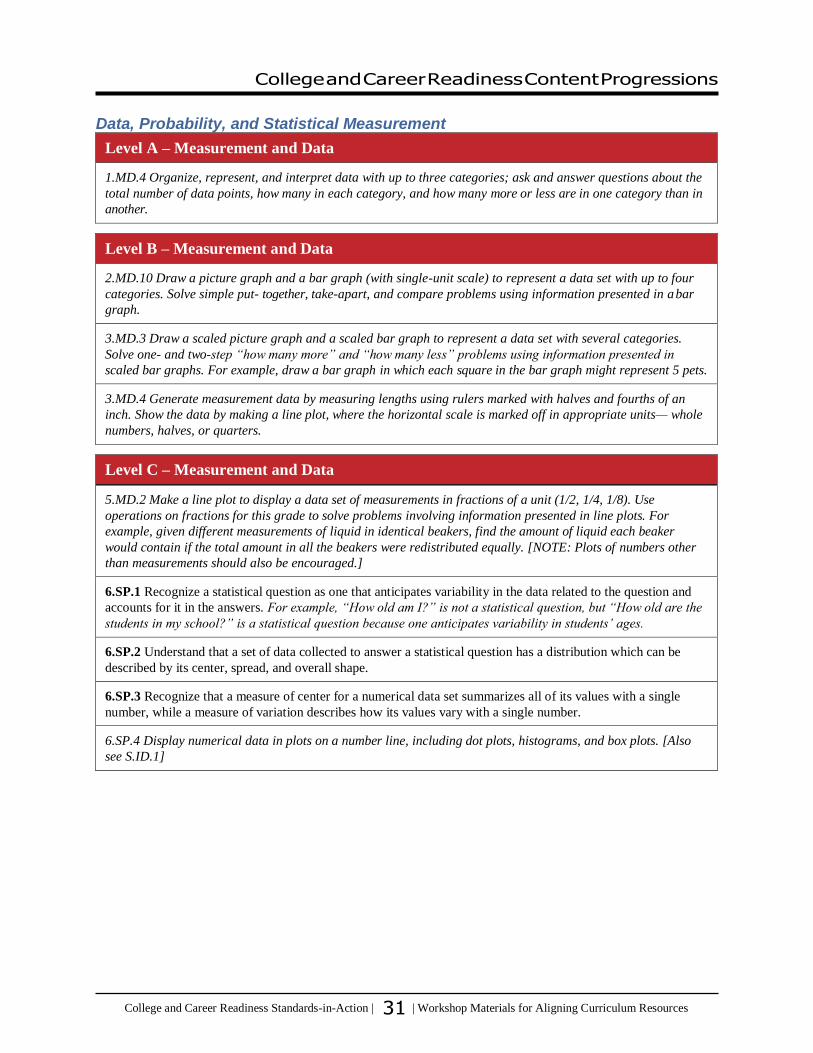
Data, Probability, and Statistical Measurement
Level A – Measurement and Data
1.MD.4 Organize, represent, and interpret data with up to three categories; ask and answer questions about the
total number of data points, how many in each category, and how many more or less are in one category than in
another.
Level B – Measurement and Data
2.MD.10 Draw a picture graph and a bar graph (with single-unit scale) to represent a data set with up to four
categories. Solve simple put- together, take-apart, and compare problems using information presented in a bar
graph.
3.MD.3 Draw a scaled picture graph and a scaled bar graph to represent a data set with several categories.
Solve one- and two-step “how many more” and “how many less” problems using information presented in
scaled bar graphs. For example, draw a bar graph in which each square in the bar graph might represent 5 pets.
3.MD.4 Generate measurement data by measuring lengths using rulers marked with halves and fourths of an
inch. Show the data by making a line plot, where the horizontal scale is marked off in appropriate units— whole
numbers, halves, or quarters.
Level C – Measurement and Data
5.MD.2 Make a line plot to display a data set of measurements in fractions of a unit (1/2, 1/4, 1/8). Use
operations on fractions for this grade to solve problems involving information presented in line plots. For
example, given different measurements of liquid in identical beakers, find the amount of liquid each beaker
would contain if the total amount in all the beakers were redistributed equally. [NOTE: Plots of numbers other
than measurements should also be encouraged.]
6.SP.1 Recognize a statistical question as one that anticipates variability in the data related to the question and
accounts for it in the answers. For example, “How old am I?” is not a statistical question, but “How old are the
students in my school?” is a statistical question because one anticipates variability in students’ ages.
6.SP.2 Understand that a set of data collected to answer a statistical question has a distribution which can be
described by its center, spread, and overall shape.
6.SP.3 Recognize that a measure of center for a numerical data set summarizes all of its values with a single
number, while a measure of variation describes how its values vary with a single number.
6.SP.4 Display numerical data in plots on a number line, including dot plots, histograms, and box plots. [Also
see S.ID.1]

College and Career Readiness Content Progressions
32 College and Career Readiness Standards-in-Action | | Workshop Materials for Aligning Curriculum Resources
Level D – Statistics and Probability
6. SP.5 Summarize numerical data sets in relation to their context, such as by:
a. Reporting the number of observations.
b. Describing the nature of the attribute under investigation, including how it was measured and its units of
measurement.
c. Giving quantitative measures of center (median and/or mean) and variability (interquartile range and/or mean
absolute deviation), as well as describing any overall pattern and any striking deviations from the overall pattern
with reference to the context in which the data were gathered.
d. Relating the choice of measures of center and variability to the shape of the data distribution and the context
in which the data were gathered.
7.SP.1 Understand that statistics can be used to gain information about a population by examining a sample of
the population; generalizations about a population from a sample are valid only if the sample is representative
of that population. Understand that random sampling tends to produce representative samples and support valid
inferences.
7.SP.2 Use data from a random sample to draw inferences about a population with an unknown characteristic of
interest. Generate multiple samples (or simulated samples) of the same size to gauge the variation in estimates or
predictions. For example, estimate the mean word length in a book by randomly sampling words from the book;
predict the winner of a school election based on randomly sampled survey data. Gauge how far off the estimate
or prediction might be.
7.SP.3 Informally assess the degree of visual overlap of two numerical data distributions with similar
variabilities, measuring the difference between the centers by expressing it as a multiple of a measure of
variability. For example, the mean height of players on the basketball team is 10 cm greater than the mean
height of players on the soccer team, about twice the variability (mean absolute deviation) on either team; on a
dot plot, the separation between the two distributions of heights is noticeable.
7.SP.4 Use measures of center and measures of variability for numerical data from random samples to draw
informal comparative inferences about two populations. For example, decide whether the words in a chapter of a
seventh-grade science book are generally longer than the words in a chapter of a fourth-grade science book.
7.SP.5 Understand that the probability of a chance event is a number between 0 and 1 that expresses the
likelihood of the event occurring. Larger numbers indicate greater likelihood. A probability near 0 indicates an
unlikely event, a probability around 1/2 indicates an event that is neither unlikely nor likely, and a probability
near 1 indicates a likely event.
7.SP.6 Approximate the probability of a chance event by collecting data on the chance process that produces
it and observing its long-run relative frequency, and predict the approximate relative frequency given the
probability. For example, when rolling a number cube 600 times, predict that a 3 or 6 would be rolled roughly
200 times, but probably not exactly 200 times.
7.SP.7 Develop a probability model and use it to find probabilities of events. Compare probabilities from a model
to observed frequencies; if the agreement is not good, explain possible sources of the discrepancy.
7.SP.7a Develop a uniform probability model by assigning equal probability to all outcomes, and use the model
to determine probabilities of events. For example, if a student is selected at random from a class, find the
probability that Jane will be selected and the probability that a girl will be selected.
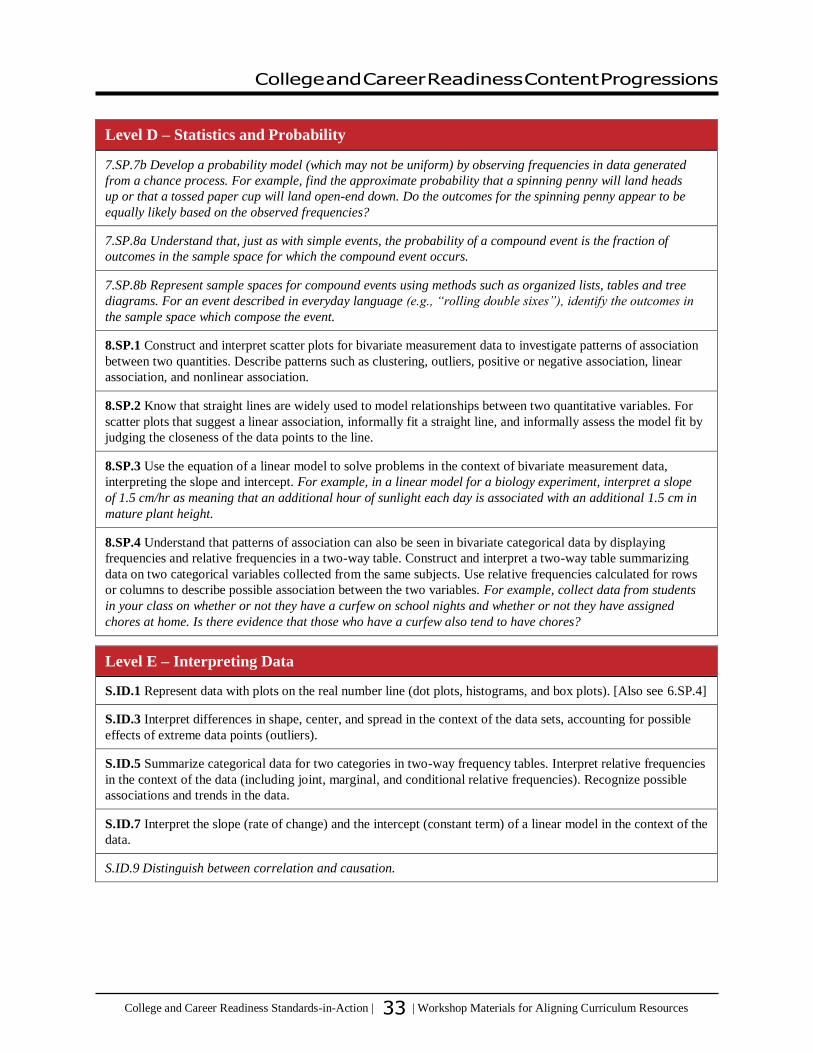
College and Career Readiness Content Progressions
33 College and Career Readiness Standards-in-Action | | Workshop Materials for Aligning Curriculum Resources
Level D – Statistics and Probability
7.SP.7b Develop a probability model (which may not be uniform) by observing frequencies in data generated
from a chance process. For example, find the approximate probability that a spinning penny will land heads
up or that a tossed paper cup will land open-end down. Do the outcomes for the spinning penny appear to be
equally likely based on the observed frequencies?
7.SP.8a Understand that, just as with simple events, the probability of a compound event is the fraction of
outcomes in the sample space for which the compound event occurs.
7.SP.8b Represent sample spaces for compound events using methods such as organized lists, tables and tree
diagrams. For an event described in everyday language (e.g., “rolling double sixes”), identify the outcomes in
the sample space which compose the event.
8.SP.1 Construct and interpret scatter plots for bivariate measurement data to investigate patterns of association
between two quantities. Describe patterns such as clustering, outliers, positive or negative association, linear
association, and nonlinear association.
8.SP.2 Know that straight lines are widely used to model relationships between two quantitative variables. For
scatter plots that suggest a linear association, informally fit a straight line, and informally assess the model fit by
judging the closeness of the data points to the line.
8.SP.3 Use the equation of a linear model to solve problems in the context of bivariate measurement data,
interpreting the slope and intercept. For example, in a linear model for a biology experiment, interpret a slope
of 1.5 cm/hr as meaning that an additional hour of sunlight each day is associated with an additional 1.5 cm in
mature plant height.
8.SP.4 Understand that patterns of association can also be seen in bivariate categorical data by displaying
frequencies and relative frequencies in a two-way table. Construct and interpret a two-way table summarizing
data on two categorical variables collected from the same subjects. Use relative frequencies calculated for rows
or columns to describe possible association between the two variables. For example, collect data from students
in your class on whether or not they have a curfew on school nights and whether or not they have assigned
chores at home. Is there evidence that those who have a curfew also tend to have chores?
Level E – Interpreting Data
S.ID.1 Represent data with plots on the real number line (dot plots, histograms, and box plots). [Also see 6.SP.4]
S.ID.3 Interpret differences in shape, center, and spread in the context of the data sets, accounting for possible
effects of extreme data points (outliers).
S.ID.5 Summarize categorical data for two categories in two-way frequency tables. Interpret relative frequencies
in the context of the data (including joint, marginal, and conditional relative frequencies). Recognize possible
associations and trends in the data.
S.ID.7 Interpret the slope (rate of change) and the intercept (constant term) of a linear model in the context of the
data.
S.ID.9 Distinguish between correlation and causation.
34 College and Career Readiness Standards-in-Action | | Workshop Materials for Aligning Curriculum Resources
Standards for Mathematical Practice
Standards for Mathematical Practice
The Standards for Mathematical Practice (the Practices) describe habits of mind that mathematics
educators at all levels of learning should seek to develop in their students.1 They rest on “processes
and proficiencies” with established significance in mathematics education, including such skills
as complex problem solving, reasoning and proof, modeling, precise communication, and making
connections. The Practices define ways students are to engage with the subject matter as they grow
in mathematical maturity and expertise across levels. Use this resource to search for evidence of the
Practices in your lessons. It will also be helpful as you work to add the Practices to lessons you are
creating or revising.
1. Make sense of problems and persevere in solving them.
Mathematically proficient students start by explaining to themselves the meaning of a problem and
looking for entry points to its solution. They analyze givens, constraints, relationships, and goals.
They make conjectures about the form and meaning of the solution and plan a solution pathway
rather than simply jumping into a solution attempt. They consider analogous problems, and try
special cases and simpler forms of the original problem in order to gain insight into its solution. They
monitor and evaluate their progress and change course if necessary. Students might, depending on
the context of the problem, transform algebraic expressions or change the viewing window on their
graphing calculator to get the information they need. Mathematically proficient students can explain
correspondences between equations, verbal descriptions, tables, and graphs or draw diagrams of
important features and relationships, graph data, and search for regularity or trends. Less experienced
students might rely on using concrete objects or pictures to help conceptualize and solve a problem.
Mathematically proficient students check their answers to problems using a different method, and
they continually ask themselves, “Does this make sense?” They can understand the approaches of
others to solving complex problems and identify correspondences between different approaches.
2. Reason abstractly and quantitatively.
Mathematically proficient students make sense of quantities and their relationships in problem
situations. They bring two complementary abilities to bear on problems involving quantitative
relationships: the ability to decontextualize—to abstract a given situation and represent it
symbolically and manipulate the representing symbols as if they have a life of their own, without
necessarily attending to their referents—and the ability to contextualize, to pause as needed
during the manipulation process in order to probe into the referents for the symbols involved.
Quantitative reasoning entails habits of creating a coherent representation of the problem at
hand; considering the units involved; attending to the meaning of quantities, not just how to
compute them; and knowing and flexibly using different properties of operations and objects.
1 Pimentel, S. (2013). College and career readiness standards for adult education. Berkeley, CA: MPR Associates, Inc. http://
lincs.ed.gov/publications/pdf/CCRStandardsAdultEd.pdf
35 College and Career Readiness Standards-in-Action | | Workshop Materials for Aligning Curriculum Resources
Standards for Mathematical Practice
3. Construct viable arguments and critique the reasoning of others.
Mathematically proficient students understand and use stated assumptions, definitions, and
previously established results in constructing arguments. They make conjectures and build a
logical progression of statements to explore the truth of their conjectures. They are able to analyze
situations by breaking them into cases, and can recognize and use counterexamples. They justify
their conclusions, communicate them to others, and respond to the arguments of others. They reason
inductively about data, making plausible arguments that take into account the context from which
the data arose. Mathematically proficient students are also able to compare the effectiveness of two
plausible arguments, distinguish correct logic or reasoning from that which is flawed, and—if there
is a flaw in an argument—explain what it is. Less experienced students can construct arguments
using concrete referents such as objects, drawings, diagrams, and actions. Such arguments can make
sense and be correct, even though they are not generalized or made formal until later. Later, students
learn to determine domains to which an argument applies. Students at all levels can listen or read the
arguments of others, decide whether they make sense, and ask useful questions to clarify or improve
the arguments.
4. Model with mathematics.
Mathematically proficient students can apply the mathematics they know to solve problems arising
in everyday life, society, and the workplace. This might be as simple as writing an addition equation
to describe a situation. A student might apply proportional reasoning to plan a school event or
analyze a problem in the community. A student might use geometry to solve a design problem or use
a function to describe how one quantity of interest depends on another. Mathematically proficient
students who can apply what they know are comfortable making assumptions and approximations
to simplify a complicated situation, realizing that these may need revision later. They are able to
identify important quantities in a practical situation and map their relationships using such tools as
diagrams, two-way tables, graphs, flowcharts and formulas. They can analyze those relationships
mathematically to draw conclusions. They routinely interpret their mathematical results in the
context of the situation and reflect on whether the results make sense, possibly improving the model
if it has not served its purpose.
5. Use appropriate tools strategically.
Mathematically proficient students consider the available tools when solving a mathematical
problem. These tools might include pencil and paper, concrete models, a ruler, a protractor, a
calculator, a spreadsheet, a computer algebra system, a statistical package, or dynamic geometry
software. Proficient students are sufficiently familiar with tools appropriate for their course to make
sound decisions about when each of these tools might be helpful, recognizing both the insight to
be gained and their limitations. For example, mathematically proficient students analyze graphs
of functions and solutions generated using a graphing calculator. They detect possible errors by
strategically using estimation and other mathematical knowledge. When making mathematical
models, they know that technology can enable them to visualize the results of varying assumptions,

36 College and Career Readiness Standards-in-Action | | Workshop Materials for Aligning Curriculum Resources
Standards for Mathematical Practice
explore consequences, and compare predictions with data. Mathematically proficient students at
various levels are able to identify relevant external mathematical resources, such as digital content
located on a website, and use them to pose or solve problems. They are able to use technological
tools to explore and deepen their understanding of concepts.
6. Attend to precision.
Mathematically proficient students try to communicate precisely to others. They try to use clear
definitions in discussion with others and in their own reasoning. They state the meaning of the
symbols they choose, including using the equal sign consistently and appropriately. They are careful
about specifying units of measure, and labeling axes to clarify the correspondence with quantities
in a problem. They calculate accurately and efficiently, express numerical answers with a degree of
precision appropriate for the problem context. Less experienced students give carefully formulated
explanations to each other. By the time they reach adult secondary education, they have learned to
examine claims and make explicit use of definitions.
7. Look for and make use of structure.
Mathematically proficient students look closely to discern a pattern or structure. Students, for
example, might notice that three and seven more is the same amount as seven and three more, or
they may sort a collection of shapes according to how many sides the shapes have. Later, students
will see 7 × 8 equals the well-remembered 7 × 5 + 7 × 3, in preparation for learning about the
distributive property. In the expression x2+ 9x + 14, students can see the 14 as 2 × 7 and the 9 as 2 +
7. They recognize the significance of an existing line in a geometric figure and can use the strategy
of drawing an auxiliary line for solving problems. They also can step back for an overview and
shift perspective. They can see complicated things, such as some algebraic expressions, as single
objects or as being composed of several objects. For example, they can see 5 – 3(x – y)2 as 5 minus
a positive number times a square and use that to realize that its value cannot be more than 5 for any
real numbers x and y.
8. Look for and express regularity in repeated reasoning.
Mathematically proficient students notice if calculations are repeated, and look both for general
methods and for shortcuts. Early on, students might notice when dividing 25 by 11 that they are
repeating the same calculations over and over again, and conclude they have a repeating decimal.
By paying attention to the calculation of slope as they repeatedly check whether points are on the
line through (1, 2) with slope 3, students might abstract the equation (y – 2)/(x – 1) = 3. Noticing
the regularity in the way terms cancel when expanding (x–1)(x+1), (x–1)(x2+x+1), and (x–1)(x3
+x2+x+1) might lead them to the general formula for the sum of a geometric series. As they work
to solve a problem, mathematically proficient students maintain oversight of the process, while
attending to the details. They continually evaluate the reasonableness of their intermediate results.