Collective Bargaining and Unemployment during … Bargaining and Unemployment during the Great...
34
Collective Bargaining and Unemployment during the Great Recession: Evidence for Spain Luis Dez CatalÆn y University of Minnesota Ernesto Villanueva z Banco de Espaæa February 15th, 2014 Abstract We study the consequences of (widespread) downward wage rigidity in Spain on job losses during 2009 and 2010, a period with a severe drop in activity. We measure wage rigidity using the fact that sector-level collective agreements in Spain are automatically extended to all rms in the province industry unit, setting wage oors that are downwardly rigid during the period of the agree- ment. Using the exact dates of bargaining periods, we nd that agreements bargained after the fall of Lehman Brothers in September 15th 2008 adjusted to the large aggregate employment losses by agreeing on wage growth below 2%, while agreements signed earlier settled increases of about 3.5%. We match information on collective agreements with longitudinal Social Security records of employees and document that, relative to comparable workers covered by contracts signed later in 2009, workers whose wages were close to the collective agreement oor and who were covered by collective contracts signed prior to September 15th 2008 (a) experienced about 2 pp higher wage growth (b) were between 2 and 4pp more likely to lose their job. The estimates suggest an elasticity of labor demand of about -1 and are consistent with the notion that downward nominal wage rigidity has real e/ects during a recession. JEL Codes: J23 - Labor Demand J50 -Collective Bargaining. We thank Samuel Bentolila, Stephane Bonhomme, Dan Hamermesh, Laura Hospido, Juan Fran- cisco Jimeno, Marcel Jansen and Claudio Michelacci for helpful comments. We also thank the comments of participants at the Society of Labor Economists in Boston 2013 and the ECB-CEPR Workshop on Labor Economics. All views and opinions are our own. y [email protected] z [email protected] 1
Transcript of Collective Bargaining and Unemployment during … Bargaining and Unemployment during the Great...

Collective Bargaining and Unemploymentduring the Great Recession:
Evidence for Spain ∗
Luis Díez Catalán†
University of Minnesota
Ernesto Villanueva ‡
Banco de España
February 15th, 2014
AbstractWe study the consequences of (widespread) downward wage rigidity in Spain
on job losses during 2009 and 2010, a period with a severe drop in activity. Wemeasure wage rigidity using the fact that sector-level collective agreements inSpain are automatically extended to all firms in the province industry unit,setting wage floors that are downwardly rigid during the period of the agree-ment. Using the exact dates of bargaining periods, we find that agreementsbargained after the fall of Lehman Brothers in September 15th 2008 adjustedto the large aggregate employment losses by agreeing on wage growth below2%, while agreements signed earlier settled increases of about 3.5%. We matchinformation on collective agreements with longitudinal Social Security recordsof employees and document that, relative to comparable workers covered bycontracts signed later in 2009, workers whose wages were close to the collectiveagreement floor and who were covered by collective contracts signed prior toSeptember 15th 2008 (a) experienced about 2 pp higher wage growth (b) werebetween 2 and 4pp more likely to lose their job. The estimates suggest anelasticity of labor demand of about -1 and are consistent with the notion thatdownward nominal wage rigidity has real effects during a recession.JEL Codes: J23 - Labor Demand J50 -Collective Bargaining.
∗We thank Samuel Bentolila, Stephane Bonhomme, Dan Hamermesh, Laura Hospido, Juan Fran-cisco Jimeno, Marcel Jansen and Claudio Michelacci for helpful comments. We also thank thecomments of participants at the Society of Labor Economists in Boston 2013 and the ECB-CEPRWorkshop on Labor Economics. All views and opinions are our own.†[email protected]‡[email protected]
1

1 Introduction
A large macroeconomic literature has long emphasized that downward nominal wage
rigidity amplifies the impact of negative aggregate shocks by preventing the wage
adjustments that could prevent employment losses. In particular, there are two main
forms of downward wage rigidity stressed in the literature. The first is based on
the low incidence of nominal wage cuts using individual level data —see Altonji and
Devereux (2000), Dickens et al (2006) or Bewley (1999). The second form of wage
rigidity is due to the fact that collective contracts signed under different macro-
economic conditions coexist in the labor market, generating wage dispersion that
amplifies aggregate shocks -see Card (1990) and Olivei and Tenreyro (2007, 2010).
We use matched data on collective agreements and Social Security records to test
whether contract staggering around the large macroeconomic shock that followed the
fall of Lehman Brothers generated employment losses in Spain during the 2009-2010
period.1
The impact of a nominal macroeconomic shock on employment and activity de-
pends on how quickly wages adjust. Flexible wages will immediately incorporate
the shock thus the level of employment unchanged. However, if nominal wages are
rigid, a shock will change the real wage (through the level of prices) altering the level
of employment in the economy. In this context, Card (1990) shows that inflation
does affect employment levels through imperfect wage adjustment. In particular, he
exploits differences in the timing of wage settlements in the presence of inflation to
identify the impact of wage rigidity in the data. Olivei and Tenreyro (2007, 2010)
illustrates the relevance of wage rigidity on employment fluctuations using macro
data. They show that nominal shocks in the US have a lower real effects in January,
when wages in collective agreements are typically bargained, than in other periods.
Our study is built on insights from that macro literature and on the nature of
collective bargaining in Spain. Collective agreements at the industry-province level in
Spain are automatically extended to all firms in the province-industry cell, regardless
of the degree of unionization. Automatic extension of province-industry agreement
1The 2009q4 the employment level in Spain was 11% lower than the 2007 peak, according to theSpanish Employment Survey. During the same period, the US economy lost 6% of the existing jobsin 2007.
2

effectively means that working conditions and, in particular, wage floors are com-
pulsory for all employers typically for periods longer than one year. Furthermore,
the high degree of decentralization implies that at every moment in time, different
bargaining units vary widely in their ability to adjust wages to an negative aggregate
shock -in particular, the one we use is the drop in activity that followed the fall of
Lehman Brothers in September 15th. In sum, the structure of collective bargaining
in Spain means that at a time of heavy employment drops, wages in already settled
contracts were unable to adjust downward, possibly leading firms to lay-off workers.
At the same time, contracts that were bargained at the time of the beginning of
the crisis have the possibility of mitigating nominal wage growth, possibly softening
unit labor costs and employment drops. In sum, automatic extension and the inabil-
ity of firms to opt out implies substantial cross-sectional variation in the degree of
(contract-induced) wage rigidity at the time of the shock. Such variation provides an
unique opportunity to estimate the role of downward wage rigidity on employment
destruction during a period of aggregate demand drops.
We use a very rich dataset with detailed information about all the collective
agreements signed in Spain. That dataset contains information about the agreed
wage increase and on the date of signature, giving us the opportunity to know at
each point in time what information the bargaining parties could possibly incorporate
into the agreements. We then match that Census of Collective Contracts with Social
Security records to analyze the effects on employment of downward wage rigidity
caused by automatic extension of collective contracts.
We first document that wages settled for 2009 in agreements signed after the fall
of Lehman Brothers displayed substantially lower wage growth than wage settlements
for the same period signed between 5 and 1 quarters before September 15th 2008.
That is, there is substantial cross-sectional variation in wage growth in 2009 that
depended only on the date of signature of the contract. We then estimate models of
the probability of job loss between 2009 and 2010 as a function of how close wages
were to the collective agreement floors in 2008, the date of signature of the contract
and province x 3-digit industry fixed effects. We find that, relative to comparable
workers covered by contracts signed later in 2009, workers whose wage were close
to the collective agreement floor and covered by collective contracts signed prior
to September 15th 2008 (a) experienced about 2 pp higher wage growth (b) were
3

between 2 and 4pp more likely to lose their job. Importantly, we find no differential
wage or employment responses by signature date among workers who are not bound
by the agreement —i.e. workers whose wages are distant from the collective agreement
floor. Those results suggest that wage rigidity created by the automatic extension
of provincial agreements and multi-period bargaining had a substantial effect on the
employment destruction during the 2008-2009 recession in Spain. The results are
robust to the inclusion of workers covariates and still hold when we control for firm
- skill specific fixed effects.
Our results contribute to two literatures. Firstly, while the effect of collective
bargaining on wages, and other important variables such as productivity, profits or
the number of hours worked is well documented studies on the impact on employment
are less numerous (see the summary in Cahuc and Zylberberg, 2004). For example,
Boal and Pencavel (1994) in a framework different from that in our study, document
that while unionized workers receive a wage premium, there is not an impact of
unions on employment level. Another literature has used legal reforms to union
power, arguably exogenous, to study the impact of unionization on transitions to and
from unemployment. Blanchflower and Freeman (1994) document that the fall in the
bargaining power of unions after the reforms introduced by Thatcher in the UK did
not lead to a drop in unemployment or the probability of exiting from unemployment.
Rather than studying long-run impacts of collective bargaining, our study focuses on
the role of wage setting in collective in generating employment losses following a
shock
Yet another literature has estimated the degree of wage rigidity in different sectors
of the economy, and then related the estimated degree of rigidity to unemployment
levels —see Barwell and Schweitzer (2007) for the UK or de Vicienti et al (2007) for
Italy. Our method has the advantage of not requiring an inference about downward
rigidity from longitudinal wage data -a daunting task in the presence of measurement
error- as wage rigidity is built in the collective bargaining framework. Hence, we can
focus on studying propagation mechanisms. Furthermore, we can study wage rigidity
within-industry and within-province, rather than across industries or regions -always
subject to the criticism that sectors or regions vary along other relevant dimensions
that also affect employment levels
The rest of the paper is organized as follows. Section 2 describes the institutional
4

background. Section 3 presents some background for modelling. Section 4 discusses
the data and Section 5 presents the results.
2 Institutional Background
The Spanish labor market is believed to be very rigid in comparison to international
standards and one possible source of rigidity is the extent and characteristics of
collective bargaining (Bentolila and Dolado, 1994, Bentolila, Izquierdo and Jimeno,
2012). Collective agreements are negotiated between the representatives of employers
and workers that can show "suffi cient representativeness" in the sector. The agree-
ments reached in the process are public and legally binding for all workers within the
scope of the agreement -independently of whether workers are union members or not.
Thus, despite a relatively low rate of union membership (15% or less), the coverage of
collective bargaining in Spain is very high (80%, according to the Ministry of Labor).
Collective contracts in Spain take place at multiple levels. There are basically two
main types: firm level and sectorial agreements. The former include the ones which
only affect the workers in a particular firm. The others are bargained at a given
geographical or industry level (either national, regional or provincial) and affect all
the workers in the given unit which are not covered by a firm agreement (Card and De
la Rica, 2006). That is, these are automatically extended to firms in the scope of the
agreement regardless of the degree of unionization of the particular firm. The majority
of workers are covered by sectorial agreements, particularly, under provincial ones.
That level of bargaining represents an intermediate degree of centralization between
national - and firm - level agreements (Izquierdo, Moral and Urtasun, 2003). The
analysis below focuses on provincial agreements for several reasons. Firstly, more
than 50% of the workers covered by collective bargaining are covered by a provincial
agreement. Secondly, it is typically argued in theoretical models that the intermediate
level of bargaining is suboptimal: national level agreements internalize the impact of
wage growth, while firm level agreements are most responsive to particular conditions
of the worker and firm (see Calmforms and Driffi ll, 1988 or Jimeno and Thomas,
2012). In addition, the last two labor reforms in Spain have tried to weaken the
automatic extension of provincial agreements.
Therefore, unless a worker is covered by a (more generous) firm-specific agreement,
5

provincial collective agreements establish a (de facto) minimum wage level for 10 skill
levels within a particular province and industry. The minimum is compulsory for a
whole year -basically all agreements run from December to December and, in the case
of multi-year agreements, they specify the wage growth level for subsequent years.
See Appendix A.1. for an example of the construction industry in Navarre. That
agreement sets 11 minimum wages for each skill level in the industry. Note that this
is a legally binding lower floor that does not depend on the particular situation of
the firm. Moreover, it is very diffi cult for firms to opt out of the collective agreement2.
The degree of wage rigidity caused by the automatic extension is exacerbated by
the fact that collective agreements are typically set for more than one year. Such
practice may influence the degree of nominal inertia of the economy, in the sense
that if the longer the duration of the agreements the less likely wages are to respond
to changes in demand and, therefore, the variable most significantly affected will be
unemployment (Layard, 1991).
We illustrate how binding collective agreements are in Figures A.2. and A.3.
We provide details about the samples below, but note now that those Figures show
histograms of monthly wages in December 2008 in Social Security records for spe-
cific industries, provinces and skill groups, together with the corresponding statutory
minimum. Figure A.2. documents the extent to which those wages vary with skill
in the construction industry. Clearly, there is concentration of wages around the
collective agreement minima for the lowest skill levels -laborers and foremen- while
such concentration is basically absent for college graduates. Figure A.3. shows his-
tograms of monthly wages in December 2008 for waiters in Food and Accommodation
across provinces. As a result of province-level bargaining, the statutory minima vary
markedly across provinces -as an example, note the concentration of monthly wages
close the collective minimum of 1400 euros in Barcelona while most wages in Madrid
-with a much lower minimum of 800- are below 1400 euros. A similar comparison
can be made between Granada with extremely high concentration around a very high
2The 2010 labor reform attempted to facilitate the process, causing an upheaval among unions.The alleged reason was that attempts to limit automatic extension would erode worker’s bargainingpower. Another reform in 2012 -outside our sample period- has facilitated the conditions underwhich a firm could temporarily deviate from a province level agreement.
6

minimum wage in the collective agreement, and the more dispersed distribution of
monthly wages in Valencia -with lower statutory minima.
2.1 Modelling background
Consider a simple Cobb-Douglas production function F (K,L) = Y = ALαK1−α.where
Y is output, A is technology, K is capital (assumed to be fixed) and L is labor. For
simplicity we consider the problem of a firm that takes the wage in the settlement as
given but that can choose the desired demand for labor as follows
dY/dL = αA(K/L)1−α = ω/P
ω is the nominal wage set in the agreement and P represents the level of prices,
assumed to be fixed. Imagine that there is a negative shock that decreases A. Given
our set up, there can be two possible scenarios:
I) The nominal wage, ω, is fixed and cannot respond to the aggregate shock. The
firm can only react to the shock by a drop in its labor demand, L
II) The nominal wage set in the collective agreement reacts to the aggregate shock3. In such case the drop in labor demand would be smaller than in case I.
If data on nominal wages were available, the evolution of labor could be written
as
∆L = γ0 + γ1∆ω + a+ y + ∆ε (1)
The linearized equation shows that cross-sectional variation in nominal wage
growth -as resulting from collective agreements that do or do not adjust to the ag-
gregate shock- will affect firm-level demand of labor through the slope of the demand
equation γ1. a and y are proxies for the growth of real values of A and Y . However,
there are problems in recovering the parameter γ1 from the data. Firstly, changes in
minimum statutory wages in collective agreements affect only the wages of workers
whose wage is close to the agreement floor. Those workers can only be identified us-
ing joint information on statutory minimum wages and actual wage levels. Secondly,
∆ω and ∆L are likely to be driven by unobservable demand changes, so even if we
3We assume that there are some nominal rigidities and the wage is not fully flexible, otherwisethe whole adjustment would happen through prices
7

identified the set of workers whose wage is is close to the collective agreement floor,
the variation in ∆ω and ∆L may be associated to outward or inward movements of
labor demand curves, rather than to movements along the demand curve.
Hence, we isolate the variation on the agreed wage increase ∆ω that is exclusively
due to the timing of the signature of the collective contract around a large aggregate
shock. The fall of Lehman Brothers on September 15th 2008 came to most economies
as a substantial unexpected shock that generated uncertainty throughout the world.
Under the assumption that the date of signature of a collective agreement reflects
the information set about macroeconomic conditions by bargaining parties, that large
aggregate shock could only be reflected in nominal wages bargained after September
15th 2008. However, collective agreements already signed for the years 2009 and
2010 could not adjust downward their settled wage growth -as mentioned above,
the process of opting out of a collective agreement is very costly in Spain. The
diffi culty in renegotiating contracts ex-post, coupled with the typically long durations
of collective contracts, generates a large fraction of workers whose wage growth for
2009 and 2010 reflects macroeconomic conditions very different from those in a large
recession. Under the assumption of a downward sloping labor demand, job losses in
firms covered by agreements already fixed at the time of the shock must be higher
than in firms whose contract was signed after the shock. In sum, contract staggering
due to different signature dates generates cross-sectional variation in ∆ω in 2009 and
2010. We use that variation to identify the link between the existence of rigid nominal
wages and employment losses.
The key identifying assumption is that, conditional on having a suitable proxy for
A and Y , the date of signature does not reveal systematic information about the em-
ployers’performance. We control for such possible differences by fully controlling for
unrestricted province x industry dummies. As we discuss below, γ1 is then identified
by comparing the chances of job loss of workers with wages close to the statutory
minimum across those collective contracts signed before and after the aggregate de-
mand shock that followed the fall of Lehman Brothers on September 15th 2008. If
those differential chances in job loss are larger among workers with wages close to the
statutory minimum than among workers further away from the collective agreement
minimum, we infer that downward nominal wage rigidity due to contract staggering
causes to job losses.
8

3 Data
We use two datasets: the Registro de Convenios y Acuerdos Colectivos (Census of
Collective Agreements) and the Muestra Continua de Vidas Laborales 2010 - MCVL
(Continuous Sample of Working Histories, CSWH 2010). All collective agreements
signed in Spain are to be registered in the Ministry of Labor -hence forming the
Registry- and the digitalized dataset contains detailed information about the agreed
wage increase (the wage that the union and the employers agreed ex-ante, before any
ex-post correction due to inflation), the 2-digit industry, an unions’ estimation of
the number of workers covered by the agreement, the type of agreement (sectorial or
firm level) as well as requirements in terms of hours and vacation time. Particularly
important for the purpose of the study, the dataset contains information on the day
in which the agreement was signed and bargaining ended. Then, it is possible to use
the exact day when the contract was arranged to establish what information could
possibly be incorporated in the agreement. The Census contains limited information
about the level of the wage set in the agreement for each skill level.
On the other hand, The Continuous Sample of Working Histories is a micro-level
dataset built upon Spanish Social Security records. It contains electronically recorded
information for approximately 1.1 million individuals who at any time during 2010
had an active record with the Spanish Social Security system. The CSWH also has
a longitudinal design so between 2005 to 2010, an individual who is present in a
wave and subsequently remains registered with the Social Security administration
stays as a sample member. In addition, we refreshed the sample with workers present
in the 2005-2009 waves so it remains representative of the population during the
period of analysis -2008-2010 (see Bonhomme and Hospido, 2012). The registry
contains information on the full labor market history of workers -wages, days worked
per month, an identifier of the establishment it worked -actually, of a randomized
indicator of the establishment Social Security Account- together with information on
the industry at the three digit levels
The CSWH contains some information that permits constructing the skill level
of a worker. Namely, each worker in Spain is assigned a skill level (from a table
of 11 levels). The first two levels are reserved in principle to workers with college.
The following levels 3-9 are defined by hierarchy at the job, while the latter two
9

groups correspond to laborers, unskilled workers. Importantly, the classification of
skill groups in the Social Security records is the same as in the Census of Collective
Agreements.
Sample 1: Matched Social Security records-Collective Agreements
To assess how the rigidity created by the automatic extension of the provincial
collective agreements affects the probability of losing the job during the recession, we
merged both datasets. The matching has been done using information on the 3-digit
industry of economic activity and information on the province where the individual
was working. We have assigned a collective agreement to each of the 3 digit industry-
province cell in the Social Security records using information on the 2-digit industry
in the Census of Collective Agreements and then assigned a 3-digit industry code
based on the text of the agreement -that must specify the exact industries covered.
As explained above, we use provincial collective agreements only, assuming that those
agreements are the ones binding for each of the individuals in a given cell industry-
province.4
We consider only province level agreements and use neither national or region-level
agreements. Province level agreements cover around 50% of the labor force in Spain,
while national and region-level agreements cover around 35% of workers -see Ben-
tolila, Izquierdo and Jimeno, 2012..Nation-level agreements include FIRE (financial,
Insurance and Real Estate), while other regional and national agreements are most
common in manufacturing business services and other services. We do not consider
firm level contracts either - which cover around 11% of the workers and most prevalent
in the energy, extractive and transport industries, see Izquierdo, Moral and Urtasun,
2003. We note that those omissions are not likely to bias the analysis or introduce
error. Firstly, due to the particular way agreements are bargained, provincial agree-
ments typically improve the working conditions of nation- or region-level settlements.
In that sense, province-level agreements would be the most relevant ones. Secondly,
firm- or establishment level agreements cannot undercut the labor conditions set on
a concurrent province-industry agreement. Hence, province-industry agreements still
set the effective binding minima in those cases.
On the other hand, the focus on provincial agreements presents the advantage of
4In some cases when there are several provincial agreements in a given industry, we have assignedto all the individuals in that particular cell the agreement that covered a highest number of workers.
10

providing substantial variation in minimum wages -see Figure A.3 and in signature
dates within industries and provinces.5 The focus on province-industry agreements
also implies that much of the results we exploit is driven by smaller firms, that cannot
afford to have their own agreement.
Sample 2: Sample with information on wage levels.
Wage levels are not available in the collective contracts dataset for the period
considered (2008-2010). However, for the period spanning 1994-2001, the basic wage
level by skill level was available for some contracts. Using the revised agreed wage
growth (the ex-post agreed wage increase corrected by inflation) from 2002 to 2008 we
have computed the collective wage levels in 551 out of the 1771 agreements that were
binding as of 2008. In all cases, the wage level is available for groups of the Spanish
Social Security System: 1, 2, 3 (High Skilled), 4, 5, 6 (Medium Skilled) and 10 (Low
Skilled) (see Lacuesta, Puente and Villanueva, 2012). We use that dataset for most
of the analysis that follows. The reason is that, as discussed above, to analyze the
role of wage rigidities in amplifying aggregate shocks one needs to take into account
how binding collective agreements are and for what groups. The characteristics of
the resulting sample are presented in Table 2. Figures A.2 and A.3 are based on this
subsample, and illustrate how statutory minima affect the distribution of monthly
wages.
3.0.1 Sample selection criteria, common to both samples
We use the following selection criteria:
Signature dates We use collective agreements with economic effect in 2009 and
that were signed between October 1st, 2007 and December 31st 2010, so that we
encompass a 5 quarters of dates of signature before the fall of Lehman Brothers and
have at least 5 quarters of dates signature afterwards. We want to have enough
quarters before September 15th 2009 to be able to detect possible trends in wage
setting in advance of that date. We also exclude agreements that had not been
signed by the end of 2010 -albeit those were a very limited number of agreements.
Seniority at the firm: We also require that all workers in the sample are present at
the firm at the time the first collective agreement for 2009 in our sample was signed,
5While there are 52 provinces in Spain, there are only 17 regions. Not all the regions have theirown agreement
11

so all of them have accumulated some tenure on the job at the time when heavy
employment losses occurred. In addition the outcome "being hired by an employer
in an industry i at time t” may be affected by the agreed wage increase signed before
moment t.
These two restrictions prevent us from analyzing agreements signed early on. For
example, studying the impact of a wage increase in the first quarter of 2007 would
require to analyze workers who were already working in late 2006. With a third of
the working force being hired with fixed-term contracts, such selection would bias
the sample toward stable workers.
Age We examine cohorts of males and females born between 1950 and 1991 who
have been employed during 2008 (at least 1 year). We make no selections regarding
gender, to maximize sample size, but control for that variable in our specifications.
3.0.2 Summary statistics
The resulting matched sample of collective agreements and Social Security records
contains 93,960 observations, and each individual contributes one observation. 12.5%
of workers in the sample are high-skilled (meaning that belong to the groups 1, 2 or
3 of the Spanish Social Security System), 19% are medium skilled (meaning that
belong to the groups 3, 4, 5 or 6) and 68 % is low skilled (meaning that belong to the
groups 7, 8, 9, or 10). On the other hand, the vast majority of workers in the sample
(87%) is covered by an open-ended individual contract. The mean of the agreed wage
increase for the collective contracts signed in 2008 with economic effect in 2009 is 350
basis points. However, the agreements signed after September 15th 2008 have a mean
of 150 bp. The difference suggests a substantial downward adjustment of wages after
September 15th
Table 1 provides summary statistics of the matched sample with collective agree-
ments and Social Security records. We mainly use this sample to detect changes in
wage setting behavior on a quarter by quarter basis. The sample overrepresents the
Food and Accommodation and Construction sectors.6 Examining the distribution
6We show below that the overrepresentation of construction is irrelevant for our results. Thereason is that employers and unions in the Construction sector is an unique one in that it sets wagegrowth at the national level, but other labor conditions at the province level. Hence, there is noeffective variation of wage growth across signature dates in provincial agreements.
12

of industries by quarter of signature of the collective contract, Table 1 documents
that agreements in construction, services to industries, health and accommodation
or single-year agreements were more likely to sign after September 15th 2008. We
condition on those variables in the analysis. Probably due to the overrepresenting of
construction in the collective contracts signed before September 15th 2008, workers
covered by those contracts are more likely to be low skilled. We note however, that
those differences disappear once we condition on province and industry dummies (see
the results in Column 4 of Table 1). Wage growth was substantially lower in wages
set after September 15th 2008.
The sample with matched wage levels in collective agreements is presented in
Table 2. That subsample contains about 45% of the cases in the sample containing
the Census of Collective Agreements.
4 Empirical strategy
We proceed in three steps. We firstly determine whether or not new aggregate in-
formation affects wage settlements in collective agreements. To that end we use the
matched sample of the Census of Collective Agreements and Social Security Records.
In a second step we investigate the behavior of actual wages.
4.1 Wage settlements in collective agreements around Sep-tember 15th 2008
A central element of our empirical strategy is to determine the timing of the shock
-i.e., the moment when unions and employers perceived a turning point in activity.
As mentioned above, we use September 15th, 2008 as the date of such turning point.
The fall of Lehman Brothers arguably caused a disruption in the working of financial
markets, and was possibly unanticipated by most agents in the economy. We first
examine of there was a disruption in collective bargaining in Spain as of September
15th, 2008 by analyzing wage settlements for 2009 in all the collective agreements by
signature date. The date when a collective agreement is signed reflects the informa-
tion set of all agents involved in the process, so sharp cross-province and industry
changes in wage growth by signature date is likely to reflect changes in the information
13

set of agents. That first specification is
log ∆wage2009ind,p = θind + πp +
J=11∑j=1
δj1(signind,p = q) + εind,p
θind is a (three-digit) industry fixed effect, πp is a province-specific fixed effect
and 1(signind,p = q) is an indicator variable that takes value 1 if the contract was
signed in that quarter. We include quarters between 2007q4 and 2010q2. We include
all collective contracts signed prior to September 15th 2008 as signed in 2008q3. We
do not include an indicator for contracts signed in 2007q4 -the reference period. The
regression is run on the Social Security Sample, effectively weighting the regression
by the industry and province shares in that source. Standard errors are clustered at
the province x 3-digit industry level.
4.2 Wage and employment effects by proximity to wage floors
We estimate the models of individual’s wage growth (as opposed to statutory wage
growth in collective agreements) as well as of the transition from employment to un-
employment as a function of the exact date when the collective provincial agreements
was signed. As shown in the descriptives of the full sample, wages vary as new in-
formation arrives and the date of signature matters. Therefore, workers in 2009 are
subject to a different wage settlements depending on whether their collective contract
was signed early in 2008 (when the full extent of employment destruction was hard
to predict) than in 2009 -when unions and firms could observe and bargain taking
into account national net employment losses of about 8%. The parameter of inter-
est can therefore be interpreted as the slope of a province-industry level "demand
curve": a higher bargained wage increase should increase the probability of becoming
unemployed in 2009.
In our setting, demand shocks affecting employment losses and wages are to be
expected. For example, the construction industry experienced a severe drop in 2008,
and that drop was likely to have propagated to industries that provide inputs for
the sector. In the presence of industry-specific demand shocks, an OLS specification
linking transitions into unemployment to observed wage increases would be biased.
Hence, we use variation in the date when the contract was signed, interacted with
14

the distance to the minimum wage floor. We fit the following model:
Yi,s,p = α0+α11(signed_2008s,p)∗f(Wi,2008−W s,p,2008)+f(Wi,2008−W s,p,2008)+θs,p+εi,s,p
(2)
Where Yi,s,p denotes the outcome of interest (either individual wage growth in
2009 or employment losses in that year, described below). 1(signed_2008s,p) is an
indicator function that takes value 1 if the collective contract was signed before
September 15th, 2008 and 0 otherwise. The function 1(signed_2008s,p) indicates
whether the wage increase settled for 2009 depends on the change of information set
of bargaining units after the Lehman Brothers. We document below that wage growth
was higher among collective contracts signed before the fall of Lehman Brothers.
f(Wi,2008 −W s,p,2008) is an indicator of the distance between the wage of the worker
in 2008m12 and the collective agreement floor. θs,p is a contract-specific fixed effect
(an interaction of province and 3-digit industry dummies) that absorbs any trend in
wages or employment destruction that affects all workers covered by the agreement.
Finally, Xsp collects individual characteristics such as type of contract (whether is
open-ended or fixed-term contract), age dummies, nine dummies denoting the skill
level (proxied by the group of the Spanish Social Security system).
In the first stage, the dependent variable is yearly wage growth between 2008m12
and 2009m12 -or ∆ log(Wi,2009m12). That specification allows us to verify if within the
set of workers whose wages were closest to their statutory minimum, those covered
by a contract signed in 2008 experienced systematically higher wage growth than
the rest. Introducing a flexible specification of f(Wi,2008 − W s,p,2008) we can also
examine if the impact is present all over the distribution of Wi,2008 −W s,p,2008 or if,
alternatively, the impact only happens close to the collective agreement wage floor.
As collective agreements only specify minimum wages at the industry-province level,
the increase in the agreement statutory minimum wage should mostly increase wage
growth of workers with wages close to that floor.
The second specification uses as the dependent variable an indicator of whether
the employee transited from employment into unemployment at some point in time
between 2009 and 2010. Namely, we use indicators of whether the workers experienced
at least 3 months of unemployment between 2009 and 2010 as well as an indicator
15

of the fraction of days not worked during the 2009-2010 period. That specification
is an Intention-To-Treat that checks whether workers whose wage was closest to
the statutory minimum and were covered by contracts signed before 2008m9 had
higher chances of transiting into non-employment than workers similarly close to
their agreement floor but whose contract was signed in 2009.
The coeffi cient of interest is α1. Given the discussion about the degree of an-
ticipation of the magnitude of employment destruction in the last quarter of 2008
and the first of 2009, we expect that α1 is positive in the first-stage -agreements
signed before the September 2008 should have settled higher wage increases than
those settled in the early months of 2009, and such wage increases are most relevant
for workers whose wage was already close to the statutory minimum in their province-
industry-skill group cell. Similarly, in the employment equation, workers covered by
agreements settled in 2008 and close to the statutory minimum should have a higher
chance of transiting into unemployment, as their employers would have experienced
larger wage costs.
Illustration of the empirical strategy
We illustrate the source of identification in Figure 3, that displays the histograms
of monthly wages of a specific skill group (waiters) in 2008m12 a particular industry -
Food and Accommodation- in two provinces (Valencia and Granada). The vertical line
at the left each graph denotes the statutory wage floor in the province-industry-skill
group. Employees and employers in Valencia signed their collective contract in 2007,
and agreed a 5% wage increase for 2009 -thus raising the wage floor for 2009 at the
second vertical line. That is, restaurants in Valencia employing workers with earnings
between both statutory wages must have a wage increase during 2009. Conversely,
the collective contract for Food and Accommodation in Granada expired in December
2008 and no agreement was reached until 2010 -thus leaving the set of 2008 wage floors
effectively unchanged for 2009. Unlike their counterparts in Valencia, employers in the
Food and Accommodation industry in Granada who employed waiters whose earnings
were close to the statutory minima had no obligation of increasing their wage bill.
Waiters in Valencia whose earnings in 2008m12 were below 1.05 times the statu-
tory minimum wage for 2008 (1100 euros) should have their wage increased during
the recession period. Under the assumption of a downward sloping labor demand,
those workers would have a higher chance of losing their job than workers similarly
16

close to the statutory minimum in Granada -where no wage increase was compulsory
for their employers.
Our identifying assumption is that changes in wages agreed in the second case
are due to more information about the amount of employment destruction during
the 2008-2009 crisis and do not reflect industry-province specific effects which are
correlated with the date of signature and affect workers differentially by how close
their statutory wage was from the . We also conduct robustness checks to support that
identification assumption by controlling for firm-skill group fixed effects -dummies
that control non-parametrically for any variable that varies at the firm level, like
managerial skills, access to credit or firm level shocks during the period.
5 Results
Figure 1 plots the estimated coeffi cients δ̂j, along with the standard errors -corrected
for heteroscedasticity and autocorrelation at the industry-province level. Wage set-
tlements effective in 2009 were very similar for all contracts signed in 2007q4 through
2008q3. However, contracts signed in 2008q4 settled a wage increase 50bp lower than
those settled a quarter before. Figure 1 also shows that contracts signed later in the
year included wage settlements that were progressively smaller. For example, wage
settlements for 2009 signed retrospectively in 2010q2 included wage growth 150bp
lower than those signed in 2008q3. In sum, the staggering of labor contracts caused
substantial variation of wage growth across industries and provinces in 2009, leaving
some workers covered by contracts that settled high wage increases reflecting the
situation in 2007q4 while other workers covered by contracts that settled substan-
tially lower wage increases for that same year. We exploit that source of exogenous
variation to examine the response of job loss to higher labor costs.7
7Note that the progressively lower wage growth in contracts signed later in 2009 and 2010 canreflect stickiness in the dissemination of information about the extent of the crisis, but can also bedue to strategic delays in contract settlements. For example, it could be the case that employersand employees found it optimal already in 2009 not to renew immediately because of macroeco-nomic uncertainty, postponing signature and effectively freezing nominal wage growth in statutoryminimum wage levels for 2009.
17

5.1 Individual wage growth responses
Table 3 shows estimates of Model 3 when the dependent variable is ∆ log(Wi,2009m12)
-wage growth computed at the individual level between 2008m12 and 2009m12. The
sample is restricted to workers who stay in their job for the whole year and who
worked full time both in December 2008 and in December 2009. The evidence from
Figure 1 suggests that wage growth in 2009 must have been higher among workers who
were covered by collective contracts signed before 2008m9 and, within that group,
among the set of workers who were close to the minimum wage.
In what follows, we specify f(Wi,2008 − W s,p,2008) as two dummies indicating if
the wage of the worker in 2008m12 was below 1.2 times the statutory minimum
in the province-industry-skill group cell or whether it is between 1.2 and 1.4 times
that minimum wage, the omitted group being workers whose initial wage was above
1.4 times the statutory minimum. Note also that 1(signed_2008s,p) is not identified,
because all our models include agreement-level fixed effects. However, the interaction
between 1(signed_2008s,p) and f(Wi,2008 −W s,p,2008) is identified.
The first column first row of Table 3 shows that the coeffi cient of 1(signed_2008s,p)∗1(1.2W s,p,2008 < Wi,2008 < 1.4W s,p,2008) is .018 (standard error: .0059). The esti-
mate implies that workers whose contract was signed before 2008q4 and their initial
wage was below 1.2 times the minimum wage experienced an increase in compen-
sation that was 180bp higher than similar workers covered by agreements signed
after 2008m9. Crucially, the wage growth of workers whose initial wage level was
far away from the statutory minimum depended not on whether or not the contract
was signed before or after 2008 (i.e., the interaction between 1(signed_2008s,p) and
1(Wi,2008 > 1.2W s,p,2008) is .0050 (standard error .0051). The second column of Table
3 shows that the estimate is basically unaltered once we control for additional covari-
ates, like female, five age dummies, an indicator for a fixed-term contract -in turn,
an indicator of dismissal costs- as well as the nine skill group dummies determining
the statutory wage minima.
5.2 Employment responses
Table 4 presents OLS regressions linking the probability of transiting from employ-
ment in 2008 to unemployment in 2009 to the date of signature. -interacted with
18

distance to the statutory minimum. For each specification, we present two measures
of transitions from employment to unemployment. The first is an indicator of job loss
during 2009, defined as the event "having three months or more of unemployment
during 2009 and 2010". Note that a layoff due to a high wage increase in 2009 could
have happened in any moment in 2009, so if layoffs happened late in 2009, we would
only observe the unemployment spell in 2010. In addition, we also use as a depen-
dent variable an indicator of the time elapsed in unemployment, measured as the
fraction of total days not worked during 2009 and 2010. While those outcomes mea-
sure the joint effect of job destruction and of subsequent job finding rates, they are
also unlikely to reflect churning in the labor market -such as job-to-job movements.
Columns (1-2) present estimates of Model (3) using as a dependent variable an
indicator of having spent in unemployment at least three months during the pe-
riod 2009-2010 -while initially employed. The standard errors are corrected for het-
eroskedasticity and arbitrary correlation at the collective contract level. The pattern
of the point estimates in the first and third row, first column of Table 4 suggests that
within the set of workers whose wage was less than 1.2 times the statutory minimum
in their collective contract, collective contract was signed before 2008q4 had a 2.7
higher percentage chance of transiting into unemployment (row 2 column 1 of Table
4). The estimate increases to a 3.3 higher chance if the wage in 2008 was below
1.1 times the statutory minimum wage -however the latter coeffi cient is imprecisely
estimated.
On the other hand, we find little evidence of a differential date of signature ef-
fect among workers with wages in 2008 far away from the compulsory minimum.
For example, for workers whose wages were above 1.2 times the collective agree-
ment minimum wage but below 1.4 times the estimate of 1(signed_2008s,p) and
1(1.2W s,p,2008 < Wi,2008 < 1.4W s,p,2008) is -.003 (standard error .014)
In the third column we use as the dependent variable the fraction of days spent
in non-employment. The results are similar to those in Columns 1 and 2, but much
more precise. Within the set of workers whose wage in 2008 were below 1.2 times the
statutory minimum wage, those whose collective contract was signed before 2008m9
spent 2.5 percent more time in unemployment during the sample period (standard
error: .9 percentage points) than workers whose contract was signed afterwards. We
fail to detect a statistically significant response for workers whose wage was only 1.1
19
times the statutory minimum
5.2.1 Firm level fixed effects
Firm performance during a recession may depend on its size, financial health or its
managerial skills, variables thus far omitted. The Continuous Sample of Working
Histories contains an identifier that permits identifying workers in the same estab-
lishment. Under the assumption that financial health or other characteristics affect
workers of the same skill group similarly, replacing the collective contract fixed effect
in Model 3 by firm-skill group fixed effect would absorb the impact of such confound-
ing factors. Namely, we run a model of the form:
Yi,s,p = β0+β11(signed_2008s,p)∗f(Wi,2008−W s,p,2008)+f(Wi,2008−W s,p,2008)+µf,g+εi,s,p
(3)
Where µf,g is a firm - skill group fixed effect. β1 is again identified by comparing
workers whose wage in 2008 was below 1.2 times the collective agreement industry-
level minimum wage but whose labor contract was signed before the fall of Lehman
Brothers. However, and unlike Model (3), in Model (4) β1 is identified by comparing
if those workers close to the minimum and whose collective contract was signed in
"good times" had higher chances of transiting into unemployment than the average
at the firm-skill group level. β1 is identified from the set of firms that employ multiple
workers in skill-group cells - a subsample of the one that identifies α1 in Model (3).
The estimates are shown in Table 5 and imply a higher 4.3 pp chance of transiting into
unemployment among workers whose wage was below 1.2 times the collective agree-
ment minimum and had whose wage increase was settled before the fall of Lehman
Brothers -relative to workers similarly close to the collective agreement minimum but
whose collective agreement was signed afterwards.
5.2.2 Impacts by industry
In Table 6 we examine differential effects by industry. The specification serves two
purposes. Firstly, there are sectors where there is provincial collective bargaining,
albeit in terms of wage growth it follows a national level agreement - for example,
construction. Hence, even though there is within province dispersion in the date of
20

signature, such dispersion affected not wage growth at the industry level, which is
basically set at the national agreement.8 Our main hypothesis is that dispersion in
wage growth across provinces and sub-industries causes job losses. Hence, in the
presence of dispersion of signature dates but absence of dispersion of wage growth
should result in no differences in employment losses. The second column of Table 6
shows that the interaction of 1(signed_2008s,p) and f(Wi,2008−W s,p,2008) is basically
zero. That is a reassuring result that confirms that in the absence of province-level
variation in collective agreements our specification is unable to detect differential
employment losses.
Columns 3 and 4 of Table 6 present estimates in the services industry. Column
3 shows the impact on employment losses in services like retail, wholesale, food and
accommodation as well as transportation. Column 4 shows employment impacts in
other type of services, like personal, services to business, health and education. The
effects seem confined to the first set of services, where the estimate of the interaction
of 1(signed_2008s,p) and f(Wi,2008 −W s,p,2008) is 2.95 percentage points (standard
error: 1.3). The estimates in personal or business services, health and education are
very similar in magnitude, but much more imprecisely estimated -the standard error
is eight times larger than in the Food and Accommodation case. It should be noted
that statutory minimum wages in those industries are less binding than in the Food
and Accommodation or in the Transportation industry.
6 Conclusions
We present evidence for Spain during the Great Recession suggesting that both bar-
gained wage growth and employment-to-unemployment transitions depend on the
information available at the time when collective agreement were signed . The degree
of widespread downward wage rigidity induced by automatic extension of provincial
agreements and multi-period bargaining implies that only collective contracts signed
after agents could observe large drops in aggregate activity and employment could
partially adjust by reducing wage growth by 1.5%. However, firms covered by col-
lective agreements already signed before 2009 faced a sharp drop in activity while
8There are a few collective agreements in the construction sector that do specifiy differentialwage growth. However, their coverage is very low.
21

experiencing increases in labor costs of about 3%. We combine information on the
exact dates of collective agreements bargaining periods and longitudinal Social Secu-
rity worker records to test if higher wage growth during a recession leads to higher
flows from employment to unemployment.
Using a sample with matched information on Social Security records, and detailed
collective agreement wage levels as of 2008 (prior to the recession), we find that, rel-
ative to comparable workers covered by contracts signed later in 2009, workers whose
wage were close to the collective agreement floor and covered by collective contracts
signed prior to September 15th 2008 (a) experienced about 2 pp higher wage growth
(b) were between 2 and 4pp more likely to lose their job. The evidence suggests that
the particular form of wage rigidity created for the automatic extension of provincial
agreements and multiperiod bargaining had a role on the employment destruction
during the 2008-2009 recession in Spain. However, further research must assess how
important this source of wage rigidity was during other recessions. Furthermore, the
role of downward wage rigidity on job creation is a key to assess how the labor market
reacts to economic shocks. These topics are left for further research.
7 References (incomplete)
Altonji, Joseph G. and Paul J. Devereux (1999): "The Extent and Consequences of
Downward Nominal Wage Rigidity" NBER Working Paper No. w7236
Barwell R.D. and M. Schweitzer (2007) "The Incidence of Nominal and Real
Rigidities in Great Britain: 1978-98" Economic Journal Vol 117: 523-539.
Bentolila, S. and J. J. Dolado (1994): "Labour Flexibility and Wages: Lessons
from Spain" Economic Policy, 18, 54-99
Bentolila, S. M. Izquierdo and J. F. Jimeno (2010): "Negociación colectiva: La
gran reforma pendiente" Papeles de Economía Española 124
Bonhomme S. and L. Hospido (2012) "The Cycle of Earnings Inequality" manu-
script, CEMFI
Cahuc, Pierre and Andre Zylberberg (2004): Labor Economics. Cambridge: The
MIT Press
Calmforms, Lars and John Drifill, (1988): "Bargaining structure, corporatism and
macroeconomic performance" Economic Policy, 3, 13-61
22

Card, David (1990) "Unexpected inflation, real wages, and employment determi-
nation in union contracts" American Economic Review, September, Vol.80, No. 4:
669-688
Card, David, and Sara de la Rica (2006): "Firm-level contracting and the struc-
ture of wages in Spain" Industrial and Labor Relations Review, Vol.59, No.4 (July)
Dickens, W. E. Groshen, J. Messina, J. Turunen, L. Goette, S. Holden, M.
Schweitzer and M. Ward (2006) "How Wages Change: Micro Evidence frmo the
International Wage Flexibility Project" IZA WP 2487.
De la Roca, Jorge (2008): "Real wages and business cycles: Evidence from Spain
using Social Security data" Master’s Thesis (CEMFI)
DeVicienti F., A. Maida and Paolo Sestito (2997) "Downward Wage Rigidity in
Italy: Micro Based Measures and Implications" Economic Journal 117 (November)
F530-F552
Izquierdo, Mario, Esther Moral, and Alberto Urtasun (2003): "Collective bar-
gaining in Spain: An individual data analysis" Bank of Spain Occasional Discussion
Paper #0302. Madrid: Bank of Spain
Jimeno, Juan F. and Carlos Thomas (2011): "Collective Bargaining, Firm Het-
erogeneity and Unemployment" Bank of Spain Working Paper No. 1131
Lacuesta, Aitor, Sergio Puente and Ernesto Villanueva (2012): "The schooling
response to a sustained increase in low-skill wages: Evidence from Spain 1989-2009"
Working Paper n1208, Bank of Spain
Layard, Richard, Stephen Nickel and Richard Jackman (1991): Unemployment:
Macroeconomic Performance and the Labour Market. Oxford University Press
Olivei, Giovanni and Silvana Tenreyro (2007): "The timing of monetary policy
shocks" American Economic Review, June, Vol. 97, No. 3: 636-663
Olivei, Giovanni and Silvana Tenreyro (2010) "Wage setting patterns and mon-
etary policy: International evidence" Journal of Monetary Economics, Volume 57,
Issue 7, October. Pages 785-802
23

Net of industry &
Full sample prior to 2008m9 after 2008m9 Difference province
Agriculture, manufacturing, utilities 15.9 14.9 17.2 -2.3
Construction 41.1 59.0 21.2 37.8
Trade, food & accomodation, transp. 26.4 20.7 32.8 -12.1
Services to businesses, health and educ. 16.4 5.3 28.8 -23.5
Multi-year 88.2 100 75.1 24.9
Escalation clause 64.3 82.2 44.2
Wage growth 2009 -agreement. 2.60 3.10 1.86 1.24
[mean] (1.20) (.96) (1.15)
Wage growth 2009 -agreement. 2.9 3.5 1.5 2.00
[median]Worker characteristics
Age 37.76 37.75 37.80 -.05 -.27
(10.5) (10.6) (10.4) (.12)
High skill (college) 12.5 9.4 17.1 -7.7 .6
(.4)
Mid-skill 19.2 14.6 26.1 -11.5 -1.2
(.5)
Low skill 68.2 76.0 56.1 19.9 0.6
(0.6)
Fixed-term contract 29.7 34.3 22.8 11.5 .9
(.7)
Sample size 93990 55858 38132
Characteristics of the matched sample of Social Security records with collective agreements.signed between 2007m10 and 2010m12.
Each worker contributes one observation. Worker characteristics refer to 2007m12, and agreement characteristics are those set for 2009
Contract signed
Table 1: Summary statistics, by year of signature

Table 2 Summary statistics, by year of signature. Sample with wage levels
Full sample prior to 2008m9 after 2008m9
Agriculture, manufacturing, utilities .11 .09 .12
Construction .32 .62 .15
Trade, food & accomodation, transp. .35 .25 .38
Services to businesses, health and educ. .22 .02 .35
Multi-year .89 1 .82
Escalation clause .56 .89 .36
Wage growth 2009 -agreement. 2.41 3.55 1.73
mean (S.D.) (1.29) (.82) (.102)
Worker characteristics
Age 37.6 37.5 37.6
High skill (college) .17 .105 .22
Mid-skill .20 .18 .25
Low skill .60 .69 .37
Fixed-term contract .11 .11 .11
(Wage08m12-Minwage)/Minwage .635 .45 .75
Female .32 .20 .39
Sample size 38434 14282 24152
Source: Matched Social Security-Census of Collective Agreements sample with information on wage levels in the collective agreement.
The sample contains Social Security records with collective agreements signed between 2007m10 and 2010m12 and information on wage floors
Each worker contributes one observation. Worker characteristics refer to 2007m12, and agreement characteristics are those set for
2009. (Wage08m12-Minwage)/Minwage is the distance between the wage in 2008m12 and the collective agreement minimum for
the skill group as of 2008m12
Contract signed

Table 3: Actual wage growth 2008-2009 by date of signature and distance to contract-specific minimum wage
No covariates Covariates
(1) (2)
Contract signed before 2008q4 * .0179 .0185
(min_wage<wage 2008 <1.20*min_wage) (.0059) (.0058)
Contract signed before 2008q4 * .0050 .0051
(1.2*min_wage<wage 2008 <1.40*min_wage) (.0051) (.0051)
Wage in 2008 between min_wage and .0508 .0526
1.2 times minimum wage (.0034) (.0036)
Wage in 2008 between 1.2 times min_wage and .0392 .0403
1.4 times minimum wage (.0025) (.0026)
Constant -.0112 .00075
(.0013) (.0044)
Indicator of skill level no yes
Collective contract fixed-effect yes yes
Number of observations:
R-squared .0644 .0675
Covariates in 2nd column: 5 age dummies, type of labor contract and an indicator of female worker
Sample of stayers in their 2008m12 job. Standard errors clustered at province-industry cell
34878

Table 4: The response of the probability of not working in 2009-2010 to date of contract signature x distance to wage minimum
Dependent variable:
Basic set covariates Full set Basic set of covariates Full set
(1) (2) (3) (4)
Signed before 2008m9 * .0331 .034 .0181 .0185
(min_wage <wage< 1.10 min_wage) (.022) (.022) (.0129) (.0129)
Signed before 2008m9 * .0272 .0281 .0248 .0251
(1.10 min_wage <wage< 1.20 min_wage) (.0164) (.0165) (.009) (.0094)
Signed before 2008m9 * -.003 .0054 .003 .0036
(1.20 min_wage <wage< 1.40 min_wage) (.0139) (.0073) (.007) (.0075)
Min_wage<wage 2008 <1.10 min_wage .112 .105 .058 .055
(.017) (.017) (.009) (.010)
1.1 Min_wage<wage 2008 <1.20 min_wage .095 .089 .045 .0433
(.0087) (.0089) (.005) (.005)
1.20 Min_wage<wage 2008 <1.40 min_wage .058 .053 .028 .023
(.0091) (.0091) (.005) (.0047)
Constant .146 .153 .078 .076
(.007) (.0150) (.003) (.008)
Collective contract fixed effect yes yes yes yes
Number of observations (contracts):
R-squared .104 .106 .0969 .0978
The Table shows coefficients of a regression of the dependent variable is either a dummy indicating if the worker did not work for than 3 months
in 2009-2010 or the actual share of days not worked during that period. The regressors are dummies indicating the distance between the
monthly wage of the worker in 2008m12 and the minimum statutory wage in the province - industry - skill group. The omitted group
are workers whose wage in 2008m12 was at least 1.4 times the statutory minimum wage. The coefficient of interest is the interaction of the
distance to the statutory wage and the date of signature of the contract. . All regressors include 551 separate intercepts for each contract
The basic list of covariates include 9 dummies with the skill group of the worker and a dummy for a fixed-term labor contract.
The extended set of covariates adds 5 age dummies, and an indicator of female worker. Standard errors clustered across contracts
1(90+ days in U 2009-2010) Days in U 2009-2010/730
38434 (551)

Table 5: The response of days not worked in 2009-2010 within province - industry -group cells and within firms
Dependent variable:
(1) (2) (3)
Signed before 2008q4 * .022 .012 .043
(20pp above agreement minimum) (.009) (.009) (.019)
Signed before 2008q4 * .0035 -.0035 .0073
(20pp <wage< 40pp) (.0075) (.0076) (.016)
Wage in 2008 .048 .0499 .044
20 pp above agreement minimum (.0073) (.0056) (.016)
Wage in 2008 .0264 .0276 .0275
20-40pp above agreement minimum (.0077) (.0051) (.010)
Constant .076 .085 .0739
(.008) (.0072) (.018)
Collective contract fixed effect: yes yes yes
Indicator of skill level yes -- --
Collective contract x group fixed effect -- yes --
Firm x group fixed effect yes
Number of observations:
R-squared .17 .172 .782
The Table shows coefficients of a regression of the dependent variable is either a dummy indicating the share of days not worked during that period.
The regressors are dummies indicating the distance between the monthly wage of the worker in 2008m12 and the minimum statutory wage in
the province - industry - skill group. The omitted group are workers whose wage in 2008m12 was at least 1.4 times the statutory minimum wage.
The coefficient of interest is the interaction of the distance to the statutory wage and the date of signature of the contract.
Column 1 includes 551 separate intercepts for each contract Column 2 includes province x industry x skill group fixed effects
and Column 3 includes firm x skill group fixed effects.All models include 9 dummies with the skill group of the worker, a dummy for a fixed-term
labor contract. 5 age dummies, and an indicator of female worker. Standard errors clustered across contracts
(Days not worked in 2009-2010) / 730
38384
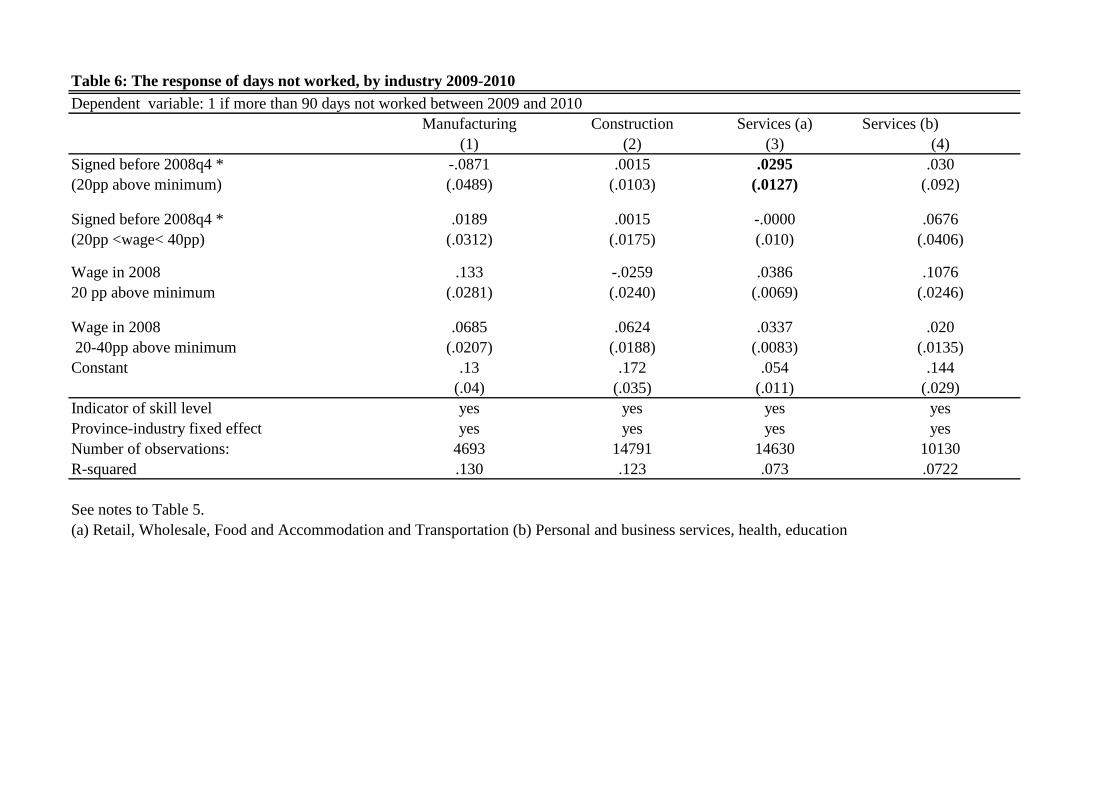
Table 6: The response of days not worked, by industry 2009-2010
Dependent variable: 1 if more than 90 days not worked between 2009 and 2010
Manufacturing Construction Services (a) Services (b)
(1) (2) (3) (4)
Signed before 2008q4 * -.0871 .0015 .0295 .030
(20pp above minimum) (.0489) (.0103) (.0127) (.092)
Signed before 2008q4 * .0189 .0015 -.0000 .0676
(20pp <wage< 40pp) (.0312) (.0175) (.010) (.0406)
Wage in 2008 .133 -.0259 .0386 .1076
20 pp above minimum (.0281) (.0240) (.0069) (.0246)
Wage in 2008 .0685 .0624 .0337 .020
20-40pp above minimum (.0207) (.0188) (.0083) (.0135)
Constant .13 .172 .054 .144
(.04) (.035) (.011) (.029)
Indicator of skill level yes yes yes yes
Province-industry fixed effect yes yes yes yes
Number of observations: 4693 14791 14630 10130
R-squared .130 .123 .073 .0722
See notes to Table 5.
(a) Retail, Wholesale, Food and Accommodation and Transportation (b) Personal and business services, health, education

The graph shows quarter dummies of a regression where:
(a) The dependent variable is agreed wage growth for 2009 (in basis points)
(b) Quarter of contract signature dummies between 2008q1 and 2010q2, 2007q4 omitted.
(c) The covariates are 49 province dummies and 141 industry dummies
Standard errors permit arbitrary correlation at the province-industry cell.
-250
-200
-150
-100
-50
0
50
100
-6 -4 -2 0 2 4 6 8
E(W
age
gro
wth
|pro
vin
ce,in
du
stry
,Q)
Quarter of signature, relative to 2008q4
Figure 1: Agreed wage growth for 2009, by quarter of signature

Figure 2: Histogram of monthly wages (2008m12) in selected provinces -Valencia and Granada
The Figures display histograms of monthly wages in Food and Accommodation as of 2008 in two provinces, Valencia and Granada.
The Food and Accommodation agreement in Valencia was signed in 2007, and it set a 5% wage increase. That in Granada was signed in 2010, after
expiring in 2009, and the agreed wage increase was below 1%.
There are two vertical lines in each Figure.
The line in the left represents the minimum statutory wage for waiters in 2008 in each province. The second one is the statutory minimum
wage in 2009 (not visible in Granada, as it coincides with that in 2008)
02
46
81
01
21
41
6
Pe
rcen
t
600 1000 1400 1800 2200 2600 3000Gross monthly wages, euro
Granada Food and Acc 2008 group 8
02
46
81
01
21
41
6
Pe
rcen
t
600 1000 1400 1800 2200 2600 3000Gross monthly wages, euro
Valencia Food and Acc 2008 group 8

Figure A.1. An example of collective agreement: construction in Navarre
Each of the entries in the Table spells a statutory minimum wage (in euros) for different wage concepts (columns).The rows in the first column
represent skill levels, from top (college graduates) to bottom (laborers). The last four rows represent four types of apprenticeship, depending on age
and seniority.
The columns represent different wage concepts, including the base monthly wage (first column), and a series of complements, including
Chistmas and Summer bonuses. The last column represents a minimum yearly wage by skill group.

Figure A.2. The distribution of monthly wages and the statutory minimum wage, by skill level
The Figure shows the distribution of monthly wages in construction in Madrid for 3 skill levels. The top left chart shows the distribution of
wages of laborers, the top right chart shows the distribution of monthly wages of foremen, and the bottom chart that of college graduates in
the sector. The red line indicates the minimum compulsoty wage for each group.
05
10
15
20
Perc
ent
600 1000 1400 1800 2200 2600 3000Gross monthly wages, euro
Construction Madrid 2008 Group 10, Line at 10
05
10
15
20
Perc
ent
600 1000 1400 1800 2200 2600 3000Gross monthly wages, euro
Construction Madrid 2008 Group 8, Line at 80
510
15
20
Perc
ent
600 1000 1400 1800 2200 2600 3000Gross monthly wages, euro
Construction Madrid 2008 Group 1, Line at 1

Figure A.3 Distribution of monthly wages in 2008 in Food and Accommodation sector, waiters
Distribution of monthly wages as of December 2008 of Food and Accommodation. The skill group
corresponds to waiters, and each of the provinces represents a different province.
The size of each bin is 25 euros.
05
10
15
20
Perc
ent
600 1000 1400 1800 2200 2600 3000Gross monthly wages, euro
Food & Accomodation Barcelona 2008 Group 8, Line at 8
05
10
15
20
Perc
ent
600 1000 1400 1800 2200 2600 3000Gross monthly wages, euro
Food & Accomodation Valencia 2008 Group 8, Line at 80
510
15
20
Perc
ent
600 1000 1400 1800 2200 2600 3000Gross monthly wages, euro
Food & Accomodation Madrid 2008 Group 8, Line at 8
05
10
15
20
Perc
ent
600 1000 1400 1800 2200 2600 3000Gross monthly wages, euro
Food & Accomodation Granada 2008 Group 8, Line at 8