Collection Efficiencies of Ammonium Nitrate, Ammonium Sulfate...
24
Collection Efficiencies of Ammonium Nitrate, Ammonium Sulfate and Mixed Organic/Ammonium Sulfate Particles as a Function of Relative Humidity for an Aerodyne Aerosol Mass Spectrometer Brendan Matthew and Ann Middlebrook National Oceanic and Atmospheric Administration, Aeronomy Laboratory, Boulder, CO 80303 Particle Inlet (1atm) 100% transmission (60 -600 nm), aerodynamic sizing, linear mass signal. Development of an Aerosol Mass Spectrometer for Size and Composi tion Analysis of Submicron Particles. Jayne et al., Aerosol Science and Technology 33:1 -2(49-70), 2000. Quadrupole Mass Spectrometer Thermal Vaporization & Electron Impact Ionization Aerodynamic Lens (2 Torr) Chopper Turbo Pump Turbo Pump Turbo Pump TOF Region Particle Beam Generation Aerodynamic Sizing Particle Composition Aerosol Mass Spectrometer (AMS)
Transcript of Collection Efficiencies of Ammonium Nitrate, Ammonium Sulfate...

Collection Efficiencies of Ammonium Nitrate, Ammonium Sulfate and Mixed Organic/Ammonium Sulfate Particles as a Function of Relative
Humidity for an Aerodyne Aerosol Mass Spectrometer
Brendan Matthew and Ann MiddlebrookNational Oceanic and Atmospheric Administration, Aeronomy Laboratory, Boulder, CO 80303
Particle Inlet (1 atm)
100% transmission (60 -600 nm), aerodynamic sizing, linear mass signal.Development of an Aerosol Mass Spectrometer for Size and Composi tion Analysis of Submicron Particles. Jayne et al., Aerosol Science and Technology 33:1 -2(49-70), 2000.
QuadrupoleMass Spectrometer
Thermal Vaporization
&Electron Impact
Ionization
Aerodynamic Lens
(2 Torr)
Chopper
Turbo Pump
Turbo Pump
Turbo Pump
TOF Region
Particle Beam Generation
Aerodynamic Sizing Particle Composition
Aerosol Mass Spectrometer (AMS)
Experiment Outline
• Performed both hydration (deliquescence) and dehydration (efflorescence) experiments.
• Solutions of NH4NO3,(NH4)2SO4, and organics prepared in nanopure water.• AMS ran in alternating mode: 5 min averages• Vaporizer: T= 580° C• Volumetric Flow Rate: 1.3 cm3 s-1
• m/z ratios for NH4NO3: 15, 16, 17, 18, 28, 30, 46• m/z ratios for (NH4)2SO4: 15, 16, 17, 18, 28, 48, 64, 80, 81• m/z ratios for organics: 44

Experimental Setup
AMS
CPC
Relative Humidity Sensors
Mixing Chamber
Humidifier
ExhaustA
ir Tank
DMA
AerosolGenerator
Air Tank
Water Boat
Heated Water Boat
Mixing Chamber
DrierExhaust
= valve
= drier/humidifier flowBold lines = aerosol flow path
= main flow path= dry flow path= wet flow path

Ammonium Nitrate Hydration Experiment
200
150
100
50
0
Colle
ctio
n Ef
ficie
ncy
(%)
100806040200Sampling Line Relative Humidity (%)
Ammonium Nitrate Particles Ddma,dry = 199 nm
Deliq. RH (DRH)
Ammonium Sulfate Hydration Experiment
100
80
60
40
20
0
Colle
ctio
n Ef
ficie
ncy
(%)
100806040200Sampling Line Relative Humidity (%)
Ammonium Sulfate Particles Ddma,dry = 199 nm
Deliq. RH (DRH)
Conclusions: Hydration Experiments
• CE for NH4NO3 are ~ 100% and do not demonstrate a dependence upon RH. (In most cases, the CE values were >100%; this is believed to be associated with the AMS software particle counting procedure.)
– Consistent with early findings: pure NH4NO3 particles are associated with water, even below the predicted deliquescence point (e.g. Tang, 1980). Because of this, the particles should be spherical in shape and focused in the lens with a high degree of efficiency resulting in high CE values (less bounce?).
• CE for (NH4)2SO4 do demonstrate a strong dependence on RH. At RH < deliquescence relative humidity (DRH), the CE values are 20-30%, but when RH > DRH, the CE values rise quickly and approach 100%.
– (NH4)2SO4 particles have well defined deliquescence and efflorescence points, 80% and 36% respectively (Tang, 1980). Therefore, (NH4)2SO4 particles can form dry nonspherical particles at low RH which have a lower focusing efficiencies and CE (more bounce?).
• CE for (NH4)2SO4 drop at RH values approaching 100%– Particles become larger due to the addition of water and the larger particles can
be lost in the critical orifice of the AMS inlet which will result in lower CE values.– This can happen to any particle type and is a function of initial particle size, RH,
and the species present in the particle.
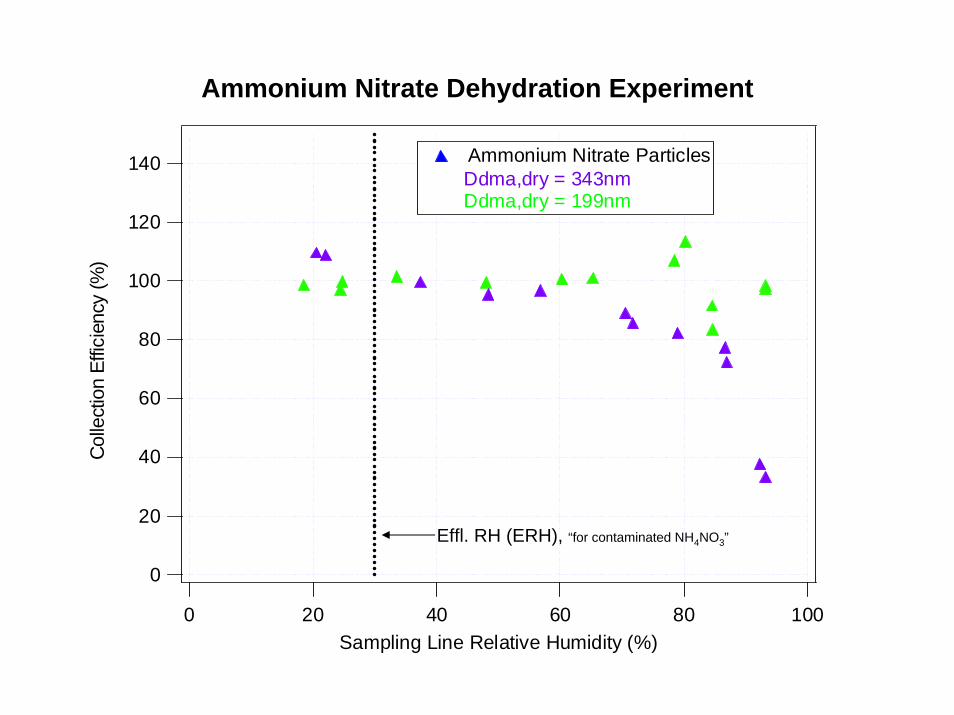
Ammonium Nitrate Dehydration Experiment
140
120
100
80
60
40
20
0
Colle
ctio
n Ef
ficie
ncy
(%)
100806040200Sampling Line Relative Humidity (%)
Ammonium Nitrate Particles Ddma,dry = 343nm Ddma,dry = 199nm
Effl. RH (ERH), “for contaminated NH4NO3”

Ammonium Sulfate Dehydration Experiment120
100
80
60
40
20
0
Colle
ctio
n Ef
ficie
ncy
(%)
100806040200Sampling Line Relative Humidity (%)
Ammonium Sulfate Particles Ddma,dry = 343nm Ddma,dry = 199nm
Effl. RH (ERH)

Conclusions: Dehydration Experiments
• CE for NH4NO3 particles were ~ 100% and did not exhibit a RH dependence when the experiment was initiated with 199 nm dry particles.
– When the experiment was initiated with 343 nm dry particles, there was a RH dependence (i.e. at high RH, the CE values began to drop below 100%) which can be attributed to the growth of particles and the loss of these particles in the critical orifice of the AMS inlet.
• CE for (NH4)2SO4 exhibit a strong dependence on RH, but not the expecteddependence.
– Based on the efflorescence relative humidity (ERH) of 36%, it was anticipated that the CE for (NH4)2SO4 would approach 100% at RH > ERH, and then drop to those values observed in the hydration experiment at RH< ERH.
– When the experiment is initiated with 199 nm dry particles, CE values drop to ~ 40% at RH values (i.e. RH = 80%) considerably higher than the ERH. At the ERH, it appears there is another drop in the CE values to ~25-30%.
– Strong indication that the RH in the inlet system is considerably lower than the RH in sampling line. This lower RH could result in the particles loosing water faster than what would be expected based upon the sampling line RH.
– When the experiments are initiated with 343 nm particles, the (NH4)2SO4particles become to large at higher RH and are lost in the AMS inlet leading to lower CE values
Summary
• In general NH4NO3 particles have collection efficiencies (CE) approaching 100% and do not vary as function of RH.
• CE values for (NH4)2SO4 particles do vary as a function of RH, and range from 20% at low RH to near 100% at higher RH values. This implies a correction factor of 5 for sulfate field data obtained at RH < ERH (36%), but in practice the correction factor is ~ 2. This discrepancy may be due to: – field measurements are mainly in the RH range above the ERH and below
the DRH where CE is ~ 40%– the presence of organic species internally mixed with the sulfate, which
could increase the CE for sulfate.• Both NH4NO3 and (NH4)2SO4 particles have low collection efficiencies at high
RH if the particle diameter exceeds the maximum transmittable diameter of the critical orifice.
Mixed Organic/Ammonium Sulfate Experiments
• Looked at three organic compounds; idea was that presence of organics would cause ammonium sulfate (AS) particles to retain water at RH values below the DRH of AS and increase CE at lower RH values. – Ammonium Acetate (AA)– Ammonium Oxalate (AO)– Citric Acid (CA)
• AA and AO provided no useful results– AA – no noticeable organic peaks detected; perhaps acetate was
evaporating before reaching heater?– AO – m/z 44 was present, but DRH for AO > 94%, higher than AS;
therefore AO should not cause the particles to retain water below DRH of AS.

Experiments with Citric Acid
• Citric acid (CA) has a continuous growth curve, analogous to ammonium nitrate (Peng et al. 2001)– Anticipated that presence of CA would allow the mixed particles to
retain water below DRH of AS• Conducted both hydration and dehydration experiments with 200 and 300
nm particles

0%
10%
20%
30%
40%
50%
60%
70%
80%
90%
100%
0.0 20.0 40.0 60.0 80.0 100.0 120.0
RH
CE
300nm 10% CA200nm 50% CA 200nm NO CA300nm 50% CA300nm, pure CA (dehydration)200nm 10%CA (dehydration)200nm, 10% CA RH=94.5200nm, pure CA RH=96.7
CE for Particles Containing Ammonium Sulfate and Citric Acid/Ammonium Sulfate

Conclusion: Mixed Citric Acid/Ammonium Sulfate Particle Experiments
• Presence of CA did not increase the CE as expected.• Particles containing small amounts of CA (10%) behaved analogous to AS.• Particles containing 50% CA behaved analogous to pure CA.• Pure CA particles had low CE and did exhibit a small RH dependence.• Overall, CA particles do not behave as anticipated.


Collection Efficiencies as a Function of Vacuum Aerodynamic Diameter
160
140
120
100
80
60
40
20
0
Colle
ctio
n Ef
ficie
ncy
(%)
102 3 4 5 6 7 8 9
1002 3 4 5 6 7 8 9
1000Vacum Aerodynamic Diameter (nm)
Experimental Data Ammonium Nitrate Ammonium Sulfate
FLUENT Model DataFrom John Jayne, Aerodyne

Conclusions: Size Experiments
• The collection efficiencies for NH4NO3 were always greater than ~ 75%, which is in agreement with our previous findings.
• Fluent Model predicts that there should be a drop in CE for large spherical particles which we also observe (it is assumed the “dry” NH4NO3 particles are still associated with some water, and therefore are spherical).
• The collection efficiencies for dry (NH4)2SO4 are ~ 20%, over the size range tested, which is consistent with our previous results..

Ammonium Nitrate Growth2.0
1.8
1.6
1.4
1.2
1.0
0.8
Dva
/Dva
,dry
100806040200
Sampling Line Relative Humidity (%)
2.0
1.8
1.6
1.4
1.2
1.0
0.8
Dv/Dv,dry (Tang, 1980)
Ammonium Nitrate Particles hydration expts.
dehydration expts. Tang, 1980
Ddma,dry = 343 nmDdma,dry = 199 nm
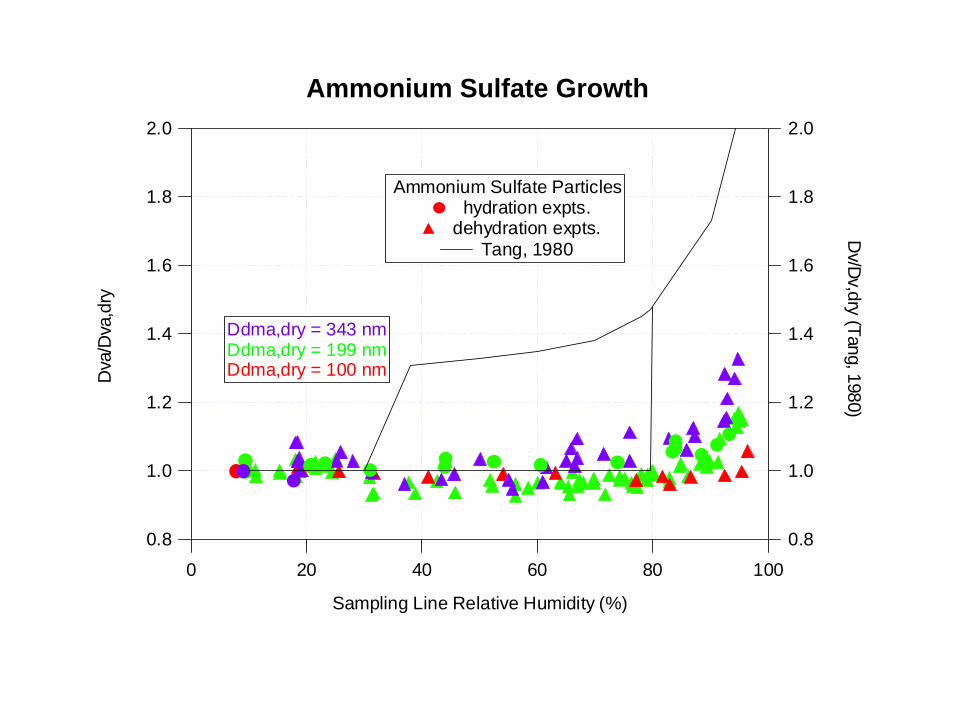
Ammonium Sulfate Growth2.0
1.8
1.6
1.4
1.2
1.0
0.8
Dva
/Dva
,dry
100806040200
Sampling Line Relative Humidity (%)
2.0
1.8
1.6
1.4
1.2
1.0
0.8
Dv/Dv,dry (Tang, 1980)
Ammonium Sulfate Particles hydration expts.
dehydration expts. Tang, 1980
Ddma,dry = 343 nmDdma,dry = 199 nmDdma,dry = 100 nm

Conclusions: Particle growth
• The relative change in Dva is not as large as the relative change in Dv.– Because the Dva depends on the particle density and physical size, increases in
physical size are somewhat offset by decreases in particle density as more H2O is absorbed. When the density approaches one, the Dva increases because the Dv increases.
• The deliquescence and efflorescence points are not as distinct in the AMS growth curves compared to the Tang data.
– Other experiments (discussed previously) indicate that phase changes probably depend on the conditions within the critical orifice and lens.

Ammonium Nitrate Water Content
-1.0
-0.5
0.0
0.5
1.0
Mwa
ter/M
tota
l
100806040200
Sampling Line Relative Humidity (%)
Ammonium Nitrate Particles hydration expts.
dehydration expts. Tang, 1980
Ddma,dry = 343 nmDdma,dry = 199 nm
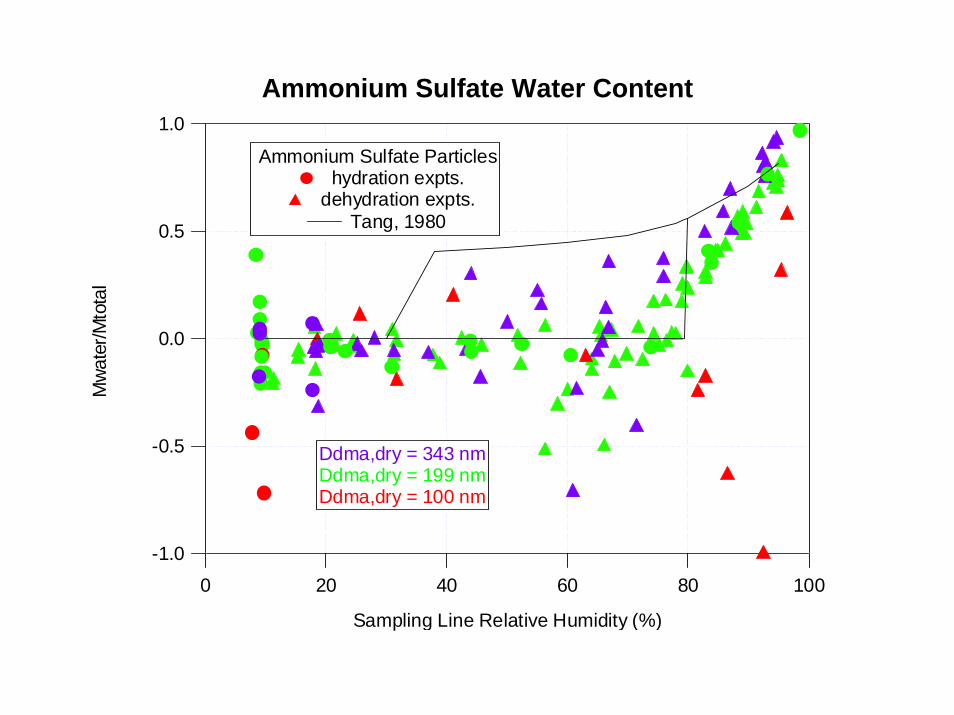
Ammonium Sulfate Water Content
-1.0
-0.5
0.0
0.5
1.0M
wat
er/M
tota
l
100806040200
Sampling Line Relative Humidity (%)
Ammonium Sulfate Particles hydration expts.
dehydration expts. Tang, 1980
Ddma,dry = 343 nmDdma,dry = 199 nmDdma,dry = 100 nm
Conclusions: Water Content
• The AMS measurements of H2O content are lower than expected.– The low pressure within the AMS instrument (critical orifice followed by
aerodynamic focusing lens and a vacuum chamber) is likely causing some H2O to evaporate from the particles (i.e., the RH within the AMS is significantly lower than the RH within the sampling line).
• Particle growth and water content appear to be dependent on initial particle dry size, and the smallest particles do not “grow” as much as the larger particles.
– While the evaporation rates are probably comparable, the relative amounts of H2O lost from the smaller particles will be greater than from larger particles.
• Although the AMS can measure increases in particle water content at high RH, the quantification of particle water is limited by evaporation in the AMS, accurate subtraction of gas phase H2O and H2O due to fragmentation of molecules containing water (H2SO4), and knowing the ionization efficiency of H2O relative to nitrate.