Collecting and Analyzing Data – Part 1 Week 3 Day 1 DIE 4564 Research Methods.
105
Collecting and Analyzing Data – Part 1 Week 3 Day 1 DIE 4564 Research Methods
-
Upload
todd-dorsey -
Category
Documents
-
view
226 -
download
0
Transcript of Collecting and Analyzing Data – Part 1 Week 3 Day 1 DIE 4564 Research Methods.

Collecting and Analyzing Data – Part 1Week 3 Day 1
DIE 4564 Research Methods
Do you know what you are measuring?…
• Conceptualization comes before operationalizing• Conceptualizing is the process through which we
specify what we mean when we use particular terms in research. (ex. “ physically active” – need to define it in order to measure it)
• The outcome of conceptualization is to produce a specific, agreed-upon meaning for a concept for the purposes of research.
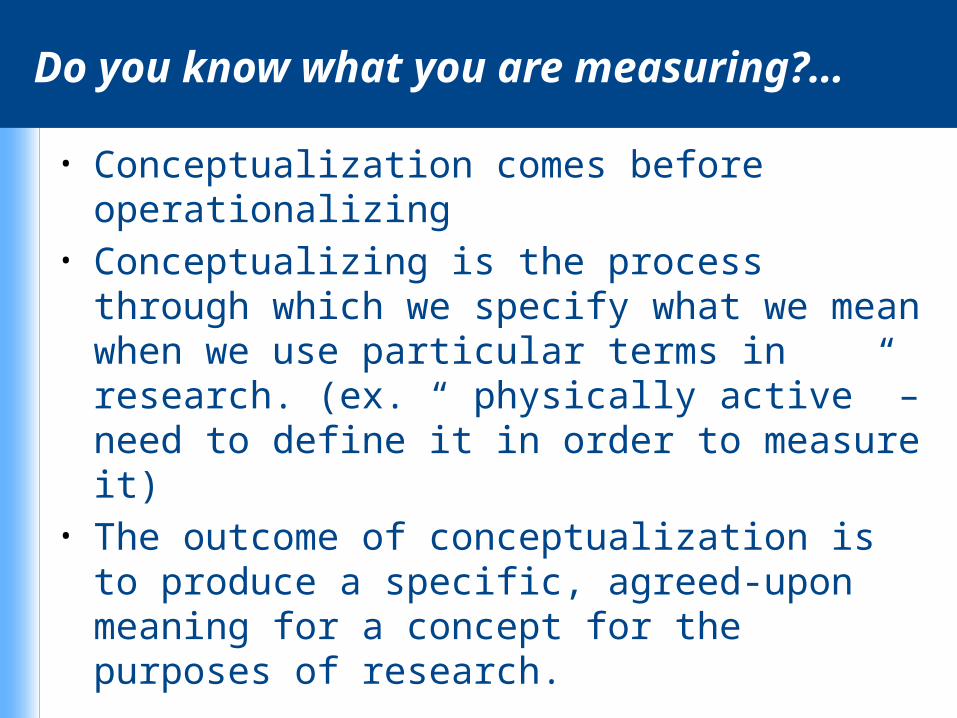
Conceptualization- Indicators and Dimensions
Indicator – an observation or measure that we choose as a reflection or proxy of a variable we wish to study. (ex- serum carotenoids as indicator of vegetable intake)
Dimension – a specifiable aspect of a concept. (ex – nutrient density as an aspect of a healthy diet)

Conceptualization
• Indicators and Dimensions – Practice Obesity Diabetes complication Physical activity Motivation

Conceptualization
• Real, Nominal, and Operational Definitions Specification – the process through which
concepts are made more specific. A nominal definition is one that is simply
assigned to a term without any claim that the definition represents a “real” entity.
An operational definition specifies precisely how a concept will be measured – that is, the operations we will perform.

Conceptualization

Conceptualization
• Review Question In the first measurement stage we focus on the
different meanings and dimensions of our concept, for example “plant-based nutrition”. What are the next two steps?
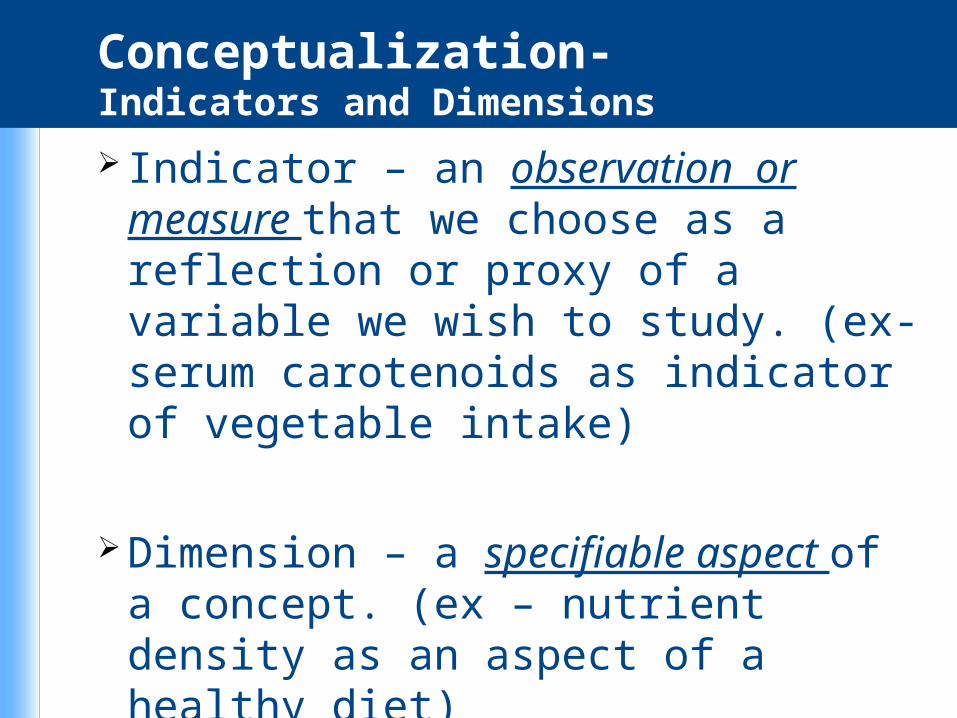
Conceptualization• Review Question
After conceptualizing our concept, “plant-based nutrition”, we would next develop a nominal definition. For example, we could define “plant-based nutrition”. as representing “vegan” or “vegetarian” to include variations that represent more plant consumption.
Once our nominal definition is set, we would develop an operational definition. For example, we could ask 7th Day Adventist respondents the following survey question, “Do you consider yourself vegan?”

Operationalization Choices
• Conceptualization is the refinement and specification of abstract concepts.
• Operationalization is the development of specific research procedures that will result in empirical observations representing those concepts in the real world.

Operationalization Choices
• Defining Variables and Attributes An attribute is a characteristic or quality of
something (ex: female, old, student). A variable is a logical set of attributes (ex:
gender, age).
*Every variable must have two important qualities. Attributes must be exhaustive. Attributes must be mutually exclusive.

Operationalization Choices
• Levels of Measurement Nominal Ordinal Interval Ratio
http://www.youtube.com/watch?v=hZxnzfnt5v8&list=TLFnRyKtISo3c

Levels of Measurement
• – Nominal / categorical / qualitative / nonparametric Variables whose attributes are merely
different; they have only the characteristics of exhaustiveness and mutually exclusiveness.
Examples: gender, ethnicity, preference for coffee, tea, or soft drink

Levels of Measurement
• – Ordinal Variables with attributes we
can logically rank in order.
Examples: socioeconomic
status, educational level, satisfaction with body image

Levels of Measurement
• – Interval / ratio / quantitative / parametric Variables whose attributes are rank-
ordered and have equal distances between adjacent attributes.
Examples: temperature, BMI, age

Levels of Measurement
• – Difference between Interval and Ratio Ratio is an interval measure with a true
zero point.
Examples: temperature (Kelvin), age, length of time, number of fruit servings, number of groups, number of “A”s received in college

Further classification of variables
• Nominal variables (categorical variables) Binomial variables
• Ordinal variables (ranked variables)• Ratio / Interval variables
Continuous variables Discrete variables

Continuous and Discrete Variables
Continuous Variable – a variable whose attributes form a steady progression, such as age or income.
Discrete Variable – a variable whose attributes are separate from one another or discontinuous, such as gender or religious affiliation.

Operationalization Choices

Operationalization Choices
• Implications of Levels of Measurement Determines the arithmetic operations that
can be applied to a variable.


Quiz
A level of measurement describing a variable whose attributes are rank-ordered and have equal distances between adjacent attributes are _____ measures.
A. ratio
B. interval
C. nominal
D. ordinal

Quiz
Answer: B.
A level of measurement describing a variable whose attributes are rank-ordered and have equal distances between adjacent attributes are interval measures

Operationalization Choices
• Review Question How would you measure satisfaction with
one’s food intake? Are there different dimensions to
“dietary satisfaction”? What level of measurement would you
use? Would you use single or multiple
indicators?

Criteria of Measurement Quality
• Precision• Accuracy• Reliability• Validity

Criteria of Measurement Quality
• Precision and Accuracy Precise measures are superior to
imprecise ones. Precision is not the same as accuracy.
Accuracy means getting a result that is close to the real answer.
Precision means getting a similar result every time you try.

Criteria of Measurement Quality
• Reliability – the quality of measurement method that suggests the same data would have been collected each time in repeated observations of the same phenomenon. Reliability describes the precision of the method.
• Reliability is not the same as accuracy.
Criteria of Measurement Quality
• Validity – a term describing a measure that accurately reflects the concept it is intended to measure. Validity reflects the accuracy of the measurement method.

Criteria of Measurement Quality
An Analogy to Validity and Reliability. A good measurement technique should be both valid (measuring what it is intended to measure) and reliable (yielding a given measurement dependably).

Criteria of Measurement Quality
• Validity* Face Validity – the quality of an indicator that makes it a
reasonable measure of some variable. Criterion-Related Validity – the degree to which a
measure relates to some external criterion. Construct Validity – the degree to which a measure
relates to other variables as expected within a system of theoretical relationships.
Content Validity – the degree to which a measure covers the range of meanings included within a concept.

Determining validity and reliability of your test methods
Test-Retest MethodTo make the same measurement more
than once.
Split-Half MethodMultiple sets of randomly assigned
variables should produce the same classifications

Criteria of Measurement Quality
Established MeasuresUse measures previously shown to be
reliable.
Reliability of Research WorkersClarity, specificity, training, and practice
can prevent much unreliability.

Quiz
_____ is the degree to which a measure covers the range of meanings included within a concept.
A. Construct validity
B. Criterion-related validity
C. Face validity
D. Content validity

Quiz
Answer: D.
Content validity is the degree to which a measure covers the range of meanings included within a concept.

4 Main Steps to Index Construction
• Item Selection• Examination of Empirical Relationships• Index Scoring• Index Validation

Issues in Index Item Selection
Face Validity – does it measure what is meant to measure?
Unidimensionality – does it represent only one concept?
General or Specific – what type of answer do you need to address your study question?
Variance – what range of response on your variable do you need to measure?

Index Construction• Index Scoring
1. Determine the desirable range of the index scores. Conflicting desire for a range of measurement in the
index and an adequate number of cases at each point in the index.
2. Determine whether to give each item in the index equal or different weights.
Standard: items should be weighted equally unless there are compelling reasons for differential weighting.

Index Construction
• Handling Missing Data
1. If there are few cases with missing data, you may decide to exclude them from the construction of the index and analyses.
2. Treat missing data as one of the available responses.
3. Analyze the missing data to interpret their meaning.
4. Assign missing data the middle value, or the mean value
5. Assign values to the proportion of variables scored.

Index Construction
• Index Validation Item Analysis – as assessment of whether each
of the items included in a composite measure makes an independent contribution or merely duplicates the contribution of other items in the measure.
External Validation – the process of testing the validity of a measure, such as an index or score, by examining its relationship to other presumed indicators of the same variable.

Index Construction
• Bad Index versus Bad Validators If the index fails to predict strongly the
external validation items, choose between two possibilities:
1. The index does not adequately measure the variable in question.
2. The validation items do not adequately measure the variable and thereby do not provide a sufficient test of the index.

Scale Construction
• Likert Scaling – a type of composite measure, using standardized response categories to determine the relative intensity of different items.

Scale Construction
• Guttman Scaling – a type of composite measure used to summarize several discrete observations and to represent more general variables.
• A well-known example of a Guttman scale is the Bogardus Social Distance Scale.

Scale Construction
• Bogardus Social Distance Scale – a measurement technique for determining the willingness of people to participate in social relations – of varying degrees of closeness – with other kinds of people.
Might have use in determining willingness to participate in programs, community capacity building,
nutrition advocacy coalitions,…

Univariate Analysis
• Univariate Analysis – the analysis of a single variable, for purposes of description (examples: frequency distribution, averages, and measures of dispersion).
Example: GenderThe number of men in a
sample/population and the number of women in a sample/population.
Univariate Analysis
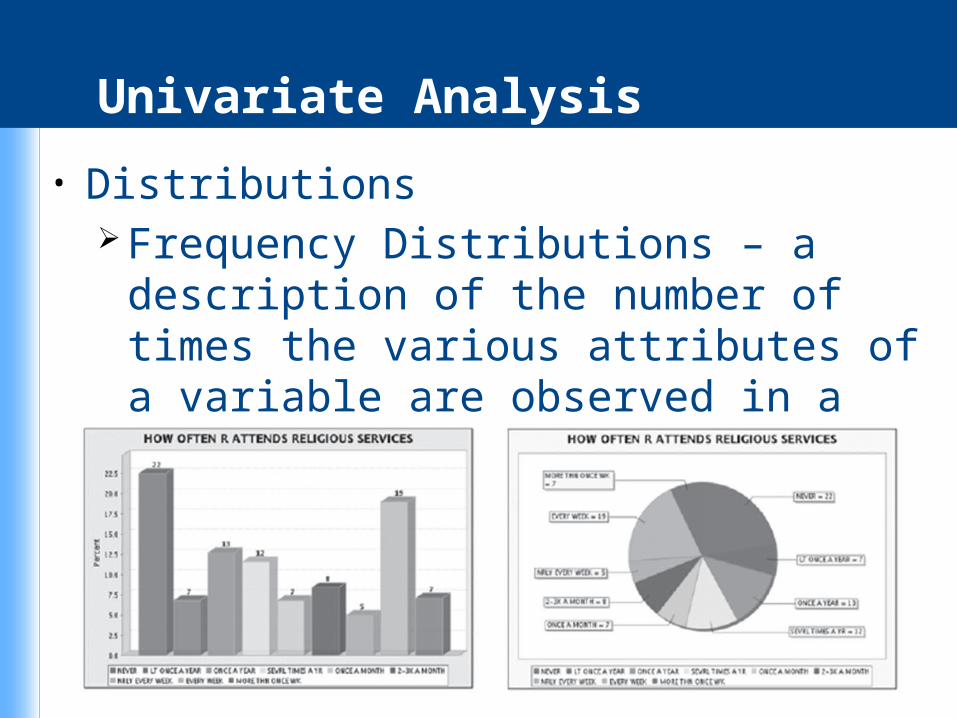
• Distributions Frequency Distributions – a description of
the number of times the various attributes of a variable are observed in a sample.

Univariate Analysis
• Central Tendency Average – an ambiguous term generally
suggesting typical or normal – a central tendency (examples: mean, median, mode).

Univariate Analysis
• Central Tendency Mean – an average computed by summing
the values of several observations and dividing by the number of observations.
Mode- an average representing the most frequently observed value or attribute.
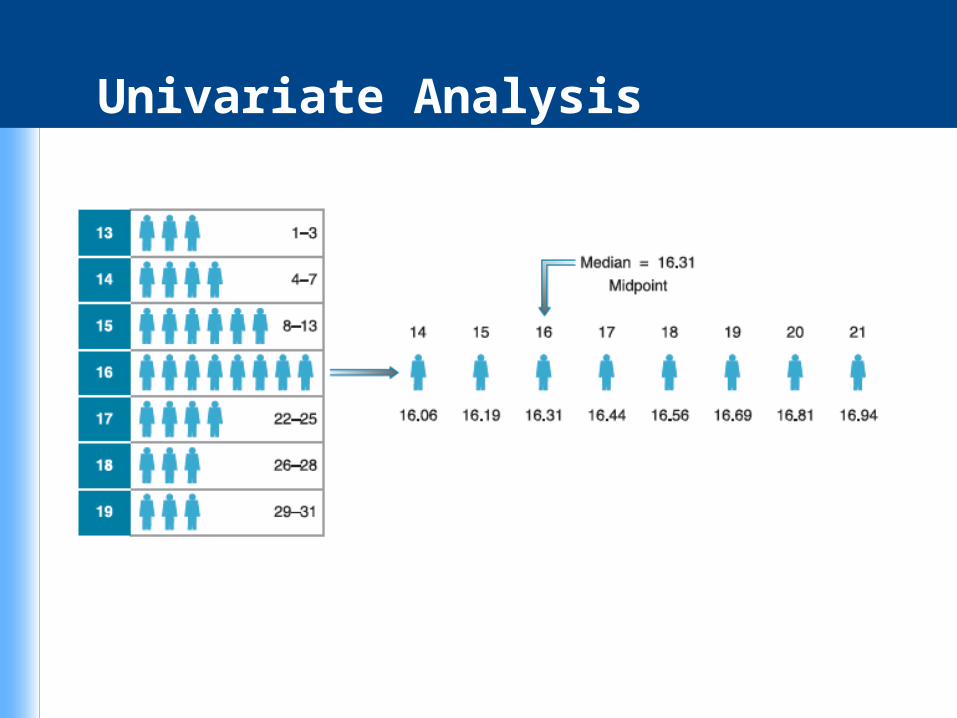
Median – an average representing the value of the “middle” case in a rank-ordered set of observations.

Example of a Mean, Median, and Mode

Univariate Analysis Practice
Practice: The following list represents the scores on a mid-term exam.
100, 94, 88, 91, 75, 61, 93, 82, 70, 88, 71, 88
Determine the mean. Determine the mode. Determine the median.

Univariate Analysis
Univariate Analysis

Measures of Central Tendency
There are several ways to report the average response to a variable in a population:• For ratio and interval variables, the central
tendency can be described using means, medians, and modes.
• For ordinal variables, a median or mode can be reported.
• A mode can be reported for categorical variables.

Measures of Spread
Measures of spread, also called “dispersion,” are used to describe the variability and range of responses.• range • median• quartiles • interquartile range (IQR)

Sample Boxplot

Measures of Spread
• A normal distribution of responses has a bell-shaped curve with one peak in the middle
• Not all numeric variables have a normal distribution. The distribution may instead be left-skewed, right-skewed, bimodal, or uniform.

Sample Histogram

Standard Deviation
For variables with a relatively normal distribution the standard deviation describes the narrowness or wideness of the range of responses. • 68% of responses fall within one standard
deviation above or below the mean.• 95% of responses are within two standard
deviations above or below the mean.• More than 99% of responses are within three
standard deviations above or below the mean.

Z-scores
A z-score indicates how many standard deviations away from the sample mean an individual’s response is. • An individual whose age is exactly the mean age
in the population will have a z-score of 0. • A person whose age is one standard deviation
above the mean in the population will have a z-score of 1.
• A person whose age is two standard deviations below the population mean will have a z-score of –2.

Example of the Distribution of Responses for a Normally Distributed Numeric Variable

Standard deviation
Categorical Responses
• A histogram or boxplot cannot be used to display the responses to categorical variables.
• The distribution of responses must instead be displayed in a bar chart (or, less often, a pie chart).

Sample Bar Chart

Common Descriptive Statistics by Variable Type

Bivariate Analysis
• Bivariate Analysis – the analysis of two variables simultaneously, for the purpose of determining the empirical relationship between them.
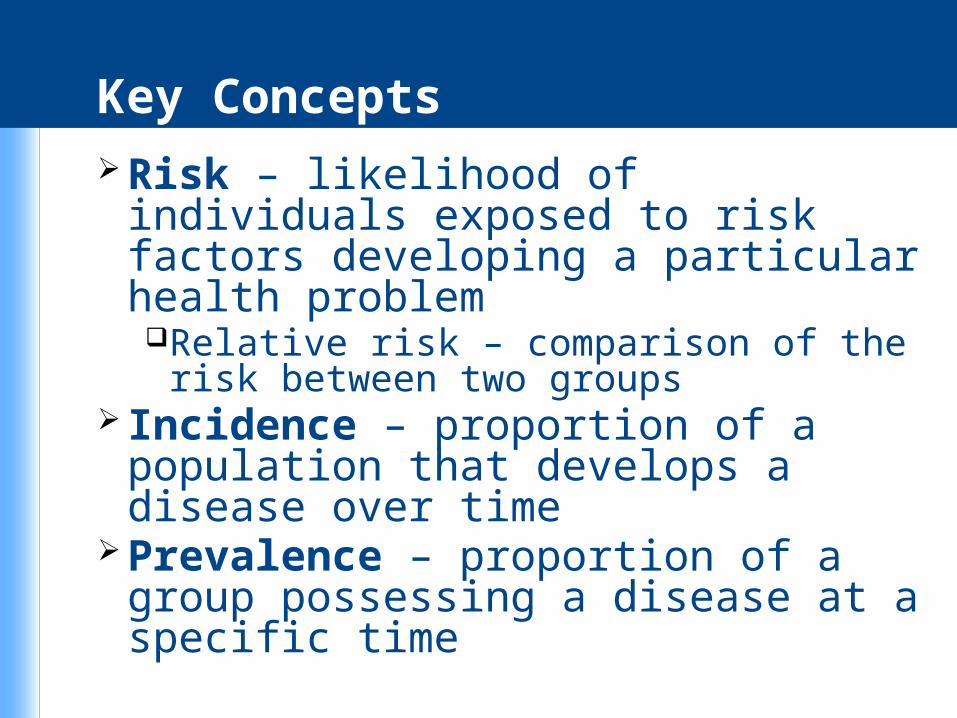
Key Concepts Risk – likelihood of individuals exposed to
risk factors developing a particular health problemRelative risk – comparison of the risk between
two groups Incidence – proportion of a population that
develops a disease over time Prevalence – proportion of a group
possessing a disease at a specific time

Absolute Risk• Involves people who contract disease
due to an exposure• Doesn’t consider those who are sick but
haven’t been exposed
Relative v Attributable Risks
http://www.youtube.com/watch?v=FZzm3-RRlI4 interpreting RR and OR

Calculations for Attributable Risks (cont.)

Calculating Excess Risk

Relative Risk
Definition:
A measure of the strength of association based on prospective studies (cohort studies).
http://www.youtube.com/watch?v=xk2uK14eHNs calculating relative risk

Determining Relative Risk

Interpreting Relative Risk

Relative Risk in Case-Control Studies
• Can’t derive incidence from case-control studies Begin with diseased people (cases)
and non-diseased people (controls)• Therefore, can’t calculate relative risk
directly• But, we can use another method called
an odds ratio

Odds Ratio in Prospective (Cohort) Studies
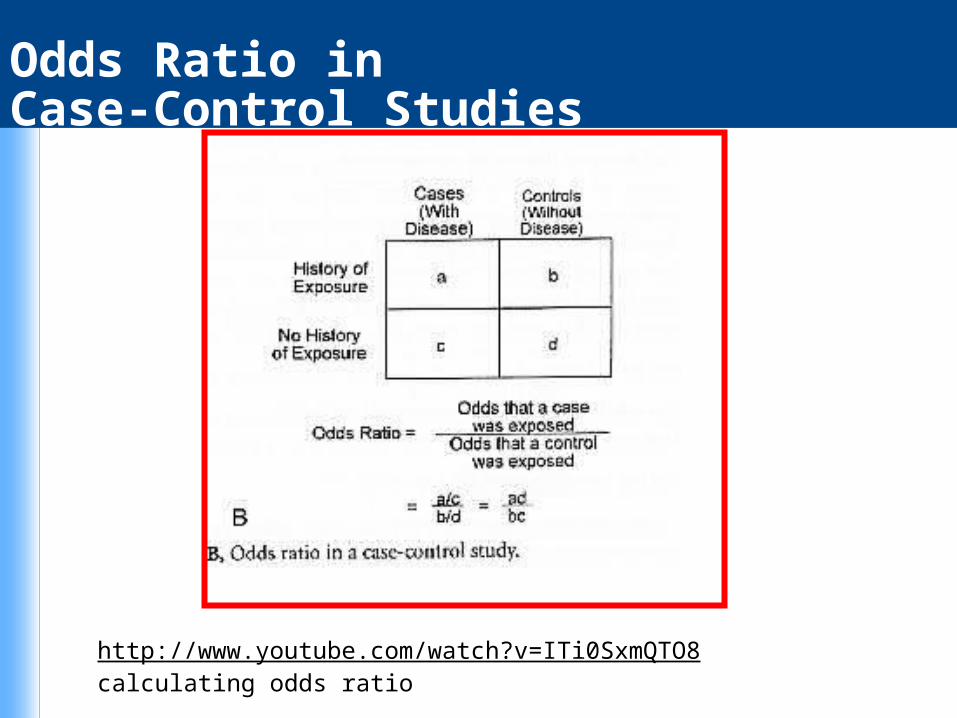
Odds Ratio in Case-Control Studies
http://www.youtube.com/watch?v=ITi0SxmQTO8 calculating odds ratio

Odds Ratio in Case-Control Studies (cont.)

Summary
• Relative risk and odds ratio are important as measures of the strength of association Important for deriving causal “inference”
• Attributable risk is a measure of how much disease risk is attributed to a certain exposure Useful in determining how much disease can be
prevented• Therefore:
Relative risk is valuable in etiologic studies of disease
Attributable risk is useful for Public Health guidelines and planning

Analytic Plan for Comparing Groups
http://www.youtube.com/watch?v=FZzm3-RRlI4 interpreting RR and OR

Hypotheses for Statistical Tests
• Comparative statistical tests usually are designed to test for difference rather than for sameness.
• Statistical test questions are usually phrased in terms of differences: Are the means different? Are the proportions different? Are the distributions different?

Examples of Hypotheses for Statistical Tests

Hypotheses for Statistical Tests
• The null hypothesis (H0) describes the expected result of a statistical test if there is no difference between the two values being compared.
• The alternative hypothesis (Ha) describes the expected result if there is a difference.

Rejecting the Null Hypothesis
The decision to reject or fail to reject the null hypothesis is based on the likelihood that the result of a test was due to chance.

Rejecting the Null Hypothesis
• Rejecting the null hypothesis means concluding that the values are different by rejecting the claim that the values are not different.
• Failing to reject the null hypothesis means concluding that the there is no evidence that the values are different. Functionally, this is like saying that the values are close enough to be considered similar, but failing to reject H0 should never be taken as evidence that the values are the same.
Rejecting the Null Hypothesis
• One way to understand the concept of chance is to consider the variability in sample populations.
• When a sample population is drawn from a source population, the mean age in the sample population is usually not exactly the mean age of the source population.
• The range of expected values for the mean age of sample populations drawn from a source population can be estimated using statistics.

Rejecting the Null Hypothesis
• Some sample populations will have mean ages that are very close to the mean in the source population; some will be quite far from the mean.
• The 5% of sample means farthest from the true mean are designated “extreme.”
• Thus, by chance, 5% of the samples drawn from a source population will be expected to have an extreme mean.

Example of the Distribution of Mean Ages for Sample Populations Drawn from a Larger Source Population

Rejecting the Null Hypothesis
• Comparative statistical tests accommodate expected variability in sample populations when testing whether 2 groups in a study population are different.
• When the difference in mean ages is great, the statistical test will show that it is highly unlikely that the group means are not significantly different reject H0.
• If the statistical test shows that the mean ages of cases and controls are fairly close fail to reject H0.

Interpreting P-values
• A p-value, or probability value, determines whether the null hypothesis (H0) will be rejected.
• The standard is to use a significance level of α = 0.05, or 5%.
• Any statistical test with a result that is in the 5% of most extreme responses expected by chance will result in the rejection of the null hypothesis.

Interpreting p -Values

Examples of One-Sided and Two-Sided Alternative Hypotheses

Interpreting Confidence Intervals
• Confidence intervals (CIs) provide information about the expected value of a measure in a source population based on the value of that measure in a study population.
• The width of the interval is related to the sample size of the study. A larger sample size will yield a narrower confidence interval.

Interpreting Confidence Intervals (CIs)

90%, 95%, and 99% Confidence Intervals (CIs) for the Same Odds Ratio (OR)
Measures of Association
• Some of the most common types of comparative analysis are the odds ratio (OR) used for case-control studies and the rate ratio (RR) used for cohort studies.
• The reference group for an OR or RR should be well-defined.
• The 95% confidence interval provides information about the statistical significance of the tests.
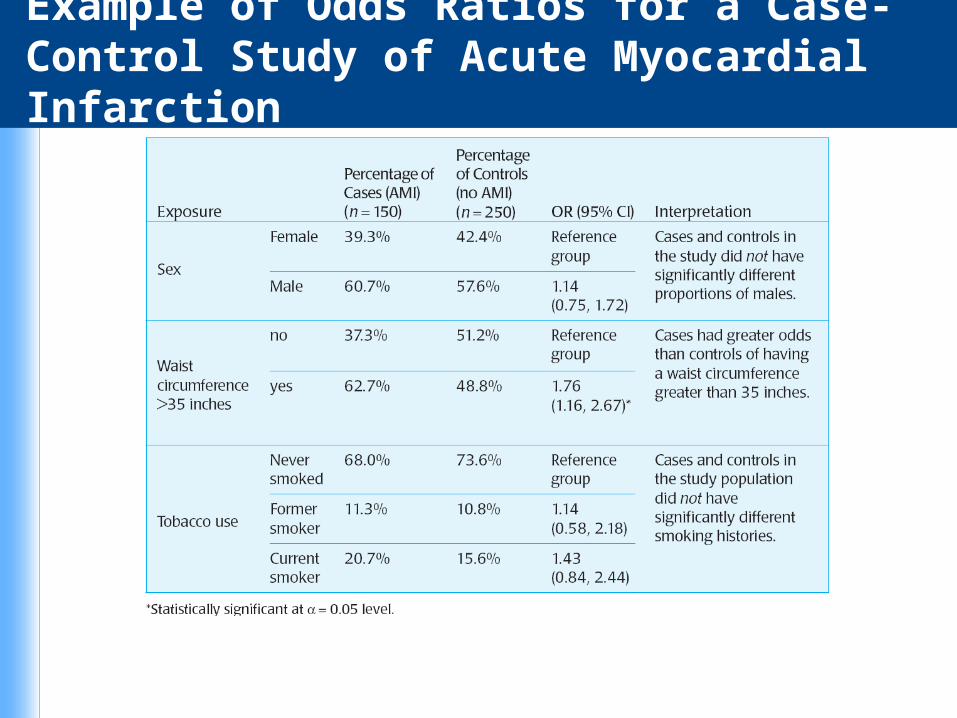
Example of Odds Ratios for a Case-Control Study of Acute Myocardial Infarction
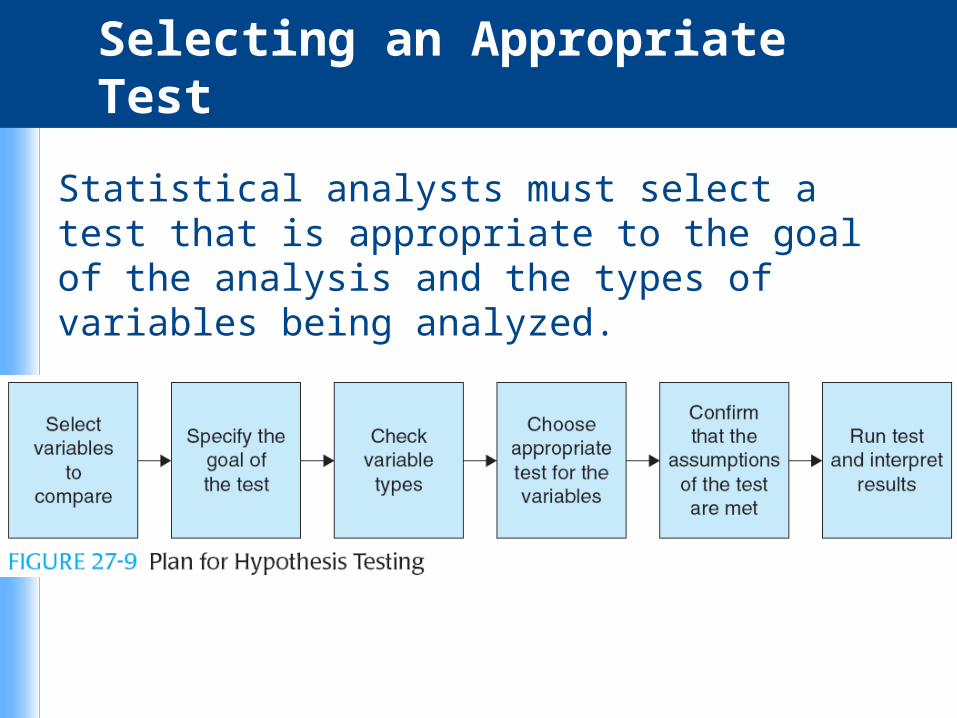
Selecting an Appropriate Test
Statistical analysts must select a test that is appropriate to the goal of the analysis and the types of variables being analyzed.

Selecting an Appropriate Test
• Parametric tests assume that the variables being examined have particular (usually normal) distributions and that the variances for the variables being examined be similar in the population groups being compared.
• Nonparametric tests do not make assumptions about the distributions of responses.

Selecting an Appropriate Test
• Parametric tests are typically used for ratio and interval variables with relatively normal distributions of responses.
• Nonparametric tests are used for ranked variables, categorical variables, and when the distribution of a ratio or interval variable is non-normal.

One-Sample Tests
• The goal of some statistical tests is to compare the value of a statistic in a study population to some set value.

Two-Sample Tests
• Independent populations: populations in which each individual can be a member of only one of the population groups being compared
• A variety of statistical tests can be used to compare independent populations.
• The appropriate test to use depends on the type of variable being examined.

Tests for Comparing Two or More Groups

Examples of Tests for Comparing Males and Females in a Study Population

Simplified Version

Paired Tests
A different set of tests is used when the goal is to compare before-and-after results in the same individuals.
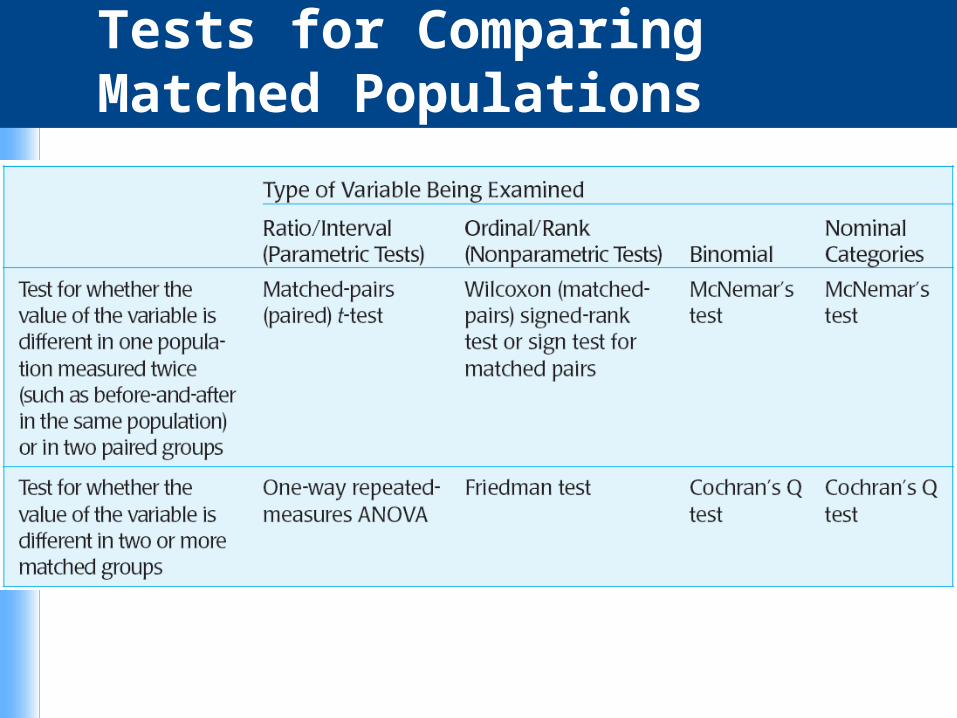
Tests for Comparing Matched Populations

Examples of Tests for Comparing Pretest and Post-Test Results for Participants in a 3-Month Exercise Program

Avoid being a “Lone Ranger”.
Let a statistician help!