
Collaborative Web Accessibility Improvement
127
Collaborative Web Accessibility Improvement with Users and Volunteers Graduate School of Systems and Information Engineering University of Tsukuba November 2011 Daisuke Sato
Transcript of Collaborative Web Accessibility Improvement

Collaborative Web Accessibility Improvement
with Users and Volunteers
Graduate School of Systems and Information Engineering
University of Tsukuba
November 2011
Daisuke Sato

i
Abstract
The Web connects people and brings new opportunities for collaborative activities. This
affects not only mainstream Web applications such as wikis and social networking
services, but also accessibility-related services. This dissertation describes a
collaborative Web accessibility improvement system that can adapt Web content to be
more accessible for various types of users. This approach solves accessibility problems in
a timely manner through collaboration among Web users who face barriers on a webpage,
the site's owners, developers, and volunteers who are interested in Web accessibility.
Although concerns about Web accessibility have become widespread among site owners
and developers in response to accessibility guidelines and laws, there are still many basic
accessibility problems with webpages. The collaborative approach complements the
guidelines and legislation and seeks to support accessibility for everyone as a human
right.
The main theme of this study is to transform the concept of Web accessibility which
was thought to be a staff responsibility into a new, broader concept that allows anyone,
including the actual users and any volunteers, to refine the accessibility by authoring
external metadata. First, this thesis describes a collaborative Web accessibility
improvement approach with an implementation called Social Accessibility. This was a
20-month experiment with about 150 visually impaired users and about 340 volunteers.
The experiments show the feasibility of and improvements in this approach and I also
describe the lessons learned. Thanks to the active participation of the volunteers,
improvement requests from the users were handled in times as short as several minutes,
with about half of the problems being addressed within 24 hours. The accessibility
visualization technology provides an intuitive user interface to help understand and
renovate the webpages, and this encouraged the volunteers to join in the work. We
improved existing accessibility technologies and proposed a new visualization technique.
There is also experimental evidence of the superiority of the new accessibility
visualizations.
This approach also aims to expand the possible ways of applying external metadata
into advanced assistive technologies, allowing for new kinds of user experiences.

Abstract ii
Although the experiment with the Social Accessibility system focused on basic
accessibility problems, the volunteers are able to create more intelligent and informative
metadata for the webpages. By utilizing these kinds of advanced metadata we proposed a
new assistive technology, voice-augmented Web browsing. The voice-augmented system
provides a secondary supplemental voice, which overlaps the main screen reader voice
for people with visual impairments and improves their performance and confidence in
navigation on webpages. In an alternative scenario involving older adults, the system
provides a supportive voice modeled after a family member standing nearby to give them
confidence and reassurance.
This thesis makes four original contributions. (1) It proposes a collaborative way to
improve Web accessibility with users and volunteers. (2) It presents the findings from a
20-month experiment with actual users and volunteers. (3) It improves existing
accessibility visualization technique and proposes a new accessibility visualization
technique for the reading order of Web content. (4) The thesis then describes an assistive
technology for voice augmentation of websites, introducing a new user experience with
external metadata.

iii
Acknowledgements
I would like to give heartfelt thanks to my advisor, Professor Jiro Tanaka whose comments and
suggestions were of inestimable value for my work. His technical and editorial advice and his warm
words of encouragement were essential to the completion of this dissertation.
Special thanks also go to Dr. Chieko Asakawa, Dr. Hironobu Takagi, Dr. Masatomo Kobayashi,
Dr. Susumu Harada, and Shaojian Zhu whose opinions and information have greatly helped me
throughout this work.
I would like to thank the members of the thesis committee, Professor Hiroyuki Kitagawa, Professor
Yukio Fukui, Professor Shoji Makino, Dr. Tomohiro Haraikawa (all of the University of Tsukuba) ,
and Associate Professor Tomoyuki Nishioka (Tsukuba University of Technology), for their extensive
comments and criticism.
I would also like to express my gratitude to all of the members of the accessibility research group at
IBM Research – Tokyo and IPLAB at the University of Tsukuba with whom I have worked and
played and eaten.
I also would like to thank all of the people involved in my experiments, including the participants
in the Social Accessibility service trials, the relevant parties involved in the WAIS project in Tottori
Prefecture, and the Tottori Prefecture Information Center (TIC), and all of the participants in the
various user experiments. Their active participation and diligent effort were crucial.
Last, I would like to thank my wife Ayako for her understanding and love. Her support and
encouragement was in the end what made this dissertation possible. Also my entire family receives
my deepest gratitude, especially my parents for their dedication and the many years of support during
my undergraduate and masters course studies that provided the foundation for this work.

iv
Table of Contents
Chapter 1 Introduction ................................................................................................. 1
1.1 Volunteering and Accessibility ............................................................................... 2
1.2 Approach and Goals ............................................................................................... 2
1.3 Our Contributions .................................................................................................. 3
1.4 Summary of Thesis ................................................................................................. 4
Chapter 2 Social Accessibility ...................................................................................... 5
2.1 Social Accessibility Service ..................................................................................... 6
2.1.1 Architecture ..................................................................................................... 6
2.1.2 End User Tool .................................................................................................. 8
2.1.2.1 Problem Reporting and Metadata Application ........................................ 9
2.1.2.2 Advanced Functions ................................................................................. 9
2.1.3 Metadata Authoring Tool for Volunteers ........................................................10
2.1.3.1 The First Prototype .................................................................................10
2.1.3.2 Visual Metadata Authoring Tool ............................................................. 11
2.1.3.3 Metadata Inference .................................................................................13
2.2 Examples of Collaboration ....................................................................................14
2.2.1 Case 1: Hospital Website ................................................................................14
2.2.2 Case 2: Radio Station Website ........................................................................15
2.2.3 Case 3: Website of a Local Foundation for People with Disabilities .............15
2.2.4 Case 4: Sightseeing Information Site .............................................................15
2.3 Activity Analysis ....................................................................................................16
2.3.1 Problem Solving by Volunteers.......................................................................16
2.3.2 Requests from Users .......................................................................................18
2.3.3 Quality of the Created Metadata ...................................................................19
2.3.4 Robustness of the Created Metadata .............................................................20
2.3.5 Sustainability .................................................................................................23
2.4 Findings and Challenges .......................................................................................23
2.4.1 Time Effectiveness ..........................................................................................24
2.4.2 Request-driven Model .....................................................................................25

Table of Contents v
2.4.2.1 Users' lack of awareness of problems .....................................................25
2.4.2.2 Too many basic problems ........................................................................26
2.4.3 Quality of Created Metadata ..........................................................................26
2.4.4 Robustness of Created Metadata ...................................................................27
2.4.5 Sustainability .................................................................................................28
2.5 Social Accessibility Service for Site Owners .........................................................28
2.5.1 Improvements from Public Social Accessibility Service ................................29
2.5.1.1 Backstage Metadata Application Model .................................................29
2.5.1.2 Accessibility Crawler ..............................................................................30
2.5.1.3 Site-wide Metadata Inference .................................................................31
2.5.2 Summary of Improvement ..............................................................................33
2.5.2.1 Participants and Productivity .................................................................33
2.5.3 Lessons Learned .............................................................................................35
2.6 Next Steps .............................................................................................................35
2.6.1 Activating the End Users ...............................................................................35
2.6.2 Metadata Quality Management .....................................................................37
2.7 Related Work .........................................................................................................37
2.8 Summary ...............................................................................................................40
Chapter 3 Reading Order Visualization......................................................................42
3.1 Problems with Reading Order ...............................................................................42
3.1.1 Visualization of Reading Flow ........................................................................43
3.1.2 Editing of the Reading Flow ...........................................................................45
3.1.3 Granularity Control of Reading Flow ............................................................46
3.2 Experiments ..........................................................................................................47
3.2.1 Participants ....................................................................................................47
3.2.2 Implementation ..............................................................................................47
3.2.3 Test Devices ....................................................................................................48
3.2.4 Task 1: Determining the Quality of the Reading Order ................................48
3.2.5 Task 2: Revising the Reading Order of the Content ......................................49
3.2.6 Results ............................................................................................................50
3.3 Discussion ..............................................................................................................52
3.3.1 Effectiveness and Visual Patterns .................................................................52
3.3.2 Interface for Correction ..................................................................................53
3.3.3 Possibility for Collaborative Correction .........................................................54
3.3.4 Feedback to the Original Content ..................................................................54

Table of Contents vi
3.4 Related Work .........................................................................................................55
3.5 Summary ...............................................................................................................56
Chapter 4 Voice Augmented Web Browsing ................................................................57
4.1 Voice Augmentation ...............................................................................................58
4.1.1 Voice Augmentation for the Blind ..................................................................58
4.1.2 Voice Augmentation for Older Adults .............................................................60
4.2 User Experiment with Blind Users ......................................................................62
4.2.1 Implementation of Prototype System .............................................................62
4.2.1.1 Role-based Notifications and Jumps ......................................................62
4.2.1.2 Page Overview and Text Analysis ...........................................................63
4.2.2 Pilot Study ......................................................................................................63
4.2.3 Main Study .....................................................................................................64
4.2.3.1 Equipment ...............................................................................................64
4.2.3.2 Sasayaki Conditions ................................................................................65
4.2.4 Tasks ...............................................................................................................65
4.2.4.1 Tasks 1 and 2: Reading a news article....................................................66
4.2.4.2 Tasks 3 and 4: Shopping for a product ...................................................66
4.2.4.3 Task 5: Searching for a price in a list of search results .........................66
4.2.5 Questionnaire and Interview .........................................................................66
4.3 Results of User Experiments with Blind Users ....................................................67
4.3.1 Task Completion Time ....................................................................................67
4.3.2 Subjective Scores ............................................................................................68
4.3.3 Navigation Behavior Analysis ........................................................................69
4.3.4 Navigation Trace Analysis ..............................................................................70
4.4 User Experiment with Older Adults .....................................................................73
4.4.1 Study 1: Banking and Shopping .....................................................................73
4.4.1.1 Participants .............................................................................................74
4.4.1.2 Procedure.................................................................................................74
4.4.2 Study 2: Webforms ..........................................................................................76
4.4.2.1 Participants .............................................................................................77
4.4.2.2 Procedure.................................................................................................77
4.5 Results of User Experiments with Older Adults ..................................................78
4.5.1 Results of Study 1 ...........................................................................................78
4.5.1.1 Could not grasp content structure and meaning ....................................78
4.5.1.2 Did not understand widgets ....................................................................78

Table of Contents vii
4.5.1.3 Did not know the function of the application or understand the general
GUI metaphors .........................................................................................................79
4.5.1.4 Anxiety Interference ...............................................................................79
4.5.2 Results of Study 2 ...........................................................................................79
4.5.2.1 Keyboard Analysis...................................................................................81
4.6 Discussion ..............................................................................................................82
4.6.1 Navigation Improvements with Sasayaki ......................................................82
4.6.2 Are Two Simultaneous Voices Distinguishable? ............................................83
4.6.3 Tradeoff of Confidence for Speed ....................................................................84
4.6.4 Another Way to Gain Confidence ...................................................................85
4.6.5 Will They Want to Stop the Assistant? ...........................................................86
4.6.6 Potential Applications ....................................................................................86
4.7 Related Work .........................................................................................................87
4.8 Summary ...............................................................................................................91
Chapter 5 Conclusion ..................................................................................................93
5.1 Summary of Contributions ....................................................................................93
5.2 Future Work ..........................................................................................................94
Appendix A Details of Metadata Application ...............................................................96
A.1 List of Metadata ....................................................................................................96
A.1.1 Perceivable ......................................................................................................96
A.1.2 Operable ..........................................................................................................98
A.1.3 Understandable ..............................................................................................99
A.2 Sample Bootstrap Code for the Back Stage Model ............................................. 100
Appendix B Details of the Reading Flow ................................................................... 101
B.1 Drawing Smoothly Connected Path .................................................................... 101
B.2 Controlling Granularity Level of Reading Flow ................................................. 102

viii
List of Tables
Table 2.1. Ratio of Metadata Types .............................................................................17
Table 2.2. Classification of User Requests ..................................................................19
Table 2.3. Classification of Requested Websites .........................................................20
Table 2.4. Number of Automatically Detected Problems ............................................34
Table 2.5. Number of Participants ..............................................................................34
Table 2.6. Productivity of the Renovation ...................................................................34
Table 2.7. Focus of Each Organization ........................................................................34
Table 3.1. The relationships between the properties of the elements and their
visualization ..........................................................................................................44
Table 4.1. Numbers of participants who failed to complete a task within the time
limit .......................................................................................................................68
Table 4.2. Number of participants with incorrect answers during each test .............68
Table 4.3. The average ratios of navigation command usage .....................................70
Table 4.4. Experience with online banking and shopping ..........................................75
Table 4.5. Translations of the items from the questionnaire ......................................78

ix
List of Figures
Figure 2.1. Basic Architecture of Social Accessibility Service ..................................... 6
Figure 2.2. Current Process Model ............................................................................... 7
Figure 2.3. A screen shot of the Web browser with the activated end-user tool .......... 8
Figure 2.4. Example Screen of Authoring Tool in Sidebar ..........................................10
Figure 2.5. Examples of Page Map User Interface .....................................................12
Figure 2.6. Example of Inference on Page Map User Interface ..................................14
Figure 2.7. History of the number of registered participants .....................................16
Figure 2.8. Ratio of Time for Solving Requests (from 0 hours to 1 week) ..................18
Figure 2.9. Ratio of the metadata availability ............................................................22
Figure 2.10. History of Participants' Activities ...........................................................23
Figure 2.11. Comparison of metadata application method: backstage model and
on-stage model ......................................................................................................30
Figure 2.12. Example of insertion of one line code into the template ........................31
Figure 2.13. Accessibility improvement by site-wide metadata authoring ................32
Figure 3.1. An example of an inaccessible layout using a table .................................43
Figure 3.2. A fine-grain visualization of the reading flow of a University of Tsukuba
webpage .................................................................................................................44
Figure 3.3. An example of organizing the reading flow ..............................................45
Figure 3.4. An example of changing the granularity of the reading flow ...................46
Figure 3.5. Task completion times (seconds) with standard errors ............................50
Figure 3.6. Error rate (%) for quality assessment ......................................................51
Figure 3.7. Task completion times (seconds) with standard errors for reading order
revision ..................................................................................................................51
Figure 3.8. Examples of reading flows with problems ................................................53
Figure 4.1. Concept of Sasayaki User Interface Agent ...............................................59
Figure 4.2. Concept of voice-augmented Web browsing ..............................................61
Figure 4.3. The average task completion times ..........................................................67
Figure 4.4. The average subjective scores for NS-NJ vs. S-NJ ...................................69
Figure 4.5. The average subjective scores for NS-J vs. S-J ........................................69

List of Figures x
Figure 4.6. The average number of keystrokes ...........................................................70
Figure 4.7. Navigation traces on Nikkei newspaper for NS-NJ and S-NJ by P4 .......71
Figure 4.8. Navigation traces on Asahi newspaper for NS-NJ and S-NJ by P6 ........72
Figure 4.9. Navigation traces on Asahi newspaper for S-NJ by P3 and P9 ...............73
Figure 4.10. Navigation traces on Amazon product pages for NS-J by P4 and S-NJ by
P8 ..........................................................................................................................73
Figure 4.11. Comparison of task completion times .....................................................80
Figure 4.12. Comparison of error rates of tasks .........................................................81
Figure 4.13. Subjective scores for the questions .........................................................81
Figure 4.14. Cumulative ratio of key type interval for each participant ...................82
Figure 4.15. The average number of repetitions on Amazon search result pages .....84
Figure A.1. Sample bootstrap code for the back stage metadata application .......... 100
Figure B.1. Examples of control points between two blocks ..................................... 102

1
Chapter 1
Introduction
Three out of every ten people use the Web [Miniwatts Marketing Group 2011], which
allows them to access many types of information at any time and which is leading to
many paradigm shifts in our daily activities. The Web has grown rapidly over the last
two decades and is becoming an essential part of our social infrastructure. Online
shopping services are bringing new experiences and changing our behaviors, social
networking services connect friends all over the world and are causing a revolution in our
communities, and remote work is allowing us to work with people in faraway places
without even leaving our homes.
At the same time, these major advantages are also creating new kinds of social issues
and concerns. In spite of the increasing importance of the Web, usability barriers are
appearing in many Web services, isolating various groups of users, such as people with
disabilities who use screen reading software to access content. To estimate the size of
these kinds of problems, there are an estimated 700 million people with limited reading
literacy [UNESCO 2008] and 300 million with visual impairments [WHO 2011].
Thanks to recent Web accessibility work on guidelines (such as [WCAG2.0;
WAI-ARIA]) and the adoption of standards and laws (such as [Section 508; ISO/IEC
2001; eEurope 2002; JIS X 8341-3:2010]), there are bright spots in various categories of
websites, such as e-government sites, news and publication sites, and text-oriented
consumer-generated content. The Convention on the Rights of Persons with Disabilities
also states that accessibility is a human right: "To enable persons with disabilities to live
independently and participate fully in all aspects of life, States Parties shall take
appropriate measures to ensure to persons with disabilities access" [United Nations
2006].
However, there are many basic accessibility problems still remaining on the Web.
Missing alternative text, inadequate headings, or inaccessible tables often lead to
misunderstandings and make it hard to navigate among pages within a service. Such
problems mean that visually impaired users are often unable to buy goods or to join in

Chapter 1 Introduction 2
remote collaborations.
In addition, it is increasingly important to make Web content accessible for aging
populations, because elderly people often tend to shy away from using such services as
online banking and online shopping. People experience various degenerative effects of
ageing in their senses of vision and hearing, in their psychomotor abilities, and in their
attention and memory [Harper et al. 2008]. Even people who are happily using the Web
now may face problems in the future, because the technologies are always evolving and
the new technologies will be different [Hanson 2009]. The percentage of elderly people
(60 or older) is continuing to rise. They currently constitute over 10% of the world's
population, but over 20% in many developed countries [United Nations 2010].
1.1 Volunteering and Accessibility
Various types of accessibility have been improved through the volunteer-based
activities of nonprofit organizations (NPO) or public organizations. For example, there
are sign language translations, video transcriptions, and book translations into voice or
Braille. One of the examples is Bookshare.org, which is a "social scanning" service for
printed books in the United States [Benetech]. People with visual disabilities and
reading disabilities around the world can access these books that were collaboratively
scanned or transcribed by volunteers. They offer more than 70,000 digital books to more
than 80,000 users who are blind. The volunteers receive incentives for submitting or
validating books, with financial support coming from the U.S. government and many
companies and nonprofit organizations. Salamon et al. [2007] reported that activities of
volunteering and NPOs are responsible for an average of 5% of the Gross Domestic
Product (GDP) in eight major countries. Considering the increasing importance of the
Web as part of the infrastructure of our society, utilizing the power of volunteers and
NPOs is a very natural and feasible way to make Web content more accessible for
everyone.
1.2 Approach and Goals
We are proposing a method called collaborative Web accessibility improvement, which
allows us to improve accessibility through collaborations between volunteers and the
users who are facing the accessibility barriers. The collaborations begin with the users'
requests, which are submitted when they encounter accessibility problems on webpages.
Although the Web content is under the control of the site owners and they are
responsible for making the content accessible, this approach allows volunteers to
Chapter 1 Introduction 3
improve the accessibility of the content without relying on the site owners by creating
external metadata.
One of the goals of this study is to establish a sustainable development lifecycle for
accessible Web content for everyone based on collaborations among users, volunteers,
and site owners. We believe that volunteer efforts can address accessibility needs and can
be accelerated through technologies such as accessibility visualization to lower the
barriers to participation.
Another goal of this work is to enrich the browsing experience of the users so they can
enjoy the Web content more naturally and more comfortably. The external metadata
approach can apply not only to complement content accessibility but also go beyond the
current accessibility limitations. We believe that voice-augmented Web browsing
techniques, which provide audible support for users based on the external metadata, can
also enhance the usability for people with various disabilities, such as the elderly.
1.3 Our Contributions
Here are the main foci of this dissertation:
1. Introduction of a collaborative Web accessibility improvement system.
We proposed collaborative Web accessibility improvements and implemented a
prototype system called the Social Accessibility Service to improve the accessibility
of the Web for blind users through collaboration with volunteers. This was the first
implementation of a public accessibility metadata repository that conformed to the
accessibility metadata specification named Accessibility Commons, which was
developed by four of the leading labs working on accessibility research [Kawanaka
et al. 2008].
2. Findings from a long-term experiment with the external metadata authoring
system involving actual users and volunteers.
A 20-month-long online experiment was conducted using the Social Accessibility
service with about 150 end users and about 340 volunteers, which discovered both
positive and negative effects of the collaborative Web accessibility improvement
approach. These findings will be very useful for similar projects that use
collaborative methods to improve accessibility, and they are guiding the next steps
of this work.
3. Providing accessibility visualization and response techniques to understand and
address the accessibility problems.
We showed that accessibility visualization helped volunteers actively participate

Chapter 1 Introduction 4
in the collaborations. Also, the visualization for reading order reduced the time to
recognize and fix problems in the reading order of documents. Visualization
techniques are needed to support collaboration for broader volunteer populations
with limited knowledge of accessibility but with a passion to help other people.
4. Prototyping of voice augmentation techniques to change the browsing experience
of blind users and older adults.
Voice augmentation can help give people more courage to explore the Web by
providing contextual support based on metadata created by volunteers. We showed
how the voice augmentation changes their minds about the difficulties, giving
them more positive attitudes and improving their performance of tasks. This
approach can increase the power of assistive technologies.
1.4 Summary of Thesis
This dissertation has five chapters and the related work for each topic is covered within
the corresponding chapter. The second chapter describes the architecture of a
collaborative Web accessibility improvement system and the initial user interface design
for the tools for users and volunteers. Then this chapter covers examples of
collaborations and analyzes the logs in detail for a long-term online experiment that was
freely available to the public. Another deployment to improve the webpages of a local
government in Japan that used a limited NPO community is also described. The third
chapter discusses the importance of accessibility visualization for volunteers and
introduces a new visualization technique called reading flow. Then this chapter describes
an experiment with this user interface and the results. The fourth chapter describes an
innovative assistive technology, voice augmentation, which supports blind users and
older adults in browsing the Web with more comfort. Then this chapter reviews the user
interface design for both user populations, presents two evaluations of the user interfaces,
and considers the possibilities for metadata authoring involving volunteers to support
the assistive technologies. The fifth chapter concludes this dissertation and summarizes
future work.

5
Chapter 2
Social Accessibility
This chapter describes Social Accessibility, a prototype Web service based on the idea of
collaborative Web accessibility improvement. First, the design and architecture of the
Social Accessibility system are presented, including detailed descriptions of the client
tools. We conducted an extended experiment to investigate how people collaborate with
this system and what they could accomplish with it [Sato et al. 2010]. The duration of the
experiment was 20 months from July 2008 and about 500 people participated online.
Both the design principles and the results of the online experiments are presented,
followed by more detailed analysis of the results. We discuss some of the successes and
limitations of our approach, and propose future directions, not only for this specific
project, but also for similar projects that aim at better accessibility through social
collaboration. Although this service is currently addressing only the problems in
webpages as encountered by users who are blind and using screen readers, this approach
could be extended to support all types of accessibility problems, such as people with
hearing impairments, people who are elderly, and people with limited literacy.
Our central theme is: How can such collaborative approaches adapt the Web to
increase accessibility? To address this central theme, we broke our analysis into five
sub-themes:
• Can volunteers fix the reported problems in a timely manner? What types of
metadata support can they create?
• How can users report their problems to the service? What types of requests were
reported on what types of sites?
• How good is the metadata provided by volunteers?
• How robust is the created metadata against the evolution of the content?
• How can we create a self-sustaining service with active participation?
Based on our experiences, the productivity of volunteers was higher than we had
anticipated. They were able to work effectively to respond to the requests from users in a
timely manner and their metadata work was of good quality. We encountered no

Chapter 2 Social Accessibility 6
malicious or mischievous volunteers. This may be because the original system provides
relatively limited functions targeted at specific accessibility problems and because the
community was relatively small. The robustness of the metadata roughly matched our
expectations, but improvements are needed to make the metadata more robust against
changes in the Web, such as resource relocation and updates within webpages.
The ultimate goals are to help end users access more websites with greater ease and
satisfaction through collaboration while also helping the site owners with accessibility
concerns, including guideline-based compliance. Later, we deployed a similar system,
though not a fully public service but targeted to support all of the website of a local
government, Tottori Prefecture in Japan. They hired about 20 people with disabilities
from a NPO as private-source website renovators. The results of their efforts and the
lessons learned are also covered.
2.1 Social Accessibility Service
Our Social Accessibility Project [IBM 2008] allows us to improve the accessibility of
any webpage by providing external metadata without requiring the site owners to modify
the pages. This creates opportunities to bring people who face problems in accessing
webpages together with people who have a passion to address the Web's accessibility.
2.1.1 Architecture
Figure 2.1 shows the basic architecture of the service. The system has a public server
as the metadata repository and both the end users and volunteers access the repository
Social Accessibility Server
Open
Repository
Client PC
Volunteer Tool
(Firefox Sidebar)
UsersClient PC
End User Tool
(Windows Application)
Web API
(JSON)
Portal
Site
Web Browser
(IE or Firefox)Screen
Reader
Web Browser (Firefox)
Volunteers
• Metadata
• Request
• Discussion
• Log
Figure 2.1. Basic Architecture of Social Accessibility Service

Chapter 2 Social Accessibility 7
by using client-side tools with Web APIs or by visiting the portal site on the Web. We also
regard the users as volunteers, because skilled users of screen readers can also support
novice users. Figure 2.2 shows a typical interaction using the service. It starts with an
end user's report that describes problems on a webpage in the user's own words. The end
user can not only describe the accessibility problems, but also ask general questions
about the webpage. These reports go to the volunteer community instead of to the site
owner (as with a contact form). Then a volunteer can either create external metadata to
fix the reported problem or directly answer the questions. As a result, the end user can
browse the webpage that was made accessible with the metadata or with the benefit of
the volunteer's explanation. This reporting-based strategy allows quick solutions to
accessibility problems, while reducing the volunteers' work, and focuses on problems that
end-users actually encounter.
The following is a concrete example of the process of improvement. (1) The end user
reports the problem as "Please add headings for the page at http://www.example.jp". (2) A
volunteer creates metadata with a URI pattern of "http://www.example.jp" and an XPath
notation such as "/HTML[1]/BODY[1]/TABLE/DIV[1]" with a heading level 2 as the
metadata type. (3) The end user can now call the function to "apply metadata" to fix the
webpage using the client-side tool. The client-side tool looks for any metadata for
"http://www.example.jp" by calling the Web API with that URI. The Web service returns
the metadata records matching the URI, and finally the client-side tool applies the
heading metadata in the page. This creates the proper heading level 2 tags around the
Social
Accessibility
Server
Accessibility
Commons DB
ProblemProblem
Volunteer
Community
End User
Accessibility
Metadata
Accessibility
Metadata
Fix
Accessibility
Metadata
Fix
Accessibility
Metadata
(1) Problem
Reporting
(3) Browsing
(2) Metadata
Authoring
Notify
Report
SubmitLoad
Figure 2.2. Current Process Model

Chapter 2 Social Accessibility 8
target DIV elements. Applying the metadata to the webpage will typically take a few
seconds, depending on such factors as the network traffic and the quantity of metadata.
The most important feature of the service is the public metadata repository. This
allows the metadata to benefit all of the end users, not just the user who originally
reported the problem. Metadata also can be redistributed to other services compatible
with Accessibility Commons metadata [Kawanaka et al. 2008], which is a specification
for metadata created by several research organizations and universities. In addition, the
source code of the metadata repository service including the Web APIs and the portal site,
has been open sourced as a project called Multimodal Collaboration Framework (MCOF)
at SourceForge [MCOF].
We have also added some special functions since the service started in July 2008 to
encourage more active collaboration within the community. Based on the feedback we
received and our analyses of user activities during the pilot study, we frequently
improved our prototype system. Some of these changes are described in the following
sections.
2.1.2 End User Tool
For screen reader users, we want to provide tools to enhance their browser functions
while allowing them to report accessibility problems at any time on any webpage and to
quickly improve their Web experiences using the external metadata. Therefore we
developed a native application for Windows® as a resident end-user tool. This utility
offers a dialog menu whenever the user presses its short-cut key while browsing the Web.
(Figure 2.3). This approach is independent of the screen reader and supports two major
Web browsers, Microsoft Internet Explorer® and Mozilla Firefox®.
Figure 2.3. A screen shot of the Web browser with the activated end-user tool

Chapter 2 Social Accessibility 9
2.1.2.1 Problem Reporting and Metadata Application
The menu includes problem reporting and metadata patching to apply metadata to a
displayed webpage. The resident utility works by injecting special JavaScript code into
the webpages to support its functions. The injected code inspects the webpage and
extracts the required information. For example the title of the webpage for the problem
report, the URL of the webpage, and the URLs of any embedded resources such as
images and Flash® objects as needed by the display with metadata. Problem reporting
uses the POST method of the HTTP/HTTPS protocol and sends the information about the
problematic webpage to open a separate webpage where the users can input a description
of the problem. The metadata application uses a sophisticated technique to obtain the
metadata from the metadata repository server, because there are cross-domain access
limitations since the domain of the target webpage is different from the domain of the
metadata server.
A special Flash® object is loaded into the webpage from the metadata server with a
cross-site configuration that allows the JavaScript code to access to metadata server
through the external interfaces of the Flash® object. Also, some other JavaScript code for
the metadata application is simultaneously loaded into the webpage to work with the
obtained metadata records. The metadata records are consumed in a certain order so
that the metadata is used properly. Some metadata affects the document structure of the
webpage, which can disrupt the XPath references. Appendix A shows the details of the
implemented metadata in the system and which criteria of the guidelines are controlled
by each type of metadata.
2.1.2.2 Advanced Functions
The end-user tool also has an advanced feature to handle elements ignored and
inaccessible with earlier approaches. These elements include images with no alternative
text and Flash® movies in the opaque mode. Since screen readers ignored these elements
they were completely inaccessible, while our new feature creates menus to handle these
problems (plus a submenu for the lower-level elements of opaque Flash® movies). These
opaque-mode Flash® movies are one of the major recent gaps created between visual
browsers and screen readers in modern webpages with multimedia content. In addition,
these menus allow expert users to create alternative text labels for these inaccessible
elements based on the context. Once specified, the text labels are stored in the public
metadata repository. This is another way blind users can participate in the project,

Chapter 2 Social Accessibility 10
acting as metadata authors in certain cases, not just as problem reporters. Since Flash®
movies use an object model with a flat object list, it is not possible to identify each object
by hierarchy-based addressing such as XPath, and so the function to label Flash® objects
uses coordinate-based addressing for each object.
2.1.3 Metadata Authoring Tool for Volunteers
The metadata mainly consists of three attributes: type, description, and addressing
(URI pattern and XPath). We developed a metadata authoring tool for the first prototype
which automatically generates and displays URI patterns and XPaths so that renovators
can customize the patterns and paths. However when we demonstrated the tool to a
volunteer organization, they expressed concerns about the usability of the authoring tool.
Based on this feedback, we decided to develop a visual metadata authoring tool that
encapsulates the details of the metadata descriptions.
2.1.3.1 The First Prototype
Figure 2.4 shows an example of screen of the first prototype of the authoring tool which
Fo
rm f
or
met
ad
ata
Scr
een
rea
der
sim
ula
tio
n v
iew
Figure 2.4. Example Screen of Authoring Tool in Sidebar

Chapter 2 Social Accessibility 11
is provided as a sidebar extension of Mozilla Firefox®. The view has several modes. The
main mode is a simulation of the reading text that would be heard from a screen reader.
The screen reader simulation uses color coding, such as red text to show obvious
accessibility problems (such as an image without alternative text), blue text to show the
current heading tags, and green text to show the already existing external metadata for
the page (from the repository). As an example, when a volunteer clicks an image without
text, a basic form to create supplemental alternative text for the image appears. When a
volunteer clicks on a text fragment next to an image, a different form appears, a form
designed to create an element heading tag with some additional commentary. When the
submit button is clicked for any of these forms, the created metadata is automatically
submitted to the server. The tool also provides a "page map" function to give a visual
overview of the accessibility status of the page. In this view, all of the related information
as color coded in the screen reader simulation is overlaid on the thumbnail image of the
whole page. This function helps volunteers to get an overview and understand the
necessary repairs for the page.
2.1.3.2 Visual Metadata Authoring Tool
For novice volunteers the most difficult part of making metadata is creating a
reference that describes where the problems are. The first prototype had a text-based
interface for metadata authoring. That forced the volunteer to locate the problems in the
HTML representation of each webpage. This unfriendly interface discouraged volunteers
from participating in the pilot study. To address this problem, we added visual authoring
functions to the page map (Figure 2.5 and Figure 2.6). The new version of page map is a
WYSIWYG-style metadata authoring tool that handles such technical concerns as the
XPath expressions and HTML behind the scenes. Since the content of the webpages is
gradually updated over time, the system tries to generate robust XPath that will be as
resistant as possible against the updates. Instead of using an absolute path, the system
uses a relative path from the nearest parent having an id attribute whenever possible.
Another powerful technique is to use the value of the attributes to specify an element
from among sibling elements with the same tags. Section 0 gives an analysis of the
robustness of the created metadata entries.
This tool is also provided as a sidebar extension of Mozilla Firefox®, appearing on the
right side of the browser. It shows an image of the webpage without changing the original
layout. This allows novice volunteers to easily understand the concept of the tool so they
can easily choose a webpage element for the external metadata by just clicking on that

Chapter 2 Social Accessibility 12
element. Exclamation marks used as error icons appear on the image for such metadata
targets such as inaccessible images, thus guiding and helping the volunteers in adding
useful metadata (Figure 2.5a). Inaccessible images include those without alternative text
or with uninformative alternative text (such as "banner" or "spacer"). Also marked are
image links pointing to the same destinations as nearby text links. These error detecting
functions are based on the technologies of the accessibility-checking tool called aDesigner
[Takagi et al. 2004]. Clicking on an error icon invokes a dialog box with a description of
the accessibility problem and how to fix it, with an easy-to-use input form for the new
metadata.
This visual editor also visualizes the estimated times needed for a screen reader to
reach each element using another aDesigner technology. The darker elements in Figure
2.5a take longer to access, indicating that additional headings are called for. This helps
the volunteers with the headings metadata. When a volunteer clicks on such an element,
a dialog box appears to specify a heading level (H1-H6) with an optional text description.
Once the metadata is created, an icon indicating the metadata type is shown at the
position where the metadata was added (Figure 2.5b). The original method of the
aDesigner changes the background color of each element and indicates that the elements
with darker background take longer to access. However this process collapses the visual
layout of the webpage when showing the results of the visualization because it removes
(a) Before metadata authoring (b) After metadata authoring
Error
Heading level 1
metadata
Heading level 2
metadata
Alttext
metadata
Figure 2.5. Examples of Page Map User Interface

Chapter 2 Social Accessibility 13
all of the stylesheets in the webpage and then adds the background color. A new version
of this visualization method uses an overlapping opaque element on the original webpage
and adds shadows to each element according to the reaching time. This means the
results of the visualization can retain their original layout and this makes it easy for the
users to understand the usability of the webpage (Figure 2.5). To implement this function,
the system needs to traverse all of the elements of the document to check for overlaps
among elements. Specifically it checks the properties of the elements that are related to
the rendering layout such as float, position, and z-index of the style attributes to
determine the areas and orders of shadowing.
2.1.3.3 Metadata Inference
The page map also has a function to infer generalized metadata that covers repetitive
layout features. Many webpages use similar visual layouts several times within a page,
and fixing the same problem many times can become tedious. The inference algorithm is
quite simple. Initially, the volunteer creates a piece of metadata on the page map. Then
(beginning with the second piece of metadata created) the system calculates a similarity
metric between all possible pairs of metadata. Figure 2.6a shows that the volunteer has
created metadata for a heading. When the volunteer creates the next heading metadata,
the system will then recommend generalized metadata by showing balloon icons on the
page map (Figure 2.6b). In this case, two metadata records have been created. The XPath
expression for the first one is id("main")/DIV[1]/SPAN[1] and the second one is
id("main")/DIV[2]/SPAN[1]. Then the system creates a generalized metadata record with
the XPath id("main")/DIV/SPAN[1], which it then offers for the third and the fourth DIV
elements in the id("main") element. The system compares each pair of XPath expressions
in terms of each id expression, tag name, and each attribute including the index and then
generates a maximum match between two expressions. This means that a generalized
XPath expression and a normal XPath expression can also be merged into an even more
general XPath expression.
The volunteer can then check the coverage of the generalized metadata by clicking the
white icons, and can accept or reject each recommendation. If the volunteer accepts the
recommendation to generalize, then all of those pieces of metadata (linked by one set of
balloons), will be combined into a single piece of metadata, and this newly generalized
metadata may also apply to other places in the website.

Chapter 2 Social Accessibility 14
2.2 Examples of Collaboration
The collaborations among users and volunteers yielded various collaboration patterns.
We regard a successful case as one that helped real users with problems and a failure
case as one for which the service was unable to provide a solution. In this section we
review four examples, three successes and one failure.
2.2.1 Case 1: Hospital Website
In this success case, a user found that a website for a local hospital didn't seem to
make sense, and sent a request saying "I feel this page is too complicated and not easy to
understand." The underlying problems were things that the user was not even aware of
when the request was sent. Within seven hours of the request, an active volunteer
analyzed the request and decided to respond by addressing some of the basic problems in
the page. The volunteer created 10 alternative texts and 121 heading tags for 22 of the
webpages near the original target page. During the same period, a member of our
development team created four alternatives texts for buttons in a Flash® movie on the
target page, and described that work on the discussion board. On the following day, the
first volunteer created another alternative text and 61 heading tags for four additional
(a) First heading metadata is created (b) Second heading metadata is created
and four headings are inferred
First
heading level 2
metadata
Second
heading level 2
metadata
Inferred
headings
Inferred
headings
Inferred
headings
Inferred
headings
Figure 2.6. Example of Inference on Page Map User Interface
Chapter 2 Social Accessibility 15
pages, and changed the status to "resolved". The status decision seemed to include
reference to the public comment about the Flash® movie. In this case, the initial solution
was provided within 7 hours, and the final decision was made within 49 hours. Although
the original requester didn't explicitly react to the metadata creation, he did use the
created metadata a few weeks after the collaboration.
2.2.2 Case 2: Radio Station Website
This success involved a user who commented on a radio station page that "the heading
jump function of my screen reader does not work well on this page and also it seems like
some images don't have alternative texts." In this case, the request was concrete, since
the user was aware of the problems. Two volunteers created 5 alternative texts and 8
headings, and the status was changed to "resolved" 20 hours after the request was
submitted. However, the user also requested some "site-wide" metadata for related pages.
Four volunteers responded, eventually creating 140 alternative texts and 96 heading
tags. Finally the request was fully resolved 6 days after the initial request.
2.2.3 Case 3: Website of a Local Foundation for People with
Disabilities
In this success case, the collaboration led the user to understand the severity of a
problem that initially seemed to be a relatively small problem. The problem was in the
website of a local foundation for people with disabilities, and the user, who is an
experienced and skilled user, initially reported that "this site is generally
understandable but some alternative texts are missing, so please fix up this page." In
fact, the site had many accessibility problems. Six days after the request was submitted,
82 alternative texts and 19 headings had been created by two volunteers. The original
user commented "I was surprised that the original version of the page had other
information I was missing. I had accessed this site regularly for two years, but now I
became aware of the existence of the forum and the blog."
2.2.4 Case 4: Sightseeing Information Site
We classify this failure as an example of a technical gap that cannot be addressed with
our current technology. A user visited a webpage about sightseeing spots in a particular
town. The request was "Please explain the map." However the map was actually a
scrollable widget which was mashed up into the page from a major map service website,
which made it difficult to describe. After 30 minutes, a volunteer changed the status to

Chapter 2 Social Accessibility 16
"call for experts" with the comment "It is difficult to describe the scrollable map. I want
to call for the experts." The accessibility of such visual information is an old research
topic and it was difficult to provide any immediate help, so the appropriate status was
"technical pending" for this case.
2.3 Activity Analysis
In the previous section, four example collaborations were summarized. This section
presents some overall statistics about the service as of 1 March 2010. Figure 2.7 shows
the evolution of the number of registered participants. There are about 500 participants
including 152 end-users and 344 volunteers. We have also a guest account which is
mainly used by screen reader users.
2.3.1 Problem Solving by Volunteers
The volunteers created 19,398 metadata records in response to requests from the users.
The guest account created 1,781 metadata records (9.2%) and each registered volunteer
created 164.6 metadata records on average. There are 101, 14, and 2 volunteers who
create at least one, more than a hundred, and more than a thousand of metadata records,
respectively, out of 344 registered volunteers. About 70% of the metadata records were
created based on the users' requests and the others were created on the initiative of a
volunteer. Out of 1,092 domains, there are 307 domains that have 10 or more metadata
records and each domain has an average of about 52 pieces of metadata. The maximum
0
50
100
150
200
250
300
350
400
450
500
Jul.
2008
Sep. 2
008
Nov
. 200
8
Jan.
200
9
Mar
. 200
9
May
200
9
Jul.
2009
Sep. 2
009
Nov
. 200
9
Jan.
201
0
Mar
. 201
0The
num
ber
of
regis
tere
d p
arti
cipan
ts
Total
End -users
Volunteers
0
50
100
150
200
250
300
350
400
450
500
Jul.
2008
Sep. 2
008
Nov
. 200
8
Jan.
200
9
Mar
. 200
9
May
200
9
Jul.
2009
Sep. 2
009
Nov
. 200
9
Jan.
201
0
Mar
. 201
0The
num
ber
of
regis
tere
d p
arti
cipan
ts
Total
End -users
Volunteers
Figure 2.7. History of the number of registered participants

Chapter 2 Social Accessibility 17
number of metadata records for one domain was 521.
Table 2.1 shows the ratio of metadata types. The most frequent metadata type was
alternative text. This metadata covers alternative texts for non-textual objects, labels for
input forms, textual descriptions added to content, and alternative text for Flash®
content. The second most frequent metadata type was headings, which includes all six
heading levels (H1 – H6). These metadata records refer to text added as a heading (even
though the target may be inaccessible). The script to apply the metadata directly
modifies the DOM as required for each target HTML element. There were only 19 items
of metadata of this type that were created by users with the latest version of the
authoring tool. Landmarks are new destinations added as heading elements for
navigation within a page and the end-user tool can also reach them directly from the
beginning of the page. This is useful for making the main content more accessible if the
page has many headings before the main content.
The volunteers resolved 296 requests (83.4%) out of the 355 submitted requests and
only 26 requests (7.3%) remained fully unresolved. The requests are first labeled as
"unanswered" and volunteers can change the status with the authoring tool for
volunteers. When volunteers cannot resolve a problem, there are two options. If the
service is not technically capable of resolving the request, "technical pending" is the right
option. Only 18 requests (5.1%) were classified this way, mostly in relation to Flash® or
DHTML. If a request (or solution) was unclear to the volunteers, then the "call for
experts" option was appropriate. Only 15 requests (4.2%) were given this status.
Figure 2.8 shows the accumulative time for solving requests. The vertical axis shows
the percentage of requests resolved up to that time on the horizontal axes. All of the
requests resolved within one week are included in this figure. A total of 128 requests
Table 2.1. Ratio of Metadata Types
Metadata Type Count
Alternative text 12,942 (66.7%)
Alternative text for Flash® 614
Add Heading 6,196 (31.9%)
Add Heading Level 1 3,907
Add Heading Level 2 1,930
Remove Heading 119 (0.6%)
Landmark 122 (0.6%)
Others 19 (0.1%)
Total 19,398 (100%)

Chapter 2 Social Accessibility 18
(43.2%) were solved within one day (24 hours), increasing to 50% (150 requests) by 39
hours. However 83 resolvable requests (28.0%) required more than a week. Table 2.2
shows a classification of the requests as reported by the end users and is discussed in the
next section.
2.3.2 Requests from Users
Our requests came not only from the request mechanisms in the end-user tool but also
from a mailing list, from interviews, and from our work in experimental sessions, so it is
difficult to estimate the exact number of requests addressed by the volunteers. In this
section, we focus on deeper analysis of the requests submitted via the tool, a total of 355.
Many users, especially novices, used the no-registration guest account, which prevents
us from doing a deeper user-oriented analysis.
Table 2.2 shows the classification of the requests as reported by the users. For example,
if a user misunderstood a DHTML problem as being a problem with a missing heading,
then the request would be categorized as "Request for heading tags" as it was perceived
by the user. The largest numbers of requests were reported as problems with alternative
texts for images or for non-textual objects (140/355 = 39.2%), followed by requests for
heading tags (84/355 = 23.7%). Some users requested both alternative text and heading
tags in one report (15/355 = 4.2%). This was expected, since these are major problems on
the Web and since our service was especially designed to target these two kinds of
problems.
Beyond that, some non-obvious items appear. The third most-common item (20/355 =
0%
10%
20%
30%
40%
50%
60%
70%
80%
90%
100%
0 20 40 60 80 100 120 140 160
Time to Solve Requests (hours)
Cu
mu
lati
ve
Rat
io o
f S
olv
ed R
eques
ts
0%
10%
20%
30%
40%
50%
60%
70%
80%
90%
100%
0 20 40 60 80 100 120 140 160
Time to Solve Requests (hours)
Cu
mu
lati
ve
Rat
io o
f S
olv
ed R
eques
ts
0%
10%
20%
30%
40%
50%
60%
70%
80%
90%
100%
0 20 40 60 80 100 120 140 160
Time to Solve Requests (hours)
Cu
mu
lati
ve
Rat
io o
f S
olv
ed R
eques
ts
0%
10%
20%
30%
40%
50%
60%
70%
80%
90%
100%
0 20 40 60 80 100 120 140 160
Time to Solve Requests (hours)
Cu
mu
lati
ve
Rat
io o
f S
olv
ed R
eques
ts
Figure 2.8. Ratio of Time for Solving Requests (from 0 hours to 1 week)

Chapter 2 Social Accessibility 19
5.6%) is problems related to Flash®. Based on our previous work, around 50% of the
Flash® content is hidden from screen reader users [Asakawa et al. 2007]. This means
that typical users are not even aware of half of the Flash-related problems. In spite of
that, the users were often still aware of the existence of the inaccessible Flash® content.
This may reflect the latest Flash® access function of our end-user tool. Collectively,
questions were a large category. When a user was unsure of the exact nature of a problem,
they would send questions to the service. There were several types of questions, such as
asking why something couldn't be done (e.g. "Why can't I edit the reply message?"),
whether a certain object existed (e.g. "Where is the list of links?"), or if there was any
workaround for a problem (e.g. "How can I move to the next page?"). Table 2.3 shows a
classification of the targeted websites. A wide-variety of websites were involved in the
requests, such as online-shopping, public services, government sites, e-learning sites,
online-music/video sites, news sites, restaurant and hotel sites, sporting event sites,
social networking sites, and others. The list of target websites was fairly representative
of the variety to be found on the Internet. Government websites are relatively easy to fix
because most of these sites use static webpages, while online-music/video sites are
relatively hard to fix because DHTML and Flash® appear often.
2.3.3 Quality of the Created Metadata
We checked some of the metadata records manually to find out whether the volunteers
worked in a secure way and whether the volunteers created good quality metadata to fix
Table 2.2. Classification of User Requests
Request Types
Cou
nt
Perc
en
tage
Reso
lved
Tech
nic
al
pen
din
g
Call
for
exp
ert
s
Un
reso
lved
Request for alternative texts 140 39.4% 126 1 4 9
Request for heading tags 84 23.7% 78 0 2 4
Questions 46 13.0% 34 7 4 1
Request for making Flash accessible 19 5.4% 11 5 2 1
Request for alternative texts and headings 15 4.2% 14 0 0 1
Report for Form-related problems 12 3.4% 8 0 0 4
Request for removing repetitive information 10 2.8% 10 0 0 0
Request for landmarks 7 2.0% 5 2 0 0
Others (color-related, CAPTCHA, DHTML, etc.) 22 6.2% 10 3 3 6
Total 355 100.0% 296 18 15 26

Chapter 2 Social Accessibility 20
the webpages. For each volunteer of the 101 volunteers who created at least one
metadata record, we randomly selected some of the webpages that were repaired by that
volunteer, based on the belief that each volunteer's work ought to be consistent. We also
checked all 1,781 records of metadata created by the guest account. Social Accessibility
also has a reputation system for the volunteers (built into the end-user tool) with which
the end users can evaluate the metadata. Unfortunately, the current version of the
reputation system didn't work quite as intended, which may be because the modification
on a webpage is often not obvious to the users who are not familiar with the webpage and
who did not report the problems on the webpage. Therefore the quality of the created
metadata can best be understood from our manual investigations.
In our evaluations, there was no malicious metadata in any of the records we examined,
and most of the records were good repairs for the target webpages, though not perfect.
For example, some volunteers created alternative texts for images adjacent to their
intended target. Another problematic example was when different volunteers created
multiple metadata records for the same page, which can lead to redundancy or
inconsistency in the fixed page. This was possible because the current system does not
lock the page during the metadata editing.
2.3.4 Robustness of the Created Metadata
Since metadata is bound to the Web resources by using URI patterns and XPath
Table 2.3. Classification of Requested Websites
Website Types
Cou
nt
Reso
lved
Tech
nic
al
pen
din
g
Call
for
exp
ert
s
Un
reso
lved
Reso
lved
Rati
o
Online Shopping 52 43 2 1 6 82.7%
Public Service 47 43 1 2 1 91.5%
Government 44 42 2 0 0 95.5%
E-learning 38 33 2 1 2 86.8%
Online Music/Video 29 15 3 5 6 51.7%
News 25 22 0 2 1 88.0%
Restaurant & Hotel 25 21 2 1 1 84.0%
Sporting Event 21 19 0 1 1 90.5%
Social Networking Site 14 11 1 0 2 78.6%
Others 60 47 5 2 6 78.3%
Total 355 296 18 15 26 83.4%

Chapter 2 Social Accessibility 21
notations, the metadata is not permanently addressable as the webpage changes. The
system loads metadata records for a webpage by filtering using the URI of the webpage
and then applying the records to the proper elements. This means there are three types
of robustness: for the pages as determined by the URI patterns, for elements as
determined by XPath references, and for the Web as determined by both the URI and
XPath patterns.
On 10 March 2010, we examined the effectiveness of the 19,398 pieces of metadata
created in the pilot study between July 2008 and 1 March 2010. We built a crawler using
the Eclipse Accessibility Tools Framework [ACTF] to crawl static snapshots of webpages.
Our automatic crawler visited the webpages and tested whether or not the metadata
could still be applied on the 3,071 webpages for which the metadata was originally
created. Because some webpages changed after the time when their metadata records
were created, some metadata records were applied to elements that were not intended to
be modified. Even though this test did not catch such inappropriate application of
metadata, the results still provide us with an overall indication of the robustness of the
metadata specification.
The result shows that 2,582 webpages (84.1%) were still available, but 489 of the
webpages (15.9%) could no longer be found. In 1,286 webpages (41.9%), none of the
metadata was still valid. This means that a lot of those webpages changed without a new
URI. Out of the total of 19,398 pieces of metadata, we found that 10,330 metadata
records (53.3%) were loaded for the visited pages and 8,638 metadata records (44.5%)
were applied for 1,296 webpages (42.2%). These webpages were unchanged or only
partially changed, meaning that 1,692 metadata records could no longer be applied to the
webpages even though the webpages were found and loaded into the browser.
Figure 2.9 shows the quarterly trends of the metadata creation activities and the
metadata availability. The participants' activities decreased after the second quarter of
2009, so the metadata availability ratios are hard to interpret. However, we can still see
some trends with this graph. The graph contains three series of metadata totals, created,
loaded, and applied, and three series of availability ratios, the availability for pages
(suggesting how robust the metadata is against updates on the Web, especially as URIs
are moved, deleted, or renamed), the availability for elements (suggesting how robust the
metadata is against updates on the webpages), and the combined availability for the Web.
The availability ratios for pages, elements, and the Web for each month m are estimated
as

Chapter 2 Social Accessibility 22
)(
)()(
mC
mLmPagestyRatioForAvailabili ,
)(
)()(
mL
mAmElementstyRatioForAvailabili ,
)(
)(
)(
)(
)(
)()(
mC
mA
mL
mA
mC
mLmTheWebtyRatioForAvailabili ,
where C(m) is the total amount of metadata created in that month, and out of metadata
created in that month, L(m) is the number of pieces of metadata that were loaded at least
once and A(m) is the number of pieces of metadata that were applied to any of the
elements in the page at least once. The availability ratio for pages is 33.0% from the third
quarter of 2008 and the ratio increases during the first year. After that time, the number
of target webpages became small and many of them had already changed. Therefore the
availability ratio for elements is 69.1% from the third quarter of 2008 and the ratio
increased over time. The availability ratio for the Web was only 22.8% from the third
quarter of 2008 and that ratio increased for a year.
0
1000
2000
3000
4000
5000
6000
7000
8000
9000
10000
2008 3Q 2008 4Q 2009 1Q 2009 2Q 2009 3Q 2009 4Q 2010 1Q
Am
ou
nt
of
Met
adat
a
0
0.1
0.2
0.3
0.4
0.5
0.6
0.7
0.8
0.9
1
Rat
io
Amount of created metadata: C(m)
Amount of loaded metadata at least once: L(m)
Amount of applied metadata at least once: A(m)
Ratio of availability for pages: L(m) / C(m)
Ratio of availability for elements: A(m) / L(m)
Ratio of availability for the Web: A(m) / C(m)
Amount of created metadata: C(m)
Amount of loaded metadata at least once: L(m)
Amount of applied metadata at least once: A(m)
Ratio of availability for pages: L(m) / C(m)
Ratio of availability for elements: A(m) / L(m)
Ratio of availability for the Web: A(m) / C(m)
0
1000
2000
3000
4000
5000
6000
7000
8000
9000
10000
2008 3Q 2008 4Q 2009 1Q 2009 2Q 2009 3Q 2009 4Q 2010 1Q
Am
ou
nt
of
Met
adat
a
0
0.1
0.2
0.3
0.4
0.5
0.6
0.7
0.8
0.9
1
Rat
io
Amount of created metadata: C(m)
Amount of loaded metadata at least once: L(m)
Amount of applied metadata at least once: A(m)
Ratio of availability for pages: L(m) / C(m)
Ratio of availability for elements: A(m) / L(m)
Ratio of availability for the Web: A(m) / C(m)
Amount of created metadata: C(m)
Amount of loaded metadata at least once: L(m)
Amount of applied metadata at least once: A(m)
Ratio of availability for pages: L(m) / C(m)
Ratio of availability for elements: A(m) / L(m)
Ratio of availability for the Web: A(m) / C(m)
Figure 2.9. Ratio of the metadata availability

Chapter 2 Social Accessibility 23
2.3.5 Sustainability
Figure 2.10 shows the historical metadata authoring activities and request reporting
activities. The horizontal axis shows the time and the left vertical axis shows the
cumulative amount of metadata created for each category of participant. The right
vertical axis shows the cumulative number of requests. The development team members
tried to reduce their activities over time to encourage the participants. Most of the
activities were metadata authoring by the volunteers after the page-map release. Some
of the activity was authoring activities for landmarks and alternative texts added by the
users themselves (the small region between the "Guests" and the "Developers" in the
chart). Most of the participants worked for brief periods, though a few volunteers were
contributing for longer periods, such as one volunteer who answered many requests from
the Japanese community. Figure 2.7 also shows how the number of volunteers continued
to increase, though the number of end-users became stable fairly early.
2.4 Findings and Challenges
This section considers the statistics in the previous section to clarify the essential and
common challenges for collaborative accessibility improvement services.
Time from Project Launch (weeks)
Cum
ula
tiv
e M
etad
ata
Nu
mber
s
0
2000
4000
6000
8000
10000
12000
14000
16000
18000
20000
0 5
10
15
20
25
30
35
40
45
50
55
60
65
70
75
80
85
0
50
100
150
200
250
300
350
400
Cum
ula
tiv
e U
ser
Req
ues
t N
um
ber
s
Supporters
Guests
Users
Developers
User Requests
Release of
Page Map
March 1, 2010
Supporters
Guests
Users
Developers
User Requests
Volunteers
Guests
Users
Developers
User Requests
Release of
Page Map
March 1, 2010Release of
Page Map
March 1, 2010
Time from Project Launch (weeks)
Cum
ula
tiv
e M
etad
ata
Nu
mber
s
0
2000
4000
6000
8000
10000
12000
14000
16000
18000
20000
0 5
10
15
20
25
30
35
40
45
50
55
60
65
70
75
80
85
0
50
100
150
200
250
300
350
400
Cum
ula
tiv
e U
ser
Req
ues
t N
um
ber
s
Supporters
Guests
Users
Developers
User Requests
Supporters
Guests
Users
Developers
User Requests
Release of
Page Map
March 1, 2010Release of
Page Map
March 1, 2010
Supporters
Guests
Users
Developers
User Requests
Volunteers
Guests
Users
Developers
User Requests
Release of
Page Map
March 1, 2010Release of
Page Map
March 1, 2010
Figure 2.10. History of Participants' Activities

Chapter 2 Social Accessibility 24
2.4.1 Time Effectiveness
Can volunteers fix the requested problems in a timely manner? What types of
metadata can volunteers create?
Before starting the project, we expected that encouraging the activities of the
volunteers might be the most important challenge for the project. However, the
volunteers worked much more effectively than we had anticipated. The results (Figure
2.8) show that almost half (43.2%) of the requests were resolved within only 1 day (24
hours). It took more than 1 week (168 hours) for only 28.0% of requests. One of the
reasons is that the current mechanism for status changes did not work very well because
of volunteers' reservations about their own solutions. Status changes can be made by the
volunteer who worked on a request, but sometimes the volunteer hesitated to change the
status to "resolved" because of uncertainty about the quality of their solution. Given the
gap between such the resolution work and the decision making, the resolution time could
be shortened by reminding volunteers to change the status or by assigning another
volunteer to check the quality of the work. This would let users benefit more quickly.
Compared to the existing source-code modification approaches, the time effectiveness
of the approach is clear. Source-code approaches involve at least one iteration of the
development process, at its fastest about two weeks but typically much longer. Our
service allows users to access the improved sites within a few days. This is clearly a huge
leap beyond the previous methodology. The productivity of the metadata authoring tool
was a key success factor for the volunteers' work. The new page map system was released
in November 2008 (after 20 weeks), and the volunteers' activities increased dramatically
(Figure 2.10) at that point. Also, the participants who joined after the new tool became
available were much more likely to continue contributing to the service. They evidently
felt that working with the service was valuable as a use of their time.
The page-map approach dramatically lowered the required skill for the metadata
authoring. Looking at the metadata that was created, it appears that many of the
volunteers had some knowledge about Web accessibility. They seemed to understand the
basic rules for alternative texts and how users would use the heading tags for navigation.
These two skills may be the minimum required knowledge for volunteers using the
current page-map tool. Recently, the uses of dynamic Web content with advanced
technologies such as DHTML and Ajax are increasing, so metadata to make such content
accessible will be a key focus in the future. WAI-ARIA metadata is one solution, but it is
too complex for most volunteers to work with, because these dynamic applications often

Chapter 2 Social Accessibility 25
drastically change the structure of their content. To further reduce the needed skills, new
authoring technologies will be needed.
2.4.2 Request-driven Model
How can users report their problems to the service? What types of requests did users
report and for what types of sites?
One of our findings is that "challenges exist on the user side." In our process model, the
starting point for each collaboration was always a request (Figure 2.2), and this proved to
be a challenge. We found that making requests was more difficult than we had expected.
In this section, we consider three of the major reasons revealed by analysis of our results
and in interviews and discussions with the participants. Among these issues, the issue of
the lack of awareness is crucial and severe for the blind community.
2.4.2.1 Users' lack of awareness of problems
One of most important findings of the service was the high ratio of users who are not
aware of the problems they are facing. We were surprised by how many users were
unaware of the real causes of their difficulties. Petrie et al. [Petrie et al. 2006] reported
on awareness problems in their investigation of remote usability evaluations and we also
reported on such problems in an analysis of voice browsing behavior [Takagi et al. 2007].
The severity of these problems is growing rapidly, which was unexpected. As shown in
our Example 3 (Section 2.2.3), skilled and experienced users may be aware of most of
their problems as they encounter them, and they can easily report those problems.
However, even expert users may be unaware of what they don't know about the limits of
their understanding. For novice users, this situation is even worse.
Surveys of screen reader users conducted by WebAIM [2009] show that half of the
screen reader users "don't know how accessible these technologies (Web 2.0) are, or quite
possibly, they didn't know what we were asking." According to our own survey [Takagi et
al. 2007], many users are not even aware of the heading jump function. Such screen
reader users can remain unaware of the exact problems they are encountering, such as
inaccessible dynamic content or complex content without headings.
About 30 blind computer users joined a seminar-style discussion that we organized.
Most of them were not actively accessing the Web, but only accessing some "selected
special sites for users who are blind". Many had tried to access general websites, but they
found such websites "totally confusing and time consuming", and most of them soon quit
trying. In other words, they gave up on the wider Web without even knowing much about

Chapter 2 Social Accessibility 26
the world's information and services. Some of the more aware users that we interviewed
mentioned that this phenomenon is "a major concern for the blind community." Without
wider public awareness of the real problems, this situation will not change.
Another awareness problem involves the major screen readers that silently skip
certain objects, such as unlinked images without alternative texts or Flash® movies with
the opaque setting. In such cases the users are quite unaware of the objects regardless of
their importance. A related example involves inappropriate or misleading headings. If
such a heading tag appears near the bottom of a page, most users will jump directly to
the heading, and thus miss most of the actual content of the page. As long as something
is found after the heading the user will usually report that the page has "no problem", as
a result of being misled about the true content of the page.
This raises an epistemological question: How can users report problems that they
cannot recognize? They may be able to infer the existence of problems from other content,
and we found some examples of this among the actual requests we received. For example,
one request said that an instruction should appear at a certain place on the webpage, but
reported that there was no readable information there. In this case, the user was able to
report the problem because the missing information was obvious and easy to infer, but
such situations seem relatively unusual.
2.4.2.2 Too many basic problems
The interview sessions revealed that another factor that discouraged users from
submitting any request at all was finding too many problems on a page. The most
common requests were basic accessibility errors, such as missing alternative texts and
missing headings (Section 2.3.2). That is why so much of the volunteers' work was
devoted to such basic and repetitive improvements (Sections 2.2.1 and 2.2.2). In addition,
such problems often appear repeatedly when a website uses many pages with a similar
layout. For example, if an article does not have a heading tag, all of the pages with a
similar layout may lack heading tags. As a result, many users feel uncertain about when
to send requests. This phenomenon is consistent with the results showing that the
experts tended to leave out more minor problems, as reported by Mankoff et al. [2005] in
their investigation of the scope of errors detected by blind experts.
2.4.3 Quality of Created Metadata
How good is the metadata provided by the volunteers?
Our results showed that the volunteers' work is generally good and addresses the

Chapter 2 Social Accessibility 27
users' needs, though sometimes they made mistakes. However the wisdom of crowds
approach seems overall to be effective in correcting most errors. We will discuss how to
maintain and protect the metadata quality in the Section 2.6.2.
Security is also an important metric of data quality. Since our metadata system can
change the content seen by the end users using our tool without any special permission,
this could create security vulnerabilities. For example, someone could try to use the
service to publish ads or could create malicious or misleading alternative text. Although
the existence of the guest account could invite such problematic activities, our actual
results showed that none of the volunteers attempted to create any malicious metadata
records (Section 0). One of the reasons is that the volunteers have rather limited
capabilities within this system, so dangerous exploits are unlikely. Another reason is that
the community was quite small and not visible for attack. If the service becomes large
and visible, we will need to consider protection mechanisms against potential attackers.
Beyond such security concerns, the management approaches from wiki-style content
aggregators such as Wikipedia could be applied to our service.
2.4.4 Robustness of Created Metadata
How robust is the created metadata for content evolution?
Basically external metadata tends to be fragile as the Web evolves. Ntoulas et al.
[2004] said "after a year, about 50% of the content on the Web is new" and "only 20% of
the pages available today will be still accessible after one year." Also in our pilot study,
the amount of invalid metadata was increasing over time, and over half of the metadata
had become invalid within 20 months (Section 0).
To cope with this problem of obsolescence, metadata should be created with more
flexible pointing methods such as text-based context matching [Brush et al. 2001; Phelps
et al. 2000] or the metadata should be maintained to avoid obsolescence and to be
extended to more content. In terms of metadata robustness, the Web's evolution could be
categorized into the three types of webpage creation, change, and deletion. For creation,
the system might generalize already existing metadata by calculating similarity metrics
between the content structure of older webpages and a new webpage. For changes, the
system could adjust the addressing of the metadata to avoid applying the metadata
incorrectly. This might be done by comparing the latest and earlier versions. Finally, for
deletion, to dispose of metadata no longer used, the system could check the applicability
of the metadata.
Our maintenance system needs to know about webpages, metadata, and their

Chapter 2 Social Accessibility 28
relationships, so the system is based on site-wide metadata authoring and site-wide
crawling technologies. One of the simplest ways to motivate the volunteers' activities is
to inform them about the popularity their metadata by regularly observing the status of
metadata usage.
2.4.5 Sustainability
How can we create a self-sustaining service with active participation?
There are three sides of sustainability. One is motivating the volunteers to continue
helping users. As described in Section 2.3.1, a few volunteers contributed frequently for
months. Their activities were sufficient to respond to the current numbers of requests
from users.
The second is the ongoing participation of the end users. We found significant
challenges on this side. In order to sustain ongoing participation, we need organizations
to educate and encourage the users and volunteers as they address the problems. The
problems will be there, but the users need the skills to imagine the improved Web
environment resulting from the solution of these accessibility problems. The
collaboration approach is a method to make this goal more achievable, but skills are
required to reach the goals. To encourage the users, collaboration with existing
organizations seems to be the most promising approach. If they can satisfy the needs for
educating and encouraging users, the situation will be dramatically improved.
The last side is building an ecosystem involving site-owners in addition to users and
volunteers. Collaborative accessibility efforts should provide feedback to the site-owners
and serve to raise awareness in society in general.
2.5 Social Accessibility Service for Site Owners
The collaborative accessibility improvement model is often seen as a competing
approach to the compliance-oriented accessibility improvement model, but we feel this is
an overly limited perspective. One of the reasons is that collaboration between
"volunteers" and "users" can be regarded as an approach to crowd-sourcing for
accessibility compliance. In reality, the special advantages of external metadata, its
timeliness and adaptivity, can also contribute value to the site owners. The collaborative
model will also accelerate the process of compliance by helping to connect with the
stakeholders on the site-owner side, such as the designers, developers, content authors,
and system vendors.
The Social Accessibility service with some customization has been deployed to the
Chapter 2 Social Accessibility 29
website of a local government in Japan, Tottori Prefecture, to maintain the Web
accessibility of Tottori's webpages [IBM 2010]. The system was developed based on the
Social Accessibility service and is called the Web Accessibility Improvement System
(WAIS). Instead of employing volunteers from the open community, Tottori is outsourcing
the accessibility maintenance work for their webpages to two NPOs where persons with
disabilities such as motor impairments and hearing impairments are employed. This is
one of the best scenarios of collaborative Web accessibility improvement in which a
person with disabilities can help other persons with different types of disabilities.
2.5.1 Improvements from Public Social Accessibility Service
As described in Section 2.5, the most significant difference is that private volunteers
are employed for this work. Some other differences are the use of an improved version of
the visual metadata authoring tool for volunteer with motor impairments, a new
metadata application model, and a site-wide accessibility management system. We
developed two site-wide management mechanisms to maintain the overall accessibility
level of the site: an accessibility crawler and a site-wide metadata inference.
The visual metadata authoring tool was modified based on requests from an interview
with the leading renovator with motor impairments. He can use a keyboard and control
the cursor with a special pointing device with a joy stick, but this is slow and relatively
inaccurate. Therefore larger widgets and controls were provided, the keyboard bindings
were refined, and the layout of the widget was redesigned to minimize the required
cursor movements.
2.5.1.1 Backstage Metadata Application Model
A backstage model allows site owners to integrate external metadata into their pages
(see Figure 2.11). This is a simple mechanism for applying metadata inside of webpages
without any external tools. This approach also supports compliance work on the website,
since the improvements are handled within the general JavaScript libraries in the
webpages. A dynamic improvement approach with a JavaScript library is also used by
Google for their AxsJAX technology [Chen et al. 2008].
When using end-user tools to apply metadata into webpage, the users are required to
think about the tool itself during their Web browsing. This is not the ideal experience for
the users but is required to make it possible to apply metadata for arbitrary webpages. In
contrast, in this Tottori application, it was feasible to make a small change by adding the
bootstrap JavaScript code for metadata application into the templates of the webpages

Chapter 2 Social Accessibility 30
(Figure 2.12). Sample code for "wais.js" is shown in Section A.2. With this support from
the site owners, a special HTML tag could be inserted into the page templates (where the
server side includes PHP, JSP, and other software). Then this script tag can
automatically access the database, acquire the metadata, and apply it to the page. In
addition, if the metadata repository server is in the same domain as the website of the
organization, there is no need for a special Flash® object to bypass the security-related
communications restrictions. Users may not even notice that the metadata mechanism is
there. The end users are able to access the accessible content without installing any tools,
and the entire process can be handled behind the scenes.
2.5.1.2 Accessibility Crawler
Tottori has more than 50,000 webpages and many departments manage their content
separately. Although they are using a content management system, it is hard to
manually check the accessibility of all of the webpages. The accessibility crawler checks
the website on a regular and systematic basis and automatically detects accessibility
problems with reference to the accessibility guidelines. The accessibility level of the
Users
Website
Accessibility
metadata
Accessibility
metadataBrowser
Users
Browser
Metadata
Repository
Accessibility
metadata
Accessibility
metadata
End-user tool
“On stage”
improvements
Screen
Reader
Screen
Reader
“Behind the scene”
improvements.
“One line code”
Website
Mashup! Mashup!
Metadata
Repository
On-stage ModelBackstage Model
Figure 2.11. Comparison of metadata application method: backstage model and on-stage
model

Chapter 2 Social Accessibility 31
website has gradually been decreasing because of a lack of accessibility literacy. The
accessibility crawler consists of two component, the crawl dispatcher server and the
accessibility checking clients. Users manage the crawling schedule and the crawling
addresses on the server and the system submits the URLs to a crawling queue for the
clients. Each client opens the target webpages in a special browser that was developed
based on software in the Eclipse accessibility tools framework [ACTF]. Then the clients
the check accessibility of the rendered DOM, including any content generated with
JavaScript, and returns the results to the server along with all of the links in the
document. The server stores the results and merges the received links into the crawling
queue, and continues to submit URLs until the queue becomes empty.
The renovators can see the accessibility check results for each webpage and can also
review the summarized results for the entire website. The server system also has views
for the results ordered by error types, numbers of error occurrences, scores for
accessibility, and so on. The time-series views of the results show the site owners how the
site has been improved by the renovators. Also, the renovators can schedule and
prioritize their improvement work by checking these results.
2.5.1.3 Site-wide Metadata Inference
As noted in Section 2.4.2, some users explicitly and most users implicitly requested
improvements not only for specific pages but also for other pages on the target website.
To address those requests, some volunteers worked enthusiastically on as many
neighboring pages as possible, thus encouraging users to access the entire website, not
just the original target pages.
From this we realized that site-wide metadata authoring support would dramatically
improve the effectiveness of the service. Site-wide metadata can cover thousands of
related pages on a website, for example by adding heading tags to all of the pages with
similar layouts [Takagi et al. 2002]. The current Accessibility Commons database is
capable of handling site-wide metadata [Kawanaka et al. 2008], but it is technically
difficult to create an easy-to-use site-wide authoring tool for a broad community of
<html>
<head><title>One line code sample</title>
<script type="text/javascript" charset=“utf-8” src="js/wais.js"></script>
</head><body>
...
<html>
<head><title>One line code sample</title>
<script type="text/javascript" charset=“utf-8” src="js/wais.js"></script>
</head><body>
...
Figure 2.12. Example of insertion of one line code into the template

Chapter 2 Social Accessibility 32
volunteers. New techniques and approaches are needed to make site-wide metadata
easier to create, more robust, and more practical.
Our site-wide annotation inference algorithm and its integration into our authoring
tool is such an approach. The algorithm is capable of finding and recommending possibly
applicable metadata for a new page by analyzing the similarity between the new page
and other webpages with existing metadata. This is an expansion of the inference
mechanism described in Section 2.1.3.3. If a volunteer creates a set of metadata for one
page and opens another page with a similar layout on the same website, then a list of
recommendations will be presented. In the current implementation, our tool uses the
metadata records having the same domain as the new page in its URI pattern to show
recommendations. The tool simply tries to check if the new page has elements that match
the XPath notation of the metadata records that are targeted in other webpages. If the
volunteer accepts a recommendation, then that metadata will be generalized to cover all
of the similar pages, perhaps thousands, by generalizing the matching patterns for the
URI and the description that selects the elements (using XPath).
Creating site-wide metadata is generally considered to be tedious and time-consuming,
but that is not an intrinsic limitation. From our experiences, we have found ways that
site-wide authoring technologies can reduce the work of the volunteers. This is evident
when we see similar metadata created for many pages on a website. We have estimated
the potential workload reductions by analyzing the created metadata. The results show
that over four thousands metadata records out of the total of 12,942 alternative texts and
over a thousand metadata records among the 6,196 headings seem to be redundant.
Beyond the saved work, the coverage of websites can be dramatically broadened.
The combination of the backstage model with site-wide metadata authoring will be a
new approach to make websites not only compliant but also adaptive for end users. For
example, in one of our preliminary experiments, one volunteer needed only an hour to fix
0 min 20 min. 50 min. 60 min.
Fixed 10 pages, directly linked from the front page
Fixed remaining 72 pages
Tuned.
3500 errors 0 errors
Figure 2.13. Accessibility improvement by site-wide metadata authoring

Chapter 2 Social Accessibility 33
an existing government agency website with 3,500 accessibility validation errors in 82
pages (for 2 levels of links from the main page). Figure 2.13 shows the progress of the
improvements, where each graph represents the accessibility scores of all of the pages as
evaluated by aDesigner [Takagi et al. 2004]. In the first 20 minutes, the volunteer fixed
only 10 pages directly linked from the front page using the site-wide function, but all 82
pages were drastically improved. This involved creating 104 metadata records.
2.5.2 Summary of Improvement
The renovation work was conducted for four months from November 2010 to February
2011. Over 52,000 errors were detected by the automatic accessibility crawler at the start
of the working period (see Table 2.4). As of December 2010, about half of the errors had
been fixed mainly by the renovators from two NPOs. Finally about 60% of errors were
fixed by February 2011. The reasons why there were still over 20,000 errors at the end of
the period were the many false-positive errors and a lack of some needed renovation
functions. For example the crawler detects and may report space-separated characters
(improperly used for layout purpose) but some of them are actually separating spaces
that are used appropriately, such as a space between a first name and a last name.
2.5.2.1 Participants and Productivity
Table 2.5 and Table 2.6 give details about the participants. Table 2.5 shows the number
of participants who were employed as renovators. There are 23 renovators with
disabilities from two NPOs and 7 supporters for the disabled renovators. Ten of the
renovators have motor disabilities and included the participant we took interviewed
about the visual editor. Others had language disabilities and various other conditions.
The Tottori Information Center (TIC) is the contractor for this project and two of TIC
employees also joined as participants.
Table 2.7 shows the focus of each organization by metadata types. The renovators did
4,424 hours of work, which includes not only the actual working hours but also other
hours such as training. The TIC, NPO A, and NPO B created 22,846, 25,519, and 2,353
records of metadata in 672, 3,080, and 672 hours, respectively. Although the average
productivity was 11.4 records of metadata per hour, it depends on ability, focus, and the
durations of the working periods.
The efficiency of the accessibility metadata, which we define as how many problems
can be fixed by one record of metadata, averaged 1.05 overall. This is because Tottori
prefecture used a conservative policy of one record of metadata to fix one problem in the
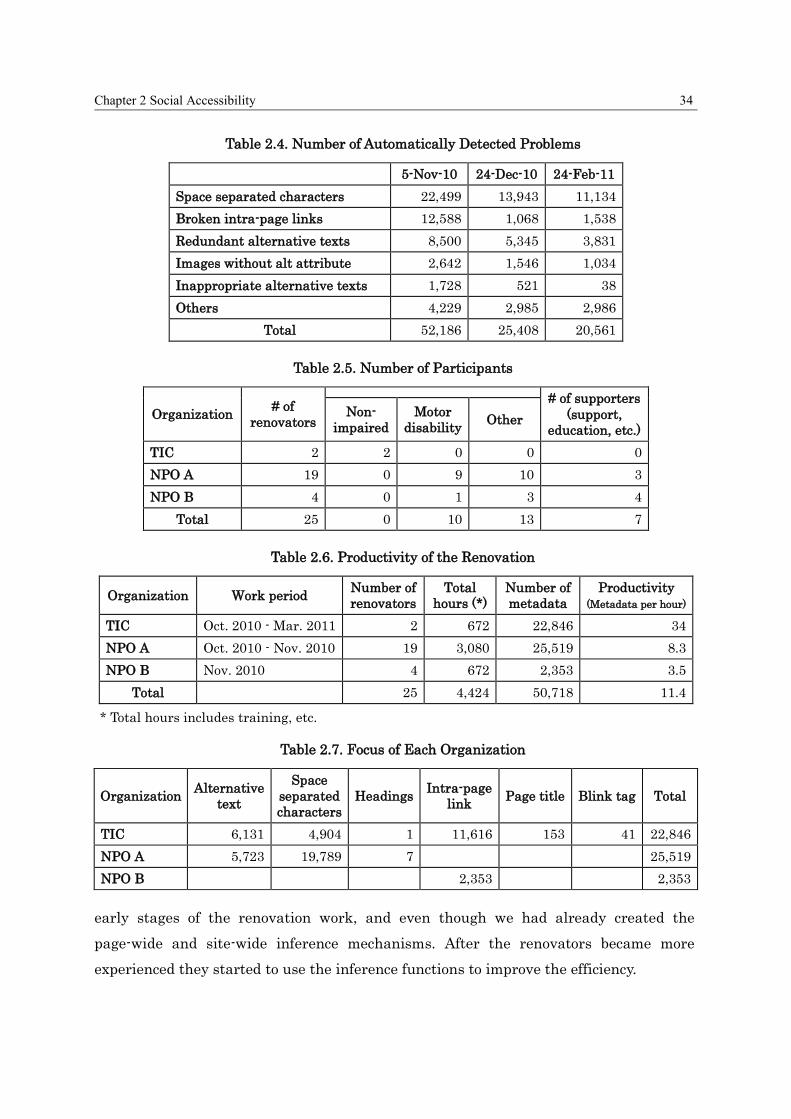
Chapter 2 Social Accessibility 34
early stages of the renovation work, and even though we had already created the
page-wide and site-wide inference mechanisms. After the renovators became more
experienced they started to use the inference functions to improve the efficiency.
Table 2.4. Number of Automatically Detected Problems
5-Nov-10 24-Dec-10 24-Feb-11
Space separated characters 22,499 13,943 11,134
Broken intra-page links 12,588 1,068 1,538
Redundant alternative texts 8,500 5,345 3,831
Images without alt attribute 2,642 1,546 1,034
Inappropriate alternative texts 1,728 521 38
Others 4,229 2,985 2,986
Total 52,186 25,408 20,561
Table 2.5. Number of Participants
Organization # of
renovators
# of supporters
(support,
education, etc.)
Non-
impaired
Motor
disability Other
TIC 2 2 0 0 0
NPO A 19 0 9 10 3
NPO B 4 0 1 3 4
Total 25 0 10 13 7
Table 2.6. Productivity of the Renovation
Organization Work period Number of
renovators
Total
hours (*)
Number of
metadata
Productivity
(Metadata per hour)
TIC Oct. 2010 - Mar. 2011 2 672 22,846 34
NPO A Oct. 2010 - Nov. 2010 19 3,080 25,519 8.3
NPO B Nov. 2010 4 672 2,353 3.5
Total 25 4,424 50,718 11.4
* Total hours includes training, etc.
Table 2.7. Focus of Each Organization
Organization Alternative
text
Space
separated
characters
Headings Intra-page
link Page title Blink tag Total
TIC 6,131 4,904 1 11,616 153 41 22,846
NPO A 5,723 19,789 7 25,519
NPO B 2,353 2,353
Chapter 2 Social Accessibility 35
2.5.3 Lessons Learned
This section describes some of the lessons we learned as we improved the Social
Accessibility system while working with the website owners. First, we need to have a
consensus on the methods and rules for the fixes among both the representative of the a
site's owner and the renovators before starting the work. For example rules for heading
levels, rules for alternative text, and so on. Also, they have to share information about
unexpected problems to update the rules.
Second, we need to be careful about the page layout when metadata is applied. To gain
the acceptance of the site owner, the metadata application should not be affect the
appearance of the webpages. For example, if a non-heading element is used as a heading
element, then the style of the element may be changed.
Third, we need to take into account the learning curves of the renovators. They need to
start with simple fixes, such as providing alternative text for images and then advance to
more complicated fixes such as inserting headings or using inference functions to apply
one record of metadata to multiple problems.
2.6 Next Steps
The most important challenges are on the blind user side, and therefore we need to
consider sustainable social mechanisms and technologies to address these challenges.
For this and other challenges, this section discusses some of the most promising
technical and organizational extensions and improvements for the service.
2.6.1 Activating the End Users
In order to encourage active participation by users in spite of the challenges
summarized in Section 2.4.2, three types of technologies should be created or improved.
First is the method for making a site request to improve the basic accessibility of a target
site. This is already partially addressed in Section 2.4.2.1, but there should be a special
focus on users who feel discouraged about accessing the Web. We believe that a site-based
service could motivate them to use the Web.
Second would be accessibility checking functions for the end users. This would be a
relatively basic but important function to help users be aware of the problems they are
facing. Some of the existing screen readers have functions to give an overview of the
accessibility by announcing statistics for the content when the page is loaded, such as the
number of links. Vigo et al. [2009] reported that links annotated with accessibility scores
Chapter 2 Social Accessibility 36
can help blind users navigate more effectively. With such improvements that offer
intuitive and non-intrusive functions to present the accessibility problems the users will
be more aware and more motivated to address the problems.
Another highly desirable feature would involve functions for user-side metadata
authoring. In our interviews we found that expert users are eager to improve the
accessibility by themselves and to contribute to other users. Actually user-side "labeling"
of images is one of the major functions of leading screen readers such as JAWS [Freedom
Scientific Inc.] and of some existing collaboration services [Serotek; Webvisum].
Our end-user tool has been gradually improved in the direction of integrating checking
and authoring functions. The function to list and navigate among images without
alternative texts allows users to be aware of problems without disrupting their daily use
of the Internet. A natural extension of this function would be an alternative text
authoring function. If a user is aware of an appropriate alternative text for an image, the
user could create and submit the alternative text for the image. AccessMonkey [Bigham
et al. 2007] is an example with a combination of accessibility checking and authoring
functions for inappropriate alternative texts for users who are blind. Integration and
convergence with these technologies will be an obvious future direction, and the core
database of Social Accessibility was originally designed to enable that kind of integration
[Kawanaka et al. 2008]. For example, the Flash-access function also gives the users
awareness of the existence of opaque Flash® movies. Beyond awareness, the tool
converts such Flash® movies into non-opaque movies and allows the users to access their
content. In addition, users can add appropriate labels to the buttons in the content.
Finally, for novice users, it may be useful to provide a function that allows them to
easily report ambiguous problems such as "I've encountered some problem" by simply
selecting a menu item without adding a comment. The current report system requires
the users to input some comment. This may discourage novice users from reporting
problems. Often the volunteers can guess at the actual problem based on the users'
activities, and some technical support could also be helpful to find the problems, such as
by tracking and recreating the users' operations on the webpages.
These recently added functions are small steps, but they increase the power of users to
be aware of their own problems while allowing them to resolve more problems by
themselves. However, it is clear that new technologies to empower users could allow
them to access various types of content and help them discover the gaps between visual
and non-visual information.

Chapter 2 Social Accessibility 37
2.6.2 Metadata Quality Management
The current system has no mechanisms to maintain the quality of the metadata except
for the self-regulation of the community members. It may be possible to limit some of the
risks of the external metadata approach by implementing some automatic protection
functions such as filtering on certain keywords or filtering repetitive edits within a short
time. Exploiting the power of the community is also a good approach to safeguard the
quality of the metadata. For example, we could implement a moderation feature so that
all of the new metadata records would be checked by at least one other volunteer before
being published to the end users.
Another useful feature would be a locking mechanism to prevent multiple volunteers
from fixing the same webpage at the same time, which might happen if an end user sends
a request that is broadcast when many volunteers are available.
Bug tracking systems are good examples of how to handle some of these problems in a
similar context. A bug tracking system provides functions to manage which user has the
authority to work on certain problems at a particular time. In comparing a bug tracking
system to a collaborative improvement process, both systems start with the reports from
the end users. Our system could assign a volunteer to the problem and inform the other
volunteers that the authority has been delegated to the first volunteer. After editing the
metadata, that volunteer will return the authority to the system so that it can be passed
to another volunteer if additional editing is needed. Finally, the end user who reported
the problem can retain the authority to close the problem as solved.
As part of our initial prototype, we experimented with a credit system that used
feedback from the end users. However, as noted in Section 0, our first version of the
feedback system didn't work very well. If such a credit-based system was implemented
more effectively, it might be possible that the system would help automatically detect
malicious users.
2.7 Related Work
This section describes some examples of collaborative accessibility improvement and
technologies related to our approach. The approach is based primarily on two kinds of
technologies, one for collaborative authoring and the other for external metadata.
Collaborative authoring technologies have a long history [Leland et al. 1988] and have
brought us large and successful services such as Wikipedia, the best known wiki-type
system [Leuf et al. 2001]. External metadata is a foundation technology for many

Chapter 2 Social Accessibility 38
applications such as document annotating and Web content transcoding.
Collaborative Accessibility Improvement
Several projects support people who are blind or visually impaired. Helen™ [AFB] is a
website-rating service created by the American Foundation for the Blind. Users can
submit and share ratings and comments about the accessibility of various websites. At
this time, they have ratings for 157 domains, though most of the domains have only a few
ratings from users.
Social captioning for people who are deaf or hard of hearing is also becoming popular,
especially for movies. [YouTube Subtitler] is a public experimental service for YouTube
videos that currently has a total of about 1,800 captioned videos in 23 languages. The
captions are provided not only for the use of people with hearing impairments, but also
as translation and search support. They don't have a systematic method to evaluate the
quality of the captions, but captions can be modified and improved by other users.
We-LCoME [Ferretti et al. 2008, 2007] is an e-learning system produced by
collaborations among teachers, captioning volunteers, translators, and students.
Currently, this system is still unavailable to the general public. Nico-Nico Douga
[Niwango] is a large Japanese movie-sharing system with a comment overlay function,
which is often used to create collaborative captions. There are tens of millions of users
and more than three million videos with over two billion comments. Only the owner of a
video can delete the users' comments.
Social labeling allows users to add and share labels, which are mainly alternative texts
and landmarks to aid navigation via screen readers. The 1997 ALT-server [Dardailler
1997] was the earliest system with social labeling. Its primary function was to label
images, but there has been no assessment of the quality of the alternative texts.
WebInSight [Bigham et al. 2006] is a unique system combining social approaches with
automatic optical character recognition to generate appropriate alternative texts. In
their experiments the automatic approach can provide alternative text for 43.2% of the
images with 94.1% accuracy. Again, there is no assessment of the quality of the
human-authored labels. AccessMonkey [Bigham et al. 2007] is a platform for sharing
JavaScript scripts. This system allows both Web users and Web developers to write
scripts that automatically improve the accessibility of webpages and to utilize existing
efforts such as the alternative text created with WebInSight.
The System Access Mobile Network [Serotek] is a commercial service for users of the
Serotek browser, while Webvisum is a free service for Mozilla Firefox® users [Webvisum].

Chapter 2 Social Accessibility 39
These services allow users to share proper labels for page titles, poorly named links, and
unlabeled forms. Webvisum also has a function to help with CAPTCHA images via the
support of remote volunteers. Solona also provides a CAPTCHA solution service which
offers to read CAPTCHA text for visually impaired people [Solona]. They return the text
within one minute by human operators who are employed as volunteers from all over the
world. The sizes of these three services were not disclosed. Another example is the Google
Image Labeler [Google]. This is a system to collect accurate textual descriptions of
images by using a game. The goal of the project is to improve the accuracy of Google
Image search through a game where users gain points by generating textual descriptions
that match those written by other participants. The generated metadata could
potentially be used for accessibility. This system seeks appropriate alternative texts by
reporting the matching text descriptions written by pairs of users. The numbers of labels
and users have not been disclosed, but the score of the top contributor was approximately
15 million, which implies the creation of more than ten thousand matched labels.
VizWiz is utilizing a crowd sourcing platform called Mechanical Turk to help visually
impaired users [Bigham, Jayant, et al. 2010]. Users can ask people questions with photos
taken by their mobile phone through the VizWiz system. The system recruits online
users from the Mechanical Turk with small fees and they are ready to respond to users'
questions immediately. In their experiment, a question cost less than ten cents. This
outsourcing approach could apply to activities such as Web accessibility improvement.
In these ways, collaborative improvements are becoming popular because they
generate accessibility metadata with minimal costs. To date, only a few projects have
been notably successful, but knowledge and experience are accumulating in the
accessibility field. Our Social Accessibility efforts are also seeking to contribute to society
by using an advanced collaborative service.
Web Content Transcoding and Metadata Authoring
Web content transcoding technologies were originally developed to adapt webpages for
mobile devices [Bickmore et al. 1997] and to personalize pages [Maglio et al. 2000]. The
original approaches used intelligent proxy servers to transform the dominant static
webpages of that time. IBM's transcoding system was characterized by its
template-based metadata matching for site-wide metadata [Takagi et al. 2000, 2002]. It
was a typical proxy-based approach for static content but could handle large numbers of
webpages with small sets of metadata. Later, Brajnik et al. [2005] conducted a
quantitative experiment to demonstrate that text-based transcoding systems did not

Chapter 2 Social Accessibility 40
decrease the usability of a website for users with visual impairments.
Metadata-based transcoding technology is a key underlying technology for our
collaborative Web accessibility approach [Takagi et al. 2008]. HearSay [Borodin et al.
2007] is an experimental voice browser with advanced automatic metadata generation
and labeling by users. Both of these systems run as client-side applications and
manipulate the final rendered webpages, which also allows these transcoder systems to
handle dynamically generated content created by JavaScript. The aiBrowser [Miyashita
et al. 2007] has a function for transcoding DHTML and Flash® content with declarative
metadata using XPath notation to provide users a unified tree-view interface converted
from rich and dynamic Web applications. AxsJAX [Chen et al. 2008] is a library for
transcoding Ajax applications with procedural JavaScript code which injects WAI-ARIA
[WAI-ARIA] properties into the applications so that screen readers can properly read
them aloud. SADIe [Harper et al. 2006] is an approach that uses styling information for
transcoding. For example, there are clues in the style information that can reveal a
button-styled element is a button. Lunn et al. [2009] implemented the SADIe
transcoding system using an AxsJAX library. The aiBrowser, AxsJAX, and SADIe
approaches do not need a proxy server, but instead use client-side tools to transcode the
content locally. The trend of transcoding technologies has been to move from proxy-based
system to client-side tools that make it possible to handle more advanced and interactive
content.
Authoring metadata technology is also a key technology for our approach for two major
reasons. One reason is to provide user-friendly interfaces for our target users, including
people without knowledge of Web technologies such as HTML and XPath. The other
reason is to make metadata more robust against normal updates on the Web. Abe et al.
[2001, 2003] introduced a visual editor for XPath expressions that supports more robust
expressions, but their document-tree-based interface is still hard for novice users to
understand intuitively. There are more intuitive methods to point at an element within a
webpage by selecting text [Brush et al. 2001; Phelps et al. 2000]. Although their pointing
method of matching text and content seems more robust than the method using XPath
expressions, annotations for repetitive layout features are not supported.
2.8 Summary
In this chapter, we summarized 20 months of our experimental Social Accessibility
service and tried to foresee future directions to make collaborative accessibility
improvements into a mainstream approach. The five topics of the screen reader users,

Chapter 2 Social Accessibility 41
the volunteers, the quality of the metadata, the robustness of the metadata, and the
sustainability of the approach were considered to clarify the challenges of the approach.
We reviewed our work, summarized examples and the statistics of the experimental
service, and considered some of the technical innovations included as this new service
evolved. Although we found that the volunteers were surprisingly productive and they
have never created any malicious metadata, some management functions to insure the
security and the quality of the metadata are required to expand the activities. We also
found that the users were often unsure what to ask for. We found that activating
end-users participation and improving their understanding are the most important
things in nurturing a sustainable ecosystem. We also summarized a newer collaboration
with Tottori Prefecture, a local government in Japan, to improve their entire website,
introducing technologies for site-wide metadata authoring and an automatic accessibility
crawler. We learned many lessons from these empirical trials of collaborative Web
accessibility improvement approaches. These trials have led us to consider some of
features and technologies that seem most promising as next steps.
42
Chapter 3
Reading Order Visualization
Accessibility visualization is a crucial technology to lower the barriers to joining in
activities for Web accessibility improvements by novice users and by people not familiar
with accessibility problems. As described in Section 2.4.1, page-map visualization
accelerated the participation of volunteers. Page-map visualization shows how hard it is
for users with visual impairments to navigate within a page and where the accessibility
problems are located in the document (see Section 2.1.3.2). Since it is hard to imagine
what users see on webpages, especially what they imagine after the pages have been
interpreted through audible interfaces, accessibility visualization is important to provide
the kind of experience similar to What the Users See Is What You Get in a WYSIWYG
style of interface. This type of interface lets people understand how users with
disabilities experience the accessibility problems through visual cues. Also the interface
can support functions to fix the accessibility problems using the visual representation
and immediately show how the fix affects the visualization. In this chapter we focus on a
specific accessibility visualization technique for the reading order of Web content.
3.1 Problems with Reading Order
With advances in Web technology, there are increasing demands for highly visual
webpages. At the same time, it's extremely helpful if the serialized form of each webpage
appears in a meaningful order for alternative representations, such as the audible forms
used by visually impaired users or the transcoded forms used on small devices. For
example, when a set of lists and the headings for the lists are arranged in multiple
columns in a table, a typical default is that all of the headings are read first, and then
each of the lists is read sequentially. In the more concrete example of Figure 3.1, the
table would be read as "LCD TV, Plasma TV, OLED TV, Tube TV, 42 inch, $2500, 40 inch,
$2200, 20 inch, $3000, 29 inch, $1000, link add to cart, link add to cart, link add to cart,
link add to cart". Each list is separated from its title, and the intended semantics are
hidden in the audible form. This is a well known, common, and severe accessibility

Chapter 3 Reading Order Visualization 43
problem. Authors should make the order meaningful at authoring time. This is
mentioned in major accessibility guidelines and regulations. For example, the W3C Web
Content Accessibility Guidelines (WCAG) 1.0 [WCAG1.0; WCAG2.0] rate the reading
order adjustments at conformance level "A", the highest priority. Section 508 of the U.S.
Rehabilitation Act [Section 508], JIS X 8341-3 in Japan [JIS X 8341-3:2010], and the
eEurope Action Plan 2002 [eEurope 2002] all mention reading order.
However, the order of the serialized form (which reflects the order in the source code) is
rarely noticed, because the existing WYSIWYG authoring tools allow authors to edit the
content without considering the underlying source code order. The authors would have to
modify the source code directly to control the ordering. Although there are many types of
accessibility checking tools, the order of the serialized forms is rarely evaluated
automatically because of the essential difficulty of algorithmically defining an
appropriate reading order. Existing tools force authors to manually inspect the order of
the serialized forms, but this is not intuitive and the tools do not support changing the
order.
Therefore we propose a new visualization technique called "reading flow" that
visualizes the order of the serialized form by using a visible path extended through the
elements in the content [Sato et al. 2009]. The reading flow represents the visual flow of
reading the corresponding elements, and can represent fine or coarse granularity of the
flow of the content. This allows an author to immediately see the serialized form and
easily adjust it. The technique reduces the work for authors and developers when they
build the webpages, since they can freely modify the reading order separately from the
page design tasks. Going beyond webpages, our technique can potentially be applied to
other types of documents where the reading order causes problems, such as presentation
documents, PDF documents, and Flash® content, and can help improve their
accessibility.
3.1.1 Visualization of Reading Flow
LCD TV Plasma TV OLED TV
• 42 inch
• $2500
• 40 inch
• $2200
• 20 inch
• $3000
Tube TV
• 29 inch
• $1000
Add to cart Add to cart Add to cart Add to cart
LCD TV Plasma TV OLED TV
• 42 inch
• $2500
• 40 inch
• $2200
• 20 inch
• $3000
Tube TV
• 29 inch
• $1000
Add to cart Add to cart Add to cart Add to cart
Figure 3.1. An example of an inaccessible layout using a table
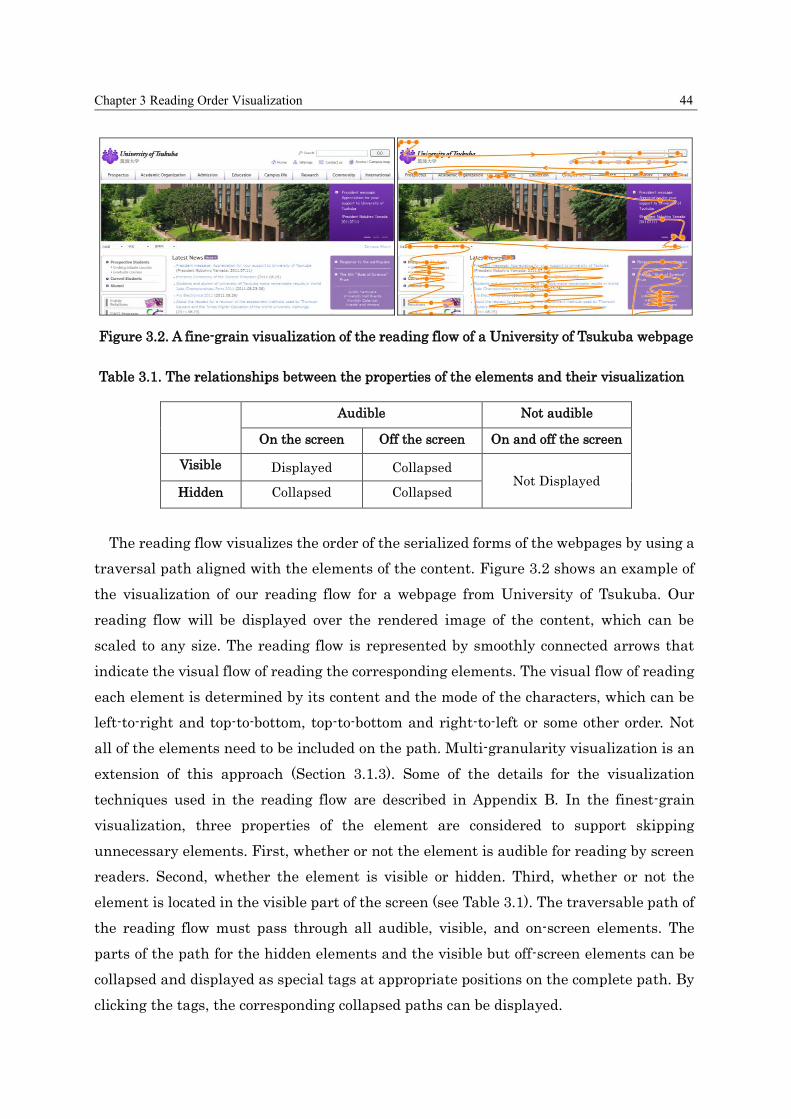
Chapter 3 Reading Order Visualization 44
The reading flow visualizes the order of the serialized forms of the webpages by using a
traversal path aligned with the elements of the content. Figure 3.2 shows an example of
the visualization of our reading flow for a webpage from University of Tsukuba. Our
reading flow will be displayed over the rendered image of the content, which can be
scaled to any size. The reading flow is represented by smoothly connected arrows that
indicate the visual flow of reading the corresponding elements. The visual flow of reading
each element is determined by its content and the mode of the characters, which can be
left-to-right and top-to-bottom, top-to-bottom and right-to-left or some other order. Not
all of the elements need to be included on the path. Multi-granularity visualization is an
extension of this approach (Section 3.1.3). Some of the details for the visualization
techniques used in the reading flow are described in Appendix B. In the finest-grain
visualization, three properties of the element are considered to support skipping
unnecessary elements. First, whether or not the element is audible for reading by screen
readers. Second, whether the element is visible or hidden. Third, whether or not the
element is located in the visible part of the screen (see Table 3.1). The traversable path of
the reading flow must pass through all audible, visible, and on-screen elements. The
parts of the path for the hidden elements and the visible but off-screen elements can be
collapsed and displayed as special tags at appropriate positions on the complete path. By
clicking the tags, the corresponding collapsed paths can be displayed.
Figure 3.2. A fine-grain visualization of the reading flow of a University of Tsukuba webpage
Table 3.1. The relationships between the properties of the elements and their visualization
Audible Not audible
On the screen Off the screen On and off the screen
Visible Displayed Collapsed Not Displayed
Hidden Collapsed Collapsed

Chapter 3 Reading Order Visualization 45
3.1.2 Editing of the Reading Flow
The reading flow also provides a knob on each element so that the author can explicitly
and visually change the ordering by connecting a knob to the desired next one. Figure 3.3
shows an example of reordering. If a user finds an incorrect order on the reading flow at
an element (Figure 3.3a), the user can easily change the flow by dragging the knob on
that element to the knob of the proper next element. During the dragging operation, the
prior path of the dragged knob is highlighted and the rest of the path is temporally
hidden (Figure 3.3b and c). By dragging the first knob at the upper left to the knob below
it Figure 3.3b, the skipped knob at the upper right is moved to the end of the path Figure
3.3c. The pairs Figure 3.3d – e, f – g, and h – i show similar reordering operations to
create a two-column layout in this example.
The interface uses three constraints to maintain the consistency of the reading order in
spite of the reordering and to make the interface as simple as possible (so even novice
users can use it). (1) A knob can only be connected to another knob going forward. In
other words, the user connects a knob to some later element or an unlinked element, not
to an earlier element. (2) A knob cannot be connected to make a loop in the reordered
path. (3) If a group of elements becomes disconnected, then that segment is moved to the
end of the current path.
(a) (d) (g)
(b) (e) (h)
(c) (f) (i)
Figure 3.3. An example of organizing the reading flow

Chapter 3 Reading Order Visualization 46
3.1.3 Granularity Control of Reading Flow
Our tool has a slider that allows users to determine the granularity level of the reading
flow. Figure 3.4 shows an example of controlling the granularity of the reading flow. With
the fine-grain reading flow the users can check the path to each element in the content
(Figure 3.4a). By selecting a higher granularity level, the users can grasp a higher level
view of the reading order in the page. For example, the items of a list now have a
left-to-right flow and are aligned at the left side of the list (Figure 3.4b), and at the
highest level, the entire series of lists is regarded as one object (Figure 3.4c). The
reordering in the granularity level affects the other levels of granularity, so that the
users can edit the order of the flow at any granularity level that is displayed.
The granularity control is implemented as a grouping of elements by using geometric
similarities in the tree structure of the content, because the layout of the content is often
separated from the tree structure by the style sheets. The system calculates the
linkability between adjacent elements in the flow, and then assembles the pairs of
elements having highest linkability into a group. The linkability is determined by the
geometric similarity and the size of the elements, and the more similar and smaller
elements get the higher linkability scores. The system continues this step of prioritizing
elements until the number of elements is greater than a target number determined by
the setting of the slider for the granularity control. In this process certain pairs are
excluded, such as a pair of widely separated elements or a pair that causes an unnatural
a)
b)
c)
Figure 3.4. An example of changing the granularity of the reading flow

Chapter 3 Reading Order Visualization 47
flow (as when the second element of a pair is above the other element within a
top-to-bottom block of text). More details of this process are described in Appendix B.2.
3.2 Experiments
We carried out a two-task experiment to empirically evaluate user performance using
our reading flow technique. The first task involved finding problems in the reading order.
The second task studied the editing process for the reading order. In the experiment we
compared our technique with a baseline numerical sequence display, controlled by
entering sequence numbers into the interface.
3.2.1 Participants
Twelve computer science researchers (9 males and 3 females) from 25 to 33 years of age
participated in the experiment. (One participant's age was unknown.) All had experience
with graphical user interfaces. Seven had advanced to intermediate knowledge of
accessibility problems. Four had prior knowledge of the reading order problem. We a
selected the participants with some focus on their expertise in accessibility, because the
target users of these user interfaces are people who want to correct accessibility
problems, such as Web designers and Internet volunteers.
3.2.2 Implementation
Our reading flow is currently implemented as a function in a Firefox extension written
in JavaScript using canvas elements. The metadata generated by the tool is in the
Accessibility Commons format [Kawanaka et al. 2008] and can be shared among Web
services using such formats as XML or JSON.
The current implementation handles the order of the content in a semantic layer
separated from the original content to reduce the complexity and to allow for sharing the
order information as accessibility metadata. When a user modifies the sequence, the
modification is stored as a set of metadata to change the reading order. The metadata is
created with a "flowto" concept, as defined in the working draft of the Accessible Rich
Internet Applications (WAI-ARIA) version 1.0 [WAI-ARIA]. Each flowto attribute has an
ID for a target element to be read next.
It is easy to add flowto attributes to the content, but currently (as of September 2011)
there are no screen readers that can directly use the flowto attributes to control the order
of the content. Therefore currently the flowto metadata is applied to the content inside
the browser on the client side to change the order within the DOM tree of the original
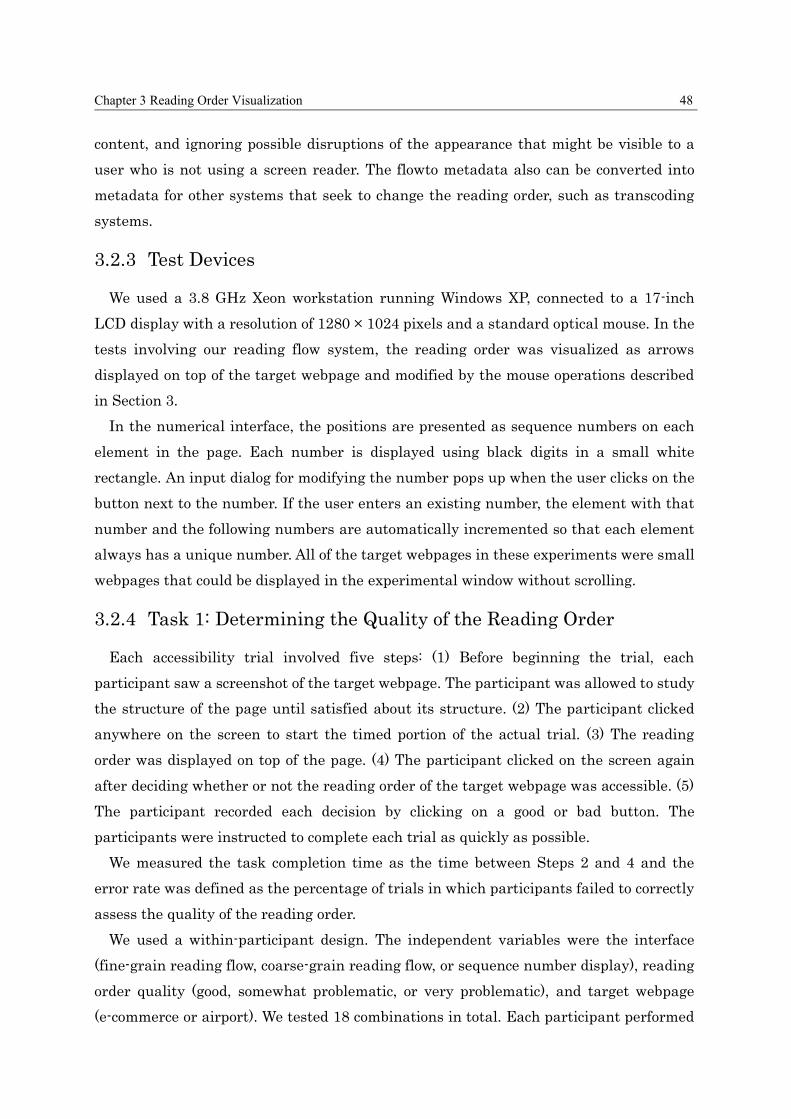
Chapter 3 Reading Order Visualization 48
content, and ignoring possible disruptions of the appearance that might be visible to a
user who is not using a screen reader. The flowto metadata also can be converted into
metadata for other systems that seek to change the reading order, such as transcoding
systems.
3.2.3 Test Devices
We used a 3.8 GHz Xeon workstation running Windows XP, connected to a 17-inch
LCD display with a resolution of 1280 × 1024 pixels and a standard optical mouse. In the
tests involving our reading flow system, the reading order was visualized as arrows
displayed on top of the target webpage and modified by the mouse operations described
in Section 3.
In the numerical interface, the positions are presented as sequence numbers on each
element in the page. Each number is displayed using black digits in a small white
rectangle. An input dialog for modifying the number pops up when the user clicks on the
button next to the number. If the user enters an existing number, the element with that
number and the following numbers are automatically incremented so that each element
always has a unique number. All of the target webpages in these experiments were small
webpages that could be displayed in the experimental window without scrolling.
3.2.4 Task 1: Determining the Quality of the Reading Order
Each accessibility trial involved five steps: (1) Before beginning the trial, each
participant saw a screenshot of the target webpage. The participant was allowed to study
the structure of the page until satisfied about its structure. (2) The participant clicked
anywhere on the screen to start the timed portion of the actual trial. (3) The reading
order was displayed on top of the page. (4) The participant clicked on the screen again
after deciding whether or not the reading order of the target webpage was accessible. (5)
The participant recorded each decision by clicking on a good or bad button. The
participants were instructed to complete each trial as quickly as possible.
We measured the task completion time as the time between Steps 2 and 4 and the
error rate was defined as the percentage of trials in which participants failed to correctly
assess the quality of the reading order.
We used a within-participant design. The independent variables were the interface
(fine-grain reading flow, coarse-grain reading flow, or sequence number display), reading
order quality (good, somewhat problematic, or very problematic), and target webpage
(e-commerce or airport). We tested 18 combinations in total. Each participant performed

Chapter 3 Reading Order Visualization 49
one trial for each combination. The presentation order of the interfaces was
counterbalanced. The various qualities of the reading order and the various target
webpages were presented in a random order.
To introduce this task, we instructed participants about accessible and inaccessible
reading orders, including several good and bad examples. Each participant also had a
training trial for each interface to become familiar with the task. Each session took
approximately 10 minutes, including the training.
3.2.5 Task 2: Revising the Reading Order of the Content
Each editing trial involved four steps: (1) Before beginning the trial, each participant
saw two screenshots, one with the initial reading order and another with the desired
reading order. The participant was also told about the specific problems of the initial
order and given instructions about how to fix the problems. (2) The participant clicked on
a start button to begin the trial. (3) The participant modified the reading order to change
it to the desired order using one of the two interfaces. (4) The trial ended as soon as the
modified reading order matched the desired order. During this task, the granularity
slider was set to "fine" because several steps in this task required low-level changes in
the reading order, which could only be performed with the fine-grain arrows. The
participants were asked to complete each trial as quickly as possible. We defined the task
completion time as the time between Steps 2 and 4. We did not measure error rates
because each trial continued until the reading order matched the desired order.
We again used a within-participant design. The independent variables were the
interface (reading flow or sequence number entry), reading order quality (somewhat
problematic or very problematic), and target webpage (e-commerce or airport). We tested
eight combinations in total. Each participant performed one trial for each combination.
Half of the participants had four trials of the reading flow interface first, followed by four
trials of the number sequence entry interface. The other half of the participants had the
reverse order. The quality of the reading order and the target webpages were presented
in a random order.
At the beginning of each session, both interfaces were described. The participants also
received a training trial for each interface to familiarize them with this task. Each series
of sessions took approximately 20 minutes, including training. After finishing all of the
sessions, the participants filled in a questionnaire that covered both tasks.
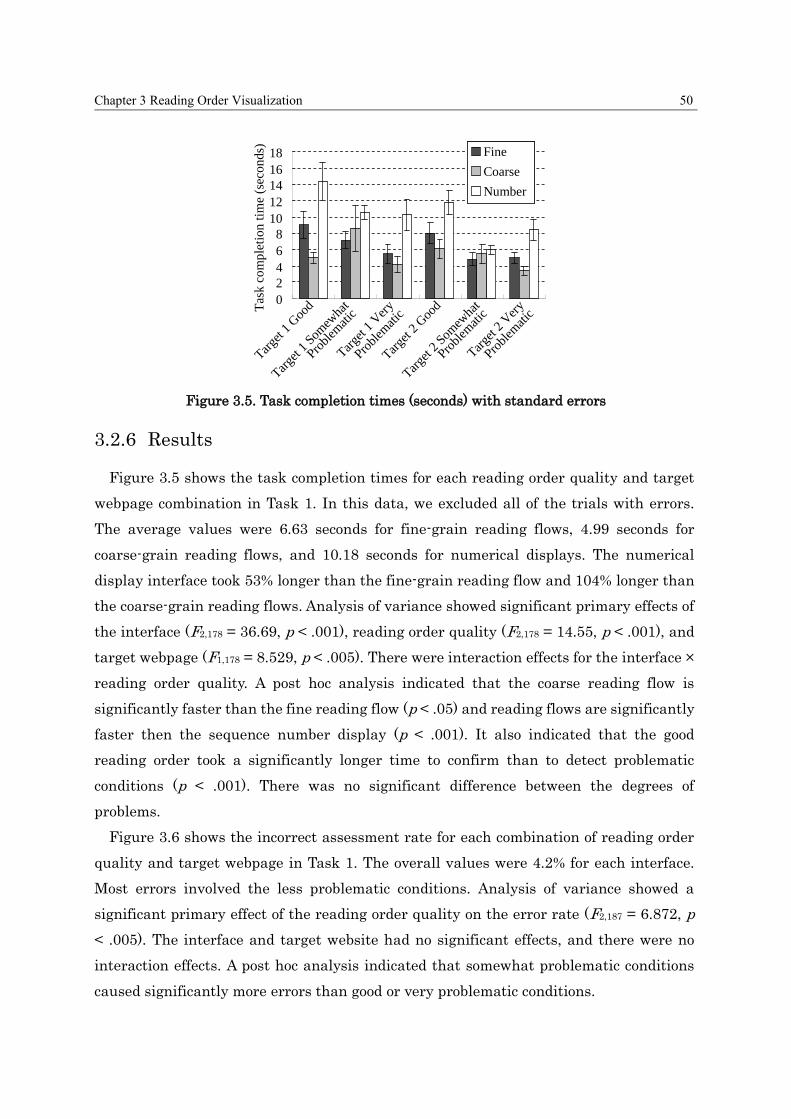
Chapter 3 Reading Order Visualization 50
3.2.6 Results
Figure 3.5 shows the task completion times for each reading order quality and target
webpage combination in Task 1. In this data, we excluded all of the trials with errors.
The average values were 6.63 seconds for fine-grain reading flows, 4.99 seconds for
coarse-grain reading flows, and 10.18 seconds for numerical displays. The numerical
display interface took 53% longer than the fine-grain reading flow and 104% longer than
the coarse-grain reading flows. Analysis of variance showed significant primary effects of
the interface (F2,178 = 36.69, p < .001), reading order quality (F2,178 = 14.55, p < .001), and
target webpage (F1,178 = 8.529, p < .005). There were interaction effects for the interface ×
reading order quality. A post hoc analysis indicated that the coarse reading flow is
significantly faster than the fine reading flow (p < .05) and reading flows are significantly
faster then the sequence number display (p < .001). It also indicated that the good
reading order took a significantly longer time to confirm than to detect problematic
conditions (p < .001). There was no significant difference between the degrees of
problems.
Figure 3.6 shows the incorrect assessment rate for each combination of reading order
quality and target webpage in Task 1. The overall values were 4.2% for each interface.
Most errors involved the less problematic conditions. Analysis of variance showed a
significant primary effect of the reading order quality on the error rate (F2,187 = 6.872, p
< .005). The interface and target website had no significant effects, and there were no
interaction effects. A post hoc analysis indicated that somewhat problematic conditions
caused significantly more errors than good or very problematic conditions.
0
2
4
6
8
10
12
14
16
18
Targe
t 1 G
ood
Targe
t 1 S
omew
hat
Probl
emat
ic
Targe
t 1 V
ery
Probl
emat
ic
Targe
t 2 G
ood
Targe
t 2 S
omew
hat
Probl
emat
ic
Targe
t 2 V
ery
Probl
emat
ic
Fine
Coarse
Number
Fine
Coarse
Number
Tas
k c
om
ple
tio
n t
ime
(sec
on
ds)
Figure 3.5. Task completion times (seconds) with standard errors

Chapter 3 Reading Order Visualization 51
Figure 3.7 shows the task completion time for each combination of reading order
quality and target webpage in Task 2. The overall average values were 31.6 seconds for
reading flows and 49.1 seconds for numerical entries. The numerical entry interface took
56% longer than the reading flow interface. The reading flow interface generally
outperformed the numerical entry interface except for the e-commerce website in the
somewhat problematic condition. Analysis of variance showed a significant primary
effect of the interface on this value (F1,77 = 9.226, p < .005). The reading order quality and
target website had no significant effects and there were no interaction effects.
The post experiment questionnaire asked for subjective evaluations of our reading flow
interface. All eleven participants preferred the reading flow interface to the numerical
display interface for both tasks. For Task 1, six participants preferred coarse-grain
reading flows, two preferred fine-grain reading flows, and the others had no preference
between the reading-flow granularities.
0%
2%
4%
6%
8%
10%
12%
14%
16%
18% Fine
Coarse
Number
Err
or
rate
(%
)
Targe
t 1 G
ood
Targe
t 1 S
omew
hat
Probl
emat
ic
Targe
t 1 V
ery
Probl
emat
ic
Targe
t 2 G
ood
Targe
t 2 S
omew
hat
Probl
emat
ic
Targe
t 2 V
ery
Probl
emat
ic
Figure 3.6. Error rate (%) for quality assessment
0
20
40
60
80
100
120
Tar
get
1
So
mew
hat
Pro
ble
mat
ic
Tar
get
1
Ver
y
Pro
ble
mat
ic
Tar
get
2
So
mew
hat
Pro
ble
mat
ic
Tar
get
2
Ver
y
Pro
ble
mat
ic
Reading Flow
Number
Tas
k c
om
ple
tion
tim
e (s
econ
ds)
0
20
40
60
80
100
120
Tar
get
1
So
mew
hat
Pro
ble
mat
ic
Tar
get
1
Ver
y
Pro
ble
mat
ic
Tar
get
2
So
mew
hat
Pro
ble
mat
ic
Tar
get
2
Ver
y
Pro
ble
mat
ic
Reading Flow
Number
Reading Flow
Number
Tas
k c
om
ple
tion
tim
e (s
econ
ds)
Figure 3.7. Task completion times (seconds) with standard errors for reading order revision

Chapter 3 Reading Order Visualization 52
3.3 Discussion
3.3.1 Effectiveness and Visual Patterns
The results clearly show the effectiveness of this new visualization method. Subjects
could perform the tasks in significantly shorter times (Figure 3.5) by using the
visualization than by using the sequence number display. Also, the subjects preferred the
visualization over the sequence number display (Figure 3.7). The coarse-grain
visualization also accelerated the work. In most cases, coarse-grain visualizations were
significantly faster than fine-grain visualizations (Figure 3.5), even though the error
rates were the same (Figure 3.6).
The differences in task completion time were significant between visualization and
sequence number display in all cases, but the degree varied depending on the quality of
each target page. When a page did not have any problems ("good" in Figure 3.5) or when
a page had many problems ("very problematic"), the difference is much larger than for
pages with a smaller numbers of problems ("somewhat problematic").
One possible interpretation of the result is that subjects could recognize visual
patterns for good or very problematic pages at a glance. The visual patterns are not clear
from the interview comments, but we think that one of cues is the number of crossing
points in the visualization. The line traverses the content with fewer crossing points if
the reading flow matches smoothly with the visual semantics, otherwise the line becomes
tangled with many crossing points (Figure 3.8a). In contrast, for "somewhat problematic"
pages, the problem is elusive in the smooth reading flow line, which is not visually
obvious in comparison to good pages (Figure 3.8b). The error rate was significantly
higher in those tasks, even though subjects spent substantial time with somewhat
problematic pages (Figure 3.6). This may indicate that subjects overlooked small visual
patterns with problems.
If this hypothesis is true, it should be possible to improve the visualization by
highlighting the characteristic visual patterns of problems on a page. For example, the
color gradation for each segment of the flow line from the top to the end of a page could
improve the visibility of visual patterns by giving a sense of the distance for each
intersection. A more direct enhancement might be the highlighting of each crossing point
with a red flag on the background. If a visualization is filled with red, then the page may
have many problems. Another type of improvement involves few crossing points. For
example, Figure 3.8b looks like a good example with a smooth line and no crossing points,
but it has the table layout problem. This example resulted in the highest error ratio

Chapter 3 Reading Order Visualization 53
(Figure 3.6 "Target 2 Somewhat Problematic"). This type of problem can be easily
recognized by comparing the reading order with the original content without considering
the visual patterns. Therefore, it is necessary to warn users about potential problems in
the visualization. For example, if the knobs had different colors for table elements, that
could warn users to carefully consider the semantic reading order in the visualization.
3.3.2 Interface for Correction
The results of Task 2 show the significance of the visualization for correction tasks
compared with the numerical interface. However, the difference is not clear in some cases.
For example, the somewhat problematic example for target 1 had results that were
reversed from the other cases (Figure 3.7). Subjects commented that they consistently
tried to scan the numbers from the top of a page, and changed the values to satisfy the
semantic ordering. For the reversed results, the page can be fixed by changing only a few
numbers close to the top of the page. Then the subjects could finish more quickly, since
the time duration for each repair operation is shorter than the visualization. One subject
also commented that the temporary intermediate visualizations during a sequence of
repair operations were often hard to interpret as the lines became tangled.
These results give insights into the characteristics of the repair operations. The
visualization was very quick and effective when subjects could recognize the problems in
a webpage, and the improved recognition times also contributed to the improvements in
the correction task (Task 2). However, the correction operation based on mouse dragging
was relatively less time effective and also the method for temporary intermediate
visualization was not completely effective for the subjects during the task.
Several areas for possible improvements appear in these results. The biggest area
might be a combination interface with both sequence numbers and the visualization. The
(a) (b)
Figure 3.8. Examples of reading flows with problems

Chapter 3 Reading Order Visualization 54
numbering of each element would be the simplest combination and also temporary and
local numbering may improve the usability when changing the order of a series of
elements. The number-based correction also can be integrated into the visualization
along with a mouse-based interface that uses dragging and clicking. We will consider
these improvements as future work.
3.3.3 Possibility for Collaborative Correction
It is clear from the experiment that the visualization allows users to correct the
reading order significantly more quickly. If the method becomes sufficiently easy for
average Web users, then collaborative accessibility improvements for reading order by
the community volunteers will become possible in the near future. This would be part of
a new strategy to make a wide range of Web content more accessible by gathering the
power of Web users, based on the same social computing techniques as used in the widely
accepted wikis and social bookmarking services. Projects by Takagi et al. [2008] and
Bigham et al. [2007] are leading in this area, allowing volunteers to fix various
accessibility problems, such as missing alternative texts and missing heading tags.
Currently, the services do not have any functions to allow volunteers to reorganize
reading order, mainly because the existing reordering interfaces (such as the sequence
number display) are too difficult for typical Web users to understand without special
training. The reading flow will be one of the key technologies for such services to provide
ideally accessible webpages for the blind. We plan to deploy these functions to help blind
users who face difficulties in the current visual Web environment.
3.3.4 Feedback to the Original Content
Although the metadata for reading order is completely separated from the original
content in our current implementation, there are various possibilities for applying the
metadata to improve the content. The metadata can be used to modify the source of the
content or to change the live DOM on the client browsers, but the feedback system for the
reading order without affecting the appearance and the usability is a challenging
problem, because the structure of the content and the style sheets influence the
appearance and the usability. However this is one of the final stages when trying to
implement a full ecosystem of checking and organizing the reading order for the
collaborative corrections that help the blind users.

Chapter 3 Reading Order Visualization 55
3.4 Related Work
Accessibility Checking Tools
There are various types of automated tools to check whether or not a document
complies with the accessibility standards such as WCAG [WCAG1.0; WCAG2.0]. Some of
them also have functions to simulate or visualize the serialized forms of the content.
Textualization is the basic function provided by WAVE [Kasday 2000; WebAIM 2001],
aDesigner [Takagi et al. 2004], and many other tools. The textualizing functions provide
text-only views that simulate the serialized forms of the content. However, this function
does not offer an intuitive way for users to evaluate the appropriateness of the content
order because it obscures the positional information of the display. The users must
struggle to understand the relationships between the text and the original visual layout.
Numbering is an advanced function provided by WAVE. It visualizes the content order
by showing the sequence as a number with each element. Although the number is clear
about the order of the content, it is still hard to get an overview of the reading order. The
aDesigner tool also provides a function to visualize the content order using gradations of
the background color, thus showing the reaching time from the top of the webpage in the
screen readers, but there is no easy way for users to determine which elements come first
in the content. These tools are mainly used for checking the accessibility, and they don't
have functions to organize the order of the content.
In addition, there are some special techniques to visualize the Web accessibility on a
webpage or a website. Bailey et al. [2005] developed a tree-map visualization technique
to highlight areas of a website that need to be improved in accessibility. The system
evaluates the accessibility level of each of the webpages within a website, and then draws
a tree-map with rectangular nodes that represents the hierarchy of the webpages. Each
node's color saturation is determined by the accessibility level. The lighter areas of the
tree-map indicates the less accessible parts of the website that need attention. Bigham et
al. [2010] proposed WebTrax which visualizes the process that screen reader users
employ to access content. WebTrax makes a heatmap for the interaction of a user with a
webpage. This is inspired by a visualization of an eye-tracking heatmap and also
assesses how much of the content the user listened to before moving to another element.
The heatmaps give observers a global picture of what content is easy to access, and show
the irrelevant content that users must listen to before finding what they want.
Tools for Optical Character Recognition (OCR)

Chapter 3 Reading Order Visualization 56
In the field of OCR, there are also problems with the reading order of the content, and
these problems have led to significant research. Various technologies predict the reading
order based on layout analysis [Meunier 2005] or machine learning techniques [Malerba
et al. 2008]. Those automatic predictions may not be perfect. Therefore tools to visualize
the results and to allow users to correct the results have been created. Such tools also
include functions that allow users to adjust the reading order, which is important when
validating OCR results [Ha Lee et al. 2003; Yacoub et al. 2005; Yanikoglu et al. 1998].
One system visualized the order between pairs of recognized text zones in the captured
image by using arrows. Our reading flow was motivated by these techniques. We have
extended the functions to handle the specific accessibility problems of HTML documents,
and also improved the usability and the presentation.
3.5 Summary
A new method to visualize the reading order of webpages was introduced. Our "reading
flow" approach allows Web authors to easily and intuitively evaluate the appropriateness
of the reading order for their webpages. We have shown how the reading flow visually
exposes the order of webpages with a variable granularity, supporting functions for
visually reordering the elements, and generating reading order metadata that is
separate from the original content. Two sets of user experiments were conducted
comparing the performance in recognition and the performance of repair tasks in the
reading order (relative to a numerical interface). The results show that the reading flow
technique is significantly faster than a numerical interface. The result also suggested
several areas for improvement, both in visualization and in the interface for repairs. The
visualization will be a key technology to allow average Web users to work on improving
Web accessibility in the social approach. We hope to deploy the visualization function to
broader audiences, and to provide the benefits of this new metadata for correcting
reading order for blind users worldwide.

57
Chapter 4
Voice Augmented Web Browsing
We showed in Chapter 2 that collaboration with volunteers can make webpages
accessible through authoring external metadata. This chapter describes voice augmented
Web browsing which we are proposing as a possible user interface for external metadata
created by volunteers. This is user interface supports users through aural channels and
focuses mainly on users (such as visually impaired users) who are using screen reading
software to access the webpages and older adults who are losing their cognitive and
physical abilities gradually not completely losing one of any ability.
Of course, the voice augmentation systems for visually impaired users are totally
different from those suitable for older adults. For visually impaired users, since screen
reading software is provided through audible channels, a voice augmentation system
results in a two-channel audible interface. In contrast, for older adults it can utilize both
visual and audio capabilities even though their physical capabilities may be diminished.
The current capabilities of audible interfaces for visually impaired people are quite
limited and the Web is still evolving rapidly, making many webpages too complicated to
access with audible interfaces such as screen reading software. There is a central
limitation in the current model of Web navigation. An audible user interface is
fundamentally sequential, so it provides only a limited amount of information at a time,
which makes it hard for a user to get an overview of a webpage. Many webpages have
highly visual layouts that are hard to understand by ear. Due to these limitations, people
who use audible interfaces to browse webpages find it slow and tend to lose their place
repeatedly, making their browsing experience less reliable and less satisfying [Takagi et
al. 2007].
In addition, much of the Web is being created by younger adults and is designed for
them, reflecting their tastes and capabilities. Recently some activities to improve Web
accessibility guidelines for older adults have begun [Affonso de Lara et al. 2010;
WAI-AGE]. The elderly tend to shy away from the Web because they are not familiar
with the uses of Web applications and the concepts of the typical GUIs and they fear

Chapter 4 Voice Augmented Web Browsing 58
being misled by the unfamiliar operations.
Therefore, we devised a new voice augmentation system to improve the Web
experience for these users [Sato, Kobayashi, et al. 2011; Sato, Zhu, et al. 2011]. This
chapter summarizes several prototypes of the voice augmentation systems for the blind
users and the older adults along with user studies with actual users, as well as covering
the related work. Although the prototypes and the initial evaluations focus on the
audible Web browser, the insights obtained are important for developing broader types of
audible user interfaces.
4.1 Voice Augmentation
Voice augmentation aims to simulate a friend (or a family member) of the user who is
standing nearby with whispered tips for navigating the webpages. This virtual friend is
watching the display and observing the behavior of the user to provide context-based
hints and guidance. Computers cannot simulate complicated human behaviors, but even
partial assistance can be helpful. Various kinds of information can be provided by using
external metadata created by volunteers and also by using heuristics and data analysis
techniques with the data from the webpages and records of user behaviors.
We regard voice augmentation as an example of a general concept of a user interface
that provides supplemental information for many kinds of people via an audio channel.
From the users' various viewpoints, ideally they would have a non-intrusive audio-based
augmented environment.
One of the advantages of voice augmentation approach is that voice support can
provide additional content within current Web applications. This allows applications to
be used as they are. Of course voice augmentation can coexist with alternative interfaces
and just provide basic components for older adults or novice users.
4.1.1 Voice Augmentation for the Blind
As the first proof-of-concept prototype, the voice augmentation browser we developed,
called the Sasayaki (which means „whisper' in Japanese) system, presents the output of a
standard auditory browser and the supporting information about the webpages in
parallel through separate voice channels. The main voice provides raw text and some
structured information from the webpages.
In contrast, the secondary voice is for contextual navigation guidance based on the
user's position and overviews of the webpages from content analysis and the metadata
for the webpages. A user listens to these two different voices from two physically

Chapter 4 Voice Augmented Web Browsing 59
separated speakers. Sasayaki helps users dynamically switch their focus depending on
the context, so they can focus on relevant information while moving and jumping quickly,
but without losing track of their location within the webpage.
Sasayaki tries to act in a supportive role to help the users as would a sighted person in
assisting the visually impaired user (Figure 4.1). It provides apparently intelligent
feedback by analyzing user behavior, status, and other related contextual evidence.
Sasayaki then provides bits of verbal information and advice with a synthesized voice.
Sasayaki can also provide other kinds of audio-based hints, such as sound effects,
background music, or background noises. One simple example would be a car navigation
system that could provide extra information about popular restaurants near the
anticipated location of the user's car based on the planned route, in parallel with the
main voice that provides driving directions. Another example would help a blind user
shopping for gifts on an e-commerce site. In this situation, the agent could suggest
popular gifts while helping to orient and guide the user around the webpages. However,
since people who have visual impairments are the main population who must depend on
the audible interface and often experience various difficulties in using it, we focused on
them in the initial design and development of Sasayaki.
The following four categories of information are expected to be useful for blind users
navigating webpages. This includes information that is hard to obtain from non-visual
user interfaces as well as some information that is useful for sighted people.
Spatial: For the blind users, it is very hard to be aware of the position of their cursors
or to know the position where the screen reader is currently reading. Although this is
very fundamental and easy for sighted people, the blind users cannot get an overview of
Current position,
User behavior, ContextVoice Browser
Voice Browser
“Skipped the main!”
“It’s a popular link”
“The price is $120”
Voice Augmentation
XYZ news
link politics
link economics
link sports
…
Heading level 1 …
Figure 4.1. Concept of Sasayaki User Interface Agent

Chapter 4 Voice Augmented Web Browsing 60
their context without special help. There are Braille blocks, Braille maps, and audio
signals for crossing streets or climbing stairs in our physical world, and these give blind
people some awareness of their locations and the context. Webpages need similar signals
for easier navigation [Goble et al. 2000].
Contextual: Sasayaki changes behavior according to the context of the users. For
example, the Sasayaki system can detect when a user seems to be lost and then provide
appropriate support to recover. As described in the related work section, there are many
forms of contextual support. For example, when a user is shopping, Sasayaki provides
prices and user reviews for achieving the goals of the user's purchases.
Social: Sasayaki provides a kind of extra intelligence for blind users. The intelligence
can be socially generated by volunteers or users. Many studies tried to improve
accessibility by using external metadata [Chen et al. 2008; Lunn et al. 2008; Miyashita et
al. 2007; Takagi et al. 2008]. Such metadata can provide an outline of a webpage, locating
the header, the main content, advertisements, related information, and the footer.
Analysis: The intelligence also can be generated by the computer automatically.
Analyzing many user reviews to summarize the users' positive and negative reactions to
a restaurant is a typical example. Another example from an e-Commerce page would be
to suggest popular links or buttons in webpages by analyzing clickstreams, which would
allow the blind users to be aware of which webpages other people tended to navigate to
without having any visual cues.
4.1.2 Voice Augmentation for Older Adults
We also describe how a voice-based augmented interface can make elderly users more
confident in completing tasks with online Web applications. The original
voice-augmented interface was evaluated for people with visual impairments. Those
results showed that the second channel for voice guidance increases blind users'
confidence in navigating in Web application. We assume that although the main
channels of the user interfaces are different (voice vs. graphics), the second channel using
a voice may help older adults complete the tasks in Web applications by increasing their
confidence in their operations. Proper support can reduce their cognitive load and help
them remember and learn. For example, some new home electrical appliances have
functions to provide voice guidance about proper usage. Users can operate such an
appliance without any manual, and such appliances are increasingly popular with the
elderly, though most Web applications still lack corresponding approaches to customer
support. This is primarily because the Web tends to be designed by and for younger

Chapter 4 Voice Augmented Web Browsing 61
people, a situation that is steadily changing. That is why we are investigating new ways
to apply voice augmentation methods to operations in Web applications.
The voice output we tested is a very simple concept to support operations in Web
applications (see Figure 4.2). The voice can provide instructions for users even when they
visit an application for the first time. During the processing of each webform in the
application, the voice repeats the user's input and tells the user about the next action.
Users can be notified of errors that are augmented with voices or sounds more easily
than by error texts alone. Such a voice can be pre-recorded or synthesized. Older adults
prefer a pre-recorded voice to a synthesized voice, but that approach is less flexible and
more expensive. Although we have developed a voice-based augmented interface for
people with visual impairments, a system for older adults requires different type of
augmentation, so we investigated the use cases and categorized the augmentations into
four types: confirmation, notification, contextualization, and summarization.
Confirmation: The system provides confirmation of a user's input. It reads all types of
form fields such as text, radio buttons, and so on, checking whenever the value of the
field is changed.
Notification: This system makes users aware of a status change on a webpage, such as
errors in a form (e.g., incorrect input) and the progress of content loading.
Contextualization: The system suggests the next action a user should perform in a
situation, such as the choices that can be performed and operational tips. For example,
"Press the search address button to input the address automatically using the
postal-code". The system can also explain the results of some actions.
What should I do?
The transaction menu is
located at left side. You can
select a menu …
Voice Augmentation
Figure 4.2. Concept of voice-augmented Web browsing

Chapter 4 Voice Augmented Web Browsing 62
Summarization: The system explains choices available on a page, summarizes the page
structure, or lists the steps to be performed by the user.
4.2 User Experiment with Blind Users
4.2.1 Implementation of Prototype System
We implemented a prototype of the Sasayaki system that helps users retain awareness
of their current position while providing overviews of the webpages. This supportive
information becomes available to the users through the whispering channel, either
automatically or as requested. Sasayaki comes from a different sound device physically
separated from the main speaker and uses a different speech synthesizer engine to
simulate the "whispering" scenario. In this way, Sasayaki efficiently and simultaneously
presents both voices to the users, making Sasayaki less intrusive but still noticeable. The
Sasayaki system is designed as a plug-in component for our voice browser called
aiBrowser [Eclipse 2008]. The behaviors and functions of aiBrowser are similar to
popular screen readers. Since Sasayaki system needs an API to obtain the context of the
Web browsing, aiBrowser was extended to provide it. Sasayaki could work with other
screen readers by adding a corresponding API as a plug-in or extension.
4.2.1.1 Role-based Notifications and Jumps
To provide users with contextual support, the Sasayaki plug-in retrieves pre-defined
role-based data about a webpage from an Accessibility Commons [Kawanaka et al. 2008]
server. The typical roles for content include main content, header, advertisement, and so
on. The Sasayaki plug-in also monitors the position of the current focus of the voice
browser and tracks key events linked to user behaviors. This allows the plug-in to
generate the most appropriate advice for each user. Sasayaki role-based notification will
be provided when entering a block with a role, when leaving the block, when approaching
an important block, and when an important block is skipped, and includes the length of
the current block and a summary of the blocks in the webpage. For example, when a user
reaches the defined main content body for the first time, the system will decide that
"Entering main" is a good contextual prompt. We call this Sasayaki whispering. A
notification that is the same as the previous will not be repeated within a certain period
of time. When multiple notifications are generated at the same time, the current system
gives just the notification having the highest priority. However, the system can also be
set to provide all of the notifications in priority order. If a new notification is triggered

Chapter 4 Voice Augmented Web Browsing 63
while a previous notification is playing, the system may interrupt the current
notification or finish it, depending on the relative priorities. Basically it is important to
provide the latest status of the system, but important messages such as "Skipped the
main content" should be conveyed to the users without disruption.
The Sasayaki whispering is provided at several role-tagged parts of the webpage.
Sasayaki also allows users to freely change the focus of the screen reader between
role-based parts using a „jump' function. We decided to add this feature since jump
functions are very common in modern screen reading software. For example, many users
already use jumps between heading elements (H1-H6), table elements, list items, form
elements, and so on. Hence users should be able to benefit from the Sasayaki jump
functions without changing their interaction model for browsing webpages.
4.2.1.2 Page Overview and Text Analysis
In addition, for webpages that belong to the same category, the important information
tends to be similar. For example, for product pages from an online shopping website, each
page has the same kinds of important information, including price, in-stock information,
shipping rules, and so on. On complex webpages, non-visual users may have difficulties
in simply finding that basic information. Since such information appears in a variety of
formats in various webpages, Sasayaki parses the information by using metadata that
describes where and in what format the information appears. Then the system arranges
it into an easy-to-understand format sequenced according to the user's preferences, such
as availability information before price and grouped by star rankings, so that each user
can quickly get an overview of the crucial content in each page. Although the preference
setting was fixed for the pilot study, the design calls for user control.
Another problem is when voice browser users want the useful information in a large
body of user reviews. Some online shopping webpages collect such reviews, and in this
case Sasayaki can extract and analyze a large number of user reviews by using its
sentiment-based text mining component [Kanayama et al. 2004]. Sasayaki does this by
retrieving the original user reviews as text from the related webpages and passing it
internally to the text-mining component that generates statistics about the user
comments, covering various product aspects such as price, quality, or texture.
4.2.2 Pilot Study
An empirical study was conducted to evaluate the user performance and behaviors in
navigating webpages using our Sasayaki, comparing it to typical screen reader software.

Chapter 4 Voice Augmented Web Browsing 64
The primary foci of the evaluations were the role-based notifications and the jump
functions. Each participant was familiarized with Sasayaki and then asked to perform 5
tasks. After observing their performance, we also asked for their subjective ratings of the
agent system.
A pilot study [Zhu et al. 2010] was done before the main experiment with three blind
people (2 males and 1 female from 37 to 44 years old). Two of them are completely blind
and one has limited vision. Four tasks and a survey were given to each participant. In
this pilot study, we tried to explore differences between the same system with and
without Sasayaki functions. We compared the original aiBrowser system and aiBrowser
with all of the Sasayaki functions. We found that Sasayaki effectively supported the
users' navigation. The users working with Sasayaki spent much less time navigating to
the required page elements for each task. They also showed high confidence in their
abilities to do Web browsing tasks with Sasayaki functions. This study supported our
belief that Sasayaki could be a useful aid to improve user experience. This led us to focus
on the differences between Sasayaki whispering functions and the Sasayaki jump
functions in the main experiment.
4.2.3 Main Study
Nine native Japanese blind people (8 males and 1 female, from 30 to 53 years old),
none of whom were involved in the pilot study, participated in the experiment as paid
volunteers. They are referred to as P1 to P9 in the following sections. All of them were
completely blind and all had experience with Web navigation using screen reading
software. Eight of the participants were expert users with Web experience going back to
the 90s. The participant P9 became blind a few years ago and also has less experience
with the Web. Most of the participants had little or no exposure to the webpages used in
this experiment, though one participant was already familiar with the Amazon.co.jp site.
None of them had experience with aiBrowser.
4.2.3.1 Equipment
A ThinkPad T400 laptop with a 2.40-GHz Core 2 Duo CPU running Windows XP was
used as the experimental computer. This laptop has a build-in stereo speaker which was
used for the main voice output. A Yamaha USB-powered stereo speaker (NX-U10) was
placed next to the laptop for the Sasayaki voice. A standard Japanese 109-key USB
keyboard was used instead of the laptop keyboard, because keyboards differ among
laptops and using a standard Japanese keyboard helped avoid confusion.

Chapter 4 Voice Augmented Web Browsing 65
4.2.3.2 Sasayaki Conditions
We compared two types of differences, whether or not the system has the Sasayaki
whispering function and whether or not the system has the Sasayaki jump function.
There were four test conditions for the Sasayaki settings to evaluate how the Sasayaki
whispering and the Sasayaki jump functions affected the participants' performance of
typical navigation tasks.
The first condition was the original aiBrowser without Sasayaki whispering and
Sasayaki jump (NS-NJ). The second was aiBrowser with Sasayaki whispering but
without Sasayaki jump (S-NJ). The third was aiBrowser with the Sasayaki jump
function but without Sasayaki whispering (NS-J). The fourth was aiBrowser with both
Sasayaki whispering and Sasayaki jump (S-J).
4.2.4 Tasks
We used a within-participant design, so for each webpage each participant was asked
to perform the same set of tasks with each of the four Sasayaki conditions. The
independent variables were whispering (with or without Sasayaki whispering) and jump
(with or without Sasayaki jump). There were four sets of five target webpages (news
articles on Asahi1 and Nikkei2, product pages on Amazon3 and Yahoo4, and a product
search results page on Amazon3). Each participant performed one trial for each
combination. The presentation order of Sasayaki whispering was counterbalanced and
the order of Sasayaki jump was fixed because Sasayaki jump was observed to be able to
significantly reduce the task completion time in our pilot study, which led us to focus
primarily on the Sasayaki whispering conditions. Also, if the jump function was not
constant, then the number of samples for each condition became too small. Recruiting
more blind participants for larger samples is also difficult.
The participants were first familiarized with the functions of aiBrowser and Sasayaki,
including how to adjust the volumes and speech speeds of both voices. This involved a
different and special webpage. They were then asked to attempt each task with a time
limit or until they had failed three times. We prepared four different webpages with
1 Asahi newspaper: http://www.asahi.com/
2 Nikkei newspaper: http://www.nikkei.com/
3 Amazon.co.jp: http://www.amazon.co.jp
4 Yahoo Japan Shopping: http://shopping.yahoo.co.jp/

Chapter 4 Voice Augmented Web Browsing 66
similar test problems for each category of webpage. For all of the tasks, each participant
was asked to find specific information on the webpages and to report out loud with a
phrase such as "Here it is." The observer would then look at the focus of aiBrowser to
determine whether or not it was the correct position. We measured the task completion
time from when we asked them to start to when they successfully reported finding the
desired information. The keyboard events were recorded by the test system.
4.2.4.1 Tasks 1 and 2: Reading a news article
These two tasks were performed for article pages on two news websites, Asahi and
Nikkei. The participants were asked to find the first paragraph of the article on the page
within three minutes. This task assesses their navigation to the main content of a
webpage.
4.2.4.2 Tasks 3 and 4: Shopping for a product
These two tasks were performed at product pages on two e-commerce websites,
Amazon and Yahoo. They were asked to first find the price of the product and then find
the button to purchase the product. The total time limit for each pair of tasks was five
minutes. This task assessed navigation for the important information on the webpages.
4.2.4.3 Task 5: Searching for a price in a list of search results
The last task involved product search result pages on an e-commerce website, Amazon
(A-search). This kind of webpage has a list of more than twenty products. The
participants were asked to find the product with the highest price among the first ten
items in the list. This task tested navigation for a more sophisticated task and was timed
up to seven minutes.
4.2.5 Questionnaire and Interview
After the experiment, we used a survey with seven-point Likert items from
-3/definitely disagree to +3/definitely agree to compare the test conditions in pairs,
NS-NJ against S-NJ and NS-J against S-J. This produced subjective scores for the Web
experiences with the Sasayaki functions. Here are translations of the items from the
questionnaire.
Compared to the system without Sasayaki whispering [(NS-NJ or NS-J)], I found
the system with Sasayaki whispering [(S-NJ or S-J)] to be easier to use.
Compared to the system without Sasayaki whispering, I found the system with

Chapter 4 Voice Augmented Web Browsing 67
Sasayaki whispering to be useful.
Compared to the system without Sasayaki whispering, I had more control using
the system with Sasayaki whispering.
Compared to the system without Sasayaki whispering, I found the system with
Sasayaki whispering to be more pleasant.
Compared to the system without Sasayaki whispering, I felt more sure I would
finish with the system with Sasayaki whispering.
Compared to the system without Sasayaki whispering, I rated the system with
Sasayaki whispering output quality as better.
I would use the system with Sasayaki whispering if I had access to it.
The page overview functions, the text analysis functions, and the Sasayaki whispering
voice setting features were all explained before we interviewed the participants about
these three Sasayaki functions, about their ideas for improving the system, and about
some other questions.
4.3 Results of User Experiments with Blind Users
4.3.1 Task Completion Time
Figure 4.3 shows the average task completion times with standard errors. The average
values were 112 seconds for NS-NJ, 126 seconds for S-NJ, 71 seconds for NS-J, and 65
seconds for S-J. Analysis of variance showed significant primary effects for the Sasayaki
jump (F1,130 = 65.23, p < .001) and the target website (F4,130 = 51.05, p < .001).
00
30
60
90
120
150
180
210
240
270
300
330
360
Asahi Nikkei Amazon Yahoo A-searchTarget Website
Tas
k C
om
ple
tio
n T
ime
(sec
on
ds) NS-NJ
S-NJ
NS-J
S-J
Figure 4.3. The average task completion times

Chapter 4 Voice Augmented Web Browsing 68
There were interaction effects for the jump × the target website (F4,130 = 5.06, p < .005),
whispering × the target website (F4,130 = 3.33, p < .05). A post hoc analysis indicated that
Sasayaki jump function significantly decreased the task completion time and the impact
of the Sasayaki whispering function depended on the task. The data for the trials that
were stopped because of the time limits are not included in this graph. Seven
participants ran out of time in the Amazon webpage with NS-NJ and some participants
were out of time for Nikkei, Yahoo, and A-search with the NS-NJ condition, for Amazon
and A-search with the S-NJ condition and for Yahoo with the NS-J condition. With the
S-J condition, everyone finished the problems within the allowed time.
Table 4.1 shows the number of participants who failed to complete tasks due to the
time limits. The reason many people failed on the Amazon webpages was that these
webpages have a difficult structure. Table 4.2 shows the number of participants who had
incorrect answers during the task. No participant had more than two mistakes and no
participant made any mistakes with the S-NJ or S-J conditions.
4.3.2 Subjective Scores
Figure 4.4 and Figure 4.5 show the average subjective ratings with standard errors for
the seven questions comparing conditions without jump (NS-NJ vs. S-NJ) and conditions
with jump (NS-J vs. S-J). All of the participants except P4 gave positive ratings. The
average score is 1.43 for NS-NJ vs. S-NJ and 2.10 for NS-J vs. S-J. All of the scores of
NS-J vs. S-J are equal to or higher than those of NS-NJ vs. S-NJ. "Would use" received
Table 4.1. Numbers of participants who failed to complete a task within the time limit
Asahi Nikkei Amazon Yahoo A-search
NS-NJ 0 1 7 2 4
S-NJ 0 0 4 0 3
NS-J 0 0 0 1 0
S-J 0 0 0 0 0
Table 4.2. Number of participants with incorrect answers during each test
Asahi Nikkei Amazon Yahoo A-search
NS-NJ 0 0 2 3 1
S-NJ 0 0 0 0 0
NS-J 0 0 0 1 0
S-J 0 0 0 0 0

Chapter 4 Voice Augmented Web Browsing 69
the highest score in both, with or without jump comparisons. For conditions without the
Sasayaki jump feature, the "pleasant" and "confident" questionnaire items received
higher scores. For conditions with jump, the "easy to use", "useful", and "sure" items
received higher scores.
4.3.3 Navigation Behavior Analysis
All of the participants finished all of the tasks within 30 to 50 minutes. While working
on the tasks they made from 1,800 to 3,500 keystrokes in navigating the webpages.
Figure 4.6 shows the average numbers of keystrokes for each condition, including all of
the trials. The average values were 194 keystrokes for NS-NJ, 175 for S-NJ, 77 for NS-J,
and 69 keystrokes for S-J. Analysis of variance showed significant primary effects for the
Sasayaki jump (F1,152 = 80.090, p < .001) and for the target website (F4,152 = 38.098, p
< .001). There were interaction effects for the jump × the target website (F4,152 = 10.85, p
< .001).
A post hoc analysis indicated that the Sasayaki jump function decreased the numbers
of keystrokes. Table 4.3 shows the average ratios when using the navigation commands.
Easier to use
Useful
Had more control
Pleasant
Sure
Better output quality
Would use
-3 0 3
Subjective Score
-2 -1 1 2NS-NJ S-NJ
Easier to use
Useful
Had more control
Pleasant
Sure
Better output quality
Would use
-3 0 3
Subjective Score
-2 -1 1 2NS-NJ S-NJ
Figure 4.4. The average subjective scores for NS-NJ vs. S-NJ
-3 0 3
Subjective Score
-2 -1 1 2NS-J S-J
Easier to use
Useful
Had more control
Pleasant
Sure
Better output quality
Would use
-3 0 3
Subjective Score
-2 -1 1 2NS-J S-J
Easier to use
Useful
Had more control
Pleasant
Sure
Better output quality
Would use
Figure 4.5. The average subjective scores for NS-J vs. S-J

Chapter 4 Voice Augmented Web Browsing 70
More than 60% of the navigation commands were "Next element" and about 20% of the
navigation commands were "Previous element". The rest of the navigation commands
were mostly for jumps.
4.3.4 Navigation Trace Analysis
Each blind user has a strategy for Web navigation and may change that strategy based
on the type of webpage or the purpose of navigation. Based on their different strategies,
the nine participants can be categorized into three groups. In the first group, five
participants (P1, P2, P3, P4, and P5) mainly used the heading jump with page search as
their second choice. In the second group, three participants (P6, P7, P9) mainly used page
searching functions and heading jumps as a second choice. There was only one
0
50
100
150
200
250
300
350
400
450
Asahi Nikkei Amazon Yahoo A-search
Target Website
Num
ber
of
Key
stro
kes
NS-NJ
S-NJ
NS-J
S-J
Figure 4.6. The average number of keystrokes
Table 4.3. The average ratios of navigation command usage
Type NS-NJ S-NJ NS-J S-J
Next element 64.6% 66.7% 61.3% 60.0%
Previous element 21.8% 18.6% 21.1% 19.4%
Next heading 4.0% 6.0% 1.0% 1.5%
Previous heading 1.4% 2.0% 0.5% 0.3%
Next link 3.3% 3.2% 0.3% 1.1%
Previous link 3.1% 2.2% 0.0% 0.4%
Sasayaki jump (next) 0.0% 0.0% 9.4% 10.5%
Sasayaki jump
(previous)
0.0% 0.0% 3.9% 5.3%
Others 1.8% 1.3% 2.4% 1.5%

Chapter 4 Voice Augmented Web Browsing 71
participant in group three who mainly used the cursor keys, usually with the tab key, to
explore elements linearly or to jump between links (P8).
Figure 4.7 shows the traces for P4 with the NS-NJ and S-NJ conditions in the Nikkei
webpage. The horizontal axis is the time spent on each task and the vertical axis is the
focus position in the page. The black line shows how the participant moved on the page
and the horizontal gray line indicates the area with the target element for that task. The
dashed gray lines are for heading elements. In both the traces for NS-NJ and for S-NJ, by
using heading jump functions the participants' focus arrived at the same location, which
was just ahead of the target area. For NS-NJ, the participant accidentally passed the
target area and came back to it. For S-NJ, the Sasayaki whispers such as "close to main"
and "entering main" were helpful for the participant in finding the target content. Figure
4.8 shows another trace of P6 with NS-NJ and S-NJ. This user's navigation strategy was
mostly based on page search. For NS-NJ, P6 failed in the search because of a typing
mistake. He then used the heading jump function and found the main content. However
P6 checked the previous content again to make sure about the goal of the task (in the
period from 40 to 50 seconds). This kind of pattern was observed 11 times without
Sasayaki whispering and only 5 times with Sasayaki whispering, indicating that the
Sasayaki whispering improved users' confidence that they had found the desired
webpage elements.
There were also cases in which the Sasayaki functions didn't work well. Figure 4.9
shows the traces for the Asahi newspaper with S-NJ by P3 and P9. P3 heard "close to
Focu
s po
siti
on
in
th
e p
age
Time Spent (seconds)
NS-NJ, P4 S-NJ, P4
120100806040200 120100806040200
Target content Headings
Pag
e to
pP
age
bott
om
Pag
e to
pP
age
bott
om
Pag
e to
pP
age
bott
om
Pag
e to
pP
age
bott
om
120100806040200 120100806040200
Figure 4.7. Navigation traces on Nikkei newspaper for NS-NJ and S-NJ by P4

Chapter 4 Voice Augmented Web Browsing 72
main" as a Sasayaki whisper but P3 could not navigate step by step before passing the
target area and then skipped the main content by using heading jump. Unfortunately the
Sasayaki system basically tries to convey information about the current position rather
than about the content the user has already passed. This design was chosen to reduce the
amount of information whispered by Sasayaki so that the two voices could be heard more
easily. P9 was confused by the Sasayaki whispering and said "the structure of the page
from the Sasayaki whispers was not easy to understand" and "'close to main' should
mean within two or three items of the position". This case suggests that we need either a
personalized control for the details of the Sasayaki content, or better training so that
users would be more familiar with our Sasayaki system.
Another problem involved incorrect assumptions about the structure of the webpage,
especially for the Amazon product page. In this page, the "add to cart" button, the
product title as the first heading element, and the price appeared in that order. However,
most participants thought that the "add to cart" button must be below the price. Figure
4.10 shows the traces of Amazon webpages for NS-J by P4 and for S-NJ by P9. There are
two target areas in this task. The first area contains the "add to cart" button and the
other contains the price information. P4 found the "add to cart" button by using the
Sasayaki jump function, and then tried to search for the price in front of the button three
times. Finally P4 used the page search function to get the price. In contrast, P8's strategy
is to explore the webpage elements one by one, so P8 was aware of the position of the
"add to cart" button when the Sasayaki whisper said "often used button" to emphasize it.
Fo
cus
po
siti
on
in t
he
pag
e
Time Spent (seconds)
NS-NJ, P6 S-NJ, P6
6050403020100 6050403020100
Target content Headings
Pag
e to
pP
age
bott
om
Pag
e to
pP
age
bott
om
Pag
e to
pP
age
bott
om
Pag
e to
pP
age
bott
om
6050403020100 6050403020100
Figure 4.8. Navigation traces on Asahi newspaper for NS-NJ and S-NJ by P6

Chapter 4 Voice Augmented Web Browsing 73
However, P8 then searched for another "add to cart" button after the price and thus could
not finish.
4.4 User Experiment with Older Adults
4.4.1 Study 1: Banking and Shopping
Our first study observed how users interacted with unfamiliar Web applications and
how they felt about voice augmentation with a Wizard-of-Oz implementation [Dahlbäck et
al. 1993].
Fo
cus
po
siti
on
in t
he
pag
e
Time Spent (seconds)
S-NJ, P3 S-NJ, P9
120100806040200 120100806040200
Target content Headings
Pag
e to
pP
age
bott
om
Pag
e to
pP
age
bott
om
Pag
e to
pP
age
bott
om
Pag
e to
pP
age
bott
om
120100806040200 120100806040200
Figure 4.9. Navigation traces on Asahi newspaper for S-NJ by P3 and P9
.
Focu
s po
siti
on
in t
he
pag
e
Time Spent (seconds)
NS-J, P4 S-NJ, P8
300250200150100500 300250200150100500
Target content Headings
Pag
e to
pP
age
bott
om
Pag
e to
pP
age
bott
om
Pag
e to
pP
age
bott
om
Pag
e to
pP
age
bott
om
300250200150100500 300250200150100500
Figure 4.10. Navigation traces on Amazon product pages for NS-J by P4 and S-NJ by P8

Chapter 4 Voice Augmented Web Browsing 74
4.4.1.1 Participants
Ten older adults participated in this study. Half of them were in their 60s and the other
half were in their 70s. They were familiar with computers because they had retired after
working for IT companies. Some of them were engineers and others were in sales. Since
current employees are quite experienced with computers and the Web, we believe that
our participants typify the older population of the future.
Table 4.4 summarizes their experiences with online Web applications, online banking,
and online shopping. Most of them were experienced online shoppers but only three had
experience with online banking. The participants without online banking experience said
they felt it was insecure, they were satisfied with ATMs, and that it was too much trouble
to sign up for and learn how to use new services and applications.
4.4.1.2 Procedure
Each user was asked to perform two tasks with Web applications: (1) a fund transfer
using an online banking application, followed by (2) a purchase using an online shopping
application. Table 4.4 shows the experience of each user. For each task, the observer first
told the user about the task and then the user attempted to perform the task without
voice augmentation or human assistance. The observer manually recorded the user's
behavior, including the page navigation history, struggles, errors, and so on, as precisely
as possible. After the task was finished, the user was asked about the task with reference
to the recorded notes about the session.
The three users with experience using online banking had not used the specific
application used in this study. Four of the users with experience in online shopping had
used the same application as the study (the *s in Table 4.4). It was not feasible to register
for the online banking application for each user in this study, so the authors provided two
online banking accounts and the participants transferred money from one account to the
other. This gave the users an authentic feeling of making transactions on the Web. In
contrast, the shopping purchases were not executed, but the users were told to stop just
before clicking on the last button in the ordering process.
After doing the two tasks without voice augmentation, the user and the observer
walked through the tasks again with voice augmentation using a Wizard-of-Oz protocol
and the user was interviewed again. The observer manually used a text-to-speech
application to play predefined messages suitable for the user's operations. Typical
messages were (Japanese) instructions such as "Please click the red login button on the

Chapter 4 Voice Augmented Web Browsing 75
right side of this page to start online banking", "Please input your account number and
the password", or "Please click the Continue button. The transaction will not be executed
yet."
Task 1: Online Banking
First the user was given an account card that describes the user ID with a table of
random numbers, the password for the account, and the account information for the
recipient of the transfer. Next the user was asked to open the webpage of the banking
application5 based on the observer's instructions. Then the user was told to transfer a
specified amount of money from the account to the recipient. Here are the required steps
for the task.
1. Click the "login" button at the top right of the webpage to open a new window for the
transaction. The user must do all of the banking transactions in this new window.
The window will initially be 700 pixels wide and 600 pixels high, which will require
scrolling or resizing.
2. Input the user ID and password for the account to get to the account page.
3. Click on the "transfer" menu at the top left of the account page.
4. Select the "new recipient" button after scrolling down approximately one screen (for
the initial window size).
5 Bank of Tokyo-Mitsubishi UFJ: http://direct.bk.mufg.jp/. The experiment was conducted from April 18 to
22, 2011.
Table 4.4. Experience with online banking and shopping
User
ID
Age-
group
Experience with
online banking
Experience with
online shopping
1 60-64 Yes Yes
2 60-64 No Yes *
3 65-69 No Yes
4 65-69 Yes Yes *
5 65-69 No Yes
6 70-74 No Yes *
7 70-74 No No
8 70-74 No Yes
9 70-74 No Yes *
10 75-79 Yes Yes
* indicates that the user has experience with the specific application that was used in the task.

Chapter 4 Voice Augmented Web Browsing 76
5. Select the bank of the recipient and click on the button with the first letter of the
branch of the recipient account to navigate to the next page.
6. Select the proper branch from a combobox and select the account type, and input the
account number and the amount of money. Then click on the "next" button to confirm
the information.
7. Check the information and input two requested random characters from the table on
the account card. Finally click on the "execute" button to finish the transfer.
Task 2: Online Shopping
Here are the required steps for this task, starting after the user had opened a product
page on the shopping website6.
1. Put the item into the shopping cart to open the page for the shopping cart.
2. Click the "proceed to checkout" button for the next page.
3. Input the user's name, address, and e-mail address and click the "next" button to
open the next form.
4. Select a payment option and a delivery option using radio buttons and click the
"next" button to open the last form
5. Confirm the information for the order but stop before clicking the "order" button.
4.4.2 Study 2: Webforms
Operations with a webform are likely to cause errors because the users must input or
select values that are acceptable to the application. Errors include typos, long or short
input, illegal characters for a text field, null selections, and so on. Another reason is that
older adults tend to type keys while looking at the keyboard instead of the screen. Our
hypotheses were that the voice augmentation could enhance their focus and also help
support accurate input, thus reducing errors and increasing the confidence of the users.
For this study, we implemented a simple webform application with voice augmentation
using Eclipse ACTF [ACTF] and a synthesized Japanese male voice. The application
immediately repeats the user's selection when the values of the combo boxes, check boxes,
or radio buttons are changed. It also repeats each key input in a text field and repeats
the final value of the text field which helps users to confirm their input, for example the
final value "1000000" will be read as "one million". This confirmation will be provided
6 Rakuten Ichiba: http://www.rakuten.co.jp/. The experiment was conducted from April 18 to 22, 2011.

Chapter 4 Voice Augmented Web Browsing 77
after a brief interval once the last key is typed to avoid confusing the users. We decided
on an interval of 1.5 seconds based on our experience in the pilot study with older adults.
Since the optimum time may be different for each user, the logs of the keyboard events
from this study are analyzed in Section 4.5.2.1 to investigate users' performance.
All events from the mouse and keyboard were recorded by the application. The
application was running on Windows, in an A4 notebook with a Japanese keyboard. The
users could point with the trackpoint on the notebook or with a USB mouse with a scroll
wheel.
4.4.2.1 Participants
Five younger adults and ten older adults participated in this study. The younger adults
are all in their 30s and are all familiar with computers and have advanced computer
skills. The older adults were the same participants from Study 1.
4.4.2.2 Procedure
The users were asked to fill out several types of forms in two modes, one without voice
(normal) and one with voice. The forms are: input a number (task-1), input a user's name
in Japanese (task-2), input a bank account type and number (task-3), and choose a valid
option (task-4). The voice assistant read aloud each key when the user typed the forms in
the first three tasks. After a short delay, the assistant would read all of the input text.
For example, a user would input "1000" into a text field and the assistant read "one, zero,
zero, zero, (pause), one thousand". For task-4, the voice read the current status. For
example if there was an unchecked checkbox by the words "mail notification", then the
voice read a phrase such as "mail notification is off". Users had a practice session before
the actual experimental session.
The users first did the tasks without the voice, followed by the tasks with the voice for
training. Then users were asked to input 8 things in each task. In total, 8 × 4 tasks × 2
modes = 64 actions were to be performed. The order of the tasks was randomized. After
finishing all of the tasks, we used a survey with seven-point Likert items from
-3/definitely-disagree to +3/definitely-agree to compare the test conditions. Table 4.5
shows a translation of the items from the questionnaire related to accurate, fast,
comfortable, and distracting.

Chapter 4 Voice Augmented Web Browsing 78
4.5 Results of User Experiments with Older Adults
4.5.1 Results of Study 1
Here are some characteristic observations from the sessions. Most of these points are
addressable by voice augmentation. Some items confirm findings from earlier studies.
4.5.1.1 Could not grasp content structure and meaning
Participants struggling with a task tend to read and reread content that was not
relevant to the task, and scanned the content sequentially seeking the correct path for
the task. A participant might scroll up and down rapidly looking for a target. Such
behaviors were described in earlier studies. Participants sometimes lost their partial
work on a task because of confusion about their status.
They often failed to select required radio-button options in the shopping application.
The form used in this application was hard to understand because a needed set of radio
buttons could not be seen within the initial window because the descriptions of the
options were too long. In addition, most of the participants with problems overlooked the
error messages that appeared at the top of the page when the incomplete form was
submitted. In addition, some participants were confused by the expired-page warning
that appeared if the browser "back" button was used within the form.
4.5.1.2 Did not understand widgets
Participants in their 70s tended to click on non-clickable elements, being misled by
bright colors or disabled radio buttons. They also tried clicking on unneeded buttons or
links even when they had figures showing how to use the application. They could not
understand the meaning of some widgets by looking at them.
Table 4.5. Translations of the items from the questionnaire
Label Question
Accurate Compared to the normal mode, I found voice
augmentation to be accurate for input
Fast Compared to the normal mode, I could input
faster with voice augmentation
Comfortable Compared to the normal mode, I felt sure that I
would finish with voice augmentation
Distracting
Compared to the normal mode, I could not
concentrate on the tasks with voice
augmentation

Chapter 4 Voice Augmented Web Browsing 79
One user sometimes clicked (left and right) on some breadcrumb navigation links with
a distinctive background to try to input the information. This was because the
default-size window was too small and users had to scroll down to complete the
transaction.
4.5.1.3 Did not know the function of the application or understand the
general GUI metaphors
About half of participants were not aware of standard functions that are generally
used in Web applications, such as a function to search for an address from a postal code.
Some participants needed a long time to understand the functions needed for the
application, such as how to use the table of randomized numbers. One user quickly found
the login button and succeeded in logging in, but after that he returned to the initial page
because he accidentally clicked outside of the new window. He said "The window
disappeared" in the interview. After that he assumed that he had logged into the
application and he searched for "transfer", but got lost in a FAQ page that describes how
to transfer funds.
4.5.1.4 Anxiety Interference
One user, whenever he tried to click a link or button for the next action seemed to
nervously confirm the action to himself. Also he said "What?" and struggled with a page
for a while when the behavior of the application was different from his expectations.
The top page of the banking application provides a menu with over 20 items, various
types of statuses and notifications for the account, and also advertisements for some
financial products. A participant said about this page "I feel that [this] important thing
(banking) was done like an advertising flyer."
4.5.2 Results of Study 2
Figure 4.11 compares the average task completion times for each participant group
(30s, 60s, and 70s) for each task. The overall average values without the voice
augmentation were 6.67 (SD = 3.82), 10.17 (SD = 4.86), and 13.57 (SD = 6.20) seconds for
30s, 60s, and 70s, respectively. The values with voice were 6.72 (SD = 3.72), 10.47 (SD =
5.04), and 15.77 (SD = 9.47) seconds. Obviously the task completion times are increasing
with age. In addition, they tend to slightly increase with the voice augmentation for
people in their 70s.

Chapter 4 Voice Augmented Web Browsing 80
Three-way mixed ANOVA showed significant main effects on the task completion times
of the age (F2,12 = 43.05, p < .001), the task (F3,924 = 309.48, p < .001), and the mode (F1,924
= 10.52, p < .005). It also showed significant interaction effects of the age and the task
(F6,924 = 9.66, p < .001) and the age and the mode (F2,924 = 6.78, p < .005). Only the
participants in their 70s were significantly slowed down by the voice augmentation (F1,924
= 23.65, p < .001). A post-hoc analysis found that the participants in their 30s were
significantly faster than those in their 60s (p < .005) and 70s (p < .001) while the 60s
were significantly faster than the 70s (p < .005). We also found that task-3 took
significantly longer than the other three tasks (p < .001) while task-4 took significantly
less time than the other three tasks (p < .001).
Figure 4.12 compares the error rates of each group on each task and the overall error
rates. The overall values without the voice augmentation were 2.5%, 4.4%, and 4.4% for
30s, 60s, and 70s, respectively. The values with voice were 2.5%, 0.6%, and 3.8%.
Three-way mixed ANOVA showed a significant main effect of the task on the error rate
(F3,924 = 4.43, p < .005). The age and the mode had no significant main effects. A post-hoc
analysis found that task-4 caused significantly more errors than task-1 or task-2 (p
< .05).
Figure 4.13 shows a comparison of the average scores for the subjective questionnaires.
For the question on "accurate", the values were 1.2 (SD = 0.98), 1.6 (SD = 0.49), and 2.4
(SD = 0.8) for 30s, 60s, and 70s, respectively. For "fast", the values were 0.2 (SD = 0.75),
1.2 (SD = 0.75), and 2 (SD = 1.10). For "comfortable", the values were 1 (SD = 0.90), 1.4
(SD = 0.8), and 2.6 (SD = 0.49). For "distracting", the values were -2 (SD = 1.10), -0.6 (SD
= 1.36), and -2.2 (SD = 0.4). The respondents in their 70s gave relatively more positive
scores for each question. Based on the recorded times, the participants in their 70s took
longer with voice than with the normal mode, but they said they could input faster and
0
5
10
15
20
25
Task 1 Task 2 Task 3 Task 4 Over All
Tas
k C
om
ple
tio
n T
ime
(sec
on
ds)
Normal 30s
Voice 30s
Normal 60s
Voice 60s
Normal 70s
Voice 70s
Figure 4.11. Comparison of task completion times

Chapter 4 Voice Augmented Web Browsing 81
did not need more time with voice than with the normal mode.
4.5.2.1 Keyboard Analysis
Most participants reported the voice did not distract their attention from the input,
though two participants in their 60s reported they were distracted during the task. They
disliked the timing of the voice presentation. As described in Section 4.4.2, the
confirmation voice is provided 1.5 seconds after the last key is pressed. Since this
interval, 1.5 seconds was determined by heuristics based on our experience, some users
took more time to type keys. And many of participants in their 30s ignore the
confirmation because the confirmation was presented after they had already gone ahead.
Figure 4.14 shows the cumulative ratios of the key typing interval for each participant.
It indicates the percentage of key typing that is done in a certain interval since the last
key was typed. For example, two of the 30s participants took less than 0.5 seconds to type
90% of their keys and a 60s participant took more than 2 seconds to type 90% of his keys.
The average time to type more than 90% of their keystroke for 30s, 60s, and 70s were 0.7
0.0%
2.5%
5.0%
7.5%
10.0%
12.5%
Task 1 Task 2 Task 3 Task 4 Over All
Err
or
Rat
e
Normal 30s
Voice 30sNormal 60s
Voice 60sNormal 70s
Voice 70s
Figure 4.12. Comparison of error rates of tasks
-3
-2
-1
0
1
2
3
Accurate Fast Comfortable Distracting
Su
bje
ctiv
e S
core
30s
60s
70s
Figure 4.13. Subjective scores for the questions

Chapter 4 Voice Augmented Web Browsing 82
seconds, 1.4 seconds, and 1.4 seconds. Although, from this average point of view, the
heuristic interval (1.5 seconds) seems to be appropriate for the interval of notification, it
also indicates that the voice presentation should be optimized to consider the user's
typing speed or some other criteria.
4.6 Discussion
4.6.1 Navigation Improvements with Sasayaki
Even though most of the participants gave positive ratings for the test conditions with
Sasayaki whispers compared to those without Sasayaki, the quantitative results showed
no significant difference between the conditions with and without Sasayaki whispers
regarding the task completion time or number of keystrokes. The navigation traces also
suggest improvements of the navigation behaviors. One possible interpretation of the
results is that the assisting voice (Sasayaki) gave participants "a feeling of confidence",
but the processes of mental model building was not enhanced enough to improve the
performance in the tasks.
The participants' comments support this interpretation. Typical positive comments
include "I feel confident with Sasayaki compared to without Sasayaki" (P7), "A Sasayaki
whisper, e.g. „close to main' is so nice, making me feel comfortable" (P6) and "It is useful
for exploring the structure of unfamiliar webpages" (P8). Those comments suggested that
50%
55%
60%
65%
70%
75%
80%
85%
90%
95%
100%
0 0.5 1 1.5 2 2.5 3
Key typing interval (seconds)
Cu
mla
tiv
e ra
tio
of
typ
ed k
eys
(%)
30s-1
30s-2
30s-3
30s-4
30s-5
60s-1
60s-2
60s-3
60s-4
60s-5
70s-1
70s-2
70s-3
70s-4
70s-5
Figure 4.14. Cumulative ratio of key type interval for each participant

Chapter 4 Voice Augmented Web Browsing 83
the Sasayaki system reduced the stresses of unaided navigation and the strain of
sustained listening.
We also see evidence in the traces of navigation behaviors. As shown in Figure 4.7, the
browsing pattern of passing the target and coming back to increase their confidence were
frequently recognized in the conditions without Sasayaki whispering. Blind users
concentrated on the synthesized voices to track their positions in the page. This indicates
that unaided navigation is a very hard task that lowers the user's confidence. A Sasayaki
system can help to increase their confidence with relatively little concentration on the
second voice. The fact that the number of incorrect answers by the participants was
reduced by Sasayaki whispering is evidence that supports this finding.
Based on the extracted approaches from the less successful patterns, we also got hints
on how to improve the design of Sasayaki voices to enhance the mental model building
processes. The cases shown in Figure 4.9 and Figure 4.10 could be addressed by
presenting a structure map for the users to study before they start to navigate on the
page. In fact, some participants requested such a function in the interview session and
one participant suggested that providing a tree view would be useful for him to form a
basic idea of the webpage structure before exploring.
4.6.2 Are Two Simultaneous Voices Distinguishable?
Although we didn't explicitly experiment with the effects of the two simultaneous
voices, we recognized repeated listening as a noticeable behavior of the participants in
the Amazon search result pages. Figure 4.15 shows the average numbers of repetitions
within each Sasayaki condition. For the webpages where they were asked to report the
index of the item with the highest price among the top ten items, the Sasayaki whisper
was available for the first element of each result item and the first element was the index
number. In the S-NJ condition, seven participants did listen to the rank repeatedly. In
contrast, we observed a smaller number of repeated listening in the S-J condition, as
shown in Figure 4.15. In the test conditions with Sasayaki jump features (NS-J and S-J),
the participants seem to be able to recognize the two voices simultaneously and properly
interpret the Sasayaki whispering. This result would be caused by some learning effects,
since in the experiment all of the participants first tested the conditions without the
Sasayaki jump features.

Chapter 4 Voice Augmented Web Browsing 84
The participants did not complain about the audibility of the secondary voice and felt
confident about it. Two participants commented about the two parallel voices, "the two
physically separated voices were sufficiently distinguishable" (P2, P8), and "it could be
improved by adjusting the volumes and combinations of the types of voices" (P6). This
result might be due to the fact that blind people have good listening skills to compensate
for their loss of visual perception. However even sighted people can recognize multiple
voices near them. Further studies on improving the listenability of the secondary voice
might be necessary, for example by adjusting the voice output timing and choosing more
distinguishable combinations of the two voices. The information density of the auditory
user interface could be increased by the Sasayaki approach. This would be a paradigm
shift for the audible interface.
4.6.3 Tradeoff of Confidence for Speed
The participants, especially those over 70, reported that the voice augmentation sped
up their operations. However, the actual task-completion times increased in spite of their
own reports. These results were surprisingly contradictory. We believe this shows that
participants had increased confidence in their operations due to the support of the voice
augmentation. However the actual time increased, because participants listened to the
voice while pausing in the operations that could be observed in the logged events. The
time seemed shorter because of their higher confidence. It is known that stressful
situations lengthen subjective time [Droit-Volet et al. 2009]. Some of the participants'
comments support this interpretation, such as "The voice makes us feel relaxed", "It is
useful on the first attempt", "I'm sure the input is correct with the voice", and "I could
confirm the input without watching the screen". The participants also reported that they
could do the tasks more accurately, but there was no significant difference in the actual
0
1
2
3
4
5
6
NS-NJ S-NJ NS-J S-J
Sasayaki conditions
Nu
mb
er o
f re
pea
ted
lis
ten
ing
0
1
2
3
4
5
6
NS-NJ S-NJ NS-J S-J
Sasayaki conditions
Nu
mb
er o
f re
pea
ted
lis
ten
ing
Figure 4.15. The average number of repetitions on Amazon search result pages
-3 -2 -1 0 1 2 3
Accurate Fast Comfortable Distracting
Subjective Score 30s 60s 70s

Chapter 4 Voice Augmented Web Browsing 85
error rates. Given the relatively small number of errors in the experiments, more
experiments and observations are required to determine how voice augmentation affects
accuracy.
It is known that there are generally small correlations between empirical
measurements (speed and accuracy) and subjective evaluations [Hornbæk et al. 2007].
Since many elderly people tend to resist using technologies due to their fears [Kolodinsky
et al. 2002], we believe that subjective factors should be regarded as more important
than objective performance in the design and development of senior-friendly
applications.
The participants in their 30s and 60s also reported they could input accurately and felt
comfortable. Although their subjective scores are relatively lower than those of the
participants in their 70s, they were also confident about using voice augmentation
compared to the normal condition. They tended to click on the complete button before the
confirmation message was finished (which stopped the voice), and therefore there was no
significant difference in their task completion times. The final message began 1.5
seconds after the final key was pressed for the normal speech rate. Using a faster speech
or and shorter pauses for the confirmation messages linked to the user's input speed
might change the results.
4.6.4 Another Way to Gain Confidence
The participants in their 70s tended to first focus on the most appealing content or on
the content located at the center of the screen without grasping the structure of the page.
Especially with the small window, the buttons the participants must click are located
elsewhere and scrolling is needed. This often worried the older participants. They tended
to try to read all of the visible content (which was mostly a warning statement about the
timing of the transfer). One participant tried to click on an unclickable element without
scrolling down.
The next element that should be focused on by the user can be identified for most of the
webpages used here. The voice augmentation can say where the next focal element is
located. Also visual feedback with highlighting using dynamic HTML technologies would
help the users more effectively than voice augmentation alone and would give them more
confidence. Participants also commented about such support, with comments such as
"The element mentioned by the voice should be highlighted" while the content that
should be focused on by the user in that status could be changed according to the user's
intention. For example, though the user wants to transfer money, it may be hard for the

Chapter 4 Voice Augmented Web Browsing 86
system to anticipate the user's intention. An instruction for the page structure can help
in such a situation, with a message such as "A transaction menu is located at the top left
of this page."
4.6.5 Will They Want to Stop the Assistant?
Many people have bad memories of Microsoft's "Clippit" or "Clippy" (a dolphin in
Japanese versions), an intrusive assistant avatar for a user interface agent in GUI
applications, and a frequently asked question was "How can I disable Clippy?" That
strongly indicated that users want to control the assistance shown to them based on the
context and their own skills.
Out of four types of voice augmentation, repetition and notification seem acceptable in
many situations for older adults, giving them confidence in completing forms.
Contextualization and summarization mainly support users in constructing mental
models of the applications. Therefore they may stop supporting and start interfering with
the users as they try to complete the webforms. More investigation is needed to answer
such questions as how older adults learn about applications, how long they remember
what they have learned, and how can we assess the mental models of the users from
their behaviors. Studying the navigation history in a Web application and the interaction
events may help in understanding the users.
Appropriate analysis of a user's behavior and skills may be useful in deciding on the
proper presentation for that user. For example a financial Web application may offer a
new financial product to a user, based on frequent visits to the application, and lead the
user to contact a sales representative.
4.6.6 Potential Applications
As we noted, Sasayaki is a general concept for a user interface that provides
supplemental information for various kinds of people via an audio channel. This concept
could be applied to many real world environments. One example might be navigation for
blind pedestrians. This kind of system could be enhanced with a secondary voice to
augment the primary voice that provides walking directions, for example to provide
user-generated information about nearby restaurants. The creation of supplemental
audio information to provide situational support has been already introduced in some
emerging technologies (e.g., [Wilson et al. 2007]). Telephony applications could also be
enhanced to increase information density. For example, when a user is trying to access a
telephony application for the first time, the user could hear the main voice, and, at the

Chapter 4 Voice Augmented Web Browsing 87
same time, if the system detects the user status to be "needs help" by analyzing the user's
behavior and contextual information, then a second voice could provide situational
instructions or tips on how to navigate or interact with the application more easily.
Sloan et al. [2010] reported on the potential of adaptive assistive technology for people
whose abilities are gradually declining. In their study, they proposed a new application
architecture that provides on-demand assistive technologies for each level of impairment
(e.g. vision, hearing, motor, and so on). Instead of providing OS-dependent assistive
technologies for certain impairments, users could be supported by multiple forms of
assistance running within applications.
The most important component of our system is the voice output component. A
prerecorded voice is one solution to provide good voice quality and it is preferred by older
adults over a synthesized voice. However, synthesized voices are needed for a voice
augmentation system because the Web content is dynamic and fluid and users can input
text freely. Synthesized voices are usually provided by library applications installed in a
client system, while some applications provide synthetic voices through the Internet.
Client-side voices have advantages in reduced response latency. Server-side voices have
disadvantages in latency but the users don't need to install any voice libraries.
WebAnywhere [Bigham et al. 2008] is an audible Web browser that provides a server-side
synthesized voice through the Internet. This system tries to predict the user's next action
to reduce the latency of the speech response by analyzing the keyboard events with a
hidden Markov model. Although synthesized voices are disliked by older adults [Zajicek
et al. 2003], most of the participants could understand the synthesized voice messages.
Several of them complained about the quality of the voice and could not understand the
meaning of the sentence until they heard it a second time. They said "Hmm?" or "What?"
to ask for a repetition of the sentence, which could provide feedback to a speech
recognition component. [Zajicek et al. 2003] also mentioned that a deeper male voice is
generally easier for older adults, while some participants suggested a female voice would
be better.
4.7 Related Work
Our work was initially inspired by observing the urgent needs of screen reader users to
overcome problems as they were surfing the Web. Barnicle [2000] evaluated screen
reader users' experiences with thirteen visually impaired people and identified 58 unique
obstacles that are not problematic to the same degree for sighted people. Lazar et al.
[2007] collected users' reports of the causes of frustration when using screen readers,

Chapter 4 Voice Augmented Web Browsing 88
with confusing page layout being ranked as the leading problem. They also found that a
user generally spends more time recovering from an incident than the time it took to
create the problem.
User Interface Agent
Sasayaki was also guided by the concepts of user interface agents, which unobtrusively
provide users with needed help. Maes [1994] talked about the concepts of interface
agents to help users save work and avoid information overload. Among the various types
of user agents, we focused on two categories.
Bederson [1995] created an automated tour guide prototype that uses audio to guide
tourists. Sawhney and Schmandt [2000] worked on „Nomadic Radio', a wearable system
which allows users to access information by using voices and textual information in a
nomadic environment. This agent system could decide how to most effectively present
information to the user based on the context, interruption settings, and automatic text
understanding. Eckel [2001] created the Listen project, which augments everyday
environments with interactive soundscapes. Depending on the location and other context
data, the system can suggest the most effective options for users. Other voice-based
agent systems seek to provide users an impression of reality. Kalantari et al. [2004] and
Miyashita et al. [2007] wrote about their voice-based augmented reality systems for
visitors at museums. Voice-based agents were also used for navigation. Shoval et al.
[1998] introduced NAVBELT and GUIDECANE, which are voice and touch-based tools
that can use a stereo earphone with a tactile stimulator to help blind people navigate in
real environments. Jones et al. [2008] described the ONTRACK system which uses
adaptive music playback to support navigation in a 3D virtual space. Ward et al. [2003]
report a design of a hands-free documentation which is designed for people who are
working with using their hands in environments without PCs. For example when an
engineer is repairing a jet engine, he can access the documents for the engine by using
his voice. Then the system searches in the document for that input in the context of the
current operations and outputs results through a head-mounted display or an audio
channel.
Web surfing is one of the important tasks for screen reader users when they interact
with computers. Stylos et al. [2004] introduced an intelligent clipboard monitoring agent
that helps to identify formatted data (such as addresses or appointments) for smart
pasting into webforms. Wagner and Lieberman [2004] introduced Woodstein, which
predicts and assists the next user action based on analysis of a collected sequence of

Chapter 4 Voice Augmented Web Browsing 89
previous actions on the webpages. Roth et al. [1999] created an agent to provide audio
feedback for the user's cursor location. Yu et al. [2005] created context-aware Web agents
to provide audio and haptic feedback for the user's cursor location in the screen reader.
Dontcheva et al. [2006] created a Web agent that can help record and organize user
sessions for comparison and analysis. The authors reduced the users' memory load and
simplified tasks. Hartmann et al. [2009] described Augur, a context-based smart agent
that can do three things for users: highlight, suggest, and automate by analyzing context
data and using pre-defined rules. Parente [2006] introduced Clique, an audible interface
with four assistants and distinct voices. Each assistant has a role involving tasks or
events on a desktop including email, calendar, and browser applications. Although
sometimes the assistants speak simultaneously, it is a different type of synchronicity
from Sasayaki.
Context has also received attention for more intelligently improving accessibility. Most
user agents systems [Sawhney et al. 2000; Shoval et al. 1998] make good use of context
for decisions. Mahmud et al. [2007] introduced their CSurf system that finds the most
relevant information based on user behaviors and other contextual clues using a
statistical machine-learning model. Borodin et al. [2008] reported on the
problem-causing lack of awareness of visual changes in dynamic webpages. This led to an
algorithm to detect changes in dynamic webpages, allowing the system to collect useful
context information. As in Web browsing scenarios, they found that user behavior, cursor
location, and webpage layout were the most important contextual clues for analysis
[Hartmann et al. 2009; Mahmud et al. 2007; Wagner et al. 2004; Yu et al. 2005].
Studies for Elderly Users
Although there is no prior study that supports older adults in navigating Web
applications by themselves while using audible user interfaces, there are many assistive
approaches for older adults. BrookesTalk is an audible Web browser designed for people
with visual impairments. A BrookesTalk extension called Voice Help provides guided
support for older people with visual impairments [Gregor et al. 2002]. It provides the
status of the applications and lists of possible next actions in a way similar to the
interface of IVR. Zajicek et al. [2003] used BrookesTalk to study the effects of
multimodality with older adults. They reported that messages with long instructions
interfered with the correct operations and the users preferred text instructions rather
than mixed text and speech. They also mentioned that older adults found synthesized
voices hard to understand.

Chapter 4 Voice Augmented Web Browsing 90
Hailpern [2006] proposed a wizard interface that tracks the current status of elderly
users. The system provides a simple interface within a single window and uses a history
list to recognize the status of users. Milne et al. [2005] proposed a minimal application
interface for senior users. Their prototype browser has only five buttons and highly
intuitive labels. For example they used "look up" and "look down" for "page up" and "page
down". Muta et al. [2005] developed a Web browser extension for older adults. It provides
functions to read the selected content out loud, to magnify it, or to manage the colors to
improve the contrast of the text and background.
Some online shopping applications use online support systems with chat, telephone
support, or special applications for remote control by an operator [Citrix Online; Dell].
Basically these forms of help are provided by humans, but some systems include
intelligent agents combined with frequently asked questions. These applications target
novice users (including older adults) who are customers or potential customers.
There have been many field studies with older adults. [Fairweather 2008; Meyer et al.
1997] cover the differences between younger and older adults in their Web navigation
behaviors. Meyer et al. [1997] conducted a study with thirteen older and seven younger
adults. They reported that the older group needed more steps to find information, but
both groups decreased their steps after a hands-on tutorial session. One of the
interesting behaviors of older adults reported in this study is returning back to a "home"
location if they became disoriented during navigation. Fairweather [2008] reports that
older adults tended to use the least risky method in navigating. Chadwick-Dias et al.
[2004] studied how Web experience influenced the behavior of users on the Web. They
report Web experience is the same as Web expertise, but older adults take more time to
develop their Web expertise. They concluded that older adults need more opportunities
for collaborative learning with other people to learn Web navigation techniques.
Sayago et al. [2009], Akatsu et al. [2004], and Leitner et al. [2009] presented
observations of older adults using existing systems. Sayago et al. [2009] conducted a
3-year study of everyday interactions with the Web and reported that problems with
remembering steps, with understanding Web and computer jargon, and with using the
mouse are more significant than problems with perceiving visual information, with
understanding icons, or with using the keyboard. Akatsu et al. [2004] studied the
unexpected behaviors of older Japanese adults using Automated Teller Machines (ATMs).
Some users overreacted to certain voice messages or repeated the same error when they
couldn't understand the situation. Leitner et al. [2009] found that older adults do not
show major differences from younger people in their needs and preferences related to an

Chapter 4 Voice Augmented Web Browsing 91
online ticket service.
Hanson et al. [2007] evaluated a voice browsing application that provides functions to
interact with the browser using speech. Inexperienced users tended to use long
commands instead of the brief voice commands that the system could easily recognize.
Many studies about ageing Web users have been conducted and many guidelines for
Web content have been published to improve accessibility. The Web Accessibility
Initiative (WAI) of the World Wide Web Consortium (W3C) discussed accessibility for
older adults in their three-year WAI-AGE project that contributed to the Web Content
Accessibility Guidelines (WCAG) 2.0 in 2010. Web accessibility for people with
disabilities has gradually improved due to guidelines and new accessibility technologies.
In addition, work continues on new assistive technologies for older adults. ISO IEC
Guideline 71 [ISO/IEC 2001] also requires considering the needs of the elderly and of
persons with disabilities. This guideline affects local standards that implement
accessible designs such as JIS X8341, which is also based on the WCAG.
The SPRY Foundation published a Web guideline for older adults in 1999 [SPRY
Foundation 1999]. This guideline mainly focuses on vision, cognition, hearing, and motor
skills. The criteria of this guideline are very similar to WCAG. Newell and Dickinson
[2006] used a case study approach to the development of a simple Web application for
elderly users. Chandwick-Dias et al. [2007] studied how older users surf and their
problems with the accessibility of Web 2.0 content. They found that each functional
impairment of elderly people was relatively smaller than the corresponding impairment
of people who need special support. Most of the special needs guidelines are easily
applicable for elderly people. In addition, we need to address problems related to memory
and learning to support older adults, limitations that have rarely been considered in
accessibility technologies to date.
4.8 Summary
This chapter describes a concept of voice augmented Web browsing which help users
with supplemental voice that provides contextually relevant information automatically
or in response to user requests.
A prototype system was implemented as a plug-in system for a voice-based Web
browser with a small API for the Sasayaki controls. An empirical evaluation with nine
visually impaired users showed that the Sasayaki system significantly improved their
navigation behaviors and increased their confidence levels. The jump function based on
Sasayaki significantly increased the navigation performance. The results also show the

Chapter 4 Voice Augmented Web Browsing 92
possibilities of the Sasayaki approach, with two simultaneous voices increasing the
information density of the auditory user interface.
Another system supports elderly people in online banking transactions and online
shopping. Subjective evaluations showed that the system made them feel confident
(especially for people in their 70s) when they needed to accurately fill out electronic
forms for online banking. This means the voice augmentation succeeded in reducing the
mental barriers for using webforms, giving the users confidence in their accuracy. The
results of the experiment showed that the voice augmentation system can to encourage
elderly Web users in using Web services even if their abilities are declining.

93
Chapter 5
Conclusion
This thesis described studies of collaborative Web accessibility improvements based on
external metadata authoring with collaboration among users and volunteers. It also
describes a new assistive technology, voice augmented Web browsing which supports
people through a secondary voice channel using the power of volunteers. These
contributions are part of work that will lead to a new era of Web accessibility.
5.1 Summary of Contributions
Our main contribution in this work is demonstrating a new methodology, collaborative
Web accessibility improvement that renovates websites for higher accessibility with
external metadata created using the system of Social Accessibility. The Social
Accessibility system is an open accessibility metadata repository that implements an
open accessibility metadata specification called Accessibility Commons that was
developed by accessibility research institutes around the world. The system that
improves Web content using external metadata has been released as an open source
project. Enhanced systems based on Social Accessibility will improve larger websites
based on collaborations among the site owners and a limited NPO community.
A long-term experiment with the Social Accessibility system involving about 500 users
and volunteers was conducted and produced many findings and lessons. They were able
to improve Web accessibility through our collaborative system and tools. Volunteers can
support users with visual impaired in a timely manner by creating external metadata
using accessibility visualization tools and there were no problems with malicious
metadata or other possible causes of confusion. The most important lesson in the
experiment was that the users were often unable to describe the problems they
encountered on webpages, perhaps because they lacked ways to recognize the existence
of the problems. Although there are various reasons for these problems, it is quite
difficult for users who lack confidence about computers to report the accessibility
problems encountered in actual webpages.

Chapter 5 Conclusion 94
From these experiments, we found that accessibility visualization helped the
volunteers more quickly understand and fix the accessibility problems on webpages. We
also proposed and implemented a new visualization technique for the reading order of
Web content. Experiments showed that this helped volunteers in understanding and
fixing the reading-order problems in webpages. Understanding how the users see the
content can motivate the volunteers to fix the content and can improve their efficiency in
that work.
We also explored the possibilities of new user interfaces using external metadata.
Volunteers can make intelligent and advanced metadata by using their cognitive abilities
and rich knowledge. The webpages that are annotated (using external metadata created
by volunteers) with various types of semantic information can extend the possibilities of
the user interfaces and lead to new assistive technologies. The voice-augmented Web
browsing is just one example of the potential. The supplemental voice improves the
users' performance and encourages them to use Web with more comfort. Although this is
an exploratory experiment of new type of assistive technology, it may be a major step for
Web accessibility.
5.2 Future Work
This study makes advances in changing paradigms and concepts of Web accessibility. It
could be used for many other areas of Web accessibility, not just for people with visual
impairments and older adults. The collaboration can also involve site owners, developers,
designers and various related parties as well as the users and volunteers, and can make
the Web accessibility improvement activities more effective and powerful. For example,
the developers can correct the problems in a Web application before deploying it by
hearing from the actual users with details of their actual problems, such as which kinds
of problems, where the problems are, and how the problems are triggered. By sharing
such reports from the users with the designers and site owners, they may improve their
Web application and its accessibility.
The external accessibility metadata approach expands the potential of new assistive
technologies. For example, an advanced assistive audible interface with more than two
stimuli could fully utilize a user's cognitive abilities, and the semantic external metadata
could be used for building question and answering systems based on knowledge found
within the Web. Many previous studies have proven that human-generated metadata is
very useful. It will be important that the power of computers be used to automatically
build useful metadata. Many studies also have been conducted to automatically analyze

Chapter 5 Conclusion 95
Web content. The collaboration among humans and computers, such as gemifying
[Deterding et al. 2011], may be one of the solutions in the future.
Active participation of the users and volunteers as central players are the key to using
collaborative Web accessibility improvement to keep sustainable lifecycle. We hope this
work will lead to a better future for Web accessibility and make it easy for people to
request accessibility improvements so they can access the Web more easily. People should
be able to improve Web accessibility as a daily activity similar to the way they clean up
the sidewalks in front of their homes.

96
Appendix A
Details of Metadata Application
This Appendix describes the specifications of the metadata implemented for Social
Accessibility and the Web Accessibility Improvement System (WAIS) and includes
sample code for a metadata application with the back stage model used in the WAIS.
A.1 List of Metadata
All of the implemented metadata types are listed below with their specifications and
their targeted criteria in the Web Accessibility Content Guidelines 2.0 [WCAG2.0]. There
are four major criteria in the WCAG 2.0 guidelines, perceivable, operable,
understandable, and robustness. This metadata doesn't yet cover robustness because of
our priority in implementation but covers various subitems for the other criteria. Each
entry for metadata consists of its type, description, URI pattern for identifying webpages
or resources (images, etc.), and addresses for selecting one or more elements in the
identified webpages for the metadata operations.
A.1.1 Perceivable
Edit Alternative Text
Target guidelines: 1.1.1, 1.3.3, 1.4.5, 1.4.9
Type: alttext
Description: description of image or name of frame
Addresses: null or target elements
If the URI pattern specifies an image directory, then the addresses will be null,
otherwise the addresses specify elements in the webpage. If the element specified by
the address is an image element, then the description is used for the value of the alt
attribute of the image. If the URI pattern matches the href attribute of a frame element
or the element specified by the address is a frame element then the description is used
for the value of the title attribute of the frame.

Appendix A Details of Metadata Application 97
Edit Alternative Text for Flash®
Target guidelines: 1.1.1, 1.3.3, 1.4.5, 1.4.9
Type: alttext
Description: description of objects in Flash® content
Addresses: special XPath for Flash® object
This is almost the same as the previous alttext entry, but the address format is
specialized for Flash® content. An example of an XPath description is "/pushbutton[@
height='20'][@width='24'][1][@top='20'][@left='202']" to specify the first push button
object displayed at 20x202 with 24 pixel width and 20 pixel height.
Change Reading Order
Target guidelines: 1.3.2
Type: flowto
Description: null
Addresses: pairs of from element and to element
There are two types of applications for changing the reading order of a document.
The first one is for adding aria-flowto attributes, which are defined in a new
specification called Accessible Rich Internet Applications [WAI-ARIA], to the document
(attribute mode) and the other is changing the document structure directory (structure
mode). The addresses contain pairs of XPath expressions corresponding to pairs of
elements. For the attribute-mode application, the system adds the aria-flowto attribute
to the first element with the id attribute of the second element as the value. If the
second element doesn't have id attribute, then a unique id is generated for it. This
mode doesn't affect the appearance of the document and the WAI-ARIA specification
has not yet been published as a W3C recommendation and no screen reading software
supports it yet. For the structure-mode application, each document tree is divided into
three subtrees with pairs of elements: (1) a subtree from the top of the content to the
first element, (2) a subtree from the element next to the first element to the element
before the second element, and (3) a subtree from the second element to the end of the
content. Then the system removes the subtree (2) from the document and moves it to
after the subtree (3). The order of the subtrees in this case becomes (1), (3), and (2). If
the first XPath expression is null, this means it is referring to the top of the content
and if the second XPath expression is null, then it refers to the end of the content. The
system continues this operation for each pair. Since this operation disrupts the original
document structure and affects the XPath evaluations, this operation should be
Appendix A Details of Metadata Application 98
executed as the last step of metadata application and all XPath expressions for this
operation should be evaluated in advance. Since the appearance of the document is also
affected, the system embeds a special invisible link at the top of the page, which a blind
user can use to choose whether or not the metadata for the reading order is applied to
the document.
A.1.2 Operable
Change Heading Level, Insert Heading
Target guidelines: 2.4.6, 2.4.10
Type: h1, h2, h3, h4, h5, h6
Description: null or heading text
Addresses: target elements
If this description is specified then a new invisible heading element is inserted before
the specified element with the description as the heading text. If the target element is a
heading element then the element is replaced with a new heading element according to
the level specified by the type (H1-H6). If the target element is not a heading element
then the element will be wrapped with the new heading element. In this case the target
element should have readable content or the system will ignore the new heading. Since
this operation can affect the appearance of the webpage, the system adjusts the styles
of the original element and the new element to minimize any changes in the
appearance of the webpage.
Remove Heading
Target guidelines: 2.4.6, 2.4.10
Type: h-
Description: null
Addresses: target elements
If the target element is a heading element then the system replaces the element with
a div element. The system also adjusts the style of the inserted div element to minimize
any changes in the appearance of the webpage.
Repair Broken Inner Page Link, Add Skip Link
Target guidelines: 2.4.1
Type: anchor
Description: null or display text for the source link
Addresses: source element and target element

Appendix A Details of Metadata Application 99
If the target element is null then the intent is to remove the link to the source
element and replace the source element with a span element. Otherwise, if the
description is specified then a new link element is inserted before the source element as
a new source element and the display text is set to the description. The href attribute of
the source element is changed to the name or id attribute of the target element. A
unique id is generated if the target element doesn't have both name and id attributes.
Remove Deprecated Tag
Target guidelines: 2.2.2
Type: remdep
Description: null
Addresses: target elements
The target element is replaced with a new span element with style adjustment. This
can remove deprecated tags and unofficial tags such as blink tags, marquee tags, and
so on.
Update Page Title
Target guidelines: 2.4.2
Type: ptitle
Description: new title of the page
Addresses: null
This changes the title of the webpage specified by the URL pattern to the text of the
description.
A.1.3 Understandable
Remove Space between Characters
Target guidelines: 3.1.1
Type: delspace
Description: text pattern or null
Addresses: target elements
This removes spaces between characters. This problem can often be seen in Japanese
webpages. For example "Hello" is typed as "H e l l o" in the text in order to adjust the
layout. But this makes it hard for users to understand the content when using an
audible interface. All spaces in the specified element are removed if the description is
null. Otherwise, only the spaces in the part of the text matching the input text pattern
specified in the description field are removed.

Appendix A Details of Metadata Application 100
Edit Form Label
Target guidelines: 3.3.2
Type: alttext
Description: label text for form input
Addresses: target elements
The text of the label element of the target element is replaced with the description. If
there is no label element for the target element then a new hidden label element is
inserted before the target element.
A.2 Sample Bootstrap Code for the Back Stage Model
Figure A.1 shows sample code which is loaded by one line of inserted code (see Figure
2.12). This will then load the main script from the server when the content load has been
completed. Lines 17-23 are a technique for checking that the load has actually been
completed on Internet Explorer. This protects the browser from crashing due to the
insertion of a new script element. Then bsloader.js (Line 08-12) will load another script
file for the metadata application used in the back stage model.
01 (function() {
02 if ( window._SA_LOADER_STARTED_) {
03 return;
04 }
05 window._SA_LOADER_STARTED _ = true;
06 function load() {
07 var base = location.protocol + "//<SERVER_NAME>/";
08 var s = document.createElement("script");
09 s.charset = "UTF-8";
10 s.type = "text/javascript";
11 s.src = base + "js/bsloader.js";
12 document.getElementsByTagName("head")[0].appendChild(s);
13 }
14 (function() {
15 if (window.addEventListener) {
16 window.addEventListener("load", load, false);
17 } else if (/msie/.test(navigator.userAgent.toLowerCase())) {
18 try {
19 document.documentElement.doScroll("left");
20 } catch (e) {
21 return setTimeout(arguments.callee, 0);
22 }
23 load();
24 } else {
25 window.onload = load;
26 }
27 })();
28 })();
Figure A.1. Sample bootstrap code for the back stage metadata application

101
Appendix B
Details of the Reading Flow
This section describes details about the implementation of the reading flow
visualization, explaining how to draw a smoothly connected path that represents the flow
of the reading order and how to decide the linkability between blocks to control the
granularity of the reading flow.
B.1 Drawing Smoothly Connected Path
Reading flow is a path aligned on all of the visible blocks of elements in a webpage. The
path is drawn by using quadratic Bézier curves whose control points are arranged on the
blocks. Drawing quadratic Bézier curve is supported by the canvas element of HTML5,
Flash®, Java, and by many libraries. The control points are carefully arranged so that
the path can represent the order of the content and the path is smoothly connected
among the blocks. Each block has 2 subpaths drawn as Bézier curves that are controlled
by the block itself and its adjacent blocks. Here is the process of the reading flow
visualization.
First, the reading direction of each block is determined by the reading direction of the
document and the style property of the block. Then according to the height of the block,
the type of each block is determined and the path across on the block is set horizontally
(Figure B.1-(1)) or diagonally (Figure B.1-(2)) to make the path intuitively represent the
reading order. The system then arranges the 5 points (a-e) on each pair of blocks for two
curves. The first path and the second path are controlled by (a, b, b, c)7 and (c, d, d, e),
respectively. The points a and b, and the points d and e are determined by the reading
direction and the type of the first block and the second block, respectively. The point c is
the midpoint between points b and d so that the points b, c, and d lie on a straight line. If
two blocks are aligned in an unnatural flow, for example when the reading direction is
left to right and the first block is located to the right of the second block (Figure B.1-(3)),
7 Quadratic Bézier curve is controlled by four control points and it is described as (p1, p2, p3, p4).

Appendix B Details of the Reading Flow 102
then the system adds control points b' and d' to avoid making the path a straight line.
The paths are controlled by (a, b, b', c) and (c, d', d, e). The points b', c, and d' should also
lie on a straight line.
The system adds an arrow head at the end of the first path if it is longer than a certain
threshold to avoid making the reading flow messy. An arrow heads is always added at the
end of the second path just before the end point because the knob for manipulating the
reading flow is shown at the end point (see Figure 3.4).
B.2 Controlling the Granularity Level of Reading Flow
The granularity level controls the level of detail shown in the reading flow by
assembling adjacent blocks of elements according to the linkability metric between them.
The area of each new block assembled from two blocks is their minimum bounding
rectangle and the linkability between blocks is calculated based on the following criteria.
1. The more similar the shape of the two blocks
2. The smaller the difference between the new merged area and the total area of the
two original blocks
3. The smaller the total area of the two blocks
4. The blocks that are more neatly aligned on the left or on the top (depending on the
reading direction)
In addition, blocks having these features cannot be merged.
1. The area of either of the blocks or of the new merged area is larger than a certain
threshold
2. The new area is relatively large compared to the total area of the two original
blocks
3. The second block is not located at natural position in relation to the reading
direction of the document (as in Figure B.1-(3)).
1)
a b
c
d e
2) a
b
c
d
e
3) a bcd e
b‟
d‟
Figure B.1. Examples of control points between two blocks

Appendix B Details of the Reading Flow 103
When the user specifies the granularity level, the system continues to merge the pairs
of elements having the highest linkability into groups until the number of blocks reaches
the number of blocks determined by the granularity. The granularity defines the number
of blocks in the document; the higher the granularity level, the greater numbers of blocks.
For example, a granularity 50% means that the number of blocks for the visualization is
half of the original number of blocks in the document.

104
Bibliography
[Abe et al. 2001] Mari Abe and Masahiro Hori. 2001. A visual approach to authoring
XPath expressions. Markup Languages, 3, 191–212.
[Abe et al. 2003] Mari Abe and Masahiro Hori. 2003. Robust pointing by XPath language:
authoring support and empirical evaluation. Proceedings of the 2003 Symposium on
Applications and the Internet, SAINT '03, IEEE Computer Society, Washington, DC,
USA, 156–165.
[ACTF] ACTF. Accessibility Tools Framework Project Home. http://www.eclipse.org/actf/,
(Jul. 25, 2011).
[AFB] AFB. Welcome to the HelenTM Project! - American Foundation for the Blind.
http://www.afb.org/aap.asp, (Jul. 25, 2011).
[Affonso de Lara et al. 2010] Silvana Maria Affonso de Lara, Willian Massami Watanabe,
Eduardo Pezutti Beletato dos Santos, and Renata P M Fortes. 2010. Improving WCAG
for elderly Web accessibility. Proceedings of the 28th ACM International Conference
on Design of Communication, SIGDOC '10, ACM, São Carlos, São Paulo, Brazil, 175–
182.
[Akatsu et al. 2004] Hiroko Akatsu and Hiroyuki Miki. 2004. Usability research for the
elderly people. Oki Technical Review (Special Issue on Human Friendly Technologies),
71(3), 54–57.
[Asakawa et al. 2007] Chieko Asakawa, Takashi Itoh, Hironobu Takagi, and Hisashi
Miyashita. 2007. Accessibility evaluation for multimedia content. Proceedings of the
4th International Conference on Universal Access in Human Computer Interaction:
Applications and Services, UAHCI '07, Springer-Verlag, Berlin, Heidelberg, 11–19.
[Bailey et al. 2005] John Bailey and Elizabeth Burd. 2005. Tree-map visualization for
Web accessibility. Computer Software and Applications Conference, Annual
International, IEEE Computer Society, Los Alamitos, CA, USA, 275-280.
[Barnicle 2000] Kitch Barnicle. 2000. Usability testing with screen reading technology in
a Windows environment. Proceedings on the 2000 Conference on Universal Usability,
CUU '00, ACM, Arlington, Virginia, United States, 102–109.
[Bederson 1995] Benjamin B Bederson. 1995. Audio augmented reality: a prototype

Bibliography 105
automated tour guide. Conference Companion on Human Factors in Computing
Systems, CHI '95, ACM, Denver, Colorado, United States, 210–211.
[Benetech] Benetech. Accessible Books and Periodicals for Readers with Print
Disabilities - Bookshare - Accessible Books for Individuals with Print Disabilities.
http://www.bookshare.org/, (Jul. 25, 2011).
[Bickmore et al. 1997] Timothy W Bickmore and Bill N Schilit. 1997. Digestor:
device-independent access to the World Wide Web. Computer Networks and ISDN
Systems, Elsevier Science Publishers Ltd., Essex, UK, 1075–1082.
[Bigham et al. 2007] Jeffrey P Bigham and Richard E Ladner. 2007. Accessmonkey: a
collaborative scripting framework for Web users and developers. Proceedings of the
2007 International Cross-Disciplinary Conference on Web Accessibility (W4A), W4A
'07, ACM, New York, NY, USA, 25–34.
[Bigham, Jayant, et al. 2010] Jeffrey P Bigham, Chandrika Jayant, Hanjie Ji, Greg Little,
Andrew Miller, Robert C Miller, Robin Miller, Aubrey Tatarowicz, Brandyn White,
Samual White, and Tom Yeh. 2010. VizWiz: nearly real-time answers to visual
questions. Proceedings of the 23nd Annual ACM Symposium on User Interface
Software and Technology, UIST '10, ACM, New York, New York, USA, 333–342.
[Bigham et al. 2006] Jeffrey P Bigham, Ryan S Kaminsky, Richard E Ladner, Oscar M
Danielsson, and Gordon L Hempton. 2006. WebInSight: making Web images accessible.
Proceedings of the 8th International ACM SIGACCESS Conference on Computers and
Accessibility, ASSETS '06, ACM, New York, NY, USA, 181–188.
[Bigham et al. 2008] Jeffrey P Bigham, Craig M Prince, Sangyun Hahn, and Richard E
Ladner. 2008. WebAnywhere: a screen reading interface for the Web on any computer.
Proceedings of the 2008 International Cross-Disciplinary Conference on Web
Accessibility (W4A), W4A '08, ACM, Beijing, China, 132–133.
[Bigham and Murray 2010] Jeffrey P. Bigham and Kyle Murray. 2010. WebTrax:
visualizing non-visual Web interactions. Proceedings of the 12th International
Conference on Computers Helping People with Special Needs, ICCHP '10, K.
Miesenberger, J. Klaus, W. Zagler, and A. Karshmer, eds., Springer Berlin Heidelberg,
Berlin, Heidelberg, 346-353.
[Borodin et al. 2008] Yevgen Borodin, Jeffrey P Bigham, Rohit Raman, and I. V
Ramakrishnan. 2008. What's new? – making Web page updates accessible.
Proceedings of the 10th International ACM SIGACCESS Conference on Computers
and Accessibility, ASSETS '08, ACM, Halifax, Nova Scotia, Canada, 145–152.
[Borodin et al. 2007] Yevgen Borodin, Jalal Mahmud, I. V Ramakrishnan, and Amanda

Bibliography 106
Stent. 2007. The HearSay non-visual Web browser. Proceedings of the 2007
International Cross-Disciplinary Conference on Web Accessibility (W4A), W4A '07,
ACM, New York, NY, USA, 128–129.
[Brajnik et al. 2005] Giorgio Brajnik, Daniela Cancila, Daniela Nicoli, and Mery
Pignatelli. 2005. Do text transcoders improve usability for disabled users? Proceedings
of the 2005 International Cross-Disciplinary Workshop on Web Accessibility (W4A),
W4A '05, ACM, New York, NY, USA, 9–17.
[Brush et al. 2001] A. J. Bernheim Brush, David Bargeron, Anoop Gupta, and J. J Cadiz.
2001. Robust annotation positioning in digital documents. Proceedings of the SIGCHI
Conference on Human Factors in Computing Systems, CHI '01, ACM, New York, NY,
USA, 285–292.
[Chadwick-Dias et al. 2007] Ann Chadwick-Dias, Marguerite Bergel, and Thomas S.
Tullis. 2007. Senior Surfers 2.0: a re-examination of the older Web user and the
dynamic Web. Proceedings of the 4th International Conference on Universal Access in
Human-Computer Interaction: Applications and Services, UACHI '07, C. Stephanidis,
ed., Springer Berlin Heidelberg, Berlin, Heidelberg, 868-876.
[Chadwick-Dias et al. 2004] Ann Chadwick-Dias, Donna Tedesco, and Tom Tullis. 2004.
Older adults and Web usability: Is Web experience the same as Web expertise? CHI
2004 Extended Abstracts on Human Factors in Computing Systems, CHA EA '04,
ACM, Vienna, Austria, 1391–1394.
[Chen et al. 2008] Charles L Chen and T. V Raman. 2008. AxsJAX: a talking translation
bot using Google IM: bringing Web2.0 applications to life. Proceedings of the 2008
International Cross-Disciplinary Conference on Web Accessibility (W4A), W4A '08,
ACM, New York, NY, USA, 54–56.
[Citrix Online] Citrix Online. Remote Support and Remote Support Services |
GoToAssist. http://www.gotoassist.com/, (Aug. 9, 2011).
[Dahlbäck et al. 1993] N. Dahlbäck, A. Jönsson, and L. Ahrenberg. 1993. Wizard of Oz
studies -- why and how. Knowledge-Based Systems, 6(4), 258-266.
[Dardailler 1997] Daniel Dardailler. 1997. The ALT-server ("An eye for an alt").
http://www.w3.org/WAI/altserv.htm, (Jun. 14, 2011).
[Dell] Dell. DellConnectTM.
http://support.dell.com/support/topics/global.aspx/support/en/dellconnect, (Aug. 9,
2011).
[Deterding et al. 2011] Sebastian Deterding, Miguel Sicart, Lennart Nacke, Kenton
O'Hara, and Dan Dixon. 2011. Gamification. using game-design elements in
Bibliography 107
non-gaming contexts. Proceedings of the 2011 Annual Conference Extended Abstracts
on Human Factors in Computing Systems, CHI EA '11, Vancouver, BC, Canada,
2425-2428.
[Dontcheva et al. 2006] Mira Dontcheva, Steven M Drucker, Geraldine Wade, David
Salesin, and Michael F Cohen. 2006. Summarizing personal Web browsing sessions.
Proceedings of the 19th Annual ACM Symposium on User Interface Software and
Technology, UIST '06, ACM, Montreux, Switzerland, 115–124.
[Droit-Volet et al. 2009] Sylvie Droit-Volet and Sandrine Gil. 2009. The time–emotion
paradox. Philosophical Transactions of the Royal Society B: Biological Sciences,
364(1525), 1943 -1953.
[Eckel 2001] Gerhard Eckel. 2001. Immersive audio-augmented environments the
LISTEN project. Proceedings of the Fifth International Conference on Information
Visualisation, IEEE, 571-573.
[Eclipse 2008] Eclipse. 2008. ACTF Accessibility Internet Browser for Multimedia
(aiBrowser). http://www.eclipse.org/actf/downloads/tools/aiBrowser/, (Jul. 26, 2011).
[eEurope 2002] eEurope 2002. eEurope 2002 an information society for all action plan.
[Fairweather 2008] Peter G Fairweather. 2008. How older and younger adults differ in
their approach to problem solving on a complex website. Proceedings of the 10th
International ACM SIGACCESS Conference on Computers and Accessibility, ASSETS
'08, ACM, Halifax, Nova Scotia, Canada, 67–72.
[Ferretti et al. 2008] Stefano Ferretti, Silvia Mirri, Ludovico Antonio Muratori, Marco
Roccetti, and Paola Salomoni. 2008. E-learning 2.0: you are We-LCoME! Proceedings of
the 2008 International Cross-Disciplinary Conference on Web Accessibility (W4A),
W4A '08, ACM, New York, NY, USA, 116–125.
[Ferretti et al. 2007] Stefano Ferretti, Silvia Mirri, Marco Roccetti, and Paola Salomoni.
2007. Notes for a collaboration: on the design of a wiki-type educational video lecture
annotation system. Proceedings of the International Conference on Semantic
Computing, IEEE Computer Society, Washington, DC, USA, 651–656.
[Freedom Scientific Inc.] Freedom Scientific Inc. JAWS Screen Reading Software.
http://www.freedomscientific.com/products/fs/jaws-product-page.asp, (Jul. 25, 2011).
[Goble et al. 2000] Carole Goble, Simon Harper, and Robert Stevens. 2000. The travails
of visually impaired Web travellers. Proceedings of the Eleventh ACM on Hypertext
and Hypermedia, HYPERTEXT '00, ACM, San Antonio, Texas, United States, 1–10.
[Google] Google. Google Image Labeler. http://images.google.com/imagelabeler/, (Jul. 25,
2011).

Bibliography 108
[Gregor et al. 2002] Peter Gregor, Alan F Newell, and Mary Zajicek. 2002. Designing for
dynamic diversity: interfaces for older people. Proceedings of the Fifth International
ACM Conference on Assistive Technologies, ASSETS '02, ACM, Edinburgh, Scotland,
151–156.
[Ha Lee et al. 2003] Chang Ha Lee and Tapas Kanungo. 2003. The architecture of
TrueViz: a groundTRUth/metadata editing and VIsualiZing ToolKit. Pattern
Recognition, 36(3), 811-825.
[Hailpern 2006] Joshua M Hailpern. 2006. WISE: a wizard interface supporting
enhanced usability. Proceedings of the 8th International ACM SIGACCESS
Conference on Computers and Accessibility, ASSETS '06, ACM, Portland, Oregon,
USA, 291–292.
[Hanson 2009] Vicki L Hanson. 2009. Age and Web access: the next generation.
Proceedings of the 2009 International Cross-Disciplinary Conference on Web
Accessibility (W4A), W4A '09, ACM, Madrid, Spain, 7–15.
[Hanson et al. 2007] Vicki L Hanson, John T Richards, and Chin Chin Lee. 2007. Web
access for older adults: voice browsing? Proceedings of the 4th International
Conference on Universal Access in Human Computer Interaction: Coping with
Diversity, UAHCI '07, Springer-Verlag, Beijing, China, 904–913.
[Harper et al. 2008] Simon Harper and Yeliz Yesilada. 2008. Web accessibility: a
foundation for research. Springer.
[Harper et al. 2006] Simon Harper, Sean Bechhofer, and Darren Lunn. 2006. SADIe:
transcoding based on CSS. Proceedings of the 8th International ACM SIGACCESS
Conference on Computers and Accessibility, ASSETS '06, ACM, New York, NY, USA,
259–260.
[Hartmann et al. 2009] Melanie Hartmann, Daniel Schreiber, and Max Mühlhäuser.
2009. AUGUR: providing context-aware interaction support. Proceedings of the 1st
ACM SIGCHI Symposium on Engineering Interactive Computing Systems, EICS '09,
ACM, Pittsburgh, PA, USA, 123–132.
[Hornbæk et al. 2007] Kasper Hornbæk and Effie Lai-Chong Law. 2007. Meta-analysis of
correlations among usability measures. Proceedings of the SIGCHI Conference on
Human Factors in Computing Systems, CHI '07, ACM, San Jose, California, USA, 617
–626.
[IBM 2008] IBM. 2008. Social Accessibility Project. http://sa.watson.ibm.com/, (Jul. 25,
2011).
[IBM 2010] IBM. 2010. IBM Press room - 2010-08-04 New IBM Collaboration with

Bibliography 109
Japan's TIC and KOA to Address Urgent Need for Elderly, Disabled Citizens to Join
e-Government. http://www-03.ibm.com/press/us/en/pressrelease/32265.wss, (Aug. 10,
2011).
[ISO/IEC 2001] ISO/IEC. 2001. ISO/IEC Guide 71:2001 - Guidelines for standards
developers to address the needs of older persons and persons with disabilities.
http://www.iso.org/iso/catalogue_detail?csnumber=33987, (Jul. 4, 2011).
[JIS X 8341-3:2010] JIS X 8341-3:2010. Guidelines for older persons and persons with
disabilities - information and communications equipment, software and services - part
3: Web content.
[Jones et al. 2008] Matt Jones, Steve Jones, Gareth Bradley, Nigel Warren, David
Bainbridge, and Geoff Holmes. 2008. ONTRACK: dynamically adapting music
playback to support navigation. Personal Ubiquitous Comput., 12(7), 513–525.
[Kalantari et al. 2004] Leila Kalantari, Marek Hatala, and Jordan Willms. 2004. Using
semantic Web approach in augmented audio reality system for museum visitors.
Proceedings of the 13th International World Wide Web Conference on Alternate Track
Papers & Posters, WWW Alt. '04, ACM, New York, NY, USA, 386–387.
[Kanayama et al. 2004] Hiroshi Kanayama, Tetsuya Nasukawa, and Hideo Watanabe.
2004. Deeper sentiment analysis using machine translation technology. Proceedings of
the 20th International Conference on Computational Linguistics, COLING '04,
Association for Computational Linguistics, Geneva, Switzerland, 7 pages.
[Kasday 2000] Leonard R Kasday. 2000. A tool to evaluate universal Web accessibility.
Proceedings on the 2000 Conference on Universal Usability, CUU '00, ACM, Arlington,
Virginia, United States, 161–162.
[Kawanaka et al. 2008] Shinya Kawanaka, Yevgen Borodin, Jeffrey P Bigham, Darren
Lunn, Hironobu Takagi, and Chieko Asakawa. 2008. Accessibility Commons: a
metadata infrastructure for Web accessibility. Proceedings of the 10th International
ACM SIGACCESS Conference on Computers and Accessibility, ASSETS '08, ACM,
New York, NY, USA, 153–160.
[Kolodinsky et al. 2002] J. Kolodinsky, M. Cranwell, and E. Rowe. 2002. Bridging the
generation gap across the digital divide: Teens teaching Internet skills to senior
citizens. Journal of Extension, 5(10), 2.
[Lazar et al. 2007] J. Lazar, A. Allen, J. Kleinman, and C. Malarkey. 2007. What
frustrates screen reader users on the Web: A study of 100 blind users. International
Journal of Human-Computer Interaction, 22(3), 247–269.
[Leitner et al. 2009] Michael Leitner, Özge Subasi, Norman Höller, Arjan Geven, and

Bibliography 110
Manfred Tscheligi. 2009. User requirement analysis for a railway ticketing portal with
emphasis on semantic accessibility for older users. Proceedings of the 2009
International Cross-Disciplinary Conference on Web Accessibility (W4A), W4A '09,
ACM, Madrid, Spain, 114–122.
[Leland et al. 1988] Mary D. P Leland, Robert S Fish, and Robert E Kraut. 1988.
Collaborative document production using Quilt. Proceedings of the 1988 ACM
Conference on Computer-Supported Cooperative Work, CSCW '88, ACM, New York,
NY, USA, 206–215.
[Leuf et al. 2001] Bo Leuf and Ward Cunningham. 2001. The wiki way : quick
collaboration on the Web. Boston, EUA : Addison-Wesley.
[Lunn et al. 2008] Darren Lunn, Sean Bechhofer, and Simon Harper. 2008. The SADIe
transcoding platform. Proceedings of the 2008 International Cross-Disciplinary
Conference on Web Accessibility (W4A), W4A '08, ACM, Beijing, China, 128–129.
[Lunn et al. 2009] Darren Lunn, Simon Harper, and Sean Bechhofer. 2009. Combining
SADIe and AxsJAX to improve the accessibility of Web content. Proceedings of the
2009 International Cross-Disciplinary Conference on Web Accessibility (W4A), W4A
'09, ACM, New York, NY, USA, 75–78.
[Maes 1994] Pattie Maes. 1994. Agents that reduce work and information overload.
Communications of the ACM, 37(7), 30–40.
[Maglio et al. 2000] Paul Maglio and Rob Barrett. 2000. Intermediaries personalize
information streams. Communications of the ACM, 43(8), 96–101.
[Mahmud et al. 2007] Jalal U Mahmud, Yevgen Borodin, and I. V Ramakrishnan. 2007.
CSurf: a context-driven non-visual Web-browser. Proceedings of the 16th International
Conference on World Wide Web, WWW '07, ACM, Banff, Alberta, Canada, 31–40.
[Malerba et al. 2008] Donato Malerba, Michelangelo Ceci, and Margherita Berardi. 2008.
Machine learning for reading order detection in document image understanding.
Machine Learning in Document Analysis and Recognition, S. Marinai and H. Fujisawa,
eds., Springer Berlin Heidelberg, Berlin, Heidelberg, 45-69.
[Mankoff et al. 2005] Jennifer Mankoff, Holly Fait, and Tu Tran. 2005. Is your Web page
accessible? A comparative study of methods for assessing Web page accessibility for
the blind. Proceedings of the SIGCHI Conference on Human Factors in Computing
Systems, CHI '05, ACM, Portland, Oregon, USA, 41–50.
[MCOF] MCOF. Multimodal Collaboration Framework | Download Multimodal
Collaboration Framework software for free at SourceForge.net.
http://sourceforge.net/projects/mcof/, (Sep. 6, 2011).

Bibliography 111
[Meunier 2005] J. -L Meunier. 2005. Optimized XY-cut for determining a page reading
order. Proceedings of the 2005 Eight International Conference on Document Analysis
and Recognition, ICDAR '05, IEEE, 347- 351 Vol. 1.
[Meyer et al. 1997] Beth Meyer, Richard A Sit, Victoria A Spaulding, Sherry E Mead, and
Neff Walker. 1997. Age group differences in World Wide Web navigation. CHI 1997
Extended Abstracts on Human Factors in Computing Systems: Looking to the Future,
CHI EA '97, ACM, Atlanta, Georgia, 295–296.
[Milne et al. 2005] Scott Milne, Anna Dickinson, Peter Gregor, Lorna Gibson, Louise
McIver, and David Sloan. 2005. Not browsing, but drowning: designing a Web browser
for novice older users. Proceedings of HCI International, HCII '05, 7 pages.
[Miniwatts Marketing Group 2011] Miniwatts Marketing Group. 2011. World Internet
Usage Statistics News and World Population Stats.
http://www.internetworldstats.com/stats.htm, (Jul. 26, 2011).
[Miyashita et al. 2007] Hisashi Miyashita, Daisuke Sato, Hironobu Takagi, and Chieko
Asakawa. 2007. aiBrowser for multimedia: introducing multimedia content
accessibility for visually impaired users. Proceedings of the 9th International ACM
SIGACCESS Conference on Computers and Accessibility, ASSETS '07, ACM, Tempe,
Arizona, USA, 91–98.
[Muta et al. 2005] Hidemasa Muta, Takuya Ohko, and Hideshi Yoshinaga. 2005. An
activeX-based accessibility solution for senior citizens. Proceedings of the Center on
Disabilities Technology and Persons with Disabilities Conference 2005.
[Newell et al. 2006] Alan F Newell, Anna Dickinson, Mick J Smith, and Peter Gregor.
2006. Designing a portal for older users: A case study of an industrial/academic
collaboration. ACM Transaction on Computer-Human Interaction, 13(3), 347–375.
[Niwango] Niwango. Nico-Nico Douga. http://www.nicovideo.jp/, (Jul. 25, 2011).
[Ntoulas et al. 2004] Alexandros Ntoulas, Junghoo Cho, and Christopher Olston. 2004.
What's new on the Web? The evolution of the Web from a search engine perspective.
Proceedings of the 13th International Conference on World Wide Web, WWW '04, ACM,
New York, NY, USA, 1–12.
[Parente 2006] Peter Parente. 2006. Clique: a conversant, task-based audio display for
GUI applications. Newsletter ACM SIGACCESS Accessibility and Computing, Issue
84, 34–37.
[Petrie et al. 2006] Helen Petrie, Fraser Hamilton, Neil King, and Pete Pavan. 2006.
Remote usability evaluations with disabled people. Proceedings of the SIGCHI
Conference on Human Factors in Computing Systems, CHI '06, ACM, New York, NY,

Bibliography 112
USA, 1133–1141.
[Phelps et al. 2000] Thomas A Phelps and Robert Wilensky. 2000. Robust intra-document
locations. Computer Networks: The International Journal of Computer and
Telecommunications Networking, 33(1-6), 105–118.
[Roth et al. 1999] Patrick Roth, Lori Petrucci, Thierry Pun, and André Assimacopoulos.
1999. Auditory browser for blind and visually impaired users. CHI 1999 Extended
Abstracts on Human Factors in Computing Systems, CHI EA '99, ACM, Pittsburgh,
Pennsylvania, 218–219.
[Salamon, Lester M. et al. 2007] Salamon, Lester M., Megan A. Haddock, S. Wojciech
Sokolowski, and Helen S. Tice. 2007. Measuring civil society and volunteering: Initial
findings from implementation of the UN handbook on nonprofit institutions.
Baltimore: Johns Hopkins Center for Civil Society Studies.
[Sato et al. 2009] Daisuke Sato, Masatomo Kobayashi, Hironobu Takagi, and Chieko
Asakawa. 2009. What's next? A visual editor for correcting reading order. Proceedings
of the 12th IFIP TC 13 International Conference on Human-Computer Interaction:
Part I, INTERACT '09, Springer Berlin Heidelberg, Berlin, Heidelberg, 364-377.
[Sato, Kobayashi, et al. 2011] Daisuke Sato, Masatomo Kobayashi, Hironobu Takagi,
Chieko Asakawa, and Jiro Tanaka. 2011. How voice augmentation supports elderly
Web users. Proceedings of the 13th International ACM SIGACCESS Conference on
Computers and Accessibility, ASSETS '11, ACM, New York, NY, USA, 8 pages.
[Sato et al. 2010] Daisuke Sato, Hironobu Takagi, Masatomo Kobayashi, Shinya
Kawanaka, and Chieko Asakawa. 2010. Exploratory analysis of collaborative Web
accessibility improvement. ACM Transactions on Accessible Computing, 3(2), 5:1–5:30.
[Sato, Zhu, et al. 2011] Daisuke Sato, Shaojian Zhu, Masatomo Kobayashi, Hironobu
Takagi, and Chieko Asakawa. 2011. Sasayaki: augmented voice Web browsing
experience. Proceedings of the 2011 Annual Conference on Human Factors in
Computing Systems, CHI '11, ACM, New York, NY, USA, 2769–2778.
[Sawhney et al. 2000] Nitin Sawhney and Chris Schmandt. 2000. Nomadic Radio: speech
and audio interaction for contextual messaging in nomadic environments. ACM
Transaction on Computer-Human Interaction, 7(3), 353–383.
[Sayago et al. 2009] Sergio Sayago and Josep Blat. 2009. About the relevance of
accessibility barriers in the everyday interactions of older people with the Web.
Proceedings of the 2009 International Cross-Disciplinary Conference on Web
Accessibility (W4A), W4A '09, ACM, Madrid, Spain, 104–113.
[Section 508] Section 508. Section 508 of the rehabilitation act.

Bibliography 113
http://www.section508.gov/, (Jul. 26, 2011).
[Serotek] Serotek. System Access Mobile Network.
http://www.serotek.com/system-access-mobile-network, (Jul. 25, 2011).
[Shoval et al. 1998] Shraga Shoval, Johann Borenstein, and Yoram Koren. 1998. The
NavBelt-a computerized travel aid for the blind based on mobile robotics technology.
IEEE Transactions on Biomedical Engineering, 45(11), 1376-1386.
[Sloan et al. 2010] David Sloan, Matthew Tylee Atkinson, Colin Machin, and Yunqiu Li.
2010. The potential of adaptive interfaces as an accessibility aid for older Web users.
Proceedings of the 2010 International Cross-Disciplinary Conference on Web
Accessibility (W4A), W4A '10, ACM, Raleigh, North Carolina, 35:1–35:10.
[Solona] Solona. Solona a11y — When inaccessible is unacceptable!
http://www.solona.net/, (Jul. 15, 2011).
[SPRY Foundation 1999] SPRY Foundation. 1999. SPRY's Work: Education - A Guide for
Web Site Creators. http://www.spry.org/sprys_work/education/web_guide.html, (Jul. 4,
2011).
[Stylos et al. 2004] Jeffrey Stylos, Brad A Myers, and Andrew Faulring. 2004. Citrine:
providing intelligent copy-and-paste. Proceedings of the 17th Annual ACM Symposium
on User Interface Software and Technology, UIST '04, ACM, Santa Fe, NM, USA, 185–
188.
[Takagi et al. 2000] Hironobu Takagi and Chieko Asakawa. 2000. Transcoding proxy for
nonvisual Web access. Proceedings of the Fourth International ACM Conference on
Assistive Technologies, ASSETS '00, ACM, New York, NY, USA, 164–171.
[Takagi et al. 2002] Hironobu Takagi, Chieko Asakawa, Kentarou Fukuda, and Junji
Maeda. 2002. Site-wide annotation: reconstructing existing pages to be accessible.
Proceedings of the Fifth International ACM Conference on Assistive Technologies,
ASSETS '02, ACM, New York, NY, USA, 81–88.
[Takagi et al. 2004] Hironobu Takagi, Chieko Asakawa, Kentarou Fukuda, and Junji
Maeda. 2004. Accessibility designer: visualizing usability for the blind. Proceedings of
the 6th International ACM SIGACCESS Conference on Computers and Accessibility,
ASSETS '04, 177–184.
[Takagi et al. 2008] Hironobu Takagi, Shinya Kawanaka, Masatomo Kobayashi, Takashi
Itoh, and Chieko Asakawa. 2008. Social Accessibility: achieving accessibility through
collaborative metadata authoring. Proceedings of the 10th International ACM
SIGACCESS Conference on Computers and Accessibility, ASSETS '08, ACM, New
York, NY, USA, 193–200.

Bibliography 114
[Takagi et al. 2007] Hironobu Takagi, Shin Saito, Kentarou Fukuda, and Chieko
Asakawa. 2007. Analysis of navigability of Web applications for improving blind
usability. ACM Transaction on Computer-Human Interaction, 14(3), 13:1-13:37.
[UNESCO 2008] UNESCO. 2008. International literacy statistics: a review of concepts,
methodology and current data.
[United Nations 2006] United Nations. 2006. Convention on the rights of persons with
disabilities. http://www.un.org/disabilities/convention/conventionfull.shtml, (Jul. 27,
2011).
[United Nations 2010] United Nations. 2010. World population ageing 2009.
[Vigo et al. 2009] Markel Vigo, Barbara Leporini, and Fabio Paternò. 2009. Enriching
Web information scent for blind users. Proceedings of the 11th International ACM
SIGACCESS Conference on Computers and Accessibility, ASSETS '09, ACM,
Pittsburgh, Pennsylvania, USA, 123–130.
[Wagner et al. 2004] Earl J Wagner and Henry Lieberman. 2004. Supporting user
hypotheses in problem diagnosis. Proceedings of the 9th International Conference on
Intelligent User Interfaces, IUI '04, ACM, Funchal, Madeira, Portugal, 30–37.
[WAI-AGE] WAI-AGE. Web Accessibility and Older People: Meeting the Needs of Ageing
Web Users. http://www.w3.org/WAI/older-users/, (Jul. 27, 2011).
[WAI-ARIA] WAI-ARIA. Accessible Rich Internet Applications (WAI-ARIA) 1.0.
http://www.w3.org/TR/wai-aria/, (Jul. 25, 2011).
[Ward et al. 2003] Karen Ward and David G Novick. 2003. Hands-free documentation.
Proceedings of the 21st Annual International Conference on Documentation, SIGDOC
'03, ACM, San Francisco, CA, USA, 147–154.
[WCAG1.0] WCAG1.0. Web Content Accessibility Guidelines 1.0.
http://www.w3.org/TR/WCAG10/, (Jul. 26, 2011).
[WCAG2.0] WCAG2.0. Web Content Accessibility Guidelines (WCAG) 2.0.
http://www.w3.org/TR/WCAG20/, (Jul. 26, 2011).
[WebAIM 2001] WebAIM. 2001. WAVE - Web Accessibility Evaluation Tool.
http://wave.webaim.org/, (Jul. 26, 2011).
[WebAIM 2009] WebAIM. 2009. WebAIM: Survey of Preferences of Screen Readers Users.
http://webaim.org/projects/screenreadersurvey/, (Jul. 25, 2011).
[Webvisum] Webvisum. Webvisum - your web helper - Welcome to Webvisum.
http://www.webvisum.com/, (Jul. 25, 2011).
[WHO 2011] WHO. 2011. Fact sheet of visual impairment and blindness.
http://www.who.int/mediacentre/factsheets/fs282/en/, (Jul. 26, 2011).

Bibliography 115
[Wilson et al. 2007] Jeff Wilson, Bruce N Walker, Jeffrey Lindsay, Craig Cambias, and
Frank Dellaert. 2007. SWAN: system for wearable audio navigation. Proceedings of the
11th IEEE International Symposium on Wearable Computers, IEEE, 91-98.
[Yacoub et al. 2005] S. Yacoub, Vinay Saxena, and S. N Sami. 2005. PerfectDoc: a ground
truthing environment for complex documents. Proceedings of the Eighth International
Conference on Document Analysis and Recognition, IEEE, 452- 456 Vol. 1.
[Yanikoglu et al. 1998] Berrin A Yanikoglu and Luc Vincent. 1998. Pink Panther: a
complete environment for ground-truthing and benchmarking document page
segmentation. Pattern Recognition, 31, 1191-1204.
[YouTube Subtitler] YouTube Subtitler. Subtitles in English - YouTube Subtitler.
http://yt-subs.appspot.com/, (Jul. 25, 2011).
[Yu et al. 2005] Wai Yu, Graham McAllister, Philip Strain, Ravi Kuber, and Emma
Murphy. 2005. Improving Web accessibility using content-aware plug-ins. CHI 2005
Extended Abstracts on Human Factors in Computing Systems, CHI EA '05, ACM,
Portland, OR, USA, 1893–1896.
[Zajicek et al. 2003] Mary Zajicek and Wesley Morrissey. 2003. Multimodality and
interactional differences in older adults. Universal Access in the Information Society,
2(2), 125-133.
[Zhu et al. 2010] Shaojian Zhu, Daisuke Sato, Hironobu Takagi, and Chieko Asakawa.
2010. Sasayaki: an augmented voice-based Web browsing experience. Proceedings of
the 12th International ACM SIGACCESS Conference on Computers and Accessibility,
ASSETS '10, ACM, New York, NY, USA, 279–280.

116
List of Publications
Journal
Daisuke Sato, Hironobu Takagi, Masatomo Kobayashi, Shinya Kawanaka, and
Chieko Asakawa. 2010. Exploratory analysis of collaborative Web accessibility
improvement. ACM Transactions on Accessible Computing, 3(2), 5:1–5:30.
Conference
Daisuke Sato, Masatomo Kobayashi, Hironobu Takagi, and Chieko Asakawa. 2009.
What's next? A visual editor for correcting reading order. Proceedings of the 12th
IFIP TC 13 International Conference on Human-Computer Interaction: Part I,
INTERACT '09, Springer Berlin Heidelberg, Berlin, Heidelberg, 364-377.
Daisuke Sato, Shaojian Zhu, Masatomo Kobayashi, Hironobu Takagi, and Chieko
Asakawa. 2011. Sasayaki: augmented voice Web browsing experience. Proceedings of
the 2011 Annual Conference on Human Factors in Computing Systems, CHI '11,
ACM, New York, NY, USA, 2769–2778.
Daisuke Sato, Masatomo Kobayashi, Hironobu Takagi, Chieko Asakawa, and Jiro
Tanaka. 2011. How voice augmentation supports elderly Web users. Proceedings of
the 13th International ACM SIGACCESS Conference on Computers and
Accessibility, ASSETS '11, ACM, New York, NY, USA, 8 pages.


